The following table sets forth cash and cash equivalents, as well as our capitalization, as of JuneSeptember 30, 20182021 as follows:
us. Similarly, each increase or decrease of 1.0 million shares in the number of shares offered by us would increase or decrease, as applicable, the amount of our pro forma as adjusted net tangible book valuecash and cash equivalents, additional paid-in capital, total stockholders’ equity, and total capitalization by $ per share and increase or decrease, as applicable, the dilution to new investors by $ per share,$45.2 million, assuming an initial publicassumed offering price of $$46.55 per share, which iswas the midpointlast reported sale price of the estimated offering price range set forthour Class A common stock on the cover page of this prospectus,Nasdaq on November 1, 2021, after deducting underwriting discounts and commissions and estimated offering expenses payable by us.
SELECTED CONSOLIDATED FINANCIAL AND OTHER DATA
The following tables present our selected consolidated financial and other data. We have derived the selected consolidated statements of operations data for the years ended December 31, 2016 and 2017 and our selected consolidated balance sheet data as of December 31, 2016 and 2017 from our audited consolidated financial statements included elsewhere in this prospectus. We have derived the selected consolidated statements of operations data for the six months ended June 30, 2017 and 2018 and our selected consolidated balance sheet data as of June 30, 2018 from our unaudited interim consolidated financial statements included elsewhere in this prospectus. The unaudited interim consolidated financial statements have been prepared on the same basis as the audited consolidated financial statements and reflect, in the opinion of management, all adjustments of a normal, recurring nature that are necessary for a fair statement of the unaudited interim consolidated financial statements. Our historical results are not necessarily indicative of the results that may be expected in the future, and the results for the six months ended June 30, 2017 or 2018 are not necessarily indicative of the results to be expected for the full year or any other future period. The following selected consolidated financial and other data should be read in conjunction with the section titled “Management’s Discussion and Analysis of Financial Condition and Results of Operations” and our consolidated financial statements and the related notes included elsewhere in this prospectus.
|
| | | | | | | | | | | | | | | |
| | Year Ended December 31, | | Six Months Ended
June 30, |
| | 2016 | | 2017 | | 2017 | | 2018 |
| Consolidated Statements of Operations Data: | (In thousands, except per share data) |
| Revenue: | | | | | | | |
| Subscription | $ | 142,525 |
| | $ | 213,274 |
| | $ | 96,152 |
| | $ | 136,267 |
|
| Research on Demand | 38,147 |
| | 51,812 |
| | 24,384 |
| | 33,304 |
|
| Professional services and other | 9,931 |
| | 24,817 |
| | 10,898 |
| | 14,626 |
|
| Total revenue | 190,603 |
| | 289,903 |
| | 131,434 |
| | 184,197 |
|
Cost of revenue(1)(2): |
| |
| |
| |
|
| Subscription | 27,904 |
| | 25,552 |
| | 11,432 |
| | 17,062 |
|
| Research on Demand | 21,322 |
| | 26,639 |
| | 12,940 |
| | 14,449 |
|
| Professional services and other | 11,754 |
| | 26,893 |
| | 11,523 |
| | 17,595 |
|
| Total cost of revenue | 60,980 |
| | 79,084 |
| | 35,895 |
| | 49,106 |
|
| Gross profit | 129,623 |
| | 210,819 |
| | 95,539 |
| | 135,091 |
|
Operating expenses(1)(2): |
| |
| |
| |
|
| Research and development | 22,303 |
| | 40,680 |
| | 18,227 |
| | 27,977 |
|
| Sales and marketing | 95,919 |
| | 140,524 |
| | 69,294 |
| | 91,320 |
|
| General and administrative | 21,909 |
| | 26,522 |
| | 11,595 |
| | 19,073 |
|
| Total operating expenses | 140,131 |
| | 207,726 |
| | 99,116 |
| | 138,370 |
|
| Operating income (loss) | (10,508 | ) | | 3,093 |
| | (3,577 | ) | | (3,279 | ) |
| Other non-operating income (expense), net | (501 | ) | | 1,370 |
| | 671 |
| | 320 |
|
| Income (loss) before income taxes | (11,009 | ) | | 4,463 |
| | (2,906 | ) | | (2,959 | ) |
| Provision for income taxes | 1,025 |
| | 1,907 |
| | 799 |
| | 457 |
|
| Net income (loss) | $ | (12,034 | ) | | $ | 2,556 |
| | $ | (3,705 | ) | | $ | (3,416 | ) |
| Net income (loss) per share attributable to common stockholders, basic | $ | (2.42 | ) | | $ | 0.01 |
| | $ | (0.65 | ) | | $ | (0.48 | ) |
| Net income (loss) per share attributable to common stockholders, diluted | $ | (2.42 | ) | | $ | 0.01 |
| | $ | (0.65 | ) | | $ | (0.48 | ) |
| Weighted-average shares used in computing net income (loss) per share attributable to common stockholders, basic | 4,965 |
| | 5,778 |
| | 5,666 |
| | 7,169 |
|
| Weighted-average shares used in computing net income (loss) per share attributable to common stockholders, diluted | 4,965 |
| | 371,468 |
| | 5,666 |
| | 7,169 |
|
| Pro forma net income (loss) per share attributable to common stockholders, basic |
|
| |
|
| |
|
| |
|
|
| Pro forma net income (loss) per share attributable to common stockholders, diluted |
|
| |
|
| |
|
| |
|
|
| Weighted-average shares used in computing pro forma net income (loss) per share attributable to common stockholders, basic |
|
| |
|
| |
|
| |
|
|
| Weighted-average shares used in computing pro forma net income (loss) per share attributable to common stockholders, diluted |
|
| |
|
| |
|
| |
|
|
____________________
| |
(1) | Includes stock-based compensation expense as follows: |
|
| | | | | | | | | | | | | | | |
| | Year Ended
December 31, | | Six Months Ended
June 30, |
| | 2016 | | 2017 | | 2017 | | 2018 |
| | (In thousands) |
| Cost of revenue | $ | 7 |
| | $ | 7 |
| | $ | 4 |
| | $ | 4 |
|
| Research and development | 309 |
| | 1,438 |
| | 1,242 |
| | 908 |
|
| Sales and marketing | 64 |
| | 4,415 |
| | 4,411 |
| | 410 |
|
| General and administrative | 322 |
| | 1,087 |
| | 475 |
| | 706 |
|
| Total stock-based compensation expense | $ | 702 |
| | $ | 6,947 |
| | $ | 6,132 |
| | $ | 2,028 |
|
| |
(2) | Includes amortization of acquired intangible assets as follows: |
|
| | | | | | | | | | | | | | | |
| | Year Ended
December 31, | | Six Months Ended
June 30, |
| | 2016 | | 2017 | | 2017 | | 2018 |
| | (In thousands) |
| Cost of revenue | $ | 81 |
| | $ | 135 |
| | $ | 68 |
| | $ | 260 |
|
| Research and development | — |
| | — |
| | — |
| | — |
|
| Sales and marketing | 47 |
| | 32 |
| | 30 |
| | 60 |
|
| General and administrative | 59 |
| | 59 |
| | 30 |
| | 62 |
|
| Total amortization of acquired intangible assets | $ | 187 |
| | $ | 226 |
| | $ | 128 |
| | $ | 382 |
|
|
| | | | | | | | | | | |
| | As of December 31, 2016 | | As of December 31, 2017 | | As of
June 30,
2018 |
| Consolidated Balance Sheet Data: | (In thousands) |
| Cash and cash equivalents | $ | 61,860 |
| | $ | 113,435 |
| | $ | 135,610 |
|
Working capital(1) | $ | 113,947 |
| | $ | 188,679 |
| | $ | 203,839 |
|
| Total assets | $ | 180,700 |
| | $ | 280,337 |
| | $ | 314,840 |
|
| Total deferred revenue | $ | 133,391 |
| | $ | 185,145 |
| | $ | 219,305 |
|
| Redeemable convertible preferred stock | $ | 99,762 |
| | $ | 129,609 |
| | $ | 129,609 |
|
| Accumulated deficit | $ | (83,880 | ) | | $ | (81,324 | ) | | $ | (84,740 | ) |
| Total stockholders’ deficit | $ | (82,708 | ) | | $ | (72,597 | ) | | $ | (75,327 | ) |
____________________
| |
(1) | Working capital is defined as current assets less current liabilities, excluding current deferred revenue. See our audited consolidated financial statements and related notes included elsewhere in this prospectus for further details regarding our current assets and current liabilities. |
Non-GAAP Financial Measures
In addition to our results determined in accordance with GAAP, we believe the following non-GAAP measures are useful in evaluating our operating performance. We use the following non-GAAP financial information to evaluate our ongoing operations and for internal planning and forecasting purposes. We believe that non-GAAP financial information, when taken collectively, may be helpful to investors because it provides consistency and comparability with past financial performance. However, non-GAAP financial information is presented for supplemental informational purposes only, has limitations as an analytical tool and should not be considered in isolation or as a substitute for financial information presented in accordance with GAAP. In particular, free cash flow is not a substitute for cash used in operating activities. Additionally, the utility of free cash flow as a measure of our liquidity is further limited as it
does not represent the total increase or decrease in our cash balance for a given period. In addition, other companies, including companies in our industry, may calculate similarly-titled non-GAAP measures differently or may use other measures to evaluate their performance, all of which could reduce the usefulness of our non-GAAP financial measures as tools for comparison. A reconciliation is provided below for each non-GAAP financial measure to the most directly comparable financial measure stated in accordance with GAAP. Investors are encouraged to review the related GAAP financial measures and the reconciliation of these non-GAAP financial measures to their most directly comparable GAAP financial measures, and not to rely on any single financial measure to evaluate our business.
Non-GAAP Operating Income (Loss)
|
| | | | | | | | | | | | | | | |
| | Year Ended December 31, | | Six Months Ended
June 30, |
| | 2016 | | 2017 | | 2017 | | 2018 |
| | (In thousands) |
| GAAP operating income (loss) | $ | (10,508 | ) | | $ | 3,093 |
| | $ | (3,577 | ) | | $ | (3,279 | ) |
| Add: Stock-based compensation expense | 702 |
| | 6,947 |
| | 6,132 |
| | 2,028 |
|
| Add: Amortization of acquired intangible assets | 187 |
| | 226 |
| | 128 |
| | 382 |
|
| Add: Legal costs related to acquisitions | 60 |
| | — |
| | — |
| | 648 |
|
| Non-GAAP operating income (loss) | $ | (9,559 | ) | | $ | 10,266 |
| | $ | 2,683 |
| | $ | (221 | ) |
We calculate non-GAAP operating income (loss), as GAAP operating income (loss) excluding stock-based compensation expense, amortization of acquired intangible assets, and legal costs related to acquisitions.
Free Cash Flow
|
| | | | | | | | | | | | | | | |
| | Year Ended December 31, | | Six Months Ended
June 30, |
| | 2016 | | 2017 | | 2017 | | 2018 |
| | (In thousands) |
| Net cash provided by operating activities | $ | 17,806 |
| | $ | 39,618 |
| | $ | 26,502 |
| | $ | 39,286 |
|
| Less: Capital expenditures | (14,372 | ) | | (18,272 | ) | | (5,462 | ) | | (7,631 | ) |
| Free cash flow | $ | 3,434 |
| | $ | 21,346 |
| | $ | 21,040 |
| | $ | 31,655 |
|
We calculate free cash flow as net cash provided by operating activities less capital expenditures.
MANAGEMENT’S DISCUSSION AND ANALYSIS OF FINANCIAL CONDITION AND RESULTS OF OPERATIONS
The following discussion and analysis of our financial condition and results of operations should be read in conjunction with the section titled “Selected Consolidated Financial and Other Data” and the consolidated financial statements and related notes thereto included elsewhere in this prospectus. This discussion contains forward-looking statements that involve risks and uncertainties. Our actual results could differ materially from those discussed below. Factors that could cause or contribute to such differences include, but are not limited to, those identified below and those discussed in the section titled “Risk Factors” included elsewhere in this prospectus.
Overview
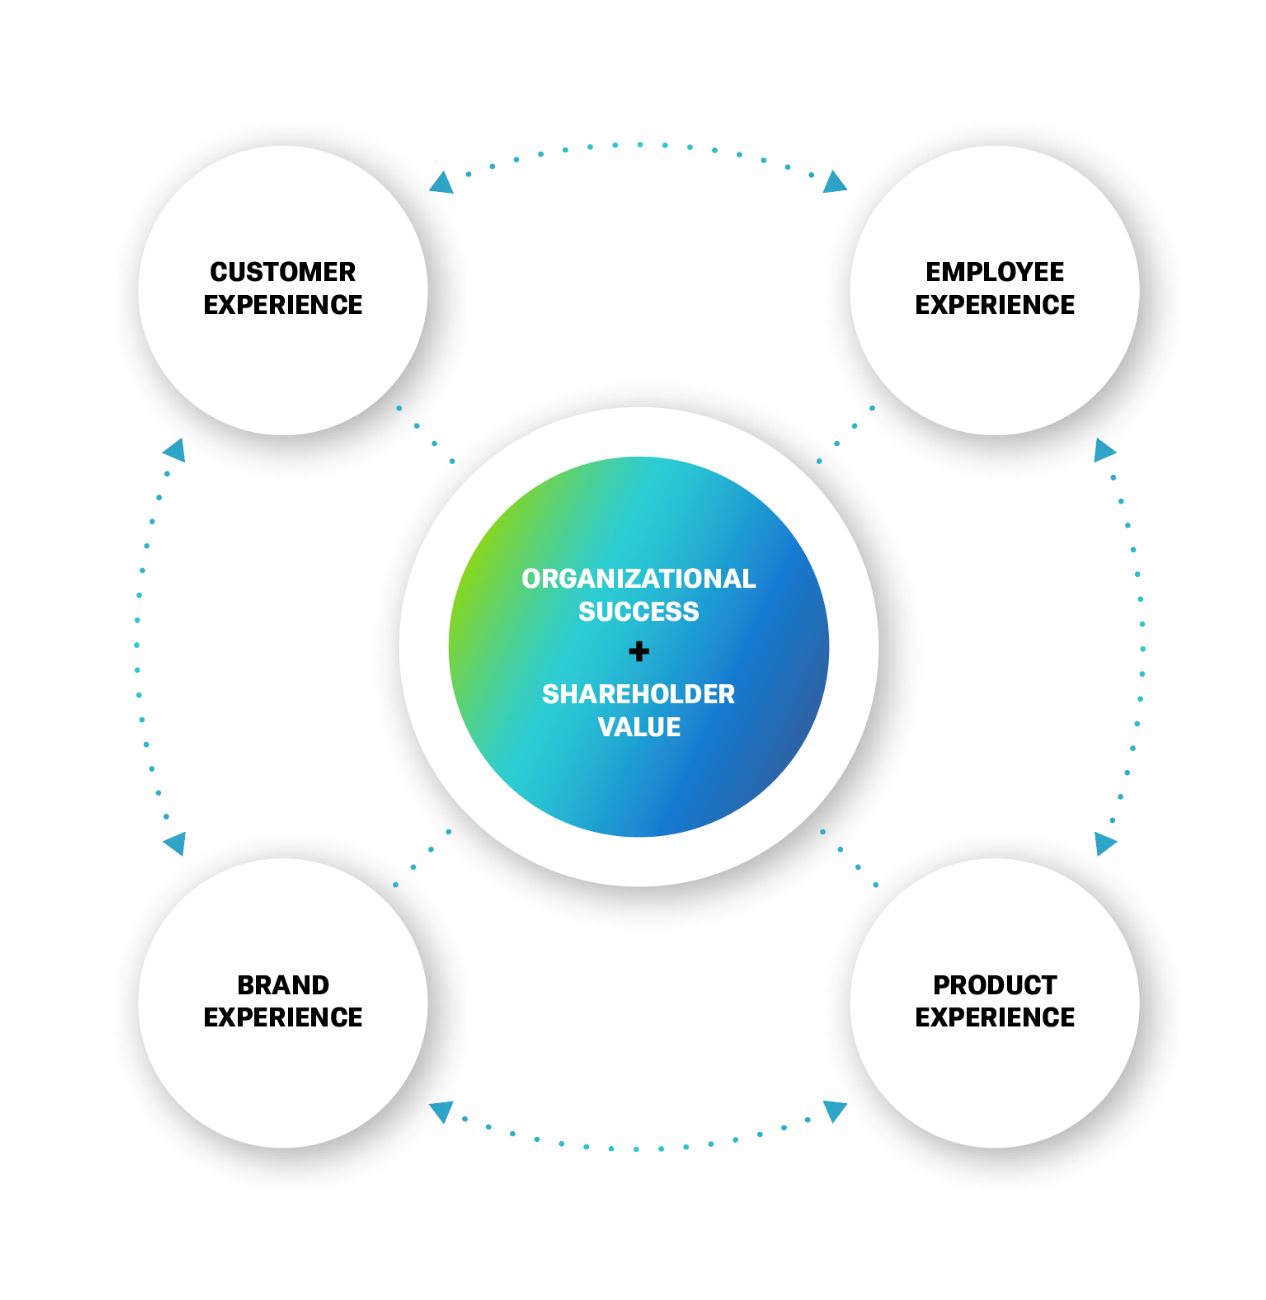
We created the first experience management platform to manage customer, employee, brand, and product experiences.
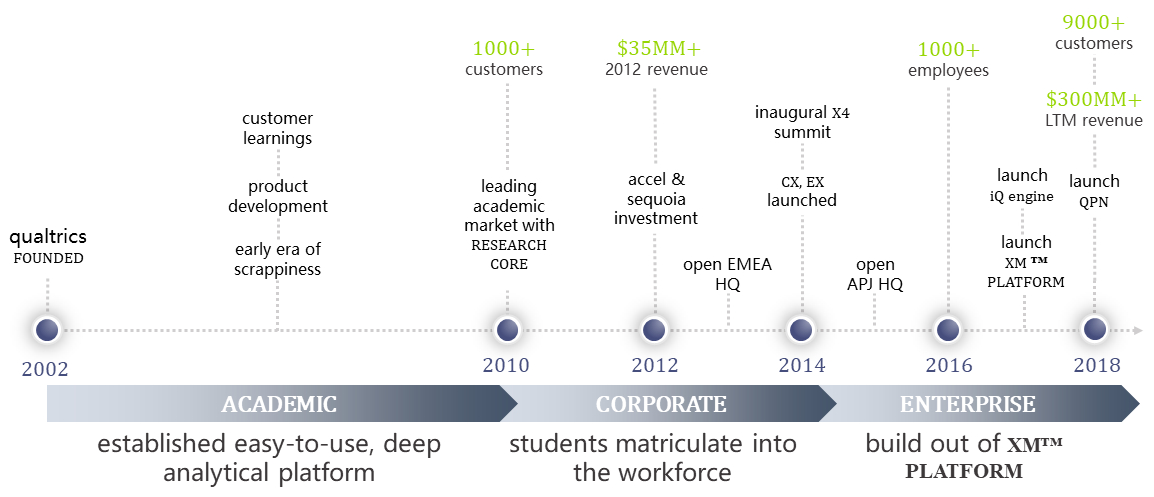
We’ve built a thriving global business with over 9,000 customers, including over 75% of the Fortune 100 and over 30% of the 2018 Global 2000. Our revenue was $190.6 million and $289.9 million for the years ended December 31, 2016 and 2017, respectively, representing an annual growth rate of 52%. We generated a net loss of $12.0 million for the year ended December 31, 2016 and net income of $2.6 million for the year ended December 31, 2017. We have been free cash flow positive in every year since inception. We generated positive free cash flow of $3.4 million and $21.3 million for the years ended December 31, 2016 and 2017, respectively.
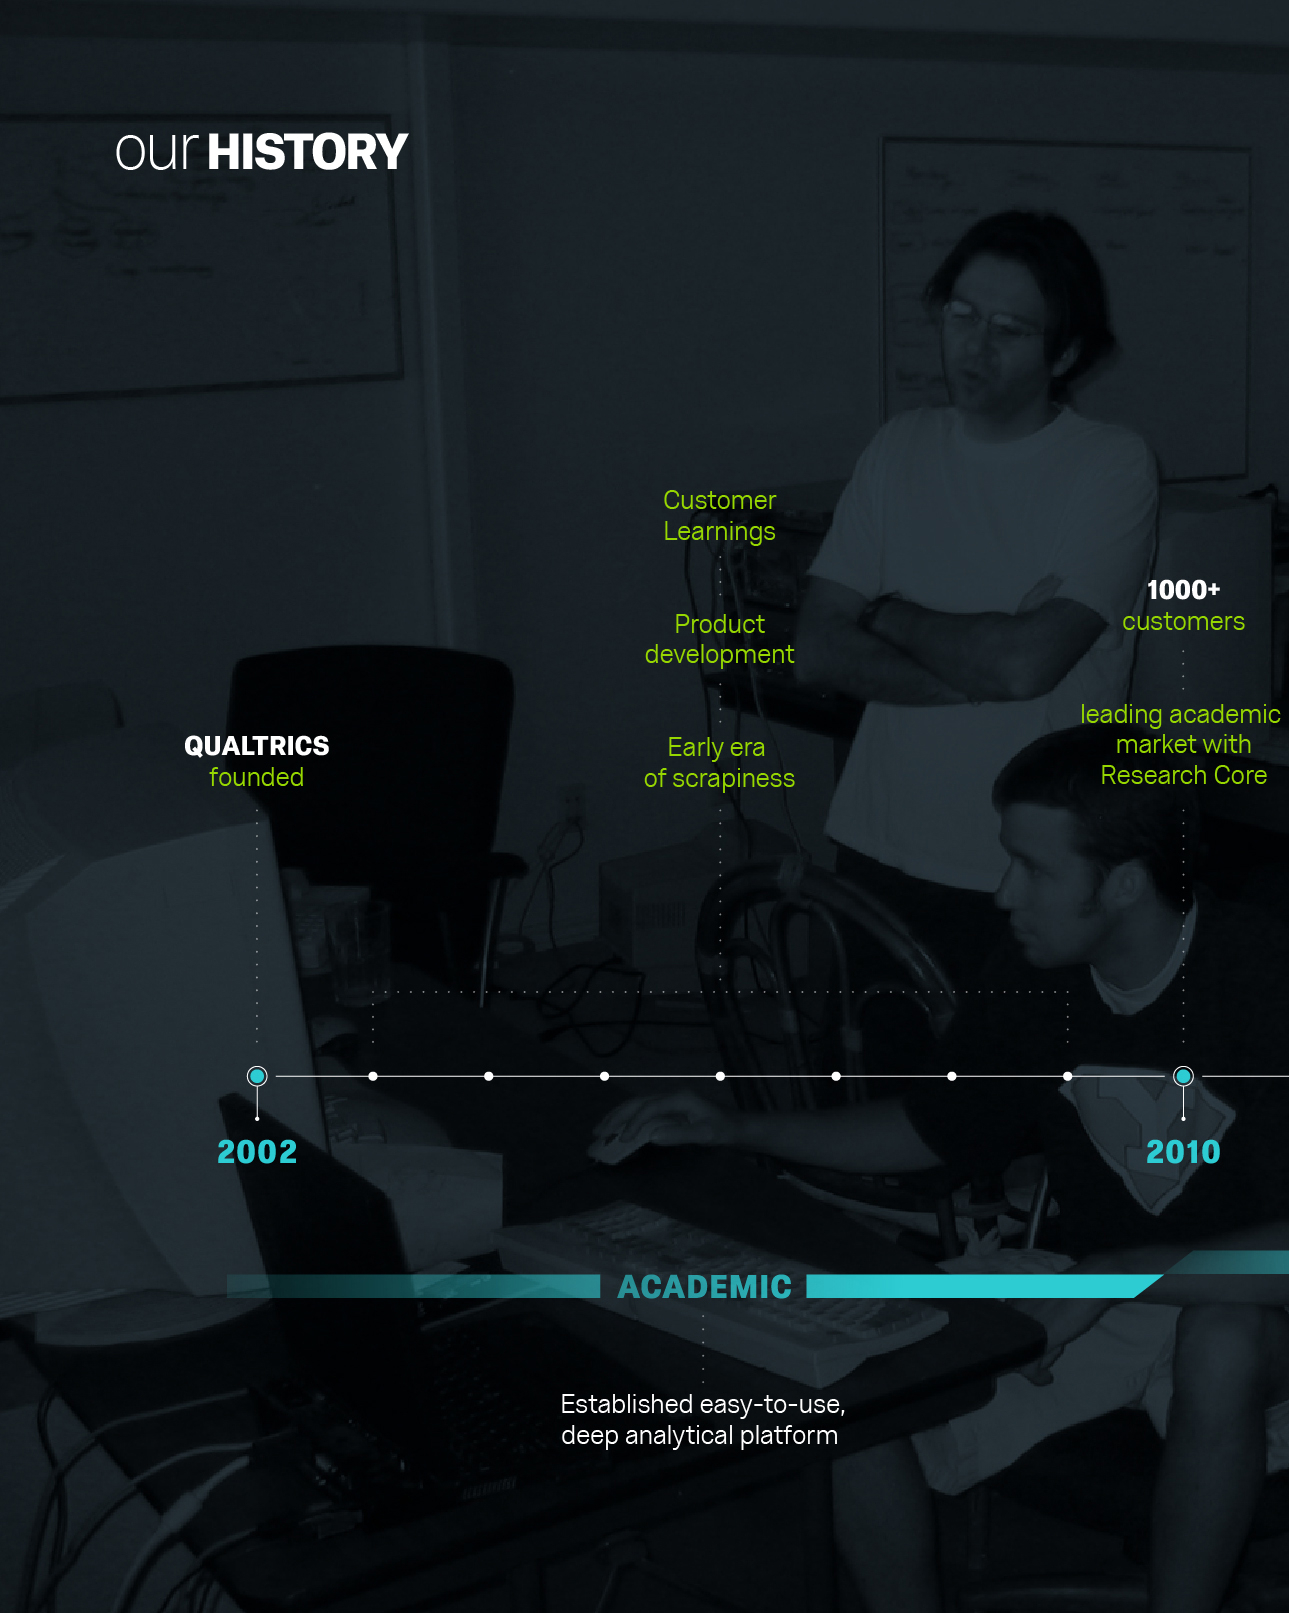
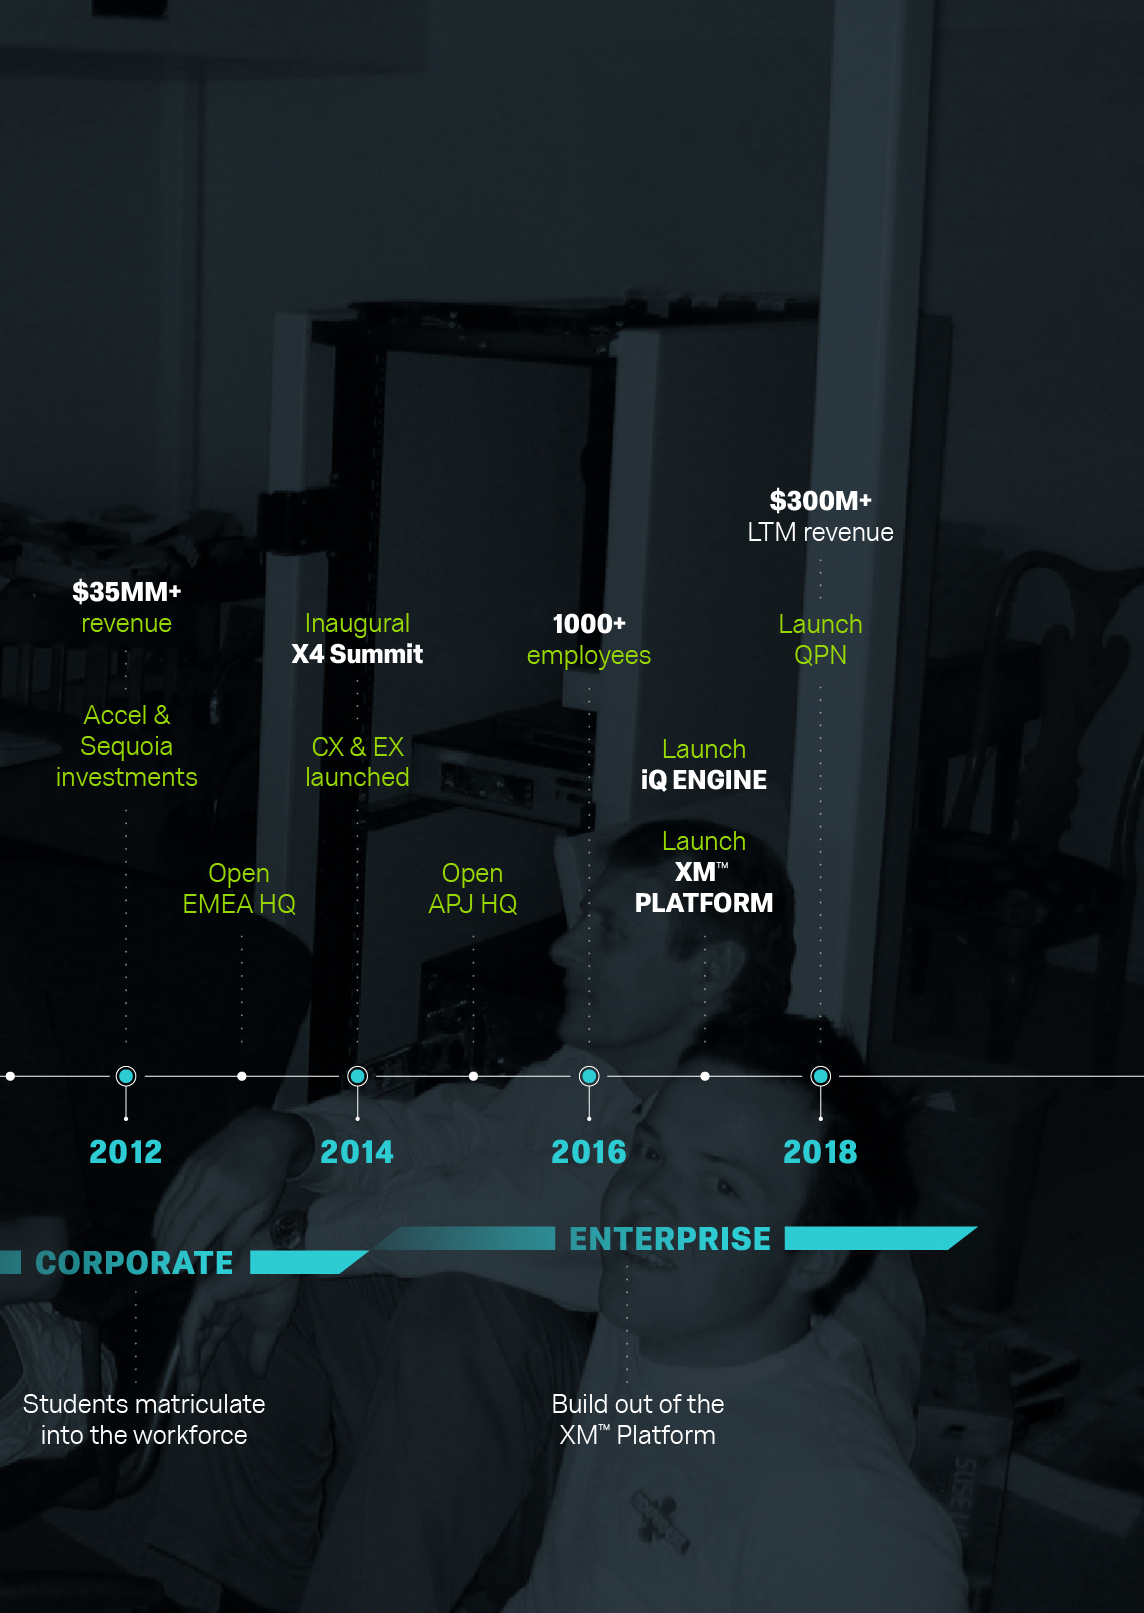
The following graphic highlights key milestones since our founding in 2002.
We generate revenue by selling subscriptions to our XM™ Platform, sales of our Research on Demand solution, and professional services which serve the experience management needs of our diverse customer base. We typically bill for subscriptions at the beginning of the contract term and recognize revenue ratably over the term of the subscription period. Over 98% of our subscription agreements have a subscription period of one year or longer. Our largest customer accounted for less than 2% of revenue for the year ended December 31, 2017. International customers can pay in U.S. dollars or a select number of foreign currencies.
We price and package our subscription software solutions based on the capacity and functionality needs of our customers. This pricing and packaging includes volume of expected responses, number of users accessing our platform, number of employees, and level of functionality provided, such as dashboards, iQ functionality, and integrations. Our customers expand their subscriptions as they increase volume of responses, add solutions, add users, and increase features within each solution.
Our Research on Demand solution allows customers to gain market intelligence by procuring a curated group of respondents and returning tangible results, while conforming to best-practice design and methodology. We provide our Research on Demand solution as an automated, software-led approach, providing ease of use and efficiency for our customers. Our Research on Demand solution is sold into our existing XM™ Platform customers, resulting in minimal incremental sales and marketing spend, and leads to higher platform usage for customers.
Our professional services consist primarily of implementations, configurations, and integrations to help customers deploy our XM™ Platform. Other revenue consists of consulting and training fees.
We deploy an efficient, hybrid go-to-market model that addresses the many ways a customer may typically choose to buy. We utilize a combination of a highly productive inside sales team and a field sales team, as well as partners, to target customers.
Key Factors Affecting Our Performance
We believe that the growth and future success of our business depends on many factors. While each of these factors presents significant opportunities for our business, they also pose important challenges that we must successfully address in order to sustain our growth and improve our results of operations.
New Customer Acquisition
We are focused on continuing to acquire new customers to support our long-term growth. We have invested, and expect to continue to invest, heavily in our sales and marketing efforts to drive customer acquisition. As of September 30, 2018, we had over 9,000 customers, including over 75% of the Fortune 100 and 30% of the 2018 Global 2000. Our customers include businesses of all sizes, academic institutions, and government organizations. We define the number of customers at the end of any particular period as the number of parties or individual legal entities that have entered into a separate subscription contract with us for which the term has not ended. For avoidance of doubt, international subsidiaries of parent entities are not separately counted, but business units, brands, and academic institutions are counted if they are distinct legal entities. A single organization or customer may have multiple paid business accounts.
Expand Sales to Existing Customers
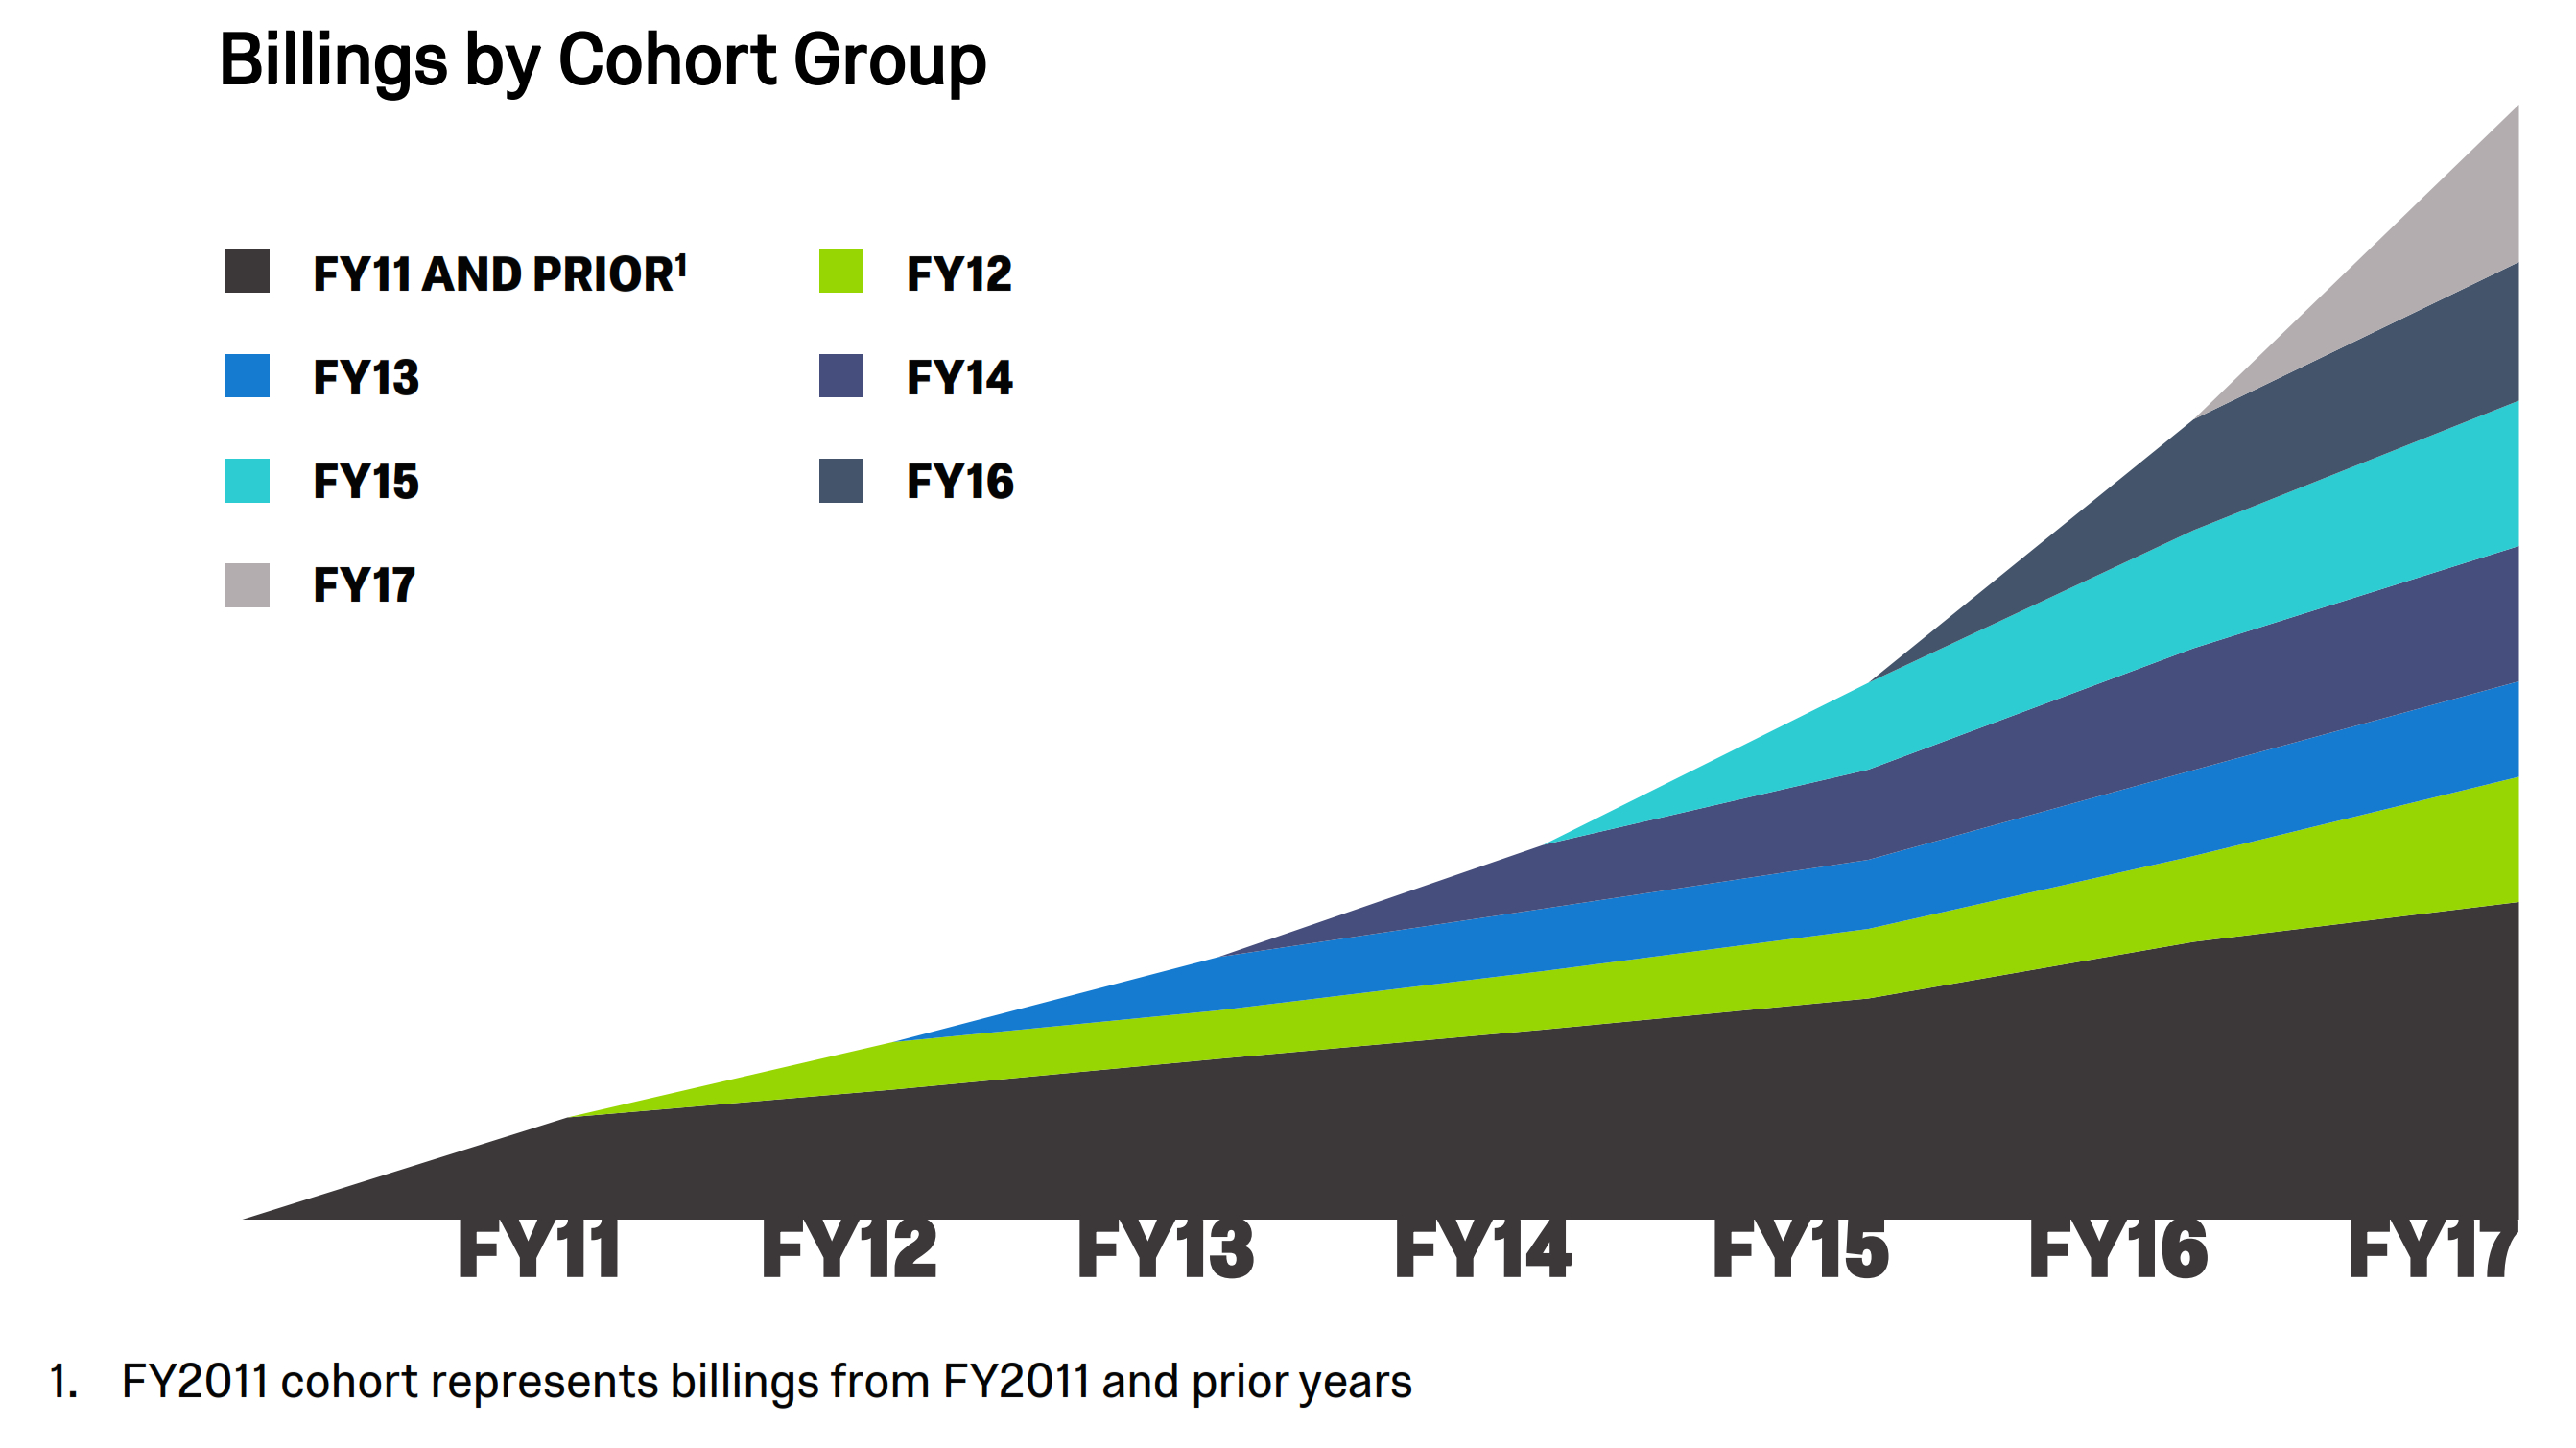
Our business model relies on rapidly and efficiently landing new customers and expanding our relationship with them over time. As the chart below illustrates, we have a history of attracting new customers, driving expanded use through upselling our XM™ Platform across the enterprise, and cross-selling through the subsequent deployment of additional solutions throughout the enterprise. Specifically, the chart below illustrates the total subscription billings of each cohort over the periods presented with each cohort representing customers who made their first purchase from us in a given fiscal year. For example, the 2014 cohort includes all customers that purchased their first subscription from us between January 1, 2014 and December 31, 2014. Our subscription billings from customers for the 2012 cohort, 2013 cohort, 2014 cohort, 2015 cohort, and 2016 cohort in 2017 represent an increase over each cohort’s initial aggregate subscription billings by 2.6x, 1.8x, 2.1x, 1.7x, and 1.2x, respectively.
We also use dollar-based net retention rate to measure our ability to expand business generated from our existing customers. Our net retention rate compares our subscription revenue from the same set of customers across comparable periods. We calculate our net retention rate on a trailing four-quarter basis. As of June 30, 2018, our net retention rate was 122%. We have benefited from a higher net retention rate from our customers in the 2017 Global 2000, since they
often purchase our solutions for one use case or within one department, and then expand across their organization. As such, our net retention rate for our customers in the 2017 Global 2000 was 143% as of June 30, 2018.
We focus on a dollar-based net retention rate metric because it captures the full impact on revenue of our customers expanding, decreasing, or ending their subscriptions. We do not focus on a numerical-based customer retention rate because it does not include expansion or contraction and it does not take into account the amount a customer spends and as such does not necessarily correlate consistently to revenue. Because the dollar-based net retention rate also includes expansion and contraction of customers, there is (and will likely continue to be for the foreseeable future) a material disparity between the dollar-based net retention rate and a numerical-based customer retention rate, which by definition cannot exceed 100%. We note that there has not been a material change in our period-over-period actual customer retention rate and associated impact on revenue during the periods presented.
To calculate our net retention rate, we first calculate the subscription revenue in one quarter from a cohort of customers that were customers at the beginning of the same quarter in the prior fiscal year, or cohort customers. We repeat this calculation for each quarter in the trailing four-quarter period. The numerator for net retention rate is the sum of subscription revenue from cohort customers for the four most recent quarters, or numerator period, and the denominator is the sum of subscription revenue from cohort customers for the four quarters preceding the numerator period. Net retention rate for the 2017 Global 2000 cohort follows the same calculation for our customers in the 2017 Global 2000 at the initial date of the calculation.
Investing for Growth
Our investment for growth encompasses multiple critical areas, including international growth, enterprise sales, partner network, and product expansion.
Our international revenue represented 19%, 21%, and 22% of our total revenue in the years ended December 31, 2016 and 2017 and the six months ended June 30, 2018, respectively. We started our international expansion in English-speaking countries, such as Ireland, the United Kingdom, and Australia, as we were able to leverage our core technologies. We historically sold into international markets out of our Provo, Utah headquarters. Since opening our first international office in Dublin, Ireland in 2013, we now have sales offices in nine countries around the globe. These include Australia, Canada, France, Germany, Ireland, Japan, Singapore, and the United Kingdom, along with the United States. See Note 2 to our accompanying financial statements for further information regarding revenue by geographic areas.
In order to expand and further penetrate our enterprise customer base, we have made and plan to continue to make significant investments in expanding our direct sales teams and enterprise grade delivery capability, as well as increasing our brand awareness. We have also added sales support capability, such as subject matter experts and solution architects to help provide turnkey program delivery.
At our March 2018 X4 Summit, we announced the launch of the Qualtrics Partner Network, or QPN. We are building out a network of content and consulting partners, delivery partners, and technology partners who enrich our offerings, scale our coverage, and help us to reach a broader audience than we would be able to on our own. We expect our partner channel to extend our sales reach and provide implementation leverage both domestically and internationally.
We continue to enable our technology to draw insights and ensure that we are best serving our customers’ needs. We believe this will lead to increased retention and positive customer referrals that will continue to generate new business both within organizations and with new customers. Since 2015, we have established offices in Seattle and Poland to expand our engineering headcount focused on product innovation and development.
Key Business Metrics
We review a number of operating and financial metrics, including the following key metrics to evaluate our business, measure our performance, identify trends affecting our business, formulate business plans, and make strategic decisions.
Large Customers
We define our large customers as those spending more than $100,000 in subscription annual contract value, or Subscription ACV, on our XM™ Platform. We believe that our ability to increase the number of large customers is an indicator of our market penetration, the growth of our business, and our potential future business opportunities. Increasing awareness of our platform and its broad range of capabilities, coupled with the mainstream adoption of cloud-based technology, has expanded the diversity of our large customer base to include organizations of different sizes across virtually all industries. This cohort represented approximately 52% of our subscription revenue for the six months ended June 30, 2018.
The below table sets forth the number of our large customers as of the respective dates presented:
|
| | | | | | | | | | | | | | | | | |
| | | | | | | | | | Growth Rate |
| | December 31, | | June 30, | | December 31, | | June 30, |
| | 2016 | | 2017 | | 2017 | | 2018 | | 2017 | | 2018 |
| | | | | | | | | | | | |
| Large customers | 288 |
| | 454 |
| | 362 |
| | 576 |
| | 58 | % | | 59 | % |
Calculated Billings
We use calculated billings to measure and monitor our ability to provide our business with the working capital generated by upfront payments from our customers and our ability to sell subscriptions to our XM™Platform to both existing and new customers. Calculated billings represent our total revenue plus the change in deferred revenue in the period, as presented in our consolidated financial statements. Calculated billings in any particular period aims to reflect amounts invoiced for subscriptions to access our XM™Platform, Research on Demand, and professional services related to our new and existing customers. We primarily invoice our subscription customers annually in advance. While we believe that calculated billings provides valuable insight into the cash that will be generated from sales of our subscriptions, Research on Demand, and professional services, this metric may vary from period-to-period for a number of reasons, and therefore has a number of limitations as a quarter-to-quarter or year-over-year comparative measure. These reasons include, but are not limited to, (i) a variety of customer contractual terms could result in some periods having a higher proportion of multi-year time-based subscriptions than other periods, (ii) as we experience an increasing number of larger sales transactions, the timing of executing these larger transactions has and will continue to vary, with some transactions occurring in quarters subsequent to or in advance of those that we anticipated, (iii) fluctuations in payment terms affecting the billings recognized in a particular period, and (iv) seasonality in our billings, as described in quarterly trends. Because of these and other limitations, you should consider calculated billings along with revenue and our other GAAP financial results.
|
| | | | | | | | | | | | | | | | | | | | | |
| | | | | | | | | | Period-over-Period Growth Rate |
| | Year Ended December 31, | | Six Months Ended
June 30, | | Year Ended December 31, | | Six Months Ended
June 30, |
| | 2016 | | 2017 | | 2017 | | 2018 | | 2017 | | 2018 |
| | (In thousands) | | | | |
| Revenue | $ | 190,603 |
| | $ | 289,903 |
| | $ | 131,434 |
|
| $ | 184,197 |
| | | | |
| Add: Total deferred revenue, end of period | 133,391 |
| | 185,145 |
| | 157,688 |
| | 219,305 |
| | | | |
| Less: Total deferred revenue, beginning of period | (85,930 | ) | | (133,391 | ) | | (133,391 | ) | | (185,145 | ) | | | | |
| Calculated billings | $ | 238,064 |
| | $ | 341,657 |
| | $ | 155,731 |
| | $ | 218,357 |
| | 44 | % | | 40 | % |
Components of Our Results of Operations
Revenue
We generate revenue from sales of subscriptions to our XM™ Platform and sales of Research on Demand, together with related professional services. Sales of XM™ Platform subscriptions and Research on Demand together accounted for 95% and 91% of revenue for the years ended December 31, 2016 and 2017, respectively, and 92% and 92% of revenue for the six months ended June 30, 2017 and 2018, respectively.
Subscription revenue is recognized ratably over the related contractual term generally beginning on the date that our XM™ Platform is made available to our customer. Our subscription agreements generally have annual contractual terms, while some have multi-year contractual terms. Our agreements generally cannot be canceled with refund. We primarily bill in advance for our annual contracts and in advance annually for our multi-year contracts. Amounts that have been billed are initially recorded as deferred revenue until the revenue is recognized. Subscription revenue as a percentage of total revenue may fluctuate period to period.
Research on Demand revenue is recognized upon completion of the project. Our agreements generally cannot be canceled with refund. We typically bill in advance for Research on Demand projects, with a growing number of customers purchasing annual retainers to fund future projects. Amounts that have been billed are initially recorded as deferred revenue until the revenue is recognized. Research on Demand revenue as a percentage of total revenue may fluctuate period to period.
Professional services and other revenue includes fees associated with new and expanding customers requesting implementation and integration services. We price professional services on a fixed fee basis. Our agreements generally cannot be canceled with refund. We typically bill in advance for professional services and other revenue. Amounts that have been billed are initially recorded as deferred revenue until the revenue is recognized. As we continue to increase deployment of partners to fulfill these services, we generally expect professional services and other revenue to decrease as a percentage of total revenue in the long term, although this percentage may fluctuate from period to period.
Cost of revenue and gross margin
Cost of revenue. Our cost of subscription revenue includes expenses related to operating our XM™ Platform in data centers, depreciation of our data center equipment, and the amortization of our capitalized internal-use software and acquired technology. Cost of revenue also includes employee-related costs associated with our customer support and XM™ Platform operations organizations. Our cost of Research on Demand revenue includes vendor costs and employee-related costs associated with the delivery of the solution. Our cost of professional services and other revenue includes employee-related costs associated with the delivery of these services, as well as delivery partner costs. Additionally, we make allocations of certain overhead costs, primarily based on headcount, to each of these costs of revenue. Allocated overhead includes costs such as facilities, including rent, utilities, depreciation on leasehold improvements, and shared information technology costs. We expect our cost of revenue will increase in absolute dollars in future periods as we continue to invest in our business.
Gross margin. Gross margin is gross profit expressed as a percentage of revenue. Our gross margin may fluctuate from period to period based on the timing of capital expenditures and the related depreciation expense, or other changes in stock-based compensation, employee-related costs, infrastructure costs, revenue mix, timing of completion of Research on Demand and professional services projects, as well as revenue fluctuations. As we continue to increase the utilization of our internal infrastructure, we generally expect our gross margin to remain relatively consistent in the near term and to increase modestly in the long term, although our gross margin may fluctuate from period to period depending on the interplay of all of these factors.
Operating expenses
Research and development. Our research and development expenses consist primarily of employee-related costs for our engineering, product, and design teams, and allocated overhead.
We plan to continue to hire employees for our engineering, product, and design teams to support our efforts to enhance the functionality and improve the reliability, availability, and scalability of our XM™ Platform. We expect that research and development costs will increase in absolute dollars in future periods. However, we expect our research and development expenses to decrease as a percentage of our revenue over the long term, although our research and development expenses may fluctuate as a percentage of our revenue from period to period due to the timing and extent of these expenses.
Sales and marketing. Our sales and marketing expenses relate to both inside and outbound sales activities, as well as expansion efforts with our current customers. The expenses consist primarily of employee-related costs, marketing programs and events, including our X4 Summit, lead generation fees, and allocated overhead. Sales commissions earned by our sales team and the related payroll taxes, that we consider to be incremental and recoverable costs of obtaining a contract with an organization, are deferred and amortized over an estimated period of benefit of five years.
We plan to continue to invest in sales and marketing to grow our customer base and increase our brand awareness. The trend and timing of sales and marketing expenses will depend in part on the timing of marketing campaigns. We expect that sales and marketing expenses will increase in absolute dollars in future periods. However, we expect our sales and marketing expenses to decrease as a percentage of our revenue over the long term, although our sales and marketing expenses may fluctuate as a percentage of our revenue from period to period due to the timing and extent of these expenses.
General and administrative. Our general and administrative expenses consist primarily of employee-related costs for our legal, finance, people operations, and other administrative teams, as well as certain executives. In addition,
general and administrative expenses include allocated overhead, outside legal, accounting and other professional fees, and non-income based taxes.
We expect to incur additional general and administrative expenses to support our growth as well as our transition to being a publicly traded company. We expect that general and administrative expenses will increase in absolute dollars in future periods. Our general and administrative expenses may fluctuate as a percentage of our revenue from period to period due to the timing and extent of these expenses.
As a result of certain stock-based compensation charges described in “—Critical Accounting Policies and Judgments—Stock-based compensation,” we expect our research and development, sales and marketing, and general and administrative expenses to increase significantly in absolute dollars and as a percentage of revenue in the quarter during which we complete this offering.
Other income (expense), net
Other income (expense), net consists of other non-operating gains or losses, including those related to interest income and foreign currency transaction gains and losses.
Provision for income taxes
On December 22, 2017, the 2017 Tax Cuts and Jobs Act, or Tax Act, was enacted into law and the new legislation contains several key tax provisions that affect us, including the reduction of the corporate income tax rate to 21%, effective January 1, 2018. We are required to recognize the effect of the tax law changes in the period of enactment. As such, we have remeasured our consolidated deferred tax assets and liabilities to reflect the lower rate and have also reassessed the net realizability of those deferred tax assets and liabilities.
In December 2017, the SEC staff issued Staff Accounting Bulletin No. 118, Income Tax Accounting Implications of the Tax Cuts and Jobs Act, or SAB 118, which allows us to record provisional amounts during a measurement period not to extend beyond one year of the enactment date. Since the Tax Act was passed late in the fourth quarter of 2017, and ongoing guidance and accounting interpretation are expected throughout calendar year 2018, we consider the accounting of the deferred tax remeasurements and state tax conformity to be incomplete but have made a reasonable estimate and have included provisional amounts in the financial statements. Due to the forthcoming guidance and our ongoing analysis of final year-end data and tax positions, we expect to complete our analysis within the measurement period provided for and in accordance with SAB 118.
Deferred income tax balances reflect the effects of temporary differences between the financial reporting and tax bases of our assets and liabilities using enacted tax rates expected to apply when taxes are actually paid or recovered. In addition, deferred tax assets and liabilities are recorded for net operating loss and credit carryforwards.
A valuation allowance is provided against deferred tax assets unless it is more likely than not that they will be realized based on all available positive and negative evidence. Such evidence includes, but is not limited to, recent cumulative earnings or losses, expectations of future taxable income by taxing jurisdiction, and the carry-forward periods available for the utilization of deferred tax assets.
We use a two-step approach to recognizing and measuring uncertain income tax positions. The first step is to evaluate the tax position for recognition by determining if the weight of available evidence indicates it is more likely than not that the position will be sustained on audit. The second step is to measure the tax benefit as the largest amount, which is more than 50% likely of being realized upon ultimate settlement. We recognize interest and penalties related to unrecognized tax benefits as a component of income tax expense. Significant judgment is required to evaluate uncertain tax positions.
Although we believe that we have adequately reserved for our uncertain tax positions, we can provide no assurance that the final tax outcome of these matters will not be materially different. We evaluate our uncertain tax positions on a regular basis and evaluations are based on a number of factors, including changes in facts and circumstances, changes in tax law, such as the Tax Act, correspondence with tax authorities during the course of an audit, and effective settlement of audit issues.
To the extent that the final tax outcome of these matters is different than the amounts recorded, such differences will affect the provision for income taxes in the period in which such determination is made and could have a material impact on our financial condition and results of operations.
As of December 31, 2017, we had approximately $39.0 million of consolidated federal NOL carryforwards and $41.7 million of state NOL carryforwards available to offset future taxable income. If unused, the federal and state NOL carryforwards will begin to expire in 2035 and 2025, respectively. As of December 31, 2017, we had federal research tax credit carryforwards of $4.2 million and state research tax credit carryforwards of $0.7 million, which if not utilized will begin to expire in 2034 and 2029, respectively. These NOL and research tax credit carryforwards could expire unused and be unavailable to reduce future income tax liabilities, which could adversely affect our profitability. Realization of our NOL carryforwards and tax credits is dependent on generating sufficient taxable income prior to their expiration. Although a portion of these carryforwards and tax credits may be subject to the provisions of Internal Revenue Code Sections 382 and 383, we have not performed a formal study to determine the amount of a limitation, if any. The use of the NOL carryforwards and tax credits may have additional limitations resulting from future ownership changes or other factors under Sections 382 and 383 of the Internal Revenue Code.
Results of Operations
The following table sets forth our results of operations for the periods presented:
|
| | | | | | | | | | | | | | | |
| | Year Ended December 31, | | Six Months Ended
June 30, |
| | 2016 | | 2017 | | 2017 | | 2018 |
| | (In thousands) |
| Revenue: | | | | | | | |
| Subscription | $ | 142,525 |
| | $ | 213,274 |
| | $ | 96,152 |
| | $ | 136,267 |
|
| Research on Demand | 38,147 |
| | 51,812 |
| | 24,384 |
| | 33,304 |
|
| Professional services and other | 9,931 |
| | 24,817 |
| | 10,898 |
| | 14,626 |
|
| Total revenue | 190,603 |
| | 289,903 |
| | 131,434 |
| | 184,197 |
|
Cost of revenue(1)(2): | | | | |
| |
|
| Subscription | 27,904 |
| | 25,552 |
| | 11,432 |
| | 17,062 |
|
| Research on Demand | 21,322 |
| | 26,639 |
| | 12,940 |
| | 14,449 |
|
| Professional services and other | 11,754 |
| | 26,893 |
| | 11,523 |
| | 17,595 |
|
| Total cost of revenue | 60,980 |
| | 79,084 |
| | 35,895 |
| | 49,106 |
|
| Gross profit | 129,623 |
| | 210,819 |
| | 95,539 |
| | 135,091 |
|
Operating expenses(1)(2): | | | | |
| |
|
| Research and development | 22,303 |
| | 40,680 |
| | 18,227 |
| | 27,977 |
|
| Sales and marketing | 95,919 |
| | 140,524 |
| | 69,294 |
| | 91,320 |
|
| General and administrative | 21,909 |
| | 26,522 |
| | 11,595 |
| | 19,073 |
|
| Total operating expenses | 140,131 |
| | 207,726 |
| | 99,116 |
| | 138,370 |
|
| Operating income (loss) | (10,508 | ) | | 3,093 |
| | (3,577 | ) | | (3,279 | ) |
| Other non-operating income (expense), net | (501 | ) | | 1,370 |
| | 671 |
| | 320 |
|
| Income (loss) before income taxes | (11,009 | ) | | 4,463 |
| | (2,906 | ) | | (2,959 | ) |
| Provision for income taxes | 1,025 |
| | 1,907 |
| | 799 |
| | 457 |
|
| Net income (loss) | $ | (12,034 | ) | | $ | 2,556 |
| | $ | (3,705 | ) | | $ | (3,416 | ) |
____________________
| |
(1) | Includes stock-based compensation expense as follows: |
|
| | | | | | | | | | | | | | | |
| | Year Ended December 31, | | Six Months Ended
June 30, |
| | 2016 | | 2017 | | 2017 | | 2018 |
| | (In thousands) |
| Cost of revenue | $ | 7 |
| | $ | 7 |
| | $ | 4 |
| | $ | 4 |
|
| Research and development | 309 |
| | 1,438 |
| | 1,242 |
| | 908 |
|
| Sales and marketing | 64 |
| | 4,415 |
| | 4,411 |
| | 410 |
|
| General and administrative | 322 |
| | 1,087 |
| | 475 |
| | 706 |
|
| Total stock-based compensation | $ | 702 |
| | $ | 6,947 |
| | $ | 6,132 |
| | $ | 2,028 |
|
____________________
(2) Includes amortization of acquired intangible assets as follows:
|
| | | | | | | | | | | | | | | |
| | Year Ended
December 31, | | Six Months Ended
June 30, |
| | 2016 | | 2017 | | 2017 | | 2018 |
| | (In thousands) |
| Cost of revenue | $ | 81 |
| | $ | 135 |
| | $ | 68 |
| | $ | 260 |
|
| Research and development | — |
| | — |
| | — |
| | — |
|
| Sales and marketing | 47 |
| | 32 |
| | 30 |
| | 60 |
|
| General and administrative | 59 |
| | 59 |
| | 30 |
| | 62 |
|
| Total amortization of acquired intangible assets | $ | 187 |
| | $ | 226 |
| | $ | 128 |
| | $ | 382 |
|
The following table sets forth our results of operations for the periods presented as a percentage of our total revenue for those periods:
|
| | | | | | | | | | | |
| | Year Ended December 31, | | Six Months Ended
June 30, |
| | 2016 | | 2017 | | 2017 | | 2018 |
| | (as a % of revenue) |
| Revenue: | | | | | | | |
| Subscription | 75 |
| | 74 |
| | 73 |
| | 74 |
|
| Research on Demand | 20 |
| | 18 |
| | 19 |
| | 18 |
|
| Professional services and other | 5 |
| | 8 |
| | 8 |
| | 8 |
|
| Total revenue | 100 | % | | 100 | % | | 100 | % | | 100 | % |
| Cost of revenue: | | | | |
| |
|
| Subscription | 15 |
| | 9 |
| | 9 |
| | 9 |
|
| Research on Demand | 11 |
| | 9 |
| | 10 |
| | 8 |
|
| Professional services and other | 6 |
| | 9 |
| | 9 |
| | 10 |
|
| Total cost of revenue | 32 |
| | 27 |
| | 28 |
| | 27 |
|
| Gross profit | 68 |
| | 73 |
| | 72 |
| | 73 |
|
| Operating expenses: | | | | |
| |
|
| Research and development | 12 |
| | 14 |
| | 14 |
| | 15 |
|
| Sales and marketing | 50 |
| | 49 |
| | 53 |
| | 50 |
|
| General and administrative | 12 |
| | 9 |
| | 9 |
| | 10 |
|
| Total operating expenses | 74 |
| | 72 |
| | 76 |
| | 75 |
|
| Operating income (loss) | (6 | ) | | 1 |
| | (4 | ) | | (2 | ) |
| Other non-operating income, net | — |
| | — |
| | 1 |
| | — |
|
| Income (loss) before income taxes | (6 | ) | | 1 |
| | (3 | ) | | (2 | ) |
| Provision for income taxes | — |
| | — |
| | 1 |
| | — |
|
| Net income (loss) | (6 | )% | | 1 | % | | (4 | )% | | (2 | )% |
Comparison of six months ended June 30, 2017 and 2018
Revenue
|
| | | | | | | | | | | | | | |
| | Six Months Ended June 30, | | | | |
| | 2017 | | 2018 | | $ Change | | % Change |
| | (In thousands) | | |
| Subscription and Research on Demand revenue | $ | 120,536 |
| | $ | 169,571 |
| | $ | 49,035 |
| | 41 | % |
| Professional services and other revenue | 10,898 |
| | 14,626 |
| | 3,728 |
| | 34 | % |
| Total revenue | $ | 131,434 |
| | $ | 184,197 |
| | $ | 52,763 |
| | 40 | % |
Subscription and Research on Demand revenue increased $49.0 million, or 41%, for the six months ended June 30, 2018, as compared to the six months ended June 30, 2017. This increase was primarily due to increased demand for our solutions from new and existing customers. Of the increase in subscription and Research on Demand revenue for the six months ended June 30, 2018 compared to the same period of 2017, approximately $18.3 million was attributable to existing customers and approximately $30.7 million was attributable to new customers. The increase in revenue from existing customers was driven by upgrades of current subscription and Research on Demand solutions and the purchase of additional solutions within our platform. Pricing changes were not material to the increase in revenue. Professional services and other revenue increased $3.7 million, or 34%, during the six months ended June 30, 2018, as compared to the six months ended June 30, 2017. This increase was primarily due to an increase in revenue from large customers, who generally require more services. Professional services and other revenue did not increase at the same rate as subscription and Research on Demand revenue due to an increased deployment of partners to fulfill these services.
Cost of revenue, gross profit, and gross margin
|
| | | | | | | | | | | | | | |
| | Six Months Ended June 30, | | | | |
| | 2017 | | 2018 | | $ Change | | % Change |
| | (In thousands) | | |
| Cost of subscription and Research on Demand revenue | $ | 24,372 |
| | $ | 31,511 |
| | $ | 7,139 |
| | 29 | % |
| Cost of professional services and other revenue | 11,523 |
| | 17,595 |
| | 6,072 |
| | 53 | % |
| Total cost of revenue | 35,895 |
| | 49,106 |
| | 13,211 |
| | 37 | % |
| | | | | | | | |
| Subscription and Research on Demand gross profit | 96,164 |
| | 138,060 |
| | 41,896 |
| | 44 | % |
| Professional services and other gross profit | (625 | ) | | (2,969 | ) | | (2,344 | ) | | 375 | % |
| Total gross profit | $ | 95,539 |
| | $ | 135,091 |
| | $ | 39,552 |
| | 41 | % |
| | | | | | | | |
| Subscription and Research on Demand gross margin | 80 | % | | 81 | % | | | | |
| Professional services and other gross margin | (6 | )% | | (20 | )% | | | | |
| Total gross margin | 73 | % | | 73 | % | | | | |
Cost of subscription and Research on Demand revenue increased $7.1 million, or 29%, for the six months ended June 30, 2018, as compared to the six months ended June 30, 2017, compared to subscription and Research on Demand revenue growth of 41% over the same period. This increase was driven by a $4.1 million increase in server costs, $1.3 million increase in employee-related costs, and $0.7 million increase in Research on Demand vendor costs. Costs did not increase at the same rate as revenue primarily due to improved pricing from Research on Demand vendors. Cost of professional services and other revenue increased $6.1 million, or 53%, during the six months ended June 30, 2018,
as compared to the six months ended June 30, 2017. This increase was primarily due to an increase in employee-related costs of $5.2 million as we grew our professional services headcount to support a growing number of large customers. Our gross margins remained steady at 73% during the six months ended June 30, 2017 and 2018.
Operating Expenses
Research and development
|
| | | | | | | | | | | | | | |
| | Six Months Ended June 30, | | | | |
| | 2017 | | 2018 | | $ Change | | % Change |
| | (In thousands) | | |
| Research and development | $ | 18,227 |
| | $ | 27,977 |
| | $ | 9,750 |
| | 53 | % |
Research and development expenses increased $9.8 million, or 53%, for the six months ended June 30, 2018, as compared to the six months ended June 30, 2017. This increase was primarily driven by a $10.0 million increase in employee-related costs from headcount growth as we continue to add to and enhance our solutions and a $0.3 million increase in allocated overhead costs, partially offset by a $1.7 million increase in capitalized internal-use software.
Sales and marketing
|
| | | | | | | | | | | | | | |
| | Six Months Ended June 30, | | | | |
| | 2017 | | 2018 | | $ Change | | % Change |
| | (In thousands) | | |
| Sales and marketing | $ | 69,294 |
| | $ | 91,320 |
| | $ | 22,026 |
| | 32 | % |
Sales and marketing expenses increased $22.0 million, or 32%, for the six months ended June 30, 2018, as compared to the six months ended June 30, 2017. This increase was primarily due to a $13.8 million increase in employee-related costs, including increased sales commission expenses due to increased billings. Additional increases include $4.5 million in marketing campaign expenses, and $1.0 million in allocated overhead costs.
General and administrative
|
| | | | | | | | | | | | | | |
| | Six Months Ended June 30, | | | | |
| | 2017 | | 2018 | | $ Change | | % Change |
| | (In thousands) | | |
| General and administrative | $ | 11,595 |
| | $ | 19,073 |
| | $ | 7,478 |
| | 64 | % |
General and administrative expenses increased $7.5 million, or 64%, for the six months ended June 30, 2018, as compared to the six months ended June 30, 2017. This increase was primarily due to a $2.2 million increase in employee-related costs driven by headcount growth as we prepare to operate as a public company, a $1.7 million increase in legal and professional expenses as we prepare to operate as a public company, a $1.5 million increase in support of charitable organizations, a $0.5 million increase in travel expenses, and a $0.4 million increase in allocated overhead costs.
Other non-operating income (expense), net
Other non-operating income (expense), net decreased $0.4 million for the six months ended June 30, 2018, as compared to the six months ended June 30, 2017, primarily due to an increase in foreign currency losses of $0.8 million related to monetary assets and liabilities denominated in foreign currencies, partially offset by a $0.4 million increase in interest income.
Provision for income taxes
Provision for income taxes did not materially change during the six months ended June 30, 2018 as compared to the six months ended June 30, 2017.
Comparison of the years ended December 31, 2016 and 2017
Revenue
|
| | | | | | | | | | | | | | |
| | Year Ended December 31, | | | | |
| | 2016 | | 2017 | | $ Change | | % Change |
| | (In thousands) | | |
| Subscription and Research on Demand revenue | $ | 180,672 |
| | $ | 265,086 |
| | $ | 84,414 |
| | 47 | % |
| Professional services and other revenue | 9,931 |
| | 24,817 |
| | 14,886 |
| | 150 | % |
| Total revenue | $ | 190,603 |
| | $ | 289,903 |
| | $ | 99,300 |
| | 52 | % |
Subscription and Research on Demand revenue increased by $84.4 million, or 47%, for the year ended December 31, 2017 as compared to the year ended December 31, 2016. This increase was due primarily to increased demand for our solutions from new and existing customers. Of the increase in subscription and Research on Demand revenue for the year ended December 31, 2017 compared to the year ended December 31, 2016, approximately $59.8 million was attributable to existing customers and approximately $24.6 million was attributable to new customers. The increase in revenue from existing customers was driven by upgrades of current subscription and Research on Demand solutions and the purchase of additional solutions within our platform. Pricing changes were not material to the increase in revenue. Professional services and other revenue increased $14.9 million, or 150%, from the year ended December 31, 2016 to the year ended December 31, 2017. This increase was primarily due to beginning to sell implementation and consulting services in the second half of year ended December 31, 2016, as well as an increase in revenue from large customers, who generally require more services.
Cost of revenue, gross profit, and gross margin
|
| | | | | | | | | | | | | | |
| | Year Ended December 31, | | | | |
| | 2016 | | 2017 | | $ Change | | % Change |
| | (In thousands) | | |
| Cost of subscription and Research on Demand revenue | $ | 49,226 |
| | $ | 52,191 |
| | $ | 2,965 |
| | 6 | % |
| Cost of professional services and other revenue | 11,754 |
| | 26,893 |
| | 15,139 |
| | 129 | % |
| Total cost of revenue | 60,980 |
| | 79,084 |
| | 18,104 |
| | 30 | % |
| | | | | | | | |
| Subscription and Research on Demand gross profit | 131,446 |
| | 212,895 |
| | 81,449 |
| | 62 | % |
| Professional services and other gross profit | (1,823 | ) | | (2,076 | ) | | (253 | ) | | 14 | % |
| Total gross profit | $ | 129,623 |
| | $ | 210,819 |
| | $ | 81,196 |
| | 63 | % |
| | | | | | | | |
| Subscription and Research on Demand gross margin | 73 | % | | 80 | % | | | | |
| Professional services and other gross margin | (18 | )% | | (8 | )% | | | | |
| Total gross margin | 68 | % | | 73 | % | | | | |
Cost of subscription and Research on Demand revenue increased $3.0 million, or 6%, for the year ended December 31, 2017, as compared to the year ended December 31, 2016, while subscription and Research on Demand revenue grew 47% over the same periods. This increase was driven by a $4.0 million increase in Research on Demand vendor
costs, a $3.7 million increase in server costs, partially offset by a $5.1 million decrease in employee-related costs. Costs did not increase at the same rate as revenue primarily due to a more efficient customer support model and improved pricing with Research on Demand vendors. We realized customer support efficiencies through platform enhancements and added online support resources, which allowed us to transition certain employees from support activities to account expansion activities. Cost of professional services and other revenue increased $15.1 million, or 129%, for the year ended December 31, 2017, as compared to the year ended December 31, 2016. This increase was primarily due to an $11.3 million increase in employee-related costs as we grew our professional services and implementation teams, and a $1.8 million increase in partnership costs related to delivery partners.
Our gross margins increased from 68% in 2016 to 73% in 2017 due to costs increasing at a slower rate than our revenue, as described above.
Operating Expenses
Research and development
|
| | | | | | | | | | | | | | |
| | Year Ended December 31, | | | | |
| | 2016 | | 2017 | | $ Change | | % Change |
| | (In thousands) | | |
| Research and development | $ | 22,303 |
| | $ | 40,680 |
| | $ | 18,377 |
| | 82 | % |
Research and development expenses increased $18.4 million, or 82%, for the year ended December 31, 2017, as compared to the year ended December 31, 2016. This increase was primarily driven by a $19.1 million increase in employee-related costs from headcount growth as we continue to add to and enhance our products and a $0.9 million increase in allocated overhead costs, partially offset by a $2.4 million increase in capitalized internal-use software.
Sales and marketing
|
| | | | | | | | | | | | | | |
| | Year Ended December 31, | | | | |
| | 2016 | | 2017 | | $ Change | | % Change |
| | (In thousands) | | |
| Sales and marketing | $ | 95,919 |
| | $ | 140,524 |
| | $ | 44,605 |
| | 47 | % |
Sales and marketing expenses increased $44.6 million, or 47%, for the year ended December 31, 2017, as compared to the year ended December 31, 2016. The increase in sales and marketing was primarily driven by a $38.7 million increase in employee-related costs, including increased sales commission expenses due to increased billings. The increased expenses include the transition of certain employees from support activities to account expansion activities, further complementing our land and expand strategy. Additional increases include $3.3 million in marketing campaign expenses.
General and administrative
|
| | | | | | | | | | | | | | |
| | Year Ended December 31, | | | | |
| | 2016 | | 2017 | | $ Change | | % Change |
| | (In thousands) | | |
| General and administrative | $ | 21,909 |
| | $ | 26,522 |
| | $ | 4,613 |
| | 21 | % |
General and administrative expenses increased $4.6 million, or 21%, for the year ended December 31, 2017, as compared to the year ended December 31, 2016. The increase in general and administrative expenses was primarily due to a $2.7 million increase in employee-related costs driven by headcount growth as we prepare to operate as a public company, a $0.7 million increase in legal and professional expenses, and $0.5 million due to increase in support of charitable organizations.
Other non-operating income (expense), net
Other non-operating income (expense), net increased $1.9 million for the year ended December 31, 2017, as compared to the year ended December 31, 2016, primarily due to an increase in foreign currency gains of $1.6 million related to monetary assets and liabilities denominated in foreign currencies.
Provision for income taxes
Provision for income taxes increased $0.9 million for the year ended December 31, 2017, as compared to the year ended December 31, 2016, due to our growth internationally.
On December 22, 2017, the Tax Cuts and Jobs Act of 2017, or the Tax Act, was enacted. The Tax Act contains several key tax provisions that affect us, including, but not limited to, reducing the U.S. federal corporate tax rate from 34% to 21% for tax years beginning after December 31, 2017, imposing a one-time repatriation tax on deemed repatriated earnings and changing rules related to uses and limitations of net operating loss carryforwards created in tax years beginning after December 31, 2017. We have not completed our accounting assessment for the effects of the Tax Act. We currently maintain a full valuation allowance recorded against our U.S. federal deferred tax assets. As such, the remeasurement of the deferred tax assets and related valuation allowance did not have a material impact to the financial statements for the year ended December 31, 2017, other than disclosures in our financial statements.
The increase in our effective tax rate to 42.7% for the year ended December 31, 2017, as compared to negative 9.3% for the year ended December 31, 2016, was primarily driven by differences in the U.S. statutory tax rate and our effective tax rate for the respective years, as described below.
Our effective tax rate for the year ended December 31, 2017 was 42.7%. The difference between the U.S. statutory rate of 34% and our effective tax rate is primarily driven by rate increases due to federal tax legislation (147.8%), equity compensation (34.9%), and foreign and state taxes (28.4%). These increases to our effective tax rate are partially offset by rate decreases due to changes in the valuation allowance (125%) and tax credits (78.4%). The effective tax rate increase related to federal tax legislation and decrease related to changes in the valuation allowance are due to the Tax Act, which resulted in a remeasurement of our deferred tax assets and related valuation allowance based on a reduction in the U.S. federal corporate tax rate from 34% to 21%. The effective tax rate increase related to equity compensation is due to non-deductible compensation expense for tax purposes resulting from a tender offer for employee equity awards. The changes resulting from the federal tax legislation and employee tender offer are not expected to recur.
Our effective tax rate for the year ended December 31, 2016 was negative 9.3%. The difference between the U.S. statutory rate of 34% and our effective tax rate is primarily driven by rate adjustments due to changes in the valuation allowance (49.5%), which was partially offset by a rate adjustment due to tax credits (7.6%). Our valuation allowance increased to offset increases in our deferred tax assets primarily driven by additional net operating loss carryforwards.
We currently anticipate that our effective tax rate, before discrete adjustments that may occur, for 2018 to be approximately 37%.
Quarterly Results of Operations
The following table sets forth our unaudited quarterly statements of operations data for each of the last eight quarters ended June 30, 2018. The information for each of these quarters has been prepared on the same basis as the audited annual financial statements included elsewhere in this prospectus and, in the opinion of management, includes all adjustments, which includes only normal recurring adjustments, necessary for the fair statement of the results of operations for these periods. This data should be read in conjunction with our audited consolidated financial statements and related notes thereto included elsewhere in this prospectus. These quarterly results of operations are not necessarily indicative of our future results of operations that may be expected for any future period.
|
| | | | | | | | | | | | | | | | | | | | | | | | | | | | | | | |
| | Three Months Ended |
| | Sept. 30, | | Dec. 31, | | March 31, | | June 30, | | Sept. 30, | | Dec. 31, | | March 31, | | June 30, |
| | 2016 | | 2016 | | 2017 | | 2017 | | 2017 | | 2017 | | 2018 | | 2018 |
| | (In thousands) |
| Revenue: | | | | | | | | | | | | | | | |
| Subscription | $ | 36,872 |
| | $ | 41,552 |
| | $ | 45,376 |
| | $ | 50,776 |
| | $ | 55,548 |
| | $ | 61,576 |
| | $ | 64,233 |
| | $ | 72,034 |
|
| Research on Demand | 10,057 |
| | 10,417 |
| | 11,634 |
| | 12,750 |
| | 13,140 |
| | 14,287 |
| | 15,108 |
| | 18,196 |
|
| Professional services and other | 2,601 |
| | 2,705 |
| | 4,870 |
| | 6,028 |
| | 6,958 |
| | 6,960 |
| | 7,711 |
| | 6,915 |
|
| Total revenue | 49,530 |
| | 54,674 |
| | 61,880 |
| | 69,554 |
| | 75,646 |
| | 82,823 |
| | 87,052 |
| | 97,145 |
|
Cost of revenue(1)(2): | | | | | | | | | | | | | | | |
| Subscription | 7,046 |
| | 7,757 |
| | 5,513 |
| | 5,919 |
| | 6,730 |
| | 7,391 |
| | 8,198 |
| | 8,864 |
|
| Research on Demand | 5,587 |
| | 6,353 |
| | 6,372 |
| | 6,568 |
| | 6,645 |
| | 7,054 |
| | 7,392 |
| | 7,057 |
|
| Professional services and other | 3,169 |
| | 4,078 |
| | 5,670 |
| | 5,853 |
| | 7,336 |
| | 8,034 |
| | 8,366 |
| | 9,229 |
|
| Total cost of revenue | 15,802 |
| | 18,188 |
| | 17,555 |
| | 18,340 |
| | 20,711 |
| | 22,479 |
| | 23,956 |
| | 25,150 |
|
| Gross profit | 33,728 |
| | 36,486 |
| | 44,325 |
| | 51,214 |
| | 54,935 |
| | 60,344 |
| | 63,096 |
| | 71,995 |
|
Operating expenses(1)(2): | | | | | | | | | | | | | | | |
| Research and development | 5,797 |
| | 6,998 |
| | 7,685 |
| | 10,542 |
| | 10,851 |
| | 11,602 |
| | 12,680 |
| | 15,297 |
|
| Sales and marketing | 24,002 |
| | 25,776 |
| | 33,202 |
| | 36,092 |
| | 33,700 |
| | 37,530 |
| | 46,044 |
| | 45,276 |
|
| General and administrative | 5,442 |
| | 6,763 |
| | 5,447 |
| | 6,148 |
| | 5,644 |
| | 9,283 |
| | 10,142 |
| | 8,931 |
|
| Total operating expenses | 35,241 |
| | 39,537 |
| | 46,334 |
| | 52,782 |
| | 50,195 |
| | 58,415 |
| | 68,866 |
| | 69,504 |
|
| Operating income (loss) | (1,513 | ) | | (3,051 | ) | | (2,009 | ) | | (1,568 | ) | | 4,740 |
| | 1,929 |
| | (5,770 | ) | | 2,491 |
|
| Other non-operating income (expense), net | (31 | ) | | (467 | ) | | 201 |
| | 470 |
| | 460 |
| | 238 |
| | 1,034 |
| | (714 | ) |
| Income (loss) before income taxes | (1,544 | ) | | (3,518 | ) | | (1,808 | ) | | (1,098 | ) | | 5,200 |
| | 2,167 |
| | (4,736 | ) | | 1,777 |
|
| Provision for (benefit from) income taxes | 204 |
| | 300 |
| | 441 |
| | 358 |
| | 523 |
| | 585 |
| | (345 | ) | | 802 |
|
| Net income (loss) | $ | (1,748 | ) | | $ | (3,818 | ) | | $ | (2,249 | ) | | $ | (1,456 | ) | | $ | 4,677 |
| | $ | 1,582 |
| | $ | (4,391 | ) | | $ | 975 |
|
____________________
| |
(1) | Includes stock-based compensation expense as follows: |
|
| | | | | | | | | | | | | | | | | | | | | | | | | | | | | | | |
| | Three Months Ended |
| | Sept. 30, | | Dec. 31, | | March 31, | | June 30, | | Sept. 30, | | Dec. 31, | | March 31, | | June 30, |
| | 2016 | | 2016 | | 2017 | | 2017 | | 2017 | | 2017 | | 2018 | | 2018 |
| | (In thousands) |
| Cost of revenue | $ | 2 |
| | $ | 2 |
| | $ | 2 |
| | $ | 2 |
| | $ | 2 |
| | $ | 2 |
| | $ | 2 |
| | $ | 2 |
|
| Research and development | 2 |
| | 307 |
| | 119 |
| | 1,123 |
| | 106 |
| | 106 |
| | 171 |
| | 737 |
|
| Sales and marketing | 16 |
| | 15 |
| | 12 |
| | 4,399 |
| | 3 |
| | 3 |
| | 3 |
| | 407 |
|
| General and administrative | 65 |
| | 241 |
| | 5 |
| | 470 |
| | 275 |
| | 299 |
| | 415 |
| | 291 |
|
| Total stock-based compensation | $ | 85 |
| | $ | 565 |
| | $ | 138 |
| | $ | 5,994 |
| | $ | 386 |
| | $ | 410 |
| | $ | 591 |
| | $ | 1,437 |
|
____________________
(2) Includes amortization of acquired intangible assets as follows:
|
| | | | | | | | | | | | | | | | | | | | | | | | | | | | | | | |
| | Three Months Ended |
| | Sept. 30, | | Dec. 31, | | March 31, | | June 30, | | Sept. 30, | | Dec. 31, | | March 31, | | June 30, |
| | 2016 | | 2016 | | 2017 | | 2017 | | 2017 | | 2017 | | 2018 | | 2018 |
| | (In thousands) |
| Cost of revenue | $ | 34 |
| | $ | 34 |
| | $ | 34 |
| | $ | 34 |
| | $ | 34 |
| | $ | 34 |
| | $ | 34 |
| | $ | 226 |
|
| Research and development | — |
| | — |
| | — |
| | — |
| | — |
| | — |
| | — |
| | — |
|
| Sales and marketing | 20 |
| | 20 |
| | 20 |
| | 10 |
| | — |
| | — |
| | — |
| | 60 |
|
| General and administrative | 15 |
| | 15 |
| | 15 |
| | 15 |
| | 15 |
| | 15 |
| | 15 |
| | 47 |
|
| Total amortization of acquired intangible assets | $ | 69 |
| | $ | 69 |
| | $ | 69 |
| | $ | 59 |
| | $ | 49 |
| | $ | 49 |
| | $ | 49 |
| | $ | 333 |
|
The following table sets forth our results of operations for the last eight quarterly periods presented as a percentage of our total revenue for those periods:
|
| | | | | | | | | | | | | | | | | | | | | | | |
| | Three Months Ended |
| | Sept. 30, | | Dec. 31, | | March 31, | | June 30, | | Sept. 30, | | Dec. 31, | | March 31, | | June 30, |
| | 2016 | | 2016 | | 2017 | | 2017 | | 2017 | | 2017 | | 2018 | | 2018 |
| | (As a % of revenue) |
| Revenue: | | | | | | | | | | | | | | | |
| Subscription | 75 |
| | 76 |
| | 73 |
| | 73 |
| | 74 |
| | 74 |
| | 74 |
| | 74 |
|
| Research on Demand | 20 |
| | 19 |
| | 19 |
| | 18 |
| | 17 |
| | 17 |
| | 17 |
| | 19 |
|
| Professional services and other | 5 |
| | 5 |
| | 8 |
| | 9 |
| | 9 |
| | 9 |
| | 9 |
| | 7 |
|
| Total revenue | 100 | % | | 100 | % | | 100 | % | | 100 | % | | 100 | % | | 100 | % | | 100 | % | | 100 | % |
| Cost of revenue: | | | | | | | | | | | | | | | |
| Subscription | 14 |
| | 14 |
| | 9 |
| | 9 |
| | 9 |
| | 9 |
| | 9 |
| | 9 |
|
| Research on Demand | 11 |
| | 12 |
| | 10 |
| | 9 |
| | 9 |
| | 8 |
| | 9 |
| | 7 |
|
| Professional services and other | 6 |
| | 7 |
| | 9 |
| | 8 |
| | 9 |
| | 10 |
| | 10 |
| | 10 |
|
| Total cost of revenue | 32 |
| | 33 |
| | 28 |
| | 26 |
| | 27 |
| | 27 |
| | 28 |
| | 26 |
|
| Gross profit | 68 |
| | 67 |
| | 72 |
| | 74 |
| | 73 |
| | 73 |
| | 72 |
| | 74 |
|
| Operating expenses: | | | | | | | | | | | | | | | |
| Research and development | 12 |
| | 13 |
| | 12 |
| | 15 |
| | 14 |
| | 14 |
| | 14 |
| | 16 |
|
| Sales and marketing | 48 |
| | 47 |
| | 54 |
| | 52 |
| | 45 |
| | 45 |
| | 53 |
| | 47 |
|
| General and administrative | 11 |
| | 12 |
| | 9 |
| | 9 |
| | 7 |
| | 11 |
| | 12 |
| | 9 |
|
| Total operating expenses | 71 |
| | 72 |
| | 75 |
| | 76 |
| | 66 |
| | 70 |
| | 79 |
| | 72 |
|
| Operating income (loss) | (3 | ) | | (5 | ) | | (3 | ) | | (2 | ) | | 7 |
| | 3 |
| | (7 | ) | | 2 |
|
| Other non-operating income (expense), net | — |
| | (1 | ) | | — |
| | 1 |
| | 1 |
| | — |
| | 1 |
| | — |
|
| Income (loss) before income taxes | (3 | ) | | (6 | ) | | (3 | ) | | (1 | ) | | 8 |
| | 3 |
| | (6 | ) | | 2 |
|
| Provision for income taxes | — |
| | 1 |
| | 1 |
| | — |
| | — |
| | — |
| | — |
| | 1 |
|
| Net income (loss) | (3 | )% | | (7 | )% | | (4 | )% | | (1 | )% | | 8 | % | | 3 | % | | (6 | )% | | 1 | % |
Quarterly Revenue Trends
Our revenue increased sequentially in each of the quarters presented primarily due to increases in the number of customers and expansion with existing customers. We generally experience seasonality in billings with our customers, and we typically record a higher percentage of billings in our fourth quarter. However, because we recognize subscription revenue ratably over the terms of our subscription agreements, a substantial portion of the subscription revenue that we report in each period is attributable to the recognition of deferred revenue relating to agreements that we entered into during previous periods. Consequently, increases or decreases in new or renewal billings in any one period may not be immediately reflected as subscription revenue for that period. Beginning in 2017, our professional services and other revenue increased as a percentage of revenue primarily due to an increase in revenue from large customers, who generally require more services. For the three months ended June 30, 2018, professional services and other revenue decreased as a percentage of total revenue due to an increased deployment of partners to fulfill these services.
Quarterly cost of revenue and gross margin trends
Beginning in 2017, our quarterly subscription cost of revenue decreased to 9% of revenue compared to 14% for the three months ended December 31, 2016. The decrease is primarily due to a more efficient customer support model. We realized this efficiency through platform enhancements and added online support resources, which allowed us to transition certain employees from support activities to account expansion activities. Beginning in 2017, our Research
on Demand cost of revenue has decreased as a percentage of revenue primarily due to improved pricing from key vendors. From the three months ended September 30, 2016 through the three months ended March 31, 2018, our professional services and other cost of revenue have gradually increased as a percentage of revenue primarily due to an increase in revenue from large customers, who generally require more services. We generally expect our gross margin to remain relatively constant in the near term and to increase modestly in the long term, although our gross margin may fluctuate from period to period depending on the interplay of all of these factors.
Quarterly operating expense trends
Sales and marketing expenses were 54% and 53% of revenue for the three months ended March 31, 2017 and 2018, respectively, which was higher than all other quarters. The increased percentage of sales and marketing expenses relative to revenue in the first fiscal quarter of each fiscal year is primarily due to our X4 Summit that we host annually during the first quarter. In addition, operating expenses increased during the second fiscal quarter of 2017 due to recognizing $5.8 million of stock-based compensation related to a modification of equity awards in conjunction with an approved tender offer executed by our investors.
Our overall total quarterly operating expenses increased sequentially in the quarters presented primarily due to headcount growth in connection with the expansion of our business.
Liquidity and Capital Resources
As of June 30, 2018, we had cash and cash equivalents of $135.6 million. Our cash and cash equivalents consist primarily of cash and money market funds. As of June 30, 2018, we had $7.5 million of our cash and cash equivalents held by our foreign subsidiaries. We do not expect to incur material taxes in the event we repatriate any of these amounts.
Since our inception, we have financed our operations primarily through cash generated from our operations and equity issuances. Our principal uses of cash in recent periods have been funding our operations and making capital expenditures.
We believe our existing cash and cash equivalents, together with cash provided by operations, will be sufficient to meet our needs for at least the next 12 months. Our future capital requirements will depend on many factors, including our revenue growth rate, subscription renewal activity, the timing and extent of spending to support further infrastructure development and research and development efforts, the timing and extent of additional capital expenditures to invest in existing and new office spaces, the satisfaction of tax withholding obligations for the release of RSUs the expansion of sales and marketing and international operation activities, the introduction of new product capabilities and enhancement of our XM™ Platform, and the continuing market acceptance of our platform. We have based this estimate on assumptions that may prove to be wrong, and we could use our available capital resources sooner than we currently expect. We may in the future enter into arrangements to acquire or invest in complementary businesses, services, and technologies, including intellectual property rights. We may be required to seek additional equity or debt financing. In the event that additional financing is required from outside sources, we may not be able to raise it on terms acceptable to us or at all. If we are unable to raise additional capital when desired, our business, results of operations, and financial condition would be materially and adversely affected.
Our cash flow activities were as follows for the periods presented:
|
| | | | | | | | | | | | | | | |
| | Years Ended December 31, | | Six Months Ended June 30, |
| | 2016 | | 2017 | | 2017 | | 2018 |
| | (In thousands) |
| Net cash provided by operating activities | $ | 17,806 |
| | $ | 39,618 |
| | $ | 26,502 |
| | $ | 39,286 |
|
| Net cash used in investing activities | (15,338 | ) | | (18,272 | ) | | (5,462 | ) | | (16,147 | ) |
| Net cash provided by (used in) financing activities | (130 | ) | | 29,847 |
| | 29,847 |
| | — |
|
| Effect of exchange rate changes on cash and cash equivalents | (82 | ) | | 382 |
| | 308 |
| | (962 | ) |
| Net increase in cash and cash equivalents | $ | 2,256 |
|
| $ | 51,575 |
| | $ | 51,195 |
| | $ | 22,177 |
|
Operating activities
Our largest source of operating cash is cash collections from our paying customers for subscriptions to our XM™ Platform. Our primary uses of cash from operating activities are for employee-related costs, infrastructure-related expenditures, and marketing expenses. Net cash provided by operating activities is impacted by our net income (loss) adjusted for certain non-cash items, including depreciation and amortization expenses and stock-based compensation, as well as the effect of changes in operating assets and liabilities.
Net cash provided by operating activities during the six months ended June 30, 2018 was $39.3 million, which resulted from net loss of $3.4 million, adjusted for non-cash charges of $14.8 million and net cash inflow of $27.9 million from changes in operating assets and liabilities. Non-cash charges primarily consisted of $7.0 million for depreciation and amortization expense, $6.2 million for amortization of deferred contract acquisition costs and $2.0 million for stock-based compensation expense. The net cash inflow from changes in operating assets and liabilities was primarily the result of a $34.2 million increase in deferred revenue due to advance invoicing in accordance with our subscription contracts.
Net cash provided by operating activities during the six months ended June 30, 2017 was $26.5 million, which resulted from net loss of $3.7 million, adjusted for non-cash charges of $16.0 million and net cash inflow of $14.2 million from changes in operating assets and liabilities. Non-cash charges primarily consisted of $5.0 million for depreciation and amortization expense, $4.4 million for amortization of deferred contract acquisition costs and $6.1 million for stock-based compensation expense. The net cash inflow from changes in operating assets and liabilities was primarily the result of a $24.3 million increase in deferred revenue due to advance invoicing in accordance with our subscription contracts.
For the year ended December 31, 2017, net cash provided by operating activities was $39.6 million, which resulted from net income of $2.6 million, adjusted for non-cash charges of $27.9 million and net cash inflow of $9.2 million from changes in operating assets and liabilities. Non-cash charges primarily consisted of $10.8 million for depreciation and amortization expense, $9.6 million of amortization of deferred contract acquisition costs and $6.9 million for stock-based compensation expense. The inflow from operating assets and liabilities was primarily due to an increase of $51.8 million in deferred revenue from advance invoicing in accordance with our subscription contracts, $6.6 million aggregate increase in accrued liabilities and accounts payable, partially offset by $21.2 million increase in accounts receivable due to billings growth and timing of collections, $19.7 million increase in deferred contract acquisition costs as our sales commission payments increased due to addition of new customers and expansion of our existing customer subscriptions, and $6.7 million increase in prepaid and other current assets.
For the year ended December 31, 2016, net cash provided by operating activities was $17.8 million, which resulted from net loss of $12.0 million, adjusted for non-cash charges of $16.2 million and net cash inflow of $13.6 million from changes in operating assets and liabilities. Non-cash charges primarily consisted of $9.0 million for depreciation and amortization expense, $6.5 million of amortization of deferred contract acquisition costs and $0.7 million for stock-based compensation expense. The inflow from operating assets and liabilities was primarily due to an increase of $47.5 million in deferred revenue from advance invoicing in accordance with our customer contracts, $6.3 million aggregate
increase in accrued liabilities and accounts payable, partially offset by $24.9 million increase in accounts receivable due to billings growth and timing of collections, $13.1 million increase in deferred contract acquisition costs as our sales commission payments increased due to addition of new customers and expansion of our existing customer subscriptions, and $3.5 million increase in prepaid and other current assets.
Investing activities
Net cash used in investing activities is primarily impacted by purchases of property and equipment, particularly for capital expenditures for our data centers, capitalized software, improvements to existing and new office spaces, and business combinations.
Net cash used in investing activities during the six months ended June 30, 2017 and 2018 of $5.5 million and $16.1 million, respectively, resulted primarily from capital expenditures for our data centers and office build-outs, in addition to acquisitions of intangible assets and a business combination during the 2018 period.
Net cash used in investing activities during the years ended December 31, 2017 and 2016 of $18.3 million and $15.3 million, respectively, resulted primarily from capital expenditures for our XM™ Platform and office build-outs.
Financing activities
Net cash provided by financing activities of $29.8 million during the six months ended June 30, 2017 was due to net proceeds from the issuance of Series B-3 and B-5 redeemable convertible preferred stock, less the repurchase of Series A-1 and A-2 redeemable convertible preferred stock. There were no financing activities for the six months ended June 30, 2018.
Net cash provided by financing activities of $29.8 million during the year ended December 31, 2017 was due to net proceeds from the issuance of Series B-3 and B-5 redeemable convertible preferred stock, less the repurchase of Series A-1 and A-2 redeemable convertible preferred stock.
Net cash used in financing activities of $0.1 million during the year ended December 31, 2016 was primarily due to deferred financing costs.
Backlog
We generally enter into agreements with our customers with annual contractual terms, while some have multi-year contractual terms. The timing of our invoices to the customer is a negotiated term and thus varies among our customer contracts. Due to this, at any point in the contract term, there can be amounts that we have not yet invoiced per the terms of our contracts. Until such time as these amounts are invoiced, they are not recorded in revenue, deferred revenue, or elsewhere in our consolidated financial statements, and are considered by us to be backlog. The amount of contract backlog, which does not include deferred revenue, was approximately $22.3 million and $33.0 million as of December 31, 2017 and June 30, 2018, respectively.
We expect that the amount of backlog relative to the total value of our contracts will change from period to period for several reasons, including the specific timing and duration of large customer agreements, varying invoicing cycles of customer agreements, the specific timing of customer renewal, changes in customer financial circumstances, and foreign currency fluctuations. Moreover, customers may attempt to renegotiate the terms of their agreements. Changes during the term of a customer’s agreement may significantly impact the amount of backlog as of any particular date. Accordingly, we believe that fluctuations in backlog are not necessarily a reliable indicator of future revenue, and we do not utilize backlog as a key management metric internally.
Contractual Obligations
The following table summarizes our contractual obligations as of December 31, 2017:
|
| | | | | | | | | | | | | | | | | | | |
| | Payments Due by Period |
| | Total | | Less than 1 year | | 1 - 3 years | | 3 - 5 years | | More than 5 years |
| | (In thousands) |
| Operating lease commitments | $ | 56,626 |
| | $ | 8,268 |
| | $ | 16,443 |
| | $ | 10,447 |
| | $ | 21,468 |
|
| Non-cancelable purchase obligations | 6,387 |
| | 688 |
| | 5,699 |
| | — |
| | — |
|
| Total | $ | 63,013 |
| | $ | 8,956 |
| | $ | 22,142 |
| | $ | 10,447 |
| | $ | 21,468 |
|
The contractual commitment amounts in the table above are associated with agreements that are enforceable and legally binding. Obligations under contracts that we can cancel without a significant penalty are not included in the table above. Purchase orders issued in the ordinary course of business are not included in the table above, as our purchase orders represent authorizations to purchase rather than binding agreements. In March 2018, we entered into a lease commitment for additional office space that is yet to be constructed in Dublin, Ireland. Upon delivery of the constructed office space, we will pay approximately $1.9 million per annum to lease the space. We expect the constructed office space to be delivered in 2020. The lease agreement is for 15-years, with a termination option at our election at the end of the 8th year.
Off-Balance Sheet Arrangements
As of June 30, 2018, we did not have any relationships with unconsolidated entities or financial partnerships, such as entities often referred to as structured finance or variable interest entities, which would have been established for the purpose of facilitating off-balance sheet arrangements or other contractually narrow or limited purposes.
Critical Accounting Policies and Judgments
The preparation of financial statements in conformity with GAAP requires us to make certain estimates and assumptions. These estimates and assumptions affect the reported amounts of assets and liabilities and disclosure of contingent assets and liabilities as of the balance sheet date, as well as reported amounts of revenue and expenses during the reporting period. Our most significant estimates and judgments involve revenue recognition with respect to the determination of the standalone selling prices for our services, valuation of our stock-based compensation, including the underlying deemed estimated fair value of our common stock, exchange of preferred stock, valuation of deferred income tax assets and liabilities, uncertain tax positions, and contingencies and litigation. Actual results could differ from those estimates. To the extent that there are differences between our estimates and actual results, our future financial statement presentation, financial condition, results of operations, and cash flows will be affected.
On January 1, 2017, we early adopted the requirements of Accounting Standards Update, or ASU, No. 2014-09, Revenue from Contracts with Customers, or Topic 606. Topic 606 establishes a principle for recognizing revenue upon the transfer of promised goods or services to customers, in an amount that reflects the expected consideration received in exchange for those goods or services. Topic 606 also includes Subtopic 340-40, Other Assets and Deferred Costs-Contracts with Customers, which requires the deferral of incremental costs of obtaining a contract with a customer. Collectively, references to Topic 606 used herein refer to both Topic 606 and Subtopic 340-40. We adopted Topic 606 with retrospective application to the beginning of the earliest period presented. The adoption of Topic 606 resulted in changes to our accounting policies for revenue recognition and deferred commissions. The primary impact of adopting Topic 606 relates to the deferral of incremental costs of obtaining customer contracts and the amortization of those costs.
We believe that the accounting policies described below involve a greater degree of judgment and complexity. Accordingly, these are the policies we believe are the most critical to aid in fully understanding and evaluating our consolidated financial condition and results of operations.
Revenue recognition
We recognize revenue from contracts with customers when control is transferred to customers, in an amount that reflects the consideration we expect to be entitled to in exchange for the services. Sales and other taxes collected from customers to be remitted to government authorities are excluded from revenue. We account for revenue contracts with customers by applying the requirements of Topic 606, which includes the following steps:
Identification of the contract, or contracts, with a customer.
Identification of the performance obligations in a contract.
Determination of the transaction price.
Allocation of the transaction price to the performance obligations in the contract.
Recognition of revenue when, or as, performance obligations are satisfied.
We derive revenue from three sources:
Subscription revenue
We generate revenue primarily from sales of subscriptions to access our XM™ Platform, together with related support services to our customers. Arrangements with our customers do not provide the customer with the right to take possession of the software operating the XM™ Platform at any time. Instead, customers are granted continuous access to the XM™ Platform over the contractual period. Access to the platform represents a series of distinct services as we continually provide access to, and fulfill our obligation to the end customer over the subscription term. The series of distinct services represents a single performance obligation that is satisfied over time. Accordingly, the fixed consideration related to subscription revenue is generally recognized on a straight-line basis over the contract term, beginning on the date that the service is made available to our customer.
Our subscription contracts generally have annual contractual terms, while some have multi-year contractual terms. Our contracts are generally non-cancelable. In rare instances, customers have the option to purchase additional subscription and support services at a stated price. These options do not provide a material right as they are priced at standalone selling price, or SSP.
Research on Demand revenue
Research on Demand is a solution provided to existing subscription customers. Research on Demand arrangements are distinct from subscription revenue services. Research on Demand revenue is recognized upon completion, because completion and delivery of the solution is considered a separate performance obligation satisfied at a point in time.
Professional services and other revenue
Professional services and other revenue includes fees associated with new and expanding customers requesting implementation, integration services, and other ancillary services. These services are distinct from subscription revenue services. Revenue from professional services and other revenue related to customized software coding is recognized upon completion, because the customer consumes the intended benefit and assumes control upon final completion of the custom coding. Revenue from professional services and other revenue related to implementation and other ancillary services is recognized as the services are performed, because the customer consumes the benefit as the services are provided.
Some contracts with customers contain multiple performance obligations. For these contracts, we account for individual performance obligations separately, if they are distinct. The transaction price is allocated to the separate performance obligations on a relative standalone selling price basis. We determine standalone selling prices based on overall pricing objectives, taking into consideration market conditions, observable standalone selling prices, and other factors, including the value of contracts, types of services sold, customer demographics, and the number and types of users within such contracts.
We record contract liabilities to deferred revenue when cash payments are received or due in advance of performance. Deferred revenue primarily relates to the advance consideration received from the customer.
We bill in advance for annual contracts, and at times enter into non-cancelable multi-year deals. Non-cancelable multi-year deals typically include price escalations each year. We recognize revenue on a straight-line basis over the non-cancelable term and accounts for the difference between straight-line revenue and annual invoice amounts as a contract asset.
We applied the practical expedient in Topic 606 and did not evaluate contracts of one year or less for the existence of a significant financing component. We determined that no significant financing component existed on its multi-year contracts, as these deals were structured for purposes other than obtaining financing from customers. Additionally, prices are generally fixed at contract inception; therefore, our contracts do not contain a significant amount of variable consideration.
Accounts receivable allowance
Accounts receivable are recorded at the invoiced amount, net of allowances.
In the event of lack of payment from a customer for issues unrelated to credit risk, we cancel the customer’s subscription access or service and write off the corresponding accounts receivable with reductions to revenue and deferred revenue. Write-offs to revenue and deferred revenue from cancellations are based upon the composition of revenue recognized and deferred revenue remaining at the time of cancellation.
In the event of lack of payment due to a bankruptcy or other credit-related issues of a customer, we write off the related accounts receivable with a charge to bad debt expense in the consolidated statements of operations. Bad debt expense was not material for the years ended December 31, 2016 and 2017, or for the six months ended June 30, 2017 and 2018.
We consider the lack of payment for issues unrelated to credit risk to be variable consideration and estimate the impact to revenue and deferred revenue on a portfolio basis. This estimated allowance is based upon historical cancellation patterns due to lack of payment, the number of days that billings are past due, and an evaluation of the potential risk of loss associated with problem accounts. We continuously monitor the adequacy of the allowance by comparing actual write-offs against the estimated allowance and update estimates as needed. Allowances are recorded and adjusted based upon historical patterns related to the timing of cancellations. Adjustments to the allowance are recorded in the consolidated balance sheets with an offsetting adjustment to deferred revenue and revenue in the consolidated statements of operations. Write-offs to accounts receivable in a period are recorded in the activity in the allowance for that period. We believe that our allowances are adequate to absorb any known or probable uncollectible amounts due to service cancellations or customer credit risk.
Our allowances consist of the following activity (in thousands):
|
| | | | | | | | | | | |
| | As of December 31, | | As of June 30, |
| | 2016 | | 2017 | | 2018 |
| | | | | | |
| Allowances, beginning balance | $ | 1,834 |
| | $ | 4,573 |
| | $ | 5,273 |
|
| Additions | | | | | |
| Charged to revenue | 1,778 |
| | 1,832 |
| | 1,508 |
|
| Charged to deferred revenue | 10,599 |
| | 10,465 |
| | 6,276 |
|
| Deductions | | | | | |
| Write-offs to revenue | (1,550 | ) | | (1,804 | ) | | (1,266 | ) |
| Write-offs to deferred revenue | (8,088 | ) | | (9,793 | ) | | (6,281 | ) |
| Allowances, ending balance | $ | 4,573 |
| | $ | 5,273 |
| | $ | 5,510 |
|
The activity in the allowances for the year ended December 31, 2016 compared to the year ended December 31, 2017 remained consistent despite growth in revenue and accounts receivable primarily due to a reduction in the number of cancellations.
The activity in the allowances for the six months ended June 30, 2018 has increased compared to the six months ended June 30, 2017 primarily due to growth in revenue and accounts receivable, as well as changes in the timing of cancellations.
We generally expect the activity in the allowance to fluctuate consistently with fluctuations in our revenue and accounts receivable, although activity may fluctuate from period to period.
Stock-based compensation
We measure and recognize compensation expense for stock-based payment awards, including restricted stock awards, or RSAs, RSUs, and stock options granted to employees and advisors, based on the grant date fair value of the awards. Awards granted to non-employees are marked-to-market each quarter. The grant date fair value of RSAs and RSUs is estimated based on the fair value of our underlying common stock. The grant date fair value of stock options is estimated using the Black-Scholes option pricing model.
We have issued two types of RSAs, one-tier and two-tier. One-tier RSAs vest solely on a service-based condition. For these awards, we recognize stock-based compensation expense on a straight-line basis over the vesting period. Two-tier RSAs contain both a service-based condition and performance condition, defined as the earlier of (i) an acquisition or change in control of the company or (ii) upon the occurrence of our initial public offering. A change in control event and effective registration event are not deemed probable until consummated; accordingly, no expense is recorded related to two-tier RSAs until the performance condition becomes probable of occurring. Awards which contain both service-based and performance conditions are recognized using the accelerated attribution method once the performance condition is probable of occurring.
Our issued RSUs contain both a service-based condition and performance condition, defined as the earlier of (i) an acquisition or change in control of the company or (ii) upon the occurrence of our initial public offering. A change in control event and effective registration event are not deemed probable until consummated; accordingly, no expense is recorded related to RSUs until the performance condition becomes probable of occurring. Awards which contain both service-based and performance conditions are recognized using the accelerated attribution method once the performance condition is probable of occurring.
As of December 31, 2017, all compensation expense related to two-tier RSAs and two-tier RSUs remained unrecognized because the performance condition was not satisfied. At the time the performance condition becomes probable, we will recognize the cumulative stock-based compensation expense for the two-tier RSAs and RSUs that have met the service vesting condition using the accelerated attribution method. Under the 2014 Plan as of June 30, 2018, 2.0 million two-tier RSAs were outstanding and 44.1 million two-tier RSUs were outstanding, of which 2.0 million RSAs and 12.2 million RSUs had met the service condition. If the performance condition had occurred on June 30, 2018, we would have recorded $73.9 million of stock-based compensation expense. If the performance condition had been satisfied on these two-tier RSAs and two-tier RSUs as of June 30, 2018, we would recognize future stock-based compensation expense of $91.8 million over a weighted-average period of approximately two years, if the requisite service is provided.
The estimated valuation of stock options requires us to make assumptions and judgments about the variables used in the Black-Scholes pricing model, including the fair value of our common stock, expected term, expected volatility, risk-free interest rate, and expected dividend yield. These estimates involve inherent uncertainties and the application of management’s judgment. These judgments are made as follows:
Fair value of common stock. The absence of an active market for our common stock requires us to estimate the fair value of our common stock. We obtained contemporaneous third party valuations to assist in determining the estimated fair value of our common stock. These contemporaneous third party valuations used the methodologies, approaches, and assumptions consistent with the American Institute of Certified Public Accountants Practice Guide, Valuation of Privately-Held-Company Equity Securities Issued as Compensation.
We considered numerous factors in assessing the estimated fair value of our common stock, including the results of contemporaneous valuations of its common stock by unrelated third parties; the rights, preferences, and privileges of our redeemable convertible preferred stock relative to those of our common stock; market multiples of comparable public companies in our industry as indicated by their market capitalization and guideline merger and acquisition transactions; our performance and market position relative to our competitors, who may change from time to time; our historical financial results and estimated trends and prospects for our future performance; the economic and competitive environment; the likelihood and timeline of achieving a liquidity event, such as an initial public offering or sale of the Company, given prevailing market conditions; any adjustments necessary to recognize a lack of marketability for our common stock; and precedent sales of or offers to purchase our common stock.
Expected term. We estimate the expected term using the simplified method, as we do not have sufficient historical exercise activity to develop reasonable expectations about future exercise patterns and post-vesting employment termination behavior. The simplified method calculates the average period the stock options are expected to remain outstanding as the midpoint between the vesting date and the contractual expiration date of the award.
Expected volatility. The expected volatility rate is based on an average of the historical volatilities of the publicly traded equity securities of several entities with characteristics similar to ours, as there has been no public market for our Class B common stock to date and as a result we do not have any trading history of our Class B common stock.
Risk-free interest rate. The risk-free interest rate is based on the U.S. Treasury security in effect at the time of grant for maturities corresponding with the expected term of the option.
Expected dividend yield. We have not paid and do not expect to pay dividends. Consequently, we use an expected dividend yield of zero.
The fair values of the stock options granted during the years ended December 31, 2016 and 2017 were calculated using the following assumptions:
|
| | | |
| | 2016 | | 2017 |
| Fair value of underlying common stock | $1.66 | | $6.32 - $6.46 |
| Expected term (in years) | 7.0 | | 6.1 - 6.4 |
| Expected volatility | 45.0% | | 45.0% |
| Risk-free interest rate | 1.4% | | 2.1% - 2.3% |
| Expected dividend yield | — | | — |
On January 1, 2017, we adopted ASU No. 2016-09: Improvement to Employee Share-based Payment Accounting, or Topic 718, issued by the Financial Accounting Standards Board, which among other items, provides an accounting policy election to account for forfeitures as they occur, rather than to account for them based on an estimate of expected forfeitures. We elected to account for forfeitures as they occur and therefore, stock-based compensation expense for the year ended December 31, 2017, has been calculated based on actual forfeitures in our consolidated statements of operations. The net cumulative effect of this change as of January 1, 2017 was not material.
Following this offering, it will not be necessary to determine the fair value of our Class B common stock as the shares will be traded in the public market.
Based on the assumed initial public offering price of per share, which is the midpoint of the estimated price page on the cover page of this prospectus, the aggregate intrinsic value of our outstanding stock options as of , 2018 was $ million related to vested stock options, and the aggregate intrinsic value of outstanding RSAs was $ million and outstanding RSUs was $ million as of that date.
Deferred contract acquisition costs, net
Deferred contract acquisition costs, net is stated at gross deferred contract acquisition costs less accumulated amortization. Sales commissions and related payroll taxes for initial SaaS subscription contracts earned by our sales force are considered to be incremental and recoverable costs of obtaining a contract with a customer. As a result, these amounts have been capitalized as deferred contract acquisition costs on the consolidated balance sheets. The Company deferred incremental costs of obtaining a contract of $20.3 million and $12.9 million during the years ended December 31, 2017 and 2016, respectively.
Sales commissions for renewal contracts are not considered commensurate with the commissions paid for the acquisition of an initial SaaS subscription contract, given the substantive difference in commission rates in proportion to their respective contract values. As such, we expense renewal commissions as incurred.
Deferred contract acquisition costs are amortized over a period of benefit of five years. The period of benefit was estimated by considering factors such as estimated average customer life, the rate of technological change in the subscription service, and the impact of competition in our industry. As our average customer life significantly exceeded the rate of change in our technology, we concluded that the rate of change in the technology underlying our subscription service was the most significant factor in determining the period of benefit for which the asset relates. In evaluating the rate of change in the technology, we considered the competition in our industry, our commitment to continuous innovation, and the frequency of product, platform, and technology updates. We determined that the impact of competition in our industry is reflected in the period of benefit through the rate of technological change. Should any of these factors significantly change, whether in response to competitive pressures, or customer demand for newer or more advanced subscription services, the resulting effect could impact both our remaining estimated period of benefit and the determination of our future estimated period of benefit. As a result, both the timing and amounts of amortization of our deferred contract acquisition costs could change.
Amortized costs were $9.6 million and $6.5 million for the years ended December 31, 2017 and 2016, and $6.2 million and $4.4 million for the six months ended June 30, 2018 and 2017, respectively. Amortized costs are included in sales and marketing expense in the accompanying consolidated statements of operations. There was no impairment loss in relation to the deferred costs for any period presented.
Internal-use software
We capitalize certain development costs incurred in connection with our internal-use software. These capitalized costs are primarily related to our XM™Platform that we host and are accessed by our customers on a subscription basis. Costs incurred in the preliminary stages of development are expensed as incurred as research and development costs. Once an application has reached the development stage, internal and external costs, if direct and incremental, are capitalized until the software is substantially complete and ready for its intended use. Capitalization ceases upon completion of all substantial testing. We also capitalize costs related to specific upgrades and enhancements when it is probable the expenditures will result in additional functionality. Capitalized costs are recorded as part of property and equipment. Maintenance and training costs are expensed as incurred. Internal-use software is amortized on a straight line basis over its estimated useful life of 24 months. We recognized amortization expenses of $6.7 million and $5.3 million related to capitalized internal-use software for the years ended December 31, 2017 and 2016, respectively, within cost of subscription revenue.
Recent Accounting Pronouncements
Refer to Note 2 to our consolidated financial statements included elsewhere in this prospectus for more information about other recent accounting pronouncements.
Quantitative and Qualitative Disclosures about Market Risk
We have operations in the United States and internationally, and we are exposed to market risk in the ordinary course of our business.
Interest rate risk
We had cash and cash equivalents of $113.4 million as of December 31, 2017. We hold our cash and cash equivalents for working capital purposes. Our cash and cash equivalents are held in cash deposits and money market funds. The primary objectives of our investment activities are the preservation of capital, the fulfillment of liquidity needs, and the control of cash and investments. We do not enter into investments for trading or speculative purposes. Due to the short-term nature of these instruments, we believe that we do not have any material exposure to changes in the fair value of our investment portfolio as a result of changes in interest rates. Decreases in interest rates, however, would reduce future interest income.
We do not have any long-term debt or financial liabilities with floating interest rates that would subject us to interest rate fluctuations.
A hypothetical 10% change in interest rates during any of the periods presented would not have had a material impact on our financial statements.
Foreign currency exchange risk
Our results of operations and cash flows are subject to fluctuations due to changes in foreign currency exchange rates relative to U.S. dollars, our reporting currency. Our revenue is primarily generated in U.S. dollars, Euros, Australian dollars, British pounds sterling, Canadian dollars, New Zealand dollars, Japanese yen, and Singapore dollars. A portion of our operating expenses are incurred outside the United States, denominated in foreign currencies and subject to fluctuations due to changes in foreign currency exchange rates, particularly changes in the Euro, British pound sterling, and Australian dollar. Additionally, fluctuations in foreign currency exchange rates may cause us to recognize transaction gains and losses in our consolidated statements of operations. As the impact of foreign currency exchange rates has not been material to our historical operating results, we have not entered into derivative or hedging transactions, but we may do so in the future if our exposure to foreign currency becomes more significant.
We recorded $1.0 million in net foreign currency transaction gains in the year ended December 31, 2017, and $0.6 million in net foreign currency transaction losses in the year ended December 31, 2016. A hypothetical 10% change in foreign currency rates would not have resulted in material gains or losses for the years ended December 31, 2016 and 2017.
Inflation risk
We do not believe that inflation has had a material effect on our business, results of operations, or financial condition. Nonetheless, if our costs were to become subject to significant inflationary pressures, we may not be able to fully offset such higher costs. Our inability or failure to do so could harm our business, results of operations, or financial condition.
LETTER FROM THE QUALTRICS FOUNDERS
Our mission is to help organizations leverage experience management to turn their customers into fanatics, employees into ambassadors, brands into religions, and products into obsessions.
We have always known that uncommon results require uncommon sense. That is why we have always done things a little differently. From our earliest days, we knew that if we were going to do something special we had to write our own playbook, not follow someone else’s. We bucked convention and chose to bootstrap our company for a decade without raising any outside funding. Through three distinct economic environments, Qualtrics has steadily grown and been free cash flow positive in each and every one of our 16 years. All primary capital raised remains unspent and still on the balance sheet. We intend to continue our thoughtful stewardship of capital as we go forward and to treat your investment with the same care and respect we have treated the capital that we and our private investors have contributed. We are excited to share our story and invite investors to join us in powering the experience economy.
How We Work
We are two operating co-founders. We are also brothers and the perfect marriage of complete opposites. One of us comes from a background in economics, product, and engineering. The other is built for growth, go-to-market, sales, and marketing. We are both operationally minded and creators in our own way. We push each other to reach our full potential and never settle for anything less. We are driven to build an enduring business, always think long-term, and encourage our team to do the same, even when not settling is the more difficult path.
We believe in and compete on the strength of our amazing team, which is more than 1,900 strong in 20 offices across the world. They range from eminent data scientists to brilliant engineers to award-winning customer support representatives. In addition, we have an incredible board of directors. We have deep respect for each member of our board of directors and have benefited from their guidance and governance over many years. All of us at Qualtrics – from the board of directors and C-suite to the newest intern – are immersed in our core values. We call these “TACOS:”
Transparency
All in
Customer obsessed
One team
Scrappy
We are relentless in our determination to live up to these values every single day.
What We Believe
We started Qualtrics 16 years ago in our parents’ basement in Provo, Utah. While a lot has changed since then, the core beliefs that guided us from the beginning haven’t. Those beliefs are the key to our accomplishments in the past and to our continued success in the future. They are what make Qualtrics one-of-a-kind to its customers, employees, partners, and investors.
| |
• | We believe experiences matter. We have pioneered a new category called Experience Management, or XM. The Qualtrics XM™ Platform brings together the four key technology solutions for managing overall experience on a single platform: customer experience, employee experience, brand experience, and product experience. For too long, experiences were measured in silos. Qualtrics breaks down these silos and allows organizations to manage these four core experiences in one place for the first time ever.
|
| |
• | We believe in X-data™. Too many companies are managed from the inside out. This is how you get blindsided. Every organization in the world—large or small, new or mature, private or public—needs to look outward to close the massive gaps between the experiences organizations think they are delivering and what is really happening. That requires a new kind of data: experience data, or X-data™. For too long, companies have relied on internal or operational data, or O-data, to try to close experience gaps. But experience gaps can only be
|
closed using external or X-data™. Qualtrics is the single system to collect, house, and take action on all X-data™ across customers, employees, brands, and products. Not having a unified system for all X-data™ and the ability to take action across the entire organization ensures failure.
We believe we only win if our customers win. We obsess over the success of our customers. While there are many ways to buy and sell software, two of our primary differentiators are the flexibility and scalability we offer our customers. This means our platform can be leveraged by every organization from the smallest, most immature programs to the largest, most sophisticated enterprises in a way that is unique to it and provides the greatest competitive advantage. We can make adjustments in real time to adapt to fast-paced, changing circumstances, and we can grow with an organization over time as it scales programs across departments, geographies, and functions. Markets are cruel and competition produces a shifting battlefield. Qualtrics is the solution that evolves as experience gaps do.
We believe in iteration, innovation, and creation. To be ordinary is to be irrelevant. To be complacent is to be dead. We have developed a culture of constant innovation, meaning we continuously iterate to make good things better. We have refined the skill of designing new and better ways to achieve what has been done in the past. Most importantly, we are always creating new things. Sometimes that means we are creating new products or platforms, new go-to-market strategies, or completely new industries, like experience management. We are not afraid to tear down what we have built if that means creating something better.
We believe there are no shortcuts. We have succeeded because we were willing to make hard choices and do the hard work. We were willing bet on the academic market when no one else would. We are willing to make the 90,000 cold calls, to code the technically “impossible” features, and to be disciplined in our spending. This will not change. It is what got us here and it is how we will get to the next level and the next one after that and the next one after that. Time is the ultimate equalizer and there are no shortcuts.
We believe in acting for the long-term. We have always been focused on creating a company that will outlast any individual, thrive in any market condition, and help customers overcome any challenge. That is why we have always made decisions with the long-term in mind. We will continue to run the company for the gain of our long-term stockholders, not short-term speculators. We have designed a corporate voting structure that will allow us to continue to focus on the long-term vision of Qualtrics. This has served our stockholders well over the last 16 years, and we believe this will allow Qualtrics to thrive in an environment that is increasingly focused on short-term quarterly achievements rather than long-term sustainable growth. Our voting structure ensures that all stockholders, including investors in this offering, will have a voice and the ability to make that voice heard publicly. It also ensures that as founders, we will ultimately have the final say on the most critical choices along our journey to building long-term value for all of our stockholders. Investors should understand that this means we may make choices that sacrifice some short term “pop” as we continue to invest and plan for long-term sustainable growth. Consistent with our core values, we want to be fully transparent in saying that investors interested only in short-term quarterly gain and stock speculation should look elsewhere, as we are committed to powering the experience economy for the long-term.
We believe in our responsibility as founders. Qualtrics will be a force for good. We will lead where governments lag and be vocal when others are quiet. We are determined to create positive experiences in everything we do. With strong views on diversity and inclusion, immigration, wage equality, and the universality of human rights—without regard to race, color, creed, gender, or sexual orientation—we will not be quiet but will amplify these views on behalf of our employees and organization. We know and embrace our responsibility to use business as a source for good.
We believe research changes the world. We power many of the world’s leading academics and have seen firsthand the power of research to change the world. We are proud of the research done with Qualtrics and the impact it is having—whether that’s transforming our understanding of human productivity, revolutionizing the way people make decisions, or powering the research behind New York Times best-selling books. Research has the power to close some of the world’s biggest gaps, because many of our most pressing problems occur from a lack of understanding, and that’s a problem we can solve.
We believe in giving back. Beginning with our days as a basement startup, we intentionally instilled a culture of giving back. Our focus has always been on defeating cancer. We are all in on eradicating the disease and know the best way to do that is to support groundbreaking cancer research. We started a campaign to crowdfund cancer research called 5 For The Fight™, inviting everyone to give $5 for the fight against cancer. We believe in a future without cancer and we believe we can all play a part in bringing that day closer.
Every day is a new experience with new opportunities and challenges. We have been working alongside our customers and employees for 16 years to create breakthrough experiences that directly impact people’s lives. Whether a customer has been with us from the beginning or just joined us, we are excited to be on this journey with every one of them. We know that the XM™ category will revolutionize the future of business, because experience is the future of business. Just like we are committed to doing everything we can to deliver the best experiences to our customers and employees, we will work hard and smart to deliver the best experience to our investors as well. We hope you will join us on this journey as we continue to apply our beliefs and implement our mission to shape the future of the experience economy.
Sincerely,
Ryan Smith and Jared Smith
BUSINESS
Overview
Qualtrics has pioneered a new category of software that enables organizations to succeed in today’s experience economy. Our mission is to help organizations deliver the experiences that turn their customers into fanatics, employees into ambassadors, brands into religions, and products into obsessions.
We Live in an Experience Economy
Today, organizations thrive or fail based on the experiences they deliver. In a world of abundant choice, experiences differentiate brands and products, and foster customer and employee loyalty. Great experiences drive customer loyalty, upsell and expansion, employee engagement, brand quality, improved retention and referral, and ultimately, greater shareholder value. Conversely, unfavorable experiences lead to increased churn, lower productivity, diminished competitiveness, and value destruction. With the advent of digital communication channels, favorable or unfavorable experiences can be shared instantly and spread virally, amplifying these impacts and raising the stakes for organizations of all types and sizes.
Executives Must Own All Dimensions of Experience
In this environment, C-level executives are increasingly accountable for issues that transcend basic product and service quality and encompass all of the dimensions that surround those offerings. This extends to thousands of often subtle factors that determine the quality of experiences their organizations deliver, including company culture, speed, convenience, attentiveness, design, and ease of use. We believe that customer, employee, brand, and product experience represent the four vital signs of organizational well-being and that executives are now measured on their performance across these domains. Customer and employee expectations are high, setting up the potential for significant gaps between actual and anticipated experiences. Yet, executives often lack the tools to understand, assess, and take decisive action to address these “experience gaps” as they arise. Today, disruptive start-ups and other businesses flourish by identifying such gaps and designing experiences that attack these blind spots of incumbents.
Organizations Need to Address Experience Directly, in the Moment
While organizations have traditionally deployed consultants or other third parties to gather data about customer and employee satisfaction, the increasing centrality, complexity, and nuance of delivering great experiences has compelled C-level executives to seek the capability to understand and take ownership of these matters directly and in real time. Given the immediate nature of experience, there is also a strong desire to allow individuals at every level in an organization to comprehend changes in experience quality and empower them to act decisively when it matters most.
We Pioneered Experience Management to Power the Experience Economy
We have created a new category of software, Experience Management, or XM™, which enables organizations to address the challenges and opportunities presented by the experience economy. XM™ allows organizations to accomplish the following:
| |
• | Comprehensively gather and analyze a new class of data, Experience Data, or X-data™, that is richer, more immediate, and more salient to understanding quality of experience than traditional operational data, or O-data™, which comes from sources such as customer relationship management, or CRM, enterprise resource planning, or ERP, human capital management, or HCM, Customer Service, and Marketing Automation systems. X-data™ is the human factor data — individual beliefs, emotions, and intentions — collected across multiple channels through which customers and employees engage with an organization.
|
Go beyond an assessment of what is happening within organizations to an understanding of why trends are emerging in the moment.
Address experience holistically, unifying information and insights from customers, employees, and partners and recognizing the operational linkages between the sentiment of these constituencies.
Become more predictive and proactive, closing feedback loops, and turning insight into real-time action to prevent and close experience gaps where they exist.
Democratize and own analysis and decision making across the organization by delivering powerful capabilities in a simple, easy-to-use product.
In today’s experience economy, we believe that XM™ is more critical to improving customer experience than CRM, more influential upon employee experience than HCM systems, and more important to enhancing brand experience than Marketing Automation. Consequently, we believe that XM™ represent a vast, rapidly growing, and underpenetrated market opportunity, and we estimate our total addressable market to be approximately $44 billion in 2018.
Our History Uniquely Positioned Us to Create and Lead XM™
Our history uniquely positioned us to pioneer and develop this new XM™ category. Founded in 2002 with the goal of solving the most complex problems encountered by the most advanced academic researchers, we were forged in an environment that required rigorous analytical methods, ease of use, the versatility to address the broadest range of inquiries, and the scalability to reach millions of touch points globally. Our leading presence with academic institutions has introduced millions of students to Qualtrics and allowed them to become proficient in the use of our software. As these students have migrated into the workplace, they have often brought us with them, spawning a whole new class of commercial customers and developing new use cases for our XM™ Platform. Led by these customers, we evolved beyond our traditional research product offering to develop our platform, which incorporates our core research capability and is also designed to specifically address customer, employee, brand, and product use cases. Taken together, we believe that this platform provides a System of Action for organizations to monitor and act upon the vital signs that drive performance in any organization.
Our Platform Defines All the Elements of Experience Management
Our XM™ Platform is purpose-built to help organizations collect feedback and data across the four vital signs of a business: Customers, Employees, Brand, and Product. XM™ transforms that data into insight, and drives action to create value. The key elements of our platform include:
Research Core — A collection of powerful, flexible research tools to build and distribute data collection systems, aggregate and analyze data, build reports, and draw insight from data. Research Core is designed specifically to instrument, gather, and index human factor data in any format through any channel. Users can synthesize and identify trends within minutes and immediately dig deeper into any data point to extract additional insight.
Customer Experience (CX) — Enables a deep understanding of customer sentiment throughout every customer journey, allowing organizations to monitor, measure, and take action where there may be any experience gaps, with a focus on identifying specific challenges and designing solutions to remediate issues and improve satisfaction in the moment.
Employee Experience (EX) — Allows managers and employees to identify gaps in the employee experience from recruiting and on-boarding to performance management in order to improve employee engagement, raise productivity, and limit attrition from start to finish at every touchpoint.
Brand Experience (BX) — Identifies key drivers of brand perception, including psychographic information, marketing effectiveness, and competitive positioning.
Product Experience (PX) — Facilitates the aggregation and analysis of critical feedback to identify and isolate the features and experiences that drive product differentiation and quality and permit more informed pricing and packaging decisions across all products.
While our XM™ Platform represents a deeply integrated set of capabilities, each component features functionality and analytics that are significantly differentiated from one another, allowing our customers to adopt the entire platform or individual solutions that directly address their specific needs. Our platform delivers insight to customers in the form
of rich visualizations that unify diverse data streams, demonstrate trends, and identify important deviations that signal the need for action.
We Have Built a Powerful and Innovative Go-To-Market Model
Today, our XM™ Platform is used by over 9,000 customers globally, including over 75% of the Fortune 100. As our research product evolved into our XM™ Platform, our customer base and go-to-market model have evolved as well. From our academic roots, we built a strong low-touch sales model that allowed us to target users in any size organization. By integrating Research Core and emerging use cases into our platform, we began to penetrate larger businesses and developed more outbound sales capability to drive a land and expand sales motion. More recently, we have developed a strong direct sales capability to address larger customers. Throughout this evolution, we have sought to broaden our reach, delight our growing base of customers, and operate efficiently and profitably.
We Bootstrapped Our Company and Have Consistently Generated Cash
We believe that we have built a scalable and sustainable business model. As we built Qualtrics, we relied primarily on capital generated by the business. The primary capital we raised remains on our balance sheet, demonstrating the cash flow efficiency of our business. We have been free cash flow positive in every year since our inception, while driving rapid adoption of our solution among organizations of all sizes around the world. For the years ended December 31, 2016 and 2017, our revenue was $190.6 million, and $289.9 million, respectively, representing year over year growth of 52%. For the years ended December 31, 2016 and 2017, our net gains (losses) were ($12.0) million and $2.6 million, respectively, and free cash flows were $3.4 million and $21.3 million, respectively.
Industry Trends in Our Favor
Experiences Drive Differentiation and Competitive Advantage
Today, the value of any organization is dictated by the experiences of its customers, employees, and other constituencies. While effective organizations have always recognized this truism, we now live in a world where those experiences can be shared and amplified globally and instantaneously through digital channels. Today, brand perception and reputation can shift quickly and profoundly. Consumers and employees are able to transition easily from brand to brand and from organization to organization. Direct commerce, the rise of new promotional platforms, and a proliferation of new brands have reduced switching costs for consumers. And, in many sectors, the number of job openings exceeds the number of job seekers, leading to more professional mobility.
Industries are being transformed by companies that deliver superior experiences. This includes retailers that enhance store design and customer service, manufacturers that deliver superior product quality, service providers that offer increased convenience, and organizations that focus on their employees. These organizations that thoughtfully shape interactions with their customers and employees to create differentiated experiences are in the best position to win.
Understanding the impact of experiences, both positive and negative on customers and employees, is critical in today’s experience economy to remain competitive:
Positive experiences lead to better outcomes:
Greater Loyalty and Retention. According to a study by the Temkin Group, customer experience leaders enjoy a net promoter score, or NPS, over 18 points higher than customer experience laggards.
Increased Productivity. According to the Gallup Organization, organizations with a high level of employee engagement report 21% higher productivity.
Stronger Financial Performance. Forrester Research, an industry research firm, reported that the average stock price of top publicly-traded brands in Forrester’s “CX Index” grew 32%, compared to 3% for the portfolio of lagging brands, over the last 12 months ending October 2017. During this same period, the S&P 500 Index grew 17%.
And poor experiences can have severe outcomes:
Lower Retention. PricewaterhouseCoopers LLP reported that 32% of all customers say they will walk away from a brand they loved after just one bad experience.
Decreased Productivity. Deloitte found that the cost of losing an employee can cost up to 1.5-2.0 times the employee’s annual salary.
Inferior Financial Performance. According to academic research and industry studies, failing to meet customer expectations has been shown to have twice the negative economic impact as delighting customers has a positive impact.
Experience Gaps Create Challenges for Organizations
Experience is all-important in winning and retaining customers and employees; however, actual experiences often fall short of expectations. The difference between the experience an organization believes they are delivering and the actual experience delivered is the “experience gap.” Experience gaps often have detrimental consequences for an organization, including lost customers, lower spend, complaints, employee turnover, employee disengagement, poor performance, and product failures.
Understanding the causes of experience gaps enables organizations to prioritize the investments that they make. This can prevent organizations from overinvesting in areas that yield diminishing returns and enable them to redirect resources into aspects of the customer and employee experience that matter most. Companies are increasingly turning to Chief Experience Officers to identify and manage experience gaps across their entire organizations. Boards of directors have also taken notice and now tie C-level compensation to key metrics that demonstrate success at closing these gaps, such as customer satisfaction, product net promoter score, customer churn, employee engagement, and leadership approval. Sustained market leadership is defined by the pace at which organizations recognize and close experience gaps.
Organizations Struggle to Explain Why Experience Gaps Exist
Organizations rely on systems of record, such as CRM, ERP, HCM, Customer Service, and Marketing Automation systems, for gathering and reporting O-data™. While these systems are useful for reporting what is happening as of a certain date, such as pipeline and sales data, employee data, and financial events, they are not designed to explain why something is happening. This why factor determines experience: why customers buy, why they are brand loyal, why a product release was successful, or why employees are engaged.
O-data™ systems on their own come with limitations that prevent them from measuring experience:
Cannot link events across systems of record;
Not designed to collect feedback across channels and formats;
Do not layer in necessary sentiment behind an event;
Backward looking, not capturing and acting on data in real-time; and
Use cookie-based data collection that is becoming increasingly scrutinized by privacy regulation and users.
O-data™ alone is far from sufficient to close experience gaps. Moreover, most organizations are O-data™ rich and X-data™ poor. X-data™ is the human factor data, the beliefs, emotions, and intentions that tell you why things are happening and, more importantly, what is going to happen. X-data™ is fragmented, often unstructured, and needs to be collected across all engagement methods, including e-mail, SMS, chat, phone, website, and in-app links. Together, X-data™ and O-data™ can provide differentiated and related insights to understand where experience gaps exist and how to address them. For example, a new product launch did not have the expected results because the price point was too high (X-data™) and customers expected more features for the higher price point (X-data); as a result, sales are down compared to the last product release (O-data™).
X-data™ needs to be collected ad-hoc and in real-time. For example, product managers need to understand the features that users want as they are developing products, marketing managers need to understand how their brand is perceived to develop the proper messaging in targeted ad campaigns, HR managers need to understand the impact of a negative event on employee morale as it is happening in order to address potential concerns, and sales reps need to understand which customers are most likely to churn so they can course correct in real time to prevent attrition.
Insight from Direct Feedback Drives Value
Direct, timely, and authentic data about the sentiment and experiences of all constituents is needed to drive growth, competitiveness, and value in today’s economy. Direct commerce models have allowed businesses to create multiple touch points with customers and garner data that allows them to rapidly evolve and improve their offerings and operations. Companies without this direct customer connectivity, including those that operate via indirect channels, find themselves at an increasing disadvantage, often resulting in the inability to gather direct customer experience data and reducing the ability to assess customer sentiment and needs. Despite this lack of direct customer connectivity, companies need a software platform that enables them to maintain direct feedback loops. The absence of direct signals meaningfully inhibits organizations’ ability to adapt and thrive.
Organizations Need to Manage Experiences Across Customers, Employees, Brand, and Product
The success of organizations today depends on the quality of the experiences that they deliver to constituents across four critical areas: customer experience, employee experience, brand experience, and product experience. These four experiences serve as the key vital signs of every organization, and every interaction that an organization delivers, positive or negative, can be attributed to one of these categories.
Examples of how experience management can impact each of the four vital signs include:
Customer Experience:
Help sales teams understand what factors influence demand across product offerings
Help drive higher conversions during an active purchase funnel
Turn a potential detractor into a promoter through systematic intervention
Analyze the impact of sales promotions on customer spend, retention, and upsell
Identify which customers are most likely to churn and implementing specific steps to course correct
Understand customer satisfaction, NPS, and key reasons for or against recommendation
Employee Experience:
Prioritize investments across factors (e.g. compensation, perks, vacation, etc.) to reduce turnover
Identify causes of high employee turnover
Provide feedback to individual managers on their impact on employee experience; providing personalized recommendations on how to improve and systematically track progress
Use employee multi-rater reviews to determine professional action plans and improve employee job satisfaction
Understand factors leading to higher employee productivity and, as a result, organization performance
Brand Experience:
Identify the areas contributing to brand degradation and impact on customer retention
Enable marketers to prioritize investments that are most likely to enhance brand perception
Track brand value and perception over time
Help marketers measure and manage advertising campaign effectiveness
Product Experience:
Understand features most important to customers during product development
Correlate areas of low satisfaction and high importance to address areas with highest impact to customers
Create optimal pricing and packaging structures based on customer needs and demographics
Organizations must be able to manage all four of these experiences individually and understand the impact that these interconnected experiences have upon each other. For example, engaged and empowered employees and partners are better able to address customer needs, enhance service levels, and elevate brand value. The result is richer and interrelated insights that could not be gained from tracking just one experience.
Organizations able to manage these experiences in an integrated manner create a competitive advantage that drives increased organizational success and shareholder value.
Organizations Need a Holistic Experience Management Platform
Providing effective experience management requires organizations to combine O-data™ and X-data™ and take action to close experience gaps. Experience management capabilities need to be available to everyone throughout an organization, from C-level executives who are accountable for results down to those on the front lines best positioned to respond to feedback. Doing so has the potential to empower every person in an organization to make better and more informed decisions when it matters most.
To measure experiences, organizations have used a combination of various processes and tools for specific uses:
Third Party Market Research Firms and Consultants: This is a labor-intensive approach to researching a specific topic at a specific point in time. These firms can be effective at answering specific questions using in-depth market research through creating and sampling panels from their large networks. However, their methods of data collection and analysis lack a software-driven approach that can span across broad use cases
in a timely manner. Further, they cannot automatically correlate and interpret O-data™ and X-data™ to provide recommendations on how to close experience gaps.
Organizations are also often required to have their own dedicated Market Research teams to commission research studies and liaise with these firms, which can serve as bottlenecks between the analysis and both the front-line employees who are seeking answers and the C-suite that is being held accountable for results.
Point Solutions: Services-intensive point solutions require a high level of system integration and human involvement to interpret results, are not available broadly to employees, and lack applicability across all vital signs of an organization. These include specific use systems as well as added functionality sometimes offered by enterprise software providers.
| |
• | Survey Tools: Survey tools are useful for broad sampling across thousands of subjects, but lack the ability to combine data in different formats across different channels, correlate with O-data™, and apply the analytical rigor needed to determine what actions need to be taken to improve results. They also lack enterprise grade security, scalability, and administrative control.
|
Organizations cannot afford to wait for others to tell them where experience gaps exist. Just as operational systems of record have emerged for an organization’s core functions of finance, HR, sales, and marketing, there is a clear need for a platform that extends across various O-data™ silos and unifies experience management across the organization.
A comprehensive experience management platform that empowers organizations to identify, assess, and close experience gaps needs the following capabilities:
| |
• | Comprehensive Data Collection. Ability to collect X-data™ across all channels and formats and integrate it with and enrich O-data™ from various existing systems.
|
Powerful Analytics. Analytics that provide robust analysis on sentiment, priorities, churn, and organizational impact and actionable insights for users to address potential experience gaps, including actionable reports that explain why something is happening, not just what has already happened.
Address Experience Holistically. A unified and inter-connected view across key areas that have the highest impact on an organization: customers, employees, brand, and product.
Real Time. Ability to collect, interpret, and act upon an experience and trigger workflow in real-time, when it has the highest impact for an organization.
Easy to Use. Simple user interface that is accessible from any device and applicable to all users at every level within an organization, enabling every person to be a researcher.
Configurable. Programs need to be able to adapt to the ever-changing needs of organizations without the need for professional services.
Scalable. Ability to meet the needs of the largest and most sophisticated organizations and scalable to millions of touch points.
Privacy and Security. Robust data privacy and security features required to scale for organizations of all sizes and meet the highest enterprise standards.
Our Roots
We founded Qualtrics in 2002 to make sophisticated research simple for the academic market. In serving academia, we focused on the core needs of researchers who demanded analytical rigor and real-time research capabilities across a broad range of topics. As use of our solution grew within an increasing number of academic departments, we evolved our offering to address new requirements, including advanced embedded analytics, increased flexibility, and hardened security and administrative controls to support university-wide deployments.
Our roots in academia helped us to develop our research engine with an interface that was intuitive and easy-to-use, yet powerful in functionality. Students trained on our software began to graduate into corporate roles at the same time corporate mandates to reduce outsourced spending and improve data driven decision making were emerging. As a result, use of our software and our Research on Demand solution started to gain traction in the corporate market, primarily at the department level. Our insight into how customers were using our software across hundreds of different use cases across multiple departments enabled us to develop programmatic ways for users to make better decisions and drive value.
Corporate use of our software was discovered to be driven largely by four core use cases: customer, employee, brand, and product related feedback and research. We developed focused solutions consisting of use case specific capabilities, content, dashboards, and workflow integration built on top of the base research and analytics engine. To provide a better, more consistent, and focused practice area around the customer, we developed Customer Experience as the first solution on our core platform. Next, we developed our solution for Employee Experience, which utilizes the same research engine at the core of our platform, but has specific functionality around employee experiences. We then developed our Brand and Product Experience solutions to round out a holistic approach to experience management in the areas that have the greatest impact on an organization’s success or failure. In 2017, we launched the Qualtrics XM™ Platform. We believe that the XM™ Platform provides a System of Action for organizations to monitor and act upon the vital signs that best drive organizational success.
The Qualtrics XM™ Platform
Our XM™ Platform consists of solutions for Customer Experience, Employee Experience, Brand Experience, and Product Experience, all built on our Research Core and integrated with our Research on Demand offering. Our platform is designed to help organizations measure, prioritize, and optimize the experiences that they provide to customers, employees, and other constituencies. Leveraging our intelligence engine, Qualtrics iQ, our platform provides our customers with the ability to target the right users in the right moments to glean the insights that they need to drive action.
Key benefits of our platform include:
| |
• | Comprehensive Data Collection. Our XM™ Platform enables organizations to personalize their communication with customers, employees, and partners and interact with these groups through the most effective channels. We engage with constituents in an intelligent manner across a variety of channels, including
|
SMS, email, voice, website, in-app responses, and chat. Our platform enables our customers to correlate and decipher such data in order to make better decisions. Through simple integrations, users can incorporate O-data™ into XM™ analysis using native formats or through Excel exports, without the use of outside professional services.
| |
• | Differentiated Analytical Capabilities. Our XM™ Platform is powered by a proprietary analytics engine that organizations of all types use to address some of the most demanding research projects. Our platform leverages the latest in artificial intelligence and natural language processing to allow users to discover correlations between events, develop predictive models without using third party tools, identify at-risk customers and employees, and suggest actions to course correct and drive impact. These capabilities are incorporated into our platform through Qualtrics iQ, enabling advanced analytical features to make statistical analysis and insights available to everyone. Ultimately, this allows users across organizations to understand why something is happening, not just what has already happened.
|
| |
• | Ability to Address Experience Holistically. We provide specific solutions across the key areas that have the highest impact on an organization: customers, employees, brand, and product. Our XM™ Platform analyzes experiences within each of these areas individually and correlates data across areas to provide insight into how they impact each other. Our platform integrates X-data™ that we collect with siloed O-data™ that organizations already have, providing everyone in an organization from the C-suite to employees on the front line with a holistic view of experiences across key areas and constituencies.
|
| |
• | Real-time Insight and Action. Our XM™ Platform is able to extract real-time feedback and provide insights and analysis when it matters most. This timeliness is necessary to affect outcomes, including reducing churn, increasing sales, preventing employee turnover, increasing engagement, and enhancing brand among others. Our platform can drive action natively or by integrating with systems that an organization already uses. For example, our platform can automatically generate a customer ticket when a negative sentiment is expressed on a social media site and prompt an organization to action all the way to issue resolution. In this way, our platform not only helps to identify issues, but also serves as a System of Action to remedy potential problems in a timely manner.
|
| |
• | Ease of Use Enabling Democratization of Research Across All Users. We designed our XM™ Platform for every knowledge worker. Users can design a customer feedback program in minutes using simple drag and drop functions. Once X-data™ is collected, we provide easy to consume analysis. Results are presented to users in discernible reports, charts or graphs, and through simple language that anyone can put into action such as “Level of service is ranked highest in customer priorities and has the highest correlation with returning visits.” This ease of use allows our platform to be used by employees across the organization.
|
Flexible Configuration to Meet Specific Needs. Our customers have configured our platform to meet diverse needs from preparing PhD dissertations to ensuring successful product launches. Our platform provides all of the tools necessary to enable program design configured to specific needs. Through an intuitive and elegant interface, users can design programs that implement complex logic, and advances workflows. Users can also design, deploy, and alter these programs without help from professional services or IT, leading to faster and more impactful insights. Our platform can deliver these insights through flexible and scalable role-based dashboards to ensure people within an organization can access insight in real time and on any device.
| |
• | Scalable for the Needs of the Largest Organizations. In addition to scaling seamlessly across use cases, our XM™ Platform can collect, analyze, and interpret data across millions of touch points, meeting the needs of the world’s most sophisticated and demanding organizations. We have built our platform on contemporary open-source technologies that are designed to scale horizontally while providing high performance. We believe this has enabled us to scale our platform indefinitely to support rapidly increasing data storage and processing needs, such as near real-time stream processing and massive-scale batch processing of big data.
|
| |
• | Security and Privacy Designed for the Enterprise. Our XM™ Platform adheres to the highest standards of security and privacy that are demanded by the largest organizations in the world. Our platform enables role-based permissioning to ensure that only the right people have access to the most sensitive customer and employee information. We believe our systems and processes exceed industry practices, including being
|
certified for the global security gold standard, ISO 27001. We have achieved FedRAMP authorization to deliver services to United States federal government agencies. Additionally, organizations own and retain all their data gathered on our platform.
As a result of our robust platform features and functionality, the impact to customers is profound. Below are examples of how some of our customers have benefited from using Qualtrics:
Customer Experience: JetBlue found that 82% of their passengers didn’t care about free bags and instead preferred cheaper ticket prices. JetBlue responded by rolling out different rate structures and pricing options to cater to these customers.
Employee Experience: Twilio achieved a 90% response rate for employee engagement and changed company policy to provide unlimited time off as a result of employee feedback.
Brand Experience: Royal Caribbean drove actionable insights on everything from loyalty research to advertising to segmentation. With the help of Qualtrics, Royal Carribean's overall awareness and preference has reached an all-time high among those who have never cruised.
Product Experience: Yamaha used Qualtrics to run a quick-turn study of their power users’ preferences on important features in new keyboard models at the critical point in product development.
Market Opportunity
In today’s experience economy, we believe that XM™ is more critical to improving customer experience than CRM, more influential upon employee experience than HCM systems, and more important to enhancing brand experience than Marketing Automation. As a new category of software, we believe that XM™ has broad applicability to individuals at every level in an organization to gain valuable insight regarding the customer, employee, brand, and product experiences their organizations deliver and empower them to act decisively to address potential issues as they arise. Consequently, we believe that XM™ represents a vast, rapidly growing, and underpenetrated market opportunity today, and we estimate our total addressable market to be approximately $44 billion in 2018.
We have calculated our market opportunity by using third party data on the total number of global enterprises with an estimated annual revenue greater than or equal to $50 million and governmental institutions, plus the total number of K-12 academic institutions in the United States and international post-secondary academic institutions, and applying a calculated annual contract value, or ACV, to these organizations in different segments based on their respective size and leveraging internally generated data applicable to each corresponding segment. For example, because larger enterprises have generally demonstrated greater deployment of our solutions across their organizations, we have segmented the number of enterprises into tiers to reflect this distinction.
The calculated ACV applied to the estimated number of organizations in each respective segment across enterprise, academic institutions, and government entities is calculated using internal company data of actual customer spend by type and size. For each respective segment, we calculate the median ACV of the top 50 customers, which we believe representative of having achieved broader implementation of our solutions within their organizations. The ACV for each customer by segment includes actual spend on subscription to our XM™ Platform as well as Research on Demand. We then multiplied the calculated ACVs and number of organizations by type and segment, and the aggregate value across all these segments represent our estimated TAM in 2018.
What Sets Us Apart
As the creator and leader of XM™, we have several distinguishing advantages:
Pioneer and Market Leader for Experience Management. Our users have continually provided us valuable insights that fuel our development and innovation. Our experiential learning over the past 15 years has helped us develop, test, and refine our software solutions. Today, users across over 9,000 organizations rely on our software for differentiated and actionable insights into their businesses. Their experience with Qualtrics - across our products, brand, and employees - defines our continued success and serves as a powerful differentiator for our business.
| |
• | Scalable within Organizations from Departments to Enterprise-Wide. Our XM™ Platform combines ease of use with the scalability required by the world’s largest enterprises. Built for enterprise scale, Qualtrics has been architected as an open and easily configurable platform to facilitate a wide breadth of use cases. For example, Qualtrics now powers over 40,000 dashboards for Walmart’s managers to track employee experience. Additionally, up to one million healthcare providers within the Aetna network link customer digital behavior with NPS and CSAT across their 22 million customers. Our platform has become critical to our thousands of customers, and since 2015, Qualtrics has maintained average up-time of 99.89%.
|
Academic Roots. Our academic roots have allowed us to differentiate in the following key ways:
| |
◦ | Technology focus: Our initial focus on the academic market required us to build sophisticated software that balanced the complex design requirements requested by researchers with our goal of providing a user-friendly interface for professors, researchers, and students. It also required the ability to scale within large university deployments and played naturally into our scalable enterprise platform. Our integration amongst the academic community has introduced us to innovative research techniques and methodologies which we have been able to incorporate into our software.
|
| |
◦ | Effective on-ramp: Our strength amongst academic researchers and students has served as a powerful foundation for efficient growth among knowledge workers. We estimate that over 2 million academic users have been introduced to Qualtrics as students or researchers, who in turn have helped bring Qualtrics into their organizations as they have entered the workforce.
|
Modern Technology Architecture. We have a modern technology platform that enables us to scale, store, and process efficiently large batches of data, and can support our broad portfolio of solutions. Qualtrics is built on open-source technologies that are designed to scale horizontally while providing high performance. In addition, our architecture allows for easy integration of operating data through APIs which enriches the value of experiential feedback data. With a broad range of high quality and relevant data, we are able to apply intelligent statistics, text analytics, machine learning, natural language processing, and other sophisticated capabilities to transform this data into insights and action.
| |
• | Rapid Time to Value. Our technology is designed to be easy to deploy, configure, use, and scale. By making the complex capabilities of our XM™ Platform simple to use, we allow customers of all types and sizes to generate value quickly. In addition, the modularity of our platform allows our customers to deploy one or more of our solutions initially and then adopt additional modules as their use cases grow and evolve. As initial deployments generate valuable X-data™ and the value of that data compounds over time, we see many customers adding additional functionality as the power and influence of XM™ insights spread throughout their organizations.
|
Powerful and Innovative Go-to-Market Model. We deploy a powerful and innovative go-to-market model that addresses the many ways a customer may choose to buy. We utilize a combination of highly productive inside sales team and a field sales team to target customers. In addition, we leverage the Qualtrics Partner Network, or QPN, for joint go-to-market opportunities, product enhancement and service delivery. We are intently focused on the profitable delivery of our solution. As such, we consistently measure sales rep productivity to ensure we achieve targeted goals for calling and conversion. Our sales rep impact is measured through a proprietary application, which provides transparency across our broad sales team on achievement to goals. We believe our go-to-market model enables us to meet customer requirements while utilizing our resources internally in an efficient way.
| |
• | Customer-centric Product Innovation. We are focused on continuously improving our software, and we have a customer-centric focus that is embedded in our culture. Using our own XM™ Platform, we are able to collect continuous feedback from our customers in real-time. This knowledge surrounding the needs of our customers enables us to drive product innovation and the direction of our company. For example, both our Customer Experience and Employee Experience solutions were created based on observing our customers using Research Core for specific customer and employee use cases.
|
Employees and Culture
Our culture of TACOS defines Qualtrics and our employees. These are principles that came about over 16 years, burned into in our DNA, one at a time. They make up lessons, beliefs, and a model to our success and of who we want to be. This is how people have described our culture from the inside. These words are how we talk internally. That being said, we are also aspirational that they are more than the language we use, that they must be lived up to on a daily basis by each one of us. TACOS are a call to action and North Star everyday as we approach our work. These are our TACOS:
Transparency. We are a meritocracy and hold ourselves accountable. We reward the competent over the confident.
All-In. We bet on Qualtrics and Qualtrics bets on us. This is our company. We deliver whatever it takes.
Customer Obsessed. If a customer is upset, we failed. Period. We learn, and we fix it.
One Team. There is only one team at Qualtrics. We hunt as a pack. We win and lose together and never say, “That’s not my job.”
Scrappy. We’re smart, resourceful and find a way. We write our own story instead of following others.
We live by our TACOS culture. Our culture impacts who we hire, how we retain and promote employees, and how we engage with each other and our customers.
We also utilize our XM™ Platform to close our own experience gaps. Employees understand how their own and their teams’ experiences connect to the value we deliver to customers and the perception of our brand.
Our own EX deployment keeps managers attuned to what is important to their teams and what is driving success. We understand what matters most and what drives engagement. These insights have led to unique benefits like our annual ‘experience bonus’ that offers employees an opportunity to have and share an epic experience with their peers, like a hike up Kilimanjaro, or a dance off with Justin Timberlake.
Our CX deployment feeds customer feedback directly into all employees’ hands as it occurs, so we all know who is a promoter, who is a detractor, and why. And we can all see these feedback loops closed in real time.
We take delight in our customers’ success and enthusiasm, as many of our employees were able to experience first-hand with approximately 7,000 attendees at our X4 Summit in March of 2018.
We care about each other and our community. In 2016, we launched a cancer research initiative, Five for the Fight, broadly supported by our employee base.
Our Growth Strategy
Key elements of our growth strategy include:
Drive New Customer Sales. We believe that our market opportunity remains largely underpenetrated. We will continue to invest aggressively in our direct and indirect sales and marketing capabilities to continue to acquire new customers, including continued growth in the number of enterprise customers.
| |
• | Expand Within Existing Customers. Our customer base of over 9,000 organizations represents a significant growth opportunity for us. Historically, many of our customers started with a general use case in the form of our Research Core platform, but we now also land with any of our four integrated solutions. Our XM™ Platform has the flexibility to allow a single division or a specific team to use it on a small scale, which could grow to an organization-wide deployment. As a result, there is an opportunity to expand both scale and use cases within an organization. As users start to focus more deeply on specific experiences, they will then look to Customer Experience, Employee Experience, Brand Experience, and Product Experience, complemented by Research on Demand. Our goal is to increase the number of customers that standardize on our platform within their organization, creating opportunity for expanded use cases.
|
Expand Our International Presence. A key focus of our company is to continue to penetrate unaddressed global markets. Constituents can provide feedback in 74 languages, and our core admin user interface supports 14 languages. To penetrate international markets, we have developed a hub-and-spoke sales model, comprised of centralized inside-sales teams surrounded by regional direct sales groups. Our first two international hubs were in Dublin, Ireland and Sydney, Australia. More recently we have opened sales offices in additional countries including France, Germany, Japan, Singapore, and the United Kingdom. To address data sovereignty concerns amongst our international customers we have built data centers in Canada, Germany, and Australia. We believe that this investment should further increase our international expansion opportunities. For the six months ended June 30, 2018, 22% of our revenue is from international markets, and we believe that there is significant opportunity for continued growth from outside the United States.
| |
• | Continue to Innovate and Enhance Our Platform. As we continue to build out our customer base, we use our technology to draw insights and ensure that we are best serving our customers’ needs. We believe continued innovation will lead to a greater value proposition for our customers and increased adoption of our XM™ Platform by both new and existing customers. In 2015, we built-out our Seattle office to function as an engineering center focusing on product innovation and development, including our artificial intelligence and machine learning capabilities. Since then, the office has grown to over 300 employees. In 2018, we launched our Krakow, Poland office as our European engineering center. Both of these growing locations support our goal of continuously enhancing our platform and providing the best technology for our customers.
|
| |
• | Grow Revenue from Key Industry Verticals. While our XM™ Platform is industry-agnostic, we have made a number of industry specific investments that will accelerate our adoption within certain verticals, including government, education, and financial services. We have developed Certified XM™ Solutions, leveraging partners’ expertise, and embedding industry specific content into our products. Our Certified XM™ Solutions are packaged projects and programs with expert content, workflow, and automation. In every key vertical, we have reference customers that we believe validate the adoption of our platform.
|
Further Develop Our Partner Network. We are building out a network of content and consulting partners, delivery partners, and technology partners who enrich our offerings, scale our coverage, and help us reach a broader audience than we would be able to reach on our own. We expect our partner channel to extend our sales reach and provide implementation leverage both domestically and internationally. At our March 2018 X4 Summit, we announced the launch of the QPN. Since then, we have entered into many impactful partnerships, including IBM, J.D. Power, and Kantar. We will continue to partner with other leading organizations to broaden our reach.
Our Platform, Solutions, and Technology
As a System of Action, our XM™ Platform enables organizations to identify, monitor, assess, and close experience gaps. We have designed our solutions to easily extract powerful insights across a customer or employee journey and drive action, allowing organizations to improve business results and increase shareholder value.
We offer a range of experience management solutions, including:
Integrated Solutions for Customer Experience, Employee Experience, Brand Experience, and Product Experience;
Research Core, which is powered by our iQ engine; and
Research on Demand, which enables organizations to generate measurable and tailored market intelligence to meet specific research needs.
Customers have the ability to deploy our experience management solutions with the flexibility to meet their specific needs across their organization.
Integrated Solutions
Customer Experience (CX)
Our CX solution enables organizations to collect extensive data on and draw insights from their customers at every touchpoint along the customer lifecycle. It provides customer-focused analysis that allows organizations to make effective, data-driven decisions ultimately leading to more customers, reduced customer churn, and increased loyalty.
Customer Experience use cases include:
Omni-channel Engagement, Measurement, and Optimization – Engage with customers across multiple channels, including in-app, email, SMS, mobile, interactive voice response, chat platforms, call centers, websites, social media, voice-enabled devices, and other channels; measure key touch points and interactions, and use insights to optimize decisions.
Customer Experience Reporting, Analytics, and Dashboards – Build automated, real-time dashboards to track customer analytics, identify customer experience drivers, and model the impact of CX on key customer loyalty and business metrics.
Follow-up and Case Management– Ensure no customer case is left unresolved with smart routing, automated actions, and end-to-end closed loop ticketing capabilities that help organizations follow-up on every relevant customer interaction from within our platform.
Our CX solution seamlessly integrates with existing operational workflow and system processes to ensure companies can easily use the tools provided to improve how they interact with customers on a day-to-day basis.
Employee Experience (EX)
Our EX solution provides a holistic view of an employee’s experience to help companies reduce unwanted attrition, improve employee engagement, develop and retain top performers, and build strong teams. It allows organizations to draw insights from their employees at every touchpoint during the employment lifecycle - from recruitment onwards.
Key use cases of Employee Experience include:
Employee Engagement – Enable managers to measure and quantify each of their employee’s experiences - in real-time. This empowers any person in an organization who is responsible for managing other individuals to analyze and track employee engagement and sentiment.
Multi-rater Employee Feedback – Enable managers or HR to aggregate an employee’s feedback from multiple parties, including managers, peers, and direct reports. Synthesizing all these data sources empowers managers or team leaders to better track performance, develop skills, and identify problem areas.
Training Feedback – Help organizations measure the effectiveness of their training and development programs, and determine what improvements can be made.
Pre-hire and Onboarding – Measure new employee experiences by tracking items such as satisfaction with the hiring and onboarding process, managers’ initial feedback on performance, and the effectiveness of the orientation processes. This measurement is not only able to assist in tracking the experience of newly hired employees, but also in understanding the experience of potential targets before they are hired.
Exit Interviews – Manage and monitor employee retention and the reasons provided for employee attrition during exit interviews. Careful collection and analysis of this valuable information regarding employee satisfaction can be used to inform ongoing strategies around employee fulfillment and retention.
We have architected our EX solution to meet the exacting requirements of human resource managers. It features workflows that enable employees to seek the right feedback from across the organization, robust administrator rights that enable higher anonymity thresholds, and interactive data visualization that conveys the right information to each user, surfacing the areas where potential improvements would drive the highest impact. The solution also integrates with a number of HCM and Learning Management System, or LMS, vendors.
Brand Experience (BX)
Our BX solution empowers brand managers to collect extensive data in order to understand key market trends, provide competitive tracking and intelligence, and conduct sentiment analysis across multiple channels. Organizations can measure how their brand is perceived, how that perception changes over time, and ultimately how to strengthen brand equity by optimizing brand and communication strategies.
Brand Experience use cases include:
Brand Awareness – Track changes in awareness and perceptions of an organization’s brand, and compare these changes in relation to competing brands to isolate key drivers of market success and decline.
Brand Equity – Understand the functional, physical, financial, social, and psychological aspects of an organization’s brand to gauge brand loyalty and value and ensure alignment with desired brand perception at the executive level.
Advertising and Copy Testing – Quantify an advertisement’s effectiveness by tracking and measuring consumer responses, feedback, and behaviors.
Brand Strategy Research – Optimize marketing investments by comprehensively testing and optimizing every element of an organization’s marketing strategy.
Segmentation and Positioning – Segment target markets based on demographics, needs, priorities, common interests, and other psychographic or behavioral criteria that can be used to better understand a target audience and a brand’s perception within that audience.
Product Experience (PX)
Our PX solution helps organizations collect extensive data on and draw insights from every stage of product development, from concept development to initial product marketing to ultimate product satisfaction and loyalty. Organizations can proactively incorporate this feedback into key product decisions, assisting in product feature prioritization and building a data-driven product roadmap.
Key Product Experience use cases include:
Concept Testing – Collect rich feedback on ideas and prototypes to accelerate the innovation process and validate early concepts before development and production. Ubiquitous access to real-time product feedback ensures that concept testing is performed efficiently, and minimizes unwanted development bottlenecks.
Pricing Research– Eliminate ad hoc and disjointed pricing analyses and replace them with a unified pricing research approach capable of identifying valuable product features, empowering a data-driven pricing strategy, and maximizing revenue for each product. Tests can be conducted at any point in the product lifecycle, and can help organizations understand the value of both full products and specific features.
Market Analysis– Understand the audience for an organization’s products and services through both in-depth customer feedback and broad market feedback. Focus product development on goods and services that would appeal to target market segments, and solicit feedback on designs and concepts from relevant buyer types.
Usability Testing – Optimize the user experience for both physical and digital products by testing and validating product design decisions that can carry significant business repercussions. These research methodologies and analysis can assist companies in making large scale changes with confidence.
Conjoint Analysis– Ensure that products and services comprise the features and specifications that are most important to target consumers. This can empower organizations to build more innovative products, predict customer demand, efficiently allocate R&D resources on areas that are most important to consumers, and understand which products and services will drive the highest financial impact and widest customer satisfaction.
Research Core
The Qualtrics Research Core platform is our collection of powerful, flexible, cross vertical research tools used to build and distribute data collection schemes, aggregate and analyze data, and build reports and draw insights from data. This platform is the underlying toolset powering all four of the experience solutions, and can also be purchased directly by our customers to allow their users to conduct sophisticated research in a simple, easy-to-use platform. These users can adopt a self-service approach to conducting a wide variety of research projects that formerly required hiring expensive outsourced consultants, such as tracking consumer behavior across diverse segments, conducting complex academic research, and advertising and product testing.
Research Core includes the following critical functionality:
Intelligent interactions.Research Core enables organizations to engage with constituents in a natural way through intelligent interactions across a variety of channels, such as email, websites, and SMS. Our platform can conduct data collection from constituents both in traditional ways, such as sending pre-created questions to pre-selected audiences, and contextual ways, such as dynamically-generated, in-context question prompts on websites and mobile apps that can target specific individuals based on various criteria.
Advanced analytics. Once data has been collected, Research Core provides users with robust, best-in-class analysis tools that are easy-to-use for anyone. Data visualization then allows customers to see dashboards tailored to their role within their organizations and schedule reports to be automatically shared with peers, clients, managers, and others on a regular basis to ensure that everyone in the organization is informed of a project’s results in real-time.
Prescriptive actions. Research Core goes beyond data analysis by providing organizations with insights into the actions they can take to drive improvements in their organization. Our platform includes functionality for automatic alerts, action planning, and closed loop ticketing. Tickets can be triggered based on conditions predetermined by the user to inform them of experience gaps in a constituent’s journey and can alert users both within the Qualtrics platform, or in other channels like email, Slack, Salesforce, and other channels through Web API requests.
Research on Demand
Our Research on Demand solution allows customers to gain market intelligence for a particular area of interest by procuring a curated group of respondents and swiftly returning actionable results, while conforming to best-practice design and methodology. We provide our Research on Demand solution as an automated, software-led approach, providing ease of use and efficiency for our customers. Our Research on Demand solution is sold into our existing XM™ Platform customers.
Powerful and Predictive Intelligence Engine
Our solutions are powered by our predictive intelligence engine, iQ. Our iQ engine consists of the following critical functionality:
iQ Directory
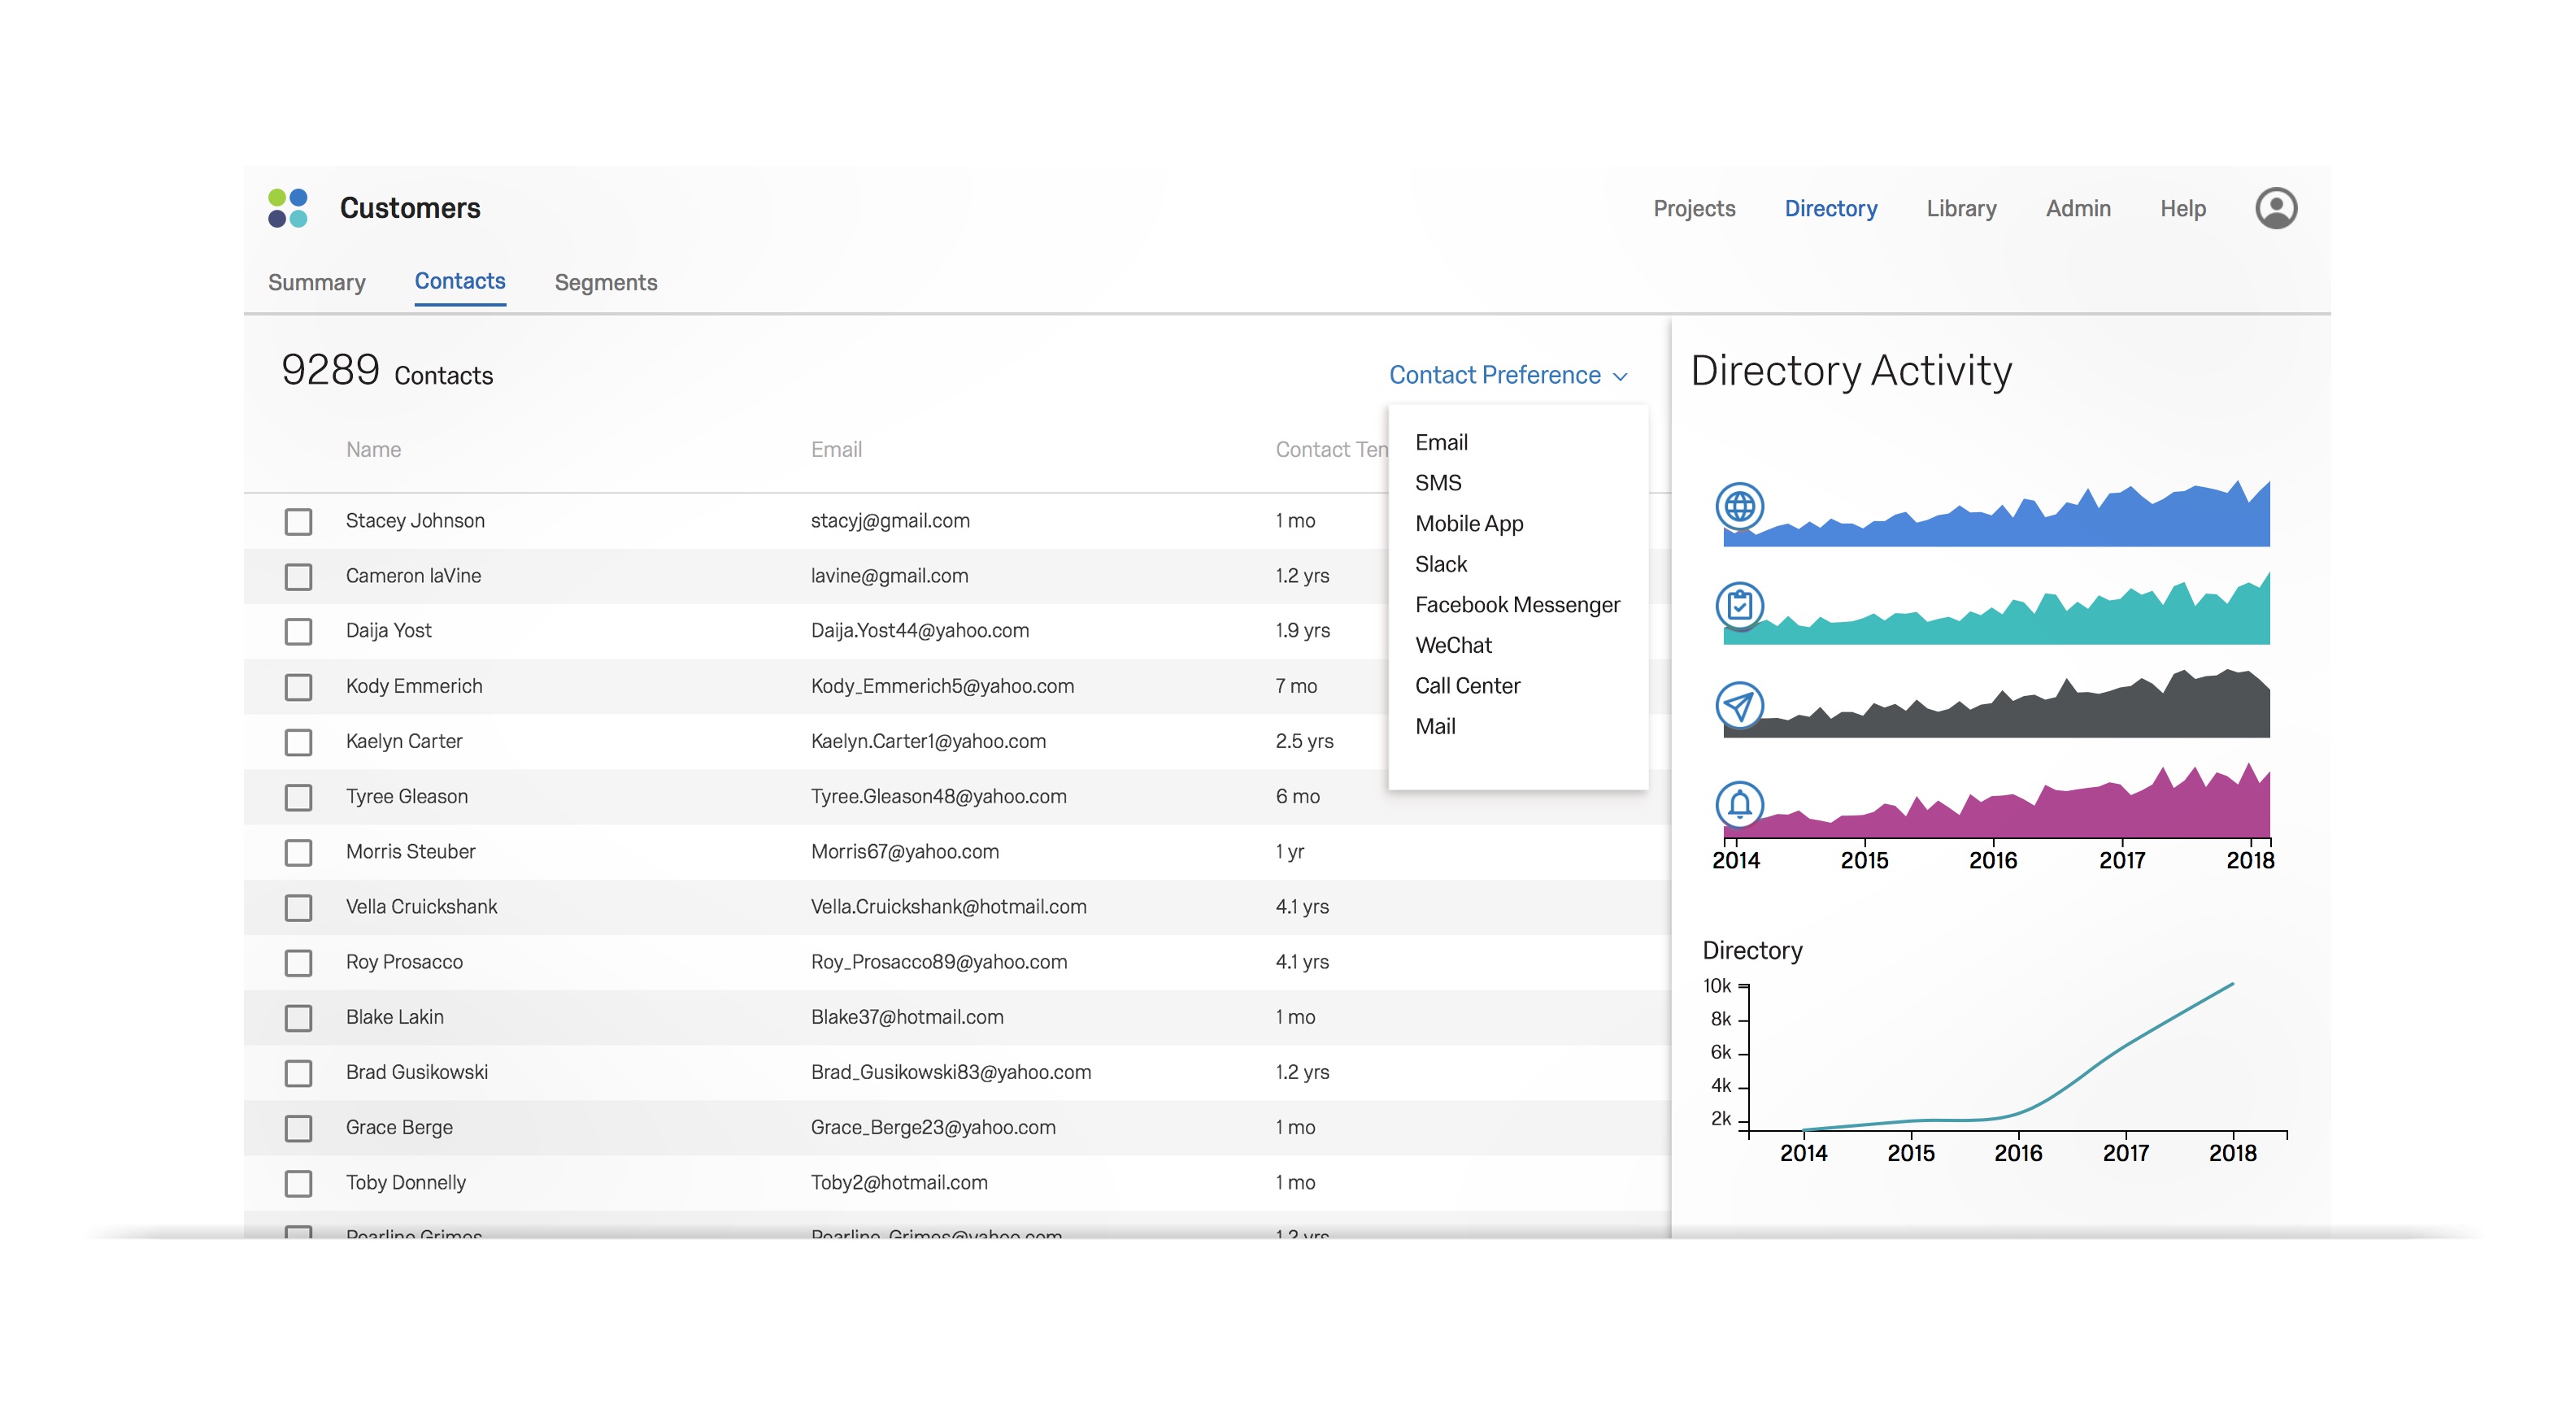
The iQ Directory contains all experience data collected over time, formally tracking all experiences, interactions and feedback that each individual provides to an organization. iQ Directory enables an organization to collect data from multiple data sources and gain a person-centric view of their constituents by capturing each interaction throughout the constituent’s journey. The directory makes it possible for organizations to pinpoint key drivers and changes in individual sentiment over time and drive action to close experience gaps. For example, an e-commerce company can track a customer’s key experience touchpoints across the lifetime of the customer, including sales of items, customer feedback, and engagement with customer support, all in one location. iQ Directory’s machine learning technology also helps predict how an individual might respond in a certain situation. This enables organizations to interact with people at the right moment, with the right message, via the right channels to drive the most optimal outcomes, and allows interactions with individuals to feel like an ongoing conversation rather than transactional pings along a constituent’s journey. iQ Directory also allows organizations to better understand the journeys that their customers are experiencing, helping them to identify key gaps in customer interaction with their brand.
Text iQ

Our Text iQ functionality uses natural language processing and machine learning algorithms to analyze unstructured, open-end text data for responses and insights. Our technology uncovers trends within unstructured data responses without any additional manual tagging by using a cluster-based approach to understand the context of the unstructured data and extracting insights from the data automatically. Text iQ assigns sentiment scores to incoming open text data to allow organizations to capture the emotion of individual respondents and each topic they discuss, directing organizations on where to focus their attention. For example, after requesting written employee feedback, a financial services company can immediately gain a pulse on how the employees feel about the company and can drill down to understand specific employee sentiment by job type and which aspects employees are most frustrated with, allowing the company to identify and act on problem areas within the workplace. Text iQ automatically updates reports and dashboards with this analysis and immediately pushes this newly-analyzed data to employees, giving them the insights they need to make changes in the moment while also showing the evolution of sentiment over time.
Stats iQ
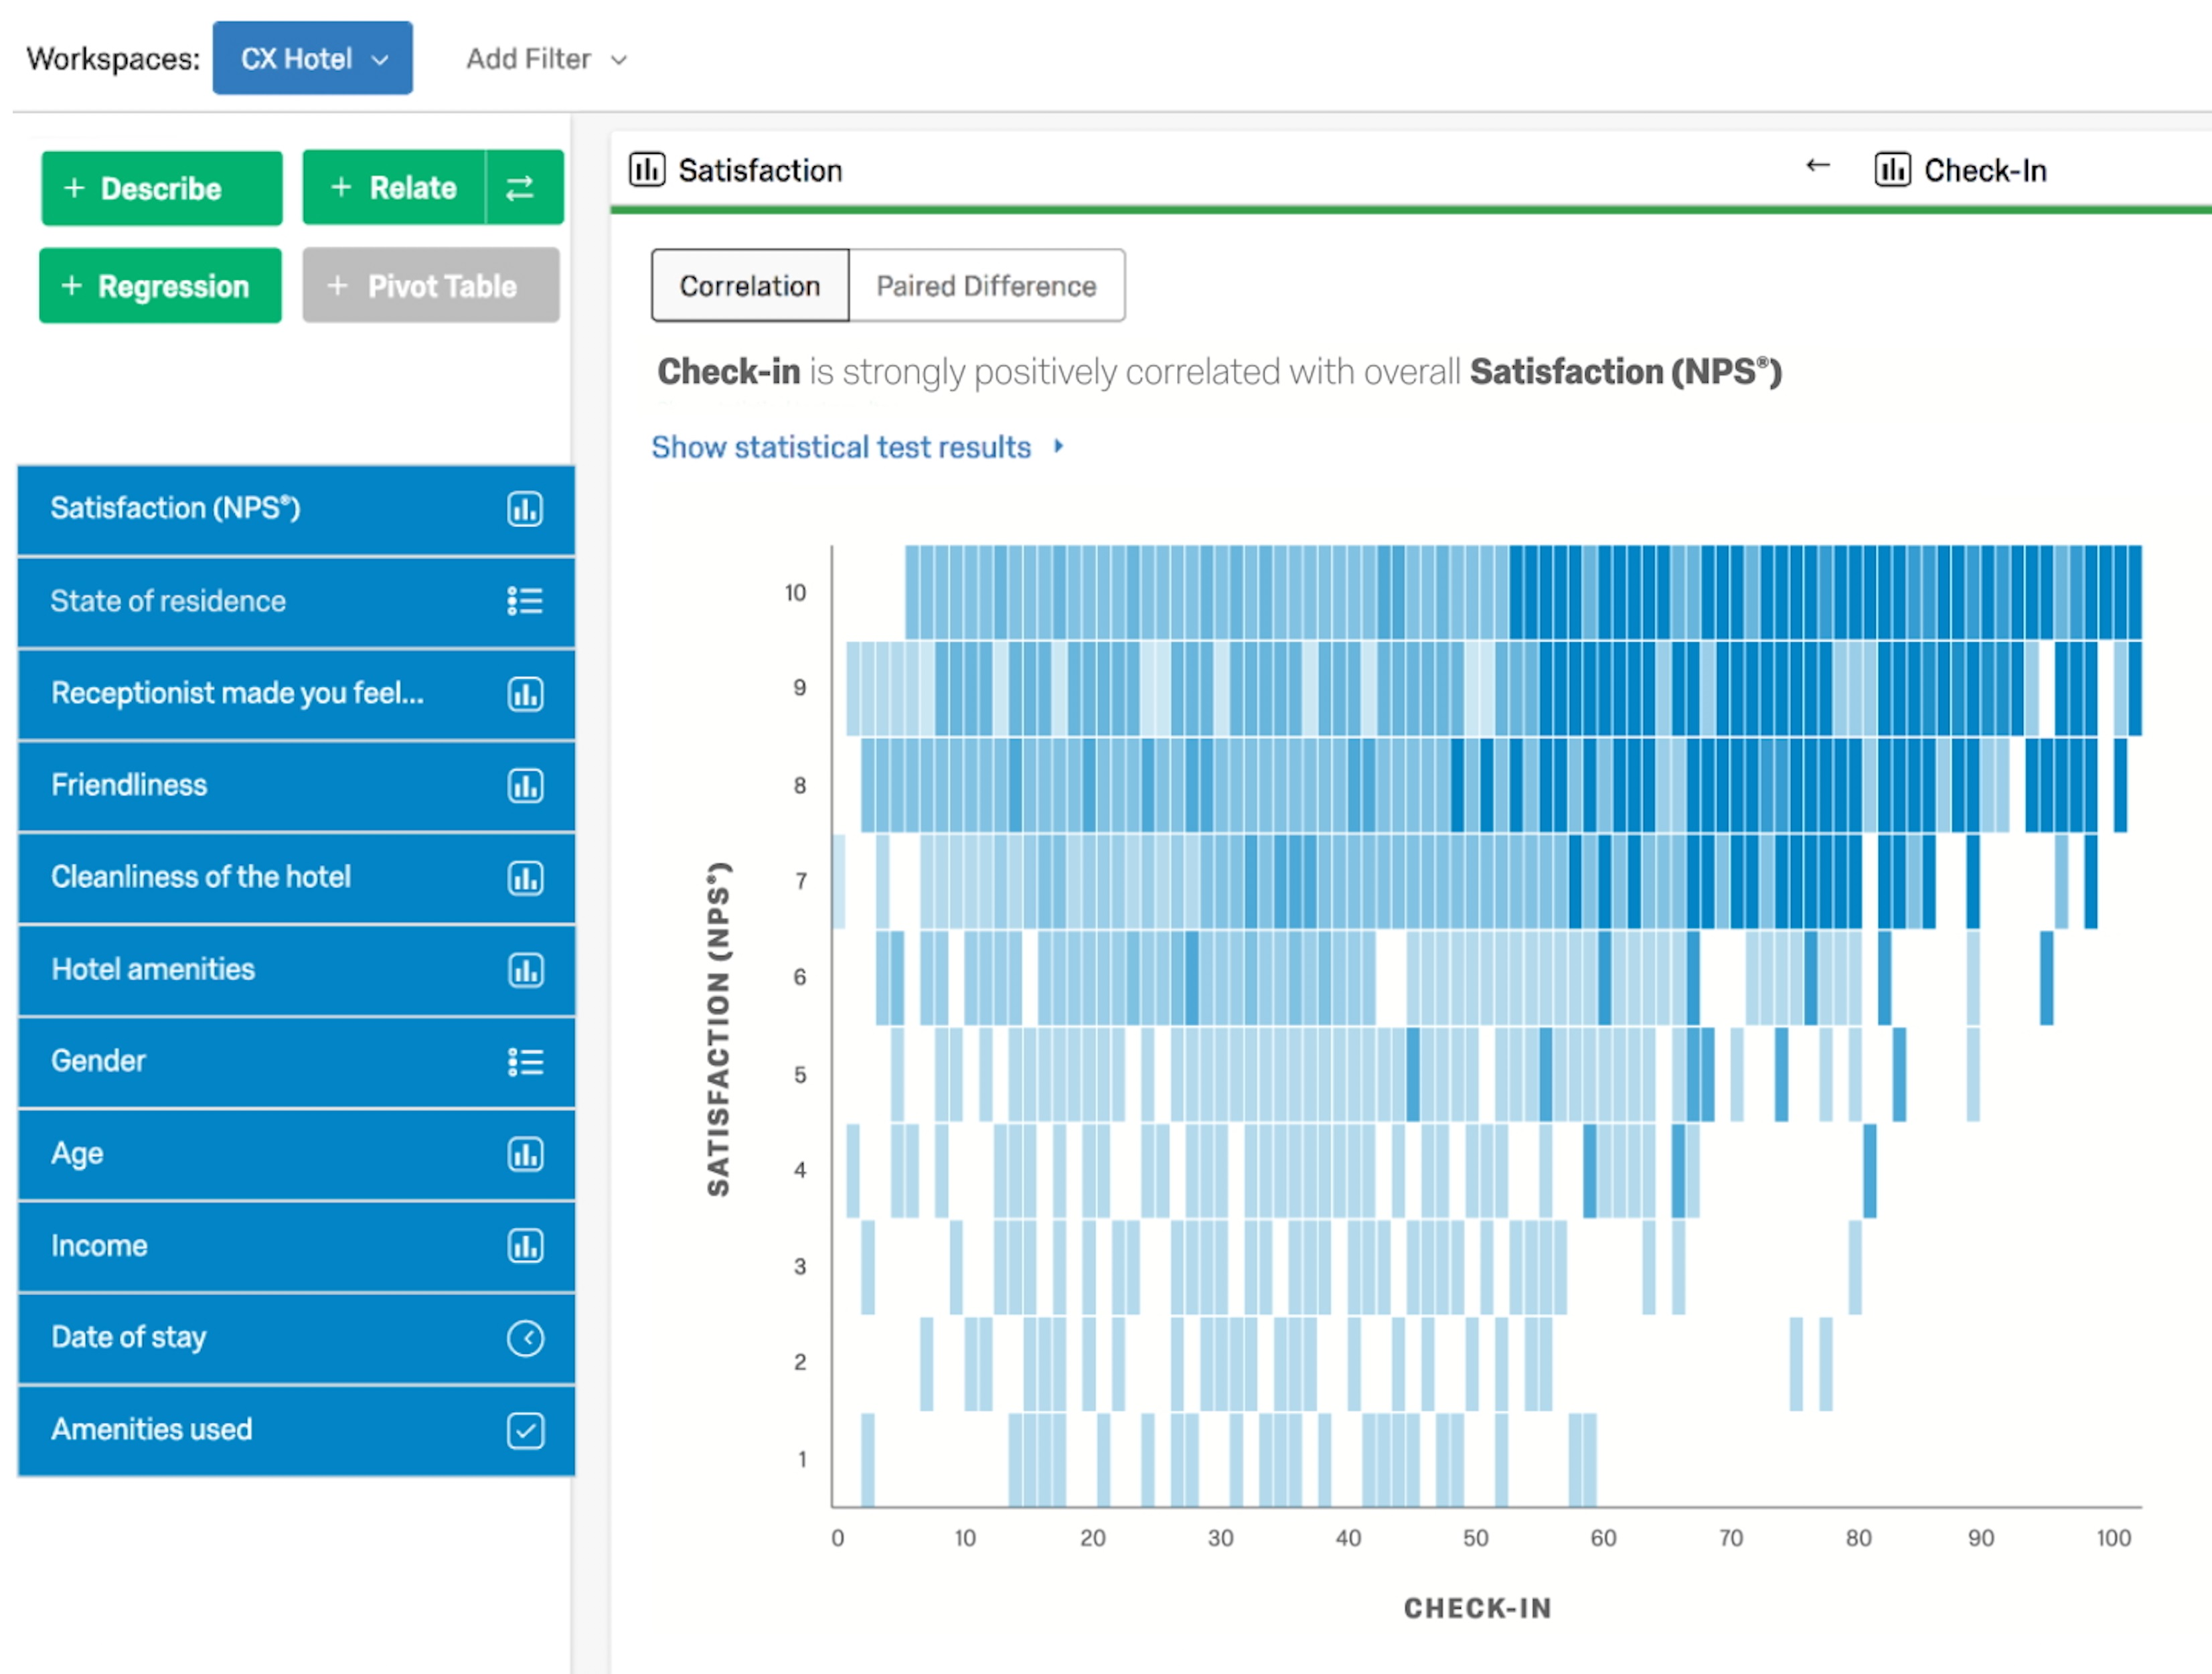
Our Stats iQ technology makes advanced statistical analysis of experience data accessible for any user. Based on the structure of the data set, Stats iQ automatically chooses the appropriate statistical analyses to run and then presents the results to the user in a digestible and understandable format in plain English, which democratizes the ability for anyone in an organization to extract business insight from sophisticated research and analysis. For example, when reviewing feedback on brand awareness and equity, a consumer-packaged goods company can use Stats iQ to automatically correlate awareness and equity by demographics and location to understand which groups of people they should target in their marketing strategy. Stats iQ also helps organizations identify their distinct customer cohorts, and better understand the characteristics, needs, and satisfaction levels of those key groups. Comprehensive and advanced data analytic functions include relate, univariate, bivariate, crosstabs, pivot tables, regression, and modeling.
Driver iQ
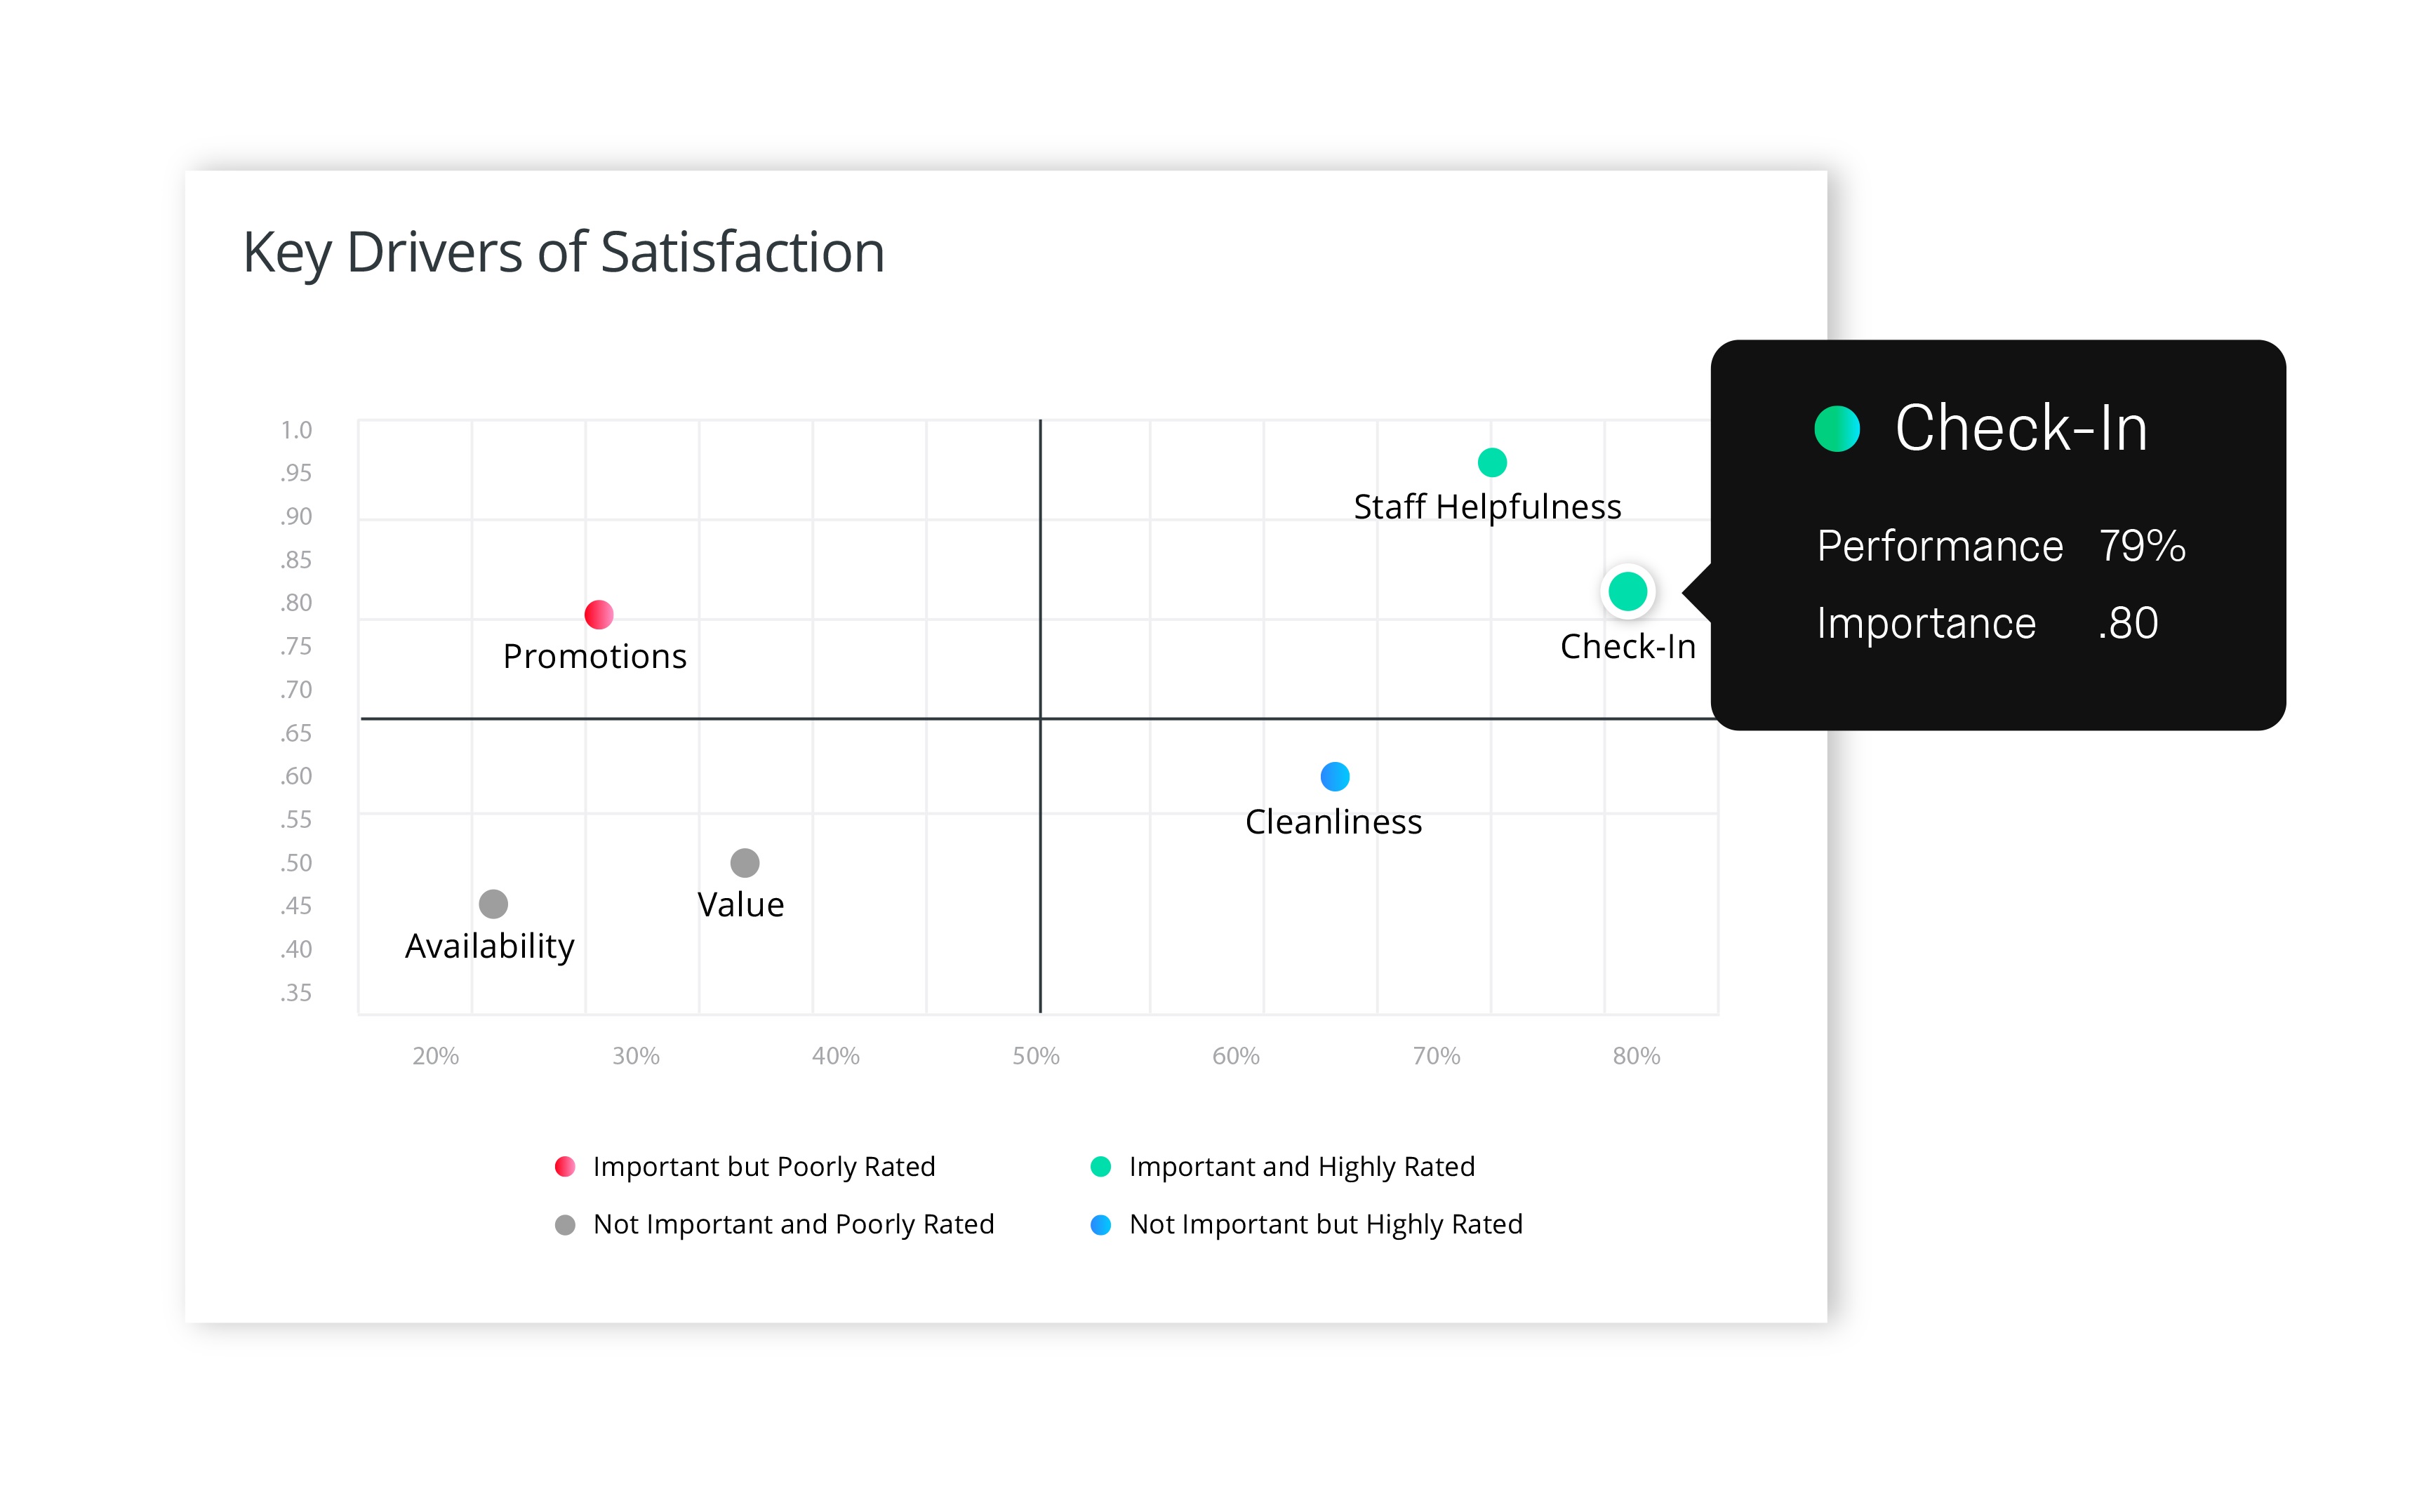
Our Driver iQ technology uses financial impact and advanced regression analyses to automatically recommend the organizational improvements that will drive the highest ROI. It prioritizes key drivers from the C-Suite to the frontline employees in clear business terms. Using advanced statistical analytics, Driver iQ correlates the quality of the customer-journey with specific satisfaction drivers, and allows users to prioritize the drivers that will most improve the overall experience going forward. For example, when receiving feedback on paint colors for a new line of cars, an automotive company can use Driver iQ to identify which car colors will drive the highest sales amounts, allowing them to produce the optimal amount of each color of car. The Driver iQ interface also allows different users to configure the data in real-time to drill down in the data and identify the key drivers at their specific points of impact, yielding more relevant and actionable insights and follow-up directives for each specific user.
Predict iQ
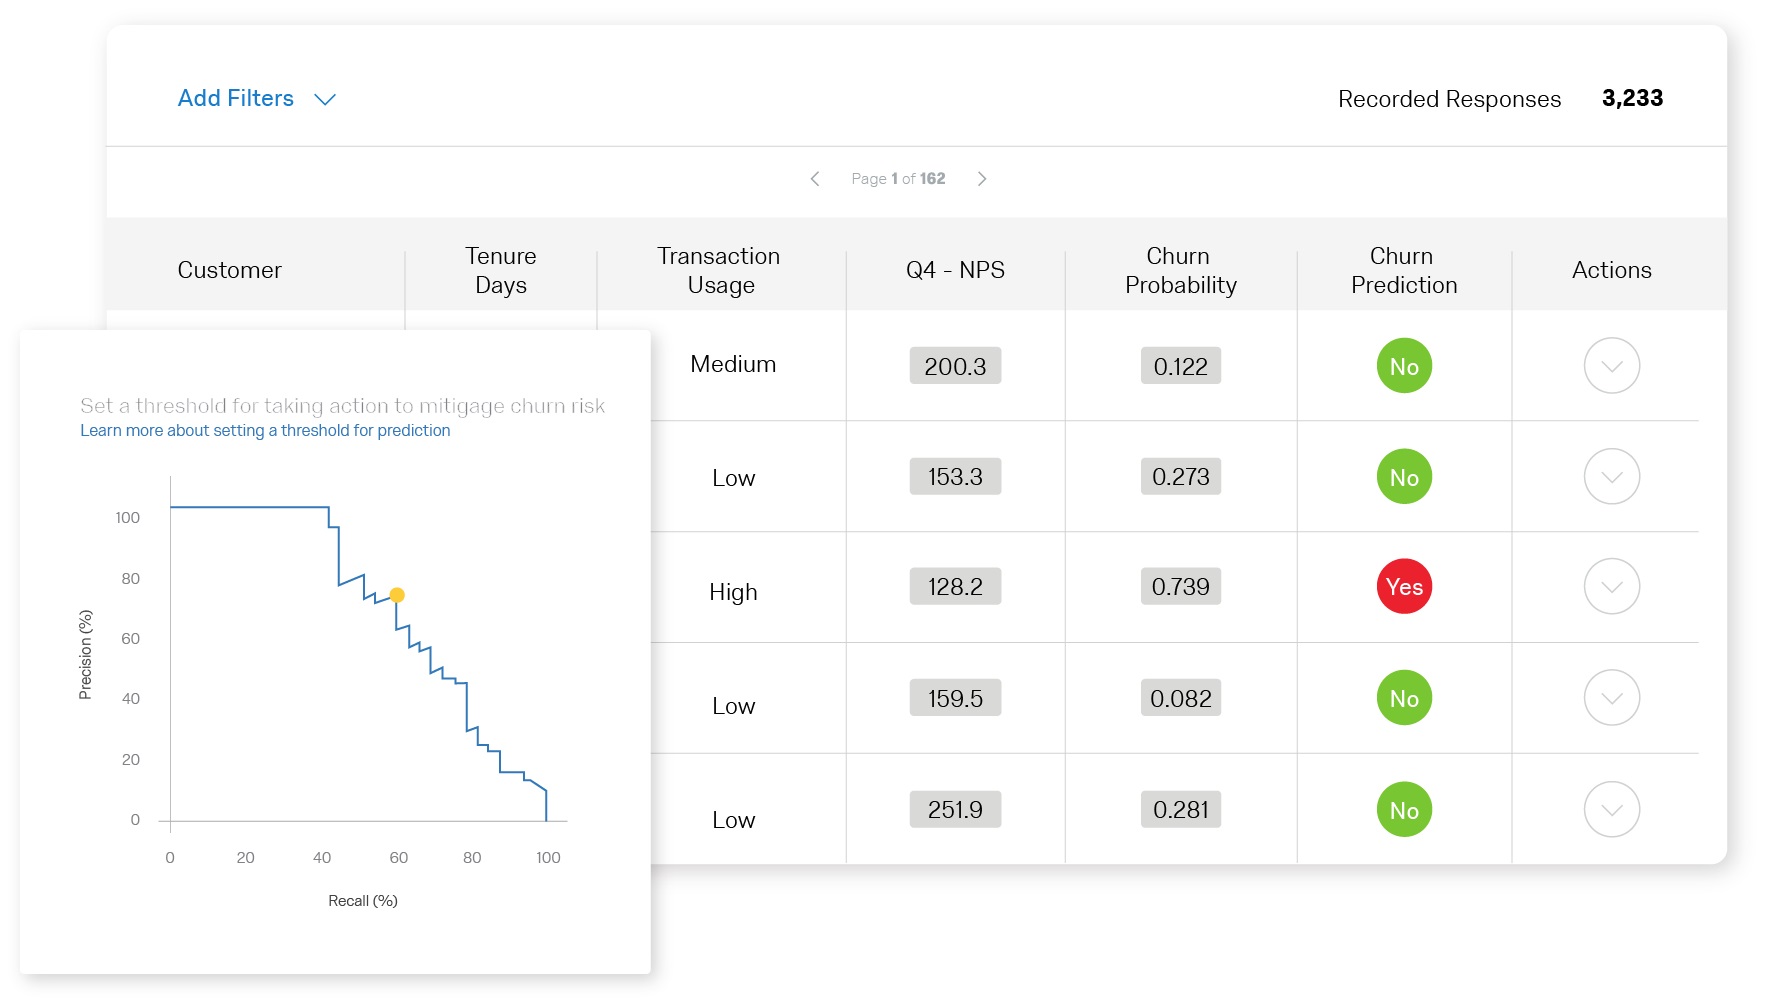
Our Predict iQ technology helps companies understand which customers are likely to leave and what they can do to prevent attrition before it happens. Using deep learning neural networks and open-source algorithms to make its predictions, Predict iQ identifies customers who are likely to churn and provides visibility into what is driving that behavior. The technology can also be used in a workflow with Qualtrics Actions, allowing users to set up triggers to send emails, create tickets, or ping any third party service for immediate action to prevent attrition. For example, within an enterprise software company, if Predict iQ identifies a customer that has unresolved issues with the product and is likely to churn, the company’s pre-set workflows can open up a ticket in Salesforce to remind their sales and customer success teams to resolve any product issues and provide the right amount attention to the customer. Users can also leverage other Qualtrics iQ technologies, such as sentiment analysis from Text iQ and regression models from Stats iQ, into Predict iQ to provide the neural networks with additional variables that users find relevant to enhance the accuracy and sophistication of the deep learning algorithms.
Flexible Integrations
We have extensive real-time API integrations into leading enterprise applications, collaboration tools, and communication platforms. Users can configure workflows in Qualtrics Actions that automatically trigger events and send emails, create tickets, or ping any third party service for immediate action. We provide out of the box integrations, including Adobe Analytics, Marketo, Microsoft Dynamics, Salesforce, Slack, Tableau, and Zendesk. Additionally, we offer the ability to use our API and build out custom integrations with third party or in-house tools, allowing users to seamlessly integrate our platform with existing tools and workflows. There are also numerous custom integrations that we have built for our engineering service engagements, including integrations with Oracle Eloqua, TripAdvisor, and Twilio.
Modern Data Processing Architecture
Approximately 50 million distinct responses are generated each month on our XM™ Platform. Each piece of X-data™ represents a distinct data stream, which are combined with related streams generated from social media, enterprise, and third party integrations via API. Our platform continually aggregates these data streams to provide up-to-the-minute analytics, as well as near real-time analysis across billions of historical data points collected. Our architecture is designed to scale horizontally and cost-effectively by combining the Platform-as-a-Service offerings and modern open-source technology stacks running within our co-location data centers.
Information Security as a Key Business Enabler
We have achieved multiple information security certifications including the globally recognized ISO 27001 standard in addition to FedRAMP certification to authorize the use of our XM™ Platform for U.S. Federal Government agencies.
These certifications require ongoing independent validation of our compliance frameworks to provide our customers with confidence in choosing our platform. Our premium Data Isolation feature protects customer response data with a customer specific encryption key. Qualtrics is Privacy Shield certified and provides our customers with self-service tools to help comply with privacy frameworks such as GDPR.
Customers
As of September 30, 2018, we had over 9,000 customers using our platform in more than 100 countries. We have key reference customers in many industry verticals that we believe validate our solutions in the market, and our customers range from small and medium-sized organizations to Fortune 100 companies. Below is a representative list of customers categorized by industry vertical. No single customer accounted for more than 2% of our revenue in 2017 or in the six months ended June 30, 2018. As of September 30, 2018, each customer listed below has spent more than $100,000 in Subscription ACV.
|
| | |
Banking / Insurance | | Oil & Gas / Utilities |
Allianz SE
American Express Company
Bank of America Corp.
GEICO Corporation
| | CenterPoint Energy, Inc.
Chevron Corporation
Duke Energy Corp.
E.ON SE
|
| | |
Consumer Packaged Goods | | Retail |
adidas AG
The Coca-Cola Company
Levi Strauss & Co
Under Armour, Inc.
| | CDW Corporation
CVS Health Corporation
Target Corporation
Weight Watchers International
|
| | |
Education | | Services / Consulting |
Denver Public Schools
Columbia University
Northwestern University
University of California, Los Angeles
| | Aramark Corporation
Bain & Company
Gallup, Inc.
PricewaterhouseCoopers LLP
|
| | |
Government | | Technology |
Centers for Medicare and Medicaid Services
General Services Administration
United States Air Force
United States Postal Services (USPS)
| | Atlassian Corporation plc
Cisco Systems, Inc.
Dropbox, Inc.
Microsoft Corporation
|
| | |
Healthcare / Life Sciences | | Telecom / Media |
AstraZeneca plc
Cerner Corporation
DaVita Inc.
Pfizer Inc.
| | Scripps Networks Interactive, Inc.
Sprint Corporation
Telefónica, S.A.
The Walt Disney Company
|
| | |
Industrials / Automotive | | Travel / Hospitality |
Airbus S.A.S.
Bayerische Motoren Werke AG (BMW)
Ford Motor Company
Volkswagen AG
| | All Nippon Airways Co., Ltd.
American Airlines, Inc.
Cathay Pacific Airways Limited
MGM Resorts International
|
| | |
Non-Profit | | |
CFA Institute
The Character Lab
Girl Scouts of the United States of America
National 4-H Council
| | |
Customer Case Studies
We believe that the following case studies provide a representative sample of how our customers use our XM™ Platform and illustrate the results our customers have achieved using our XM™ Platform.
Allianz Global Corporate & Specialty
Allianz Global Corporate & Specialty, or AGCS, is the Allianz center of expertise for global business insurance and large corporate and specialty risks. AGCS has a worldwide network in more than 200 countries and territories, including a network of more than 70 Allianz-owned offices.
Situation:
In 2015, AGCS knew that it was operating in a highly competitive market where excess supply and declining rates were applying pressure on it to innovate and provide a superior service in order to retain and attract new customers. It needed to make sure it was staying ahead of the market, which required providing its employees and leadership the insights that would help anticipate customer needs and provide a single view of its customers. With the introduction of a new CEO, Allianz began to implement the Allianz renewal agenda, with one of the key pillars being true customer centricity. Through this, AGCS started to develop a clear roadmap to make it a truly customer centric organization. It believed that through a heightened focus around customer experience, it could increase revenue growth, expand its margins, and improve its competitive position. To achieve these goals, AGCS brought together a team of 35 key business leaders from across the world to design a scalable customer experience program that would win over customers and accelerate growth year after year. It needed a partner that would not only provide it with a leading technology platform, but also work with it in a consultative way to help shape the future of its customer experience program.
Qualtrics Solution & Benefits:
In 2015, AGCS selected Qualtrics to partner with on this initiative. AGCS quickly rolled out a globally consistent program on the Qualtrics XM™ Platform to collect experience data from customers in 22 countries and in 16 languages. This program consisted of a relational program for both brokers and clients and a transactional program for clients.
Under its relational program, AGCS sent custom consumer feedback requests to both brokers and clients to understand how it perceived AGCS, and just as importantly, to determine how AGCS’ stakeholders’ perceptions of AGCS compared to its perception of competing brands. After receiving the ongoing results in real-time dashboards, country-level business units used the information to evaluate the status of its customer relationships and benchmark its competitive performance in the market. This feedback allowed managers and leaders to develop clear action plans on global, functional, and local levels to improve ACGS’ CX.
After launching the relational feedback system, AGCS saw clear improvement opportunities to gather feedback regarding customer satisfaction directly after an experience. As part of its transaction program, AGCS began to solicit feedback from customers after a visit from a risk engineer. Qualtrics provided the risk engineers real-time customer insights who could then quickly work to close the loop with the customer. Following the success to date, AGCS will be expanding this program in 2019.
Results:
As a result of its implementation of the Qualtrics XM™ Platform, AGCS has achieved the following results:
AGCS has established a centralized view of all customer insights, helping it uncover key gaps in its customers’ journeys and business opportunities.
A year into its program, AGCS was able to determine the direct impact of client and broker satisfaction on key business metrics. Specifically:
| |
◦ | Gross Written Premium, or GWP, of brokers who were promoters was two times higher than compared to detractors; and |
| |
◦ | GWP of clients who were promoters was six times higher than compared to detractors. |
As a response to gaps surfaced in customer feedback, AGCS has developed innovative products for businesses to protect themselves from emerging risks, such as cybersecurity.
AGCS is making the connection between CX and EX internally, and is due to launch the first employee pulse check, using the Qualtrics employee experience solution by the end of 2018. It believes that the future of experience management involves linking these two critical programs together.
Between 2016 and 2017, significant improvement was seen in the NPS performance of AGCS in 22 countries with over 75% achieving above market or loyalty leader position.
Belkin International, Inc.
Belkin International, Inc., or Belkin, is a privately held, American manufacturer of consumer electronics that specializes in connectivity devices, headquartered in Los Angeles, California.
Situation:
As a consumer electronics manufacturer, Belkin’s customer experience is primarily defined by the interaction that its customers have with its product. To manage the user experience across every customer touchpoint and for all products, Belkin needed a flexible and agile end-to-end user experience feedback platform accessible across departments (engineering, marketing, and executive management) that could report out data in real-time.
Qualtrics Solution & Benefits:
Using both Qualtrics’ CX and PX solutions, Belkin has implemented a fully automated process to collect, aggregate, and track product feedback across all stages of the customer journey. Customer feedback is then made visible to all of Belkins’ key stakeholders through Qualtrics dashboards, and is integrated with its salesforce through salesforce.com to power real-time triggers and ticketing through the system that its employees already use. By embedding Qualtrics into Belkin’s existing technology stack, employees can immediately resolve customer issues seamlessly.
An important use of Qualtrics at Belkin is the capacity for real-time user feedback across a product life cycle, particularly in the first 90 days of a product launch. For example, after the launch of a new networking product line, the Belkin product team collected user feedback at multiple touchpoints, including post-sales, post-support, website searches, and community message boards. Using Qualtrics, the team organized the data by customer segment, and distributed the data through filterable dashboards. Even though the product development team did the standard pre-work for launch such as focus groups with consultants, post-release sales indicated poor product market fit with the intended buyer. To take immediate action and address the growing sales gap, Belkin held daily team huddles with its marketing, engineering, and product teams to review the Qualtrics data and insights. Using Qualtrics statistical and text analytics, the cross-departmental product team was able to make daily improvements to the product, messaging, packaging, instructions and customer support needs. These daily strategy sessions, powered by Qualtrics real-time insights served to get product sales back on track within two months and eventually helped the team exceed initial first year projections.
Results:
As a result of its implementation of the Qualtrics XM™ Platform, Belkin has achieved the following results:
Using Qualtrics data, the product teams intervened post-product launch and successfully closed an $80 million gap against sales targets.
Using Qualtrics to surface product gaps and drive improvements, Belkin reduced support call volume by 5% year over year.
Using feedback from prospects, sales enablement was able to take specific actions to improve sales training, resulting in a 30 point improvement in post-sales call NPS.
Amazon.com ratings improved from 2.8 to 4.7 stars - and became the #1 recommended product for the category on Amazon.com.
BlackRock, Inc.
BlackRock, Inc., or BlackRock, is a global investment management company based in New York, New York that manages over $6 trillion in assets and has almost 15,000 employees worldwide.
Situation:
Competing in the extremely personalized and competitive world of financial planning and investment management, BlackRock knew that it needed to maintain a high level of service, and understood that a highly engaged workforce was the key to delivering a superior experience to its clients. BlackRock’s leadership desired to build an end-to-end employee experience program agile enough to grow with its organization. BlackRock’s leadership was interested in understanding what drove its engaged and enabled workforce. BlackRock wanted the flexibility to ask the questions specific to its organization and allow its in-house data experts to analyze the data and glean insights. BlackRock sought to partner with an organization that would empower it to listen to its employees and quickly understand what changes needed to be made to improve engagement.
Qualtrics Solution & Benefits:
In the first quarter of 2015, to accomplish its goals of creating a flexible and sophisticated EX program, BlackRock turned to Qualtrics. With the Qualtrics EX platform, BlackRock implemented an internally-managed, employee experience program that has allowed it to reduce costs, enhance capacity, save time, and mitigate risk. BlackRock began its partnership with Qualtrics by sending out an annual employee engagement feedback request to every employee across its organization. Through Qualtrics’ organizational hierarchy management and integration with its Human Capital Management System, BlackRock provided senior managers and executives with direct, real-time access to engagement metrics, clearly laying out key improvement areas. In collaboration with its leadership, BlackRock’s human resources team used the company-level data to establish company priorities and set action plans for the coming year. To monitor progress in certain focus areas, BlackRock solicited regular employee feedback and encouraged ongoing and open conversations between employees and leadership through customized, pulsed requests to small employee populations throughout the year. Blackrock then expanded to Qualtrics’ 360-review module, allowing it to provide comprehensive, automated, and actionable insights to company leaders regarding areas of improvement in their skill sets.
BlackRock is also utilizing the 360 module to enable its most promising leaders to better understand their strengths and areas for development in preparation for promotion to more senior roles. In addition to an employee engagement and multi-rater assessment programs, the BlackRock human resources team uses the Qualtrics EX platform for a number of ad-hoc professional development and culture-building initiatives, and continue to expand its use cases.
Results:
As a result of its implementation of the Qualtrics XM™ Platform, BlackRock has achieved the following results:
Built a centralized, rigorous employee data management system that directly integrates with all core human resources systems and connects engagement and performance data to identify the impact of performance metrics on enablement, engagement, and attrition.
Has reduced employee experience program costs by 66% per year by transitioning from an external third-party to an in-house employee insights program.
Successfully moved from batch-based monthly reports to realtime dashboards and analytics, enabling human resources to move from feedback collection to recommendations in 1/10th of the time (from one month to three days).
Improved its efficiency and effectiveness in identifying what employees desire in a high performing manager; thereby allowing BlackRock to build a customized manager training programs.
Under Armour, Inc.
Under Armour, Inc., or Under Armour, headquartered in Baltimore, Maryland, is a company that manufactures sportswear, footwear, and casual apparel.
Situation:
In the highly competitive sportswear space, Under Armour has built and maintained its advantage through the introduction of innovative products. The product innovation team at Under Armour learned early on that the most game-changing products are developed through a deep understanding of how athletes actually use its products and what they need to succeed. For Under Armour, athletes define unmet needs and are the ultimate critics or champions of the products that Under Armour creates. As such, Under Armour understands how critical it is maintain a connection to athletes throughout the product creation process, engaging with them to learn about their needs and specifications before a product goes to market. To enhance the communication channels and receive real-time product feedback from its athlete-customers, Under Armour needed a platform that could be a competitive advantage by channeling hundreds of deep insights from athletes to products.
Qualtrics Solution & Benefits:
In 2013, Under Armour started with a $10,000 per year license to enable its Consumer Insights team to conduct consumer research. Its implementation of Qualtrics quickly grew in scope to include product testing and perception research, and in 2014 Under Armour partnered with Qualtrics to develop a sophisticated wear testing platform. On the Qualtrics XM™ Platform, Under Armour built a complex product feedback and evaluation system that could run and automate thousands of projects throughout the year, helping it to manage the typical seasonal surges that most apparel companies experience. Under Armour built and began to manage its team of over 10,000 wear-testers through the Qualtrics XM™ Platform. After Under Armour product teams enter new projects into the platform, Qualtrics automatically identifies the right testers to send the products to, narrowing the database based on details like running miles per week, hours of activity, and surface conditions experienced by each product-tester. Through an API-based integration with FedEx, Qualtrics makes it easy to ship product directly to appropriate testers. These testers then provide detailed product feedback at defined milestones through a variety of formats, including structured questions, heat map images, hot spots, open text, and video and image uploads. Using Qualtrics, Under Armour reports out and distributes real-time evaluation data, providing relevant views of product health and issues with automated custom report templates for different members of cross-functional teams like development, design, and marketing.
Results:
As a result of its implementation of Qualtrics Product Testing platform, Under Armour has achieved the following results:
Grew its product-tester database from approximately 100 to over 10,000 vetted, dedicated athletes from 2017 to 2018.
Created a detail-rich database of athletes (including details such as level of skill, surfaces played on, frequency of product wash, etc.) to scale a detailed, context-specific testing program which enables Under Armour to get the right product to the right product-tester.
Evaluated over 2,000 products in less than one year through the ease and speed of the Qualtrics Product Testing platform, enabling the automation of the complete product testing process.
Introduced cross-functional teams across Under Armour to a more detailed and data-driven decision-making process by focusing on in-depth feedback in the moment.
Under Armour was able to realize faster time to failure through real time access to specific and timely tester feedback, helping it to improve or cut potentially under performing products.
Created an efficient, single system for a global team to manage the testing process, engage testers, and deliver insights throughout the company.
Volkswagen Group Australia
Volkswagen Group is a multinational automobile manufacturer headquartered in Wolfsburg, Germany and is currently the world’s third largest car maker by volume.
Situation:
In 2016, Volkswagen Group Australia , or Volkswagen, was looking to increase customer loyalty across its dealership network. To accomplish this goal, it wanted an experience management platform that could help fuel an innovative CX program in the sales and post-sales process. It also knew that the key to providing a superior CX was to engage frontline employees, so it looked for a technology platform that could integrate insights and drive action across both CX and EX programs.
Qualtrics Solution & Benefits:
In 2016, to support this effort, Volkswagen selected Qualtrics to power its new CX program. Using Qualtrics, Volkswagen was able to solicit feedback from customers who had had a recent interaction with a dealership. Based on customer feedback, Volkswagen was able to trigger automatic and personalized alerts to dealership salespeople and managers-providing thousands of employees access to real-time dashboards to monitor daily performance and built-in tools to take action and drive accountability. These dashboards have become critical to all dealership employees, as Volkswagen directly ties incentives to CX metrics.
In 2017, Volkswagen added the Qualtrics EX solution. Now, Volkswagen collects experience data from dealership employees to evaluate their engagement level, assess their likelihood to remain at Volkswagen, and understand the drivers behind why they might stay or leave. The integration of the CX and EX solutions allows Volkswagen to collect data into a single system and better understand the holistic experience each dealership provides.
Through Qualtrics, Volkswagen ran analyses of both customer and employee experience data to identify opportunities for action. These insights served to drive changes such as improvements to customer service training, communications, and dealership layout design.
Results:
As a result of its implementation of the Qualtrics XM™ Platform, Volkswagen has achieved the following results:
Certain dealerships experienced improvements of up to 20 points in NPS (Volkswagen’s largest increase in NPS in 15 years).
A 9% average reduction in employee churn across all dealerships resulting in an estimated $10 to $15 million in savings from reduced hiring costs.
Volkswagen’s top 10 performing dealerships measured by employee advocacy and NPS have become the top 10 most profitable dealers in the Volkswagen Australia dealer network.
Volkswagen has achieved its best ever results in Australia’s national industry panel on customer satisfaction.
| |
• | Volkswagen has won a number of awards for its innovation in customer and employee experience, including best use of experience management technology by leveraging the Qualtrics XM™ Platform.
|
1-800 CONTACTS
1-800 CONTACTS is an American contact lens retailer headquartered in Draper, Utah. It is one of the largest online retailers of contact lenses in the United States with annual net sales of over $250 million.
Situation:
The consumer market for contact lenses has seen greater competition for market share over the last 15 years with the growth of multi-brand optical brick and mortar stores and the surge in online retailers. However, this market has
few consolidated sources for accurate market data and trends. In order to understand its position within this constantly shifting landscape, 1-800 CONTACTS needed regular access to robust market, customer, and brand research and tracking. For years, 1-800 CONTACTS relied on third-party market and consumer research providers, but realized limited value from these studies. This approach did not provide 1-800 CONTACTS the information it needed to be able to develop and implement the agile strategy to compete in its evolving market.
Qualtrics Solution & Benefits:
In order to build a robust and continuous source of consumer insights within its budget, 1-800 CONTACTS recognized that it needed to bring key elements of its market, customer and brand research in-house.
1-800 CONTACTS deployed Qualtrics in 2013 for implementation of a post-transactional NPS and customer satisfaction scores, or CSAT, tracking program to understand how well it was meeting its customers’ expectations. Impressed by the number of actionable insights, 1-800 CONTACTS worked with Qualtrics to implement a triggering system that would identify detractors in real time based on low scores and negative sentiment from open-text responses. This system was integrated into 1-800 CONTACTS’ custom call-center application so that dedicated agents would receive alerts and then reach out directly to these customers for resolution. This has become a key part of 1-800 CONTACTS’ customer satisfaction program. Customer comments from the Qualtrics’ platform were also displayed in high-traffic areas in 1-800 CONTACTS headquarters to reinforce a customer-centric culture.
In 2015, recognizing the value of faster access to insights, 1-800 CONTACTS extended its implementation of the Qualtrics XM™ Platform to include an NPS tracker and dashboards. With this addition, key 1-800 CONTACTS stakeholders across marketing, operations, and distribution had their fingers on the pulse of customer experiences. 1-800 CONTACTS then ran monthly analyses and action-planning to address opportunities for improving CSAT.
Focused on its brand within the changing market, 1-800 CONTACTS worked with Qualtrics to implement a highly robust brand tracker and dashboard in 2016. The tracker measures the brand’s relative equity in the market and is robust enough to report out statistically significant results by various segments.
1-800 CONTACTS has also run multiple key strategic research projects through Qualtrics’ Research on Demand. Specifically, it has measured consumer perceptions, appetite and consideration for new products, services, and technology such as remote eye exams, private label lenses, and subscription order and payment plans. Results from these projects have informed major pivots for the 1-800 CONTACTS business.
Results:
As a result of its implementation of the Qualtrics XM™ Platform, 1-800 CONTACTS has achieved the following results:
| |
• | A significant increase in NPS by directly addressing root cause issues identified through use of the XM™ Platform.
|
Definition of customer buyer segments - where message testing revealed opportunity to improve average order size by 2-3%.
| |
• | The transition from manual monthly voice of the customer reporting to XM™ Platform and its integrated dashboards saves two weeks per month of dedicated analyst time now spent on root cause analyses and data deep dives.
|
Identification of optimal product delivery times led to the revision of distribution center locations, improved delivery times, and less delivery costs.
Successfully launched online eye exams, remote eye testing, and a subscription-based model based on Qualtrics’ Research on Demand insights. These business changes directly addressed customer needs in areas where 1-800 CONTACTS was losing market share.
Savings of more than $250,000 per year in research costs through in-house deployment of research compared to the use of third party vendors.
Sales, Customer Success, and Marketing
Our go-to-market efforts are centered on landing and expanding subscriptions to our XM™ Platform as well as driving use of our Research on Demand solution.
We primarily generate sales through our direct sales team, which includes both inside sales personnel and field sales. All sales personnel focus on attracting new customers as well as expanding usage within our existing customer base. We also make it easy for users and organizations to sign up for free trials on our website, which can be converted to paid subscriptions. Our sales team is supported by technical sales professionals and subject-matter experts who facilitate the sales process through developing and presenting demonstrations of our XM™ Platform after assessing requirements, addressing security and technical questions, and matching customer needs with the appropriate Qualtrics solutions. We also have a team of solution experts who help advise on best practices and methodologies, assist with program design, and provide assistance as required through customer launch to accelerate time to value.
Our customer success team complements our sales team by consulting with our customers and helping drive adoption, subscription renewal, expansion to additional use cases, and customer value.
Our marketing efforts are focused on generating awareness of our XM™ Platform, creating sales leads, establishing and promoting our brand, and cultivating a community of loyal customers and users. We utilize both online and offline marketing initiatives, including user conferences (such as our annual X4 Summit), online advertising, webinars, blogs, corporate communications, white papers and case studies. We also engage frequently with technology analyst firms, such as Forrester Research, to educate them as to the benefits of our platform and accelerate the maturation of an appropriate market category.
We have also developed go-to-market partnerships with a number of key technology, system integrator, and consultant and content partners. These partners provide introductions to potential customers, validate our solutions and in some cases provide professional services related to our platform. We anticipate that we will continue to develop a select number of third party relationships to help grow our business.
Customer Support
Our customer support team resolves technical and operational issues for our customers, if and when such issues arise. Our team consists of full-time employees, who are available 24 hours a day and 7 days a week.
Professional Services
Our professional services team provides our customers with implementation, training, and similar services to help them realize the full benefits of our XM™ Platform. Our training programs include a mix of virtual and in-person offerings with different options focused either on helping onboard teams of users quickly or helping individuals achieve certification level subject matter expertise. Our team works closely with our partners and enables them to deploy our solutions. By working with these partners, we both augment our pipeline and our ability to scale globally by size and complexity of deployment.
Research and Development
Our ability to compete depends in large part on our continuous commitment to research and development and our ability to rapidly introduce new technologies, features and functionality. Our research and development organization is responsible for the design, architecture, testing, and quality of our platform. We focus our efforts on developing our core technologies and further enhancing their usability, functionality, reliability, performance, and flexibility.
As a company, we prioritize research and development and attempt to foster creativity and autonomy in our engineering teams. Research and development expenses were $22.3 million, $40.7 million, and $28.0 million for the years ended December 31, 2016 and 2017 and the six months ended June 30, 2018, respectively.
Competition
Experience management is a new and rapidly developing software category. We do not believe that any of our competitors currently offer a full suite of experience management solutions that effectively competes with the full functionality of our XM™ Platform. However, certain features of our platform compete in certain segments of the overall experience management market. Our main competitors fall into the following categories:
Providers of software for specific use cases, such as Medallia for customer experience;
Traditional professional and marketing research services firms, such as Aon Hewitt and Towers Watson; and
Individual-focused and self-service survey tools, such as SurveyMonkey.
We believe that the principal competitive factors in our markets include the following:
Product features, quality, functionality, and design;
Ease of deployment and use;
Market vision and pace of product innovation;
Security and privacy;
Overall platform experience;
Third party integrations;
Pricing and total cost of ownership;
Brand awareness and reputation;
Accessibility across several devices, operating systems, and applications;
Strength of sales and marketing efforts; and
Customer support.
We believe we compete favorably across these factors. However, some of our competitors and potential competitors are larger and have greater brand name recognition, longer operating histories, larger marketing budgets and established marketing relationships, access to larger customer bases and significantly greater resources for the development of their offerings. Moreover, because our market is new and rapidly developing, it is possible that new entrants, especially those with substantial resources, more efficient operating models, more rapid technology and content development cycles or lower marketing costs, could introduce new products and services that disrupt our market and better address the needs of our customers and potential customers. See the section titled “Risk Factors—The software category in which we participate is new and rapidly changing, and if we do not compete effectively, our business, results of operations, and financial condition could be harmed” for additional information.
Intellectual Property
We rely on a combination of patent, copyright, trademark and trade secret laws in the United States and other jurisdictions, as well as license agreements and other contractual provisions, to protect our proprietary technology. We also rely on a number of international and domestic registered, pending and common law trademarks to protect our brand.
As of September 30, 2018, we had 121 registered trademarks and 64 pending trademark applications worldwide.
As of September 30, 2018, we had 27 issued utility patents in the United States, which expire between November 10, 2024 and March 5, 2036; 2 issued design patents in the United States, which expire on January 3, 2031 and April
11, 2031, respectively; 42 United States non-provisional patent applications pending, including one allowed United States patent application; and two PCT patent applications pending.
In addition, we seek to protect our intellectual property rights by requiring our employees and independent contractors involved in development of intellectual property on our behalf to enter into agreements acknowledging that all works or other intellectual property generated or conceived by them on our behalf are our property, and assigning to us any rights, including intellectual property rights, that they may claim or otherwise have in those works or property, to the extent allowable under applicable law.
Despite our efforts to protect our technology and proprietary rights through intellectual property rights, licenses and other contractual protections, unauthorized parties may still copy or otherwise obtain and use our software and other technology. In addition, we intend to continue to expand our international operations, and effective patent, copyright, trademark, trade secret and other intellectual property protection may not be available or may be limited in foreign countries. Any significant impairment of our intellectual property rights could harm our business or our ability to compete. Further, many companies in the communications and technology industries own large numbers of patents, copyrights and trademarks and may threaten litigation or file suit against us based on allegations of infringement or other violations of intellectual property rights. We are currently subject to, and expect to face in the future, allegations that we have infringed the intellectual property rights of third parties. See the section titled “Risk Factors—We may be sued by third parties for alleged infringement or misappropriation of their proprietary rights” for additional information.
Our Employees
As of September 30, 2018, we had 1,866 full-time employees. We also engage contractors and consultants from time to time. We have not experienced any work stoppages, and we believe that our employee relations are good.
Our Facilities
Our corporate headquarters is located in Provo, Utah, and consists of approximately 165,000 square feet of space pursuant to a lease that expires in 2025. Our second largest office is in Seattle, Washington, and consists of approximately 45,000 square feet of space pursuant to a lease that expires in 2021. We maintain additional offices in multiple locations in the United States and internationally in Australia, Canada, France, Germany, Ireland, Japan, Poland, Singapore, and the United Kingdom. We lease all of our facilities, except that we own one office building in Provo, Utah consisting of approximately 39,000 square feet. We intend to procure additional space in the future as we continue to add employees and expand geographically. We believe our facilities are adequate and suitable for our current needs and that, should it be needed, suitable additional or alternative space will be available to accommodate our operations.
Legal Proceedings
From time to time, we may be subject to legal proceedings and claims in the ordinary course of business. We are not presently a party to any legal proceedings that, if determined adversely to us, would individually or taken together have a material adverse effect on our business, results of operations, financial condition or cash flows. We have received, and may in the future continue to receive, claims from third parties asserting, among other things, infringement of their intellectual property rights. Future litigation may be necessary to defend ourselves, our partners and our customers by determining the scope, enforceability and validity of third party proprietary rights, or to establish our proprietary rights. The results of any current or future litigation cannot be predicted with certainty, and regardless of the outcome, litigation can have an adverse impact on us because of defense and settlement costs, diversion of management resources and other factors.
MANAGEMENT
Executive Officers and Directors
The following table provides information regarding our executive officers and directors as of September 30, 2018:
|
| | | | |
Name | | Age | | Position |
Executive Officers: | | | | |
Ryan Smith | | 40 | | Co-Founder, Director and Chief Executive Officer |
Jared Smith | | 43 | | Co-Founder, Director and President |
David Faugno | | 48 | | Chief Financial Officer |
Zig Serafin | | 45 | | Chief Operating Officer |
John D’Agostino | | 51 | | Vice President, Global Sales |
| | | | |
Non-Employee Directors: | | | | |
R. Duff Thompson | | 67 | | Chairman of the Board and Director |
Scott Smith | | 69 | | Co-Founder and Director |
Murray Demo | | 57 | | Director |
Jeffrey Lieberman | | 44 | | Director |
R. Bryan Schreier | | 40 | | Director |
Kimball Malone Scott | | 51 | | Director |
Ryan Sweeney | | 41 | | Director |
Executive Officers
Ryan Smith. Mr. Smith co-founded our company and has served as our Chief Executive Officer and a member of our board of directors since December 2002. Mr. Smith holds a B.S. in Management from Brigham Young University. Mr. Smith is the brother of Jared Smith, our President and a member of our board of directors, and is the son of Scott Smith, a member of our board of directors.
We believe that Mr. Smith is qualified to serve as a member of our board of directors based on the perspective and experience he brings as our Chief Executive Officer and co-founder.
Jared Smith. Mr. Smith co-founded our company and has served as a member of our board of directors since December 2002 and has been our President since May 2010. He also previously served as our Chief Operating Officer. From 2004 to 2010, Mr. Smith held various engineering and product management roles at Google, Inc., a multi-national technology company. Mr. Smith holds a BSc from the London School of Economics and Political Science. Mr. Smith is the brother of Ryan Smith, our Chief Executive Officer and a member of our board of directors, and the son of Scott Smith, a member of our board of directors.
We believe that Mr. Smith is qualified to serve as a member of our board of directors based on the perspective and experience he brings as our President and co-founder.
David Faugno. Mr. Faugno has served as our Executive Vice President and Chief Financial Officer since October 2017. From September 2016 through October 2017, Mr. Faugno served in various board, advisory, and consulting roles for a number of technology companies. From February 2006 to September 2016, Mr. Faugno served as Chief Financial Officer at Barracuda Networks, Inc., a security and data protection solutions provider. From July 2004 to February 2006, Mr. Faugno served as Senior Director of Corporate Finance, Mergers and Acquisitions at Cisco Systems Inc., an IT and networking company, which he joined in connection with Cisco’s acquisition of Actona Technologies Inc., a wide area storage vendor, where he served as Chief Financial Officer and Vice President of Operations from March
2002 to July 2004. Mr. Faugno received his B.S. in accounting from Rutgers University and an M.B.A. from Duke University.
Zig Serafin. Mr. Serafin has served as our Chief Operating Officer since October 2016. From July 2009 to October 2016, Mr. Serafin served as a Corporate Vice President at Microsoft Corporation, a multi-national technology company, where he led a global team responsible for engineering, service operations and strategy in telecommunications services and applications. During his tenure at Microsoft Corporation, Mr. Serafin served as General Manager at Tellme Networks, Inc., a telephone based applications provider, following its acquisition by Microsoft Corporation. Mr. Serafin holds a B.S. from Brigham Young University.
John D’Agostino. Mr. D’Agostino has served as our Vice President of Global Sales since March 2013. From July 1995 to November 2012, Mr. D’Agostino served in various roles at PTC Inc. (formerly Parametric Technology Corporation), a computer software and services company, most recently as Division Vice President Americas Sales and Distribution. From June 1989 to July 1995, Mr. D’Agostino served in various roles at Pitney Bowes Corporation, an information technology and services company, most recently as Area Sales Manager for the Southeast Region. Mr. D’Agostino holds a B.A. in Marketing from Nazareth College of Rochester.
Non-Employee Directors
R. Duff Thompson. Mr. Thompson has served as Chairman of our board of directors since 2012. Since January 1994, Mr. Thompson has served as Managing General Partner of EsNet, Ltd, a Utah based investment group investing in technology and real estate ventures. From 2001 to 2005, Mr. Thompson served as a member of the Supervisory Board of Syzygy AG, a German based interactive marketing network. From 2003 to 2012, Mr. Thompson served as a member of the board of directors, and as a member of the Compensation Committee of TSG Group, Inc. (formerly known as The SCO Group, Inc.), an operating system software company. Mr. Thompson holds a B.S. in Economics, and an M.B.A. and a J.D. from Brigham Young University.
We believe that Mr. Thompson is qualified to serve as a member of our board of directors due to his executive and board experience at other private and public technology companies.
Scott Smith. Mr. Smith co-founded our company and has served as a member of our board of directors since December 2002. Prior to 2010, Mr. Smith served as our President. From June 1981 to August 2011, Mr. Smith served as a Professor Emeritus, Marriott School of Management at Brigham Young University. Mr. Smith holds a B.S. in Business Management from Brigham Young University, an M.B.A. from Michigan State University, and a Ph.D. from Pennsylvania State University, with emphasis in Market Research and Quantitative Methods. Mr. Smith is the father of Ryan Smith, our Chief Executive Officer and a member of our board of directors, and Jared Smith, our President and a member of our board of directors.
We believe that Mr. Smith is qualified to serve as a member of our board of directors based on the perspective and experience he brings as our former President and co-founder.
Murray J. Demo. Mr. Demo has served as a member of our board of directors since February 2017. Since January 2018, Mr. Demo has served as Executive Vice President and Chief Financial Officer of Rubrik, Inc., a data management company. From October 2015 to January 2018, Mr. Demo served as Chief Financial Officer of Atlassian Corporation PLC, or Atlassian. From 2009 to 2012, Mr. Murray served as Executive Vice President and Chief Financial Officer of Dolby Laboratories, an entertainment technology company. From May 2012 to November 2015, Mr. Demo served on the board of directors of Xoom Corporation. From December 2011 to October 2015, Mr. Demo served on the board of directors of Atlassian. Since 2005, Mr. Demo has served as a member of the board of directors of Citrix Systems, Inc. He also currently serves on the board of directors of several private companies. Mr. Demo holds a B.A. in Business Economics from the University of California, Santa Barbara, and an M.B.A. from Golden Gate University.
We believe that Mr. Demo is qualified to serve as a member of our board of directors due to his extensive finance and accounting experience for companies in the technology industry, including as an officer and director of publicly traded companies.
Jeffrey Lieberman. Mr. Lieberman has served as a member of our board of directors since September 2014. Since 1998, Mr. Lieberman has held various roles at Insight Venture Management, LLC, a private equity and venture capital firm, where he currently serves as Managing Director. Mr. Lieberman served as a member of the board of directors of Shutterstock, Inc., a stock photography and media provider, from June 2007 to December 2016 and Cvent, Inc., a meetings management technology company, from July 2011 to November 2016. Since September 2012, Mr. Lieberman has served as a member of the board of directors of Mimecast Ltd., a cloud-based email management company. Mr. Lieberman also currently serves on the board of directors of several private companies. Mr. Lieberman holds a B.A. in Economics and a B.S. in Systems Engineering from the University of Pennsylvania.
We believe that Mr. Lieberman is qualified to serve as a member of our board of directors due to his broad investment experience in the technology industry and his background as an advisor to companies in the technology industry.
R. Bryan Schreier. Mr. Schreier has served as a member of our board of directors since April 2012. Since March 2008, Mr. Schreier has served as a partner at Sequoia Capital, a venture capital firm. Since July 2009, Mr. Schreier has served as a member of the board of directors of Dropbox, Inc., a cloud-based platform for file sync and sharing. Mr. Schreier also serves on the board of directors of several private companies. Mr. Schreier holds a B.A. in Computer Science from Princeton University.
We believe that Mr. Schreier is qualified to serve as a member of our board of directors due to his broad investment experience in the technology industry and his background advising companies in the technology industry.
Kimball Malone Scott. Ms. Scott has served as an advisor to our company since May 2013 and a member of our board of directors since May 2016. Ms. Scott is the author of Radical Candor, a book published in March 2017. Since November 2017, Ms. Scott has served as the co-founder of Radical Candor LLC. From January 2016 to June 2017, Ms. Scott served as the Chief Executive Officer and co-founder of Candor, Inc. Ms. Scott has served as a CEO coach and advisor for Dropbox, Inc., Twitter, Inc., Square, Inc., and several private technology companies. Ms. Scott holds a B.A. in Slavic Languages and Literature from Princeton University and an M.B.A. from Harvard Business School.
We believe that Ms. Scott is qualified to serve as a member of our board of directors due to her extensive experience advising and serving in leadership positions at companies in the technology industry.
Ryan Sweeney. Mr. Sweeney has served as a member of our board of directors since April 2012. Since 2008, Mr. Sweeney has been a Partner at Accel, a venture capital firm. Mr. Sweeney currently serves on the board of directors of several private companies. Mr. Sweeney holds an A.B. from the University of Notre Dame and an M.B.A. from Harvard Business School.
We believe that Mr. Sweeney is qualified to serve as a member of our board of directors due to his broad investment experience in the technology industry and his background as an advisor to companies in the technology industry.
Each executive officer serves at the discretion of our board of directors and holds office until his or her successor is duly elected and qualified or until his or her earlier resignation or removal.
Code of Business Conduct and Ethics
Our board of directors will adopt a code of business conduct and ethics that will apply to all of our employees, officers and directors, including our Chief Executive Officer, Chief Financial Officer and other executive and senior financial officers. The full text of our code of business conduct and ethics will be posted on the investor relations page on our website. We intend to disclose any amendments to our code of business conduct and ethics, or waivers of its requirements, on our website or in filings under the Exchange Act.
Board of Directors
Our business and affairs are managed under the direction of our board of directors. Our board of directors consists of nine directors, six of whom qualify as “independent” under the listing standards of Nasdaq.
Pursuant to our current certificate of incorporation and amended and restated voting agreement, (i) holders of Series B-1 redeemable convertible preferred stock are entitled to elect two directors, one of which shall be nominated
by Accel Growth Fund II L.P., or Accel, and one of which shall be nominated by Sequoia Capital U.S. Growth Fund V, L.P., or Sequoia Capital, (ii) holders of Series A-1, Series A-2 and Series A-3 redeemable convertible preferred stock are entitled to elect six directors, (iii) holders of Series B-2 and Series B-4 redeemable convertible preferred stock are entitled to elect one director, to be nominated by Insight Venture Partners VIII, L.P., or Insight Venture Partners, and (iv) certain holders of preferred stock and common stock, voting together, are entitled to elect the remaining directors who shall be approved by the other members of the Board. Accordingly, our current directors were elected as follows:
Mr. Sweeney was elected as the designee nominated by Accel;
Mr. Schreier was elected as the designee nominated by Sequoia Capital;
Messrs. R. Smith, J. Smith, S. Smith, Thompson and Demo were elected as the designees nominated by holders of Series A-1, Series A-2 and Series A-3 redeemable convertible preferred stock;
Mr. Lieberman was elected as the designee nominated by Insight Venture Partners; and
Ms. Scott was elected as the designee approved by a majority of the other members of our board of directors.
Our amended and restated voting agreement will terminate and the provisions of our current certificate of incorporation by which our directors were elected will be amended and restated in connection with this offering. After this offering, the number of directors will be fixed by our board of directors, subject to the terms of our amended and restated certificate of incorporation and amended and restated bylaws that will become effective immediately prior to the completion of this offering. Each of our current directors will continue to serve as a director until the election and qualification of his or her successor, or until his or her earlier death, resignation or removal.
Classified Board
We intend to adopt an amended and restated certificate of incorporation that will become effective immediately prior to the completion of this offering. Our amended and restated certificate of incorporation will provide that, immediately after the completion of this offering, our board of directors will be divided into three classes with staggered three-year terms. Only one class of directors will be elected at each annual meeting of stockholders. Our current directors will be divided among the three classes as follows:
the Class I directors will be Messrs. S. Smith, Lieberman, and Sweeney, and their terms will expire at the annual meeting of stockholders to be held in 2019;
the Class II directors will be Messrs. Schreier and J. Smith, and Ms. Scott, and their terms will expire at the annual meeting of stockholders to be held in 2020; and
the Class III directors will be Messrs. R. Smith, Demo, and Thompson, and their terms will expire at the annual meeting of stockholders to be held in 2021.
Upon expiration of the term of a class of directors, directors for that class will be elected for three-year terms at the annual meeting of stockholders in the year in which that term expires. As a result, only one class of directors will be elected at each annual meeting of our stockholders, with the other classes continuing for the remainder of their respective three-year terms. Each director’s term continues until the election and qualification of his or her successor, or his or her earlier death, resignation or removal.
So long as our board of directors is classified, only our board of directors may fill vacancies on our board. Any additional directorships resulting from an increase in the number of directors will be distributed among the three classes so that, as nearly as possible, each class will consist of one-third of the total number of directors.
The classification of our board of directors may have the effect of delaying or preventing changes in our control or management. See the section titled “Description of Capital Stock—Anti-Takeover Provisions—Amended and Restated Certificate of Incorporation and Amended and Restated Bylaw Provisions.”
Director Independence
Our board of directors has undertaken a review of the independence of each director. Based on information provided by each director concerning his or her background, employment and affiliations, our board of directors has determined that Messrs. Demo, Lieberman, Schreier, Sweeney and Thompson and Ms. Scott do not have a relationship that would interfere with the exercise of independent judgment in carrying out the responsibilities of a director and that each of these directors is “independent” as that term is defined under the listing standards of Nasdaq. In making these determinations, our board of directors considered the current and prior relationships that each non-employee director has with our company and all other facts and circumstances our board of directors deemed relevant in determining their independence, including the beneficial ownership of our capital stock by each non-employee director, and the transactions involving them described in the section titled “Certain Relationships and Related Party Transactions.”
Committees of the Board of Directors
Our board of directors has established an audit committee, a compensation committee and a nominating and corporate governance committee. The composition and responsibilities of each of the committees of our board of directors is described below. Members will serve on these committees until their resignation or until as otherwise determined by our board of directors.
Audit Committee
Our audit committee consists of Messrs. Demo, Thompson, and Lieberman, with Mr. Demo serving as Chairman. Each member of our audit committee meets the requirements for independence under the listing standards of Nasdaq and SEC rules and regulations. Each member of our audit committee also meets the financial literacy and sophistication requirements of the listing standards of Nasdaq. In addition, our board of directors has determined that Mr. Demo is an audit committee financial expert within the meaning of Item 407(d) of Regulation S-K under the Securities Act. We intend to comply with the listing requirements of Nasdaq regarding the composition of our audit committee within the transition period for newly public companies. Following the completion of this offering, our audit committee will, among other things:
select a qualified firm to serve as the independent registered public accounting firm to audit our financial statements;
help to ensure the independence and performance of the independent registered public accounting firm;
discuss the scope and results of the audit with the independent registered public accounting firm, and review, with management and the independent registered public accounting firm, our interim and year-end results of operations;
develop procedures for employees to submit concerns anonymously about questionable accounting or audit matters;
review our policies on risk assessment and risk management;
review related party transactions; and
approve or, as required, pre-approve, all audit and all permissible non-audit services, other than de minimis non-audit services, to be performed by the independent registered public accounting firm.
Our audit committee operates under a written charter that satisfies the applicable rules and regulations of the SEC and the listing standards of Nasdaq.
Compensation Committee
Our compensation committee consists of Messrs. Schreier and Sweeney, and Ms. Scott, with Mr. Schreier serving as Chairman. Each member of our compensation committee meets the requirements for independence under the listing standards of Nasdaq and SEC rules and regulations. Each member of our compensation committee is also a non-
employee director, as defined pursuant to Rule 16b-3 promulgated under the Exchange Act, or Rule 16b-3. Following the completion of this offering, our compensation committee will, among other things:
review, approve and determine, or make recommendations to our board of directors regarding, the compensation of our executive officers;
administer our equity compensation plans;
review and approve, or make recommendations to our board of directors, regarding incentive compensation and equity compensation plans; and
establish and review general policies relating to compensation and benefits of our employees.
Our compensation committee operates under a written charter that satisfies the applicable rules and regulations of the SEC and the listing standards of Nasdaq.
Nominating and Corporate Governance Committee
Our nominating and governance committee consists of Mr. Thompson and Ms. Scott, with Mr. Thompson serving as Chairman. Each member of our nominating and governance committee meets the requirements for independence under the listing standards of Nasdaq and SEC rules and regulations. Following the completion of this offering, our nominating and corporate governance committee will, among other things:
identify, evaluate and select, or make recommendations to our board of directors regarding, nominees for election to our board of directors and its committees;
evaluate the performance of our board of directors and of individual directors;
consider and make recommendations to our board of directors regarding the composition of our board of directors and its committees;
review developments in corporate governance practices;
evaluate the adequacy of our corporate governance practices and reporting; and
develop and make recommendations to our board of directors regarding corporate governance guidelines and matters.
Our nominating and corporate governance committee operates under a written charter that satisfies the applicable listing standards of Nasdaq.
Compensation Committee Interlocks and Insider Participation
None of the members of our compensation committee is or has been an officer or employee of our company. None of our executive officers currently serves, or in the past year has served, as a member of the board of directors or compensation committee (or other board committee performing equivalent functions) of any entity that has one or more of its executive officers serving on our board of directors or compensation committee. See the section titled “Certain Relationships and Related Party Transactions” for information about related party transactions involving members of our compensation committee or their affiliates.
Non-Employee Director Compensation
The following table presents the total compensation for each person who served as a non-employee member of our board of directors during 2017. Other than as set forth in the table and described more fully below, we did not pay any compensation, make any equity awards or non-equity awards to, or pay any other compensation to any of the non-employee members of our board of directors in 2017. However, directors may be reimbursed for travel, food, lodging and other expenses directly related to their activities as directors. Non-employee directors affiliated with Accel, Sequoia Capital, and Insight Venture Partners, including Messrs. Sweeney, Schreier, and Lieberman, did not receive
compensation from us for their service as directors. In addition, directors who also serve as employees receive no additional compensation for their service as directors. Accordingly, during the fiscal year ended December 31, 2017, Mr. Ryan Smith, our Chief Executive Officer, and Mr. Jared Smith, our President, were members of our board of directors, as well as employees, and thus received no additional compensation for their service as directors. Additionally, during the fiscal year ended December 31, 2017, Mr. Scott Smith, a member of our board of directors, received no additional compensation for his service as a director. See the section titled “Executive Compensation” for more information about Mr. Ryan Smith’s compensation for the fiscal year ended December 31, 2017.
The following table provides certain information concerning compensation earned by the directors who were not employees during the year ended December 31, 2017.
|
| | | | | | | | |
Name(1) | Fees Earned or Paid in Cash ($) | | Stock Awards ($)(2) | | Total ($) |
Murray Demo(3) | — |
| | 2,102,200 |
| | 2,102,200 |
|
| Jeffrey Lieberman | — |
| | — |
| | — |
|
| R. Bryan Schreier | — |
| | — |
| | — |
|
Kimball Malone Scott(4) | — |
| | — |
| | — |
|
| Ryan Sweeney | — |
| | — |
| | — |
|
| R. Duff Thompson | 100,000 |
| | — |
| | 100,000 |
|
____________________
| |
(1) | Other than as set forth below with respect to Ms. Scott and Mr. Demo, no non-employee directors held unvested stock or unexercised stock options as of December 31, 2017. |
| |
(2) | The amounts reported represent the aggregate grant date fair value of the RSUs awarded to the director in the year ended December 31, 2017, calculated in accordance with FASB ASC Topic 718. Such grant date fair values do not take into account any estimated forfeitures related to service-vesting conditions. The assumptions used in calculating the grant date fair value of the RSUs reported in this column are set forth in the Notes to our Consolidated Financial Statements included elsewhere in this prospectus. The amounts reported in this column reflect the accounting cost for these RSUs and do not correspond to the actual economic value that may be received by the director upon vesting/settlement of the RSUs or sale of the underlying shares of common stock. |
| |
(3) | Mr. Demo joined our board of directors in February 2017. In connection with Mr. Demo’s service on our board of directors, on February 16, 2017 we granted Mr. Demo RSUs for 460,000 shares of Class B common stock. Such RSUs vest upon the satisfaction of both a service-based condition and a liquidity-based vesting condition. The service-based condition shall be satisfied in four equal annual installments commencing upon the first anniversary of January 1, 2017. The liquidity-based vesting condition for such award is the earlier to occur of (i) a Sale Event or (ii) the consummation of our initial public offering, which will be satisfied upon the effectiveness of this offering. In the case of a Sale Event, the service-based condition shall accelerate and vest in full. As of December 31, 2017, Mr. Demo held 460,000 unvested RSUs. |
| |
(4) | Ms. Scott joined our board of directors in 2015. In connection with Ms. Scott’s service on our board of directors, on October 22, 2015, we granted Ms. Scott RSUs for 380,000 shares of Class B common stock. Such RSUs vest upon the satisfaction of a liquidity-based vesting condition. The liquidity-based vesting condition for such award is the earlier to occur of (i) a Sale Event (as defined in the 2014 Plan) or (ii) the consummation of our initial public offering, which will be satisfied upon the effectiveness of this offering. As of December 31, 2017, Ms. Scott held 380,000 unvested RSUs. |
Prior to this offering, we did not have a formal policy or plan to compensate our non-employee directors. Immediately prior to the completion of this offering, we intend to implement a formal policy pursuant to which our non-employee directors will be eligible to receive the following cash retainers and equity awards:
|
| | | |
| | | |
| Annual Retainer for Board Membership | | |
| Annual service on the board of directors | $ | 30,000 |
|
| Annual service as chair of the board of directors | $ | 20,000 |
|
| Additional Annual Retainer for Committee Membership | | |
| Annual service as member of the audit committee (other than chair) | $ | 9,000 |
|
| Annual service as chair of the audit committee | $ | 20,000 |
|
| Annual service as member of the compensation committee (other than chair) | $ | 7,500 |
|
| Annual service as chair of the compensation committee | $ | 14,000 |
|
| Annual service as member of the nominating and corporate governance committee (other than chair) | $ | 4,000 |
|
| Annual service as chair of the nominating and corporate governance committee | $ | 8,000 |
|
Non-employee directors will be given the opportunity to elect to receive all or a portion of their retainer and committee fees in the form of an equity award of fully vested unrestricted stock having a grant-date fair value equal to the amount (or portion of the amount) of such retainer and committee fees.
Our policy will provide that, on the date of each of our annual meetings of stockholders following the completion of this offering, each non-employee director who is re-elected to or is continuing on our board of directors after the annual meeting will be granted a restricted stock unit award having an aggregate grant date fair value of $185,000, or the Annual Grant. In addition, upon initial election to our board of directors, each new non-employee director will be granted a prorated Annual Grant, or the Initial Grant. The Initial Grant and Annual Grant will vest in full on the earlier of (i) the anniversary of the grant date or (ii) our next annual meeting of stockholders, subject to continued service as a director through the applicable vesting date. The Initial Grant and the Annual Grant will vest in full upon a Sale Event, as defined in the 2018 Plan.
Employee directors will receive no additional compensation for their service as a director.
We will reimburse all reasonable out-of-pocket expenses incurred by directors for their attendance at meetings of our board of directors or any committee thereof.
EXECUTIVE COMPENSATION
Overview
The following discussion contains forward-looking statements that are based on our current plans, considerations, expectations, and determinations regarding future compensation programs. The actual amount and form of compensation and the compensation policies and practices that we adopt in the future may differ materially from currently planned programs as summarized in this discussion.
As an emerging growth company, we have opted to comply with the executive compensation disclosure rules applicable to “smaller reporting companies,” as such term is defined in the rules promulgated under the Securities Act. This section provides an overview of the compensation provided to our named executive officers for the fiscal year ended December 31, 2017, and is detailed in the 2017 Summary Compensation Table and accompanying footnotes and narrative that follow.
Our named executive officers in the fiscal year ended December 31, 2017, which consisted of our Chief Executive Officer and our two most highly compensated executive officers other than our Chief Executive Officer, were:
Ryan Smith, our Co-Founder and Chief Executive Officer;
David Faugno, our Chief Financial Officer; and
Zig Serafin, our Chief Operating Officer.
Our executive compensation program is based on a pay for performance philosophy. Compensation for our executive officers is composed primarily of the following main components: base salary; bonus; and equity incentives in the form of RSUs and stock options. Our executive officers, like all full-time employees, are eligible to participate in our health and welfare benefit plans. As we transition from a private company to a publicly traded company, we intend to evaluate our compensation philosophy and compensation plans and arrangements as circumstances require.
2017 Summary Compensation Table
The following table provides information regarding the total compensation, for services rendered in all capacities, that was earned by our named executive officers during the fiscal year ended December 31, 2017.
|
| | | | | | | | | | | | | | | | | | | | | | |
| Name and principal position | Year | | Salary ($) | | Bonus ($)(1) | | Stock awards ($)(2) | | Option awards ($)(2) | | Nonequity incentive plan compensation ($) | | All other compensation ($) | | Total ($) |
| Ryan Smith | 2017 | | 100,000 |
| | 15,000 |
| | — |
| | — |
| | — |
| | 611,062 |
| (3) | 726,062 |
|
| Chief Executive Officer | | | | | | | | | | | | | | | |
David Faugno (4) | 2017 | | 66,667 |
| | — |
| | 10,659,000 |
| | 3,069,797 |
| | 16,958 |
| (5) | — |
| | 13,812,422 |
|
| Chief Financial Officer | | | |
| | |
| | |
| | |
| | |
| | |
| | |
|
| Zig Serafin | 2017 | | 500,000 |
| | — |
| | — |
| | — |
| | 373,950 |
| (5) | 8,100 |
| (6) | 882,050 |
|
| Chief Operating Officer | | | | | | | | | | | | | | | |
____________________
| |
(1) | The amount represents a discretionary holiday bonus to Mr. Smith of $15,000. |
| |
(2) | The amounts reported represent the aggregate grant date fair value of the RSUs and options awarded to the named executive officer in the fiscal year ended December 31, 2017, calculated in accordance with FASB ASC Topic 718. Such grant date fair values do not take into account any estimated forfeitures related to service-vesting conditions. The assumptions used in calculating the grant date fair value of the RSUs and options reported in this column are set forth in the Notes to our Consolidated Financial Statements included elsewhere in this prospectus. The amounts reported in this column reflect the accounting cost for these RSUs and options and do not correspond to the actual economic value that may be received by the named executive officers upon vesting or exercise of these awards or sale of the underlying shares of common stock. |
| |
(3) | The amounts reported represent company-paid 401(k) contributions, which we provided to all of our 401(k) plan eligible employees during 2017, including our named executive officers. The amount reported also includes income imputed to Mr. |
Smith in connection with the forgiveness of indebtedness incurred by Mr. Smith, plus accrued interest, in the aggregate of $589,024 and a tax gross-up of $9,156 for the payroll taxes related to the forgiveness of such indebtedness. The amount reported also includes $9,882 tax gross-up associated with the discretionary holiday bonus paid to Mr. Smith.
| |
(4) | Mr. Faugno joined us in October 2017. The amounts reported represent a pro-rata portion of his salary in 2017. His annualized base salary for 2017 was $400,000. |
| |
(5) | The amounts reported represent incentive bonuses paid in early 2018 based upon the achievement of certain performance objectives pursuant to our 2017 Bonus Plan. |
| |
(6) | The amounts reported represent Company-paid 401(k) plan contributions, which we provided to all of our 401(k) plan eligible employees during 2017, including our named executive officers. |
Narrative to Summary Compensation Table
Base Salaries
For the year ended December 31, 2017, the annual base salaries for each of Messrs. Smith, Faugno, and Serafin were $100,000, $400,000, and $500,000, respectively. As of September 2018, the annual base salary for Mr. Smith was increased to $500,000.
Annual Bonuses
During the fiscal year ended December 31, 2017, we maintained a Shared Performance Bonus Plan, or the 2017 Bonus Plan. Each of our named executive officers (other than Mr. Smith) was eligible to receive an annual bonus based on our achievement of certain performance goals, consisting of bookings, renewal rate and free cash flow. For 2017, the target annual bonuses for Messrs. Faugno and Serafin were equal to $100,000 and $300,000, respectively. Based on the Company’s achievement of the relevant performance goals under the 2017 Bonus Plan, our compensation committee determined that the bonuses would be paid at 124.25% of target for each of Messrs. Faugno and Serafin (with Mr. Faugno’s bonus prorated to reflect his partial year of employment). Mr. Smith also received a discretionary holiday bonus of $15,000.
Equity Compensation
Although we do not have a formal policy with respect to the grant of equity incentive awards to our executive officers, we believe that equity grants provide our executives with a strong link to our long-term performance, create an ownership culture and help to align the interests of our executives and our stockholders. During the fiscal year ended December 31, 2017, we granted RSUs and options to purchase shares of our common stock to Mr. Faugno in connection with his commencement of employment with us and as shown in more detail in the “Outstanding Equity Awards at Fiscal 2017 Year-End” table.
2018 Equity Awards
Founder Restricted Stock Unit Grants
In September 2018, the Company’s board of directors approved co-founder equity grants to Messrs. Ryan Smith and Jared Smith. These are the first equity grants offered to the founders in the history of the company. The grants issued are a mix of time-based grants and performance grants based upon the future success of the company. The grant includes RSUs with respect to 22,500,000 shares of Class B common stock in the aggregate, or, collectively, the Founder Grants, of which 18 million RSUs were granted to Mr. Ryan Smith, our co-founder and Chief Executive Officer, and 4.5 million RSUs were granted to Mr. Jared Smith, our co-founder and President. Subject to satisfaction of a liquidity-based vesting condition, 50 percent of the Founder Grants vest upon the satisfaction of a service condition, or the Founder Time Grants, and 50 percent of the Founder Grants vest upon the satisfaction of a service condition and achievement of certain stock price goals, or the Founder Performance Grants, each as described below. The liquidity-based vesting condition for each Founder Grant is the earlier to occur of (i) a Sale Event (as defined in our 2014 Plan) or (ii) the consummation of our initial public offering, which will be satisfied upon the effectiveness of this offering.
The Founder Time Grants satisfy the service condition over the five year period following August 1, 2018, with the initial 20% satisfying the service condition on August 1, 2019 and the remaining 80% satisfying the service condition in sixteen equal quarterly installments thereafter.
The Founder Performance Grants are eligible to vest over the five-year period following August 1, 2018. The Founder Grants comprise five tranches that are eligible to vest upon the first applicable vesting date, or Vesting Date, to occur following the achievement of specified stock price goals, or each, a Stock Price Target, measured as a ninety-day rolling average trading price at any time during the 12-month period prior to a Vesting Date as follows:
|
| | | | | | | | | |
| Vesting Date(s) | Company Stock Price Target* | | Shares Eligible to Vest for Mr. Ryan Smith | | Shares Eligible to Vest for Mr. Jared Smith |
Earliest of 1st, 2nd, 3rd, 4th or 5th anniversary of August 1, 2018 | $ | 17.78 |
| | 1,800,000 |
| | 450,000 |
|
Earliest of 2nd, 3rd, 4th or 5th anniversary of August 1, 2018 | $ | 22.22 |
| | 1,800,000 |
| | 450,000 |
|
Earliest of 3rd, 4th or 5th anniversary of August 1, 2018 | $ | 26.67 |
| | 1,800,000 |
| | 450,000 |
|
Earlier of 4th or 5th anniversary of August 1, 2018 | $ | 31.11 |
| | 1,800,000 |
| | 450,000 |
|
5th anniversary of August 1, 2018 | $ | 35.56 |
| | 1,800,000 |
| | 450,000 |
|
*The Stock Price Targets will be adjusted to reflect any stock splits, stock dividends, combinations, reorganizations, reclassifications, or similar event.
Further, the founders will only vest in the Founder Grants if they continue as Chief Executive Officer or Executive Chairman, with respect to Mr. Ryan Smith, and as a member of the senior management team, with respect to Mr. Jared Smith, at the time a Vesting Date occurs, or the Executive Service Requirement. Upon a founder’s no longer satisfying the Executive Service Requirement, any unvested portion of the Founder Grants will terminate and be canceled. In the event of a Sale Event, any tranche(s) of shares related to the Founder Performance Grants shall vest if the per share deal price of the acquisition exceeds the Stock Price Target for that tranche. In addition, upon a Sale Event, 50 percent of any then-unvested portion of the Founder Time Grants will vest in full.
Other Named Executive Officer Awards
In September 2018, the Company’s board of directors approved an RSU award to Mr. Faugno with respect to 883,500 shares of Class B common stock. If this offering is completed, the RSU award will first begin vesting (subject to a continuing service condition) on January 1, 2022 as to 12.5% of the award, and in seven equal quarterly installments of 12.5% of the award thereafter. In October 2018, the Company’s board of directors also approved an option award to Mr. Faugno with respect to 662,625 shares of Class B common stock. The option award will first begin vesting (subject to a continuing service condition) in 48 equal monthly installments on October 1, 2018. In the case of a Sale Event, if the awards are not assumed, continued or otherwise substituted, they will vest in full. If the awards are assumed, continued, or otherwise substituted in a Sale Event, and if Mr. Faugno’s employment is terminated without Cause or Mr. Faugno resigns for Good Reason (in each case, as defined in Mr. Faugno’s offer letter) on or within 12 months following such Sale Event, then the awards will vest in full. If the awards are assumed, continued or otherwise substituted in a Sale Event, and Mr. Faugno’s employment is terminated without Cause or he resigns for Good Reason at any time that is either (1) more than 12 months after a Sale Event or (2) after both Ryan Smith and Jared Smith cease to be in senior executive positions with the Company, then, 50% of the unvested portions of the awards will vest. The foregoing acceleration terms, or the Faugno Acceleration Terms, also apply to Mr. Faugno’s equity awards that were granted to him on November 15, 2017 in connection with his joining the Company.
Outstanding Equity Awards at Fiscal 2017 Year-End
The following table sets forth information regarding outstanding equity awards held by our named executive officers as of December 31, 2017:
|
| | | | | | | | | | | | | | | | | | | | | |
| | | | | | Option Awards(1) | | Stock Awards(1)(2) |
| Name | Grant Date | | Vesting Commencement Date | |
Number of securities underlying unexercised options (#) exercisable | | Number of securities underlying unexercised options (#) unexercisable | | Option exercise price ($) | | Option expiration date | | Equity incentive plan award: Number of unearned units that have not vested (#) | | Equity incentive plan award: Market or payout value of unearned units that have not vested ($) |
| Ryan Smith | | | | | — |
| | | | — |
| | — |
| | — |
| | — |
|
| Chief Executive Officer | | | | | | | | | | | | | | | |
| David Faugno | 11/15/2017 | | 10/31/2017 | | — |
| | 1,030,000 |
| | 6.46 |
| | 11/15/2027(3) |
| | | | |
| Chief Financial Officer | 11/15/2017 | | 10/31/2017 | | | | | | | | | | 1,650,000(4) |
| | 10,972,500(5) |
|
| Zig Serafin | 10/27/2016 | | 10/18/2016 | | — |
| | | | — |
| | | | 5,850,000(6) |
| | 38,902,500(5) |
|
| Chief Operating Officer | 10/27/2016 | | 10/18/2016 | | | | | | | | | | 312,000(7) |
| | 2,074,800(5) |
|
____________________
| |
(1) | All of the awards listed in the table above were granted under our 2014 Plan, the terms of which are described below under “-Employee Benefits and Stock Plans.” |
| |
(2) | All awards in this column are RSUs that will settle into shares of Class B common stock upon vesting. RSUs issued to our executive officers only vest upon the satisfaction of both a service-based condition and a liquidity-based vesting condition. The service-based condition for each award is described below. The liquidity-based vesting condition for each award is the earlier to occur of (i) a Sale Event (as defined in our 2014 Plan) or (ii) the consummation of our initial public offering, which will be satisfied upon the effectiveness of this offering. |
| |
(3) | The shares of Class B common stock underlying this option vest and become exercisable over a four-year period as to 25% of the Class B common stock underlying the option on the first anniversary of the Vesting Commencement Date and as to 75% of the shares of Class B common stock underlying the option in 12 equal quarterly installments thereafter, subject to Mr. Faugno’s continued service through each vesting date. If Mr. Faugno’s employment terminates without Cause or for Good Reason (in each case, as defined in Mr. Faugno’s offer letter), and such termination occurs within 12 months of a Sale Event, then the option shall accelerate and vest in full. If Mr. Faugno’s employment terminates without Cause or for Good Reason, and such termination is not within the 12-month period following a sale event, then (i) if such termination occurs prior to the first anniversary of the vesting commencement date, then the option shall accelerate and vest as if Mr. Faugno had remained employed through the first anniversary of the vesting commencement date and (ii) if such termination occurs following the 12-month anniversary of the vesting commencement date, then the option shall accelerate and vest as if Mr. Faugno had completed an additional three months of service. In October 2018, the Company determined that the Faugno Acceleration Terms would apply to this award in lieu of the immediately preceding sentence. |
| |
(4) | The service-based condition shall be satisfied as to 25% of the RSUs on the first anniversary of the Vesting Commencement Date, and the remaining RSUs shall satisfy the service-based condition in 12 equal quarterly installments thereafter, subject to Mr. Faugno’s continued service through each vesting date. If Mr. Faugno’s employment terminates without Cause or for Good Reason (in each case, as defined in Mr. Faugno’s offer letter), and such termination occurs within 12 months of a Sale Event, then the service-based vesting condition shall be satisfied in full. If Mr. Faugno’s employment terminates without Cause or for Good Reason, and such termination is not within the 12-month period following a Sale Event, then (i) if such termination occurs prior to the first anniversary of the vesting commencement date, then the RSUs shall satisfy the service-based condition as if Mr. Faugno had remained employed through the first anniversary of the vesting commencement date and (ii) if such termination occurs following the 12-month anniversary of the vesting commencement date, then the RSUs shall satisfy the service-based condition as if Mr. Faugno had completed an additional three months of service. In September 2018, the Company determined that the Faugno Acceleration Terms would apply to this award in lieu of the immediately preceding sentence. |
| |
(5) | The market value set forth above reflects the fair market value of our Class B common stock of $6.65 per share as of December 31, 2017 multiplied by the number of unvested RSUs outstanding as of December 31, 2017. |
| |
(6) | The service-based condition shall be satisfied as to 1/6th of the RSUs on the first anniversary of the Vesting Commencement Date, and the remaining RSUs shall satisfy the service-based condition in 20 equal quarterly installments thereafter, subject to Mr. Serafin’s continued service through each vesting date. If Mr. Serafin’s employment terminates without Cause or for Good
|
Reason (in each case, as defined in Mr. Serafin’s offer letter), and such termination occurs within 12 months of a Sale Event, then the time-based vesting condition shall be deemed satisfied in full. If Mr. Serafin’s employment terminates without Cause or for Good Reason, and such termination is not within the 12-month period following a Sale Event, then 50% of the RSUs shall be deemed to have satisfied the service-based condition.
| |
(7) | The service-based condition shall be satisfied as to 50% of the RSUs on the first anniversary of the Vesting Commencement Date, and the remaining RSUs shall satisfy the service-based condition in 4 equal quarterly installments thereafter, subject to Mr. Serafin’s continued service through each vesting date. If Mr. Serafin’s employment terminates without Cause or for Good Reason (in each case, as defined in Mr. Serafin’s offer letter), and such termination occurs within 12 months of a Sale Event, then the time-based vesting condition shall be deemed satisfied in full. If Mr. Serafin’s employment terminates without Cause or for Good Reason, and such termination is not within the 12-month period following a Sale Event, then 50% of the RSUs shall be deemed to have satisfied the service-based condition. |
Executive Employment Arrangements
Executive Employment Arrangements
We initially entered into offer letters with each of the named executive officers, except for Ryan Smith, in connection with his or her employment with us, which set forth the terms and conditions of employment of each individual, including base salary, target annual bonus opportunity and standard employee benefit plan participation. In addition, certain of these offer letters provided for certain payments and benefits in the event of an involuntary termination of employment following a change in control of the company. We have also entered into employment agreements that contain standard confidentiality, intellectual property assignment, and non-competition and non-solicitation restrictions.
Offer Letters in Place During the Fiscal Year Ended December 31, 2017 for Named Executive Officers
Ryan Smith
As of the date hereof, we have not entered into any offer letter with Mr. Smith.
David Faugno
On October 30, 2017, we entered into an offer letter with Mr. Faugno, who currently serves as our Executive Vice President and Chief Financial Officer, and who we refer to as our Chief Financial Officer. The offer letter provided for Mr. Faugno’s at will employment and set forth his initial annual base salary and target bonus, as well as his eligibility to participate in our benefit plans generally. In addition, the offer letter provided for an initial grant of 1,650,000 RSUs and 1,030,000 stock options, both of which vest over a 4-year period with a one year cliff and quarterly vesting thereafter. In addition, the initial RSU grant is subject to a liquidity based vesting condition, as further described in the “Outstanding Equity Awards at Fiscal 2017 Year-End” table above.
Zig Serafin
On September 28, 2016, we entered into an offer letter with Mr. Serafin, who currently serves as our Chief Operating Officer. The offer letter provided for Mr. Serafin’s at will employment and set forth his initial annual base salary and target bonus, as well as his eligibility to participate in our benefit plans generally. Mr. Serafin also received a $200,000 signing bonus in the year of his hire, which is subject to clawback in the event he is terminated by us for Cause or resigns without Good Reason (each, as defined in his offer letter) during the first two years of his employment. Mr. Serafin’s offer letter also provided that he was eligible to receive two RSU awards representing 5,850,000 and 312,000 shares of Class B common stock. In addition, his offer letter provides for the payment of a cash retention bonus of $1,050,000, payable at the earlier of the 4.5 year anniversary of his start date or the effective date of an S-1 filing, in each case, subject to his continued employment with us. Such cash retention bonus may be payable earlier upon certain qualifying terminations. We expect that this cash retention bonus will be paid to Mr. Serafin upon consummation of this offering. In addition, Mr. Serafin’s offer letter provides that if his employment is terminated by us other than for Cause or he resigns for Good Reason, then subject to the execution of a release of claims in favor of the Company, he will be entitled to receive cash severance in an amount equal to six months of his monthly salary. Mr. Serafin’s offer letter also provided him with a loan in the amount of $1 million, which is further described under “Certain Relationships and Related Party Transactions” below.
Employee Benefits and Stock Plans
2018 Stock Option and Incentive Plan
Our 2018 Stock Option and Incentive Plan, or the 2018 Plan, has been adopted by our board of directors and is expected to be approved by our stockholders and will become effective the day before the date that the registration statement of which this prospectus is part is declared effective by the SEC. The 2018 Plan will replace the 2014 Stock Option and Grant Plan, as amended, or the 2014 Plan, as our board of directors is expected to determine not to make additional awards under the 2014 Plan following the completion of our initial public offering. However, the 2014 Plan will continue to govern outstanding equity awards granted thereunder. The 2018 Plan will allow the compensation committee to make equity-based incentive awards to our officers, employees, directors, and other key persons, including consultants.
Authorized Shares. We will initially reserve shares of our Class B common stock for the issuance of awards under the 2018 Plan, or the Initial Limit. The 2018 Plan will provide that the number of shares reserved and available for issuance under the 2018 Plan will automatically increase each January 1, beginning on January 1, 2019, and ending on (and including) January 1, 2028 by 5% of the outstanding number of shares of our Class B and Class A common stock on the immediately preceding December 31 or such lesser number of shares as determined by our compensation committee, which increase is referred to as the Annual Increase. This number will be subject to adjustment in the event of a stock split, stock dividend or other change in our capitalization. The shares we issue under the 2018 Plan will be authorized but unissued shares or shares that we reacquire. The shares of Class B common stock underlying any awards that are forfeited, canceled, held back upon exercise or settlement of an award to satisfy the exercise price or tax withholding, reacquired by us prior to vesting, satisfied without the issuance of stock, expire or are otherwise terminated, other than by exercise, under the 2018 Plan and the 2014 Plan will be added back to the shares of Class B common stock available for issuance under the 2018 Plan. The maximum number of shares that may be issued as incentive stock options may not exceed the sum of the Initial Limit plus the lesser of the amount added to the share reserve pursuant to the Annual Increase each year or shares, if lower, for each year during which the Annual Increase applies. Accordingly, the maximum number of shares that may be issued as incentive stock options may not exceed the sum of the Initial Limit plus shares. The value of all awards issued under the 2018 Plan and all other cash compensation paid by us to any non-employee director in any calendar year cannot exceed $1,000,000.
Administration. The 2018 Plan will be administered by our compensation committee. Our compensation committee will have full power to select, from among the individuals eligible for awards, the individuals to whom awards will be granted, to make any combination of awards to participants, and to determine the specific terms and conditions of each award, subject to the provisions of the 2018 Plan.
Eligibility. Persons eligible to participate in the 2018 Plan will be those full or part-time officers, employees, non-employee directors and other key persons, including consultants, as selected from time to time by our compensation committee in its discretion.
Options. The 2018 Plan will permit the granting of both options to purchase Class B common stock intended to qualify as incentive stock options under Section 422 of the Code and options that do not so qualify. The option exercise price of each option will be determined by our compensation committee but may not, generally, be less than 100% of the fair market value of our Class B common stock on the date of grant. The term of each option will be fixed by our compensation committee and may not exceed 10 years from the date of grant. Our compensation committee will determine at what time or times each option may be exercised.
Stock Appreciation Rights. Our compensation committee will be able to award stock appreciation rights subject to such conditions and restrictions as it may determine. Stock appreciation rights entitle the recipient to shares of Class B common stock, or cash, equal to the value of the appreciation in our stock price over the exercise price. The exercise price may not be less than 100% of the fair market value of our Class B common stock on the date of grant. The term of each stock appreciation right will be fixed by our compensation committee and may not exceed 10 years from the date of grant. Our compensation committee will determine at what time or times each stock appreciation right may be exercised.
Restricted Stock and Restricted Stock Units. Our compensation committee will be able to award restricted shares of Class B common stock and RSUs to participants subject to such conditions and restrictions as it may determine. These conditions and restrictions may include the achievement of certain performance goals and/or continued employment with us through a specified vesting period.
Unrestricted Stock Awards. Our compensation committee will also be able to grant shares of Class B common stock that are free from any restrictions under the 2018 Plan. Unrestricted stock may be granted to participants in recognition of past services or for other valid consideration and may be issued in lieu of cash compensation due to such participant.
Dividend Equivalent Rights. Our compensation committee will be able to grant dividend equivalent rights to participants that entitle the recipient to receive credits for dividends that would be paid if the recipient had held a specified number of shares of Class B common stock.
Cash-Based Awards. Our compensation committee will be able to grant cash bonuses under the 2018 Plan to participants, subject to the achievement of certain performance goals.
Sale Event. The 2018 Plan will provide that upon the effectiveness of a “sale event,” as defined in the 2018 Plan, an acquirer or successor entity may assume, continue or substitute for the outstanding awards under the 2018 Plan. To the extent that awards granted under the 2018 Plan are not assumed or continued or substituted by the successor entity, all awards granted under the 2018 Plan shall terminate. In such case, except as may be otherwise provided in the relevant award agreement, all options and stock appreciation rights with time-based vesting,conditions or restrictions that are not vested and/or exercisable immediately prior to the sale event will become fully vested and exercisable as of the sale event, all other awards with time-based vesting, conditions or restrictions will become fully vested and nonforfeitable as of the sale event, and all awards with conditions and restrictions relating to the attainment of performance goals may become vested and nonforfeitable in connection with the sale event in the plan administrator’s discretion or to the extent specified in the relevant award agreement. In the event of such termination, individuals holding options and stock appreciation rights may be permitted to exercise such options and stock appreciation rights (to the extent exercisable) prior to the sale event or alternatively, we may make or provide for a payment to participants holding exercisable options and stock appreciation rights equal to the difference between the per share consideration payable to stockholders in the sale event and the exercise price of the options or stock appreciation rights. The Company may also elect to provide for payment in cash or in kind to holders of other awards equal to the per share consideration payable to stockholders in the sale event multiplied by the number of shares subject to the stock awards.
Amendment. Our board of directors will be able to amend or discontinue the 2018 Plan and our compensation committee will be able to amend or cancel outstanding awards for purposes of satisfying changes in law or any other lawful purpose, but no such action may materially and adversely affect rights under an award without the holder’s consent. The compensation committee is specifically authorized to exercise its discretion to reduce the exercise price of outstanding stock options or stock appreciation rights or effect the repricing of such awards through cancellation and re-grants. Certain amendments to the 2018 Plan will require the approval of our stockholders.
No awards may be granted under the 2018 Plan after the date that is 10 years from the date immediately preceding the registration date. No awards under the 2018 Plan have been made prior to the date hereof.
2014 Stock Option and Grant Plan, as amended
Our board of directors adopted, and our stockholders approved, our 2014 Plan in September 2014, which has subsequently been amended. Our 2014 Plan allowed for the grant of incentive stock options to our employees and any of our parent and subsidiary corporations’ employees, and for the grant of nonqualified stock options, restricted stock unit awards, restricted stock awards and unrestricted stock awards to employees, officers, directors and consultants of ours and our parent and subsidiary corporations.
Authorized Shares. No shares will be available for future issuance under the 2014 Plan following the closing of this offering. However, our 2014 Plan will continue to govern outstanding awards granted thereunder. As of June 30, 2018, 6,453,457 shares of restricted stock, shares covering 44,109,560 RSUs and options to purchase 2,867,500 shares
of our Class B common stock remained outstanding under our 2014 Plan at a weighted-average exercise price of approximately $6.49 per share.
Administration. Our board of directors currently administers our 2014 Plan. Subject to the provisions of our 2014 Plan, the administrator has the power to interpret and administer our 2014 Plan and any agreement thereunder and to determine the terms of awards, including the recipients, the number of shares subject to each award, the exercise price, if any, the vesting schedule applicable to the awards together with any vesting acceleration and the terms of the award agreement for use under our 2014 Plan. The administrator is specifically authorized to exercise its discretion to reduce the exercise price of outstanding stock options or effect the repricing of such awards through cancellation and re-grants.
Options. Stock options have been granted under our 2014 Plan. The exercise price per share of all options must have equaled at least 100% of the fair market value per share of our Class B common stock on the date of grant. The term of an incentive stock option may not have exceeded 10 years. An incentive stock option granted to a participant who owns more than 10% of the total combined voting power of all classes of our stock on the date of grant, or any parent or subsidiary corporations, may not have had a term in excess of five years and must have an exercise price of at least 110% of the fair market value per share of our Class B common stock on the date of grant. The administrator will determine the methods of payment of the exercise price of an option, which may include cash, shares or certain other property or other consideration acceptable to the administrator. After a participant’s termination of service, the participant generally may exercise his or her options, to the extent vested as of such date of termination, for 3 months after termination or such longer period of time as specified in the applicable option agreement. If termination is due to death or disability, the option generally will remain exercisable, to the extent vested as of such date of termination, until the 12-month anniversary of such termination. However, in no event may an option be exercised later than the expiration of its term.
Restricted Stock and RSUs. Restricted Stock and RSUs have been granted under our 2014 Plan. The administrator determined the terms and conditions of restricted stock and RSUs, including the number of shares or units granted, the vesting criteria (which may include accomplishing specified performance criteria or continued service to us) and the form and timing of payment.
Transferability or Assignability of Awards. Our 2014 Plan generally does not allow for the transfer or assignment of awards, other than, at the discretion of the administrator, by will or the laws of descent and distribution, by gift to an immediate family member, or by instrument to an inter vivos or testamentary trust in which the award is passed to beneficiaries upon the death of the grantee.
Certain Adjustments. In the event of certain changes in our capitalization, the exercise prices of and the number of shares subject to outstanding options, and the purchase price of and the numbers of shares subject to outstanding awards will be proportionately adjusted, subject to any required action by our board of directors or stockholders.
Change in Control; Dissolution or Liquidation. The 2014 Plan provides that, upon the consummation of a Sale Event, unless provision is made in connection with the Sale Event for the assumption or continuation of the awards by the successor entity or substitution of the awards with new awards of the successor entity, with appropriate adjustment, the 2014 Plan and all outstanding and unexercised options and other awards issued thereunder will terminate upon the effective time of the Sale Event. In the event of such termination, each option holder shall be permitted, within a specified period prior to the Sale Event as specified by the administrator, to exercise all exercisable options or all options that will become exercisable as of the effective time of the Sale Event, as further described in the 2014 Plan. If shares of unvested restricted stock are forfeited, the shares shall be repurchased from the holder at a price per share equal to the original per share purchase price paid for such shares, subject to adjustments provided in the 2014 Plan. In our discretion, (i) we may make or provide for cash payment to holders of options equal to the difference between (x) the per share cash consideration in the Sale Event multiplied by the number of shares subject to outstanding options being cancelled, and (y) the aggregate exercise price to the holders of all vested and exercisable options and (ii) make or provide for cash payment to holders of restricted stock and RSUs the per share cash consideration in the Sale Event multiplied by the number of shares of restricted stock or RSUs being cancelled. For purposes of the 2014 Plan, a “Sale Event” shall mean the consummation of (i) the dissolution or liquidation of the Company, (ii) the sale of all or substantially all of the assets of the Company on a consolidated basis to an unrelated person or entity, (iii) a merger, reorganization or consolidation pursuant to which the holders of the Company’s outstanding voting power immediately
prior to such transaction do not own a majority of the outstanding voting power of the surviving or resulting entity (or its ultimate parent, if applicable), (iv) the acquisition of all or a majority of the outstanding voting stock of the Company in a single transaction or a series of related transactions by a person or persons, or (v) any other acquisition of the business of the Company, as determined by our board of directors.
Our board of directors has determined not to grant any further awards under the 2014 Plan after the completion of the offering. Following the consummation of our initial public offering, we expect to make future awards under the 2018 Plan.
2018 Employee Stock Purchase Plan
Our 2018 Employee Stock Purchase Plan, or ESPP, has been adopted by our board of directors and is expected to be approved by our stockholders and will become effective the day before the date that the registration statement of which this prospectus is part is declared effective by the SEC. Our compensation committee administers the ESPP. The ESPP will initially reserve and authorize the issuance of up to a total of shares of Class B common stock to participating employees. The ESPP will provide that the number of shares reserved and available for issuance will automatically increase each January 1, beginning on January 1, 2019 and ending on (and including) January 1, 2028 by the lesser of shares of our Class B common stock, 1% of the outstanding number of shares of our Class B and Class A common stock on the immediately preceding December 31, or such lesser number of shares as determined by our compensation committee. This number will be subject to adjustment in the event of a stock split, stock dividend or other change in our capitalization.
All employees whose customary employment is for more than 20 hours per week and for more than five months in any calendar year will be eligible to participate in the ESPP; provided, however, that employees who are employed for 20 hours or less a week or for five months or less in any calendar year may be eligible to participate if required by applicable law. Any employee who owns 5% or more of the total combined voting power or value of all classes of stock will not be eligible to purchase shares under the ESPP.
We will make one or more offerings, consisting of one or more purchase periods, each year to our employees to purchase shares under the ESPP. The first offering, or the Initial Offering, will begin onthe effective date of the registration statement of which this prospectus is part and, unless otherwise determined by the administrator of the ESPP, will end on November 30, 2020, and the next two offerings will commence on the first trading day on or following each of June 1, 2019 and December 1, 2019 and will end on November 30, 2020. Thereafter, unless otherwise determined by the administrator of the ESPP, offerings will commence on the first trading day on or following each June 1 and December 1 and will end on the last trading day on or before November 30 or May 31, respectively. Unless otherwise determined by the administrator of the ESPP, each offering will be divided into equal six-month purchase periods, except that the first purchase period in the Initial Offering will commence on the registration date and end on the last trading day on or before May 31, 2019. Each eligible employee as of the effective date of the registration statement for the Initial Offering will be deemed to be a participant in the ESPP at that time and must authorize payroll deductions or other contributions by submitting an enrollment form by the deadline specified by the plan administrator. Each eligible employee may elect to participate in any subsequent offering by submitting an enrollment form at least 15 business days before the relevant offering date.
Each employee who is a participant in the ESPP may purchase shares by authorizing contributions of up to 20% of his or her compensation during a purchase period. Unless the participating employee has previously withdrawn from the offering, his or her accumulated contributions will be used to purchase shares on the last business day of the purchase period at a price equal to 85% of the fair market value of the shares on the first business day of the offering period (which, for purposes of the Initial Offering, will be equal to our initial public offering price) or the last business day of the purchase period, whichever is lower, provided that no more than a number of shares of Class B common stock determined by dividing $15,000 by the fair market value of the shares on the first business day of the offering period (or a lesser number as established by the plan administrator in advance of the purchase period) may be purchased by any one employee during each purchase period. Under applicable tax rules, an employee may purchase no more than $25,000 worth of shares of Class B common stock, valued at the start of the offering period, under the ESPP for each calendar year in which a purchase right is outstanding.
The accumulated contributions of any employee who is not a participant on the last day of a purchase period will be refunded. An employee’s rights under the ESPP terminate upon voluntary withdrawal from the plan or when the employee ceases employment with us for any reason.
The ESPP may be terminated or amended by our board of directors at any time but shall automatically terminate on the 10 year anniversary of the registration date. An amendment that increases the number of shares of Class B common stock that are authorized under the ESPP and certain other amendments will require the approval of our stockholders. The plan administrator may adopt subplans under the ESPP for employees of our non-U.S. subsidiaries who may participate in the ESPP and may permit such employees to participate in the ESPP on different terms, to the extent permitted by applicable law.
Senior Executive Cash Incentive Bonus Plan
In October 2018, our board of directors adopted the Senior Executive Cash Incentive Bonus Plan, or Bonus Plan. The Bonus Plan provides for cash bonus payments based upon the attainment of performance targets established by our compensation committee. The payment targets will be related to financial and operational measures or objectives with respect to our company, or corporate performance goals, as well as individual performance objectives.
Our compensation committee may select corporate performance goals from among, but shall not be limited to, the following: achievement of billings, including subscription, Research on Demand, and professional services and other; renewal rate; achievement of cash flow (including, but not limited to, operating cash flow and free cash flow); research and development, earnings before interest, taxes, depreciation and amortization; net income (loss) (either before or after interest, taxes, depreciation and/or amortization); changes in the market price of our common stock; acquisitions or strategic transactions, including licenses, collaborations, joint ventures or promotion arrangements; operating income (loss); total stockholder returns; productivity; expense efficiency; margins; operating efficiency; working capital; earnings (loss) per share of our common stock; bookings, new bookings or renewals; sales or market shares; corporate revenue; net retention rate; and/or net annual recurring revenue, any of which may be (A) measured in absolute terms or compared to any incremental increase, (B) measured in terms of growth, (C) compared to another company or companies or to results of a peer group, (D) measured against the market as a whole and/or as compared to applicable market indices, and/or (E) measured on a pre-tax or post-tax basis (if applicable).
Each executive officer who is selected to participate in the Bonus Plan will have a target bonus opportunity set for each performance period. The bonus formulas will be adopted in each performance period by the compensation committee and communicated to each executive. The corporate performance goals will be measured at the end of each performance period as the compensation committee determines. If the corporate performance goals and/or individual performance objectives are met, payments will be made as soon as practicable following the end of each performance period. Subject to the rights contained in any agreement between the executive officer and us, an executive officer must be employed by us on the bonus payment date to be eligible to receive a bonus payment. The Bonus Plan also permits the compensation committee to approve additional bonuses to executive officers in its sole discretion and provides the compensation committee with discretion to adjust the size of the award as it deems appropriate to account for unforeseen factors beyond management’s control that affected corporate performance.
401(k) Plan
We maintain a tax-qualified retirement plan that provides eligible U.S. employees with an opportunity to save for retirement on a tax-advantaged basis. Plan participants are able to defer eligible compensation subject to applicable annual Code limits. We automatically make a non-elective safe harbor contribution of 3% of each participant’s eligible compensation. The 401(k) plan is intended to be qualified under Section 401(a) of the Code with the 401(k) plan’s related trust intended to be tax exempt under Section 501(a) of the Code. As a tax-qualified retirement plan, contributions to the 401(k) plan and earnings on those contributions are not taxable to the employees until distributed from the 401(k) plan.
CERTAIN RELATIONSHIPS AND RELATED PARTY TRANSACTIONS
In addition to the compensation arrangements, including employment, termination of employment and change in control arrangements, discussed in the sections titled “Management” and “Executive Compensation” and the registration rights described in the section titled “Description of Capital Stock—Registration Rights,” the following is a description of each transaction since January 1, 2015 and each currently proposed transaction in which:
we have been or are to be a participant;
the amount involved exceeded or exceeds $120,000; and
any of our directors, executive officers or holders of more than 5% of our outstanding capital stock, or any immediate family member of, or person sharing the household with, any of these individuals or entities, had or will have a direct or indirect material interest.
Equity Financing
Series B-3 and Series B-5 Redeemable Convertible Preferred Stock Financing
In March 2017, we sold an aggregate of 20,204,436 shares of our Series B-3 redeemable convertible preferred stock and an aggregate of 4,849,065 shares of our Series B-5 redeemable convertible preferred stock, in each case, at a purchase price of $6.19 per share, or the Preferred Share Price, for a total aggregate purchase price of approximately $155.0 million. The following table summarizes purchases of our Series B-3 redeemable convertible preferred stock and our Series B-5 redeemable convertible preferred stock by related persons. None of our executive officers purchased shares of Series B-3 redeemable convertible preferred stock or Series B-5 redeemable convertible preferred stock.
|
| | | | | | | | |
| Stockholder | | Shares of
Series B-3
Redeemable Convertible
Preferred Stock | | Shares of
Series B-5
Redeemable Convertible
Preferred Stock | | Total
Purchase
Price |
Entities affiliated with Accel(1) | | 7,735,040 | | 1,856,410 | | $ | 59,340,000 |
|
Entities affiliated with Insight Venture Partners(2) | | 11,891,940 | | 2,854,066 | | $ | 91,230,000 |
|
Entities affiliated with Sequoia Capital(3) | | 577,456 | | 138,589 | | $ | 4,430,000 |
|
____________________
| |
(1) | Ryan Sweeney, a member of our board of directors, is a partner at Accel. Affiliates of Accel holding our securities whose shares are aggregated for purposes of reporting share ownership information include Accel Growth Fund III L.P., Accel Growth Fund III Strategic Partners L.P., Accel Growth Fund Investors 2014 L.L.C., Accel Leaders Fund Investors 2016 L.L.C., Accel Leaders Fund L.P., Accel Growth Fund II L.P., Accel Growth Fund II Strategic Partners L.P., and Accel Growth Fund Investors 2012 L.L.C. |
| |
(2) | Jeffrey Lieberman, a member of our board of directors, is a managing director of Insight Venture Partners. Affiliates of Insight Venture Partners holding our securities whose shares are aggregated for purposes of reporting share ownership information include Insight Venture Partners (Cayman) IX, L.P., Insight Venture Partners (Cayman) VIII, L.P., Insight Venture Partners (Delaware) IX, L.P., Insight Venture Partners (Delaware) VIII, L.P., Insight Venture Partners Coinvestment Fund (Delaware) III, L.P., Insight Venture Partners Coinvestment Fund III, L.P., Insight Venture Partners IX, L.P., Insight Venture Partners IX (Co-Investors), L.P., Insight Venture Partners VIII, L.P., and Insight Venture Partners VIII (Co-Investors), L.P. |
| |
(3) | R. Bryan Schreier, a member of our board of directors, is a partner at Sequoia Capital. Affiliates of Sequoia Capital holding our securities whose shares are aggregated for purposes of reporting share ownership information include Sequoia Capital U.S. Growth Fund V, L.P. and SC US GF V Holdings Ltd.
|
Stock Repurchases
Company Repurchase
In March 2017, in connection with the Series B-3 and Series B-5 financing and using a portion of the proceeds from the Series B-3 and Series B-5 financing, we repurchased an aggregate of 8,081,774 shares of our outstanding Series A-1 redeemable convertible preferred stock from a holder of our Series A-1 redeemable convertible preferred
stock, at the Preferred Share Price, and an aggregate of 12,122,661 shares of our outstanding Series A-2 redeemable convertible preferred stock from a holder of our Series A-2 redeemable convertible preferred stock, at the Preferred Share Price, for a total aggregate purchase price of approximately $125.0 million. We refer to this series of transactions as the Company Repurchase. The following table summarizes our repurchases of Series A-1 redeemable convertible preferred stock and Series A-2 redeemable convertible preferred stock from entities affiliated with our directors and executive officers in the Company Repurchase.
|
| | | | | | | | | | |
| Name | | Shares of
Series A-1
Redeemable Convertible
Preferred Stock | | Shares of
Series A-2
Redeemable Convertible
Preferred Stock | | Aggregate
Purchase
Price |
Mooo, LLC(1) | | 8,081,774 |
| | — |
| | $ | 50,000,000 |
|
Grandview Holdings LLC(2) | | — |
| | 12,122,661 |
| | $ | 75,000,000 |
|
____________________
| |
(1) | Stuart Orgill, a former member of our board of directors, is a manager of Mooo, LLC. Mr. Orgill resigned from our board of directors in June 2017. |
| |
(2) | Ryan Smith, our Chief Executive Officer and a member of our board of directors, Jared Smith, our President and a member of our board of directors and Scott Smith, a member of our board of directors, are managers of Grandview Holdings LLC. |
Secondary Sale
In April 2017, we agreed to waive certain transfer restrictions in connection with a sale and transfer of 479,925 shares of our outstanding Series A-1 redeemable convertible preferred stock, 200,000 shares of our outstanding Series A-3 redeemable convertible preferred stock and 282,862 shares of our outstanding Class B common stock from certain holders of our capital stock to certain other holders of our capital stock at the Preferred Share Price, for a total aggregate purchase price of approximately $6.0 million, which series of transactions we refer to as the Secondary Sale. The following table summarizes purchases of our Series A-1 redeemable convertible preferred stock, our Series A-3 redeemable convertible preferred stock and our Class B common stock by related persons in the Secondary Sale. An entity affiliated with R. Duff Thompson, the chairman of our board of directors, sold 200,000 shares of our Series A-3 redeemable convertible preferred stock in the Secondary Sale.
|
| | | | | | | | | | |
| Stockholder | | Shares of
Series A-1
Redeemable Convertible
Preferred Stock | | Shares of
Series A-3
Redeemable Convertible
Preferred Stock | | Shares of Class B Common Stock | | Aggregate
Purchase
Price |
Entities affiliated with Accel(1) | | 191,969 | | 80,000 | | 113,145 | | $ | 2,382,613 |
|
Entities affiliated with Insight Venture Partners(2) | | 287,956 | | 120,000 | | 169,717 | | $ | 3,573,919 |
|
____________________
| |
(1) | Ryan Sweeney, a member of our board of directors, is a partner at Accel. Affiliates of Accel holding our securities whose shares are aggregated for purposes of reporting share ownership information include Accel Growth Fund III L.P., Accel Growth Fund III Strategic Partners L.P., Accel Growth Fund Investors 2014 L.L.C., Accel Leaders Fund Investors 2016 L.L.C., Accel Leaders Fund L.P., Accel Growth Fund II L.P., Accel Growth Fund II Strategic Partners L.P., and Accel Growth Fund Investors 2012 L.L.C. |
| |
(2) | Jeffrey Lieberman, a member of our board of directors, is a managing director of Insight Venture Partners. Affiliates of Insight Venture Partners holding our securities whose shares are aggregated for purposes of reporting share ownership information include Insight Venture Partners (Cayman) IX, L.P., Insight Venture Partners (Cayman) VIII, L.P., Insight Venture Partners (Delaware) IX, L.P., Insight Venture Partners (Delaware) VIII, L.P., Insight Venture Partners Coinvestment Fund (Delaware) III, L.P., Insight Venture Partners Coinvestment Fund III, L.P., Insight Venture Partners IX, L.P., Insight Venture Partners IX (Co-Investors), L.P., Insight Venture Partners VIII, L.P., and Insight Venture Partners VIII (Co-Investors), L.P. |
2017 Tender Offer
In April 2017 we agreed to waive certain transfer restrictions in connection with, and assist in the administration of, a tender offer by entities affiliated with Accel and Insight Venture Partners. In April 2017, these holders commenced
a tender offer to purchase shares of our outstanding capital stock from certain of our then-current employees and certain former employees. We refer to this tender offer as the 2017 Tender Offer.
The 2017 Tender Offer closed in May 2017. An aggregate of 2,203,180 shares of our capital stock were tendered pursuant to the 2017 Tender Offer at the Preferred Share Price (less applicable deductions), of which entities affiliated with Accel purchased 881,272 shares for a total purchase price of approximately $5.5 million and entities affiliated with Insight Venture Partners purchased 1,321,908 shares for a total purchase price of approximately $8.2 million. Each of Accel, together with its affiliates, and Insight Venture Partners, together with its affiliates, is a beneficial holder of more than 5% of our outstanding capital stock. In addition, Ryan Sweeney, a member of our board of directors, is a partner at Accel and Jeffrey Lieberman, a member of our board of directors, is a managing director of Insight Venture Partners.
Engagement with Simplex Cleaning
In July 2010 we engaged Simplex Cleaning, an entity owned by relatives of Ryan Smith and Jared Smith, to provide certain office cleaning services to us. For the years ended December 31, 2017, 2016, and 2015, we incurred $336,000, $235,000, and $141,000, respectively, of expenses related to these services. In October 2018, we terminated our engagement with Simplex Cleaning.
Lease Agreement with Timpanogos Land Holdings, LLC
In November 2015, we entered into a 10-year lease agreement with Timpanogos Land Holdings, LLC, an entity controlled by Ryan Smith, Jared Smith and Scott Smith for our Provo, Utah, 165,074 square foot corporate headquarters. For the years ended December 31, 2017, 2016, and 2015, we incurred $2.7 million, $2.6 million, and $1.2 million, respectively, of expense related to the lease agreement. Pursuant to the terms of the lease agreement, we have two options to extend the lease term each for a period of five additional years, for an aggregate lease extension of up to 10 years. Additionally, under the terms of the lease agreement, we have a right of first offer in the event of a sale of the building.
In October 2018, Timpanogos Land Holdings, LLC sold its ownership of the 165,074 square foot corporate headquarters in Provo, Utah to an independent third party. Pursuant to this sale, our lease agreement with Timpanogos Land Holdings, LLC was terminated. We have entered into a new lease agreement with the independent third party.
Loan Agreement with Zig Serafin
In May 2017, we entered into a loan agreement with Zig Serafin, our Chief Operating Officer. As of December 31, 2017, the aggregate outstanding principal amount of the loan was $1.0 million. The loan matures and becomes due on the earlier of May 23, 2022, 60 days following the date of termination of employment of Mr. Serafin, or immediately prior to the first filing of a registration statement on Form S-1 related to this offering. Until that time, the loan will accrue interest at 2.04% per annum, compounded annually. The loan was repaid by Mr. Serafin in July 2018.
Investors’ Rights Agreement
We are party to an investors’ rights agreement which provides, among other things, that certain holders of our capital stock have the right to demand that we file a registration statement or request that their shares of our capital stock be covered by a registration statement that we are otherwise filing. The parties to the investors’ rights agreement include entities affiliated with Ryan Smith, our chief executive officer and a current director, Jared Smith, our president and a current director, Scott Smith, a current director, R. Duff Thompson, our chairman of the board and a current director, Stuart Orgill, a former director, and entities affiliated with Accel, Insight Venture Partners, and Sequoia Capital. See the section titled “Description of Capital Stock—Registration Rights.”
Right of First Refusal
Pursuant to certain of our equity compensation plans and certain agreements with our stockholders, including a right of first refusal and co-sale agreement, we or our assignees have a right to purchase shares of our capital stock which stockholders propose to sell to other parties. This right will terminate upon completion of this offering. The parties to the right of first refusal and co-sale agreement include entities affiliated with Ryan Smith, our chief executive
officer and a current director, Jared Smith, our president and a current director, Scott Smith, a current director, R. Duff Thompson, our chairman of the board and a current director, Stuart Orgill, a former director, and entities affiliated with Accel, Insight Venture Partners, and Sequoia Capital.
Voting Agreement
We are party to a voting agreement under which certain holders of our capital stock have agreed to vote their shares of our capital stock on certain matters, including with respect to the election of directors. Upon completion of this offering, the voting agreement will terminate and none of our stockholders will have any special rights regarding the election or designation of members of our board of directors. The parties to the voting agreement include entities affiliated with Ryan Smith, our chief executive officer and a current director, Jared Smith, our president and a current director, Scott Smith, a current director, R. Duff Thompson, our chairman of the board and a current director, Stuart Orgill, a former director, and entities affiliated with Accel, Insight Venture Partners, and Sequoia Capital.
Other than as described above under this section titled “Certain Relationships and Related Party Transactions,” since January 1, 2015, we have not entered into any transactions, nor are there any currently proposed transactions, between us and a related party where the amount involved exceeds, or would exceed, $120,000, and in which any related person had or will have a direct or indirect material interest. We believe the terms of the transactions described above were comparable to terms we could have obtained in arm’s-length dealings with unrelated third parties.
Limitation of Liability and Indemnification of Officers and Directors
We have adopted an amended and restated certificate of incorporation, which will become effective immediately prior to the completion of this offering, and which will contain provisions that limit the liability of our directors for monetary damages to the fullest extent permitted by Delaware law. Consequently, our directors will not be personally liable to us or our stockholders for monetary damages for any breach of fiduciary duties as directors, except liability for the following:
any breach of their duty of loyalty to our company or our stockholders;
any act or omission not in good faith or that involves intentional misconduct or a knowing violation of law;
unlawful payments of dividends or unlawful stock repurchases or redemptions as provided in Section 174 of the DGCL; or
any transaction from which they derived an improper personal benefit.
Any amendment to, or repeal of, these provisions will not eliminate or reduce the effect of these provisions in respect of any act, omission or claim that occurred or arose prior to that amendment or repeal. If the DGCL is amended to provide for further limitations on the personal liability of directors of corporations, then the personal liability of our directors will be further limited to the greatest extent permitted by the DGCL.
In addition, we have adopted amended and restated bylaws, which will become effective immediately prior to the completion of this offering, and which will provide that we will indemnify, to the fullest extent permitted by law, any person who is or was a party or is threatened to be made a party to any action, suit or proceeding by reason of the fact that he or she is or was one of our directors or officers or is or was serving at our request as a director or officer of another corporation, partnership, joint venture, trust or other enterprise. Our amended and restated bylaws are expected to provide that we may indemnify to the fullest extent permitted by law any person who is or was a party or is threatened to be made a party to any action, suit or proceeding by reason of the fact that he or she is or was one of our employees or agents or is or was serving at our request as an employee or agent of another corporation, partnership, joint venture, trust or other enterprise. Our amended and restated bylaws will also provide that we must advance expenses incurred by or on behalf of a director or officer in advance of the final disposition of any action or proceeding, subject to limited exceptions.
Further, we have entered into or will enter into indemnification agreements with each of our directors and executive officers that may be broader than the specific indemnification provisions contained in the DGCL. These indemnification agreements require us, among other things, to indemnify our directors and executive officers against liabilities that may
arise by reason of their status or service. These indemnification agreements also require us to advance all expenses incurred by the directors and executive officers in investigating or defending any such action, suit or proceeding. We believe that these agreements are necessary to attract and retain qualified individuals to serve as directors and executive officers.
The limitation of liability and indemnification provisions that are expected to be included in our amended and restated certificate of incorporation, amended and restated bylaws and in indemnification agreements that we have entered into or will enter into with our directors and executive officers may discourage stockholders from bringing a lawsuit against our directors and executive officers for breach of their fiduciary duties. They may also reduce the likelihood of derivative litigation against our directors and executive officers, even though an action, if successful, might benefit us and other stockholders. Further, a stockholder’s investment may be adversely affected to the extent that we pay the costs of settlement and damage awards against directors and executive officers as required by these indemnification provisions. At present, we are not aware of any pending litigation or proceeding involving any person who is or was one of our directors, officers, employees or other agents or is or was serving at our request as a director, officer, employee or agent of another corporation, partnership, joint venture, trust or other enterprise, for which indemnification is sought, and we are not aware of any threatened litigation that may result in claims for indemnification.
We have obtained insurance policies under which, subject to the limitations of the policies, coverage is provided to our directors and executive officers against loss arising from claims made by reason of breach of fiduciary duty or other wrongful acts as a director or executive officer, including claims relating to public securities matters, and to us with respect to payments that may be made by us to these directors and executive officers pursuant to our indemnification obligations or otherwise as a matter of law.
Certain of our non-employee directors may, through their relationships with their employers, be insured and/or indemnified against certain liabilities incurred in their capacity as members of our board of directors.
The underwriting agreement will provide for indemnification by the underwriters of us and our officers and directors for certain liabilities arising under the Securities Act or otherwise.
Insofar as indemnification for liabilities arising under the Securities Act may be permitted to directors, officers or persons controlling our company pursuant to the foregoing provisions, we have been informed that, in the opinion of the SEC, such indemnification is against public policy as expressed in the Securities Act and is therefore unenforceable.
Policies and Procedures for Related Party Transactions
Following the completion of this offering, our audit committee will have the primary responsibility for reviewing and approving or disapproving “related party transactions,” which are transactions between us and related persons in which the aggregate amount involved exceeds or may be expected to exceed $120,000 and in which a related person has or will have a direct or indirect material interest. Upon completion of this offering, our policy regarding transactions between us and related persons will provide that a related person is defined as a director, executive officer, nominee for director, or greater than 5% beneficial owner of our Class A-1, Class A-2, and Class B common stock, in each case since the beginning of the most recently completed year, and any of their immediate family members. Our audit committee charter that will be in effect upon completion of this offering will provide that our audit committee shall review and approve or disapprove any related party transactions.
PRINCIPAL STOCKHOLDERS
The following table sets forth certain information with respect to the beneficial ownership of our capitalcommon stock as of September 30, 2018,October 1, 2021, and as adjusted to reflect the sale of our Class BA common stock offered by us in this offering, assuming no exercise of the underwriters’ over-allotment option to purchase additional shares, for:
•each of our named executive officers;
•each of our directors;
•all of our current directors and executive officers as a group; and
•each person known by us to be the beneficial owner of more than 5% of the outstanding shares of our Class A-1, Class A-2,A or Class B common stock (by number or by voting power).
We have determined beneficial ownership in accordance with the rules of the SEC, and thus it represents sole or shared voting or investment power with respect to our securities. Unless otherwise indicated below, to our knowledge, the persons and entities named in the table have sole voting and sole investment power with respect to all shares that they beneficially owned, subject to community property laws where applicable. The information does not necessarily indicate beneficial ownership for any other purpose, including for purposes of Sections 13(d) and 13(g) of the Securities Act.
We have based our calculation of the percentage of beneficial ownership prior to this offering on 163,272,517117,719,582 shares of our Class A-1 common stock, 202,791,238 shares of our Class A-2A common stock and 24,771,384423,170,610 shares of our Class B common stock outstanding as of June 30, 2018, assuming (i) the automatic conversion of all outstanding shares of our Series A-1 and Series A-2 redeemable convertible preferred stock into our Class A-2 common stock immediately prior to the completion of this offering, as if such conversion had occurred as of September 30, 2018, (ii) the automatic conversion of all outstanding shares of our Series A-3 redeemable convertible preferred stock and Series B redeemable convertible preferred stock into our Class A-1 common stock immediately prior to the completion of this offering, as if such conversion had occurred as of September 30, 2018, and (iii) the vesting and settlement of all outstanding RSUs for which the service-based vesting would be satisfied as of September 30, 2018, assuming the performance vesting condition had been achieved as of such date, before giving effect to shares withheld to satisfy the associated withholding tax obligations.
October 1, 2021. We have based our calculation of the percentage of beneficial ownership after this offering on 163,272,517139,201,859 shares of our Class A-1A common stock 202,791,238 shares of our Class A-2 common stock and 423,170,610 shares of our Class B common stock outstanding immediately afterfollowing the completion of this offering, assuming that the underwriters will not exercise their over-allotment option in full and assuming the issuance of up to shares of Class B common stock at the closing of this offering on the vesting and settlement of certain RSUs subject to a performance condition in connection with the completion of this offering.purchase additional shares. We have deemed shares of our capitalcommon stock subject to restricted stock options that are currently exercisableunits, or exercisable within 60 days of September 30, 2018, to be outstanding and to be beneficially owned by the person holding the stock option for the purpose of computing the percentage ownership of that person. We have deemed shares of our Class B common stock subject to RSUs, for which the service condition has been satisfied or would be satisfied within 60 days of September 30, 2018October 1, 2021 to be outstanding and to be beneficially owned by the person holding the RSUs for the purpose of computing the percentage ownership of that person. In addition, for RSUs that contain a vesting condition that is contingent upon completion of this offering, we have assumed that such condition has been met. However, we did not deem these shares subject to stock options or restricted stock unitsRSUs outstanding for the purpose of computing the percentage ownership of any other person.
Unless otherwise indicated, the address of each beneficial owner listed in the table below is c/o Qualtrics International Inc., 333 West River Park Drive, Provo, Utah 84604.
| | | | | | | | | | | | | | | | | | | | | | | | | | | | | | | | | | | | | | | | | | | | | | | | | | | | | | | | | | | |
| Beneficial Ownership Before the Offering | | Beneficial Ownership After the Offering |
| Class A Common Stock | | Class B Common Stock | | Total Voting Power Before the Offering | | Class A Common Stock | | Class B Common Stock | | Total Voting Power After the Offering |
| Name of Beneficial Owner | Shares | | % | | Shares | | % | | %† | | Shares | | % | | Shares | | % | | %† |
| Directors and Named Executive Officers: | | | | | | | | | | | | | | | | | | | |
Ryan Smith(1) | 6,400,840 | | | 5.4 | % | | — | | — | | * | | 6,400,840 | | | 4.6 | % | | — | | — | | * |
Zig Serafin(2) | 221,365 | | | * | | — | | — | | * | | 221,365 | | | * | | — | | — | | * |
John Thimsen(3) | 75,354 | | | * | | — | | — | | * | | 75,354 | | | * | | — | | — | | * |
Bill McMurray(4) | 68,512 | | | * | | — | | — | | * | | 68,512 | | | * | | — | | — | | * |
| Egon Durban | — | | | — | | — | | — | | — | | — | | | — | | — | | — | | — |
| Sindhu Gangadharan | — | | | — | | — | | — | | — | | — | | | — | | — | | — | | — |
| Christian Klein | — | | | — | | — | | — | | — | | — | | | — | | — | | — | | — |
| Luka Mucic | — | | | — | | — | | — | | — | | — | | | — | | — | | — | | — |
| Scott Russell | — | | | — | | — | | — | | — | | — | | | — | | — | | — | | — |
| Donald J. Paoni | — | | | — | | — | | — | | — | | — | | | — | | — | | — | | — |
| Kelly Steckelberg | — | | | — | | — | | — | | — | | — | | | — | | — | | — | | — |
All directors and executive officers as a group (13 persons)(5) | 6,841,719 | | | 5.8 | % | | — | | — | | * | | 6,841,719 | | | 4.9 | % | | — | | — | | * |
| 5% Stockholders: | | | | | | | | | | | | | | | | | | | |
SAP SE(6) | — | | | — | | | 423,170,610 | | 100.0 | % | | 97.3 | % | | — | | | — | | | 423,170,610 | | 100.0 | % | | 96.8 | % |
Silver Lake Group, L.L.C.(7) | 22,736,074 | | | 19.3 | % | | — | | — | | * | | 22,736,074 | | | 16.3 | % | | — | | — | | * |
|
| | | | | | | | | | | | | | | | | | | | | | | | | | | | | | | | | | | |
| | | Beneficial Ownership Before the Offering | | Beneficial Ownership After the Offering |
| | | Class A-1 Common Stock | | Class A-2 Common Stock | | Class B Common Stock | |
Total Voting Power Before the Offering | | Class A-1 Common Stock | | Class A-2 Common Stock | | Class B Common Stock | |
Total Voting Power After the Offering |
| Name of Beneficial Owner | | Shares | | % | | Shares | | % | | Shares | | % | | % | | Shares | | % | | Shares | | % | | Shares | | % | | % |
| Directors and Named Executive Officers: | | | | | | | | | | | | | | | | | | | | | | | | | | | | |
Ryan Smith(1) | | — |
| | * |
| | 177,646,836 |
| | 87.6 | % | | — |
| | * |
| | 48.2 | % | | | | | | | | | | | | | | |
Jared Smith(1) | | — |
| | * |
| | 177,646,836 |
| | 87.6 | % | | — |
| | * |
| | 48.2 | % | | | | | | | | | | | | | | |
David Faugno(2) | | — |
| | * |
| | — |
| | * |
| | 670,000 |
| | 2.6% |
| | * |
| | | | | | | | | | | | | | |
Zig Serafin(3) | | — |
| | * |
| | — |
| | * |
| | 2,262,000 |
| | 8.4 | % | | * |
| | | | | | | | | | | | | | |
Scott Smith(1) | | — |
| | * |
| | 177,646,836 |
| | 87.6 | % | | — |
| | * |
| | 48.2 | % | | | | | | | | | | | | | | |
Murray Demo(4) | | — |
| | * |
| | — |
| | * |
| | 115,000 |
| | * |
| | * |
| | | | | | | | | | | | | | |
Jeffrey Lieberman(5) | | 58,416,380 |
| | 35.8 | % | | 287,956 |
| | * |
| | 1,491,625 |
| | 6.0 | % | | 16.0 | % | | | | | | | | | | | | | | |
R. Bryan Schreier(6) | | — |
| | * |
| | — |
| | * |
| | — |
| | * |
| | * |
| | | | | | | | | | | | | | |
Kimball Malone Scott(7) | | — |
| | * |
| | — |
| | * |
| | 380,000 |
| | 1.5 | % | | * |
| | | | | | | | | | | | | | |
Ryan Sweeney(8) | | 62,951,392 |
| | 38.6 | % | | 191,969 |
| | * |
| | 994,417 |
| | 4.0 | % | | 17.2 | % | | | | | | | | | | | | | | |
R. Duff Thompson(9) | | 2,600,000 |
| | 1.6 | % | | — |
| | * |
| | — |
| | * |
| | * |
| | | | | | | | | | | | | | |
All directors and executive officers as a group (12 persons)(10) | | 123,967,772 |
| | 75.9 | % | | 178,126,761 |
| | 87.8 | % | | 7,743,042 |
| | 26.6 | % | | 82.2 | % | | | | | | | | | | | | | | |
| 5% Stockholders: | | | | | | | | | | | | | | | | | | | | | | | | | | | | |
Grandview Holdings LLC(11) | | — |
| | * |
| | 177,646,836 |
| | 87.6 | % | | — |
| | * |
| | 48.2 | % | | | | | | | | | | | | | | |
Entities affiliated with Accel(8) | | 62,951,392 |
| | 38.6 | % | | 191,969 |
| | * |
| | 994,417 |
| | 4.0 | % | | 17.2 | % | | | | | | | | | | | | | | |
Entities affiliated with Insight Venture Partners(5) | | 58,416,380 |
| | 35.8 | % | | 287,956 |
| | * |
| | 1,491,625 |
| | 6.0 | % | | 16.0 | % | | | | | | | | | | | | | | |
Entities affiliated with Sequoia Capital(12) | | 39,304,745 |
| | 24.1 | % | | — |
| | * |
| | — |
| | * |
| | 10.7 | % | | | | | | | | | | | | | | |
____________________________________
*Represents beneficial ownership of less than one percent (1%).
† Percentage of the outstandingtotal voting power represents voting power with respect to all shares of our capital stock.
| |
(1) | Consists of 177,646,836 shares of Class A-2 common stock held by Grandview Holdings LLC. Ryan Smith, our Chief Executive Officer and one of our directors, Jared Smith, our President and one of our directors, and Scott Smith, one of our directors, are the managers of Grandview Holdings LLC and share voting and investment powers over such shares. The mailing address for Grandview Holdings LLC is P.O. Box 1224, Provo, Utah 84603. |
| |
(2) | Consists of (i) 257,500 shares of Class B common stock subject to outstanding options that are exercisable within 60 days of September 30, 2018 and (ii) RSUs for 412,500 shares of Class B common stock for which the service-based vesting condition would be satisfied within 60 days of September 30, 2018. |
| |
(3) | Mr. Serafin holds RSUs for 2,262,000 shares of Class B common stock for which the service-based vesting condition would be satisfied within 60 days of September 30, 2018. |
| |
(4) | Mr. Demo holds RSUs for 115,000 shares of Class B common stock for which the service-based vesting condition would be satisfied within 60 days of September 30, 2018. |
| |
(5) | Consists of (i) 15,751,510 shares of Class A-1 common stock, 43,377 shares of Class A-2Class A common stock and 224,697 shares of Class B common stock held by Insight Venture Partners VIII, L.P., (ii) 4,074,477 shares of Class A-1 common stock, 11,221 shares of Class A-2 common stock and 58,123 shares of Class B common stock held by Insight Venture Partners (Cayman) VIII, L.P., (iii) 4,995,912 shares of Class A-1 common stock, 13,758 shares of Class A-2 common stock and 71,268 shares of |
Class B common stock, held by Insight Venture Partners (Delaware) VIII, L.P., (iv) 562,163as a single class. The holders of our Class A common stock are entitled to one vote per share, and the holders of our Class B common stock are entitled to ten votes per share.
(1)Consists of (i) 6,000,000 shares of Class A-1A common stock 1,548held by Q II, LLC, an entity controlled by Mr. Smith, our Founder and Executive Chair, (ii) 238,677 shares of Class A-2A common stock held by Mr. Smith, and 8,020(iii) 162,163 shares of Class A common stock subject to RSUs held by Mr. Smith that have vested or will vest and that will settle within 60 days of October 1, 2021. The address for Q II, LLC is 105 South State Street #513, Orem, Utah 84058.
(2)Consists of (i) 79,190 shares of Class A common stock held by Mr. Serafin and (ii) 142,175 shares of Class A common stock subject to RSUs held by Mr. Serafin that have vested or will vest and that will settle within 60 days of October 1, 2021.
(3)Consists of (i) 73,269 shares of Class A common stock held by Mr. Thimsen and (ii) 2,085 shares of Class A common stock subject to RSUs held by Mr. Thimsen that have vested or will vest and that will settle within 60 days of October 1, 2021.
(4)Consists of (i) 64,345 shares of Class A common stock held by Mr. McMurray and (ii) 4,167 shares of Class A common stock subject to RSUs held by Mr. McMurray that have vested or will vest and that will settle within 60 days of October 1, 2021.
(5)Consists of (i) 6,520,394 shares of Class A common stock held of record by our current directors, executive officers, and entities affiliated with our directors and executive officers, and (ii) 321,325 shares of Class A common stock subject to RSUs held by our directors and executive officers that have vested or will vest and that will settle within 60 days of October 1, 2021.
(6)Consists of 423,170,610 shares of Class B common stock held by Insight Venture Partners VIII (Co-Investors)SAP America, Inc., L.P., (v) 4,713,042a wholly owned subsidiary of SAP SE. The address for SAP SE is Dietmar-Hopp-Allee 16, 69190 Walldorf, Federal Republic of Germany.
(7)Consists of (i) 22,518,484 shares of Class A-1 common stock, 91,292 shares of Class A-2 common stock and 472,895 shares of Class BA common stock held by Insight Venture Partners IX,SLP Quartz Aggregator, L.P., (vi) 2,341,792or SLP Quartz, (ii) 201,489 shares of Class A-1 common stock, 45,361 shares of Class A-2 common stock and 234,971 shares of Class BA common stock held by Insight VentureSilver Lake Partners (Cayman) IX,VI DE (AIV), L.P., (vii) 499,347or SLP VI, and (iii) 16,101 shares of Class A-1 common stock, 9,672 shares of Class A-2 common stock and 50,104 shares of Class BA common stock held by Insight Venture Partners (Delaware) IX,Silver Lake Technology Investors VI, L.P., (viii) 94,075 shares of Class A-1 common stock, 1,823 shares of Class A-2 common stock and 9,439 shares of Class B common stock held by Insight Venture Partners IX (Co-Investors), L.P., (ix) 14,726,240 shares of Class A-1 common stock, 40,554 shares of Class A-2 common stock and 210,072 shares of Class B common stock held by Insight Venture Partners Coinvestment Fund III, L.P., and (x) 10,657,822 shares of Class A-1 common stock, 29,350 shares of Class A-2 common stock and 152,036 shares of Class B common stock held by Insight Venture Partners Coinvestment Fund (Delaware) III, L.P.or SLTI VI. The general partner of Insight Venture Partners VIII, L.P.SLP Quartz is SLP VI Aggregator GP, L.L.C., Insight Venture Partners (Cayman) VIII, L.P., Insight Venture Partners (Delaware) VIII, L.P., and Insight Venture Partners VIII (Co-Investors), L.P. (collectively, “Fund VIII”) is Insight Venture Associates VIII, L.P.or Quartz GP. The general partner of Insight Ventureeach of SLP VI and SLTI VI and the managing member of Quartz GP is Silver Lake Technology Associates VIII,VI, L.P. is Insight Venture Associates VIII, Ltd., the sole shareholder of which is Insight Holdings Group, LLC.or SLTA. The general partner of Insight Venture Partners IX, L.P.SLTA is SLTA VI (GP), Insight Venture Partners (Cayman) IX, L.P.L.L.C., Insight Venture Partners (Delaware) IX, L.P., and Insight Venture Partners IX (Co-Investors), L.P. (collectively, “Fund IX”)or SLTA GP. The managing member of SLTA GP is Insight Venture Associates IX, L.P.Silver Lake Group, L.L.C. The general partner of Insight Venture Associates IX, L.P. is Insight Venture Associates IX, Ltd., the sole shareholder of which is Insight Holdings Group, LLC. The general partner of Insight Venture Partners Coinvestment Fund III, L.P. and Insight Venture Partners Coinvestment Fund (Delaware) III, L.P. (collectively, “Coinvestment Fund III”) is Insight Venture Associates Coinvestment III, L.P. The general partner of Insight Venture Associates Coinvestment III, L.P. is Insight Venture Associates Coinvestment III, Ltd., the sole shareholder of which is Insight Holdings Group, LLC. Jeffrey Horing, Deven Parekh, Peter Sobiloff, Michael Triplett, and Jeffrey Lieberman are the members of the board of managers of Insight Holdings Group, LLC and may be deemed to have shared voting and dispositive power over the shares held by Fund VIII, Fund IX and Coinvestment Fund III. The principal business address for alleach of these entities and individuals affiliated with Insight Venture Partners is c/o Insight Venture Partners, 1114 Avenue of the Americas, 36th Floor, New York, NY, 10036.
| |
(6) | Excludes the shares listed in footnote 12 below, which are held by entities affiliated with Sequoia Capital. |
| |
(7) | Ms. Scott holds RSUs for 380,000 shares of Class B common stock for which the service-based vesting condition would be satisfied within 60 days of September 30, 2018. |
| |
(8) | Consists of (i) 35,445,689 shares of Class A-1 common stock held by Accel Growth Fund II L.P. (“AGF2”), (ii) 2,566,486 shares of Class A-1 common stock held by Accel Growth Fund II Strategic Partners L.P. (“AGF2SP”), (iii) 3,449,622 shares of Class A-1 common stock held by Accel Growth Fund Investors 2012 L.L.C., (iv) 14,503,100 shares of Class A-1 common stock, 77,198 shares of Class A-2 common stock and 399,890 shares of Class B common stock held by Accel Growth Fund III L.P. (“AGF3”), (v) 684,701 shares of Class A-1 common stock, 3,643 shares of Class A-2 common stock and 18,879 shares of Class B common stock held by Accel Growth Fund III Strategic Partners L.P. (“AGF3SP”), (vi) 960,843 shares of Class A-1 common stock, 5,115 shares of Class A-2 Common Stock and 26,493 shares of Class B common stock held by Accel Growth Fund Investors 2014 L.L.C., (vii) 5,097,404 shares of Class A-1 common stock, 101,180 shares of Class A-2 common stock and 524,114 shares of Class B common stock held by Accel Leaders Fund L.P. (“ALF”), and (viii) 243,547 shares of Class A-1 common stock, 4,833 shares of Class A-2 common stock and 25,041 shares of Class B common stock held by Accel Leaders Fund Investors 2016 L.L.C. Accel Growth Fund II Associates L.L.C. (“AGF2A”) is the General Partner of AGF2 and has the sole voting and investment power. Andrew G. Braccia, Sameer K. Gandhi, Ping Li, Tracy L. Sedlock, Ryan J. Sweeney, and Richard P. Wong are the Managing Members of AGF2A and share such powers. AGF2A is the General Partner of AGF2SP and has the sole voting and investment power. Andrew G. Braccia, Sameer K. Gandhi, Ping Li, Tracy L. Sedlock, Ryan J. Sweeney, and Richard P. Wong are the Managing Members of AGF2A and share such powers. Andrew G. Braccia, Sameer K. Gandhi, Ping Li, Tracy L. Sedlock, Ryan J. Sweeney, and Richard P. Wong are the Managing Members of Accel Growth Fund Investors 2012 L.L.C. and therefore share the voting and investment powers. Accel Growth Fund III Associates L.L.C. (“AGF3A”) is the General Partner of AGF3 and has the sole voting and investment power. Andrew G. Braccia, Sameer K. Gandhi, Ping Li, Tracy L. Sedlock, Ryan J. Sweeney, and Richard P. Wong are the Managing Members of AGF3A and share such powers. AGF3A is the General Partner of AGF3SP and has the sole voting and investment power. Andrew G. Braccia, Sameer K. Gandhi, Ping Li, Tracy L. Sedlock, Ryan J. Sweeney, and Richard P. Wong are the Managing Members of AGF3A and share such powers. Andrew G. Braccia, Sameer K. Gandhi, Ping Li, Tracy L. Sedlock, Ryan J. Sweeney, and Richard P. Wong are the Managing Members of Accel Growth Fund Investors 2014 L.L.C. and therefore share the voting and investment powers. Accel Leaders Fund Associates L.L.C. (“ALFA”) is the General Partner of ALF and has the sole voting and investment power. Andrew G. Braccia, Sameer K. Gandhi, Ping Li, Tracy L. Sedlock, Ryan J. Sweeney, and Richard P. Wong are the Managing Members of ALFA and share such powers. Andrew G. Braccia, Sameer K. Gandhi, Ping Li, Tracy L. Sedlock, Ryan J. Sweeney, and Richard P. Wong are the Managing Members of Accel Leaders Fund Investors 2016 L.L.C. and therefore share the voting and investment powers. The address for these entities and individuals is 500 University Ave., Palo Alto, California 94301. |
| |
(9) | Consists of 2,600,000 shares of Class A-1 common stock held by S7 Investments, LLC (“S7”). R. Duff Thompson, one of our directors, and Sharleen Thompson are the managers of S7 and share voting and investment power over such shares. The address for S7 is 5255 N. Edgewood Drive, Suite 200, Provo, Utah, 84604. |
Silver Lake, 2775 Sand Hill Road, Suite 100, Menlo Park, CA 94025.
150
The following description summarizes certain important terms of our capital stock as they are expected to be in effect immediately prior to the completionand of this offering. We have adopted anour amended and restated certificate of incorporation and amended and restated bylaws that will become effective immediately prior to the completion of this offering, and this description summarizes the provisions that are expected to be included in such documents.bylaws. Because it is only a summary, it does not contain all the information that may be important to you. For a complete description of the matters set forth in this section titled “Description of Capital Stock,” you should refer to our amended and restated certificate of incorporation amended and restated bylaws, and amended and restated investors’ rights agreement,bylaws, which are included as exhibits to the registration statement of which this prospectus forms a part, and to the applicable provisions of Delaware law. Immediately following the completion of this offering, our
In connection with this offering, our legal counsel will opine that the shares of our Class BA common stock to be issued pursuant to this offering will be fully paid and non-assessable.
The provisions of Delaware law, our amended and restated certificate of incorporation and our amended and restated bylaws, which are summarized below, may have the effect of delaying, deferring or discouraging another person from acquiring control of our company. They are also designed, in part, to encourage persons seeking to acquire control of us to negotiate first with our board of directors. We believe that the benefits of increased protection of our potential ability to negotiate with an unfriendly or unsolicited acquirer outweigh the disadvantages of discouraging a proposal to acquire us because negotiation of these proposals could result in an improvement of their terms.
We will be governed by the provisions of Section 203 of the DGCL. In general, Section 203 prohibits a public Delaware corporation from engaging in a “business combination” with an “interested stockholder” for a period of three years after the date of the transaction in which the person became an interested stockholder, unless:
In general, Section 203 defines a “business combination” to include mergers, asset sales and other transactions resulting in financial benefit to a stockholder, and an “interested stockholder” as a person who, together with affiliates and associates, owns, or within three years did own, 15% or more of the corporation’s outstanding voting stock. These provisions may have the effect of delaying, deferring or preventing changes in control of our company.
Amended and Restated Certificate of Incorporation and Amended and Restated Bylaw Provisions
Our amended and restated certificate of incorporation and our amended and restated bylaws will include a number of provisions that could deter hostile takeovers or delay or prevent changes in control of our company, as well as changes in our board of directors or management team, including the following:
This will make it more difficult to change the composition of our board of directors and will promote continuity of management.
To be in proper written form, a stockholder’s notice must set forth as to each matter of business the stockholder intends to bring before our annual meeting of stockholders: (1) a brief description of the business intended to be brought before the annual meeting and the reasons for conducting such business at the annual meeting, (2) the name and address, as they appear on the Company’s books, of the stockholder proposing such business and any controlling stockholder or beneficial owner of stockholder’s shares, or a Stockholder Associated Person, (3) the class and number of our shares that are held of record or are beneficially owned by the stockholder or any Stockholder Associated Person and any derivative positions held or beneficially held by the stockholder or any Stockholder Associated Person, (4) whether and the extent to which any hedging or other transaction or series of transactions has been entered into by or on behalf of such stockholder or any Stockholder Associated Person with respect to our securities, and a description of any other agreement, arrangement or understanding the effect or intent of which is to mitigate loss to, or to manage the risk or benefit from share price changes for, or to increase or decrease the voting power of, such stockholder or any Stockholder Associated Person with respect to our securities, (5) any material interest of the stockholder or a Stockholder Associated Person in such business, and (6) a statement whether either such stockholder or any Stockholder Associated Person will deliver a proxy statement and form of proxy to holders of at least the percentage of the voting power of our voting shares required under applicable law to carry the proposal. In addition, to be in proper written form, a stockholder’s notice must be supplemented not later than ten days following the record date for the determination of stockholders entitled to notice of the meeting to disclose the information contained in clauses (3) and (4) above as of the record date.
to which the nominations are to be made by the stockholder or relating to the nominee’s potential service on the board of directors, (5) a written statement executed by the nominee acknowledging that, as a director of the Company, the nominee will owe a fiduciary duty under Delaware law with respect to the Company and its stockholders, and (6) any other information relating to the nominee that would be required to be disclosed about such nominee if proxies were being solicited for the election of the nominee as a director, or that is otherwise required, in each case pursuant to Regulation 14A under the Exchange Act (including without limitation the nominee’s written consent to being named in the proxy statement, if any, as a nominee and to serving as a director if elected). In addition, to be in proper written form, a stockholder’s notice must (i) provide, with respect to such stockholder, the information required to be provided pursuant to clauses (2) through (5) in the prior paragraph, and be supplemented not later than ten days following the record date for the determination of stockholders entitled to notice of the meeting to disclose the information contained in clauses (3) and (4) in the prior paragraph as of the record date (except that the references to “business” in such clauses shall instead refer to nominations of directors) and (ii) a statement whether either such stockholder will deliver a proxy statement and form of proxy to holders at least the percentage of the Company’s voting shares reasonably believed by such stockholder to be necessary to elect such nominee(s).
These provisions might preclude our stockholders from bringing matters before our annual meeting of stockholders or from making nominations for directors at our annual meeting of stockholders if the proper procedures are not followed. We expect that these provisions may also discourage or deter a potential acquirer from conducting a solicitation of proxies to elect the acquirer’s own slate of directors or otherwise attempting to obtain control of our company.
The foregoing provisions will make it more difficult for our existing stockholders, other than holders of our Class A-1 and A-2B common stock, to replace our board of directors, as well as for another party to obtain control of us by replacing our board of directors. Since our board of directors has the power to retain and discharge our officers, these provisions could also make it more difficult for existing stockholders, other than the holders of our Class A-1 and Class A-2B common stock, or another party to effect a change in management.
The restrictions described in the immediately preceding paragraph do not apply to our directors and executive officers and securityholdersSAP America with respect to, the (i) transfers of our common stockamong other things:
activities and may end any of these activities at any time.
The underwriters and their respective affiliates are full service financial institutions engaged in various activities, which may include securitiessales and trading, commercial and investment banking, financial advisory, investment management,
For the purposes of this provision, the expression an “offer to the public” in relation to anythe shares of our Class B common stock in any Relevant Member State means the communication in any form and by any means of sufficient information on the terms of the offer and any shares of our Class B common stock to be offered so as to enable an investor to decide to purchase or subscribe for any shares, of our Class B common stock, as the same may be varied in that Member
Securities legislation in certain provinces or territories of Canada may provide a purchaser with remedies for rescission or damages if this prospectus (including any amendment thereto) contains a misrepresentation, provided that the remedies for rescission or damages are exercised by the purchaser within the time limit prescribed by the securities legislation of the purchaser’s province or territory. The purchaser should refer to any applicable provisions of the securities legislation of the purchaser’s province or territory for particulars of these rights or consult with a legal advisor.
Pursuant to section 3A.3 of National Instrument 33-105 Underwriting Conflicts (NI 33-105), the underwriters are not required to comply with the disclosure requirements of NI 33-105 regarding underwriter conflicts of interest in connection with this offering.
No placement document, prospectus, product disclosure statement or other disclosure document has been lodged with the Australian Securities and Investments Commission, or ASIC, in relation to the offering. This prospectusoffering document does not constitute a prospectus, product disclosure statement or other disclosure document under the Corporations Act 2001, or the Corporations Act, and does not purport to include the information required for a prospectus, product disclosure statement or other disclosure document under the Corporations Act.
Any offer in Australia of the shares may only be made to persons, or the Exempt Investors, who are “sophisticated investors” (within the meaning of section 708(8) of the Corporations Act), “professional investors” (within the meaning of section 708(11) of the Corporations Act) or otherwise pursuant to one or more exemptions contained in section 708 of the Corporations Act so that it is lawful to offer the shares without disclosure to investors under Chapter 6D of the Corporations Act.
The shares applied for by Exempt Investors in Australia must not be offered for sale in Australia in the period of 12 months after the date of allotment under the offering, except in circumstances where disclosure to investors under Chapter 6D of the Corporations Act would not be required pursuant to an exemption under section 708 of the Corporations Act or otherwise or where the offer is pursuant to a disclosure document which complies with Chapter 6D of the Corporations Act. Any person acquiring shares must observe such Australian on-sale restrictions.