CALCULATION OF REGISTRATION FEE
Title of Each Class of | Amount to be | Proposed | Proposed | Amount of | ||||
Accumulation units in TIAA Real Estate Account | * | * | $4,000,000,000** | $122,800** | ||||
* | The securities are not issued in predetermined amounts or units, and the maximum aggregate offering price is estimated solely for purposes of determining the registration fee pursuant to Rule 457(o) under the Securities Act. |
** | In addition to the $4,000,000,000 of accumulation units registered hereunder, the registrant is carrying forward securities which remain unsold but which were previously registered under the Prior Registration Statements for which filing fees were previously paid. |
(1) | Previously paid. |
o ________The registrant hereby amends this registration statement on such date or dates as may be necessary to delay its effective date until the registrant shall file a further amendment which specifically states that this registration statement shall thereafter become effective in accordance with Section 8(a) of the Securities Act of 1933 or until the registration statement shall become effective on such date as the Securities and Exchange Commission, acting pursuant to Section 8(a), may determine.
PROSPECTUS
PROSPECTUS TIAA REAL ESTATE ACCOUNT A Tax-Deferred Variable Annuity Option Offered by Teachers Insurance and Annuity Association of America This prospectus tells you about the TIAA Real Estate Account, an investment option offered through individual and group variable annuity contracts issued by TIAA. Please read it carefully before investing and keep it for future reference. The Real Estate Account, which we refer to sometimes as “the Account” in this prospectus, invests primarily in real estate and real The Real Estate Account is designed as an option for retirement and tax-deferred savings plans for employees of nonprofit institutions. TIAA offers the Real Estate Account under the following annuity contracts: RA and GRAs (Retirement Annuities and Group Retirement Annuities) SRAs (Supplemental Retirement Annuities) GSRAs (Group Supplemental Retirement Annuities) Retirement Choice and Retirement Choice Plus Annuity GAs (Group Annuities) and Institutionally-Owned GSRAs Classic and Roth IRAs (Individual Retirement Annuities) including SEP IRAs (Simplified Employee Pension Plans) Keoghs ATRAs (After-Tax Retirement Annuities) Note that state regulatory approval may be pending for certain of these contracts and they may not currently be available in your state. The Securities and Exchange Commission (SEC) has not approved or disapproved these securities or passed upon the adequacy of the information in this prospectus. Any representation to the contrary is a criminal offense. An investment in the Real Estate Account is not a bank deposit and is not insured or guaranteed by the Federal Deposit Insurance Corporation or any other government agency. TABLE OF CONTENTS 2 3 4 4 5 8 11 17 21 34 35 Management’s Discussion and Analysis of Financial Condition and Results of Operations 36 52 54 57 58 59 64 68 73 74 80 82 82 82 83 84 85 86 212 214 Please see Appendix B for definitions of certain special terms used in this prospectus. The Real Estate Account securities offered by this prospectus are only being offered in those jurisdictions where it is legal to do so. No person may make any representation to you or give you any information about the offering that is not in the prospectus. If anyone provides you with information about the offering that is not in the prospectus, you shouldn’t rely on it. ABOUT THE REAL ESTATE ACCOUNT AND TIAA The TIAA Real Estate Account was established in February 1995 as a separate account of Teachers Insurance and Annuity Association of America (TIAA). TIAA is a life insurance company founded in 1918 by the Carnegie Foundation for the Advancement of Teaching. Its home office is at 730 Third Avenue, New York, NY 10017-3206 and its telephone number is More information about the Account may be obtained by writing us at 730 Third Avenue, New York, New York 10017-3206, calling us at 877 518-9161 or visiting our website at www.tiaa-cref.org. THE ACCOUNT’S INVESTMENT OBJECTIVE AND STRATEGY Investment Objective:The Real Estate Account seeks favorable long-term returns primarily through rental income and appreciation of real estate investments owned by the Account. The Account also will invest in publicly traded securities and other investments that are easily converted to cash to make redemptions, purchase or improve properties or cover other expenses. The Account will invest the remaining portion of its assets in government and corporate debt securities, money market instruments and, The amount the Account invests in real estate and real TIAA Real Estate AccountProspectus|3 As of that date, the Account also held investments in a mortgage loan receivable, representing 0.48% of Total Investments, real estate equity securities, representing 3.99% of Total Investments, commercial mortgage backed securities (CMBSs), representing 0.55% of Total Investments, real estate limited partnerships, representing The bar chart and performance table below helps illustrate some of the risks of investing in the Account, and how investment performance varies. The bar chart shows the Account’s total return over the last ten calendar years and the performance table shows the Account’s returns for the one-, three-, five- and 1 Year 5 Year 10 Years 3 Year 5 Year 10 Year 14.02% 8.68% 8.86% 14.04% 13.53% 10.22% 9.43% SUMMARY OF ACCOUNT’S EXPENSE DEDUCTIONS Deductions are made each valuation day from the net assets of the Account for various services required to manage investments, administer the Account and the contracts, and to cover certain risks borne by TIAA. The current annual expense deductions are: 4|ProspectusTIAA Real Estate Account Type of Expense Deduction Estimated Services Performed Investment Management For TIAA’s investment advice, portfolio accounting, custodial services, and similar services, including independent fiduciary and appraisal fees Administration For administrative services performed by TIAA-CREF Individual & Institutional Services, LLC (“Services”), such as allocating premiums and paying annuity income Distribution 0.080% For Services’ expenses related to distributing the annuity contracts Mortality and Expense Risk 0.050% For TIAA’s bearing certain mortality and expense risks Liquidity Guarantee For TIAA’s liquidity guarantee Total Annual Expense Deduction1,2 For total services to the Account 1 TIAA guarantees that the total annual expense deduction will not exceed 2 TIAA currently does not impose a fee on transfers from the Account, but reserves the right to impose a fee on transfers from the Account in the future. The following table shows you an example of the expenses you would incur on a hypothetical investment of $1,000 in the TIAA Real Estate Account over several periods. The table assumes a 5% annual return on 1 Year $ 8 3 Year $ 25 5 Years $ 43 10 Years $ 99 ABOUT THE ACCOUNT’S INVESTMENTS — IN GENERAL DIRECT INVESTMENTS IN REAL ESTATE TIAA Real Estate AccountProspectus|5 Purchase-Leaseback Transactions:Although it has not yet done so, the Account can enter into purchase-leaseback transactions (leasebacks) in which it typically will buy land and income-producing improvements on the land (such as buildings), and simultaneously lease the land and improvements to a third party (the lessee). Leasebacks are generally for very long terms. Usually, the lessee is responsible for operating the property and paying all operating costs, including taxes and mortgage debt. The Account can also give the lessee an option to buy the land and improvements. In some leasebacks, the Account may purchase only the land under an income-producing building and lease the land to the building owner. In those cases, the Account will often seek to share (or “participate”) in any increase in property value from building improvements or in the lessee’s revenues from the building above a base amount. The Account can invest in leasebacks that are subordinated to other interests in the land, buildings, and improvements (e.g., first mortgages); in that case, the leaseback interest will be subject to greater risks. INVESTMENTS IN MORTGAGES General:The Account can originate or acquire interests in mortgage loans, generally on the same types of properties it might otherwise buy. These mortgage loans may pay fixed or variable interest rates or have “participating” features (as described below). Normally the Account’s mortgage loans will be secured by properties that have income-producing potential. They usually will not be insured or guaranteed by the U.S. government, its agencies or anyone else. They usually will be non-recourse, which means they won’t be the borrower’s personal obligations. Most will be first mortgage loans on existing income-producing property, with first-priority liens on the property. These loans may be amortized (i.e., principal is paid over the course of the loan), or may provide for interest-only payments, with a balloon payment at maturity. Participating Mortgage Loans:The Account may make mortgage loans which permit the Account to share (have a “participation”) in the income from or appreciation of the underlying property. These participations let the Account receive additional interest, usually calculated as a percentage of the income the borrower receives from operating, selling or refinancing the property. The Account may also have an option to buy an interest in the property securing the participating loan. Managing Mortgage Loan Investments:TIAA can manage the Account’s mortgage loans in a variety of ways, including: • renegotiating and restructuring the terms of a mortgage loan • extending the maturity of any mortgage loan made by the Account • consenting to a sale of the property subject to a mortgage loan • financing the purchase of a property by making a new mortgage loan in connection with the sale • selling 6|ProspectusTIAA Real Estate Account OTHER REAL Real Estate Investment Trusts:The Account may invest in real estate investment trusts (REITs), which are publicly owned entities that lease, manage, acquire, hold mortgages on, and develop real estate. Normally the Account will buy the common or preferred stock of a REIT, although at times it may purchase REIT debt securities. REITs seek to maximize share value and increase cash flows by acquiring and developing new real estate projects, upgrading existing properties or renegotiating existing arrangements to increase rental rates and occupancy levels. REITs must distribute at least 90% of their taxable income to shareholders in order to benefit from a special tax structure, which means they may pay high dividends. The value of a particular REIT can be affected by such factors as cash flow, the skill of its management team, and defaults by its lessees or borrowers. Stock of Companies Involved in Real Estate Activities:The Account can invest in common or preferred stock of companies whose business involves real estate. These stocks may be listed on U.S. or foreign stock exchanges or traded over-the-counter in the U.S. or abroad.20062007
________________, 2007estate–relatedestate-related investments. TIAA, one of the largest and most experienced mortgage and real estate investors in the nation, manages the Account’s assets.estate–relatedestate-related investments, and the income generated by those investments. The Account’s returns could go down if, for example, real estate values or rental and occupancy rates decrease due to general economic conditions or a weak market for real estate generally. Property operating costs and government regulations, such as zoning or environmental laws, could also affect a property’s profitability. TIAA does not guarantee the investment performance of the Account, and you will bear the entire investment risk. For a detailed discussion of the specific risks of investing in the Account, see “Risks,” page 7.11.
We take deductions daily from the Account’s net assets for the Account’s operating and investment management expenses. The Account also pays TIAA for bearing mortality and expense risks and for providing a liquidity guarantee. The current estimated annual expense deductions from the Account’s net assets total 0.630%.§ n§ Retirement Select and Retirement Select Plus Annuity§ n§ n§ n§ n§ n§ n§ n

Below12368141730313244464951566064667173737474747576152154Please see Appendix B for definitions of certain special terms used in this prospectus.The Real Estate Account offered by this prospectus is(212)212 490-9000. In addition to issuing variable annuities, whose returns depend upon the performance of certain specified investments, TIAA also offers traditional fixed annuities.
With its 5060 years in the real estate business and interests in properties located across the U.S., and internationally, TIAA is one of the nation’s largest and most experienced investors in mortgages and real estate equity interests. As of December 31, 2005,2006, TIAA’s general account had a mortgage and real property portfolio of approximately $26$25.2 billion.2005,2006, TIAA’s assets were approximately $171.1$184 billion; the combined assets for TIAA and CREF totaled approximately $359.1$392 billion.
The Account offers individual and group accumulating annuity contracts (with contributions made on a pre-tax or after-tax basis), as well as individual lifetime and term-certain variable payout annuity contracts (including the payment of death benefits to beneficiaries). Investors are entitled to transfer funds to or from the Account under certain circumstances. Funds invested in the Account for each category of contract are expressed in terms of units, and unit values will fluctuate depending on the Account’s performance.
Investment Strategy:The Account seeksintends to invest between 7075 percent to 95and 90 percent of its assets directly in real estate or real estate–relatedestate-related investments. The Account’s principal strategy is to purchase direct ownership interests in income-producing real estate, such as office, industrial, retail, and multi-family residential properties. The Account can also invest in other real estate or real estate–relatedestate-related investments through joint ventures, real estate partnerships or real estate equity securities. To a limited extent, the Account can also invest in conventional mortgage loans, participating mortgage loans, common or preferred stock of companies whose operations involve real estate (i.e., that primarily own or manage real estate), and collateralized mortgage obligations, including commercial mortgage-backed securities.securities and other similar investments. The Account may also make foreign investments, which are expected to becomprise no more than 25 percent of the Account’s portfolio.total assets.other cash equivalents, and, at times, stock of companies that don’tdo not primarily own or manage real estate. In some circumstances, the Account can increase the portion of its assets invested in debt securities or money market instruments. This could happen if the Account receives a large inflow of money in a short period of time, there is a lack of attractive real estate investments available on the market, or the Account anticipates a need to have more cash available.estate–relatedestate-related investments at a given time will vary depending on market conditions and real estate prospects, among other factors. As of December 31, 2005,2006, the Account’s net assets totaled $14,132,692,512. At December 31, 2006, the Account ownedheld a total of 109121 real estate properties (including its interests in 12 real estate-related joint ventures), representing 80.10%80.03% of the Account’s total investment portfolio. Theportfolio (“Total Investments”).1.71%1.80% of the portfolio, real estate equity securities, representing 3.72% of the portfolio, commercial mortgage-backed securities (CMBS), representing 0.19% of the portfolio,Total Investments, commercial paper representing 11.67%10.79% of the portfolioTotal Investments, and government bonds representing 2.61%2.36% of the portfolio.Total Investments.
Risks:An investment in the Account is subject to the risks associated with real estate investing, including acquiring, owing and selling real property, interest rate risk, market risk, credit risk, and regulatory and environmental risks. Further risks include the risks associated with making mortgage loan investments and investing in mortgage-backed securities, liquid investments and foreign real estate investments. These risks, among others, are described in “Risks” beginning on page 7.11. You may lose money by investing in this Account.TIAA Real Estate Account Prospectus | 1ten- year period fromten-year periods through December 31, 2005.2006. How the Account has performed in the past is not necessarily an indication of how it will perform in the future.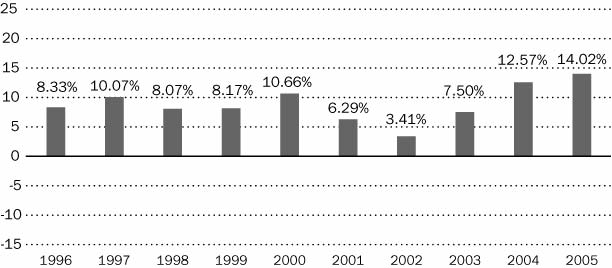

Average Annual Total Return (as of DecemberAVERAGE ANNUAL TOTAL RETURN (AS OF DECEMBER 31, 2005)2006)
Percent of Net
Assets Annually0.190%0.240%0.275%0.255%0.035%0.160%0.630%0.785%thean annual rate of 2.50% of average net assets.2934 for additional information.2 | Prospectus TIAA Real Estate Account Services are performed at cost by TIAA or subsidiaries of TIAA.TIAA perform these services at cost. Since expenses are charged at cost, the expenses described are estimates for the year based on projected expense and asset levels. Any differences between actual and estimated expenses are adjusted quarterly. The expenses identified in the table above do not include any fees which may be imposed by your employer under a plan maintained by your employer. For more detailed information, see “Expense Deductions” pages 49 and 50.on page 57.assets.assets and an annual expense deduction equal to 0.785%. Remember that these figures do not represent actual expenses or investment performance, which may differ.1 Year$63 Year$205 Years$3510 Years$79
Direct Purchase:The Account will generally buy direct ownership interests in existing or newly constructed income-producing properties, including office, industrial, retail, and multi-family residential properties. The Account will invest mainly in established properties with existing rent and expense schedules or in newly constructed properties with predictable cash flows or in which a seller agrees to provide certain minimum income levels. On occasion, the Account might invest in real estate development projects.TIAA Real Estate Account Prospectus | 3them,the mortgage loans, or portions of them, before maturity.maturityESTATE–RELATEDESTATE-RELATED INVESTMENTS4 | Prospectus TIAA Real Estate Account
Mortgage-Backed Securities:The Account can invest in mortgage-backed securities and other mortgage-related or asset-backed instruments, including commercial mortgage-backed securities (CMBSs), residential mortgage-backed securities, mortgage-backed securities issued or guaranteed by agencies or instrumentalities of the U.S. government, non-agency mortgage instruments, and collateralized mortgage obligations that are fully collateralized by a portfolio of mortgages or mortgage-related securities. Mortgage-backed securities are instruments that directly or indirectly represent a participation in, or are secured by and payable from, one or more mortgage loans secured by real estate. In most cases, mortgage-backed securities distribute principal and interest payments on the mortgages to investors. Interest rates on these instruments can be fixed or variable. Some classes of mortgage-backed securities may be entitled to receive mortgage prepayments before other classes do. Therefore, the prepayment risk for a particular instrument may be different than for other mortgage-related securities.
Investment Vehicles Involved in Real Estate Activities:The Account can hold interests in limited partnerships, funds, and other commingled investment vehicles involved in real estate–relatedestate-related activities, including owning, financing, managing, or developing real estate.
NON-REAL ESTATE-RELATED INVESTMENTS
The Account can also invest in:
|
|
|
|
| U.S. government or government agency securities |
| ||
|
| Money market instruments and other cash equivalents. These will usually be high-quality short-term debt instruments, including U.S. government or government agency securities, commercial paper, certificates of deposit, |
TIAA Real Estate AccountProspectus|7
bankers’ acceptances, repurchase agreements, interest-bearing time deposits, and corporate debt | ||
| ||
|
| Corporate debt or asset-backed securities of U.S. or foreign entities, or debt securities of foreign governments or multi-national organizations, but only if they’re investment-grade and rated in the top four categories by a nationally recognized rating organization (or, if not rated, deemed by TIAA to be of equal quality) |
| ||
|
| Common or preferred stock, or other ownership interests, of U.S. or foreign companies that aren’t involved in real estate, to a limited |
FOREIGN REAL ESTATE AND OTHER FOREIGN INVESTMENTS
The Account may invest in foreign real estate or real estate–relatedestate-related investments. It might also invest in securities or other instruments of foreign government or private issuers. While the percentage will vary, we expect that foreign investments will becomprise no more than 25 percent of the Account’s portfolio.total assets.
TIAA Real Estate Account Prospectus | 5
Depending on investment opportunities, the Account’s foreign investments could at times be concentrated in one or two foreign countries.
We will consider the special risks involved in foreign investing before investing in foreign real estate and won’t invest unless our standards are met.
GENERAL INVESTMENT AND OPERATING POLICIES
STANDARDS FOR REAL ESTATE INVESTMENTS
General Criteria for Buying Real Estate or Making Mortgage Loans:Before the Account purchases real estate or makes a mortgage loan, TIAA will consider such factors as:
|
|
|
| • | the location, condition, and use of the underlying property |
| ||
| • | its operating history, and its future income-producing capacity |
| ||
| • | the quality, operating experience, and creditworthiness of the borrower |
TIAA will analyze the fair market value of the underlying real estate, taking into account the property’s operating cash flow (based on the historical and projected levels of rental and occupancy rates and expenses), as well as the general economic conditions in the area where the property is located.
Diversification:We haven’t placed percentage limitations on the type and location of properties that the Account can buy. However, the Account seeks to diversify its investments by type of property and geographic location. How much the Account diversifies will depend upon whether suitable investments are available and how much the Account has available to invest.
Special Criteria for Making Mortgage Loans:Ordinarily, the Account will only make a mortgage loan if the loan, when added to any existing debt, will not exceed 85 percent of the appraised value of the mortgaged property when the loan is made, unless the Account is compensated for taking additional risk.
8|ProspectusTIAA Real Estate Account
Selling Real Estate Investments:The Account doesn’t intend to buy and sell its real estate investments simply to make short-term profits. ButRather, the Account may sellAccount’s general strategy in selling real estate investments if market conditions are favorableis to dispose of those assets which have either maximized in value, underperformed or to raise cash.represent properties needing significant capital infusions in the future. The Account will reinvest any sale proceeds that it doesn’t need to pay operating expenses or to meet redemption requests (e.g., cash withdrawals or transfers).
OTHER REAL ESTATE–RELATEDESTATE-RELATED POLICIES
6 | Prospectus TIAA Real Estate Account
Borrowing:The Account may borrow money and assume or obtain a mortgage on a property —i.e., make leveraged real estate investments. In addition, to meet short-term cash needs, the Account may obtain a line of credit with terms requiring that the Account secure a loan with one or more of its properties. The Account’s total borrowings may not exceed 20%30% of the Account’s total net asset value.value at the time of incurrence. (In calculating the 20%30% limit, we will include only the Account’s actual percentage interest in any borrowings and not that of any joint venture partner.) The Account may only borrow up to 70% of the then current value of a property, although construction loans may be for 100% of costs incurred in developing the property. Except for construction loans, any mortgage loans on a property will be non-recourse, meaning that if the Account defaults on its loan, the lender will have recourse only to the property encumbered or the joint venture owning the property, and not to any other assets of the Account. When possible, the Account will seek to have loans mature at different times to limit the risks of borrowing.
The Account will not obtain mortgage financing from TIAA or any of its affiliates. However, the Account may place aan intra-company mortgage on an Account property held by a subsidiary for tax planning or other purposes. This type of mortgage will not be subject to the general limitations on borrowing described above.
When the Account assumes or obtains a mortgage on a property, it will bear the expense of mortgage payments. It will also be exposed to certain additional risks, which are described in “Risks of Borrowing” on page 9.
12.
Joint Investments:The Account can hold property jointly through general or limited partnerships, joint ventures, leaseholds, tenancies-in-common, or other
TIAA Real Estate AccountProspectus|9
legal arrangements. However, the Account will not hold real property jointly with TIAA or its affiliates.
Discretion to Evict or Foreclose:TIAA may, in its discretion, evict defaulting tenants or foreclose on defaulting borrowers to maintain the value of an investment, when it decides that it’sit is in the Account’s best interests.
Property Management and Leasing Services:The Account usually will hire a local management company to perform the day-to-day management services for the Account’s properties, including supervising any on-site personnel, negotiating maintenance and service contracts, and providing advice on major repairs and capital improvements. The local manager will also recommend changes in rent schedules and create marketing and advertising programs to attain and maintain good occupancy rates by responsible tenants. The Account may also hire leasing companies to perform or coordinate leasing and marketing services to fill any vacancies. The fees paid to the local management company, along with any leasing commissions and expenses, will reduce the Account’s cash flow from a property.
Insurance:We will try to arrange for, or require proof of, comprehensive insurance, including liability, fire, and extended coverage, for the Account’s real property and properties securing mortgage loans or subject to purchase-leaseback transactions. The Account’s insurance policies on its properties currently include some coverage for earthquakes and terrorist acts, but we can’t assure you that it will be adequate to
TIAA Real Estate Account Prospectus | 7
cover all losses. We also can’t assure you that we will be able to obtain coverage for earthquakes and terrorist acts at an acceptable cost, if at all, when the current policy expires.
OTHER POLICIES
Liquid Assets:At times, a significant percentage of the Account may be invested in liquid assets (which may or may not be real estate–related)estate-related) while we look for suitable real property investments. The Account can temporarily increase the percentage of its liquid assets under some circumstances, including the rapid inflow of participants’ funds, lack of suitable real estate investments, or a need for greater liquidity.
Investment Company Act of 1940:We intend to operate the Account so that it will not have to register as an “investment company” under the Investment Company Act of 1940 (the 1940 Act). This will require monitoring the Account’s portfolio so that it won’t have more than 40 percent of total assets, other than U.S. government securities and cash items, in investment securities. As a result, the Account may be unable to make some potentially profitable investments.investments, it may be unable to sell assets it would otherwise want to sell or it may be forced to sell investments in investment securities before it would otherwise want to do so.
Changing Operating Policies or Winding Down:Under the terms of the contracts and in accordance with applicable insurance law, TIAA can decide to change, in its sole discretion, the operating policies of the Account or wind it down. If the Account is wound down, you may need to transfer your accumulations or annuity income to TIAA’s traditional annuity or any CREF account available under
10|ProspectusTIAA Real Estate Account
your employer’s plan. YouAll investors in the Account will be notified in advance if we decide to change a significant policy or wind down the Account.
The value of your investment in the Account will go up and down based on the value of the Account’s assets and the income the assets generate.The potential risk of investing in the Account is moderate. You can lose money by investing in the Account. The Account’s assets and income (particularly its real estate assets and rental income) can be affected by many factors, and you should consider the specific risks presented below before investing in the Account. Please refer to the section entitled “Statements Regarding Forward-Looking Information,” which is contained in the section entitled “Management’s Discussion and Analysis of Financial Condition and Results of Operations.”
RISKS OF REAL ESTATE INVESTING
General Risks of Acquiring and Owning Real Property:The Account will beis subject to the risks inherent in acquiring and owning real property, including:
• | Competition for real estate investments and any resulting delays in the acquisition of investments may increase the Account’s costs or otherwise adversely affect the Account’s investment results. | |
|
|
|
| • | The Account’s property values or rental and occupancy rates could go down due to general global economic conditions, a weak market for real estate generally or in specific locations, changing supply and demand for certain types of properties, |
| ||
| • | A property may be unable to attract and retain tenants, which means that rental income would decline. This situation could be exacerbated if a concentration of lease expirations occurred during any one period. |
8 | Prospectus TIAA Real Estate Account
|
|
|
| • | The Account could lose revenue if tenants |
| ||
| • | A property’s profitability could go down if operating costs, such as property taxes, utilities, maintenance and insurance costs, not reimbursed by tenants, go up in relation to gross rental income, or if the property needs unanticipated repairs and renovations. |
• | The Account may experience periods in which its investments are geographically concentrated, either regionally or in certain markets with similar demographics. In this event, the Account’s income and performance may be adversely impacted disproportionately by economic conditions in those areas in which the Account’s investments are geographically concentrated. |
General Risks of Selling Real Estate Investments:Among the risks of selling real estate investments are:
TIAA Real Estate AccountProspectus|11
|
|
|
| • | The sale price of an Account property might differ from its estimated or appraised value, leading to losses or reduced profits to the Account. |
| ||
| • | Because of the nature of real estate, the Account might not be able to sell a property at a particular time for its full value, particularly in a poor market. This might make it difficult to raise cash quickly and also could lead to Account losses. |
| ||
| • | The Account may need to provide financing to a purchaser if no cash buyers are available. |
Appraisal Risks:Real estate appraisals are only estimates of property values based on a professional’s opinion and may not be accurate predictors of the amount the Account would actually receive if it sold a property. If an appraisal is too high, the Account’s value could go down upon reappraisal or if the property is sold for a lower price than the appraisal. If appraisals are too low, those who redeem prior to an adjustment to the valuation or a property sale will have received less than their pro rata share of the value of the Account’s assets. Further, the Account generally obtains appraisals only on a quarterly basis, and there will be circumstances in the interim in which the true value of a property is not reflected in the Account’s daily net asset value calculation.
Risks of Borrowing:The Account may borrow, in the aggregate, either directly or through its joint venture investments, an amount up to 30% of the Account’s Total Net Assets, and the Account may borrow up to 70% of the then-current value of a particular property. Among the risks of borrowing money and investing in a property subject to a mortgage are:
|
|
|
| • | The Account may not be able to make its loan payments, which could result in a default on its loan. The lender then could foreclose on the underlying property and the Account would lose the value of its investment in the foreclosed property. |
| ||
| • | If the Account obtains a mortgage loan that involves a balloon payment, there is a risk that the Account may not be able to make the lump sum principal payment due under the loan at the end of the loan term, or otherwise obtain adequate refinancing. The Account then may be forced to sell the property or other properties under unfavorable market conditions or default on its mortgage. |
| ||
| • | If the Account takes out variable-rate loans, the Account’s returns may be volatile when interest rates are volatile. Further, to the extent that the Account takes out fixed-rate loans and interest rates subsequently decline, this may cause the Account to pay interest at above-market rates for a significant period of time. |
• | The market valuation of mortgage loans payable could have an adverse impact on the Account’s performance. |
Regulatory Risks:Government regulation at the federal, state and local levels, including, without limitation, zoning laws, property taxes, and fiscal, accounting, environmental or other government policies, could operate or change in a way that hurts the Account and its properties. For example, these regulations could raise
12|ProspectusTIAA Real Estate Account
the cost of owning, andimproving or maintaining properties, present barriers to otherwise desirable investment opportunities or make it harder to sell, rent, finance, or refinance properties either on economically desirable terms, or at all, due to the increased costs associated with regulatory compliance.
Environmental Risks:The Account may be liable for damage to the environment caused by hazardous substances used or found on its properties. Under various environmental regulations, the Account may also be liable, as a current or previous property owner or mortgagee, for the cost of removing or cleaning up hazardous substances found on a property, even if it didn’t know of and wasn’t responsible for the hazardous substances. If any hazardous substances are present or the Account doesn’t properly clean up any hazardous substances, or if the
TIAA Real Estate Account Prospectus | 9
Account fails to comply with regulations requiring it to actively monitor the business activities on its premises, the Account may have difficulty selling or renting a property or be liable for monetary penalties. The cost of any required cleanup and the Account’s potential liability for environmental damage, including performance under indemnification obligations to third parties, to a single real estate investment could exceed the value of the Account’s investment in a property, the property’s value, or in an extreme case, a significant portion of the Account’s assets.
Uninsurable Losses:Certain catastrophic losses (e.g., from earthquakes, wars, terrorist acts, nuclear accidents, floods, or environmental or industrial hazards or accidents) aremay be uninsurable or so expensive to insure against that it doesn’t make senseis economically disadvantageous to buy insurance for them. If a disaster that we haven’t insured against occurs, or if the insurance contains a high deductible, the Account could lose both its original investment and any future profits from the property affected. In addition, some leases may permit a tenant to terminate its obligations in certain situations, regardless of whether those events are fully covered by insurance. In that case, the Account would not receive rental income from the property while that tenant’s space is vacant.
Risks of Developing Real Estate or Buying Recently Constructed Properties:If the Account chooses to develop a property or buys a recently constructed property, it may face the following risks:
|
|
|
| • | In developing real estate, there may be delays or unexpected increases in the cost of property development and construction due to strikes, bad weather, material shortages, increases in material and labor costs, or other events. |
| ||
| • | Because external factors may have changed from when the project was originally conceived (e.g., slower growth in local economy, higher interest rates, or overbuilding in the area), the property, if purchased when unleased, may not operate at the income and expense levels first projected or may not be developed in the way originally planned. |
|
|
Risks of Joint Ownership:Investing in joint venture partnerships or other forms of joint property ownership may involve special risks.
|
|
|
| • | The co-venturer may have interests or goals inconsistent with those of the Account. |
TIAA Real Estate AccountProspectus|13
| ||
| • | If a co-venturer doesn’t follow the Account’s instructions or adhere to the Account’s policies, the |
• | The Account may have limited rights pursuant to the terms of the joint venture, including the right to operate, manage or dispose of a property. | |
| ||
| • | A co-venturer can make it harder for the Account to transfer its property interest, particularly if the co-venturer has the right to decide whether and when to sell the property. |
| ||
| • | The co-venturer may become insolvent or bankrupt, which could expose the Account to greater liabilities than expected. |
10 | Prospectus TIAA Real Estate Account
Risks with Purchase-Leaseback Transactions:The major risk of purchase-leasebackpurchase leaseback transactions is that the third party lessee will not be able to make required payments to the Account. If the leaseback interest is subordinate to other interests in the real property, such as a first mortgage or other lien, the risk to the Account increases because the lessee may have to pay the senior lienholder to prevent foreclosure before it pays the Account. If the lessee defaults or the leaseback is terminated prematurely, the Account might not recover its investment unless the property is sold or leased on favorable terms.
Appraisal Risks:Real estate appraisals are only estimates of property values based on a professional’s opinion and may not be accurate predictors of the amount the Account would actually receive if it sold a property. If an appraisal is too high, the Account’s value could go down upon reappraisal or if the property is sold for a lower price than the appraisal. If appraisals are too low, those who redeem prior to an adjustment to the valuation or a property sale will have received less than the true value of the Account’s assets.
RISKS OF MAKING MORTGAGE LOAN INVESTMENTS
General Risks of Mortgage Loans:The Account will be subject to the risks inherent in making mortgage loans, including:
|
|
|
| • | The borrower may default, requiring that the Account foreclose on the underlying property to protect the value of its mortgage loan. Since its mortgage loans are usually non-recourse, the Account must rely solely on the value of a property for its security. |
• | The larger the mortgage loan compared to the value of the property securing it, the greater the loan’s risk. Upon default, the Account may not be able to sell the property for its estimated or appraised value. Also, certain liens on the property, such as mechanic’s or tax liens, may have priority over the Account’s security interest. | |
|
|
|
| • | A deterioration in the financial condition of tenants, or the bankruptcy or insolvency of a major tenant, may adversely affect the income of a property, which could increase the likelihood that the borrower will default under its obligations. |
|
|
|
| • | The borrower may not be able to make a lump sum principal payment due under a mortgage loan at the end of the loan term, unless it can refinance the mortgage loan with another lender. |
|
|
|
| • | If interest rates are volatile during the loan period, the Account’s variable-rate mortgage loans could have volatile yields. Further, to the extent the Account makes mortgage loans with fixed interest rates, it may receive lower |
Prepayment Risks:The Account’s mortgage loan investments will usually be subject to the risk that the borrower repays the loan early. Prepayments can change the Account’s return because we may be unable to reinvest the proceeds at as high an interest rate as the original mortgage loan rate.14|
ProspectusTIAA Real Estate Account Prospectus | 11
• | Prepayment Risks:The Account’s mortgage loan investments will usually be subject to the risk that the borrower repays a loan early. Also, we may be unable to reinvest the proceeds at as high an interest rate as the original mortgage loan rate. |
• | Interest Limitations:The interest rate we charge on mortgage loans may inadvertently violate state usury laws that limit rates, if, for example, state law changes during the loan term. If this happens, we could incur penalties or may not be able to enforce payment of the loan. |
• |
Risks of Participations:Participating mortgages are subject to the following additional risks: |
|
|
|
| • | The participation |
|
|
|
| • | In very limited circumstances, a court could possibly characterize the Account’s participation interest as a partnership or joint venture with the borrower and the Account could lose the priority of its security interest, or be liable for the borrower’s debts. |
RISKS OF REIT INVESTMENTSINVESTING IN REAL ESTATE INVESTMENT TRUST (“REIT”) SECURITIES
REITs Investments in REIT securities are subject to many of the same general risks associated with direct real property ownership. In particular, equity REITs may be affected by changes in the value of the underlying property owned by the trust, while mortgage REITs may be affected by the quality of any credit extended. In addition to these risks, because REIT investments are securities, they may be exposed to market risk, — price volatility due to changing conditions in the financial markets and, in particular, changes in overall interest rates.
In addition, REITs are tax regulated entities established to invest in real estate–relatedestate-related assets. REITs do not pay federal income taxes if they distribute most of their earnings to their shareholders and meet other tax requirements. As a result, REITs are subject to tax risk in continuing to qualify as a REIT.
RISKS OF MORTGAGE-BACKED SECURITIES
Mortgage-backed securities are subject to many of the same general risks inherent in real estate investing, making mortgage loans and investing in debt securities. In particular, these types of investments may be subject to prepayment risk —or extension risk (i.e., the risk that borrowers will repay the loans early.earlier or later than anticipated). If the underlying mortgage assets experience greaterfaster than anticipated paymentsprepayments of principal, the Account could fail to recoup some or all of its initial investment in these securities, since the original price paid by the Account iswas based in part on assumptions regarding the receipt of interest payments. If the underlying mortgage assets are repaid later than anticipated, the Account could lose the opportunity to reinvest the anticipated cash flows at a time when interest rates might be rising. The rate of prepayments depends on a variety
TIAA Real Estate AccountProspectus|15
of geographic, social and other functions, including prevailing market interest rates and general economic factors.
The market value of these securities is also highly sensitive to changes in interest rates. Note that the potential for appreciation, which could otherwise be expected to result from a decline in interest rates, may be limited by any increased prepayments.
These Further, these securities may be harder to sell than other securities.
12 | Prospectus TIAA Real Estate Account
RISKS OF LIQUID INVESTMENTS
The Account’s investments in marketable securities and other liquid investments may bemortgage loans receivable are subject to:to the following general risks:
|
|
|
| • |
|
|
|
|
| • |
|
|
|
|
| • | Interest Rate Volatility— The risk that interest rate volatility |
RISKS OF FOREIGN INVESTMENTS
In addition to other investment risks noted above, foreign investments present the following special risks:
|
|
|
| • | Foreign real estate markets may have different liquidity and volatility attributes than U.S. markets. |
|
|
|
| • | The value of foreign investments or rental income can go up or down |
|
|
|
| • | The Account may, |
|
|
|
| • | It may be more difficult to obtain and collect a judgment on foreign investments than on domestic ones. |
NO OPPORTUNITY FOR PRIOR REVIEW OF PURCHASE
You won’tInvestors do not have the opportunity to evaluate the economic merit of the purchase of a property purchaseor other investment before the Account completes the purchase, so youinvestors will need to rely solely on TIAA’s judgment and ability to select investments consistent with the Account’s investment objective and policies. Further, the Account may change its investment objective and pursue specific investments without the consent of the Account’s investors.
16|ProspectusTIAA Real Estate Account Prospectus | 13
RISKS OF REGISTRATION UNDER THE INVESTMENT COMPANY ACT OF 1940
The Account has not registered, and management intends to continue to operate the Account so that it will not have to register, as an “investment company” under the Investment Company Act of 1940, as amended (the “Investment Company Act”). Generally, a company is an “investment company” and required to register under the Investment Company Act if, among other things, it holds itself out as being engaged primarily, or proposes to engage primarily, in the business of investing, reinvesting or trading in securities, or it is engaged or proposes to engage in the business of investing, reinvesting, owning, holding or trading in securities and owns or proposes to acquire investment securities having a value exceeding 40% of the value of such company’s total assets (exclusive of government securities and cash items) on an unconsolidated basis.
If the Account were obligated to register as an investment company, the Account would have to comply with a variety of substantive requirements under the Investment Company Act that impose, among other things, limitations on capital structure, restrictions on certain investments, compliance with reporting, record keeping, voting and proxy disclosure requirements and other rules and regulations that could significantly increase its operating expenses and reduce its operating flexibility. To maintain compliance with the exemptions from the Investment Company Act, the Account may be unable to sell assets it would otherwise want to sell and may be unable to purchase securities it would otherwise want to purchase, which might materially adversely impact the Account’s performance.
ESTABLISHING AND MANAGING THE ACCOUNT —THE ROLE OF TIAA
ESTABLISHING THE ACCOUNT
TIAA’s Board of Trustees established the Real Estate Account as a separate account of TIAA under New York law on February 22, 1995. The Account is regulated by the State of New York Insurance Department (NYID) and the insurance departments of some other jurisdictions in which the annuity contracts are offered. Although TIAA owns the assets of the Real Estate Account, and the Account’s obligations are obligations of TIAA, the Account’s income, investment gains, and investment losses are credited to or charged against the assets of the Account without regard to TIAA’s other income, gains, or losses. Under New York insurance law, we can’t charge the Account with liabilities incurred by any other TIAA business activities or any other TIAA separate account.
MANAGING THE ACCOUNT
TIAA employees, under the direction and control of TIAA’s Board of Trustees and its Investment Committee, manage the investment of the Account’s assets,
TIAA Real Estate AccountProspectus|17
following investment management procedures TIAA adopted for the Account. TIAA’s investment management responsibilities include:
|
|
|
| • | identifying, recommending and purchasing appropriate real |
|
|
|
| • | providing all portfolio accounting, custodial, and related services for the Account |
|
|
|
| • | arranging for others to provide certain advisory or other management services to the Account’s joint ventures or other investments |
TIAA provides all services to the Account at cost. For more about the charge for investment management services, see “Expense Deductions” on page 49.57.
You don’t have the right to vote for TIAA Trustees directly. See “Voting Rights” on page 72.80. For information about the Trustees, and principal executive officers of TIAA and the Account’s portfolio managment team, see Appendix A of this prospectus.prospectus on page 212.
TIAA’s ERISA Fiduciary Status.To the extent that assets of a plan subject to the Employee Retirement Income Security Act of 1974, as amended (ERISA) are allocated to the Account, TIAA will be acting as an “investment manager” and a fiduciary under ERISA with respect to those assets.
LIQUIDITY GUARANTEE
TIAA provides the Account with a liquidity guarantee —i.e., TIAA ensures that the Account has funds available to meet participant transfer or cash withdrawal requests. If the Account can’t fund participant requests from the Account, TIAA’s general account will fund them by purchasing Account accumulation units (liquidity units). TIAA guarantees that you can redeem your accumulation units at their accumulation unit value next determined. Importantly, however, this liquidity guarantee is not a guarantee of the investment performance of the Account or a guarantee of the value of your units. Of course, you can make a cash withdrawal only if allowed
14 | Prospectus TIAA Real Estate Account
by the terms of your plan. The Account pays TIAA for the liquidity guarantee through a daily deduction from net assets. See “Expense Deductions,”Deductions” on page 49.57.
An independent fiduciary (described below) monitors the Account to ensure, among other things, that TIAA does not own too much of the Account and may require TIAA to redeem some of its liquidity units, particularly when the Account has uninvested cash or liquid investments available. The independent fiduciary may also propose properties for the Account to sell so that TIAA can redeem liquidity units. TIAA does not currently own liquidity units.
CONFLICTS OF INTEREST
TIAA does not accept acquisition or placement fees for the services it provides to the Account. Employees of TIAA may also provide investment advice with respect to investments managed by Teachers Advisors, Inc. (“Advisors”), an indirect, wholly owned subsidiary of TIAA. In addition, TIAA and its affiliates may
18|ProspectusTIAA Real Estate Account
offer other investment products that are not managed under an “at cost” expense structure. Therefore, TIAA may at times face various conflicts of interest.
For example, TIAA’s general account and the TIAA-CREF Asset Management Core Property Fund LP,L.P. (the “Core Property Fund”), which is managed by Advisors, may sometimes compete with the Real Estate Account in the purchase or sale of investments. (Each of TIAA’s general accounts, the Real Estate Account and the Core Property Fund, together with any other real estate accounts or funds that may be established by TIAA in the future, are herein referred to as an “account.”) AGenerally, the portfiolio managers for each of the accounts will identify opportunities which conform to the investment strategy of the account. If more than one account expresses an interest and an informal resolution cannot be reached, a special TIAA Allocation Committee, consisting primarily of senior TIAA real estate professionals, will seek to resolve any conflict by considering which account has the relative cash available as a percentagenumber of the account’s total gross value to make the purchase, the effect the purchase or sale will have on the diversification of each account’s portfolio,factors, including the investment strategy fitof the bidding account, the capital available for investment by each account, liquidity requirements, portfolio diversification, whether the property would be at a particularcompetitive disadvantage to properties owned by another account in the subject market and such other factors deemed relevant legal or investment policy factors.by the Allocation Committee. If this analysis does not clearly determine, by a unanimous vote of the Allocation Committee, which account should participate in a transaction, a strict rotation system will be used whereby the interested account highest on the list will be allowed to participate in the transaction, and then such account will drop to the bottom of the list thereafter.
Conflicts could also arise because some properties in TIAA’s general account and the Core Property Fund may compete for tenants with the Real Estate Account’s properties. We will seek to resolve this conflict by determining the tenant’s preference between the two properties, how much the tenant is willing to pay for rent, and which property can best afford to pay any required costs associated with such leasing. Finally, conflicts could potentially arise when two TIAA accounts attempt to sell properties located in the same market or submarket, especially if there are a limited number of potential purchasers.
Many of the personnel of TIAA involved in performing services to the Real Estate Account will have competing demands on their time. The personnel will devote such time to the affairs of the Account as TIAA’s management determines, in its sole discretion exercising good faith, is necessary to properly service the Account. TIAA believes that it has sufficient personnel to discharge its responsibility to the Real Estate Account, the general account, and the Core Property Fund and to avoid conflicts of interest. TIAA or its affiliates may form other real estate investment vehicles in the future and we will take steps to assure that those vehicles are integrated into these conflict of interest policies.
TIAA Real Estate Account Prospectus | 15
INDEMNIFICATION
The Account has agreed to indemnify TIAA and its affiliates, including its officers and directors,trustees, against certain liabilities including, to the extent permitted by law,
TIAA Real Estate AccountProspectus|19
including liabilities under the Securities Act of 1933. The Account may make such indemnification out of its assets.
ROLE OF THE INDEPENDENT FIDUCIARY
Because TIAA’s ability to purchase and sell liquidity units raises certain technical issues under ERISA, TIAA applied for and received a prohibited transaction exemption from the U.S. Department of Labor (PTE 96-76). In connection with the exemption, TIAA has appointed an independent fiduciary for the Real Estate Account, with overall responsibility for reviewing Account transactions to determine whether they are in accordance with the Account’s investment guidelines.
Real Estate Research Corporation, a real estate consulting firm whose principal offices are located in Chicago, Illinois, currently serves as the Account’s independent fiduciary. The independent fiduciary’s responsibilities include:
|
|
|
| • | reviewing and approving the Account’s investment guidelines and monitoring whether the Account’s investments comply with those guidelines |
|
|
|
| • | reviewing and approving valuation procedures for the Account’s |
|
|
|
| • | approving adjustments to any property valuations that change the value of the property or the Account as a whole above or below certain prescribed levels, or that are made within three months of the annual independent appraisal |
|
|
|
| • | reviewing and approving how the Account values accumulation and annuity units |
|
|
|
| • | approving the appointment of all independent appraisers |
|
|
|
| • | reviewing the purchase and sale of units by TIAA to ensure that the Account uses the correct unit values |
|
|
|
| • | requiring appraisals besides those normally conducted, if the independent fiduciary believes that any of the properties have changed materially, or that an additional appraisal is necessary to assure the Account has correctly valued a property |
The independent fiduciary also must monitor TIAA’s ownership in the Account and supervise any winding down of the Account’s operations. Its responsibilities include:
|
|
|
| • | calculating the percentage of total accumulation units that TIAA’s ownership shouldn’t exceed (the trigger point) and creating a method for changing the trigger point |
|
|
|
| • | approving any adjustment of TIAA’s interest in the Account and requiring an adjustment if TIAA’s investment reaches the trigger point |
|
|
|
| • | participating in any program to reduce TIAA’s ownership in the Account or to facilitate winding down the Account, including selecting properties for sale, |
16 | Prospectus TIAA Real Estate Account
providing sales guidelines, and approving those sales that, in the independent fiduciary’s opinion, are desirable |
20|ProspectusTIAA Real Estate Account
A special subcommittee of the Investment Committee of TIAA’s Board of Trustees appointed Real Estate Research Corporation as the independent fiduciary for a three-year term, starting March 1, 2006. This subcommittee may renew the independent fiduciary appointment, remove the independent fiduciary, or appoint its successor. The independent fiduciary can be removed for cause by the vote of a majority of subcommittee members and will not be reappointed if 40 percent of the subcommittee members disapprove the reappointment. It can resign after at least 180 days’ written notice.
TIAA pays the independent fiduciary directly. The investment management charge paid to TIAA includes TIAA’s costs for retaining the independent fiduciary. The independent fiduciary will receive less than 5 percent of its annual income (including payment for its services to the Account) from TIAA.TIAA and its affiliates.
When you decide as a participant or plan fiduciary to invest in the Account, after TIAA has provided you with full and fair disclosure including the disclosure in this prospectus, you are also acknowledging that you approve and accept Real Estate Research Corporation or any successor to serve as the Account’s independent fiduciary.
THE PROPERTIES — IN GENERAL
As of December 31, 2005,2006, the Account owned a total of 109121 real estate properties, whose value on that date represented approximately 80.10%property investments (109 of which were wholly owned and 12 of which were held in joint ventures) representing 80.03% of the Account’s total investment portfolio (eleven of which are held in joint ventures). Thisportfolio. The real estate portfolio includes 45included 49 office properties (six of which arewere held in joint ventures)ventures and one located in London, England), 3035 industrial properties (including one held in a joint venture), 2423 apartment complexes, 913 retail properties (including threefour held in joint ventures), and a 75% unconsolidated joint venture partnership interest in a portfolio of storage facilities. Of the 121 real estate property investments, only 18 were subject to debt.
In the table beginning on the next page you will find general information about each of the Account’s portfolio propertiesproperty investments as of December 31, 2005.2006. The Account’s property investments includee both properties that are wholly owned by the Account and properties owned by the Account’s joint venture investments. Certain property investments are comprised of a portfolio of properties.
TIAA Real Estate AccountProspectus|| 1721
Properties
|
|
|
|
|
|
|
|
|
|
|
|
|
|
|
|
|
|
|
|
|
|
|
|
|
|
|
|
|
|
|
|
|
|
|
|
Property |
| Location |
| Year Built |
| Year |
| Rentable | (1) | Percent |
| Annual Avg. | (2) | Market Value | (3) | ||||||||||||||||||||
Property |
| Location |
| Year Built |
| Year |
| Rentable | (1) | Percent |
| Annual Avg. | (2) |
| Market | (3) | |||||||||||||||||||
OFFICE PROPERTIES |
|
|
|
|
|
|
|
|
|
|
|
|
| ||||||||||||||||||||||
OFFICE PROPERTY INVESTMENTS | OFFICE PROPERTY INVESTMENTS |
|
|
|
|
|
|
|
|
|
|
|
|
| |||||||||||||||||||||
1001 Pennsylvania Ave |
| Washington, DC |
| 1987 |
| 2004 |
| 802,390 |
| 99 | % | $ | 32.69 |
| $ | 502,993,710 | (4) |
| Washington, DC |
| 1987 |
| 2004 |
| 802,390 |
| 100 | % | $ | 34.11 |
| $ | 552,502,209 | (4) | |
1 & 7 Westferry Circus |
| London, UK |
| 1992, 1993 |
| 2005 |
| 395,784 |
| 82 | % | $ | 25.73 |
| $ | 373,116,817 | (4)(5) |
| London, UK |
| 1992, 1993 |
| 2005 |
| 395,784 |
| 81 | % | $ | 63.96 |
| $ | 428,574,628 | (4)(5) | |
50 Fremont Street |
| San Francisco, CA |
| 1983 |
| 2004 |
| 817,412 |
| 90 | % | $ | 30.65 |
| $ | 373,010,003 | (4) |
| San Francisco, CA |
| 1983 |
| 2004 |
| 817,412 |
| 94 | % | $ | 30.05 |
| $ | 421,000,000 | (4) | |
IDX Tower |
| Seattle, WA |
| 2002 |
| 2004 |
| 845,533 |
| 97 | % | $ | 27.39 |
| $ | 370,000,000 | (4) |
| Seattle, WA |
| 2002 |
| 2004 |
| 845,533 |
| 98 | % | $ | 28.07 |
| $ | 398,990,017 | (4) | |
The Newbry |
| Boston, MA |
| 1940-1961 | (6) | 2006 |
| 607,685 |
| 100 | % | $ | 39.72 |
| $ | 370,745,525 |
| ||||||||||||||||||
Four Oaks Place |
| Houston, TX |
| 1983 |
| 2004 |
| 1,762,616 |
| 91 | % | $ | 18.63 |
| $ | 295,239,109 |
|
| Houston, TX |
| 1983 |
| 2004 |
| 1,754,366 |
| 96 | % | $ | 17.55 |
| $ | 306,200,984 |
| |
780 Third Avenue |
| New York, NY |
| 1984 |
| 1999 |
| 487,501 |
| 91 | % | $ | 40.89 |
| $ | 298,000,000 |
| ||||||||||||||||||
99 High Street |
| Boston, MA |
| 1971 |
| 2005 |
| 731,204 |
| 90 | % | $ | 28.99 |
| $ | 276,266,900 | (4) |
| Boston, MA |
| 1971 |
| 2005 |
| 731,204 |
| 90 | % | $ | 32.30 |
| $ | 291,806,564 | (4) | |
Lincoln Centre |
| Dallas, TX |
| 1984 |
| 2005 |
| 1,635,352 |
| 85 | % | $ | 16.32 |
| $ | 255,311,299 |
|
| Dallas, TX |
| 1984 |
| 2005 |
| 1,635,352 |
| 90 | % | $ | 16.80 |
| $ | 270,000,000 | (4) | |
780 Third Avenue |
| New York, NY |
| 1984 |
| 1999 |
| 487,501 |
| 88 | % | $ | 41.60 |
| $ | 230,000,000 |
| ||||||||||||||||||
1900 K Street |
| Washington, DC |
| 1996 |
| 2004 |
| 342,884 |
| 100 | % | $ | 37.20 |
| $ | 230,000,000 |
|
| Washington, DC |
| 1996 |
| 2004 |
| 342,884 |
| 100 | % | $ | 40.72 |
| $ | 255,002,226 |
| |
701 Brickell |
| Miami, FL |
| 1986 | (7) | 2002 |
| 677,667 |
| 96 | % | $ | 30.44 |
| $ | 231,239,379 |
| ||||||||||||||||||
Embarcadero Center West |
| San Francisco, CA |
| 1988 |
| 2005 |
| 472,261 |
| 87 | % | $ | 33.91 |
| $ | 205,965,261 |
|
| San Francisco, CA |
| 1988 |
| 2005 |
| 472,261 |
| 87 | % | $ | 30.16 |
| $ | 231,000,000 |
| |
701 Brickell |
| Miami, FL |
| 1986 | (6) | 2002 |
| 677,667 |
| 91 | % | $ | 27.59 |
| $ | 201,173,724 |
| ||||||||||||||||||
161 North Clark Street(7) |
| Chicago, IL |
| 1992 |
| 2003 |
| 1,010,520 |
| 94 | % | $ | 16.14 |
| $ | 175,578,714 |
| ||||||||||||||||||
U.S. Bank Plaza |
| Sacramento, CA |
| 1992 |
| 2005 |
| 481,885 |
| 90 | % | $ | 22.96 |
| $ | 159,000,000 |
| ||||||||||||||||||
1401 H Street NW |
| Washington, D.C. |
| 1992 |
| 2006 |
| 348,629 |
| 96 | % | $ | 38.39 |
| $ | 207,806,286 | (4) | ||||||||||||||||||
Wilshire Rodeo Plaza |
| Beverly Hills, CA |
| 1935, 1984 |
| 2006 |
| 261,932 |
| 98 | % | $ | 48.32 |
| $ | 204,084,734 | (4) | ||||||||||||||||||
161 North Clark Street(8) |
| Chicago, IL |
| 1992 |
| 2003 |
| 1,010,520 |
| 94 | % | $ | 15.10 |
| $ | 189,183,793 |
| ||||||||||||||||||
Yahoo! Center(9) |
| Santa Monica, CA |
| 1984 |
| 2004 |
| 1,082,952 |
| 99 | % | $ | 32.13 |
| $ | 187,766,625 |
| ||||||||||||||||||
Mellon Financial Center at One Boston Place(10) |
| Boston, MA |
| 1970 | (7) | 2002 |
| 802,716 |
| 94 | % | $ | 38.17 |
| $ | 177,900,327 |
| ||||||||||||||||||
Ten & Twenty Westport Road |
| Wilton, CT |
| 1974(6); 2001 |
| 2001 |
| 538,840 |
| 100 | % | $ | 27.84 |
| $ | 157,000,000 |
|
| Wilton, CT |
| 1974 | (7), 2001 | 2001 |
| 538,840 |
| 100 | % | $ | 30.03 |
| $ | 175,000,000 |
| |
Mellon Financial Center at One Boston Place(8) |
| Boston, MA |
| 1970 | (6) | 2002 |
| 785,415 |
| 97 | % | $ | 38.79 |
| $ | 149,723,498 |
| ||||||||||||||||||
Yahoo! Center(9) |
| Santa Monica, CA |
| 1984 |
| 2004 |
| 1,082,952 |
| 98 | % | $ | 30.59 |
| $ | 138,531,366 |
| ||||||||||||||||||
980 9th Street and 1010 8th Street(11) |
| Sacramento, CA |
| 1992 |
| 2005 |
| 481,885 |
| 94 | % | $ | 21.58 |
| $ | 168,000,000 |
| ||||||||||||||||||
Millennium Corporate Park |
| Redmond, VA |
| 1999, 2000 |
| 2006 |
| 536,884 |
| 100 | % | $ | 14.83 |
| $ | 139,107,181 |
| ||||||||||||||||||
Urban Centre |
| Tampa, FL |
| 1984, 1987 |
| 2005 |
| 549,375 |
| 90 | % | $ | 19.05 |
| $ | 106,007,400 |
|
| Tampa, FL |
| 1984, 1987 |
| 2005 |
| 549,375 |
| 96 | % | $ | 19.49 |
| $ | 121,000,000 |
| |
Morris Corporate Center III |
| Parsippany, NJ |
| 1990 |
| 2000 |
| 525,154 |
| 78 | % | $ | 17.12 |
| $ | 114,857,104 |
| ||||||||||||||||||
Inverness Center |
| Birmingham, AL |
| 1980-1985 |
| 2005 |
| 903,857 |
| 94 | % | $ | 10.87 |
| $ | 98,090,987 |
|
| Birmingham, AL |
| 1980-1985 |
| 2005 |
| 903,857 |
| 99 | % | $ | 12.00 |
| $ | 112,256,914 |
| |
Morris Corporate Center III |
| Parsippany, NJ |
| 1990 |
| 2000 |
| 525,154 |
| 64 | % | $ | 11.08 |
| $ | 97,400,000 |
| ||||||||||||||||||
Prominence in Buckhead(7) |
| Atlanta, GA |
| 1999 |
| 2003 |
| 424,309 |
| 97 | % | $ | 27.01 |
| $ | 97,142,406 |
| ||||||||||||||||||
Prominence in Buckhead(8) |
| Atlanta, GA |
| 1999 |
| 2003 |
| 424,309 |
| 95 | % | $ | 27.17 |
| $ | 107,256,320 |
| ||||||||||||||||||
Treat Towers(8) |
| Walnut Creek, CA |
| 1999 |
| 2003 |
| 367,313 |
| 78 | % | $ | 24.63 |
| $ | 94,023,131 |
| ||||||||||||||||||
88 Kearny Street |
| San Francisco, CA |
| 1986 |
| 1999 |
| 228,470 |
| 99 | % | $ | 43.53 |
| $ | 90,310,024 |
| ||||||||||||||||||
The Ellipse at Ballston |
| Arlington, VA |
| 1989 |
| 2006 |
| 195,743 |
| 97 | % | $ | 31.61 |
| $ | 85,439,350 |
| ||||||||||||||||||
Oak Brook Regency Towers |
| Oakbrook, IL |
| 1977 | (7) | 2002 |
| 402,318 |
| 83 | % | $ | 13.64 |
| $ | 83,200,000 |
| ||||||||||||||||||
Sawgrass Office Portfolio |
| Sunrise, FL |
| 1997-2000 |
| 1997, 1999-2000 |
| 344,009 |
| 97 | % | $ | 13.81 |
| $ | 72,000,000 |
| ||||||||||||||||||
Centerside I |
| San Diego, CA |
| 1982 |
| 2004 |
| 205,137 |
| 79 | % | $ | 21.25 |
| $ | 67,000,000 |
| ||||||||||||||||||
22|ProspectusTIAA Real Estate Account
|
|
|
|
|
|
|
|
|
|
|
|
|
|
|
|
|
|
The North 40 Office Complex |
| Boca Raton, FL |
| 1983, 1984 |
| 2006 |
| 350,004 |
| 100 | % | $ | 10.91 |
| $ | 63,500,000 |
|
8270 Greensboro Drive |
| McLean, VA |
| 2000 |
| 2005 |
| 158,110 |
| 90 | % | $ | 31.68 |
| $ | 62,000,000 |
|
West Lake North Business Park |
| Westlake Village, CA |
| 2000 |
| 2004 |
| 198,558 |
| 100 | % | $ | 28.47 |
| $ | 61,000,000 |
|
Parkview Plaza |
| Oakbrook, IL |
| 1990 |
| 1997 |
| 263,912 |
| 86 | % | $ | 11.77 |
| $ | 59,400,000 |
|
3 Hutton Centre |
| Santa Ana, CA |
| 1985 | (7) | 2003 |
| 197,817 |
| 100 | % | $ | 25.38 |
| $ | 59,011,323 |
|
Monument Place |
| Fairfax, VA |
| 1990 |
| 1999 |
| 221,538 |
| 98 | % | $ | 20.90 |
| $ | 58,600,000 |
|
One Virginia Square |
| Arlington, VA |
| 1999 |
| 2004 |
| 116,077 |
| 100 | % | $ | 31.52 |
| $ | 53,000,000 |
|
The Pointe on Tampa Bay |
| Tampa, FL |
| 1982 | (7) | 2002 |
| 250,357 |
| 100 | % | $ | 23.69 |
| $ | 50,573,824 |
|
Capitol Place |
| Sacramento, CA |
| 1988 | (7) | 2003 |
| 151,803 |
| 96 | % | $ | 27.32 |
| $ | 50,331,828 |
|
Wellpoint |
| Westlake Village, CA |
| 1986, 1998 |
| 2006 |
| 208,000 |
| 100 | % | $ | 13.23 |
| $ | 49,000,000 |
|
Park Place on Turtle Creek |
| Dallas, TX |
| 1986 |
| 2006 |
| 177,169 |
| 98 | % | $ | 24.36 |
| $ | 44,573,669 |
|
4200 West Cypress Street |
| Tampa, FL |
| 1989 |
| 2003 |
| 220,579 |
| 99 | % | $ | 21.61 |
| $ | 43,100,425 |
|
Tysons Executive Plaza II(12) |
| McLean, VA |
| 1988 |
| 2000 |
| 259,614 |
| 97 | % | $ | 24.15 |
| $ | 40,570,382 |
|
Creeksides at CenterPoint |
| Kent, WA |
| 1985 |
| 2006 |
| 218,589 |
| 81 | % | $ | 12.36 |
| $ | 40,508,139 |
|
10 Waterview Boulevard |
| Parsippany, NJ |
| 1984 |
| 1999 |
| 208,601 |
| 58 | % | $ | 12.95 |
| $ | 32,100,000 |
|
9 Hutton Centre |
| Santa Ana, CA |
| 1990 |
| 2001 |
| 149,946 |
| 82 | % | $ | 16.40 |
| $ | 29,000,000 |
|
Columbus Portfolio |
| Various, OH |
| 1997-1998 |
| 1999, 2001 |
| 259,694 |
| 89 | % | $ | 10.00 |
| $ | 24,600,000 |
|
Needham Corporate Center |
| Needham, MA |
| 1987 |
| 2001 |
| 138,684 |
| 75 | % | $ | 13.20 |
| $ | 22,712,550 |
|
Batterymarch Park II |
| Quincy, MA |
| 1986 |
| 2001 |
| 104,718 |
| 53 | % | $ | 10.08 |
| $ | 13,234,314 |
|
|
|
|
|
|
|
|
|
|
|
|
|
|
|
|
| ||
Office Property Investments |
|
|
|
|
|
|
|
|
| 92 | % |
|
|
| $ | 7,308,069,775 |
|
INDUSTRIAL PROPERTY INVESTMENTS |
|
|
|
|
|
|
|
|
|
|
|
|
|
|
| ||
Ontario Industrial Portfolio(13) |
| Various, CA |
| 1997-1998 |
| 1998, 2000, 2004 |
| 3,584,769 |
| 100 | % | $ | 3.31 |
| $ | 270,000,000 | (4) |
Dallas Industrial Portfolio(14) |
| Dallas and Coppell, TX |
| 1997-2001 |
| 2000-2002 |
| 3,886,541 |
| 90 | % | $ | 2.44 |
| $ | 153,210,519 |
|
Southern California RA Industrial Portfolio |
| Los Angeles, CA |
| 1982 |
| 2004 |
| 920,028 |
| 96 | % | $ | 5.31 |
| $ | 97,558,473 |
|
Cabot Industrial Portfolio |
| Rancho Cucamonga, CA |
| 2000-2002 |
| 2000, 2001, |
|
|
|
|
|
|
|
|
|
|
|
|
|
|
|
|
| 2002, 2004 |
| 1,214,475 |
| 100 | % | $ | 3.71 |
| $ | 88,200,000 |
|
Chicago Industrial Portfolio(15) |
| Chicago and Joliet, IL |
| 1997-2000 |
| 1998, 2000 |
| 1,577,606 |
| 90 | % | $ | 3.83 |
| $ | 89,104,640 |
|
Atlanta Industrial Portfolio |
| Lawrenceville, GA |
| 1996-1999 |
| 2000 |
| 1,945,693 |
| 95 | % | $ | 2.18 |
| $ | 77,863,416 |
|
Shawnee Ridge Industrial Portfolio(16) |
| Atlanta, GA |
| 2000-2005 |
| 2005 |
| 1,422,922 |
| 100 | % | $ | 3.05 |
| $ | 76,117,193 |
|
Chicago Caleast Industrial Portfolio |
| Chicago, IL |
| 1974-2005 |
| 2003 |
| 1,493,706 |
| 93 | % | $ | 2.52 |
| $ | 74,999,590 |
|
Northern California RA Industrial Portfolio |
| Oakland, CA |
| 1981 |
| 2004 |
| 741,456 |
| 93 | % | $ | 4.06 |
| $ | 71,317,741 |
|
IDI National Portfolio(17) |
| Various, U.S. |
| 1999-2004 |
| 2004 |
| 3,655,671 |
| 98 | % | $ | 3.30 |
| $ | 70,348,753 |
|
TIAA Real Estate AccountProspectus|23
Properties(continued)
|
|
|
|
|
|
|
|
|
|
|
|
|
|
|
|
|
|
|
|
|
|
|
|
|
|
|
|
|
|
|
|
|
|
| |
Property |
| Location |
| Year Built |
| Year |
| Rentable | (1) | Percent |
| Annual Avg. | (2) |
| Market | (3) | |
INDUSTRIAL PROPERTY INVESTMENTS(continued) |
|
|
|
|
|
|
|
|
|
|
|
| |||||
Rainier Corporate Park |
| Fife, WA |
| 1991-1997 |
| 2003 |
| 1,104,646 |
| 97 | % | $ | 4.03 |
| $ | 69,362,219 |
|
IDI Kentucky Portfolio |
| Various, KY |
| 1998-2000 |
| 1998, 2000, 2005 |
| 1,437,022 |
| 100 | % | $ | 3.24 |
| $ | 66,552,034 |
|
Regal Logistics Campus |
| Seattle, WA |
| 1999-2004 |
| 2005 |
| 968,535 |
| 100 | % | $ | 4.15 |
| $ | 66,000,000 |
|
South River Road Industrial |
| Cranbury, NJ |
| 1999 |
| 2001 |
| 858,957 |
| 100 | % | $ | 4.24 |
| $ | 60,600,000 |
|
Memphis Caleast Industrial Portfolio |
| Memphis, TN |
| 1996-1997 |
| 2003 |
| 1,600,232 |
| 100 | % | $ | 2.01 |
| $ | 52,500,000 |
|
GE Appliance East Coast Distribution Facility |
| Perryville, MD |
| 2003 |
| 2005 |
| 1,004,000 |
| 100 | % | $ | 2.82 |
| $ | 48,000,000 |
|
Pinnacle Industrial/DFW Trade Center |
| Grapevine, TX |
| 2003, 2004, 2006 |
| 2006 |
| 899,200 |
| 100 | % | $ | 3.49 |
| $ | 45,874,807 |
|
New Jersey Caleast Industrial Portfolio |
| Cranbury, NJ |
| 1982-1989 |
| 2003 |
| 807,773 |
| 50 | % | $ | 2.23 |
| $ | 41,920,988 |
|
East North Central RA Industrial Portfolio |
| Chicago, IL |
| 1978 |
| 2004 |
| 541,266 |
| 96 | % | $ | 4.65 |
| $ | 37,503,284 |
|
Broadlands Business Park |
| Elkton, MD |
| 2006 |
| 2006 |
| 756,690 |
| 100 | % | $ | 2.85 |
| $ | 35,002,731 |
|
Centre Pointe and Valley View |
| Los Angeles County, CA |
| 1965-1989 |
| 2004 |
| 307,685 |
| 100 | % | $ | 4.10 |
| $ | 32,385,980 |
|
Northeast RA Industrial Portfolio |
| Boston, MA |
| 2000 |
| 2004 |
| 384,000 |
| 100 | % | $ | 5.60 |
| $ | 30,900,000 |
|
1900 South Burgundy Place |
| Ontario, CA |
| 1988-1999 |
| 2006 |
| 397,125 |
| 100 | % | $ | 3.69 |
| $ | 28,045,226 |
|
Summit Distribution Center |
| Memphis, TN |
| 2002 |
| 2003 |
| 708,532 |
| 100 | % | $ | 2.52 |
| $ | 26,300,000 |
|
Eastgate Distribution Center |
| San Diego, CA |
| 1996 |
| 1997 |
| 200,000 |
| 100 | % | $ | 7.02 |
| $ | 25,558,962 |
|
Airways Distribution Center |
| Memphis, TN |
| 2005 |
| 2006 |
| 556,600 |
| 100 | % | $ | 3.20 |
| $ | 24,857,278 |
|
Konica Photo Imaging Headquarters |
| Mahwah, NJ |
| 1999 |
| 1999 |
| 168,000 |
| 100 | % | $ | 11.25 |
| $ | 23,100,000 |
|
Weber Distribution |
| Rancho Cucamonga, CA |
| 1988 |
| 2006 |
| 275,760 |
| 100 | % | $ | 4.04 |
| $ | 20,800,000 |
|
Northwest RA Industrial Portfolio |
| Seattle, WA |
| 1996 |
| 2004 |
| 312,321 |
| 100 | % | $ | 3.51 |
| $ | 20,684,499 |
|
Landmark at Salt Lake City (Building #4) |
| Salt Lake City, UT |
| 2000 |
| 2000 |
| 328,508 |
| 85 | % | $ | 2.77 |
| $ | 16,509,871 |
|
Mideast RA Industrial Portfolio |
| Wilmington, DE |
| 1989 |
| 2004 |
| 266,141 |
| 90 | % | $ | 3.22 |
| $ | 16,014,758 |
|
UPS Distribution Facility |
| Fernley, NV |
| 1998 |
| 1998 |
| 256,000 |
| 100 | % | $ | 4.07 |
| $ | 15,000,000 |
|
FEDEX Distribution Facility |
| Crofton, MD |
| 1998 |
| 1998 |
| 110,842 |
| 100 | % | $ | 7.18 |
| $ | 8,500,000 |
|
Mountain RA Industrial Portfolio |
| Phoenix, AZ |
| 1989 |
| 2004 |
| 136,704 |
| 100 | % | $ | 2.14 |
| $ | 6,605,429 |
|
Butterfield Industrial Park(18) |
| El Paso, TX |
| 1980-1981 |
| 1995 |
| 183,510 |
| 100 | % | $ | 2.39 |
| $ | 5,100,000 |
|
|
|
|
|
|
|
|
|
|
|
|
|
|
|
|
| ||
Industrial Property Investments |
|
|
|
|
|
|
|
|
| 96 | % |
|
|
| $ | 1,892,398,391 |
|
|
|
|
|
|
|
|
|
|
|
|
|
|
|
|
|
| |
24|ProspectusTIAA Real Estate Account
|
|
|
|
|
|
|
|
|
|
|
|
|
|
|
|
|
RETAIL PROPERTY INVESTMENTS |
|
|
|
|
|
|
|
|
|
|
|
|
|
| ||
Florida Retail Portfolio(19) |
| Various, FL |
| 1974-2005 |
| 2006 |
| 1,259,554 |
| 100 | % | $15.94 |
| $ | 265,396,677 |
|
The Florida Mall(20) |
| Orlando, FL |
| 1986 | (7) | 2002 |
| 921,370 | (21) | 99 | % | $37.71 |
| $ | 237,919,775 |
|
West Town Mall(20) |
| Knoxville, TN |
| 1972 | (7) | 2002 |
| 761,357 | (21) | 97 | % | $19.18 |
| $ | 126,214,963 |
|
Miami International Mall(20) |
| Miami, FL |
| 1982 | (7) | 2002 |
| 290,299 | (21) | 97 | % | $37.03 |
| $ | 97,300,131 |
|
Marketfair |
| West Windsor, NJ |
| 1987 |
| 2006 |
| 235,144 |
| 99 | % | $20.74 |
| $ | 94,058,427 |
|
Westwood Marketplace |
| Los Angeles, CA |
| 1950 | (7) | 2002 |
| 202,201 |
| 100 | % | $29.95 |
| $ | 91,467,954 |
|
Mazza Gallerie |
| Washington, DC |
| 1975 |
| 2004 |
| 293,935 |
| 98 | % | $18.46 |
| $ | 86,350,179 |
|
Publix at Weston Commons |
| Weston, FL |
| 2005 |
| 2006 |
| 126,922 |
| 97 | % | $22.04 |
| $ | 54,411,436 | (4) |
Plainsboro Plaza |
| Plainsboro, NJ |
| 1987 |
| 2005 |
| 218,653 |
| 90 | % | $11.55 |
| $ | 50,900,000 |
|
South Frisco Village |
| Frisco, TX |
| 2002 |
| 2006 |
| 227,175 |
| 99 | % | $13.47 |
| $ | 47,014,065 | (4) |
The Market at Southpark |
| Littleton, CO |
| 1988 |
| 2004 |
| 190,080 |
| 96 | % | $12.03 |
| $ | 35,800,000 |
|
Suncrest Village |
| Orlando, FL |
| 1987 |
| 2005 |
| 93,358 |
| 100 | % | $ 9.48 |
| $ | 17,009,378 |
|
Plantation Grove |
| Ocoee, FL |
| 1995 |
| 1995 |
| 73,655 |
| 100 | % | $12.31 |
| $ | 15,010,406 |
|
|
|
|
|
|
|
|
|
|
|
|
|
|
|
| ||
Retail Property Investments |
|
|
|
|
|
|
| 98 | % |
|
| $ | 1,218,853,391 |
| ||
OTHER COMMERCIAL PROPERTY INVESTMENTS |
|
|
|
|
|
|
|
|
|
|
|
|
|
| ||
Storage Portfolio I(22) |
| Various, U.S. |
| 1972-1990 |
| 2003 |
| 2,226,549 |
| 83 | % | $ 9.64 |
| $ | 74,864,074 |
|
|
|
|
|
|
|
|
|
|
|
|
|
|
|
| ||
Commercial Property Investments |
|
|
|
|
|
|
| 94 | % |
|
| $ | 10,494,185,631 |
| ||
RESIDENTIAL PROPERTY INVESTMENTS(23) |
|
|
|
|
|
|
|
|
|
|
|
|
|
| ||
Houston Apartment Portfolio(24) |
| Houston, TX |
| 1984-2004 |
| 2006 |
| NA |
| 93 | % | NA |
| $ | 306,042,523 |
|
Kierland Apartment Portfolio(25) |
| Scottsdale, AZ |
| 1996-2000 |
| 2006 |
| NA |
| 96 | % | NA |
| $ | 206,100,000 |
|
Palomino Park Apartments |
| Denver, CO |
| 1996-2001 |
| 2005 |
| NA |
| 92 | % | NA |
| $ | 184,000,000 |
|
Phoenix Apartment Portfolio(26) |
| Greater Phoenix Area, AZ |
| 1995-1998 |
| 2006 |
| NA |
| 94 | % | NA |
| $ | 182,900,000 |
|
The Legacy at Westwood Apartments |
| Los Angeles, CA |
| 2001 |
| 2002 |
| NA |
| 94 | % | NA |
| $ | 110,231,593 |
|
The Colorado |
| New York, NY |
| 1987 |
| 1999 |
| NA |
| 99 | % | NA |
| $ | 100,000,000 |
|
Larkspur Courts |
| Larkspur, CA |
| 1991 |
| 1999 |
| NA |
| 93 | % | NA |
| $ | 93,043,346 |
|
Ashford Meadows Apartments |
| Herndon, VA |
| 1998 |
| 2000 |
| NA |
| 92 | % | NA |
| $ | 89,091,341 |
|
1050 Lenox Park |
| Atlanta, GA |
| 2001 |
| 2005 |
| NA |
| 97 | % | NA |
| $ | 79,470,836 |
|
Regents Court Apartments |
| San Diego, CA |
| 2001 |
| 2002 |
| NA |
| 92 | % | NA |
| $ | 67,800,000 |
|
South Florida Apartment Portfolio |
| Boca Raton and Plantation, FL |
| 1986 |
| 2001 |
| NA |
| 96 | % | NA |
| $ | 65,099,785 |
|
The Caruth |
| Dallas, TX |
| 1999 |
| 2005 |
| NA |
| 96 | % | NA |
| $ | 60,007,237 |
|
The Reserve at Sugarloaf |
| Duluth, GA |
| 2000 |
| 2005 |
| NA |
| 99 | % | NA |
| $ | 49,500,000 | (4) |
Glenridge Walk |
| Atlanta, GA |
| 1996, 2001 |
| 2005 |
| NA |
| 97 | % | NA |
| $ | 48,710,574 |
|
The Lodge at Willow Creek |
| Denver, CO |
| 1997 |
| 1997 |
| NA |
| 96 | % | NA |
| $ | 39,501,399 |
|
The Maroneal |
| Houston, TX |
| 1998 |
| 2005 |
| NA |
| 95 | % | NA |
| $ | 39,113,694 |
|
TIAA Real Estate AccountProspectus|25
Properties(continued)
|
|
|
|
|
|
|
|
|
|
|
|
|
|
|
|
|
Property |
| Location |
| Year Built |
| Year |
| Rentable | (1) | Percent |
| Annual Avg. | (2) |
| Market | (3) |
RESIDENTIAL PROPERTY INVESTMENTS(23)(continued) |
|
|
|
|
|
|
|
|
| |||||||
Lincoln Woods Apartments |
| Lafayette Hill, PA |
| 1991 |
| 1997 |
| NA |
| 93 | % | NA |
| $ | 37,781,555 |
|
Westcreek Apartments |
| Westlake Village, CA |
| 1988 |
| 1997 |
| NA |
| 95 | % | NA |
| $ | 35,300,000 |
|
The Legends at Chase Oaks |
| Plano, TX |
| 1997 |
| 1998 |
| NA |
| 98 | % | NA |
| $ | 29,025,236 |
|
The Fairways of Carolina |
| Margate, FL |
| 1993 |
| 2001 |
| NA |
| 96 | % | NA |
| $ | 25,309,965 |
|
Royal St. George |
| W. Palm Beach, FL |
| 1995 |
| 1996 |
| NA |
| 97 | % | NA |
| $ | 25,000,000 |
|
Quiet Water at Coquina Lakes |
| Deerfield Beach, FL |
| 1995 |
| 2001 |
| NA |
| 95 | % | NA |
| $ | 24,006,100 |
|
The Greens at Metrowest Apartments |
| Orlando, FL |
| 1990 |
| 1995 |
| NA |
| 91 | % | NA |
| $ | 21,011,825 |
|
|
|
|
|
|
|
|
|
|
|
|
|
|
|
| ||
Residential Property Investments |
|
|
|
|
|
|
|
|
| 95 | % |
|
| $ | 1,918,047,009 |
|
Total—All Property Investments |
|
|
|
|
|
|
|
|
|
|
|
|
| $ | 12,412,232,640 |
|
|
|
(1) | The square footage is an approximate measure and is subject to periodic remeasurement. |
|
|
(2) | Based on total contractual rent on leases existing as of December 31, |
|
|
(3) | Market value reflects the value determined in accordance with the procedures described in the Account’s prospectus and as stated in the Statement of |
|
|
(4) | Market value shown represents the Account’s interest gross of debt. |
|
|
(5) | This property is located in London, the United Kingdom, and the market value is converted from |
| |
(6) |
|
| |
(7) |
|
(8) | The property is held in a 75%/25% joint venture with Equity Office |
|
|
| Formerly known as “Colorado Center”, this property is held in a 50%/50% joint venture with Equity Office Properties Trust. Market value shown reflects the value of the Account’s interest in the joint venture, net of debt. |
(10) | The Account purchased a 50.25% interest in a private REIT, which owns this property. A 49.70% interest is owned by Societe Immobiler Trans-Quebec, and .05% is owned by 100 individuals. Market value shown reflects the value of the Account’s interest in the joint venture. |
|
|
| Formerly known as |
18 |Prospectus TIAA Real Estate Account
Properties(continued)
|
|
|
|
|
|
|
|
|
|
|
|
|
|
|
|
|
|
Property |
| Location |
| Year Built |
| Year |
| Rentable | (1) | Percent |
|
| Annual Avg. | (2) |
| Market Value | (3) |
OFFICE PROPERTIES(continued) |
|
|
|
|
|
|
|
|
|
|
|
|
|
|
|
|
|
Treat Towers(6) |
| Walnut Creek, CA |
| 1999 |
| 2003 |
| 367,313 |
| 96 | % | $ | 32.46 |
| $ | 93,964,192 |
|
88 Kearny Street |
| San Francisco, CA |
| 1986 |
| 1999 |
| 228,470 |
| 84 | % | $ | 34.94 |
| $ | 81,567,474 |
|
Oak Brook Regency Towers |
| Oakbrook, IL |
| 1977 | (5) | 2002 |
| 402,318 |
| 77 | % | $ | 11.93 |
| $ | 73,400,000 |
|
1015 15th Street |
| Washington, DC |
| 1978 | (5) | 2001 |
| 184,825 |
| 99 | % | $ | 32.76 |
| $ | 73,121,166 |
|
Centerside I |
| San Diego, CA |
| 1982 |
| 2004 |
| 205,137 |
| 77 | % | $ | 23.15 |
| $ | 66,000,000 |
|
8270 Greensboro Drive |
| McLean, VA |
| 2000 |
| 2005 |
| 157,980 |
| 97 | % | $ | 32.17 |
| $ | 60,200,000 |
|
Sawgrass Office Portfolio |
| Sunrise, FL |
| 1997-2000 |
| 1997, 1999-2000 |
| 344,009 |
| 93 | % | $ | 13.35 |
| $ | 59,700,000 |
|
West Lake North Business Park |
| Westlake Village, CA |
| 2000 |
| 2004 |
| 198,558 |
| 100 | % | $ | 26.26 |
| $ | 57,600,000 |
|
Parkview Plaza(10) |
| Oakbrook, IL |
| 1990 |
| 1997 |
| 263,912 |
| 65 | % | $ | 10.43 |
| $ | 54,500,000 |
|
Monument Place |
| Fairfax, VA |
| 1990 |
| 1999 |
| 221,538 |
| 97 | % | $ | 22.29 |
| $ | 53,000,000 |
|
3 Hutton Centre |
| Santa Ana, CA |
| 1985 | (5) | 2003 |
| 197,817 |
| 99 | % | $ | 24.74 |
| $ | 48,349,580 |
|
Capitol Place |
| Sacramento, CA |
| 1988 | (5) | 2003 |
| 151,803 |
| 95 | % | $ | 28.12 |
| $ | 48,000,000 |
|
One Virginia Square |
| Arlington, VA |
| 1999 |
| 2004 |
| 117,967 |
| 100 | % | $ | 33.16 |
| $ | 47,000,000 |
|
The Pointe on Tampa Bay |
| Tampa, FL |
| 1982 | (5) | 2002 |
| 249,215 |
| 97 | % | $ | 22.12 |
| $ | 44,711,876 |
|
Maitland Promenade One |
| Maitland, FL |
| 1999 |
| 2000 |
| 227,814 |
| 89 | % | $ | 13.55 |
| $ | 37,817,891 |
|
4200 West Cypress Street |
| Tampa, FL |
| 1989 |
| 2003 |
| 220,579 |
| 91 | % | $ | 18.80 |
| $ | 36,691,519 |
|
Fairgate at Ballston(7) |
| Arlington, VA |
| 1988 |
| 1997 |
| 137,117 |
| 64 | % | $ | 16.75 |
| $ | 35,300,000 |
|
Tysons Executive Plaza II(8) |
| McLean, VA |
| 1988 |
| 2000 |
| 259,614 |
| 85 | % | $ | 18.73 |
| $ | 34,032,806 |
|
Columbia Centre III |
| Rosemont, IL |
| 1989 |
| 1997 |
| 238,696 |
| 70 | % | $ | 7.93 |
| $ | 28,700,000 |
|
10 Waterview Boulevard |
| Parsippany, NJ |
| 1984 |
| 1999 |
| 209,553 |
| 64 | % | $ | 13.07 |
| $ | 27,500,000 |
|
9 Hutton Centre |
| Santa Ana, CA |
| 1990 |
| 2001 |
| 148,265 |
| 84 | % | $ | 16.48 |
| $ | 26,746,837 |
|
Columbus Portfolio |
|
|
|
|
|
|
| 259,626 |
| 89 | % | $ | 10.32 |
| $ | 23,000,000 |
|
Metro South Building |
| Dublin, OH |
| 1997 |
| 1999 |
| 90,726 |
|
|
|
|
|
|
| — |
|
Vision Service Plan Building |
| Eaton, OH |
| 1997 |
| 1999 |
| 50,000 |
|
|
|
|
|
|
| — |
|
One Metro Place |
| Dublin, OH |
| 1998 |
| 2001 |
| 118,900 |
|
|
|
|
|
|
| — |
|
Needham Corporate Center |
| Needham, MA |
| 1987 |
| 2001 |
| 138,684 |
| 50 | % | $ | 10.60 |
| $ | 17,143,612 |
|
371 Hoes Lane |
| Piscataway, NJ |
| 1986 |
| 1997 |
| 136,084 |
| 86 | % | $ | 14.07 |
| $ | 11,700,000 |
|
Batterymarch Park II |
| Quincy, MA |
| 1986 |
| 2001 |
| 104,718 |
| 46 | % | $ | 8.32 |
| $ | 11,472,283 |
|
|
|
|
|
|
|
|
|
|
|
|
|
|
|
|
| ||
Subtotal—Office Properties Average Percent Leased |
|
|
|
|
|
|
| 20,644,523 |
| 87 | % |
|
|
| $ | 5,642,770,430 |
|
TIAA Real Estate Account Prospectus | 19
|
|
|
|
|
|
|
|
|
|
|
|
|
|
|
|
|
|
Property |
| Location |
| Year Built |
| Year |
| Rentable | (1) | Percent |
| Annual Avg. | (2) | Market | (3) | ||
INDUSTRIAL PROPERTIES |
|
|
|
|
|
|
|
|
|
|
|
|
|
|
|
|
|
Ontario Industrial Portfolio |
|
|
|
|
|
|
| 3,584,769 |
| 100 | % | $ | 2.97 |
| $ | 230,000,000 | (4) |
Timberland Building |
| Ontario, CA |
| 1998 |
| 1998 |
| 414,435 |
|
|
|
|
|
|
| — |
|
5200 Airport Drive |
| Ontario, CA |
| 1997 |
| 1998 |
| 404,500 |
|
|
|
|
|
|
| — |
|
1200 S. Etiwanda Ave. |
| Ontario, CA |
| 1998 |
| 1998 |
| 223,170 |
|
|
|
|
|
|
| — |
|
Park Mira Loma West |
| Mira Loma, CA |
| 1998 |
| 1998 |
| 557,500 |
|
|
|
|
|
|
| — |
|
Wineville Center Buildings |
| Mira Loma, CA |
| 1999 |
| 2000 |
| 1,099,112 |
|
|
|
|
|
|
| — |
|
Harrell Street |
| Mira Loma, CA |
| 1998 |
| 2004 |
| 886,052 |
|
|
|
|
|
|
| — |
|
Dallas Industrial Portfolio (formerly Parkwest Center) |
| Dallas and |
| 1997-2001 |
| 2000-2002 |
| 3,886,541 |
| 67 | % | $ | 1.96 |
|
| 146,000,000 |
|
Southern California RA Industrial Portfolio |
| Los Angeles, CA |
| 1982 |
| 2004 |
| 920,028 |
| 92 | % | $ | 4.97 |
| $ | 89,017,793 |
|
Cabot Industrial Portfolio |
| Rancho Cucamonga, CA |
| 2000-2002 |
| 2000; 2001; |
| 1,214,475 |
| 100 | % | $ | 3.54 |
| $ | 77,000,000 |
|
|
|
|
| 2000; 2001; 2004 |
|
|
|
|
|
|
|
|
|
|
|
|
|
Chicago CalEast Industrial Portfolio |
| Chicago, IL |
| 1974-2005 |
| 2003 |
| 1,493,706 |
| 90 | % | $ | 4.51 |
| $ | 74,622,731 |
|
Atlanta Industrial Portfolio |
| Lawrenceville, GA |
| 1996-1999 |
| 2000 |
| 1,945,693 |
| 90 | % | $ | 2.26 |
| $ | 73,825,000 |
|
Chicago Industrial Portfolio |
| Chicago and Joliet, |
| 1997-2000 |
| 1998; 2000 |
| 1,452,974 |
| 86 | % | $ | 3.28 |
| $ | 72,000,000 |
|
(consolidation of Rockrun, Glen Pointe |
|
|
|
|
|
|
|
|
|
|
|
|
|
|
| — |
|
and WoodcreekBusiness Parks) |
|
|
|
|
|
|
|
|
|
|
|
|
|
|
| — |
|
IDI National Portfolio(9) |
| Various, U.S. |
| 1999-2004 |
| 2004 |
| 3,655,671 |
| 95 | % | $ | 2.86 |
| $ | 66,871,766 |
|
Rainier Corporate Park |
| Fife, WA |
| 1991-1997 |
| 2003 |
| 1,104,646 |
| 100 | % | $ | 3.77 |
| $ | 64,273,372 |
|
Regal Logistics Campus |
| Seattle, WA |
| 1999-2004 |
| 2005 |
| 968,535 |
| 100 | % | $ | 4.15 |
| $ | 63,103,879 |
|
Northern California RA Industrial Portfolio |
| Oakland, CA |
| 1981 |
| 2004 |
| 741,456 |
| 89 | % | $ | 4.02 |
| $ | 62,325,024 |
|
|
|
|
|
|
|
|
|
|
|
|
|
|
|
|
|
|
|
26|ProspectusTIAA Real Estate Account
|
|
|
|
(14) | The Dallas Industrial Portfolio contains 11 warehouse distribution properties located in Dallas and Copell, Texas. |
(15) | On October 5, 2006, the Account purchased Prairie Point Corporate Park, an industrial building in Bolingbrook, IL. This property was consolidated into the existing Chicago Industrial Portfolio. |
(16) | On October 5, 2006, the Account purchased Hamilton Mill Business Center, an industrial building in Buford, GA. This property was consolidated into the existing Shawnee Ridge Industrial Portfolio. |
(17) | The property is held in a 60%/40% joint venture with Industrial Development International. Market value shown reflects the value of the Account’s interest in the joint venture, net of debt. |
20 |Prospectus TIAA Real Estate Account
Properties(continued)
|
|
|
|
|
|
|
|
|
|
|
|
|
|
|
|
|
|
Property |
| Location |
| Year Built |
| Year |
| Rentable | (1) | Percent |
| Annual Avg. | (2) | Market Value | (3) | ||
INDUSTRIAL PROPERTIES(continued) |
|
|
|
|
|
|
|
|
|
|
|
|
|
|
|
|
|
IDI Kentucky Portfolio |
|
|
|
|
|
|
| 1,437,022 |
| 99 | % | $ | 2.96 |
| $ | 58,500,000 |
|
Building C |
| Hebron, KY |
| 1998 |
| 1998 |
| 520,000 |
|
|
|
|
|
|
| — |
|
Building D |
| Hebron, KY |
| 1998 |
| 1998 |
| 184,800 |
|
|
|
|
|
|
| — |
|
Building E |
| Hebron, KY |
| 2000 |
| 2000 |
| 207,222 |
|
|
|
|
|
|
| — |
|
Building J |
| Hebron, KY |
| 2000 |
| 2000 |
| 525,000 |
|
|
|
|
|
|
| — |
|
South River Road Industrial |
| Cranbury, NJ |
| 1999 |
| 2001 |
| 626,071 |
| 100 | % | $ | 4.14 |
| $ | 55,000,000 |
|
Memphis CalEast Industrial Portfolio |
| Memphis, TN |
| 1996-1997 |
| 2003 |
| 1,600,232 |
| 100 | % | $ | 2.61 |
| $ | 54,000,000 |
|
GE Appliance East Coast Distribution Facility |
| Perryville, MD |
| 2003 |
| 2005 |
| 1,004,000 |
| 100 | % | $ | 2.82 |
| $ | 46,470,475 |
|
Shawnee Ridge Industrial Portfolio |
| Atlanta, GA |
| 2000-2005 |
| 2005 |
| 775,694 |
| 100 | % | $ | 3.20 |
| $ | 44,418,860 |
|
New Jersey CalEast Industrial Portfolio |
| Cranbury, NJ |
| 1982-1989 |
| 2003 |
| 807,773 |
| 100 | % | $ | 3.67 |
| $ | 42,000,000 |
|
East North Central RA Industrial Portfolio |
| Chicago, IL |
| 1978 |
| 2004 |
| 541,266 |
| 90 | % | $ | 4.64 |
| $ | 37,717,159 |
|
Northeast RA Industrial Portfolio |
| Boston, MA |
| 2000 |
| 2004 |
| 384,000 |
| 100 | % | $ | 6.33 |
| $ | 29,000,000 |
|
Centre Pointe and Valley View |
| Los Angeles County, CA |
| 1965-1989 |
| 2004 |
| 307,685 |
| 88 | % | $ | 5.10 |
| $ | 28,000,000 |
|
Summit Distribution Center |
| Memphis, TN |
| 2002 |
| 2003 |
| 708,532 |
| 100 | % | $ | 2.52 |
| $ | 25,900,000 |
|
Konica Photo Imaging Headquarters |
| Mahwah, NJ |
| 1999 |
| 1999 |
| 168,000 |
| 100 | % | $ | 10.93 |
| $ | 25,300,000 |
|
Eastgate Distribution Center |
| San Diego, CA |
| 1996 |
| 1997 |
| 200,000 |
| 100 | % | $ | 3.67 |
| $ | 22,000,000 |
|
Northwest RA Industrial Portfolio |
| Seattle, WA |
| 1996 |
| 2004 |
| 312,321 |
| 100 | % | $ | 3.58 |
| $ | 19,700,000 |
|
UPS Distribution Facility |
| Fernley, NV |
| 1998 |
| 1998 |
| 256,000 |
| 100 | % | $ | 4.07 |
| $ | 15,000,000 |
|
Landmark at Salt Lake City (Building #4) |
| Salt Lake City, UT |
| 2000 |
| 2000 |
| 328,508 |
| 85 | % | $ | 2.70 |
| $ | 14,700,000 |
|
Mideast RA Industrial Portfolio |
| Wilmington, DE |
| 1989 |
| 2004 |
| 266,141 |
| 72 | % | $ | 3.35 |
| $ | 14,258,555 |
|
FEDEX Distribution Facility |
| Crofton, MD |
| 1998 |
| 1998 |
| 110,842 |
| 100 | % | $ | 7.18 |
| $ | 8,500,000 |
|
Mountain RA Industrial Portfolio |
| Phoenix, AZ |
| 1989 |
| 2004 |
| 136,704 |
| 100 | % | $ | 2.82 |
| $ | 5,754,652 |
|
Butterfield Industrial Park |
| El Paso, TX |
| 1980-81 |
| 1995 |
| 183,510 |
| 100 | % | $ | 2.35 |
| $ | 4,618,955 |
|
|
|
|
|
|
|
|
|
|
|
|
|
|
|
|
| ||
Subtotal—Industrial Properties Average Percent Leased |
|
|
|
|
|
|
| 31,122,795 |
| 95 | % |
|
|
| $ | 1,569,878,221 |
|
TIAA Real Estate Account Prospectus | 21
|
|
|
|
|
|
|
|
|
|
|
|
|
|
|
|
|
|
Property |
| Location |
| Year Built |
| Year |
| Rentable | (1) | Percent |
|
| Annual Avg. | (2) |
| Market Value | (3) |
RETAIL PROPERTIES |
|
|
|
|
|
|
|
|
|
|
|
|
|
|
|
|
|
The Florida Mall(5) |
| Orlando, FL |
| 1986 | (4) | 2002 |
| 921,370 | (6) | 99 | % | $ | 37.29 |
| $ | 208,013,192 |
|
West Town Mall(5) |
| Knoxville, TN |
| 1972 | (4) | 2002 |
| 684,777 | (6) | 96 | % | $ | 17.20 |
| $ | 112,650,844 |
|
Mazza Gallerie |
| Washington, DC |
| 1975 |
| 2004 |
| 293,935 |
| 97 | % | $ | 18.13 |
| $ | 86,001,109 |
|
Westwood Marketplace |
| Los Angeles, CA |
| 1950 | (7) | 2002 |
| 202,201 |
| 100 | % | $ | 27.55 |
| $ | 86,000,000 |
|
Miami International Mall(5) |
| Miami, FL |
| 1982 | (4) | 2002 |
| 290,299 | (6) | 94 | % | $ | 28.27 |
| $ | 82,290,482 |
|
Plainsboro Plaza |
| Plainsboro, NJ |
| 1987 |
| 2005 |
| 218,653 |
| 92 | % | $ | 12.10 |
| $ | 50,745,252 |
|
The Market at Southpark |
| Littleton, CO |
| 1988 |
| 2004 |
| 190,080 |
| 89 | % | $ | 10.74 |
| $ | 34,001,746 |
|
Suncrest Village |
| Orlando, FL |
| 1987 |
| 2005 |
| 93,358 |
| 99 | % | $ | 10.93 |
| $ | 16,400,000 |
|
Plantation Grove |
| Ocoee, FL |
| 1995 |
| 1995 |
| 73,655 |
| 100 | % | $ | 11.64 |
| $ | 13,800,000 |
|
|
|
|
|
|
|
|
|
|
|
|
|
|
|
|
| ||
Subtotal—Retail Properties Average Percent Leased |
|
|
|
|
|
|
| 2,968,328 |
| 96 | % |
|
|
| $ | 689,902,625 |
|
Subtotal—Commercial Properties |
|
|
|
|
|
|
|
|
|
|
|
|
|
| $ | 7,902,551,276 |
|
|
|
|
|
|
|
|
|
|
|
|
|
|
|
|
|
|
|
RESIDENTIAL PROPERTIES(8) |
|
|
|
|
|
|
|
|
|
|
|
|
|
|
|
|
|
Palomino Park Apartments |
| Denver, CO |
| 1996-2001 |
| 2005 |
| NA |
| 92 | % |
| NA |
| $ | 176,232,394 |
|
The Legacy at Westwood Apartments |
| Los Angeles, CA |
| 2001 |
| 2002 |
| NA |
| 98 | % |
| NA |
| $ | 100,000,000 |
|
Larkspur Courts |
| Larkspur, CA |
| 1991 |
| 1999 |
| NA |
| 95 | % |
| NA |
| $ | 86,000,000 |
|
The Colorado |
| New York, NY |
| 1987 |
| 1999 |
| NA |
| 99 | % |
| NA |
| $ | 85,048,163 |
|
Ashford Meadows Apartments |
| Herndon, VA |
| 1998 |
| 2000 |
| NA |
| 94 | % |
| NA |
| $ | 78,904,526 |
|
1050 Lenox Park |
| Atlanta, GA |
| 2001 |
| 2005 |
| NA |
| 97 | % |
| NA |
| $ | 71,000,000 |
|
Regents Court Apartments |
| San Diego, CA |
| 2001 |
| 2002 |
| NA |
| 100 | % |
| NA |
| $ | 62,500,000 |
|
The Caruth |
| Dallas, TX |
| 1999 |
| 2005 |
| NA |
| 93 | % |
| NA |
| $ | 61,200,000 |
|
South Florida Apartment Portfolio |
| Boca Raton and Plantation, FL |
| 1986 |
| 2001 |
| NA |
| 98 | % |
| NA |
| $ | 56,400,000 |
|
|
|
|
|
|
|
|
|
|
|
|
|
|
|
| Each property is held in a 50%/50% joint venture with the Simon Property Group. Market value shown reflects the value of the Account’s interest in the joint venture, net of debt. |
|
|
| Reflects the square footage owned by the joint venture. |
|
|
|
|
|
|
22 |Prospectus TIAA Real Estate Account
Properties(continued)
|
|
|
|
|
|
|
|
|
|
|
|
|
|
|
|
|
|
Property |
| Location |
| Year Built |
| Year |
| Rentable | (1) | Percent |
| Annual Avg. | (2) | Market Value | (3) | ||
RESIDENTIAL PROPERTIES(16)(continued) |
|
|
|
|
|
|
|
|
|
|
|
|
|
|
|
|
|
Glenridge Walk |
| Atlanta, GA |
| 1996, 2001 |
| 2005 |
| NA |
| 95 | % |
| NA |
| $ | 45,300,000 |
|
The Reserve at Sugarloaf |
| Duluth, GA |
| 2000 |
| 2005 |
| NA |
| 97 | % |
| NA |
| $ | 44,800,000 | (4) |
Lincoln Woods Apartments |
| Lafayette Hill, PA |
| 1991 |
| 1997 |
| NA |
| 99 | % |
| NA |
| $ | 35,528,316 |
|
The Maroneal |
| Houston, TX |
| 1998 |
| 2005 |
| NA |
| 97 | % |
| NA |
| $ | 35,000,000 |
|
Alexan Buckhead |
| Atlanta, GA |
| 2002 |
| 2002 |
| NA |
| 99 | % |
| NA |
| $ | 34,800,000 |
|
The Lodge at Willow Creek |
| Denver, CO |
| 1997 |
| 1997 |
| NA |
| 96 | % |
| NA |
| $ | 34,600,000 |
|
Westcreek Apartments |
| Westlake Village, CA |
| 1988 |
| 1997 |
| NA |
| 99 | % |
| NA |
| $ | 30,939,671 |
|
Golfview Apartments |
| Lake Mary, FL |
| 1998 |
| 1998 |
| NA |
| 98 | % |
| NA |
| $ | 30,835,506 |
|
Kenwood Mews Apartments |
| Burbank, CA |
| 1991 |
| 2001 |
| NA |
| 100 | % |
| NA |
| $ | 30,000,000 |
|
The Legends at Chase Oaks |
| Plano, TX |
| 1997 |
| 1998 |
| NA |
| 97 | % |
| NA |
| $ | 28,499,971 |
|
Monte Vista |
| Littleton, CO |
| 1995 |
| 1996 |
| NA |
| 93 | % |
| NA |
| $ | 24,647,901 |
|
Royal St. George |
| W. Palm Beach, FL |
| 1995 |
| 1996 |
| NA |
| 98 | % |
| NA |
| $ | 21,400,000 |
|
The Fairways of Carolina |
| Margate, FL |
| 1993 |
| 2001 |
| NA |
| 100 | % |
| NA |
| $ | 21,100,000 |
|
Quiet Water at Coquina Lakes |
| Deerfield Beach, FL |
| 1995 |
| 2001 |
| NA |
| 100 | % |
| NA |
| $ | 20,912,293 |
|
The Greens at Metrowest Apartments |
| Orlando, FL |
| 1990 |
| 1995 |
| NA |
| 95 | % |
| NA |
| $ | 18,200,000 |
|
|
|
|
|
|
|
|
|
|
|
|
|
|
|
|
| ||
Subtotal—Residential Properties Average Percent Leased |
|
|
|
|
|
|
|
|
| 97 | % |
|
|
| $ | 1,233,848,741 |
|
OTHER COMMERCIAL PROPERTIES |
|
|
|
|
|
|
|
|
|
|
|
|
|
|
|
|
|
Storage Portfolio I(5) |
| Various, U.S. |
| 1972—1990 |
| 2003 |
| 2,225,234 |
| 80 | % | $ | 9.77 |
| $ | 63,237,298 |
|
|
|
|
|
|
|
|
|
|
|
|
|
|
|
|
| ||
|
|
|
|
|
|
|
|
|
|
|
|
|
|
|
|
|
|
Total—All Properties |
|
|
|
|
|
|
| 56,960,880 |
|
|
|
|
|
| $ | 9,199,637,315 |
|
| The |
|
|
|
|
|
|
|
|
(23) | For the average unit size and annual average rent per unit for each residential property, see “Residential Properties” below. |
(24) | The Houston Apartment Portfolio contains 11 properties that are a mix of two and three-story luxury garden style apartments and are located in Houston, Texas. |
(25) | The Kierland Apartment Portfolio contains three properties that are a mix of two and three-story luxury garden style apartments and are located in Scottsdale, Arizona. |
(26) | The Phoenix Apartment Portfolio contains four properties that are a mix of two and three-story luxury garden style apartments and are located in the greater Phoenix area in Arizona. |
TIAA Real Estate AccountProspectus|| 2327
COMMERCIAL (NON-RESIDENTIAL) PROPERTIES
In General.At December 31, 2005,2006, the Account held 8598 commercial (non-residential) propertiesproperty investments in its portfolio, including a portfolio of storage facilities located throughout the United States. ElevenTwelve of these properties arewere held through joint ventures, and thirteen are18 were subject to mortgages. Although the terms vary under each lease, certain expenses, such as real estate taxes and other operating expenses, are paid or reimbursed in whole or in part by the tenants.
TheManagement believes that the Account’s portfolio is well diversified by both property type as well asand geographic location. The portfolio consists of: 4549 office properties containing approximately 2123 million square feet located in 13 states, the District of Columbia and the United Kingdom; 3035 industrial properties containing 3135 million square feet located in 14 states, including a 60% interest in a portfolio of industrial properties located throughout the United States; and 913 retail properties containing approximately 3five million square feet located in 5six states and the District of Columbia. In addition, the Account has a 75% interest in a portfolio of storage facilities located throughout the United States containing approximately 2.2 million square feet.
As of December 31, 2005,2006, the average overall occupancy rate of the Account’s commercial real estate portfolio was 91% on a weighted94%. On an average basis. Officebasis, the Account’s office properties were 87%92% leased, with 1,843 leases, industrial properties were 95% leased with 340 leases, and retail properties were 96% leased, with 587 leases. No single tenant accounts for more than 1.9% ofretail properties were 98% leased and the total rentable area of the Account’s commercial properties.storage portfolio was 83% leased.
Major Tenants:The following table lists the Account’s major commercial tenants based on the total space they occupied as of December 31, 2005,2006, in the Account’s properties.
|
|
|
|
|
|
|
|
|
|
|
|
| Occupied |
| Percentage of |
| Percentage of |
| |||
MAJOR INDUSTRIAL TENANTS |
|
|
|
|
|
|
|
|
|
|
Wal-Mart |
|
| 1,099,112 |
|
| 3.5 | % |
| 1.9 | % |
Gap |
|
| 1,045,000 |
|
| 3.4 | % |
| 1.8 | % |
GE |
|
| 1,004,000 |
|
| 3.2 | % |
| 1.8 | % |
Regal Logistics |
|
| 968,535 |
|
| 3.1 | % |
| 1.7 | % |
Tyco Healthcare |
|
| 800,000 |
|
| 2.6 | % |
| 1.4 | % |
Hewlett-Packard |
|
| 708,532 |
|
| 2.3 | % |
| 1.2 | % |
Kaz |
|
| 700,000 |
|
| 2.2 | % |
| 1.2 | % |
Del Monte |
|
| 689,660 |
|
| 2.2 | % |
| 1.2 | % |
RR Donnelley |
|
| 659,157 |
|
| 2.1 | % |
| 1.2 | % |
Priority Fulfillment |
|
| 602,500 |
|
| 1.9 | % |
| 1.1 | % |
|
|
|
|
|
|
|
|
|
|
|
|
| Occupied |
| Percentage of |
| Percentage of |
| |||
MAJOR INDUSTRIAL TENANTS |
|
|
|
|
|
|
|
|
|
|
Walmart |
|
| 1,099,112 |
|
| 3.1 | % |
| 1.8 | % |
Gap |
|
| 1,045,000 |
|
| 3.0 | % |
| 1.7 | % |
General Electric |
|
| 1,004,000 |
|
| 2.9 | % |
| 1.6 | % |
Priority Fulfillment Services |
|
| 993,120 |
|
| 2.8 | % |
| 1.6 | % |
Regal West |
|
| 968,535 |
|
| 2.8 | % |
| 1.5 | % |
Tyco Healthcare |
|
| 800,000 |
|
| 2.3 | % |
| 1.3 | % |
TNT |
|
| 756,600 |
|
| 2.2 | % |
| 1.2 | % |
Hewlett Packard |
|
| 708,532 |
|
| 2.0 | % |
| 1.1 | % |
Kaz |
|
| 700,000 |
|
| 2.0 | % |
| 1.1 | % |
Del Monte |
|
| 689,660 |
|
| 2.0 | % |
| 1.1 | % |
24 28|ProspectusTIAA Real Estate Account
|
|
|
|
|
|
|
|
|
|
|
|
| Occupied |
| Percentage of |
| Percentage of |
| |||
MAJOR OFFICE TENANTS |
|
|
|
|
|
|
|
|
|
|
Southern Company Services |
|
| 448,004 |
|
| 2.2 | % |
| 0.8 | % |
Deloitte & Touche |
|
| 417,221 |
|
| 2.0 | % |
| 0.7 | % |
Mellon (Boston Co) |
|
| 361,623 |
|
| 1.8 | % |
| 0.6 | % |
Yahoo! |
|
| 330,825 |
|
| 1.6 | % |
| 0.6 | % |
AON |
|
| 322,662 |
|
| 1.6 | % |
| 0.6 | % |
Crowell & Moring |
|
| 320,514 |
|
| 1.6 | % |
| 0.6 | % |
Accenture |
|
| 302,730 |
|
| 1.5 | % |
| 0.5 | % |
BHP Petroleum |
|
| 267,486 |
|
| 1.3 | % |
| 0.5 | % |
Chicago Title & Trust |
|
| 267,118 |
|
| 1.3 | % |
| 0.5 | % |
ATMOS Energy |
|
| 260,377 |
|
| 1.3 | % |
| 0.5 | % |
|
|
|
|
|
|
|
|
|
|
|
|
| Occupied |
| Percentage of |
| Percentage of |
| |||
MAJOR RETAIL TENANTS |
|
|
|
|
|
|
|
|
|
|
JC Penney |
|
| 196,931 |
|
| 6.6 | % |
| 0.3 | % |
Proffitts |
|
| 162,501 |
|
| 5.5 | % |
| 0.3 | % |
Parisian |
|
| 143,278 |
|
| 4.8 | % |
| 0.3 | % |
Neiman Marcus |
|
| 124,314 |
|
| 4.2 | % |
| 0.2 | % |
Saks Fifth Avenue |
|
| 127,727 |
|
| 4.3 | % |
| 0.2 | % |
Home Depot Expo Design |
|
| 98,350 |
|
| 3.3 | % |
| 0.2 | % |
Publix |
|
| 90,067 |
|
| 3.0 | % |
| 0.2 | % |
Regal Cinema |
|
| 76,580 |
|
| 2.6 | % |
| 0.1 | % |
King Soopers |
|
| 64,532 |
|
| 2.2 | % |
| 0.1 | % |
Super Fresh |
|
| 61,059 |
|
| 2.1 | % |
| 0.1 | % |
|
|
|
|
|
|
|
|
|
|
|
|
| Occupied |
| Percentage of |
| Percentage of |
| |||
MAJOR OFFICE TENANTS |
|
|
|
|
|
|
|
|
|
|
Deloitte & Touche |
|
| 517,705 |
|
| 2.3 | % |
| 0.8 | % |
Yahoo! |
|
| 476,740 |
|
| 2.1 | % |
| 0.8 | % |
Southern Company Services, Inc |
|
| 448,004 |
|
| 2.0 | % |
| 0.7 | % |
Mellon (Boston Co) |
|
| 361,623 |
|
| 1.6 | % |
| 0.6 | % |
Microsoft |
|
| 361,528 |
|
| 1.6 | % |
| 0.6 | % |
Crowell & Moring |
|
| 320,539 |
|
| 1.4 | % |
| 0.5 | % |
BHP Petroleum |
|
| 316,638 |
|
| 1.4 | % |
| 0.5 | % |
Accenture |
|
| 302,730 |
|
| 1.3 | % |
| 0.5 | % |
Met Life Insurance |
|
| 289,433 |
|
| 1.3 | % |
| 0.5 | % |
IDX Systems |
|
| 284,631 |
|
| 1.3 | % |
| 0.5 | % |
|
|
|
|
|
|
|
|
|
|
|
Year of Lease Expiration |
| Rentable Area Subject |
|
|
|
| Percentage of Total |
| ||
OFFICE PROPERTIES |
|
|
|
|
|
|
|
|
|
|
2006 |
|
| 1,612,787 |
|
|
|
|
| 7.8 | % |
2007 |
|
| 2,051,460 |
|
|
|
|
| 9.9 | % |
2008 |
|
| 1,880,522 |
|
|
|
|
| 9.1 | % |
2009 |
|
| 1,778,969 |
|
|
|
|
| 8.6 | % |
2010 |
|
| 2,476,157 |
|
|
|
|
| 12.0 | % |
2011 and thereafter |
|
| 9,080,969 |
|
|
|
|
| 44.0 | % |
Total |
|
| 18,880,864 |
|
|
|
|
| 91.5 | % |
|
|
|
|
|
|
|
|
|
|
|
|
| Occupied |
| Percentage of |
| Percentage of |
| |||
MAJOR RETAIL TENANTS |
|
|
|
|
|
|
|
|
|
|
Publix |
|
| 313,859 |
|
| 6.4 | % |
| 0.5 | % |
JC Penney |
|
| 196,931 |
|
| 4.0 | % |
| 0.3 | % |
Belk |
|
| 162,501 |
|
| 3.3 | % |
| 0.3 | % |
Parisian |
|
| 143,278 |
|
| 2.9 | % |
| 0.2 | % |
Saks & Co. |
|
| 127,727 |
|
| 2.6 | % |
| 0.2 | % |
Neiman Marcus |
|
| 124,314 |
|
| 2.5 | % |
| 0.2 | % |
Bed Bath & Beyond |
|
| 101,100 |
|
| 2.1 | % |
| 0.2 | % |
Expo Design |
|
| 98,350 |
|
| 2.0 | % |
| 0.2 | % |
Old Navy |
|
| 82,075 |
|
| 1.7 | % |
| 0.1 | % |
Regal Cinema |
|
| 76,580 |
|
| 1.6 | % |
| 0.1 | % |
TIAA Real Estate AccountProspectus|| 2529
|
|
|
|
|
|
|
|
|
|
|
Year of Lease Expiration |
| Rentable Area Subject |
|
|
|
| Percentage of Total |
| ||
INDUSTRIAL PROPERTIES |
|
|
|
|
|
|
|
|
|
|
2006 |
|
| 4,154,942 |
|
|
|
|
| 13.4 | % |
2007 |
|
| 2,780,562 |
|
|
|
|
| 8.9 | % |
2008 |
|
| 4,518,870 |
|
|
|
|
| 14.5 | % |
2009 |
|
| 4,950,215 |
|
|
|
|
| 15.9 | % |
2010 |
|
| 4,001,848 |
|
|
|
|
| 12.9 | % |
2011 and thereafter |
|
| 8,315,003 |
|
|
|
|
| 26.7 | % |
Total |
|
| 28,721,440 |
|
|
|
|
| 92.3 | % |
The following table lists the rentable area subject to expiring leases during the next five years, and an aggregate figure for expirations in 2012 and thereafter, in the Account’s properties.
|
|
|
|
|
|
|
|
Year of Lease Expiration |
| Rentable Area Subject |
| Percentage of Total |
| ||
OFFICE PROPERTIES |
|
|
|
|
|
|
|
2007 |
|
| 2,229,661 |
|
| 9.9 | % |
2008 |
|
| 2,171,122 |
|
| 9.6 | % |
2009 |
|
| 1,913,318 |
|
| 8.5 | % |
2010 |
|
| 2,335,573 |
|
| 10.3 | % |
2011 |
|
| 2,945,731 |
|
| 13.0 | % |
2012 and thereafter |
|
| 9,272,527 |
|
| 41.0 | % |
Total |
|
| 20,867,932 |
|
| 92.2 | % |
|
|
|
|
|
|
|
|
|
|
|
|
|
|
|
|
|
|
Year of Lease Expiration |
| Rentable Area Subject |
|
|
| Percentage of Total |
|
| Rentable Area Subject |
| Percentage of Total |
| |||||
RETAIL PROPERTIES |
|
|
|
|
|
|
| ||||||||||
2006 |
| 173,237 |
|
|
| 5.8 | % | ||||||||||
INDUSTRIAL PROPERTIES |
|
|
|
|
| ||||||||||||
2007 |
| 282,367 |
|
|
| 9.5 | % |
| 3,915,050 |
| 11.2 | % | |||||
2008 |
| 362,003 |
|
|
| 12.2 | % |
| 5,034,465 |
| 14.4 | % | |||||
2009 |
| 164,045 |
|
|
| 5.5 | % |
| 6,078,823 |
| 17.4 | % | |||||
2010 |
| 253,433 |
|
|
| 8.5 | % |
| 4,464,370 |
| 12.8 | % | |||||
2011 and thereafter |
| 1,629,428 |
|
|
| 54.9 | % | ||||||||||
2011 |
| 3,780,235 |
| 10.8 | % | ||||||||||||
2012 and thereafter |
| 9,397,067 |
| 26.8 | % | ||||||||||||
Total |
| 2,864,513 |
|
|
| 96.5 | % |
| 32,670,010 |
| 93.3 | % | |||||
|
|
|
|
|
|
|
|
Year of Lease Expiration |
| Rentable Area Subject |
| Percentage of Total |
| ||
RETAIL PROPERTIES |
|
|
|
|
|
|
|
2007 |
|
| 324,085 |
|
| 6.6 | % |
2008 |
|
| 283,346 |
|
| 5.8 | % |
2009 |
|
| 374,582 |
|
| 7.6 | % |
2010 |
|
| 534,841 |
|
| 10.9 | % |
2011 |
|
| 462,270 |
|
| 9.4 | % |
2012 and thereafter |
|
| 2,770,806 |
|
| 56.3 | % |
Total |
|
| 4,749,930 |
|
| 96.5 | % |
(1) | The percentages indicated as expiring in a given year may not equal the total percentages due to rounding. |
30|ProspectusTIAA Real Estate Account
RESIDENTIAL PROPERTIES
The Account’s residential property portfolio currently consists of 2423 property investments comprised of first class or luxury multi-family, garden, apartment complexes, mid-risemidrise, and high risehigh-rise apartment buildings. The portfolio contains approximately 7,50211,106 units located in 8nine states and is 97% leased overall. Nonehas a 95% average occupancy rate. One of the residential properties in the portfolio is subject to a mortgage. The complexes generally contain one- to three-bedroom apartment units with a range of amenities, such as patios or balconies, washers and dryers, and central air conditioning. Many of these apartment communities have use of on-site fitness facilities, including some with swimming pools. Rents on each of the properties tend to be comparable with competitive communities and are not subject to rent regulation. The Account is responsible for the expenses of operating theits residential properties.
26 |Prospectus TIAA Real Estate Account
The table below provides additionalcontains detailed information regarding the residential propertiesapartment complexes in the Account’s portfolio as of December 31, 2005.2006.
|
|
|
|
|
|
|
|
|
|
|
|
|
|
|
|
|
|
|
|
|
|
|
|
Property |
| Location |
| Number |
| Average |
| Avg. Rent |
|
| Location |
| Number |
| Average |
| Avg. Rent |
| |||||
The Greens at Metrowest |
| Orlando, FL |
| 200 |
| 920 |
|
| $ | 930 |
|
| Orlando, FL |
| 200 |
|
| 920 |
|
| $ | 940 |
|
Monte Vista |
| Littleton, CO |
| 219 |
| 888 |
|
| $ | 1,029 |
| ||||||||||||
Royal St. George |
| West Palm Beach, FL |
| 224 |
| 870 |
|
| $ | 990 |
| ||||||||||||
The Royal St. George Apts |
| West Palm Beach, FL |
| 224 |
|
| 870 |
|
| $ | 1,056 |
| |||||||||||
Westcreek Apartments |
| Thousand Oaks, CA |
| 126 |
| 951 |
|
| $ | 1,798 |
|
| Westlake Village, CA |
| 126 |
|
| 951 |
|
| $ | 1,819 |
|
Lincoln Woods Apartments |
| Lafayette Hill, PA |
| 216 |
| 774 |
|
| $ | 1,235 |
|
| Lafayette Hill, PA |
| 216 |
|
| 774 |
|
| $ | 1,272 |
|
The Lodge at Willow Creek |
| Douglas County, CO |
| 316 |
| 996 |
|
| $ | 1,016 |
| ||||||||||||
Lodge at Willow Creek |
| Denver, CO |
| 316 |
|
| 996 |
|
| $ | 1,008 |
| |||||||||||
Legends at Chase Oaks |
| Plano, TX |
| 346 |
| 972 |
|
| $ | 1,082 |
|
| Plano, TX |
| 346 |
|
| 972 |
|
| $ | 1,082 |
|
Golfview Apartments |
| Lake Mary, FL |
| 276 |
| 1,149 |
|
| $ | 1,223 |
| ||||||||||||
The Colorado |
| New York, NY |
| 256 |
| 622 |
|
| $ | 2,492 |
|
| New York, NY |
| 256 |
|
| 622 |
|
| $ | 2,703 |
|
Larkspur Courts |
| Larkspur, CA |
| 248 |
| 1,001 |
|
| $ | 1,859 |
|
| Larkspur, CA |
| 248 |
|
| 1,001 |
|
| $ | 2,086 |
|
Ashford Meadows |
| Herndon, VA |
| 440 |
| 1,050 |
|
| $ | 1,430 |
|
| Herndon, VA |
| 440 |
|
| 1,050 |
|
| $ | 1,435 |
|
South Florida Apartment Portfolio |
| Ft. Lauderdale, FL |
| 550 |
| 889 |
|
| $ | 1,036 |
|
| Boca Raton, Plantation, FL |
| 550 |
|
| 889 |
|
| $ | 1,105 |
|
The Fairways of Carolina |
| Margate, FL |
| 208 |
| 1,026 |
|
| $ | 1,058 |
| ||||||||||||
Quiet Waters at Coquina Lakes |
| Deerfield Beach, FL |
| 200 |
| 1,048 |
|
| $ | 1,118 |
| ||||||||||||
Kenwood Mews Apartments |
| Burbank, CA |
| 141 |
| 942 |
|
| $ | 1,520 |
| ||||||||||||
The Legacy at Westwood |
| Los Angeles, CA |
| 187 |
| 1,181 |
|
| $ | 4,006 |
| ||||||||||||
Fairways of Carolina |
| Margate, FL |
| 208 |
|
| 1,026 |
|
| $ | 1,160 |
| |||||||||||
Quiet Waters Apartments |
| Deerfield Beach, FL |
| 200 |
|
| 1,048 |
|
| $ | 1,250 |
| |||||||||||
Legacy at Westwood |
| Los Angeles, CA |
| 187 |
|
| 1,181 |
|
| $ | 4,223 |
| |||||||||||
Regents Court |
| San Diego, CA |
| 251 |
| 886 |
|
| $ | 1,613 |
|
| San Diego, CA |
| 251 |
|
| 884 |
|
| $ | 1,717 |
|
Alexan Buckhead |
| Atlanta, GA |
| 231 |
| 990 |
|
| $ | 1,200 |
| ||||||||||||
The Reserve at Sugarloaf |
| Atlanta, GA |
| 333 |
| 1,220 |
|
| $ | 1,144 |
|
| Duluth, GA |
| 333 |
|
| 1,220 |
|
| $ | 1,149 |
|
The Maroneal |
| Houston, TX |
| 309 |
| 1,232 |
|
| $ | 1,158 |
|
| Houston, TX |
| 309 |
|
| 928 |
|
| $ | 1,207 |
|
Glenridge Walk |
| Atlanta, GA |
| 296 |
| 1,143 |
|
| $ | 1,340 |
|
| Atlanta, GA |
| 296 |
|
| 1,142 |
|
| $ | 1,337 |
|
1050 Lenox Park |
| Atlanta, GA |
| 407 |
| 1,007 |
|
| $ | 1,154 |
|
| Atlanta, GA |
| 407 |
|
| 1,023 |
|
| $ | 1,386 |
|
Caruth at Lincoln Park |
| Dallas, TX |
| 338 |
|
| 1,168 |
|
| $ | 1,680 |
| |||||||||||
Palomino Park |
| Denver, CO |
| 1,184 |
| 1,096 |
|
| $ | 1,244 |
|
| Highlands Ranch, CO |
| 1,184 |
|
| 1,095 |
|
| $ | 1,520 |
|
The Caruth Apartments |
| Dallas, TX |
| 338 |
| 1,168 |
|
| $ | 1,534 |
| ||||||||||||
Houston Apartment Portfolio |
| Houston, TX |
| 2,295 |
|
| 1,062 |
|
| $ | 1,332 |
| |||||||||||
Phoenix Apartment Portfolio |
| Greater Phoenix, AZ |
| 1,176 |
|
| 996 |
|
| $ | 1,084 |
| |||||||||||
Kierland Apartment Portfolio |
| Scottsdale, AZ |
| 1,000 |
|
| 1,049 |
|
| $ | 1,166 |
| |||||||||||
RECENT PROPERTY PURCHASES AND SALESTRANSACTIONS
The following describes properties purchased or expected to be purchasedproperty transactions by the Account since November 15, 2005,February 1, 2007, the date of the last supplement to the Account prospectus describing property purchases. Except as noted, the expenses for operating the properties purchased are either borne or reimbursed, in whole or in part, by the property tenants, although the terms vary under each lease. The Account is responsible for operating expenses not reimbursed under the terms of a lease. All rental rates are quoted on an annual basis unless otherwise noted.
TIAA Real Estate AccountProspectus|31
PURCHASES
OfficeRetail Properties
Lincoln Centre – Dallas TXJoint Venture with Developers Diversified Realty Corporation
On February 27, 2007, DDR/TC Core Retail Fund, LLC, a Delaware limited liability company (Company) and a joint venture between a wholly owned subsidiary of TIAA, for the benefit of the Account, and a wholly owned subsidiary of Developers Diversified Realty Corporation (DDR), acquired an aggregate of 66 community center properties located predominantly the southeastern United States for approximately $3.0 billion of total asset value (collectively, the “Portfolio”). Prior to this acquisition, the Properties were owned by Inland Retail Real Estate Trust, Inc. The Account contributed 85% of the equity in the Company (approximately $1.04 billion) and DDR contributed 15% of the equity in the Company (approximately $170 million). The Portfolio consists of approximately 17.0 million square feet of owned gross leasable area (over 18 million square feet including “shadow” anchors) and has an average occupancy of approximately 96.0%. The properties are located in 13 states, with 42 properties, representing approximately 60.7% of the Portfolio’s valuation, located in Georgia, North Carolina and Florida. The largest asset accounts for 6.3% of the total value and the largest state concentration is in Georgia with 18 properties which account for 34.6% of the Portfolio’s total value. The majority of the Portfolio is anchored by well-known, high-quality retailers including Wal-Mart (6%), Kohl’s (5%), Ross Dress for Less (3%), Goody’s Family Clothing (3%), and Linens ‘N Things (2%).
The Portfolio is subject to an aggregate of approximately $1.8 billion in indebtedness and consists of assumed indebtedness and three separate pools of financing, each provided by a different lender. Solely for purposes of the financing, the lenders have divided the Portfolio into 70 individual properties. The material components of the three pools of financing are as follows:
• | One lender has provided 25 individual non-recourse loans, to subsidiaries of Company, with customary recourse carve-outs, in the aggregate amount of $736,558,611. The loans bear interest at a fixed rate of 5.4475%. Each loan is a separate, individual loan secured by an individual community retail center and each loan is not cross-collateralized or cross-defaulted with any of the other loans or other community retail centers. | |
• | One lender has provided a non-recourse loan, to subsidiaries of Company, with customary recourse carve-outs, in the aggregate amount of $559,533,762. The loan bears interest at a fixed rate of 5.48%. This loan is secured by 17 community retail centers. The loan is cross-defaulted and cross-collateralized on a Portfolio basis, but Company will be permitted to transfer any or all of the 17 individual properties upon compliance with certain conditions, including the requirement that either the transferee expressly assumes the loan or Company reduces the loan amount allocated to the transferred property by an amount in excess of the loan value. | |
• | One lender has provided a $250,000,000 5-year (a base 3-year term with two 1-year options) revolving credit recourse loan to Company at an interest rate calculated as the London Interbank Offered Rate (LIBOR) plus 65 basis |
32|ProspectusTIAA Real Estate Account
points (0.65%), calculated on a Actual/ 360-day year basis. The facility also provides for assets within the collateral to be released or substituted. This facility is initially secured by 13 community retail centers. |
Finally, Company assumed indebtedness on a total of 15 properties with an aggregate loan balance amount of approximately $285 million. These individual loans mature between June 2009 and June 2018, and all but one loan matures on or before August 2012.
Printemps De L’Homme - Paris, France
On December 1, 2005,March 8, 2007, the Account purchased an office complex containing three Class A office buildings and the adjoining Lincoln City Club locateda retail center in Dallas, Texas, subject to debt,Paris, France for approximately $255.3$263.7 million. Lincoln Centre,The property consists of a nine-story retail building with three basement levels, was built in 1981-1984the 1930s, and underwent major renovations in 1999. The retail center contains 1,635,352 net rentable142,365 square feet and was 86%is 100% leased at the time of purchase. The three largest tenants are Atmos Energy (259,887 square feet), Santa Fe Energy (99,644 square feet), and Valhi/Contran (59,956 square feet)to France Printemps SA for their Printemps De L’Homme (Men’s Store). Rental rates average $19.44637 Euros per square foot,meter (at the time of underwriting, equivalent to $78.12 per square foot), which is below the current average market rent for comparable properties. The property is located in the Far North Dallas Class A submarket,Paris City Centre and Shopping Centre market, which had approximately 16.2consists of 4.2 million square feetmeters (45.21 million square feet) and had a direct vacancy rate of 14.2% or 16.59% including sublet space3% at the time of purchase.
TIAA Real Estate Account Prospectus | 27
Embarcadero Center West – San Francisco, CASALES
On December 14, 2005, the Account purchased a thirty-story, Class A office building, located in San Francisco, California for approximately $206.0 million. Embarcadero Center, built in 1988 contains 472,261 square feet, and was 85% leased at the time of purchase. The three largest tenants are Gordon & Rees, LLP (83,313 square feet), O’ Melveny and Meyers (75,280 square feet), and Lieff, Cabraser, Heinman and Bernstein LLP (53,292 square feet). Rental rates average $40.60 per square foot, which is above the current average market rent for comparable properties. The property is located in the North Financial District of San Francisco, which had approximately 23.8 million square feet and a direct vacancy rate of 10.2% or 12.9% including sublet space at the time of purchase.
Residential Properties
Palomino Park Apartments – Denver, COThe Greens at MetroWest - Orlando, FL
On November 22, 2005, the Account purchased a Class A apartment complex containing 1,184 units, located in Denver, Colorado for approximately $176.2 million. The Palomino was built between 1996 and 2001, and was 93% occupied at the time of purchase. Property amenities include a 30 acre park, a central club house, tennis and racquet ball courts, a fitness center and an outdoor resort style pool. . Rental rates average $1.14 per square foot per month, which is within the current average market rent for comparable properties. The property is located in the Highlands Ranch/Lone Tree submarket, which had approximately 5,989 units, with a vacancy rate of 10.0% at the time of purchase.
Industrial Properties
GE Appliance East Coast Distribution Facility – Perryville, MD
On December 29, 2005, the Account purchased a bulk distribution warehouse consisting of a single-story building in Perryville, Maryland for approximately $46.5 million. The purchase included 12.4 acres of land for an expansion option of 200,000 square feet of space. GE Appliance East Coast Distribution Facility, built in 2003, contains 1,004,000 rentable square feet and was 100% leased to the General Electric Company. Rental rates average $2.82 per square foot, which is below the current average market rent for comparable properties. The property is located in the Hartford/Cecil County submarket which had approximately 15.0 million square feet and a vacancy rate of 15.8% at the time of purchase.
Broadlands Business Park – Elkton, MD
On February 17, 2006, the Account purchased a single-story industrial building, located in Elkton, Maryland for approximately $34.7 million. The purchase includes approximately 10 acres of land for an additional 150,000 square feet of expansion space. Broadlands Business Park, built in 2006, contains 756,690 rentable square feet and was 100% leased to TNT Logistics N.A. Rental rates average $2.85 per square foot, which is below the current average market rent for
28 |Prospectus TIAA Real Estate Account
comparable properties. The property is located in the Hartford/Cecil County submarket, which had approximately 15 million square feet and a vacancy of 15.8% at the time of purchase.
Retail Properties
Plainsboro Plaza – Plainsboro, NJ
On December 23, 2005, the Account purchased a neighborhood retail shopping center in Plainsboro, New Jersey for approximately $50.7 million. Plainsboro Plaza, built in 1987 and renovated in 2002, contains 218,653 gross leaseable square feet and was 92% leased at the time of purchase to 34 tenants. The anchor tenants are Super Fresh (61,059 square feet) and CVS Pharmacy (12,150 square feet). Rental rates average $13.64 per square foot, which is within the current average market rent for comparable properties. The shopping center is located in the Princeton market, which for grocery anchored retail centers, had a vacancy of 2.3% at the time of purchase.
The following describes property sales by the Account since November 15, 2005, the date of the last supplement to the Account prospectus describing property sales. Keep in mind that any changes in the valuation of the property since it was purchased have been reflected in the Account’s daily unit value over the period the Account held the property.
Rolling Meadows Shopping Center – Rolling Meadows, IL
On November 29, 200514, 2007, the Account sold a 130,909 square foot neighborhood, grocery anchored shopping centeran apartment complex in Orlando, Florida for net sales proceeds of approximately $18.0$21.7 million. The Account purchased the property on May 28, 1997December 15, 1995 for an original investment for $12.9of $12.5 million.
Biltmore Commerce Center – Phoenix, AZ
On December 28, 2005, At the Account sold a three story, multi-tenant office building for $57.5 million. The Account purchasedtime of sale, the property on February 23, 1999 for an original investment for $35.2 million.
had a market value of $21.5 million and a cost to date of $15.0 million in the records of the Account.
TIAA Real Estate AccountProspectus|| 2933
The following selected financial data should be considered in conjunction with the Account’s financial statements and notes provided in this report.prospectus.
|
|
|
|
|
|
|
|
|
|
|
|
|
|
|
|
|
|
|
|
|
|
|
|
|
|
|
|
|
|
|
|
|
|
| Year Ended |
| Year Ended |
| Year Ended |
| Year Ended |
| Year Ended |
|
| Year Ended |
| Year Ended |
| Year Ended |
| Year Ended |
| Year Ended |
| ||||||||||
Investment income: |
|
|
|
|
|
|
|
|
|
|
|
|
|
|
|
|
|
|
|
|
|
| ||||||||||
Real estate income, net |
| $ | 340,089,550 |
| $ | 239,429,500 |
| $ | 224,938,080 |
| $ | 198,998,685 |
| $ | 180,752,326 |
|
| $ | 444,782,843 |
| $ | 340,089,550 |
| $ | 239,429,500 |
| $ | 224,938,080 |
| $ | 198,998,685 |
|
Income from real estate joint ventures |
| 63,580,501 |
| 57,275,242 |
| 31,989,569 |
| 17,077,072 |
| 1,580,805 |
| |||||||||||||||||||||
Income from real estate joint ventures and limited partnerships |
| 84,671,528 |
| 71,826,443 |
| 71,390,397 |
| 31,989,569 |
| 17,077,072 |
| |||||||||||||||||||||
Dividends and interest |
| 79,245,154 |
| 41,623,715 |
| 19,461,931 |
| 26,437,901 |
| 33,687,343 |
|
| 135,407,210 |
| 70,999,212 |
| 27,508,560 |
| 19,461,931 | �� |
| 26,437,901 |
| |||||||||
Total investment income |
| 482,915,205 |
| 338,328,457 |
| 276,389,580 |
| 242,513,658 |
| 216,020,474 |
|
| 664,861,581 |
| 482,915,205 |
| 338,328,457 |
| 276,389,580 |
| 242,513,658 |
| ||||||||||
Expenses |
| 56,100,197 |
| 36,728,425 |
| 31,654,065 |
| 23,304,336 |
| 17,191,929 |
|
| 83,448,664 |
| 56,100,197 |
| 36,728,425 |
| 31,654,065 |
| 23,304,336 |
| ||||||||||
Investment income, net |
| 426,815,008 |
| 301,600,032 |
| 244,735,515 |
| 219,209,322 |
| 198,828,545 |
|
| 581,412,917 |
| 426,815,008 |
| 301,600,032 |
| 244,735,515 |
| 219,209,322 |
| ||||||||||
Net realized and unrealized gain (loss) on investments |
| 765,970,272 |
| 414,580,303 |
| 58,837,371 |
| (102,967,284 | ) |
| (29,609,560 | ) | ||||||||||||||||||||
Net realized and unrealized gain (loss) on investments and mortgage notes payable |
| 1,032,787,765 |
| 765,970,272 |
| 414,580,303 |
| 58,837,371 |
| (102,967,284 | ) | |||||||||||||||||||||
Net increase in net assets resulting from operations |
| 1,192,785,280 |
| 716,180,335 |
| 303,572,886 |
| 116,242,038 |
| 169,218,985 |
|
| 1,614,200,682 |
| 1,192,785,280 |
| 716,180,335 |
| 303,572,886 |
| 116,242,038 |
| ||||||||||
Participant transactions |
| 2,110,375,836 |
| 1,735,947,490 |
| 813,860,715 |
| 346,079,345 |
| 657,326,121 |
|
| 1,969,780,728 |
| 2,110,375,836 |
| 1,735,947,490 |
| 813,860,715 |
| 346,079,345 |
| ||||||||||
Net increase in net assets |
| $ | 3,303,161,116 |
| $ | 2,452,127,825 |
| $ | 1,117,433,601 |
| $ | 462,321,383 |
| $ | 826,545,106 |
|
| $ | 3,583,981,410 |
| $ | 3,303,161,116 |
| $ | 2,452,127,825 |
| $ | 1,117,433,601 |
| $ | 462,321,383 |
|
Total Return |
| 14.02 | % |
| 12.57 | % |
| 7.50 | % |
| 3.41 | % |
| 6.29 | % | |||||||||||||||||
|
| December 31, |
| |||||||||||||||||||||||||||||
|
| 2005 |
| 2004 |
| 2003 |
| 2002 |
| 2001 |
| |||||||||||||||||||||
Total assets |
| $ | 11,685,426,413 |
| $ | 7,843,979,924 |
| $ | 4,867,089,727 |
| $ | 3,731,503,245 |
| $ | 3,262,648,457 |
| ||||||||||||||||
Total liabilities |
| 1,136,715,311 |
| 598,429,938 |
| 73,667,566 |
| 55,514,685 |
| 48,981,280 |
| |||||||||||||||||||||
Total net assets |
| $ | 10,548,711,102 |
| $ | 7,245,549,986 |
| $ | 4,793,422,161 |
| $ | 3,675,988,560 |
| $ | 3,213,667,177 |
| ||||||||||||||||
Accumulation units outstanding |
| 42,623,491 |
| 33,337,597 |
| 24,724,183 |
| 20,346,696 |
| 18,456,445 |
| |||||||||||||||||||||
Accumulation unit value |
| $ | 239.95 |
| $ | 210.44 |
| $ | 186.94 |
| $ | 173.90 |
| $ | 168.16 |
| ||||||||||||||||
Mortgage notes payable |
| $ | 973,502,186 |
| $ | 499,479,256 |
| — |
| — |
| — |
| |||||||||||||||||||
|
|
|
|
|
|
|
|
|
|
|
|
|
|
|
|
|
|
| December 31, |
| |||||||||||||
|
|
| ||||||||||||||
|
| 2006 |
| 2005 |
| 2004 |
| 2003 |
| 2002 |
| |||||
Total assets |
| $ | 15,759,961,333 |
| $ | 11,685,426,413 |
| $ | 7,843,979,924 |
| $ | 4,867,089,727 |
| $ | 3,731,503,245 |
|
Total liabilities |
|
| 1,627,268,821 |
|
| 1,136,715,311 |
|
| 598,429,938 |
|
| 73,667,566 |
|
| 55,514,685 |
|
Total net assets |
| $ | 14,132,692,512 |
| $ | 10,548,711,102 |
| $ | 7,245,549,986 |
| $ | 4,793,422,161 |
| $ | 3,675,988,560 |
|
Accumulation units outstanding |
|
| 50,142,688 |
|
| 42,623,491 |
|
| 33,337,597 |
|
| 24,724,183 |
|
| 20,346,696 |
|
Accumulation unit value |
| $ | 273.65 |
| $ | 239.95 |
| $ | 210.44 |
| $ | 186.94 |
| $ | 173.90 |
|
Mortgage notes payable |
| $ | 1,437,149,148 |
| $ | 973,502,186 |
| $ | 499,479,256 |
|
| — |
|
| — |
|
30 34|Prospectus TIAA Real Estate Account
QUARTERLY SELECTED FINANCIAL INFORMATION
The following selected unaudited financial data for each full quarter of 20052006 and 20042005 are derived from the financial statements of the Account for the years ended December 31, 20052006 and 2004.2005.
|
|
|
|
|
|
|
|
|
|
|
|
|
|
|
|
|
|
|
|
|
|
|
|
|
|
|
|
| 2005 |
|
| 2006 |
| ||||||||||||||||||||
|
|
| ||||||||||||||||||||||||
|
| March 31 |
| June 30 |
| September 30 |
| December 31 |
|
| March 31 |
| June 30 |
| September 30 |
| December 31 |
| ||||||||
Investment income, net |
| $ | 93,301,077 |
| $ | 98,805,190 |
| $ | 114,048,282 |
| $ | 120,660,459 |
|
| $ | 117,280,069 |
| $ | 135,154,810 |
| $ | 173,662,421 |
| $ | 155,315,617 |
|
Net realized gain on investments |
| 4,937,265 |
| 35,140,947 |
| 24,667,629 |
| 55,186,510 |
| |||||||||||||||||
Net unrealized gain on investments |
| 16,273,314 |
| 227,960,106 |
| 243,216,887 |
| 158,587,614 |
| |||||||||||||||||
| ||||||||||||||||||||||||||
Net realized and unrealized gain on investments and mortgage loans payable |
| 229,766,395 |
| 411,609,818 |
| 266,396,224 |
| 125,015,328 |
| |||||||||||||||||
Net increase in net assets resulting from operations |
| $ | 114,511,656 |
| $ | 361,906,243 |
| $ | 381,932,798 |
| $ | 334,434,583 |
|
| $ | 347,046,464 |
| $ | 546,764,628 |
| $ | 440,058,645 |
| $ | 280,330,945 |
|
Total return |
| 1.52 | % |
| 4.38 | % |
| 4.13 | % |
| 3.33 | % |
| 3.21 | % |
| 4.69 | % |
| 3.43 | % |
| 2.04 | % | ||
|
|
|
|
|
|
|
|
|
|
|
|
|
| |||||||||||||
|
|
|
|
|
|
|
|
|
|
|
|
|
|
|
|
|
|
|
|
|
|
| ||||
|
| 2004 |
|
| 2005 |
| ||||||||||||||||||||
|
|
| ||||||||||||||||||||||||
|
| March 31 |
| June 30 |
| September 30 |
| December 31 |
|
| March 31 |
| June 30 |
| September 30 |
| December 31 |
| ||||||||
Investment income, net |
| $ | 60,427,326 |
| $ | 69,917,576 |
| $ | 81,063,054 |
| $ | 90,192,076 |
|
| $ | 93,301,077 |
| $ | 98,805,190 |
| $ | 114,048,282 |
| $ | 120,660,459 |
|
Net realized gain on investments |
| 13,957,043 |
| 6,937,958 |
| 12,050,272 |
| 28,258,158 |
| |||||||||||||||||
Net unrealized gain on investments |
| (25,237,864 |
| 41,478,561 |
| 175,720,751 |
| 110,939,696 |
| |||||||||||||||||
| ||||||||||||||||||||||||||
Net realized and unrealized gain on investments and mortgage loans payable |
| 21,210,579 |
| 263,101,053 |
| 267,884,516 |
| 213,774,124 |
| |||||||||||||||||
Net increase in net assets resulting from operations |
| $ | 99,622,233 |
| $ | 118,334,095 |
| $ | 268,834,077 |
| $ | 229,389,930 |
|
| $ | 114,511,656 |
| $ | 361,906,243 |
| $ | 381,932,798 |
| $ | 334,434,583 |
|
Total return |
| 2.01 | % |
| 2.17 | % |
| 4.48 | % |
| 3.38 | % |
| 1.52 | % |
| 4.38 | % |
| 4.13 | % |
| 3.33 | % | ||
TIAA Real Estate AccountProspectus|| 3135
MANAGEMENT’S DISCUSSION AND ANALYSIS OF FINANCIAL CONDITION AND RESULTS OF OPERATIONS
The following discussion and analysis of our financial condition and results of operations should be read together with our financial statements and notes contained in this prospectus.prospectus and with consideration to the sub-section entitled “Forward-Looking Statements,” which begins on page 51, and the section entitled “Risks,” which begins on page 11. The past performance of the Account is not indicative of future results.
2006 OVERVIEW
The TIAA Real Estate Account (the “Account”) invests primarily in commercial real estate in order to meet its investment objective of obtaining favorable long-term returns through rental income and the appreciation of its real estate holdings. Commerical real estate enjoyed another strong year of performance in 2006. The continued positive performance of commercial real estate markets is a reflection of positive economic indicators and improved real estate market fundamentals, as discussed in the following section. While economic growth was relatively strong throughout the year, the Federal Reserve Board reported in its January 2007 “Beige Book,” which summarizes economic conditions in the 12 Federal Reserve Districts, that economic activity had moderated in several Districts since its November 2006 report. However, the Federal Reserve Board also stated that commercial real estate markets remained very active throughout the country: “…in contrast to the housing sector, commercial real estate markets continued to see strong activity in most Districts.”
Investor demand for commercial real estate in 2006 was fueled by the solid performance of the U.S. economy, healthy market fundamentals, a dip in interest rates in the second half of 2006, and relatively attractive returns when compared to other asset classes. Unlike the single family housing market, which experienced softening in demand and prices, commercial real estate prices and investment activity increased in 2006. According to Real Capital Analytics, one of the primary industry sources of commercial real estate transaction data, commercial real estate transactional volume in 2006 totaled approximately $307 billion, an 11% increase over 2005. A number of REIT privatization transactions and the $5 billion purchase price paid for a single property (Peter Cooper Village/Stuyvesant Town in New York City) were responsible for a sizeable share of the 2006 increase, which may make it difficult for the commercial real estate market to sustain this pace in 2007.
While management believes that economic and real estate market fundamentals should remain stable to positive in the near term, commercial real estate markets are cyclical over the longer term and, therefore, are subject to change. Geopolitical and economic risks, changes in interest rates or monetary policy, industry or sector slowdowns, the dynamics of supply and demand for commercial real estate and changing demographics are but a few of the factors which can affect commercial real estate values and, consequently, the
2005 OVERVIEW36|ProspectusTIAA Real Estate Account
performance of the Account. While management cannot predict the exact nature or timing of such changes or the magnitude of their impact, our experience has demonstrated that market fluctuations can and will take place without advance notice, and any significant changes could have a direct and meaningful impact on the returns of the Account. Please refer to the section entitled “Risks,” which begins on page 11, for a more detailed description of the risks associated with an investment in the Account.
It is also important to note that, while the single family residential real estate market has slowed to varying degrees in particular markets throughout the country, the Account does not directly invest in single family residential real estate. Historically, there has not been a strong link between commercial real estate and single family housing because different market fundamentals drive the performance of each. The volatility in interest rates had an immediate negative impact on the affordability of single family housing while not affecting commercial real estate values in the short term. During this same period, the commercial real estate market has been experiencing improved market conditions (improving occupancies and increases in rental rates) and moderate levels of new construction.
INVESTMENTS AS OF DECEMBER 31, 2006
As of December 31, 2005,2006, the TIAA Real Estate Account had total net assets in the amount of $10,548,711,102,$14,132,692,512, a 46%4% increase overfrom the 2004 year end total net assets.of the third quarter of 2006 and a 34% increase from year-end 2005. The growth in net assets was primarily due to the strong inflow of premiums and net transfers into the Account, combined with a healthy increase in net new money into the Account. The remainder of the increase was due toinvestment income from investments and capital appreciation on the Account’s investment portfolio during the year ended December 31, 2006, as compared to 2005.
As of December 31, 2006, the Account owned a total of 121 real estate property investments (109 of which were wholly owned and 12 of which were held in joint ventures) representing 80.03% of the Account’s total investment portfolio. The real estate portfolio included 49 office properties (six of which were held in joint ventures and one located in London, England), 35 industrial properties (including one held in a joint venture), 23 apartment complexes, 13 retail properties (including four held in joint ventures), and a 75% joint venture interest in a portfolio of storage facilities. Of the 121 real estate property investments, only 18 were subject to debt. Total debt on the Account’s wholly owned real estate portfolio as of December 31, 2006 was $1,437,149,148, representing 10.17% of Total Net Assets. The Account’s share of joint venture debt is netted out in determining the joint venture values shown in the Statement of Investments, but, when that debt is also considered, total debt on the Account’s portfolio as of December 31, 2006 was $1,909,316,373, representing 13.51% of Total Net Assets.
Management believes the Account’s real estate assets. The Account closed on 42 transactions in 2005 for a total net investment, including acquisitions, dispositions, commitments to purchase interests in real estate limited partnerships and real estate investment trusts, of $1.6 billion.estate-related transactional activity in the year ended December 31, 2006 was strong. The Account purchased 24 properties23 property investments, including a joint venture interest, for
TIAA Real Estate AccountProspectus|37
a total net equity investment of $1.9$2.3 billion. These purchases were diversediversified by both location (twelve(12 states in the United States and the United Kingdom)Washington, D.C.) and sector. The Account purchased eightan 80% joint venture interest in four retail centers, and purchased nine office properties, including the Account’s first foreign investment, an office complex located in London, United Kingdom, which is subject to debt, eightseven industrial properties, six apartmentthree retail properties and two retailthree apartment properties. Additional transactions included three commitments to purchase limited partnership interests in two real estate related funds and one private real estate investment trust inTwo of the total amount of $227.5 million of which $172 million has been funded and the placement of $250 million in debt on an office building in which the Account owns a 50% joint venture interest.seven industrial properties were consolidated into existing portfolios. The Account also sold 14 properties (five industrial,nine property investments (four apartment and five office three apartment and one retail property)properties), whichfor approximately $381.9 million. These properties had either maximized in value, under-performed, or represented properties needing significant capital infusions in the future, which could have had a negative impact on the Account’s overall performance, for approximately $511.5performance. The properties sold had a total net realized gain of $76.1 million.
Subsequent to December 31, 2005, In addition, the Account closed on two transactions:made a $75 million mortgage loan receivable investment secured by an apartment complex in Washington, D.C.
Management believes that the purchase of a bulk distribution warehouse for a total amount of approximately $34.7 million and the placement of approximately $153 million in debt on an office building which the Account already owns.
As of December 31, 2005, the Account owned a total of 109 real estate properties, representing 80.11% of the Account’s Total Investments (eleven of which are held in joint ventures). The real estate portfolio includes 45 office properties (sixis diversified by location and property type and, at December 31, 2006, no single property investment represented more than 3.56% of which are held in joint ventures), 30 industrial properties (including one joint venture), 24 apartment complexes, 9 retail properties (including three joint ventures), and a 75% joint venture partnership interest in a portfolioits total investments or more than 4.45% of storage facilities.
its total real estate investments, based on the values of such assets. The following charts reflect the diversification of the Account’s real estate assets by region and property type, as well aslist its ten largest holdings.holdings, and list its top five overall market exposures by metropolitan statistical area. All
32 | Prospectus TIAA Real Estate Account
information is based on the values of the properties as stated in the financial statements as of December 31, 2005.2006.
REAL ESTATE ASSETSPROPERTY INVESTMENT DIVERSIFICATION BY MARKET VALUE
|
|
|
|
|
|
|
|
|
|
|
|
|
|
|
|
|
|
|
|
|
|
|
|
| ||
|
| East |
| West |
| South |
| Midwest |
| Various* |
| Foreign** |
| TOTAL |
| |||||||||||
Office (45) |
|
|
| 21.9 | % |
|
| 18.1% |
|
| 13.4% |
|
| 3.9% |
|
| 0.0% |
|
| 4.1% |
|
| 61.4% |
| ||
Apartment (24) |
|
|
| 2.2 | % |
|
| 5.9% |
|
| 5.3% |
|
| 0.0% |
|
| 0.0% |
|
| 0.0% |
|
| 13.4% |
| ||
Industrial (30) |
|
|
| 3.0 | % |
|
| 7.5% |
|
| 3.8% |
|
| 2.0% |
|
| 0.7% |
|
| 0.0% |
|
| 17.0% |
| ||
Retail (9) |
|
|
| 1.5 | % |
|
| 1.3% |
|
| 4.7% |
|
| 0.0% |
|
| 0.0% |
|
| 0.0% |
|
| 7.5% |
| ||
Other*** (1) |
|
|
| 0.0 | % |
|
| 0.0% |
|
| 0.0% |
|
| 0.0% |
|
| 0.7% |
|
| 0.0% |
|
| 0.7% |
| ||
TOTAL (109) |
|
|
| 28.6 | % |
|
| 32.8% |
|
| 27.2% |
|
| 5.9% |
|
| 1.4% |
|
| 4.1% |
|
| 100.0% |
| ||
|
|
|
|
|
|
|
|
|
|
|
|
|
|
|
|
|
|
|
|
|
|
|
|
|
| East |
| West |
| South |
| Midwest |
| Other* |
| Foreign** |
| TOTAL | |||||||
|
|
| (32) |
| (40) |
| (39) |
| (7) |
| (2) |
| (1) |
| (121) | |||||||
Office (49) |
|
| 22.6 | % |
| 18.4 | % |
| 11.5 | % |
| 2.9 | % |
| 0.0 | % |
| 3.5 | % |
| 58.9 | % |
Apartment (23) |
|
| 1.9 | % |
| 7.4 | % |
| 6.2 | % |
| 0.0 | % |
| 0.0 | % |
| 0.0 | % |
| 15.5 | % |
Industrial (35) |
|
| 2.6 | % |
| 6.6 | % |
| 3.8 | % |
| 1.6 | % |
| 0.6 | % |
| 0.0 | % |
| 15.2 | % |
Retail (13) |
|
| 1.9 | % |
| 1.0 | % |
| 6.9 | % |
| 0.0 | % |
| 0.0 | % |
| 0.0 | % |
| 9.8 | % |
Other (1) |
|
| 0.0 | % |
| 0.0 | % |
| 0.0 | % |
| 0.0 | % |
| 0.6 | % |
| 0.0 | % |
| 0.6 | % |
TOTAL (121) |
|
| 29.0 | % |
| 33.4 | % |
| 28.4 | % |
| 4.5 | % |
| 1.2 | % |
| 3.5 | % |
| 100.0 | % |
|
| |
( ) | Number of | |
|
| |
| * | Represents a portfolio of storage facilities and a portfolio of industrial properties located in various regions across the U.S. |
|
| |
| ** | Represents a United Kingdom real estate investment. |
|
|
38|Prospectus TIAA Real Estate Account
TOP TEN REAL ESTATE HOLDINGSPROPERTY INVESTMENTS
|
|
|
|
|
|
|
|
|
|
|
|
|
|
|
|
|
|
|
|
|
|
|
|
|
|
|
|
|
|
|
|
|
|
|
|
| ||||||||||||
Property Name |
| City |
| State/ |
| Property |
| Market |
| % of Total |
| % Total |
|
| City |
| State/ |
| Property |
| Market |
| % of Total |
| % of Total |
| ||||||||||||||||||||||
1001 Pennsylvania Ave |
| Washington |
| DC |
| Office |
| $ | 503.0 | (b) |
| 5.47 | % |
| 4.38 | % |
|
| Washington |
| DC |
| Office |
| $ | 552.5 | (b) |
| 4.45 | % |
| 3.56 | % |
| ||||||||||||||
1 & 7 Westferry Circus |
| London |
| UK |
| Office |
| $ | 373.1 | (c) |
| 4.06 | % |
| 3.25 | % |
|
| London |
| UK |
| Office |
| $ | 428.6 | (c) |
| 3.45 | % |
| 2.76 | % |
| ||||||||||||||
50 Fremont Street |
| San Francisco |
| CA |
| Office |
| $ | 373.0 | (d) |
| 4.05 | % |
| 3.25 | % |
|
| San Francisco |
| CA |
| Office |
| $ | 421.0 | (d) |
| 3.39 | % |
| 2.71 | % |
| ||||||||||||||
IDX Tower |
| Seattle |
| WA |
| Office |
| $ | 370.0 | (e) |
| 4.02 | % |
| 3.22 | % |
|
| Seattle |
| WA |
| Office |
| $ | 399.0 | (e) |
| 3.21 | % |
| 2.57 | % |
| ||||||||||||||
The Newbry |
| Boston |
| MA |
| Office |
| $ | 370.7 |
| 2.99 | % |
| 2.39 | % |
| ||||||||||||||||||||||||||||||||
Four Oaks Place |
| Houston |
| TX |
| Office |
| $ | 295.2 |
| 3.21 | % |
| 2.57 | % |
|
| Houston |
| TX |
| Office |
| $ | 306.2 |
| 2.47 | % |
| 1.97 | % |
| ||||||||||||||||
Houston Apartment Portfolio |
| Houston |
| TX |
| Apartment |
| $ | 306.0 |
| 2.47 | % |
| 1.97 | % |
| ||||||||||||||||||||||||||||||||
780 Third Avenue |
| New York City |
| NY |
| Office |
| $ | 298.0 |
| 2.40 | % |
| 1.92 | % |
| ||||||||||||||||||||||||||||||||
99 High Street |
| Boston |
| MA |
| Office |
| $ | 276.3 | (f) |
| 3.00 | % |
| 2.41 | % |
|
| Boston |
| MA |
| Office |
| $ | 291.8 | (f) |
| 2.35 | % |
| 1.88 | % |
| ||||||||||||||
Lincoln Centre |
| Dallas |
| TX |
| Office |
| $ | 255.3 |
| 2.78 | % |
| 2.22 | % |
| ||||||||||||||||||||||||||||||||
780 Third Avenue |
| New York City |
| NY |
| Office |
| $ | 230.0 |
| 2.50 | % |
| 2.00 | % |
| ||||||||||||||||||||||||||||||||
1900 K Street |
| Washington |
| DC |
| Office |
| $ | 230.0 |
| 2.50 | % |
| 2.00 | % |
| ||||||||||||||||||||||||||||||||
Ontario Industrial Portfolio |
| Ontario |
| CA |
| Industrial |
| $ | 230.0 | (g) |
| 2.50 | % |
| 2.00 | % |
|
| Ontario |
| CA |
| Industrial |
| $ | 270.0 | (g) |
| 2.18 | % |
| 1.74 | % |
| ||||||||||||||
|
|
(a) | Value as reported in the 12/31/ |
|
|
(b) | This property is shown gross of |
|
|
(c) | This property is shown gross of |
|
|
(d) | This property is shown gross of |
|
|
(e) | This property is shown gross of |
|
|
(f) | This property is shown gross of debt. The value of the Account’s interest less leverage is |
|
|
(g) | This property is shown gross of |
TIAA Real Estate Account Prospectus | 33
TOP FIVE OVERALL MARKET EXPOSURE
|
|
|
|
|
|
|
|
|
|
|
|
|
|
|
|
|
|
|
|
| |||||||
Metropolitan Statistical Area |
| # of |
| % Total |
|
| % |
| # of |
| % Total |
| |||||||||||||||
Washington-Arlington-Alexandria |
| 10 |
| 10.45 |
|
| 96.8 | % |
| 10 |
| 9.61 | % |
| |||||||||||||
Boston-Quincy |
| 85.3 | % |
| 6 |
| 5.85 | % |
| ||||||||||||||||||
San Francisco-San Mateo-Redwood City |
| 4 |
| 6.50 |
|
| 93.3 | % |
| 4 |
| 5.39 | % |
| |||||||||||||
Los Angeles-Long Beach-Glendale |
| 7 |
| 4.61 |
|
| 98.4 | % |
| 8 |
| 5.37 | % |
| |||||||||||||
Chicago-Naperville-Joliet |
| 7 |
| 4.50 |
| ||||||||||||||||||||||
Dallas-Plano-Irving |
| 4 |
| 4.27 |
| ||||||||||||||||||||||
Seattle-Bellevue-Everett |
| 95.8 | % |
| 5 |
| 4.29 | % |
| ||||||||||||||||||
As of December 31, 2005,2006, the Account also held investments in real estate limited partnerships, representing 1.71%1.80% of Total Investments, real estate equity securities, representing 3.71%3.99% of Total Investments, commercial mortgage-backed securities (CMBS)(CMBSs), representing 0.19%0.55% of Total Investments, a mortgage loan receivable representing 0.48% of Total Investments, commercial paper representing 11.67%10.79% of Total Investments, and government bonds, representing 2.61%2.36% of Total Investments.
TIAA Real Estate AccountProspectus|39
Real Estate Market Outlook—In General
Real estate had another year of strong performance in 2005. Due to strong inflows of equity and debt capital from domestic and international sources, investment into the asset class grew substantially. The combination of strong inflows of capital, sustained economic growth, steady improvement in (Commercial real estate market conditionsstatistics discussed in this section are obtained by the Account from sources that management considers reliable, but the data is preliminary for the year ended December 31, 2006 and low interest rates pushedmay be subsequently revised. Prior period data may have been adjusted to reflect updated calculations. Investors should not rely exclusively on the data presented below in forming a judgment regarding the current or prospective performance of the commercial real estate prices higher in 2005. As a result of higher prices and greater interest inmarket generally.)
The United States commercial real estate sales transactional volumemarkets and the national economy continued to experience improvements throughout 2006. Commercial real estate market fundamentals improved while the national economy moved ahead, albeit more slowly in 2005 totaled approximately $250 billion, 35% higher than in 2004 accordingthe second half of 2006. Despite the slower economic growth, capital inflow from investors to Real Capital Analytics, a prime source for transactional information for commercial real estate.estate assets remained strong in 2006, continuing to support commercial real estate values, while moderating investment returns. Management believes it is important to remember that real estate values can be affected by prospective changes in economic and capital market conditions, as well as by changes in supply and demand at the local level.
Economic activity expanded throughout the nation in 2005.2006. The U.S.United States economy added a total of 2.02.24 million new jobs over the course of 2006 and 2.54 million new jobs in 2005. GainsThe unemployment rate dropped to 4.5% as of December 2006, from 4.9% in December 2005. Economic gains were broadly based, asboth geographically and across industries. While the economy did grow throughout 2006, the Federal Reserve Board’sBoard reported in its January 20062007 “Beige Book” reported that “Economic expansion continued across the twelveeconomic activity had moderated in several Districts during December. The Federal Reserve Districts through the last several weeks of 2005.” Accordingalso noted, however, that “...in contrast to the Beige Book, economichousing sector, commercial real estate markets continued to see strong activity was “expanding modestly” in six districts, “accelerating” or “increasing at a solid pace” in four more, and “continuing to expand” or “reasonably strong” in the remaining two districts.most Districts.”
EmploymentPayroll employment growth in the Account’s primary metropolitan areas has strengthened over the course of 2005.remained positive in 2006. Of the Account’s five top markets (Washington, D.C., Boston, San Francisco, Los Angeles and Seattle), based on the net equity value of the Account’s property investments, employment growth was strongest in the Seattle metropolitan area, where payroll employment grew 3.9% in 2006.Employment growth was also strong in the Washington, D.C. metropolitan area, where payroll employment grew at 3.1% during 2005.2.5% over the course of 2006. Employment growth was more modest in the Boston (+0.9%), San Francisco (+ 0.9%1.5%), and Los Angeles (+ 0.7%), Chicago (+ 1.1%), and Dallas (+ 1.4%1.2%) follow.metropolitan areas. By comparison, payroll employment grew 1.6%1.4% in the United States as a whole during 2005.in 2006.
Growth in payroll employment is highly correlated with tenant demand for commercial real estate, thoughestate; however, growth in employment may not immediately result in demand for space often occurs following aspace. Space demand can lag growth in employment due to the nature of the leasing cycle. OfficeAlternatively, absorption can be a leading indicator as companies lease space demand, in particular, is correlated with employment growth in theto accommodate anticipated hiring. The “financial activities” and “professional &and business services” sectors are the primary office users, and growth in these sectors is correlated with office space demand over the long term. These two sectors added 179,000 and 442,000 jobs, respectively, over the course of 2006, and office space demand responded in kind. According to Torto Wheaton
34 40|ProspectusProspectus TIAA Real Estate Account
services” sectors. These two sectors added 188,000Research, an independent subsidiary of CB Richard Ellis and 486,000 jobs, respectively, over the coursea widely-used source of 2005. With 24 consecutive months of employment growthreal estate market data, office absorption in the United States, office space demand has responded in kind. Office absorption, which is the net change in occupied space and a key fundamental indicator of demand, totaled 87a healthy 75 million square feet in 2005 and 76 million square feet in 2004. By comparison, net absorption in 2003 was only 23 million square feet and in 2002 it was a negative 14 million square feet, which indicates that companies vacated more space than they leased.2006. Gains in net absorption in turn, haveduring 2006 lowered office vacancy rates.rates throughout much of the country. Torto Wheaton Research a widely used source of real estate market data, reported that office market vacancies averaged 12.5% at year-end 2006, as compared with 13.6% at year-end 2005, and 15.4%the end of 2005. In comparison, at year-end 2004. According to2006, the Torto Wheaton,vacancy rate of the Account’s office vacancies on aportfolio was 8%, well below the national basis have now declined for ten consecutive quarters.average.
ImprovementsReal estate conditions in the Account’s top office markets are evident.were solid in 2006. For example, office vacancies in the Washington D.C. metropolitan area, where the largest concentration of the Account’s topreal estate investments are located, office market, arevacancies were well below the national average and have fallen to 9.3%at 9.1% as of the year-end 2005 compared with 10.3%2006, down from 9.3% at year-end 2004. The2005. In comparison, the average vacancy rate of the Account’s office marketportfolio in the Washington, D.C. metrometropolitan area has undoubtedly benefited from 40 consecutive monthswas significantly better and stood at 3.0% at the end of employment growth. Vacancies2006. Office vacancy rates in the New York metro area averaged 7.7% as of year-end 2005Boston, Los Angeles, San Francisco, and have declined from 9.3% as of year-end 2004. InSeattle metropolitan areas, which were the Account’s other top office markets, vacancy rates remain high: Chicago (16.9%), Houston (16.4%), San Francisco (13.1%), and Boston (14.3%). However, San Francisco, Boston and Houston have seen measurableexperienced steady declines in vacancy rates over the past year.year, and the average office vacancy rates in those three markets at year-end 2006 were 11.9%, 10.0%, 10.8% and 9.4%, respectively. In comparison, the Account’s office portfolios in Los Angeles, San Francisco, Seattle and Boston had an average vacancy rate at year-end 2006 of 1%, 7%, 7% and 18%, respectively. It is important to note that three of the five property investments owned by the Account in the Boston metropolitan area are located within the city of Boston and had an average vacancy rate of 5%. The remaining two property investments are located in suburban areas and had an average vacancy rate of 36% due to a slower leasing pace.
Industrial space demand is related to a number of factors, including the national business cycle, national industrial production, international trade volumes, changes in corporate logistics and distribution systems, and employment growth in the manufacturing, wholesale trade and transportation and& warehousing industries. Most of these indicatorsfactors have experienced sustained growth over the last several years. For example, U.S. gross domestic product (GDP), a basic indicator of the national business cycle, grew at a 3.5% pacean estimated 3.3% in 2006, after growing 3.2% in 2005 following a growth rate of 4.2%and 3.9% in 2004 and 2.7% in 2003.2004. Similarly, national industrial production grew at a 2.8%4.4% rate in 2006, following growth of 3.2% in 2005 followingand 2.5% in 2004. While GDP growth and growth in industrial production slowed during the second half of the year due primarily to a growth rate of 4.1%slowdown in 2004domestic auto production and 0.6%weakness in 2003. These gains are reflected industrial space absorption.the single-family housing market, those factors continued to grow at relatively healthy rates. According to Torto Wheaton Research, industrial space absorption in major U.S. metropolitan areas totaled 281188 million square feet in 2005,2006, which is a reflection of U.S. economic growth, and, as compared with 183 million square feeta result of the healthy absorption, industrial vacancies dipped lower in 2004 and a mere 31 million square feet in 2003. Healthy space demand, in turn, has lowered industrial vacancies.2006. According to Torto Wheaton Research, reports that industrial vacancies averaged 9.7%9.4% at year-end 2005,2006 compared with 11.4%9.9% at the end of 2004. Industrial vacancies have now declined for six consecutive quarters.
The improvement in2005. In comparison, at year-end 2006, the vacancy rate of the Account’s industrial markets is clear. Industrial vacancies in the Riverside-San Bernardino metropolitan area, the Account’s top industrial market, for example, areportfolio was 4%, well below the national average (9.7%), and have fallen to 5.4% at year-end 2005 compared with 7.1% at year-end 2004. The industrial market in Riverside-San Bernardino has benefited from 20 millionaverage.
TIAA Real Estate AccountProspectus| | 3541
Industrial market vacancies in the Riverside, California metropolitan area, where the largest concentration of the Account’s industrial properties are located, averaged 7.9% at year-end 2006, which was below the national average, but up from 6.1% at year-end 2005. Still, the Riverside industrial market remained the most active industrial market in the country with over 21 million square feet of absorption in both 2004 and 2005,2006, which is the most of any U.S. market. Vacancieswas 30% greater than that in the next most active market. In Los Angeles, metro area areanother of the Account’s top industrial markets, vacancies were also well below the national average at 4.5% at year-end 2005.2006. The industrial market vacancy rates in the Chicago (11.4%), Dallas (11.7%), and Atlanta (13.0%) metropolitan areas were above the national average, but vacancies in these markets declined over the course of 2006. In comparison, at December 31, 2006, the Account’s industrial portfolio in Riverside was 100% occupied, and, in Los Angeles and Dallas, the Account’s industrial market vacancy rates were 2% and 5%, respectively. In the Account’s otherremaining top two industrial markets, Chicago and Atlanta, average vacancy rates are aboveat year-end 2006 were 7% and 2%, respectively.
The apartment market remained healthy throughout 2006, with the national average: Chicago (10.8%), Dallas (12.6%), and Atlanta (12.6%). Each of these markets has experienced a meaningful decline in vacancies over the past year.
Key factors influencing demandslow-down in the single-family housing market producing mostly positive effects for the apartment sector include employmentmarket. While the growth population and household growth, andof single-family housing prices slowed in 2006, past price increases had pushed housing affordability each of which moved in ways favorable to apartment demand during 2005. For example, data from the National Association of Realtors show that housing affordability declined to its lowest level since 2001 due to home price increases of 15% nationwide during 2005 and modest increases in mortgage interest rates. In addition to healthy apartment demand, Real Capital Analytics reported that the2001. The supply of rental units was significantly reduced in a number of markets by developers who removed units from the rental stock as developers converted sizeable numbersthey pursued condominium conversion plans. The pace of apartment units to condominiums overcondo conversions and conversion-driven acquisitions slowed significantly in the coursesecond half of 2005. Condo conversions were particularly prevalent in metropolitan areas like Miami, Las Vegas, San Diego and Washington D.C. As a result of these two trends—an increase in demand and a2006, but the reduction in supply—rental supply during 2005 and the first half of 2006 was sufficient to keep apartment vacancies relatively low. According to Torto Wheaton Research, reported in its year-end 2005 report that the U.S. apartment market “...tightened throughout 2005”. Nationally, vacancies averagedincreased to 5.1% at year-end 20052006, as compared with 6.2%5.0% at year-end 2004.the end of 2005. In addition, many landlords were able to raiseapartment rents increased in a number of markets for the first time in several years. Other landlords eliminatedyears, and rental concessions and incentives which are usedsuch as free rent were reduced or eliminated in many markets. The average vacancy rate for competitive purposes when demand is soft.
The market conditions in the Account’s apartment markets have clearly improved as well. For example, apartment vacanciesportfolio was 5% at the end of 2006.
Market vacancy rates in the AtlantaPhoenix metropolitan area, the Account’s top apartment market, declined to 6.1%averaged 5.3% at year-end 2005 compared with 8.4% at year-end 2004.2006. In the Account’s other top apartment markets, market vacancy rates are well below the national average, Los Angeles (2.4%were higher: Houston (7.6%), Ft. Lauderdale (1.3%Denver (5.8%), Atlanta (5.9%), and Washington D.C. (4.2%Los Angeles (2.8%). VacanciesIn comparison, at December 31, 2006, the Account’s apartments located in Dallas are above the nationalAtlanta had an average at 7.4%vacancy rate of 2%, but declined from 9.9% at year-end 2004.Phoenix had a vacancy rate of 5%, and in Denver, Houston and Los Angeles, average vacancy rates were 6%.
Key factors influencing retail space demand include trendsRetail markets remained healthy in consumer spending, growth in personal income and wages, and retailers’ growth and expansion plans. For example,2006. Preliminary data from the U.S. Census Bureau reportedDepartment of Commerce indicated that U.S. retail and food service sales excluding(excluding autos and auto parts) increased 7.3% in 2006, a solid 8.3% in 2005. Thissignificant gain came despite headwinds from higher energygiven the elevated prices of oil and gasoline prices. Healthy retail sales, in turn, sustained retail space demand.during much of the year. According to Torto Wheaton Research, vacancies in neighborhood and community centers averagedincreased to 8.7% at the end of 2006, versus 7.7% at year-end 20052005. In comparison, the average vacancy rate at the end of 2006 for the Account’s entire retail portfolio, as compared with 8.0% at year-end 2004. Inwell as, for its year-end 2005 report, Torto Wheaton Research noted that retail rentsneighborhood and occupancies have risen steadily in recent years, and “...there is nothing in the marketplace today to suggest that that trend is not going to continue…community centers, was 3%.”
Real estate supply/demand conditions also appear favorable. Office construction nationally totaled 35 million square feet in 2005 compared with an annual average of 80 million square feet during the 1998-2002 cyclical peak period. Torto Wheaton Research expects office construction to increase marginally to 38 million
36 42|ProspectusProspectus TIAA Real Estate Account
Overall, Torto Wheaton Research believes that commercial real estate construction remains at appropriate levels to maintain the favorable real estate supply/demand conditions that existed in 2006 over the near term. Space demand is expected to track closely with construction for most property types over the next several years. According to Torto Wheaton Research, office construction nationally should total 87 million square feet in 2006. Similarly, constructionover the 2007-2008 period and absorption should total 91 million square feet. Construction of industrial space is projected to total 340 million square feet over the 2007-2008 period, as compared with absorption of 304 million square feet. While industrial vacancies are expected to increase modestly to 9.8% at year-end 2008, rents are projected to grow 4.3% per year. Apartment construction is expected to total almost 425,000 units over the 2007-2008 period, and absorption is projected to total approximately 350,000 units. While apartment vacancies are expected to increase modestly in 2005 was roughly 35% below totals during the 1996-2001 peak construction period.2007-2008, they will remain low by historical standards. Further, apartment rents are projected to grow 3.2% in 2007 and 3.0% in 2008. Torto Wheaton Research does not expect a significant increase in industrial construction in 2006. Multi-family construction has slowed less sharply; however, a growing number of these units are being built for sale rather than rent. Torto Wheaton Research expects that construction of neighborhood and community shopping centers which totaled 26to total 41.6 million square feet over the 2007-2008 period and absorption to total 40.8 million square feet. With construction and absorption closely aligned, retail rents are projected to grow 4.4% in 2005, to decline roughly 25%2007 and 3.3% in 2006 due in part to increased land and construction costs.2008.
Economic Outlook for 20062007
On balance, management believes that prospects for U.S. commercial real estate markets appearremain promising given current economic and property market conditions. Several years into recovery, the national economy shows signs of a modest slowdown in economic activity primarily due to high energy prices and a weakened single-family housing market; however, many economists believe that the economy is in the midst of a “soft landing” and that economic activity should remain healthy throughout 2007. Nationally, employment is growing at a solid pace, as is employment in key office-using industries. In addition to promising fundamentals, domestic and sustainable pace. The combination of ongoing employment growth and moderate construction bode wellforeign investor demand for commercial real estate markets.shows little sign of abating. Strong inflows should provide support to current values but are also likely to continue to exert continued pressure on property prices and future returns. The Account will seek to balance the promising market fundamentals against pricing pressures when executing its investment strategy. However, continued strong inflows of capital tomarket conditions affecting real estate investments at any given time cannot be predicted, and an unexpected, sudden economic downturn in one or a number of the markets are likely to put pressure on future pricingin which the Account invests could significantly and returns. Given these trends, prudence and pricing discipline will be required with respect toadversely impact the Account’s acquisition activities going forward.returns.
RESULTS OF OPERATIONS
Year Ended December 31, 2006 Compared to Year Ended December 31, 2005
Performance
The Account’s total return was 14.04% for the year ended December 31, 2006, two basis points higher than the 2005 annual return of 14.02%. The Account’s
TIAA Real Estate AccountProspectus|43
overall performance on a year-to-year basis reflects the continued strong performance of the Account’s real estate property investments and an increase in interest rates on its marketable securities.
Commercial real estate has been experiencing historically high pricing for the past several years as capital has continued to flow into the asset class. While this increase in property pricing has positively impacted the Account’s net realized and unrealized gains on its real estate assets and joint venture holdings, the underlying property values are subject to decline prospectively, if capital or real estate market conditions experience adverse changes. Real estate as an investment should be considered from a long-term perspective. The Account’s total return (after expenses) over the past three, five and 10 years ended December 31, 2006 was 13.53%, 10.22% and 9.43%, respectively.
The Account’s total net assets grew 34.0% from December 31, 2005 to December 31, 2006. The primary drivers of this growth were significant net participant transactions, the Account’s net investment income from its investment portfolio and the Account’s realized and unrealized gains on its investments over the last twelve months. Management believes that the net participant transfers into the Account are due to its positive historical performance and its low return volatility relative to other available investment options.
Income and Expenses
The Account’s net investment income, after deduction of all expenses, was 36.2% higher for the year ended December 31, 2006, as compared to 2005. This increase was related to the increase in total net assets, which included a 35.1% increase in the Account’s real estate properties, joint venture holdings and limited partnerships.
The Account’s real estate holdings, including real estate joint ventures and limited partnerships, generated approximately 79.6% and 85.3% of the Account’s total investment income (before deducting Account level expenses) during 2006 and 2005, respectively. The remaining portion of the Account’s total investment income was generated by investments in marketable securities, including real estate equity securities, commercial paper, government bonds, and an investment in a commercial mortgage loan receivable. The decline in the percentage of the Account’s total investment income derived from its real estate holdings was primarily due to an increase in the Account’s interest income from its marketable securities and mortgage loan receivable.
Gross real estate rental income increased approximately 34.9% in the year ended December 31, 2006, as compared to 2005. This increase was primarily due to the increased number and size of the Account’s wholly-owned property investments (98 at December 31, 2005 compared to 109 at December 31, 2006). Income from real estate joint ventures and limited partnerships was $84,671,528 for the year ended December 31, 2006, as compared with $71,826,443 for the year ended December 31, 2005. This 17.9% increase was due to an increase in gross rental income from the properties owned in joint ventures, as well as increased
44|Prospectus TIAA Real Estate Account
income from limited partnerships. Investment income on the Account’s investments in marketable securities increased by 90.7%, from $70,999,212 in 2005 to $135,407,210 in 2006. This increase was due to an increase in the related investments and higher interest rates in 2006.
Total property level expenses for wholly-owned property investments for the years ended December 31, 2006 and 2005 were $389,672,945 and $278,544,030, respectively. In 2006, operating expenses and real estate taxes represented 53% and 28% of the total property level expenses, respectively, with the remaining 19% representing interest payments on mortgages. In comparison, operating expenses, real estate taxes, and interest expense represented 54%, 32% and 14% of total property level expenses, respectively, in 2005. Overall, property level expenses increased by 40% from 2005 to 2006. The majority of this increase (71%) was due to increases in operating expenses and real estate taxes associated with the Account’s larger portfolio of wholly-owned property investments. The increase in the interest expense paid on properties subject to a mortgage accounted for 29% of the overall increase. As of year-end 2006, there were 12 wholly-owned properties subject to debt, as compared to seven leveraged properties at year-end 2005.
The Account also incurred expenses for the years ended December 31, 2006 and 2005 for investment advisory services ($26,899,307 and $19,603,225, respectively), administrative and distribution services ($45,712,473 and $27,130,406, respectively), and mortality, expense risk and liquidity guarantee charges ($10,836,884 and $9,366,566 respectively). The total 49% increase in these expenses was a result of the larger net asset base in the Account, on which the fees are calculated, and the increased costs associated with managing and administering the Account.
Net Realized and Unrealized Gains and Losses on Investments and Mortgage Loans Payable
The Account had net realized and unrealized gains on investments and mortgage loans payable of $1,032,787,765 for the year ended December 31, 2006, as compared with net realized and unrealized gains on investments and mortgage loans payable of $765,970,272 for the year ended December 31, 2005. The overall increase was partially driven by the increase in net realized and unrealized gains on the Account’s real estate properties to $735,507,509 for the year ended December 31, 2006 from $619,333,773 for 2005. The Account also posted substantial net realized and unrealized gains on its marketable securities of $130,710,746 for the year ended 2006, as compared to $8,770,726 in 2005. In addition, the Account had unrealized gains on its real estate joint ventures and limited partnership holdings of $193,477,741 for the year ended December 31, 2006, as compared to unrealized gains of $167,019,921 for 2005. The increase in net realized and unrealized gains on the Account’s property investments, including those held in joint ventures, was due to the positive effect of the strong inflow of capital into the real estate market from investors, combined with improved real estate market fundamentals, which had the effect of increasing the value of the
TIAA Real Estate AccountProspectus|45
Account’s existing real estate assets. This trend, which has continued for several years, was also evidenced by the net realized gains on the properties sold in 2006. During the year ended December 31, 2006, the Account sold nine properties for total net proceeds, after selling expenses, of $381.9 million, for a cumulative net gain of $76.1 million, based on the properties’ capitalized costs. The unrealized gains on the Account’s marketable securities in 2006 were primarily associated with the Account’s investments in real estate equity securities.
Year Ended December 31, 2005 Compared to Year Ended December 31, 2004
Performance
The Account’s total return was 14.02% for the year ended December 31, 2005, 145 basis points higher than the 2004 annualtotal return of 12.57%. The substantial increase in the Account’s overall performance on a year-to-year basis reflectsreflected the strong performance of the Account’s real estate properties. The market value of the Account’s real estate portfolio increased substantially in 2005 due to capital appreciation of these assets as a result of the sustained growth in capital investment intoin the real estate market from institutional investors as well as foreign investors.
Income and Expenses
The Account’s net investment income, after deduction of all expenses, was 42%41.5% higher for the year ended December 31, 2005, as compared to the same period in 2004. This increase is related to a 46%45.6% growth in Total Net Assets from year-end 2004 to year-end 2005. The growth in Total Net Assets was driven by a year-to-year 84.8% increase in total net assets, which includedrealized and unrealized gains on its investments and a 41%24.8% increase in net transfers and premiums into the Account’s real estate holdings, including joint ventures and limited partnerships, over the same period.Account.
The Account’s real estate holdings, including real estate joint venture investments,ventures and limited partnerships, generated approximately 83%85.3% and 88%91.9% of the Account’s total investment income (before deducting Account level expenses) during 2005 and 2004, respectively. The decline is due to the effect of the increase in total net assets, a decline in the total percentage of the Account’s assets held in real estate and joint venture interests and the corresponding growth in the non-real estate assets owned by the Account. As of year end 2005, the Account held 80% of its assets in real estate and 14% short term holdings, as compared to 85% and 9%, respectively in 2004. The
TIAA Real Estate Account Prospectus | 37
remaining portion of the Account’s total investment income was generated by investments in marketable securities investments.securities. The decline in the real estate component was due to the growth in the non-real estate assets owned by the Account as a percentage of Total Net Assets. As of year-end 2005, the Account held 89.1% of its Total Net Assets in real estate, joint ventures and limited partnership holdings, as compared to 92.2% in 2004.
Gross real estate rental income increased approximately 56%55.7% in the year ended December 31, 2005 as compared to the same period in 2004. This increase was primarily due to the increased number and size of properties owned by the Account. In 2005, the Account benefited from the full year’s income from the properties purchased in 2004 (21) and for a partial year’s income from those properties purchased throughout 2005 (24 in total). Income from the real estate joint ventures and limited partnerships was $63,580,501$71,826,443 for the year ended December 31, 2005 as compared with $57,275,242$71,390,397 for the year ended December 31, 2004. This 11% increase in joint venture income was due to an increase in the number of joint venture owned by the Account purchased in 2004. Interest and dividend income on the Account’s marketable securities investments increased from $15,055,451$27,508,560 in 2004 to $54,114,448$70,999,212 in 2005 due to the increase in the amount of non-real estate assets held by the Account, as well as an increase in short term rates from 2004 to 2005. Dividend income on the Account’s real estate equity securities and limited partnership investments increased from $26,568,264 for the year ended December 31, 2004 to $25,130,706.
46|
Prospectus TIAA Real Estate Account
Total property level expenses for the yearyears ended December 31, 2005 and 2004 were $278,544,030 and $157,768,776, respectively. In 2005, operating expenses and real estate and other taxes represented 54%54.0% and 32%31.6% of the total property level expenses, respectively, with the remaining 14%14.4% due to interest payments on mortgages. In comparison, operating expenses, real estate and other taxes, and interest expense represented 64%64.0%, 35%35.5% and 1%,0.5% of the total property level expenses, respectively in 2004. Overall, property level expenses increased by 77%76.6% from 2004 to 2005, with approximately one-third of this increase attributable to interest payments madeexpense in 2005. The factors influencing this year to year variance were: an increase in the number of properties subject to debt, which increased from 4 in 2004, (all acquired in the fourth quarter of 2004) to 7 in 2005 (the interest expense incurred by the Account was $830,361 and $40,028,630, respectively, in 2004 and 2005);2005. The factors influencing these year-to-year increases were an increase in the number of wholly-owned properties subject to debt, which increased from four in 2004 (all acquired in the fourth quarter of 2004) to seven in 2005, and the purchase of additional properties in 2005.
The Account also incurred expenses for the years ended December 31, 2005 and 2004 of $19,603,225 and $14,393,388, respectively, for investment advisory services $27,130,406($19,603,225 and $16,372,446, respectively, for$14,393,388, respectively), administrative and distribution services ($27,130,406 and $9,366,566$16,372,446, respectively) and $5,962,591 respectively, for mortality, expense risk and liquidity guarantee charges.charges ($9,366,566 and $5,962,591, respectively). The overall 53%52.7% increase in expenses iswas a result of the larger net asset base in the Account and the increased costs associated with managing and administering the Account.
Net Realized and Unrealized Gains and Losses on Investments and Mortgage Loans Payable
The Account had net realized and unrealized gains on investments and mortgage loans payable of $765,970,272 for the year ended December 31, 2005, as compared with net realized and unrealized gains on investments ofto $414,580,303 for the year ended December 31, 2004. This positive variance iswas primarily due to a substantial increase in net realized and unrealized gain on the Account’s real estate properties of $590,179,625to $619,333,773 for the year ended December 31, 2005, as compared to $184,531,410$186,313,976 for
38 | Prospectus TIAA Real Estate Account
the year ended December 31, 2004. The increase in net realized and unrealized gains iswas due to the capital appreciation of real estate assets attributable to the continued inflow of capital into the real estate market from institutional and other investors, which had the effect of increasing the value of real estate. This trend, which began in 2004 and increased in 2005, is further evidenced by the net realized gain of $90.3$84.8 million on the properties sold in 2005. The net proceeds of these sales waswere $511.5 milllion.million. The Account also had unrealized gains on its real estate joint ventures and limited partnership holdings of $168,723,129$167,019,921 for the year ended December 31, 2005, as compared to unrealized gains of $161,584,369 for the same period$162,245,601 in 2004. This increase was due to the unrealized gains posted in 2005 on the properties in which the Account has an interest. The Account’s marketable securities had net realized and unrealized gains totaling $8,770,726 for the year ended December 31, 2005, had net realized and unrealized gains totaling $7,067,518 as compared with net realized and unrealized gains of $68,464,524to $67,803,292 for the year ended December 31, 2004. The primary factor in the decline iswas the net effect on the Account’s real estate equity securities of the relatively weak performance of the REIT market on the Account’s real estate equity securities in 2005, as compared to the strong performance of this market in 2004.
Year Ended December 31, 2004 Compared to Year Ended December 31, 2003
Performance
The Account’s total return was 12.57% for the year ended December 31, 2004 and 7.50% for 2003. The substantial increase in the Account’s overall performance on a year-to-year basis reflects the strong performance of the Account’s real estate properties and real estate-related (real estate equity securities, CMBS and limited partnerships) investments. The market value of the Account’s real estate portfolio increased substantially in 2004, as did the value of its real estate equity securities holdings. These increases in the real estate and real estate-related assets were due to the significant amount of capital which flowed into the real estate market from institutional investors as well as foreign investors, increasing the price of core real estate investments.
Income and Expenses
The Account’s net investment income after deduction of all expenses was 23% higher for the year ended December 31, 2004 compared to the same period in 2003. This increase was primarily due to a 51% increase in total net assets, which included a 66% increase in the Account’s real estate holdings, including joint ventures and limited partnerships, over the same period.
The Account’s real estate holdings, including joint venture and fund investments, generated approximately 88% and 93% of the Account’s total investment income (before deducting Account level expenses) during 2004 and 2003, respectively. The remaining portion of the Account’s total investment income was generated by marketable securities investments.
TIAA Real Estate AccountProspectus| | 39
Gross real estate rental income increased approximately 10% in the year ended December 31, 2004 as compared to the same period in 2003. This increase was due to the increased number of properties owned by the Account. Income from the real estate joint ventures was $57,275,242 for the year ended December 31, 2004 as compared with $31,989,569 for the year ended December 31, 2003. This increase in joint venture income was due to positive leasing activity at several retail properties as well as the purchase of an additional joint venture interest in an existing office property, and the addition of two joint venture investments in 2004. Interest income on the Account’s marketable securities investments increased from $7,221,765 in 2003 to $15,055,451 in 2004 due to the increase in the amount of non-real estate assets held by the Account as well as a slight increase in short term rates from 2003 to 2004. Dividend income on the Account’s real estate equity securities and limited partnership investments increased from $12,240,166 for the year ended December 31, 2003 to $26,568,264 for the year ended December 31, 2004. This increase was due to the strong performance of the real estate market reflecting the increased inflow of capital into real estate-related investments.
Total property level expenses for the years ended December 31, 2004 and 2003 were $157,768,776, and $136,678,570, respectively. This 15% increase in property level expenses reflected the increased number of real estate properties owned by the Account from 2003 to 2004. In addition, during 2004, the Account incurred interest expense of $830,361 related to the mortgages.
The Account also incurred expenses for the years ended December 31, 2004 and 2003 of $14,393,388 and $12,751,191 respectively, for investment advisory services, $16,372,446 and $14,786,580 respectively, for administrative and distribution services and $5,962,591 and $4,116,294 respectively, for mortality, expense risk and liquidity guarantee charges. The overall 16% increase in expenses is a result of the larger net asset base in the Account, and the increased costs associated with managing and administering the Account.
Net Realized and Unrealized Gains and Losses on Investments
The Account had net realized and unrealized gains on investments of $414,580,303 for the year ended December 31, 2004, as compared with net realized and unrealized gains on investments of $58,837,371 for the year ended December 31, 2003. The increase in net realized and unrealized gains is primarily due to the substantial net realized and unrealized gain on the Account’s real estate properties of $184,531,410 for the year ended December 31, 2004 as compared to net realized and unrealized losses for the year ended December 31, 2003 of $5,040,820. In addition, the Account had an unrealized gain on its joint venture holdings of $161,584,369 for the year ended December 31, 2004 as compared to unrealized gain of $23,914,271 for the year ended December 31, 2003. The substantial net gains in the year ending December 31, 2004 are due to the increase in market value of its real estate portfolio, particularly in the value of three regional malls in which the Account owns joint venture interests. The Account’s marketable securities for the year ended December 31, 2004 had net realized and unrealized gains totaling
40 | Prospectus TIAA Real Estate Account47
$68,464,524 as compared with net realized and unrealized gains of $39,963,920 for the year ended December 31, 2003.
During 2004, the Account sold five properties. Proceeds of sale were $113,765,000 and cost at the time of sale was $99,937,568, resulting in a realized gain of $13,827,432. During 2003, the Account sold two properties. Proceeds of sale were $187,225,000 and cost at the time of sale was $154,626,452, resulting in a realized gain of $32,598,548.
LIQUIDITY AND CAPITAL RESOURCES
At year endyear-end 2006 and 2005, and 2004, the Account’s liquid assets (i.e.(i.e., its real estate equity securities, CMBSs, commercial papercash and governmentmarketable securities) had a value of $2,089,557,113$2,747,445,678 and $1,045,733,841,$2,090,768,483, respectively. The increase in the Account’s liquid assets was primarily due to an increase in its net investment income and the continued net positive inflow from participant transfers and premiums into the Account, which is likelymanagement believes was in response to the continued strong relative performance of the Account.
In 2005,2006, the Account received $968,189,436$1,085,057,614 in premiums and $1,435,432,984$1,354,697,847 in net participant transfers from TIAA, CREF Accounts and affiliated mutual funds, while, for 20042005, the Account received $738,048,183$968,189,436 in premiums and $1,188,465,203$1,435,432,984 in net participants’participant transfers. Real estate acquisitions totaling approximately $1.9 billion and $2.5 billion were made duringThe Account’s net investment income increased from $426,815,008 for the year ended December 31, 2005 and 2004, respectively.to $581,412,917 for the year ended December 31, 2006.
The Account’s liquid assets will continue to be available to purchase additional suitable real estate properties and to meet the Account’s expense needs and participant redemption requests (i.e.(i.e., cash withdrawals, benefits, or transfers). In the unlikely event that the Account’s liquid assets and its cash flow from operating activities and participant transactions are not sufficient to meet itsparticipant transfer or cash needs, including redemptionwithdrawal requests, TIAA’s general account will purchase liquidity units in accordance with TIAA’s liquidity guarantee to the Account.
The Account, under certain conditions more fully described in the Account’s prospectus (as supplemented from time to time), may borrow money and assume or obtain a mortgage on a property —i.e.(i.e., to make leveraged real estate investments. Note that the Account changed its borrowing policy in 2005 to expand the circumstances under which it could borrow.investments). Also, to meet any short-term cash needs, the Account may obtain a line of credit whose terms may require that the Account secure the loan with one or more of its properties. The Account’s total borrowings may not exceed 20%30% of the Account’s total net asset value.Total Net Assets. In calculating this limit, only the Account’s actual percentage interest in any borrowings is included, and not that of any joint venture partner. Further, the Account may only borrow up to 70% of the then-current value of a property, although construction loans may be for 100% of costs incurred in developing a property.
EFFECTS OF INFLATION AND INCREASING OPERATING EXPENSES
Inflation, along with increased insurance, taxes, utilities and security costs, may increase property operating expenses in the future. These increases in operating expenses are generally billed to tenants either through contractual lease provisions in office, industrial, and retail properties or through rent increases in apartment complexes. However, depending on how long any vacantThe Account remains responsible for the expenses for unleased space in a property remains unleased, the Accountas well as expenses which may not be able to recoverreimbursed under the full amountterms of such increases in operating expenses.an existing lease.
TIAA Real Estate Account Prospectus | 41
CRITICAL ACCOUNTING POLICIES
The financial statements of the Account are prepared in conformity with accounting principles generally accepted in the United States.States of America.
48|Prospectus TIAA Real Estate Account
In preparing the Account’s consolidated financial statements, management is required to make estimates and judgments that affect the reported amounts of assets, liabilities, revenues and expenses. Management bases its estimates on historical experience and assumptions that are believed to be reasonable under the circumstances, — the results of which form the basis for making judgments about the carrying value of assets and liabilities that are not readily apparent from other sources. Actual results may differ from these estimates.
Management believes that the following policies related to the valuation of the Account’s assets reflected in the Account’s financial statements affect the significant judgments, estimates and assumptions used in preparing its financial statements:
Valuation of Real Estate Properties:Investments in real estate properties are stated at fair value, as determined in accordance with procedures approved by the Investment Committee of the TIAA Board of Trustees.Trustees and in accordance with the responsibilities of the Board as a whole; accordingly, the Account does not record depreciation. Fair value for real estate properties is defined as the most probable price for which a property will sell in a competitive market under all conditions requisite to a fair sale. Determination of fair value involves subjective judgment because the actual market value of real estate can be determined only by negotiation between the parties in a sales transaction. The Account’sReal estate properties owned by the Account are initially valued at their respective purchase prices (including acquisition costs). Subsequently, the properties are valued on a quarterly cycle, and independent appraisers value each real estate property at least once a year. TIAA’s appraisal staff performs a valuationthe other quarterly valuations of each real estate property on a quarterly basis and updates the property value if it believes that the value of thea property has changed since the previous valuation or appraisal. The appraisals are performed in accordance with Uniform Standards of Professional Appraisal Practices (USPAP), the real estate appraisal industry standards created by The Appraisal Foundation. Real estate appraisals are estimates of property values based on a professional’s opinion. Real estate properties subject to a mortgage are generally valued as described; the mortgage is valued independently of the property, and its fair value is reported separately.
Valuation of Real Estate Joint Ventures:Ventures and Limited Partnerships:Real estate joint ventures and limited partnerships are stated at the Account’s equity in the net assets of the underlying entities, adjusted, for the joint venture entities, whichventures, to value their real estate holdings and mortgage notes payable at fair value.
Valuation of Marketable Securities:Equity securities listed or traded on any United States national securitiesmarket or exchange are valued at the last sale price as of the close of the principal securities exchange on which such securities are traded or, if there is no sale, at the mean of the last bid and asked prices on such exchange. Short-termDebt securities, other than money market instruments, are statedvalued at the most recent bid price or the equivalent quoted yield for such securities (or those of comparable maturity, quality and type). Money market value.instruments, with maturities of one year or less, are valued in the same manner as debt securities or derived from a
TIAA Real Estate AccountProspectus|49
pricing matrix that has various types of money market instruments along one axis and various maturities along the other. Portfolio securities and limited partnership interests for which market quotations are not readily available are valued at fair value as determined in good faith under the direction of the Investment Committee of the TIAA Board of Trustees and in accordance with the responsibilities of the Board as a whole.
Mortgage Loans Receivable: Mortgage loans receivable are stated at fair value and are initially valued at the face amount of the mortgage loan funding. Subsequently, mortgage loans receivable are valued quarterly based on market factors, such as market interest rates and spreads for comparable loans, and the performance of the underlying collateral.
42 | Prospectus TIAA Real Estate Mortgage Loans Payable: Estimated market values of mortgage loans payable are based on the amount at which the liability could be settled (either transferred or paid back) in a current transaction exclusive of direct transaction costs. Different assumptions or changes in future market conditions could significantly affect estimated market value. At times, the Account may assume debt in connection with the purchase of real estate. For debt assumed, the Account allocates a portion of the purchase price to the below- or above-market debt and amortizes the premium or discount over the remaining life of the debt.
Foreign currency transactions and translation: Portfolio investments and other assets and liabilities denominated in foreign currencies are translated into U.S. dollars at the exchange rates prevailing at the end of the period. Purchases and sales of securities, income receipts and expense payments made in foreign currencies are translated into U.S. dollars at the exchange rates prevailing on the respective dates of the transactions. The effects of changes in foreign currency exchange rates on portfolio investments and mortgage loans payable are included in the net realized and unrealized gains and losses on investments and mortgage loans payable. Net realized gains and losses on foreign currency transactions include maturities of forward foreign currency contracts, disposition of foreign currencies, and currency gains and losses between the accrual and receipt dates of portfolio investment income and between the trade and settlement dates of portfolio investment transactions.
Accumulation and Annuity Fund:The Accumulation Fund represents the net assets attributable to participants in the accumulation phase of their investment. The Annuity Fund represents the net assets attributable to the participants currently receiving annuity payments. The net increase or decrease in net assets from investment operations is apportioned between the accounts based upon their relative daily net asset values. Once an Account participant begins receiving lifetime annuity income benefits, monthly payment levels cannot be reduced as a result of the Account’s adverse mortality experience. In addition, the contracts are required to stipulate the maximum expense charge that can be assessed, which is equal to 2.50% of average net assets per year. Accordingly, a small risk charge is paid by the Account to TIAA to assume these risks.
50|Prospectus TIAA Real Estate Account
Accounting for Investments:Real estate transactions are accounted for as of the date on which the purchase or sale transactions for the real estate properties close (settlement date). The Account recognizes a gain to the extent that the contract sales price exceeds the cost-to-date of the property being sold. A loss occurs when the cost-to-date exceeds the sales price. As the Account is fair valued and all properties are appraised quarterly, any accumulated unrealized gains and losses are reversed in the calculation of realized gains and losses. Rent from real estate properties consists of all amounts earned under tenant operating leases, including base rent, recoveries of real estate taxes and other expenses and charges for miscellaneous services provided to tenants. Rental income is recognized in accordance with the billing terms of the lease agreements. The Account bears the direct expenses of the real estate properties owned. These expenses include, but are not limited to, fees to local property management companies, property taxes, utilities, maintenance, repairs, insurance and other operating and administrative costs. An estimate of the net operating income earned from each real estate property is accrued by the Account on a daily basis and such estimates are adjusted as soon as actual operating results are determined.
The Account has limited partnershipsownership interests in various real estate funds (limited partnerships)partnerships and one limited liability corporation) and a private REIT (collectively, the “limited partnerships”). The Account records its contributions as increases to the investments, and distributions from the investments are treated as either income or return of capital, as determined by the management of the limited partnerships. Unrealized gains and losses are calculated and recorded quarterly when ourthe Account’s accounting records are compared to the fund’s financial statements and we true up our equity value.
of the limited partnerships.
Income from joint ventures is recorded based on the Account’s proportional interest in the income earned by the joint venture that has been distributed from the joint venture to the Account.venture.
Securities transactions are accounted for as of the date the securities are purchased or sold (trade date). Interest income is recorded as earned and includes accrual of discount and amortization of premium. Dividend income is recorded on the ex-dividend date or as soon as the Account is informed of the dividend. Realized gains and losses on securities transactions are accounted for on the specific identification method.
Mortgage Notes Payable:Commencing in 2005, the Account separately reports mortgage notes payable at estimated market value. Estimated market values are based on the amount at which the liability could be settled (either transferred or paid back) in a current transaction exclusive of direct transaction costs. Different assumptions or changes in future market conditions could significantly affect
TIAA Real Estate Account Prospectus | 43
estimated market value. At times, the Account may assume debt in connection with the purchase of real estate. For debt assumed, the Account allocates a portion of the purchase price to the below or above market debt and amortizes the premium or discount over the remaining life of the debt.
Foreign currency transactions and translation:Portfolio investments and other assets and liabilities denominated in foreign currencies are translated into U.S. dollars at the exchange rates prevailing at the end of the period. Purchases and sales of securities, income receipts and expense payments made in foreign currencies are translated into U.S. dollars at the exchange rates prevailing on the repsective dates of the transactions. The effect of changes in foreign currency exchange rates on portfolio investments are included in the net realized and unrealized gains and losses on investments. Net realized gains and losses on foreign currency transactions include maturities of forward foreign currency contracts, disposition of foreign currencies, and currency gains and losses between the accrual and receipt dates of portfolio investment income and between the trade and settlement dates of portfolio investment transactions.
FORWARD-LOOKING STATEMENTS
Some statements in this reportprospectus which are not historical facts may be “forward-looking statements” within the meaning of Section 21E of the Securities Exchange Act of 1934 and the Private Securities Litigation Reform Act of 1995. Forward-looking statements include statements about our expectations, beliefs, intentions or strategies for the future, and include the assumptions underlying these forward-looking statements. Forward-looking statements appear in this prospectus, among other places, in “Management’s Discussion and Analysis of Financial Conditions and Results of Operations.” Forward-looking statements involve risks and uncertainties, some of which are referenced in the sections of
TIAA Real Estate AccountProspectus|51
this prospectus entitled “Risk Factors” and below in “Quantitative and Qualitative Disclosures About Market Risk,” that could cause actual results to differ materially from historical experience or management’s present expectations.
Caution should be taken not to place undue reliance on management’s forward-looking statements, which represent management’s views only as of the date of this report is filed.prospectus. Neither management nor the Account undertake any obligation to update publicly or revise any forward-looking statement, whether as a result of new information, changed assumptions, future events or otherwise.
QUANTITATIVE AND QUALITATIVE DISCLOSURES ABOUT MARKET RISK
The Account’s real estate holdings, including real estate joint ventures and real estate-related investments,limited partnerships, which, as of December 31, 20052006 represented 81.82%81.8% of the Account’s total investments, (not including real estate equity securities), expose the Account to a variety of risks. These risks include, but are not limited to:
|
|
|
| • | General Real Estate Risk — The risk that the Account’s property values or rental and occupancy rates could go down due to general economic conditions, a weak market for real estate generally, |
44 | Prospectus TIAA Real Estate Account
|
|
|
| • | Appraisal Risk — The risk that the sale price of an Account property |
|
|
|
| • | Risk Relating to Property Sales — The risk that the Account might not be able to sell a property at a particular time for its full value, particularly in a poor market. This might make it difficult to raise cash quickly and also could lead to Account losses; |
|
|
|
| • | Risks of Borrowing — The risk that interest rate changes may impact Account returns if the Account takes out a mortgage on a property or buys a property subject to a |
• | Foreign Currency Risk — The risk that the value of the Account’s foreign investments, related debt or rental income could increase or decrease due to changes in foreign currency exchange rates or foreign currency exchange control regulations, and hedging against such changes, if undertaken by the Account, may entail additional costs and be unsuccessful. |
As of December 31, 2005, 18.19%2006, 18.2% of the Account’s total investments were in market risk sensitive instruments, comprised entirely of marketable securities. Thesesecurities and an adjustable rate mortgage loan receivable. Marketable securities include real estate equity securities, commercial mortgage-backed securities (CMBSs)(CMBS), and high-quality short-term debt instruments (i.e., commercial paper and government agency instruments)bonds). The Statement of Investments for the Account sets forth the general financial terms of these instruments, along with their fair value,values, as
52|ProspectusTIAA Real Estate Account
determined in accordance with procedures described in Note 1 to the Account’s financial statements. Note that the Account does not currently invest in derivative financial instruments.
The Account’s investments in marketable securities and mortgage loans receivable are subject to the following general risks:
|
|
|
| • |
|
|
|
|
| • |
|
|
|
|
| • | Interest Rate Volatility — The risk that interest rate volatility |
In addition, mortgage-backed securities are subject to prepayment risk —or extension risk (i.e., the risk that borrowers will repay the loans early.earlier or later than anticipated). If the underlying mortgage assets experience greaterfaster than anticipated paymentsrepayments of principal, the Account could fail to recoup some or all of its initial investment in these securities.securities, since the original price paid by the Account was based in part on assumptions regarding the receipt of interest payments. If the underlying mortgage assets are repaid later than anticipated, the Account could lose the opportunity to reinvest the anticipated cash flows at a time when interest rates might be rising. The rate of prepayment depends on a variety of geographic, social and other functions, including prevailing market interest rates and general economic factors. The market value of these securities is also highly sensitive to changes in interest rates. Note that the potential for appreciation, which could otherwise be expected to result from a decline in interest rates, may be limited by any increased prepayments. These securities may be harder to sell than other securities.
In addition to these risks, real estate equity securities and mortgage-backed securities are subject to many of the same general risks inherent in real estate investing, making mortgage loans and investing in debt securities. For more information on the risks associated with all of the Account’s investments, see the Account’s most recent prospectus.
TIAA Real Estate AccountProspectus| | 4553
We value the Account’s assets as of the close of each valuation day by taking the sum of:
|
|
|
| • | the value of the Account’s cash, cash equivalents, and short-term and other debt instruments |
|
|
|
| • | the value of the Account’s other securities investments and other assets |
|
|
|
| • | the value of the individual real properties and other real |
|
| |
| • | an estimate of the net operating income accrued by the Account from its properties and other real |
VALUING REAL ESTATE INVESTMENTS
Valuing Real Property:Individual real properties will be valued initially at their purchase prices. (PricesPrices include all expenses related to purchase, such as acquisition fees, legal fees and expenses, and other closing costs.) We could use a different value in appropriate circumstances.
After this initial valuation, an independent appraiser, approved by the independent fiduciary, will value properties at least once a year. The independent fiduciary can require additional appraisals if it believes that a property has changed materially or otherwise to assure that the Account is valued correctly.
Quarterly, we will conduct an internal review of each of the Account’s properties. We’ll adjust a valuation if we believe that the value of the property has changed since the previous valuation. We’ll continue to use the revised value to calculate the Account’s net asset value until the next review or appraisal. However, we can adjust the value of a property in the interim to reflect what we believe are actual changes in property value.
The Account’s net asset value will include the current value of any note receivable (an amount that someone else owes the Account) from selling a real estate–relatedestate-related investment. We’ll estimate the value of the note by applying a discount rate appropriate to then-current market conditions.
Development properties initially will be valued at the Account’s cost, and the value will be adjusted as additional development costs are incurred. Once a property receives a certificate of occupancy, within one year from the initial funding by the Account, or the property is substantially leased, whichever is earlier, the property will be appraised by an independent appraiser, approved by the independent fiduciary. We may also have the properties independently appraised earlier if circumstances warrant.
The Account may, at times, value properties purchased together as a portfolio as a single asset, to the extent we believe that the property will likely be sold as
46 54|ProspectusTIAA Real Estate Account
one portfolio. The value assigned to the portfolio as a whole may be more or less than the valuation of each property individually.
Because of the nature of real estate assets, the Account’s net asset value won’t necessarily reflect the true or realizable value of its real estate assets (i.e., what the Account would getreceive if it sold them).
Valuing Real Property Encumbered by Debt:In general, when we value an Account property subject to a mortgage, the Account’s net asset value will include the value of the Account’s interest in the property (with the property valued as described above). The value of the mortgage will be recorded as a liability based on a valuation performed independently of the property.
Valuing Conventional Mortgages:Individual mortgage loans made by the Account will be valued initially at their face amount. Thereafter, quarterly, we’ll value the Account’s fixed interest mortgage loans by discounting payments of principal and interest to their present value (using a rate at which commercial lenders would make similar mortgage loans). We’ll also use this method for foreign mortgages with conventional terms. We can adjust the mortgage value more frequently if circumstances require it. Floating variable rate mortgages will generally be valued at their face amount, although we may adjust these values as market conditions dictate.
Valuing Participating Mortgages:Individual mortgages will initially be valued at their face amount. Thereafter, quarterly, we’ll estimate the values of the participating mortgages by making various assumptions about occupancy rates, rental rates, expense levels, and other things. We’ll use these assumptions to project the cash flow and anticipated sale proceeds from each investment over the term of the loan, or sometimes over a shorter period. To calculate sale proceeds, we’ll assume that the real property underlying each investment will be sold at the end of the period used in the valuation at a price based on market assumptions for the time of the projected sale. We’ll then discount the estimated cash flows and sale proceeds to their present value (using rates appropriate to then-current market conditions).
Net Operating Income:The Account usually receives operating income from its investments intermittently, not daily. In fairness to participants, we estimate the Account’s net operating income rather than applying it when we actually receive it, and assume that the Account has earned (accrued) a proportionate amount of that estimated amount daily. You bear the risk that, until we adjust the estimates when we receive actual income reports, the Account could be under- or over-valued.
Every year, we prepare a month-by-month estimate of the revenues and expenses (estimated net operating income) for each of the Account’s properties. Each day, we add the appropriate fraction of the estimated net operating income for the month to the Account’s net asset value.
Every month, the Account receives a report of the actual operating results for the prior month for each property (actual net operating income). We then recognize the actual net operating income on the accounting records of the
TIAA Real Estate AccountProspectus|55
Account and adjust the outstanding daily accrued receivable accordingly. As the
TIAA Real Estate Account Prospectus | 47
Account actually receives cash from a property, we’ll adjust the daily accrued receivable and other accounts appropriately.
Adjustments:We can adjust the value of an investment if we believe events or market conditions (such as a borrower’s or tenant’s default) have affected how much the Account could getreceive if it sold the investment. We may not always be aware of each event that might require a valuation adjustment, and because our evaluation is based on subjective factors, we may not in all cases make adjustments where changing conditions could affect the value of an investment.
The independent fiduciary will need to approve adjustments to any valuation of one or more properties that
|
|
|
| • | is made within three months of the annual independent appraisal or |
|
|
|
| • | results in an increase or decrease of: |
|
|
|
| • | more than 6 percent of the value of any of the Account’s properties since the last independent annual appraisal |
|
|
|
| • | more than 2 percent in the value of the Account since the prior month or |
|
|
|
| • | more than 4 percent in the value of the Account within any quarter. |
Right to Change Valuation Methods:If we decide that a different valuation method would reflect the value of a real estate–relatedestate-related investment more accurately, we may use that method if the independent fiduciary consents. Changes in TIAA’s valuation methods could change the Account’s net asset value and change the values at which participants purchase or redeem Account interests.
VALUING OTHER INVESTMENTS (INCLUDING CERTAIN REAL ESTATE–RELATEDESTATE-RELATED INVESTMENTS)
Debt Securities and Money Market Instruments:We value debt securities (excluding money market instruments) for which market quotations are readily available based on the most recent bid price or the equivalent quoted yield for such securities (or those of comparable maturity, quality and type). We derive these values utilizing an independent pricing service, except when we believe the prices do not accurately reflect the security’s fair value. We value money market instruments with maturities of one year or less in the same manner as debt securities, or derive them from a pricing matrix that has various types of money market instruments along one axis and various maturities along the other. All debt securities may also be valued at fair value as determined in good faith by the Investment Committee of the TIAA Board of Trustees.
Equity Securities:We value equity securities (including REITs) listed or traded on the New York Stock Exchange or the American Stock Exchange at their last sale price on the valuation day. If no sale is reported that day, we use the mean of the closing bid and asked prices. Equity securities listed or traded on any other exchange are valued in a comparable manner on the principal exchange where traded.
We value equity securities traded on the NASDAQ Stock Market’s National MarketMarkets at their last sale pricethe Nasdaq Official Closing Price on the valuation day. If no sale is reported that day,
48 56|ProspectusTIAA Real Estate Account
we use the mean of the closing bid and asked prices. Other U.S. over-the-counter equity securities are valued at the mean of the closing bid and asked prices.
Mortgage-Backed Securities:We value mortgage-backed securities in the same manner in which we value debt securities, as described above.
Foreign Securities:To value investments traded on a foreign exchange or in foreign markets, we use their closing values under the generally accepted valuation method in the country where traded, as of the valuation date. We convert this to U.S. dollars at the exchange rate in effect on the valuation day.
Investments Lacking Current Market Quotations:We value securities or other assets for which current market quotations are not readily available at fair value as determined in good faith under the direction of the Investment Committee of TIAA’s Board of Trustees and in accordance with the responsibilities of TIAA’s Board as a whole. In evaluating fair value for the Account’s interest in certain commingled investment vehicles, the Account will generally look to the value periodically assigned to interests by the issuer. When possible, the Account will seek to have input in formulating the issuer’s valuation methodology.
Deductions are made each valuation day from the net assets of the Account for various services required to manage investments, administer the Account and the contracts, and to cover certain risks borne by TIAA. Services are performed at cost by TIAA and TIAA-CREF Individual & Institutional Services, LLC (“Services”), a wholly owned subsidiary of TIAA. Because services are provided at cost, we expect that expense deductions will be relatively low. TIAA guarantees that in the aggregate, the expense charges will never be more than 2.50% of average net assets per year.
TIAA Real Estate Account Prospectus | 49
The current annual estimated expense deductions are:
| ||||||
|
|
|
|
| ||
Type of Expense Deduction |
| Estimated |
| Services Performed | ||
Investment Management |
|
| % |
| For TIAA’s investment advice, portfolio | |
accounting, custodial services, and similar | ||||||
services, including independent fiduciary and | ||||||
appraisal fees | ||||||
|
|
|
|
|
| |
Administration |
|
| % |
| For Services’ administrative services, such as | |
| ||||||
|
|
|
|
|
| |
Distribution |
|
| % |
| For Services’ expenses related to distributing | |
the annuity contracts | ||||||
|
|
|
|
|
| |
Mortality and Expense Risk |
|
| % |
| For TIAA’s bearing certain mortality and expense | |
risks | ||||||
|
|
|
|
|
| |
Liquidity Guarantee |
|
| % |
| For TIAA’s liquidity guarantee | |
Total Annual Expense Deduction |
|
| % |
| For total services to the Account | |
TIAA Real Estate AccountProspectus|57
After the end of every quarter, we reconcile how much we deducted as discussed above with the expenses the Account actually incurred. If there is a difference, we add it to or deduct it from the Account in equal daily installments over the remaining days in the following quarter. Since our at-cost deductions are based on projections of Account assets and overall expenses, the size of any adjusting payments will be directly affected by how different our projections are from the Account’s actual assets or expenses. While our projections of Account asset size (and resulting expense fees) are based on our best estimates, the size of the Account’s assets can be affected by many factors, including premium growth, participant transfers into or out of the Account, and any changes in the value of portfolio holdings. Historically, the adjusting payments have resulted in both upward and downward adjustments to the Account’s expense deductions for the following quarter.
TIAA’s boardBoard of Trustees can revise the deduction rates from time to time to keep deductions as close as possible to actual expenses.
Currently there are no deductions from premiums or withdrawals, but we might change this in the future. Property expenses, brokers’ commissions, transfer taxes, and other portfolio expenses are charged directly to the Account.
EMPLOYER PLAN FEE WITHDRAWALS
Your employer may, in accordance with the terms of your plan, and with TIAA’s approval, withdraw amounts from your Real Estate Account accumulation under your Retirement Select,Choice or Retirement Choice Retirement Choice Plus, or Retirement Select Plus contract, and, on a limited basis, under your GA, GSRA, GA or Keogh contract, to pay fees associated with the administration of the plan. These fees are separate from the expense deductions of the Account, and are not included for purposes of TIAA’s guarantee that the total annual expense deduction of the Account will not exceed the rate 2.50% of average net assets per year. TIAA
50 | Prospectus TIAA Real Estate Account
reserves the right to suspend or reinstate its approval for a plan to make such withdrawals. The amount and the effective date of an employer plan fee withdrawal will be in accordance with the terms of your plan. TIAA will determine all values as of the end of the effective date. An employer plan fee withdrawal cannot be revoked after its effective date. Each employer plan fee withdrawal will be made on a pro-rata basis from all your available TIAA and CREF accounts. An employer plan fee withdrawal reduces the accumulation from which it is paid by the amount withdrawn.
If allowed by your contract, your employer may also charge a fee on your account to pay fees associated with administering the plan.
CERTAIN RELATIONSHIPS WITH TIAA
As noted elsewhere in this prospectus, TIAA’s general account plays a significant role in operating the Real Estate Account, including providing a liquidity guarantee, and investment advisory and other services. In addition,
58|ProspectusTIAA Real Estate Account
Services, a wholly-owned subsidiary of TIAA, provides administration and distribution services for the Account.
Liquidity Guarantee.As noted above under “Establishing and Managing the Account — The Role of TIAA — Liquidity Guarantee,” if the Account’s liquid assets and its cash flow from operating activities and participant transactions are insufficient to fund redemption requests, TIAA’s general account has agreed to purchase liquidity units. TIAA thereby guarantees that a participant can redeem accumulation units at their then-current daily net asset value. For the years ended December 31, 2006, December 31, 2005 and December 31, 2004, the Account expensed $3,905,051, $3,170,017 and $1,868,733, respectively, for this liquidity guarantee from TIAA through a daily deduction from the net assets of the Account.
Investment Advisory and Administrative Services/Certain Risks Borne by TIAA.As noted above under “Expense Deductions,” deductions are made each valuation day from the net assets of the Account for various services required to manage investments, administer the Account and distribute the contracts. These services are performed at cost by TIAA and Services. Deductions are also made each valuation day to cover mortality and expense risks borne by TIAA.
For the years ended December 31, 2006, December 31, 2005 and December 31, 2004, the Account expensed $26,899,307, $19,603,225 and $14,393,388, respectively, for investment management services and $6,931,833, $6,196,549 and $4,093,858, respectively, for mortality and expense risks provided/borne by TIAA. For the same period, the Account expensed $45,712,473, $27,130,406 and $16,372,446, respectively, for administrative and distribution services provided by Services.
TIAA offers the Real Estate Account as a variable option for the annuity contracts described below. Some employer plans may not offer the Real Estate Account as an option for RA, GRA, GSRA, Retirement Select, Retirement Select Plus, Retirement Choice, Retirement Choice Plus, or Keogh contracts. The College Retirement Equities Fund (CREF) is a companion organization to TIAA. A companion CREF contract may have been issued to you when you received the TIAA contract offering the Account. For more information about the CREF annuity contracts, the TIAA traditional annuity, the TIAA Access variable annuity accounts, other TIAA separate accounts offered from time to time and particular mutual funds and investment options offered under the terms of your plan, please see the applicable contracts and respective prospectuses for those investment options.
Importantly, neither TIAA nor CREF guarantee the investment performance of the Account nor do they guarantee the value of your units at any time.
RA (RETIREMENT ANNUITY), AND GRA (GROUP RETIREMENT ANNUITY), AND RETIREMENT SELECT CONTRACTS
RA GRA, and Retirement SelectGRA contracts are used mainly for employee retirement plans. RA contracts are issued directly to you. GRA and Retirement Select contracts, which are group contracts, are issued through an agreement between your employer and TIAA.
TIAA Real Estate AccountProspectus|59
Depending on the terms of your plan, RA GRA, and Retirement SelectGRA premiums can be paid by your employer, you, or both. If you’re paying some of or the entire periodic premium, your contributions can be in either pre-tax dollars by salary reduction or after-tax dollars by payroll deduction. Your employer may offer you the option of making contributions in the form of after-tax Roth-style contributions, though you won’t be able to take tax deductions for these contributions. You can also transfer funds from another investment choice under your employer’s plan to your contract. Ask your employer for more information about these contracts.
SRA (SUPPLEMENTAL RETIREMENT ANNUITY), AND GSRA (GROUP SUPPLEMENTAL RETIREMENT ANNUITY)
These are for voluntary tax-deferred annuity (TDA) plans and 401(k) plans. SRA contracts are issued directly to you. GSRA and Retirement Select Plus
TIAA Real Estate Account Prospectus | 51
contracts, which are group contracts, are issued through an agreement between your employer and TIAA. Generally, your employer pays premiums in pre-tax dollars through salary reduction. Your employer may offer you the option of making contributions in the form of after-tax Roth-style contributions, though you won’t be able to take tax deductions for these contributions. Although you can’t pay premiums directly, you can transfer amounts from other TDA plans.
RETIREMENT SELECT/RETIREMENT SELECT PLUS ANNUITIES AND RETIREMENT CHOICE/RETIREMENT CHOICE PLUS ANNUITIES
These are very similar in operation to the GRAs and GSRAs, respectively, except that they are issued directly to your employer onor your plan’s trustee. Among other rights, the employer retains the right to transfer accumulations under these contracts to alternate funding vehicles.
CLASSIC IRA AND ROTH IRA
Classic IRAs are individual contracts issued directly to you. You and your spouse can each open a Classic IRA with an annual contribution of up to $4,000 or by rolling over funds from another IRA or retirement plan, if you meet our eligibility requirements. If you are age 50 or older, you may contribute up to $5,000. The combined limit for your contributions to a Classic IRA and a Roth IRA for a single year is $4,000, or $5,000 if you are age 50 or older, excluding rollovers. (The dollar limits listed are for 2006;2007; different dollar limits may apply in future years.) We can’t issue you a joint contract.
Roth IRAs are also individual contracts issued directly to you. You or your spouse can each open a Roth IRA with an annual contribution up to $4,000 or with a rollover from another IRA or a Classic IRA issued by TIAA if you meet our eligibility requirements. If you are age 50 or older you may contribute up to $5,000. The combined limit for your contributions to a Classic IRA and a Roth IRA for a single year is $4,000, or $5,000 if you are age 50 or older, excluding rollovers. (The dollar limits listed are for 2006;2007; different dollar limits may apply in future years.) We can’t issue you a joint contract.
60|ProspectusTIAA Real Estate Account
Your employer may offer SEP IRAs (Simplified Employee Retirement Plans), which are subject to different rules.
Classic and Roth IRAs may together be referred to as “IRAs” in this prospectus.
GA (GROUP ANNUITY) AND INSTITUTIONALLY OWNED GSRA
These are used exclusively for employee retirement plans and are issued directly to your employer or your plan’s trustee. Your employer pays premiums directly to TIAA (you can’t pay the premiums directly to TIAA) and your employer or the plan’s trustee may control the allocation of contributions and transfers to and from these contracts including withdrawing completely from the Account. If a GA or GSRA contract is issued pursuant to your plan, the rules relating to transferring and withdrawing your money, receiving any annuity income or death
52 | Prospectus TIAA Real Estate Account
benefits, and the timing of payments may be different, and are determined by your plan. Ask your employer or plan administrator for more information.
KEOGHS
TIAA also offers contracts for Keogh plans. If you are a self-employed individual who owns an unincorporated business, you can use our Keogh contracts for a Keogh plan, and cover common law employees, subject to our eligibility requirements.
ATRA (AFTER-TAX RETIREMENT ANNUITY)
The after-tax retirement annuities (ATRA) are individual non-qualified deferred annuity contracts, issued to participants who are eligible and would like to remit personal premiums under the contractual provisions of their RA contract. To be eligible, you must have an active and premium-paying or paid up RA contract.
Note that the tax rules governing these non-qualified contracts differ significantly from the treatment of qualified contracts. See “Taxes,” on page 6574 for more information.
IRA AND KEOGH ELIGIBILITY
You or your spouse can set up a TIAA Classic or Roth IRA or a Keogh if you’re a current or retired employee or trustee of an eligible institution, or if you own a TIAA or CREF annuity or a TIAA individual insurance contract. To be considered a retired employee for this purpose, an individual must be at least 55 years old and have completed at least three years of service at an eligible institution. In the case of partnerships, at least half the partners must be eligible individuals and the partnership itself must be primarily engaged in education or research. Eligibility may be restricted by certain income limits on opening Roth IRA contracts.
TIAA Real Estate AccountProspectus|61
STATE REGULATORY APPROVAL
State regulatory approval may be pending for certain of these contracts and they may not currently be available in your state.
STARTING OUT
Generally, we’ll issue you a TIAA contract when we receive your completed application or enrollment form. Your premiums will be credited to the Real Estate Account as of the business day we receive them.
If we receive premiums from your employer before your application or enrollment form, we’ll generally invest the money in the CREF Money Market Account until we receive your form. (Some employer plans may require that we send such premiums back to the employer or have a different default.) We’ll transfer the appropriate amount from the CREF Money Market Account and credit it to the Real Estate Account as of end of the business day we receive your completed form.
TIAA Real Estate Account Prospectus | 53
If the allocation instructions on your application or enrollment form are incomplete, violate plan restrictions, or total more than 100 percent, we’ll invest your premiums in the CREF Money Market Account (Some employer plans may have a different default). After we receive a complete and correct application, we’ll follow your allocation instructions for future premiums. However, any amounts that we credited to the CREF Money Market Account before we received correct instructions will be transferred to the Real Estate Account only on request, and will be credited as of the business day we receive that request.
TIAA generally doesn’t currently restrict the amount or frequency of premiums to your contract, although we may in the future. Your employer’s retirement plan may limit your premium amounts, while the Internal Revenue Code limits the total annual premiums you may invest in plans qualified for favorable tax treatment.
If you want to directly contribute personal premiums under the contractual provisions of your RA contract, you will be issued an ATRA contract. Premiums and any earnings on the ATRA contract will not subject to your employer’s retirement plan.
In most cases (subject to any restriction we may impose, as described in this prospectus), TIAA will accept premiums to a contract at any time during your accumulation period. Once your first premium has been paid, your TIAA contract can’t lapse or be forfeited for nonpayment of premiums. TIAA can stop accepting premiums to contracts at any time.
Note that we cannot accept money orders or travelers checks. In addition, we will not accept a third-party check where the relationship of the payor to the account owner cannot be identified from the face of the check.
We will not be deemed to have received any premiums sent to the addresses designated for remitting premiums until the third-party service that administers
62|ProspectusTIAA Real Estate Account
the receipt of mail through those addresses has processed the payment on our behalf.
Important Information About Procedures for Opening a New Account
To help the U.S. government fight the funding of terrorism and money laundering activities, Federal law requires all financial institutions, including us, to obtain, verify and record information that identifies each person who opens an account.
What this means for you:When you open an account, we will ask for your name, address, date of birth, social security number and other information that will allow us to identify you, such as your home telephone number. Until you provide us with the information we need, we may not be able to open an account or effect any transactions for you.
CHOOSING AMONG INVESTMENT ACCOUNTS
You can allocate all or part of your premiums to the Real Estate Account, unless your employer’s plan precludes that choice. You can also allocate premiums to TIAA’s traditional annuity, the CREF variable investment accounts, the TIAA Access variable annuity accounts, other TIAA separate accounts offered from time to time (if available under the terms of your employer’s plan) and, in
54 | Prospectus TIAA Real Estate Account
some cases, certain mutual funds if the account or fund is available under your employer’s plan.
You can change your allocation choices for future premiums
|
|
|
| • | by writing to our home office |
|
|
|
| • | using the TIAA-CREF Web Center’s account access feature at www.tiaa-cref.org or |
|
|
|
| • | calling our Automated Telephone Service (24 hours a day) at 800 842-2252 |
THE RIGHT TO CANCEL YOUR CONTRACT
You can generally cancel yourany RA, SRA or GSRA contract (other than a Retirement Select contract or Retirement Select Plus contract not issued in New York) up to 30 days after you first receive it, unless we have begun making annuity payments from it. If you already had a TIAA contract prior to investing in the Real Estate Account, you have no 30-day right to cancel the contract. To cancel, mail or deliver the contract with a signed Notice of Cancellation (available by contacting TIAA) to our home office. We’ll cancel the contract, then send the entire current accumulation to whomever sent the premiums. You bear the investment risk during this period (although some states require us to send back your entire premium without accounting for investment results).
DETERMINING THE VALUE OF YOUR INTEREST IN THE ACCOUNT — ACCUMULATION UNITS
When you pay premiums or make transfers to the Real Estate Account, you buy accumulation units. When you take a cash withdrawal, transfer from the Account, or apply funds to begin annuity income, the number of your
TIAA Real Estate AccountProspectus|63
accumulation units decrease. We calculate how many accumulation units to credit your account with by dividing the amount you applied to the Account by its accumulation unit value at the end of the business day when we received your premium or transfer. To determine how many accumulation units to subtract for cash withdrawals and transfers, we use the accumulation unit value for the end of the business day when we receive your transaction request and all required information and documents (unless you ask for a later date). A business day ends at 4:00 p.m. Eastern time or when trading closes on the NYSE, if earlier.
The accumulation unit value reflects the Account’s investment experience (i.e., the real estate net operating income accrued, as well as dividends, interest and other income accrued), realized and unrealized capital gains and losses, as well as Account expense charges.
Calculating Accumulation Unit Values:We calculate the Account’s accumulation unit value at the end of each valuation day. To do that, we multiply the previous day’s value by the net investment factor for the Account. The net investment factor is calculated asAdivided byB, whereAandBare defined as:
TIAA Real Estate Account Prospectus | 55
|
|
|
| A. | The value of the Account’s net assets at the end of the current valuation period, less premiums received during the current valuation period. |
|
|
|
| B. | The value of the Account’s net assets at the end of the previous valuation period, plus the net effect of transactions made at the start of the current valuation period. |
HOW TO TRANSFER AND WITHDRAW YOUR MONEY
Generally, TIAA allows you to move your money to or from the Real Estate Account in the following ways:
|
|
|
| • | from the Real Estate Account to a CREF investment account, a TIAA Access variable account (if available) or TIAA’s traditional annuity |
|
|
|
| • | to the Real Estate Account from a CREF investment account, a TIAA Access variable account (if available) or TIAA’s traditional annuity (transfers from TIAA’s traditional annuity under RA, GRA |
|
|
|
| • | from the Real Estate Account to other companies |
|
|
|
| • | to the Real Estate Account from other companies/plans |
|
|
|
| • | by withdrawing cash |
|
|
|
| • | by setting up a program of automatic withdrawals or transfers |
For more information regarding the transfer policies of CREF, TIAA Access or another investment option listed above, please see the respective contract, prospectus or other governing instrument.
These transactions generally must be for at least $1,000 at a time (or your entire Account accumulation, if less). These options may be limited by the terms of your
64|ProspectusTIAA Real Estate Account
employer’s plan, or by current tax law, or by the terms of your contract, as set forth below. Transfers and cash withdrawals are currently free. TIAA can place restrictions on transfers or charge fees for transfers andand/or withdrawals in the future.
Transfers and cash withdrawals are effective at the end of the business day we receive your request and all required documentation. You can also choose to have transfers and withdrawals take effect at the close of any future business day. For any transfers to TIAA’s traditional annuity, the crediting rate will be the rate in effect at the close of business of the first day that you participate in TIAA’s traditional annuity, which is the next business day after the effective date of the transfer.
To request a transfer or to withdraw cash:
|
|
|
| • | write to TIAA’s home office at 730 Third Avenue, New York, NY 10017-3206 |
|
|
|
| • | call us at 800 842-2252 or |
|
|
|
| • | for internal transfers, using the TIAA-CREF Web Center’s account access feature at www.tiaa-cref.org |
56 | Prospectus TIAA Real Estate Account
You may be required to complete and return certain forms to effect these transactions. We can suspend or terminate your ability to transact by telephone, over the Internet, or by fax at any time, for any reason.
Before you transfer or withdraw cash, make sure you understand the possible federal and other income tax consequences. See “Taxes,”“Taxes” on page 65.74.
TRANSFERS TO AND FROM OTHER TIAA-CREF ACCOUNTS
Once every calendar quarter you can transfer some or all of your accumulation in the Real Estate Account to TIAA’s traditional annuity, to another TIAA annuity offered by your employer’s plan, to one of the CREF accounts, to a TIAA Access variable annuity account or to mutual funds offered under the terms of your plan. Transfers to CREF accounts or to certain other options may be restricted by your employer’s plan.
You can also transfer some or all of your accumulation in TIAA’s traditional annuity, in your CREF accounts, TIAA Access variable annuity accounts or in the mutual funds or TIAA annuities offered under the terms of your plan to the Real Estate Account, if your employer’s plan offers the Account. Transfers from TIAA’s traditional annuity to the Real Estate Account under RA, GRA Retirement Select, or Retirement Choice contracts can only be effected over a period of time (up to ten years) and may be subject to other limitations, as specified in your contract. Amounts held under an ATRA contract cannot be transferred to or from any retirement plan contract.
Because excessive transfer activity can hurt Account performance and other participants, we may further limit how often you transfer or otherwise modify the transfer privilege.
TRANSFERS TO OTHER COMPANIES
Generally you may transfer funds from the Real Estate Account to a company other than TIAA or CREF, subject to certain tax restrictions. This right may be limited by your employer’s plan. If your employer participates in our special
TIAA Real Estate AccountProspectus|65
transfer services program, we can make automatic monthly transfers from your RA GRA, or Retirement SelectGRA contract to another company, and the $1,000 minimum will not apply to these transfers. Roth amounts in a 403(b) or 401(a) plan can only be rolled over to another Roth account under such plan or to a Roth IRA, as permitted by applicable law and the terms of the plans.
Under the Retirement Choice and Retirement Choice Plus contracts, your employer could transfer monies from an Account and apply it to another Account or investment option, subject to the terms of your plan, and without your consent.
TRANSFERS FROM OTHER COMPANIES/PLANS
Subject to your employer’s plan, you can usually transfer or rollover money from another 403(b), 401(a)/403(a) or governmental 457(b) retirement plan to your qualified TIAA contract. You may also rollover before-tax amounts in a Classic IRA to 403(b) plans, 401(a)/403(a) plans or eligible governmental 457(b) plans, provided such employer plans agree to accept the rollover. Similarly, you may be able to rollover funds from 401(a), 403(a), 403(b) and governmental 457(b)
TIAA Real Estate Account Prospectus | 57
plans to a TIAA Classic IRA. Roth amounts in a 403(b) or 401(a) plan can only be rolled over to another Roth account under such plan or to a Roth IRA, as permitted by applicable law and the terms of the plans. Funds in a private 457(b) plan can be transferred to another private 457(b) plan only. Accumulations in private 457(b) plans may not be rolled over to a qualified plan (e.g., a 401(a) plan), a 403(b) plan, a governmental 457(b) plan or an IRA.
WITHDRAWING CASH
You may withdraw cash from your SRA, GSRA, Retirement Select Plus, IRA, or Keogh Real Estate Account accumulation at any time during the accumulation period, provided federal tax law permits it (see below). CashReal Estate Account cash withdrawals from your RA, GRA, Retirement Choice or Retirement Choice Plus or Retirement Select accumulation may be limited by the terms of your employer’s plan and federal tax law. Normally, you can’t withdraw money from a contract if you’ve already applied that money to begin receiving lifetime annuity income. Current federal tax law restricts your ability to make cash withdrawals from your accumulation under most voluntary salary reduction agreements. Withdrawals are generally available only if you reach age 59½, leave your job, become disabled, or die, or if your employer terminates its retirement plan. If your employer’s plan permits, you may also be able to withdraw money if you encounter hardship, as defined by the IRS, but hardship withdrawals can be from contributions only, not investment earnings. You may be subject to a 10 percent penalty tax if you make a withdrawal before you reach age 59½, unless an exception applies to your situation.
Under current federal tax law, you are not permitted to withdraw from 457(b) plans earlier than the calendar year in which you reach age 70½ or leave your job or are faced with an unforeseeable emergency (as defined by law). There are generally no early withdrawal tax penalties if you withdraw under any of these circumstances (i.e., no 10% tax on distributions prior to age 59½).
66|ProspectusTIAA Real Estate Account
Special rules and restrictions apply to Classic and Roth IRAs.
SYSTEMATIC WITHDRAWALS AND TRANSFERS
If your employer’s plan allows, you can set up a program to make cash withdrawals or transfers automatically by specifying that we withdraw or transfer from your Real Estate Account accumulation any fixed number of accumulation units, dollar amount, or percentage of accumulation until you tell us to stop or until your accumulation is exhausted. Currently, the program must be set up so that at least $100 is automatically withdrawn or transferred at a time.
WITHDRAWALS TO PAY ADVISORY FEES
You can set up a program to have monies withdrawn directly from your retirement plan or IRA accumulations to pay your financial advisor, if your employer’s plan allows. You will be required to complete and return certain forms to effect these withdrawals, including how and from which accounts you want these monies to be withdrawn. Before you set up this program, make sure you
58 | Prospectus TIAA Real Estate Account
understand the possible tax consequences of these withdrawals. See the discussion under “Taxes” below.
POSSIBLE RESTRICTIONS ON PREMIUMS AND TRANSFERS TO THE ACCOUNT
From time to time we may stop accepting premiums for and/or transfers into the Account. We might do so if, for example, we can’t find enough appropriate real estate-related investment opportunities at a particular time. Whenever reasonably possible, we will notify you before we decide to restrict premiums and/or transfers. However, because we may need to respond quickly to changing market conditions, we reserve the right to stop accepting premiums and/or transfers at any time without prior notice.
If we decide to stop accepting premiums into the Account, amounts that would otherwise be allocated to the Account will be allocated to the CREF Money Market Account (or to a different default account under the terms of your employer’s plan) instead, unless you give us other allocation instructions. We will not transfer these amounts out of the CREF Money Market Account (or such different default account) when the restriction period is over, unless you request that we do so. However, we will resume allocating premiums to the Account on the date we remove the restrictions.
ADDITIONAL LIMITATIONS
Federal law requires us to obtain, verify and record information that identifies each person who opens an account. Until we receive the information we need, we may not be able to effect transactions for you. Furthermore, if we are unable to verify your identity, or that of another person authorized to act on your behalf, or if we believe that we have identified potentially criminal activity, we reserve the right to take such action as we deem appropriate, which may include closing your account.
TIAA Real Estate AccountProspectus|67
MARKET TIMING POLICY
There are participants who may try to profit from transferring money back and forth among the CREF accounts, the Real Estate Account, the TIAA Access variable accounts and mutual funds available under the terms of your plan, in an effort to “time” the market. As money is shifted in and out of these accounts, the accounts or funds incur transaction costs, including, among other things, expenses for buying and selling securities. These costs are borne by all participants, including long-term investors who do not generate the costs. In addition, market timing can interfere with efficient portfolio management and cause dilution, if timers are able to take advantage of pricing inefficiencies. To discourage market-timing activity, transfers from the Account to a CREF or TIAA account are limited to once every calendar quarter. In addition, participants who make more than three transfers out of any TIAA or CREF account or any of the TIAA-CREF mutual funds available under your plan (other than the CREF Money Market Account) in a calendar month will be advised that if this transfer frequency continues, we will suspend their ability to make telephone, fax and Internet transfers. Systematic withdrawals and transfers which are established and effected in accordance with an employer’s plan will not be deemed to be multiple transfers for purposes of these market timing restrictions.
We have the right to modify our policy at any time without advance notice.
TIAA Real Estate Account Prospectus | 59
THE ANNUITY PERIOD IN GENERAL
You can receive an income stream from all or part of your Real Estate Account accumulation. Unless you opt for a lifetime annuity, generally you must be at least age 59½ to begin receiving annuity income payments from your annuity contract free of a 10 percent early distribution penalty tax. Your employer’s plan may also restrict when you can begin income payments. Under the minimum distribution rules of the Internal Revenue Code, you generally must begin receiving some payments from your contract shortly after you reach the later of age 70½ or you retire. For more information, see “Minimum Distribution Requirements,” on page 61.76. Also, you can’t begin a one-life annuity after you reach age 90, nor may you begin a two-life annuity after either you or your annuity partner reach age 90.
Your income payments may be paid out from the Real Estate Account through a variety of income options. You can pick a different income option for different portions of your accumulation, but once you’ve started payments you usually can’t change your income option or annuity partner for that payment stream.
Usually income payments are monthly. You can choose quarterly, semi-annual, and annual payments as well. (TIAA has the right to not make payments at any interval that would cause the initial payment to be less than $100.) We’ll send your payments by mail to your home address or, on your request, by mail or electronic funds transfer to your bank.
68|ProspectusTIAA Real Estate Account
Your initial income payments are based on the value of your accumulation on the last valuation day before the annuity starting date. Your payments change after the initial payment based on the Account’s investment experience and the income change method you choose.
There are two income change methods for annuity payments: annual and monthly. Under the annual income change method, payments from the Account change each May 1, based on the net investment results during the prior year (April 1 through March 31). Under the monthly income change method, payments from the Account change every month, based on the net investment results during the previous month. For the formulas used to calculate the amount of annuity payments, see page 62.71. The total value of your annuity payments may be more or less than your total premiums.
ANNUITY STARTING DATE
Ordinarily, annuity payments begin on the date you designate as your annuity starting date, provided we have received all documentation necessary for the income option you’ve picked. If something’s missing, we’ll defer your annuity starting date until we receive it. Your first annuity check may be delayed while we process your choice of income options and calculate the amount of your initial payment. Any premiums received within 70 days after payments begin may be used to provide additional annuity income. Premiums received after 70 days will remain in your accumulating annuity contract until you give us further instructions. Ordinarily, your
60 | Prospectus TIAA Real Estate Account
first annuity payment can be made on any business day between the first and twentieth of any month.
INCOME OPTIONS
Both the number of annuity units you purchase and the amount of your income payments will depend on which income option you pick. Your employer’s plan, tax law and ERISA may limit which income options you can use to receive income from an RA or GRA, GSRA, Retirement Select, Retirement Select Plus, Retirement Choice, Retirement Choice Plus or Keogh contract. Ordinarily you’ll choose your income options shortly before you want payments to begin, but you can make or change your choice any time before your annuity starting date.
All Real Estate Account income options provide variable payments, and the amount of income you receive depends in part on the investment experience of the Account. The current options are:
|
|
|
| • | One-Life Annuity with or without Guaranteed Period: Pays income as long as you live. If you opt for a guaranteed period (10, 15 or 20 years) and you die before it’s over, income payments will continue to your beneficiary until the end of the period. If you don’t opt for a guaranteed period, all payments end at your death — so that it’s possible for you to receive only one payment if you die less than a month after payments start. (The 15-year guaranteed period is not available under all contracts.) |
TIAA Real Estate AccountProspectus|69
|
|
|
| • | Annuity for a Fixed Period: Pays income for any period you choose from 5 to 30 years (2 to 30 years for RAs, |
|
|
|
| • | Two-Life Annuities: Pays income to you as long as you live, then continues at either the same or a reduced level for the life of your annuity partner. There are three types of two-life annuity options, all available with or without a guaranteed period — Full Benefit to Survivor, Two-Thirds Benefit to Survivor, and a Half-Benefit to Annuity Partner. Under the Two-Thirds Benefit to Survivor option, payments to you will be reduced upon the death of your annuity partner. |
|
|
|
| • | Minimum Distribution Option (MDO) Annuity: Generally available only if you must begin annuity payments under the Internal Revenue Code minimum distribution requirements. (Some employer plans allow you to elect this option earlier — contact TIAA for more information.) The option pays an amount designed to fulfill the distribution requirements under federal tax law. (The option is not available under all contracts.) |
You must apply your entire accumulation under a contract if you want to use the MDO annuity. It is possible that income under the MDO annuity will cease during your lifetime. Prior to age 90, and subject to applicable plan and legal restrictions, you can apply any remaining part of an accumulation applied to the MDO annuity to any other income option for which you’re eligible. Using an MDO won’t affect your right to take a cash withdrawal of any accumulation not yet
TIAA Real Estate Account Prospectus | 61
distributed. This pay-out annuity is not available under the Retirement SelectChoice or Retirement SelectChoice Plus contracts. Instead, required minimum distributions will be paid directly from these contracts pursuant to the terms of your employer’s plan.
For any of the income options described above, current federal tax law says that your guaranteed period can’t exceed the joint life expectancy of you and your beneficiary or annuity partner. Other income options may become available in the future, subject to the terms of your retirement plan and relevant federal and state laws. For more information about any annuity option, please contact us.
Receiving Lump Sum Payments (Retirement Transition Benefit):If your employer’s plan allows, you may be able to receive a single sum payment of up to 10 percent of the value of any part of an accumulation being converted to annuity income on the annuity starting date. (This does not apply to IRAs.) Of course, if your employer’s plan allows cash withdrawals, you can take a larger amount (up to 100 percent) of your Real Estate Account accumulation as a cash payment. The retirement transition benefit will be subject to current federal income tax requirements and possible early distribution penalties. See “Taxes,”“Taxes” on page 65.74.
If you haven’t picked an income option when the annuity starting date arrives for your contract, TIAA usually will assume you want theone-life annuity with 10-year guaranteed periodif you’re unmarried, subject to the terms of your plan, paid from TIAA’s traditional annuity. If you’re married, we may assume for youa survivor annuity with half-benefit to annuity partner with a 10-Year guaranteed period,, with your
70|ProspectusTIAA Real Estate Account
spouse as your annuity partner, paid from TIAA’s traditional annuity. If you haven’t picked an income option when the annuity starting date arrives for your IRA, we may assume you want the minimum distribution option annuity.
TRANSFERS DURING THE ANNUITY PERIOD
After you begin receiving annuity income, you can transfer all or part of the future annuity income payable once each calendar quarter (i) from the Real Estate Account into a “comparable annuity” payable from a CREF or TIAA account or TIAA’s traditional annuity, or (ii) from a CREF account into a comparable annuity payable from the Real Estate Account. Comparable annuities are those which are payable under the same income option, and have the same first and second annuitant, and remaining guaranteed period.
We’ll process your transfer on the business day we receive your request. You can also choose to have a transfer take effect at the close of any future business day. Transfers under the annual income payment method will affect your annuity payments beginning on the May 1 following the March 31 which is on or after the effective date of the transfer. Transfers under the monthly income payment method and all transfers into TIAA’s traditional annuity will affect your annuity payments beginning with the first payment due after the monthly payment valuation day that is on or after the transfer date. You can switch between the annual and monthly income change methods, and the switch will go into effect on the following March 31.
62 | Prospectus TIAA Real Estate Account
ANNUITY PAYMENTS
The amount of annuity payments we pay you or your beneficiary (annuitant) will depend upon the number and value of the annuity units payable. The number of annuity units is first determined on the day before the annuity starting date. The amount of the annuity payments will change according to the income change method chosen.
Under the annual income change method, the value of an annuity unit for payments is redetermined on March 31 of each year — the payment valuation day. Annuity payments change beginning May 1. The change reflects the net investment experience of the Real Estate Account. The net investment experience for the twelve months following each March 31 revaluation will be reflected in the following year’s value.
Under the monthly income change method, the value of an annuity unit for payments is determined on the payment valuation day, which is the 20th day of the month preceding the payment due date or, if the 20th is not a business day, the preceding business day. The monthly changes in the value of an annuity unit reflect the net investment experience of the Real Estate Account. The formulas for calculating the number and value of annuity units payable are described below.
Calculating the Number of Annuity Units Payable:When a participant or a beneficiary converts the value of all or a portion of his or her accumulation into an income-paying contract, the number of annuity units payable from the Real Estate
TIAA Real Estate AccountProspectus|71
Account under an income change method is determined by dividing the value of the Account accumulation to be applied to provide the annuity payments by the product of the annuity unit value for that income change method and an annuity factor. The annuity factor as of the annuity starting date is the value of an annuity in the amount of $1.00 per month beginning on the first day such annuity units are payable, and continuing for as long as such annuity units are payable.
The annuity factor will reflect interest assumed at the effective annual rate of 4 percent, and the mortality assumptions for the person(s) on whose life (lives) the annuity payments will be based. Mortality assumptions will be based on the then-current settlement mortality schedules for this Account. Annuitants bear no mortality risk under their contracts — actual mortality experience will not reduce annuity payments after they have started. TIAA may change the mortality assumptions used to determine the number of annuity units payable for any future accumulations converted to provide annuity payments.
The number of annuity units payable under an income change method under your contract will be reduced by the number of annuity units you transfer out of that income change method under your contract. The number of annuity units payable will be increased by any internal transfers you make to that income change method under your contract.
Value of Annuity Units:The Real Estate Account’s annuity unit value is calculated separately for each income change method for each business day and for the last calendar day of each month. The annuity unit value for each income
TIAA Real Estate Account Prospectus | 63
change method is determined by updating the annuity unit value from the previous valuation day to reflect the net investment performance of the Account for the current valuation period relative to the 4 percent assumed investment return. In general, your payments will increase if the performance of the Account is greater than 4 percent and decrease if the value is less than 4 percent. The value is further adjusted to take into account any changes expected to occur in the future at revaluation either once a year or once a month, assuming the Account will earn the 4 percent assumed investment return in the future.
The initial value of the annuity unit for a new annuitant is the value determined as of the day before annuity payments start.
For participants under the annual income change method, the value of the annuity unit for payment remains level until the following May 1. For those who have already begun receiving annuity income as of March 31, the value of the annuity unit for payments due on and after the next succeeding May 1 is equal to the annuity unit value determined as of such March 31.
For participants under the monthly income change method, the value of the annuity unit for payments changes on the payment valuation day of each month for the payment due on the first of the following month.
TIAA reserves the right, subject to approval by the Board of Trustees, to modify the manner in which the number and/or value of annuity units is calculated in the future.
72|ProspectusTIAA Real Estate Account
AVAILABILITY; CHOOSING BENEFICIARIES
TIAA may pay death benefits if you or your annuity partner dies, which may be subject to the terms of your employer’s plan. When you purchase your annuity contract, you name one or more beneficiaries to receive the death benefit if you die. You can change your beneficiaries anytime before you die, and, unless you instruct otherwise, your annuity partner can do the same after your death.
YOUR SPOUSE’S RIGHTS
Your choice of beneficiary for death benefits may, in some cases, be subject to the consent of your spouse. Similarly, if you are married at the time of your death, federal law may require a portion of the death benefit be paid to your spouse even if you have named someone else as beneficiary. If you die without having named any beneficiary, any portion of your death benefit not payable to your spouse will go to your estate.
AMOUNT OF DEATH BENEFIT
If you die during the accumulation period, the death benefit is the amount of your accumulation. If you and your annuity partner die during the annuity period while payments are still due under a fixed-period annuity or for the remainder of a guaranteed period, the death benefit is the value of the remaining guaranteed payments.
64 | Prospectus TIAA Real Estate Account
PAYMENT OF DEATH BENEFIT
To authorize payment and pay a death benefit, we must have received all necessary forms and documentation, including proof of death and the selection of the method of payment.
METHODS OF PAYMENT OF DEATH BENEFITS
Generally, you can choose for your beneficiary the method we’ll use to pay the death benefit, but few participants do this. If you choose a payment method, you can also block your beneficiaries from changing it. Most people leave the choice to their beneficiaries. We can block any choice if its initial payment is less than $25. If death occurs while your contract is in the accumulation stage, in most cases we can pay the death benefit using the TIAA-CREF Savings & Investment Plan. We won’t do this if you preselected another option or if the beneficiary elects another option. Some beneficiaries aren’t eligible for the TIAA-CREF Savings & Investment Plan. If your beneficiary isn’t eligible and doesn’t specifically tell us to start paying death benefits within a year of your death, we can start making payments to them over five years using the fixed-period annuity method of payment.
Payments During the Accumulation Period:Currently, the available methods of payment for death benefits from funds in the accumulation period are:
TIAA Real Estate AccountProspectus|73
|
|
|
| • | Single-Sum Payment,in which the entire death benefit is paid to your beneficiary at once; |
|
|
|
| • | One-Life Annuity with or without Guaranteed Period,in which the death benefit is paid monthly for the life of the beneficiary or through the guaranteed period; |
|
|
|
| • | Annuity for a Fixed Period of 5 to 30 years (not available under Retirement |
|
|
|
| • | Accumulation-Unit Deposit Option,which pays a lump sum at the end of a fixed period, ordinarily two to five years, during which period the accumulation units deposited participate in the Account’s investment experience (generally the death benefit value must be at least $5,000); (This option is not available under all contracts) and |
|
|
|
| • | Minimum Distribution Option,which automatically pays income according to the Internal Revenue Code’s minimum distribution requirements ( |
Death benefits are usually paid monthly (unless you chose a single-sum method of payment), but your beneficiary can switch them to quarterly, semi-annual, or annual payments.
Payments During the Annuity Period:If you and your annuity partner die during the annuity period, your beneficiary can choose to receive any remaining guaranteed periodic payments due under your contract. Alternatively, your
TIAA Real Estate Account Prospectus | 65
beneficiary can choose to receive the commuted value of those payments in a single sum unless you have indicated otherwise. The amount of the commuted value will be different than the total of the periodic payments that would otherwise be paid.
Ordinarily, death benefits are subject to federal estate tax. Generally, if taken as a lump sum, death benefits would be taxed like complete withdrawals. If taken as annuity benefits, death benefits would be taxed like annuity payments. For more information on death benefits, see the discussion under “Taxes” below, or for further detail, contact TIAA.
This section offers general information concerning federal taxes. It doesn’t cover every situation. Tax treatment varies depending on the circumstances, and state and local taxes may also be involved. For complete information on your personal tax situation, check with a qualified tax advisor.
74|ProspectusTIAA Real Estate Account
HOW THE REAL ESTATE ACCOUNT IS TREATED FOR TAX PURPOSES
The Account is not a separate taxpayer for purposes of the Internal Revenue Code — its earnings are taxed as part of TIAA’s operations. Although TIAA is not expected to owe any federal income taxes on the Account’s earnings, if TIAA does incur taxes attributable to the Account, it may make a corresponding charge against the Account.
TAXES IN GENERAL
During the accumulation period, Real Estate Account premiums paid in before-tax dollars, employer contributions and earnings attributable to these amounts are not taxed until they’re withdrawn. Annuity payments, single-sum withdrawals, systematic withdrawals, and death benefits are usually taxed as ordinary income. Premiums paid in after-tax dollars aren’t taxable when withdrawn, but earnings attributable to these amounts are taxable unless those amounts are contributed as Roth contributions to a 401(a) or 403(b) plan and certain criteria are met before the amounts (and the income on the amounts) are withdrawn. Death benefits are usually also subject to federal estate and state estate or inheritance taxation. Generally, transfers between qualified retirement plans are not taxed. Generally, contributions you can make under an employer’s plan are limited by federal tax law. Employee voluntary salary reduction contributions and Roth after-tax contributions to 403(b) and 401(k) plans are limited in the aggregate to $15,000$15,500 per year ($20,00020,500 per year if you are age 50 or older). Certain long-term employees may be able to defer up to $18,000$18,500 per year in a 403(b) plan ($23,00023,500 per year if you are age 50 or older). Contributions to Classic and Roth IRAs, other than rollover contributions, cannot generally exceed $4,000 per year ($5,000 per year for taxpayers age 50 or older).
The maximum contribution limit to a 457(b) non-qualified deferred compensation plan for employees of state and local governments is $15,000$15,500 ($20,00020,500 if you are age
66 |Prospectus TIAA Real Estate Account
50 or older). Special catch-up rules may permit a higher contribution in one or more of the last three years prior to an individual’s normal retirement age under the plan.
Note that the dollar limits listed above are for 2006;2007; different dollar limits may apply in future years.
EARLY DISTRIBUTIONS
If you want to withdraw funds or begin receiving income from any 401(a), 403(a), or 403(b) retirement plan or an IRA before you reach age 591/259½, you may have to pay a 10 percent early distribution tax on the taxable amount. Distributions from a Roth IRA generally are not taxed, except that, once aggregate distributions exceed contributions to the Roth IRA, income tax and a 10% penalty tax may apply to distributions made (1) before age 591/2(subject59½ (subject to certain exceptions) or (2) during the five taxable years starting with the year in which the first contribution is made to any Roth IRA. A 10 percent penalty tax may apply to amounts attributable to a conversion from an IRA if they are
TIAA Real Estate AccountProspectus|75
distributed during the five taxable years beginning with the year in which the conversion was made. You won’t have to pay this tax in certain circumstances. Early distributions from 457(b) plans are not subject to a 10% penalty tax unless, in the case of a governmental 457(b) plan, the distribution includes amounts rolled over to the plan from an IRA, 401(a)/403(a), or 403(b) plan. Consult your tax advisor for more information.
MINIMUM DISTRIBUTION REQUIREMENTS
In most cases, payments from qualified contracts must begin by April 1 of the year after the year you reach age 701/270½, or if later, by retirement. For Classic IRAs, and with respect to 5 percent or more owners of the business covered by a Keogh plan, payments must begin by April 1 of the year after you reach age 701/270½. Under the terms of certain retirement plans, the plan administrator may direct us to make the minimum distributions required by law even if you do not elect to receive them. In addition, if you don’t begin distributions on time, you may be subject to a 50 percent excise tax on the amount you should have received but did not. Roth IRAs are generally not subject to these rules requiring minimum distributions during your lifetime. You are responsible for requesting distributions that comply with the minimum distribution rules.
WITHHOLDING ON DISTRIBUTIONS
If we pay an “eligible rollover” distribution directly to you, federal law requires us to withhold 20 percent from the taxable portion. On the other hand, if we roll over such a distribution directly to an IRA or employer plan, we do not withhold any federal income tax. The 20 percent withholding also does not apply to certain types of distributions that are not considered eligible rollovers such as payments from IRAs, hardship withdrawals, lifetime annuity payments, substantially equal periodic payments over your life expectancy or over 10 or more years, or minimum distribution payments.
TIAA Real Estate Account Prospectus | 67
For the taxable portion of non-eligible rollover distributions, we will usually withhold federal income taxes unless you tell us not to and you are eligible to avoid withholding. However, if you tell us not to withhold but we don’t have your taxpayer identification number on file, we still are required to deduct taxes. These rules also apply to distributions from governmental 457(b) plans. In general, all amounts received under a private 457(b) plan are taxable and are subject to federal income tax withholding as wages. Nonresident aliens who pay U.S. taxes are subject to different withholding rules.
SPECIAL RULES FOR AFTER-TAX RETIREMENT ANNUITIES
If you paid premiums directly to an RA and the premiums are not subject to your employer’s retirement plan, or if you have been issued an ATRA contract, the following general discussion describes our understanding of current federal income tax law that applies to these accumulations. This discussion does not apply to premiums paid on your
76|ProspectusTIAA Real Estate Account
behalf under the terms of your employer’s retirement plan. It also does not cover every situation and does not address all possible circumstances.
In General.These annuities are generally not taxed until distributions occur. When distributions occur, they are taxed as follows:
|
|
|
| • | Withdrawals, including withdrawals of the entire accumulation under the contract, are generally taxed as ordinary income to the extent that the contract’s value is more than your investment in the contract (i.e., |
|
|
|
| • | Annuity payments are generally treated in part as taxable ordinary income and in part as non-taxable recovery of your investment in the contract until you recover all of your investment in the contract. After that, annuity payments are taxable in full as ordinary income. |
Required Distributions.In general, if you die after you start your annuity payments but before the entire interest in the annuity contract has been distributed, the remaining portion must be distributed at least as quickly as under the method in effect on the date of your death. If you die before your annuity payments begin, the entire interest in your annuity contract generally must be distributed within five years after your death, or be used to provide payments that begin within one year of your death and that will be made for the life of your designated beneficiary or for a period not extending beyond the life expectancy of your designated beneficiary. The “designated beneficiary” refers to a natural person you designate and to whom ownership of the contract passes because of your death. However, if the designated beneficiary is your surviving spouse, your surviving spouse can continue the annuity contract as the new owner.
Death Benefit Proceeds.Death benefit proceeds are taxed like withdrawals of the entire accumulation in the contract if distributed in a single sum and are taxed like annuity payments if distributed as annuity payments. Your beneficiary may be required to take death benefit proceeds within a certain time period.
68 |Prospectus TIAA Real Estate Account
Penalty Tax on Certain Distributions.You may have to pay a penalty tax (10 percent of the amount treated as taxable income) on distributions you take prior to age 59½591/2. There are some exceptions to this rule, however. You should consult a tax advisor for information about those exceptions.
Withholding.Annuity distributions are generally subject to federal income tax withholding but most recipients can usually choose not to have the tax withheld.
Certain Designations or Exchanges.Designating an annuitant, payee or other beneficiary, or exchanging a contract may have tax consequences that should be discussed with a tax advisor before you engage in any of these transactions.
Multiple Contracts.All non-qualified deferred annuity contracts issued by us and certain of our affiliates to the same owner during a calendar year must generally be treated as a single contract in determining when and how much income is taxable and how much income is subject to the 10 percent penalty tax (see above).
TIAA Real Estate AccountProspectus|77
Diversification Requirements.The investments of the Real Estate Account must be “adequately diversified” in order for the ATRA Contracts to be treated as annuity contracts for Federal income tax purposes. It is intended that Real Estate Account will satisfy these diversification requirements.
Owner Control.In certain circumstances, owners of non-qualified variable annuity contracts have been considered for Federal income tax purposes to be the owners of the assets of the separate account supporting their contracts due to their ability to exercise investment control over those assets. When this is the case, the contract owners have been currently taxed on income and gains attributable to the variable account assets. While we believe that the ATRA Contracts do not give you investment control over assets in the Real Estate Account or any other separate account underlying your ATRA Contract, we reserve the right to modify the ATRA Contracts as necessary to prevent you from being treated as an owner of the assets in the Real Estate Account.
FEDERAL ESTATE TAXES
While no attempt is being made to discuss the Federal estate tax implications of the Contract, you should keep in mind that the value of an annuity contract owned by a decedent and payable to a beneficiary by virtue of surviving the decedent is included in the decedent’s gross estate. Depending on the terms of the annuity contract, the value of the annuity included in the gross estate may be the value of the lump sum payment payable to the designated beneficiary or the actuarial value of the payments to be received by the beneficiary. Consult an estate planning advisor for more information.
GENERATION-SKIPPING TRANSFER TAX
Under certain circumstances, the Code may impose a “generation skipping transfer tax” when all or part of an annuity contract is transferred to, or a death benefit is paid to, an individual two or more generations younger than the Owner. Regulations issued under the Code may require us to deduct the tax from your Contract, or from any applicable payment, and pay it directly to the IRS.
TIAA Real Estate Account Prospectus | 69
ANNUITY PURCHASES BY RESIDENTS OF PUERTO RICO
The Internal Revenue ServiceIRS has announced that income received by residents of Puerto Rico under annuity contracts issued by a Puerto Rico branch of a United States life insurance company is U.S.-source income that is generally subject to United States Federal income tax.
ANNUITY PURCHASES BY NONRESIDENT ALIENS
The discussion above provides general information regarding U.S. federal income tax consequences to annuity purchasers that are U.S. citizens or residents. Purchasers that are not U.S. citizens or residents will generally be subject to U.S. federal withholding tax on taxable distributions from annuity contracts at a 30% rate, unless a lower treaty rate applies. In addition, purchasers may be subject to state and/or municipal taxes and taxes that may be imposed by the purchaser’s
78|ProspectusTIAA Real Estate Account
country of citizenship or residence. Prospective purchasers who are nonresident aliens are advised to consult with a qualified tax adviser regarding U.S. state, and foreign taxation with respect to an annuity contract purchase.
SPECIAL RULES FOR WITHDRAWALS TO PAY ADVISORY FEES
If you have arranged for us to pay advisory fees to your financial advisor from your accumulations, those partial withdrawals generally will not be treated as taxable distributions as long as:
|
|
|
| • | the payment is for expenses that are ordinary and necessary; |
|
|
|
| • | the payment is made from a Section 401 or 403 retirement plan or an IRA; |
• | your financial advisor’s payment is only made from the accumulations in your retirement plan or IRA, as applicable, and not directly by you or anyone else, under the agreement with your financial advisor; and | |
|
|
|
| • | once advisory fees begin to be paid from your retirement plan or IRA, as applicable, you continue to pay those fees solely from your plan or IRA, as applicable, and not from any other source. |
However, withdrawals to pay advisory fees to your financial advisor from your accumulations under an ATRA Contractcontract will be treated as taxable distributions.
FOREIGN TAX CREDIT
Foreign Tax Credit.The Account may be subject to foreign taxes on investments in other countries, including capital gains tax on any appreciation in value when a real estate investment in a foreign jurisdiction is eventually sold. Any potential tax impact will not be reflected in the valuation of the foreign investment and may not be fully reflected in a tax accrual by the Account. Upon payment of any foreign tax by the Account, TIAA will receive a foreign tax credit, which may be available to reduce its U.S. tax burden. The Account is a segregated asset account of TIAA and incurs no material federal income tax attributable to the investment performance of the Account under the Internal Revenue Code. As a result, the Account will not realize any tax benefit from any foreign tax credit that may be
70 |Prospectus TIAA Real Estate Account
available to TIAA; however, to the extent that TIAA can utilize the foreign tax credit in its consolidated tax return, TIAA will reimburse the Account for that benefit at that time. The extent to which TIAA is able to utilize the credits when the Account incurs a foreign tax will determine the amount and timing of reimbursement from TIAA to the Account for the resulting foreign tax credit. The Account’s unit values may be adversely impacted in the future if a foreign tax is paid, and TIAA is not able to utilize (and therefore does not reimburse the Account for), either immediately or in the future, the foreign tax credit earned as a result of the foreign tax paid by the Account.
POSSIBLE TAX LAW CHANGES
Although the likelihood of legislative changes is uncertain, there is always the possibility that the tax treatment of your contract could change by legislation or
TIAA Real Estate AccountProspectus|79
otherwise. Consult a tax advisor with respect to legislative developments and their effect on your contract.
We have the right to modify the contract in response to legislative changes that could otherwise diminish the favorable tax treatment that annuity contract owners currently receive. We make no guarantee regarding the tax status of any contract and do not intend the above discussion as tax advice.
MAKING CHOICES AND CHANGES
You may have to make certain choices or changes (e.g., changing your income option, making a cash withdrawal) by written notice satisfactory to us and received at our home office or at some other location that we have specifically designated for that purpose. When we receive a notice of a change in beneficiary or other person named to receive payments, we’ll execute the change as of the date it was signed, even if the signer has died in the meantime. We execute all other changes as of the date received.
TELEPHONE AND INTERNET TRANSACTIONS
You can use our Automated Telephone Service (ATS) or the TIAA-CREF Web Center’s account access feature to check your account balances, transfer to TIAA’s traditional annuity, TIAA Access variable annuity accounts or CREF, and/or allocate future premiums among the accounts and funds available to you through TIAA-CREF. You will be asked to enter your Personal Identification Number (PIN) and social security number for both systems. (You can establish a PIN by calling us.) Both will lead you through the transaction process and will use reasonable procedures to confirm that instructions given are genuine. If we use such procedures, we are not responsible for incorrect or fraudulent transactions. All transactions made over the ATS and Internet are electronically recorded.
To use the ATS, you need a touch-tone phone. The toll free number for the ATS is 800 842-2252. To use the Internet, go to the account access feature of the
TIAA Real Estate Account Prospectus | 71
TIAA-CREF Web Center at http://www.tiaa-cref.org. We can suspend or terminate your ability to transact by telephone, over the Internet, or by fax at any time, for any reason.
VOTING RIGHTS
You don’t have the right to vote on the management and operation of the Account directly; however, you may send ballots to advise the TIAA Board of Overseers about voting for nominees for the TIAA Board of Trustees.
ELECTRONIC PROSPECTUS
If you received this prospectus electronically and would like a paper copy, please call 877 518-9161 and we will send it to you. Under certain circumstances
80|ProspectusTIAA Real Estate Account
where we are legally required to deliver a prospectus to you, we cannot send you a prospectus electronically unless you’ve consented.
HOUSEHOLDING
To lower costs and eliminate duplicate documents sent to your home, we may begin mailing only one copy of the Account’s prospectus, prospectus supplements or any other required documents to your household, even if more than one participant lives there. If you would prefer to continue receiving your own copy of any of these documents, you may call us toll-free at 877 518-9161, or write us.
MISCELLANEOUS POLICIES
Amending the Contracts:The contract may be amended by agreement of TIAA and the contractholder without the consent of any other person, provided that such change does not reduce any benefit purchased under the contract up to that time. Any endorsement or amendment of this contract, waiver of any of its provisions, or change in rate schedule will be valid only if in writing and signed by an executive officer of TIAA.
If You’re Married:If you’re married, you may be required by law or your employer’s plan to get advance written consent from your spouse before we make certain transactions for you. If you’re married at your annuity starting date, you may also be required by law or your employer’s plan to choose an income option that provides survivor annuity income to your spouse, unless he or she waives that right in writing. There are limited exceptions to the waiver requirement.
Texas Optional Retirement Program Restrictions:If you’re in the Texas Optional Retirement Program, you or your beneficiary can redeem some or all of your accumulation only if you retire, die, or leave your job in the state’s public institutions of higher education.
Assigning Your Contract:Generally, neither you nor your beneficiaries can assign your ownership of a TIAA retirement contract to anyone else.
Overpayment of Premiums:If your employer mistakenly sends more premiums on your behalf than you’re entitled to under your employer’s retirement plan or the Internal Revenue Code, we’ll refund them to your employer as long as
72 | Prospectus TIAA Real Estate Account
we’re requested to do so (in writing) before you start receiving annuity income. Any time there’s a question about premium refunds, TIAA will rely on information from your employer. If you’ve withdrawn or transferred the amounts involved from your accumulation, we won’t refund them.
Errors or Omissions:We reserve the right to correct any errors or omissions on any form, report, or statement that we send you.
Payment to an Estate, Guardian, Trustee, etc.:We reserve the right to pay in one sum the commuted value of any benefits due an estate, corporation, partnership, trustee, or other entity not a natural person. Neither TIAA nor the Account will be responsible for the conduct of any executor, trustee, guardian, or other third party to whom payment is made.
TIAA Real Estate AccountProspectus|81
Benefits Based on Incorrect Information:If the amounts of benefits provided under a contract were based on information that is incorrect, benefits will be recalculated on the basis of the correct data. If the Account has overpaid or underpaid, appropriate adjustments will be made.
Proof of Survival:We reserve the right to require satisfactory proof that anyone named to receive benefits under a contract is living on the date payment is due. If we have not received this proof after we request it in writing, the Account will have the right to make reduced payments or to withhold payments entirely until such proof is received.
The annuity contracts are offered continuously by TIAA-CREF Individual & Institutional Services, LLC (Services), which is registered with the SEC as a broker-dealer and a registered investment adviser and is a member of the National Association of Securities Dealers, Inc. (NASD). Teachers Personal Investors Services, Inc. (TPIS), which is also registered with the SEC and is a member of the NASD, may participate in the distribution of the contracts on a limited basis. Services and TPIS are direct or indirect wholly owned subsidiaries of TIAA. Their addresses are at 730 Third Avenue, New York, NY 10017-3206. No commissions are paid for distributing the contracts.
TIAA, the Real Estate Account, and the contracts are subject to regulation by the New York Insurance Department (NYID) as well as by the insurance regulatory authorities of certain other states and jurisdictions.
TIAA and the Real Estate Account must file with the NYID both quarterly and annual statements. The Account’s books and assets are subject to review and examination by the NYID at all times, and a full examination into the affairs of the Account is made at least every five years. In addition, a full examination of the Real Estate Account operations is usually conducted periodically by some other states.
TIAA Real Estate Account Prospectus | 73
All matters involving state law and relating to the contracts, including TIAA’s right to issue the contracts, have been passed upon by George W. Madison, Executive Vice President and General Counsel of TIAA. Sutherland Asbill & Brennan LLP, Washington, D.C., have passed upon legal matters relating to the federal securities laws.
82|ProspectusTIAA Real Estate Account
The financial statements as of December 31, 2006 and December 31, 2005 and for each of the two years in the period ended December 31, 2006 included in this Prospectus have been so included in reliance on the report of PricewaterhouseCoopers LLP (PwC)(“PWC”), an independent registered public accounting firm, forgiven on the Account, has audited the Account’s financial statements at December 31, 2005,authority of said firm as experts in auditing and for the year ended December 31, 2005, as set forth in their report.accounting.
Ernst & Young LLP (“E&Y”), independent registered public accounting firm, has audited the Account’s financial statements at December 31, 2004, and for the year then ended, as set forth in their report.
With respect to TIAA, PWC has audited TIAA’s statutory-basis financial statements as of December 31, 2006 and December 31, 2005, and for each of the two years in the period ended December 31, 2004,2006, as set forth in their report.report, given on the authority of said firm as experts in auditing and accounting.
With respect to TIAA, PwC has audited TIAA’s statutory-basis financial statements at December 31, 2005, and for the year ended December 31, 2005, as set forth in their report.
Friedman LLP, independent auditors, haveregistered public accounting firm, has audited the statement of revenues and certain expenses of the following properties:
(i) | The North 40 Office Complex for the year ended December 31, 2005; | ||
(ii) | Publix at Weston Commons for the year ended December 31, 2005; | ||
(iii) | City Center for the year ended December 31, 2005; | ||
(iv) | WellPoint Office Campus for the year ended December 31, 2005; | ||
(v) | DLF Multi Family Portfolio for the year ended December 31, 2005; | ||
(vi) | The Creeksides at CenterPoint for the year ended December 31, 2005; | ||
(vii) | Park Place on Turtle Creek for the year ended December 31, 2005; | ||
(viii) | MarketFair for the year ended December 31, 2005; | ||
(ix) | South Frisco Village for the year ended December 31, 2005; | ||
(x) | IDI National Industrial Portfolio for the year ended December 31, 2005; | ||
(xi) | Millennium Corporate Park for the year ended December 31, 2005; | ||
(xii) | The following properties comprising the Florida Retail Portfolio, a joint venture with Weingarten Realty Investors (“WRI”), in which the Account owns an 80% equity interest in the Florida Retail JV and WRI owns the remaining 20% equity interest: | ||
(1) | East Lake Woodlands for the period August 5, 2005 to December 31, 2005; | ||
TIAA Real Estate AccountProspectus|83
(2) | Palm Lakes Plaza for the year ended December 31, 2005; | ||
(3) | The Marketplace at Dr. Phillips for the year ended December 31, 2005; | ||
(4) | International Drive Value Center for the period January 18, 2005 to December 31, 2005; | ||
(5) | Alfaya Square for the year ended December 31, 2005; | ||
(6) | Kendall Corners for the year ended December 31, 2005; | ||
(7) | South Dade Shopping Center for the year ended December 31, 2005; | ||
(xiii) | The Ellipse at Ballston for the year ended December 31, 2005; | ||
(xiv) | The properties comprising the Account’s joint venture with Developers Diversified Realty Corporation (“DDR”), in which the Account has an 85% equity intereast and DDR has a 15% equity interest, for the year ended December 31, 2005; | ||
(xv) | Printemps de l’Homme for the year ended December 31, 2005; | ||
(xvi) | 1900 South Burgundy for the year ended December 31, 2005; and | ||
(xvii) | Wilshire Rodeo Plaza for the nine months ended September 30, 2005. | ||
Berdon LLP, independent registered public accounting firm, has audited the statement of revenues and certain expenses of the following properties: (i) Windsor at Lenox Park501 Boylston Street (The Newbry) for the year ended December 31, 2004;2005 and (ii) Lincoln Centre9345 Santa Anita Avenue (Weber Distribution) for the year ended December 31, 2004; (iii) Urban Centre2005.
Aarons Grant & Habif, LLC, independent registered public accounting firm, has audited the statement of revenues and certain expenses for the Camelback Center property for the year ended December 31, 2004; (iv) U.S. Bank Plaza for2005.
After reasonable inquiry, the year ended December 31, 2004; (v) Inverness Center forAccount is not aware of any material factors relating to the year ended December 31, 2004; (vi) RREEF America Industrial Portfolio forspecific properties audited by any of Friedman LLP, Berdon LLP, or Aarons Grant & Habif, LLC, other than as specifically set forth elsewhere in this prospectus that would cause the year ended December 31, 2004; (vii) 99 High Street for the year ended December 31, 2004; (viii) 8270 Greensboro Drive for the year ended December 31, 2004; (ix) The Reserve at Sugarloaf for the year ended December 31, 2004; (x) Suncrest Village for the year ended December 31, 2004; (xi) Palomino Park Apartments for the year ended December 31, 2004; (xii) Embarcadero Center West for the year ended December 31, 2004; and (xiii) 1 and 7 Westferry Circus for the year ended December 31, 2004.reported financial information indicated in such financial statements not to be necessarily indicative of future operating results.
We have included these financial statements in the prospectus and elsewhere in the registration statement in reliance on the auditing firms’ respective reports, given on the authority of such firms as experts in accounting and auditing.
INFORMATION AVAILABLE AT THE SEC
The Account has filed with the SEC a registration statement under the Securities Act of 1933, which contains this prospectus and additional information related to the offering described in this prospectus. The Account also files annual, quarterly, and current reports, along with other information, with the SEC, as required by the Securities Exchange Act of 1934. You may read and copy the full registration statement, and any reports and information filed with the SEC for the
74 84|ProspectusTIAA Real Estate Account
Account, at the SEC’s public reference room at 100 F Street, N.E., Washington, DC 20549. This information can also be obtained through the SEC’s website on the Internet (http://www.sec.gov).
OTHER REPORTS TO PARTICIPANTS
TIAA will mail to each participant in the Real Estate Account periodic reports providing information relating to their accumulations in the Account, including premiums paid, number and value of accumulations, and withdrawals or transfers during the period, as well as such other information as may be required by applicable law or regulations.
Further information may be obtained from TIAA at 730 Third Avenue, New York, NYNew York 10017-3206.
CUSTOMER COMPLAINTS
Customer complaints may be directed to our Participant Relations Unit, P.O. Box 1259, Charlotte, NCNorth Carolina 28201-1259, telephone 800 842-2776.
The financial statements of the TIAA Real Estate Account, financial statements of certain properties purchased by the Account and condensed unaudited statutory-basis financial statements of TIAA follow. The full audited statutory-basis financial statements of TIAA, which are incorporated into this prospectus by reference, are available upon request by calling 877 518-9161.
The financial statements of TIAA should be distinguished from the financial statements of the Account and should be considered only as bearing on the ability of TIAA to meet its obligations under the contracts. They should not be considered as bearing upon the assets held in the Account.
TIAA Real Estate AccountProspectus|| 7585
TIAA REAL ESTATE ACCOUNT
Audited Financial Statements:
|
| |
Audited Financial Statements: | ||
TIAA Real Estate Account | ||
| ||
|
| |
|
| |
| ||
| ||
| ||
| ||
| ||
|
| |
| ||
|
| |
Proforma Condensed Financial Statements: | ||
| ||
| ||
| ||
|
| |
Property Financial Statements: | ||
| ||
|
| |
|
| |
|
| |
Developers Diversified Realty Corporation Joint Venture Portfolio | ||
|
| |
| ||
|
| |
|
| |
|
| |
| ||
|
| |
|
| |
|
| |
| ||
|
| |
|
| |
|
| |
| ||
|
| |
|
| |
|
| |
| ||
|
| |
|
| |
| ||
|
| |
|
| |
|
| |
| ||
|
| |
|
| |
|
| |
| ||
|
| |
|
| |
|
| |
| ||
|
| |
|
| |
|
| |
| ||
|
| |
|
| |
|
| |
| ||
|
| |
|
| |
|
| |
| ||
|
| |
|
| |
|
| |
| ||
|
| |
| Basis of Presentation | ||
76 86|ProspectusTIAA Real Estate Account
Report of management responsibility
To the Participants of the TIAA Real Estate Account:
The accompanying financial statements of the TIAA Real Estate Account (“Account”) of Teachers Insurance and Annuity Association of America (“TIAA”) are the responsibility of TIAA’s management. They have been prepared in accordance with U.S.accounting principles generally accepted accounting principlesin the United States of America and have been presented fairly and objectively in accordance with such principles.
TIAA has established and maintains a sound system of internal controls and disclosure controls designed to provide reasonable assurance that assets are properly safeguarded and transactions are properly executed in accordance with management’s authorization, and to carry out the ongoing responsibilities of management for reliable financial statements. In addition, TIAA’s internal audit personnel provide a continuing review of the internal controls and operations of the Account, and the chief audit executive regularly reports to the TIAA Audit Committee.
The accompanying financial statements have been audited by an independent registered public accounting firm. To maintain auditor independence and avoid any conflict of interest, it continues to be the Account’s policy that any management advisory or consulting services be obtained from a firm other than the independent registered public accounting firm. The reportreports of the independent registered public accounting firm,firms, which followsfollow the statements of investments, expresses anexpress independent opinionopinions on the fairness of presentation of these financial statements.
The Audit Committee of the TIAA Board of Trustees, consisting entirely of trustees who are not officers of TIAA, meets regularly with management, representatives of PricewaterhouseCoopers LLP and the internal audit group to review matters relating to financial reporting, internal controls and auditing. In addition to the annual audit of the Account’s financial statements by the independent registered public accounting firm, the New York State Insurance Department and other state insurance departments perform periodic examinations of the Account’s operations.
March 14, 200615, 2007
|
|
|
|
|
|
Herbert M. Allison, Jr. |
|
Chairman, President and | Executive Vice President and |
Chief Executive Officer |
|


TIAA Real Estate AccountProspectus|| 7787
To the Participants of the TIAA Real Estate Account:
The TIAA Audit Committee (“Committee”) oversees the financial reporting process of the TIAA Real Estate Account (“Account”) on behalf of TIAA’s Board of Trustees. The Committee operates in accordance with a formal written charter (copies of which are available upon request) which describes the Audit Committee’s responsibilities. All members of the Committee are independent, as defined under the listing standards of the New York Stock Exchange.
Management has the primary responsibility for the Account’s financial statements, development and maintenance of a strong system of internal controls and disclosure controls, and compliance with applicable laws and regulations. In fulfilling its oversight responsibilities, the Committee reviewed and approved the audit plans of the internal audit group and the independent registered public accounting firm in connection with their respective audits of the Account. The Committee also meets regularly with the internal audit group and the independent registered public accounting firm, both with and without management present, to discuss the results of their examinations, their evaluation of internal controls, and the overall quality of financial reporting. As required by its charter, the Committee will evaluate rotation of the independent registered public accounting firm whenever circumstances warrant, but in no event will the evaluation be later than between their fifth and tenth years of service.
The Committee reviewed and discussed the accompanying audited financial statements with management, including a discussion of the quality and appropriateness of the accounting principles and financial reporting practices followed, the reasonableness of significant judgments, and the clarity and completeness of disclosures in the financial statements. The Committee has also discussed the audited financial statements with PricewaterhouseCoopers LLP, the independent registered public accounting firm responsible for expressing an opinion on the conformity of these audited financial statements with U.S.accounting principles generally accepted accounting principles.in the United States of America.
The discussion with PricewaterhouseCoopers LLP focused on their judgments concerning the quality and appropriateness of the accounting principles and financial reporting practices followed by the Account, the clarity and completeness of the financial statements and related disclosures, and other significant matters, such as any significant changes in accounting policies, internal controls, management judgments and estimates, and the nature of any uncertainties or unusual transactions. In addition, the Committee discussed with PricewaterhouseCoopers LLP the auditors’ independence from management and the Account, and has received a written disclosure regarding such independence, as required by the Independence Standards Board.Securities and Exchange Commission.
78 88|ProspectusTIAA Real Estate Account
|
|
Report of the Audit committee | concluded |
Based on the review and discussions referred to above, the Committee has approved the release of the accompanying audited financial statements for publication and filing with appropriate regulatory authorities.
Rosalie J. Wolf, Audit Committee Chair
Donald K. Peterson, Audit Committee Member
Leonard S. Simon, Audit Committee MemberDavid F. Swensen, Audit Committee Member
Paul R. Tregurtha, Audit Committee Member
March 14, 200615, 2007
TIAA Real Estate AccountProspectus|| 7989
|
| |
Statements of assets and liabilities | ||
|
|
|
|
|
|
|
|
December 31, |
|
| 2005 |
|
| 2004 |
|
ASSETS |
|
|
|
|
|
|
|
Investments, at value: |
|
|
|
|
|
|
|
Real estate properties |
|
|
|
|
|
|
|
(cost: $7,386,769,868 and $5,315,565,355) |
| $ | 7,977,600,751 |
| $ | 5,391,469,250 |
|
Real estate joint ventures and limited partnerships |
|
|
|
|
|
|
|
(cost: $1,086,041,287 and $1,085,720,476) |
|
| 1,418,583,542 |
|
| 1,288,715,399 |
|
Marketable securities: |
|
|
|
|
|
|
|
Real estate related |
|
|
|
|
|
|
|
(cost: $433,482,015 and $326,109,979) |
|
| 448,662,598 |
|
| 369,744,168 |
|
Other |
|
|
|
|
|
|
|
(cost: $1,640,676,190 and $676,124,265) |
|
| 1,640,894,515 |
|
| 675,989,673 |
|
Total investments |
|
|
|
|
|
|
|
(cost: $10,546,969,360 and $7,403,520,075) |
|
| 11,485,741,406 |
|
| 7,725,918,490 |
|
Cash |
|
| 1,211,370 |
|
| — |
|
Due from investment advisor |
|
| 7,717,256 |
|
| 4,185,034 |
|
Other |
|
| 190,756,381 |
|
| 113,876,400 |
|
TOTAL ASSETS |
|
| 11,685,426,413 |
|
| 7,843,979,924 |
|
LIABILITIES |
|
|
|
|
|
|
|
Mortgage notes payable—Note 5 |
|
| 973,502,186 |
|
| 499,479,256 |
|
Amounts due to bank |
|
| — |
|
| 231,476 |
|
Payable for securities transactions |
|
| 993,809 |
|
| — |
|
Accrued real estate property level expenses |
|
| 145,789,277 |
|
| 84,959,882 |
|
Security deposits held |
|
| 16,430,039 |
|
| 13,759,324 |
|
TOTAL LIABILITIES |
|
| 1,136,715,311 |
|
| 598,429,938 |
|
NET ASSETS |
|
|
|
|
|
|
|
Accumulation Fund |
|
| 10,227,655,797 |
|
| 7,015,717,162 |
|
Annuity Fund |
|
| 321,055,305 |
|
| 229,832,824 |
|
TOTAL NET ASSETS |
| $ | 10,548,711,102 |
| $ | 7,245,549,986 |
|
NUMBER OF ACCUMULATION UNITS OUTSTANDING—Notes 6 and 7 |
|
| 42,623,491 |
|
| 33,337,597 |
|
NET ASSET VALUE, PER ACCUMULATION UNIT—Note 6 |
| $ | 239.95 |
| $ | 210.44 |
|
| |
|
|
| |
|
|
|
|
|
|
|
|
|
|
|
Years Ended December 31, |
|
| 2005 |
|
| 2004 |
|
| 2003 |
|
INVESTMENT INCOME |
|
|
|
|
|
|
|
|
|
|
Real estate income, net: |
|
|
|
|
|
|
|
|
|
|
Rental income |
| $ | 618,633,580 |
| $ | 397,198,276 |
| $ | 361,616,650 |
|
Real estate property level expenses and taxes: |
|
|
|
|
|
|
|
|
|
|
Operating expenses |
|
| 150,501,136 |
|
| 100,991,997 |
|
| 87,238,469 |
|
Real estate taxes |
|
| 88,014,264 |
|
| 55,946,418 |
|
| 49,440,101 |
|
Interest expense |
|
| 40,028,630 |
|
| 830,361 |
|
| — |
|
Total real estate property level expenses and taxes |
|
| 278,544,030 |
|
| 157,768,776 |
|
| 136,678,570 |
|
Real estate income—net |
|
| 340,089,550 |
|
| 239,429,500 |
|
| 224,938,080 |
|
Income from joint ventures |
|
| 63,580,501 |
|
| 57,275,242 |
|
| 31,989,569 |
|
Dividends |
|
| 25,130,706 |
|
| 26,568,264 |
|
| 12,240,166 |
|
Interest |
|
| 54,114,448 |
|
| 15,055,451 |
|
| 7,221,765 |
|
TOTAL INCOME |
|
| 482,915,205 |
|
| 338,328,457 |
|
| 276,389,580 |
|
EXPENSES—NOTE 2: |
|
|
|
|
|
|
|
|
|
|
Investment advisory charges |
|
| 19,603,225 |
|
| 14,393,388 |
|
| 12,751,191 |
|
Administrative and distribution charges |
|
| 27,130,406 |
|
| 16,372,446 |
|
| 14,786,580 |
|
Mortality and expense risk charges |
|
| 6,196,549 |
|
| 4,093,858 |
|
| 2,916,880 |
|
Liquidity guarantee charges |
|
| 3,170,017 |
|
| 1,868,733 |
|
| 1,199,414 |
|
TOTAL EXPENSES |
|
| 56,100,197 |
|
| 36,728,425 |
|
| 31,654,065 |
|
INVESTMENT INCOME—NET |
|
| 426,815,008 |
|
| 301,600,032 |
|
| 244,735,515 |
|
REALIZED AND UNREALIZED GAIN (LOSS) ON INVESTMENTS |
|
|
|
|
|
|
|
|
|
|
|
|
|
|
|
|
|
|
|
|
|
Net realized gain (loss) on: |
|
|
|
|
|
|
|
|
|
|
Real estate properties |
|
| 84,764,142 |
|
| 13,827,432 |
|
| 32,598,548 |
|
Marketable securities |
|
| 35,168,209 |
|
| 47,375,999 |
|
| 7,692,266 |
|
Total realized gain (loss) on investments |
|
| 119,932,351 |
|
| 61,203,431 |
|
| 40,290,814 |
|
Net change in unrealized appreciation (depreciation) on: |
|
|
|
|
|
|
|
|
|
|
Real estate properties |
|
| 505,415,483 |
|
| 170,703,978 |
|
| (37,639,368 | ) |
Real estate joint ventures and limited partnerships |
|
| 168,723,129 |
|
| 161,584,369 |
|
| 23,914,271 |
|
Marketable securities |
|
| (28,100,691 | ) |
| 21,088,525 |
|
| 32,271,654 |
|
Net change in unrealized appreciation (depreciation) on investments |
|
| 646,037,921 |
|
| 353,376,872 |
|
| 18,546,557 |
|
NET REALIZED AND UNREALIZED GAIN (LOSS) ON INVESTMENTS |
|
| 765,970,272 |
|
| 414,580,303 |
|
| 58,837,371 |
|
NET INCREASE IN NET ASSETS RESULTING FROM OPERATIONS |
| $ | 1,192,785,280 |
| $ | 716,180,335 |
| $ | 303,572,886 |
|
|
|
| |
|
|
|
|
|
|
|
|
|
|
|
Years Ended December 31, |
|
| 2005 |
|
| 2004 |
|
| 2003 |
|
FROM OPERATIONS |
|
|
|
|
|
|
|
|
|
|
Investment income, net |
| $ | 426,815,008 |
| $ | 301,600,032 |
| $ | 244,735,515 |
|
Net realized gain on investments |
|
| 119,932,351 |
|
| 61,203,431 |
|
| 40,290,814 |
|
Net change in unrealized appreciation (depreciation) on investments |
|
| 646,037,921 |
|
| 353,376,872 |
|
| 18,546,557 |
|
NET INCREASE IN NET ASSETS RESULTING FROM OPERATIONS |
|
| 1,192,785,280 |
|
| 716,180,335 |
|
| 303,572,886 |
|
FROM PARTICIPANT TRANSACTIONS |
|
|
|
|
|
|
|
|
|
|
Premiums |
|
| 968,189,436 |
|
| 738,048,183 |
|
| 515,435,665 |
|
Net transfers from (to) TIAA |
|
| 197,272,397 |
|
| 147,340,801 |
|
| 30,198,200 |
|
Net transfers from CREF Accounts |
|
| 1,238,160,587 |
|
| 1,041,124,402 |
|
| 403,594,402 |
|
Annuity and other periodic payments |
|
| (44,487,142 | ) |
| (30,761,316 | ) |
| (22,213,682 | ) |
Withdrawals and death benefits |
|
| (248,759,442 | ) |
| (159,804,580 | ) |
| (113,153,870 | ) |
NET INCREASE IN NET ASSETS RESULTING FROM PARTICIPANT TRANSACTIONS |
|
| 2,110,375,836 |
|
| 1,735,947,490 |
|
| 813,860,715 |
|
NET INCREASE IN NET ASSETS |
|
| 3,303,161,116 |
|
| 2,452,127,825 |
|
| 1,117,433,601 |
|
NET ASSETS |
|
|
|
|
|
|
|
|
|
|
Beginning of year |
|
| 7,245,549,986 |
|
| 4,793,422,161 |
|
| 3,675,988,560 |
|
End of year |
| $ | 10,548,711,102 |
| $ | 7,245,549,986 |
| $ | 4,793,422,161 |
|
|
|
| |
|
|
|
|
|
|
|
|
|
|
|
Years Ended December 31, |
|
| 2005 |
|
| 2004 |
|
| 2003 |
|
| ||||||||||
CASH FLOWS FROM OPERATING ACTIVITIES |
|
|
|
|
|
|
|
|
|
|
Net increase in net assets resulting from operations |
| $ | 1,192,785,280 |
| $ | 716,180,335 |
| $ | 303,572,886 |
|
Adjustments to reconcile net increase in net assets resulting from operations to net cash used in operating activities: |
|
|
|
|
|
|
|
|
|
|
Purchases of real estate properties |
|
| (1,864,646,776 | ) |
| (1,690,454,136 | ) |
| (326,513,028 | ) |
Capital improvements on real estate properties |
|
| (83,150,771 | ) |
| (37,811,864 | ) |
| (26,697,465 | ) |
Proceeds from sale of real estate properties |
|
| 511,500,399 |
|
| 113,765,000 |
|
| 187,225,000 |
|
Decrease (increase) in other investments |
|
| (1,313,788,390 | ) |
| (648,107,782 | ) |
| (958,290,679 | ) |
Increase in other assets |
|
| (80,412,203 | ) |
| (30,270,749 | ) |
| (19,808,324 | ) |
Increase (decrease) in amounts due from bank |
|
| (231,476 | ) |
| (783,869 | ) |
| 1,015,345 |
|
Increase in accrued real estate property level expenses and taxes |
|
| 60,829,395 |
|
| 25,445,331 |
|
| 18,678,441 |
|
Increase in security deposits held |
|
| 2,670,715 |
|
| 621,654 |
|
| 1,419,425 |
|
Increase (decrease) in other liabilities |
|
| (1,162,347 | ) |
| — |
|
| — |
|
Net realized (gain) on investments |
|
| (119,932,351 | ) |
| (13,827,432 | ) |
| (32,598,548 | ) |
Unrealized (gain) loss on investments |
|
| (646,037,921 | ) |
| (170,703,978 | ) |
| 37,639,368 |
|
NET CASH USED IN OPERATING ACTIVITIES |
|
| (2,341,576,446 | ) |
| (1,735,947,490 | ) |
| (814,357,579 | ) |
CASH FLOWS FROM FINANCING ACTIVITIES |
|
|
|
|
|
|
|
|
|
|
Premiums |
|
| 968,189,436 |
|
| 738,048,183 |
|
| 515,435,665 |
|
Net transfers from (to) TIAA |
|
| 197,272,397 |
|
| 147,340,801 |
|
| 30,198,200 |
|
Net transfers from CREF Accounts |
|
| 1,238,160,587 |
|
| 1,041,124,402 |
|
| 403,594,402 |
|
Principal payments of mortgages |
|
| (173,361 | ) |
| — |
|
| — |
|
Proceeds from mortgage financing |
|
| 232,585,341 |
|
| — |
|
| — |
|
Annuity and other periodic payments |
|
| (44,487,142 | ) |
| (30,761,316 | ) |
| (22,213,682 | ) |
Withdrawals and death benefits |
|
| (248,759,442 | ) |
| (159,804,580 | ) |
| (113,153,870 | ) |
NET CASH PROVIDED BY FINANCING ACTIVITIES |
|
| 2,342,787,816 |
|
| 1,735,947,490 |
|
| 813,860,715 |
|
NET INCREASE (DECREASE) IN CASH |
|
| 1,211,370 |
|
| — |
|
| (496,864 | ) |
CASH |
|
|
|
|
|
|
|
|
|
|
Beginning of year |
|
| — |
|
| — |
|
| 496,864 |
|
End of year |
| $ | 1,211,370 |
| $ | — |
| $ | — |
|
Supplemental disclosure: Cash paid for interest |
| $ | 38,267,618 |
| $ | 121,408 |
| $ | — |
|
Non-cash activity: Debt assumed upon purchase of real estate |
| $ | 211,400,000 |
| $ | 499,479,256 |
| $ | — |
|
|
|
| ||
|
|
|
|
|
|
|
|
December 31, |
| 2006 |
| 2005 |
| ||
ASSETS |
|
|
|
|
|
|
|
Investments, at value: |
|
|
|
|
|
|
|
Real estate properties |
| $ | 10,743,487,689 |
| $ | 7,977,600,751 |
|
Real estate joint ventures and limited partnerships |
|
| 1,948,028,002 |
|
| 1,418,583,542 |
|
Marketable securities: |
|
|
|
|
|
|
|
Real estate-related |
|
| 704,922,323 |
|
| 448,662,598 |
|
Other |
|
| 2,038,938,210 |
|
| 1,640,894,515 |
|
Mortgage loan receivable |
|
| 74,660,626 |
|
| — |
|
Total investments |
|
| 15,510,036,850 |
|
| 11,485,741,406 |
|
Cash |
|
| 3,585,145 |
|
| 1,211,370 |
|
Due from investment advisor |
|
| 8,461,793 |
|
| 7,717,256 |
|
Other |
|
| 237,877,545 |
|
| 190,756,381 |
|
TOTAL ASSETS |
|
| 15,759,961,333 |
|
| 11,685,426,413 |
|
LIABILITIES |
|
|
|
|
|
|
|
Mortgage loans payable—Note 5 (principal outstanding: |
|
|
|
|
|
|
|
$1,384,920,990 and $943,291,236) |
|
| 1,437,149,148 |
|
| 973,502,186 |
|
Payable for securities transactions |
|
| 1,219,323 |
|
| 993,809 |
|
Accrued real estate property level expenses |
|
| 169,657,402 |
|
| 145,789,277 |
|
Security deposits held |
|
| 19,242,948 |
|
| 16,430,039 |
|
TOTAL LIABILITIES |
|
| 1,627,268,821 |
|
| 1,136,715,311 |
|
NET ASSETS |
|
|
|
|
|
|
|
Accumulation Fund |
|
| 13,722,700,176 |
|
| 10,227,655,797 |
|
Annuity Fund |
|
| 409,992,336 |
|
| 321,055,305 |
|
TOTAL NET ASSETS |
| $ | 14,132,692,512 |
| $ | 10,548,711,102 |
|
NUMBER OF ACCUMULATION UNITS OUTSTANDING—Notes 6 and 7 |
|
| 50,146,354 |
|
| 42,623,491 |
|
NET ASSET VALUE, PER ACCUMULATION UNIT—Note 6 |
| $ | 273.65 |
| $ | 239.95 |
|
90|ProspectusTIAA Real Estate Account
| | TIAA Real Estate Account | |
|
|
|
|
|
|
|
|
|
|
|
Years Ended December 31, |
| 2006 |
| 2005 |
| 2004 |
| |||
INVESTMENT INCOME |
|
|
|
|
|
|
|
|
|
|
Real estate income, net: |
|
|
|
|
|
|
|
|
|
|
Rental income |
| $ | 834,455,788 |
| $ | 618,633,580 |
| $ | 397,198,276 |
|
Real estate property level expenses and taxes: |
|
|
|
|
|
|
|
|
|
|
Operating expenses |
|
| 207,452,982 |
|
| 150,501,136 |
|
| 100,991,997 |
|
Real estate taxes |
|
| 110,059,852 |
|
| 88,014,264 |
|
| 55,946,418 |
|
Interest expense |
|
| 72,160,111 |
|
| 40,028,630 |
|
| 830,361 |
|
Total real estate property level expenses |
|
|
|
|
|
|
|
|
|
|
and taxes |
|
| 389,672,945 |
|
| 278,544,030 |
|
| 157,768,776 |
|
Real estate income, net |
|
| 444,782,843 |
|
| 340,089,550 |
|
| 239,429,500 |
|
Income from real estate joint ventures |
|
|
|
|
|
|
|
|
|
|
and limited partnerships |
|
| 84,671,528 |
|
| 71,826,443 |
|
| 71,390,397 |
|
Interest |
|
| 118,621,441 |
|
| 54,114,448 |
|
| 15,055,451 |
|
Dividends |
|
| 16,785,769 |
|
| 16,884,764 |
|
| 12,453,109 |
|
TOTAL INCOME |
|
| 664,861,581 |
|
| 482,915,205 |
|
| 338,328,457 |
|
EXPENSES—NOTE 2: |
|
|
|
|
|
|
|
|
|
|
Investment advisory charges |
|
| 26,899,307 |
|
| 19,603,225 |
|
| 14,393,388 |
|
Administrative and distribution charges |
|
| 45,712,473 |
|
| 27,130,406 |
|
| 16,372,446 |
|
Mortality and expense risk charges |
|
| 6,931,833 |
|
| 6,196,549 |
|
| 4,093,858 |
|
Liquidity guarantee charges |
|
| 3,905,051 |
|
| 3,170,017 |
|
| 1,868,733 |
|
TOTAL EXPENSES |
|
| 83,448,664 |
|
| 56,100,197 |
|
| 36,728,425 |
|
INVESTMENT INCOME—NET |
|
| 581,412,917 |
|
| 426,815,008 |
|
| 301,600,032 |
|
REALIZED AND UNREALIZED GAIN (LOSS) |
|
|
|
|
|
|
|
|
|
|
ON INVESTMENTS AND MORTGAGE LOANS PAYABLE |
|
|
|
|
|
|
|
|
|
|
Net realized gain (loss) on: |
|
|
|
|
|
|
|
|
|
|
Real estate properties |
|
| 76,137,064 |
|
| 84,764,142 |
|
| 13,827,432 |
|
Marketable securities |
|
| 10,257,108 |
|
| 36,871,417 |
|
| 46,714,767 |
|
Total realized gain on investments |
|
| 86,394,172 |
|
| 121,635,559 |
|
| 60,542,199 |
|
Net change in unrealized appreciation |
|
|
|
|
|
|
|
|
|
|
(depreciation) on: |
|
|
|
|
|
|
|
|
|
|
Real estate properties |
|
| 659,370,445 |
|
| 534,569,631 |
|
| 172,486,544 |
|
Real estate joint ventures and |
|
|
|
|
|
|
|
|
|
|
limited partnerships |
|
| 193,477,741 |
|
| 167,019,921 |
|
| 162,245,601 |
|
Marketable securities |
|
| 120,453,638 |
|
| (28,100,691 | ) |
| 21,088,525 |
|
Mortgage loan receivable. |
|
| (339,374 | ) |
| — |
|
| — |
|
Mortgage loans payable |
|
| (26,568,857 | ) |
| (29,154,148 | ) |
| (1,782,566 | ) |
Net change in unrealized appreciation on |
|
|
|
|
|
|
|
|
|
|
investments and mortgage loans payable |
|
| 946,393,593 |
|
| 644,334,713 |
|
| 354,038,104 |
|
NET REALIZED AND UNREALIZED GAIN |
|
|
|
|
|
|
|
|
|
|
ON INVESTMENTS AND MORTGAGE |
|
|
|
|
|
|
|
|
|
|
LOANS PAYABLE |
|
| 1,032,787,765 |
|
| 765,970,272 |
|
| 414,580,303 |
|
NET INCREASE IN NET ASSETS |
|
|
|
|
|
|
|
|
|
|
RESULTING FROM OPERATIONS |
| $ | 1,614,200,682 |
| $ | 1,192,785,280 |
| $ | 716,180,335 |
|
TIAA Real Estate AccountProspectus|91
| | TIAA Real Estate Account | |
|
|
|
|
|
|
|
|
|
|
|
Years Ended December 31, |
| 2006 |
| 2005 |
| 2004 |
| |||
FROM OPERATIONS |
|
|
|
|
|
|
|
|
|
|
Investment income, net |
| $ | 581,412,917 |
| $ | 426,815,008 |
| $ | 301,600,032 |
|
Net realized gain on investments |
|
| 86,394,172 |
|
| 121,635,559 |
|
| 60,542,199 |
|
Net change in unrealized appreciation |
|
|
|
|
|
|
|
|
|
|
on investments and mortgage loans payable |
|
| 946,393,593 |
|
| 644,334,713 |
|
| 354,038,104 |
|
NET INCREASE IN NET ASSETS |
|
|
|
|
|
|
|
|
|
|
RESULTING FROM OPERATIONS |
|
| 1,614,200,682 |
|
| 1,192,785,280 |
|
| 716,180,335 |
|
FROM PARTICIPANT TRANSACTIONS |
|
|
|
|
|
|
|
|
|
|
Premiums |
|
| 1,085,057,614 |
|
| 968,189,436 |
|
| 738,048,183 |
|
Net transfers from TIAA |
|
| 215,893,898 |
|
| 172,305,147 |
|
| 147,340,801 |
|
Net transfers from CREF Accounts |
|
| 1,154,122,836 |
|
| 1,238,160,587 |
|
| 1,045,910,051 |
|
Net transfers from (to) TIAA-CREF Institutional |
|
|
|
|
|
|
|
|
|
|
Mutual Funds |
|
| (15,318,887 | ) |
| 24,967,250 |
|
| (4,785,649 | ) |
Annuity and other periodic payments |
|
| (65,192,000 | ) |
| (44,487,142 | ) |
| (30,761,316 | ) |
Withdrawals and death benefits |
|
| (404,782,733 | ) |
| (248,759,442 | ) |
| (159,804,580 | ) |
NET INCREASE IN NET ASSETS RESULTING |
|
|
|
|
|
|
|
|
|
|
FROM PARTICIPANT TRANSACTIONS |
|
| 1,969,780,728 |
|
| 2,110,375,836 |
|
| 1,735,947,490 |
|
NET INCREASE IN NET ASSETS |
|
| 3,583,981,410 |
|
| 3,303,161,116 |
|
| 2,452,127,825 |
|
NET ASSETS |
|
|
|
|
|
|
|
|
|
|
Beginning of year |
|
| 10,548,711,102 |
|
| 7,245,549,986 |
|
| 4,793,422,161 |
|
End of year |
| $ | 14,132,692,512 |
| $ | 10,548,711,102 |
| $ | 7,245,549,986 |
|
92|ProspectusTIAA Real Estate Account
| | TIAA Real Estate Account | |
|
|
|
|
|
|
|
|
|
|
|
Years Ended December 31, |
| 2006 |
| 2005 |
| 2004 |
| |||
CASH FLOWS FROM OPERATING ACTIVITIES |
|
|
|
|
|
|
|
|
|
|
Net increase in net assets resulting |
|
|
|
|
|
|
|
|
|
|
from operations |
| $ | 1,614,200,682 |
| $ | 1,192,785,280 |
| $ | 716,180,335 |
|
Adjustments to reconcile net increase in |
|
|
|
|
|
|
|
|
|
|
net assets resulting from operations to |
|
|
|
|
|
|
|
|
|
|
net cash used in operating activities: |
|
|
|
|
|
|
|
|
|
|
Purchase of real estate properties |
|
| (2,016,229,061 | ) |
| (1,864,646,776 | ) |
| (1,690,454,136 | ) |
Capital improvements on real |
|
|
|
|
|
|
|
|
|
|
estate properties |
|
| (117,041,456 | ) |
| (83,150,771 | ) |
| (37,770,043 | ) |
Proceeds from sale of real estate properties |
|
| 387,290,000 |
|
| 511,500,399 |
|
| 113,765,000 |
|
Increase in other investments |
|
| (859,898,769 | ) |
| (1,313,788,390 | ) |
| (418,058,889 | ) |
Increase in mortgage loan receivable |
|
| (74,660,626 | ) |
| — |
|
| — |
|
Increase in other assets |
|
| (47,865,701 | ) |
| (80,412,203 | ) |
| (30,270,749 | ) |
Decrease in amounts due to bank |
|
| — |
|
| (231,476 | ) |
| (783,869 | ) |
Increase in accrued real estate property |
|
|
|
|
|
|
|
|
|
|
level expenses and taxes |
|
| 23,868,125 |
|
| 60,829,395 |
|
| 25,445,331 |
|
Increase in security deposits held |
|
| 2,812,909 |
|
| 2,670,715 |
|
| 621,654 |
|
Increase (decrease) in other liabilities |
|
| 225,514 |
|
| (1,162,347 | ) |
| — |
|
Net realized gain on investments |
|
| (86,394,172 | ) |
| (121,635,559 | ) |
| (60,542,199 | ) |
Unrealized gain on investments and |
|
|
|
|
|
|
|
|
|
|
mortgage loans payable |
|
| (946,393,593 | ) |
| (644,334,713 | ) |
| (354,038,104 | ) |
NET CASH USED IN OPERATING ACTIVITIES |
|
| (2,120,086,148 | ) |
| (2,341,576,446 | ) |
| (1,735,905,669 | ) |
CASH FLOWS FROM FINANCING ACTIVITIES |
|
|
|
|
|
|
|
|
|
|
Mortgage loans payable acquired |
|
| 153,000,000 |
|
| 232,585,341 |
|
| — |
|
Principal payments on mortgage loans payable |
|
| (320,805 | ) |
| (173,361 | ) |
| (41,821 | ) |
Premiums |
|
| 1,085,057,614 |
|
| 968,189,436 |
|
| 738,048,183 |
|
Net transfers from TIAA |
|
| 215,893,898 |
|
| 172,305,147 |
|
| 147,340,801 |
|
Net transfers from CREF Accounts |
|
| 1,154,122,836 |
|
| 1,238,160,587 |
|
| 1,045,910,051 |
|
Net transfers from (to) TIAA-CREF Institutional |
|
|
|
|
|
|
|
|
|
|
Mutual Funds |
|
| (15,318,887 | ) |
| 24,967,250 |
|
| (4,785,649 | ) |
Annuity and other periodic payments |
|
| (65,192,000 | ) |
| (44,487,142 | ) |
| (30,761,316 | ) |
Withdrawals and death benefits |
|
| (404,782,733 | ) |
| (248,759,442 | ) |
| (159,804,580 | ) |
NET CASH PROVIDED BY |
|
|
|
|
|
|
|
|
|
|
FINANCING ACTIVITIES |
|
| 2,122,459,923 |
|
| 2,342,787,816 |
|
| 1,735,905,669 |
|
NET INCREASE IN CASH |
|
| 2,373,775 |
|
| 1,211,370 |
|
| — |
|
CASH |
|
|
|
|
|
|
|
|
|
|
Beginning of year |
|
| 1,211,370 |
|
| — |
|
| — |
|
End of year |
| $ | 3,585,145 |
| $ | 1,211,370 |
| $ | — |
|
Supplemental disclosure: Cash paid for interest |
| $ | 68,034,179 |
| $ | 38,267,618 |
| $ | 121,408 |
|
Debt assumed upon acquisition of properties |
| $ | 288,950,559 |
| $ | 211,400,000 |
| $ | 499,521,077 |
|
TIAA Real Estate AccountProspectus|93
Note 1—1–Organization and Significant Accounting Policies
The TIAA Real Estate Account (“Account”) is a segregated investment account of Teachers Insurance and Annuity Association of America (“TIAA”) and was established by resolution of TIAA’s Board of Trustees on February 22, 1995, under the insurance laws of the State of New York, for the purpose of funding variable annuity contracts issued by TIAA. The investment objective of the Account is a favorable long-term rate of return primarily through rental income and capital appreciation from real estate investments owned by the Account. The Account holds real estate properties directly and through wholly-owned subsidiaries. The Account also holds interests in limited partnerships and real estate joint ventures and limited partnerships that own real estate.in which the Account does not hold a controlling interest. Such joint ventures are not consolidated for financial statement purposes. The Account also invests in publicly-traded securities and other instruments to maintain adequate liquidity for operating expenses, capital expenditures and to make benefit payments. The Account also invests in mortgage loans receivable collateralized by commercial real estate properties. The financial statements were prepared in accordance with U.S.accounting principles generally accepted accounting principlesin the United States of America which may require the use of estimates made by management. Actual results may vary from those estimates. The following is a summary of the significant accounting policies of the Account.
Basis of Presentation: The accompanying financial statements include the Account and those subsidiaries wholly-owned by TIAA for the benefit of the Account. All significant intercompany accounts and transactions have been eliminated in consolidation.
Valuation of Real Estate Properties: Investments in real estate properties are stated at fair value, as determined in accordance with procedures approved by the Investment Committee of the TIAA Board of Trustees and in accordance with the responsibilities of the Board as a whole; accordingly, the Account does not record depreciation. Fair value for real estate properties is defined as the most probable price for which a property will sell in a competitive market under all conditions requisite to a fair sale. Determination of fair value involves subjective judgementjudgment because the actual market value of real estate can be determined only by negotiation between the parties in a sales transaction. Real estate properties owned by the Account are initially valued at their respective purchase prices (including acquisition costs). Subsequently, the properties are valued on a quarterly cycle, and independent appraisers value each real estate property at least once a year. An independent fiduciary, Real Estate Research Corporation, has been appointed by a special subcommittee of TIAA’s Board of Trustees. The independent fiduciary must approve all independent appraisers used by the Account. TIAA’s appraisal staff performs the other quarterly valuation reviews of each real estate property on a quarterly basis and updates the property value if it believes that the value of a property has changed since the previous valuation review or appraisal. The appraisals are performed in accordance with Uniform Standards of Professional Appraisal Practices (USPAP), the real estate appraisal industry standards created by The Appraisal Foundation. Real estate appraisals are estimates of property values based on a professional’s opinion. The independent fiduciary can also require additional appraisals if it believes that a
94|ProspectusTIAA Real Estate Account
Notes to financial statements | continued |
property’s value has changed materially and that such change is not reflected in the quarterly appraisal.valuation review, or otherwise to ensure that the Account is valued correctly. The independent fiduciary must also approve an appraisal where a property’s value changed by 6% or more from the most recent annual appraisal. The independent fiduciary is appointed by a special subcommittee of TIAA’s Board of Trustees. TIAA’s appraisal staff performs a valuation review of each real estate property on a quarterly basis and updates the property value if it believes that the value of the property has changed since the previous valuation review or appraisal. Real estate properties subject to a mortgage including debt assumed in connection with the purchase of real estate, are generally valued as described; however, beginning in 2005, the value of the mortgage is appraisedvalued independently of the property, and its fair value is reported separately, whereas, in 2004, any change in the fair value of the mortgage, including debt
84 | Prospectus TIAA Real Estate Account
|
|
assumed in connection with the purchase of real estate, was shown as an adjustment to the real estate property value. The fair value of the outstanding mortgage could have a material affect on the equity investment value of the property.separately. The independent fiduciary reviews and approves any such mortgage valuation adjustments which exceed certain prescribed limits before such adjustments are recorded by the Account. The Account continues to use the revised value for each real estate property and mortgage loan payable to calculate the Account’s daily net asset value until the next valuation review or appraisal.
Valuation of Real Estate Joint Ventures:Ventures and Limited Partnerships: Real estate joint ventures and limited partnerships are stated at the Account’s equity in the net assets of the underlying entities, whichadjusted, for the joint ventures, to value their real estate holdings and mortgage notes payable at fair value.
Valuation of Marketable Securities: Equity securities listed or traded on any national market or exchange are valued at the last sale price as of the close of the principal securities exchange on which such securities are traded or, if there is no sale, at the mean of the last bid and asked prices on such exchange.
Debt securities, other than money market instruments, are valued at the most recent bid price or the equivalent quoted yield for such securities (or those of comparable maturity, quality and type). Money market instruments, with maturities of one year or less, are valued in the same manner as debt securities or derived from a pricing matrix that has various types of money market instruments along one axis and various maturities along the other. Portfolio securities and limited partnership interests for which market quotations are not readily available are valued at fair value as determined in good faith under the direction of the Investment Committee of the TIAA Board of Trustees and in accordance with the responsibilities of the Board as a whole.
Mortgage Loans Receivable: Mortgage loans receivable are stated at fair value and are initially valued at the face amount of the mortgage loan funding. Subsequently, mortgage loans receivable are valued quarterly based on market factors, such as market interest rates and spreads for comparable loans, and the performance of the underlying collateral.
Mortgage Loans Payable: Estimated market values of mortgage loans payable are based on the amount at which the liability could be settled (either transferred or paid back) in a current transaction exclusive of direct transaction costs. Different assumptions or changes in future market conditions could significantly affect estimated market value. At times, the Account may assume debt in connection with the purchase of real estate. For debt assumed, the Account allocates a portion of the purchase price to the below- or above-market debt and amortizes the premium or discount over the remaining life of the debt.
Foreign currency transactions and translation: Portfolio investments and other assets and liabilities denominated in foreign currencies are translated into U.S. dollars at the exchange rates prevailing at the end of the period. Purchases and sales
TIAA Real Estate AccountProspectus|95
Notes to financial statements | continued |
of securities, income receipts and expense payments made in foreign currencies are translated into U.S. dollars at the exchange rates prevailing on the respective dates of the transactions. The effect of changes in foreign currency exchange rates on portfolio investments and mortgage loans payable is included in the net realized and unrealized gains and losses on investments and mortgage loans payable. Net realized gains and losses on foreign currency transactions include maturities of forward foreign currency contracts, disposition of foreign currencies, and currency gains and losses between the accrual and receipt dates of portfolio investment income and between the trade and settlement dates of portfolio investment transactions.
Accumulation and Annuity Funds: The Accumulation Fund represents the net assets attributable to participants in the accumulation phase of their investment. The Annuity Fund represents the net assets attributable to the participants currently receiving annuity payments. The net increase or decrease in net assets from investment operations is apportioned between the Accountsaccounts based upon their relative daily net asset values. Once an Account participant begins receiving lifetime annuity income benefits, monthly payment levels cannot be reduced as a result of the Account’s adverse mortality experience. In addition, the contracts are required to stipulate the maximum expense charge that can be assessed, which is equal to 2.50% of average net assets per year. Accordingly,The Account pays a small risk charge is paid by the Accountfee to TIAA to assume these mortality and expense risks.
Accounting for Investments: Real estate transactions are accounted for as of the date on which the purchase or sale transactions for the real estate properties close (settlement date). The Account recognizes a gain to the extent that the contract sales price exceeds the cost-to-date of the property being sold. A loss occurs when the cost-to-date exceeds the sales price. As the Account is fair valued and all properties are appraised quarterly, any accumulated unrealized gains and losses are reversed in the calculation of realized gains and losses. Rent from real estate properties consists of all amounts earned under tenant operating leases, including base rent, recoveries of real estate taxes and other expenses and charges for miscellaneous services provided to tenants. Rental income is recognized in accordance with the billing terms of the lease agreements. The Account bears the direct expenses of the real estate properties owned. These expenses include, but are not limited to, fees to local property management companies, property taxes, utilities, maintenance, repairs, insurance, and other operating and administrative costs. An estimate of the net operating income earned from each real estate property is accrued by the Account on a daily
TIAA Real Estate Account Prospectus | 85
|
|
basis and such estimates are adjusted as soon as actual operating results are determined. The Account recognizes a gain to the extent that the contract sales price exceeds the cost-to-date of the property being sold. A loss occurs when the cost-to-date exceeds the sales price. As the Account is marked-to-market and all properties are appraised quarterly, any accumulated unrealized gains and losses are reversed in the calculation of realized gains and losses.
The Account has limited partnershipownership interests in various real estate funds (limited partnerships)partnerships and one limited liability corporation) and a private REIT (collectively, the “limited partnerships”). The Account records its contributions as increases to the investments, and distributions from the investments are treated as either income or return of capital, as determined by the management of the limited partnerships. Unrealized gains and losses are calculated and recorded quarterly when the Account’s accounting records are compared to the financial statements of the limited partnerships.
96|ProspectusTIAA Real Estate Account
Notes to financial statements | continued |
Income from real estate joint ventures is recorded based on the Account’s proportional interest in the income earned by the joint venture that has been distributed from the joint venture to the Account.venture.
Securities transactions are accounted for as of the date the securities are purchased or sold (trade date). Interest income is recorded as earned and includes accrual of discount and amortization of premium. Dividend income is recorded on the ex-dividend date or as soon as the Account is informed of the dividend. Realized gains and losses on securities transactions are accounted for on the specific identification method.
Mortgage Notes Payable: Commencing in 2005, the Account separately reports mortgage notes payable at estimated market value. Estimated market values are based on the amount at which the liability could be settled (either transferred or paid back) in a current transaction exclusive of direct transaction costs. Different assumptions or changes in future market conditions could significantly affect estimated market value. At times, the Account may assume debt in connection with the purchase of real estate. For debt assumed, the Account allocates a portion of the purchase price to the below or above market debt and amortizes the premium or discount over the remaining life of the debt.
Foreign currency transactions and translation: Portfolio investments and other assets and liabilities denominated in foreign currencies are translated into U.S. dollars at the exchange rates prevailing at the end of the period. Purchases and sales of securities, income receipts and expense payments made in foreign currencies are translated into U.S. dollars at the exchange rates prevailing on the respective dates of the transactions. The effect of changes in foreign currency exchange rates on portfolio investments are included in the net realized and unrealized gains and losses on investments. Net realized gains and losses on foreign currency transactions include disposition of foreign currencies and currency gains and losses between the accrual and receipt dates of portfolio investment income and between the trade and settlement dates of portfolio investment transactions.
Federal Income Taxes: Based on provisions of the Internal Revenue Code, Section 817, the Account is taxed as a segregated asset account of TIAA. The Account should incur
86 | Prospectus TIAA Real Estate Account
|
|
no material federal income tax attributable to the net investment experience of the Account.
Reclassifications: Certain prior period amounts have been reclassified to conform to the current presentation. These reclassifications did not affect the total assets, total net assets or net increase in net assets previously reported.
Note 2—2–Management Agreements
Investment advisory services for the Account are provided by TIAA employees, under the direction of TIAA’s Board of Trustees and its Investment Committee, pursuant to investment management procedures adopted by TIAA for the Account. TIAA’s investment management decisions for the Account are also subject to review by the Account’s independent fiduciary.fiduciary, Real Estate Research Corporation. TIAA also provides all portfolio accounting and related services for the Account.
DistributionAdministrative and administrativedistribution services for the Account are provided by TIAA-CREF Individual & Institutional Services, LLC (“Services”) pursuant to a Distribution and Administrative Services Agreement with the Account. Services, a wholly-owned subsidiary of TIAA, is a registered broker-dealer and member of the National Association of Securities Dealers, Inc.
The services performed by TIAA and Services are providedprovide their services at cost. TIAA and Services receive payments from the Account on a daily basis according to formulas established each year with the objective of keeping the payments as close as possible to the Account’s actual expenses. Any differences between actual expenses and the amounts paid are adjusted quarterly.
TIAA also provides a liquidity guarantee to the Account, for an annual rate of 0.04% of net assets,a fee, to ensure that sufficient funds are available to meet participant transfer and cash withdrawal requests in the event that the Account’s cash flows and liquid investments are insufficient to fund such requests. TIAA also imposesreceives a daily chargefee for bearingassuming certain mortality and expense risks in connection with the contracts equivalent to an annual rate of 0.07% of net assets of the Account.
Note 3—Leasesrisks.
The Account’s real estate properties are leased to tenants under operating lease agreements which expire on various dates through 2031. Aggregate minimum annual rentalsexpenses for the properties owned, excluding short-term residential leases,services noted above that are as follows:
|
|
|
|
|
Years Ending December 31, |
|
|
|
|
2006 |
| $ | 653,416,605 |
|
2007 |
|
| 611,538,186 |
|
2008 |
|
| 549,973,188 |
|
2009 |
|
| 491,561,855 |
|
2010 |
|
| 396,090,166 |
|
2011–2031 |
|
| 1,198,826,686 |
|
Total |
| $ | 3,901,406,686 |
|
Certain leases provide for additional rental amounts based uponprovided to the recoveryAccount by TIAA and other related parties are identified in the accompanying Statements of actual operating expenses in excess of specified base amounts.Operations.
TIAA Real Estate AccountProspectus|8797
|
|
Notes to financial statements | continued |
Note 4—3–Leases
The Account’s real estate properties are leased to tenants under operating lease agreements which expire on various dates through 2035. Aggregate minimum annual rentals for the properties owned, excluding short-term residential and storage facility leases, are as follows:
|
|
|
|
|
Years Ending December 31, |
|
|
|
|
| ||||
2007 |
| $ | 795,495,322 |
|
2008 |
|
| 728,447,351 |
|
2009 |
|
| 654,178,920 |
|
2010 |
|
| 557,829,144 |
|
2011 |
|
| 443,396,596 |
|
2012–2035 |
|
| 1,527, 743,118 |
|
| ||||
Total |
| $ | 4,707,090,451 |
|
|
Certain leases provide for additional rental amounts based upon the recovery of actual operating expenses in excess of specified base amounts.
Note 4–Investment in Joint Ventures and Limited Partnerships
The Account owns interests in several real estate properties through joint ventures and receives distributions and allocations of profits and losses from the joint ventures based on the Account’s ownership interest percentages. Several of these joint ventures have mortgage notes payable on the properties owned. At December 31, 2006, the Account held 12 joint venture investments with ownership interest percentages that ranged from 50% to 80%. The Account’s allocated portion of the mortgage notes payable iswas $472,167,225 and $468,664,313 and $345,136,785 at December 31, 20052006 and 2004,December 31, 2005, respectively. The Accounts’Account’s equity in the joint ventures at December 31, 2006 and December 31, 2005 was $1,668,744,951 and 2004 was $1,222,036,564, and $1,257,893,004, respectively. A condensed summary of the financial position and results of operations of the joint ventures is shown below.
|
|
|
|
|
|
|
|
|
|
|
|
|
|
| |
|
| December 31, 2005 |
| December 31, 2004 |
| ||
| |||||||
|
|
|
|
|
|
|
|
Assets |
|
|
|
|
|
|
|
Real estates properties, at value |
| $ | 2,989,209,293 |
| $ | 2,760,426,300 |
|
Other assets |
|
| 80,768,265 |
|
| 55,021,655 |
|
| |||||||
Total assets |
| $ | 3,069,977,558 |
| $ | 2,815,447,955 |
|
| |||||||
Liabilities and Equity |
|
|
|
|
|
|
|
Mortgage notes payable |
| $ | 865,828,626 |
| $ | 618,773,569 |
|
Other liabilities |
|
| 70,471,251 |
|
| 47,389,201 |
|
| |||||||
Total liabilities |
|
| 936,299,877 |
|
| 666,162,770 |
|
Equity |
|
| 2,133,677,681 |
|
| 2,149,285,185 |
|
| |||||||
Total liabilities and equity |
| $ | 3,069,977,558 |
| $ | 2,815,447,955 |
|
| |||||||
|
|
|
|
|
|
| |
|
|
|
|
|
|
|
|
|
|
|
|
| Year Ended |
| Year Ended |
| Year Ended |
| |||
| ||||||||||
Operating Revenues and Expenses |
|
|
|
|
|
|
|
|
|
|
Revenues |
| $ | 270,519,206 |
| $ | 250,697,181 |
| $ | 145,432,123 |
|
Expenses |
|
| 142,782,169 |
|
| 122,017,640 |
|
| 77,571,384 |
|
Excess of revenues over expenses |
| $ | 127,737,037 |
| $ | 128,679,541 |
| $ | 67,860,739 |
|
|
|
|
|
|
|
|
|
|
| December 31, 2006 |
| December 31, 2005 |
| ||
| |||||||
Assets |
|
|
|
|
|
|
|
Real estate properties, at value |
| $ | 3,650,902,513 |
| $ | 2,989,209,293 |
|
Other assets |
|
| 101,949,855 |
|
| 80,768,265 |
|
| |||||||
Total assets |
| $ | 3,752,852,368 |
| $ | 3,069,977,558 |
|
| |||||||
Liabilities and Equity |
|
|
|
|
|
|
|
Mortgage loans payable, at value |
| $ | 875,560,195 |
| $ | 865,828,626 |
|
Other liabilities |
|
| 74,287,727 |
|
| 70,471,251 |
|
| |||||||
Total liabilities |
|
| 949,847,922 |
|
| 936,299,877 |
|
Equity |
|
| 2,803,004,446 |
|
| 2,133,677,681 |
|
| |||||||
Total liabilities and equity |
| $ | 3,752,852,368 |
| $ | 3,069,977,558 |
|
| |||||||
8898| | ProspectusTIAA Real Estate Account
|
| |
Notes to financial statements | continued | |
|
|
|
|
|
|
|
|
|
|
|
|
| Year Ended |
| Year Ended |
| Year Ended |
| |||
| ||||||||||
Operating Revenues and Expenses |
|
|
|
|
|
|
|
|
|
|
Revenues |
| $ | 299,078,956 |
| $ | 270,519,206 |
| $ | 250,697,181 |
|
Expenses |
|
| 157,686,944 |
|
| 142,782,169 |
|
| 122,017,640 |
|
| ||||||||||
Excess of revenues over expenses |
| $ | 141,392,012 |
| $ | 127,737,037 |
| $ | 128,679,541 |
|
| ||||||||||
The account invests in limited partnerships that own real estate properties and receives distributions from the limited partnerships based on the Account’s ownership interest percentages. At December 31, 2006, the Account held six limited partnership investments with ownership interest percentages that ranged from 5.27% to 19.75%. The Account’s investment in limited partnerships was $279,283,051 and $196,546,978 at December 31, 2006 and December 31, 2005, respectively.
Note 5—5–Mortgage NotesLoans Payable
At December 31, 2005 and 2004,2006, the Account had outstanding mortgage balancesloans payable on the properties as follows:following properties:
|
|
|
|
|
|
|
|
|
|
|
|
|
|
|
|
|
|
|
|
|
Property |
| Interest Rate Percentage |
| Amount 2005 |
| Amount 2004 |
| Due |
|
| Interest Rate Percentage |
| Amount December 31, 2006 |
| Due | |||||
50 Fremont |
| 6.40 paid monthly | (d) | $ | 135,000,000 |
| $ | 135,000,000 |
| August 21, 2013 |
|
| 6.40 paid monthly |
| $ | 135,000,000 |
| August 21, 2013 | ||
Ontario Industrial Portfolio |
| 7.24 paid monthly | (a) |
| 9,305,895 |
| 9,479,256 |
| May 1, 2011 |
|
| 7.42 paid monthly |
| 9,119,033 |
| May 1, 2011 | ||||
IDX Tower |
| 6.40 paid monthly | (d) |
| 145,000,000 |
| 145,000,000 |
| August 21, 2013 |
|
| 6.40 paid monthly |
| 145,000,000 |
| August 21, 2013 | ||||
1001 Pennsylvania Ave |
| 6.40 paid monthly | (d) |
| 210,000,000 |
| 210,000,000 |
| August 21, 2013 |
|
| 6.40 paid monthly |
| 210,000,000 |
| August 21, 2013 | ||||
99 High Street |
| 5.5245 paid monthly | (b) |
| 185,000,000 |
| — |
| November 11, 2015 |
|
| 5.5245 paid monthly |
| 185,000,000 |
| November 11, 2015 | ||||
Reserve at Sugarloaf |
| 5.49 paid monthly | (c) |
| 26,400,000 |
| — |
| June 1, 2013 |
|
| 5.49 paid monthly |
| 26,266,057 |
| June 1, 2013 | ||||
Westferry Circus |
| 5.4003 paid quarterly | (d) |
| 230,429,185 |
| — |
| November 15, 2012 |
|
| 5.4003 paid quarterly | (a) |
| 232,585,341 |
| November 15, 2012 | |||
Lincoln Centre |
| 5.51 paid monthly |
| 153,000,000 |
| February 1, 2016 | ||||||||||||||
Wilshire Rodeo Plaza |
| 5.28 paid monthly |
| 112,700,000 |
| April 11, 2014 | ||||||||||||||
1401 H Street |
| 5.97 paid monthly |
| 115,000,000 |
| December 7, 2014 | ||||||||||||||
South Frisco Village |
| 5.85 paid monthly |
| 26,250,559 |
| June 1, 2013 | ||||||||||||||
Publix at Weston Commons |
| 5.08 paid monthly |
| 35,000,000 |
| January 1, 2036 | ||||||||||||||
Total maturities |
|
|
| $ | 941,135,080 |
| $ | 499,479,256 |
|
|
| |||||||||
Net unrealized loss |
|
|
| 32,367,106 |
|
|
|
|
| |||||||||||
Total principal outstanding |
|
|
| $ | 1,384,920,990 |
|
| |||||||||||||
Unamortized discount |
|
|
| (5,277,414 | ) |
| ||||||||||||||
Total Mortgage Notes Payable |
|
|
| $ | 973,502,186 |
| $ | 499,479,256 |
|
|
| |||||||||
Amortized cost |
|
|
| 1,379,643,576 |
|
| ||||||||||||||
Fair value adjustment |
|
|
| 57,505,572 |
|
| ||||||||||||||
Total mortgage loans payable |
|
|
| $ | 1,437,149,148 |
|
| |||||||||||||
|
|
(a) |
|
|
|
|
|
|
|
Principal on mortgage notesloans payable is due as follows:
|
|
|
|
|
|
|
|
|
|
| Amount |
|
| Amount |
| ||
|
|
| ||||||
2006 |
| $ | 186,862 |
| ||||
2007 |
| 201,415 |
|
| $ | 576,135 |
| |
2008 |
| 215,163 |
|
| 575,921 |
| ||
2009 |
| 233,858 |
|
| 619,325 |
| ||
2010 |
| 252,070 |
|
| 659,550 |
| ||
2011 |
| 8,647,276 |
| |||||
Thereafter |
| 940,045,712 |
|
| 1,373,842,783 |
| ||
|
|
| ||||||
Total maturities |
| 941,135,080 |
|
| 1,384,920,990 |
| ||
|
|
| ||||||
TIAA Real Estate AccountProspectus|| 8999
|
| |
Notes to financial statements | continued | |
Note 6—6–Condensed Financial Information
Selected condensed financial information for an Accumulation Unit of the Account is presented below.
|
|
|
|
|
|
|
|
|
|
|
|
|
|
|
|
|
|
|
|
|
|
|
|
|
|
|
|
|
|
|
|
|
|
| Years Ended December 31, |
|
| Years Ended December 31, |
| ||||||||||||||||||||||||||
|
|
|
| |||||||||||||||||||||||||||||
|
| 2005 |
| 2004 |
| 2003 |
| 2002 |
| 2001 |
|
| 2006 |
| 2005 |
| 2004 |
| 2003 |
| 2002 |
| ||||||||||
| ||||||||||||||||||||||||||||||||
Per Accumulation Unit data: |
|
|
|
|
|
|
|
|
|
|
|
|
|
|
|
|
|
|
|
|
|
| ||||||||||
Rental income |
| $ | 15.604 |
| $ | 13.422 |
| $ | 15.584 |
| $ | 14.225 |
| $ | 14.862 |
|
| $ | 16.717 |
| $ | 15.604 |
| $ | 13.422 |
| $ | 15.584 |
| $ | 14.225 |
|
Real estate property level expenses and taxes |
| 7.026 |
| 5.331 |
| 5.890 |
| 4.819 |
| 4.754 |
|
| 7.807 |
| 7.026 |
| 5.331 |
| 5.890 |
| 4.819 |
| ||||||||||
| ||||||||||||||||||||||||||||||||
Real estate income, net |
| 8.578 |
| 8.091 |
| 9.694 |
| 9.406 |
| 10.108 |
|
| 8.910 |
| 8.578 |
| 8.091 |
| 9.694 |
| 9.406 |
| ||||||||||
Income from real estate joint ventures |
| 1.604 |
| 1.935 |
| 1.379 |
| 0.807 |
| 0.130 |
| |||||||||||||||||||||
Dividends and interest |
| 1.998 |
| 1.406 |
| 0.839 |
| 1.249 |
| 1.950 |
| |||||||||||||||||||||
Other income |
| 4.409 |
| 3.602 |
| 3.341 |
| 2.218 |
| 2.056 |
| |||||||||||||||||||||
| ||||||||||||||||||||||||||||||||
Total income |
| 12.180 |
| 11.432 |
| 11.912 |
| 11.462 |
| 12.188 |
|
| 13.319 |
| 12.180 |
| 11.432 |
| 11.912 |
| 11.462 |
| ||||||||||
Expense charges(1) |
| 1.415 |
| 1.241 |
| 1.365 |
| 1.101 |
| 0.995 |
|
| 1.671 |
| 1.415 |
| 1.241 |
| 1.365 |
| 1.101 |
| ||||||||||
| ||||||||||||||||||||||||||||||||
Investment income, net |
| 10.765 |
| 10.191 |
| 10.547 |
| 10.361 |
| 11.193 |
|
| 11.648 |
| 10.765 |
| 10.191 |
| 10.547 |
| 10.361 |
| ||||||||||
Net realized and unrealized gain (loss) on investments |
| 18.744 |
| 13.314 |
| 2.492 |
| (4.621 | ) |
| (1.239 | ) | ||||||||||||||||||||
Net realized and unrealized gain (loss) on investments and mortgage loans payable |
| 22.052 |
| 18.744 |
| 13.314 |
| 2.492 |
| (4.621 | ) | |||||||||||||||||||||
| ||||||||||||||||||||||||||||||||
Net increase in Accumulation Unit Value |
| 29.509 |
| 23.505 |
| 13.039 |
| 5.740 |
| 9.954 |
|
| 33.700 |
| 29.509 |
| 23.505 |
| 13.039 |
| 5.740 |
| ||||||||||
Accumulation Unit Value: |
|
|
|
|
|
|
|
|
|
|
|
|
|
|
|
|
|
|
|
|
|
| ||||||||||
Beginning of year |
| 210.444 |
| 186.939 |
| 173.900 |
| 168.160 |
| 158.206 |
|
| 239.953 |
| 210.444 |
| 186.939 |
| 173.900 |
| 168.160 |
| ||||||||||
| ||||||||||||||||||||||||||||||||
End of year |
| $ | 239.953 |
| $ | 210.444 |
| $ | 186.939 |
| $ | 173.900 |
| $ | 168.160 |
|
| $ | 273.653 |
| $ | 239.953 |
| $ | 210.444 |
| $ | 186.939 |
| $ | 173.900 |
|
| ||||||||||||||||||||||||||||||||
Total return |
| 14.02 | % |
| 12.57 | % |
| 7.50 | % |
| 3.41 | % |
| 6.29 | % |
| 14.04 | % |
| 14.02 | % |
| 12.57 | % |
| 7.50 | % |
| 3.41 | % | ||
Ratios to Average Net Assets: |
|
|
|
|
|
|
|
|
|
|
|
|
|
|
|
|
|
|
|
|
|
| ||||||||||
Expenses(1) |
| 0.63 | % |
| 0.63 | % |
| 0.76 | % |
| 0.67 | % |
| 0.61 | % |
| 0.67 | % |
| 0.63 | % |
| 0.63 | % |
| 0.76 | % |
| 0.67 | % | ||
Investment income, net |
| 4.82 | % |
| 5.17 | % |
| 5.87 | % |
| 5.65 | % |
| 6.81 | % |
| 4.68 | % |
| 4.82 | % |
| 5.17 | % |
| 5.87 | % |
| 5.65 | % | ||
Portfolio turnover rate: |
|
|
|
|
|
|
|
|
|
|
|
|
|
|
|
|
|
|
|
|
|
| ||||||||||
Real estate properties |
| 6.72 | % |
| 2.32 | % |
| 5.12 | % |
| 0.93 | % |
| 4.61 | % |
| 3.62 | % |
| 6.72 | % |
| 2.32 | % |
| 5.12 | % |
| 0.93 | % | ||
Securities |
| 77.63 | % |
| 143.47 | % |
| 71.83 | % |
| 52.08 | % |
| 40.62 | % | |||||||||||||||||
Thousands of Accumulation Units outstanding at end of year |
| 42,623 |
| 33,338 |
| 24,724 |
| 20,347 |
| 18,456 |
| |||||||||||||||||||||
Marketable securities |
| 51.05 | % |
| 77.63 | % |
| 143.47 | % |
| 71.83 | % |
| 52.08 | % | |||||||||||||||||
Accumulation Units outstanding at end of year (in thousands) |
| 50,146 |
| 42,623 |
| 33,338 |
| 24,724 |
| 20,347 |
| |||||||||||||||||||||
Net assets end of year (in thousands) |
| $ | 10,548,711 |
| $ | 7,245,550 |
| $ | 4,793,422 |
| $ | 3,675,989 |
| $ | 3,213,667 |
|
| $ | 14,132,693 |
| $ | 10,548,711 |
| $ | 7,245,550 |
| $ | 4,793,422 |
| $ | 3,675,989 |
|
| ||||||||||||||||||||||||||||||||
|
|
(1) | Expense charges per Accumulation Unit and the Ratio of Expenses to Average Net Assets exclude real estate property level expenses. If the real estate property level expenses were included, the expense charge per Accumulation Unit for the year ended December 31, |
90 100|ProspectusTIAA Real Estate Account
|
|
Notes to financial statements |
|
Note 7—7 – Accumulation Units
Changes in the number of Accumulation Units outstanding were as follows:
|
| For the Years Ended December 31, |
|
|
|
|
|
|
|
|
|
|
| |||||||
|
|
| For the Years Ended December 31, |
| ||||||||||||||||
|
| 2005 |
| 2004 |
| 2003 |
|
|
| |||||||||||
| 2006 |
| 2005 |
| 2004 |
| ||||||||||||||
Accumulation Units: |
|
|
|
|
|
|
| |||||||||||||
| ||||||||||||||||||||
Credited for premiums |
| 4,335,121 |
| 3,746,093 |
| 2,860,354 |
|
| 4,056,196 |
| 4,335,121 |
| 3,746,093 |
| ||||||
Credited (cancelled) for transfers, net disbursements and amounts applied to the Annuity Fund |
| 4,950,773 |
| 4,867,321 |
| 1,517,133 |
| |||||||||||||
Net units credited for transfers, net disbursements and amounts applied to the Annuity Fund |
| 3,466,667 |
| 4,950,773 |
| 4,867,321 |
| |||||||||||||
Outstanding: |
|
|
|
|
|
|
|
|
|
|
|
|
|
| ||||||
Beginning of year |
| 33,337,597 |
| 24,724,183 |
| 20,346,696 |
|
| 42,623,491 |
| 33,337,597 |
| 24,724,183 |
| ||||||
| ||||||||||||||||||||
End of year |
| 42,623,491 |
| 33,337,597 |
| 24,724,183 |
|
| 50,146,354 |
| 42,623,491 |
| 33,337,597 |
| ||||||
| ||||||||||||||||||||
Note 8—8–Commitments and Subsequent Events
During the normal course of business, the Account enters into discussions and agreements to purchase or sell real estate properties.property investments. As of December 31, 2005,2006, the Account had two outstanding commitments in the total gross amount of approximately $2.8 billion to purchase two property investments: i) a bulk distribution warehouse propertyportfolio of existing retail properties, which are located predominately in the Southeastern United States, for approximately $34.7 million (which has closed subsequent to December 31, 2005) and a mixed use project comprised of an office building and a retail component for a total net amount of $85 million. This property will be$2.5 billion, subject to approximately $112.7 million in debt. Subsequent to December 31, 2005, the Account placed approximately $153 million$1.5 billion in debt, on Lincoln Centre which was purchasedand ii) a retail property located in France for approximately $263.7 million. The retail portfolio will be acquired through the 4th quarterAccount’s investment in a newly-formed joint venture. The amounts disclosed above represent the Account’s share of 2005.the retail portfolio and the related debt, and the Account’s share of the joint venture will be a non-controlling 85% interest. The acquisition of the retail portfolio and the French property closed in February and March of 2007, respectively.
In addition, the Account hashad outstanding commitments to purchase interests in six limited partnerships, and to purchase shareswhich totaled approximately $366.7 million in a private real estate equity investment trusts, which total $366.7 million.the aggregate. As of December 31, 2005, $101.32006, approximately $43.9 million remains to be funded under these commitments.
Other than lawsuits in the ordinary course of business that are expected to have no material impact, there are no lawsuits into which the Account is a party.
Note 9–New Accounting Pronouncements
In June 2006, the Financial Accounting Standards Board (“FASB”) issued FASB Interpretation (“FIN”) 48, an interpretation of FASB Statement No. 109, “Accounting for Income Taxes.” FIN 48 clarifies the accounting for uncertainty in income taxes recognized in an enterprise’s financial statements and is effective for fiscal years beginning after December 31, 2006. The Account does not expect FIN 48 to have a significant impact on the Account’s financial position or results of operations.
In September 2006, FASB issued Statement No. 157, “Fair Value Measurements.” This Statement defines fair value, establishes a framework for measuring fair value in generally accepted accounting principles, and requires additional disclosures
TIAA Real Estate AccountProspectus|| 91101
|
|
|
|
|
|
|
|
|
|
|
|
|
| VALUE |
| ||||
|
| ||||||
LOCATION/DESCRIPTION |
| 2005 |
| 2004 |
| ||
| |||||||
REAL ESTATE PROPERTIES—69.46% AND 69.78% |
|
|
|
|
|
|
|
ALABAMA: |
|
|
|
|
|
|
|
Inverness Center—Office building |
| $ | 98,090,987 |
| $ | — |
|
ARIZONA: |
|
|
|
|
|
|
|
Biltmore Commerce Center—Office building |
|
| — |
|
| 34,104,182 |
|
Mountain RA Industrial Portfolio—Industrial building |
|
| 5,754,652 |
|
| 5,513,947 |
|
CALIFORNIA: |
|
|
|
|
|
|
|
3 Hutton Centre Drive—Office building |
|
| 48,349,580 |
|
| 41,106,333 |
|
9 Hutton Centre—Office building |
|
| 26,746,837 |
|
| 23,169,449 |
|
50 Fremont—Office building |
|
| 373,010,003 | (1) |
| 323,264,602 | (1) |
88 Kearny Street—Office building |
|
| 81,567,474 |
|
| 69,026,718 |
|
Cabot Industrial Portfolio—Industrial building |
|
| 77,000,000 |
|
| — |
|
Capitol Place—Office building |
|
| 48,000,000 |
|
| 42,400,000 |
|
Centerside I—Office building |
|
| 66,000,000 |
|
| 65,037,900 |
|
Centre Pointe and Valley View—Industrial building |
|
| 28,000,000 |
|
| 25,329,023 |
|
Eastgate Distribution Center—Industrial building |
|
| 22,000,000 |
|
| 18,800,000 |
|
Embarcadero Center West—Office building |
|
| 205,965,261 |
|
| — |
|
Kenwood Mews—Apartments |
|
| 30,000,000 |
|
| 27,700,000 |
|
Larkspur Courts—Apartments |
|
| 86,000,000 |
|
| 66,000,000 |
|
The Legacy at Westwood—Apartments |
|
| 100,000,000 |
|
| 90,750,000 |
|
Northern CA RA Industrial Portfolio—Industrial building |
|
| 62,325,024 |
|
| 59,169,642 |
|
Northpoint Commerce Center—Industrial building |
|
| — |
|
| 46,000,000 |
|
Ontario Industrial Portfolio—Industrial building |
|
| 230,000,000 | (1) |
| 187,079,256 | (1) |
Regents Court—Apartments |
|
| 62,500,000 |
|
| 56,700,000 |
|
Southern CA RA Industrial Portfolio—Industrial building |
|
| 89,017,793 |
|
| 89,097,299 |
|
U.S. Bank Plaza—Office building |
|
| 159,000,000 |
|
| — |
|
Westcreek—Apartments |
|
| 30,939,671 |
|
| 28,161,865 |
|
West Lake North Business Park—Office building |
|
| 57,600,000 |
|
| 50,021,000 |
|
Westwood Marketplace—Shopping center |
|
| 86,000,000 |
|
| 80,019,410 |
|
COLORADO: |
|
|
|
|
|
|
|
The Lodge at Willow Creek—Apartments |
|
| 34,600,000 |
|
| 32,201,274 |
|
The Market at Southpark—Shopping center |
|
| 34,001,746 |
|
| 33,522,400 |
|
Monte Vista—Apartments |
|
| 24,647,901 |
|
| 22,501,650 |
|
Palomino Park—Apartments |
|
| 176,232,394 |
|
| — |
|
CONNECTICUT: |
|
|
|
|
|
|
|
Ten & Twenty Westport Road—Office building |
|
| 157,000,000 |
|
| 148,000,000 |
|
DELAWARE: |
|
|
|
|
|
|
|
Mideast RA Industrial Portfolio—Industrial building |
|
| 14,258,555 |
|
| 16,543,121 |
|
FLORIDA: |
|
|
|
|
|
|
|
701 Brickell—Office building |
|
| 201,173,724 |
|
| 177,000,000 |
|
4200 West Cypress Street—Office building |
|
| 36,691,519 |
|
| 33,900,000 |
|
The Fairways of Carolina—Apartments |
|
| 21,100,000 |
|
| 18,100,000 |
|
Golfview—Apartments |
|
| 30,835,506 |
|
| 28,543,437 |
|
The Greens at Metrowest—Apartments |
|
| 18,200,000 |
|
| 14,623,330 |
|
Maitland Promenade One—Office building |
|
| 37,817,891 |
|
| 36,053,639 |
|
Plantation Grove—Shopping center |
|
| 13,800,000 |
|
| 11,200,000 |
|
Pointe on Tampa Bay—Office building |
|
| 44,711,876 |
|
| 40,551,310 |
|
about fair value measurements. This Statement does not require any new fair value measurements, but the application of this Statement could change current practices in determining fair value. The Account plans to adopt this guidance effective January 1, 2008. The Account is currently assessing the impact of Statement No. 157 but does not expect it to have a significant impact on the Account’s financial position or results of operations when implemented.
In February 2007, FASB issued Statement No. 159, “The Fair Value Option for Financial Assets and Financial Liabilities.” This Statement permits entities to choose to measure many financial instruments and certain other items at fair value and is expected to expand the use of fair value measurement. The Statement is effective for fiscal years beginning after November 15, 2007. The Account is currently assessing the impact of Statement No. 159 on the Account’s financial position and results of operations.
92 102|ProspectusTIAA Real Estate Account
|
|
|
TIAA Real Estate Account |
| |
|
|
|
|
|
|
|
|
|
|
|
|
| VALUE |
| ||||
|
| ||||||
LOCATION/DESCRIPTION |
| 2005 |
| 2004 |
| ||
|
|
|
|
|
|
|
|
Quiet Waters at Coquina Lakes—Apartments |
| $ | 20,912,293 |
| $ | 19,200,000 |
|
Royal St. George—Apartments |
|
| 21,400,000 |
|
| 19,400,000 |
|
Sawgrass Office Portfolio—Office building |
|
| 59,700,000 |
|
| 52,000,000 |
|
South Florida Apartment Portfolio—Apartments |
|
| 56,400,000 |
|
| 47,700,000 |
|
Suncrest Village—Shopping center |
|
| 16,400,000 |
|
| — |
|
Urban Centre—Office building |
|
| 106,007,400 |
|
| — |
|
GEORGIA: |
|
|
|
|
|
|
|
Alexan Buckhead—Apartments |
|
| 34,800,000 |
|
| 37,500,000 |
|
Atlanta Industrial Portfolio—Industrial building |
|
| 73,825,000 |
|
| 37,750,840 |
|
Reserve at Sugarloaf—Apartments |
|
| 44,800,000 | (1) |
| — |
|
Glenridge Walk—Apartments |
|
| 45,300,000 |
|
| — |
|
1050 Lenox Park—Apartments |
|
| 71,000,000 |
|
| — |
|
Shawnee Ridge Industrial Portfolio—Industrial building |
|
| 44,418,860 |
|
| — |
|
ILLINOIS: |
|
|
|
|
|
|
|
Chicago CalEast Industrial Portfolio- Industrial building |
|
| 74,622,731 |
|
| 42,000,000 |
|
Chicago Industrial Portfolio—Industrial building |
|
| 72,000,000 |
|
| 70,002,239 |
|
Columbia Centre III—Office building |
|
| 28,700,000 |
|
| 28,900,000 |
|
East North Central RA Industrial Portfolio- Industrial building |
|
| 37,717,159 |
|
| 23,734,331 |
|
Oak Brook Regency Towers—Office building |
|
| 73,400,000 |
|
| 68,400,000 |
|
Parkview Plaza—Office building |
|
| 54,500,000 |
|
| 48,700,000 |
|
Rolling Meadows—Shopping center |
|
| — |
|
| 15,750,000 |
|
KENTUCKY: |
|
|
|
|
|
|
|
IDI Kentucky Portfolio—Industrial building |
|
| 58,500,000 |
|
| 49,000,000 |
|
MARYLAND: |
|
|
|
|
|
|
|
Corporate Boulevard—Office building |
|
| — |
|
| 65,038,710 |
|
FEDEX Distribution Facility—Industrial building |
|
| 8,500,000 |
|
| 8,200,000 |
|
GE Appliance East Coast Distribution Facility—Industrial building |
|
| 46,470,475 |
|
| — |
|
MASSACHUSETTS: |
|
|
|
|
|
|
|
99 High Street—Office building |
|
| 276,266,900 | (1) |
| — |
|
Batterymarch Park II—Office building |
|
| 11,472,283 |
|
| 10,700,000 |
|
Longwood Towers—Apartments |
|
| — |
|
| 82,500,000 |
|
Needham Corporate Center—Office building |
|
| 17,143,612 |
|
| 15,030,046 |
|
Northeast RA Industrial Portfolio—Industrial building |
|
| 29,000,000 |
|
| 33,110,903 |
|
MICHIGAN: |
|
|
|
|
|
|
|
Indian Creek—Apartments |
|
| — |
|
| 18,825,000 |
|
MINNESOTA: |
|
|
|
|
|
|
|
Interstate Crossing—Industrial building |
|
| — |
|
| 7,300,000 |
|
River Road Distribution Center—Industrial building |
|
| — |
|
| 4,600,000 |
|
NEVADA: |
|
|
|
|
|
|
|
UPS Distribution Facility—Industrial building |
|
| 15,000,000 |
|
| 12,900,000 |
|
NEW JERSEY: |
|
|
|
|
|
|
|
10 Waterview Boulevard—Office building |
|
| 27,500,000 |
|
| 26,400,000 |
|
371 Hoes Lane—Office building |
|
| 11,700,000 |
|
| 10,666,570 |
|
Konica Photo Imaging Headquarters—Industrial building |
|
| 25,300,000 |
|
| 21,200,000 |
|
Morris Corporate Center III—Office building |
|
| 97,400,000 |
|
| 82,300,000 |
|
NJ CalEast Industrial Portfolio—Industrial building |
|
| 42,000,000 |
|
| 39,300,000 |
|
Plainsboro Plaza—Shopping center |
|
| 50,745,252 |
|
| — |
|
|
|
|
|
|
|
|
|
|
| VALUE |
| ||||
|
|
| |||||
LOCATION/DESCRIPTION |
| 2006 |
| 2005 |
| ||
| |||||||
| |||||||
REAL ESTATE PROPERTIES—69.27% AND 69.46% |
|
|
|
|
|
|
|
|
|
|
|
|
|
|
|
ALABAMA: |
|
|
|
|
|
|
|
Inverness Center—Office building |
| $ | 112,256,914 |
| $ | 98,090,987 |
|
ARIZONA: |
|
|
|
|
|
|
|
Kierland Apartment Portfolio—Apartments |
|
| 206,100,000 |
|
| — |
|
Mountain RA Industrial Portfolio—Industrial building |
|
| 6,605,429 |
|
| 5,754,652 |
|
Phoenix Apartment Portfolio—Apartments |
|
| 182,900,000 |
|
| — |
|
CALIFORNIA: |
|
|
|
|
|
|
|
3 Hutton Centre Drive—Office building |
|
| 59,011,323 |
|
| 48,349,580 |
|
9 Hutton Centre—Office building |
|
| 29,000,000 |
|
| 26,746,837 |
|
50 Fremont—Office building |
|
| 421,000,000 | (1) |
| 373,010,003 | (1) |
88 Kearny Street—Office building |
|
| 90,310,024 |
|
| 81,567,474 |
|
980 9th Street and 1010 8th Street—Office building |
|
| 168,000,000 |
|
| 159,000,000 |
|
1900 South Burgundy Place —Industrial building |
|
| 28,045,226 |
|
| — |
|
Cabot Industrial Portfolio—Industrial building |
|
| 88,200,000 |
|
| 77,000,000 |
|
Capitol Place—Office building |
|
| 50,331,828 |
|
| 48,000,000 |
|
Centerside I—Office building |
|
| 67,000,000 |
|
| 66,000,000 |
|
Centre Pointe and Valley View—Industrial building |
|
| 32,385,980 |
|
| 28,000,000 |
|
Eastgate Distribution Center —Industrial building |
|
| 25,558,962 |
|
| 22,000,000 |
|
Embarcadero Center West—Office building |
|
| 231,000,000 |
|
| 205,965,261 |
|
Kenwood Mews—Apartments |
|
| — |
|
| 30,000,000 |
|
Larkspur Courts—Apartments |
|
| 93,043,346 |
|
| 86,000,000 |
|
Northern CA RA Industrial Portfolio—Industrial building |
|
| 71,317,741 |
|
| 62,325,024 |
|
Ontario Industrial Portfolio—Industrial building |
|
| 270,000,000 | (1) |
| 230,000,000 | (1) |
Regents Court—Apartments |
|
| 67,800,000 |
|
| 62,500,000 |
|
Southern CA RA Industrial Portfolio—Industrial building |
|
| 97,558,473 |
|
| 89,017,793 |
|
The Legacy at Westwood—Apartments |
|
| 110,231,593 |
|
| 100,000,000 |
|
Weber Distribution—Industrial building |
|
| 20,800,000 |
|
| — |
|
Wellpoint—Office building |
|
| 49,000,000 |
|
| — |
|
Westcreek—Apartments |
|
| 35,300,000 |
|
| 30,939,671 |
|
West Lake North Business Park—Office building |
|
| 61,000,000 |
|
| 57,600,000 |
|
Westwood Marketplace—Shopping center |
|
| 91,467,954 |
|
| 86,000,000 |
|
Wilshire Rodeo Plaza—Office building |
|
| 204,084,734 | (1) |
| — |
|
COLORADO: |
|
|
|
|
|
|
|
Monte Vista—Apartments |
|
| — |
|
| 24,647,901 |
|
Palomino Park—Apartments |
|
| 184,000,000 |
|
| 176,232,394 |
|
The Lodge at Willow Creek—Apartments |
|
| 39,501,399 |
|
| 34,600,000 |
|
The Market at Southpark—Shopping center |
|
| 35,800,000 |
|
| 34,001,746 |
|
CONNECTICUT: |
|
|
|
|
|
|
|
Ten & Twenty Westport Road—Office building |
|
| 175,000,000 |
|
| 157,000,000 |
|
DELAWARE: |
|
|
|
|
|
|
|
Mideast RA Industrial Portfolio—Industrial building |
|
| 16,014,758 |
|
| 14,258,555 |
|
FLORIDA: |
|
|
|
|
|
|
|
701 Brickell—Office building |
|
| 231,239,379 |
|
| 201,173,724 |
|
4200 West Cypress Street—Office building |
|
| 43,100,425 |
|
| 36,691,519 |
|
Golfview—Apartments |
|
| — |
|
| 30,835,506 |
|
Maitland Promenade One—Office building |
|
| — |
|
| 37,817,891 |
|
Plantation Grove—Shopping center |
|
| 15,010,406 |
|
| 13,800,000 |
|
Pointe on Tampa Bay—Office building |
|
| 50,573,824 |
|
| 44,711,876 |
|
TIAA Real Estate AccountProspectus|| 93103
|
|
|
Statement of investments| | TIAA Real Estate Account | continued |
|
|
|
|
|
|
|
|
|
| VALUE |
| ||||
|
|
| |||||
LOCATION/DESCRIPTION |
| 2006 |
| 2005 |
| ||
| |||||||
|
|
|
|
|
|
|
|
Publix at Weston Commons—Shopping center |
| $ | 54,411,436 | (1) | $ | — |
|
Quiet Waters at Coquina Lakes—Apartments |
|
| 24,006,100 |
|
| 20,912,293 |
|
Royal St. George—Apartments |
|
| 25,000,000 |
|
| 21,400,000 |
|
Sawgrass Office Portfolio—Office building |
|
| 72,000,000 |
|
| 59,700,000 |
|
South Florida Apartment Portfolio—Apartments |
|
| 65,099,785 |
|
| 56,400,000 |
|
Suncrest Village—Shopping center |
|
| 17,009,378 |
|
| 16,400,000 |
|
The Fairways of Carolina—Apartments |
|
| 25,309,965 |
|
| 21,100,000 |
|
The Greens at Metrowest—Apartments |
|
| 21,011,825 |
|
| 18,200,000 |
|
The North 40 Office Complex—Office building |
|
| 63,500,000 |
|
| — |
|
Urban Centre—Office building |
|
| 121,000,000 |
|
| 106,007,400 |
|
GEORGIA: |
|
|
|
|
|
|
|
1050 Lenox Park—Apartments |
|
| 79,470,836 |
|
| 71,000,000 |
|
Alexan Buckhead—Apartments |
|
| — |
|
| 34,800,000 |
|
Atlanta Industrial Portfolio—Industrial building |
|
| 77,863,416 |
|
| 73,825,000 |
|
Glenridge Walk—Apartments |
|
| 48,710,574 |
|
| 45,300,000 |
|
Reserve at Sugarloaf—Apartments |
|
| 49,500,000 | (1) |
| 44,800,000 | (1) |
Shawnee Ridge Industrial Portfolio—Industrial building |
|
| 76,117,193 |
|
| 44,418,860 |
|
ILLINOIS: |
|
|
|
|
|
|
|
Chicago Caleast Industrial Portfolio—Industrial building |
|
| 74,999,590 |
|
| 74,622,731 |
|
Chicago Industrial Portfolio—Industrial building |
|
| 89,104,640 |
|
| 72,000,000 |
|
Columbia Centre III—Office building |
|
| — |
|
| 28,700,000 |
|
East North Central RA Industrial Portfolio—Industrial building |
|
| 37,503,284 |
|
| 37,717,159 |
|
Oak Brook Regency Towers—Office building |
|
| 83,200,000 |
|
| 73,400,000 |
|
Parkview Plaza—Office building |
|
| 59,400,000 |
|
| 54,500,000 |
|
KENTUCKY: |
|
|
|
|
|
|
|
IDI Kentucky Portfolio—Industrial building |
|
| 66,552,034 |
|
| 58,500,000 |
|
MARYLAND: |
|
|
|
|
|
|
|
Broadlands Business Park—Industrial building |
|
| 35,002,731 |
|
| — |
|
FEDEX Distribution Facility—Industrial building |
|
| 8,500,000 |
|
| 8,500,000 |
|
GE Appliance East Coast Distribution Facility—Industrial building |
|
| 48,000,000 |
|
| 46,470,475 |
|
MASSACHUSETTS: |
|
|
|
|
|
|
|
99 High Street—Office building |
|
| 291,806,564 | (1) |
| 276,266,900 | (1) |
Batterymarch Park II—Office building |
|
| 13,234,314 |
|
| 11,472,283 |
|
Needham Corporate Center—Office building |
|
| 22,712,550 |
|
| 17,143,612 |
|
Northeast RA Industrial Portfolio—Industrial building |
|
| 30,900,000 |
|
| 29,000,000 |
|
The Newbry—Office building |
|
| 370,745,525 |
|
| — |
|
NEVADA: |
|
|
|
|
|
|
|
UPS Distribution Facility—Industrial building |
|
| 15,000,000 |
|
| 15,000,000 |
|
NEW JERSEY: |
|
|
|
|
|
|
|
10 Waterview Boulevard—Office building |
|
| 32,100,000 |
|
| 27,500,000 |
|
371 Hoes Lane—Office building |
|
| — |
|
| 11,700,000 |
|
Konica Photo Imaging Headquarters—Industrial building |
|
| 23,100,000 |
|
| 25,300,000 |
|
Marketfair—Shopping center |
|
| 94,058,427 |
|
| — |
|
Morris Corporate Center III—Office building |
|
| 114,857,104 |
|
| 97,400,000 |
|
NJ Caleast Industrial Portfolio—Industrial building |
|
| 41,920,988 |
|
| 42,000,000 |
|
Plainsboro Plaza—Shopping center |
|
| 50,900,000 |
|
| 50,745,252 |
|
South River Road Industrial—Industrial building |
|
| 60,600,000 |
|
| 55,000,000 |
|
104|ProspectusTIAA Real Estate Account
Statement of investments| | TIAA Real Estate Account | continued |
|
|
|
|
|
|
|
|
|
| VALUE |
| ||||
|
|
| |||||
LOCATION/DESCRIPTION |
| 2006 |
| 2005 |
| ||
| |||||||
|
|
|
|
|
|
|
|
NEW YORK: |
|
|
|
|
|
|
|
780 Third Avenue—Office building |
| $ | 298,000,000 |
| $ | 230,000,000 |
|
The Colorado—Apartments |
|
| 100,000,000 |
|
| 85,048,163 |
|
OHIO: |
|
|
|
|
|
|
|
Columbus Portfolio—Office building |
|
| 24,600,000 |
|
| 23,000,000 |
|
PENNSYLVANIA: |
|
|
|
|
|
|
|
Lincoln Woods—Apartments |
|
| 37,781,555 |
|
| 35,528,316 |
|
TENNESSEE: |
|
|
|
|
|
|
|
Airways Distribution Center—Industrial building |
|
| 24,857,278 |
|
| — |
|
Memphis Caleast Industrial Portfolio—Industrial building |
|
| 52,500,000 |
|
| 54,000,000 |
|
Summit Distribution Center—Industrial building |
|
| 26,300,000 |
|
| 25,900,000 |
|
TEXAS: |
|
|
|
|
|
|
|
Butterfield Industrial Park—Industrial building |
|
| 5,100,000 | (2) |
| 4,618,955 | (2) |
Dallas Industrial Portfolio—Industrial building |
|
| 153,210,519 |
|
| 146,000,000 |
|
Four Oaks Place—Office building |
|
| 306,200,984 |
|
| 295,239,109 |
|
Houston Apartment Portfolio—Apartments |
|
| 306,042,523 |
|
| — |
|
Lincoln Centre—Office building |
|
| 270,000,000 | (1) |
| 255,311,299 |
|
Park Place on Turtle Creek—Office building |
|
| 44,573,669 |
|
| — |
|
Pinnacle Industrial /DFW Trade Center—Industrial building |
|
| 45,874,807 |
|
| — |
|
South Frisco Village—Shopping center |
|
| 47,014,065 | (1) |
| — |
|
The Caruth—Apartments |
|
| 60,007,237 |
|
| 61,200,000 |
|
The Legends at Chase Oaks—Apartments |
|
| 29,025,236 |
|
| 28,499,971 |
|
The Maroneal—Apartments |
|
| 39,113,694 |
|
| 35,000,000 |
|
UNITED KINGDOM: |
|
|
|
|
|
|
|
1& 7 Westferry Circus—Office building |
|
| 428,574,628 | (1) |
| 373,116,817 | (1) |
UTAH: |
|
|
|
|
|
|
|
Landmark at Salt Lake City (Building #4)—Industrial building |
|
| 16,509,871 |
|
| 14,700,000 |
|
VIRGINIA: |
|
|
|
|
|
|
|
8270 Greensboro Drive—Office building |
|
| 62,000,000 |
|
| 60,200,000 |
|
Ashford Meadows—Apartments |
|
| 89,091,341 |
|
| 78,904,526 |
|
Fairgate at Ballston—Office building |
|
| — |
|
| 35,300,000 |
|
Monument Place—Office building |
|
| 58,600,000 |
|
| 53,000,000 |
|
One Virginia Square—Office building |
|
| 53,000,000 |
|
| 47,000,000 |
|
The Ellipse at Ballston—Office building |
|
| 85,439,350 |
|
| — |
|
WASHINGTON: |
|
|
|
|
|
|
|
Creeksides at Centerpoint—Office building |
|
| 40,508,139 |
|
| — |
|
IDX Tower—Office building |
|
| 398,990,017 | (1) |
| 370,000,000 | (1) |
Millennium Corporate Park—Office building |
|
| 139,107,181 |
|
| — |
|
Northwest RA Industrial Portfolio—Industrial building |
|
| 20,684,499 |
|
| 19,700,000 |
|
Rainier Corporate Park—Industrial building |
|
| 69,362,219 |
|
| 64,273,372 |
|
Regal Logistics Campus—Industrial building |
|
| 66,000,000 |
|
| 63,103,879 |
|
WASHINGTON DC: |
|
|
|
|
|
|
|
1001 Pennsylvania Avenue—Office building |
|
| 552,502,209 | (1) |
| 502,993,710 | (1) |
1015 15th Street—Office building |
|
| — |
|
| 73,121,166 |
|
1401 H Street, NW—Office building |
|
| 207,806,286 | (1) |
| — |
|
1900 K Street—Office building |
|
| 255,002,226 |
|
| 230,000,000 |
|
Mazza Gallerie—Shopping center |
|
| 86,350,179 |
|
| 86,001,109 |
|
|
|
|
| ||||
TOTAL REAL ESTATE PROPERTIES |
|
|
|
|
|
|
|
(Cost $9,462,471,032 and $7,355,833,152) |
|
| 10,743,487,689 |
|
| 7,977,600,751 |
|
|
|
|
| ||||
TIAA Real Estate AccountProspectus|105
| ||
Statement of investments | | TIAA Real Estate Account | continued |
|
|
|
|
|
|
|
|
|
| VALUE |
| ||||
|
| ||||||
LOCATION/DESCRIPTION |
| 2005 |
| 2004 |
| ||
|
|
|
|
|
|
|
|
South River Road Industrial—Industrial building |
| $ | 55,000,000 |
| $ | 34,900,000 |
|
NEW YORK: |
|
|
|
|
|
|
|
780 Third Avenue—Office building |
|
| 230,000,000 |
|
| 197,000,000 |
|
The Colorado—Apartments |
|
| 85,048,163 |
|
| 58,156,056 |
|
OHIO: |
|
|
|
|
|
|
|
Bent Tree—Apartments |
|
| — |
|
| 13,600,000 |
|
Columbus Portfolio—Office building |
|
| 23,000,000 |
|
| 21,500,000 |
|
OREGON: |
|
|
|
|
|
|
|
Five Centerpointe—Office building |
|
| — |
|
| 14,500,000 |
|
PENNSYLVANIA: |
|
|
|
|
|
|
|
Lincoln Woods—Apartments |
|
| 35,528,316 |
|
| 31,472,870 |
|
TENNESSEE: |
|
|
|
|
|
|
|
Memphis CalEast Industrial Portfolio—Industrial building |
|
| 54,000,000 |
|
| 47,400,000 |
|
Summit Distribution Center—Industrial building |
|
| 25,900,000 |
|
| 23,800,000 |
|
TEXAS: |
|
|
|
|
|
|
|
Butterfield Industrial Park—Industrial building |
|
| 4,618,955 | (2) |
| 4,600,000 | (2) |
Dallas Industrial Portfolio—Industrial building |
|
| 146,000,000 |
|
| 138,500,000 |
|
Four Oaks Place—Office building |
|
| 295,239,109 |
|
| 255,357,238 |
|
The Caruth—Apartments |
|
| 61,200,000 |
|
| — |
|
The Legends at Chase Oaks—Apartments |
|
| 28,499,971 |
|
| 27,051,851 |
|
Lincoln Centre—Office building |
|
| 255,311,299 |
|
| — |
|
The Maroneal—Apartments |
|
| 35,000,000 |
|
| — |
|
UNITED KINGDOM: |
|
|
|
|
|
|
|
1 & 7 Westferry Circus—Office building |
|
| 373,116,817 | (1) |
| — |
|
UTAH: |
|
|
|
|
|
|
|
Landmark at Salt Lake City (Building #4)—Industrial building |
|
| 14,700,000 |
|
| 12,500,000 |
|
VIRGINIA: |
|
|
|
|
|
|
|
8270 Greensboro Drive—Office building |
|
| 60,200,000 |
|
| — |
|
Ashford Meadows—Apartments |
|
| 78,904,526 |
|
| 68,000,000 |
|
Fairgate at Ballston—Office building |
|
| 35,300,000 |
|
| 28,500,017 |
|
Monument Place—Office building |
|
| 53,000,000 |
|
| 37,000,000 |
|
One Virginia Square—Office building |
|
| 47,000,000 |
|
| 42,500,000 |
|
WASHINGTON: |
|
|
|
|
|
|
|
IDX Tower—Office building |
|
| 370,000,000 | (1) |
| 347,978,282 | (1) |
Northwest RA Industrial Portfolio—Industrial building |
|
| 19,700,000 |
|
| 19,438,852 |
|
Rainier Corporate Park—Industrial building |
|
| 64,273,372 |
|
| 56,035,878 |
|
Regal Logistics Campus—Industrial building |
|
| 63,103,879 |
|
| — |
|
WASHINGTON DC: |
|
|
|
|
|
|
|
1001 Pennsylvania Avenue—Office building |
|
| 502,993,710 | (1) |
| 466,424,940 | (1) |
1015 15th Street—Office building |
|
| 73,121,166 |
|
| 59,000,134 |
|
1900 K Street—Office building |
|
| 230,000,000 |
|
| 219,453,706 |
|
The Farragut Building—Office building |
|
| — |
|
| 46,500,000 |
|
Mazza Gallerie—Shopping center |
|
| 86,001,109 |
|
| 81,000,000 |
|
|
|
|
| ||||
TOTAL REAL ESTATE PROPERTIES |
|
|
|
|
|
|
|
(Cost $7,386,769,868 and $5,315,565,355) |
|
| 7,977,600,751 |
|
| 5,391,469,250 |
|
|
|
|
| ||||
|
|
|
|
|
|
|
|
|
| VALUE |
| ||||
|
|
| |||||
LOCATION/DESCRIPTION |
| 2006 |
| 2005 |
| ||
| |||||||
|
|
|
|
|
|
|
|
REAL ESTATE JOINT VENTURES AND |
|
|
|
|
|
|
|
LIMITED PARTNERSHIPS—12.56% AND 12.35% |
|
|
|
|
|
|
|
|
|
|
|
|
|
|
|
REAL ESTATE JOINT VENTURES—10.76% AND 10.64% |
|
|
|
|
|
|
|
|
|
|
|
|
|
|
|
CA—Colorado Center LP |
|
|
|
|
|
|
|
Yahoo Center (50% Account Interest) |
| $ | 187,766,625 | (4) | $ | 138,531,366 | (4) |
CA—Treat Towers LP |
|
|
|
|
|
|
|
Treat Towers (75% Account Interest) |
|
| 94,023,131 |
|
| 93,964,192 |
|
GA—Buckhead LLC |
|
|
|
|
|
|
|
Prominence in Buckhead (75% Account Interest) |
|
| 107,256,320 |
|
| 97,142,406 |
|
Florida Mall Associates, Ltd. |
|
|
|
|
|
|
|
The Florida Mall (50% Account Interest) |
|
| 237,919,775 | (4) |
| 208,013,192 | (4) |
IL—161 Clark Street LLC |
|
|
|
|
|
|
|
161 North Clark Street (75% Account Interest) |
|
| 189,183,793 |
|
| 175,578,714 |
|
One Boston Place REIT |
|
|
|
|
|
|
|
One Boston Place (50.25% Account Interest) |
|
| 177,900,327 |
|
| 149,723,498 |
|
Storage Portfolio I, LLC |
|
|
|
|
|
|
|
Storage Portfolio(3) (75% Account Interest) |
|
| 74,864,074 | (4) |
| 63,237,298 | (4) |
Strategic Ind Portfolio I, LLC |
|
|
|
|
|
|
|
IDI Nationwide Industrial Portfolio(3) (60% Account Interest) |
|
| 70,348,753 | (4) |
| 66,871,766 | (4) |
Teachers REA IV, LLC |
|
|
|
|
|
|
|
Tyson’s Executive Plaza II (50% Account Interest) |
|
| 40,570,382 |
|
| 34,032,806 |
|
TREA Florida Retail, LLC |
|
|
|
|
|
|
|
Florida Retail Portfolio (80% Account Interest) |
|
| 265,396,677 |
|
| — |
|
West Dade Associates |
|
|
|
|
|
|
|
Miami International Mall (50% Account Interest) |
|
| 97,300,131 | (4) |
| 82,290,482 | (4) |
West Town Mall, LLC |
|
|
|
|
|
|
|
West Town Mall (50% Account Interest) |
|
| 126,214,963 | (4) |
| 112,650,844 | (4) |
|
|
|
| ||||
TOTAL REAL ESTATE JOINT VENTURES |
|
|
|
|
|
|
|
(Cost $1,168,027,179 and $888,034,873) |
|
| 1,668,744,951 |
|
| 1,222,036,564 |
|
|
|
|
| ||||
|
|
|
|
|
|
|
|
LIMITED PARTNERSHIPS—1.80% AND 1.71% |
|
|
|
|
|
|
|
|
|
|
|
|
|
|
|
Cobalt Industrial Reit (11.0131% Account Interest) |
|
| 26,506,381 |
|
| 8,352,409 |
|
Colony Realty Partners Lp (5.27% Account Interest) |
|
| 26,382,659 |
|
| 13,481,704 |
|
Essex Property Trust, Inc. (10% Account Interest) |
|
| — |
|
| 487,306 |
|
Heitman Value Partners Fund (8.43% Account Interest) |
|
| 24,578,388 |
|
| 8,106,810 |
|
Lion Gables Apartment Fund (18.45% Account Interest) |
|
| 179,013,211 |
|
| 150,000,000 |
|
Mezz Fund (19.75% Account Interest) |
|
| 454,319 |
|
| 1,975,927 |
|
Mony/Transwestern Mezz RP (16.67% Account Interest) |
|
| 22,348,093 |
|
| 14,142,822 |
|
|
|
|
| ||||
TOTAL LIMITED PARTNERSHIPS |
|
|
|
|
|
|
|
(Cost $245,295,745 and $198,006,414) |
|
| 279,283,051 |
|
| 196,546,978 |
|
|
|
|
| ||||
TOTAL REAL ESTATE JOINT VENTURES AND LIMITED PARTNERSHIPS |
|
|
|
|
|
|
|
(Cost $1,413,322,924 and $1,086,041,287) |
|
| 1,948,028,002 |
|
| 1,418,583,542 |
|
|
|
|
| ||||
94 106|ProspectusTIAA Real Estate Account
Statement of investments| | TIAA Real Estate Account | continued |
|
|
|
|
|
|
|
|
|
|
|
|
|
|
SHARES |
|
|
|
| VALUE |
| |||||||
|
|
|
|
| |||||||||
2006 |
| 2005 |
| ISSUER |
|
| 2006 |
|
| 2005 |
| ||
| |||||||||||||
|
|
|
|
|
|
|
|
|
|
|
|
|
|
MARKETABLE SECURITIES—17.69% AND 18.19% |
|
|
|
|
|
|
| ||||||
|
|
|
|
|
|
|
| ||||||
REAL ESTATE-RELATED MARKETABLE SECURITIES—4.54% AND 3.91% |
|
|
|
| |||||||||
|
|
|
|
|
|
|
| ||||||
REAL ESTATE EQUITY SECURITIES—3.99% AND 3.72% |
|
|
|
|
|
|
| ||||||
|
|
|
|
|
|
|
|
|
|
|
|
|
|
| — |
|
| 75,000 |
| Aames Investment Corp. |
| $ | — |
| $ | 484,500 |
|
| 53,300 |
|
| — |
| Acadia Realty Trust |
|
| 1,333,566 |
|
| — |
|
| 68,700 |
|
| 550,000 |
| Affordable Residential Communities LP |
|
| 800,355 |
|
| 5,241,500 |
|
| 68,700 |
|
| — |
| Affordable Residential Communities LP |
|
|
|
|
|
|
|
|
|
|
|
|
| share rights (expiring 1/23/07) |
|
| 16,488 |
|
| — |
|
| — |
|
| 303,820 |
| Alesco Financial Inc. |
|
| — |
|
| 2,576,394 |
|
| 3,800 |
|
| — |
| Alexander’s Inc. |
|
| 1,594,670 |
|
| — |
|
| 54,400 |
|
| — |
| Alexandria Real Estate Equities Inc. |
|
| 5,461,760 |
|
| — |
|
| 166,985 |
|
| 36,685 |
| AMB Property Corp. |
|
| 9,786,991 |
|
| 1,803,801 |
|
| 42,500 |
|
| 40,000 |
| American Campus Communities Inc. |
|
| 1,209,975 |
|
| 992,000 |
|
| 244,900 |
|
| 919,000 |
| American Financial Realty Trust |
|
| 2,801,656 |
|
| 11,028,000 |
|
| 181,500 |
|
| — |
| Apartment Investment & Management Co. |
|
| 10,167,630 |
|
| — |
|
| 408,900 |
|
| 450,000 |
| Archstone—Smith Trust |
|
| 23,802,069 |
|
| 18,850,500 |
|
| 118,500 |
|
| 150,000 |
| Ashford Hospitality Trust Inc. |
|
| 1,475,325 |
|
| 1,573,500 |
|
| 33,300 |
|
| — |
| Associated Estates Realty Corp. |
|
| 457,542 |
|
| — |
|
| 138,900 |
|
| 40,000 |
| AvalonBay Communities Inc. |
|
| 18,063,945 |
|
| 3,570,000 |
|
| — |
|
| 150,000 |
| Bimini Mortgage Management Inc. |
|
| — |
|
| 1,357,500 |
|
| 122,400 |
|
| — |
| BioMed Realty Trust Inc. |
|
| 3,500,640 |
|
| — |
|
| 217,200 |
|
| — |
| Boston Properties Inc. |
|
| 24,300,336 |
|
| — |
|
| 171,500 |
|
| — |
| Brandywine Realty Trust |
|
| 5,702,375 |
|
| — |
|
| 94,200 |
|
| 30,000 |
| BRE Properties Inc. |
|
| 6,124,884 |
|
| 1,364,400 |
|
| 220,300 |
|
| 270,000 |
| Brookfield Properties Corp. |
|
| 8,664,399 |
|
| 7,943,400 |
|
| 105,200 |
|
| — |
| Camden Property Trust |
|
| 7,769,020 |
|
| — |
|
| — |
|
| 194,000 |
| Carramerica Realty Corp. |
|
| — |
|
| 6,718,220 |
|
| 121,500 |
|
| — |
| CBL & Associates Properties Inc. |
|
| 5,267,025 |
|
| — |
|
| 74,900 |
|
| 424,000 |
| Cedar Shopping Centers Inc. |
|
| 1,191,659 |
|
| 5,965,680 |
|
| — |
|
| 50,000 |
| Centerpoint Properties Corp. |
|
| — |
|
| 2,474,000 |
|
| — |
|
| 280,000 |
| Cogdell Spencer Inc. |
|
| — |
|
| 4,729,200 |
|
| 87,600 |
|
| — |
| Colonial Properties Trust |
|
| 4,106,688 |
|
| — |
|
| 80,600 |
|
| — |
| Corporate Office Properties Trust |
|
| 4,067,882 |
|
| — |
|
| 75,500 |
|
| — |
| Cousins Properties Inc. |
|
| 2,662,885 |
|
| — |
|
| 179,000 |
|
| — |
| Crescent Real Estate Equities Company |
|
| 3,535,250 |
|
| — |
|
| — |
|
| 976,000 |
| Deerfield Triarc Capital Corp. |
|
| — |
|
| 13,371,200 |
|
| 204,000 |
|
| 380,000 |
| Developers Diversified Realty Corp. |
|
| 12,841,800 |
|
| 17,867,600 |
|
| 125,500 |
|
| — |
| DiamondRock Hospitality Co. |
|
| 2,260,255 |
|
| — |
|
| 84,100 |
|
| — |
| Digital Realty Trust Inc. |
|
| 2,878,743 |
|
| — |
|
| 123,500 |
|
| — |
| Douglas Emmett Inc. |
|
| 3,283,865 |
|
| — |
|
| 252,100 |
|
| 193,400 |
| Duke Realty Corp. |
|
| 10,310,890 |
|
| 6,459,560 |
|
| 42,900 |
|
| — |
| EastGroup Properties Inc. |
|
| 2,297,724 |
|
| — |
|
| — |
|
| 1,087,000 |
| ECC Capital Corp. |
|
| — |
|
| 2,456,620 |
|
| 49,900 |
|
| 600,000 |
| Education Realty Trust Inc. |
|
| 737,023 |
|
| 7,734,000 |
|
| 103,400 |
|
| — |
| Equity Inns Inc. |
|
| 1,650,264 |
|
| — |
|
| 38,800 |
|
| — |
| Equity Lifestyle Properties Inc. |
|
| 2,111,884 |
|
| — |
|
| 654,500 |
|
| — |
| Equity Office Properties Trust |
|
| 31,527,265 |
|
| — |
|
TIAA Real Estate AccountProspectus|107
Statement of investments| | TIAA Real Estate Account | continued |
|
|
|
|
|
|
|
|
|
|
|
|
|
|
SHARES |
|
|
| VALUE |
| ||||||||
|
|
|
| ||||||||||
2006 |
| 2005 |
| ISSUER |
| 2006 |
| 2005 |
| ||||
| |||||||||||||
| |||||||||||||
| 69,900 |
|
| — |
| Equity One Inc. |
| $ | 1,863,534 |
| $ | — |
|
| 544,300 |
|
| 180,000 |
| Equity Residential |
|
| 27,623,225 |
|
| 7,041,600 |
|
| 43,600 |
|
| — |
| Essex Property Trust Inc. |
|
| 5,635,300 |
|
| — |
|
| 120,200 |
|
| 580,577 |
| Extra Space Storage Inc. |
|
| 2,194,852 |
|
| 8,940,886 |
|
| 103,200 |
|
| — |
| Federal Realty Investment Trust |
|
| 8,772,000 |
|
| — |
|
| 115,300 |
|
| — |
| FelCor Lodging Trust Inc. |
|
| 2,518,152 |
|
| — |
|
| — |
|
| 1,367,000 |
| Feldman Mall Properties Inc. |
|
| — |
|
| 16,417,670 |
|
| 84,300 |
|
| — |
| First Industrial Realty Trust Inc. |
|
| 3,952,827 |
|
| — |
|
| 41,600 |
|
| 111,600 |
| First Potomac Realty Trust |
|
| 1,210,976 |
|
| 2,968,560 |
|
| 423,600 |
|
| 110,000 |
| General Growth Properties Inc. |
|
| 22,124,628 |
|
| 5,168,900 |
|
�� | 69,600 |
|
| — |
| Glimcher Realty Trust |
|
| 1,859,016 |
|
| — |
|
| 73,800 |
|
| 404,800 |
| GMH Communities Trust |
|
| 749,070 |
|
| 6,278,448 |
|
| — |
|
| 348,700 |
| Gramercy Capital Corp./New York |
|
| — |
|
| 7,943,386 |
|
| — |
|
| 300,000 |
| Great Wolf Resorts Inc. |
|
| — |
|
| 3,093,000 |
|
| 59,500 |
|
| 562,000 |
| Hersha Hospitality Trust |
|
| 674,730 |
|
| 5,063,620 |
|
| 107,500 |
|
| 150,000 |
| Highland Hospitality Corp. |
|
| 1,531,875 |
|
| 1,657,500 |
|
| 101,700 |
|
| — |
| Highwoods Properties Inc. |
|
| 4,145,292 |
|
| — |
|
| — |
|
| 60,000 |
| Hilton Hotels Corp. |
|
| — |
|
| 1,446,600 |
|
| 64,000 |
|
| 80,000 |
| Home Properties Inc. |
|
| 3,793,280 |
|
| 3,264,000 |
|
| — |
|
| 450,000 |
| HomeBanc Corp./Atlanta GA |
|
| — |
|
| 3,366,000 |
|
| 147,900 |
|
| — |
| Hospitality Properties Trust |
|
| 7,029,687 |
|
| — |
|
| 973,570 |
|
| 300,000 |
| Host Hotels & Resorts Inc. |
|
| 23,901,143 |
|
| 5,685,000 |
|
| 396,700 |
|
| — |
| HRPT Properties Trust |
|
| 4,899,245 |
|
| — |
|
| 116,700 |
|
| — |
| Inland Real Estate Corp. |
|
| 2,184,624 |
|
| — |
|
| 84,800 |
|
| — |
| Innkeepers USA Trust |
|
| 1,314,400 |
|
| — |
|
| — |
|
| 300,000 |
| Interstate Hotels & Resorts Inc. |
|
| — |
|
| 1,311,000 |
|
| — |
|
| 80,000 |
| Istar Financial Inc. |
|
| — |
|
| 2,852,000 |
|
| — |
|
| 1,958,000 |
| Jameson Inns Inc. |
|
| — |
|
| 4,209,700 |
|
| — |
|
| 100,000 |
| JER Investors Trust Inc. |
|
| — |
|
| 1,695,000 |
|
| 59,400 |
|
| — |
| Kilroy Realty Corp. |
|
| 4,633,200 |
|
| — |
|
| 409,521 |
|
| 108,000 |
| Kimco Realty Corp. |
|
| 18,407,969 |
|
| 3,464,640 |
|
| 55,300 |
|
| 426,000 |
| Kite Realty Group Trust |
|
| 1,029,686 |
|
| 6,590,220 |
|
| — |
|
| 300,000 |
| KKR Financial Corp. |
|
| — |
|
| 7,197,000 |
|
| 75,000 |
|
| 200,000 |
| LaSalle Hotel Properties |
|
| 3,438,750 |
|
| 7,344,000 |
|
| — |
|
| 120,000 |
| Lexington Realty Trust |
|
| — |
|
| 2,556,000 |
|
| 167,000 |
|
| — |
| Liberty Property Trust |
|
| 8,206,380 |
|
| — |
|
| — |
|
| 1,266,660 |
| Lodgian Inc. |
|
| — |
|
| 13,591,262 |
|
| — |
|
| 200,000 |
| LTC Properties Inc. |
|
| — |
|
| 4,206,000 |
|
| 135,900 |
|
| 75,000 |
| Macerich Co./The |
|
| 11,764,863 |
|
| 5,035,500 |
|
| 118,700 |
|
| 400,000 |
| Mack—Cali Realty Corp. |
|
| 6,053,700 |
|
| 17,280,000 |
|
| 81,000 |
|
| — |
| Maguire Properties Inc. |
|
| 3,240,000 |
|
| — |
|
| — |
|
| 200,000 |
| Medical Properties Trust Inc. |
|
| — |
|
| 1,956,000 |
|
| 44,000 |
|
| — |
| Mid—America Apartment Communities |
|
| 2,518,560 |
|
| — |
|
| 100,200 |
|
| 40,000 |
| Mills Corp./The |
|
| 2,004,000 |
|
| 1,677,600 |
|
| — |
|
| 100,000 |
| Mission West Properties |
|
| — |
|
| 974,000 |
|
| — |
|
| 331,200 |
| Monmouth Reit |
|
| — |
|
| 2,656,224 |
|
| — |
|
| 300,000 |
| Mortgage IT Holdings Inc. |
|
| — |
|
| 4,098,000 |
|
108|ProspectusTIAA Real Estate Account
Statement of investments| | TIAA Real Estate Account | continued |
|
|
|
|
|
|
|
|
|
|
|
|
|
|
SHARES |
|
|
| VALUE |
| ||||||||
|
|
|
| ||||||||||
2006 |
| 2005 |
| ISSUER, CURRENT RATE AND MATURITY DATE |
| 2006 |
| 2005 |
| ||||
| |||||||||||||
|
|
|
|
|
|
|
|
|
|
|
|
|
|
| 198,000 |
|
| — |
| New Plan Excel Realty Trust |
| $ | 5,441,040 |
| $ | — |
|
| — |
|
| 130,000 |
| Newcastle Investment Corp. |
|
| — |
|
| 3,230,500 |
|
| — |
|
| 100,000 |
| Novastar Financial Inc. |
|
| — |
|
| 2,811,000 |
|
| — |
|
| 525,000 |
| Origen Financial Inc. |
|
| — |
|
| 3,738,000 |
|
| 25,100 |
|
| 328,100 |
| Parkway Properties Inc./Md |
|
| 1,280,351 |
|
| 13,169,934 |
|
| 69,500 |
|
| — |
| Pennsylvania Real Estate Investment Trust |
|
| 2,736,910 |
|
| — |
|
| 79,300 |
|
| — |
| Post Properties Inc. |
|
| 3,624,010 |
|
| — |
|
| 462,500 |
|
| 400,000 |
| Prologis |
|
| 28,106,125 |
|
| 18,688,000 |
|
| 30,200 |
|
| — |
| PS Business Parks Inc. |
|
| 2,135,442 |
|
| — |
|
| 241,114 |
|
| 30,000 |
| Public Storage Inc. |
|
| 23,508,615 |
|
| 2,031,600 |
|
| — |
|
| 100,000 |
| RAIT Financial Trust |
|
| — |
|
| 2,592,000 |
|
| 28,500 |
|
| — |
| Ramco—Gershenson Properties |
|
| 1,086,990 |
|
| — |
|
| 157,000 |
|
| — |
| Reckson Associates Realty Corp. |
|
| 7,159,200 |
|
| — |
|
| 129,300 |
|
| 236,000 |
| Regency Centers Corp. |
|
| 10,107,381 |
|
| 13,912,200 |
|
| — |
|
| 384,000 |
| Republic Property Trust |
|
| — |
|
| 4,608,000 |
|
| 20,600 |
|
| — |
| Saul Centers Inc. |
|
| 1,136,914 |
|
| — |
|
| 412,821 |
|
| 305,721 |
| Simon Property Group Inc. |
|
| 41,814,639 |
|
| 23,427,400 |
|
| 86,300 |
|
| — |
| SL Green Realty Corp. |
|
| 11,458,914 |
|
| — |
|
| 33,500 |
|
| — |
| Sovran Self Storage Inc. |
|
| 1,918,880 |
|
| — |
|
| — |
|
| 350,000 |
| Starwood Hotels & Resorts Worldwide |
|
| — |
|
| 22,351,000 |
|
| 134,700 |
|
| — |
| Strategic Hotels & Resorts Inc. |
|
| 2,935,113 |
|
| — |
|
| 30,900 |
|
| — |
| Sun Communities Inc. |
|
| 999,924 |
|
| — |
|
| 109,400 |
|
| — |
| Sunstone Hotel Investors Inc. |
|
| 2,924,262 |
|
| — |
|
| 58,300 |
|
| — |
| Tanger Factory Outlet Centers |
|
| 2,278,364 |
|
| — |
|
| 98,400 |
|
| — |
| Taubman Centers Inc. |
|
| 5,004,624 |
|
| — |
|
| — |
|
| 111,200 |
| Thomas Properties Group Inc. |
|
| — |
|
| 1,391,112 |
|
| — |
|
| 50,000 |
| Trizec Properties Inc. |
|
| — |
|
| 1,146,000 |
|
| 250,400 |
|
| 100,000 |
| United Dominion Realty Trust Inc. |
|
| 7,960,216 |
|
| 2,344,000 |
|
| 95,400 |
|
| — |
| U-Store-It Trust |
|
| 1,960,470 |
|
| — |
|
| — |
|
| 95,000 |
| Ventas Inc. |
|
| — |
|
| 3,041,900 |
|
| 245,800 |
|
| 200,000 |
| Vornado Realty Trust |
|
| 29,864,700 |
|
| 16,694,000 |
|
| 85,500 |
|
| — |
| Washington Real Estate Investment Trust |
|
| 3,420,000 |
|
| — |
|
| 148,500 |
|
| — |
| Weingarten Realty Investors |
|
| 6,847,335 |
|
| — |
|
| — |
|
| 944 |
| Windrose Medical Properties Trust |
|
| — |
|
| 14,028 |
|
| 44,700 |
|
| — |
| Winston Hotels Inc. |
|
| 592,275 |
|
| — |
|
|
|
|
|
|
|
|
|
|
| ||||
TOTAL REAL ESTATE EQUITY SECURITIES |
|
|
|
|
|
|
| ||||||
(Cost $484,071,757 and $411,877,936) |
|
| 619,342,386 |
|
| 426,781,565 |
| ||||||
|
|
|
| ||||||||||
TIAA Real Estate AccountProspectus|109
Statement of investments| | TIAA Real Estate Account | continued |
|
|
|
|
|
|
|
|
|
|
|
|
|
|
PRINCIPAL |
|
|
| VALUE |
| ||||||||
|
|
|
| ||||||||||
2006 |
| 2005 |
| ISSUER, CURRENT RATE AND MATURITY DATE |
| 2006 |
| 2005 |
| ||||
| |||||||||||||
|
|
|
|
|
|
|
| ||||||
COMMERCIAL MORTGAGE-BACKED SECURITIES—0.55% AND 0.19% |
|
|
|
|
|
|
| ||||||
| |||||||||||||
$ | 10,000,000 |
| $ | — |
| Commercial Mortgage Pass |
|
|
|
|
|
|
|
|
|
|
|
|
| 5.450% 12/15/20 |
| $ | 10,000,000 |
| $ | — |
|
| 3,389,773 |
|
| — |
| Credit Suisse Mortgage Company |
|
|
|
|
|
|
|
|
|
|
|
|
| 5.470% 4/15/21 |
|
| 3,390,255 |
|
| — |
|
| 10,000,000 |
|
| 10,000,000 |
| GS Mortgage Securities Co |
|
|
|
|
|
|
|
|
|
|
|
|
| 5.682% 5/3/18 |
|
| 10,186,930 |
|
| 10,217,650 |
|
| 8,780,566 |
|
| — |
| GS Mortgage Securities Co |
|
|
|
|
|
|
|
|
|
|
|
|
| 5.420% 6/6/20 |
|
| 8,782,059 |
|
| — |
|
| 9,996,970 |
|
| — |
| JP Morgan Chase Commercial |
|
|
|
|
|
|
|
|
|
|
|
|
| 5.440% 11/15/18 |
|
| 9,996,970 |
|
| — |
|
| 9,298,609 |
|
| — |
| Lehman Brothers Floating |
|
|
|
|
|
|
|
|
|
|
|
|
| 5.430% 9/15/21 |
|
| 9,298,971 |
|
| — |
|
| 9,143,864 |
|
| — |
| Morgan Stanley Capital |
|
|
|
|
|
|
|
|
|
|
|
|
| 5.440% 7/15/19 |
|
| 9,144,605 |
|
| — |
|
| 10,000,000 |
|
| 10,000,000 |
| Morgan Stanley Dean Witter |
|
|
|
|
|
|
|
|
|
|
|
|
| 5.712% 2/3/16 |
|
| 10,137,150 |
|
| 10,061,730 |
|
| — |
|
| 1,601,634 |
| TrizecHahn Office Property |
|
|
|
|
|
|
|
|
|
|
|
|
| 5.700% 3/15/13 |
|
| — |
|
| 1,601,653 |
|
| 14,642,368 |
|
| — |
| Wachovia Bank Commercial |
|
|
|
|
|
|
|
|
|
|
|
|
| 5.440% 9/15/21 |
|
| 14,642,997 |
|
| — |
|
|
|
|
|
|
|
|
|
|
| ||||
TOTAL COMMERCIAL MORTGAGE-BACKED SECURITIES |
|
| 85,579,937 |
|
| 21,881,033 |
| ||||||
|
|
|
|
|
|
|
|
| |||||
TOTAL REAL ESTATE-RELATED MARKETABLE SECURITIES |
|
| 704,922,323 |
|
| 448,662,598 |
| ||||||
|
|
|
| ||||||||||
|
|
|
|
|
|
|
|
|
|
|
|
|
|
OTHER MARKETABLE SECURITIES—13.15% AND 14.28% |
|
|
|
|
|
| |||||||
|
|
|
|
|
|
|
|
|
|
|
|
|
|
COMMERCIAL PAPER—10.79% AND 11.67% |
|
|
|
|
|
| |||||||
|
|
|
|
|
|
|
|
|
|
|
|
|
|
| — |
|
| 25,000,000 |
| Abbey National North America LLC |
|
|
|
|
|
|
|
|
|
|
|
|
| 4.330% 1/5/06 |
|
| — |
|
| 24,994,000 |
|
| 25,000,000 |
|
| — |
| Abbey National North America LLC |
|
|
|
|
|
|
|
|
|
|
|
|
| 5.260% 1/17/07 |
|
| 24,945,207 |
|
| — |
|
| — |
|
| 25,000,000 |
| Abbey National Plc |
|
|
|
|
|
|
|
|
|
|
|
|
| 4.280% 1/17/06 |
|
| — |
|
| 24,999,500 |
|
| — |
|
| 10,000,000 |
| Alabama Power Co |
|
|
|
|
|
|
|
|
|
|
|
|
| 4.250% 1/12/06 |
|
| — |
|
| 9,989,100 |
|
| 10,000,000 |
|
| — |
| American Express Bank, FSB |
|
|
|
|
|
|
|
|
|
|
|
|
| 5.565% 1/8/07 |
|
| 10,000,235 |
|
| — |
|
| 1,500,000 |
|
| — |
| American Express Bank, FSB |
|
|
|
|
|
|
|
|
|
|
|
|
| 5.290% 1/12/07 |
|
| 1,499,996 |
|
| — |
|
| 24,000,000 |
|
| — |
| American Express Bank, FSB |
|
|
|
|
|
|
|
|
|
|
|
|
| 5.280% 1/18/07 |
|
| 23,999,578 |
|
| — |
|
| 20,000,000 |
|
| — |
| American Express Centurion Bank |
|
|
|
|
|
|
|
|
|
|
|
|
| 5.290% 1/9/07 |
|
| 19,999,954 |
|
| — |
|
| 19,165,000 |
|
| — |
| American Express Centurion Bank |
|
|
|
|
|
|
|
|
|
|
|
|
| 5.290% 1/8/07 |
|
| 19,164,962 |
|
| — |
|
110|ProspectusTIAA Real Estate Account
Statement of investments| | TIAA Real Estate Account | continued |
|
|
|
|
|
|
|
|
|
|
|
|
|
|
PRINCIPAL |
|
|
| VALUE |
| ||||||||
|
|
| |||||||||||
2006 |
| 2005 |
| ISSUER, CURRENT RATE AND MATURITY DATE |
| 2006 |
| 2005 |
| ||||
| |||||||||||||
$ | — |
| $ | 25,000,000 |
| American Express Centurion Bank |
|
|
|
|
|
|
|
|
|
|
|
|
| 4.310% 1/19/06 |
| $ | — |
| $ | 25,000,000 |
|
| 25,000,000 |
|
| — |
| American Express Centurion Bank |
|
|
|
|
|
|
|
|
|
|
|
|
| 5.290% 1/3/07 |
|
| 24,999,988 |
|
| — |
|
| — |
|
| 2,430,000 |
| American Honda Finance, Corp |
|
|
|
|
|
|
|
|
|
|
|
|
| 4.240% 1/9/06 |
|
| — |
|
| 2,428,250 |
|
| 50,000,000 |
|
| — |
| American Honda Finance, Corp |
|
|
|
|
|
|
|
|
|
|
|
|
| 5.260% 1/22/07 |
|
| 49,853,055 |
|
| — |
|
| 17,475,000 |
|
| — |
| American Honda Finance, Corp |
|
|
|
|
|
|
|
|
|
|
|
|
| 5.210% 2/9/07 |
|
| 17,377,605 |
|
| — |
|
| 10,000,000 |
|
| — |
| Anheuser — Busch Co. |
|
|
|
|
|
|
|
|
|
|
|
|
| 5.240% 1/19/07 |
|
| 9,975,019 |
|
| — |
|
| — |
|
| 25,000,000 |
| Atlantis One Funding Corp. |
|
|
|
|
|
|
|
|
|
|
|
|
| 4.205% 2/8/06 |
|
| — |
|
| 24,890,750 |
|
| — |
|
| 10,000,000 |
| Atlantis One Funding Corp. |
|
|
|
|
|
|
|
|
|
|
|
|
| 4.380% 2/24/06 |
|
| — |
|
| 9,936,500 |
|
| — |
|
| 25,000,000 |
| Bank Of Montreal |
|
|
|
|
|
|
|
|
|
|
|
|
| 4.285% 1/26/06 |
|
| — |
|
| 24,999,500 |
|
| — |
|
| 30,000,000 |
| Barclays Bank, PLC |
|
|
|
|
|
|
|
|
|
|
|
|
| 4.420% 3/14/06 |
|
| — |
|
| 29,998,200 |
|
| — |
|
| 15,000,000 |
| Barclays Bank, PLC |
|
|
|
|
|
|
|
|
|
|
|
|
| 4.329% 8/30/06 |
|
| — |
|
| 14,999,400 |
|
| 25,000,000 |
|
| — |
| Barclay’s U.S. Funding Corp |
|
|
|
|
|
|
|
|
|
|
|
|
| 5.240% 1/26/07 |
|
| 24,912,383 |
|
| — |
|
| — |
|
| 18,040,000 |
| Becton Dickinson & Co |
|
|
|
|
|
|
|
|
|
|
|
|
| 4.210% 1/24/06 |
|
| — |
|
| 17,994,720 |
|
| — |
|
| 13,100,000 |
| Beta Finance, Inc |
|
|
|
|
|
|
|
|
|
|
|
|
| 4.140% 1/12/06 |
|
| — |
|
| 13,085,590 |
|
| — |
|
| 11,000,000 |
| Beta Finance, Inc |
|
|
|
|
|
|
|
|
|
|
|
|
| 4.070% 1/17/06 |
|
| — |
|
| 10,981,190 |
|
| 20,000,000 |
|
| — |
| BMW US Capital Corp |
|
|
|
|
|
|
|
|
|
|
|
|
| 5.250% 2/7/07 |
|
| 19,894,400 |
|
| — |
|
| 23,050,000 |
|
| — |
| BMW US Capital Corp |
|
|
|
|
|
|
|
|
|
|
|
|
| 5.210% 2/9/07 |
|
| 22,921,533 |
|
| — |
|
| — |
|
| 20,000,000 |
| Calyon |
|
|
|
|
|
|
|
|
|
|
|
|
| 4.100% 1/19/06 |
|
| — |
|
| 19,997,800 |
|
| — |
|
| 10,000,000 |
| Canadian Wheat Board (The) |
|
|
|
|
|
|
|
|
|
|
|
|
| 1.870% 2/6/06 |
|
| — |
|
| 9,959,500 |
|
| — |
|
| 14,000,000 |
| CC (USA), Inc |
|
|
|
|
|
|
|
|
|
|
|
|
| 3.830% 1/13/06 |
|
| — |
|
| 13,982,920 |
|
| — |
|
| 40,000,000 |
| Ciesco LP |
|
|
|
|
|
|
|
|
|
|
|
|
| 4.280% 1/23/06 |
|
| — |
|
| 39,903,200 |
|
| — |
|
| 10,000,000 |
| Ciesco LP |
|
|
|
|
|
|
|
|
|
|
|
|
| 4.370% 2/24/06 |
|
| — |
|
| 9,936,500 |
|
| 25,000,000 |
|
| — |
| Ciesco LP |
|
|
|
|
|
|
|
|
|
|
|
|
| 5.260% 1/9/07 |
|
| 24,973,942 |
|
| — |
|
| 14,000,000 |
|
| — |
| Ciesco LP |
|
|
|
|
|
|
|
|
|
|
|
|
| 5.260% 1/25/07 |
|
| 13,952,299 |
|
| — |
|
TIAA Real Estate AccountProspectus|111
Statement of investments| | TIAA Real Estate Account | continued |
|
|
|
|
|
|
|
|
|
|
|
|
|
|
PRINCIPAL |
|
|
| VALUE |
| ||||||||
|
|
| |||||||||||
2006 |
| 2005 |
| ISSUER, CURRENT RATE AND MATURITY DATE |
| 2006 |
| 2005 |
| ||||
| |||||||||||||
$ | — |
| $ | 37,000,000 |
| Citigroup Funding Inc. |
|
|
|
|
|
|
|
|
|
|
|
|
| 4.220% 1/20/06 |
| $ | — |
| $ | 36,925,260 |
|
| — |
|
| 13,000,000 |
| Citigroup Funding Inc. |
|
|
|
|
|
|
|
|
|
|
|
|
| 4.350% 2/21/06 |
|
| — |
|
| 12,923,560 |
|
| 50,000,000 |
|
| — |
| Citigroup Funding Inc. |
|
|
|
|
|
|
|
|
|
|
|
|
| 5.250% 1/11/07 |
|
| 49,934,060 |
|
| — |
|
| 35,825,000 |
|
| — |
| Citigroup Funding Inc. |
|
|
|
|
|
|
|
|
|
|
|
|
| 5.250% 2/5/07 |
|
| 35,647,365 |
|
| — |
|
| — |
|
| 24,150,000 |
| Colgate-Palmolive Co |
|
|
|
|
|
|
|
|
|
|
|
|
| 4.250% 1/6/06 |
|
| — |
|
| 24,141,306 |
|
| — |
|
| 15,000,000 |
| Corporate Asset Funding Corp, Inc |
|
|
|
|
|
|
|
|
|
|
|
|
| 4.150% 1/13/06 |
|
| — |
|
| 14,981,700 |
|
| — |
|
| 5,035,000 |
| Corporate Asset Funding Corp, Inc |
|
|
|
|
|
|
|
|
|
|
|
|
| 4.200% 1/23/06 |
|
| — |
|
| 5,022,815 |
|
| — |
|
| 16,000,000 |
| Corporate Asset Funding Corp, Inc |
|
|
|
|
|
|
|
|
|
|
|
|
| 4.210% 1/25/06 |
|
| — |
|
| 15,957,440 |
|
| — |
|
| 5,905,000 |
| Corporate Asset Funding Corp, Inc |
|
|
|
|
|
|
|
|
|
|
|
|
| 4.290% 1/31/06 |
|
| — |
|
| 5,884,982 |
|
| — |
|
| 2,020,000 |
| Corporate Asset Funding Corp, Inc |
|
|
|
|
|
|
|
|
|
|
|
|
| 4.340% 2/17/06 |
|
| — |
|
| 2,008,930 |
|
| 6,000,000 |
|
| — |
| Corporate Asset Funding Corp, Inc |
|
|
|
|
|
|
|
|
|
|
|
|
| 5.240% 1/22/07 |
|
| 5,982,193 |
|
| — |
|
| 8,760,000 |
|
| — |
| Corporate Asset Funding Corp, Inc |
|
|
|
|
|
|
|
|
|
|
|
|
| 5.260% 1/29/07 |
|
| 8,725,048 |
|
| — |
|
| 25,000,000 |
|
| — |
| Corporate Asset Funding Corp, Inc |
|
|
|
|
|
|
|
|
|
|
|
|
| 5.250% 2/7/07 |
|
| 24,867,250 |
|
| — |
|
| 54,000,000 |
|
| — |
| Corporate Asset Funding Corp, Inc |
|
|
|
|
|
|
|
|
|
|
|
|
| 5.250% 2/8/07 |
|
| 53,705,295 |
|
| — |
|
| — |
|
| 25,000,000 |
| Deutsche Bank |
|
|
|
|
|
|
|
|
|
|
|
|
| 4.270% 2/14/06 |
|
| — |
|
| 24,997,000 |
|
| 3,000,000 |
|
| — |
| Deutsche Bank |
|
|
|
|
|
|
|
|
|
|
|
|
| 5.290% 1/9/07 |
|
| 2,999,962 |
|
| — |
|
| 30,000,000 |
|
| — |
| Deutsche Bank |
|
|
|
|
|
|
|
|
|
|
|
|
| 5.300% 1/22/07 |
|
| 29,999,154 |
|
| — |
|
| — |
|
| 50,000,000 |
| Dexia Bank |
|
|
|
|
|
|
|
|
|
|
|
|
| 4.280% 1/30/06 |
|
| — |
|
| 49,998,000 |
|
| — |
|
| 8,000,000 |
| Dorada Finance Inc. |
|
|
|
|
|
|
|
|
|
|
|
|
| 3.900% 1/23/06 |
|
| — |
|
| 7,980,640 |
|
| — |
|
| 21,500,000 |
| Dorada Finance Inc. |
|
|
|
|
|
|
|
|
|
|
|
|
| 4.250% 2/16/06 |
|
| — |
|
| 21,384,975 |
|
| — |
|
| 20,000,000 |
| Dorada Finance Inc. |
|
|
|
|
|
|
|
|
|
|
|
|
| 4.300% 2/27/06 |
|
| — |
|
| 19,865,600 |
|
| 7,000,000 |
|
| — |
| Dorada Finance Inc. |
|
|
|
|
|
|
|
|
|
|
|
|
| 5.250% 1/9/07 |
|
| 6,992,704 |
|
| — |
|
| — |
|
| 13,000,000 |
| Edison Asset Securitization, LLC |
|
|
|
|
|
|
|
|
|
|
|
|
| 4.190% 1/17/06 |
|
| — |
|
| 12,977,770 |
|
112|ProspectusTIAA Real Estate Account
|
|
|
Statement of investments| | TIAA Real Estate Account | |
| continued | |
|
|
|
|
|
|
|
|
|
| VALUE |
| ||||
|
| ||||||
LOCATION/DESCRIPTION |
| 2005 |
|
| 2004 |
| |
|
|
|
|
|
|
|
|
OTHER REAL ESTATE RELATED |
|
|
|
|
|
|
|
INVESTMENTS—12.35% AND 16.68% |
|
|
|
|
|
|
|
|
|
|
|
|
|
|
|
REAL ESTATE JOINT VENTURE—10.64% AND 16.28% |
|
|
|
|
|
|
|
Teachers REA LLC, which owns |
|
|
|
|
|
|
|
Cabot Industrial Portfolio (100% Account Interest) |
| $ | — |
| $ | 60,600,000 |
|
Bisys Crossings I, LLC |
|
|
|
|
|
|
|
BISYS Fund Services Building (96% Account Interest) |
|
| — |
|
| 34,751,940 |
|
GA-Buckhead LLC |
|
|
|
|
|
|
|
Prominence in Buckhead (75% Account Interest) |
|
| 97,142,406 |
|
| 80,618,771 |
|
IL-161 Clark Street LLC |
|
|
|
|
|
|
|
161 North Clark Street (75% Account Interest) |
|
| 175,578,714 |
|
| 157,282,972 |
|
One Boston Place REIT |
|
|
|
|
|
|
|
One Boston Place (50.25% Account Interest) |
|
| 149,723,498 |
|
| 139,382,942 |
|
Storage Portfolio I, LLC |
|
|
|
|
|
|
|
Storage Portfolio (3) (75% Account Interest) |
|
| 63,237,298 | (4) |
| 50,430,399 | (4) |
CA-Treat Towers LP |
|
|
|
|
|
|
|
Treat Towers (75% Account Interest) |
|
| 93,964,192 |
|
| 88,524,364 |
|
Strategic Ind Portfolio I, LLC |
|
|
|
|
|
|
|
IDI Nationwide Industrial Portfolio (3) (60% Account Interest) |
|
| 66,871,766 | (4) |
| 64,041,442 | (4) |
CA-Colorado Center LP |
|
|
|
|
|
|
|
Yahoo! Center (50% Account Interest) |
|
| 138,531,366 | (4) |
| 222,702,820 |
|
Florida Mall Associates, Ltd. |
|
|
|
|
|
|
|
The Florida Mall (50% Account Interest) |
|
| 208,013,192 | (4) |
| 162,632,565 | (4) |
Teachers REA IV, LLC, which owns |
|
|
|
|
|
|
|
Tyson’s Executive Plaza II (50% Account Interest) |
|
| 34,032,806 |
|
| 27,894,742 |
|
West Dade Associates |
|
|
|
|
|
|
|
Miami International Mall (50% Account Interest) |
|
| 82,290,482 | (4) |
| 61,577,257 | (4) |
West Town Mall, LLC |
|
|
|
|
|
|
|
West Town Mall (50% Account Interest) |
|
| 112,650,844 | (4) |
| 107,452,790 | (4) |
TOTAL REAL ESTATE JOINT VENTURE |
|
|
|
|
|
|
|
(Cost $888,034,873 and $1,060,788,631) |
|
| 1,222,036,564 |
|
| 1,257,893,004 |
|
|
|
|
|
|
|
|
|
LIMITED PARTNERSHIPS—1.71% AND 0.40% |
|
|
|
|
|
|
|
Cobalt Industrial REIT (10.00% Account Interest) |
|
| 8,352,409 |
|
| — |
|
Colony Realty Partners LP (5.27% Account Interest) |
|
| 13,481,704 |
|
| — |
|
Essex Apartment Value Fund, L.P. (10% Account Interest) |
|
| 487,306 |
|
| 11,434,495 |
|
Heitman Value Partners, LP (8.43% Account Interest) |
|
| 8,106,810 |
|
| 3,766,214 |
|
Lion Gables Apartment Fund, LP (18.45% Account Interest) |
|
| 150,000,000 |
|
| — |
|
MONY/Transwestern Mezzanine Realty Partners II, LLC (16.67% Account Interest) |
|
| 14,142,822 |
|
| 3,134,952 |
|
MONY/Transwestern Mezzanine Realty Partners, L.P. |
|
|
|
|
|
|
|
(19.75% Account Interest) |
|
| 1,975,927 |
|
| 12,486,734 |
|
|
|
|
| ||||
TOTAL LIMITED PARTNERSHIP |
|
|
|
|
|
|
|
(Cost $198,006,414 and $24,931,845) |
|
| 196,546,978 |
|
| 30,822,395 |
|
|
|
|
| ||||
TOTAL OTHER REAL ESTATE RELATED INVESTMENTS |
|
|
|
|
|
|
|
(Cost $1,086,041,287 and $1,085,720,476) |
|
| 1,418,583,542 |
|
| 1,288,715,399 |
|
|
|
|
| ||||
|
|
|
|
|
|
|
|
|
|
|
|
|
|
PRINCIPAL |
|
|
| VALUE |
| ||||||||
|
|
| |||||||||||
2006 |
| 2005 |
| ISSUER, CURRENT RATE AND MATURITY DATE |
| 2006 |
| 2005 |
| ||||
|
|
|
|
|
|
|
|
|
|
|
|
|
|
$ | — |
| $ | 20,000,000 |
| Edison Asset Securitization, LLC |
|
|
|
|
|
|
|
|
|
|
|
|
| 1.720% 2/22/06 |
| $ | — |
| $ | 19,877,800 |
|
| — |
|
| 7,248,000 |
| Edison Asset Securitization, LLC |
|
|
|
|
|
|
|
|
|
|
|
|
| 4.390% 4/7/06 |
|
| — |
|
| 7,162,981 |
|
| 24,000,000 |
|
| — |
| Edison Asset Securitization, LLC |
|
|
|
|
|
|
|
|
|
|
|
|
| 5.230% 1/19/07 |
|
| 23,939,287 |
|
| — |
|
| 10,000,000 |
|
| — |
| Edison Asset Securitization, LLC |
|
|
|
|
|
|
|
|
|
|
|
|
| 5.240% 2/1/07 |
|
| 9,955,666 |
|
| — |
|
| 32,900,000 |
|
| — |
| Fairway Finance Company, LLC |
|
|
|
|
|
|
|
|
|
|
|
|
| 5.240% 1/17/07 |
|
| 32,826,521 |
|
| — |
|
| — |
|
| 20,000,000 |
| FCAR Owner Trust I |
|
|
|
|
|
|
|
|
|
|
|
|
| 4.340% 2/7/06 |
|
| — |
|
| 19,915,000 |
|
| — |
|
| 17,000,000 |
| First Tennessee National Bank |
|
|
|
|
|
|
|
|
|
|
|
|
| 4.330% 2/6/06 |
|
| — |
|
| 16,999,660 |
|
| — |
|
| 21,590,000 |
| General Electric Capital Corp |
|
|
|
|
|
|
|
|
|
|
|
|
| 4.440% 4/28/06 |
|
| — |
|
| 21,282,343 |
|
| — |
|
| 25,000,000 |
| General Electric Capital Corp |
|
|
|
|
|
|
|
|
|
|
|
|
| 4.520% 6/28/06 |
|
| — |
|
| 24,435,000 |
|
| 23,760,000 |
|
| — |
| General Electric Capital Corp |
|
|
|
|
|
|
|
|
|
|
|
|
| 5.250% 1/18/07 |
|
| 23,704,454 |
|
| — |
|
| 13,155,000 |
|
| — |
| General Electric Capital Corp |
|
|
|
|
|
|
|
|
|
|
|
|
| 5.240% 2/8/07 |
|
| 13,084,017 |
|
| — |
|
| 30,000,000 |
|
| — |
| General Electric Capital Corp |
|
|
|
|
|
|
|
|
|
|
|
|
| 5.250% 2/15/07 |
|
| 29,807,499 |
|
| — |
|
| — |
|
| 35,000,000 |
| Goldman Sachs Group, LP |
|
|
|
|
|
|
|
|
|
|
|
|
| 4.280% 2/3/06 |
|
| — |
|
| 34,870,150 |
|
| — |
|
| 29,140,000 |
| Govco Incorporated |
|
|
|
|
|
|
|
|
|
|
|
|
| 4.020% 1/9/06 |
|
| — |
|
| 29,118,436 |
|
| — |
|
| 10,000,000 |
| Govco Incorporated |
|
|
|
|
|
|
|
|
|
|
|
|
| 2.280% 1/18/06 |
|
| — |
|
| 9,981,700 |
|
| — |
|
| 9,000,000 |
| Govco Incorporated |
|
|
|
|
|
|
|
|
|
|
|
|
| 4.390% 3/14/06 |
|
| — |
|
| 8,922,420 |
|
| 50,000,000 |
|
| — |
| Govco Incorporated |
|
|
|
|
|
|
|
|
|
|
|
|
| 5.240% 1/5/07 |
|
| 49,977,665 |
|
| — |
|
| 25,700,000 |
|
| — |
| Govco Incorporated |
|
|
|
|
|
|
|
|
|
|
|
|
| 5.260% 3/8/07 |
|
| 25,454,668 |
|
| — |
|
| — |
|
| 5,015,000 |
| Grampian Funding LLC |
|
|
|
|
|
|
|
|
|
|
|
|
| 4.320% 1/23/06 |
|
| — |
|
| 5,002,814 |
|
| — |
|
| 20,000,000 |
| Grampian Funding LLC |
|
|
|
|
|
|
|
|
|
|
|
|
| 4.040% 2/1/06 |
|
| — |
|
| 19,929,600 |
|
| — |
|
| 10,000,000 |
| Greyhawk Funding LLC |
|
|
|
|
|
|
|
|
|
|
|
|
| 4.000% 1/6/06 |
|
| — |
|
| 9,996,300 |
|
| 33,000,000 |
|
| — |
| Greyhawk Funding LLC |
|
|
|
|
|
|
|
|
|
|
|
|
| 5.230% 2/6/07 |
|
| 32,829,314 |
|
| — |
|
| — |
|
| 25,000,000 |
| Harrier Finance Funding (US) LLC |
|
|
|
|
|
|
|
|
|
|
|
|
| 3.810% 1/25/06 |
|
| — |
|
| 24,933,500 |
|
TIAA Real Estate AccountProspectus|| 95113
|
|
|
Statement of investments| | TIAA Real Estate Account | |
| continued | |
|
|
|
|
|
|
|
|
|
|
|
|
|
|
SHARES |
|
|
| VALUE |
| ||||||||
|
|
| |||||||||||
| 2005 |
|
| 2004 |
| ISSUER |
|
| 2005 |
|
| 2004 |
|
|
|
|
|
|
|
|
|
|
|
|
|
|
|
MARKETABLE SECURITIES—18.19% AND 13.54% |
|
|
|
|
|
|
| ||||||
|
|
|
|
|
|
|
|
|
|
|
|
|
|
REAL ESTATE RELATED—3.91% AND 4.79% |
|
|
|
|
|
|
| ||||||
|
|
|
|
|
|
|
|
|
|
|
|
|
|
REAL ESTATE EQUITY SECURITIES—3.72% AND 4.25% |
|
|
|
|
|
|
| ||||||
|
|
|
|
|
|
|
|
|
|
|
|
|
|
| 75,000 |
|
| — |
| Aames Investment Corp |
| $ | 484,500 |
| $ | — |
|
| — |
|
| 70,000 |
| Acadia Realty Trust |
|
| — |
|
| 1,141,000 |
|
| 550,000 |
|
| 550,000 |
| Affordable Residential Communities |
|
| 5,241,500 |
|
| 7,892,500 |
|
| 36,685 |
|
| 36,685 |
| AMB Property Corp |
|
| 1,803,801 |
|
| 1,481,707 |
|
| 40,000 |
|
| 446,100 |
| American Campus Communities |
|
| 992,000 |
|
| 10,032,789 |
|
| 919,000 |
|
| — |
| American Financial Realty |
|
| 11,028,000 |
|
| — |
|
| — |
|
| 140,000 |
| Amli Residential Properties |
|
| — |
|
| 4,480,000 |
|
| 450,000 |
|
| 46,000 |
| Archstone—Smith Trust |
|
| 18,850,500 |
|
| 1,761,800 |
|
| 150,000 |
|
| 232,900 |
| Ashford Hospitality Trust |
|
| 1,573,500 |
|
| 2,531,623 |
|
| 40,000 |
|
| — |
| Avalonbay Communities Inc |
|
| 3,570,000 |
|
| — |
|
| 150,000 |
|
| — |
| Bimini Mortgage Management—A |
|
| 1,357,500 |
|
| — |
|
| — |
|
| 150,000 |
| Boston Properties Inc. |
|
| — |
|
| 9,700,500 |
|
| — |
|
| 150,000 |
| Brandywine Realty Trust |
|
| — |
|
| 4,408,500 |
|
| 30,000 |
|
| 35,000 |
| BRE Properties |
|
| 1,364,400 |
|
| 1,410,850 |
|
| 270,000 |
|
| — |
| Brookfield Properties |
|
| 7,943,400 |
|
| — |
|
| — |
|
| 60,000 |
| Capital Lease Funding Inc. |
|
| — |
|
| 750,000 |
|
| 194,000 |
|
| — |
| Carramerica Realty Corp |
|
| 6,718,220 |
|
| — |
|
| 424,000 |
|
| — |
| Cedar Shopping Centers Inc. |
|
| 5,965,680 |
|
| — |
|
| 50,000 |
|
| 60,000 |
| Centerpoint Properties Trust |
|
| 2,474,000 |
|
| 2,873,400 |
|
| 280,000 |
|
| — |
| Cogdell Spencer Inc. |
|
| 4,729,200 |
|
| — |
|
| — |
|
| 143,000 |
| Corporate Office Properties |
|
| — |
|
| 4,197,050 |
|
| 976,000 |
|
| — |
| Deerfield Triarc Capital Corp |
|
| 13,371,200 |
|
| — |
|
| 380,000 |
|
| 434,000 |
| Developers Diversified Realty |
|
| 17,867,600 |
|
| 19,256,580 |
|
| — |
|
| 1,072,990 |
| Digital Realty Trust Inc. |
|
| — |
|
| 14,453,175 |
|
| 193,400 |
|
| — |
| Duke Realty Corp. |
|
| 6,459,560 |
|
| — |
|
| 1,087,000 |
|
| — |
| ECC Capital Corp. |
|
| 2,456,620 |
|
| — |
|
| 600,000 |
|
| — |
| Education Realty Trust Inc |
|
| 7,734,000 |
|
| — |
|
| — |
|
| 31,875 |
| Equity Lifestyle Properties |
|
| — |
|
| 1,139,532 |
|
| — |
|
| 147,518 |
| Equity Office Properties Trust |
|
| — |
|
| 4,295,724 |
|
| 180,000 |
|
| 180,000 |
| Equity Residential |
|
| 7,041,600 |
|
| 6,512,400 |
|
| 580,577 |
|
| 594,500 |
| Extra Space Storage Inc. |
|
| 8,940,886 |
|
| 7,924,685 |
|
| — |
|
| 413,873 |
| Falcon Financial Investment |
|
| — |
|
| 2,897,111 |
|
| 1,367,000 |
|
| 1,367,000 |
| Feldman Mall Properties |
|
| 16,417,670 |
|
| 17,784,670 |
|
| 111,600 |
|
| — |
| First Potomac Realty Trust |
|
| 2,968,560 |
|
| — |
|
| 110,000 |
|
| 110,000 |
| General Growth Properties |
|
| 5,168,900 |
|
| 3,977,600 |
|
| — |
|
| 75,000 |
| Glenborough Realty Trust Inc. |
|
| — |
|
| 1,596,000 |
|
| 404,800 |
|
| 912,000 |
| GMH Communities Trust |
|
| 6,278,448 |
|
| 12,859,200 |
|
| 348,700 |
|
| 38,818 |
| Gramercy Capital Corp. |
|
| 7,943,386 |
|
| 799,651 |
|
| 300,000 |
|
| 72,550 |
| Great Wolf Resorts Inc. |
|
| 3,093,000 |
|
| 1,620,767 |
|
| — |
|
| 75,000 |
| HealthCare Realty Trust Inc. |
|
| — |
|
| 3,052,500 |
|
| 562,000 |
|
| 350,000 |
| Hersha Hospitality Trust |
|
| 5,063,620 |
|
| 4,007,500 |
|
| 150,000 |
|
| — |
| Highland Hospitality Corp. |
|
| 1,657,500 |
|
| — |
|
| 60,000 |
|
| — |
| Hilton Hotels Corp. |
|
| 1,446,600 |
|
| — |
|
|
|
|
|
|
|
|
|
|
|
|
|
|
|
PRINCIPAL |
|
|
| VALUE |
| ||||||||
|
|
| |||||||||||
2006 |
| 2005 |
| ISSUER, CURRENT RATE AND MATURITY DATE |
| 2006 |
| 2005 |
| ||||
|
|
|
|
|
|
|
|
|
|
|
|
|
|
$ | — |
| $ | 10,085,000 |
| HBOS Treasury Srvcs Plc |
|
|
|
|
|
|
|
|
|
|
|
| 4.200% 2/15/06 |
| $ | — |
| $ | 10,033,163 |
| |
| 8,415,000 |
|
| — |
| HBOS Treasury Srvcs Plc |
|
|
|
|
|
|
|
|
|
|
|
|
| 5.260% 3/21/07 |
|
| 8,319,680 |
|
| — |
|
| 40,000,000 |
|
| — |
| HSBC Finance Corporation |
|
|
|
|
|
|
|
|
|
|
|
|
| 5.250% 1/26/07 |
|
| 39,859,012 |
|
| — |
|
| 19,000,000 |
|
| — |
| IBM (International Business Machine Corp) |
|
|
|
|
|
|
|
|
|
|
|
|
| 5.240% 1/10/07 |
|
| 18,966,750 |
|
| — |
|
| 22,200,000 |
|
| — |
| IBM Capital Inc. |
|
|
|
|
|
|
|
|
|
|
|
|
| 5.250% 3/16/07 |
|
| 21,963,166 |
|
| — |
|
| 25,000,000 |
|
| — |
| ING (US) Finance |
|
|
|
|
|
|
|
|
|
|
|
|
| 5.230% 3/27/07 |
|
| 24,695,265 |
|
| — |
|
| 24,000,000 |
|
| — |
| Johnson & Johnson |
|
|
|
|
|
|
|
|
|
|
|
|
| 5.200% 1/2/07 |
|
| 24,000,000 |
|
| — |
|
| 25,000,000 |
|
| — |
| Johnson & Johnson |
|
|
|
|
|
|
|
|
|
|
|
|
| 5.250% 1/18/07 |
|
| 24,941,555 |
|
| — |
|
| 20,259,000 |
|
| — |
| Kimberly—Clark Worldwide, Inc. |
|
|
|
|
|
|
|
|
|
|
|
|
| 5.265% 1/29/07 |
|
| 20,179,184 |
|
| — |
|
| — |
|
| 31,740,000 |
| Kitty Hawk Funding Corp. |
|
|
|
|
|
|
|
|
|
|
|
|
| 4.295% 1/12/06 |
|
| — |
|
| 31,705,086 |
|
| — |
|
| 10,000,000 |
| Kitty Hawk Funding Corp. |
|
|
|
|
|
|
|
|
|
|
|
|
| 1.680% 2/15/06 |
|
| — |
|
| 9,947,600 |
|
| — |
|
| 25,000,000 |
| Links Finance L.L.C. |
|
|
|
|
|
|
|
|
|
|
|
|
| 4.270% 2/10/06 |
|
| — |
|
| 24,884,750 |
|
| — |
|
| 25,000,000 |
| Links Finance L.L.C. |
|
|
|
|
|
|
|
|
|
|
|
|
| 4.380% 3/13/06 |
|
| — |
|
| 24,787,750 |
|
| 10,000,000 |
|
| — |
| Links Finance L.L.C. |
|
|
|
|
|
|
|
|
|
|
|
|
| 5.230% 1/16/07 |
|
| 9,979,190 |
|
| — |
|
| 30,000,000 |
|
| — |
| Morgan Stanley Dean Witter |
|
|
|
|
|
|
|
|
|
|
|
|
| 5.255% 2/12/07 |
|
| 29,819,598 |
|
| — |
|
| — |
|
| 10,000,000 |
| Paccar Financial Corp |
|
|
|
|
|
|
|
|
|
|
|
|
| 4.020% 1/12/06 |
|
| — |
|
| 9,989,200 |
|
| — |
|
| 13,655,000 |
| Paccar Financial Corp |
|
|
|
|
|
|
|
|
|
|
|
|
| 4.360% 3/3/06 |
|
| — |
|
| 13,557,913 |
|
| — |
|
| 10,000,000 |
| Park Avenue Receivables Corp |
|
|
|
|
|
|
|
|
|
|
|
|
| 2.150% 1/4/06 |
|
| — |
|
| 9,998,800 |
|
| — |
|
| 20,080,000 |
| Park Avenue Receivables Corp |
|
|
|
|
|
|
|
|
|
|
|
|
| 4.270% 1/27/06 |
|
| — |
|
| 20,021,166 |
|
| 11,601,000 |
|
| — |
| Pitney Bowes Inc |
|
|
|
|
|
|
|
|
|
|
|
|
| 5.240% 1/4/07 |
|
| 11,597,578 |
|
| — |
|
| — |
|
| 10,000,000 |
| Preferred Receivables Funding Corp |
|
|
|
|
|
|
|
|
|
|
|
|
| 4.130% 1/6/06 |
|
| — |
|
| 9,996,300 |
|
| — |
|
| 19,150,000 |
| Private Export Funding Corporation |
|
|
|
|
|
|
|
|
|
|
|
|
| 4.170% 2/7/06 |
|
| — |
|
| 19,070,145 |
|
| — |
|
| 15,000,000 |
| Private Export Funding Corporation |
|
|
|
|
|
|
|
|
|
|
|
|
| 4.080% 2/13/06 |
|
| — |
|
| 14,926,500 |
|
96 114|ProspectusTIAA Real Estate Account
|
|
|
Statement of investments| | TIAA Real Estate Account | |
| continued | |
|
|
|
|
|
|
|
|
|
|
|
|
|
|
SHARES |
|
|
| VALUE |
| ||||||||
|
|
|
| ||||||||||
| 2005 |
|
| 2004 |
| ISSUER |
|
| 2005 |
|
| 2004 |
|
|
|
|
|
|
|
|
|
|
|
|
|
|
|
| 80,000 |
|
| 168,000 |
| Home Properties Inc. |
| $ | 3,264,000 |
| $ | 7,224,000 |
|
| 450,000 |
|
| 325,000 |
| Homebanc Corp/Ga. |
|
| 3,366,000 |
|
| 3,146,000 |
|
| 300,000 |
|
| — |
| Host Marriott Corp. |
|
| 5,685,000 |
|
| — |
|
| — |
|
| 74,257 |
| Impac Mortgage Holdings Inc. |
|
| — |
|
| 1,683,406 |
|
| 300,000 |
|
| 300,000 |
| Interstate Hotels & Resorts |
|
| 1,311,000 |
|
| 1,608,000 |
|
| 80,000 |
|
| — |
| Istar Financial Inc |
|
| 2,852,000 |
|
| — |
|
| 1,958,000 |
|
| 1,908,000 |
| Jameson Inns Inc |
|
| 4,209,700 |
|
| 3,758,760 |
|
| 100,000 |
|
| — |
| JER Investors Trust Inc. |
|
| 1,695,000 |
|
| — |
|
| 108,000 |
|
| 54,000 |
| Kimco Realty Corp |
|
| 3,464,640 |
|
| 3,131,460 |
|
| 426,000 |
|
| 324,443 |
| Kite Realty Group Trust |
|
| 6,590,220 |
|
| 4,957,489 |
|
| 300,000 |
|
| — |
| KKR Financial Corp |
|
| 7,197,000 |
|
| — |
|
| 200,000 |
|
| — |
| Lasalle Hotel Properties |
|
| 7,344,000 |
|
| — |
|
| 120,000 |
|
| 215,078 |
| Lexington Corporate Properties Trust |
|
| 2,556,000 |
|
| 4,856,461 |
|
| 1,266,660 |
|
| 1,266,660 |
| Lodgian Inc |
|
| 13,591,262 |
|
| 15,579,918 |
|
| 200,000 |
|
| 162,000 |
| LTC Properties Inc |
|
| 4,206,000 |
|
| 3,225,420 |
|
| 75,000 |
|
| 150,000 |
| Macerich Company/The |
|
| 5,035,500 |
|
| 9,420,000 |
|
| 400,000 |
|
| 30,420 |
| Mack—Cali Realty Corp. |
|
| 17,280,000 |
|
| 1,400,233 |
|
| 200,000 |
|
| — |
| Medical Properties Trust Inc. |
|
| 1,956,000 |
|
| — |
|
| 40,000 |
|
| 40,000 |
| Mills Corp/The |
|
| 1,677,600 |
|
| 2,550,400 |
|
| 100,000 |
|
| 150,000 |
| Mission West Properties |
|
| 974,000 |
|
| 1,596,000 |
|
| 331,200 |
|
| — |
| Monmouth REIT—CLA |
|
| 2,656,224 |
|
| — |
|
| 300,000 |
|
| — |
| Mortgageit Holdings Inc |
|
| 4,098,000 |
|
| — |
|
| 130,000 |
|
| — |
| NewCastle Investment Corp |
|
| 3,230,500 |
|
| — |
|
| — |
|
| 270,000 |
| New York Mortgage Trust Inc |
|
| — |
|
| 3,024,000 |
|
| — |
|
| 100,000 |
| Northstar Realty Finance Cor |
|
| — |
|
| 1,145,000 |
|
| 100,000 |
|
| — |
| Novastar Financial Inc. |
|
| 2,811,000 |
|
| — |
|
| 525,000 |
|
| 525,000 |
| Origen Financial Inc. |
|
| 3,738,000 |
|
| 3,927,000 |
|
| 328,100 |
|
| 70,700 |
| Parkway Properties |
|
| 13,169,934 |
|
| 3,588,025 |
|
| — |
|
| 75,000 |
| Prentiss Properties Trust |
|
| — |
|
| 2,865,000 |
|
| 400,000 |
|
| 200,000 |
| Prologis Trust |
|
| 18,688,000 |
|
| 8,666,000 |
|
| 30,000 |
|
| — |
| Public Storage, Inc. |
|
| 2,031,600 |
|
| — |
|
| 100,000 |
|
| — |
| RAIT Investment Trust |
|
| 2,592,000 |
|
| — |
|
| — |
|
| 507,000 |
| Reckson Associates Realty Corp |
|
| — |
|
| 16,634,670 |
|
| 236,000 |
|
| 45,000 |
| Regency Centers Corp. |
|
| 13,912,200 |
|
| 2,493,000 |
|
| 384,000 |
|
| — |
| Republic Property Trust |
|
| 4,608,000 |
|
| — |
|
| 305,721 |
|
| 255,900 |
| Simon Property Group Inc. |
|
| 23,427,400 |
|
| 16,549,053 |
|
| 350,000 |
|
| — |
| Starwood Hotels & Resorts |
|
| 22,351,000 |
|
| — |
|
| 303,820 |
|
| 303,820 |
| Sunset Financial Resources |
|
| 2,576,394 |
|
| 3,162,766 |
|
| — |
|
| 315,000 |
| Sunstone Hotel Investors Inc. |
|
| — |
|
| 6,545,700 |
|
| 111,200 |
|
| 268,200 |
| Thomas Properties Group |
|
| 1,391,112 |
|
| 3,416,868 |
|
| 50,000 |
|
| 1,500,000 |
| Trizec Properties Inc. |
|
| 1,146,000 |
|
| 28,380,000 |
|
| 100,000 |
|
| 100,000 |
| United Dominion Realty Trust |
|
| 2,344,000 |
|
| 2,480,000 |
|
| 95,000 |
|
| 77,558 |
| Ventas Inc. |
|
| 3,041,900 |
|
| 2,125,865 |
|
| 200,000 |
|
| 50,000 |
| Vornado Realty Trust |
|
| 16,694,000 |
|
| 3,806,500 |
|
| 944 |
|
| — |
| Windrose Medical Properties |
|
| 14,028 |
|
| — |
|
|
|
|
|
|
|
|
|
|
| ||||
TOTAL REAL ESTATE EQUITY SECURITIES |
|
|
|
|
|
|
| ||||||
(Cost $411,877,936 and $284,166,107) |
|
| 426,781,565 |
|
| 327,785,808 |
| ||||||
|
|
|
| ||||||||||
|
|
|
|
|
|
|
|
|
|
|
|
|
|
PRINCIPAL |
|
|
| VALUE |
| ||||||||
|
|
| |||||||||||
2006 |
| 2005 |
| ISSUER, CURRENT RATE AND MATURITY DATE |
| 2006 |
| 2005 |
| ||||
|
|
|
|
|
|
|
|
|
|
|
|
|
|
$ | — |
| $ | 9,000,000 |
| Private Export Funding Corporation |
|
|
|
|
|
|
|
|
|
|
|
|
| 4.300% 3/9/06 |
| $ | — |
| $ | 8,929,260 |
|
| — |
|
| 5,000,000 |
| Private Export Funding Corporation |
|
|
|
|
|
|
|
|
|
|
|
|
| 4.335% 4/4/06 |
|
| — |
|
| 4,944,250 |
|
| 20,500,000 |
|
| — |
| Private Export Funding Corporation |
|
|
|
|
|
|
|
|
|
|
|
|
| 5.220% 1/3/07 |
|
| 20,496,976 |
|
| — |
|
| 1,845,000 |
|
| — |
| Private Export Funding Corporation |
|
|
|
|
|
|
|
|
|
|
|
|
| 5.300% 1/11/07 |
|
| 1,842,553 |
|
| — |
|
| 23,000,000 |
|
| — |
| Private Export Funding Corporation |
|
|
|
|
|
|
|
|
|
|
|
|
| 5.260% 1/18/07 |
|
| 22,945,922 |
|
| — |
|
| 6,000,000 |
|
| — |
| Private Export Funding Corporation |
|
|
|
|
|
|
|
|
|
|
|
|
| 5.230% 1/23/07 |
|
| 5,981,485 |
|
| — |
|
| 15,000,000 |
|
| — |
| Private Export Funding Corporation |
|
|
|
|
|
|
|
|
|
|
|
|
| 5.220% 2/15/07 |
|
| 14,903,199 |
|
| — |
|
| 14,120,000 |
|
| — |
| Private Export Funding Corporation |
|
|
|
|
|
|
|
|
|
|
|
|
| 5.230% 3/6/07 |
|
| 13,989,828 |
|
| — |
|
| — |
|
| 20,000,000 |
| Procter & Gamble |
|
|
|
|
|
|
|
|
|
|
|
|
| 4.025% 1/10/06 |
|
| — |
|
| 19,983,200 |
|
| — |
|
| 3,500,000 |
| Procter & Gamble |
|
|
|
|
|
|
|
|
|
|
|
|
| 4.090% 1/26/06 |
|
| — |
|
| 3,490,445 |
|
| 25,000,000 |
|
| — |
| Procter & Gamble |
|
|
|
|
|
|
|
|
|
|
|
|
| 5.225% 1/12/07 |
|
| 24,963,380 |
|
| — |
|
| 25,000,000 |
|
| — |
| Procter & Gamble International S.C |
|
|
|
|
|
|
|
|
|
|
|
|
| 5.250% 2/1/07 |
|
| 24,890,625 |
|
| — |
|
| 50,000,000 |
|
| — |
| Procter & Gamble International S.C |
|
|
|
|
|
|
|
|
|
|
|
|
| 5.230% 2/14/07 |
|
| 49,686,455 |
|
| — |
|
| — |
|
| 50,000,000 |
| Ranger Funding Company LLC |
|
|
|
|
|
|
|
|
|
|
|
|
| 4.075% 1/17/06 |
|
| — |
|
| 49,914,500 |
|
| 10,000,000 |
|
| — |
| Ranger Funding Company LLC |
|
|
|
|
|
|
|
|
|
|
|
|
| 5.250% 1/24/07 |
|
| 9,967,385 |
|
| — |
|
| 20,000,000 |
|
| — |
| Ranger Funding Company LLC |
|
|
|
|
|
|
|
|
|
|
|
|
| 5.260% 1/25/07 |
|
| 19,931,856 |
|
| — |
|
| 23,760,000 |
|
| — |
| Ranger Funding Company LLC |
|
|
|
|
|
|
|
|
|
|
|
|
| 5.260% 2/12/07 |
|
| 23,616,311 |
|
| — |
|
| — |
|
| 17,000,000 |
| Regions Bank (Alabama) |
|
|
|
|
|
|
|
|
|
|
|
|
| 4.180% 1/30/06 |
|
| — |
|
| 16,998,130 |
|
| 10,000,000 |
|
| — |
| Scaldis Capital LLC |
|
|
|
|
|
|
|
|
|
|
|
|
| 5.300% 1/10/07 |
|
| 9,988,068 |
|
| — |
|
| 25,000,000 |
|
| — |
| Sheffield Receivables Corporation |
|
|
|
|
|
|
|
|
|
|
|
|
| 5.250% 1/12/07 |
|
| 24,962,735 |
|
| — |
|
| 35,750,000 |
|
| — |
| Sheffield Receivables Corporation |
|
|
|
|
|
|
|
|
|
|
|
|
| 5.240% 1/17/07 |
|
| 35,670,156 |
|
| — |
|
| — |
|
| 540,000 |
| Sherwin—Williams Co |
|
|
|
|
|
|
|
|
|
|
|
|
| 4.080% 2/7/06 |
|
| — |
|
| 537,732 |
|
| — |
|
| 14,390,000 |
| Sigma Finance Inc |
|
|
|
|
|
|
|
|
|
|
|
|
| 3.890% 1/12/06 |
|
| — |
|
| 14,374,171 |
|
TIAA Real Estate AccountProspectus|| 97115
|
|
|
Statement of investments| | TIAA Real Estate Account | |
| continued | |
|
|
|
|
|
|
|
|
|
|
|
|
|
|
PRINCIPAL |
|
|
| VALUE |
| ||||||||
|
|
|
| ||||||||||
| 2005 |
|
| 2004 |
| ISSUER, CURRENT RATE AND MATURITY DATE |
|
| 2005 |
|
| 2004 |
|
| |||||||||||||
COMMERCIAL MORTGAGE BACKED SECURITIES—0.19% AND 0.54% |
|
|
|
|
|
|
| ||||||
$ | — |
| $ | 10,000,000 |
| Bear Stearns CMS 3.436% 05/14/16 |
| $ | — |
| $ | 10,006,950 |
|
| — |
|
| 10,000,000 |
| COMM 2004 HTL1 A1 4.008% 07/15/16 |
|
| — |
|
| 10,013,820 |
|
| 10,000,000 |
|
| 10,000,000 |
| GSMS 2001—Rock A2FL 4.680% 05/03/18 |
|
| 10,217,650 |
|
| 10,070,610 |
|
| 10,000,000 |
|
| 10,000,000 |
| MSDWC 2001—280 A2F 4.710% 02/03/16 |
|
| 10,061,730 |
|
| 9,915,150 |
|
| 1,601,634 |
|
| 1,940,947 |
| Trize 2001—TZHA A3FL 4.740% 03/15/13 |
|
| 1,601,653 |
|
| 1,951,830 |
|
|
|
|
|
|
|
|
|
|
| ||||
TOTAL COMMERCIAL MORTGAGE BACKED SECURITIES |
|
|
|
|
|
|
| ||||||
(Cost $21,604,079 and $41,943,872) |
|
| 21,881,033 |
|
| 41,958,360 |
| ||||||
|
|
|
| ||||||||||
TOTAL REAL ESTATE RELATED |
|
|
|
|
|
|
| ||||||
(Cost $433,482,015 and $326,109,979) |
|
| 448,662,598 |
|
| 369,744,168 |
| ||||||
|
|
|
|
|
|
|
|
|
| ||||
OTHER—14.28% AND 8.75% |
|
|
|
|
|
|
| ||||||
|
|
|
|
|
|
|
| ||||||
COMMERCIAL PAPER—11.67% AND 4.51% |
|
|
|
|
|
|
| ||||||
|
|
|
|
|
|
|
| ||||||
| 25,000,000 |
|
| — |
| Abbey National North America LLC 4.330% 01/05/06 |
|
| 24,994,000 |
|
| — |
|
| 25,000,000 |
|
| — |
| Abbey National PLC 4.280% 01/17/06 |
|
| 24,999,500 |
|
| — |
|
| 10,000,000 |
|
| — |
| Alabama Power Co 4.250% 01/12/06 |
|
| 9,989,100 |
|
| — |
|
| 25,000,000 |
|
| — |
| American Express Centurion Bank 4.310% 01/19/06 |
|
| 25,000,000 |
|
| — |
|
| 2,430,000 |
|
| 25,000,000 |
| American Honda Finance, Corp 4.240% 01/09/06 |
|
| 2,428,250 |
|
| 24,981,667 |
|
| 10,000,000 |
|
| — |
| Atlantis One Funding Corp 4.380% 02/24/06 |
|
| 9,936,500 |
|
| — |
|
| 25,000,000 |
|
| — |
| Atlantis One Funding Corp 4.210% 02/08/06 |
|
| 24,890,750 |
|
| — |
|
| 25,000,000 |
|
| — |
| Bank of Montreal 4.290% 01/26/06 |
|
| 24,999,500 |
|
| — |
|
| 30,000,000 |
|
| — |
| Barclay’s Bank, PLC 4.420% 03/14/06 |
|
| 29,998,200 |
|
| — |
|
| 15,000,000 |
|
| — |
| Barclay’s Bank, PLC 4.330% 08/30/06 |
|
| 14,999,400 |
|
| — |
|
| 18,040,000 |
|
| — |
| Becton Dickinson & Co. 4.210% 01/24/06 |
|
| 17,994,719 |
|
| — |
|
| 13,100,000 |
|
| 10,000,000 |
| Beta Finance, Inc 4.160% 01/12/06 |
|
| 13,085,590 |
|
| 9,991,445 |
|
| 11,000,000 |
|
| 15,000,000 |
| Beta Finance, Inc 4.070% 01/17/06 |
|
| 10,981,190 |
|
| 14,980,050 |
|
| — |
|
| 18,100,000 |
| BMW US Capital Corp 3.550% 10/06/05 |
|
| — |
|
| 18,077,073 |
|
| 20,000,000 |
|
| — |
| Calyon 4.100% 01/19/06 |
|
| 19,997,800 |
|
| — |
|
| 10,000,000 |
|
| — |
| Canadian Wheat Board (The) 4.320% 02/06/06 |
|
| 9,959,500 |
|
| — |
|
| 14,000,000 |
|
| 13,000,000 |
| CC (USA), Inc 4.000% 01/13/06 |
|
| 13,982,920 |
|
| 12,988,878 |
|
| 40,000,000 |
|
| 3,100,000 |
| Ciesco LP 4.280% 01/23/06 |
|
| 39,903,200 |
|
| 3,097,537 |
|
| 10,000,000 |
|
| — |
| Ciesco LP 4.370% 02/24/06 |
|
| 9,936,500 |
|
| — |
|
| 37,000,000 |
|
| — |
| Citigroup Funding Inc. 4.220% 01/20/06 |
|
| 36,925,260 |
|
| — |
|
| 13,000,000 |
|
| — |
| Citigroup Funding Inc. 4.350% 02/21/06 |
|
| 12,923,560 |
|
| — |
|
| 24,150,000 |
|
| — |
| Colgate-Palmolive Co 4.250% 01/06/06 |
|
| 24,141,306 |
|
| — |
|
|
|
|
|
|
|
|
|
|
|
|
|
|
|
| 15,000,000 |
|
| 25,000,000 |
| Corporate Asset Funding Corp, Inc 4.270% 01/13/06 |
|
| 14,981,700 |
|
| 24,949,625 |
|
| 5,035,000 |
|
| — |
| Corporate Asset Funding Corp, Inc 4.200% 01/23/06 |
|
| 5,022,815 |
|
| — |
|
| 16,000,000 |
|
| — |
| Corporate Asset Funding Corp, Inc 4.210% 01/25/06 |
|
| 15,957,440 |
|
| — |
|
| 5,905,000 |
|
| — |
| Corporate Asset Funding Corp, Inc 4.290% 01/31/06 |
|
| 5,884,982 |
|
| — |
|
| 2,020,000 |
|
| — |
| Corporate Asset Funding Corp, Inc 4.360% 02/17/06 |
|
| 2,008,930 |
|
| — |
|
| 25,000,000 |
|
| — |
| Deutsche Bank 4.270% 02/14/06 |
|
| 24,997,000 |
|
| — |
|
| 50,000,000 |
|
| — |
| Dexia Bank 4.280% 01/30/06 |
|
| 49,998,000 |
|
| — |
|
| 8,000,000 |
|
| — |
| Dorada Finance Inc 3.900% 01/23/06 |
|
| 7,980,640 |
|
| — |
|
| 20,000,000 |
|
| — |
| Dorada Finance Inc 4.350% 02/27/06 |
|
| 19,865,600 |
|
| — |
|
| 21,500,000 |
|
| — |
| Dorada Finance Inc 4.250% 02/16/06 |
|
| 21,384,975 |
|
| — |
|
| 13,000,000 |
|
| — |
| Edison Asset Securitization, LLC 4.190% 01/17/06 |
|
| 12,977,770 |
|
| — |
|
| 20,000,000 |
|
| — |
| Edison Asset Securitization, LLC 4.360% 02/22/06 |
|
| 19,877,800 |
|
| — |
|
|
|
|
|
|
|
|
|
|
|
|
|
|
|
PRINCIPAL |
|
|
| VALUE |
| ||||||||
|
|
| |||||||||||
2006 |
| 2005 |
| ISSUER, CURRENT RATE AND MATURITY DATE |
| 2006 |
| 2005 |
| ||||
|
|
|
|
|
|
|
|
|
|
|
|
|
|
$ | — |
| $ | 17,000,000 |
| Sigma Finance Inc |
|
|
|
|
|
|
|
|
|
|
|
|
| 4.230% 1/31/06 |
| $ | — |
| $ | 16,942,370 |
|
| — |
|
| 5,575,000 |
| Sigma Finance Inc |
|
|
|
|
|
|
|
|
|
|
|
|
| 4.340% 2/27/06 |
|
| — |
|
| 5,537,536 |
|
| — |
|
| 5,000,000 |
| Sigma Finance Inc |
|
|
|
|
|
|
|
|
|
|
|
|
| 3.940% 3/1/06 |
|
| — |
|
| 4,965,150 |
|
| — |
|
| 8,000,000 |
| Sigma Finance Inc |
|
|
|
|
|
|
|
|
|
|
|
|
| 4.390% 3/8/06 |
|
| — |
|
| 7,937,120 |
|
| 7,850,000 |
|
| — |
| Societe Generale North America, Inc |
|
|
|
|
|
|
|
|
|
|
|
|
| 5.255% 1/10/07 |
|
| 7,836,262 |
|
| — |
|
| 25,000,000 |
|
| — |
| Societe Generale North America, Inc |
|
|
|
|
|
|
|
|
|
|
|
|
| 5.250% 1/19/07 |
|
| 24,937,902 |
|
| — |
|
| — |
|
| 6,030,000 |
| Societe Generale North America, Inc |
|
|
|
|
|
|
|
|
|
|
|
|
| 4.390% 3/20/06 |
|
| — |
|
| 5,974,281 |
|
| 20,000,000 |
|
| — |
| SunTrust Banks, Inc. |
|
|
|
|
|
|
|
|
|
|
|
|
| 5.245% 5/1/07 |
|
| 20,001,700 |
|
| — |
|
| — |
|
| 27,600,000 |
| Swedish Export Credit Corp |
|
|
|
|
|
|
|
|
|
|
|
|
| 4.260% 1/18/06 |
|
| — |
|
| 27,550,596 |
|
| 14,675,000 |
|
| — |
| Swedish Export Credit Corp |
|
|
|
|
|
|
|
|
|
|
|
|
| 5.319% 1/10/07 |
|
| 14,657,788 |
|
| — |
|
| 33,895,000 |
|
| — |
| Swedish Export Credit Corp |
|
|
|
|
|
|
|
|
|
|
|
|
| 5.250% 1/16/07 |
|
| 33,825,624 |
|
| — |
|
| 30,000,000 |
|
| — |
| Swedish Export Credit Corp |
|
|
|
|
|
|
|
|
|
|
|
|
| 5.240% 2/13/07 |
|
| 29,816,250 |
|
| — |
|
| 5,800,000 |
|
| — |
| The Concentrate Manufacturing Company of |
|
|
|
|
|
|
|
|
|
|
|
|
| Ireland 5.260% 1/9/07 |
|
| 5,790,695 |
|
| — |
|
| 50,000,000 |
|
| — |
| Toyota Motor Credit Corp |
|
|
|
|
|
|
|
|
|
|
|
|
| 5.235% 1/23/07 |
|
| 49,846,580 |
|
| — |
|
| 30,000,000 |
|
| — |
| Toyota Motor Credit Corp |
|
|
|
|
|
|
|
|
|
|
|
|
| 5.230% 1/25/07 |
|
| 29,899,221 |
|
| — |
|
| — |
|
| 15,000,000 |
| Toyota Motor Credit Corp |
|
|
|
|
|
|
|
|
|
|
|
|
| 4.300% 10/10/06 |
|
| — |
|
| 15,000,900 |
|
| 19,000,000 |
|
| — |
| U.S. Bancorp |
|
|
|
|
|
|
|
|
|
|
|
|
| 5.245% 12/5/07 |
|
| 18,998,765 |
|
| — |
|
| — |
|
| 24,000,000 |
| UBS Finance, (Delaware) Inc |
|
|
|
|
|
|
|
|
|
|
|
|
| 4.310% 2/10/06 |
|
| — |
|
| 23,891,280 |
|
| — |
|
| 3,120,000 |
| UBS Finance, (Delaware) Inc |
|
|
|
|
|
|
|
|
|
|
|
|
| 1.760% 4/19/06 |
|
| — |
|
| 3,079,190 |
|
| 17,500,000 |
|
| — |
| UBS Finance, (Delaware) Inc |
|
|
|
|
|
|
|
|
|
|
|
|
| 5.230% 2/20/07 |
|
| 17,375,018 |
|
| — |
|
|
|
|
|
|
|
|
|
|
|
|
|
|
|
| 34,530,000 |
|
| — |
| Variable Funding Capital Corporation |
|
|
|
|
|
|
|
|
|
|
|
|
| 5.320% 2/2/07 |
|
| 34,371,217 |
|
| — |
|
| 30,000,000 |
|
| — |
| Variable Funding Capital Corporation |
|
|
|
|
|
|
|
|
|
|
|
|
| 5.250% 2/5/07 |
|
| 29,848,698 |
|
| — |
|
| 25,000,000 |
|
| — |
| Variable Funding Capital Corporation |
|
|
|
|
|
|
|
|
|
|
|
|
| 5.250% 2/6/07 |
|
| 24,870,208 |
|
| — |
|
98 116|ProspectusTIAA Real Estate Account
|
|
|
Statement of investments| | TIAA Real Estate Account | |
| continued | |
|
|
|
|
|
|
|
|
|
|
|
|
|
|
|
|
|
|
|
|
|
|
|
|
|
|
|
PRINCIPAL | PRINCIPAL |
| VALUE |
| PRINCIPAL |
| VALUE |
| ||||||||||||||||||
| ||||||||||||||||||||||||||
2006 | 2006 |
| 2005 |
| ISSUER, CURRENT RATE AND MATURITY DATE |
| 2006 |
| 2005 |
| ||||||||||||||||
|
|
|
|
|
| |||||||||||||||||||||
$ | — |
| $25,000,000 |
| Variable Funding Capital Corporation |
|
| |||||||||||||||||||
|
|
|
| 4.000% 1/5/06 |
| $ | — |
| $ | 24,993,750 |
| |||||||||||||||
| 2005 |
| 2004 |
| ISSUER, CURRENT RATE AND MATURITY DATE |
| 2005 |
| 2004 |
| — |
| 5,010,000 |
| Washington Gas Light Co |
|
| |||||||||
|
| 4.330% 1/9/06 |
| — |
| 5,006,393 |
| |||||||||||||||||||
|
| — |
| 20,000,000 |
| Wells Fargo |
|
| ||||||||||||||||||
$ | 7,248,000 |
| $ | — |
| Edison Asset Securitization, LLC 4.420% 04/07/06 |
| $ | 7,162,981 |
| $ | — |
| |||||||||||||
|
|
| 4.320% 2/9/06 |
| — |
| 19,999,600 |
| ||||||||||||||||||
| — |
| 19,460,000 |
| Yorktown Capital, LLC |
|
| |||||||||||||||||||
|
|
| 4.190% 1/4/06 |
| — |
| 19,457,665 |
| ||||||||||||||||||
| — |
| 4,066,000 |
| Yorktown Capital, LLC |
|
| |||||||||||||||||||
|
|
| 4.275% 1/6/06 |
| — |
| 4,064,496 |
| ||||||||||||||||||
| — |
| 2,625,000 |
| Yorktown Capital, LLC |
|
| |||||||||||||||||||
|
|
| 4.280% 2/10/06 |
| — |
| 2,611,893 |
| ||||||||||||||||||
| 23,415,000 |
| — |
| Yorktown Capital, LLC |
|
| |||||||||||||||||||
|
|
| 1.340% 1/4/07 |
| 23,408,027 |
| — |
| ||||||||||||||||||
|
|
|
|
| ||||||||||||||||||||||
TOTAL COMMERCIAL PAPER | TOTAL COMMERCIAL PAPER |
|
| |||||||||||||||||||||||
(Cost $1,672,398,634 and $1,340,511,661) | (Cost $1,672,398,634 and $1,340,511,661) |
| 1,672,544,145 |
| 1,340,656,583 |
| ||||||||||||||||||||
|
|
|
| |||||||||||||||||||||||
|
|
|
|
| ||||||||||||||||||||||
GOVERNMENT AGENCY BONDS—2.36% AND 2.61% | GOVERNMENT AGENCY BONDS—2.36% AND 2.61% |
|
| |||||||||||||||||||||||
| 20,000,000 |
| — |
| FCAR Owner Trust I 4.340% 02/07/06 |
| 19,915,000 |
| — |
|
|
|
|
| ||||||||||||
| 17,000,000 |
| — |
| First Tennessee National Bank 4.330% 02/06/06 |
| 16,999,660 |
| — |
| 17,700,000 |
| — |
| Federal Home Loan Banks |
|
| |||||||||
| — |
| 2,670,000 |
| Fortune Brands 2.060% 01/11/05 |
| — |
| 2,668,205 |
|
|
| 5.135% 1/5/07 |
| 17,694,938 |
| — |
| ||||||||
| 21,590,000 |
| — |
| General Electric Capital Corp 4.440% 04/28/06 |
| 21,282,342 |
| — |
| 19,745,000 |
| — |
| Federal Home Loan Banks |
|
| |||||||||
| 25,000,000 |
| — |
| General Electric Capital Corp 4.520% 06/28/06 |
| 24,435,000 |
| — |
|
|
| 5.190% 1/12/07 |
| 19,719,628 |
| — |
| ||||||||
| 35,000,000 |
| — |
| Goldman Sachs Group, LP 4.280% 02/03/06 |
| 34,870,150 |
| — |
| 39,969,000 |
| — |
| Federal Home Loan Banks |
|
| |||||||||
| 10,000,000 |
| 15,000,000 |
| Govco Incorporated 4.080% 01/18/06 |
| 9,981,700 |
| 14,990,833 |
|
|
| 5.130% 1/19/07 |
| 39,877,711 |
| — |
| ||||||||
| 9,000,000 |
| 10,000,000 |
| Govco Incorporated 4.390% 03/14/06 |
| 8,922,420 |
| 9,986,700 |
| 23,753,000 |
| — |
| Federal Home Loan Banks |
|
| |||||||||
| 29,140,000 |
| — |
| Govco Incorporated 4.040% 01/09/06 |
| 29,118,436 |
| — |
|
|
| 2.330% 2/28/07 |
| 23,563,451 |
| — |
| ||||||||
| 5,015,000 |
| — |
| Grampian Funding LLC 4.320% 01/23/06 |
| 5,002,814 |
| — |
| — |
| 7,030,000 |
| Federal Home Loan Banks |
|
| |||||||||
| 20,000,000 |
| — |
| Grampian Funding LLC 4.040% 02/01/06 |
| 19,929,600 |
| — |
|
|
| 1.750% 1/3/06 |
| — |
| 7,027,383 |
| ||||||||
| 10,000,000 |
| 25,000,000 |
| Greyhawk Funding LLC 4.000% 01/06/06 |
| 9,996,300 |
| 24,948,000 |
| — |
| 50,000,000 |
| Federal Home Loan Mortgage Corporation |
|
| |||||||||
| — |
| 10,750,000 |
| Harley— Davidson Funding Corp 2.230% 02/14/05 |
| — |
| 10,718,556 |
|
|
| 4.150% 1/31/06 |
| — |
| 49,839,500 |
| ||||||||
| 25,000,000 |
| — |
| Harrier Finance Funding (US) LLC 3.930% 01/25/06 |
| 24,933,500 |
| — |
| 13,654,000 |
| — |
| Federal Home Loan Mortgage Corporation |
|
| |||||||||
| 10,085,000 |
| — |
| HBOS Treasury Srvcs Plc 4.200% 02/15/06 |
| 10,033,163 |
| — |
|
|
| 2.190% 1/2/07 |
| 13,654,000 |
| — |
| ||||||||
| 31,740,000 |
| 15,000,000 |
| Kitty Hawk Funding Corp 4.300% 01/12/06 |
| 31,705,086 |
| 14,975,300 |
| 22,250,000 |
| — |
| Federal Home Loan Mortgage Corporation |
|
| |||||||||
| 10,000,000 |
| 9,565,000 |
| Kitty Hawk Funding Corp 3.890% 02/15/06 |
| 9,947,600 |
| 9,550,461 |
|
|
| 1.250% 1/16/07 |
| 22,208,704 |
| — |
| ||||||||
| 25,000,000 |
| — |
| Links Finance L.L.C. 4.300% 02/10/06 |
| 24,884,750 |
| — |
| 43,400,000 |
| — |
| Federal Home Loan Mortgage Corporation |
|
| |||||||||
| 25,000,000 |
| — |
| Links Finance L.L.C. 4.380% 03/13/06 |
| 24,787,750 |
| — |
|
|
| 5.151% 1/24/07 |
| 43,269,887 |
| — |
| ||||||||
| 10,000,000 |
| 10,000,000 |
| Paccar Financial Corp 4.020% 01/12/06 |
| 9,989,200 |
| 9,984,800 |
| 50,000,000 |
| — |
| Federal Home Loan Mortgage Corporation |
|
| |||||||||
| 13,655,000 |
| — |
| Paccar Financial Corp 4.360% 03/03/06 |
| 13,557,913 |
| — |
|
|
| 1.240% 1/30/07 |
| 49,807,250 |
| — |
| ||||||||
| 20,080,000 |
| — |
| Park Avenue Receivables Corp 4.270% 01/27/06 |
| 20,021,166 |
| — |
| 33,675,000 |
| — |
| Federal Home Loan Mortgage Corporation |
|
| |||||||||
| 10,000,000 |
| — |
| Park Avenue Receivables Corp 4.290% 01/04/06 |
| 9,998,800 |
| — |
|
|
| 5.150% 1/31/07 |
| 33,540,367 |
| — |
| ||||||||
| 10,000,000 |
| — |
| Preferred Receivables Funding Corp 4.130% 01/06/06 |
| 9,996,300 |
| — |
| — |
| 30,000,000 |
| Federal Home Loan Mortgage Corporation |
|
| |||||||||
| 15,000,000 |
| 10,000,000 |
| Private Export Funding Corporation 4.080% 02/13/06 |
| 14,926,500 |
| 9,992,667 |
|
|
| 2.380% 1/3/06 |
| — |
| 30,000,000 |
| ||||||||
| 5,000,000 |
| — |
| Private Export Funding Corporation 4.440% 04/04/06 |
| 4,944,250 |
| — |
| — |
| 3,840,000 |
| Federal Home Loan Mortgage Corporation |
|
| |||||||||
| 9,000,000 |
| — |
| Private Export Funding Corporation 4.300% 03/09/06 |
| 8,929,260 |
| — |
|
|
| 1.780% 1/9/06 |
| — |
| 3,837,350 |
| ||||||||
| 19,150,000 |
| — |
| Private Export Funding Corporation 4.170% 02/07/06 |
| 19,070,145 |
| — |
| — |
| 18,000,000 |
| Federal Home Loan Mortgage Corporation |
|
| |||||||||
| 20,000,000 |
| — |
| Proctor & Gamble 4.030% 01/10/06 |
| 19,983,200 |
| — |
|
|
| 4.210% 2/9/06 |
| — |
| 17,922,240 |
| ||||||||
| 3,500,000 |
| — |
| Proctor & Gamble 4.090% 01/26/06 |
| 3,490,445 |
| — |
| ||||||||||||||||
| — |
| 25,000,000 |
| Rabobank USA Financial Corp 3.640% 11/28/05 |
| — |
| 24,946,375 |
| ||||||||||||||||
| 50,000,000 |
| — |
| Ranger Funding Company LLC 4.290% 01/17/06 |
| 49,914,500 |
| — |
| ||||||||||||||||
| 17,000,000 |
| — |
| Regions Bank (Alabama) 4.180% 01/30/06 |
| 16,998,130 |
| — |
| ||||||||||||||||
| — |
| 23,135,000 |
| Royal Bank of Canada 3.660% 11/08/05 |
| — |
| 23,108,626 |
| ||||||||||||||||
| — |
| 16,430,000 |
| Royal Bank of Scotland PLC 3.680% 11/16/05 |
| — |
| 16,393,690 |
| ||||||||||||||||
| 540,000 |
| 2,000,000 |
| Sherwin—Williams Co 4.070% 02/07/06 |
| 537,732 |
| 1,997,467 |
| ||||||||||||||||
| 14,390,000 |
| 15,000,000 |
| Sigma Finance Inc 4.030% 01/12/06 |
| 14,374,171 |
| 14,965,875 |
| ||||||||||||||||
| 8,000,000 |
| — |
| Sigma Finance Inc 4.390% 03/08/06 |
| 7,937,120 |
| — |
| ||||||||||||||||
| 5,000,000 |
| — |
| Sigma Finance Inc 3.940% 03/01/06 |
| 4,965,150 |
| — |
| ||||||||||||||||
| 17,000,000 |
| — |
| Sigma Finance Inc 4.220% 01/31/06 |
| 16,942,370 |
| — |
| ||||||||||||||||
| 5,575,000 |
| — |
| Sigma Finance Inc 4.340% 02/27/06 |
| 5,537,536 |
| — |
| ||||||||||||||||
| 6,030,000 |
| — |
| Societe Generale North America, Inc 4.400% 03/20/06 |
| 5,974,283 |
| — |
| ||||||||||||||||
| 27,600,000 |
| — |
| Swedish Export Credit Corp 4.260% 01/18/06 |
| 27,550,596 |
| — |
| ||||||||||||||||
| 15,000,000 |
| — |
| Toyota Motor Credit Corp 4.300% 10/10/06 |
| 15,000,900 |
| — |
| ||||||||||||||||
| — |
| 25,000,000 |
| Toronto Dominion Bank 3.160% 09/14/05 |
| — |
| 24,977,213 |
| ||||||||||||||||
| 24,000,000 |
| 25,000,000 |
| UBS Finance, (Delaware) Inc 4.310% 02/10/06 |
| 23,891,280 |
| 24,990,500 |
| ||||||||||||||||
TIAA Real Estate AccountProspectus|| 99117
|
|
|
Statement of investments| | TIAA Real Estate Account | |
| concluded | |
|
|
|
|
|
|
|
|
|
|
|
|
|
|
PRINCIPAL |
|
|
| VALUE |
| ||||||||
|
|
|
| ||||||||||
| 2005 |
|
| 2004 |
| ISSUER, CURRENT RATE AND MATURITY DATE |
|
| 2005 |
|
| 2004 |
|
$ | 3,120,000 |
| $ | — |
| UBS Finance, (Delaware) Inc 4.440% 04/19/006 |
| $ | 3,079,190 |
| $ | — |
|
| 25,000,000 |
|
| — |
| Variable Funding Capital Corporation 4.000% 01/05/06 |
|
| 24,993,750 |
|
| — |
|
| 5,010,000 |
|
| — |
| Washington Gas Light Co 4.330% 01/09/06 |
|
| 5,006,393 |
|
| — |
|
| 20,000,000 |
|
| — |
| Wells Fargo 4.320% 02/09/06 |
|
| 19,999,600 |
|
| — |
|
| 19,460,000 |
|
| — |
| Yorktown Capital, LLC 4.19% 01/04/06 |
|
| 19,457,665 |
|
| — |
|
| 2,625,000 |
|
| — |
| Yorktown Capital, LLC 4.280% 02/10/06 |
|
| 2,611,893 |
|
| — |
|
| 4,066,000 |
|
| — |
| Yorktown Capital, LLC 4.350% 01/06/06 |
|
| 4,064,496 |
|
| — |
|
|
|
|
|
|
|
|
|
|
| ||||
TOTAL COMMERCIAL PAPER |
|
|
|
|
|
|
|
| |||||
(Cost $1,340,511,661 and $348,329,276) |
|
|
| 1,340,656,583 |
|
| 348,261,543 |
| |||||
|
|
|
|
| |||||||||
|
|
|
|
|
|
|
|
| |||||
GOVERNMENT AGENCY BONDS—2.61% AND 4.24% |
|
|
|
|
|
|
| ||||||
|
|
|
|
|
|
|
|
| |||||
| — |
|
| 9,380,000 |
| Federal Farm Credit Banks 1.780% 03/15/05 |
|
| — |
|
| 9,334,882 |
|
| — |
|
| 8,603,000 |
| Federal Farm Credit Banks 1.220% 01/07/05 |
|
| — |
|
| 8,599,403 |
|
| 7,030,000 |
|
| 7,860,000 |
| Federal Home Loan Banks 3.400% 01/03/06 |
|
| 7,027,383 |
|
| 7,798,928 |
|
| — |
|
| 18,000,000 |
| Federal Home Loan Banks 3.380% 10/11/05 |
|
| — |
|
| 17,992,475 |
|
| — |
|
| 22,825,000 |
| Federal Home Loan Banks 3.590% 10/12/05 |
|
| — |
|
| 22,795,841 |
|
| — |
|
| 20,700,000 |
| Federal Home Loan Banks 3.640% 11/04/05 |
|
| — |
|
| 20,636,761 |
|
| — |
|
| 11,245,000 |
| Federal Home Loan Banks 3.230% 09/02/05 |
|
| — |
|
| 11,227,214 |
|
| — |
|
| 8,510,000 |
| Federal Home Loan Banks 2.950% 07/01/05 |
|
| — |
|
| 8,471,280 |
|
| 30,000,000 |
|
| 20,000,000 |
| Federal Home Loan Mortgage Corp 3.910% 01/03/06 |
|
| 30,000,000 |
|
| 19,995,222 |
|
| 18,000,000 |
|
| 15,000,000 |
| Federal Home Loan Mortgage Corp 4.210% 02/09/06 |
|
| 17,922,240 |
|
| 14,993,546 |
|
| 50,000,000 |
|
| 15,540,000 |
| Federal Home Loan Mortgage Corp 4.210% 01/31/06 |
|
| 49,839,500 |
|
| 15,516,366 |
|
| 3,840,000 |
|
| — |
| Federal Home Loan Mortgage Corp 3.740% 01/09/06 |
|
| 3,837,351 |
|
| — |
|
| 37,615,000 |
|
| 22,280,000 |
| Federal National Mortgage Association 4.150% 01/10/06 |
|
| 37,584,908 |
|
| 22,094,408 |
|
| 23,940,000 |
|
| 50,000,000 |
| Federal National Mortgage Association 4.240% 02/23/06 |
|
| 23,797,557 |
|
| 49,942,208 |
|
| 46,555,000 |
|
| 25,000,000 |
| Federal National Mortgage Association 4.100% 01/11/06 |
|
| 46,512,169 |
|
| 24,980,590 |
|
| 29,320,000 |
|
| 31,925,000 |
| Federal National Mortgage Association 4.200% 02/02/06 |
|
| 29,217,380 |
|
| 31,919,281 |
|
| 1,766,000 |
|
| 32,184,000 |
| Federal National Mortgage Association 3.960% 02/15/06 |
|
| 1,757,135 |
|
| 32,174,390 |
|
| 50,000,000 |
|
| 9,270,000 |
| Federal National Mortgage Association 4.240% 02/17/06 |
|
| 49,737,500 |
|
| 9,255,335 |
|
| 3,015,000 |
|
| — |
| Federal National Mortgage Association 4.110% 02/01/06 |
|
| 3,004,809 |
|
| — |
|
|
|
|
|
|
|
|
|
|
| ||||
TOTAL GOVERNMENT AGENCY BONDS |
|
|
|
|
|
|
| ||||||
(Cost $300,164,529 and $327,794,989) |
|
|
| 300,237,932 |
|
| 327,728,130 |
| |||||
|
|
|
|
| |||||||||
TOTAL OTHER |
|
|
|
|
|
|
|
|
|
|
| ||
(Cost $1,640,676,190 and $676,124,265) |
|
| 1,640,894,515 |
|
| 675,989,673 |
| ||||||
|
|
|
| ||||||||||
TOTAL MARKETABLE SECURITIES |
|
|
|
|
|
|
| ||||||
(Cost $2,074,158,205 and $1,002,234,244) |
|
| 2,089,557,113 |
|
| 1,045,733,841 |
| ||||||
|
|
|
|
|
|
|
|
|
| ||||
TOTAL INVESTMENTS—100.00% |
|
|
|
|
|
|
|
| |||||
| (Cost $10,546,969,360 and $7,403,520,075) |
| $ | 11,485,741,406 |
| $ | 7,725,918,490 |
| |||||
|
|
|
|
| |||||||||
|
|
|
|
|
|
|
|
|
|
|
|
|
|
PRINCIPAL |
|
|
| VALUE |
| ||||||||
|
|
| |||||||||||
2006 |
| 2005 |
| ISSUER, CURRENT RATE AND MATURITY DATE |
| 2006 |
| 2005 |
| ||||
|
|
|
|
|
|
|
|
|
|
|
|
|
|
$ | — |
| $ | 46,555,000 |
| Federal National Mortgage |
|
|
|
|
|
|
|
|
|
|
|
|
| 4.350% 1/11/06 |
| $ | — |
| $ | 46,512,169 |
|
| 30,000,000 |
|
| — |
| Federal National Mortgage Association |
|
|
|
|
|
|
|
|
|
|
|
|
| 1.260% 2/6/07 |
|
| 29,854,650 |
|
| — |
|
| 23,768,000 |
|
| — |
| Federal National Mortgage Association |
|
|
|
|
|
|
|
|
|
|
|
|
| 1.740% 1/8/07 |
|
| 23,751,029 |
|
| — |
|
| 50,000,000 |
|
| — |
| Federal National Mortgage Association |
|
|
|
|
|
|
|
|
|
|
|
|
| 1.240% 3/21/07 |
|
| 49,452,450 |
|
| — |
|
| — |
|
| 37,615,000 |
| Federal National Mortgage Association |
|
|
|
|
|
|
|
|
|
|
|
|
| 2.290% 1/10/06 |
|
| — |
|
| 37,584,908 |
|
| — |
|
| 3,015,000 |
| Federal National Mortgage Association |
|
|
|
|
|
|
|
|
|
|
|
|
| 1.830% 2/1/06 |
|
| — |
|
| 3,004,809 |
|
| — |
|
| 29,320,000 |
| Federal National Mortgage Association |
|
|
|
|
|
|
|
|
|
|
|
|
| 4.200% 2/2/06 |
|
| — |
|
| 29,217,380 |
|
| — |
|
| 1,766,000 |
| Federal National Mortgage Association |
|
|
|
|
|
|
|
|
|
|
|
|
| 1.740% 2/15/06 |
|
| — |
|
| 1,757,135 |
|
| — |
|
| 50,000,000 |
| Federal National Mortgage Association |
|
|
|
|
|
|
|
|
|
|
|
|
| 4.240% 2/17/06 |
|
| — |
|
| 49,737,500 |
|
| — |
|
| 23,940,000 |
| Federal National Mortgage Association |
|
|
|
|
|
|
|
|
|
|
|
|
| 4.240% 2/23/06 |
|
| — |
|
| 23,797,558 |
|
|
|
|
|
|
|
|
|
| |||||
TOTAL GOVERNMENT AGENCY BONDS |
|
|
|
|
|
|
| ||||||
(Cost $366,282,560 and $300,164,529) |
|
| 366,394,065 |
|
| 300,237,932 | |||||||
|
|
| |||||||||||
TOTAL OTHER MARKETABLE SECURITIES |
|
|
|
|
|
|
| ||||||
(Cost $2,038,681,194 and $1,640,676,190) |
|
| 2,038,938,210 |
|
| 1,640,894,515 |
| ||||||
|
|
| |||||||||||
TOTAL MARKETABLE SECURITIES |
|
|
|
|
|
|
| ||||||
(Cost $2,608,007,989 and $2,074,158,205) |
|
| 2,743,860,533 |
|
| 2,089,557,113 |
| ||||||
|
|
| |||||||||||
| |||||||||||||
MORTGAGE LOAN RECEIVABLE—0.48% AND 0.00% |
|
|
|
|
|
|
| ||||||
|
|
|
|
|
|
|
|
|
|
|
|
|
|
PRINCIPAL |
|
|
| VALUE |
| ||||||||
|
|
| |||||||||||
2006 |
| 2005 |
| BORROWER, CURRENT RATE AND MATURITY DATE |
| 2006 |
| 2005 |
| ||||
| 75,000,000 |
|
| — |
| Klingle Corporation |
|
|
|
|
|
|
|
|
|
|
|
|
| 6.17% 07/10/11 |
|
| 74,660,626 |
|
| — |
|
|
|
| |||||||||||
TOTAL MORTGAGE LOAN RECEIVABLE |
|
|
|
|
|
|
| ||||||
(Cost $75,000,000) |
|
| 74,660,626 |
|
| — |
| ||||||
|
|
| |||||||||||
TOTAL INVESTMENTS |
|
|
|
|
|
|
| ||||||
(Cost $13,558,801,945 and $10,516,032,644) |
| $ | 15,510,036,850 |
| $ | 11,485,741,406 |
| ||||||
|
|
| |||||||||||
|
|
|
|
|
|
|
| ||||||
|
|
(1) | The investment has a mortgage loan payable outstanding, as indicated in Note 5. |
(2) | Leasehold interest only. |
(3) | Located throughout the U.S. |
(4) | The market value reflects the Account’s interest in the joint venture, net of any debt. |
100 118|ProspectusTIAA Real Estate Account
Report of Independent Registered Public Accounting Firm
To the Participants of the TIAA Real Estate Account and the
Board of Trustees of Teachers Insurance and Annuity Association of America:
In our opinion, the accompanying statements of assets and liabilities, including the statement of investments, and the related statements of operations, changes in net assets and cash flows, present fairly, in all material respects, the financial position of the TIAA Real Estate Account (the “Account”) at December 31, 2005 and 2006, the results of its operations and its cash flows for the yearyears then ended in conformity with accounting principles generally accepted in the United States of America. These financial statements are the responsibility of the Account’s management. Our responsibility is to express an opinion on these financial statements based on our audit.audits. We conducted our auditaudits of these statements in accordance with the standards of the Public Company Accounting Oversight Board (United States). Those standards require that we plan and perform the audit to obtain reasonable assurance about whether the financial statements are free of material misstatement. An audit includes examining, on a test basis, evidence supporting the amounts and disclosures in the financial statements, assessing the accounting principles used and significant estimates made by management, and evaluating the overall financial statement presentation. We believe that our audit providesaudits provide a reasonable basis for our opinion.
/s/ PricewaterhouseCoopers LLP
New York, New York
March 14, 2006
15, 2007
TIAA Real Estate AccountProspectus|| 101119
Report of Independent Registered Public Accounting Firm
To the Participants of the TIAA Real Estate Account and the
Board of Trustees of Teachers Insurance and Annuity Association of America:
We have audited the accompanying statementstatements of operations, changes in net assets and liabilitiescash flows of the TIAA Real Estate Account (“Account”) of Teachers Insurance and Annuity Association of America (“TIAA”), including for the statement of investments, as of December 31, 2004, and the related statements of operations, changes in net assets and cash flows for each of the two years in the periodyear ended December 31, 2004. These financial statements are the responsibility of TIAA’s management. Our responsibility is to express an opinion on these financial statements based on our audits.audit.
We conducted our auditsaudit in accordance with the standards of the Public Company Accounting Oversight Board (United States). Those standards require that we plan and perform the audit to obtain reasonable assurance about whether the financial statements are free of material misstatement. An audit includes examining, on a test basis, evidence supporting the amounts and disclosures in the financial statements. An audit also includes assessing the accounting principles used and significant estimates made by management, as well as evaluating the overall financial statement presentation. We believe that our audits provideaudit provides a reasonable basis for our opinion.
In our opinion, the financial statements referred to above present fairly, in all material respects, the financial positionresults of operations, changes in net assets and cash flows of the Account at December 31, 2004, andfor the results of its operations, changes in its net assets and its cash flows for each of the two years in the periodyear ended December 31, 2004, in conformity with U.S. generally accepted accounting principles.
/s/ Ernst & Young LLP
New York, New York
April 14, 2005
102 120|ProspectusTIAA Real Estate Account
Proforma Condensed Statement of Assets and Liabilities (Unaudited)
TIAA Real Estate Account
For the Year Ended December 31, 2005
|
|
|
|
|
|
|
|
|
|
|
|
|
|
|
|
|
|
|
|
|
As of December 31, 2006 |
|
|
|
|
|
|
| |||||||||||||
|
| Historical |
| Adjustments |
| Proforma |
|
| Historical |
| Adjustments |
| Proforma |
| ||||||
| ||||||||||||||||||||
ASSETS |
|
|
|
|
|
|
|
| ||||||||||||
Real estate, and other real estate-related investments |
| $ | 9,396,184,293 |
| $ | 34,692,647 | (a) | $ | 9,430,876,940 |
| ||||||||||
Real estate and other real estate-related investments |
| $ | 12,691,515,691 |
| $ | 2,889,456,503 | (a) | $ | 15,580,972,194 |
| ||||||||||
Marketable securities |
| 2,089,557,113 |
| — |
| 2,089,557,113 |
|
| 2,743,860,533 |
| — |
| 2,743,860,533 |
| ||||||
Other |
| 199,685,007 |
| — |
| 199,685,007 |
|
| 324,585,109 |
| — |
| 324,585,109 |
| ||||||
| ||||||||||||||||||||
TOTAL ASSETS |
| 11,685,426,413 |
| 34,692,647 |
| 11,720,119,060 |
|
| 15,759,961,333 |
| 2,889,456,503 |
| 18,649,417,836 |
| ||||||
| ||||||||||||||||||||
Mortgage notes payable |
| 973,502,186 |
| 34,692,647 | (a) |
| 1,008,194,833 |
|
| 1,437,149,148 |
| 2,889,456,503 | (a) |
| 4,326,605,651 |
| ||||
Payable for securities transactions |
| 993,809 |
| — |
| 993,809 |
|
| 1,219,323 |
| — |
| 1,219,323 |
| ||||||
Accrued real estate property level expenses and taxes |
| 145,789,277 |
| — |
| 145,789,277 |
|
| 169,657,402 |
| — |
| 169,657,402 |
| ||||||
Security deposits held |
| 16,430,039 |
| — |
| 16,430,039 |
|
| 19,242,948 |
| — |
| 19,242,948 |
| ||||||
| ||||||||||||||||||||
TOTAL LIABILITIES |
| 1,136,715,311 |
| 34,692,647 |
| 1,171,407,958 |
|
| 1,627,268,821 |
| 2,889,456,503 |
| 4,516,725,324 |
| ||||||
| ||||||||||||||||||||
NET ASSETS |
| $ | 10,548,711,102 |
| $ | — |
| $ | 10,548,711,102 |
|
| $ | 14,132,692,512 |
| $ | — |
| $ | 14,132,692,512 |
|
| ||||||||||||||||||||
TIAA Real Estate AccountProspectus| | 103121
Proforma Condensed Statement of Operations (Unaudited)
TIAA Real Estate Account
For the Year Ended December 31, 2005
|
|
|
|
|
|
|
|
|
|
|
|
|
|
|
|
|
|
|
|
|
For the Year Ended December 31, 2006 |
|
|
|
|
|
|
| |||||||||||||
|
| Historical |
| Adjustments |
| Proforma |
|
| Historical |
| Adjustments |
| Proforma |
| ||||||
| ||||||||||||||||||||
Rental income |
| $ | 618,633,580 |
| $ | 138,006,406 | (b) | $ | 756,639,986 |
|
| $ | 834,455,788 |
| $ | 110,540,084 | (b) | $ | 944,995,872 |
|
| ||||||||||||||||||||
Operating expenses |
| 150,501,136 |
| 34,662,461 | (b) |
| 185,163,597 |
|
| 207,452,982 |
| 31,567,152 | (b) |
| 239,020,134 |
| ||||
Real estate taxes |
| 88,014,264 |
| 19,747,623 | (b) |
| 107,761,887 |
|
| 110,059,852 |
| 14,143,847 | (b) |
| 124,203,699 |
| ||||
Interest expense |
| 40,028,630 |
| 52,378,626 | (b) |
| 92,407,256 |
|
| 72,160,111 |
| 82,609,148 | (b) |
| 154,769,259 |
| ||||
| ||||||||||||||||||||
Total real estate property expenses and taxes |
| 278,544,030 |
| 106,788,710 |
| 385,332,740 |
|
| 389,672,945 |
| 128,320,147 |
| 517,993,092 |
| ||||||
| ||||||||||||||||||||
Real estate income, net |
| 340,089,550 |
| 31,217,696 |
| 371,307,246 |
|
| 444,782,843 |
| (17,780,063 | ) |
| 427,002,780 |
| |||||
Income from real estate joint ventures |
| 63,580,501 |
| — |
| 63,580,501 |
| |||||||||||||
Income from real estate joint ventures and limited partnerships |
| 84,671,528 |
| 48,440,533 | (c) |
| 133,112,061 |
| ||||||||||||
Interest and dividends |
| 79,245,154 |
| — |
| 79,245,154 |
|
| 135,407,210 |
| — |
| 135,407,210 |
| ||||||
| ||||||||||||||||||||
TOTAL INCOME, NET |
| 482,915,205 |
| 31,217,696 |
| 514,132,901 |
|
| 664,861,581 |
| 30,660,470 |
| 695,522,051 |
| ||||||
EXPENSES |
| 56,100,197 |
| 11,062,591 | (c) |
| 67,162,788 |
|
| 83,448,664 |
| 11,695,465 | (d) |
| 95,144,129 |
| ||||
| ||||||||||||||||||||
INVESTMENT INCOME, NET |
| 426,815,008 |
| 20,155,105 |
| 446,970,113 |
|
| 581,412,917 |
| 18,965,005 |
| 600,377,922 |
| ||||||
REALIZED AND UNREALIZED GAINS |
| 765,970,272 |
| — |
| 765,970,272 |
|
| 1,032,787,765 |
| — |
| 1,032,787,765 |
| ||||||
| ||||||||||||||||||||
NET INCREASE IN NET ASSETS RESULTING FROM OPERATIONS |
| $ | 1,192,785,280 |
| $ | 20,155,105 |
| $ | 1,212,940,385 |
|
| $ | 1,614,200,682 |
| $ | 18,965,005 |
| $ | 1,633,165,687 |
|
| ||||||||||||||||||||
104 122|ProspectusTIAA Real Estate Account
Notes to Proforma Condensed Financial Statements (Unaudited)
TIAA Real Estate Account
Note 1—Purpose and Assumptions
As required by the Securities and Exchange Commission under Regulation S-X Article 11-01(5), these proforma condensed financial statements of the TIAA Real Estate Account (“Account”) have been prepared because the Account has made significant purchases of real estate propertiesproperty investments during the period from January 1, 2005 through the date of this prospectus. During 2005, the Account purchased 24 properties: eight office properties, eight industrial properties, six apartment properties and two retail properties. During the period from January 1, 2006 through the date of this prospectus. During 2006, the Account purchased 23 property investments: nine office properties, seven industrial properties, three apartment properties, three retail properties and an 85% interest in a joint venture that owns four retail centers. During the period from January 1, 2007 through the date of this prospectus, the Account purchased one industrial property.office property, one retail property in Paris, France and an 85% interest in a joint venture that owns 66 retail centers. Information regarding some of these properties is included under “Recent Property Purchases and Sales”Transactions” on page 27.31.
Various assumptions have been made in order to prepare these proforma condensed financial statements. The proforma condensed statement of assets and liabilities has been prepared assuming the real estate property investments purchased during the period from January 1, 2007 through the date of this prospectus were purchased as of December 31, 2006. The proforma condensed statement of operations for the year ended December 31, 2006 has been prepared assuming real estate property investments purchased during the period from January 1, 2006 through the date of this prospectus were purchased as of December 31, 2005. The proforma condensed statement of operations for the year ended December 31, 2005 has been prepared assuming real estate properties purchased during the period from January 1, 2005 through the date of this prospectus were purchased as of January 1, 2005.2006.
Note 2—Proforma Adjustments
The following proforma adjustments were made in preparing the proforma condensed financial statements to reflect the purpose described in Note 1.