
Registration Statement No. 333-112978333-
SECURITIES AND EXCHANGE COMMISSION
AMENDMENT NO. 3
Blackbaud, Inc.
| Delaware | 7372 | 11-2617163 | ||
| (State or other jurisdiction of incorporation or organization) | (Primary Standard Industrial Classification Code Number) | (I.R.S. Employer Identification No.) |
2000 Daniel Island Drive
Robert J. Sywolski
Copies to:
| Donald R. Reynolds, Esq. Kevin A. Prakke, Esq. Wyrick Robbins Yates & Ponton LLP 4101 Lake Boone Trail, Suite 300 Raleigh, North Carolina 27607 Telephone: (919) 781-4000 Facsimile: (919) 781-4865 |
Approximate date of commencement of proposed sale to the public: As soon as practicableFrom time to time after the effective date of this registration statement.
If any of the securities being registered on this Form are to be offered on a delayed or continuous basis pursuant to Rule 415 under the Securities Act, check the following box. ox
If this Form is filed to register additional securities for an offering pursuant to Rule 462(b) under the Securities Act, check the following box and list the Securities Act registration statement number of the earlier effective registration statement for the same offering. o
If this Form is a post-effective amendment filed pursuant to Rule 462(c) under the Securities Act, check the following box and list the Securities Act registration statement number of the earlier effective registration statement for the same offering. o
If this Form is a post-effective amendment filed pursuant to Rule 462(d) under the Securities Act, check the following box and list the Securities Act registration statement number of the earlier effective registration statement for the same offering. o
If delivery of the prospectus is expected to be made pursuant to Rule 434, please check the following box. o
CALCULATION OF REGISTRATION FEE
| Proposed Maximum | ||||
| Aggregate Offering | Amount of | |||
| Title of Each Class of Securities to be Registered | Price(1) | Registration Fee | ||
| Common Stock, par value $0.001 per share | $138,950,000 | $16,354.42 | ||
| (1) | Estimated solely for purposes of calculating the registration fee under Rule 457(c) under the Securities Act, based on the average of the high and low prices of the common stock on the Nasdaq National Market on January 12, 2005. |
The registrant hereby amends this registration statement on such date or dates as may be necessary to delay its effective date until the registrant shall file a further amendment which specifically states that this registration statement shall thereafter become effective in accordance with Section 8(a) of the Securities Act or until the registration statement shall become effective on such date as the Commission, acting pursuant to said Section 8(a), may determine.
| The information in this prospectus is not complete and may be changed. We may not sell these securities until the registration statement filed with the SEC is effective. This prospectus is not an offer to sell these securities, and we are not soliciting an offer to buy these securities in any state where the offer or sale is not permitted. |
Subject to completion, dated , 2004January 18, 2005
Prospectus
10,000,000 shares
Common stock
This isprospectus relates to the initial public offeringoffer and sale from time to time of up to an aggregate of 10,000,000 shares of our common stock of Blackbaud, Inc. All offor the sharesaccount of common stock being sold in this offering are being sold by the selling stockholders named in this prospectus. We will not receiveThe selling stockholders may sell the common stock from time to time in public transactions or in privately negotiated transactions, without limitation, through any proceeds frommeans described in the section hereof entitled “Plan of Distribution”, at market prices prevailing at the time of sale or at negotiated prices. The timing and amount of shares in this offering. The estimated initial public offering price is between $ and $ per share.
We have indicated toany sale are within the underwriters an intention to purchase, simultaneously with this underwritten offering and based on the midpointsole discretion of the price range shownselling stockholders.
Our common stock is listed on the cover of this prospectus, shares of our common stock directly from Anthony E. Bakker in a private, non-underwritten transaction at the net per share price to be received by the selling stockholders in this underwritten offering. The repurchase, if consummated, is conditioned on the simultaneous completion of this underwritten offering.
Prior to this offering, there has been no public market for our common stock. We have applied for listing of our common stock on The Nasdaq National Market under the symbol BLKB.
The selling stockholders have granted the underwriters an optionYou should read this prospectus and any prospectus supplement carefully before you invest. See “Where You Can Find More Information” for a period of 30 days to purchase up to additional shares of common stock.more information.
See “Risk factors” beginning on page 76 to read about factors you should consider before buying shares of our common stock.
Neither the SEC nor any state securities commission has approved or disapproved of these securities or passed on the adequacy or accuracy of this prospectus. Any representation to the contrary is a criminal offense.
, 2004

Table of contents
| Page | ||||
| Prospectus summary | 1 | |||
| Risk factors | ||||
| Forward-looking statements | ||||
| Use of proceeds | ||||
| Dividend policy | ||||
| Capitalization | ||||
| Dilution | ||||
| Selected consolidated financial data | ||||
| Management’s discussion and analysis of financial condition and results of operations | ||||
| Business | 49 | |||
| Management | 66 | |||
| Principal and selling stockholders | 75 | |||
| Certain relationships and related transactions | ||||
| Description of capital stock | ||||
| U.S. federal tax considerations for non-U.S. holders of common stock | ||||
| Legal matters | ||||
| Experts | ||||
| Where you can find more information | ||||
| Index to consolidated financial statements | F-1 | |||
i
Prospectus summary
This summary highlights selected information contained elsewhere in this prospectus. This summary does not contain all the information you should consider before investing in shares of our common stock. Except as otherwise noted herein, all information in this prospectus reflects [a one-for- reverse stock split of our outstanding shares of common stock and] our reincorporation under the laws of the State of Delaware to be effected in July 2004 prior to the closing of the offering made hereby. You should read this entire prospectus carefully, including “Risk factors” beginning on page 76 and our consolidated financial statements and the related notes thereto, before making an investment decision.
Blackbaud, Inc.
We are the leading global provider of software and related services designed specifically for nonprofit organizations. Our products and services enable nonprofit organizations to increase donations, reduce fundraising costs, improve communications with constituents, manage their finances and optimize internal operations. We have focused solely on the nonprofit market since our incorporation in 1982 and have developed our suite of products and services based upon our extensive knowledge of the operating challenges facing nonprofit organizations. In 2003,2004, we had over 12,50012,700 customers, over 11,90012,300 of which pay us annual maintenance and support fees. Our customers operate in multiple verticals within the nonprofit market including religion, education, foundations, health and human services, arts and cultural, public and societal benefits, environment and animal welfare, and international and foreign affairs.
Industry
Nonprofit organizations are a large part of the U.S. economy, employing one out of every ten Americans. There were greater than 1.41.5 million registered U.S. nonprofit organizations in 20022003 according to data from the Internal Revenue Service. In addition, there are greater than 1.5 million nonprofit organizations outside the United States. Donations to nonprofit organizations in the United States were $241 billion in 2002,2003, having increased almost every year since 1962, with a compound annual growth rate over that period of 7.8%, according to Giving USA. In addition, these organizations received fees of approximately $600 billion in the twelve months prior to December 2003 for services they provided.
Nonprofit organizations often utilize methods of fundraising that are costly and inefficient, largely because of the difficulties in effectively collecting, sharing and using information. Fundraising and administration costs are significant, with the fundraising component alone amounting to more than $0.24 for each dollar donated based on our market research. Furthermore, nonprofit organizations face distinct operational challenges, such as soliciting small cash contributions from numerous contributors and complying with unique accounting, tax and reporting issues. Because of these fundraising costs and operational challenges, we believe nonprofit organizations can benefit from software applications and services specifically designed to serve their particular needs.
1
Our products and services
Our suite of products and services includes:
| • | The Raiser’s Edge®, a complete fundraising software solution that helps nonprofit organizations improve relationships with their donors and constituents to more effectively raise money; |
| • | The Financial Edge™, a complete financial management solution that addresses the specific fund accounting needs of nonprofit organizations; |
1
| • | The Education Edge™, a student information management software suite designed primarily for K-12 independent schools; |
| • | The Patron Edge™, a comprehensive ticketing management solution that streamlines ticketing, marketing, staffing and other administrative tasks; |
| • | The Information Edge™, a comprehensive business intelligence application that extracts, aggregates and analyzes data to improve strategic decision making; |
| • | |
| • | NetCommunity™ and NetSolutions™, internet applications that enable our customers to establish online communities and conduct online fundraising. |
We have web-enabled most of our applications to allow our customers to access them over the Internet. We also offer a variety of Internet applications and consulting services that allow nonprofit organizations to leverage the Internet for online fundraising and other important operations. In addition, we provide a broad range of services, including implementation, business process improvement, training and education services, and maintenance and technical support to enable our customers to more effectively run their organizations.
Our strategy
Our objective is to maintain and leverage our position as the leading provider of software and related services designed specifically for nonprofit organizations. Key elements of our strategy to achieve this objective are to:
| • | grow our customer base; |
| • | maintain and expand existing customer relationships; |
| • | introduce additional products and services; |
| • | leverage the Internet as a means of additional growth; |
| • | expand international presence; and |
| • | pursue strategic acquisitions and alliances. |
Sales and marketing
We primarily sell our products and services to nonprofit organizations through our direct sales force. Our customers enter into license agreements and pay us an upfront license fee and annual maintenance and support fees for our software. We also receive fees, on a subscription and fixed price basis, for our hosted services and access to our data enrichment and analytical services. We sell the majority of our consulting and technical services on a time and materials basis.
Over the past three years we have added an average of 1,3001,400 new customers per year. Our customers are located in 4547 countries, primarily the United States, the United Kingdom and Canada. Ongoing customer relationships that illustrate our broad customer base include the American Red Cross, the Chesapeake Bay Foundation, the Crohn’s & Colitis Foundation of
2
Company information
We originally incorporated in New York in 1982 and moved our operations to Charleston, South Carolina in 1989. We reincorporated in South Carolina in December 1991, engaged in a recapitalization in October 1999 and reincorporated under the laws of the State of Delaware on July ,16, 2004. Our principal executive offices are located at 2000 Daniel Island Drive, Charleston, South Carolina 29492, and our telephone number at that location is (843) 216-6200. Our web site address iswww.blackbaud.com. The information contained on our web site is not a part of, and should not be construed as being incorporated by reference into, this prospectus.
3
The offering
The number of shares of common stock to be outstanding after this offering excludes:
Unless otherwise indicated, all information contained in this prospectus:
4
Summary consolidated financial data
The following table sets forth a summarydata, insofar as it relates to each of ourthe years 1998 -2003, has been derived from annual financial statements, including the consolidated financial databalance sheets at December 31, 2003 and 2002 and the related consolidated statements of operations, cash flows and shareholders’ equity (deficit) and comprehensive income for the periods presented.three years ended December 31, 2003 and notes thereto appearing elsewhere herein. The consolidated financial statements for the year ended December 31, 1998 were audited by other auditors. The consolidated financial statements for the fiscal year ended December 31, 1999 were audited by Arthur Andersen LLP, which has since ceased operations. The data for the nine months ended September 30, 2004 and 2003 has been derived from unaudited financial statements also appearing herein and which, in the opinion of management, include all adjustments, consisting only of normal recurring adjustments, necessary for a fair statement of the results for the unaudited interim periods. This summary consolidated financial data should be read together with “Selected consolidated financial data”, “Management’s discussion and analysis of financial condition and results of operations” and our consolidated financial statements and related notes contained elsewhere in this prospectus. See “Capitalization”.
| Three months | Nine months | |||||||||||||||||||||||||||||||||||||||||||||||||||||||||||||||||||
| Year ended December 31, | ended March 31, | Year ended December 31, | ended September 30, | |||||||||||||||||||||||||||||||||||||||||||||||||||||||||||||||||
| (in thousands, except per share data) | (in thousands, except per share data) | 1998(2)(3) | 1999(2)(3) | 2000(3) | 2001 | 2002 | 2003 | 2003 | 2004 | (in thousands, except per share data) | 1998(2)(3) | 1999(2)(3) | 2000(3) | 2001 | 2002 | 2003 | 2003 | 2004 | ||||||||||||||||||||||||||||||||||||||||||||||||||
| Consolidated statements of operations data: | Consolidated statements of operations data: | (unaudited) | Consolidated statements of operations data: | |||||||||||||||||||||||||||||||||||||||||||||||||||||||||||||||||
Revenue | Revenue | Revenue | ||||||||||||||||||||||||||||||||||||||||||||||||||||||||||||||||||
| License fees | $ | 29,408 | $ | 37,938 | $ | 24,471 | $ | 19,300 | $ | 20,572 | $ | 21,339 | $ | 4,504 | $ | 5,077 | License fees | $ | 29,408 | $ | 37,938 | $ | 24,471 | $ | 19,300 | $ | 20,572 | $ | 21,339 | $ | 15,427 | $ | 18,614 | |||||||||||||||||||||||||||||||||||
| Services | 10,716 | 17,309 | 14,266 | 18,797 | 26,739 | 34,042 | 7,744 | 9,545 | Services | 10,716 | 17,309 | 14,266 | 18,797 | 26,739 | 34,042 | 25,888 | 32,678 | |||||||||||||||||||||||||||||||||||||||||||||||||||
| Maintenance and subscriptions | 22,446 | 29,680 | 39,042 | 47,022 | 52,788 | 58,360 | 14,099 | 15,779 | Maintenance and subscriptions | 22,446 | 29,680 | 39,042 | 47,022 | 52,788 | 58,360 | 43,271 | 48,886 | |||||||||||||||||||||||||||||||||||||||||||||||||||
| Other revenue | 3,062 | 7,550 | 5,838 | 4,915 | 5,130 | 4,352 | 962 | 954 | Other revenue | 3,062 | 7,550 | 5,838 | 4,915 | 5,130 | 4,352 | 2,906 | 2,849 | |||||||||||||||||||||||||||||||||||||||||||||||||||
| Total revenue | 65,632 | 92,477 | 83,617 | 90,034 | 105,229 | 118,093 | 27,309 | 31,355 | Total revenue | 65,632 | 92,477 | 83,617 | 90,034 | 105,229 | 118,093 | 87,492 | 103,027 | |||||||||||||||||||||||||||||||||||||||||||||||||||
Cost of revenue | Cost of revenue | Cost of revenue | ||||||||||||||||||||||||||||||||||||||||||||||||||||||||||||||||||
| Cost of license fees | 709 | 989 | 1,284 | 1,726 | 2,547 | 2,819 | 567 | 729 | Cost of license fees | 709 | 989 | 1,284 | 1,726 | 2,547 | 2,819 | 2,110 | 2,733 | |||||||||||||||||||||||||||||||||||||||||||||||||||
Cost of services(1) | 4,339 | 5,534 | 7,028 | 10,253 | 14,234 | 21,006 | 4,911 | 5,378 | Cost of services(1) | 4,339 | 5,534 | 7,028 | 10,253 | 14,234 | 21,006 | 15,347 | 15,988 | |||||||||||||||||||||||||||||||||||||||||||||||||||
Cost of maintenance and subscriptions(1) | 11,443 | 15,246 | 15,120 | 11,733 | 10,588 | 11,837 | 2,835 | 2,660 | Cost of maintenance and subscriptions(1) | 11,443 | 15,246 | 15,120 | 11,733 | 10,588 | 11,837 | 9,031 | 7,864 | |||||||||||||||||||||||||||||||||||||||||||||||||||
| Cost of other revenue | 1,559 | 2,160 | 1,972 | 2,750 | 3,611 | 3,712 | 805 | 860 | Cost of other revenue | 1,559 | 2,160 | 1,972 | 2,750 | 3,611 | 3,712 | 2,556 | 2,577 | |||||||||||||||||||||||||||||||||||||||||||||||||||
| Total cost of revenue | 18,050 | 23,929 | 25,404 | 26,462 | 30,980 | 39,374 | 9,118 | 9,627 | Total cost of revenue | 18,050 | 23,929 | 25,404 | 26,462 | 30,980 | 39,374 | 29,044 | 29,162 | |||||||||||||||||||||||||||||||||||||||||||||||||||
Gross profit | Gross profit | 47,582 | 68,548 | 58,213 | 63,572 | 74,249 | 78,719 | 18,191 | 21,728 | Gross profit | 47,582 | 68,548 | 58,213 | 63,572 | 74,249 | 78,719 | 58,448 | 73,865 | ||||||||||||||||||||||||||||||||||||||||||||||||||
| Sales and marketing | 11,337 | 13,719 | 12,326 | 15,173 | 19,173 | 21,883 | 5,062 | 6,360 | Sales and marketing | 11,337 | 13,719 | 12,326 | 15,173 | 19,173 | 21,883 | 15,991 | 20,646 | |||||||||||||||||||||||||||||||||||||||||||||||||||
| Research and development | 9,604 | 13,923 | 13,912 | 14,755 | 14,385 | 15,516 | 3,620 | 4,276 | Research and development | 9,604 | 13,923 | 13,912 | 14,755 | 14,385 | 15,516 | 11,506 | 13,245 | |||||||||||||||||||||||||||||||||||||||||||||||||||
| General and administrative | 8,938 | 12,833 | 10,390 | 9,031 | 10,631 | 11,085 | 2,823 | 2,851 | General and administrative | 8,938 | 12,833 | 10,390 | 9,031 | 10,631 | 11,085 | 8,042 | 9,093 | |||||||||||||||||||||||||||||||||||||||||||||||||||
| Amortization | 2,574 | 2,510 | 2,200 | 2,239 | 1,045 | 848 | 48 | 32 | Amortization | 2,574 | 2,510 | 2,200 | 2,239 | 1,045 | 848 | 800 | 32 | |||||||||||||||||||||||||||||||||||||||||||||||||||
| Cost of initial public offering | — | — | — | — | — | — | — | 950 | Cost of initial public offering | — | — | — | — | — | — | — | 2,455 | |||||||||||||||||||||||||||||||||||||||||||||||||||
| Stock option compensation | — | — | — | — | — | 23,691 | 5,446 | 667 | Stock option compensation | — | — | — | — | — | 23,691 | 17,326 | 55 | |||||||||||||||||||||||||||||||||||||||||||||||||||
| Total operating expenses | 32,453 | 42,985 | 38,828 | 41,198 | 45,234 | 73,023 | 16,999 | 15,136 | Total operating expenses | 32,453 | 42,985 | 38,828 | 41,198 | 45,234 | 73,023 | 53,665 | 45,526 | |||||||||||||||||||||||||||||||||||||||||||||||||||
Income from operations | Income from operations | 15,129 | 25,563 | 19,385 | 22,374 | 29,015 | 5,696 | 1,192 | 6,592 | Income from operations | 15,129 | 25,563 | 19,385 | 22,374 | 29,015 | 5,696 | 4,783 | 28,339 | ||||||||||||||||||||||||||||||||||||||||||||||||||
| Interest income | 1,032 | 716 | 241 | 96 | 138 | 97 | 26 | 25 | Interest income | 1,032 | 716 | 241 | 96 | 138 | 97 | 70 | 133 | |||||||||||||||||||||||||||||||||||||||||||||||||||
| Interest expense | (638 | ) | (2,752 | ) | (11,265 | ) | (7,963 | ) | (4,410 | ) | (2,559 | ) | (863 | ) | (213 | ) | Interest expense | (638 | ) | (2,752 | ) | (11,265 | ) | (7,963 | ) | (4,410 | ) | (2,559 | ) | (2,216 | ) | (268 | ) | |||||||||||||||||||||||||||||||||||
| Other income (expense), net | 6,310 | (79 | ) | (185 | ) | (113 | ) | 63 | 235 | 15 | 349 | Other income (expense), net | 6,310 | (79 | ) | (185 | ) | (113 | ) | 63 | 235 | (100 | ) | 342 | ||||||||||||||||||||||||||||||||||||||||||||
Income before provision for income taxes | Income before provision for income taxes | 21,833 | 23,448 | 8,176 | 14,394 | 24,806 | 3,469 | 370 | 6,753 | Income before provision for income taxes | 21,833 | 23,448 | 8,176 | 14,394 | 24,806 | 3,469 | 2,537 | 28,546 | ||||||||||||||||||||||||||||||||||||||||||||||||||
| Income tax provision (benefit) | 158 | (1,456 | ) | 3,080 | 5,488 | 9,166 | 3,947 | 421 | 2,756 | Income tax provision (benefit) | 158 | (1,456 | ) | 3,080 | 5,488 | 9,166 | 3,947 | 2,886 | 11,619 | |||||||||||||||||||||||||||||||||||||||||||||||||
Net income (loss) | Net income (loss) | $ | 21,675 | $ | 24,904 | $ | 5,096 | $ | 8,906 | $ | 15,640 | $ | (478 | ) | $ | (51 | ) | $ | 3,997 | Net income (loss) | $ | 21,675 | $ | 24,904 | $ | 5,096 | $ | 8,906 | $ | 15,640 | $ | (478 | ) | $ | (349 | ) | $ | 16,927 | ||||||||||||||||||||||||||||||
| Earnings (loss) per share | Earnings (loss) per share | Earnings (loss) per share | ||||||||||||||||||||||||||||||||||||||||||||||||||||||||||||||||||
| Basic | $ | — | $ | — | $ | 0.08 | $ | 0.13 | $ | 0.23 | $ | (0.01 | ) | $ | (0.00 | ) | $ | 0.06 | Basic | $ | — | $ | — | $ | 0.13 | $ | 0.21 | $ | 0.37 | $ | (0.01 | ) | $ | (0.01 | ) | $ | 0.40 | |||||||||||||||||||||||||||||||
| Diluted | $ | — | $ | — | $ | 0.08 | $ | 0.13 | $ | 0.23 | $ | (0.01 | ) | $ | (0.00 | ) | $ | 0.05 | Diluted | $ | — | $ | — | $ | 0.13 | $ | 0.21 | $ | 0.37 | $ | (0.01 | ) | $ | (0.01 | ) | $ | 0.36 | |||||||||||||||||||||||||||||||
| Common shares and equivalents outstanding | Common shares and equivalents outstanding | Common shares and equivalents outstanding | ||||||||||||||||||||||||||||||||||||||||||||||||||||||||||||||||||
| Basic weighted average shares | N/A | N/A | 64,443 | 66,389 | 67,777 | 67,833 | 67,777 | 67,858 | Basic weighted average shares | N/A | N/A | 40,277 | 41,492 | 42,360 | 42,396 | 42,391 | 42,480 | |||||||||||||||||||||||||||||||||||||||||||||||||||
| Diluted weighted average shares | N/A | N/A | 64,443 | 66,389 | 67,777 | 67,833 | 67,777 | 73,823 | Diluted weighted average shares | N/A | N/A | 40,277 | 41,492 | 42,360 | 42,396 | 42,391 | 46,467 | |||||||||||||||||||||||||||||||||||||||||||||||||||
Summary of stock option compensation: | Summary of stock option compensation: | Summary of stock option compensation: | ||||||||||||||||||||||||||||||||||||||||||||||||||||||||||||||||||
| Cost of services | $ | — | $ | — | $ | — | $ | — | $ | — | $ | 3,342 | $ | 622 | $ | 294 | Cost of services | $ | — | $ | — | $ | — | $ | — | $ | — | $ | 3,342 | $ | 2,291 | $ | (644 | ) | ||||||||||||||||||||||||||||||||||
| Cost of maintenance and subscriptions | — | — | — | — | — | 505 | 93 | 37 | Cost of maintenance and subscriptions | — | — | — | — | — | 505 | 344 | (106 | ) | ||||||||||||||||||||||||||||||||||||||||||||||||||
| Total cost of revenue | — | — | — | — | — | 3,847 | 715 | 331 | Total cost of revenue | — | — | — | — | — | 3,847 | 2,635 | (750 | ) | ||||||||||||||||||||||||||||||||||||||||||||||||||
| Sales and marketing | — | — | — | — | — | 1,817 | 336 | 254 | Sales and marketing | — | — | — | — | — | 1,817 | 1,201 | (194 | ) | ||||||||||||||||||||||||||||||||||||||||||||||||||
| Research and development | — | — | — | — | — | 2,341 | 456 | 174 | Research and development | — | — | — | — | — | 2,341 | 1,639 | (517 | ) | ||||||||||||||||||||||||||||||||||||||||||||||||||
| General and administrative | — | — | — | — | — | 19,533 | 4,654 | 239 | General and administrative | — | — | — | — | — | 19,533 | 14,486 | 766 | |||||||||||||||||||||||||||||||||||||||||||||||||||
| Total operating expenses | — | — | — | — | — | 23,691 | 5,446 | 667 | Total operating expenses | — | — | — | — | — | 23,691 | 17,326 | 55 | |||||||||||||||||||||||||||||||||||||||||||||||||||
| Total stock option compensation | $ | — | $ | — | $ | — | $ | — | $ | — | $ | 27,538 | $ | 6,161 | $ | 998 | Total stock option compensation | $ | — | $ | — | $ | — | $ | — | $ | — | $ | 27,538 | $ | 19,961 | $ | (695 | ) | ||||||||||||||||||||||||||||||||||
| (1) | Includes stock option compensation as set forth in Summary of stock option compensation. |
| (2) | Earnings per share not computed for this year because we were an S corporation until our recapitalization in October 1999 and therefore the information would not be meaningful. |
| (3) | Certain amounts in the 1998, 1999 and 2000 financial statements have been reclassified to conform to the 2003 financial statement presentation. These reclassifications have no effect on previously reported net income (loss), shareholders’ equity or net income (loss) per share. |
54
| March 31, 2004 (unaudited) | ||||||||||||
| September 30, 2004 (unaudited) | ||||||||||||
| (in thousands) | Actual | As adjusted(4) | ||||||||||
Consolidated balance sheet data: | ||||||||||||
| Cash and cash equivalents | $ | 6,085 | $ | $ | 33,382 | |||||||
| Deferred tax asset | 86,725 | |||||||||||
| Deferred tax asset, including current portion | 81,210 | |||||||||||
| Working capital | (28,442 | ) | (11,879 | ) | ||||||||
| Total assets | 118,242 | 142,585 | ||||||||||
| Deferred revenue | 43,765 | 51,727 | ||||||||||
| Long-term debt and capital lease obligations, excluding current portion | 7 | — | ||||||||||
| Total liabilities | 53,443 | 66,266 | ||||||||||
| Common stock | 41,728 | 43 | ||||||||||
| Additional paid-in capital | 38,056 | |||||||||||
| Total stockholders’ equity | $ | 64,799 | $ | $ | 76,319 | |||||||
65
Risk factors
An investment in our common stock involves a high degree of risk. You should carefully consider the following risk factors and the other information in this prospectus, including our consolidated financial statements and the related notes thereto, before investing in our common stock. Our business, operating results and financial condition could be seriously harmed by any of the following risks. The trading price of our common stock could decline due to any of these risks, in which case you could lose all or part of your investment.
Risks related to our business
The market for software and services for nonprofit organizations might not grow, and nonprofit organizations might not continue to adopt our products and services.
Many nonprofit organizations have not traditionally used integrated and comprehensive software and services for their nonprofit-specific needs. We cannot be certain that the market for such products and services will continue to develop and grow or that nonprofit organizations will elect to adopt our products and services rather than continue to use traditional, less automated methods, attempt to develop software internally, rely upon legacy software systems, or use generalized software solutions not specifically designed for the nonprofit market. Nonprofit organizations that have already invested substantial resources in other fundraising methods or other non-integrated software solutions might be reluctant to adopt our products and services to supplement or replace their existing systems or methods. In addition, the implementation of one or more of our core software products can involve significant time and capital commitments by our customers, which they may be unwilling or unable to make. If demand for and market acceptance of our products and services does not increase, we might not grow our business as we expect.
We might not generate increased business from our current customers, which could limit our revenue in the future.
Our business model is highly dependent on the success of our efforts to increase sales to our existing customers. Many of our customers initially make a purchase of only one or a limited number of our products or only for a single department within their organization. These customers might choose not to expand their use of or make additional purchases of our products and services. If we fail to generate additional business from our current customers, our revenue could grow at a slower rate or even decrease. In addition, as we deploy new applications and features for our existing products or introduce new products and services, our current customers could choose not to purchase these new offerings.
If our customers do not renew their annual maintenance and support agreements for our products or if they do not renew them on terms that are favorable to us, our business might suffer.
Most of our maintenance agreements are for a term of one year. As the end of the annual period approaches, we pursue the renewal of the agreement with the customer. Historically, maintenance renewals have represented a significant portion of our total revenue, including approximately 49% of our total revenue in 2003.2003 and 47% of our total revenue for the fiscal nine months ended September 30, 2004. Because of this characteristic of our business, if our customers choose not to renew their maintenance and support agreements with us on beneficial terms, our business, operating results and financial condition could be harmed.
76
A substantial majority of our revenue is derived from The Raiser’s Edge and a decline in sales or renewals of this product and related services could harm our business.
We derive a substantial majority of our revenue from the sale of The Raiser’s Edge and related services, and revenue from this product and related services is expected to continue to account for a substantial majority of our total revenue for the foreseeable future. For example, revenue from the sale of The Raiser’s Edge and related services represented approximately 72% of our total revenue in 2003 and 70% of our total revenue in 2003.for the nine months ended September 30, 2004. Because we generally sell licenses to our products on a perpetual basis and deliver new versions and enhancements to customers who purchase annual maintenance and support, our future license, services and maintenance revenue are substantially dependent on sales to new customers. In addition, we frequently sell The Raiser’s Edge to new customers and then attempt to generate incremental revenue from the sale of additional products and services. If demand for The Raiser’s Edge declines significantly, our business would suffer.
Our quarterly financial results fluctuate and might be difficult to forecast and, if our future results are below either any guidance we might issue or the expectations of public market analysts and investors, the price of our common stock might decline.
Our quarterly revenue and results of operations are difficult to forecast. We have experienced, and expect to continue to experience, fluctuations in revenue and operating results from quarter to quarter. As a result, we believe that quarter-to-quarter comparisons of our revenue and operating results are not necessarily meaningful and that such comparisons might not be accurate indicators of future performance. The reasons for these fluctuations include but are not limited to:
| • | the size and timing of sales of our software, including the relatively long sales cycles associated with many of our large software sales; |
| • | budget and spending decisions by our customers; |
| • | market acceptance of new products we release, such as our recently-introduced business intelligence tools; |
| • | the amount and timing of operating costs related to the expansion of our business, operations and infrastructure; |
| • | changes in our pricing policies or our competitors’ pricing policies; |
| • | seasonality in our revenue; |
| • | general economic conditions; and |
| • | costs related to acquisitions of technologies or businesses. |
Our operating expenses, which include sales and marketing, research and development and general and administrative expenses, are based on our expectations of future revenue and are, to a large extent, fixed in the short term. If revenue falls below our expectations in a quarter and we are not able to quickly reduce our operating expenses in response, our operating results for that quarter could be adversely affected. It is possible that in some future quarter our operating results may be below either any guidance we might issue or the expectations of public market analysts and investors and, as a result, the price of our common stock might fall.
87
We encounter long sales and implementation cycles, particularly for our largest customers, which could have an adverse effect on the size, timing and predictability of our revenue and sales.
Potential customers, particularly our larger enterprise-wide clients, generally commit significant resources to an evaluation of available software and require us to expend substantial time, effort and money educating them as to the value of our software and services. Sales of our core software products to these larger customers often require an extensive education and marketing effort.
We could expend significant funds and management resources during the sales cycle and ultimately fail to close the sale. Our core software product sales cycle averages approximately two months for sales to existing customers and from six to nine months for sales to new customers and large enterprise-wide sales. Our implementation cycle for large enterprise-wide sales can extend for a year or more, which can negatively impact the timing and predictability of our revenue. Our sales cycle for all of our products and services is subject to significant risks and delays over which we have little or no control, including:
| • | our customers’ budgetary constraints; |
| • | the timing of our clients’ budget cycles and approval processes; |
| • | our clients’ willingness to replace their current methods or software solutions; |
| • | our need to educate potential customers about the uses and benefits of our products and services; and |
| • | the timing and expiration of our clients’ current license agreements or outsourcing agreements for similar services. |
If we are unsuccessful in closing sales after expending significant funds and management resources or if we experience delays as discussed above, it could have a material adverse effect on the size, timing and predictability of our revenue.
We have recorded a significant deferred tax asset, and we might never realize the full value of our deferred tax asset, which would result in a charge against our earnings.
In connection with the initial acquisition of our common stock by our current stockholders in 1999, we recorded approximately $107 million as a deferred tax asset. Our deferred tax asset was approximately $87$81 million as of March 31,September 30, 2004, or approximately 73%57% of our total assets as of that date. Realization of our deferred tax asset is dependent upon our generating sufficient taxable income in future years to realize the tax benefit from that asset. In accordance with Financial Accounting Standards Board Statement of Financial Accounting Standards No. 109, deferred tax assets are reviewed at least annually for impairment. Impairment would result if, based on the available evidence, it is more likely than not that some portion of the deferred tax asset will not be realized. This impairment could be caused by, among other things, deterioration in performance, loss of key contracts, adverse market conditions, adverse changes in applicable laws or regulations, including changes that restrict the activities of or affect the products sold by our business and a variety of other factors. If an impairment were to occur in a future period, it would be recognized as an expense in our results of operations during the period of impairment. Depending on future circumstances, it is possible that we might never realize the full value of our deferred tax asset. Any future determination of impairment of a significant portion of our deferred tax asset would have an
98
Nonprofit organizations might not use the Internet to facilitate their fundraising and organizational efforts in a manner sufficient to allow us to make a profit or even recapture our investment in this area. In addition, even if they increasingly use the Internet for these purposes, if we fail to capitalize on this opportunity, we could lose market share.
The market for online fundraising solutions for nonprofit organizations is new and emerging. Nonprofit organizations have not traditionally used the Internet or web-enabled software solutions for fundraising. We cannot be certain that the market will continue to develop and grow or that nonprofit organizations will elect to use any of our web-enabled products rather than continue to use traditional offline methods, attempt to develop software solutions internally or use standardized software solutions not designed for the specific needs of nonprofits. Nonprofit organizations that have already invested substantial resources in other fundraising methods may be reluctant to use the Internet to supplement their existing systems or methods. In addition, increasing concerns about fraud, privacy, reliability and other problems might cause nonprofit organizations not to adopt the Internet as a method for fundraising. If demand for and market acceptance of Internet-based products for nonprofits does not occur, we might not recapture our investment in this area or grow our business as we expect. On the other hand, even if nonprofits increasingly use the Internet for their fundraising and organizational efforts, if we fail to develop and offer products that meet customer needs in this area, we could lose market share.
Our failure to compete successfully could cause our revenue or market share to decline.
Our market is fragmented, competitive and rapidly evolving, and there are limited barriers to entry for some aspects of this market. We mainly face competition from four sources:
| • | software developers offering integrated specialized products designed to address specific needs of nonprofit organizations; |
| • | providers of traditional, less automated fundraising services, such as services that support traditional direct mail campaigns, special events fundraising, telemarketing and personal solicitations; |
| • | custom-developed products created either internally or outsourced to custom service providers; and |
| • | software developers offering general products not designed to address specific needs of nonprofit organizations. |
The companies we compete with, and other potential competitors, may have greater financial, technical and marketing resources and generate greater revenue and better name recognition than we do. If one or more of our competitors or potential competitors were to merge or partner with one of our competitors, the change in the competitive landscape could adversely affect our ability to compete effectively. For example, a large diversified software enterprise, such as Microsoft, Oracle or PeopleSoft, could decide to enter the market directly, including through acquisitions.
Additionally, Sage and Intuit have recently made acquisitions and product development efforts in the nonprofit market. Our competitors might also establish or strengthen cooperative
109
We might not be able to manage our future growth efficiently or profitably.
We have experienced significant growth since our inception, and we anticipate that continued expansion will be required to address potential market opportunities. For example, we will need to expand the size of our sales and marketing, product development and general and administrative staff and operations, as well as our financial and accounting controls. There can be no assurance that our infrastructure will be sufficiently scalable to manage our projected growth. For example, our anticipated growth will result in a significant increase in demands on our maintenance and support services professionals to continue to provide the high level of quality service that our customers have come to expect. If we are unable to sufficiently address these additional demands on our resources, our profitability and growth might suffer. Also, if we continue to expand our operations, management might not be effective in expanding our physical facilities and our systems, procedures or controls might not be adequate to support such expansion. Our inability to manage our growth could harm our business.
Because competition for highly qualified personnel is intense, we might not be able to attract and retain the employees we need to support our planned growth.
To execute our continuing growth plans, we need to increase the size and maintain the quality of our sales force, software development staff and our professional services organization. To meet our objectives successfully, we must attract and retain highly qualified personnel with specialized skill sets focused on the nonprofit industry. Competition for qualified personnel can be intense, and we might not be successful in attracting and retaining them. The pool of qualified personnel with experience working with or selling to nonprofit organizations is limited overall and specifically in Charleston, South Carolina, where our principal office is located. Our ability to maintain and expand our sales, product development and professional services teams will depend on our ability to recruit, train and retain top quality people with advanced skills who understand sales to, and the specific needs of, nonprofit organizations. For these reasons, we have from time to time in the past experienced, and we expect to continue to experience in the future, difficulty in hiring and retaining highly skilled employees with appropriate qualifications for our business. In addition, it takes time for our new sales and services personnel to become productive, particularly with respect to obtaining and supporting major customer accounts. In particular, we plan to continue to increase the number of services personnel to attempt to meet the needs of our customers and potential new customers. In addition to hiring services personnel to meet our needs, we might also engage additional third-party consultants as contractors, which could have a negative impact on our earnings. If we are unable to hire or retain qualified personnel, or if newly hired personnel fail to develop the necessary skills or reach productivity slower than anticipated, it would be more difficult for us to sell our products and services, and we could experience a shortfall in revenue or earnings, and not achieve our planned growth.
1110
Our services revenue produces substantially lower gross margins than our license revenue, and an increase in services revenue relative to license revenue would harm our overall gross margins.
Our services revenue, which includes fees for consulting, implementation, training, data and technical services and analytics, was approximately 30%32% of our revenue for the fiscal quarternine months ended March 31,September 30, 2004, 29% of our revenue for 2003 and approximately 25% of our revenue for 2002. Our services revenue has substantially lower gross margins than our product license revenue. An increase in the percentage of total revenue represented by services revenue would adversely affect our overall gross margins.
Certain of our services are contracted under fixed fee arrangements, which we base on estimates. If our estimated fees are less than our actual costs, our operating results would be adversely affected.
Services revenue as a percentage of total revenue has varied significantly from quarter to quarter due to fluctuations in licensing revenue, economic changes, changes in the average selling prices for our products and services, our customers’ acceptance of our products and our sales force execution. In addition, the volume and profitability of services can depend in large part upon:
| • | competitive pricing pressure on the rates that we can charge for our services; |
| • | the complexity of the customers’ information technology environment and the existence of multiple non-integrated legacy databases; |
| • | the resources directed by customers to their implementation projects; and |
| • | the extent to which outside consulting organizations provide services directly to customers. |
Any erosion of our margins for our services revenue or any adverse changes in the mix of our license versus service revenue would adversely affect our operating results.
Failure to adapt to technological change and to achieve broad adoption and acceptance of our new products and services could adversely affect our earnings.
If we fail to keep pace with technological change in our industry, such failure would have an adverse effect on our revenue and earnings. We operate in a highly competitive industry characterized by evolving technologies and industry standards, changes in customer requirements and frequent new product introductions and enhancements. During the past several years, many new technological advancements and competing products have entered the marketplace. Our ability to compete effectively and our growth prospects depend upon many factors, including the success of our existing software products and services to address the changing needs of our customers, the timely introduction and success of future software products and services and releases and the ability of our products to perform well with existing and future technologies, including databases, applications, operating systems and other platforms. We have made significant investments in research and development and our growth plans are premised in part on generating substantial revenue from new product introductions. New product introductions involve significant risks. For example, delays in new product introductions, such as our new version of The Education Edge expected in mid-2004, or less-than-anticipated market acceptance of our new products are possible and would have an adverse effect on our revenue and earnings. We cannot be certain that our new products or future enhancements to existing products will meet customer performance needs or expectations when shipped or that they will be free of significant software defects or bugs.
11
12
If our products fail to perform properly due to undetected errors or similar problems, our business could suffer.
Complex software such as ours often contains undetected errors or bugs. Such errors are frequently found after introduction of new software or enhancements to existing software. We continually introduce new products and new versions of our products. If we detect any errors before we ship a product, we might have to delay product shipment for an extended period of time while we address the problem. We might not discover software errors that affect our new or current products or enhancements until after they are deployed, and we may need to provide enhancements to correct such errors. Therefore, it is possible that, despite testing by us, errors may occur in our software. These errors could result in:
| • | harm to our reputation; |
| • | lost sales; |
| • | delays in commercial release; |
| • | product liability claims; |
| • | delays in or loss of market acceptance of our products; |
| • | license terminations or renegotiations; and |
| • | unexpected expenses and diversion of resources to remedy errors. |
Furthermore, our customers may use our software together with products from other companies. As a result, when problems occur, it might be difficult to identify the source of the problem. Even when our software does not cause these problems, the existence of these errors might cause us to incur significant costs, divert the attention of our technical personnel from our product development efforts, impact our reputation and cause significant customer relations problems.
Our failure to integrate third-party technologies could harm our business.
We intend to continue licensing technologies from third parties, including applications used in our research and development activities and technologies which are integrated into our products. These technologies might not continue to be available to us on commercially reasonable terms or at all. Our inability to obtain any of these licenses could delay product development until equivalent technology can be identified, licensed and integrated. This inability in turn would harm our business and operating results. Our use of third-party technologies exposes us to increased risks, including, but not limited to, risks associated with the integration of new technology into our products, the diversion of our resources from development of our own proprietary technology and our inability to generate revenue from licensed technology sufficient to offset associated acquisition and maintenance costs.
12
If the security of our software, in particular our hosted Internet solutions products, is breached, our business and reputation could suffer.
Fundamental to the use of our products is the secure collection, storage and transmission of confidential donor and end user information. Third parties may attempt to breach our security or that of our customers and their databases. We might be liable to our customers for any breach in such security, and any breach could harm our customers, our business and our
13
If we are unable to detect and prevent unauthorized use of credit cards and bank account numbers and safeguard confidential donor data, we could be subject to financial liability, our reputation could be harmed and customers may be reluctant to use our products and services.
We rely on third-party and internally-developed encryption and authentication technology to provide secure transmission of confidential information over the Internet, including customer credit card and bank account numbers, and protect confidential donor data. Advances in computer capabilities, new discoveries in the field of cryptography or other events or developments could result in a compromise or breach of the technology we use to protect sensitive transaction data. If any such compromise of our security, or the security of our customers, were to occur, it could result in misappropriation of proprietary information or interruptions in operations and have an adverse impact on our reputation or the reputation of our customers. If we are unable to detect and prevent unauthorized use of credit cards and bank account numbers or protect confidential donor data, our business could suffer.
We currently do not have any issued patents, but we rely upon trademark, copyright, patent and trade secret laws to protect our proprietary rights, which might not provide us with adequate protection.
Our success and ability to compete depend to a significant degree upon the protection of our software and other proprietary technology rights. We might not be successful in protecting our proprietary technology, and our proprietary rights might not provide us with a meaningful competitive advantage. To protect our proprietary technology, we rely on a combination of patent, trademark, copyright and trade secret laws, as well as nondisclosure agreements, each of which affords only limited protection. We currently do not have patents issued for any of our proprietary technology and we only recently filed patent applications relating to a number of our products. Moreover, we have no patent protection for The Raiser’s Edge, which is one of our core products. Any inability to protect our intellectual property rights could seriously harm our business, operating results and financial condition. It is possible that:
| • | our pending patent applications may not result in the issuance of patents; |
| • | any patents issued to us may not be timely or broad enough to protect our proprietary rights; |
13
| • | any issued patent could be successfully challenged by one or more third parties, which could result in our loss of the right to prevent others from exploiting the inventions claimed in those patents; and |
| • | current and future competitors may independently develop similar technologies, duplicate our products or design around any of our patents. |
In addition, the laws of some foreign countries do not protect our proprietary rights in our products to the same extent as do the laws of the United States. Despite the measures taken
14
If we do not successfully address the risks inherent in the expansion of our international operations, our business could suffer.
We currently have operations in the United Kingdom, Canada and Australia, and we intend to expand further into international markets. We have limited experience in international operations and may not be able to compete effectively in international markets. In 2003, our international offices generated revenues of approximately $10.7 million, an increase of 78% over international revenue of $6.0 million for 2002. In the nine months ended September 30, 2004, our international revenue was $16.0 million. Expansion of our international operations will require a significant amount of attention from our management and substantial financial resources and may require us to add qualified management in these markets. Our direct sales model requires us to attract, retain and manage qualified sales personnel capable of selling into markets outside the United States. In some cases, our costs of sales might increase if our customers require us to sell through local distributors. If we are unable to grow our international operations in a cost effective and timely manner, our business and operating results could be harmed. Doing business internationally involves additional risks that could harm our operating results, including:
| • | difficulties and costs of staffing and managing international operations; |
| • | differing technology standards; |
| • | difficulties in collecting accounts receivable and longer collection periods; |
| • | political and economic instability; |
| • | fluctuations in currency exchange rates; |
| • | imposition of currency exchange controls; |
| • | potentially adverse tax consequences; |
| • | reduced protection for intellectual property rights in certain countries; |
| • | dependence on local vendors; |
| • | protectionist laws and business practices that favor local competition; |
| • | compliance with multiple conflicting and changing governmental laws and regulations; |
| • | seasonal reductions in business activity specific to certain markets; |
| • | longer sales cycles; |
| • | restrictions on repatriation of earnings; |
| • | differing labor regulations; |
| • | restrictive privacy regulations in different countries, particularly in the European Union; |
14
| • | restrictions on the export of technologies such as data security and encryption; and |
| • | import and export restrictions and tariffs. |
Future acquisitions could prove difficult to integrate, disrupt our business, dilute stockholder value and strain our resources.
We intend to acquire companies, services and technologies that we feel could complement or expand our business, augment our market coverage, enhance our technical capabilities, provide
15
| • | difficulties in integrating operations, technologies, services, accounting and personnel; |
| • | difficulties in supporting and transitioning customers of our acquired companies; |
| • | diversion of financial and management resources from existing operations; |
| • | risks of entering new sectors of the nonprofit industry; |
| • | potential loss of key employees; and |
| • | inability to generate sufficient revenue to offset acquisition or investment costs. |
Acquisitions also frequently result in recording of goodwill and other intangible assets, which are subject to potential impairments in the future that could harm our operating results. In addition, if we finance acquisitions by issuing equity securities or securities convertible into equity securities, our existing stockholders would be diluted, which, in turn, could affect the market price of our stock. Moreover, we could finance any acquisition with debt, resulting in higher leverage and interest costs. As a result, if we fail to evaluate and execute acquisitions or investments properly, we might not achieve the anticipated benefits of any such acquisition, and we may incur costs in excess of what we anticipate.
Claims that we infringe upon third parties’ intellectual property rights could be costly to defend or settle.
Litigation regarding intellectual property rights is common in the software industry. We expect that software products and services may be increasingly subject to third-party infringement claims as the number of competitors in our industry segment grows and the functionality of products in different industry segments overlaps. We may from time to time encounter disputes over rights and obligations concerning intellectual property. Although we believe that our intellectual property rights are sufficient to allow us to market our software without incurring liability to third parties, third parties may bring claims of infringement against us. Such claims may be with or without merit. Any litigation to defend against claims of infringement or invalidity could result in substantial costs and diversion of resources. Furthermore, a party making such a claim could secure a judgment that requires us to pay substantial damages. A judgment could also include an injunction or other court order that could prevent us from selling our software. Our business, operating results and financial condition could be harmed if any of these events occurred.
In addition, we have agreed, and will likely agree in the future, to indemnify certain of our customers against certain claims that our software infringes upon the intellectual property rights of others. We could incur substantial costs in defending ourselves and our customers against infringement claims. In the event of a claim of infringement, we and our customers might be required to obtain one or more licenses from third parties. We, or our customers, might be unable to obtain necessary licenses from third parties at a reasonable cost, if at all.
15
If we become subject to product or general liability or errors and omissions claims, they could be time-consuming and costly.
Errors, defects or other performance problems in our software, as well as the negligence or misconduct of our consultants, could result in financial or other damages to our customers. They could seek damages from us for losses associated with these errors, defects or other
16
If we were found subject to or in violation of any laws or regulations governing privacy or electronic fund transfers, we could be subject to liability or forced to change our business practices.
It is possible that the payment processing component of our web-based software is subject to various governmental regulations. Pending legislation at the state and federal levels could also restrict further our information gathering and disclosure practices. Existing and potential future privacy laws might limit our ability to develop new products and services that make use of data we gather from various sources. For example, our custom modeling and analytical services, including ProspectPoint and WealthPoint, rely heavily on securing and making use of data we gather from various sources and privacy laws could jeopardize our ability to market and profit from those services. The provisions of these laws and related regulations are complicated, and we do not have extensive experience with these laws and related regulations. Even technical violations of these laws can result in penalties that are assessed for each non-compliant transaction. In addition, we might be subject to the privacy provisions of the Health Insurance Portability and Accountability Act of 1996 and the Gramm-Leach-Bliley Act and related regulations. If we or our customers were found to be subject to and in violation of any of these laws or other privacy laws or regulations, our business would suffer and we and/or our customers would likely have to change our business practices. In addition, these laws and regulations could impose significant costs on us and our customers and make it more difficult for donors to make online donations.
Increasing government regulation could affect our business.
We are subject not only to regulations applicable to businesses generally but also to laws and regulations directly applicable to electronic commerce. Although there are currently few such laws and regulations, state, Federal and foreign governments may adopt laws and regulations applicable to our business. Any such legislation or regulation could dampen the growth of the Internet and decrease its acceptance. If such a decline occurs, companies may decide in the
16
| • | user privacy; |
| • | the pricing and taxation of goods and services offered over the Internet: |
| • | the content of websites; |
| • | copyrights; |
| • | consumer protection, including the potential application of “do not call” registry requirements on our customers and consumer backlash in general to direct marketing efforts of our customers; |
17
| • | the online distribution of specific material or content over the Internet; and |
| • | the characteristics and quality of products and services offered over the Internet. |
Our operations might be affected by the occurrence of a natural disaster or other catastrophic event in Charleston, South Carolina.
We depend on our principal executive offices and other facilities in Charleston, South Carolina for the continued operation of our business. Although we have contingency plans in effect for natural disasters or other catastrophic events, these events, including terrorist attacks and natural disasters such as hurricanes, which historically have struck the Charleston area with some regularity, could disrupt our operations. Even though we carry business interruption insurance policies and typically have provisions in our contracts that protect us in certain events, we might suffer losses as a result of business interruptions that exceed the coverage available under our insurance policies or for which we do not have coverage. Any natural disaster or catastrophic event affecting us could have a significant negative impact on our operations.
Outstanding employee stock options subject to variable accounting and recent proposed changes to accounting standards could cause us to record significant compensation expense and could significantly reduce our earnings in future periods.
OptionsPrior to our initial public offering in July 2004, options to purchase approximately 10.56.6 million shares under two of our stock option plans arewere subject to variable accounting treatment, and we anticipate that optionstreatment. Options to purchase approximately 5.63.5 million shares will continue to be subject to variable accounting treatment after the offering.and there is volatility in our stock price which could affect operating results. Accordingly, we expect tocould record significant compensation expense at the end of future periods, particularly if our stock price increases significantly. For example, we recorded compensation expense attributable to these options of $27.5 million in 2003 and $1.0 million in the fiscal quarter ended March 31, 2004.2003. This compensation expense could significantly reduce our earnings in future periods, which could cause our stock price to fall and, as a result, you could lose some or all of your investment. See our discussion of “Stock option compensation” in “Management’s discussion and analysis of financial condition and results of operations — Critical accounting policies and estimates”. In addition, under a proposal issued byon December 16, 2004, the Financial Accounting Standards Board on March 31, 2004, we might, ifStatement No. 123 (revised 2004), Share-Based Payment. Statement 123(R) would require us to measure all employee stock-based compensation awards using a fair value method and record such proposal is adopted, be required to record the fair market value of future stock options issued under our stock option plans as compensation expense in our consolidated financial statements, which would reducestatements. In addition, the adoption of Statement 123(R) will require additional accounting related to the income tax effects and additional disclosure
17
The requirements of being a public company might strain our resources and distract management.
As a newly public company, we will beare subject to a number of additional requirements, including the reporting requirements of the Securities Exchange Act of 1934, the Sarbanes-Oxley Act of 2002 and new Nasdaq rules promulgated in response to the Sarbanes-Oxley Act. These requirements might place a strain on our systems and resources. The Securities Exchange Act requires, among other things, that we file annual, quarterly and current reports with respect to our business and financial condition. The Sarbanes-Oxley Act requires, among other things, that we maintain effective disclosure controls and procedures and internal controls for financial reporting. In order to maintain and improve the effectiveness of our disclosure controls and procedures and internal controls over financial reporting, significant resources and management oversight will be required. As a result, our management’s attention might be diverted
18
Risks related to this offeringpurchasing our shares
We cannot assure you that a market will developcontinue for our common stock or what the market price of our common stock will be.
Before thisour initial public offering in July 2004, there was no public trading market for our common stock, and we cannot assure you that one will develop or be sustained after this offering.sustained. If a market does not develop or is not sustained, it might be difficult for you to sell your shares of common stock at an attractive price or at all. We cannot predict the prices at which our common stock will trade. The initial public offering price for our common stock covered by this prospectus will be determined through our and our selling stockholders’ negotiations with the underwriterspotential purchasers and might not bear any relationship to the market price at which it will trade after this offering or to any other established criteria of the value of our business. In future quarters our operating results might be below the expectations of public market analysts and investors and, as a result of these and other factors, the price of our common stock might decline.
The price of our common stock might be volatile.
Our stock price has been volatile and might continue to be, making an investment in our company risky. Between July 26, 2004, when our common stock started trading on the Nasdaq National Market, and January 14, 2005, the price of a share of our common stock varied from $8.30 to $15.22.
18
In the three years prior to 2003, technology stocks listed on The Nasdaq National Market experienced high levels of volatility and significant declines in value from their historic highs. The trading price of our common stock following this offering might fluctuate substantially. The price of the common stock that will prevail in the market after this offering might be higher or lower than the price you pay, depending on many factors, some of which are beyond our control and might not be related to our operating performance. The fluctuations could cause you to lose part or all of your investment in our shares of common stock. Those factors that could cause fluctuations in the trading price of our common stock include the following:
| • | price and volume fluctuations in the overall stock market from time to time; |
| • | significant volatility in the market price and trading volume of software and technology companies; |
| • | actual or anticipated changes in our earnings or fluctuations in our operating results or in the expectations of securities analysts; |
| • | economic conditions and trends in general and in the nonprofit industry; |
| • | major catastrophic events, including terrorist activities, which could reduce or divert funding to, and technology spending by, our core nonprofit customer base; |
| • | changes in our pricing policies or the pricing policies of our customers; |
| • | changes in the estimation of the future size and growth of our market; or |
| • | departures of key personnel. |
19
In the past, following periods of volatility in the market price of a company’s securities, securities class action litigation has often been brought against that company. Due to the potential volatility of our stock price, we might be the target of securities litigation in the future. Securities litigation could result in substantial costs and divert management’s attention and resources from our business.
Insiders will continue to hold a [majority/significant minority]percentage of our stock after this offering and could limit your ability to influence the outcome of key transactions, including a change of control, which could adversely affect the market price of our stock.
Upon completionAssuming it sells all of this offering and our proposed simultaneous repurchase of shares of ourits common stock from Anthony E. Bakker,registered under this prospectus, our largest stockholder, Hellman & Friedman Capital Partners III, L.P. and its affiliates, will beneficially own approximately %47.83% of our common stock, or % if the underwriters’ over-allotment option is exercised in full.stock. In addition, our executive officers, directors and their affiliates will, in the aggregate, beneficially own or control approximately %55.53% of our common stock, or % if the underwriters’ over-allotment option is exercised in full.stock. As a result, Hellman & Friedman will have the abilitysignificant control with respect to control all matters submitted to our stockholders for approval, including the election and removal of directors and the approval of any merger, consolidation or sales of all or substantially all of our assets. These stockholders might make decisions that are adverse to your interests. In addition, Hellman & Friedman and certain of its transferees will not be governed by Section 203 of the Delaware General Corporation Law. See “Description of capital stock—Anti-takeover effects of Delaware law and provisions of our certificate of incorporation and bylaws—Delaware anti-takeover law” for a discussion of Section 203. This fact might make it easier for Hellman & Friedman or its transferees to acquire your shares at a lower price than would otherwise be the case. This provision and the concentration of ownership could have the effect of delaying, preventing or deterring a change of control of our company, could deprive our stockholders of an opportunity to receive a premium for their common stock as part of a sale of our company and might ultimately affect the market price of our common stock.
19
Future sales of our common stock might depress our stock price.
As of the date of this prospectus and after giving effect to our proposed repurchase, simultaneous with this offering, of shares of our common stock from Anthony E. Bakker,December 31, 2004, we have 68,014,571had 42,549,056 shares of common stock outstanding. The 10,000,000 shares that may be sold by the selling stockholders inunder this offering, or shares if the underwriters’ over-allotment option is exercised in full,prospectus will be freely tradable without restriction or further registration under federal securities laws unless purchased by our affiliates. The remaining shares of common stock outstanding will be available for sale in the public market as follows:
The remaining shares held by existing stockholders will become eligible for sale at various times onIf these or before .
The above table assumes the effectiveness of the lock-up agreements under which we, our executive officers and directors and our selling stockholders have agreed that, during the period beginning from the date of this prospectus and continuing to and including the date
20
If our commonother stockholders sell substantial amounts of common stock in the public market, or if the market perceives that these sales may occur, the market price of our common stock might decline. In addition, as soon as practicable afterWe are unable to estimate the completionamount, timing or nature of this offering, we intend to file a registration statement under the Securities Act covering sharesfuture sales of outstanding common stock issuable under our stock plans. Accordingly, shares registered under that registration statement will be available for sale in the open market, subject to the contractual lock-up agreements described above that prohibit the sale or other disposition of the shares of common stock underlying the options for a period of 180 days after the date of this prospectus.stock.
As a new investor, youInvestors in this offering will experience immediate and substantial dilution.
The initial public offering price of the common stock being soldregistered for resale by the selling stockholders inunder this offering andprospectus is expected to us in the proposed simultaneous repurchase isbe considerably more than the net tangible book value per share of our outstanding common stock. Accordingly, we and investors purchasing shares of common stock inoffered under this offeringprospectus will pay a price per share that substantially exceeds, on a per share basis, the value of our assets after subtracting liabilities. Investors will suffer additional dilution to the extent outstanding stock options are exercised and to the extent we issue any restricted stock to our employees under our equity incentive plans. For more information on dilution, see “Dilution”.
We might need to raise capital, which might not be available.
We intend to use up to $10.0 million of our cash, if available, to repurchase shares from Anthony E. Bakker simultaneously with this offering, and we will not receive any of the proceeds from the sale of shares by the selling stockholders inunder this offering.prospectus. Accordingly, the proceeds from this offeringany sales by the selling stockholders will not be available to us to finance our operations, capital expenditures or investment activities. We might need to raise funds to meet these or other needs, and we might not be able to obtain such financing on favorable terms, if at all. If we need capital and cannot raise it on acceptable terms, we might not be able to:
| • | develop enhancements and additional features for our products; |
| • | develop new products and services; |
| • | hire, train and retain employees; |
| • | enhance our infrastructure; |
| • | respond to competitive pressures or unanticipated requirements; |
| • | pursue international expansion; |
| • | pursue acquisition opportunities; or |
| • | continue to fund our operations. |
If any of the foregoing consequences occur, our stock price might fall and you might lose some or all of your investment.
21
Our certificate of incorporation authorizes our board of directors to issue new series of preferred stock that may have the effect of delaying or preventing a change of control, which could adversely affect the value of your shares.
Our certificate of incorporation provides that our board of directors is authorized to issue from time to time, without further stockholder approval, up to 20,000,000 shares of preferred stock in one or more series and to fix or alter the designations, preferences, rights and any qualifications, limitations or restrictions of the shares of each series, including the dividend rights, dividend rates, conversion rights, voting rights, rights of redemption, including sinking fund provisions, redemption price or prices, liquidation preferences and the number of shares
20
Anti-takeover provisions under our charter documents and Delaware law could delay or prevent a change of control and could also limit the market price of our stock.
Our certificate of incorporation and our bylaws contain provisions that effective from and after the date of this offering, could delay or prevent a change of control of our company or changes in our board of directors that our stockholders might consider favorable, including the following:
| • | our board of directors will be classified into three classes, each of which will serve for staggered three year terms; and |
| • | we will require advance notice for stockholder proposals, including nominations for the election of directors. |
In addition, we are governed by the provisions of Section 203 of the Delaware General Corporate Law, which can prohibit certain business combinations with stockholders owning 15% or more of our outstanding voting stock, although our certificate of incorporation excludes Hellman & Friedman Capital Partners III, L.P. and its affiliates and transferees from the application of these anti-takeover provisions. These and other provisions in our certificate of incorporation and our bylaws and Delaware law could make it more difficult for stockholders or potential acquirors to obtain control of our board of directors or initiate actions that are opposed by the then-current board of directors, including delaying or impeding a merger, tender offer, or proxy contest or other change of control transaction involving our company. Any delay or prevention of a change of control transaction or changes in our board of directors could prevent the consummation of a transaction in which our stockholders could receive a substantial premium over the then current market price for their shares.
2221
Forward-looking statements
This prospectus contains forward-looking statements.statements as defined in the Private Securities Litigation Reform Act. The forward-looking statements are contained principally in the sections entitled “Prospectus summary,” “Risk factors,” “Management’s discussion and analysis of financial condition and results of operations” and “Business.” In some cases, you can identify forward-looking statements by terminology such as “may,” “might,” “will,” “should,” “could,” “would,” “expect,” “plan,” “anticipate,” “believe,” “estimate,” “project,” “predict,” “intend,” “potential” or the negative of such terms or other similar expressions.
The forward-looking statements reflect our current expectations and views about future events and speak only as of the date the statements were made. The forward-looking statements involve known and unknown risks, uncertainties and other factors which may cause our actual results, performance or achievements to be materially different from any future results, performance or achievements expressed or implied by the forward-looking statements. Given these risks and uncertainties, you should not place undue reliance on the forward-looking statements.
You should read this prospectus and the documents that we reference in this prospectus and have filed as exhibits to the registration statement, of which this prospectus is part, completely and with the understanding that our actual future results might be materially different from what we expect. We might not update the forward-looking statements, even though our situation might change in the future, unless we have obligations under U.S. federal securities laws to update and disclose material developments related to previously disclosed information. We qualify all of the forward-looking statements by these cautionary statements.
You should rely only on the information contained in this prospectus. We have not authorized anyone to provide you with information different from that contained in this prospectus. Offers to sell, and offers to buy, shares of our common stock are being made only in jurisdictions where offers and sales are permitted. The information contained in this prospectus is accurate only as of the date of this prospectus, regardless of the time of delivery of this prospectus or of any sale of our common stock.
No action is being taken in any jurisdiction outside the United States to permit a public offering of common stock or possession or distribution of this prospectus in that jurisdiction. Persons who come into possession of this prospectus in jurisdictions outside the United States are required to inform themselves about and to observe any restrictions as to this offering and the distribution of this prospectus applicable to those jurisdictions.
“Blackbaud” and “The Raiser’s Edge” are registered trademarks of Blackbaud, Inc. This prospectus also includes references to registered service marks and trademarks of other entities.
2322
Use of proceeds
We will not receive any proceeds from the sale of the common stock by the selling stockholders. The selling stockholders will receive all net proceeds from the saleany sales of shares of our common stock inunder this offering.prospectus.
Dividend policy
Although we have not declared or paid any cash dividends on our capital stock since becoming a C corporation in October 1999, we might elect to do so in the future. Any such determination to pay dividends will be at the discretion of our board of directors and will depend on the amount of any outstanding indebtedness, our financial condition, results of operations, capital requirements and other factors that our board of directors may deem relevant. In addition, certain debt agreements to which we are a party contain financial covenants that could have the effect of restricting or prohibiting the payment of cash dividends.
2423
Capitalization
The following table sets forth our cash and cash equivalents and capitalization as of March 31, 2004:
September 30, 2004. This table should be read in conjunction with “Management’s discussion and analysis of financial condition and results of operations” and the consolidated financial statements and accompanying notes included elsewhere in this prospectus.
| March 31, 2004 (unaudited) | ||||||||||||||
| September 30, 2004 (unaudited) | September 30, 2004 (unaudited) | |||||||||||||
| (in thousands) | (in thousands) | Actual | As adjusted | (in thousands) | ||||||||||
| Cash and cash equivalents | Cash and cash equivalents | $ | 6,085 | $ | Cash and cash equivalents | $ | 33,382 | |||||||
| Long-term debt and capital lease obligations, excluding current portion | 7 | |||||||||||||
| Stockholders’ equity: | Stockholders’ equity: | Stockholders’ equity: | ||||||||||||
| Common stock | Common stock | 41,728 | Common stock | 43 | ||||||||||
| Additional paid-in capital | Additional paid-in capital | 38,056 | ||||||||||||
| Deferred stock compensation | Deferred stock compensation | (3,799 | ) | Deferred stock compensation | (1,405 | ) | ||||||||
| Accumulated other comprehensive income | Accumulated other comprehensive income | 351 | Accumulated other comprehensive income | 176 | ||||||||||
| Retained earnings | Retained earnings | 26,519 | Retained earnings | 39,449 | ||||||||||
| Total stockholders’ equity | 64,799 | Total stockholders’ equity | 76,319 | |||||||||||
| Total capitalization | Total capitalization | $ | 64,806 | $ | Total capitalization | $ | 76,319 | |||||||
Dilution
TheWe anticipate that our net tangible book value per share of our common stock after giving effect to our proposed repurchase of shares of common stock from Anthony E. Bakker simultaneously with the offering, will be substantially below the initial public offering price.price for shares of our common stock sold pursuant to this prospectus. You will therefore incur immediate and substantial dilution of $$11.99 per share, based on thean assumed initial public offering price of $$13.75 per share.share, which was the closing sale price for our common stock on January 14, 2004. As a result, if we are liquidated, you maymight not receive the full value of your investment.
Dilution in pro forma net tangible book value per share represents the difference between the amount you pay per share of our common stock that you pay in this offering and the pro forma net tangible book value per share of our common stock immediately afterwards. Pro forma netNet tangible book value per share represents (1) the total pro forma net tangible assets after giving effect to(which includes the proposed repurchase,deferred tax asset), divided by (2) the pro forma number of shares of our common stock outstanding after giving effect to the proposed repurchase.
After giving effect to the proposed repurchase, our pro formaOur net tangible book value at March 31,September 30, 2004 would have beenwas approximately $$74.7 million, or $$1.76 per share. This amount represents an immediate dilution in pro forma net tangible book value of $$11.99 per share to you. The following table illustrates this dilution per share:
| Assumed offering price per share | $ | 13.75 | ||
| Net tangible book value per share as of September 30, 2004 | $ | 1.76 | ||
| Dilution per share to you | $ | 11.99 | ||
As of March 31,September 30, 2004, there were options outstanding to purchase a total of 15,235,2159,863,176 shares of common stock at a weighted average exercise price of $3.08$5.13 per share. To the extent outstanding options are exercised, you would experience further dilution.
2524
Selected consolidated financial data
You should read the selected consolidated financial data set forth below in conjunction with “Management’s discussion and analysis of financial condition and results of operations” and our financial statements and the related notes included elsewhere in this prospectus. The following data, insofar as it relates to each of the years 1998–2003, has been derived from annual financial statements, including the consolidated balance sheets at December 31, 2003 and 2002 and the related consolidated statements of operations, cash flows and shareholders’ equity (deficit) and comprehensive income for the three years ended December 31, 2003 and notes thereto appearing elsewhere herein. The consolidated financial statements for the year ended December 31, 1998 were audited by other auditors. The consolidated financial statements for the year ended December 31, 1999 were audited by Arthur Andersen LLP, which has since ceased operations. We derivedThe data for the financial data as of December 31, 2002nine months ended September 30, 2004 and 2003 has been derived from unaudited financial statements also appearing herein and which, in the opinion of management, include all adjustments, consisting only of normal recurring adjustments, necessary for a fair statement of the results for the years ended December 31, 2001, 2002 and 2003 from our audited financial statements included elsewhere in this prospectus.unaudited interim periods.
| Three months | Nine months | |||||||||||||||||||||||||||||||||||||||||||||||||||||||||||||||||||
| Year ended December 31, | ended March 31, | Year ended December 31, | ended September 30, | |||||||||||||||||||||||||||||||||||||||||||||||||||||||||||||||||
| (in thousands, except per share data) | (in thousands, except per share data) | 1998(2)(3) | 1999(2)(3) | 2000(3) | 2001 | 2002 | 2003 | 2003 | 2004 | (in thousands, except per share data) | 1998(2)(3) | 1999(2)(3) | 2000(3) | 2001 | 2002 | 2003 | 2003 | 2004 | ||||||||||||||||||||||||||||||||||||||||||||||||||
| Consolidated statements of operations data: | Consolidated statements of operations data: | |||||||||||||||||||||||||||||||||||||||||||||||||||||||||||||||||||
| Consolidated statements of operations data: | (unaudited) | |||||||||||||||||||||||||||||||||||||||||||||||||||||||||||||||||||
Revenue | Revenue | Revenue | ||||||||||||||||||||||||||||||||||||||||||||||||||||||||||||||||||
| License fees | $ | 29,408 | $ | 37,938 | $ | 24,471 | $ | 19,300 | $ | 20,572 | $ | 21,339 | $ | 4,504 | $ | 5,077 | License fees | $ | 29,408 | $ | 37,938 | $ | 24,471 | $ | 19,300 | $ | 20,572 | $ | 21,339 | $ | 15,427 | $ | 18,614 | |||||||||||||||||||||||||||||||||||
| Services | 10,716 | 17,309 | 14,266 | 18,797 | 26,739 | 34,042 | 7,744 | 9,545 | Services | 10,716 | 17,309 | 14,266 | 18,797 | 26,739 | 34,042 | 25,888 | 32,678 | |||||||||||||||||||||||||||||||||||||||||||||||||||
| Maintenance and subscriptions | 22,446 | 29,680 | 39,042 | 47,022 | 52,788 | 58,360 | 14,099 | 15,779 | Maintenance and subscriptions | 22,446 | 29,680 | 39,042 | 47,022 | 52,788 | 58,360 | 43,271 | 48,886 | |||||||||||||||||||||||||||||||||||||||||||||||||||
| Other revenue | 3,062 | 7,550 | 5,838 | 4,915 | 5,130 | 4,352 | 962 | 954 | Other revenue | 3,062 | 7,550 | 5,838 | 4,915 | 5,130 | 4,352 | 2,906 | 2,849 | |||||||||||||||||||||||||||||||||||||||||||||||||||
| Total revenue | 65,632 | 92,477 | 83,617 | 90,034 | 105,229 | 118,093 | 27,309 | 31,355 | Total revenue | 65,632 | 92,477 | 83,617 | 90,034 | 105,229 | 118,093 | 87,492 | 103,027 | |||||||||||||||||||||||||||||||||||||||||||||||||||
Cost of revenue | Cost of revenue | Cost of revenue | ||||||||||||||||||||||||||||||||||||||||||||||||||||||||||||||||||
| Cost of license fees | 709 | 989 | 1,284 | 1,726 | 2,547 | 2,819 | 567 | 729 | Cost of license fees | 709 | 989 | 1,284 | 1,726 | 2,547 | 2,819 | 2,110 | 2,733 | |||||||||||||||||||||||||||||||||||||||||||||||||||
Cost of services(1) | 4,339 | 5,534 | 7,028 | 10,253 | 14,234 | 21,006 | 4,911 | 5,378 | Cost of services(1) | 4,339 | 5,534 | 7,028 | 10,253 | 14,234 | 21,006 | 15,347 | 15,988 | |||||||||||||||||||||||||||||||||||||||||||||||||||
Cost of maintenance and subscriptions(1) | 11,443 | 15,246 | 15,120 | 11,733 | 10,588 | 11,837 | 2,835 | 2,660 | Cost of maintenance and subscriptions(1) | 11,443 | 15,246 | 15,120 | 11,733 | 10,588 | 11,837 | 9,031 | 7,864 | |||||||||||||||||||||||||||||||||||||||||||||||||||
| Cost of other revenue | 1,559 | 2,160 | 1,972 | 2,750 | 3,611 | 3,712 | 805 | 860 | Cost of other revenue | 1,559 | 2,160 | 1,972 | 2,750 | 3,611 | 3,712 | 2,556 | 2,577 | |||||||||||||||||||||||||||||||||||||||||||||||||||
| Total cost of revenue | 18,050 | 23,929 | 25,404 | 26,462 | 30,980 | 39,374 | 9,118 | 9,627 | Total cost of revenue | 18,050 | 23,929 | 25,404 | 26,462 | 30,980 | 39,374 | 29,044 | 29,162 | |||||||||||||||||||||||||||||||||||||||||||||||||||
Gross profit | Gross profit | 47,582 | 68,548 | 58,213 | 63,572 | 74,249 | 78,719 | 18,191 | 21,728 | Gross profit | 47,582 | 68,548 | 58,213 | 63,572 | 74,249 | 78,719 | 58,448 | 73,865 | ||||||||||||||||||||||||||||||||||||||||||||||||||
| Sales and marketing | 11,337 | 13,719 | 12,326 | 15,173 | 19,173 | 21,883 | 5,062 | 6,360 | Sales and marketing | 11,337 | 13,719 | 12,326 | 15,173 | 19,173 | 21,883 | 15,991 | 20,646 | |||||||||||||||||||||||||||||||||||||||||||||||||||
| Research and development | 9,604 | 13,923 | 13,912 | 14,755 | 14,385 | 15,516 | 3,620 | 4,276 | Research and development | 9,604 | 13,923 | 13,912 | 14,755 | 14,385 | 15,516 | 11,506 | 13,245 | |||||||||||||||||||||||||||||||||||||||||||||||||||
| General and administrative | 8,938 | 12,833 | 10,390 | 9,031 | 10,631 | 11,085 | 2,823 | 2,851 | General and administrative | 8,938 | 12,833 | 10,390 | 9,031 | 10,631 | 11,085 | 8,042 | 9,093 | |||||||||||||||||||||||||||||||||||||||||||||||||||
| Amortization | 2,574 | 2,510 | 2,200 | 2,239 | 1,045 | 848 | 48 | 32 | Amortization | 2,574 | 2,510 | 2,200 | 2,239 | 1,045 | 848 | 800 | 32 | |||||||||||||||||||||||||||||||||||||||||||||||||||
| Cost of initial public offering | — | — | — | — | — | — | — | 950 | Cost of initial public offering | — | — | — | — | — | — | — | 2,455 | |||||||||||||||||||||||||||||||||||||||||||||||||||
| Stock option compensation | — | — | — | — | — | 23,691 | 5,446 | 667 | Stock option compensation | — | — | — | — | — | 23,691 | 17,326 | 55 | |||||||||||||||||||||||||||||||||||||||||||||||||||
| Total operating expenses | 32,453 | 42,985 | 38,828 | 41,198 | 45,234 | 73,023 | 16,999 | 15,136 | Total operating expenses | 32,453 | 42,985 | 38,828 | 41,198 | 45,234 | 73,023 | 53,665 | 45,526 | |||||||||||||||||||||||||||||||||||||||||||||||||||
Income from operations | Income from operations | 15,129 | 25,563 | 19,385 | 22,374 | 29,015 | 5,696 | 1,192 | 6,592 | Income from operations | 15,129 | 25,563 | 19,385 | 22,374 | 29,015 | 5,696 | 4,783 | 28,339 | ||||||||||||||||||||||||||||||||||||||||||||||||||
| Interest income | 1,032 | 716 | 241 | 96 | 138 | 97 | 26 | 25 | Interest income | 1,032 | 716 | 241 | 96 | 138 | 97 | 70 | 133 | |||||||||||||||||||||||||||||||||||||||||||||||||||
| Interest expense | (638 | ) | (2,752 | ) | (11,265 | ) | (7,963 | ) | (4,410 | ) | (2,559 | ) | (863 | ) | (213 | ) | Interest expense | (638 | ) | (2,752 | ) | (11,265 | ) | (7,963 | ) | (4,410 | ) | (2,559 | ) | (2,216 | ) | (268 | ) | |||||||||||||||||||||||||||||||||||
| Other income (expense), net | 6,310 | (79 | ) | (185 | ) | (113 | ) | 63 | 235 | 15 | 349 | Other income (expense), net | 6,310 | (79 | ) | (185 | ) | (113 | ) | 63 | 235 | (100 | ) | 342 | ||||||||||||||||||||||||||||||||||||||||||||
Income before provision for income taxes | Income before provision for income taxes | 21,833 | 23,448 | 8,176 | 14,394 | 24,806 | 3,469 | 370 | 6,753 | Income before provision for income taxes | 21,833 | 23,448 | 8,176 | 14,394 | 24,806 | 3,469 | 2,537 | 28,546 | ||||||||||||||||||||||||||||||||||||||||||||||||||
| Income tax provision (benefit) | 158 | (1,456 | ) | 3,080 | 5,488 | 9,166 | 3,947 | 421 | 2,756 | Income tax provision (benefit) | 158 | (1,456 | ) | 3,080 | 5,488 | 9,166 | 3,947 | 2,886 | 11,619 | |||||||||||||||||||||||||||||||||||||||||||||||||
Net income (loss) | Net income (loss) | $ | 21,675 | $ | 24,904 | $ | 5,096 | $ | 8,906 | $ | 15,640 | $ | (478 | ) | $ | (51 | ) | $ | 3,997 | Net income (loss) | $ | 21,675 | $ | 24,904 | $ | 5,096 | $ | 8,906 | $ | 15,640 | $ | (478 | ) | $ | (349 | ) | $ | 16,927 | ||||||||||||||||||||||||||||||
| Earnings (loss) per share | Earnings (loss) per share | Earnings (loss) per share | ||||||||||||||||||||||||||||||||||||||||||||||||||||||||||||||||||
| Basic | $ | — | $ | — | $ | 0.08 | $ | 0.13 | $ | 0.23 | $ | (0.01 | ) | $ | (0.00 | ) | $ | 0.06 | Basic | $ | — | $ | — | $ | 0.13 | $ | 0.21 | $ | 0.37 | $ | (0.01 | ) | $ | (0.01 | ) | $ | 0.40 | |||||||||||||||||||||||||||||||
| Diluted | $ | — | $ | — | $ | 0.08 | $ | 0.13 | $ | 0.23 | $ | (0.01 | ) | $ | (0.00 | ) | $ | 0.05 | Diluted | $ | — | $ | — | $ | 0.13 | $ | 0.21 | $ | 0.37 | $ | (0.01 | ) | $ | (0.01 | ) | $ | 0.36 | |||||||||||||||||||||||||||||||
| Common shares and equivalents outstanding | Common shares and equivalents outstanding | Common shares and equivalents outstanding | ||||||||||||||||||||||||||||||||||||||||||||||||||||||||||||||||||
| Basic weighted average shares | N/A | N/A | 64,443 | 66,389 | 67,777 | 67,833 | 67,777 | 67,858 | Basic weighted average shares | N/A | N/A | 40,277 | 41,492 | 42,360 | 42,396 | 42,391 | 42,480 | |||||||||||||||||||||||||||||||||||||||||||||||||||
| Diluted weighted average shares | N/A | N/A | 64,443 | 66,389 | 67,777 | 67,833 | 67,777 | 73,823 | Diluted weighted average shares | N/A | N/A | 40,277 | 41,492 | 42,360 | 42,396 | 42,391 | 46,467 | |||||||||||||||||||||||||||||||||||||||||||||||||||
Summary of stock option compensation: | Summary of stock option compensation: | Summary of stock option compensation: | ||||||||||||||||||||||||||||||||||||||||||||||||||||||||||||||||||
| Cost of services | $ | — | $ | — | $ | — | $ | — | $ | — | $ | 3,342 | $ | 622 | $ | 294 | Cost of services | $ | — | $ | — | $ | — | $ | — | $ | — | $ | 3,342 | $ | 2,291 | $ | (644 | ) | ||||||||||||||||||||||||||||||||||
| Cost of maintenance and subscriptions | — | 505 | 93 | 37 | Cost of maintenance and subscriptions | — | 505 | 344 | (106 | ) | ||||||||||||||||||||||||||||||||||||||||||||||||||||||||||
| Total cost of revenue | — | — | — | — | — | 3,847 | 715 | 331 | Total cost of revenue | — | — | — | — | — | 3,847 | 2,635 | (750 | ) | ||||||||||||||||||||||||||||||||||||||||||||||||||
| Sales and marketing | — | — | — | — | — | 1,817 | 336 | 254 | Sales and marketing | — | — | — | — | — | 1,817 | 1,201 | (194 | ) | ||||||||||||||||||||||||||||||||||||||||||||||||||
| Research and development | — | — | — | — | — | 2,341 | 456 | 174 | Research and development | — | — | — | — | — | 2,341 | 1,639 | (517 | ) | ||||||||||||||||||||||||||||||||||||||||||||||||||
| General and administrative | — | — | — | — | — | 19,533 | 4,654 | 239 | General and administrative | — | — | — | — | — | 19,533 | 14,486 | 766 | |||||||||||||||||||||||||||||||||||||||||||||||||||
| Total operating expenses | — | — | — | — | — | 23,691 | 5,446 | 667 | Total operating expenses | — | — | — | — | — | 23,691 | 17,326 | 55 | |||||||||||||||||||||||||||||||||||||||||||||||||||
| Total stock option compensation | $ | — | $ | — | $ | — | $ | — | $ | — | $ | 27,538 | $ | 6,161 | $ | 998 | Total stock option compensation | $ | — | $ | — | $ | — | $ | — | $ | — | $ | 27,538 | $ | 19,961 | $ | (695 | ) | ||||||||||||||||||||||||||||||||||
| (1) | Includes stock option compensation as set forth in Summary of stock option compensation. |
| (2) | Earnings per share not computed for this year because we were an S corporation until our recapitalization in October 1999 and therefore the information would not be meaningful. |
| (3) | Certain amounts in the 1998, 1999 and 2000 financial statements have been reclassified to conform to the 2003 financial statement presentation. These reclassifications have no effect on previously reported net income (loss), shareholders’ equity or net income (loss) per share. |
2625
| March | ||||||||||||||||||||||||||||||||||||||||||||||||
| December 31, | 31, | December 31, | September 30, | |||||||||||||||||||||||||||||||||||||||||||||
| (in thousands) | 1999 | 2000 | 2001 | 2002 | 2003 | 2004 | 1999 | 2000 | 2001 | 2002 | 2003 | 2004 | ||||||||||||||||||||||||||||||||||||
| (unaudited) | (unaudited) | |||||||||||||||||||||||||||||||||||||||||||||||
Consolidated balance sheet data: | Consolidated balance sheet data: | |||||||||||||||||||||||||||||||||||||||||||||||
| Cash and cash equivalents | $ | 4,558 | $ | 1,707 | $ | 8,744 | $ | 18,703 | $ | 6,708 | $ | 6,085 | $ | 4,558 | $ | 1,707 | $ | 8,744 | $ | 18,703 | $ | 6,708 | $ | 33,382 | ||||||||||||||||||||||||
| Deferred tax asset | 108,521 | 105,441 | 99,953 | 90,943 | 88,765 | 86,725 | ||||||||||||||||||||||||||||||||||||||||||
| Deferred tax asset, including current portion | 108,521 | 105,441 | 99,953 | 90,943 | 88,765 | 81,210 | ||||||||||||||||||||||||||||||||||||||||||
| Working capital | (25,935 | ) | (33,478 | ) | (27,294 | ) | (21,111 | ) | (30,326 | ) | (28,442 | ) | (25,935 | ) | (33,478 | ) | (27,294 | ) | (18,997 | ) | (30,326 | ) | (11,879 | ) | ||||||||||||||||||||||||
| Total assets | 142,630 | 136,590 | 132,079 | 132,907 | 120,966 | 118,242 | 142,630 | 136,590 | 132,079 | 132,907 | 120,966 | 142,585 | ||||||||||||||||||||||||||||||||||||
| Deferred revenue | 20,915 | 30,699 | 33,946 | 39,047 | 43,673 | 43,765 | 20,915 | 30,699 | 33,946 | 39,047 | 43,673 | 51,727 | ||||||||||||||||||||||||||||||||||||
| Long-term debt and capital lease obligations, excluding current portion | 102,500 | 85,952 | 65,481 | 45,186 | 5,044 | 7 | 102,500 | 85,952 | 65,481 | 45,186 | 5,044 | — | ||||||||||||||||||||||||||||||||||||
| Total liabilities | 148,473 | 137,410 | 113,742 | 99,400 | 61,108 | 53,443 | 148,473 | 137,410 | 113,742 | 99,400 | 61,108 | 66,266 | ||||||||||||||||||||||||||||||||||||
| Common stock | — | 740 | 10,740 | 10,740 | 41,613 | 41,728 | — | 740 | 10,740 | 10,740 | 41,613 | 43 | ||||||||||||||||||||||||||||||||||||
| Additional paid-in capital | — | — | — | — | — | 38,056 | ||||||||||||||||||||||||||||||||||||||||||
| Total stockholders’ (deficit) equity | $ | (5,843 | ) | $ | (821 | ) | $ | 18,337 | $ | 33,507 | $ | 59,858 | $ | 64,799 | $ | (5,843 | ) | $ | (821 | ) | $ | 18,337 | $ | 33,507 | $ | 59,858 | $ | 76,319 | ||||||||||||||||||||
2726
Management’s discussion and analysis of financial condition and results of operations
The following discussion and analysis of our financial condition and results of operations should be read in conjunction with “Selected consolidated financial data” and our consolidated financial statements and related notes thereto appearing elsewhere in this prospectus. This discussion contains forward-looking statements.statements as defined in the Private Securities Litigation Reform Act. These statements reflect our current view with respect to future events and financial performance and are subject to risks, uncertainties and assumptions, including those discussed in “Risk factors”. Should one or more of these risks or uncertainties materialize, or should underlying assumptions prove incorrect, actual results might vary materially from those anticipated in the forward-looking statements.
Overview
We are the leading global provider of software and related services designed specifically for nonprofit organizations. Our products and services enable nonprofit organizations to increase donations, reduce fundraising costs, improve communications with constituents, manage their finances and optimize internal operations. We have focused solely on the nonprofit market since our incorporation in 1982 and have developed our suite of products and services based upon our extensive knowledge of the operating challenges facing nonprofit organizations. In 2003,2004, we had over 12,50012,700 customers, over 11,90012,300 of which pay us annual maintenance and support fees. Our customers operate in multiple verticals within the nonprofit market including religion, education, foundations, health and human services, arts and cultural, public and societal benefits, environment and animal welfare, and international foreign affairs.
We derive revenue from licensing software products and providing a broad offering of services, including consulting, training, installation, implementation, and donor prospect research and modeling services, as well as ongoing customer support and maintenance. Consulting, training and implementation are generally not essential to the functionality of our software products and are sold separately. Accordingly, we recognize revenue from these services separately from license fees.
Critical accounting policies and estimates
Our discussion and analysis of financial condition and results of operations are based upon our consolidated financial statements, which have been prepared in accordance with accounting principles generally accepted in the United States. The preparation of these financial statements requires us to make estimates and assumptions that affect the reported amounts of assets and liabilities at the date of the financial statements, the reported amounts of revenue and expenses during the reporting period and related disclosures of contingent assets and liabilities. The most significant estimates and assumptions relate to our allowance for sales returns and doubtful accounts, impairment of long-lived assets, valuation of stock option compensation and realization of deferred tax assets. We base our estimates on historical experience and on various other assumptions that we believe to be reasonable under the circumstances, the results of which form the basis for making judgments about the carrying values of assets and liabilities that are not readily apparent from other sources. On an ongoing basis, we reconsider and evaluate our estimates and assumptions. We are not aware of any circumstances in the past, which have caused these estimates and assumptions to be materially wrong. Furthermore, we are not currently aware of any material changes in our business that
27
28
The notes to the consolidated financial statements contained herein describe our significant accounting policies used in the preparation of the consolidated financial statements. We believe the critical accounting policies listed below affect significant judgments and estimates used in the preparation of our consolidated financial statements.
Revenue recognition
We recognizeThe Company’s revenue is generated primarily by licensing its software products and providing support, training, consulting, technical, hosting and other professional services for those products. The Company recognizes revenue in accordance with the provisions of the American Institute of Certified Public Accountants Statement of Position or SOP,(“SOP”) 97-2, “Software Revenue Recognition”, as amendedmodified by SOPSOPs 98-4 and SOP 98-9, as well as Technical Practice Aids issued from time to time by the American Institute of Certified Public Accountants, and in accordance with the SEC Staff Accounting Bulletin No. 101,104, “Revenue Recognition in Financial Statements”.
We recognizeUnder these pronouncements, the Company recognizes revenue from the salelicense of software licenses when persuasive evidence of an arrangement exists, the product has been delivered, title and risk of loss have transferred to the customer, the fee is fixed orand determinable and collection of the resulting receivable is probable. The Company uses a signed agreement as evidence of an arrangement. Delivery occurs when the product is delivered. In any sales transaction through a reseller, we shipThe Company’s typical license agreement does not include customer acceptance provisions; if acceptance provisions are provided, delivery is deemed to occur upon acceptance. The Company considers the product directlyfee to be fixed or determinable unless the fee is subject to refund or adjustment or is not payable within the Company’s standard payment terms. The Company considers payment terms greater than 90 days to be beyond its customary payment terms. The Company deems collection probable if the Company expects that the customer will be able to pay amounts under the arrangement as they become due. If the Company determines that collection is not probable, the Company postpones recognition of the revenue until cash collection. The Company sells software licenses with maintenance and, often times, professional services. The Company allocates revenue to delivered components, normally the license component of the arrangement, using the residual value method based on objective evidence of the fair value of the undelivered elements, which is specific to the end user and recognize revenue whenCompany. Fair value for the productmaintenance services associated with the Company’s software licenses is delivered. Inherentbased upon renewal rates stated in our revenue recognition policy are estimates about the probability of collectionCompany’s agreements, which vary according to the level of the resulting receivable. Historically,maintenance program. Fair value of professional services and other products and services is based on sales of these products and services to other customers when sold on a stand-alone basis.
The Company recognizes revenue from maintenance services ratably over the contract term, which is one year. Maintenance revenue also includes the right to unspecified product upgrades on an if-and-when available basis. Subscription revenue includes fees for hosted solutions, data enrichment services and hosted online training programs. Subscription-based revenue and any related set-up fees are recognized ratably over the twelve-month service period of the contracts, as there is no discernible pattern of usage.
The Company’s services, which include consulting, installation and implementation services, are generally billed based on hourly rates plus reimbursable travel and lodging related expenses. For small service engagements, less than $10,000, the Company frequently contracts for and
28
The Company sells training at a fixed rate for each specific class, at a per attendee price, or at a packaged price for several attendees, and revenue is recognized only upon the customer attending and completing training. The Company recognizes revenue from donor prospect research and data modeling service engagements upon delivery.
To the extent that the Company’s customers pay for the above-described services in advance of delivery, the amounts are recorded in deferred revenue.
Deferred sales commission costs
Prior to July 1, 2004 we paid commissions to our actual results havesales representatives based on signing a contract for the sale of both software and services arrangements, other than training. This method was changed effective July 1, 2004 such that at the time the software and services are delivered and revenue is recognized, we pay commissions to our sales representatives on the services performed. Deferred sales commission costs relate to services not varied significantly from our estimates.yet provided for which sales representatives were paid commissions prior to July 1, 2004.
Sales returns and allowance for doubtful accounts
We provide customers a 30-day right of return and maintain a reserve for returns. We estimate the amount of this reserve based on historical experience. Provisions for sales returns are charged against the related revenue items.
We maintain an allowance for doubtful accounts at an amount we estimate to be sufficient to provide adequate protection against losses resulting from extending credit to our customers. In judging the adequacy of the allowance for doubtful accounts, we consider multiple factors including historical bad debt experience, the general economic environment, the need for specific customer reserves and the aging of our receivables. Any necessary provision is reflected in general and administrative expense. A considerable amount of judgment is required in assessing these factors and if any receivables were to deteriorate, an additional provision for doubtful accounts could be required.
Deferred sales commission costs
Upon contract signing, we pay commissions to our sales representatives based on their sale of both software and services arrangements, other than training. Since the revenue associated with a portion of the commission that was paid has not yet been recognized as revenue, we treat that portion of the sales commission as deferred sales commission costs until the related revenue is recognized.
Valuation of long-lived and intangible assets and goodwill
We review identifiable intangible and other long-lived assets for impairment annually or sooner ifwhen events change or circumstances indicate the carrying amount may not be recoverable.
29
29
Stock option compensation
We account for stock option compensation under the provisions of Accounting Principles Board Opinion, or APB, No. 25, “Accounting for Stock Issued to Employees”. Under this pronouncement, there is generally no cost associated with options that are granted with an exercise price equal to or above the fair value per share of our common stock on the date of grant, as estimated by our board of directors.grant. Because there has beenwas no public market for our stock prior to our initial public offering in July 2004, our board of directors estimated the fair value of our common stock by considering a number of factors, including our operating performance, significant events in our history, trends in the broad market for technology stocks and the expected valuation we would obtain in an initial public offering. Grants under two of our option plans, covering approximately 10.56.5 million shares, contain provisions that result in them being treated as variable awards under APB No. 25. The effect of this accounting is that an amount equal to the difference between the exercise price of the options and the estimated current fair value is charged to deferred compensation and amortized as an expense over the related vesting periods of the grants using the accelerated method outlined in Statement ofFASB Financial Interpretations,Interpretation Number 28, or FIN No. 28, “Accounting for Stock Appreciation Rights and Other Variable Stock Option or Awards Plans”. Under variable award accounting, the affected option grants continue to be marked to market until such time as the amount of related compensation is deemed fixed. As such, optionsOptions for approximately 4.93.0 million shares wouldare no longer bebeing accounted for as variable awards uponfollowing the occurrence of anour initial public offering.offering in July 2004. The option for the remaining 5.63.5 million shares,options, which isare held by our Chief Executive Officer, will continue to be accounted for as a variable
30
| Three months | ||||||||||||||||||||
| Year ended December 31, | ended March 31, | |||||||||||||||||||
| (in thousands) | 2001 | 2002 | 2003 | 2003 | 2004 | |||||||||||||||
| (unaudited) | ||||||||||||||||||||
| Net income (loss) as reported | $ | 8,906 | $ | 15,640 | $ | (478 | ) | $ | (51 | ) | $ | 3,997 | ||||||||
| Total stock option compensation | — | — | 27,538 | 6,161 | 998 | |||||||||||||||
| Deferred tax benefit associated with stock option compensation | — | — | (7,683 | ) | (1,606 | ) | (260 | ) | ||||||||||||
| Net income before the effect of stock option compensation | $ | 8,906 | $ | 15,640 | $ | 19,377 | $ | 4,504 | $ | 4,735 | ||||||||||
We have separately disclosed stock option compensation throughout this discussion and in our financial statements and we have shown a reconciliation of stock option compensation as it relates to sales and marketing, research and development, and general and administrative expenses on the statementstatements of operations because, in managing our operations, we believe such costs significantly affect our ability to better understand and manage other operating expenses and cash needs.
We have also disclosed in note 1 of the Notes to the consolidated financial statements the pro forma effects of accounting for our stock option compensation in accordance with SFAS No. 123, “Accounting for Stock Based Compensation”.
Deferred taxes
Significant judgment is required in determining our interim income taxes in each of the jurisdictions in which we operate. This process involves estimating our actual current tax
30
Prior to October 13, 1999, we were organized as an S corporation under the Internal Revenue Code and, therefore, were not subject to federal income taxes. We historically made distributions to our shareholders to cover the shareholders’ anticipated tax liability. In connection with the recapitalization agreement, we converted our U.S. taxable status from an S corporation to a C corporation. Accordingly, since October 14, 1999 we have been subject to federal and state income taxes. Upon the conversion and in connection with the recapitalization, we recorded a one-time benefit of $107.0 million to establish a deferred tax asset as a result of the recapitalization agreement.
We must assess the likelihood that the net deferred tax asset will be recovered from future taxable income and to the extent we believe that recovery is not likely, we must establish a valuation allowance. To the extent we establish a valuation allowance, we must include an expense within the tax provision in the statement of operations. We have not recorded a
31
Our deferred tax assets and liabilities are recorded at an amount based upon a U.S. Federal income tax rate of 34%. This rate is based on our expectation that our deductible and taxable temporary differences will reverse over a period of years during which we will have average annual taxable income not exceeding $10.0 million per year. If our results of operations improve in the future, such that our average annual taxable income will be expected to exceed $10.0 million, we will record our deferred tax assets and liabilities at an amount reflecting an average expected U.S. Federal income tax rate of up to 35%, consistent with the corresponding expectation of higher taxable income. If such change is determined to be appropriate, it will affect the provision for income taxes during the period that the determination is made.
Contingencies
We are subject to the possibility of various loss contingencies in the normal course of business. We accrue for loss contingencies when a loss is estimable and probable.
Acquisitions
In July 2002, we acquired substantially all of the assets of AppealMaster Ltd., a software company located in the United Kingdom, for $500,000 and additional contingent payments based on future performance, which have been recorded as additional purchase price. This purchase price has been allocated to the assets acquired and liabilities assumed based upon their estimated fair values at the date of acquisition. The excess consideration above the fair value of net assets acquired of approximately $852,000 was recorded as goodwill in July 2002.
31
During the three yearthree-year period ended December 31, 2003 we made other acquisitions that were not significant. These acquisitions were accounted for under the purchase method of accounting and the results of operations of the acquirees have been included in the consolidated statement of operations since the acquisition dates.
32
There were no acquisitions during the nine month period ended September 30, 2004.
Results of operations
The following table sets forth our statements of operations data expressed as a percentage of total revenue for the periods indicated.
Consolidated statements of operations, percent of total revenue
| Three months | |||||||||||||||||||||||||||||||||||||||||||||
| Year ended December 31, | ended March 31, | ||||||||||||||||||||||||||||||||||||||||||||
| 2001 | 2002 | 2003 | 2003 | 2004 | Nine months ended | ||||||||||||||||||||||||||||||||||||||||
| Year ended December 31, | September 30, | ||||||||||||||||||||||||||||||||||||||||||||
| 2001 | 2002 | 2003 | 2004 | 2003 | |||||||||||||||||||||||||||||||||||||||||
| (unaudited) | |||||||||||||||||||||||||||||||||||||||||||||
Revenue | Revenue | Revenue | |||||||||||||||||||||||||||||||||||||||||||
| License fees | 21.4 | % | 19.5 | % | 18.1 | % | 16.5 | % | 16.2 | % | License fees | 21.4 | % | 19.5 | % | 18.1 | % | 18.1 | % | 17.6 | % | ||||||||||||||||||||||||
| Services | 20.9 | 25.4 | 28.8 | 28.4 | 30.4 | Services | 20.9 | 25.4 | 28.8 | 31.7 | 29.6 | ||||||||||||||||||||||||||||||||||
| Maintenance and subscriptions | 52.2 | 50.2 | 49.4 | 51.6 | 50.3 | Maintenance and subscriptions | 52.2 | 50.2 | 49.4 | 47.4 | 49.5 | ||||||||||||||||||||||||||||||||||
| Other revenue | 5.5 | 4.9 | 3.7 | 3.5 | 3.0 | Other revenue | 5.5 | 4.9 | 3.7 | 2.8 | 3.3 | ||||||||||||||||||||||||||||||||||
| Total revenue | 100.0 | % | 100.0 | % | 100.0 | % | 100.0 | % | 100 | % | Total revenue | 100.0 | 100.0 | 100.0 | 100.0 | 100.0 | |||||||||||||||||||||||||||||
Cost of revenue | Cost of revenue | Cost of revenue | |||||||||||||||||||||||||||||||||||||||||||
| Cost of license fees | 1.9 | 2.4 | 2.4 | 2.1 | 2.3 | Cost of license fees | 1.9 | 2.4 | 2.4 | 2.7 | 2.4 | ||||||||||||||||||||||||||||||||||
| Cost of services | 11.4 | 13.5 | 17.8 | 18.0 | 17.2 | Cost of services | 11.4 | 13.5 | 17.8 | 15.5 | 17.5 | ||||||||||||||||||||||||||||||||||
| Cost of maintenance and subscriptions | 13.0 | 10.1 | 10.0 | 10.4 | 8.5 | Cost of maintenance and subscriptions | 13.0 | 10.1 | 10.0 | 7.6 | 10.3 | ||||||||||||||||||||||||||||||||||
| Cost of other revenue | 3.1 | 3.4 | 3.1 | 2.9 | 2.7 | Cost of other revenue | 3.1 | 3.4 | 3.1 | 2.5 | 3.0 | ||||||||||||||||||||||||||||||||||
| Total cost of revenue | 29.4 | 29.4 | 33.3 | 33.4 | 30.7 | Total cost of revenue | 29.4 | 29.4 | 33.3 | 28.3 | 33.2 | ||||||||||||||||||||||||||||||||||
Gross profit | 70.6 | 70.6 | 66.7 | 66.6 | 69.3 | ||||||||||||||||||||||||||||||||||||||||
Gross Profit | 70.6 | 70.6 | 66.7 | 71.7 | 66.8 | ||||||||||||||||||||||||||||||||||||||||
Operating Expenses | Operating Expenses | ||||||||||||||||||||||||||||||||||||||||||||
| Sales and marketing | 16.9 | 18.2 | 18.5 | 18.5 | 20.3 | Sales and marketing | 16.9 | 18.2 | 18.5 | 20.0 | 18.3 | ||||||||||||||||||||||||||||||||||
| Research and development | 16.4 | 13.7 | 13.1 | 13.3 | 13.6 | Research and development | 16.4 | 13.7 | 13.1 | 12.9 | 13.2 | ||||||||||||||||||||||||||||||||||
| General and administrative | 10.0 | 10.1 | 9.4 | 10.3 | 9.1 | General and administrative | 10.0 | 10.1 | 9.4 | 8.8 | 9.1 | ||||||||||||||||||||||||||||||||||
| Amortization | 2.5 | 1.0 | 0.7 | 0.2 | 0.1 | Amortization | 2.5 | 1.0 | 0.7 | 0.0 | 0.9 | ||||||||||||||||||||||||||||||||||
| Cost of initial public offering | — | — | — | — | 3.0 | Cost of initial public offering | — | — | — | 2.4 | 0.0 | ||||||||||||||||||||||||||||||||||
| Stock option compensation | — | — | 20.1 | 19.9 | 2.1 | Stock option compensation | — | — | 20.1 | 0.1 | 19.8 | ||||||||||||||||||||||||||||||||||
| Total operating expenses | 45.8 | 43.0 | 61.8 | 62.2 | 48.3 | Total operating expenses | 45.8 | 43.0 | 61.8 | 44.2 | 61.3 | ||||||||||||||||||||||||||||||||||
Income from operations | Income from operations | 24.8 | 27.6 | 4.9 | 4.4 | 21.0 | Income from operations | 24.8 | 27.6 | 4.9 | 27.5 | 5.5 | |||||||||||||||||||||||||||||||||
| Interest income | 0.1 | 0.1 | 0.1 | 0.1 | 0.1 | Interest income | 0.1 | 0.1 | 0.1 | 0.1 | 0.0 | ||||||||||||||||||||||||||||||||||
| Interest expense | (8.9 | ) | (4.2 | ) | (2.2 | ) | (3.2 | ) | (0.7 | ) | Interest expense | (8.9 | ) | (4.2 | ) | (2.2 | ) | (0.2 | ) | (2.5 | ) | ||||||||||||||||||||||||
| Other (expense) income, net | (0.1 | ) | 0.1 | 0.2 | 0.1 | 1.1 | Other income (expenses), net | (0.1 | ) | 0.1 | 0.2 | 0.3 | (0.1 | ) | |||||||||||||||||||||||||||||||
Income before provision for income taxes | Income before provision for income taxes | 15.9 | 23.6 | 3.0 | 1.4 | 21.5 | Income before provision for income taxes | 15.9 | 23.6 | 3.0 | 27.7 | 2.9 | |||||||||||||||||||||||||||||||||
| Income tax provision | 6.1 | 8.7 | 3.3 | 1.5 | 8.8 | Income tax provision | 6.1 | 8.7 | 3.3 | 11.3 | 3.3 | ||||||||||||||||||||||||||||||||||
Net income (loss) | Net income (loss) | 9.8 | % | 14.9 | % | (0.3 | )% | (0.2 | )% | 12.7 | % | Net income (loss) | 9.8 | % | 14.9 | % | (0.3 | %) | 16.4 | % | (0.4 | %) | |||||||||||||||||||||||
32
Comparison of quartersthe nine months ended March 31,September 30, 2004 and 2003 and 2004
Revenue
First quarter totalTotal revenue of $103.0 million for the nine months ended September 30, 2004 increased by $4.1$15.5 million, or 15.0%17.7%, from $27.3compared with $87.5 million in 2003 to $31.4 million in 2004.for the nine months ended September 30, 2003. The increase resulted fromis the result of increases in sales of services and license fees from the sale of software to new and existing customers. Also contributing to the growth wereare increases in maintenance revenue resulting from new maintenance contracts associated with the new license agreements and subscription revenue associated with expanded subscription offerings.
33
License Feesfees
Revenue from license fees is derived from the sale of our software products, typically under a perpetual license agreement. Revenue from license fees increased by $0.6 million, or 13.3%, from $4.5of $18.6 million in the first quarter 2003 to $5.1nine months ended September 30, 2004 increased by $3.2 million, or 20.8%, compared with $15.4 million in the first quarter 2004.nine months ended September 30, 2003. These amounts represented 16.5%represent 18.1% and 16.2%17.6% of total revenue for the first quarter ofnine months ended September 30, 2004 and 2003, and 2004, respectively. The increase in license fees in the first quarter ofnine months ended September 30, 2004 wasis attributable to $0.6$1.4 million of product sales to our installed customer base.base and $1.8 million of product sales to new customers. The prices charged for our license fees have remained unchanged for this period.
Services
Revenue for services includes fees received from customers for consulting, installation, implementation, training, donor prospect research and data modeling services and customer training. First quarter revenueservices. Revenue from services of $32.7 million for the nine month period ended September 30, 2004 increased by $1.8$6.8 million, or 23.4%26.3%, from $7.7compared with $25.9 million in 2003 to $9.5 million in 2004.for the nine month period ended September 30, 2003. These amounts represented 28.4%represent 31.7% and 30.4%29.6% of total revenue for the first quarternine month period ended September 30, 2004 and 2003, and 2004, respectively. This increase in services revenue is attributable to an increase in sales of consulting, installation, implementation, donor prospect research and data modeling services and customer training. In the first quarternine months ended September 30, 2004, sales of 2004, salesthese services to new and existing customers increased 6%34% and 63%18%, respectively, compared withto the first quarter ofnine months ended September 30, 2003. The rates charged for our service offeringofferings have remained relatively constant over this time period and, as such, the increases resulted from an increase in volume of services provided. Consulting, installation and implementation services involve converting data from a customer’s existing system, assistance in file set up and system configuration, and/or process re-engineering. These services accountedaccount for $3.6$17.4 million and $5.0$13.0 million of revenues in the first quarternine months ended September 30, 2004 and 2003, and 2004, respectively, representing 46.8%53.2% and 53.1%50.1% of total services revenue in those quarters.nine month periods. Donor prospect research and data modeling services involve the performance of assessments of customer donor (current and prospective) information, the end product of which enables the customer to more effectively target its fundraising activities. These assessments are performed using our proprietary analytical tools. These services accountedaccount for $0.8$3.9 million and $1.1$2.8 million of revenues in the first quarternine months ended September 30, 2004 and 2003, respectively, representing 12.0% and 2004, respectively, and represented 10.8% and 11.2%10.6% of total services
33
Maintenance and subscriptions
Revenue from maintenance and subscriptions is predominantly comprised of annual fees derived from new maintenance contracts associated with new software licenses and annual renewals of existing maintenance contracts. These contracts provide customers updates, enhancements, and upgrades to our software products, as well asand online, telephone and email support. Also included is revenue derived from our subscription-based services, principally hosted fundraising software solutions and certain data services. Maintenance and subscriptions revenue increased by $1.7 million, or 12.1%, from $14.1of $48.9 million in the first quarter 2003 to $15.8nine month period ended September 30, 2004 increased by $5.6 million, or 12.9%, compared with $43.3 million in the first quarter 2004.nine month period ended September 30, 2003. These amounts represented 51.6%represent 47.4% and 50.3%49.5% of our total revenue for the first quarter ofnine month periods ended September 30, 2004 and 2003, and 2004, respectively. The 2004 first quarterincrease in maintenance and subscription revenue increasefor the nine months ended September 30, 2004, over the first quartersame period in 2003, consists of $1.7 million is comprised of $1.4$5.0 million from new maintenance contracts associated with new license agreements, $0.2$1.0 million of incremental subscriptions and $0.4$1.3 million from inflationary rate increases,adjustments, offset by $0.3$1.7 million fromof maintenance contracts that were not renewed.
34
Other revenue
Other revenue includes revenue from the sale of business forms that are used in conjunction with our software products; reimbursement of travel and related expenses, principallyexpense, primarily incurred during the performance of services at customer locations; fees from user conferences; and the sale of computer-based training modules. Other revenue of $1.0$2.8 million remains relatively constant fromin the first quarter 2003 tonine month period ended September 30, 2004 decreased by $0.1 million, or 3.4% compared with $2.9 million in the first quarter 2004. This amount represented 3.5%nine month period ended September 30, 2003. These amounts represent 2.8% and 3.3% of total revenue for the first quarternine month periods ended September 30, 2004 and 2003, and 3.0%respectively. The reduction in other revenue is due to the decrease in sales of total revenue for the first quarter 2004.
Cost of revenue
Cost of license fees
Cost of license fees includes third-party software royalties, variable reseller commissions and costs of shipping software products to our customers. Cost of license fees increased by $0.1 million, or 16.7%, from $0.6of $2.7 million in the first quarter 2003 to $0.7nine month period ended September 30, 2004 increased by $0.6 million, or 28.6%, compared with $2.1 million in the first quarter 2004.nine month period ended September 30, 2003. These amounts represented 12.6%represent 14.7% and 14.4%13.7% of license fee revenue in the first quarternine month periods ended September 30, 2004 and 2003, and 2004, respectively. The increase in the first quarter ofnine month period ended September 30, 2004 over the first quarternine month period ended September 30, 2003 was due to royalties paid for The Patron Edge software and increases in variable commissions paid to resellers of The Financial Edge as a result of increased sales of this product.
34
Cost of services
Cost of services is principallyprimarily comprised of direct controllable costs, which include salary and benefits, including non-cash stock-based compensation charges; third-party contractor expenses,expenses; data expenses and classroom rentals. Additionally, cost of services includes an allocation of facilities and depreciation expense stock option compensation and other costs incurred in providing consulting, installation, implementation, donor prospect research and data modeling services and customer training. Cost of services increased $0.5 million, or 10.2%, from $4.9of $16.0 million in the first quarter 2003 to $5.4nine month period ended September 30, 2004 increased $0.7 million, or 4.6%, compared with $15.3 million in the first quarter 2004.nine month period ended September 30, 2003. These amounts represented 63.4%represent 48.9% and 56.3%59.3% of total services revenue in the first quarter ofnine month periods ended September 30, 2004 and 2003, and 2004, respectively. Expenses associated with headcount increases were the primary driver of the increase in the cost to provide service revenue. The margin improvement is the result ofresults primarily from the decrease in the stock option compensation expense component of cost of services from an expense of $2.6 million in the 2003 period to a benefit of $0.6 million to $0.3 million.
Further analysis of cost of services is provided below; however the costs presented are before the inclusion of various allocable corporate costs and stock option compensation. For a tabular presentation of these costs,items, see note 14 of the Notes to the consolidated financial statements beginning on page F-27.
Cost of revenue in providing consulting, installation, and implementation services was $2.2$9.0 million and $2.6$6.6 million for the first quarternine month periods ended September 30, 2004 and 2003, and 2004, respectively. These amounts represent 62.2%51.9% and 52.1%50.9% of the related revenue in the first quarter ofnine month periods ended September 30, 2004 and 2003, and 2004, respectively. The expense increase wasis related to headcount growth, of 14% and the resulting higher human resource costs; however, the margin increased as a result of higher staff utilization and operational efficiencies.
Cost of revenue in providing donor prospect research and data modeling services (analytic services) was $0.2$1.6 million and $0.4$1.1 million in the first quarternine month periods ended September 30, 2004 and 2003, and 2004, respectively, representing 28.4%41.0% and 40.8%39.5% of the related revenue for the first quarternine month periods ended September 30, 2004 and 2003, and 2004, respectively. Higher data related expenses of $0.2 million are primarily responsible for the quarteryear over quarteryear increase.
35
Cost of revenue in providing customer training and education was $1.1 million and $1.2$3.6 million in the first quarternine month period ended September 30, 2004 and $3.3 million in the nine month period ended September 30, 2003, representing 31.6% and 2004, respectively, representing 33.1% and 34.4%32.4% of the related revenue in the first quarter ofnine-month periods ended September 30, 2004 and 2003, and 2004, respectively. The increase wasmargin growth is the result of increased headcount to provide training.
Cost of maintenance and subscriptions
Cost of maintenance and subscriptions is primarily comprised of salary and benefits, including non-cash stock-based compensation charges;compensation; third-party contractor expenses; data expenses; an allocation of our facilities and depreciation expenses; and other costs incurred in providing support and services to our customers. Cost of maintenance and subscriptions decreased $0.1 million, or 3.6%, from $2.8of $7.9 million in the first quarter 2003 to $2.7nine month period ended September 30, 2004 decreased $1.1 million, or 12.2%, compared with $9.0 million in the first quarter 2004.nine month period ended September 30, 2003. These amounts represented 20.1%represent 16.1% and 16.9%20.9% of related revenue in the first quarternine month periods ended September 30, 2004 and 2003, and 2004, respectively. The cost decrease wasreduction in expenses is principally due to reduced headcount.costs in 2003 associated with our attempts to develop a subscription-based patron management business and
35
Cost of other revenue
Cost of other revenue includes salaries and benefits, costs of business forms, reimbursable expenses relating to the performance of services at customer locations, and an allocation of facilities and depreciation expenses. Cost of other revenue increased $0.1 million, or 12.5%, from $0.8was $2.6 million in both the first quarter 2003 to $0.9 million innine month periods ended September 30, 2004 and 2003. These amounts represent 90.5% and 88.0% of the first quarter 2004, representing 83.7% and 90.2% of its related revenue in the first quarternine month periods ended September 30, 2004 and 2003, andrespectively. The primary factor for reduced margin in 2004 respectively. This increase was primarily dueis higher volume of reimbursable travel compared to increasesthe same period in reimbursable costs associated with the growth of our services business.
Operating expenses
Sales and marketing
Sales and marketing expenses include salaries and related human resource costs of our sales and marketing organizations, travel and entertainment expenses, sales commissions, advertising and marketing materials, public relations and an allocation of facilities and depreciation expenses. Sales and marketing costs increased by $1.3 million, or 25.5%, from $5.1of $20.6 million in the first quarter 2003 to $6.4nine month period ended September 30, 2004 increased by $4.6 million, or 28.8%, compared with $16.0 million in the first quarter of 2004.nine month period ended September 30, 2003. These amounts exclude in each year $0.3a benefit of $0.2 million and an expense of $1.2 million of stock option compensation in the nine month periods ended September 30, 2004 and 2003, respectively, which is recorded as a separate item in total operating expenses. Sales and marketing expenses represented 18.5%represent 20.0% and 20.3%18.3% of total revenue in the first quarternine month periods ended September 30, 2004 and 2003, and 2004, respectively. The increase is principally comprised of commissions of $1.6 million associated with increases in sales commissionsrevenue and costs of $0.5increased headcount of $1.7 million attributableas a result of a focused effort to increased revenue from license feesincrease the size and services and commission guarantees to certain membersskill set of the sales force in connection with a sales force reorganization, $0.7 million of costs resulting from growth in the number of people in our sales forceforce. Also contributing to the increase is $0.3 million in travel expenses and $0.1$0.2 million of travel expenses.
Research and development
Research and development expenses include salaries and related human resource costs, third-party contractor expenses, software development tools, an allocation of facilities and depreciation expenses and other expenses in developing new products and upgrading and enhancing existing products. Research and development expenses increased $0.7 million, 19.4%, from $3.6costs of $13.2 million in the first quarter 2003 to $4.3nine month period ended September 30, 2004 increased $1.7 million, or 14.8%, compared with $11.5 million in the first quarter of 2004.nine month period ended September 30, 2003. These amounts exclude a benefit of $0.5 million and $0.2an expense of $1.6 million of stock option compensation in the first quarter ofnine month periods ended September 30, 2004 and 2003, and 2004, respectively. Research and development expenses represented 13.3%
36
General and administrative
General and administrative expenses consist principallyprimarily of salaries and related human resource costs for general corporate functions, including finance, accounting, legal, human resources,
36
Stock option compensation
Stock option compensation, included in operating expenses, represents the benefit or charge taken for the difference between the estimated fair value of our common stock and the exercise price of the stock option grants to personnel in sales and marketing, research and development, and general and administrative functions. The value of these variable grants is adjusted each reporting period based upon the closing trading price of our common stock at each balance sheet date. Decreases in the Company’s closing trading price from one reporting period to the next will likely result in a benefit to the Company, and increases in the Company’s closing trading price will likely result in charges to expense. We have separately disclosed stock option compensation benefit and expense throughout this discussion and in our financial statements and we have shown a reconciliation of stock option compensation as it relates to sales and marketing, research and development, and general and administrative expenses on the statement of operations because, in managing our operations, we believe these benefits and costs significantly affect our ability to better understand and manage other operating expenses and cash needs. We are amortizing these amountsthe deferred compensation costs over the vesting periods of the applicable options using the accelerated method as prescribed in FIN 28. Stock option compensation decreased $4.7 million, or 87.0%, from $5.4 million in the first quarter 2003 towas a benefit of $0.7 million infor the firstnine months ended September 30, 2004 compared to an expense of $20.0 million for the nine months ended September 30, 2003, a decrease of $20.7 million. The decrease is principally the result of adjusting the deferred compensation associated with approximately 3.0 million options to the initial public offering price of $8.00 per share, down from the previously estimated value of $9.60 per share used at the end of the second quarter 2004. This decrease resultsBecause the provisions in these particular grants that require variable accounting expire at an IPO, these options are no longer subject to variable accounting treatment. The remaining 3.5 million shares held by our CEO have been adjusted from the absence$9.60 per share to our closing stock price of an increase$9.80 per share at September 30, 2004 and will continue to be accounted for as a variable award until such options are fully exercised.
Costs of initial public offering
The $2.5 million in the fair market value of our stock from the fourth quarter of 2003 to the first quarter of 2004 compared with the estimated 25% increase from the fourth quarter of 2002 to the first quarter of 2003.
The costs of our initial public offering include professional fees such as attorney and accountant fees, printing costs and filing fees.
Interest expense
Interest expense of $0.3 million in the nine month period ended September 30, 2004 decreased $0.7$1.9 million, or 77.8%86.4%, from $0.9compared with $2.2 million in the first quarternine month period ended September 30, 2003, to $0.2 million the first quarter 2004, representing 3.2%0.2% and 0.1%2.5% of total revenue in the first quarternine month periods
37
Other (expense) income
Other (expense) income consists of foreign exchange gains or losses and miscellaneous non-operating income and expense items. Other (expense) income increased $0.4 million to income of $0.3 million in the
37
Income tax provision
Our effective tax rate has changed fromto 40.7% in the nine month period ended September 30, 2004 compared to 113.8% in the first quarter 2003 to 40.8% in the first quarter 2004.nine month period ended September 30, 2003. In 2003, the unusual rate was attributable principally to permanent differences resulting from the portion of stock option compensation associated with incentive stock options. The stock option compensation charge associated with incentive stock options was substantially lower in the first quarter of 2004 compared with the first quarter of 2003. We expect that our effective tax rate will be less significantly impacted by these matters in the future.
Significant judgment is required in determining the provision for income taxes. During the ordinary course of business, there are many transactions and calculations for which the ultimate tax determination is uncertain. We record our tax provision at the anticipated tax rates based on estimates of annual pretax income. To the extent that the final results differ from these estimated amounts that were initially recorded, such differences will impact the income tax provision in the period in which such determination is made and could have an impact on the deferred tax asset. Our deferred tax assets and liabilities are recorded at an amount based upon a U.S. Federal income tax rate of 34%. This rate is based on ouran expectation that our deductible and taxable temporary differences will reverse over a period of years during which we will have average annual taxable income not exceeding $10.0 million per year. If our results of operations improve in the future, such that our average annual taxable income will be expected to exceed $10$10.0 million, we will record our deferred tax assets and liabilities at an amount reflecting an average expected U.S. Federal income tax rate of up to 35%, consistent with the corresponding expectation of higher taxable income. If such change is determined to be appropriate, it will affect the provision for income taxes during the period that the determination is made.
Comparison of years ended December 31, 2001, 2002 and 2003
Revenue
Total revenue increased by $15.2 million, or 16.9%, from $90.0 million in 2001 to $105.2 million in 2002, and by $12.9 million, or 12.3%, in 2003 to $118.1 million. The increase in 2002 was attributable to increases in sales of services to our customer base and license fees arising from the sale of software to new and existing customers. These product sales also drove increases in maintenance revenues. The increase in 2003 was primarily due to further growth in services and continued growth in maintenance and subscriptions. No single customer accounted for more than 2.0% of our total revenue during 2001, 2002 or 2003.
License Fees
Revenue from license fees increased by $1.3 million, or 6.7%, from $19.3 million in 2001 to $20.6 million in 2002. These amounts represented 21.4% and 19.5% of total revenue for 2001 and 2002, respectively. Revenue from license fees increased by $0.7 million, or 3.4%, from $20.6 million in 2002 to $21.3 million in 2003. This amount represented 18.0% of total revenue in 2003. The increase in license fees in 2002 was attributable to product sales to new customers
38
38
Services
Revenue from services increased by $7.9 million, or 42.0%, from $18.8 million in 2001 to $26.7 million in 2002. These amounts represented 20.9% and 25.4% of total revenue for 2001 and 2002, respectively. Revenue from services increased by $7.3 million, or 27.3%, from $26.7 million in 2002 to $34.0 million in 2003. This amount represented 28.8% of total revenue in 2003. The increase in services revenue in both years was due to an increase in sales of consulting, installation, implementation, donor prospect research and data modeling services and customer training. Sales to new customers increased 50% and 21% in 2002 and 2003, respectively, and sales to existing customers increased 28% and 22% in 2002 and 2003, respectively. The rates charged for our service offerings have remained relatively constant over this time period and, as such, the increases resulted from an increase in volume of services provided. Additionally, our ability to better penetrate larger nonprofit entities increased the demand for our service offerings, and contracts with these customers include a higher percentage of total revenue from services. Consulting, installation and implementation services accounted for $7.9 million, $11.9 million and $17.5 million, in the years ended December 31, 2001, 2002 and 2003, respectively, representing 42.0%, 44.5% and 51.4% of total services revenue for those years. Donor prospect research and data modeling services accounted for $0.6 million, $2.2 million and $3.6 million, in the years ended December 31, 2001, 2002 and 2003, respectively, and represented 3.2%, 8.2% and 10.6% of total services revenue for those years. Also contributing to this increase was customer training revenue of $10.3 million, $12.7 million and $12.9 million in the years ended December 31, 2001, 2002 and 2003, respectively, representing 54.8%, 47.5% and 37.9% of total services revenue for those years.
Maintenance and subscriptions
Maintenance and subscriptions revenue increased by $5.8 million, or 12.3%, from $47.0 million in 2001 to $52.8 million in 2002. These amounts represented 52.2% and 50.2% of our total revenue for 2001 and 2002, respectively. Maintenance and subscriptions revenue increased by $5.6 million, or 10.6%, from $52.8 million in 2002 to $58.4 million in 2003. This amount represented 49.4% of our total revenue in 2003.
The increases are attributable to the sales of new software licenses and the addition of new offerings that can be sold as renewable subscriptions, slightly offset by non-renewed maintenance contracts. The 2002 maintenance and subscription revenue increase over 2001 of $5.8 million is comprised of $5.7 million from new maintenance contracts associated with new license agreements, $1.2 million of incremental subscriptions, offset by $1.1 million of maintenance contracts that were not renewed. Maintenance and subscription revenue growth in 2003 over 2002 of $5.6 million is comprised of $6.0 million from new maintenance contracts associated with new license agreements, $0.6 million of additional subscription revenue, offset by $1.0 million of maintenance contracts that were not renewed.
Other revenue
Other revenue increased by $0.2 million, or 4.1%, from $4.9 million in 2001 to $5.1 million in 2002. These amounts represented approximately 5.5% of total revenue for 2001 and 4.9% for
39
39
Cost of revenue
Cost of license fees
Cost of license fees increased by $0.8 million, or 47.0%, from $1.7 million in 2001 to $2.5 million in 2002. These amounts represented 9% and 12% of license fee revenue in 2001 and 2002, respectively. The cost of license fees increased by $0.3 million, or 12.0%, from $2.5 million in 2002 to $2.8 million in 2003. This amount represented 13% of license fee revenue in 2003. In 2002, we decided to stop incorporating certain third-party software in our products. We had previously paid thea royalty for that software and were recognizing it over the period over which we expected to incorporate the software. Therefore, we accelerated recognition of the remaining amount in 2002, which is why the 2002 increase was larger than the 2003 increase. The increase in 2003, and the remainder of the 2002 increase, was due to variable commissions paid to resellers of The Financial Edge.
Cost of services
Cost of services increased by $3.9 million, or 38.8%, from $10.3 million in 2001 to $14.2 million in 2002. These amounts represented 54.5% and 53.2% of our services revenue in 2001 and 2002, respectively. Cost of services increased by $6.8 million, or 47.6%, from $14.2 million in 2002 to $21.0 million in 2003. This amount represented 61.8% of services revenue in 2003. The increase in both years was due to increased headcount associated with providing the services. The margin decrease in 2003 was attributable to $3.3 million in stock option compensation.
Further analysis of cost of services is provided below; however the costs presented are before the inclusion of various allocable corporate costs and stock option compensation. For a tabular presentation of these costs, see note 14 of the Notes to consolidated financial statements beginning on page F-24.
Cost of revenue in providing consulting, installation and implementation services was $5.0 million, $6.6 million and $8.8 million in the years ended December 31, 2001, 2002 and 2003, respectively, representing 63.5%, 55.5% and 50.6% of the related revenue for 2001, 2002 and 2003, respectively. The absolute dollars increased in both years as a result of increased headcount associated with providing the services; however, the margin increased as a result of operational efficiencies.
Cost of revenue in providing donor prospect research and data modeling services was $0.4 million, $0.9 million and $1.8 million in the years ended December 31, 2001, 2002 and 2003, respectively, representing 66.2%, 40.9% and 51.1% of the related revenue for 2001, 2002 and 2003, respectively. The increase of $0.5 million from 2001 to 2002 was primarily a result of increased headcount associated with this new service. The increase of $0.9 million from 2002 to 2003 was primarily due to data-related expenses for our WealthPoint service launched in July 2003.
Cost of revenue in providing customer training and education was $3.1 million, $4.3 million and $4.2 million in the year ended December 31, 2001, 2002 and 2003, respectively, representing 30.1%, 33.9% and 32.1% of the related revenue for 2001, 2002 and 2003,
40
40
Cost of maintenance and subscriptions
Cost of maintenance and subscriptions decreased by $1.1 million, or 9.4%, from $11.7 million in 2001 to $10.6 million in 2002. These amounts represented 24.9% and 20.1% of maintenance and subscriptions revenue in 2001 and 2002, respectively. The decrease in absolute terms in 2002 resulted primarily from reduced customer support headcount achieved through efficiency initiatives. Cost of maintenance and subscriptions increased by $1.2 million, or 11.3%, from $10.6 million in 2002 to $11.8 million in 2003. This amount represented 20.2% of maintenance and subscriptions revenue in 2003. The increase in costs and the related margin decrease in 2003 was primarily attributable to costs associated with our attempts to develop a subscription-based patron management business.
Cost of other revenue
Cost of other revenue increased by $0.8 million, or 28.6%, from $2.8 million in 2001 to $3.6 million in 2002. These amounts represented 56% and 71% of other revenue in 2001 and 2002, respectively. This increase was primarily due to increases in reimbursable costs associated with the growth of our services business. Cost of other revenue increased by $0.1 million, or 2.8%, from $3.6 million in 2002 to $3.7 million in 2003, representing 85% of our other revenue in 2003.
Operating expenses
Sales and marketing
Sales and marketing costs increased by $4.0 million, or 26.3%, from $15.2 million in 2001 to $19.2 million in 2002. These amounts represented 16.9% and 18.2% of our total revenue in 2001 and 2002, respectively. Sales and marketing costs increased by $2.7 million, or 14.1%, from $19.2 million in 2002 to $21.9 million in 2003. The latter amount excludes $1.8 million of stock option compensation, which is recorded as a separate item in total operating expenses, in 2003. Sales and marketing expenses represented 18.5% of total revenue in 2003. The increases in 2002 and 2003 were principally comprised of increases in sales commissions of $2.3 million and $0.5 million, respectively, which are attributable to increased revenue from license fees and services,services. The increases in 2002 and to2003 were also the result of $1.7 million and $1.9 million, respectively, of costs resulting fromassociated with increases in the number of people in our sales force.
Research and development
Research and development costs decreased from $14.8 million to $14.4 million in 2001 and 2002, respectively, representing 16.4% and 13.7% of our total revenue in 2001 and 2002, respectively. Research and development costs increased by $1.1 million, or 7.6%, from $14.4 million in 2002 to $15.5 million in 2003. The latter amount excludes $2.3 million of stock option compensation, which is recorded as a separate item in total operating expenses. Research and development expenses represented 13.1% of total revenue in 2003. The $1.1 million increase in 2003 resulted from $0.8 million of salary and related human resources costs related to the next release of The Education Edge and $0.3 million associated with transferring a portion of our development work offshore.
41
General and administrative
General and administrative expenses increased by $1.6 million, or 20.5%, from $9.0 million in 2001 to $10.6 million in 2002. These amounts represented 10.0% and 10.1% of total revenue in 2001 and 2002, respectively. General and administrative expenses increased by $0.5 million, or
41
Amortization
Amortization decreased by $1.2 million, or 54.6%, from $2.2 million in 2001 to $1.0 million in 2002. These amounts represented 2.5% and 1.0% of our total revenue in 2001 and 2002, respectively. Amortization decreased by $0.2 million, or 20.0%, from $1.0 million in 2002 to $0.8 million in 2003. This amount represented less than 1% of our total revenue in 2003.
Stock option compensation
Stock option compensation represents the charge taken for the difference between the estimated fair value of our common stock and the exercise price of stock option grants to personnel in sales and marketing, research and development, and general and administrative. We have separately disclosed stock option compensation throughout this discussion and in our financial statements and we have shown a reconciliation of stock option compensation as it relates to sales and marketing, research and development, and general and administrative expenses on the statement of operations because in managing our operations we believe such costs significantly affect our ability to better understand and manage other operating expenses and cash needs. We are amortizing these amounts over the vesting periods of the applicable options using the accelerated method as prescribed in FIN 28. The increase from $0 in 2001 and 2002 to $23.7 million in 2003 was primarily due to thean increase in the estimated fair value of our common stock.
Interest income
Interest income was approximately $0.1 million in each of 2001, 2002 and 2003. A slight increase in 2002 was attributable to larger average cash balances throughout the year. A slight decrease in 2003 was due to the decrease in cash and cash equivalents during 2003 driven by the repayment of $45.0 million in debt incurred in the October 1999 recapitalization.
Interest expense
Interest expense decreased by $3.6 million, or 45.0%, from $8.0 million in 2001 to $4.4 million in 2002. These amounts represented 8.9% and 4.2% of our total revenue in 2001 and 2002, respectively. Interest expense decreased by $1.8 million, or 40.9%, from $4.4 million in 2002 to $2.6 million in 2003. This amount represented 2.2% of our total revenue in 2003. The decreases in interest expense were directly related to repayment of debt.
Other (expense) income
Other (expense) income consists of foreign exchange gains or losses and miscellaneous non-operating income and expense items. Other (expense) income was ($0.1) million, $0.1 million and $0.2 million in 2001, 2002 and 2003, respectively.
42
Income tax provision
We had an effective tax rate of 38.1%, 37.0% and 113.8% in 2001, 2002 and 2003, respectively. In 2003, the unusual rate was attributable primarily to permanent differences resulting from the portion of stock option compensation associated with incentive stock options. The effect on the 2003 effective rate was due to the stock option compensation charge taken in 2003 versus prior years. We expect that our effective tax rate will be less significantly impacted by these matters in the future.
Quarterly results of operations (unaudited)
| Quarter ended | Quarter ended | |||||||||||||||||||||||||||||||||||||||||||||||||||||||||||||||||||||||||||||||||||
| March 31, | June 30, | Sept. 30, | Dec. 31, | March 31, | June 30, | Sept. 30, | Dec. 31, | March 31, | March 31, | June 30, | Sept. 30, | Dec. 31, | March 31, | June 30, | Sept. 30, | Dec. 31, | March 31, | June 30, | Sept. 30, | |||||||||||||||||||||||||||||||||||||||||||||||||||||||||||||||||
| (in thousands, except per share data) | (in thousands, except per share data) | 2002 | 2002 | 2002 | 2002 | 2003 | 2003 | 2003 | 2003 | 2004 | (in thousands, except per share data) | 2002 | 2002 | 2002 | 2002 | 2003 | 2003 | 2003 | 2003 | 2004 | 2004 | 2004 | ||||||||||||||||||||||||||||||||||||||||||||||||||||||||||||||
Revenue | Revenue | Revenue | ||||||||||||||||||||||||||||||||||||||||||||||||||||||||||||||||||||||||||||||||||
| License fees | $ | 5,105 | $ | 6,177 | $ | 4,622 | $ | 4,668 | $ | 4,504 | $ | 5,671 | $ | 5,252 | $ | 5,912 | $ | 5,077 | License fees | $ | 5,105 | $ | 6,177 | $ | 4,622 | $ | 4,668 | $ | 4,504 | $ | 5,671 | $ | 5,252 | $ | 5,912 | $ | 5,077 | $ | 7,293 | $ | 6,244 | |||||||||||||||||||||||||||||||||||||||||||
| Services | 5,424 | 6,902 | 7,614 | 6,799 | 7,744 | 8,629 | 9,515 | 8,154 | 9,545 | Services | 5,424 | 6,902 | 7,614 | 6,799 | 7,744 | 8,629 | 9,515 | 8,154 | 9,545 | 11,071 | 12,062 | |||||||||||||||||||||||||||||||||||||||||||||||||||||||||||||||
| Maintenance and subscriptions | 12,562 | 12,861 | 13,530 | 13,835 | 14,099 | 14,390 | 14,782 | 15,089 | 15,779 | Maintenance and subscriptions | 12,562 | 12,861 | 13,530 | 13,835 | 14,099 | 14,390 | 14,782 | 15,089 | 15,779 | 16,151 | 16,956 | |||||||||||||||||||||||||||||||||||||||||||||||||||||||||||||||
| Other revenue | 1,112 | 1,208 | 1,085 | 1,725 | 962 | 1,150 | 795 | 1,445 | 954 | Other revenue | 1,112 | 1,208 | 1,085 | 1,725 | 962 | 1,150 | 795 | 1,445 | 954 | 974 | 921 | |||||||||||||||||||||||||||||||||||||||||||||||||||||||||||||||
| Total revenue | 24,203 | 27,148 | 26,851 | 27,027 | 27,309 | 29,840 | 30,344 | 30,600 | 31,355 | Total revenue | 24,203 | 27,148 | 26,851 | 27,027 | 27,309 | 29,840 | 30,344 | 30,600 | 31,355 | 35,489 | 36,183 | |||||||||||||||||||||||||||||||||||||||||||||||||||||||||||||||
Cost of revenue | Cost of revenue | Cost of revenue | ||||||||||||||||||||||||||||||||||||||||||||||||||||||||||||||||||||||||||||||||||
| Cost of license fees | 519 | 722 | 628 | 678 | 567 | 890 | 653 | 709 | 729 | Cost of license fees | 519 | 722 | 628 | 678 | 567 | 890 | 653 | 709 | 729 | 951 | 1,053 | |||||||||||||||||||||||||||||||||||||||||||||||||||||||||||||||
Cost of services(1) | 3,169 | 3,268 | 3,801 | 3,996 | 4,911 | 5,181 | 5,255 | 5,659 | 5,378 | Cost of services(1) | 3,169 | 3,268 | 3,801 | 3,996 | 4,911 | 5,181 | 5,255 | 5,659 | 5,378 | 5,815 | 4,795 | |||||||||||||||||||||||||||||||||||||||||||||||||||||||||||||||
Cost of maintenance and subscriptions(1) | 2,693 | 2,676 | 2,618 | 2,601 | 2,835 | 2,972 | 3,225 | 2,805 | 2,660 | Cost of maintenance and subscriptions(1) | 2,693 | 2,676 | 2,618 | 2,601 | 2,835 | 2,972 | 3,225 | 2,805 | 2,660 | 2,738 | 2,466 | |||||||||||||||||||||||||||||||||||||||||||||||||||||||||||||||
| Cost of other revenue | 539 | 814 | 852 | 1,406 | 805 | 908 | 843 | 1,156 | 860 | Cost of other revenue | 539 | 814 | 852 | 1,406 | 805 | 908 | 843 | 1,156 | 860 | 915 | 802 | |||||||||||||||||||||||||||||||||||||||||||||||||||||||||||||||
| Total cost of revenue | 6,920 | 7,480 | 7,899 | 8,681 | 9,118 | 9,951 | 9,976 | 10,329 | 9,627 | Total cost of revenue | 6,920 | 7,480 | 7,899 | 8,681 | 9,118 | 9,951 | 9,976 | 10,329 | 9,627 | 10,419 | 9,116 | |||||||||||||||||||||||||||||||||||||||||||||||||||||||||||||||
Gross profit | Gross profit | 17,283 | 19,668 | 18,952 | 18,346 | 18,191 | 19,889 | 20,368 | 20,271 | 21,728 | Gross profit | 17,283 | 19,668 | 18,952 | 18,346 | 18,191 | 19,889 | 20,368 | 20,271 | 21,728 | 25,070 | 27,067 | ||||||||||||||||||||||||||||||||||||||||||||||||||||||||||||||
| Sales and marketing | 4,213 | 4,644 | 4,887 | 5,429 | 5,062 | 5,475 | 5,454 | 5,892 | 6,360 | Sales and marketing | 4,213 | 4,644 | 4,887 | 5,429 | 5,062 | 5,475 | 5,454 | 5,892 | 6,360 | 7,293 | 6,993 | |||||||||||||||||||||||||||||||||||||||||||||||||||||||||||||||
| Research and development | 3,614 | 3,659 | 3,635 | 3,477 | 3,620 | 3,585 | 4,302 | 4,009 | 4,276 | Research and development | 3,614 | 3,659 | 3,635 | 3,477 | 3,620 | 3,585 | 4,302 | 4,009 | 4,276 | 4,428 | 4,541 | |||||||||||||||||||||||||||||||||||||||||||||||||||||||||||||||
| General and administrative | 2,269 | 2,539 | 2,999 | 2,824 | 2,823 | 2,529 | 2,690 | 3,043 | 2,851 | General and administrative | 2,269 | 2,539 | 2,999 | 2,824 | 2,823 | 2,529 | 2,690 | 3,043 | 2,851 | 3,061 | 3,181 | |||||||||||||||||||||||||||||||||||||||||||||||||||||||||||||||
| Amortization | 560 | 389 | 48 | 48 | 48 | 85 | 667 | 48 | 32 | Amortization | 560 | 389 | 48 | 48 | 48 | 85 | 667 | 48 | 32 | — | — | |||||||||||||||||||||||||||||||||||||||||||||||||||||||||||||||
| Cost of initial public offering | — | — | — | — | — | — | — | — | 950 | Cost of initial public offering | — | — | — | — | — | — | — | — | 950 | 700 | 805 | |||||||||||||||||||||||||||||||||||||||||||||||||||||||||||||||
| Stock option compensation | — | — | — | — | 5,446 | 5,768 | 6,112 | 6,365 | 667 | Stock option compensation | — | — | — | — | 5,446 | 5,768 | 6,112 | 6,365 | 667 | 526 | (1,138) | |||||||||||||||||||||||||||||||||||||||||||||||||||||||||||||||
| Total operating expenses | 10,656 | 11,231 | 11,569 | 11,778 | 16,999 | 17,442 | 19,225 | 19,357 | 15,136 | Total operating expenses | 10,656 | 11,231 | 11,569 | 11,778 | 16,999 | 17,442 | 19,225 | 19,357 | 15,136 | 16,008 | 14,382 | |||||||||||||||||||||||||||||||||||||||||||||||||||||||||||||||
Income from operations | Income from operations | 6,627 | 8,437 | 7,383 | 6,568 | 1,192 | 2,447 | 1,143 | 914 | 6,592 | Income from operations | 6,627 | 8,437 | 7,383 | 6,568 | 1,192 | 2,447 | 1,143 | 914 | 6,592 | 9,062 | 12,685 | ||||||||||||||||||||||||||||||||||||||||||||||||||||||||||||||
| Interest income | 22 | 27 | 45 | 44 | 26 | 22 | 22 | 27 | 25 | Interest income | 22 | 27 | 45 | 44 | 26 | 22 | 22 | 27 | 25 | 29 | 79 | |||||||||||||||||||||||||||||||||||||||||||||||||||||||||||||||
| Interest expense | (1,106) | (1,026) | (968) | (1,310) | (863) | (759) | (594) | (343) | (213) | Interest expense | (1,106) | (1,026) | (968) | (1,310) | (863) | (759) | (594) | (343) | (213) | (37) | (18) | |||||||||||||||||||||||||||||||||||||||||||||||||||||||||||||||
| Other income (expense), net | — | — | — | 63 | 15 | 84 | (198) | 334 | 349 | Other income (expense), net | — | — | — | 63 | 15 | 84 | (198) | 334 | 349 | (3) | (4) | |||||||||||||||||||||||||||||||||||||||||||||||||||||||||||||||
Income before provision for income taxes | Income before provision for income taxes | 5,543 | 7,438 | 6,460 | 5,365 | 370 | 1,794 | 373 | 932 | 6,753 | Income before provision for income taxes | 5,543 | 7,438 | 6,460 | 5,365 | 370 | 1,794 | 373 | 932 | 6,753 | 9,051 | 12,742 | ||||||||||||||||||||||||||||||||||||||||||||||||||||||||||||||
| Income tax provision | 2,065 | 2,750 | 2,360 | 1,991 | 421 | 2,040 | 425 | 1,061 | 2,756 | Income tax provision | 2,065 | 2,750 | 2,360 | 1,991 | 421 | 2,040 | 425 | 1,061 | 2,756 | 3,708 | 5,155 | |||||||||||||||||||||||||||||||||||||||||||||||||||||||||||||||
Net income (loss) | Net income (loss) | $ | 3,478 | $ | 4,688 | $ | 4,100 | $ | 3,374 | $ | (51) | $ | (246) | $ | (52) | $ | (129) | 3,997 | Net income (loss) | $ | 3,478 | $ | 4,688 | $ | 4,100 | $ | 3,374 | $ | (51) | $ | (246) | $ | (52) | $ | (129) | $ | 3,997 | $ | 5,343 | $ | 7,587 | |||||||||||||||||||||||||||||||||||||||||||
| Earnings (loss) per share | Earnings (loss) per share | Earnings (loss) per share | ||||||||||||||||||||||||||||||||||||||||||||||||||||||||||||||||||||||||||||||||||
| Basic | $ | 0.05 | $ | 0.07 | $ | 0.06 | $ | 0.05 | $ | (0.00) | $ | (0.00) | $ | (0.00) | $ | (0.01) | $ | 0.06 | Basic | $ | 0.08 | $ | 0.11 | $ | 0.10 | $ | 0.08 | $ | (0.00) | $ | (0.01) | $ | (0.00) | $ | (0.00) | $ | 0.09 | $ | 0.13 | $ | 0.18 | |||||||||||||||||||||||||||||||||||||||||||
| Diluted | $ | 0.05 | $ | 0.07 | $ | 0.06 | $ | 0.05 | $ | (0.00) | $ | (0.00) | $ | (0.00) | $ | (0.01) | $ | 0.05 | Diluted | $ | 0.08 | $ | 0.11 | $ | 0.10 | $ | 0.08 | $ | (0.00) | $ | (0.01) | $ | (0.00) | $ | (0.00) | $ | 0.09 | $ | 0.12 | $ | 0.16 | |||||||||||||||||||||||||||||||||||||||||||
| Common shares and equivalents outstanding | Common shares and equivalents outstanding | Common shares and equivalents outstanding | ||||||||||||||||||||||||||||||||||||||||||||||||||||||||||||||||||||||||||||||||||
| Basic weighted average shares | 67,777 | 67,777 | 67,777 | 67,777 | 67,777 | 67,846 | 67,854 | 67,854 | 67,858 | Basic weighted average shares | 42,360 | 42,360 | 42,360 | 42,360 | 42,360 | 42,404 | 42,409 | 42,409 | 42,411 | 42,491 | 42,537 | |||||||||||||||||||||||||||||||||||||||||||||||||||||||||||||||
| Diluted weighted average shares | 67,777 | 67,777 | 67,777 | 67,777 | 67,777 | 67,846 | 67,854 | 67,854 | 73,823 | Diluted weighted average shares | 42,360 | 42,360 | 42,360 | 42,360 | 42,360 | 42,404 | 42,409 | 42,409 | 46,140 | 45,984 | 46,515 | |||||||||||||||||||||||||||||||||||||||||||||||||||||||||||||||
Summary of stock option compensation: | Summary of stock option compensation: | Summary of stock option compensation: | ||||||||||||||||||||||||||||||||||||||||||||||||||||||||||||||||||||||||||||||||||
| Cost of services | $ | — | $ | — | $ | — | $ | — | $ | 622 | $ | 777 | $ | 892 | $ | 1,051 | $ | 294 | Cost of services | $ | — | $ | — | $ | — | $ | — | $ | 622 | $ | 777 | $ | 892 | $ | 1,051 | $ | 294 | $ | 273 | $ | (1,211) | |||||||||||||||||||||||||||||||||||||||||||
| Cost of maintenance and subscriptions | — | — | — | — | 93 | 116 | 136 | 160 | 37 | Cost of maintenance and subscriptions | — | — | — | — | 93 | 116 | 136 | 160 | 37 | 25 | (168) | |||||||||||||||||||||||||||||||||||||||||||||||||||||||||||||||
| Total cost of revenue | — | — | — | — | 715 | 893 | 1,028 | 1,211 | 331 | Total cost of revenue | — | — | — | — | 715 | 893 | 1,028 | 1,211 | 331 | 298 | (1,379) | |||||||||||||||||||||||||||||||||||||||||||||||||||||||||||||||
| Sales and marketing | — | — | — | — | 336 | 375 | 490 | 616 | 254 | Sales and marketing | — | — | — | — | 336 | 375 | 490 | 616 | 254 | 222 | (670) | |||||||||||||||||||||||||||||||||||||||||||||||||||||||||||||||
| Research and development | — | — | — | — | 456 | 560 | 623 | 702 | 174 | Research and development | — | — | — | — | 456 | 560 | 623 | 702 | 174 | 142 | (833) | |||||||||||||||||||||||||||||||||||||||||||||||||||||||||||||||
| General and administrative | — | — | — | — | 4,654 | 4,833 | 4,998 | 5,048 | 239 | General and administrative | — | — | — | — | 4,654 | 4,833 | 4,998 | 5,048 | 239 | 162 | 365 | |||||||||||||||||||||||||||||||||||||||||||||||||||||||||||||||
| Total operating expenses | — | — | — | — | 5,446 | 5,768 | 6,111 | 6,366 | 667 | Total operating expenses | — | — | — | — | 5,446 | 5,768 | 6,112 | 6,365 | 667 | 526 | (1,138) | |||||||||||||||||||||||||||||||||||||||||||||||||||||||||||||||
| Total stock option compensation | $ | — | $ | — | $ | — | $ | — | $ | 6,161 | $ | 6,661 | $ | 7,139 | $ | 7,577 | $ | 998 | Total stock option compensation | $ | — | $ | — | $ | — | $ | — | $ | 6,161 | $ | 6,661 | $ | 7,139 | $ | 7,577 | $ | 998 | $ | 824 | $ | (2,517) | |||||||||||||||||||||||||||||||||||||||||||
(1) Includes stock option compensation set forth in Summary of stock option compensation.
43
Quarterly results of operations (unaudited)
| Quarter ended | Quarter ended | |||||||||||||||||||||||||||||||||||||||||||||||||||||||||||||||||||||||||||||||||||
| March 31, | June 30, | Sept. 30, | Dec. 31, | March 31, | June 30, | Sept. 30, | Dec. 31, | March 31, | March 31, | June 30, | Sept. 30, | Dec. 31, | March 31, | June 30, | Sept. 30, | Dec. 31, | March 31, | June 30, | Sept. 30, | |||||||||||||||||||||||||||||||||||||||||||||||||||||||||||||||||
| 2002 | 2002 | 2002 | 2002 | 2003 | 2003 | 2003 | 2003 | 2004 | 2002 | 2002 | 2002 | 2002 | 2003 | 2003 | 2003 | 2003 | 2004 | 2004 | 2004 | |||||||||||||||||||||||||||||||||||||||||||||||||||||||||||||||||
Revenue | Revenue | Revenue | ||||||||||||||||||||||||||||||||||||||||||||||||||||||||||||||||||||||||||||||||||
| License fees | 21.1 | % | 22.8 | % | 17.2 | % | 17.3 | % | 16.5 | % | 19.0 | % | 17.3 | % | 19.3 | % | 16.2 | % | License fees | 21.1 | % | 22.8 | % | 17.2 | % | 17.3 | % | 16.5 | % | 19.0 | % | 17.3 | % | 19.3 | % | 16.2 | % | 20.6 | % | 17.3 | % | |||||||||||||||||||||||||||||||||||||||||||
| Services | 22.4 | 25.4 | 28.4 | 25.2 | 28.4 | 28.9 | 31.4 | 26.6 | 30.4 | Services | 22.4 | 25.4 | 28.4 | 25.2 | 28.4 | 28.9 | 31.4 | 26.6 | 30.4 | 31.2 | 33.3 | |||||||||||||||||||||||||||||||||||||||||||||||||||||||||||||||
| Maintenance and subscriptions | 51.9 | 47.4 | 50.4 | 51.2 | 51.6 | 48.2 | 48.7 | 49.3 | 50.3 | Maintenance and subscriptions | 51.9 | 47.4 | 50.4 | 51.2 | 51.6 | 48.2 | 48.7 | 49.3 | 50.3 | 45.5 | 46.9 | |||||||||||||||||||||||||||||||||||||||||||||||||||||||||||||||
| Other revenue | 4.6 | 4.4 | 4.0 | 6.4 | 3.5 | 3.9 | 2.6 | 4.7 | 3.0 | Other revenue | 4.6 | 4.4 | 4.0 | 6.4 | 3.5 | 3.9 | 2.6 | 4.7 | 3.0 | 2.7 | 2.5 | |||||||||||||||||||||||||||||||||||||||||||||||||||||||||||||||
| Total revenue | 100.0 | 100.0 | 100.0 | 100.0 | 100.0 | 100.0 | 100.0 | 100.0 | 100.0 | Total revenue | 100.0 | 100.0 | 100.0 | 100.0 | 100.0 | 100.0 | 100.0 | 100.0 | 100.0 | 100.0 | 100.0 | |||||||||||||||||||||||||||||||||||||||||||||||||||||||||||||||
Cost of revenue | Cost of revenue | Cost of revenue | ||||||||||||||||||||||||||||||||||||||||||||||||||||||||||||||||||||||||||||||||||
| Cost of license fees | 2.1 | 2.7 | 2.3 | 2.5 | 2.1 | 3.0 | 2.2 | 2.3 | 2.3 | Cost of license fees | 2.1 | 2.7 | 2.3 | 2.5 | 2.1 | 3.0 | 2.2 | 2.3 | 2.3 | 2.7 | 2.9 | |||||||||||||||||||||||||||||||||||||||||||||||||||||||||||||||
| Cost of services | 13.1 | 12.0 | 14.2 | 14.8 | 18.0 | 17.4 | 17.3 | 18.5 | 17.2 | Cost of services | 13.1 | 12.0 | 14.2 | 14.8 | 18.0 | 17.4 | 17.3 | 18.5 | 17.2 | 16.4 | 13.2 | |||||||||||||||||||||||||||||||||||||||||||||||||||||||||||||||
| Cost of maintenance and subscriptions | 11.1 | 9.9 | 9.8 | 9.6 | 10.4 | 10.0 | 10.6 | 9.2 | 8.5 | Cost of maintenance and subscriptions | 11.1 | 9.9 | 9.8 | 9.6 | 10.4 | 10.0 | 10.6 | 9.2 | 8.5 | 7.7 | 6.8 | |||||||||||||||||||||||||||||||||||||||||||||||||||||||||||||||
| Cost of other revenue | 2.2 | 3.0 | 3.2 | 5.2 | 2.9 | 3.0 | 2.8 | 3.8 | 2.7 | Cost of other revenue | 2.2 | 3.0 | 3.2 | 5.2 | 2.9 | 3.0 | 2.8 | 3.8 | 2.7 | 2.6 | 2.2 | |||||||||||||||||||||||||||||||||||||||||||||||||||||||||||||||
| Total cost of revenue | 28.6 | 27.6 | 29.4 | 32.1 | 33.4 | 33.3 | 32.9 | 33.8 | 30.7 | Total cost of revenue | 28.6 | 27.6 | 29.4 | 32.1 | 33.4 | 33.3 | 32.9 | 33.8 | 30.7 | 29.4 | 25.1 | |||||||||||||||||||||||||||||||||||||||||||||||||||||||||||||||
Gross profit | Gross profit | 71.4 | 72.4 | 70.6 | 67.9 | 66.6 | 66.7 | 67.1 | 66.2 | 69.3 | Gross profit | 71.4 | 72.4 | 70.6 | 67.9 | 66.6 | 66.7 | 67.1 | 66.2 | 69.3 | 70.6 | 74.9 | ||||||||||||||||||||||||||||||||||||||||||||||||||||||||||||||
| Sales and marketing | 17.4 | 17.1 | 18.2 | 20.1 | 18.5 | 18.3 | 18.0 | 19.3 | 20.3 | Sales and marketing | 17.4 | 17.1 | 18.2 | 20.1 | 18.5 | 18.3 | 18.0 | 19.3 | 20.3 | 20.5 | 19.3 | |||||||||||||||||||||||||||||||||||||||||||||||||||||||||||||||
| Research and development | 14.9 | 13.5 | 13.5 | 12.9 | 13.3 | 12.0 | 14.2 | 13.1 | 13.6 | Research and development | 14.9 | 13.5 | 13.5 | 12.9 | 13.3 | 12.0 | 14.2 | 13.1 | 13.6 | 12.5 | 12.5 | |||||||||||||||||||||||||||||||||||||||||||||||||||||||||||||||
| General and administrative | 9.4 | 9.4 | 11.2 | 10.4 | 10.3 | 8.5 | 8.9 | 9.9 | 9.1 | General and administrative | 9.4 | 9.4 | 11.2 | 10.4 | 10.3 | 8.5 | 8.9 | 9.9 | 9.1 | 8.6 | 8.8 | |||||||||||||||||||||||||||||||||||||||||||||||||||||||||||||||
| Amortization | 2.3 | 1.4 | 0.2 | 0.2 | 0.2 | 0.3 | 2.2 | 0.2 | 0.1 | Amortization | 2.3 | 1.4 | 0.2 | 0.2 | 0.2 | 0.3 | 2.2 | 0.2 | 0.1 | — | — | |||||||||||||||||||||||||||||||||||||||||||||||||||||||||||||||
| Cost of initial public offering | — | — | — | — | — | — | — | — | 3.0 | Cost of initial public offering | — | — | — | — | — | — | — | — | 3.0 | 2.0 | 2.2 | |||||||||||||||||||||||||||||||||||||||||||||||||||||||||||||||
| Stock option compensation | — | — | — | — | 19.9 | 19.3 | 20.1 | 20.8 | 2.1 | Stock option compensation | — | — | — | — | 19.9 | 19.3 | 20.1 | 20.8 | 2.1 | 1.5 | (3.1) | |||||||||||||||||||||||||||||||||||||||||||||||||||||||||||||||
| Total operating expenses | 44.0 | 41.5 | 43.1 | 43.6 | 62.2 | 58.5 | 63.4 | 63.3 | 48.3 | Total operating expenses | 44.0 | 41.5 | 43.1 | 43.6 | 62.2 | 58.5 | 63.4 | 63.3 | 48.3 | 45.1 | 39.7 | |||||||||||||||||||||||||||||||||||||||||||||||||||||||||||||||
Income from operations | Income from operations | 27.4 | 31.1 | 27.5 | 24.3 | 4.4 | 8.2 | 3.8 | 3.0 | 21.0 | Income from operations | 27.4 | 31.1 | 27.5 | 24.3 | 4.4 | 8.2 | 3.8 | 3.0 | 21.0 | 25.5 | 35.2 | ||||||||||||||||||||||||||||||||||||||||||||||||||||||||||||||
| Interest income | 0.1 | 0.1 | 0.2 | 0.2 | 0.1 | 0.1 | 0.1 | 0.1 | 0.1 | Interest income | 0.1 | 0.1 | 0.2 | 0.2 | 0.1 | 0.1 | 0.1 | 0.1 | 0.1 | 0.1 | 0.1 | |||||||||||||||||||||||||||||||||||||||||||||||||||||||||||||||
| Interest expense | (4.6) | (3.8) | (3.6) | (4.8) | (3.2) | (2.5) | (2.0) | (1.1) | (0.7) | Interest expense | (4.6) | (3.8) | (3.6) | (4.8) | (3.2) | (2.5) | (2.0) | (1.1) | (0.7) | (0.1) | (0.1) | |||||||||||||||||||||||||||||||||||||||||||||||||||||||||||||||
| Other income (expense), net | — | — | — | 0.2 | 0.1 | 0.3 | (0.7) | 1.1 | 1.1 | Other income (expense), net | — | — | — | 0.2 | 0.1 | 0.3 | (0.7) | 1.1 | 1.1 | — | — | |||||||||||||||||||||||||||||||||||||||||||||||||||||||||||||||
Income before provision for income taxes | Income before provision for income taxes | 22.9 | 27.4 | 24.1 | 19.9 | 1.4 | 6.0 | 1.2 | 3.0 | 21.5 | Income before provision for income taxes | 22.9 | 27.4 | 24.1 | 19.9 | 1.4 | 6.0 | 1.2 | 3.0 | 21.5 | 25.5 | 35.2 | ||||||||||||||||||||||||||||||||||||||||||||||||||||||||||||||
| Income tax provision | 8.5 | 10.1 | 8.8 | 7.4 | 1.5 | 6.8 | 1.4 | 3.5 | 8.8 | Income tax provision | 8.5 | 10.1 | 8.8 | 7.4 | 1.5 | 6.8 | 1.4 | 3.5 | 8.8 | 10.4 | 14.2 | |||||||||||||||||||||||||||||||||||||||||||||||||||||||||||||||
Net income (loss) | Net income (loss) | 14.4 | % | 17.3 | % | 15.3 | % | 12.5 | % | (0.2) | % | (0.8) | % | (0.2) | % | (0.4) | % | 12.7 | % | Net income (loss) | 14.4 | % | 17.3 | % | 15.3 | % | 12.5 | % | (0.2) | % | (0.8) | % | (0.2) | % | (0.4) | % | 12.7 | % | 15.1 | % | 21.0 | % | ||||||||||||||||||||||||||||||||||||||||||
Liquidity and capital resources
At March 31,September 30, 2004, cash and cash equivalents totaled $6.1$33.4 million, compared to $6.7 million at December 31, 2003 and $13.4 million at March 31, 2003. The decreaseincrease in cash and cash equivalents in the first quarternine months of 2004 was primarilyis principally the result of cash generated from operations of $33.3 million reduced by $1.7 million in capital spending and $5.3 million in principal payments on debt, capital leases and payment of deferred financing fees offset slightly by proceeds from the final $5.0 million repaymentexercise of debt incurred in connection with the October 1999 recapitalization.
We have indicated to the underwriters an intention to use up to $10.0 million of our cash, if available, to purchase, simultaneously with this underwritten offering, shares of our common stock directly from Anthony E. Bakker in a private, non-underwritten transaction at the net per share price to be received by the selling stockholders in this underwritten offering. Under our investor rights agreement, Mr. Bakker, who currently holds approximately 14% of our outstanding stock, has registration rights with respect to the shares to be repurchased. In place of registration of additional shares, we intend to repurchase these shares from Mr. Bakker at the same net price per share they would receive in this offering, which is consistent with the economic terms of the investor rights agreement and will reduce dilution to our stockholders. Our board of directors has unanimously approved the repurchase. See “Certain relationships and related transactions” for more detail on the repurchase and its approval by our board.
44
The credit agreement we entered into in connection with our recapitalization in October 1999 includes a $15.0 million revolving credit facility that expires inOn September 2005. This facility bears interest at a variable rate based on the prime rate, federal funds rate or a eurodollar market rate, plus a margin of between 1.25% and 3.25% based on our consolidated leverage ratio. Amounts outstanding under this facility are secured by a lien on our assets and the facility is subject to standard covenants, which we were in compliance with as of March 31, 2004. As of that date, there were no amounts outstanding under this facility. In June30, 2004, we entered into a commitment letter forclosed a new $30.0 million revolving credit facility, which we anticipate will replacereplaces our existingprior $15.0 million revolving credit facility.facility that was terminated in July 2004. Amounts borrowed under this facility are available for working capital and general corporate purposes. No amounts were drawn down under the facility at closing and there is no outstanding balance thereunder as of the date of this filing. Amounts borrowed under the new $30.0 million revolving credit facility will bear interest, at our option, at a variable rate based on either the prime rate, federal funds rate or LIBOR plus a margin of between 0.5% and 2.0% based on our consolidated leverage ratio. Amounts outstanding under the new facility willare not be secured by a lien on our assets, but will beare guaranteed by our subsidiariesoperating subsidiary and the facility will beis subject to standard covenants.
44
Our principal source of liquidity is our operating cash flow, which depends on continued customer renewal of our maintenance and support agreements and market acceptance of our products and services. Based on current estimates of revenue and expenses, we believe that the currently available sources of funds and anticipated cash flows from operations will be adequate to finance our operations and anticipated capital expenditures for at least the next 12twelve months.
Operating cash flow
Net cash provided by operating activities of $4.9$33.4 million for the threenine months ended March 31,September 30, 2004 increased by $1.4$6.4 million compared with $27.0 million for the quarternine months ended March 31,September 30, 2003. We benefitedDuring each of these periods, our cash flows from an increaseoperations were derived primarily from (i) our earnings from on-going operations prior to non-cash expenses such as stock option compensation, depreciation and amortization, (ii) the tax benefit associated with our deferred tax asset, which reduces our cash outlay for income tax expense, (iii) changes in our working capital, which is primarily composed of $2.3net collections of accounts receivable and increases in deferred revenue (collectively representing cash inflows of $5.4 million and $3.0 million in amounts received from customers that cannot yet be recognized as revenuethe 2004 and a $0.42003 periods, respectively), plus changes in our balances of accounts payable, accrued expenses and accrued liabilities (collectively representing cash inflows of $2.1 million decrease in other current assets and other assets. These were partially offset by a decrease of $2.3$0.5 million in amounts received from customers.
Net cash provided by operating activities increased $8.9 million during the year ended December 31, 2001 from the year ended December 31, 2000. We benefited from an increase of $3.3 million in amounts received from customers that cannot yet be recognized as revenue and a $4.5 million increase in amounts received from customers due to increased collection efforts. This was offset by a $1.9 million decrease in trade accounts payable, accrued expenses and other liabilities due to timing of payments to our vendors.
Net cash provided by operating activities increased $7.5 million during the year ended December 31, 2002 from the year ended December 31, 2001. Contributing to this increase was $4.8 million from an increase in deferred revenue that arose from sales of services that have not yet been delivered and amounts principally associated with new maintenance agreements. These were partially offset by decreases in amounts received from customers. Also offsetting cash provided by operating activities was an increase to other current assets and other assets resulting from an increase in deferred commission costs related to sales of products and services not yet recognized as revenue.
Net cash provided by operating activities increased $4.1 million during the year ended December 31, 2003 from the year ended December 31, 2002 due to an increase in working capital. Contributing to the increase in working capital was an increase in deferred revenue of $4.4 million that arose from the sale of services that have not yet been delivered and also amounts principally associated with new maintenance agreements, partially offset by increases in accounts receivable and other current assets and other assets.
45
Investing cash flow
Net cash used in investing activities for the first quarternine months of 2004 was $0.7$1.7 million. This amount principally represents the purchase of property and equipment.
Net cash used in investing activities for the year ended December 31, 2001 was $3.0 million. This included $2.5 million for the purchase of property and equipment and $0.5 million paid in connection with an acquisition.
45
Net cash used in investing activities for the year ended December 31, 2002 was $2.0 million. This included $1.5 million for the purchase of property and equipment and $0.5 million paid in connection with the acquisition of AppealMaster Ltd.
Net cash used in investing activities for the year ended December 31, 2003 was $3.7 million. This included $2.7 million for the purchase of property and equipment, $0.4 million in contingent payments related to the acquisition of AppealMaster in 2002, and other acquisition-related costs.
Financing cash flow
Net cash used in financing activities in the first quarternine months of 2004 was $4.9 million. We made$4.6 million which was comprised of the final $5.0$5.1 million payment on our term loan, partially offsetting thesedebt principal payments was $0.1 million received asand capital leases, offset by proceeds from the issuance of common stock associated with the exercise of stock options.
Net cash used in financing activities for the year ended December 31, 2001 was $15.0 million. We made payments of $24.5 million on our term loan and $0.5 million on capital leases. Partially offsetting these payments were proceeds from the sale of common stock of $10.0 million.
Net cash used in financing activities for the year ended December 31, 2002 was $20.5 million. We made payments of $19.7 million on our term loan and $0.8 million on capital leases.
Net cash used in financing activities for the year ended December 31, 2003 was $45.1 million, which primarily consisted of principal payments made on our term loan. In addition, we paid $0.3 million on capital leases relating to furniture and equipment. Partially offsetting these payments was $0.2 million we received as proceeds from the issuance of common stock associated with the exercise of stock options.
Commitments and contingencies
As of March 31,September 30, 2004, we had no outstanding debt, having repaid, in the first quarter of 2004, the last $5.0 million under the term loan related to the October 1999 recapitalization.
At March 31,September 30, 2004 we had future minimum lease commitmentcommitments of $28.7$28.2 million. The future minimum lease commitments as of September 30, 2004 were as follows (amounts in thousands):
| Payments due by period | ||||||||||||||||||||
| 2004 | 2005-2006 | 2007-2008 | 2009 and after | Totals | ||||||||||||||||
| Operating leases | $ | 1,718 | $ | 9,450 | $ | 9,610 | $ | 7,922 | $ | 28,160 | ||||||||||
| Capital leases | 38 | 45 | — | — | 83 | |||||||||||||||
Payments due under capital leases include $2,000 of interest.
These commitments have not been reduced by the future minimum lease commitments under various sublease agreements extendingextended through 2007. The future minimum lease commitments as of March 31, 2004 were as follows (amounts in thousands):
| Payments due by period | ||||||||||||||||||||||||||||
| 2004 | 2005 | 2006 | 2007 | 2008 | Thereafter | Totals | ||||||||||||||||||||||
| Operating leases | $ | 3,122 | $ | 4,209 | $ | 4,298 | $ | 4,307 | $ | 4,706 | $ | 7,931 | $ | 28,573 | ||||||||||||||
| Capital leases | 114 | 45 | — | — | — | — | 159 | |||||||||||||||||||||
46
In addition, we have a commitment of $200,000 payable annually through 2009 for certain naming rights with an entity, which until initial public offering on July 22, 2004, was owned by a minority shareholder, of ours. Weand we have incurred expense of $150,000 under this agreement of $200,000 per year for each of the three years ended December 31, 2001, 2002 and 2003, and $50,000 for the three monthsnine month period ended March 31,September 30, 2004.
46
New accounting pronouncementpronouncements
In January 2002, the Emerging Issues Task Force of the FASB, or EITF, reached a consensus on EITF Issue 01-14, “Income Statement Characterization of Reimbursements Received for “Out-of-Pocket” Expenses Incurred”, which requires that reimbursements received for out-of-pocket expenses incurred be characterized as revenue in the income statement. We adopted EITF 01-14 effective January 1, 2002 and have made the appropriate reclassifications as required by EITF 01-14. Income resulting from reimbursable expenses is included in other revenues and the associated expenses are included in other cost of sales on the face of the income statement.
In July 2002, the FASB issued SFAS No. 146, “Accounting for Costs Associated with Exit or Disposal Activities”, which is effective for exit or disposal activities that are initiated after December 31, 2002. We adopted SFAS No. 146 during fiscal year 2003. SFAS No. 146 nullifies EITF Issue No. 94-3, “Liability Recognition for Certain Employee Termination Benefits and Other Costs to Exit an Activity (including Certain Costs Incurred in a Restructuring)”, and requires that a liability for costs associated with an exit or disposal activity be recognized as incurred. The impact of SFAS No. 146 will be dependent upon decisions made by us in the future and has had no impact on us to date.
In January 2003, we adopted FIN 45, “Guarantor’s Accounting and Disclosure Requirements for Guarantees, Including Indirect Guarantees of Indebtedness of Others, an Interpretation of FASB Statements No. 5, 57, and 107 and Rescission of FASB Interpretation No. 34”. The interpretation requires that upon issuance of a guarantee, the entity must recognize a liability for the fair value of the obligation it assumes under that guarantee. The initial recognition and measurement provisions of FIN No. 45 are effective for guarantees issued or modified after December 31, 2002. The adoption of this interpretation has not had a material impact on our consolidated financial position, consolidated results of operations, or liquidity.
In January 2003, the FASB issued FIN 46, “Consolidation of Variable Interest Entities.” This statement was subsequently amended under the provisions of FIN 46-R, which is effective for public entities no later than the end of the first reporting period ending after March 15, 2004. This interpretation clarifies the application of Accounting Research Bulletin No. 51, “Consolidated Financial Statements”, to certain entities in which equity investors do not have the characteristics of a controlling financial interest or do not have sufficient equity at risk for the entity to finance its activities without additional subordinated financial support from other parties. FIN 46 applies immediately to variable interest entities created after January 31, 2003, and to variable interest entities in which an enterprise obtains an interest after that date. The adoption of this interpretation has not had a material impact on our consolidated financial position, consolidated results of operations, or liquidity.
In May 2003, the FASB issued SFAS No. 150, “Accounting for Certain Financial Instruments with Characteristics of Liabilities and Equity.” This statement establishes standards for how an issuer classifies and measures certain financial instruments with characteristics of both liabilities and equity. It requires that an issuer classify a financial instrument that is within its scope as a liability. Many of those instruments were previously classified as equity. Most of the guidance
47
On December 16, 2004, the FASB issued Statement No. 123 (revised 2004), Share-Based Payment. Statement 123(R) would require us to measure all employee stock-based compensation awards using a fair value method and record such expense in our consolidated financial statements. In addition, the adoption of Statement 123(R) will require additional accounting
47
Qualitative and quantitative disclosure about market risk
Due to the nature of our short-term investments and our lack of material debt, we have concluded that we face no material market risk exposure. Therefore, no quantitative tabular disclosures are required.
Foreign currency exchange rates
Approximately 16.2%15.5% of our total net revenue for the quarternine months ended March 31,September 30, 2004 and approximately 5.7% and 9.1% of our total net revenue for the years ended December 31, 2002 and 2003, respectively, was derived from our operations outside the United States. We do not have significant operations in countries in which the economy is considered to be highly inflationary. Our financial statements are denominated in U.S. dollars and, accordingly, changes in the exchange rate between foreign currencies and the U.S. dollar will affect the translation of our subsidiaries’ financial results into U.S. dollars for purposes of reporting our consolidated financial results. Accumulated currency translation adjustmentsadjustment recorded, as a separate component of shareholders’ equity were $0.4 million at March 31, 2004 and ($0.2) andwas $0.3 million at December 31, 2002 and 2003, respectively.
The vast majority of our contracts are entered into by our U.S. or U.K. entities. The contracts entered into by the U.S. entity are almost always denominated in U.S. dollars and contracts entered into by our U.K. subsidiary are generally denominated in pounds sterling. In recent years, the U.S. dollar has weakened against many non-U.S. currencies, including the British pound. During this period, our revenues generated in the United Kingdom have increased. Though weWe do not believe our increased exposure to currency exchange rates have had a material impact on our results of operations or financial position, and we intended towill continue to monitor such exposure and take action as appropriate.
Interest rate risk
Historically fluctuations in interest rates have not had a material impact on our operating results. As of September 30, 2004 we do not have any balances outstanding under our revolving credit facility subject to variable interest rates.
48
Business
Overview
We are the leading global provider of software and related services designed specifically for nonprofit organizations. Our products and services enable nonprofit organizations to increase donations, reduce fundraising costs, improve communications with constituents, manage their finances and optimize internal operations. We have focused solely on the nonprofit market since our incorporation in 1982, and have developed our suite of products and services based upon our extensive knowledge of the operating challenges facing nonprofit organizations. In 2003,2004, we had over 12,50012,700 customers, over 11,90012,300 of which pay us annual maintenance and support fees. Our customers operate in multiple verticals within the nonprofit market including religion, education, foundations, health and human services, arts and cultural, public and societal benefits, environment and animal welfare, and international and foreign affairs.
Industry background
The nonprofit industry is large and growing
Nonprofit organizations are a large part of the U.S. economy, employing one out of every ten Americans. There were greater than 1.41.5 million registered U.S. nonprofit organizations in 2002,2003, according to data from the Internal Revenue Service. In addition, there are greater than 1.5 million nonprofit organizations outside the United States. Donations to nonprofit organizations in the United States were $241 billion in 2002,2003, having increased almost every year since 1962, with a compound annual growth rate over that period of 7.8%, according to Giving USA. In addition, these organizations received fees of approximately $600 billion in the twelve months prior to December 2003 for services they provided. Worldwide, nonprofit organizations employ more than 19 million people and account for $1.1 trillion in total annual expenditures, according to the Johns Hopkins Comparative Nonprofit Sector Project.
Traditional methods of fundraising are costly and inefficient
Many nonprofit organizations manage fundraising programs using manual methods or stand-alone software applications not specifically designed to meet the needs of nonprofit organizations. These fundraising methods are often costly and inefficient, largely because of the difficulties in effectively collecting, sharing and using information to maximize donations and minimize related costs. Some nonprofit organizations have developed proprietary software, but doing so can be expensive, requiring these organizations to hire technical personnel for development, implementation and maintenance functions. General purpose software and Internet applications typically offer stand-alone solutions with limited functionality that might not efficiently integrate multiple databases.
Fundraising and related administrative costs are significant. Based on our market research, an average $0.24 of each dollar donated is used by nonprofit organizations for their direct fundraising expenses alone. These expenses do not include additional administrative expenses associated with fundraising. Moreover, according to a recent Harvard Business Review article entitled, “The Nonprofit Sector’s $100 Billion Opportunity,” McKinsey & Company estimates that improvements in the efficiency of delivery of their services could result in savings to the nonprofit sector in excess of $55 billion annually.
49
The nonprofit industry faces particular operational challenges
Nonprofit organizations face distinct operational challenges. For example, nonprofit organizations generally must efficiently:
| • | solicit small cash contributions from numerous contributors to fund operations; |
| • | manage complex relationships with the large numbers of constituents that support their organizations; |
| • | comply with complex accounting, tax and reporting issues that differ from traditional businesses; |
| • | solicit cash and in-kind contributions from businesses to help raise money or deliver products or services; |
| • | provide a wide array of programs and services to individual constituents; and |
| • | improve the data collection and sharing capabilities of their employees, volunteers and donors by creating and providing distributed access to centralized databases. |
Because of these challenges, we believe nonprofit organizations can benefit from software applications specifically designed to serve their particular needs.
The Blackbaud solution
Our suite of products and services addresses the fundraising costs and operational challenges facing nonprofit organizations by providing them with software tools and services that help them increase donations, reduce the overall cost of managing their business and the fundraising process and improve communications with their constituents. We provide an operational platform through our three core software applications: The Raiser’s Edge, The Financial Edge and The Education Edge. In addition, we offer 3436 extended applications providing distinct, add-on functionality tailored to meet the specific needs of our diverse customer base. To complement our operational platform, we offer a suite of analytical tools and related services that enable nonprofit organizations to extract, aggregate and analyze vast quantities of data to help them make better-informed operational decisions. We also help our customers increase the return on their technology investment by providing a broad array of complementary professional services, including implementation, business process improvement, education services, as well as maintenance and technical support.
50
Our solution is illustrated as follows:

Nonprofit organizations use our products and services to increase donations
Approximately 10,50010,750 of our active customers currently subscribe to our annual maintenance and support for The Raiser’s Edge. In 2002,2003, these customers raised an aggregate of more than $26 billion in contributions. These customers use The Raiser’s Edge to help them with their fundraising and donor management efforts. The complexity of managing constituent relationships and nonprofits’ reliance on charitable contributions make managing the fundraising process the critical business function for nonprofits. The Raiser’s Edge allows nonprofit organizations to establish, maintain and develop their relationships with current and prospective donors. Our fundraising products and services enable nonprofit organizations to use a centralized database, as well as the Internet and an array of analytical tools to facilitate and expand their fundraising efforts. We believe our products and services help nonprofit organizations increase donations by enabling them to:
| • | facilitate the management of complex personal relationships with constituents; |
| • | enable the solicitation of large numbers of potential donors using automated and efficient methods; |
| • | deliver personalized messages that help inform and drive constituent action; |
| • | provide an easy-to-use system that allows the sharing and use of critical fundraising information; |
| • | allow organizations to receive online donations through our NetSolutions product, which integrates with an organization’s website; |
| • | utilize our Internet-based offerings and tools to support online volunteer and events management; and |
| • | simplify and automate business processes to allow nonprofits to more effectively pursue their missions. |
51
In addition, our array of predictive donor modeling and wealth identification products and services, including ProspectPoint and WealthPoint, integrate important third-party data, including financial, geographic and demographic information, together with sophisticated analytical techniques to assist nonprofits in their efforts to more effectively identify and target willing and able donors. The result is that organizations are able to lower fundraising costs while at the same time increase donations.
We help nonprofit organizations operate more effectively and efficiently
Our products and services combine a comprehensive suite of software and analytical tools with a centralized database to help employees more effectively and efficiently manage the key aspects of their nonprofit organization’s operations. Our products automate nonprofit business processes to create efficiencies for our customers, which helps to reduce the overall costs of operating their organizations. For example, The Raiser’s Edge and our other core products automate data collection processes, which eliminates cumbersome and inaccurate manual processes. In addition, nonprofits use The Financial Edge, which integrates with The Raiser’s Edge, to eliminate duplicate entry of gift data and streamline processes for posting the results of fundraising activities to the organization’s general ledger. Nonprofit constituents can use The Financial Edge to view information in a single, integrated dashboard view that illustrates key performance metrics and detailed information on specific campaigns, funds and programs. These efficient communications are often critical to a nonprofit’s ability to effectively strengthen relationships with important supporters, while making effective use of valuable internal resources.
We provide solutions that address many of the technological and business process needs of our customers, including:
| • | donor relationship management; |
| • | financial management and reporting; |
| • | cost accounting information for projects and grants; |
| • | integration of financial data and donor information under a centralized system; |
| • | student information systems designed for the K-12 market; |
| • | data analysis and reporting tools and services; |
| • | management of complex volunteer networks; and |
| • | results tracking for multiple campaigns. |
Our strategy
Our objective is to maintain and leverage our position as a leading provider of software and related services designed specifically for nonprofit organizations. Key elements of our strategy to achieve this objective are to:
Grow our customer base
We intend to expand our industry-leading customer base and enhance our market position. While we have established a strong presence in the nonprofit industry, we believe that the fragmented nature of the industry presents an opportunity for us to continue to increase our market penetration. We plan to achieve this objective by leveraging our experience in the nonprofit sector, our existing customer base and our strong brand recognition. We also intend to expand our overall sales efforts, especially national accounts, enterprise-focused sales teams and third-party sales channels.
52
Maintain and expand existing customer relationships
We have historically had success selling maintenance renewal and additional products and services to existing customers. In each of the past three years, an average of over 94% of our customers have renewed their maintenance and support plans for our products. We plan to continue to capitalize on our existing customer base by increasing both the number of our products and services they use and the frequency with which they use them. As part of this strategy, we have established a dedicated sales team to focus exclusively on selling products and services to our existing customers.
Introduce additional products and services
We intend to leverage our expertise and experience in developing leading products for the nonprofit industry to introduce additional products and related services, to continue to build stronger relationships with existing customers and to attract new customer relationships. We believe that our existing proprietary software and services can form the foundation for an even wider range of products and services for nonprofit organizations. Our current product offerings share approximately one-third of our proprietary code, and we anticipate that future product offerings will also share this backbone. We believe that this shared code allows us to more cost efficiently expedite the development and rollout of new products.
Leverage the Internet as a means of additional growth
We intend to continue to enhance our existing products and develop new products and services to allow our customers to more fully utilize the Internet to effectively achieve their missions. Although online fundraising composed less than 1% of all charitable contributions in 2002,2003, we believe online donations will continue to grow as a percentage of total contributions and that nonprofits will continue to benefit from the trend of increased online donations. As such, we have web-enabled our core applications and currently offer a variety of Internet applications and consulting services that allow nonprofit organizations to utilize our fundraising, accounting and administration products to leverage the Internet for online fundraising, e-marketing, alumni and membership directories, newsletters, event management and volunteer coordination. For example, through the end of 2003,September 30, 2004, we had sold our NetSolutions product, which is our online fundraising application, to over 8501,000 customers.
Expand international presence
We believe that the United Kingdom, Canada and Australia as well as other international markets represent growing market opportunities. We currently have international offices in Glasgow, Scotland, Toronto, Canada and Sydney, Australia. We believe the overall market of international nonprofit organizations is changing as donations to nonprofit organizations are increasing in response to reductions in governmental funding of certain activities and expansion of U.S.-based nonprofit organizations into international locations. We believe these markets are currently underserved, and we intend to increase our presence in international markets by expanding our sales and marketing efforts, leveraging our installed base of customers to sell complementary products and services and continuing to offer and develop new products tailored to these international markets.
53
Pursue strategic acquisitions and alliances
We intend to continue to selectively pursue acquisitions and alliances in the future with companies that provide us with complementary technology, customers, personnel with significant relevant experience, increase access to additional geographic and specific vertical markets. We have completed three acquisitions in the past threefour years and are currently involved in a number of strategic relationships. We believe that our size and our history of leadership in the nonprofit sector make us an attractive acquiror or partner for others in the industry.
Products and services
We license software and provide various services to our customers. We generate revenue in six reportable segments, as described in more detail in note 14 of the Notes to our consolidated financial statements. These revenue segments are license fees and maintenance and subscription fees for our software products, consulting services, education services, analytic services, and other. In 2001, 2002, 2003 and 2003,the nine months ended September 30, 2004, revenue from the sale of The Raiser’s Edge and related services represented approximately 71%72%, 71%70%, 72% and 70%, respectively, of our total revenue.
Software products
The Raiser’s Edge
| The Raiser’s Edge is the leading software application specifically designed to manage a nonprofit organization’s fundraising activity. The Raiser’s Edge enables nonprofit organizations to communicate with their constituents, manage fundraising activities, expand their development efforts and make better-informed decisions through its powerful segmentation, analysis, and reporting capabilities. We released version |
54
| In addition to the standard functionality of The Raiser’s Edge, we have built a number of extended applications that may be enabled directly within The Raiser’s Edge and address the specific needs of various vertical markets. Our extended applications are described below. |
| Module name | Key features/benefits | |
| Event | helps plan, organize and manage all aspects of fundraising events | |
| Volunteer | coordinates an organization’s volunteer work force | |
| Member | tracks the identity of members and the date they joined, as well as recording renewals, upgrades, downgrades and lapsed and dropped members | |
| Queue | allows an organization to schedule a series of Raiser’s Edge tasks to be executed sequentially, automatically and unattended | |
| Search | enables an organization to manage prospective planned and major gift donors (individuals, corporations and foundations) from identification and profiling to the cultivation and solicitation of major gifts | |
| Alum | includes additional information and reporting capabilities that help an organization reach, solicit and better manage its alumni constituency | |
| Tribute | tracks all gifts made in honor or memory of an individual or individuals and facilitates properly acknowledging the donor and honoree | |
| Electronic Funds Transfer | allows an organization to easily process gifts made by credit card or by direct debit from donors’ bank accounts | |
| Point of Sale | enables organizations to track inventory and customer purchases, then transfer purchase information to constituent records in The Raiser’s Edge | |
The Financial Edge
| The Financial Edge is an accounting application designed to address the specific accounting needs of nonprofit organizations. As with our other core applications, The Financial Edge integrates with The Raiser’s Edge to simplify gift entry processing, relate information from both systems in an informative manner and eliminate redundant tasks. The Financial Edge improves the transparency and accountability of organizations by allowing them to track and report from multiple views, measure the effectiveness of programs and other initiatives, use budgets as monitoring and strategic planning tools, and supervise cash flow to allocate resources efficiently. As a result, The Financial Edge provides nonprofit organizations with the means to help manage fiscal and fiduciary responsibility, enabling them to be more accountable to their constituents. In addition, The Financial Edge is designed specifically to meet governmental accounting and financial reporting requirements prescribed by the Financial Accounting Standards Board and Governmental Accounting Standards Board. We employ certified public accountants who work with our product development, professional services and customer support teams and who can apply their specialized training and background to assist our customers using The Financial Edge to help them comply with these |
55
| accounting and reporting requirements. We released version | |
| As with The Raiser’s Edge, we have built extended applications that may be enabled directly within The Financial Edge to address the specific functional needs of our customers. We currently offer |
| Module name | Key features/benefits | |
| Purchase Orders | provides a variety of options for recording purchases and generating invoices | |
| eRequisitions | automates the requisition and purchase order process by enabling multiple departments, sites and budget managers to make purchasing requests electronically | |
| Electronic Funds Transfer | allows an organization to make electronic payments | |
| Cash Management | provides on online register enabling an organization to manage and reconcile multiple bank and cash accounts in a centralized repository | |
| Cash Receipts | provides flexible receipt-entry enabling an organization to identify where cash amounts originate, produce a detailed profile of each transaction and print a deposit ticket | |
| Payroll | automates in-house payroll processing | |
| Fixed Assets | stores the information required to properly track and manage property, plant and equipment and the costs associated with them | |
| Student Billing | provides independent schools the ability to perform billing functions and process payments | |
| School Store Manager | manages sales, inventory control, discounts, mailings, pricing, purchasing, receivables, reporting and suppliers for bookstores, snack bars, cafeterias and athletic stores through an integrated point-of-sale solution | |
| Accounting Forms | integrates with our accounting products, enabling an organization to print business forms cost effectively | |
The Education Edge
| Our education administration products are a comprehensive student information management system designed principally to organize an independent school’s admissions and registrar processes, including capturing detailed student information, creating schedules, managing feedback and grading processes, producing demographic, statistic and analytical reports, and printing report cards and transcripts. With our education administration products, an organization can keep biographical and address information for students, parents, and constituents consistent across all of its Blackbaud software products. This integrated system allows an independent school to reduce data-entry time and ensure that information is current and accurate throughout the school. To date, we have marketed our education administration products under the names Admissions Office and Registrar’s Office. |
56
The Patron Edge
| The Patron Edge, which we launched in June 2004, is a comprehensive ticketing management solution specifically designed to help large or small performing arts organizations, museums, zoos, and aquariums boost attendance and increase revenue. The Patron Edge can be used in conjunction with The Raiser’s Edge to allow for comprehensive marketing based on donor profiles or as a standalone ticketing and subscription sales management tool. The Patron Edge offers a variety of ticketing methods and allows customers to save time by streamlining ticketing, staffing, scheduling, event and membership management, and other administrative tasks. The Patron Edge decreases costs incurred by customers by reducing box office expenses and eliminating the transaction fees common to other online ticketing solutions. |
The Information Edge
| The Information Edge is an open and scalable business intelligence solution designed specifically to meet the needs of nonprofit organizations. We launched The Information Edge in August 2003. The Information Edge is an analysis and reporting tool that allows an organization to extract, aggregate and analyze its data to gain insight from multiple data sources and provide opportunities to increase revenues. The Information Edge extracts data from multiple highly indexed transactional databases, including The Raiser’s Edge, and integrates that data into a data warehouse that allows high-speed queries, complex analysis and reporting across the organization including remote locations. The Information Edge is optimized to assist an organization with its direct marketing and fundraising programs, including donor segmentation and campaign strategy. |
Blackbaud Internet applications
| We provide a variety of applications that allow our customers to use our fundraising, accounting and administration products via the Internet. For example, our NetSolutions product enables a nonprofit to | |
| In addition, we have web-enabled most of our applications to allow nonprofit organizations of all sizes to easily and efficiently interact with wider audiences through dynamic content and email campaigns securely from anywhere in the world. These solutions provide a wide variety of web-based online services including the ability for constituents to register for events, update demographic information, support an organization by volunteering and make donations. We provide real-time integration between our Internet and core applications, which significantly enhances the effectiveness of our solutions by tying all information directly to the back-office, which provides an organization with a single, comprehensive view of its constituents and volunteers. |
57
Consulting services
Our consultants provide installation and implementation services for each of our software products. These services include:
| • | system installation and implementation, including assistance installing the software, setting up security, tables, attributes, field options, default sets, business rules, reports, queries, exports and user options, and explanation of data entry and processing procedures; |
| • | management of the data conversion process to ensure data is a reliable and powerful source of information for an organization; |
| • | system analysis and application customization to ensure that the organization’s Raiser’s Edge system is properly aligned with an organization’s processes and objectives; and |
| • | removal of duplicative records, database merging, and information cleansing and consolidation. |
57
In addition to these services, we apply our industry knowledge and experience, combined with our service offering expertise and expert knowledge of our products, to evaluate an organization’s needs and provide operational efficiency and business process improvement consulting for our customers. This work is performed by our staff of consultants who have extensive and relevant domain experience in fundraising, accounting, project management and IT services. This experience and knowledge allows us to make recommendations and implement solutions that ensure efficient and effective use of our products. In addition, we offer software customization services to organizations that do not have the time or in-house resources to create customized solutions using our core products. We believe that no other software company provides as broad a range of consulting and technology services and solutions dedicated to the nonprofit industry as we do.
Education services
We provide a variety of classroom, onsite and self-paced training services to our customers relating to the use of our software products and application of best practices. Our software instructors have extensive training in the use of our software and present course material that is designed to include hands-on lab exercises as well as a course workbook with examples and problems to solve. The education services segment has historically shown some seasonality, as our customers generally attend more training sessions during the second and third quarters of the year. Key aspects of our education services include:
| Education services | Description | |
| Blackbaud University | training facility based in our headquarters with 12 classrooms, each outfitted with computer workstations for each attendee to view and participate in step-by-step demonstrations of our software | |
| Regional Training | offered year-round for our clients at more than 60 regional locations throughout the United States and Canada. These regional sites include fully equipped classrooms and individual student workstations for hands-on learning | |
58
| Education services | Description | |
| Onsite Training | provided at a customer’s location, typically for customers that have a large group of employees requiring more specialized training | |
| Web-Based and Self-Paced Training | includes computer-based training, online courses and our new eLearning Library. The eLearning Library is a subscription service consisting of a collection of more than 115 online software lessons | |
Analytic services
We provide custom modeling and analytical services, including ProspectPoint and WealthPoint, to help nonprofit organizations maximize their fundraising results.
ProspectPoint, which we introduced in February 2001, is a custom modeling service designed specifically for nonprofits. ProspectPoint employs patent-pending modeling techniques to identify and rank the best donor prospects in an organization’s database and capture the distinct characteristics that define an organization and its constituencies, providing a better opportunity to maximize gift revenue. We use these proprietary statistical models to help our
58
We released WealthPoint in July 2003 as our wealth identification and information service. It provides a nonprofit organization with financial, biographical and demographic data on the individuals in its database, enabling the organization to identify its wealthiest donors and to plan the most effective donor cultivation strategies. We match donor and prospect names recorded in The Raiser’s Edge or any other database against sources of publicly available information about an individual’s assets or activities. After the names are matched against the public sources, we then return the data to the clients in a software application that allows them to query, report on, and manipulate the data.
In addition to these modeling and identification services, we offer services that enrich the quality of the data in our customers’ databases. These include a service that finds outdated address files in the database and makes corrections based on the requirements and certifications of the United States Postal Service and a service that uses known fields in an organization’s constituent records to search and find lost donors and prospects. In addition to these services, we offer services that append to a prospect record important additional information, such as phone, email, age, gender, deceased record, county, and congressional district.
Maintenance and subscriptions
The vast majority of our customers choose to receive annual maintenance and support from us under one of our tiered maintenance and support programs. In each of the past three years, an average of more than 94% of our customers have renewed their annual maintenance and support contracts for our products. For an annual fee, our customers receive regular upgrades and enhancements to our software and unlimited phone and email support, with extended
59
Customers
We have customers in each of the principal vertical markets within the nonprofit industry. In 2003,2004, we had over 12,50012,700 customers, over 11,90012,300 of which pay us annual maintenance and support fees. These organizations range from small, local charities to health care and higher education organizations to the largest national health and human services organizations. No one customer accounts for more than 2% of our annual revenue.
Selected customer examples
The selected customer examples below are intended to provide brief examples of the different ways our customers are using our software and services solutions to solve their business problems.
59
Bowdoin College
| Bowdoin College relies on the growth of its $450 million endowment through fundraising contributions to maintain financial stability and achieve its goals. Prior to deploying The Raiser’s Edge, Bowdoin used 15 systems to track student, alumni, parent and other entities associated with the college’s fundraising activities. Deploying The Raiser’s Edge as the centralized data repository allowed Bowdoin to view all aspects of its constituents’ associations with the college, enabling them to drive more personalized contact with constituents, while capturing and maintaining a complete view of all fundraising activities. With the help of our consultants, Bowdoin implemented new business processes that allow them to incorporate and use relevant data from multiple campus systems to improve targeting and resource allocation. Our solution enabled Bowdoin to eliminate several costly databases by consolidating the data into a centralized database and free resources to increase productivity. |
Detroit Zoo
| Through over 10,000 donors and approximately 48,000 members, the Detroit Zoological Society relies on fundraising activities to generate a significant portion of its revenue. The Detroit Zoological Society implemented The Raiser’s Edge and other applications of ours to consolidate several inefficient processes into a single comprehensive solution that allowed them to improve fundraising performance. We also provided them with professional services targeting business process refinements resulting in improved efficiencies in areas such as direct mail and fulfillment and also augmented the Society’s ability to analyze and report on membership performance and event attendance. |
Episcopal High School
| Episcopal High School is a private high school near Washington D.C. with over 400 students. We were selected to implement The Education Edge as a campus-wide system that could support the needs of their many offices, provide customizable transcripts and scheduling |
60
| and allow web-based access for teachers and parents. The Education Edge now serves as the backbone of the school’s operations, automating its manual systems and providing customized reports with a complete picture of each student’s educational experience. |
Help the Aged
| Help the Aged is a well-known nonprofit in the United Kingdom dedicated to addressing issues facing the elderly. In managing its relationship with over three million constituents, they were using seven separate systems, utilized by over 100 users, to collect information and manage fundraising activities. Help the Aged engaged us to implement Information Edge and Raiser’s Edge, which provided those 100 users a single comprehensive view of each constituent. Our consulting team also works with Help the Aged to refine their fundraising processes and leverage the wealth of their data. |
Mayo Foundation
| Mayo Clinic’s mission is to provide the best care to every patient every day through integrated clinical practice, education and research. Mayo Foundation chose The Raiser’s Edge to enable over 130 staff members in the Department of Development to gain direct access to the relevant data necessary to support fundraising programs that contribute over |
60
US Naval Academy Alumni Association
| The US Naval Academy Alumni Association relies on the strength of coordinated development efforts to maintain a strong and educated community of widely dispersed alumni. The association selected The Financial Edge as their financial management system to track and distribute over 700 different restricted funds while adhering to specific accounting and compliance requirements. Our consulting team worked with the US Naval Academy Alumni Association to implement business processes that help them utilize our software while complying with the unique requirements and protocols of a U.S. Military Service Academy. |
United Way of America
| United Way of America is a national organization dedicated to leading the United Way movement, which includes approximately 1,400 independent, community-based United Way organizations, in making a measurable impact in every community in America. We recently entered into an agreement with United Way of America to develop a version of The Raiser’s Edge to handle the unique needs of United Way organizations. Previously, United Way of America had developed and supported a proprietary campaign management system used by more than 100 local United Way organizations. Under the agreement, we now own that system and, in exchange for minimum fees, will support it for at least 24 months as these local United Way organizations transition to The Raiser’s Edge. |
Sales and marketing
We sell all of our software and related services through our direct sales force, which is complemented by our team of account development representatives responsible for sales lead
61
Our sales force is divided into three main areas of responsibility:
| • | selling products and services to existing customers; |
| • | acquiring new customers; and |
| • | developing and managing relationships with our resellers. |
In addition, we have a dedicated portion of our outside sales team focused exclusively on large, enterprise-wide accounts and a group of sales engineers who support both new and existing customers. In general, each sales representative is assigned responsibility for handling just one product line in a designated geographic area, except for sales representatives for the K-12 education market who are responsible for selling all of our software products in that market. We frequently lead our sales efforts with the sale of one of our primary products, such
61
We conduct a variety of marketing programs that are designed to create brand recognition and market awareness for our products and services. Our marketing efforts include participation at tradeshows, technical conferences and technology seminars, publication of technical and educational articles in industry journals and preparation of competitive analyses. Our customers and strategic partners provide references and recommendations that we often feature in our advertising and promotional activities.
We believe relationships with third parties can enhance our sales and marketing efforts. We have, and intend to seek to establish additional, relationships with companies that provide services to the nonprofit industry, such as consultants, educators, publishers, financial service providers, complementary technology providers and data providers. For example, we have developed a business solutions provider network with a number of resellers and accounting firms. These companies promote or complement our nonprofit solutions and provide us access to new customers.
We believe that active participation in charitable activities is good for the community and helps us build relationships with our clients and enhances our employees’ awareness of their activities. We have established a number of employee volunteer activities and are actively involved with a number of local and regional charities and nonprofit organizations, further demonstrating our dedication to assisting these organizations.
Competition
The market for software and related services for nonprofit organizations is fragmented, competitive and rapidly evolving, and there are limited barriers to entry for some aspects of this market. We expect to encounter new and evolving competition as this market consolidates and matures and as nonprofit organizations become more aware of the advantages and efficiencies that can be attained from the use of specialized software and other technology solutions. A number of diversified software enterprises have made recent acquisitions or developed products for the market, including Intuit, Sage and SunGard. Other companies that
62
We mainly face competition from four sources:
| • | software developers offering specialized products designed to address specific needs of nonprofit organizations; |
| • | providers of traditional, less automated fundraising services; |
| • | custom-developed solutions; and |
| • | software developers offering general products not designed to address specific needs of nonprofit organizations. |
Although there are numerous general software developers marketing products that have some application in the nonprofit market, these competitors have generally neglected to focus
62
We compete with custom-developed solutions created either internally by the nonprofit organization or outside custom service providers. However, building a custom solution often requires extensive financial and technical resources that may not be available or cost-effective for the nonprofit organization. In addition, in many cases the customer’s legacy database and software system were not designed to support the increasingly complex and advanced needs of today’s growing community of nonprofit organizations.
We also compete with providers of traditional, less automated fundraising services, including parties providing services in support of traditional direct mail campaigns, special events fundraising, telemarketing and personal solicitations. We believe we compete successfully against these traditional fundraising services, primarily because our products and services are more automated, robust and efficient than the traditional fundraising methods supported by these providers.
Research and development
We have made substantial investments in research and development, and expect to continue to do so as a part of our strategy to introduce additional products and services. As of December 31, 2003September 30, 2004 we had approximately 150 employees working on research and development. Our research and development expenses for the years ended December 31, 2001, 2002 and 2003, and for the nine months ended September 30, 2004 were $14.8 million, $14.4 million, and $15.5 million and $13.2 million, respectively.
63
Technology and architecture
We utilize a three-tier Component Object Model, or COM-based development model, because it allows our customers to extend and modify the functionality of our applications without requiring them to make any source code or data modifications themselves. This is important for customers that want to customize our applications by incorporating their own business logic
63
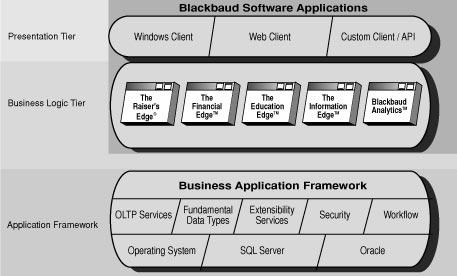
The architecture of our COM-based development model ensures our applications are:
| • | Flexible.Our component-based architecture is programmable and easily customized by our customers without requiring modification of the source code, ensuring that the technology can be leveraged and extended to accommodate changing demands of our clients and the market. |
| • | Adaptable.The architecture of our applications allows us to easily add features and functionality or to integrate with third party applications in order to adapt to our customers’ needs or market demands. |
| • | Scalable.We combine a scalable architecture with the performance, capacity, and load balancing of industry-standard web servers and databases used by our customers to ensure the applications can scale to the needs of larger organizations. |
We have and intend to continue to license technologies from third parties that are integrated into our products. Currently, we believe that the loss of any third party technology integrated into our products would not have a material adverse effect on our business. However, our inability to obtain licenses for third party technology for future products could delay product development, which could harm our business and operating results.
Intellectual property and other proprietary rights
To protect our intellectual property, we rely on a combination of patent, trademark, copyright and trade secret laws in various jurisdictions, and employee and third-party nondisclosure agreements and confidentiality procedures. We have a number of registered trademarks,
64
64
Employees
As of December 31, 2003,September 30, 2004, we had approximately 780865 employees, consisting of 150200 in sales and marketing, 150 in research and development, 360390 in customer support, and 120125 general and administrative personnel. None of our employees are represented by unions or covered by collective bargaining agreements. We are not involved in any material disputes with any of our employees, and we believe that relations with our employees are satisfactory.
Properties
We lease our headquarters in Charleston, South Carolina which consists of approximately 230,000 square feet. The lease on our Charleston headquarters expires in July 2010, and we have the option for two 5-year renewal periods. We also lease facilities in Glasgow and Sydney. We believe that our properties are in good operating condition and adequately serve our current business operations. We also anticipate that suitable additional or alternative space, including those under lease options, will be available at commercially reasonable terms for future expansion.
Legal proceedings
From time to time we may become involved in litigation relating to claims arising from our ordinary course of business. We believe that there are no claims or actions pending or threatened against us, the ultimate disposition of which would have a material adverse affect on us.
65
Management
Executive officers and directors
The following table sets forth our executive officers and directors, and their ages and positions, as of May 31, 2004.the date of this prospectus.
| Name | Age | Position | ||
| Robert J. Sywolski | President, Chief Executive Officer and Director | |||
| Timothy V. Williams | 55 | Chief Financial Officer, Vice President, Treasurer and Assistant Secretary | ||
| Louis J. Attanasi | 43 | Vice President of Strategic Technologies | ||
| Richard S. Braddock | Vice President of Marketing | |||
| Charles T. Cumbaa | 51 | Vice President of Services and Development | ||
| Andrew L. Howell | General Counsel and Corporate Secretary | |||
| Laura W. Kennedy | 40 | Vice President of Human Resources | ||
| Anthony J. Powell, CFRE | Vice President of Consulting Services | |||
| Edward M. Roshitsh | 40 | Vice President of Sales | ||
| Heidi H. Strenck | 35 | Vice President, Controller, Assistant Treasurer and Assistant Secretary | ||
| Christopher R. Todd | Vice President of Corporate Development | |||
| Germaine M. Ward | 41 | Vice President of Products | ||
| Gerard J. Zink | Vice President of Customer Support | |||
| Marco W. Hellman | 43 | Director, Chairman | ||
| Paul V. Barber | Director | |||
| Dr. Sandra R. Hernández | Director | |||
| Andrew M. Leitch | ||||
| Director | ||||
| David R. Tunnell | 34 | Director | ||
Robert J. Sywolskihas served as our President, Chief Executive Officer and a director since March 2000. From May 1998 until February 2000, Mr. Sywolski was a general partner at JMI Equity Fund, a private investment group. Prior to that, he spent twelve years as the Chairman and CEO of the North American Operations of Cap Gemini, a systems integration, management consulting and information technology services company. A member of the Association of Fundraising Professionals, Mr. Sywolski serves on the boards of the Medical University of South Carolina Cardio Vascular Institute, the South Carolina Aquarium, and ePhilanthropyFoundation.org. He also serves on the boards of Changepoint Corporationthe Health Science Foundation of the Medical University of South Carolina and METASeS. Mr. Sywolski holds a BA in electrical engineering from Widener University and an MBA from Long Island University.
Timothy V. Williamshas served as our Chief Financial Officer since January 2001. Mr. Williams is responsible for all of our financial reporting and controls, as well as human resources, legal and administrative services. From January 1994 to January 2001 he served as Executive Vice President and CFO of Mynd, Inc. (now Computer Sciences Corporation), a provider of software and services to the insurance industry. Prior to that, Mr. Williams worked at Holiday Inn
66
Louis J. Attanasihas served as our Vice President of Strategic Technologies since 2000. Prior to that, he was our Vice President of Product Development since 1996. He joined us in 1986, and in 1988, he began managing our research and development efforts. From 1988 through 1995, Mr. Attanasi was responsible for our software design. Prior to joining us, he taught mathematics at the State University of New York at Stony Brook and worked as a programming engineer at Environmental Energy Corporation. Mr. Attanasi holds a BS in Mathematics from State University of New York at Stony Brook and a MS in Mathematics from the University of Charleston.
Richard S. Braddockhas served as our Vice President of Marketing since July 2003. Prior to joining us, Mr. Braddock was a Marketing/ Private Equity Consultant for T.I.F.F., a nonprofit cooperative, from February 2003 until May 2003 and for Deutche Bank Venture Capital from June 2002 until January 2003. He was with iMediation Inc., a channel management vendor, from August 2000 until February 2002, most recently as Vice President of Marketing and Strategy, and the Vice President of Marketing for Prime Response, Inc., a customer relations management software company from January 1998 until April 2000. Mr. Braddock holds a BA from Dartmouth College and an MBA from Harvard Business School.
Charles T. Cumbaajoined us in May 2001. Prior to joining us, Mr. Cumbaa was an Executive Vice President with Intertech Information Management from December 1998 until October 2000. From 1992 until 1998 he was President and Chief Executive Officer of Cognitech, Inc., a software company he founded. Prior to that, he was employed by McKinsey & Company. Mr. Cumbaa holds a BA from Mississippi State University and an MBA from Harvard Business School.
Andrew L. Howellhas been our General Counsel and Corporate Secretary since July 2002. Prior to joining us, Mr. Howell practiced corporate and technology law, most recently with Sutherland Asbill & Brennan LLP. Mr. Howell received a BA from Washington & Lee University and a JD from Mercer University, where he served as Editor-in-Chief of the Law Review.
Laura W. Kennedyhas been our Vice President of Human Resources since February 2003. She previously served as our Director of Human Resources from November 1996 to February 2003 and prior to that as Manager of Customer Support since 1993. Prior to joining us, Ms. Kennedy held accounting and management positions with Owens & Minor, Inc. and Media General, Inc. Ms. Kennedy holds a BA in accounting from Georgia State University.
Anthony J. Powell,CFRE, has served as our Vice President of Consulting Services since October 2002. Prior to that he served as Director of Consulting Services since July 1998. Before joining us, Mr. Powell was the Major Gifts Officer at the Smithsonian Institution from June 1997 to July 1998. Prior to that he was the Assistant Vice President for the Greater Baltimore Medical Center Foundation from February 1996 to January 1997. Mr. Powell holds a BA from Allegheny College.
Edward M. Roshitshhas been our Vice President of Sales and Marketing since August 2000. From October 1990 until August 2000, he served in a variety of capacities at Data Processing Sciences Corporation, most recently as their Vice President of Sales. Mr. Roshitsh spent several years in the U.S. Air Force as a Network Communications Expert and holds a BA from Indiana Wesleyan University.
67
Heidi H. Strenckhas served as our Vice President and Controller since October 2002. Ms. Strenck joined us in September 1996 and held key management roles as Accounting Manager from 1996 until 1997 and as Controller until 2002. Prior to joining us, she served as a Senior Associate with Coopers & Lybrand and as Internal Auditor for The Raymond Corporation. Ms. Strenck serves on the board of directors of the Trident Area Salvation Army. Ms. Strenck holds a BA in management/ accounting from Hartwick College.
Christopher R. Todd, our Vice President of Corporate Development, joined us in July 2000. He heads our business development efforts and oversees our analytics division. Prior to joining us, Mr. Todd served as the Director of Business Development and Legal Affairs for NetGen Inc. from July 1999 until July 2000 and as an Associate with McKinsey & Co. from July 1997 until July 1999. Mr. Todd holds a BA from Harvard College and a JD from Yale Law School.
Germaine M. Wardhas been our Vice President of Products since April 2002. From April 1998 to April 2002, Ms. Ward served as the Vice President for several divisions of Iomega Corporation, most recently Media, Applications and Software. Prior to that, Ms. Ward spent seven years at Symantec Corporation. Ms. Ward holds a BA in computer science from Michigan Technological University.
Gerard J. Zinkhas served as our Vice President of Customer Support since June 1996. He joined us in November 1987, and served as a Customer Support Analyst and Manager of Customer Support before assuming his current position. Prior to joining us, Mr. Zink was employed as a computer consultant by the Diocese of Rockville Center in New York.
Marco W. Hellmanhas been a member of our board of directors since October 1999. Mr. Hellman was an associate and a Managing Director with Hellman & Friedman LLC between August 1987 and February 2001. Mr. Hellman holds a BAan AB from University of California at Berkeley and an MBA from Harvard Business School.
Paul V. Barberhas served on our board of directors since October 1999. Mr. Barber has been a General Partner with JMI Equity Fund since 1998. He also serves on the boards of several privately held companies. Mr. Barber holds an AB in economics from Stanford University and an MBA from Harvard Business School.
Dr. Sandra R. Hernándezhas served on our board of directors since July 2002. Ms. Hernández has served as the Chief Executive Officer of The San Francisco Foundation since September 1997. She has also been an Assistant Clinical Professor at the School of Medicine at the University of California at San Francisco since 1992 and has worked as a Medical Attending physician at the AIDS clinic at the San Francisco General Hospital. She serves on the Board of Directors of a number of nonprofit organizations, including the Lucille Packard Children’s Hospital, the American Foundation for AIDS Research and the Corporation for Supportive Housing. She holds a BA in psychology from Yale University and an MD from Tufts University School of Medicine.
Andrew M. Leitchwas appointed to our board of directors in February 2004. Mr. Leitch was with Deloitte & Touche LLP for over 27 years, most recently serving as the Vice Chairman of the Management Committee, Hong Kong from September 1997 to March 2000. Mr. Leitch also serves on the board of directors of Aldila, Inc., Citicorp Everbright China Fund Limited, Education OnLine USA, Inc., Consolidated Pass International Limited and Publishing and Broadcasting International Limited. Mr. Leitch is a Canadian chartered accountant and a licensed CPA in New York.
Larry E. Robbinshas been a member of our board of directors since October 1999. He is a partner with the law firm of Wyrick Robbins Yates & Ponton LLP located in Raleigh, North
68
David R. Tunnellhas served on our board of directors since October 1999. Mr. Tunnell joined Hellman & Friedman LLC in 1994 and currently serves as a Managing Director. He serves on the board of directors of Arch Capital Group Ltd., a public limited liability company that provides property and casualty insurance and reinsurance products.Vertafore, Inc. Mr. Tunnell holds a BA from Harvard College and an MBA from Harvard Business School.
Board composition
Our board of directors is composed of a majority of independent directors as defined under Nasdaq Marketplace Rules.
Our board of directors consists of sevensix directors, which are divided into three classes, each of whose members serve for a staggered three-year term. The board of directors will consist of threeOur two Class A directors are Paul V. Barber and Marco W. Hellman, and Larry E. Robbins,our two Class B directors are Dr. Sandra J. Hernández and Andrew M. Leitch, and our two Class C directors are Robert J. Sywolski and David R. Tunnell. At each annual meeting of stockholders, one class of directors will be elected for a three-year term to succeed the directors of the same class whose terms are then expiring. The terms of the Class A directors, Class B directors and Class C directors expire upon the election and qualification of successor directors at the annual meetings of stockholders held during the calendar years 2005, 2006 and 2007, respectively.
Our bylaws provide that the number of directors constituting the board of directors shall not be less than five nor more than nine, and the exact number of directors may be fixed or changed, within this range, by resolution adopted by the affirmative vote of a majority of the directors then in office. Any additional directorships resulting from an increase in the number of directors will be distributed among the three classes so that, as nearly as possible, each class will consist of one-third of the total number of directors. This classification of the board of directors may have the effect of delaying or preventing changes in control or management of our company.
Pursuant to an Investor Rights Agreement dated as of October 13, 1999 among us and certain of our stockholders, those stockholders were granted the right to designate two representatives on our board of directors. The right to designate representatives to our board of directors will terminate upon the closing of this offering.
Board committees
Our board of directors has established an audit committee, a compensation committee, and a nominating and corporate governance committee. Each committee is comprised entirely of independent directors in accordance with Nasdaq Marketplace Rules.
Our audit committee is comprised of Andrew M. Leitch, Chairman, Paul V. Barber and Dr. Sandra J. Hernández. The audit committee provides assistance to our board of directors in its oversight of the integrity of our financial statements, the qualifications and independence of our independent auditors,registered public accounting firm, the performance of our internal audit functions, the procedures undertaken by the independent auditorsregistered public accounting firm and our compliance with other regulatory and legal requirements. Our audit committee operates pursuant to a formal written charter.
Our compensation committee is comprised of Marco W. Hellman, Chairman, Paul V. Barber and David R. Tunnell. The compensation committee reviews and makes recommendations to our
69
Our nominating and corporate governance committee is comprised of Paul V. Barber, Chairman, Andrew M. Leitch and David R. Tunnell. The nominating and corporate governance committee is responsible for identifying and recommending qualified nominees to serve on our
69
Compensation committee interlocks and insider participation
No member of our compensation committee serves or in the past has served as a member of another entity’s board of directors or compensation committee, which entity has one or more executive officers serving as a member of our board of directors or compensation committee.
Compensation of directors
Members of the board of directors are entitled to receive an annual cash retainer of $7,500. All directors are also entitled to receive $3,000 for each Board meeting attended. The chairperson of the audit committee is entitled to receive an additional $5,000 per year.
Beginning in February 2004, each incoming member to our board of directors is entitled to receive a one-time option grant to purchase that number of shares of common stock equal to the quotient of $120,000 divided by the fair market value of our common stock on the date of grant, such option to vest over three years. Each member of the board of directors will receive an annual option grant to purchase that number of shares of common stock equal to the quotient of $40,000 divided by the fair market value of our common stock on the date of grant, such option to vest over three years. In addition, if the chairperson of the board of directors is not an executive officer, he or she will receive annual compensation of $10,000 in cash and an option to purchase that number of shares of common stock equal to the quotient of $180,000 divided by the fair market value of our common stock on the date of grant, such option to vest over three years. The exercise price for all these option grants will be the fair market value on the date of grant.
Indemnification and limitation of director and officer liability
Our certificate of incorporation limits the liability of our directors for monetary damages arising from a breach of their fiduciary duty as directors, except to the extent otherwise required by the Delaware General Corporation Law. Such limitation of liability does not affect the availability of equitable remedies such as injunctive relief or rescission.
Our certificate of incorporation and bylaws provide that we will indemnify each person who was or is made a party or threatened to be made a party to or is otherwise involved in any action, suit or proceeding, whether civil, criminal, administrative or investigative, by reason of the fact that he or she or a person of whom he or she is the legal representative is or was one of our directors or officers, or is or was serving at our request as a director, officer, employee or agent of another enterprise, to the fullest extent allowed by the Delaware General Corporation Law. This right of indemnification shall include the right to be paid by us the amount of expenses, including attorneys’ fees, incurred in connection with any such proceeding in advance of its final disposition. However, if Delaware law so requires, the advancement of such expenses will only be made upon the delivery to us of an undertaking by or on behalf of
70
In addition, our certificate of incorporation and bylaws provide that we may maintain, at our expense, insurance to protect ourselves and any of our directors, officers, employees or agents against any expense, liability or loss, whether or not we would have the power to indemnify a person against any expense, liability or loss under Delaware law. Our certificate of
70
Executive compensation
The following table sets forth summary information relating to compensation paid for services rendered for our fiscal year ended December 31, 2003,2004, with respect to the compensation paid and bonuses granted to our Chief Executive Officer as well as each of our other four most highly compensated executive officers, each of whose aggregate compensation during the last fiscal year was greater than $100,000. For purposes of this prospectus, we will refer to the executive officers named in the table below as the named executive officers.
Summary compensation table
| Long-term | Long-term | |||||||||||||||||||||||||||||||||||||||||
| compensation | compensation | |||||||||||||||||||||||||||||||||||||||||
| Annual compensation | Number of | Annual compensation | Number of | |||||||||||||||||||||||||||||||||||||||
| securities | securities | |||||||||||||||||||||||||||||||||||||||||
| Other annual | underlying | All other | Other annual | underlying | All other | |||||||||||||||||||||||||||||||||||||
| Name and principal position | Name and principal position | Salary | Bonus(1) | compensation(2) | options (#) | compensation | Name and principal position | Salary | Bonus(1) | compensation(2) | options (#) | compensation | ||||||||||||||||||||||||||||||
| Robert J. Sywolski | Robert J. Sywolski | $525,000 | $563,736 | $8,625 | 5,638,791 | $4,888 | (3) | Robert J. Sywolski | $525,000 | $486,840 | $7,798 | 3,524,244 | $5,683 | (3) | ||||||||||||||||||||||||||||
| President and Chief Executive Officer | President and Chief Executive Officer | |||||||||||||||||||||||||||||||||||||||||
| Timothy V. Williams | Timothy V. Williams | 275,000 | 134,971 | 8,400 | 1,000,000 | 6,607 | (4) | Timothy V. Williams | 275,000 | 107,389 | 8,400 | 625,000 | 7,165 | (4) | ||||||||||||||||||||||||||||
| Vice President and Chief Financial Officer | Vice President and Chief Financial Officer | |||||||||||||||||||||||||||||||||||||||||
| Charles T. Cumbaa | Charles T. Cumbaa | 255,000 | 134,317 | — | 375,000 | 7,872 | (5) | |||||||||||||||||||||||||||||||||||
| Vice President of Services and Development | ||||||||||||||||||||||||||||||||||||||||||
| Louis J. Attanasi | Louis J. Attanasi | 255,000 | 125,155 | 8,400 | 400,000 | 9,329 | (5) | Louis J. Attanasi | 255,000 | 122,401 | 8,400 | 250,000 | 7,135 | (6) | ||||||||||||||||||||||||||||
| Vice President | Vice President of Strategic Technologies | |||||||||||||||||||||||||||||||||||||||||
| Gerard J. Zink | 255,000 | 112,885 | 8,400 | 400,000 | 6,583 | (6) | ||||||||||||||||||||||||||||||||||||
| Vice President of Customer Support | ||||||||||||||||||||||||||||||||||||||||||
| Germaine M. Ward | 230,000 | 137,945 | — | 400,000 | 6,553 | (7) | ||||||||||||||||||||||||||||||||||||
| Edward M. Roshitsh | Edward M. Roshitsh | 225,000 | 135,000 | 6,000 | 250,000 | 8,817 | (7) | |||||||||||||||||||||||||||||||||||
| Vice President of Products | Vice President of Sales | |||||||||||||||||||||||||||||||||||||||||
(1) Includes a reimbursement for tax preparation services of $5,000 for Mr. Sywolski and a reimbursement for relocation expenses of $25,060 for Ms. Ward.Sywolski.
(2) Represents a perquisite for the dollar value of the use of a company automobile for Mr. Sywolski and an automobile allowance for each of Mr. Williams, Mr. Attanasi and Mr. Zink.Roshitsh.
(3) Includes $3,981$4,644 for a matching contributions under our 401(k) plan and payment of $1,040 for life insurance premiums.
(4) Includes $6,500 for a matching contribution under our 401(k) plan and payment of $907 for life insurance premiums.
(4) Includes $6,000 for a matching contribution under our 401(k) plan and payment of $607$665 for life insurance premiums.
(5) Includes $6,000$6,500 for a matching contribution under our 401(k) plan, an equipment subsidy of $2,746$738 and payment of $583$635 for life insurance premiums.
(6) Includes $6,000$6,500 for a matching contribution under our 401(k) plan and payment of $583$635 for life insurance premiums.
(7) Includes $6,000$8,228 for a matching contribution under our 401(k) plan and payment of $553$589 for life insurance premiums.
71
Option grants in last fiscal year
There were no grants of stock options to any of our named executive officers during the fiscal year ended December 31, 2003.2004.
71
Aggregated option exercises in last fiscal year and fiscal year-end option values
No named executive officers exercised any options during the fiscal year ended December 31, 2003.2004.
The following table sets forth information about the exercisable and unexercisable options held by the named executive officers as of December 31, 2003.2004. The “Value of unexercised in-the-money options at December 31, 2003”2004” is calculated based on the difference between $14.64, the estimated fair market value of the common stock of $6.00closing price on December 31, 20032004, and the exercise price for the shares underlying the option, multiplied by the number of shares issuable upon exercise of the option. All options were granted under our 1999, 2000 and 2001 Stock Option Plans.
| Number of shares underlying | Value of unexercised | Number of shares underlying | Value of unexercised | |||||||||||||||||||||||||||||
| unexercised options | in-the-money options | unexercised options | in-the-money options | |||||||||||||||||||||||||||||
| at December 31, 2003 (#) | at December 31, 2003 | at December 31, 2004 (#) | at December 31, 2004 | |||||||||||||||||||||||||||||
| Name | Exercisable | Unexercisable | Exercisable | Unexercisable | Exercisable | Unexercisable | Exercisable | Unexercisable | ||||||||||||||||||||||||
| Robert J. Sywolski | 5,094,530 | 544,261 | $ | 15,283,590 | $ | 1,632,783 | 3,524,244 | — | $ | 34,678,561 | $ | — | ||||||||||||||||||||
| Timothy V. Williams | 750,000 | 250,000 | 2,250,000 | 750,000 | 625,000 | — | 6,150,000 | — | ||||||||||||||||||||||||
| Charles T. Cumbaa | 250,000 | 125,000 | 2,420,000 | 1,190,000 | ||||||||||||||||||||||||||||
| Louis J. Attanasi | 358,462 | 41,538 | 1,069,848 | 107,998 | 232,693 | 17,307 | 2,278,623 | 159,224 | ||||||||||||||||||||||||
| Gerard J. Zink | 358,462 | 41,538 | 1,069,848 | 107,998 | ||||||||||||||||||||||||||||
| Germaine M. Ward | 100,000 | 300,000 | 300,000 | 900,000 | ||||||||||||||||||||||||||||
| Edward M. Roshitsh | 250,000 | — | 2,460,000 | — | ||||||||||||||||||||||||||||
Employment and severance agreements
In April 2004, we entered into a two year employment agreement with Robert J. Sywolski to serve as our President and Chief Executive Officer. Under the agreement, Mr. Sywolski is entitled to an annual base salary of $525,000 per year, subject to periodic review and adjustment by our compensation committee. Mr. Sywolski is also entitled to receive an annual bonus, 80% of which is based on attainment of revenue and Adjusted EBITDA (excluding bonus expense) goals and 20% of which is based on the subjective evaluation of Mr. Sywolski’s performance by the compensation committee. Mr. Sywolski’s bonus is targeted at 80% of his annual base salary, but can increase to approximately 150% of his annual base salary if we exceed our revenue and Adjusted EBITDA goals and Mr. Sywolski qualifies for the full amount of the subjective portion of his bonus. In addition, Mr. Sywolski’s bonus may be less than 80% of his base salary if we do not meet our revenue and Adjusted EBITDA goals or he does not qualify for the full amount of the subjective portion of this bonus; provided that Mr. Sywolski hashad a guaranteed minimum bonus of $100,000 for 2004. For purposes of this bonus calculation, Adjusted EBITDA means the sum of the following determined on a consolidated basis, without duplication, for us and our subsidiaries in accordance with generally accepted accounting principles: (a) net income plus (b) the sum of the following to the extent deducted in determining net income (i) income and franchise taxes, (ii) interest expense, (iii) bonus expense and (iv) amortization, depreciation and other non-cash charges (including non-cash stock compensation charges) less (c) interest income and any extraordinary gains.
Subject to certain exceptions, Mr. Sywolski is entitled to a severance payment equal to his base salary for the remainder of the term of the agreement if we terminate his employment without cause, if he is constructively terminated or if he terminates his employment upon a change in control. Pursuant to our prior employment agreement with Mr. Sywolski dated March 2000, we also granted Mr. Sywolski an option to purchase 5,638,7913,524,244 shares of our common stock. Among other things, this option requires us to pay Mr. Sywolski 10% of his
72
72
We have also entered into at-will employment agreements with Timothy V. Williams, Charles T. Cumbaa, Louis J. Attanasi Gerard J. Zink and GermaineEdward M. WardRoshitsh to employ each officer in their current positions, which agreements are dated January 2, 2001, December 17, 2002,May 16, 2001, December 17, 2002 and April 22, 2002,September 1, 2000, respectively. The relevant agreement provides for a base salary in the amount of $275,000 for Mr. Williams, $255,000 for Mr. Attanasi,Cumbaa, $255,000 for Mr. ZinkAttanasi and $230,000$225,000 for Ms. Ward,Mr. Roshitsh, each of which are subject to increase at the discretion of the board of directors or the compensation committee. Each officer isMessrs. Williams, Cumbaa and Attanasi are entitled to receive an annual bonus equal to 40%a certain percentage of their base salary (40% for Mr. Williams and Mr. Attanasi, and 45% for Mr. Cumbaa) based upon Blackbaud’s attainment of revenue and Adjusted EBITDA (excluding bonus expense)(computed as discussed above for Mr. Sywolski) goals, provided that the bonus for each officer can be increased up to 80% of his or her base salarytwo times the target bonus if we exceed our revenue and Adjusted EBITDA goals. Mr. Roshitsh is entitled to receive an annual bonus equal to 50% of his base salary based upon Blackbaud’s attainment of sales goals and Blackbaud Europe’s revenue goals, provided that his bonus can be increased up to two times the target bonus if these sales and revenue goals are exceeded. In addition, the bonus amount of each executive is subject to increase or decrease based on the subjective evaluation of each officer by the compensation committee, but in no event will the bonus exceed 80% oftwo times the target bonus for such officer’s base salary. executive officer.
Each officer may participate in our executive bonus plan and all other employee benefit plans that we offer. Each agreement prohibits the officer from entering into employment with any direct competitor and from soliciting any employee of ours to leave us while the agreement is in effect and for two years after termination of the agreement. None of the agreements provide for any severance payments. The agreements have no set term.
Employee benefit and stock plans
Equity compensation plan information
| (a) | (b) | (c) | (a) | (b) | (c) | |||||||||||||||||||||
| Number of securities | Number of securities | |||||||||||||||||||||||||
| Number of securities | remaining available for | Number of securities | remaining available for | |||||||||||||||||||||||
| to be issued upon | Weighted-average | issuance under equity | to be issued upon | Weighted-average | issuance under equity | |||||||||||||||||||||
| exercise of | price of | compensation plans | exercise of | price of | compensation plans | |||||||||||||||||||||
| outstanding options, | outstanding options, | (excluding securities | outstanding options, | outstanding options, | (excluding securities | |||||||||||||||||||||
| Plan category | Plan category | warrant and rights | warrant and rights | reflected in column (a)) | Plan category | warrant and rights | warrant and rights | reflected in column (a)) | ||||||||||||||||||
| Equity compensation plans approved by security holders | Equity compensation plans approved by security holders | Equity compensation plans approved by security holders | ||||||||||||||||||||||||
| 2004 Stock Plan | — | N/A | 1,850,000 | 2004 Stock Plan | 501,615 | $9.13 | 654,635 | |||||||||||||||||||
| 2001 Stock Option Plan | 6,557,406 | $3.15 | — | 2001 Stock Option Plan | 4,000,513 | $5.09 | — | |||||||||||||||||||
| 1999 Stock Option Plan | 2,911,299 | $3.00 | — | 1999 Stock Option Plan | 1,798,025 | $4.80 | — | |||||||||||||||||||
| Equity compensation plans not approved by security holders | Equity compensation plans not approved by security holders | Equity compensation plans not approved by security holders | ||||||||||||||||||||||||
| 2000 Stock Option Plan | 5,638,791 | $3.00 | — | 2000 Stock Option Plan | 3,524,244 | $4.80 | — | |||||||||||||||||||
73
Description of plans
1999 Stock Option Plan, 2000 Stock Option Plan and 2001 Stock Option Plan
Our 1999 Stock Option Plan was adopted by our board of directors and approved by our stockholders in October 1999. Our 2000 Stock Option Plan was adopted by our board of directors in May 2000. Our 2001 Stock Option Plan was adopted by our board of directors in July 2001 and approved by our stockholders at the annual stockholders meeting in May 2002. A total of 16,110,8308,424,945 shares of our common stock were authorized and reserved for issuance under the 1999 Stock Option Plan, the 2000 Stock Option Plan and the 2001 Stock Option Plan, and options to purchase 15,235,2159,377,186 shares of common stock, at a weighted average exercise price of $3.08$4.93 per share, were outstanding under such plans as of March 31,September 30, 2004. In
73
Generally, options granted under the 1999 Stock Option Plan vest in eight equal semi-annual installments beginning on the 180th day after the date of grant. The option granted under the 2000 Stock Option Plan vested 25% on the date of grant, with the remainder vesting in eight equal semi-annual installments thereafter. Options granted under the 2001 Stock Option Plan vest in equal annual installments on the first, second, third and fourth anniversaries of the date of grant. Subject to the terms of the plans, options may be transferred by will or the laws of descent and distribution and, in the case of nonstatutory stock options, may also be transferred with the approval of our board of directors or a committee thereof to certain of the optionee’s family members. In the event of certain changes in control of our company, all outstanding options under the 1999 Stock Option Plan, 2000 Stock Option Plan and 2001 Stock Option Plan shall become immediately exercisable.
2004 Stock Plan
Our 2004 Stock Plan was adopted by our board of directors and our stockholders on March 23, 2004. A total of 1,850,0001,156,250 shares of common stock have been reserved for issuance under the 2004 Stock Plan. The 2004 Stock Plan is administered by our board of directors, or a committee consisting of members appointed by our board of directors, and provides for grants of “incentive stock options” within the meaning of Section 422 of the Internal Revenue Code of 1986, as amended, as well as grants of non-statutory options and purchase rights. Generally, options granted under the 2004 Plan will vest as to 25% of the shares on the first, second, third and fourth anniversaries of the date of grant. Options may only be transferred by will or the laws of descent and distribution. In the event of certain changes in control of our company, all outstanding options and purchase rights under the 2004 Stock Plan shall either be assumed or replaced by the successor company, or upon proper written notice to the grantees, the options and purchase rights will terminate upon the change in control. As of the date of this prospectus, no options orto purchase rights501,615 shares of our common stock have been granted pursuant to the 2004 Stock Plan.
74
Principal and selling stockholders
The following table sets forth information regarding the beneficial ownership of our common stock as of MayDecember 31, 2004, by the following individuals or groups:
| • | each person or entity known by us to beneficially own more than 5% of our common stock; |
| • | each of the named executive officers; |
| • | each of our directors; |
| • | all directors and executive officers as a group; and |
| • | each selling stockholder. |
Beneficial ownership of a security is determined in accordance with the rules and regulations of the SEC. Under these rules, a person is deemed to beneficially own a share of our common stock if that person has or shares voting power or investment power with respect to that share, or has the right to acquire beneficial ownership of that share within 60 days, including through the exercise of any option or other right or the conversion or any other security. Shares issuable under stock options are deemed outstanding for computing the percentage of the person holding options but are not outstanding for computing the percentage of any other person. The percentage of beneficial ownership forshown in the following table is based upon 68,014,57142,549,056 shares of capital stock outstanding as of MayDecember 31, 2004 after giving effect to our proposed repurchase, simultaneous with this offering,2004. The number and percentage of shares beneficially owned after the offering in the table below assumes that the selling stockholders sell all shares of our common stock from Anthony E. Bakker.
Unless otherwise indicated, the address for each listed stockholder is: c/o Blackbaud, Inc., 2000 Daniel Island Drive, Charleston, South Carolina 29492-7541. To our knowledge, except as indicated in the footnotes to this table and pursuant to applicable community property laws, the persons named in the table have sole voting and investment power with respect to all shares of capital stock. To our knowledge, at the time of the acquisition of the securities being sold inregistered under this offeringprospectus the selling stockholders had no agreements, understandings or arrangements with any other persons, either directly or indirectly, to dispose of the securities acquired from us.
| Percentage of shares | ||||||||||||||||||||
| Beneficial | Beneficial | beneficially owned | ||||||||||||||||||
| ownership | Shares to be sold in | ownership | ||||||||||||||||||
| prior to | the offering or | after the | Before the | After the | ||||||||||||||||
| Name | offering | repurchased | offering | offering | offering | |||||||||||||||
| Five percent stockholders: | ||||||||||||||||||||
Hellman & Friedman Capital Partners III, L.P.(1) | 42,410,769 | 62.36 | % | % | ||||||||||||||||
H&F Orchard Partners III, L.P.(1) | 3,117,278 | 4.58 | % | % | ||||||||||||||||
H&F International Partners III, L.P.(1)(20) | 929,144 | 1.37 | % | % | ||||||||||||||||
Anthony E. Bakker(2) | 9,694,532 | 14.25 | % | % | ||||||||||||||||
Directors and executive officers: | ||||||||||||||||||||
David R. Tunnell(3) | 46,457,191 | 68.30 | % | % | ||||||||||||||||
Robert J. Sywolski(4) | 5,638,791 | 7.66 | % | % | ||||||||||||||||
Paul V. Barber(5) | 3,330,265 | 4.90 | % | % | ||||||||||||||||
Louis J. Attanasi(6) | 843,189 | 1.23 | % | % | ||||||||||||||||
Timothy V. Williams(7) | 750,000 | 1.09 | % | % | ||||||||||||||||
| Percentage of shares | ||||||||||||||||||||
| Beneficial | Beneficial | beneficially owned | ||||||||||||||||||
| ownership | Shares | ownership | ||||||||||||||||||
| prior to | registered | after the | Before the | After the | ||||||||||||||||
| Name | the offering | to be sold | offering | offering | offering | |||||||||||||||
| Five percent stockholders: | ||||||||||||||||||||
Hellman & Friedman Capital Partners III, L.P.(1) | 26,506,731 | 7,928,292 | 18,578,439 | 62.30 | % | 43.66% | ||||||||||||||
H&F Orchard Partners III, L.P.(1) | 1,948,299 | 582,746 | 1,365,553 | 4.58 | % | 3.21% | ||||||||||||||
H&F International Partners III, L.P.(1) | 580,715 | 173,695 | 407,020 | 1.36 | % | * | ||||||||||||||
Directors and Executive Officers: | ||||||||||||||||||||
David R. Tunnell(2) | 29,035,745 | 8,684,733 | 20,351,012 | 68.24 | % | 47.83% | ||||||||||||||
Robert J. Sywolski(3) | 3,524,244 | 692,706 | 2,460,030 | (11) | 7.65 | % | 5.34% | |||||||||||||
Paul V. Barber(4) | 2,081,415 | 622,561 | 1,458,854 | 4.89 | % | 3.43% | ||||||||||||||
Timothy V. Williams(5) | 625,000 | 0 | 625,000 | 1.45 | % | 1.45% | ||||||||||||||
Louis J. Attanasi(6) | 384,170 | 0 | 384,170 | * | * | |||||||||||||||
Gerard J. Zink(7) | 333,679 | 0 | 333,679 | * | * | |||||||||||||||
Charles T. Cumbaa(5) | 250,000 | 0 | 250,000 | * | * | |||||||||||||||
Edward M. Roshitsh(5) | 250,000 | 0 | 250,000 | * | * | |||||||||||||||
75
| Percentage of shares | ||||||||||||||||||||
| Beneficial | Beneficial | beneficially owned | ||||||||||||||||||
| ownership | Shares to be sold in | ownership | ||||||||||||||||||
| prior to | the offering or | after the | Before the | After the | ||||||||||||||||
| Name | offering | repurchased | offering | offering | offering | |||||||||||||||
Gerard J. Zink(8) | 520,040 | * | * | |||||||||||||||||
Charles T. Cumbaa(7) | 350,000 | * | * | |||||||||||||||||
Edward M. Roshitsh(7) | 300,000 | * | * | |||||||||||||||||
Christopher R. Todd(7) | 254,741 | * | * | |||||||||||||||||
Germaine M. Ward(7) | 200,000 | * | * | |||||||||||||||||
Laura W. Kennedy(7) | 140,039 | * | * | |||||||||||||||||
Heidi H. Strenck(7) | 143,022 | * | * | |||||||||||||||||
Anthony J. Powell(7) | 126,070 | * | * | |||||||||||||||||
Andrew L. Howell(7) | 75,000 | * | * | |||||||||||||||||
Dr. Sandra J. Hernández(7) | 20,000 | * | * | |||||||||||||||||
Marco W. Hellman(9) | — | — | — | |||||||||||||||||
| Richard S. Braddock | — | — | — | |||||||||||||||||
| Andrew M. Leitch | — | — | — | |||||||||||||||||
| Larry E. Robbins | — | — | — | |||||||||||||||||
All executive officers and directors as a group (19 people)(10) | 59,173,348 | 77.02 | % | % | ||||||||||||||||
Other selling stockholders: | ||||||||||||||||||||
Gary F. Thornhill(11) | 2,423,633 | 3.56 | % | % | ||||||||||||||||
JMI Equity Fund IV, L.P.(12) | 2,339,629 | 3.44 | % | % | ||||||||||||||||
JMI Euro Equity Fund IV, L.P.(12) | 747,079 | 1.10 | % | % | ||||||||||||||||
JMI Equity Fund IV (A1), L.P.(12) | 185,277 | * | * | |||||||||||||||||
JMI Equity Side Fund, L.P.(13) | 58,280 | * | * | |||||||||||||||||
BT Investment Partners, Inc.(14) | 832,565 | 1.22 | % | % | ||||||||||||||||
Covestco-Insysco, LLC(15) | 832,565 | 1.22 | % | % | ||||||||||||||||
| Timothy B. Smith | 807,877 | 1.19 | % | % | ||||||||||||||||
John L. Thompson(16) | 646,303 | * | * | |||||||||||||||||
Nigel W. H. Cooper(17) | 646,302 | * | * | |||||||||||||||||
| Joseph J. Wezwick | 646,302 | * | * | |||||||||||||||||
Michael Catanzarite(18) | 303,172 | * | * | |||||||||||||||||
| Deborah Feldman | 239,115 | * | * | |||||||||||||||||
Squam Lake Investors IV, L.P.(19) | 166,514 | * | * | |||||||||||||||||
| Christian Bonacore | 161,576 | * | * | |||||||||||||||||
| Tarek Haus Heiba | 161,576 | * | * | |||||||||||||||||
| Percentage of shares | ||||||||||||||||||||
| Beneficial | Beneficial | beneficially owned | ||||||||||||||||||
| ownership | Shares | ownership | ||||||||||||||||||
| prior to | registered | after the | Before the | After the | ||||||||||||||||
| Name | the offering | to be sold | offering | offering | offering | |||||||||||||||
Christopher R. Todd(5) | 221,713 | 0 | 221,713 | * | * | |||||||||||||||
Germaine M. Ward(5) | 125,000 | 0 | 125,000 | * | * | |||||||||||||||
Heidi H. Strenck(5) | 112,297 | 0 | 112,297 | * | * | |||||||||||||||
Laura W. Kennedy(5) | 110,433 | 0 | 110,433 | * | * | |||||||||||||||
Anthony J. Powell(5) | 96,951 | 0 | 96,951 | * | * | |||||||||||||||
Richard S. Braddock(5) | 62,500 | 0 | 62,500 | * | * | |||||||||||||||
Andrew L. Howell(5) | 46,875 | 0 | 46,875 | * | * | |||||||||||||||
Dr. Sandra R. Hernandez(5) | 12,500 | 0 | 12,500 | * | * | |||||||||||||||
Andrew M. Leitch(5) | 4,425 | 0 | 4,425 | * | * | |||||||||||||||
Marco W. Hellman(8) | 0 | 0 | 0 | * | * | |||||||||||||||
All executive officers and directors as a group (18 people)(9) | 37,276,947 | 10,000,000 | 26,905,439 | 76.93 | % | 55.53% | ||||||||||||||
Other selling stockholders | ||||||||||||||||||||
JMI Equity Fund IV, L.P.(10) | 1,462,268 | 437,371 | 1,024,897 | 3.44 | % | 2.41% | ||||||||||||||
JMI Euro Equity Fund IV, L.P.(10) | 466,924 | 139,659 | 327,265 | 1.10 | % | * | ||||||||||||||
JMI Equity Fund IV (A1), L.P.(10) | 115,798 | 34,636 | 81,162 | * | * | |||||||||||||||
JMI Equity Side Fund, L.P.(10) | 36,425 | 10,895 | 25,530 | * | * | |||||||||||||||
* Less than 1%
(1) These shares are currently held by Pobeda Partners Ltd., but ownership will be distributed to its stockholders as specified herein prior to the completion of the offering.
| (1) | Hellman & Friedman Capital Partners III, L.P., H&F Orchard Partners III, L.P. and H&F International Partners III, L.P. are referred to as the “H&F Funds”. H&F Investors III is the sole general partner of the H&F Funds. Investment decisions for the H&F Funds with respect to the Blackbaud shares are made by the investment committee of H&F Investors III which is currently composed of Brian Powers, Warren Hellman, Thomas Steyer and Matthew Barger, each of whom disclaims beneficial ownership in the Blackbaud shares except to the extent of his pecuniary interest therein. Membership of the investment committee is subject to change from time to time. The address for each of the H&F Funds is One Maritime Plaza, 12th Floor, San Francisco, California 94111. | |
| (2) | Consists entirely of those shares held by the H&F Funds (see footnote 1). Mr. Tunnell serves as a managing director of Hellman & Friedman LLC and an officer of H&F Investors III. Mr. Tunnell disclaims beneficial ownership of these shares except to the extent of his indirect pecuniary interest therein. | |
| (3) | Consists solely of shares of common stock obtainable upon the exercise of stock options. Does not include shares held by JMI Associates IV, L.L.C., of which Mr. Sywolski is a member. | |
| (4) | Consists entirely of those shares held by the JMI Funds (see footnote 10), of which Mr. Barber serves as a general partner. Mr. Barber disclaims beneficial ownership of these shares except to the extent of his pecuniary interest therein. | |
| (5) | Consists solely of shares of common stock obtainable upon the exercise of stock options. | |
| (6) | Includes 50,078 shares held by the 1999 Attanasi Family Trust and 232,693 shares of common stock obtainable upon the exercise of stock options. | |
| (7) | Includes 232,693 shares of common stock obtainable upon the exercise of stock options. | |
| (8) | Excludes shares held by the H&F Funds, of which Mr. Hellman is a limited partner (see footnote 1). Mr. Hellman may be deemed to have an indirect pecuniary interest (within the meaning of Rule 16a-1 of the Exchange Act) in a portion of the shares beneficially owned by the H&F Funds. | |
| (9) | Includes the shares and shares underlying stock options specified in footnotes (2)–(7). |
| (10) | JMI Equity Fund IV, L.P., JMI Euro Equity Fund IV, L.P. and JMI Equity Fund IV (A1), L.P. are referred to as the “JMI Funds”. JMI Associates IV, LLC is the sole general partner of the JMI Funds. Investment decisions for the JMI Funds with respect to the Blackbaud shares are made by the investment committee of JMI Associates IV, LLC which is currently composed of Paul V. Barber, Harry S. Gruner, Bradford D. Woloson, Charles E. Noell, III, Peter C. Arrowsmith and Robert Smith, each of whom disclaims beneficial ownership in the Blackbaud shares except to the extent of his pecuniary interest therein. Membership of the investment committee is subject to change from time to time. The address for each of the JMI Funds is 6109 Paseo Laredo, La Jolla, California 92037. |
| (11) | This share number assumes that Mr. Sywolski cancels options to purchase 371,508 shares of common stock as payment, under a net exercise, for the exercise price of the options that would be necessary for Mr. Sywolski to exercise in order to sell all shares registered under this prospectus. The assumed value of the shares used for calculating this net exercise was $13.75, the closing price of our common stock on January 14, 2005, the last reported sales price prior filing this prospectus. We will receive no proceeds from the net exercise of these options. |
76
(2) Includes 3,205,002 shares held by each of the 1999 Bakker EF Trust, the Anthony E. Bakker 1999 Retained Annuity Trust-TB and the Anthony E. Bakker 1999 Retained Annuity Trust-LC, of which the beneficiaries are Mr. Bakker’s children and Mr. Bakker retains investment control. Mr. Bakker disclaims beneficial ownership of the shares held by the 1999 Bakker EF Trust except to the extent of his pecuniary interest therein.
(3) Consists entirely of those shares held by the H&F Funds (see footnote 1). Mr. Tunnell serves as a managing director of Hellman & Friedman LLC. Mr. Tunnell disclaims beneficial ownership of these shares except to the extent of his indirect pecuniary interest therein.
(4) Consists solely of shares of common stock obtainable upon the exercise of stock options. Does not include shares held by JMI Associates IV, L.L.C., of which Mr. Sywolski is a member.
(5) Consists entirely of those shares held by JMI Equity Fund IV, L.P. and its affiliates of which Mr. Barber serves as a general partner. Mr. Barber disclaims beneficial ownership of these shares except to the extent of his pecuniary interest therein.
(6) Includes 160,249 shares held by the Louis J. Attanasi 1999 Retained Annuity Trust and 358,463 shares of common stock obtainable upon the exercise of stock options.
(7) Consists solely of shares of common stock obtainable upon the exercise of stock options.
(8) Includes 358,463 shares of common stock obtainable upon the exercise of stock options.
(9) Excludes shares held by the H&F Funds, of which Mr. Hellman is a limited partner (see footnote 1). Mr. Hellman may be deemed to have an indirect pecuniary interest (within the meaning of Rule 16a-1 of the Exchange Act) in a portion of the shares beneficially owned by the H&F Funds.
(10) Includes the shares and shares underlying stock options specified in footnotes (3)–(8).
(11) Includes 1,201,876 shares held by the Gary F. Thornhill 1999 Retained Annuity Trust.
(12) These shares are currently held by Pobeda Partners Ltd., but ownership will be distributed to its stockholders as specified herein prior to the completion of the offering. JMI Equity Fund IV, L.P., JMI Euro Equity Fund IV, L.P. and JMI Equity Fund IV (A1), L.P. are referred to as the “JMI Funds”. JMI Associates IV, LLC is the sole general partner of the JMI Funds. Investment decisions for the JMI Funds with respect to the Blackbaud shares are made by the investment committee of JMI Associates IV, LLC which is currently composed of Paul V. Barber, Harry S. Gruner, Bradford D. Woloson, Charles E. Noell, III, Peter C. Arrowsmith and Robert Smith, each of whom disclaims beneficial ownership in the Blackbaud shares except to the extent of his pecuniary interest therein. Membership of the investment committee is subject to change from time to time. The address for each of the JMI Funds is 6109 Paseo Laredo, La Jolla, California 92037.
(13) These shares are currently held by Pobeda Partners Ltd., but ownership will be distributed to its stockholders as specified herein prior to the completion of the offering. Investment decisions for JMI Equity Side Fund IV (AI), L.P. with respect to the Blackbaud shares are made by Charles E. Noell, III, Paul V. Barber and Bradford D. Woloson, each of whom disclaims beneficial ownership in the Blackbaud shares except to the extent of his pecuniary interest therein. The address for JMI Equity Side Fund IV (AI), L.P. is 6109 Paseo Laredo, La Jolla, California 92037.
(14) These shares are currently held by Pobeda Partners Ltd., but ownership will be distributed to its stockholders as specified herein prior to the completion of the offering. BT Investment Partners, Inc. is a subsidiary of Deutsche Bank AG. Deutsche Bank AG has voting and dispositive authority over the shares of Blackbaud held by BT Investment Partners, Inc. BT Investment Partners, Inc. is an affiliate of Deutsche Bank Securities, Inc., Scudder Distributors, Inc. and Scudder Investor Services, Inc., each of which is a registered broker dealer that is not affiliated with the underwriters. BT Investment Partners, Inc. has represented to us that it acquired the shares of our stock owned by it in the ordinary course of business and that at the time of acquisition, it had no agreements, understandings or arrangements with any other persons, either directly or indirectly, to dispose of such shares. The address for BT Investment Partners, Inc. is c/o DB Corporate Investments 345 Park Avenue, 16th Floor, New York, New York 10154.
(15) These shares are currently held by Pobeda Partners Ltd., but ownership will be distributed to its stockholders as specified herein prior to the completion of the offering. Venteura Limited is the Managing Member of Covestco-Insysco LLC. Investment decisions for Covestco-Insysco, LLC with respect to the Blackbaud shares are made by the directors of Venteura Limited, currently Albin Johann, Anton Lotzer and Prince Eugen von Liechtenstein, each of whom disclaims beneficial ownership in the Blackbaud shares except to the extent of his pecuniary interest therein. The address for Covestco-Insysco, LLC is c/o Venteura Limited, Postfach 130, Landstrasse II, FL-9495 Triessen, Liechtenstein.
(16) Includes 320,501 shares held by the John L. Thompson 1999 Retained Annuity Trust.
(17) Includes 160,249 shares held by the Nigel W. H. Cooper 1999 Retained Annuity Trust.
(18) Includes 141,596 shares obtainable upon exercise of stock options.
(19) These shares are currently held by Pobeda Partners Ltd., but ownership will be distributed to its stockholders as specified herein prior to the completion of the offering. GPI, Inc. is the Managing General Partner of Squam Lake Investors IV, L.P. GPI, Inc., through its two-member board of directors, has voting and dispositive authority over the shares held by Squam Lake Investors IV, L.P. Stephen Schaubert and Christopher Zook are the directors of GPI, Inc., and each disclaims beneficial ownership of the shares held by Squam Lake Investors IV, L.P., except to the extent of their indirect interest therein. The address for Squam Lake Investors IV, L.P. is 131 Dartmouth Street, Boston, Massachusetts 02116.
Registration rights
As of December 31, 2003,September 30, 2004, the holders of approximately 67,854,19531,117,146 shares of our common stock were entitled to rights with respect to the registration of such shares under the Securities Act
77
In addition, PobedaHellman & Friedman Capital Partners Ltd.,III, L.P. and its affiliates,affiliated funds are entitled to four demand registration rights, pursuant to which they may require us at any time after 180 days following the completion of thisour initial public offering on July 27, 2004, to file a registration statement under the Securities Act of 1933 including, if requested by the holder, on Form S-3, at our expense with respect to their registrable securities having an anticipated net aggregate price (after deducting underwriting commissions and offering expenses) of at least $5 million, and we are required to use our reasonable best efforts to effect such registration as soon as practicable after such request. Further, holders of such registrable securities may require us to file one additional registration statement on Form S-3 covering registrable securities having an aggregate price to the public of at least $500,000 at our expense. Prior to completion of the offering, Pobeda Partners Ltd.’s demand rights will be assigned by Pobeda Partners Ltd. to Hellman & Friedman Capital Partners III, L.P. and its affiliated funds. Under certain circumstances, the holders initiating their demand rights described in this paragraph may request an underwritten offering. Holders of registrable securities also have the right to include registrable securities in any future registration of our securities, other than registrations relating solely to employee benefit plans, registrations made on Form S-4 or Form S-8, registrations pursuant to which we are offering to exchange our own securities, or registrations relating solely to dividend reinvestment or similar plans.
All of the registration rights described above terminate with respect to any stockholder holding registration rights after the later of two years following the consummation of our initial public offeringJuly 27, 2006 or the date on which such holder is able to dispose of all of his, her or its shares of our common stock having registration rights in a 90-day period pursuant to Rule 144 promulgated by the SEC. In addition, common stock ceases to be considered registrable securities when such common stock may be sold pursuant to Rule 144. These registration rights are also subject to certain conditions and limitations, including the right of the underwriters of an offering to limit the number of shares included in such registration and our right not to effect a requested registration within 180 days following the effective date of an offering of our securities pursuant to Form S-1, including the offering made by this prospectus.S-1.
We granted our Chief Executive Officer, Robert J. Sywolski, the right to include shares issued upon exercise of his stock option in any future registration of our securities, other than registrations relating solely to employee benefit plans, registrations made on Form S-4 or Form S-8, registrations pursuant to which we are offering to exchange our own securities, or registrations relating solely to dividend reinvestment or similar plans. These registration rights terminate after the later of five years following the consummation of our initial public offeringJuly 27, 2009 or the date on which Mr. Sywolski is able to dispose of all of his shares of our common stock
7877
7978
Certain relationships and related transactions
We describe below some of the transactions we have entered into with one or more of the selling stockholders. In addition, certain relationships and related transactions with respect to the selling stockholders and the underwriters are set forth in “Underwriting”“Principal and selling stockholders — Registration rights” beginning on page 92.
Lease agreement
We entered into a lease agreement dated as of October 13, 1999 with Duck Pond Creek, LLC to lease the space for our headquarters in Charleston, South Carolina. Duck Pond Creek is a South Carolina limited liability company, 60% of which is owned by Anthony E. Bakker, a stockholder who beneficially ownsowned approximately 14% of our capital stock prior to thisour initial public offering in July 2004, and 4% of which is owned by each of Louis J. Attanasi and Gerard J. Zink, two of our named executive officers. Under this lease, we made payments to Duck Pond Creek totaling approximately $4.3 million in 2001, 2002, 2003 and 2003.2004. The term of the lease is for 10 years with two five-year renewal options. The current annual base rent of the lease is approximately $4.3 million. The base rate escalates annually at a rate equal to the change in the consumer price index, as defined in the agreement. Based on publicly-available survey data on office space rental rates in our area at the time we entered into the lease, we believe that this lease agreement is on terms at least as favorable to us as could have been obtained from an unaffiliated third party.
Naming rights agreement
We are party to a trademark license and promotional agreement dated as of October 13, 1999 with Charleston Battery, Inc., pursuant to which we pay to Charleston Battery, Inc. an annual fee for the naming rights to a stadium located in Charleston, South Carolina named “Blackbaud Stadium”. Charleston Battery is principally owned by Anthony E. Bakker, a stockholder who beneficially ownsowned approximately 14% of our capital stock prior to this offering.our initial public offering in July 2004. Under this agreement, we made payments to Charleston Battery of $200,000 in each of 2001, 2002, 2003 and 2003.2004. This agreement is scheduled to terminate in October 2009. While we did not evaluate fees payable for naming rights to similarly sized stadiums in comparable markets, if any, we believe that the terms of this agreement are at least as favorable to us as could have been obtained from an unaffiliated third party.
Stock purchase agreement
We entered into a common stock purchase agreement dated as of June 1, 2001 with certain of our stockholders, pursuant to which such stockholders purchased an aggregate of 3,333,3342,083,334 shares of our common stock at $3.00$4.80 per share. In this transaction, certain trusts established by Anthony E. Bakker, a stockholder who beneficially ownsowned approximately 14% of our capital stock prior to thisour initial public offering in July 2004, acquired 2,000,0011,250,001 shares of our common stock, and Louis J. Attanasi and Gerard J. Zink, two of our named executive officers, acquired 100,00062,500 and 33,33420,834 shares of our common stock, respectively.
Share repurchase agreement
Under our investor rights agreement, Mr. Bakker, who currently holds approximately 14% of our outstanding stock, has registration rights with respect to the shares to be repurchased under the share repurchase agreement described in this paragraph. In lieu of registration, we intend to enter into a share repurchase agreement with Mr. Bakker at the same net price per
80
The share repurchase agreement provides that the repurchase, if consummated, is contingent upon the simultaneous consummation of this offering and the shares repurchased will be cancelled thereafter, reducing dilution to stockholders. In addition, the share repurchase agreement confirms that Mr. Bakker will no longer have any registration rights after the repurchase and requires him to indemnify us for any losses, claims, damages or liabilities to which we become subject insofar as they arise out of, or are based on, statements provided to us by Mr. Bakker expressly for use in this prospectus pursuant to Items 403 and 507 of Regulation S-K.
The shares to be repurchased are being valued at the same price as the shares offered to you hereunder. They are of the same class of common stock as the shares we are offering and carry with them the same rights and preferences. Under our investor rights agreement, Mr. Bakker has registration rights with respect to the shares to be repurchased. The net proceeds to Mr. Bakker from the share repurchase are identical to the net proceeds he would have received had the shares been registered for sale to you in this offering.
After consultation with our advisors and accountants, our board of directors carefully considered the possible economic and legal consequences to us of the proposed share repurchase, including the advantages to stockholders of reduced dilution. The board unanimously determined that a share repurchase at a repurchase price equal to the price offered to you less the underwriting discounts would be in the best interests of Blackbaud and its stockholders.
Our board of directors includes one director who is a member of our management, one director who is affiliated with our largest stockholder, Hellman & Friedman, and five directors who are fully independent. See “Management — Board Composition”. None of our directors are affiliated with Mr. Bakker. Regardless of their affiliation, all of our directors have fiduciary duties under Delaware corporate law. Accordingly, to carry out its fiduciary duty, our board of directors consults its advisors and carefully considers various factors in approving any transaction that we might enter into.
8179
Description of capital stock
On the closing of this offering, underUnder our certificate of incorporation, our authorized capital stock will consistconsists of 180,000,000 shares of common stock, par value $0.001 per share, and 20,000,000 shares of preferred stock, par value $0.001 per share. As of MayDecember 31, 2004, there were 68,014,57142,549,056 shares of common stock outstanding that were held of record by 2035 stockholders. OnAs of the closingdate of this offering,prospectus, no shares of preferred stock will be outstanding. Our board of directors may fix the relative rights and preferences of each series of preferred stock in a resolution of the board of directors.
Common stock
Voting rights
The holders of common stock are entitled to one vote per share on all matters to be voted on by the stockholders, and there are no cumulative voting rights. Generally, all matters to be voted on by stockholders must be approved by a majority (or, in the case of election of directors, by a plurality) of the votes entitled to be cast by all shares of common stock present in person or represented by proxy, subject to any voting rights granted to holders of any preferred stock.
Dividends
The holders of common stock are entitled to receive ratable dividends, if any, payable in cash, in stock or otherwise if, as and when declared from time to time by the board of directors out of funds legally available for the payment of dividends, subject to any preferential rights that may be applicable to any outstanding preferred stock.
Other rights
In the event of a liquidation, dissolution, or winding up of our company, after payment in full of all outstanding debts and other liabilities, the holders of common stock are entitled to share ratably in all remaining assets, subject to prior distribution rights of preferred stock, if any, then outstanding. No shares of common stock have preemptive rights or other subscription rights to purchase additional shares of common stock. There are no redemption or sinking fund provisions applicable to the common stock. All outstanding shares of common stock are fully paid and nonassessable, and the shares of common stock to be issued on completion of this offering will be fully paid and nonassessable. The rights, preferences and privileges of holders of common stock will be subject to, and may be adversely affected by, the rights of holders of any preferred stock that may be issued in the future. All shares of common stock which are acquired by us shall be available for reissuance by us at any time.
Preferred stock
OnAs of the closingdate of this offering,prospectus, no shares of preferred stock will be outstanding. Our board of directors has the authority to issue up to an aggregate of 20,000,000 shares of preferred stock in one or more classes or series and to determine, with respect to any such class or series, the designations, powers, preferences and rights of such class or series, and the qualifications, limitations and restrictions thereof, including dividend rights, dividend rates, conversion rights, voting rights, terms of redemption (including sinking fund provisions), redemption prices, liquidation preferences and the number of shares constituting any class or series or the designation of such class or series, without further vote or action by the stockholders. The
82
80
The voting and other rights of the holders of common stock will be subject to, and may be adversely affected by, the rights of holders of any preferred stock that may be issued in the future.
Anti-takeover effects of Delaware law and provisions of our certificate of incorporation and bylaws
Certain of the provisions of Delaware law and our certificate of incorporation and bylaws discussed below may have the effect of making more difficult or discouraging a tender offer, proxy contest or other takeover attempt. Those provisions, summarized below, include a classified board of directors with staggered terms and requirements for advance notice of actions proposed by stockholders for consideration at meetings of the stockholders. These provisions are expected to encourage persons seeking to acquire control of our company to first negotiate with our board of directors. We believe that the benefits of increasing our ability to negotiate with the proponent of an unfriendly or unsolicited proposal to acquire or restructure our company outweigh the disadvantages of discouraging these proposals because negotiation of these proposals could result in an improvement of their terms.
Delaware anti-takeover law
We are subject to Section 203 of the Delaware General Corporation Law, an anti-takeover law. In general, Section 203 prohibits a publicly held Delaware corporation from engaging in a “business combination” with an “interested stockholder” for a period of three years following the date the person became an interested stockholder, unless:
| • | the board of directors approves the transaction in which the stockholder became an interested stockholder prior to the date the interested stockholder attained that status; |
| • | when the stockholder became an interested stockholder, he or she owned at least 85% of the voting stock of the corporation outstanding at the time the transaction commenced, excluding shares owned by persons who are directors and also officers and certain shares owned by employee benefits plans; or |
| • | on or subsequent to the date the business combination is approved by the board of directors, the business combination is authorized by the affirmative vote of at least 66 2/3% of the voting stock of the corporation at an annual or special meeting of stockholders. |
Generally, a “business combination” includes a merger, asset or stock sale, or other transaction resulting in a financial benefit to the interested stockholder. Generally, an “interested
83
81
Our certificate of incorporation provides that Hellman & Friedman Capital Partners III, L.P., H&F Orchard Partners III, L.P., H&F International Partners III, L.P., or any successor to all or substantially all of their assets, or any affiliate thereof, or any person or entity to which any of the foregoing stockholders transfers shares of our voting stock in a transaction other than an underwritten, broadly distributed public offering, regardless of the total percentage of our voting stock owned by such stockholder or such person or entity, shall not be deemed an “interested stockholder” for purposes of Section 203 of the Delaware General Corporation Law.
The existence of this provision would be expected to have an anti-takeover effect with respect to transactions not approved in advance by our board of directors, including discouraging attempts that might result in a premium over the market price for the shares of our common stock.
Certificate of incorporation and bylaws provisions
Classified board of directors. Our board of directors is divided into three classes of directors, as nearly equal in number as possible, with each class serving a staggered term of three years. Any vacancy on the board of directors, regardless of the reason for the vacancy, may be filled by vote of the majority of the directors then in office, except in the case of a vacancy caused by action of our stockholders, which vacancy may only be filled by our stockholders. Directors may be removed from office at any time with or without cause, but only by the holders of a majority of the shares entitled to vote at an election of directors. The classification of directors will have the effect of making it more difficult for stockholders to change the composition of our board of directors and could also discourage a third-party from making a tender offer or otherwise attempting to obtain control of our company and may maintain the incumbency of our board of directors, as the classification of the board of directors generally increases the difficulty of replacing a majority of the directors.
Advance notice requirement for stockholder proposals.Our bylaws contain an advance notice procedure for stockholders proposals to be brought before a meeting of stockholders, including any proposed nominations of persons for election to our board of directors. Stockholders at a meeting may only consider proposals or nominations specified in the notice of meeting or brought before the meeting by or at the direction of our board of directors or by a stockholder who was a stockholder of record on the record date for the meeting, who is entitled to vote at the meeting, who has given to our secretary timely written notice, in proper form, of the stockholder’s intention to bring that business before the meeting, and who has otherwise complied with our bylaws. Although the bylaws do not give our board of directors the power to approve or disapprove stockholder nominations of candidates for election to our board of directors or proposals regarding other business to be conducted at a special or annual meeting of the stockholders, the bylaws may have the effect of precluding the conduct of business at a meeting if the proper procedures are not followed or may discourage or deter a potential acquiror from conducting a solicitation of proxies to elect its own slate of directors or otherwise attempting to obtain control of our company. By requiring advance notice of other proposed business, the stockholder advance notice procedure will also provide a more orderly procedure for conducting annual meeting of stockholders and, to the extent deemed necessary or desirable by the board of directors, will provide the board of directors with an opportunity to inform stockholders, prior to such meetings, of any business proposed to be conducted at
84
82
Transfer agent and registrar
The transfer agent and registrar for the common stock is Wachovia Bank, N.A., and its telephone number is (800) 829-8432.
85
Shares eligible for future sale
Prior to this offering, there has been no public market for our common stock. Future sales of our common stock in the public market, or the availability of such shares for sale in the public market, could adversely affect market prices prevailing from time to time. As described below, only a limited number of shares will be available for sale shortly after this offering due to contractual and legal restrictions on resale. Nevertheless, sales of our common stock in the public market after such restrictions lapse, or the perception that those sales may occur, could adversely affect the prevailing market price at such time and our ability to raise equity capital in the future.
Sale of restricted shares
Upon the closing of this offering and the proposed simultaneous repurchase by us of shares from Anthony E. Bakker, we will have outstanding an aggregate of approximately shares of common stock. Of these shares, the shares of common stock to be sold in this offering will be freely tradable without restriction or further registration under the Securities Act, unless the shares are held by any of our “affiliates” as such term is defined in Rule 144 of the Securities Act. All remaining shares held by our existing stockholders were issued and sold by us in private transactions and are eligible for public sale only if registered under the Securities Act or if they qualify for an exemption from registration under Rule 144 or Rule 701 under the Securities Act, which rules are summarized below.
As a result of the lock-up agreements described below and the provisions of Rule 144, Rule 144(k) and Rule 701 under the Securities Act, the shares of our common stock (excluding the shares sold in this offering) will be available for sale in the public market as follows:
The remaining shares held by existing stockholders will become eligible for sale at various times on or before , 200 .
Lock-up agreements
An aggregate of shares outstanding as of , 2004, representing over % of our outstanding shares, will be subject to “lock-up” agreements on the effective date of this offering. Our executive officers and directors and certain other existing stockholders have agreed with the underwriters not to sell or otherwise dispose of any of their shares for a period of 180 days after the date of this prospectus. J.P. Morgan Securities Inc. on behalf of the underwriters may, however, in its sole discretion and without notice, release all or any portion of the shares from the restrictions in these lock-up agreements. To the extent that any of our stockholders have not entered into lock-up agreements with the underwriters, substantially all of these stockholders are subject to separate lock-up agreements with us, which agreements provide that these stockholders may not sell their shares for 180 days after the date of this prospectus. We have agreed with the underwriters not to release any of these
86
Rule 144
In general, under Rule 144 as currently in effect, beginning 90 days after the date of this prospectus, a person who has beneficially owned shares of our common stock for at least one year would be entitled to sell in “broker’s transactions” or to market makers, within any three-month period, a number of shares that does not exceed the greater of:
Sales under Rule 144 are generally subject to the availability of current public information about us.
Based upon the number of shares outstanding at , 2004 after giving effect to our proposed repurchase, simultaneous with this offering, of shares of our common stock from Anthony E. Bakker, an aggregate of approximately shares of our common stock will be eligible to be sold pursuant to Rule 144, subject to the volume restrictions described above, beginning 90 days after the date of this prospectus. However, all but of such shares are subject to the lock-up agreements described above and will only become eligible for sale upon the expiration or termination of such agreements, generally 180 days after the date of this prospectus.
Rule 144(k)
Under Rule 144(k), a person who is not deemed to have been an affiliate of us at any time during the 90 days preceding a sale, and who has beneficially owned the shares proposed to be sold for at least two years, is entitled to sell shares without having to comply with the manner of sale, public information, volume limitation or notice filing provisions of Rule 144. Therefore, unless otherwise restricted, “144(k) shares” may be sold immediately upon the completion of this offering. Based upon the number of shares outstanding at , 2004 after giving effect to our proposed repurchase, simultaneous with this offering, of shares of our common stock from Anthony E. Bakker, an aggregate of approximately shares of our common stock will be eligible to be sold pursuant to Rule 144(k) after the date of this prospectus. However, all but of such shares are subject to the lock-up agreements described above and will only become eligible for sale upon the expiration or termination of such agreements.
Rule 701
Under Rule 701, certain of our employees, directors, officers, consultants or advisors who acquire shares from us in connection with a compensatory stock or option plan or other written agreement before the effective date of this offering are entitled to sell shares 90 days after the effective date of this offering in reliance on Rule 144, without having to comply with the holding period and notice filing requirements of Rule 144 and, in the case of non-affiliates,
87
The SEC has indicated that Rule 701 will apply to typical stock options granted by an issuer before it becomes subject to the reporting requirements of the Securities Exchange Act of 1934 along with the shares acquired upon exercise of the options (including exercises after the date of this prospectus). Securities issued in reliance on Rule 701 are restricted securities and, subject to the contractual restrictions described above, beginning 90 days after the date of this prospectus, may be sold by persons other than “affiliates” (as defined in Rule 144) subject only to the manner of sale provisions of Rule 144 and by “affiliates” under Rule 144 without compliance with its one-year minimum holding period requirements.
Based upon the number of shares outstanding at , 2004 after giving effect to our proposed repurchase, simultaneous with this offering, of shares of our common stock from Anthony E. Bakker, an aggregate of approximately shares of our common stock which are outstanding as of , 2004 and approximately shares of our common stock that may be acquired upon exercise of options outstanding as of , 2004 will be eligible to be sold pursuant to Rule 701 beginning 90 days after the date of this prospectus, subject to the vesting provisions that may be contained in individual option agreements. However, all of such shares are subject to the lock-up agreements described above and will only become eligible for sale upon the expiration or termination of such agreements.
8883
U.S. federal tax considerations for
The following is a summary of the material U.S. federal income tax considerations for non-U.S. holders of our common stock and is based upon current provisions of the Internal Revenue Code of 1986, as amended (which we refer to as the “Code”), Treasury regulations thereunder, existing rulings of the Internal Revenue Service (which we refer to as the “IRS”) and judicial decisions, all of which are subject to change. Any such change could apply retroactively and could adversely affect the consequences described below.
As used in this summary, a “U.S. Person” is:
| • | an individual who is a citizen of the United States or who is resident in the United States for U.S. federal income tax purposes; |
| • | a corporation, or other entity taxable as a corporation, that is created or organized under the laws of the United States or any political subdivision thereof; |
| • | a partnership, or other entity taxable as a partnership, that (1) is created or organized under the laws of the United States or any political subdivision thereof, and (2) is not treated as a foreign partnership under applicable Treasury regulations; |
| • | an estate the income of which is subject to U.S. federal income taxation regardless of its source; or |
| • | a trust (1) that is subject to the primary supervision of a court within the United States and for which one or more U.S. persons (as described in Section 7701(a)(30) of the Code) have the authority to control all of the substantial decisions, or (2) that was treated as a domestic trust on August 19, 1996, and has a valid election in effect under applicable Treasury regulations to be treated as a U.S. person. |
As used in this summary, a “non-U.S. Holder” is any person who is a beneficial owner of shares of our common stock and who is not a U.S. Person.
This summary does not discuss U.S. federal tax consequences to U.S. holders. It also does not discuss all U.S. federal income tax considerations that may be relevant to non-U.S. Holders in light of their particular circumstances or that may be relevant to certain holders that are subject to special treatment under U.S. federal income tax law (for example, insurance companies, tax-exempt organizations, financial institutions, dealers in securities, persons who hold shares as part of a straddle, hedging, constructive sale, or conversion transaction and persons who acquire shares through exercise of employee stock options or otherwise as compensation for services). This summary does not address certain special rules that apply to non-U.S. Holders that are “controlled foreign corporations,” “foreign personal holding companies,” “passive foreign investment companies” or corporations that accumulate earnings to avoid U.S. federal income tax. Furthermore, this summary does not address any aspects of state, local or foreign taxation. This summary is limited to those persons that hold shares of our common stock as “capital assets” within the meaning of Section 1221 of the Code. In the case of any non-U.S. Holder who is an individual, the following discussion assumes that this individual was not formerly a U.S. citizen, and was not formerly a resident of the United States for U.S. federal income tax purposes.
8984
If a partnership holds our common stock, the tax treatment of a partner will generally depend upon the status of the partner and the activities of the partnership. If you are a partner of a partnership holding our common stock, you should consult your tax advisor.
This summary is included for general information only. Potential investors should consult their own tax advisors with respect to their particular circumstances.
Dividends on shares
A dividend received by a non-U.S. Holder (including a payment received in a redemption that does not qualify as an “exchange” under Section 302(b) of the Code) on shares of our common stock will be subject to withholding of U.S. federal income tax at a rate of 30% (or such lower rate as may be specified by an applicable income tax treaty), unless the dividend income is effectively connected with a U.S. trade or business conducted by the Non-U.S. Holder (and the non-U.S. Holder provides us with a properly executed IRS Form W-8ECI certifying such fact). This withholding applies even if the non-U.S. Holder has furnished the certification required to avoid backup withholding (see “Backup Withholding and Information Reporting” below) with respect to the dividend. Any dividend that is effectively connected with a U.S. trade or business conducted by the non-U.S. Holder will be subject to U.S. federal income tax at normal graduated rates (and if the non-U.S. Holder is a corporation, the dividend may also be subject to an additional branch profits tax). In order to claim treaty benefits (such as a reduction in the rate of U.S. withholding tax), the non-U.S. Holder must deliver to us a properly executed IRS Form W-8BEN or Form W-8IMY prior to the dividend payment. If the non-U.S. Holder is an entity that is classified for U.S. federal income tax purposes as a partnership, then unless the partnership has entered into a withholding agreement with the IRS, the partnership will be required, in addition to providing an IRS Form W-8IMY, to attach an appropriate certification by each partner, and to attach a statement allocating the dividend income among the various partners.
If you are eligible for a reduced rate of U.S. withholding tax pursuant to an income tax treaty, then you may obtain a refund of any excess amounts withheld by filing an appropriate claim for refund with the IRS.
Sale of shares
Any gain or loss recognized by a non-U.S. Holder upon a sale of shares (including a redemption that qualifies as an “exchange” under Section 302(b) of the Code) will be a capital gain or loss. Any such capital gain will not be subject to U.S. federal income tax, unless: (1) the gain is effectively connected with a U.S. trade or business conducted by the non-U.S. Holder; (2) the non-U.S. Holder is an individual who is present in the United States for 183 days or more in the taxable year of the sale and certain other conditions are met; or (3) we are, or have been during certain periods preceding the disposition, a “United States real property holding corporation” and either our shares are not regularly traded on an established securities market or you have owned more than 5% of our common stock at any time during a specified period. If you are described in clause (1), you will be subject to tax on the gain derived from the sale under regular graduated U.S. federal income tax rates and, if you are a foreign corporation, you may also be subject to a branch profits tax equal to 30% of your effectively connected earnings and profits or at such lower rate as may be specified by an applicable income tax treaty. If you are described in clause (2), you will be subject to a flat 30% tax on gain derived from the sale, which may be offset by U.S. source capital losses (even though you are not
9085
Backup withholding and information reporting
We must report annually to the IRS and to each non-U.S. Holder the amount of dividends paid to a non-U.S. Holder and the tax withheld (if any). This information may also be made available to the tax authorities in the non-U.S. Holder’s country of residence. A Non-U.S. Holder will not be subject to backup withholding on dividends on our shares if the owner of the shares certifies under penalties of perjury that it is not a U.S. Person (such certification may be made on an IRS Form W-8BEN), or otherwise establishes an exemption. If a Non-U.S. Holder sells shares through a U.S. office of a U.S. or foreign broker, the payment of the sale proceeds by the broker will be subject to information reporting and backup withholding, unless the owner of the shares provides the certification described above (and the payor does not have actual knowledge or reason to know that the beneficial owner is a U.S. Person) or otherwise establishes an exemption. If a non-U.S. Holder sells shares through a foreign office of a broker, backup withholding is not required. Information reporting is required if (i) the broker does not have documentary evidence that the holder is not a U.S. Person, and (ii) the broker is a U.S. Person or has certain other connections to the United States.
Amounts withheld from a non-U.S. Holder under the backup withholding rules are generally allowable as a credit against the U.S. federal income tax liability (if any) of the non-U.S. Holder, and the non-U.S. Holder may obtain a refund of any amounts withheld that exceed the non-U.S. Holder’s actual U.S. federal income tax liability, provided that the required information is furnished to the IRS.
U.S. estate tax
Any shares of our common stock that are held by an individual who is not a citizen of the United States and who is not domiciled in the United States at the time of his or her death generally will be treated as U.S.-situs assets for U.S. federal estate tax purposes and will be subject to U.S. federal estate tax, except as may otherwise be provided by an applicable estate tax treaty between the United States and the decedent’s country of residence.
The preceding discussion of the material federal income tax consequences of the ownership and disposition of our common stock is for general information only and is not tax advice. Accordingly, you should consult your own tax advisor as to the particular tax consequences to you of purchasing, holding and disposing of our common stock, including the applicability and effect of state, local or foreign tax laws, and of any proposed changes in applicable law.
9186
UnderwritingPlan of distribution
J.P. Morgan Securities Inc. and Banc of America Securities LLCWe are acting as joint book-running managers for this offering. Thomas Weisel Partners LLC and Wachovia Capital Markets, LLC are acting as co-managers for this offering.
We, our selling stockholders and the underwriters named below have entered into an underwriting agreement covering the common stock to be sold in this offering. The selling stockholders are selling all of the common shares pursuant to this offering. Each underwriter has agreed to purchase the number of shares of common stock set forth opposite its name in the following table:
The underwriting agreement provides that if the underwriters take any of the shares presented in the table above, then they must take all of these shares. No underwriter is obligated to take any shares allocated to a defaulting underwriter except under limited circumstances. The underwriting agreement provides that the obligations of the underwriters are subject to certain conditions precedent, including the absence of any material adverse change in our business and the receipt of certificates, opinions and letters from us, our counsel and our independent auditors.
The underwriters are offeringregistering the shares of common stock subject to the prior salefor resale on behalf of shares, and when, as and if such shares are delivered to and accepted by them. The underwriters will initially offer to sell shares to the public at the initial public offering price shown on the front cover page of this prospectus. The underwriters may sell shares to securities dealers at a discount of up to $ per share from the initial public offering price. Any such securities dealers may resell shares to certain other brokers or dealers at a discount of up to $ per share from the initial public offering price. After the initial public offering, the underwriters may vary the public offering price and other selling terms.
If the underwriters sell more shares than the total number shown in the table above, the underwriters have the option to buy up to an additional shares of common stock from the selling stockholders to cover such sales. They may exercise this option during the 30-day periodstockholders. As used herein, “selling stockholders” includes donees, pledgees, transferees or other successors in interest selling securities received from a selling stockholder after the date of this prospectus. If any shares are purchased with this option, the underwritersWe will purchase the shares in approximately the same proportion as shown in the table above.
We have indicated to the underwriters an intention to purchase, simultaneously with this underwritten offering, shares of our common stock directlyreceive no proceeds from Anthony E. Bakker in a private, non-underwritten transaction at the net per share price to be received by the selling stockholders in this underwritten offering. The repurchase, if consummated, is contingent upon the simultaneous consummation of this underwritten offering.
92
Underwriting discounts and commissions
The following table shows the per share and total underwriting discounts and commissions that the selling stockholders will pay to the underwriters. These amounts are shown assuming both no exercise and full exercise of the underwriters’ option to purchase additional shares.
We estimate that the total expenses of this offering, excluding discounts and commissions, will be approximately $ , which includes legal, accounting and printing costs and various other fees associated with registration and listing of our common stock.
The underwriters have advised us that they may make short sales of our common stock in connection with this offering, resulting in the sale by the underwriters of a greater number of shares than they are required to purchase pursuant to the underwriting agreement. The short position resulting from those short sales will be deemed a “covered” short position to the extent that it does not exceed the shares subject to the underwriters’ overallotment option and will be deemed a “naked” short position to the extent that it exceeds that number. A naked short position is more likely to be created if the underwriters are concerned that there may be downward pressure on the trading price of the common stock in the open market that could adversely affect investors who purchase shares in this offering. The underwriters may reduce or close out their covered short position either by exercising the overallotment option or by purchasing shares in the open market. In determining which of these alternatives to pursue, the underwriters will consider the price at which shares are available for purchase in the open market as compared to the price at which they may purchase shares through the overallotment option. Any “naked” short position will be closed out by purchasing shares in the open market. Similar to the other stabilizing transactions described below, open market purchases made by the underwriters to cover all or a portion of their short position may have the effect of preventing or retarding a decline in the market price of our common stock following this offering. As a result, our common stock may trade at a price that is higher than the price that otherwise might prevail in the open market.
The underwriters have advised us that, pursuant to Regulation M under the Securities Act of 1933, they may engage in transactions, including stabilizing bids or the imposition of penalty bids, that may have the effect of stabilizing or maintaining the market price of the shares of common stock at a level above that which might otherwise prevail in the open market. A “stabilizing bid” is a bid for or the purchase of shares of common stock on behalf of the underwriters for the purpose of fixing or maintaining the price of the common stock. A “penalty bid” is an arrangement permitting the underwriters to claim the selling concession otherwise accruing to an underwriter or syndicate member in connection with the offering if the common stock originally sold by that underwriter or syndicate member is purchased by the underwriters in the open market pursuant to a stabilizing bid or to cover all or part of a syndicate short position. The underwriters have advised us that stabilizing bids and open market purchases may be effected on The Nasdaq National Market, in the over-the-counter market or otherwise and, if commenced, may be discontinued at any time.
93
A prospectus in electronic format may be made available on the website maintained by certain underwriters and one or more of the underwriters in this offering may distribute prospectuses electronically. The underwriters may agree to allocate a number of shares to underwriters for sale to their online brokerage account holders. Internet distributions will be allocated by the joint book-running managers and co-managers to underwriters that may make Internet distributions on the same basis as other allocations.
We and the selling stockholders have agreed to indemnify the underwriters against certain liabilities, including liabilities under the Securities Act of 1933.
We, our executive officers and directors and our selling stockholders have agreed that, during the period beginning from the date of this prospectus and continuing to and including the date 180 days after the date of this prospectus, none of us will, directly or indirectly, offer, sell, offer to sell, contract to sell or otherwise dispose of any shares of our common stock without the prior written consentsold hereunder.
Any selling stockholder may offer any of J.P. Morgan Securities Inc., exceptits securities at various times in limited circumstances, including the issuance of shares of common stock by us in connection with an acquisition, provided that the recipientone or more of the shares agrees to be bound by these lock-up arrangements.
The underwriters have reserved for sale, at the initial public offering price, up to 5% of the shares of common stock for our employees who express an interest in purchasing these shares of common stock in this offering. The number of shares available for sale to the general public in the offering will be reduced to the extent these persons purchase reserved shares. Any reserved shares not purchased by these persons will be offered by the underwriters to the general public on the same terms as the other shares offered in this offering. All sales of shares pursuant to the directed share program will be made at the public offering price set forth on the cover page of this prospectus. The shares purchased by our employees in this directed share program will not be subject to the lock-up provisions described in the immediately preceding paragraph.
The underwriters have informed us that they do not intend sales to discretionary accounts to exceed five percent of the total number of shares of our common stock offered by them and that no sales to discretionary accountsfollowing transactions (which may be made without prior written approval of the customer.
We have applied to list our common stock on The Nasdaq National Market under the symbol BLKB. The underwriters intend to sell shares of our common stock to a minimum of beneficial owners in lots of or more so as to meet the distribution requirements of this listing.
There has been no public market for our common stock prior to this offering. We, the underwriters and the selling stockholders will negotiate the initial public offering price. In determining the initial public offering price, we, the underwriters and the selling stockholders expect to consider a number of factors in addition to prevailing market conditions, including:include block transactions):
| • | |
| • | |
| • | |
| • | |
| • | |
| • | |
| • | pursuant to a contract, instruction or plan of sale in compliance with Rule 10b5-1 promulgated under the Exchange Act; |
| • | through agents; |
| • | through distribution by a selling stockholder or its successor in interest to its members, partners or shareholders; |
| • | in negotiated transactions; |
| • | by pledge to secure debts and other obligations; |
| • | any other method permitted pursuant to applicable law; or |
| • | in a combination of any of the foregoing methods. |
We,A selling stockholder also may resell all or a portion of its securities in open market transactions in reliance upon Rule 144 under the underwritersSecurities Act, provided it meets the criteria and conforms to the requirements of Rule 144.
A selling stockholder may enter into hedging transactions with broker-dealers or other financial institutions. In connection with such transactions, broker-dealers or other financial institutions may engage in short sales of the securities in the course of hedging the positions they assume with a selling stockholder. A selling stockholder may also enter into options or other transactions with broker-dealers or other financial institutions which require the delivery to such broker-dealer or their financial institution of the securities offered hereby, which securities such broker-dealer or their financial institution may resell pursuant to this prospectus as supplemented or amended to reflect such transaction.
In effecting sales, brokers and dealers engaged by the selling stockholders will consider these andmay arrange for other relevant factorsbrokers or dealers to participate in relationsuch sales. Brokers or dealers may receive commissions or discounts from the selling stockholders (or, if any such broker-dealer acts as agent for the purchaser of such shares, from such purchaser) in amounts to be negotiated which are not expected to exceed those customary in the pricetypes of similar securities of generally comparable companies. Neither we, thetransactions involved. Broker-dealers may
9487
Frombroker-dealer commitment to the selling stockholders. Broker-dealers who acquire shares of common stock as principal may thereafter resell such shares of common stock from time to time in the ordinary course of their respective businesses, certaintransactions (which may involve block transactions and sales to and through other broker-dealers, including transactions of the nature described above) in the over-the-counter market or otherwise at prices and on terms then prevailing at the time of sale, at prices then related to the then-current market price or in negotiated transactions and, in connection with such resales, may pay to or receive from the purchasers of such shares commissions as described below.
A selling stockholder may offer and sell securities other than for cash. In such event, any required details of the transaction will be set forth in a prospectus supplement.
The selling stockholders and any underwriters, dealers or agents that participate in the distribution of securities may be deemed to be underwriters, and their affiliates haveany profit on the sale of securities by them and any discounts, commissions or concessions received by any such underwriters, dealers or agents might be deemed to be underwriting discounts and commissions under the Securities Act. If we are advised that an underwriter has been engaged with respect to the sale of any securities offered hereby, or in the event of any other material change in the plan of distribution, we will cause appropriate amendments to the registration statement of which this prospectus forms a part to be filed with the SEC reflecting such engagement or other change. See “Where You Can Find More Information”.
At the time a particular offer of securities is made, to the extent required, a prospectus supplement will be provided by us and distributed by the relevant selling stockholder which will set forth the aggregate amount and type of the securities being offered and the terms of the offering, including the name or names of any underwriters, dealers or agents, any discounts, commissions and other items constituting compensation from the selling stockholders and any discount, commissions or concessions allowed or reallowed or paid to dealers.
The securities may be sold from time to time in one or more transactions at a fixed offering price, which may be changed, or at market prices prevailing at the time of the sale, at varying prices determined at the time of sale or at negotiated prices. Such prices will be determined individually by the selling stockholders or by agreement among two or more of the selling stockholders.
Under applicable rules and regulations under the Exchange Act, any person engaged in a distribution of securities may not simultaneously engage in market-making activities with respect to such securities for a period of nine business days prior to the commencement of such distribution and ending upon the completion of such distribution. In addition to and without limiting the foregoing, each selling stockholder will be subject to applicable provisions of the Exchange Act and the rules and regulations thereunder, including without limitation Regulation M, which provisions may limit the timing of purchases and sales of any of the securities by the selling stockholders. All of the foregoing may affect the marketability of the securities and the ability of any person or entity to engage in market-making activities with respect to the securities.
We will pay all expenses of the registration of the shares of common stock pursuant to the registration rights agreement, including, without limitation, SEC filing fees, expenses of compliance with state securities or “blue sky” laws and underwriting discounts and selling
88
In order to comply with certain states’ securities laws, if applicable, the shares of common stock will be sold in such jurisdictions only through registered or licensed brokers or dealers. In addition, in certain states the common stock may not be sold unless the common stock has been registered or qualified for sale in such state or an exemption from registration or qualification is available and is satisfied.
Once sold under the shelf registration statement, of which this prospectus forms a part, the shares of common stock will be freely tradable in the future engage in commercial banking and/or investment banking transactions with us andhands of persons other than our affiliates. Wachovia Bank, N.A., an affiliate of Wachovia Capital Markets, LLC, is our transfer agent and is syndication agent and a lender under our current bank credit facility and receives customary fees relating thereto. We have also entered into a commitment letter with Wachovia Bank, N.A., for a new revolving credit facility which we anticipate will replace our existing credit facility.
Legal matters
The validity of the issuance of our shares of common stock offered by this prospectus will be passed upon for us by Wyrick Robbins Yates & Ponton LLP, Raleigh, North Carolina. Larry E. Robbins, a partner of Wyrick Robbins Yates & Ponton LLP, serves on our board of directors. Legal matters relating to this offering will be passed upon for the underwriters by Cravath, Swaine & Moore LLP, New York, New York, and for the selling stockholders by Wyrick Robbins Yates & Ponton LLP, Raleigh, North Carolina, except with respect to Hellman & Friedman Capital Partners III, L.P., H&F Orchard Partners III, L.P. and H&F International Partners III, L.P., for whom such matters will be passed upon by Wachtell, Lipton, Rosen & Katz, New York, New York.
The consolidated financial statements as of December 31, 2003 and 2002 and for each of the three years in the period ended December 31, 2003 included in this prospectus have been so included in reliance on the report of PricewaterhouseCoopers LLP, an independent registered public accounting firm, given on the authority of said firm as experts in auditing and accounting.
Where you can find more information
We have filed with the SEC a registration statement on Form S-1, including exhibits, under the Securities Act of 1933 with respect to the shares of our common stock tothat might be sold in the offering.under this prospectus. This prospectus does not contain all of the information set forth in the registration statement. For further information with respect to us and the shares tothat might be sold in the offering,hereunder, reference is made to the registration statement and the exhibits attached to the registration statement. Statements contained in this prospectus as to the contents of any contract, agreement or other document referred to are not necessarily complete. As a result of this offering, we will becomeWe are subject to the information and reporting requirements of the Securities Exchange Act of 1934 and will file annual, quarterly and current reports, proxy statements and other information with the SEC.
You may read and copy all or any portion of the registration statement or any of our annual, quarterly and current reports, proxy statements or other information that we file at the SEC’s Public Reference Room at 450 Fifth Street, N.W., Washington, D.C. 20549. You can request copies of these documents, upon payment of a duplicating fee, by writing to the SEC. Please call the SEC at 1-800-SEC-0330 for further information on the operation of the Public Reference Room. Our SEC filings, including the registration statement, are also available to you on the SEC’s web sitehttp://www.sec.gov.
9589
| Page | ||||
| Report of independent registered public accounting firm | F-2 | |||
| Consolidated balance sheets as of December 31, 2002 and 2003 and | F-3 | |||
| Consolidated statements of operations for the years ended December 31, 2001, 2002 and 2003 and the | F-4 | |||
| Consolidated statements of cash flows for the years ended December 31, 2001, 2002 and 2003 and the | F-5 | |||
| Consolidated statements of shareholders’ equity (deficit) and comprehensive income for the years ended December 31, 2001, 2002 and 2003 and the | F-6 | |||
| Notes to consolidated financial statements | F-7 | |||
F-1
Report of independent registered public accounting firm
To the Board of Directors and Shareholders of
Blackbaud, Inc.
In our opinion, the accompanying consolidated balance sheets and the related consolidated statements of operations, cash flows and shareholders’ equity (deficit) and comprehensive income present fairly, in all material respects, the financial position of Blackbaud, Inc. and its subsidiaries (the “Company”) at December 31, 2003 and 2002, and the results of their operations and their cash flows for each of the three years in the period ended December 31, 2003 in conformity with accounting principles generally accepted in the United States of America. These financial statements are the responsibility of the Company’s management. Our responsibility is to express an opinion on these financial statements based on our audits. We conducted our audits of these statements in accordance with the standards of the Public Company Accounting Oversight Board (United States). Those standards require that we plan and perform the audit to obtain reasonable assurance about whether the financial statements are free of material misstatement. An audit includes examining, on a test basis, evidence supporting the amounts and disclosures in the financial statements, assessing the accounting principles used and significant estimates made by management, and evaluating the overall financial statement presentation. We believe that our audits provide a reasonable basis for our opinion.
As discussed in Note 1, the Company adopted Statement of Financial Accounting Standards No. 142, “Goodwill and Other Intangible Assets” as of January 1, 2002.
/s/ PricewaterhouseCoopers LLP
Raleigh, North Carolina
February 20, 2004, except for Note 15, as to which the date is July 19, 2004
F-2
Blackbaud, Inc.
| December 31, | December 31, | September 30, | ||||||||||||||||||||||||||||
| March 31, | ||||||||||||||||||||||||||||||
| (in thousands, except share amounts) | (in thousands, except share amounts) | 2002 | 2003 | 2004 | (in thousands, except share amounts) | 2002 | 2003 | 2004 | ||||||||||||||||||||||
| (unaudited) | (unaudited) | |||||||||||||||||||||||||||||
Assets | Assets | Assets | ||||||||||||||||||||||||||||
| Current assets: | Current assets: | |||||||||||||||||||||||||||||
| Cash and cash equivalents | $ | 18,703 | $ | 6,708 | $ | 6,085 | Cash and cash equivalents | $ | 18,703 | $ | 6,708 | $ | 33,382 | |||||||||||||||||
| Accounts receivable, net of allowance of $1,209 and $1,222, respectively | 13,148 | 14,518 | 14,623 | Accounts receivable, net of allowance of $1,209, $1,222 and $1,531 (unaudited), respectively | 13,148 | 14,518 | 16,921 | |||||||||||||||||||||||
| Other current assets | 1,252 | 2,713 | 2,611 | Other current assets | 1,252 | 2,713 | 3,049 | |||||||||||||||||||||||
| Deferred tax asset, current portion | 2,114 | 1,799 | 1,675 | Deferred tax asset, current portion | 2,114 | 1,799 | 1,035 | |||||||||||||||||||||||
| Total current assets | 35,217 | 25,738 | 24,994 | Total current assets | 35,217 | 25,738 | 54,387 | |||||||||||||||||||||||
| Property and equipment, net | 6,701 | 6,621 | 6,702 | Property and equipment, net | 6,701 | 6,621 | 6,354 | |||||||||||||||||||||||
| Deferred tax asset | 88,829 | 86,966 | 85,050 | Deferred tax asset | 88,829 | 86,966 | 80,175 | |||||||||||||||||||||||
| Goodwill | 852 | 1,386 | 1,439 | Goodwill | 852 | 1,386 | 1,471 | |||||||||||||||||||||||
| Deferred financing fees, net | 1,014 | 156 | — | Deferred financing fees, net | 1,014 | 156 | 161 | |||||||||||||||||||||||
| Other assets | 294 | 99 | 57 | Other assets | 294 | 99 | 37 | |||||||||||||||||||||||
| Total assets | $ | 132,907 | $ | 120,966 | $ | 118,242 | Total assets | $ | 132,907 | $ | 120,966 | $ | 142,585 | |||||||||||||||||
Liabilities and Shareholders’ Equity | Liabilities and Shareholders’ Equity | Liabilities and Shareholders’ Equity | ||||||||||||||||||||||||||||
| Current liabilities: | Current liabilities: | |||||||||||||||||||||||||||||
| Trade accounts payable | $ | 2,116 | $ | 2,590 | $ | 1,731 | Trade accounts payable | $ | 2,116 | $ | 2,590 | $ | 2,362 | |||||||||||||||||
| Current portion of long-term debt and capital lease obligations | 5,295 | 142 | 145 | Current portion of long-term debt and capital lease obligations | 5,295 | 142 | 81 | |||||||||||||||||||||||
| Accrued expenses and other current liabilities | 7,756 | 9,659 | 7,795 | Accrued expenses and other current liabilities | 7,756 | 9,659 | 12,096 | |||||||||||||||||||||||
| Deferred revenue | 39,047 | 43,673 | 43,765 | Deferred revenue | 39,047 | 43,673 | 51,727 | |||||||||||||||||||||||
| Total current liabilities | 54,214 | 56,064 | 53,436 | Total current liabilities | 54,214 | 56,064 | 66,266 | |||||||||||||||||||||||
| Long-term debt and capital lease obligations | 45,186 | 5,044 | 7 | Long-term debt and capital lease obligations | 45,186 | 5,044 | — | |||||||||||||||||||||||
| Total liabilities | 99,400 | 61,108 | 53,443 | Total liabilities | 99,400 | 61,108 | 66,266 | |||||||||||||||||||||||
| Commitments and contingencies (Notes 8 and 10) | Commitments and contingencies (Notes 8 and 10) | |||||||||||||||||||||||||||||
| Shareholders’ equity: | Shareholders’ equity: | |||||||||||||||||||||||||||||
| Preferred stock; 5,000,000 shares authorized | — | — | — | Preferred stock; 20,000,000 shares authorized | — | — | — | |||||||||||||||||||||||
| Common stock, no par value; 95,000,000 shares authorized, 67,776,656 and 67,854,195 shares issued and outstanding in 2002 and 2003, respectively | 10,740 | 41,613 | 41,728 | Common stock, $0.001 par value and no par value; 180,000,000 and 95,000,000 shares authorized, 42,360,410, 42,408,872 and 42,542,700 shares issued and outstanding in 2002, 2003 and September 30, 2004 (unaudited), respectively | 10,740 | 41,613 | 43 | |||||||||||||||||||||||
| Deferred compensation | — | (4,795 | ) | (3,799 | ) | Additional paid-in capital | — | — | 38,056 | |||||||||||||||||||||
| Accumulated other comprehensive (loss) income | (233 | ) | 518 | 351 | Deferred compensation | — | (4,795 | ) | (1,405 | ) | ||||||||||||||||||||
| Retained earnings | 23,000 | 22,522 | 26,519 | Accumulated other comprehensive (loss) income | (233 | ) | 518 | 176 | ||||||||||||||||||||||
| Retained earnings | 23,000 | 22,522 | 39,449 | |||||||||||||||||||||||||||
| Total shareholders’ equity | 33,507 | 59,858 | 64,799 | |||||||||||||||||||||||||||
| Total shareholders’ equity | 33,507 | 59,858 | 76,319 | |||||||||||||||||||||||||||
| Total liabilities and shareholders’ equity | $ | 132,907 | $ | 120,966 | $ | 118,242 | ||||||||||||||||||||||||
| Total liabilities and shareholders’ equity | $ | 132,907 | $ | 120,966 | $ | 142,585 | ||||||||||||||||||||||||
The accompanying notes are an integral part of these consolidated financial statements.
F-3
Blackbaud, Inc.
| Three months ended | Nine months ended | |||||||||||||||||||||||||||||||||||||||||||
| Year ended December 31, | March 31, | Year ended December 31, | September 30, | |||||||||||||||||||||||||||||||||||||||||
| (in thousands, except share and per share amounts) | (in thousands, except share and per share amounts) | 2001 | 2002 | 2003 | 2003 | 2004 | (in thousands, except share and per share amounts) | 2001 | 2002 | 2003 | 2003 | 2004 | ||||||||||||||||||||||||||||||||
| (unaudited) | (unaudited) | |||||||||||||||||||||||||||||||||||||||||||
Revenue | Revenue | Revenue | ||||||||||||||||||||||||||||||||||||||||||
| License fees | $ | 19,300 | $ | 20,572 | $ | 21,339 | $ | 4,504 | $ | 5,077 | License fees | $ | 19,300 | $ | 20,572 | $ | 21,339 | $ | 15,427 | $ | 18,614 | |||||||||||||||||||||||
| Services | 18,797 | 26,739 | 34,042 | 7,744 | 9,545 | Services | 18,797 | 26,739 | 34,042 | 25,888 | 32,678 | |||||||||||||||||||||||||||||||||
| Maintenance and subscriptions | 47,022 | 52,788 | 58,360 | 14,099 | 15,779 | Maintenance and subscriptions | 47,022 | 52,788 | 58,360 | 43,271 | 48,886 | |||||||||||||||||||||||||||||||||
| Other revenue | 4,915 | 5,130 | 4,352 | 962 | 954 | Other revenue | 4,915 | 5,130 | 4,352 | 2,906 | 2,849 | |||||||||||||||||||||||||||||||||
| Total revenue | 90,034 | 105,229 | 118,093 | 27,309 | 31,355 | Total revenue | 90,034 | 105,229 | 118,093 | 87,492 | 103,027 | |||||||||||||||||||||||||||||||||
Cost of revenue | Cost of revenue | Cost of revenue | ||||||||||||||||||||||||||||||||||||||||||
| Cost of license fees | 1,726 | 2,547 | 2,819 | 567 | 729 | Cost of license fees | 1,726 | 2,547 | 2,819 | 2,110 | 2,733 | |||||||||||||||||||||||||||||||||
| Cost of services (of which $0, $0 and $3,342 in 2001, 2002 and 2003, and $622 and $294 for the three months ended March 31, 2003 and 2004, respectively, was stock option compensation) | 10,253 | 14,234 | 21,006 | 4,911 | 5,378 | Cost of services (of which $0, $0 and $3,342 in 2001, 2002 and 2003, and $2,291 and ($644) for the nine months ended September 30, 2003 and 2004, respectively, was stock option compensation) | 10,253 | 14,234 | 21,006 | 15,347 | 15,988 | |||||||||||||||||||||||||||||||||
| Cost of maintenance and subscriptions (of which $0, $0 and $505 in 2001, 2002 and 2003, and $93 and $37 for the three months ended March 31, 2003 and 2004, respectively, was stock option compensation) | 11,733 | 10,588 | 11,837 | 2,835 | 2,660 | Cost of maintenance and subscriptions (of which $0, $0 and $505 in 2001, 2002 and 2003, and $344 and ($106) for the nine months ended September 30, 2003 and 2004, respectively, was stock option compensation) | 11,733 | 10,588 | 11,837 | 9,031 | 7,864 | |||||||||||||||||||||||||||||||||
| Cost of other revenue | 2,750 | 3,611 | 3,712 | 805 | 860 | Cost of other revenue | 2,750 | 3,611 | 3,712 | 2,556 | 2,577 | |||||||||||||||||||||||||||||||||
| Total cost of revenue | 26,462 | 30,980 | 39,374 | 9,118 | 9,627 | Total cost of revenue | 26,462 | 30,980 | 39,374 | 29,044 | 29,162 | |||||||||||||||||||||||||||||||||
Gross profit | Gross profit | 63,572 | 74,249 | 78,719 | 18,191 | 21,728 | Gross profit | 63,572 | 74,249 | 78,719 | 58,448 | 73,865 | ||||||||||||||||||||||||||||||||
| Sales and marketing | 15,173 | 19,173 | 21,883 | 5,062 | 6,360 | Sales and marketing | 15,173 | 19,173 | 21,883 | 15,991 | 20,646 | |||||||||||||||||||||||||||||||||
| Research and development | 14,755 | 14,385 | 15,516 | 3,620 | 4,276 | Research and development | 14,755 | 14,385 | 15,516 | 11,506 | 13,245 | |||||||||||||||||||||||||||||||||
| General and administrative | 9,031 | 10,631 | 11,085 | 2,823 | 2,851 | General and administrative | 9,031 | 10,631 | 11,085 | 8,042 | 9,093 | |||||||||||||||||||||||||||||||||
| Amortization | 2,239 | 1,045 | 848 | 48 | 32 | Amortization | 2,239 | 1,045 | 848 | 800 | 32 | |||||||||||||||||||||||||||||||||
| Costs of initial public offering | — | — | — | — | 950 | Costs of initial public offering | — | — | — | — | 2,455 | |||||||||||||||||||||||||||||||||
| Stock option compensation | — | — | 23,691 | 5,446 | 667 | Stock option compensation | — | — | 23,691 | 17,326 | 55 | |||||||||||||||||||||||||||||||||
| Total operating expenses | 41,198 | 45,234 | 73,023 | 16,999 | 15,136 | Total operating expenses | 41,198 | 45,234 | 73,023 | 53,665 | 45,526 | |||||||||||||||||||||||||||||||||
Income from operations | Income from operations | 22,374 | 29,015 | 5,696 | 1,192 | 6,592 | Income from operations | 22,374 | 29,015 | 5,696 | 4,783 | 28,339 | ||||||||||||||||||||||||||||||||
| Interest income | 96 | 138 | 97 | 26 | 25 | Interest income | 96 | 138 | 97 | 70 | 133 | |||||||||||||||||||||||||||||||||
| Interest expense | (7,963 | ) | (4,410 | ) | (2,559 | ) | (863 | ) | (213 | ) | Interest expense | (7,963 | ) | (4,410 | ) | (2,559 | ) | (2,216 | ) | (268 | ) | |||||||||||||||||||||||
| Other (expense) income, net | (113 | ) | 63 | 235 | 15 | 349 | Other (expense) income, net | (113 | ) | 63 | 235 | (100 | ) | 342 | ||||||||||||||||||||||||||||||
Income before provision for income taxes | Income before provision for income taxes | 14,394 | 24,806 | 3,469 | 370 | 6,753 | Income before provision for income taxes | 14,394 | 24,806 | 3,469 | 2,537 | 28,546 | ||||||||||||||||||||||||||||||||
| Income tax provision | 5,488 | 9,166 | 3,947 | 421 | 2,756 | Income tax provision | 5,488 | 9,166 | 3,947 | 2,886 | 11,619 | |||||||||||||||||||||||||||||||||
Net income (loss) | Net income (loss) | $ | 8,906 | $ | 15,640 | $ | (478 | ) | $ | (51 | ) | $ | 3,997 | Net income (loss) | $ | 8,906 | $ | 15,640 | $ | (478 | ) | $ | (349 | ) | $ | 16,927 | ||||||||||||||||||
Earnings (loss) per share | Earnings (loss) per share | Earnings (loss) per share | ||||||||||||||||||||||||||||||||||||||||||
| Basic | $ | 0.13 | $ | 0.23 | $ | (0.01 | ) | $ | — | $ | 0.06 | Basic | $ | 0.21 | $ | 0.37 | $ | (0.01 | ) | $ | (0.01 | ) | $ | 0.40 | ||||||||||||||||||||
| Diluted | $ | 0.13 | $ | 0.23 | $ | (0.01 | ) | $ | — | $ | 0.05 | Diluted | $ | 0.21 | $ | 0.37 | $ | (0.01 | ) | $ | (0.01 | ) | $ | 0.36 | ||||||||||||||||||||
Common shares and equivalents outstanding | Common shares and equivalents outstanding | Common shares and equivalents outstanding | ||||||||||||||||||||||||||||||||||||||||||
| Basic weighted average shares | 66,388,526 | 67,776,656 | 67,832,951 | 67,776,656 | 67,857,599 | Basic weighted average shares | 41,492,329 | 42,360,410 | 42,395,594 | 42,391,299 | 42,480,059 | |||||||||||||||||||||||||||||||||
| Diluted weighted average shares | 66,388,526 | 67,776,656 | 67,832,951 | 67,776,656 | 73,823,256 | Diluted weighted average shares | 41,492,329 | 42,360,410 | 42,395,594 | 42,391,299 | 46,466,986 | |||||||||||||||||||||||||||||||||
Summary of stock option compensation | Summary of stock option compensation | Summary of stock option compensation | ||||||||||||||||||||||||||||||||||||||||||
| Cost of services | $ | — | $ | — | $ | 3,342 | $ | 622 | $ | 294 | Cost of services | $ | — | $ | — | $ | 3,342 | $ | 2,291 | $ | (644 | ) | ||||||||||||||||||||||
| Cost of maintenance and subscriptions | — | — | 505 | 93 | 37 | Cost of maintenance and subscriptions | — | — | 505 | 344 | (106 | ) | ||||||||||||||||||||||||||||||||
| Total cost of revenue | — | — | 3,847 | 715 | 331 | Total cost of revenue | — | — | 3,847 | 2,635 | (750 | ) | ||||||||||||||||||||||||||||||||
| Sales and marketing | — | — | 1,817 | 336 | 254 | Sales and marketing | — | — | 1,817 | 1,201 | (194 | ) | ||||||||||||||||||||||||||||||||
| Research and development | — | — | 2,341 | 456 | 174 | Research and development | — | — | 2,341 | 1,639 | (517 | ) | ||||||||||||||||||||||||||||||||
| General and administrative | — | — | 19,533 | 4,654 | 239 | General and administrative | — | — | 19,533 | 14,486 | 766 | |||||||||||||||||||||||||||||||||
| Total operating expenses | — | — | 23,691 | 5,446 | 667 | Total operating expenses | — | — | 23,691 | 17,326 | 55 | |||||||||||||||||||||||||||||||||
| Total stock option compensation | $ | — | $ | — | $ | 27,538 | $ | 6,161 | $ | 998 | Total stock option compensation | $ | — | $ | — | $ | 27,538 | $ | 19,961 | $ | (695 | ) | ||||||||||||||||||||||
The accompanying notes are an integral part of these consolidated financial statements.
F-4
Blackbaud, Inc.
| Nine months | ||||||||||||||||||||||||||||||||||||||||||||||||
| Three months ended | ended | |||||||||||||||||||||||||||||||||||||||||||||||
| Year ended December 31, | March 31, | Year ended December 31, | September 30, | |||||||||||||||||||||||||||||||||||||||||||||
| (in thousands) | (in thousands) | 2001 | 2002 | 2003 | 2003 | 2004 | (in thousands) | 2001 | 2002 | 2003 | 2003 | 2004 | ||||||||||||||||||||||||||||||||||||
| (unaudited) | (unaudited) | |||||||||||||||||||||||||||||||||||||||||||||||
Cash flows from operating activities | Cash flows from operating activities | Cash flows from operating activities | �� | |||||||||||||||||||||||||||||||||||||||||||||
| Net income (loss) | Net income (loss) | $ | 8,906 | $ | 15,640 | $ | (478 | ) | $ | (51 | ) | $ | 3,997 | Net income (loss) | $ | 8,906 | $ | 15,640 | $ | (478 | ) | $ | (349 | ) | $ | 16,927 | ||||||||||||||||||||||
| Adjustments to reconcile net income (loss) to net cash provided by operating activities | Adjustments to reconcile net income (loss) to net cash provided by operating activities | Adjustments to reconcile net income (loss) to net cash provided by operating activities | ||||||||||||||||||||||||||||||||||||||||||||||
| Depreciation | 2,552 | 2,447 | 2,781 | 666 | 624 | Depreciation | 2,552 | 2,447 | 2,781 | 2,197 | 1,889 | |||||||||||||||||||||||||||||||||||||
| Amortization | 2,239 | 1,045 | 848 | 48 | 32 | Amortization | 2,239 | 1,045 | 848 | 800 | 32 | |||||||||||||||||||||||||||||||||||||
| Stock option compensation | — | — | 25,845 | 5,738 | 998 | Stock option compensation | — | — | 25,845 | 19,961 | (695 | ) | ||||||||||||||||||||||||||||||||||||
| Amortization of deferred financing fees | 513 | 935 | 858 | 234 | 156 | Amortization of deferred financing fees | 513 | 935 | 858 | 702 | 156 | |||||||||||||||||||||||||||||||||||||
| Deferred taxes | 5,400 | 9,010 | 2,178 | 35 | 2,040 | Deferred taxes | 5,400 | 9,010 | 2,178 | 283 | 7,555 | |||||||||||||||||||||||||||||||||||||
| Changes in assets and liabilities, net of impact from acquisitions | Changes in assets and liabilities, net of impact from acquisitions | |||||||||||||||||||||||||||||||||||||||||||||||
| Accounts receivable | 4,545 | (1,844 | ) | (1,078 | ) | 2,306 | (26 | ) | Accounts receivable | 4,545 | (1,844 | ) | (1,078 | ) | (166 | ) | (2,365 | ) | ||||||||||||||||||||||||||||||
| Other current assets and other assets | (504 | ) | (238 | ) | (1,424 | ) | (254 | ) | 122 | Other current assets and other assets | (504 | ) | (238 | ) | (1,424 | ) | (1,165 | ) | (267 | ) | ||||||||||||||||||||||||||||
| Trade accounts payable | (1,234 | ) | 69 | 470 | (707 | ) | (862 | ) | Trade accounts payable | (1,234 | ) | 69 | 470 | (1,012 | ) | (230 | ) | |||||||||||||||||||||||||||||||
| Accrued expenses and other current liabilities | (676 | ) | 571 | 2,179 | (2,271 | ) | (2,183 | ) | Accrued expenses and other current liabilities | (676 | ) | 571 | 2,179 | 1,493 | 2,353 | |||||||||||||||||||||||||||||||||
| Deferred revenue | 3,253 | 4,835 | 4,407 | (2,293 | ) | 42 | Deferred revenue | 3,253 | 4,835 | 4,407 | 4,302 | 8,040 | ||||||||||||||||||||||||||||||||||||
| Total adjustments | 16,088 | 16,830 | 37,064 | 3,502 | 943 | Total adjustments | 16,088 | 16,830 | 37,064 | 27,395 | 16,468 | |||||||||||||||||||||||||||||||||||||
| Net cash provided by operating activities | 24,994 | 32,470 | 36,586 | 3,451 | 4,940 | Net cash provided by operating activities | 24,994 | 32,470 | 36,586 | 27,046 | 33,395 | |||||||||||||||||||||||||||||||||||||
Cash flows from investing activities | Cash flows from investing activities | Cash flows from investing activities | ||||||||||||||||||||||||||||||||||||||||||||||
| Purchase of property and equipment | (2,451 | ) | (1,493 | ) | (2,666 | ) | (638 | ) | (695 | ) | Purchase of property and equipment | (2,451 | ) | (1,493 | ) | (2,666 | ) | (1,837 | ) | (1,616 | ) | |||||||||||||||||||||||||||
| Purchase of net assets of acquired company | (574 | ) | (500 | ) | (1,082 | ) | — | (8 | ) | Purchase of net assets of acquired company | (574 | ) | (500 | ) | (1,082 | ) | (894 | ) | (97 | ) | ||||||||||||||||||||||||||||
| Net cash used in investing activities | (3,025 | ) | (1,993 | ) | (3,748 | ) | (638 | ) | (703 | ) | Net cash used in investing activities | (3,025 | ) | (1,993 | ) | (3,748 | ) | (2,731 | ) | (1,713 | ) | |||||||||||||||||||||||||||
Cash flows from financing activities | Cash flows from financing activities | Cash flows from financing activities | ||||||||||||||||||||||||||||||||||||||||||||||
| Repayments on long-term debt and capital lease obligations | (24,918 | ) | (20,471 | ) | (45,295 | ) | (8,010 | ) | (5,033 | ) | Repayments on long-term debt and capital lease obligations | (24,918 | ) | (20,471 | ) | (45,295 | ) | (34,280 | ) | (5,105 | ) | |||||||||||||||||||||||||||
| Proceeds from exercise of stock options | — | — | 232 | — | 113 | Proceeds from exercise of stock options | — | — | 232 | 233 | 642 | |||||||||||||||||||||||||||||||||||||
| Proceeds from sale of common stock | 10,000 | — | — | — | — | Proceeds from sale of common stock | 10,000 | — | — | — | — | |||||||||||||||||||||||||||||||||||||
| Payment of deferred financing fees | (44 | ) | — | — | — | — | Payment of deferred financing fees | (44 | ) | — | — | — | (161 | ) | ||||||||||||||||||||||||||||||||||
| Net cash used in financing activities | (14,962 | ) | (20,471 | ) | (45,063 | ) | (8,010 | ) | (4,920 | ) | Net cash used in financing activities | (14,962 | ) | (20,471 | ) | (45,063 | ) | (34,047 | ) | (4,624 | ) | |||||||||||||||||||||||||||
| Effect of exchange rate on cash and cash equivalents | Effect of exchange rate on cash and cash equivalents | 30 | (47 | ) | 230 | (109 | ) | 60 | Effect of exchange rate on cash and cash equivalents | 30 | (47 | ) | 230 | 495 | (384 | ) | ||||||||||||||||||||||||||||||||
| Net increase (decrease) in cash and cash equivalents | Net increase (decrease) in cash and cash equivalents | 7,037 | 9,959 | (11,995 | ) | (5,306 | ) | (623 | ) | Net increase (decrease) in cash and cash equivalents | 7,037 | 9,959 | (11,995 | ) | (9,237 | ) | 26,674 | |||||||||||||||||||||||||||||||
| Cash and cash equivalents, beginning of year | 1,707 | 8,744 | 18,703 | 18,703 | 6,708 | |||||||||||||||||||||||||||||||||||||||||||
| Cash and cash equivalents, beginning of period | Cash and cash equivalents, beginning of period | 1,707 | 8,744 | 18,703 | 18,703 | 6,708 | ||||||||||||||||||||||||||||||||||||||||||
| Cash and cash equivalents, end of year | $ | 8,744 | $ | 18,703 | $ | 6,708 | $ | 13,397 | $ | 6,085 | ||||||||||||||||||||||||||||||||||||||
| Cash and cash equivalents, end of period | Cash and cash equivalents, end of period | $ | 8,744 | $ | 18,703 | $ | 6,708 | $ | 9,466 | $ | 33,382 | |||||||||||||||||||||||||||||||||||||
Supplemental disclosures of cash flow information | Supplemental disclosures of cash flow information | Supplemental disclosures of cash flow information | ||||||||||||||||||||||||||||||||||||||||||||||
| Cash paid during the year for | Cash paid during the year for | |||||||||||||||||||||||||||||||||||||||||||||||
| Interest | $ | 7,462 | $ | 3,683 | $ | 1,285 | $ | 543 | $ | 26 | Interest | $ | 7,462 | $ | 3,683 | $ | 1,285 | $ | 1,152 | $ | 44 | |||||||||||||||||||||||||||
| Taxes | 29 | 195 | 1,612 | 132 | 69 | Taxes | 29 | 195 | 1,612 | 359 | 1,691 | |||||||||||||||||||||||||||||||||||||
Noncash activities | Noncash activities | Noncash activities | ||||||||||||||||||||||||||||||||||||||||||||||
| Change in fair value of derivative instruments | $ | 216 | $ | (605 | ) | $ | 389 | $ | 111 | $ | — | Change in fair value of derivative instruments | $ | 216 | $ | (605 | ) | $ | 389 | $ | 332 | $ | — | |||||||||||||||||||||||||
The accompanying notes are an integral part of these consolidated financial statements.
F-5
Blackbaud, Inc.
| Accumulated | Accumulated | |||||||||||||||||||||||||||||||||||||||||||||||||||||||||||||
| Year ended December 31, | Year ended December 31, | Common stock | other | Retained | Total | Year ended December 31, | Common stock | Additional | other | Retained | Total | |||||||||||||||||||||||||||||||||||||||||||||||||||
| (in thousands, except share | Comprehensive | comprehensive | Deferred | earnings | shareholders’ | |||||||||||||||||||||||||||||||||||||||||||||||||||||||||
| amounts) | income | Shares | Amount | income (loss) | compensation | (deficit) | equity (deficit) | |||||||||||||||||||||||||||||||||||||||||||||||||||||||
| (in thousands, | (in thousands, | Comprehensive | Paid-in | comprehensive | Deferred | earnings | shareholders’ | |||||||||||||||||||||||||||||||||||||||||||||||||||||||
| except share amounts) | except share amounts) | income | Shares | Amount | capital | income (loss) | compensation | (deficit) | equity (deficit) | |||||||||||||||||||||||||||||||||||||||||||||||||||||
Balance, December 31, 2000 | Balance, December 31, 2000 | 64,443,322 | $ | 740 | $ | (14 | ) | $ | — | $ | (1,546 | ) | $ | (820 | ) | Balance, December 31, 2000 | $ | — | 40,277,076 | $ | 740 | $ | — | $ | (14 | ) | $ | — | $ | (1,546 | ) | $ | (820 | ) | ||||||||||||||||||||||||||||
| Sale of common stock | 3,333,334 | 10,000 | — | — | — | 10,000 | Sale of common stock | — | 2,083,334 | 10,000 | — | — | — | — | 10,000 | |||||||||||||||||||||||||||||||||||||||||||||||
| Derivative instruments | $ | 216 | — | — | 216 | — | — | 216 | Derivative instruments | 216 | — | — | — | 216 | — | — | 216 | |||||||||||||||||||||||||||||||||||||||||||||
| Translation adjustment | 36 | — | — | 36 | — | — | 36 | Translation adjustment | 36 | — | — | — | 36 | — | — | 36 | ||||||||||||||||||||||||||||||||||||||||||||||
| Net income | 8,906 | — | — | — | — | 8,906 | 8,906 | Net income | 8,906 | — | — | — | — | — | 8,906 | 8,906 | ||||||||||||||||||||||||||||||||||||||||||||||
| Comprehensive income | $ | 9,158 | Comprehensive income | $ | 9,158 | |||||||||||||||||||||||||||||||||||||||||||||||||||||||||
Balance, December 31, 2001 | Balance, December 31, 2001 | 67,776,656 | 10,740 | 238 | — | 7,360 | 18,338 | Balance, December 31, 2001 | 42,360,410 | 10,740 | — | 238 | — | 7,360 | 18,338 | |||||||||||||||||||||||||||||||||||||||||||||||
| Derivative instruments | $ | (605 | ) | — | — | (605 | ) | — | — | (605 | ) | Derivative instruments | $ | (605 | ) | — | — | — | (605 | ) | — | — | (605 | ) | ||||||||||||||||||||||||||||||||||||||
| Translation adjustment | 134 | — | — | 134 | — | — | 134 | Translation adjustment | 134 | — | — | — | 134 | — | — | 134 | ||||||||||||||||||||||||||||||||||||||||||||||
| Net income | 15,640 | — | — | — | — | 15,640 | 15,640 | Net income | 15,640 | — | — | — | — | — | 15,640 | 15,640 | ||||||||||||||||||||||||||||||||||||||||||||||
| Comprehensive income | $ | 15,169 | Comprehensive income | $ | 15,169 | |||||||||||||||||||||||||||||||||||||||||||||||||||||||||
Balance, December 31, 2002 | Balance, December 31, 2002 | 67,776,656 | 10,740 | (233 | ) | — | 23,000 | 33,507 | Balance, December 31, 2002 | 42,360,410 | 10,740 | — | (233 | ) | — | 23,000 | 33,507 | |||||||||||||||||||||||||||||||||||||||||||||
| Exercise of stock options | 77,539 | 232 | — | — | — | 232 | Exercise of stock options | $ | — | 48,462 | 232 | — | — | — | — | 232 | ||||||||||||||||||||||||||||||||||||||||||||||
| Derivative instruments | $ | 389 | — | — | 389 | — | — | 389 | Derivative instruments | 389 | — | — | — | 389 | — | — | 389 | |||||||||||||||||||||||||||||||||||||||||||||
| Translation adjustment | 362 | — | — | 362 | — | — | 362 | Translation adjustment | 362 | — | — | — | 362 | — | — | 362 | ||||||||||||||||||||||||||||||||||||||||||||||
| Deferred compensation related to options issued to employees | — | — | 30,756 | — | (32,448 | ) | — | (1,692 | ) | Deferred compensation related to options issued to employees | — | — | 30,756 | — | — | (32,448 | ) | — | (1,692 | ) | ||||||||||||||||||||||||||||||||||||||||||
| Reversal of deferred compensation related to option cancellations | — | — | (115 | ) | — | 115 | — | — | Reversal of deferred compensation related to option cancellations | — | — | (115 | ) | — | — | 115 | — | — | ||||||||||||||||||||||||||||||||||||||||||||
| Amortization of deferred compensation | — | — | — | — | 27,538 | — | 27,538 | Amortization of deferred compensation | — | — | — | — | — | 27,538 | — | 27,538 | ||||||||||||||||||||||||||||||||||||||||||||||
| Net loss | (478 | ) | — | — | — | — | (478 | ) | (478 | ) | Net loss | (478 | ) | — | — | — | — | — | (478 | ) | (478 | ) | ||||||||||||||||||||||||||||||||||||||||
| Comprehensive income | $ | 273 | Comprehensive income | $ | 273 | |||||||||||||||||||||||||||||||||||||||||||||||||||||||||
Balance, December 31, 2003 | Balance, December 31, 2003 | 67,854,195 | 41,613 | 518 | (4,795 | ) | 22,522 | 59,858 | Balance, December 31, 2003 | 42,408,872 | 41,613 | — | 518 | (4,795 | ) | 22,522 | 59,858 | |||||||||||||||||||||||||||||||||||||||||||||
| (unaudited) | Exercise of stock options | $ | — | 133,828 | 480 | 161 | — | — | — | 641 | ||||||||||||||||||||||||||||||||||||||||||||||||||||
| Exercise of stock options | $ | — | 37,922 | 113 | — | — | 113 | Translation adjustment | (342 | ) | — | — | — | (342 | ) | — | — | (342 | ) | |||||||||||||||||||||||||||||||||||||||||||
| Translation adjustment | (167 | ) | — | — | (167 | ) | — | — | (167 | ) | Deferred compensation related to options issued to employees | — | — | 82 | (4,155 | ) | — | 4,003 | — | (70 | ) | |||||||||||||||||||||||||||||||||||||||||
| Deferred compensation related to options issued to employees | — | — | 82 | — | (82 | ) | — | — | Reversal of deferred compensation related to option cancellations | — | — | (82 | ) | — | — | 82 | — | — | ||||||||||||||||||||||||||||||||||||||||||||
| Reversal of deferred compensation related to option cancellations | — | — | (80 | ) | — | 80 | — | — | Amortization of deferred compensation | — | — | — | — | — | (695 | ) | — | (695 | ) | |||||||||||||||||||||||||||||||||||||||||||
| Amortization of deferred compensation | — | — | — | — | 998 | — | 998 | Reclassification of common stock to additional paid in capital resulting from the establishment of par value | — | — | (42,050 | ) | 42,050 | — | — | — | — | |||||||||||||||||||||||||||||||||||||||||||||
| Net income | 3,997 | — | — | — | — | 3,997 | 3,997 | Net income | 16,927 | — | — | — | — | — | 16,927 | 16,927 | ||||||||||||||||||||||||||||||||||||||||||||||
| Comprehensive income | $ | 3,830 | Comprehensive income | $ | 16,585 | |||||||||||||||||||||||||||||||||||||||||||||||||||||||||
Balance, March 31, 2004(unaudited) | 67,892,117 | $ | 41,728 | $ | 351 | $ | (3,799 | ) | $ | 26,519 | $ | 64,799 | ||||||||||||||||||||||||||||||||||||||||||||||||||
Balance, September 30, 2004(unaudited) | Balance, September 30, 2004(unaudited) | 42,542,700 | $ | 43 | $ | 38,056 | $ | 176 | $ | (1,405 | ) | $ | 39,449 | $ | 76,319 | |||||||||||||||||||||||||||||||||||||||||||||||
The accompanying notes are an integral part of these consolidated financial statements.
F-6
Blackbaud, Inc.
1. Organization and summary of significant accounting policies
Organization
Blackbaud, Inc. (the “Company”) is the leading global provider of software and related services designed specifically for nonprofit organizations and provides products and services that enable nonprofit organizations to increase donations, reduce fundraising costs, improve communications with constituents, manage their finances and optimize internal operations. In 2003, the Company had over 12,500 active customers distributed across multiple verticals within the nonprofit market including religion; education; foundations; health and human services; arts and cultural; public and societal benefits; environment and animal welfare; and international and foreign affairs.
Delaware Reincorporation; Initial Public Offering (unaudited)
On July 16, 2004, the Company was reincorporated under the laws of the State of Delaware and, accordingly, under its certificate of incorporation effective that date, its authorized stock consists of 180,000,000 shares of common stock, par value $0.001 per share and 20,000,000 shares of preferred stock, par value $0.001 per share.
The SEC declared the Company’s registration statement effective on July 22, 2004, which the Company filed on Form S-1 (Registration No. 333-112978) under the Securities Act of 1933 in connection with the initial public offering of its common stock. The Company sold, for the benefit of selling shareholders, an aggregate of 9,313,596 shares under this registration statement, including 1,214,817 shares subject to the underwriters’ over-allotment option. On July 27, 2004 the Company completed its initial public offering in which it sold, for the benefit of selling stockholders, a total of 8,098,779 shares of common stock for $8.00 per share (before underwriter discounts and commissions), for an aggregate public offering price of $64,790,232. On August 2, 2004, the underwriters exercised their over-allotment option for the purchase of 1,214,817 shares of common stock at $8.00 per share for an additional aggregate public offering price of $9,718,536. All of the shares sold in this offering were sold by selling stockholders and, accordingly, the Company has not received any proceeds from the sale of shares in this offering. Accordingly, the Company has expensed the costs of its initial public offering in its statement of operations, which were $2,455,000 for the nine months ended September 30, 2004, respectively. These costs were primarily comprised of printing, legal and accounting fees.
Recapitalization
Prior to October 13, 1999, the Company was 100% owned by management shareholders. On October 13, 1999, the Company completed a transaction in which it used cash on hand and proceeds from a new term loan to repurchase a portion of its then outstanding common stock from management shareholders. On the same date, an entity controlled by certain investment partnerships, Pobeda Partners Ltd., also purchased shares of the Company’s common stock from management shareholders.
F-7
The Company accounted for the above transactions as a recapitalization. The stock repurchased by the Company was accounted for as a treasury stock transaction and the carrying values of the assets and liabilities did not change for financial reporting purposes. For income tax purposes, Pobeda and the management shareholders elected to treat the transaction under Section 338(h)(10) of the Internal Revenue Code; consequently, the tax basis of the assets and liabilities of the Company were restated to their fair values at the date of the transaction. The deferred tax asset resulting from differences in bases of the assets and liabilities between financial and income tax reporting has been accounted for as an increase in shareholders’ equity.
As part of the recapitalization transaction, the Company agreed to pay certain management shareholders and employees a total of $9,975,000 for past and future services. This amount was to be paid 25% at consummation of the recapitalization and the remainder ratably every six months over a three-year period.
Compensation expense for past services of $7,198,500 was recognized and expensed at the time of the recapitalization in 1999, because this amount was not contingent upon future service. The remainder was contingent upon future service and, accordingly, was recognized as expense ratably over the following three years. An employee who left the Company during the three year period forfeited $50,000 of this amount. Expense of $962,500, $950,000 and $814,000 was recognized for the years ended December 31, 2000, 2001 and 2002, respectively. Cash payments of $2,493,750 were made in each of the years ended December 31, 1999, 2000, and 2001 and $2,443,750 in the year ended December 31, 2002. The Company had no future obligation for these payments under the recapitalization agreement after December 31, 2002.
F-7
Unaudited Interim Financial Statements
The consolidated financial statements as of March 31,September 30, 2004 and for the three-monthnine-month periods ended March 31,September 30, 2003 and 2004 are unaudited and reflect all adjustments (consisting of normal recurring adjustments) which are, in the opinion of the Company’s management, necessary for a fair presentation of financial position, results of operations and cash flows. All financial statement disclosures related to the threenine month period ended March 31,September 30, 2003 and 2004 are unaudited.
Basis of consolidation
The consolidated financial statements include the accounts of the Company and its wholly-owned subsidiaries. All significant intercompany balances and transactions have been eliminated in consolidation.
Use of estimates
The preparation of financial statements in conformity with accounting principles generally accepted in the United States requires management to make estimates and assumptions. These estimates and assumptions affect the reported amounts of assets and liabilities and disclosure of contingent assets and liabilities at the date of the financial statements, as well as the reported amounts of revenues and expenses during the reporting periods. Areas of the financial statements where estimates may have the most significant effect include the allowance for doubtful accounts receivable, lives of tangible and intangible assets, impairment of long-lived assets, realization of the deferred tax asset, stock option compensation, revenue recognition and provisions for income taxes. Changes in the facts or circumstances underlying
F-8
Revenue recognition
The Company’s revenue is generated primarily by licensing its software products and providing support, training, consulting, technical, hosted software applications and other professional services for those products. The Company recognizes revenue in accordance with SOP 97-2, “Software Revenue Recognition”, as modified by SOPs 98-4 and 98-9, as well as Technical Practice Aids issued from time to time by American Institute of Certified Public Accountants, and in accordance with the SEC Staff Accounting Bulletin No. (“SAB”) 104, “Revenue Recognition in Financial Statements”.
Under these pronouncements, the Company recognizes revenue from the license of software when persuasive evidence of an arrangement exists, the product has been delivered, the fee is fixed and determinable and collection of the resulting receivable is probable. The Company uses a signed agreement as evidence of an arrangement. Delivery occurs when the product is delivered. The Company’s typical license agreement does not include customer acceptance provisions; if acceptance provisions are provided, delivery is deemed to occur upon acceptance. The Company considers the fee to be fixed or determinable unless the fee is subject to refund or adjustment or is not payable within the Company’s standard payment terms. The Company considers payment terms greater than 90 days to be beyond its customary payment terms. The Company deems collection probable if the Company expects that the customer will be able to pay amounts under the arrangement as they become due. If the Company determines that collection is not probable, the Company postpones recognition of the revenue until cash
F-8
The Company recognizes revenue from maintenance services ratably over the contract term, which is one year. Maintenance revenue also includes the right to unspecified product upgrades on an if-and-when available basis. Subscription revenue includes fees for hosted solutions, data enrichment services and hosted online training programs. Subscription-based revenue and any related set-up fees are recognized ratably over the twelve-month service period of the contracts as there is no discernible pattern of usage.
The Company’s services, which include consulting, installation and implementation services, are generally billed based on hourly rates plus reimbursable travel and lodging related expenses. For small service engagements, less than $10,000, the Company frequently contracts for and bills based on a fixed fee plus reimbursable travel and lodging related expenses. The Company recognizes this revenue upon completion of the work performed. When the Company’s services include software customization, these services are provided to support customer requests for assistance in creating special reports and other minor enhancements that will assist with efforts to improve operational efficiency and/or to support business process improvements. These
F-9
The Company sells training at a fixed rate for each specific class, at a per attendee price, or at a packaged price for several attendees, and revenue is recognized only upon the customer attending and completing training. The Company recognizes revenue from donor prospect research and data modeling services engagements upon delivery.
To the extent that the Company’s customers are billed and/or pay for the above described services in advance of delivery, the amounts are recorded in deferred revenue.
Cash and cash equivalents
The Company considers all highly liquid investments purchased with a maturity of three months or less to be cash equivalents.
Property and equipment
Property and equipment are recorded at cost and depreciated over their estimated useful lives using the straight-line method. Property and equipment subject to capital leases are depreciated over the term of the lease. Upon retirement or sale, the cost of assets disposed of and the related accumulated depreciation are removed from the accounts and any resulting gain or loss is credited or charged to income. Repair and maintenance costs are expensed as incurred.
Construction-in-progress represents purchases of computer software and hardware associated with new internal system implementation projects, which had not been placed in service at the
F-9
Computer software costs represent software purchased from external sources for use in the Company’s internal operations. These amounts have been accounted for in accordance with the American Institute of Certified Public Accountants Statement of Position (“SOP”) 98-1, “Accounting For The Cost of Computer Software Developed or Obtained for Internal Use”.
Goodwill and intangible assets
In 2002, Statement of Financial Accounting Standards (“SFAS”) No. 142, “Goodwill and Other Intangible Assets”, became effective. Under this new standard, the Financial Accounting Standards Board (“FASB”) eliminated amortization of goodwill. In accordance with SFAS No. 142, goodwill is no longer amortized, but instead is tested for impairment at least annually in the fourth quarter of each year using a discounted cash flow valuation methodology. Other intangible assets with finite lives continue to be amortized over their useful lives of three years in accordance with the adoption of SFAS No. 142, “Accounting for the Impairment or Disposal of Long-Lived Assets”.
Identifiable intangible assets, namely technology and customer lists, that arose in connection with acquisitions have been amortized over their estimated useful lives ranging from three to five years.
F-10
Fair value of financial instruments
The fair value of a financial instrument is the amount at which the instrument could be exchanged in a current transaction between willing parties other than in a forced sale or liquidation. The financial instruments of the Company consist primarily of cash and cash equivalents, accounts receivable, accounts payable, long-term debt and capital leases at December 31, 2002 and 2003. The Company believes that the carrying amounts of these financial instruments, with the exception of long-term debt, approximate their fair values due to the immediate or short-term term maturity of these financial instruments at December 31, 2002 and 2003. Since the variable interest rate on the Company’s long-term debt is set for a maximum of 30 days, the Company believes that the carrying value of long-term debt approximates fair value at December 31, 2002 and 2003. The Company paid off its term loan in the first calendar quarter of 2004 and there is no debt outstanding at March 31,September 30, 2004.
Deferred financing fees
Deferred financing fees represent the direct costs of entering into the Company’s credit agreement in October 1999.1999 and its revolving credit facility in September 2004. These costs are amortized as interest expense using the effective interest method. The principal balance of the term loan was paid off in the first calendar quarter of 2004, accordingly the remaining deferred financing fees related to the term loan, were fully recognized as expense in the three month period ended March 31, 2004.
Deferred compensation and stock-based compensation plans
The Company accounts for stock option compensation based on the provisions of Accounting Principles Board Opinion (“APB”) No. 25, “Accounting for Stock Issued to Employees”, which states that no compensation expense is recorded for stock options or other stock-based awards
F-10
Deferred compensation is amortized using the accelerated method over the vesting period of the related stock option in accordance with FASB Interpretation No. (“FIN”) 28. The Company recognized $27,538,000 of stock option compensation expense related to amortization of deferred compensation during the year ended December 31, 2003. The Company has adopted the disclosure requirements of SFAS No. 123, “Accounting for Stock-Based Compensation”, as amended by SFAS No. 148, “Accounting for Stock Based Compensation Transition and Disclosure”, which requires compensation expense to be disclosed based on the fair value of the options granted at the date of the grant.
F-11
Had compensation cost been determined under the market value method using Black-Scholes valuation principles, net income (loss) would have been decreased (increased) to the following pro forma amounts:
| Three months ended | Nine months ended | |||||||||||||||||||||||||||||||||||||||||
| Year ended December 31, | March 31, | Year ended December 31, | September 30, | |||||||||||||||||||||||||||||||||||||||
| (in thousands, except share amounts) | (in thousands, except share amounts) | 2001 | 2002 | 2003 | 2003 | 2004 | (in thousands, except share amounts) | 2001 | 2002 | 2003 | 2003 | 2004 | ||||||||||||||||||||||||||||||
| (unaudited) | (unaudited) | |||||||||||||||||||||||||||||||||||||||||
| Net income (loss), as reported | Net income (loss), as reported | $ | 8,906 | $ | 15,640 | $ | (478 | ) | $ | (51 | ) | $ | 3,997 | Net income (loss), as reported | $ | 8,906 | $ | 15,640 | $ | (478 | ) | $ | (349 | ) | $ | 16,927 | ||||||||||||||||
| Total stock option compensation expense, net of related tax effects included in the determination of net income (loss) as reported | — | — | 19,855 | 4,555 | 738 | |||||||||||||||||||||||||||||||||||||
| Total stock option compensation expense (income), net of related tax effects included in the determination of net income (loss) as reported | Total stock option compensation expense (income), net of related tax effects included in the determination of net income (loss) as reported | — | — | 19,855 | 14,760 | (514 | ) | |||||||||||||||||||||||||||||||||||
| Total stock option compensation expense, net of related tax effects that would have been included in the determination of net income (loss) if the fair value method had been applied to all awards | Total stock option compensation expense, net of related tax effects that would have been included in the determination of net income (loss) if the fair value method had been applied to all awards | (2,462 | ) | (1,636 | ) | (13,525 | ) | (3,219 | ) | (547 | ) | Total stock option compensation expense, net of related tax effects that would have been included in the determination of net income (loss) if the fair value method had been applied to all awards | (2,462 | ) | (1,636 | ) | (13,525 | ) | (9,796 | ) | (3,063 | ) | ||||||||||||||||||||
| Pro forma net income | Pro forma net income | $ | 6,444 | $ | 14,004 | $ | 5,852 | $ | 1,285 | $ | 4,188 | Pro forma net income | $ | 6,444 | $ | 14,004 | $ | 5,852 | $ | 4,615 | $ | 13,350 | ||||||||||||||||||||
| Earnings (loss) per share: | Earnings (loss) per share: | Earnings (loss) per share: | ||||||||||||||||||||||||||||||||||||||||
| Basic, as reported | $ | 0.13 | $ | 0.23 | $ | (0.01 | ) | $ | 0.00 | $ | 0.06 | Basic, as reported | $ | 0.21 | $ | 0.37 | $ | (0.01 | ) | $ | (0.01 | ) | $ | 0.40 | ||||||||||||||||||
| Basic, pro forma | $ | 0.10 | $ | 0.20 | $ | 0.09 | $ | 0.02 | $ | 0.06 | Basic, pro forma | $ | 0.16 | $ | 0.33 | $ | 0.14 | $ | 0.11 | $ | 0.31 | |||||||||||||||||||||
| Diluted, as reported | $ | 0.13 | $ | 0.23 | $ | (0.01 | ) | $ | 0.00 | $ | 0.05 | Diluted, as reported | $ | 0.21 | $ | 0.37 | $ | (0.01 | ) | $ | (0.01 | ) | $ | 0.36 | ||||||||||||||||||
| Diluted, pro forma | $ | 0.10 | $ | 0.20 | $ | 0.08 | $ | 0.02 | $ | 0.06 | Diluted, pro forma | $ | 0.16 | $ | 0.33 | $ | 0.14 | $ | 0.10 | $ | 0.29 | |||||||||||||||||||||
The pro forma amount reflects all options granted. Pro forma compensation cost may not be representative of that expected in future years.
F-11
Significant assumptions used in the Black-Scholes option pricing model computations are as follows:
| Three months | Nine months | |||||||||||||||||||||||||||||||||||||||
| Year ended December 31, | ended March 31, | Year ended December 31, | ended September 30, | |||||||||||||||||||||||||||||||||||||
| 2001 | 2002 | 2003 | 2003 | 2004 | 2001 | 2002 | 2003 | 2003 | 2004 | |||||||||||||||||||||||||||||||
| (unaudited) | (unaudited) | |||||||||||||||||||||||||||||||||||||||
| Volatility | 0.00% | 0.00% | 0.00% | 0.00% | 0.00% | 0.00% | 0.00% | 0.00% | 0.00% | 78.02% | ||||||||||||||||||||||||||||||
| Dividend yield | 0.00% | 0.00% | 0.00% | 0.00% | 0.00% | 0.00% | 0.00% | 0.00% | 0.00% | 0.00% | ||||||||||||||||||||||||||||||
| Risk-free interest rate | 6.04% | 3.54%-6.69% | 3.68% | 3.87% | 3.61% | 6.04% | 3.54%-6.69% | 3.68% | 3.62% | 3.68% | ||||||||||||||||||||||||||||||
| Expected option life in years | 6.81 | 7.27 | 7.47 | 7.39 | 7.52 | 6.81 | 7.27 | 7.47 | 7.35 | 7.90 | ||||||||||||||||||||||||||||||
F-12
Accumulated other comprehensive income (loss)
Accumulated other comprehensive income (loss) was as follows:
| Foreign | Foreign | |||||||||||||||||||||||
| currency | currency | |||||||||||||||||||||||
| translation | Derivative | translation | Derivative | |||||||||||||||||||||
| (in thousands) | adjustments | instruments | Total | adjustments | instruments | Total | ||||||||||||||||||
| Balance at December 31, 2000 | $ | (14 | ) | $ | — | $ | (14 | ) | $ | (14 | ) | $ | — | $ | (14 | ) | ||||||||
| Current period change | 36 | 216 | 252 | 36 | 216 | 252 | ||||||||||||||||||
| Balance at December 31, 2001 | 22 | 216 | 238 | 22 | 216 | 238 | ||||||||||||||||||
| Current period change | 134 | (605 | ) | (471 | ) | 134 | (605 | ) | (471 | ) | ||||||||||||||
| Balance at December 31, 2002 | 156 | (389 | ) | (233 | ) | 156 | (389 | ) | (233 | ) | ||||||||||||||
| Current period change | 362 | 389 | 751 | 362 | 389 | 751 | ||||||||||||||||||
| Balance at December 31, 2003 | 518 | — | 518 | 518 | — | 518 | ||||||||||||||||||
| Current period change (unaudited) | (167 | ) | — | (167 | ) | (342 | ) | — | (342 | ) | ||||||||||||||
| Balance at March 31, 2004 (unaudited) | $ | 351 | $ | — | $ | 351 | ||||||||||||||||||
| Balance at September 30, 2004 (unaudited) | $ | 176 | $ | — | $ | 176 | ||||||||||||||||||
Total comprehensive income (loss) tax for the threenine months ended March 31,September 30, 2003 was $16,000.
Income taxes
Prior to October 13, 1999, the Company was organized as an S corporation under the Internal Revenue Code and, therefore, was not subject to federal income taxes. The Company historically made distributions to its shareholders to cover the shareholders’ anticipated tax liability. In connection with the recapitalization agreement, the Company converted its U.S. taxable status from an S corporation to a C corporation and, accordingly, since October 14, 1999 has been subject to federal and state income taxes. Upon the conversion and in connection with the recapitalization, the Company recorded a one-time benefit of $107,000,000 to establish a deferred tax asset as a result of the recapitalization agreement. This
F-12
Significant judgment is required in determining the provision for income taxes. During the ordinary course of business, there are many transactions and calculations for which the ultimate tax determination is uncertain. We record our tax provision at the anticipated tax rates based on estimates of annual pretax income. To the extent that the final results differ from these estimated amounts that were initially recorded, such differences will impact the income tax provision in the period in which such determination is made and could have an impact on the deferred tax asset. Our deferred tax assets and liabilities are recorded at an amount based upon a U.S. Federal income tax rate of 34%. This rate is based on our expectation that our deductible and taxable temporary differences will reverse over a period of years during which we will have average annual taxable income not exceeding $10.0 million
F-13
Foreign currency translation
The Company’s financial statements are translated into U.S. dollars in accordance with SFAS No. 52, “Foreign Currency Translation”. For all operations outside the United States net assets are translated at the current rates of exchange. Income and expense items are translated at the average exchange rate for the year and balance sheet accounts are translated at the period ending rate. The resulting translation adjustments are recorded in accumulated other comprehensive income.
Software development costs
Software development costs have been accounted for in accordance with SFAS No. 86, “Accounting for the Costs of Computer Software to be Sold, Leased or Otherwise Marketed”. Under the standard, capitalization of software development costs begins upon the establishment of technological feasibility, subject to net realizable value considerations. To date, the period between achieving technological feasibility and the general availability of such software has substantially coincided; therefore, software development costs qualifying for capitalization have been immaterial. Accordingly, the Company has not capitalized any software development costs and has charged all such costs to product development expense.
Sales returns and allowance for doubtful accounts
The Company provides customers a 30-day right of return and maintains a reserve for returns which is estimated based on historical experience. Provisions for sales returns are charged against the related revenue items.
F-13
In addition, the Company records an allowance for doubtful accounts that reflects estimates of probable credit losses. Accounts are charged against the allowance after all means of collection are exhausted and recovery is considered remote. Provisions for doubtful accounts are recorded in general and administrative expense.
Below is a summary of the changes in the Company’s allowance for doubtful accounts.
| Balance | Balance | |||||||||||||||
| Year ended December 31, | at beginning | at end | ||||||||||||||
| (in thousands) | of period | Provision | Write-off | of period | ||||||||||||
| 2001 | $ | 740 | $ | 1,612 | $ | (1,818) | $ | 534 | ||||||||
| 2002 | 534 | 1,155 | (1,046) | 643 | ||||||||||||
| 2003 | 643 | 664 | (955) | 352 | ||||||||||||
| Balance | Balance | Balance | Balance | |||||||||||||||||||||||||||||
| Three months ended March 31, (unaudited) | at beginning | at end | ||||||||||||||||||||||||||||||
| Nine months ended September 30, (unaudited) | at beginning | at end | ||||||||||||||||||||||||||||||
| (in thousands) | of period | Provision | Write-off | of period | of period | Provision | Write-off | of period | ||||||||||||||||||||||||
| 2003 | $ | 643 | $ | 113 | $ | (393) | $ | 363 | $ | 643 | $ | 498 | $ | (716) | $ | 425 | ||||||||||||||||
| 2004 | 352 | 82 | (70) | 364 | 352 | 535 | (217) | 670 | ||||||||||||||||||||||||
F-14
Below is a summary of the changes in the Company’s allowance for sales returns.
| Balance | Balance | |||||||||||||||
| Year ended December 31, | at beginning | at end | ||||||||||||||
| (in thousands) | of period | Provision | Write-off | of period | ||||||||||||
| 2001 | $ | 449 | $ | 1,596 | $ | (1,376) | $ | 669 | ||||||||
| 2002 | 669 | 1,365 | (1,468) | 566 | ||||||||||||
| 2003 | 566 | 512 | (208) | 870 | ||||||||||||
| Balance | Balance | Balance | Balance | |||||||||||||||||||||||||||||
| Three months ended March 31, (unaudited) | at beginning | at end | ||||||||||||||||||||||||||||||
| Nine months ended September 30, (unaudited) | at beginning | at end | ||||||||||||||||||||||||||||||
| (in thousands) | of period | Provision | Write-off | of period | of period | Provision | Write-off | of period | ||||||||||||||||||||||||
| 2003 | $ | 566 | $ | 290 | $ | (22) | $ | 834 | $ | 566 | $ | 384 | $ | (156) | $ | 794 | ||||||||||||||||
| 2004 | 870 | 209 | (199) | 880 | 870 | 645 | (654) | 861 | ||||||||||||||||||||||||
Sales commissions
The Company pays sales commissions at the time contracts with customers are signed. To the extent that these commissions relate to revenue not yet recognized, these amounts are recorded as deferred sales commission costs. Subsequently, the commissions are recognized as expense in the same pattern as the revenue is recognized in accordance with SAB 101.
Below is a summary of the changes in the Company’s deferred sales commission costs.
| Balance | Balance | |||||||||||||||
| Year ended December 31, | at beginning | at end | ||||||||||||||
| (in thousands) | of period | Additions | Expense | of period | ||||||||||||
| 2001 | $ | — | $ | 555 | $ | (277) | $ | 278 | ||||||||
| 2002 | 278 | 1,241 | (1,041) | 478 | ||||||||||||
| 2003 | 478 | 1,908 | (1,582) | 804 | ||||||||||||
| Balance | Balance | Balance | Balance | |||||||||||||||||||||||||||||
| Three months ended March 31, (unaudited) | at beginning | at end | ||||||||||||||||||||||||||||||
| Nine months ended September 30, (unaudited) | at beginning | at end | ||||||||||||||||||||||||||||||
| (in thousands) | of period | Additions | Expense | of period | of period | Additions | Expense | of period | ||||||||||||||||||||||||
| 2003 | $ | 478 | $ | 328 | $ | (211) | $ | 595 | $ | 478 | $ | 1,366 | $ | (1,024 | ) | $ | 820 | |||||||||||||||
| 2004 | 804 | 552 | (483) | 873 | $ | 804 | $ | 1,406 | $ | (1,498 | ) | $ | 712 | |||||||||||||||||||
F-14
Advertising costs
Advertising costs are expensed as incurred and were $389,000, $371,000 and $365,000 for the years ended December 31, 2001, 2002 and 2003 and $54,000$270,000 and $75,000$165,000 for the threenine months ended March 31,September 30, 2003 and 2004, respectively.
Impairment of long-lived assets
The Company evaluates the recoverability of its property and equipment and other assets in accordance with SFAS No. 144, “Accounting for the Impairment or Disposal of Long-Lived Assets”. SFAS No. 144 requires that one accounting model be used for long-lived assets to be disposed of by sale, whether previously held and used or newly acquired. An impairment loss is recognized when the net book value of such assets exceeds the estimated future undiscounted cash flows attributable to the assets or the business to which the assets relate. Impairment losses are measured as the amount by which the carrying value exceeds the fair value of the assets.
F-15
Derivatives
The Company used a derivative financial instrument to manage its exposure to fluctuations in interest rates on its long term debt by entering into an interest rate exchange agreement, a swap.
On January 1, 2001, the Company adopted SFAS No. 133, “Accounting for Derivative Instruments and Hedging Activities”, as amended by SFAS No. 137, “Accounting for Derivative Instruments and Hedging Activities— Deferral of the Effective Date of FASB Statement No. 133— an amendment of FASB Statement No. 133”, SFAS No. 138, “Accounting for Certain Derivative Instruments and Certain Hedging Activities— an Amendment of FASB Statement No. 133” and SFAS No. 149, “Amendment of Statement No. 133 on Derivative Instruments and Hedging Activities”. These statements establish accounting and reporting standards for derivative instruments and require recognition of all derivatives as either assets or liabilities in the statements of financial position and measurement of those instruments at fair value. Changes in the fair value of highly effective derivatives are recorded in accumulated other comprehensive income (loss). The Company’s swap agreement has been designated and is effective as a cash flow hedge and, as such, changes in the fair value of the derivative instrument are substantially offset in the consolidated statement of operations by changes in the fair value of the hedged item. See note 9.
Shipping and handling
Shipping and handling costs are expensed as incurred and included in cost of license fees. The reimbursement of these costs by our customers is included in license fees.
Earnings (loss) per share
The Company computes earnings per common share in accordance with SFAS No. 128, “Earnings Per Share”. Under the provisions of SFAS No. 128, basic earnings per share is computed by dividing net income (loss) available to common shareholders by the weighted average number of common shares outstanding. Diluted earnings per share is computed by dividing net income (loss) available to common shareholders by the weighted average number of common shares and dilutive potential common share equivalents then outstanding. Potential common shares consist of shares issuable upon the exercise of stock options. The Company had
F-15
F-16
The following table sets forth the computation of basic and fully diluted earnings per share:
| Nine months ended | ||||||||||||||||||||||||||||||||||||||||||
| Year Ended December 31, | Three months ended March 31, | Year ended December 31, | September 30, | |||||||||||||||||||||||||||||||||||||||
| (in thousands except | (in thousands except | (in thousands except | ||||||||||||||||||||||||||||||||||||||||
| share amounts) | share amounts) | 2001 | 2002 | 2003 | 2003 | 2004 | share amounts) | 2001 | 2002 | 2003 | 2003 | 2004 | ||||||||||||||||||||||||||||||
| (unaudited) | (unaudited) | |||||||||||||||||||||||||||||||||||||||||
| Numerator: | Numerator: | Numerator: | ||||||||||||||||||||||||||||||||||||||||
| Net income (loss) | Net income (loss) | $ | 8,906 | $ | 15,640 | $ | (478 | ) | $ | (51 | ) | $ | 3,997 | Net income (loss) | $ | 8,906 | $ | 15,640 | $ | (478 | ) | $ | (349 | ) | $ | 16,927 | ||||||||||||||||
| Denominator: | Denominator: | Denominator: | ||||||||||||||||||||||||||||||||||||||||
| Weighted average common shares | Weighted average common shares | 66,388,526 | 67,776,656 | 67,832,951 | 67,776,656 | 67,857,599 | Weighted average common shares | 41,492,829 | 42,360,410 | 42,395,594 | 42,391,299 | 42,480,059 | ||||||||||||||||||||||||||||||
| Add effect of dilutive securities: | Add effect of dilutive securities: | Add effect of dilutive securities: | ||||||||||||||||||||||||||||||||||||||||
| Employee stock options | — | — | — | — | 5,965,657 | Employee stock options | — | — | — | — | 3,986,927 | |||||||||||||||||||||||||||||||
| Weighted average common shares assuming dilution | Weighted average common shares assuming dilution | 66,388,526 | 67,776,656 | 67,832,951 | 67,776,656 | 73,823,256 | Weighted average common shares assuming dilution | 41,492,829 | 42,360,410 | 42,395,594 | 42,391,299 | 46,466,986 | ||||||||||||||||||||||||||||||
| Earnings (loss) per share: | Earnings (loss) per share: | Earnings (loss) per share: | ||||||||||||||||||||||||||||||||||||||||
| Basic | $ | 0.13 | $ | 0.23 | $ | (0.01 | ) | $ | — | $ | 0.06 | Basic | $ | 0.21 | $ | 0.37 | $ | (0.01 | ) | $ | (0.01 | ) | $ | 0.40 | ||||||||||||||||||
| Diluted | $ | 0.13 | $ | 0.23 | $ | (0.01 | ) | $ | — | $ | 0.05 | Diluted | $ | 0.21 | $ | 0.37 | $ | (0.01 | ) | $ | (0.01 | ) | $ | 0.36 | ||||||||||||||||||
New accounting pronouncements
In January 2002, the Emerging Issues Task Force of the FASB (“EITF”) reached a consensus on EITF Issue 01-14, “Income Statement Characterization of Reimbursements Received for Out-of-Pocket Expenses Incurred”, which requires that reimbursements received for out-of-pocket expenses incurred be characterized as revenue in the income statement. The Company adopted EITF 01-14 effective January 1, 2002 and has made the appropriate reclassifications as required by EITF 01-14. Income resulting from reimbursable expenses is included in other revenue and was $1,252,000, $1,410,000 and $1,840,000 for the years ended December 31, 2001, 2002 and 2003, and $227,000$1,352,000 and $351,000$1,691,000 for the threenine month periods ended March 31,September 30, 2003 and 2004, respectively. The associated expenses are included in cost of other revenue on the face of the statement of operations.
In July 2002, the FASB issued SFAS No. 146, “Accounting for Costs Associated with Exit or Disposal Activities”, which is effective for exit or disposal activities that are initiated after December 31, 2002. The Company adopted SFAS No. 146 during fiscal year 2003. SFAS No. 146 nullifies EITF Issue No. 94-3, “Liability Recognition for Certain Employee Termination Benefits and Other Costs to Exit an Activity (including Certain Costs Incurred in a Restructuring)”, and requires that a liability for costs associated with an exit or disposal activity be recognized as incurred. The impact of SFAS No. 146 will be dependent upon decisions made by the Company in the future and has had no impact on the Company to date.
F-16
In January 2003, the Company adopted FIN No. 45, “Guarantor’s Accounting and Disclosure Requirements for Guarantees, Including Indirect Guarantees of Indebtedness of Others, an Interpretation of FASB Statements No. 5, 57, and 107 and Rescission of FASB Interpretation No. 34”. The interpretation requires that upon issuance of a guarantee, the entity must recognize a liability for the fair value of the obligation it assumes under that guarantee. The initial recognition and measurement provisions of FIN No. 45 are effective for guarantees
F-17
In January 2003, the FASB issued FIN No. 46, “Consolidation of Variable Interest Entities”. This statement was subsequently amended under the provisions of FIN 46-R, which is effective for public entities no later than the end of the first reporting period ending after March 15, 2004. This interpretation clarifies the application of Accounting Research Bulletin No. 51, “Consolidated Financial Statements”, to certain entities in which equity investors do not have the characteristics of a controlling financial interest or do not have sufficient equity at risk for the entity to finance its activities without additional subordinated financial support from other parties. FIN No. 46 applies immediately to variable interest entities created after January 31, 2003, and to variable interest entities in which an enterprise obtains an interest after that date. The adoption of this interpretation has not had a material impact on the Company’s consolidated financial position, consolidated results of operations, or liquidity.
In May 2003, the FASB issued SFAS No. 150, “Accounting for Certain Financial Instruments with Characteristics of Liabilities and Equity”. This statement establishes standards for how an issuer classifies and measures certain financial instruments with characteristics of both liabilities and equity. It requires that an issuer classify a financial instrument that is within its scope as a liability. Many of those instruments were previously classified as equity. Most of the guidance in SFAS No. 150 is effective for all financial instruments entered into or modified after May 31, 2003. The adoption of SFAS No. 150 has not had a material impact on the Company’s financial position.
2. Acquisitions
In July 2002, to gain market share in the United Kingdom, the Company acquired substantially all of the assets of AppealMaster, Ltd., a software company in the United Kingdom, for $500,000 and additional contingent payments based on future performance, which have been recorded as additional purchase price. This purchase price has been allocated to the assets acquired and the liabilities assumed based upon their estimated fair values at the date of acquisition. The excess consideration above the fair value of net assets acquired of $852,000 was recorded as goodwill, which is deductible for tax purposes, in July 2002. As a result of payments of contingent consideration of $431,000 and an increase of $103,000 resulting from foreign currency translation, the balance of goodwill at December 31, 2003 is $1,386,000. In addition, in 2003 the Company paid $62,000 to the previous controlling AppealMaster shareholder for consulting services, as defined in the acquisition agreement and recorded this amount as an expense. The Company may be required to pay up to an additional $360,000 contingent upon cash receipts from customers as defined in the agreement. To the extent that the Company is required to pay all or a portion of this amount, it will be treated as additional consideration and recorded as goodwill. No identifiable intangible assets were recorded as part of the AppealMaster purchase accounting.
F-17
During the three-year period ended December 31, 2003, the Company made other acquisitions that were not significant. These acquisitions were accounted for under the purchase method of accounting and the results of operations of the acquirees have been included in the consolidated statement of operations since the acquisition dates. There were no acquisitions during the nine month period ended September 30, 2004.
F-18
3. Property and equipment
Property and equipment includes assets under capital lease for $1,830,000, $1,830,000 and $1,830,000 on a gross basis and $1,020,000, $750,000 and $750,000$554,000 on a net basis as of December 31, 2002 and 2003 and March 31,September 30, 2004, respectively. Property and equipment as of December 31, 2002 and 2003 and March 31,September 30, 2004, respectively, consisted of the following:
| Estimated | |||||||||||||||||||||||||||||
| December 31, | |||||||||||||||||||||||||||||
| Estimated | December 31, | September 30, | |||||||||||||||||||||||||||
| useful life | March 31, | useful life | |||||||||||||||||||||||||||
| (in thousands) | (years) | 2002 | 2003 | 2004 | (years) | 2002 | 2003 | 2004 | |||||||||||||||||||||
| (unaudited) | (unaudited) | ||||||||||||||||||||||||||||
| Equipment | 3 - 5 | $ | 4,031 | $ | 4,494 | $ | 4,749 | 3 - 5 | $ | 4,031 | $ | 4,494 | $ | 4,909 | |||||||||||||||
| Computer hardware | 3 - 5 | 10,706 | 10,316 | 10,876 | 3 - 5 | 10,706 | 10,316 | 11,382 | |||||||||||||||||||||
| Computer software | 3 - 5 | 2,699 | 3,428 | 3,923 | 3 - 5 | 2,699 | 3,428 | 4,254 | |||||||||||||||||||||
| Construction in progress | — | 482 | 1,025 | 237 | — | 482 | 1,025 | 124 | |||||||||||||||||||||
| Furniture and fixtures | 7 | 3,105 | 3,309 | 3,434 | 7 | 3,105 | 3,309 | 3,423 | |||||||||||||||||||||
| Leasehold improvements | term of lease | 110 | 172 | 241 | term of lease | 110 | 172 | 251 | |||||||||||||||||||||
| 21,133 | 22,744 | 23,460 | 21,133 | 22,744 | 24,343 | ||||||||||||||||||||||||
| Less: accumulated depreciation | (14,432 | ) | (16,123 | ) | (16,758 | ) | (14,432 | ) | (16,123 | ) | (17,989 | ) | |||||||||||||||||
| $ | 6,701 | $ | 6,621 | $ | 6,702 | $ | 6,701 | $ | 6,621 | $ | 6,354 | ||||||||||||||||||
Depreciation expense was $2,552,000, $2,447,000 and $2,781,000 for 2001, 2002 and 2003, and $668,000$2,179,000 and $635,000$1,889,000 for the threenine months ended March 31,September 30, 2003 and 2004, respectively.
4. Goodwill
Goodwill consisted of the following as of December 31, 2002 and 2003 and March 31,September 30, 2004:
| (in thousands) | (in thousands) | (in thousands) | ||||||||
| Balance at December 31, 2001 | Balance at December 31, 2001 | $ | — | Balance at December 31, 2001 | $ | — | ||||
| Acquisition | 852 | Acquisition | 852 | |||||||
| Balance at December 31, 2002 | Balance at December 31, 2002 | 852 | Balance at December 31, 2002 | 852 | ||||||
| Payment of contingent consideration | 431 | Payment of contingent consideration | 431 | |||||||
| Effect of foreign currency translation | 103 | Effect of foreign currency translation | 103 | |||||||
| Balance at December 31, 2003 | Balance at December 31, 2003 | $ | 1,386 | Balance at December 31, 2003 | $ | 1,386 | ||||
| Payment of contingent consideration (unaudited) | 8 | Payment of contingent consideration (unaudited) | 57 | |||||||
| Effect of foreign currency translation (unaudited) | 45 | Effect of foreign currency translation (unaudited) | 28 | |||||||
| Balance at March 31, 2004 (unaudited) | $ | 1,439 | ||||||||
| Balance at September 30, 2004 (unaudited) | Balance at September 30, 2004 (unaudited) | $ | 1,471 | |||||||
F-18F-19
5. Other current assets
Other current assets consisted of the following as of December 31, 2002 and 2003 and March 31,September 30, 2004:
| December 31, | December 31, | September 30, | ||||||||||||||||||||||
| March 31, | ||||||||||||||||||||||||
| (in thousands) | 2002 | 2003 | 2004 | 2002 | 2003 | 2004 | ||||||||||||||||||
| (unaudited) | (unaudited) | |||||||||||||||||||||||
| Deferred sales commission costs | $ | 478 | $ | 804 | $ | 873 | $ | 478 | $ | 804 | $ | 712 | ||||||||||||
| Prepaid rent | 66 | 467 | 477 | 66 | 467 | 462 | ||||||||||||||||||
| Prepaid insurance | 138 | 138 | 51 | 138 | 138 | 522 | ||||||||||||||||||
| Prepaid data costs | — | 107 | 63 | — | 107 | 118 | ||||||||||||||||||
| Prepaid real estate commissions | 84 | 107 | 99 | 84 | 107 | 104 | ||||||||||||||||||
| Prepaid software maintenance and royalties | 409 | 727 | 585 | 409 | 727 | 670 | ||||||||||||||||||
| Other | 77 | 363 | 463 | 77 | 363 | 461 | ||||||||||||||||||
| $ | 1,252 | $ | 2,713 | $ | 2,611 | $ | 1,252 | $ | 2,713 | $ | 3,049 | |||||||||||||
6. Accrued expenses and other current liabilities
Accrued expenses and other current liabilities consisted of the following as of December 31, 2002 and 2003 and March 31,September 30, 2004:
| December 31, | December 31, | September 30, | ||||||||||||||||||||||
| March 31, | ||||||||||||||||||||||||
| (in thousands) | 2002 | 2003 | 2004 | 2002 | 2003 | 2004 | ||||||||||||||||||
| (unaudited) | (unaudited) | |||||||||||||||||||||||
| Accrued bonuses | $ | 2,964 | $ | 2,990 | $ | 1,043 | $ | 2,964 | $ | 2,990 | $ | 2,920 | ||||||||||||
| Accrued costs of initial public offering | — | — | 950 | — | — | 124 | ||||||||||||||||||
| Accrued cash component of stock option compensation | — | 1,693 | 1,693 | — | 1,693 | 1,763 | ||||||||||||||||||
| Accrued commissions and salaries | 957 | 1,386 | 511 | 957 | 1,386 | 844 | ||||||||||||||||||
| Taxes payable | 1,382 | 2,018 | 2,432 | 1,382 | 2,018 | 4,199 | ||||||||||||||||||
| Other | 2,453 | 1,572 | 1,166 | 2,453 | 1,572 | 2,246 | ||||||||||||||||||
| $ | 7,756 | $ | 9,659 | $ | 7,795 | $ | 7,756 | $ | 9,659 | $ | 12,096 | |||||||||||||
7. Deferred revenue
Deferred revenue consisted of the following as of December 31, 2002 and 2003 and March 31,September 30, 2004:
| December 31, | December 31, | September 30, | ||||||||||||||||||||||
| March 31, | ||||||||||||||||||||||||
| (in thousands) | 2002 | 2003 | 2004 | 2002 | 2003 | 2004 | ||||||||||||||||||
| (unaudited) | (unaudited) | |||||||||||||||||||||||
| Maintenance and subscriptions | $ | 33,187 | $ | 37,077 | $ | 36,068 | $ | 33,187 | $ | 37,077 | $ | 41,820 | ||||||||||||
| Services | 5,787 | 6,594 | 7,697 | 5,787 | 6,594 | 9,891 | ||||||||||||||||||
| License fees and other | 73 | 2 | — | 73 | 2 | 16 | ||||||||||||||||||
| $ | 39,047 | $ | 43,673 | $ | 43,765 | $ | 39,047 | $ | 43,673 | $ | 51,727 | |||||||||||||
F-19F-20
8. Long-term debt
On October 13, 1999, the Company entered into a $130,000,000 credit agreement with a group of banks. The credit agreement provides for an aggregate availability of $130,000,000, including a $115,000,000 term loan and a $15,000,000 revolving credit facility. Both facilities mature on September 30, 2005. The loans bear interest at the prime rate or Eurodollar rate plus an applicable margin, as defined in the agreement, and are collateralized by all the property of the Company. The Company had no amounts outstanding on the revolving credit facility at December 31, 2002 and 2003 and March 31,September 30, 2004. The term loan requires payments of principal quarterly with interest payable in either one-, two-, three-, or six-month periods as defined in the agreement. The interest rate on the term loan was 3.61% as of December 31, 2003. The agreement requires the Company to maintain certain financial covenants. The most restrictive covenants include (1) limitations on indebtedness of the Company; (2) certain restrictions on dividend distributions; (3) limitations on capital expenditures; (4) minimum interest coverage ratio; (5) maximum leverage ratio; and (6) minimum consolidated adjusted earnings before interest, taxes, depreciation, and amortization, all of the preceding as defined.
During 2001, the Company amended its credit agreement. As part of this amendment, Blackbaud LLC (“LLC”), a wholly-owned subsidiary of the Company, was created. In addition, Blackbaud Europe and Blackbaud Pacific were incorporated in the United Kingdom and Australia, respectively. The Company transferred all of its operating assets to the LLC and then pledged both the stock and assets of the LLC, as well as 66% of its stock in both Blackbaud Europe and Blackbaud Pacific, to the bank as collateral for the Company’s outstanding term loan. This amendment also changed certain of the Company’s financial covenants and allowed for (1) up to $2.5 million in expansion expenditures to be incurred by the Company prior to June 30, 2002, as defined, and (2) modified the amount the Company could incur related to acquisition-related expenditures over the term of the agreement. As of December 31, 2003, the Company was in compliance with all of its covenants. The principal balance of the Company’s term loan was paid off during the first calendar quarter of 2004; accordingly, as of March 31,September 30, 2004, the Company had no remaining balance on the term loan.
The required future principal payments under the term loan outstanding as of December 31, 2003 were as follows (in thousands):
| 2004 | $ | — | ||
| 2005 | 5,000 | |||
| $ | 5,000 | |||
Amortization expense for deferred financing costs was $513,000, $935,000 and $858,000 for the years ended December 31, 2001, 2002 and 2003, and $312,000$702,000 and $156,000 for the threenine months ended March 31,September 30, 2003 and 2004, respectively. Of these amounts, $0, $422,000 and $345,000 in 2001, 2002 and 2003, respectively, represented charges associated with earlier than required principal repayment. The deferred financing fees have been fully amortized to interest expense as of March 31, 2004 as a result of making the final debt payment.
Revolving Credit Facility (unaudited)
On September 30, 2004, the Company closed a new $30.0 million revolving credit facility, which replaces its prior $15.0 million revolving credit facility that was canceled in July 2004. Amounts
F-21
9. Derivative financial instruments
The Company’s only derivative instrument, as defined under the various technical pronouncement discussed in note 1, is its interest rate swap.
F-20
The Company formally documents all relations between its hedging instruments and the hedged items, as well as its risk-management objectives and strategy for undertaking various hedge transactions. The Company formally assesses, both at the hedge’s inception and on an ongoing basis, whether the derivatives that are used in hedging transactions are highly effective in offsetting changes in the hedged items.
The Company has used interest rate swap agreements in the normal course of business to manage its exposure to interest rate changes. Such agreements are considered hedges of specific borrowings, and differences paid and received under the swap agreements are recognized as adjustments to interest expense. At December 31, 2002, the Company had an interest rate swap agreement that carried a total notional amount of $50,000,000, with the Company paying interest at a fixed rate of 2.738% and receiving a variable amount equal to the one-month Eurodollar rate (1.38% at December 31, 2002). The swap matured on December 29, 2003, and the notional amount of the swap decreased over time commensurate with scheduled repayments of the Company’s debt. The Company recorded interest expense in connection with the swap agreement of $750,000, $503,000 and $423,000 and for the years ended December 31, 2001, 2002 and 2003, and $144,000$366,000 and $0 for the threenine months ended March 31,September 30, 2003 and 2004, respectively.
The Company has no outstanding interest rate swap agreements, or other derivative instruments outstanding as of December 31, 2003 and March 31,September 30, 2004.
10. Commitments and contingencies
The Company currently leases office space and various equipment under operating leases and capital leases. Total rental expense was $3,064,000, $3,434,000 and $3,495,000 for the years ended December 31, 2001, 2002 and 2003, and $846,000$1,352,499 and $796,000$1,690,752 for the threenine months
F-22
| Year ending December 31, | Operating | Capital | ||||||
| (in thousands) | leases | leases | ||||||
| 2004 | $ | 4,105 | $ | 153 | ||||
| 2005 | 4,282 | 44 | ||||||
| 2006 | 4,373 | — | ||||||
| 2007 | 4,385 | — | ||||||
| 2008 | 4,779 | — | ||||||
| Thereafter | 7,930 | — | ||||||
| Total minimum lease payments | $ | 29,854 | 197 | |||||
| Less: portion representing interest | 11 | |||||||
| Present value of net minimum lease payments | 186 | |||||||
| Less: current maturities | 142 | |||||||
| Long-term maturities | $ | 44 | ||||||
F-21
Lease agreement
On October 13, 1999, the Company entered into a lease agreement for office space with Duck Pond Creek, LLC, which is owned by certain minority shareholders of the Company. The term of the lease is for ten years with two five-year renewal options by the Company. The annual base rent of the lease is $4,316,000 payable in equal monthly installments and is included in the above table. The base rate escalates annually at a rate equal to the change in the consumer price index, as defined in the agreement.
The Company has subleased a portion of its headquarters facility under various agreements extending through 2007. Under these agreements, rent expense was reduced by $1,171,000, $477,000 and $441,000 in 2001, 2002 and 2003 and $53,000$341,000 and $109,000$346,000 for the threenine months ended March 31,September 30, 2003 and 2004, respectively. The operating lease commitments above will be reduced by minimum aggregate sublease commitments of $497,000, $393,000, $402,000, $395,000, $54,000 and $0 for the periods 2004, 2005, 2006, 2007 and 2008 and thereafter, respectively. The Company has also received and expects to receive through 2015 quarterly South Carolina state incentive payments as a result of locating its headquarters facility in Berkley County, South Carolina. These amounts are recorded as a reduction of rent expense and were $0, $848,000 and $1,077,000 in 2001, 2002 and 2003, and $240,000$852,000 and $256,000$804,000 for the threenine months ended March 31,September 30, 2003 and 2004, respectively.
Other commitments
The Company has a commitment of $200,000 payable annually through 2009 for certain naming rights with an entity owned by a minority shareholder of the Company. The Company incurred expense under this agreement of $200,000 per year for each of the three years ended December 31, 2001, 2002 and 2003 and $50,000$150,000 for the threenine month period ending March 31,September 30, 2004.
F-23
The Company utilizes third party relationships in conjunction with its products. The contractual arrangements vary in length from one to three years. One of these arrangements requires a minimum annual purchase commitment of $50,000, an amount which the Company has exceeded in each of the past three years.
Legal contingencies
The Company is subject to legal proceedings and claims which have arisen in the ordinary course of business. The Company does not believe the amount of potential liability with respect to these actions will have a material adverse effect upon the Company’s financial position or results of operations.
F-22
11. Income taxes
The following summarizes the components of the income tax expense:
| Three months ended | ||||||||||||||||||||||||||||||||
| Year ended December 31, | March 31, | |||||||||||||||||||||||||||||||
| Year ended December 31, | Year ended December 31, | |||||||||||||||||||||||||||||||
| (in thousands) | 2001 | 2002 | 2003 | 2003 | 2004 | 2001 | 2002 | 2003 | ||||||||||||||||||||||||
| (unaudited) | ||||||||||||||||||||||||||||||||
| Current provision | $ | 88 | $ | 156 | $ | 1,769 | $ | 189 | $ | 715 | $ | 88 | $ | 156 | $ | 1,769 | ||||||||||||||||
| Deferred provision | 5,400 | 9,010 | 2,178 | 232 | 2,041 | 5,400 | 9,010 | 2,178 | ||||||||||||||||||||||||
| Total provision | $ | 5,488 | $ | 9,166 | $ | 3,947 | $ | 421 | $ | 2,756 | $ | 5,488 | $ | 9,166 | $ | 3,947 | ||||||||||||||||
A reconciliation of the effect of applying the federal statutory rate and the effective income tax rate used to calculate the Company’s income tax provision is as follows:
| Three months ended | ||||||||||||||||||||||||||||||||
| Year ended December 31, | March 31, | |||||||||||||||||||||||||||||||
| Year ended December 31, | Year ended December 31, | |||||||||||||||||||||||||||||||
| 2001 | 2002 | 2003 | 2003 | 2004 | ||||||||||||||||||||||||||||
| 2001 | 2002 | 2003 | ||||||||||||||||||||||||||||||
| (unaudited) | ||||||||||||||||||||||||||||||||
| Statutory federal income tax rate | 34.0% | 34.0% | 34.0% | 34.0% | 34.0% | 34.0% | 34.0% | 34.0% | ||||||||||||||||||||||||
| State income taxes | 4.0 | 5.3 | 10.5 | 10.5 | 4.0 | 4.0 | 5.3 | 10.5 | ||||||||||||||||||||||||
| Effect of variable accounting applied to incentive stock options | — | — | 73.7 | 73.7 | 1.6 | — | — | 73.7 | ||||||||||||||||||||||||
| Change in valuation allowance | — | (4.7 | ) | — | — | — | — | (4.7 | ) | — | ||||||||||||||||||||||
| Other | 0.1 | 2.4 | (4.4 | ) | (4.4 | ) | 1.2 | 0.1 | 2.4 | (4.4 | ) | |||||||||||||||||||||
| Income tax provision | 38.1% | 37.0% | 113.8% | 113.8% | 40.8% | 38.1% | 37.0% | 113.8% | ||||||||||||||||||||||||
F-24
The significant components of the Company’s deferred tax asset were as follows:
| December 31, | ||||||||||||||||||||
| December 31, | ||||||||||||||||||||
| March 31, | ||||||||||||||||||||
| (in thousands) | 2002 | 2003 | 2004 | 2002 | 2003 | |||||||||||||||
| (unaudited) | ||||||||||||||||||||
| Intangible assets | $ | 86,952 | $ | 78,844 | $ | 77,142 | $ | 86,952 | $ | 78,844 | ||||||||||
| Net operating loss carryforward | 1,691 | — | — | 1,691 | — | |||||||||||||||
| Research and other tax credits | 1,202 | 921 | 744 | 1,202 | 921 | |||||||||||||||
| Effect of variable accounting applied to nonqualified stock options | — | 7,647 | 7,907 | — | 7,647 | |||||||||||||||
| Allowance for doubtful accounts | 444 | 465 | 479 | 444 | 465 | |||||||||||||||
| Other | 654 | 888 | 453 | 654 | 888 | |||||||||||||||
| 90,943 | 88,765 | 86,725 | 90,943 | 88,765 | ||||||||||||||||
| Less: current portion | 2,114 | 1,799 | 1,675 | 2,114 | 1,799 | |||||||||||||||
| Noncurrent portion | $ | 88,829 | $ | 86,966 | $ | 85,050 | $ | 88,829 | $ | 86,966 | ||||||||||
At December 31, 2003, the Company had utilized all of its net operating loss carryforwards for federal income tax purposes.
F-23
Income taxes for the nine month period ended September 30, 2004 were calculated using the projected effective tax rate for fiscal 2004 in accordance with SFAS No. 109. The Company estimates that in the fiscal year ending December 31, 2004, it will have an effective tax rate of approximately 41%. The Company’s effective tax rate for the nine months ended September 30, 2004 was 40.7%. The Company’s effective tax rate for the nine month period ended September 30, 2003 was 113.8%. The difference from the statutory rate results principally from the non-deductible stock option compensation charge incurred in 2003.
12. Shareholders’ equity
Preferred stock
The Company has authorized 5,000,000 shares of preferred stock. No shares were issued and outstanding at December 31, 2003.2003 and September 30, 2004. The Company’s board of directors may fix the relative rights and preferences of each series of preferred stock in a resolution of the board of directors.
Common stock sale
During 2001, certain existing shareholders purchased an additional 3,333,3342,083,334 shares of common stock for a total purchase price of $10,000,002. Proceeds from the sale were used to reduce the Company’s debt, as required in the debt agreement.
13. Employee profit-sharing and stock option plans
The Company has a 401(k) profit-sharing plan (the “Plan”) covering substantially all employees. Employees can contribute between 1% and 30% of their salaries in 2003, and between 1% and 15% of their salaries in 2002 and 2001, and the Company matches 50% of qualified employees’ contributions up to 6% of their salary. The Plan also provides for additional employer contributions to be made at the Company’s discretion. Total matching contributions to the Plan for the years ended December 31, 2001, 2002 and 2003 were $708,000, $582,000 and $1,015,000, and $343,000$813,000 and $360,000$1,005,000 for the threenine months ended March 31,September 30, 2003 and
F-25
The Company has adopted three stock options plans: the 1999 Stock Option Plan (the “1999 Plan”), the 2000 Stock Option Plan (the “2000 Plan”) and the 2001 Stock Option Plan (the “2001 Plan”) on October 13, 1999, May 2, 2000 and July 1, 2001, respectively. The Company’s board of directors administers the above plans and the options are granted at terms determined by them. The total number of authorized stock options under these plans is 16,110,830.10,069,269. All options granted under these plans have a 10-year contractual term.
The option agreements also provide that all unvested options vest upon a change in control of the Company, as defined.
The Company has granted options under the 1999 Plan to purchase shares of common stock at an exercise price of $3.00$4.80 per share, of which 3,004,394 are1,913,794 and 1,819,563 were outstanding at December 31, 2003.2003 and September 30, 2004, respectively. The options granted under this plan have two vesting schedules. Options totaling 964,924603,078 vest 37.5% after one and a half years following the grant date and the remaining 62.5% vest ratably over two and a half years at six-month intervals. The 2,097,1441,310,715 remaining options vest ratably over four years at six-month intervals.
The Company has granted options under the 2000 Plan to purchase shares of common stock at an exercise price of $3.00$4.80 per share, of which 5,638,791 are3,524,244 were outstanding at December 31, 2003.2003 and September 30, 2004. The options vest 25% on the date of grant and the remaining 75% vest in eight equal semi-annual installments beginning on September 30, 2000. In addition to the change in control provision, unvested options also become 50% vested upon consummation of an initial public offering. The option grant under the 2000 Plan also includes a provision whereby the Company will pay certain tax payments of the optionee. The inclusion of this provision requires the
F-24
The accrued cash component of stock option compensation in note 6 represents the tax payments that would be due the optionee under the 2000 Stock Option Plan at December 31, 2003 and March 31,September 30, 2004. The amount has been calculated using the same assumptions used in estimating stock option compensation expense under the principles of variable accounting.
The Company has granted options under the 2001 Plan to purchase shares of common stock at an exercise price of $3.00, $3.40$4.80, $5.44 and $4.50$7.20 per share, of which 4,573,875, 1,859,6642,858,677, 1,162,288 and 165,000,103,125, respectively, arewere outstanding at December 31, 2003 and March 31,2,739,067, 1,131,038 and 103,125, respectively, were outstanding at September 30, 2004. Additionally, the Company has granted options under this plan to purchase shares of common stock at an exercise price of $5.00$8.00 and $5.65$9.04 per share, of which 75,00046,875 and 21,239,13,274, respectively, are outstanding at March 31,September 30, 2004. The options vest in equal annual installments over four years from the date of grant. The option grants under this plan include a provision whereby the Company has the right to call shares exercised under the grants at a discount from fair market value if the employee is terminated for cause, as defined. This provision expires in the event of an initial public offering. The inclusion of this provision requires the Company to account for all options
F-26
The Compensation Committee has granted options at or above its estimate of fair market value at the date of grant.
F-25
The Company adopted the 2004 Stock Plan (the “2004 Plan”) on March 23, 2004. The Company has granted options under the 2004 Plan to purchase shares of common stock at an exercise price of $8.00, $8.60 and $10.59 per share, of which 42,500, 302,240 and 141,250, respectively, were outstanding at September 30, 2004. The options vest in equal annual installments over four years from the grant date.
A summary of the activity in the Company’s stock option plan is as follows:
| Weighted | ||||||||
| average | ||||||||
| exercise | ||||||||
| Shares | price | |||||||
Options outstanding at December 31, 2000 | 12,688,294 | $ | 3.00 | |||||
| Granted | 2,176,614 | 3.00 | ||||||
| Forfeited | (1,274,255 | ) | 3.00 | |||||
Options outstanding at December 31, 2001 | 13,590,653 | 3.00 | ||||||
| Granted | 1,803,775 | 3.16 | ||||||
| Forfeited | (550,193 | ) | 3.00 | |||||
Options outstanding at December 31, 2002 | 14,844,235 | 3.02 | ||||||
| Granted | 1,284,615 | 3.54 | ||||||
| Exercised | (77,539 | ) | 3.00 | |||||
| Forfeited | (751,913 | ) | 3.00 | |||||
Options outstanding at December 31, 2003 | 15,299,398 | 3.07 | ||||||
| Granted (unaudited) | 96,239 | 5.14 | ||||||
| Exercised (unaudited) | (37,922 | ) | 3.00 | |||||
| Forfeited (unaudited) | (122,500 | ) | 3.12 | |||||
Options outstanding at March 31, 2004 (unaudited) | 15,235,215 | $ | 3.08 | |||||
The following table summarizes information about stock options outstanding at December 31, 2003:
| Options outstanding | Options exercisable | |||||||||||||||||||
| Weighted | ||||||||||||||||||||
| average | Weighted | Weighted | ||||||||||||||||||
| Range of | remaining | average | average | |||||||||||||||||
| exercise | contractual | exercise | exercise | |||||||||||||||||
| prices | Shares | life (in years) | price | Shares | price | |||||||||||||||
| $3.00 | 13,274,734 | 6.4 | $ | 3.00 | 10,603,225 | $ | 3.00 | |||||||||||||
| 3.40 | 1,859,664 | 9.2 | 3.40 | 181,209 | 3.40 | |||||||||||||||
| 4.50 | 165,000 | 9.7 | 4.50 | — | 4.50 | |||||||||||||||
| 15,299,398 | 6.7 | $ | 3.07 | 10,784,434 | $ | 3.01 | ||||||||||||||
| Weighted | ||||||||
| average | ||||||||
| exercise | ||||||||
| Shares | price | |||||||
Options outstanding at December 31, 2000 | 7,953,069 | $ | 4.80 | |||||
| Granted | 1,360,388 | 4.80 | ||||||
| Forfeited | (793,716 | ) | 4.80 | |||||
Options outstanding at December 31, 2001 | 8,519,741 | 4.80 | ||||||
| Granted | 1,127,359 | 5.06 | ||||||
| Forfeited | (369,446 | ) | 4.80 | |||||
Options outstanding at December 31, 2002 | 9,277,654 | 4.83 | ||||||
| Granted | 802,884 | 5.66 | ||||||
| Exercised | (48,462 | ) | 4.80 | |||||
| Forfeited | (469,948 | ) | 4.80 | |||||
Options outstanding at December 31, 2003 | 9,562,128 | 4.91 | ||||||
| Granted (unaudited) | 546,139 | 9.03 | ||||||
| Exercised (unaudited) | (133,828 | ) | 4.80 | |||||
| Forfeited (unaudited) | (111,263 | ) | 4.98 | |||||
Options outstanding at September 30, 2004 (unaudited) | 9,863,176 | $ | 5.13 | |||||
F-26F-27
The following table summarizes information about stock options outstanding at MarchDecember 31, 2003:
| Options outstanding | Options exercisable | |||||||||||||||
| Weighted | ||||||||||||||||
| average | Weighted | Weighted | ||||||||||||||
| remaining | average | average | ||||||||||||||
| Range of | contractual | exercise | exercise | |||||||||||||
| Exercise Prices | Shares | life (in years) | price | Shares | price | |||||||||||
| $ | 4.80 | 8,296,715 | 6.4 | $ | 4.80 | 6,627,016 | $ | 4.80 | ||||||||
| 5.44 | 1,162,288 | 9.2 | 5.44 | 113,256 | 5.44 | |||||||||||
| 7.20 | 103,125 | 9.7 | 7.20 | — | 7.20 | |||||||||||
| 9,562,128 | 6.7 | $ | 4.91 | 6,740,271 | $ | 4.82 | ||||||||||
The following table summarizes information about stock options outstanding at September 30, 2004 (unaudited):
| Options outstanding | Options exercisable | |||||||||||||||||||
| Weighted | ||||||||||||||||||||
| average | Weighted | Weighted | ||||||||||||||||||
| Range of | remaining | average | average | |||||||||||||||||
| exercise | contractual | exercise | exercise | |||||||||||||||||
| prices | Shares | life (in years) | price | Shares | price | |||||||||||||||
| $3.00 | 13,151,812 | 6.2 | $ | 3.00 | 11,178,215 | $ | 3.00 | |||||||||||||
| 3.40 | 1,822,164 | 8.9 | 3.40 | 253,612 | 3.40 | |||||||||||||||
| 4.50 | 165,000 | 9.4 | 4.50 | — | 0.00 | |||||||||||||||
| 5.00 | 75,000 | 9.9 | 5.00 | — | 0.00 | |||||||||||||||
| 5.65 | 21,239 | 9.9 | 5.65 | — | 0.00 | |||||||||||||||
| 15,235,215 | 6.6 | $ | 3.08 | 11,431,827 | $ | 3.01 | ||||||||||||||
| Options outstanding | Options exercisable | |||||||||||||||
| Weighted | ||||||||||||||||
| average | Weighted | Weighted | ||||||||||||||
| remaining | average | average | ||||||||||||||
| Range of | contractual | exercise | exercise | |||||||||||||
| Exercise Prices | Shares | life (in years) | price | Shares | price | |||||||||||
| $ | 4.80 | 8,082,874 | 5.7 | $ | 4.80 | 7,359,115 | $ | 4.80 | ||||||||
| $ | 5.44 | 1,131,038 | 8.2 | $ | 5.44 | 280,372 | $ | 5.44 | ||||||||
| $ | 7.20 | 103,125 | 8.9 | $ | 7.20 | 17,967 | $ | 7.20 | ||||||||
| $ | 8.00 | 89,375 | 9.6 | $ | 8.00 | — | $ | — | ||||||||
| $ | 8.60 | 302,240 | 9.5 | $ | 8.60 | — | $ | — | ||||||||
| $ | 9.04 | 13,274 | 9.4 | $ | 9.04 | — | $ | — | ||||||||
| $ | 10.59 | 141,250 | 10.0 | $ | 10.59 | — | $ | — | ||||||||
| 9,863,176 | 6.2 | $ | 5.13 | 7,657,454 | $ | 4.83 | ||||||||||
14. Segment information
The Company has adopted SFAS No. 131, “Disclosures about Segments of an Enterprise and Related Information”. SFAS No. 131 establishes standards for the reporting by business enterprises of information about operating segments, products and services, geographic areas, and major customers. The method of determining what information is reported is based on the way that management organizes the operating segments within the Company for making operational decisions and assessments of financial performance. The Company has determined that its reportable segments are those that are based upon internal financial reports that disaggregate certain operating information into six reportable segments. The Company’s chief operating decision maker, as defined in SFAS No. 131, is its chief executive officer, or CEO.
The CEO uses the information presented in these reports to make certain operating decisions. The CEO does not review any report presenting segment balance sheet information. The segment revenues and direct controllable costs, which include salaries, related benefits, third
F-27F-28
| Maintenance | ||||||||||||||||||||||||||||||
| License | Consulting(1) | Education(2) | Analytic(3) | and | ||||||||||||||||||||||||||
| (in thousands) | fees | services | services | services | subscriptions | Other | Total | |||||||||||||||||||||||
December 31, 2001 | ||||||||||||||||||||||||||||||
Revenue | $ | 19,300 | $ | 7,864 | $ | 10,330 | $ | 603 | $ | 47,022 | $ | 4,915 | $ | 90,034 | ||||||||||||||||
| Direct controllable costs | 1,726 | 4,990 | 3,113 | 399 | 7,907 | 2,733 | 20,868 | |||||||||||||||||||||||
| Segment income | 17,574 | 2,874 | 7,217 | 204 | 39,115 | 2,182 | 69,166 | |||||||||||||||||||||||
| Corporate costs not allocated | 5,594 | |||||||||||||||||||||||||||||
| Operating expenses | 41,198 | |||||||||||||||||||||||||||||
| Interest (income) expense, net | 7,867 | |||||||||||||||||||||||||||||
| Other expense (income), net | 113 | |||||||||||||||||||||||||||||
Income before provision for income taxes | $ | 14,394 | ||||||||||||||||||||||||||||
December 31, 2002 | ||||||||||||||||||||||||||||||
Revenue | $ | 20,572 | $ | 11,884 | $ | 12,667 | $ | 2,188 | $ | 52,788 | $ | 5,130 | $ | 105,229 | ||||||||||||||||
| Direct controllable costs | 2,547 | 6,643 | 4,297 | 895 | 7,388 | 3,592 | 25,362 | |||||||||||||||||||||||
| Segment income | 18,025 | 5,241 | 8,370 | 1,293 | 45,400 | 1,538 | 79,867 | |||||||||||||||||||||||
| Corporate costs not allocated | 5,667 | |||||||||||||||||||||||||||||
| Operating expenses | 45,185 | |||||||||||||||||||||||||||||
| Interest (income) expense, net | 4,272 | |||||||||||||||||||||||||||||
| Other expense (income), net | (63 | ) | ||||||||||||||||||||||||||||
Income before provision for income taxes | $ | 24,806 | ||||||||||||||||||||||||||||
December 31, 2003 | ||||||||||||||||||||||||||||||
Revenue | $ | 21,339 | $ | 17,434 | $ | 12,997 | $ | 3,611 | $ | 58,360 | $ | 4,352 | $ | 118,093 | ||||||||||||||||
| Direct controllable costs | 2,819 | 8,836 | 4,178 | 1,845 | 8,562 | 3,684 | 29,924 | |||||||||||||||||||||||
| Segment income | 18,520 | 8,598 | 8,819 | 1,766 | 49,798 | 668 | 88,169 | |||||||||||||||||||||||
| Corporate costs not allocated | 9,450 | |||||||||||||||||||||||||||||
| Operating expenses | 73,023 | |||||||||||||||||||||||||||||
| Interest (income) expense, net | 2,462 | |||||||||||||||||||||||||||||
| Other expense (income), net | (235 | ) | ||||||||||||||||||||||||||||
Income before provision for income taxes | $ | 3,469 | ||||||||||||||||||||||||||||
F-28F-29
| Maintenance | ||||||||||||||||||||||||||||||
| License | Consulting(1) | Education(2) | Analytic(3) | and | ||||||||||||||||||||||||||
| (in thousands) | fees | services | services | services | subscriptions | Other | Total | |||||||||||||||||||||||
March 31, 2003 (unaudited) | ||||||||||||||||||||||||||||||
Revenue | $ | 4,504 | $ | 3,621 | $ | 3,288 | $ | 835 | $ | 14,099 | $ | 962 | $ | 27,309 | ||||||||||||||||
| Direct controllable costs | 567 | 2,251 | 1,089 | 237 | 2,038 | 798 | 6,980 | |||||||||||||||||||||||
| Segment income | 3,937 | 1,370 | 2,199 | 598 | 12,061 | 164 | 20,329 | |||||||||||||||||||||||
| Corporate costs not allocated | 2,138 | |||||||||||||||||||||||||||||
| Operating expenses | 16,999 | |||||||||||||||||||||||||||||
| Interest (income) expense | 837 | |||||||||||||||||||||||||||||
| Other expense (income), net | (15 | ) | ||||||||||||||||||||||||||||
Income before provision for income taxes | $ | 370 | ||||||||||||||||||||||||||||
March 31, 2004 (unaudited) | ||||||||||||||||||||||||||||||
Revenue | $ | 5,077 | $ | 5,070 | $ | 3,403 | $ | 1,072 | $ | 15,779 | $ | 954 | $ | 31,355 | ||||||||||||||||
| Direct controllable costs | 729 | 2,643 | 1,171 | 437 | 2,060 | 853 | 7,893 | |||||||||||||||||||||||
| Segment income | 4,348 | 2,427 | 2,232 | 635 | 13,719 | 101 | 23,462 | |||||||||||||||||||||||
| Corporate costs not allocated | 1,733 | |||||||||||||||||||||||||||||
| Operating expenses | 15,136 | |||||||||||||||||||||||||||||
| Interest (income) expense | 189 | |||||||||||||||||||||||||||||
| Other expense (income), net | (349 | ) | ||||||||||||||||||||||||||||
Income before provision for income taxes | $ | 6,753 | ||||||||||||||||||||||||||||
| Maintenance | ||||||||||||||||||||||||||||||
| License | Consulting(1) | Education(2) | Analytic(3) | and | ||||||||||||||||||||||||||
| (in thousands) | fees | services | services | services | subscriptions | Other | Total | |||||||||||||||||||||||
| September 30, 2003 (unaudited) | ||||||||||||||||||||||||||||||
Revenue | $ | 15,427 | $ | 12,957 | $ | 10,179 | $ | 2,752 | $ | 43,271 | $ | 2,906 | $ | 87,492 | ||||||||||||||||
| Direct controllable costs | 2,110 | 6,589 | 3,299 | 1,087 | 6,632 | 2,536 | 22,253 | |||||||||||||||||||||||
| Segment income | 13,317 | 6,368 | 6,880 | 1,665 | 36,639 | 370 | 65,239 | |||||||||||||||||||||||
| Corporate costs not allocated | 6,791 | |||||||||||||||||||||||||||||
| Operating expenses | 53,665 | |||||||||||||||||||||||||||||
| Interest (income) expense | 2,146 | |||||||||||||||||||||||||||||
| Other expense (income), net | 100 | |||||||||||||||||||||||||||||
Income before provision for income taxes | $ | 2,537 | ||||||||||||||||||||||||||||
| September 30, 2004 (unaudited) | ||||||||||||||||||||||||||||||
Revenue | $ | 18,614 | $ | 17,398 | $ | 11,357 | $ | 3,923 | $ | 48,886 | $ | 2,849 | $ | 103,027 | ||||||||||||||||
| Direct controllable costs | 2,733 | 9,028 | 3,590 | 1,607 | 6,140 | 2,555 | 25,653 | |||||||||||||||||||||||
| Segment income | 15,881 | 8,370 | 7,767 | 2,316 | 42,746 | 294 | 77,374 | |||||||||||||||||||||||
| Corporate costs not allocated | 3,509 | |||||||||||||||||||||||||||||
| Operating expenses | 45,525 | |||||||||||||||||||||||||||||
| Interest (income) expense | 135 | |||||||||||||||||||||||||||||
| Other expense (income), net | (342 | ) | ||||||||||||||||||||||||||||
Income before provision for income taxes | $ | 28,546 | ||||||||||||||||||||||||||||
| (1) | This segment consists of consulting, installation and implementation services. |
| (2) | This segment consists of customer training and other education services. |
| (3) | This segment consists of donor prospect research and data modeling services. |
F-30
The Company also derives a portion of its revenue from its foreign operations. The following table presents revenue by geographic region based on country of invoice origin and identifiable and long-lived assets by geographic region based on the location of the assets.
| (in thousands) | Domestic | Europe | Pacific | Total | Domestic | Canada | Europe | Pacific | Total | |||||||||||||||||||||||||||||
| Revenue from external customers: | Revenue from external customers: | Revenue from external customers: | ||||||||||||||||||||||||||||||||||||
| 2002 | $ | 99,214 | $ | 4,870 | $ | 1,145 | $ | 105,229 | 2002 | $ | 99,214 | $ | — | $ | 4,870 | $ | 1,145 | $ | 105,229 | |||||||||||||||||||
| 2003 | 107,363 | 9,393 | 1,337 | 118,093 | 2003 | 107,363 | — | 9,393 | 1,337 | 118,093 | ||||||||||||||||||||||||||||
| Three months ended March 31, 2003 (unaudited) | 25,038 | 1,972 | 299 | 27,309 | Nine months ended September 30, 2003 (unaudited) | 79,782 | — | 6,718 | 993 | 87,493 | ||||||||||||||||||||||||||||
| Three months ended March 31, 2004 (unaudited) | 27,771 | 3,210 | 374 | 31,355 | Nine months ended September 30, 2004 (unaudited) | 87,076 | 5,196 | 9,563 | 1,192 | 103,027 | ||||||||||||||||||||||||||||
| Long-lived assets: | Long-lived assets: | Long-lived assets: | ||||||||||||||||||||||||||||||||||||
| December 31, 2002 | $ | 96,838 | $ | 852 | $ | — | $ | 97,690 | December 31, 2002 | $ | 96,817 | $ | — | $ | 852 | $ | 21 | $ | 97,690 | |||||||||||||||||||
| December 31, 2003 | 93,896 | 1,332 | — | 95,228 | December 31, 2003 | 93,854 | — | 1,332 | 42 | 95,228 | ||||||||||||||||||||||||||||
| March 31, 2004 (unaudited) | 91,478 | 1,770 | — | 93,248 | September 30, 2004 (unaudited) | 86,396 | — | 1,771 | 31 | 88,198 | ||||||||||||||||||||||||||||
F-29
The Company generated license fee revenue from its principal products as indicated in the table below:
| Three months ended | Nine months ended | |||||||||||||||||||||||||||||||||||||||
| Year ended December 31, | March 31, | Year ended December 31, | September 30, | |||||||||||||||||||||||||||||||||||||
| 2001 | 2002 | 2003 | 2003 | 2004 | 2001 | 2002 | 2003 | 2003 | 2004 | |||||||||||||||||||||||||||||||
| (unaudited) | (unaudited) | |||||||||||||||||||||||||||||||||||||||
| Raiser’s Edge | $ | 13,342 | $ | 13,160 | $ | 14,383 | $ | 3,049 | $ | 3,609 | $ | 13,342 | $ | 13,160 | $ | 14,383 | $ | 10,299 | $ | 12,172 | ||||||||||||||||||||
| Financial Edge | 4,432 | 5,724 | 5,570 | 1,154 | 1,258 | 4,432 | 5,724 | 5,570 | 4,082 | 4,080 | ||||||||||||||||||||||||||||||
| Admission’s Office/ Registrar’s Office | 1,526 | 1,688 | 1,217 | 301 | 151 | |||||||||||||||||||||||||||||||||||
| Education Edge | 1,526 | 1,688 | 1,217 | 948 | 972 | |||||||||||||||||||||||||||||||||||
| Information Edge | — | — | 169 | — | 59 | — | — | 169 | 98 | 292 | ||||||||||||||||||||||||||||||
| Blackbaud Analytics/Data Enrichment | — | — | — | — | 686 | |||||||||||||||||||||||||||||||||||
| Patron Edge | — | — | — | — | 412 | |||||||||||||||||||||||||||||||||||
| $ | 19,300 | $ | 20,572 | $ | 21,339 | $ | 4,504 | $ | 5,077 | $ | 19,300 | $ | 20,572 | $ | 21,339 | $ | 15,427 | $ | 18,614 | |||||||||||||||||||||
It is impractical for the Company to identify its other revenues by product category.
F-3015. Subsequent events
On June 28, 2004, the Company declared a 1-for-1.6 reverse stock split for each outstanding share of common stock. In connection with the reverse stock split, the number of issued and outstanding shares of Common Stock was decreased to 42,509,207. The 1-for-1.6 reverse stock split described above was consummated on July 19, 2004 and has been applied retrospectively for all periods presented.
In June 2004, the Company entered into a commitment letter for a new $30.0 million revolving credit facility which the Company anticipates will replace its existing $15.0 million revolving credit facility. Amounts borrowed under the new $30.0 million revolving credit facility will bear interest, at the Company’s option, at a variable rate based on either the prime rate, federal funds rate or LIBOR plus a margin of between 0.5% and 2.0% based on the Company’s
F-31
F-32
shares
Common stock
Prospectus
Joint book-running managers
, 2004
Until , 2004, all dealers that buy, sell or trade in our common stock, whether or not participating in this offering, may be required to deliver a prospectus. This is in addition to the dealers’ obligation to deliver a prospectus when acting as underwriters and with respect to their unsold allotments or subscriptions.
Part II
Information not required in prospectus
Item 13. Other expenses of issuance and distribution
The following table shows the costs and expenses, other than underwriting discounts, payable in connection with the sale and distribution of the securities being registered. Except as otherwise noted, the registrant will pay all of these amounts. All amounts except the SEC Registration Fee and the National Association of Securities Dealers, Inc. Filing Fee are estimated.
| SEC Registration Fee | SEC Registration Fee | $ | 14,570.50 | SEC Registration Fee | $ | 16,250 | ||||
| National Association of Securities Dealers, Inc. Filing Fee | $ | 12,000.00 | ||||||||
| Printing Expenses | Printing Expenses | * | Printing Expenses | $ | 50,000 | |||||
| Legal Fees and Expenses | Legal Fees and Expenses | * | Legal Fees and Expenses | $ | 150,000 | |||||
| Accounting Fees and Expenses | Accounting Fees and Expenses | * | Accounting Fees and Expenses | $ | 40,000 | |||||
| Transfer Agent and Registrar Agent Fees | Transfer Agent and Registrar Agent Fees | * | Transfer Agent and Registrar Agent Fees | $ | 2,500 | |||||
| Miscellaneous | Miscellaneous | * | Miscellaneous | $ | 1,250 | |||||
| Total | * | Total | $ | 260,000 | ||||||
Item 14. Indemnification of directors and officers
We are incorporated under the laws of the State of Delaware. Section 145 of the Delaware General Corporation Law gives a corporation power to indemnify any person who was or is a party or is threatened to be made a party to any threatened, pending or completed action, suit or proceeding, whether civil, criminal, administrative or investigative (other than an action by or in the right of the corporation) by reason of the fact that the person is or was a director, officer, employee or agent of the corporation, or is or was serving at the request of the corporation as a director, officer, employee or agent of another corporation, partnership, joint venture, trust or other enterprise, against expenses (including attorneys’ fees), judgments, fines and amounts paid in settlement actually and reasonably incurred by the person in connection with such action, suit or proceeding if the person acted in good faith and in a manner the person reasonably believed to be in or not opposed to the best interests of the corporation, and, with respect to any criminal action or proceeding, had no reasonable cause to believe the person’s conduct was unlawful.
Section 145 also gives a corporation power to indemnify any person who was or is a party or is threatened to be made a party to any threatened, pending or completed action or suit by or in the right of the corporation to procure a judgment in its favor by reason of the fact that the person is or was a director, officer, employee or agent of the corporation, or is or was serving at the request of the corporation as a director, officer, employee or agent of another corporation, partnership, joint venture, trust or other enterprise against expenses (including attorneys’ fees) actually and reasonably incurred by the person in connection with the defense or settlement of such action or suit if the person acted in good faith and in a manner the person reasonably believed to be in or not opposed to the best interests of the corporation and except that no indemnification shall be made in respect of any claim, issue or matter as to which such person shall have been adjudged to be liable to the corporation unless and only to
II-1
II-1
Section 145 also authorizes a corporation to purchase and maintain insurance on behalf of any person who is or was a director, officer, employee or agent of the corporation, or is or was serving at the request of the corporation as a director, officer, employee or agent of another corporation, partnership, joint venture, trust or other enterprise, against any liability asserted against him and incurred by him in any such capacity, arising out of his status as such, whether or not the corporation would otherwise have the power to indemnify him under Section 145.
Our Certificate of Incorporation provides for the indemnification of officers and directors to the fullest extent permitted by the Delaware General Corporation Law. We have also agreed pursuant to our Investor Rights Agreement (filed as Exhibit 10.1 to the Registration Statement) to indemnify certain stockholders party thereto against certain liabilities, including liabilities arising under the Securities Act.
The Underwriting Agreement (filed as Exhibit 1.1 to the Registration Statement) provides for the indemnification of our directors and officers in certain circumstances against certain liabilities, including liabilities arising under the Securities Act.
All of our directors and officers are covered by insurance policies maintained by us against certain liabilities for actions taken in their capacities as such, including liabilities under the Securities Act.
Item 15. Recent sales of unregistered securities.
During the past three years, the Company has issued unregistered securities in the transactions described below. Securities issued in such transactions were offered and sold in reliance upon the exemption from registration under Section 4(2) of the Securities Act of 1933 and/or Rule 701 promulgated thereunder, relating to sales by an issuer not involving any public offering. The sales of securities were made without the use of an underwriter and the certificates evidencing the shares bear a restricted legend permitting the transfer thereof only upon registration of the shares or an exemption under said Act.
| 1. | |
| During | |
II-2
| During 2003, we granted | |
II-2
Item 16. Exhibits and financial statement schedules.
(a) Exhibits
See Exhibit Index beginning on page II-5II-7 of this registration statement.
(b) Financial Statement Schedules
None.
Item 17. Undertakings.
The undersigned registrant hereby undertakes
(1) To file, during any period in which offers or sales are being made, a post-effective amendment to providethis registration statement:
| • | To include any prospectus required by section 10(a)(3) of the Securities Act of 1933; | |
| • | To reflect in the prospectus any facts or events arising after the effective date of the registration statement (or the most recent post-effective amendment thereof) which, individually or in the aggregate, represent a fundamental change in the information set forth in the registration statement. Notwithstanding the foregoing, any increase or decrease in volume of securities offered (if the total dollar value of securities offered would not exceed that which was registered) and any deviation from the low or high end of the estimated maximum offering range may be reflected in the form of prospectus filed with the Commission pursuant to Rule 424(b) if, in the aggregate, the changes in volume and price represent no more than 20% change in the maximum aggregate offering price set forth in the “Calculation of Registration Fee” table in the effective registration statement; and | |
| • | To include any material information with respect to the plan of distribution not previously disclosed in the registration statement or any material change to such information in the registration statement; |
(2) That, for the purpose of determining any liability under the Securities Act of 1933, each such post-effective amendment shall be deemed to be a new registration statement relating to the underwriterssecurities offered therein, and the offering of such securities at that time shall be deemed to be the initial bona fide offering thereof.
(3) To remove from registration by means of a post-effective amendment any of the securities being registered which remain unsold at the closing specified intermination of the underwriting agreement, certificates in such denominations and registered in such names as required by the underwriters to permit prompt delivery to each purchaser.offering.
Insofar as indemnification for liabilities arising under the Securities Act of 1933 may be permitted to directors, officers and controlling persons of the registrant pursuant to provisions described in Item 14 above or otherwise, the registrant has been advised that in the opinion of the SEC such indemnification is against public policy as expressed in the Securities Act, and is, therefore, unenforceable. In the event that a claim for indemnification against such liabilities (other than the payment by the registrant of expenses incurred or paid by a director, officer, or controlling person of the registrant in the successful defense of any action, suit or proceeding) is asserted by such director, officer or controlling person in connection with the securities being registered hereunder, the registrant will, unless in the opinion of its counsel the matter has been settled by controlling precedent, submit to a court of appropriate jurisdiction the question of whether such indemnification by it is against public policy as expressed in the Act and will be governed by the final adjudication of such issue.
II-3
The undersigned registrant also hereby undertakes that:
(1) For purposes of determining any liability under the Securities Act of 1933, the information omitted from the form of prospectus filed as part of this Registration Statement in reliance upon Rule 430A and contained in a form of prospectus filed by the registrant pursuant to Rule 424(b)(1) or (4) or 497(h) under the Act shall be deemed to be part of this Registration Statement as of the time it was declared effective.
(2) For the purpose of determining any liability under the Securities Act of 1933, each post-effective amendment that contains a form of prospectus shall be deemed to be a new Registration Statement relating to the securities offered therein, and the offering of such securities at that time shall be deemed to be the initial bona fide offering thereof.
II-3II-4
Signatures
Pursuant to the requirements of the Securities Act of 1933, the registrant certifies that it has reasonable grounds to believe that it meets all of the requirements for filing on Form S-1 and has duly caused this Registration Statement to be signed on its behalf by the undersigned, thereunto duly authorized, in the City of Charleston, State of South Carolina, on this 15th18th day of June, 2004.
| BLACKBAUD, INC. |
| By: | /s/ ROBERT J. SYWOLSKI |
| Robert J. Sywolski | |
| President and Chief Executive Officer |
Power of attorney
Each person whose signature appears below constitutes and appoints Robert J. Sywolski and Timothy V. Williams, and each of them, his or her true and lawful attorney-in-fact and agent, with full power of substitution and resubstitution, for him or her and in his or her name, place and stead, in any and all capacities, to sign any and all amendments (including post-effective amendments) to this Registration Statement and any related Registration Statements filed pursuant to Rule 462(b) promulgated under the Securities Act of 1933, and to file the same, with all exhibits thereto, and other documents in connection therewith, with the SEC, granting unto said attorney-in-fact and agent, full power and authority to do and perform each and every act and thing requisite and necessary to be done in and about the premises, as fully to all intents and purposes as he or she might or could do in person, hereby ratifying and confirming all that said attorney-in-fact and agent, or his or her substitute or substitutes, may lawfully do or cause to be done by virtue hereof.
Pursuant to the requirements of the Securities Act of 1933, this Registration Statement has been signed by the following persons in the capacities and on the dates indicated.
| Signature | Capacity | Date | ||||
| /s/ ROBERT J. SYWOLSKI Robert J. Sywolski | President, Chief Executive Officer and Director (Principal Executive Officer) | |||||
| /s/ TIMOTHY V. Timothy V. Williams | Vice President and Chief Financial Officer (Principal Financial and Accounting Officer) | |||||
| /s/ PAUL V. Paul V. Barber | Director | |||||
| /s/ MARCO W. Marco W. Hellman | Director | |||||
II-5
| Signature | Capacity | Date | ||||
| /s/ DR. SANDRA R. HERNÁ Dr. Sandra R. Hernández | Director | |||||
| /s/ ANDREW M. Andrew M. Leitch | Director | |||||
| /s/ DAVID R. David R. Tunnell | Director | |||||
II-4II-6
Exhibit index
| Filed In | Filed In | |||||||||||||||||||||||||||||||||||||||
| Exhibit | Exhibit | Registrant’s | Exhibit | Filed | Exhibit | Registrant’s | Exhibit | Filed | ||||||||||||||||||||||||||||||||
| Number | Number | Description of Document | Form | Dated | Number | Herewith | Number | Description of Document | Form | Dated | Number | Herewith | ||||||||||||||||||||||||||||
| 1 | .1 | Form of Underwriting Agreement. | X | 5 | .1 | Opinion of Wyrick Robbins Yates & Ponton LLP regarding the legality of the securities being registered. | X | |||||||||||||||||||||||||||||||||
| 2 | .1 | Agreement and Plan of Merger and Reincorporation dated April 6, 2004 | S-1 | 4/6/04 | 2 | .1 | 23 | .1 | Consent of Independent Registered Public Accounting Firm. | X | ||||||||||||||||||||||||||||||
| 3 | .1 | Form of Certificate of Incorporation of Blackbaud, Inc. to be effective at the closing of the offering made pursuant to this registration statement. | S-1 | 4/6/04 | 3 | .1 | 23 | .2 | Consent of Wyrick Robbins Yates & Ponton LLP (included in Exhibit 5.1). | X | ||||||||||||||||||||||||||||||
| 3 | .2 | Form of By-laws of Blackbaud, Inc. to be effective at the closing of the offering made pursuant to this registration statement. | S-1 | 4/6/04 | 3 | .2 | ||||||||||||||||||||||||||||||||||
| 4 | .1 | Specimen Common Stock Certificate. | S-1 | 02/20/04 | 4 | .1 | ||||||||||||||||||||||||||||||||||
| 5 | .1* | Opinion of Wyrick Robbins Yates & Ponton LLP regarding the legality of the securities being registered. | ||||||||||||||||||||||||||||||||||||||
| 10 | .1 | Investor Rights Agreement dated as of October 13, 1999 among Blackbaud, Inc. and certain of its stockholders. | S-1 | 02/20/04 | 10 | .1 | ||||||||||||||||||||||||||||||||||
| 10 | .2 | Employment and Noncompetition Agreement dated as of March 1, 2000 between Blackbaud, Inc. and Robert J. Sywolski | S-1 | 02/20/04 | 10 | .2 | ||||||||||||||||||||||||||||||||||
| 10 | .3 | Option Agreement dated as of March 8, 2000 between Blackbaud, Inc, and Robert J. Sywolski. | S-1 | 02/20/04 | 10 | .3 | ||||||||||||||||||||||||||||||||||
| 10 | .4 | Lease Agreement dated October 13, 1999 between Blackbaud, Inc., and Duck Pond Creek, LLC | S-1 | 02/20/04 | 10 | .4 | ||||||||||||||||||||||||||||||||||
| 10 | .5 | Trademark License and Promotional Agreement dated as of October 13, 1999 between Blackbaud, Inc. and Charleston Battery, Inc. | S-1 | 02/20/04 | 10 | .5 | ||||||||||||||||||||||||||||||||||
| 10 | .6 | Blackbaud, Inc. 1999 Stock Option Plan, as amended. | S-1 | 4/6/04 | 10 | .6 | ||||||||||||||||||||||||||||||||||
| 10 | .7 | Blackbaud, Inc. 2000 Stock Option Plan, as amended. | S-1 | 4/6/04 | 10 | .7 | ||||||||||||||||||||||||||||||||||
| 10 | .8 | Blackbaud, Inc. 2001 Stock Option Plan, as amended. | S-1 | 4/6/04 | 10 | .8 | ||||||||||||||||||||||||||||||||||
| 10 | .9 | Form of Software License Agreement. | S-1 | 02/20/04 | 10 | .9 | ||||||||||||||||||||||||||||||||||
| 10 | .10 | Form of Professional Services Agreement. | S-1 | 02/20/04 | 10 | .10 | ||||||||||||||||||||||||||||||||||
| 10 | .11 | Form of NetSolutions Services Agreement. | S-1 | 02/20/04 | 10 | .11 | ||||||||||||||||||||||||||||||||||
| 10 | .12 | Standard Terms and Conditions for Software Maintenance and Support | S-1 | 02/20/04 | 10 | .12 | ||||||||||||||||||||||||||||||||||
| 10 | .13 | Credit Agreement dated as of October 13, 1999 among Blackbaud, Inc., Bankers Trust Company, Fleet National Bank, First Union Securities, Inc. and the lenders party thereto. | S-1 | 4/6/04 | 10 | .13 | ||||||||||||||||||||||||||||||||||
II-5II-7
| Filed In | ||||||||||||||||||||
| Exhibit | Registrant’s | Exhibit | Filed | |||||||||||||||||
| Number | Description of Document | Form | Dated | Number | Herewith | |||||||||||||||
| 10 | .14 | First Amendment to Credit Agreement dated as of December 6, 1999 among Blackbaud, Inc., Bankers Trust Company, Fleet Boston Corporation, First Union Securities, Inc., and the lenders party thereto. | S-1 | 4/6/04 | 10 | .14 | ||||||||||||||
| 10 | .15 | Second Agreement to Credit Agreement dated as of December 19, 2000 among Blackbaud, Inc., Bankers Trust Company, Fleet Boston Corporation, First Union Securities, Inc., and the lenders party thereto. | S-1 | 02/20/04 | 10 | .15 | ||||||||||||||
| 10 | .16 | Third Amendment to Credit Agreement dated as of May 16, 2001 among Blackbaud, Inc., Blackbaud, LLC, Bankers Trust Company, Fleet Boston Corporation, First Union Securities, Inc., and the lenders party thereto. | S-1 | 02/20/04 | 10 | .16 | ||||||||||||||
| 10 | .17 | Letter Agreement dated March 23, 2004 between the Company and certain of its stockholders relating to registration rights held by those stockholders. | S-1 | 04/06/04 | 10 | .17 | ||||||||||||||
| 10 | .18 | Employment and Noncompetition Agreement dated as of April 1, 2004 between Blackbaud, Inc. and Robert J. Sywolski. | X | |||||||||||||||||
| 10 | .19** | Software Transition Agreement dated as of January 30, 2004 between Blackbaud, Inc. and United Way of America. | S-1 | 04/06/04 | 10 | .19 | ||||||||||||||
| 10 | .20 | Blackbaud, Inc. 2004 Stock Plan | S-1 | 04/06/04 | 10 | .20 | ||||||||||||||
| 10 | .21 | Commitment Letter for Arrangement of Senior Credit Facility dated June 1, 2004 from Wachovia Bank, N.A. | X | |||||||||||||||||
| 21 | .1 | Subsidiaries of Blackbaud, Inc. | S-1 | 02/20/04 | 21 | .1 | ||||||||||||||
| 23 | .1 | Consent of Independent Registered Public Accounting Firm. | X | |||||||||||||||||
| 23 | .2* | Consent of Wyrick Robbins Yates & Ponton LLP (included in Exhibit 5.1). | ||||||||||||||||||
II-6