

As filed with the Securities and Exchange Commission on July 26, 2005March 29, 2006
Registration No. 333-124824333-132480
UNITED STATES
SECURITIES AND EXCHANGE COMMISSION
Washington, DCD.C. 20549
Amendment No. 21
to
FORM S-1
REGISTRATION STATEMENTUnder the Securities Act ofUNDER THE SECURITIES ACT OF 1933
RBC BEARINGS INCORPORATED
(Exact Name of Registrant as Specified in its Charter)
| Delaware (State or other jurisdiction of incorporation or organization) | 3562 (Primary Standard Industrial Classification Code number) | 95-4372080 (I.R.S. Employer Identification No.) | |||||
One Tribology Center Oxford, CT 06478 Telephone: (203) 267-7001 (Address, Including Zip Code, and Telephone Number, Including Area Code, of Registrant's Principal Executive Offices) | |||||||
Corporation Service Company 2711 Centerville Road Suite 400 Wilmington, DE 19808 Telephone: (800) 927-9800 (Name, Address, Including Zip Code, and Telephone Number, Including Area Code, of Agent for Service) | |||||||
One Tribology CenterOxford, CT 06478Telephone: (203) 267-7001(Address, Including Zip Code, and Telephone Number, Including Area Code, of Registrant's Principal Executive Offices)
Corporation Service Company2711 Centerville RoadSuite 400Wilmington, DE 19808Telephone: (800) 927-9800
(Name, Address, Including Zip Code, and Telephone Number, Including Area Code, of Agent for Service)
Copies to:
Copies to: | ||
| Joshua N. Korff, Esq. Kirkland & Ellis LLP Citigroup Center 153 East 53rd Street New York, New York 10022-4611 (212) 446-4800 | Valerie Ford Jacob, Esq. Stuart H. Gelfond, Esq. Fried, Frank, Harris, Shriver & Jacobson LLP One New York Plaza New York, New York 10004 (212) 859-8000 | |
Approximate date of commencement of proposed sale to the public:
As soon as practicable after this Registration Statement becomes effective.
If any of the securities being registered on this Form are to be offered on a delayed or continuous basis pursuant to Rule 415 under the Securities Act of 1933 check the following box: box. o
If this Form is filed to registered additional securities for an offering pursuant to Rule 462(b) under the Securities Act, please check the following box and list the Securities Act registration statement number of the earlier effective registration statement for the same offering. o
If this Form is a post-effective amendment filed pursuant to Rule 462(c) under the Securities Act, check the following box and list the Securities Act registration statement number of the earlier effective registration statement for the same offering. o
If this Form is a post-effective amendment filed pursuant to Rule 462(d) under the Securities Act, check the following box and list the Securities Act registration statement number of the earlier effective registration statement for the same offering. o
If delivery of the prospectus is expected to be made pursuant to Rule 434, please check the following box. o
CALCULATION OF REGISTRATION FEE
| Title of Each Class of Securities to be Registered | Proposed Maximum Aggregate Offering Price(1) | Amount of Registration Fee(1) | Proposed Maximum Aggregate Offering Price(1) | Amount of Registration Fee(1) | ||||
|---|---|---|---|---|---|---|---|---|
| Common Stock, par value $0.01 per share(2) | $152,499,200 | $17,949.16(3) | $159,859,074 | $17,104.92(3) |
The Registrant hereby amends this Registration Statement on such date or dates as may be necessary to delay its effective date until the Registrant shall file a further amendment which specifically states that this Registration Statement shall thereafter become effective in accordance with Section 8(a) of the Securities Act of 1933, as amended, or until this Registration Statement shall become effective on such date as the Commission, acting pursuant to such Section 8(a), may determine.
The information in this prospectus is not complete and may be changed. We may not sell these securities until the registration statement filed with the Securities and Exchange Commission is effective. This prospectus is not an offer to sell these securities and it is not soliciting an offer to buy these securities in any state where the offer or sale is not permitted.
Subject to Completion
Preliminary Prospectus dated July 26, 2005March 29, 2006
PROSPECTUS
8,288,0007,067,000 Shares
Common Stock
This is RBC Bearings Incorporated's initial public offering. RBC Bearings Incorporated isWe are selling 6,273,0001,071,471 shares and certain of our stockholders are selling 2,015,0005,995,529 shares.
We expect the public offering price to be between $14.00 and $16.00 per share. Currently, no public market exists for the shares. Our common stock has been approved for quotationshares are quoted on the Nasdaq National Market under the symbol "ROLL." On March 28, 2006, the last sale price of our shares as reported on the Nasdaq National Market was $20.74 per share.
Investing in the common stock involves risks that are described in the "Risk Factors" section beginning on page 109 of this prospectus.
| | Per Share | Total | ||||
|---|---|---|---|---|---|---|
| Public offering price | $ | $ | ||||
| Underwriting discount | $ | $ | ||||
| Proceeds, before expenses, to us | $ | $ | ||||
| Proceeds, before expenses, to the selling stockholders | $ | $ | ||||
The underwriters may also purchase up to an additional 761,5161,060,050 shares from us and up to an additional 481,684 shares from the selling stockholders, at the public offering price, less the underwriting discount, within 30 days from the date of this prospectus to cover overallotments.
Neither the Securities and Exchange Commission nor any state securities commission has approved or disapproved of these securities or determined if this prospectus is truthful or complete. Any representation to the contrary is a criminal offense.
The shares will be ready for delivery on or about , 2005.2006.
| Merrill Lynch & Co. Sole Book-Running Manager | |||
KeyBanc Capital Markets | Co-Lead Manager | ||
Co. | |||
The date of this prospectus is , 2005.2006.


| | Page | |
|---|---|---|
| Prospectus Summary | 1 | |
| Risk Factors | ||
| Disclosure Regarding Forward-Looking Statements | ||
| Use of Proceeds | ||
| Industry and Market Data | ||
| Price Range of Our Common Stock | 23 | |
| Dividend Policy | ||
| Capitalization | ||
| Selected Consolidated Historical Financial Data | ||
| Management's Discussion and Analysis of Financial Condition and Results of Operations | ||
| Business | ||
| Management | ||
| Related Party Transactions | ||
| Principal and Selling Stockholders | ||
| Description of Capital Stock | ||
| Description of Certain Indebtedness | ||
| Shares Eligible for Future Sale | ||
| Material U.S. Federal Income Tax Considerations for Non-U.S. Holders | ||
| Underwriting | ||
| Legal Matters | ||
| Experts | ||
| Where You Can Find Additional Information |
You should rely only on the information contained in this prospectus. We have not, and the underwriters have not, authorized any other person to provide you with different information. If anyone provides you with different or inconsistent information, you should not rely on it. We are not, and the underwriters are not, making an offer to sell these securities in any jurisdiction where the offer or sale is not permitted. You should assume that the information appearing in this prospectus is accurate only as of the date on the front cover of this prospectus. Our business, financial condition, results of operations and prospects may have changed since that date.
In this prospectus, unless the context otherwise requires, "Company," "RBCI," "we," "our" and "us" refer to RBC Bearings Incorporated and our subsidiaries; "RBCA" refers to Roller Bearing Company of America, Inc., our wholly-owned subsidiary and principal operating company; and "Whitney" refers to Whitney & Co., LLC, our principal equity sponsor.LLC. Our fiscal year consists of 52 or 53 weeks, ending on the Saturday closest to March 31; therefore, references to "fiscal 2005," "fiscal 2004," "fiscal 2003," "fiscal 2002" and "fiscal 2001" refer to our fiscal years ended April 2, 2005, April 3, 2004, March 29, 2003, March 30, 2002 and March 31, 2001, respectively. The term Senior Credit Facility refers, collectively, to our existing $55.0 million revolving credit facility, referred to as our Revolving Credit Facility, and our $150.0 million term loan, referred to as our Term Loan.
This prospectus contains our registered and unregistered trademarks, service marks and trade names including: "Aerocres," "Heim," "Pitchlign," "Quadlube," "RBC Bearings," "RBC Roller," "RBC Southwest Products," "Schaublin" and "Unibal." This prospectus also contains trademarks, service marks, copyrights and trade names of other companies.
i
This summary highlights information contained elsewhere in this prospectus. As a result, it does not contain all of the information that you should consider before investing in our common stock. You should read this entire prospectus, especially the section entitled "Risk Factors" and the consolidated financial statements and the related notes.
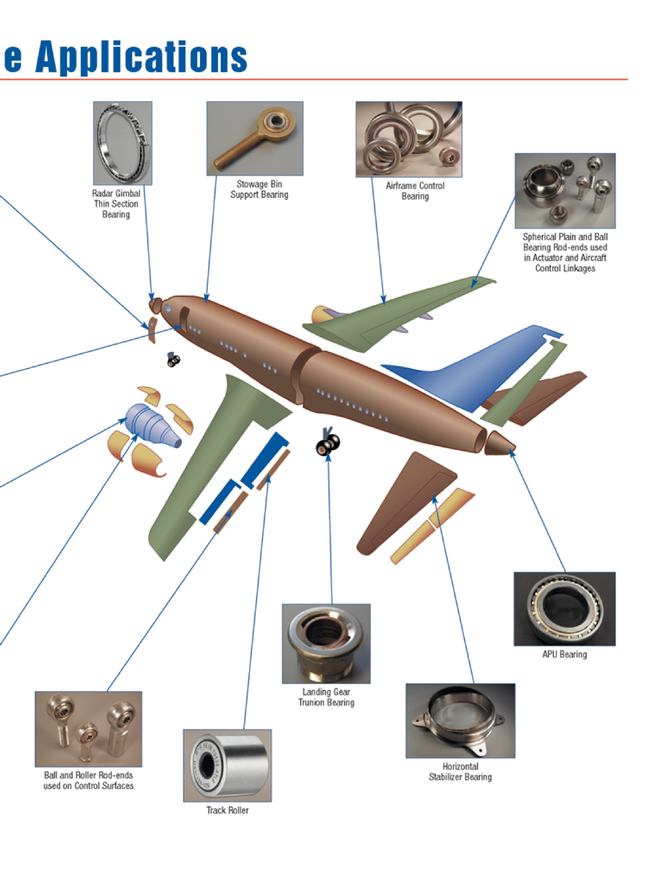
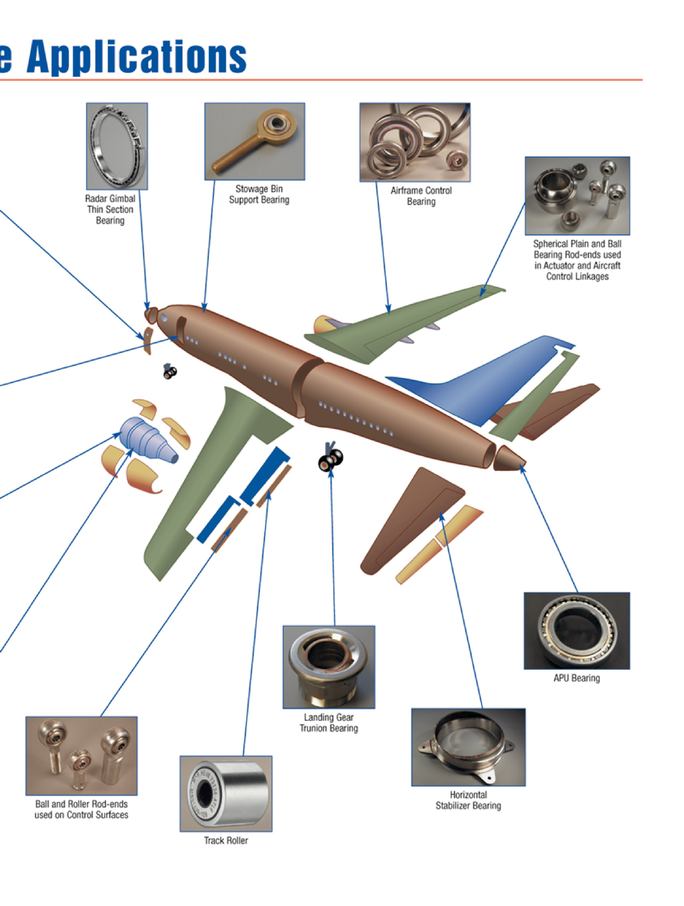
We are a well known international manufacturer and marketer of highly engineered precision plain, roller and ball bearings. Bearings, which are integral to the manufacture and operation of most machines and mechanical systems, reduce wear to moving parts, facilitate proper power transmission and reduce damage and energy loss caused by friction. While we manufacture products in all major bearing categories, we focus primarily on highly technical or regulated bearing products for specialized markets that require sophisticated design, testing and manufacturing capabilities. We believe our unique expertise has enabled us to garner leading positions in many of the product markets in which we primarily compete. We estimate that over one-fourth of our net sales are derived from products for which we are the sole supplier and the only manufacturer able to provide the required bearing solution. We believe that being the sole supplier for these products provides us with a competitive advantage due to the lengthy and rigorous certification processes and/or approvals required by a majority of these customers or government agencies, which typically take anywhere from six months to six years to complete, and due to our long track record with most of these customers of delivering high quality and uniquely designed and engineered products in a timely manner. We estimate that approximately two-thirds of our net sales during fiscal 2005 and during the nine month period ended December 31, 2005 were generated by products for which we hold the number one or two market position. We have been providing bearing solutions to our customers since 1919. Over the past ten years, under the leadership of our current management team, we have significantly broadened our end markets, products, customer base and geographic reach. We currently operate 16 manufacturing facilities in three countries.
We design, manufacture and market a broad portfolio of bearing products. The following table provides a summary of our product segments:
| Segment | FY 2005 Sales | Representative Applications | ||||
|---|---|---|---|---|---|---|
| Plain Bearings | $ | 93,250 | • | Aircraft engine controls and landing gear | ||
| (38%) | • | Helicopter rotors and missile launchers | ||||
| • | Mining and construction equipment | |||||
Roller Bearings | $ | 92,281 | • | Aircraft hydraulics | ||
| (38%) | • | Military and commercial truck chassis | ||||
| • | Packaging machinery and gear pumps | |||||
Ball Bearings | $ | 41,881 | • | Radar and night vision systems | ||
| (17%) | • | Airframe control and actuation | ||||
| • | Semiconductor equipment | |||||
Other | $15,604 (7%) | • | Precision ground ball screws for robotic handling and missile guidance | |||
| • | Collets for machine tools | |||||
| Segment | Net Sales for the Nine Month Period Ended December 31, 2005 | Representative Applications | ||
|---|---|---|---|---|
| Plain Bearings | $82,078 (41%) | • Aircraft engine controls and landing gear • Helicopter rotors and missile launchers • Mining and construction equipment | ||
Roller Bearings | $71,193 (36%) | • Aircraft hydraulics • Military and commercial truck chassis • Packaging machinery and gear pumps | ||
Ball Bearings | $33,239 (17%) | • Radar and night vision systems • Airframe control and actuation • Semiconductor equipment | ||
Other | $12,248 (6%) | • Precision ground ball screws for robotic handling and missile guidance • Collets for machine tools | ||
Our End Markets
We serve a broad range of end markets where we can add value with our specialty, precision bearing applications. We classify our customers into threetwo principal categories: diversified industrial and aerospace and defense.
Diversified Industrial (64%(55% of fiscal 2005 net sales)sales for the nine month period ended December 31, 2005). We manufacture bearing products for a wide range of diversified industrial markets, including construction and mining, oil and natural resource extraction, heavy truck, packaging and semiconductor machinery. Our diversified industrial products target specialized market applications in which our engineering and manufacturing capabilities provide us with unique competitive advantages. We believe opportunities exist for growth and margin expansion in this market as a result of increasing demand for industrial machinery, the introduction of new products and the expansion of aftermarket sales.
Aerospace (28%and Defense (45% of fiscal 2005 net sales)sales for the nine month period ended December 31, 2005). We manufacture bearing products for a wide range of aerospace applications, including commercial airframes, commercial aircraft engines and private aircraft applications. We supply bearings for many of the commercial aircraft currently operating world-wide and are the primary supplier for many of our product lines. Many of our aerospace bearing products are designed and certified during the original development of the aircraft being served, which often makes us the primary bearing supplier for the life of the aircraft. We believe that growth and margin expansion in this segment will be driven primarily by expanding our international presence, new aircraft builds and the refurbishment and maintenance of existing commercial aircraft.
Defense (8% of fiscal 2005 net sales). We In addition, we manufacture bearing products used by the U.S. Department of Defense and certain foreign governments for use in fighter jets, troop transports, naval vessels, helicopters, gas turbine engines, armored vehicles, guided weaponry and satellites. Our bearing products are manufactured to conform to U.S. military specifications and are typically custom designed during the original product design phase which often makes us the sole or primary bearing supplier for the life of the product. We believe that our current installed base of bearing products and our sophisticated engineering and manufacturing capabilities position us to benefit from growing replacement part demand caused by increased equipment utilization as well as the introduction of new weapons and transport systems.
Our Competitive Strengths
Leading Market Positions. We compete in specialized markets where we believe we are often the only supplier with the manufacturing expertise, business plan and engineering resources required to provide the required bearing solution. We estimate that approximately two-thirds of our net sales during fiscal 2005 and during the nine month period ended December 31, 2005 were generated by products for which we hold the number one or two market position.
Diversified Revenue Base. We sell a wide array of bearing products to customers across many diverse end markets, each of which is influenced by different fundamental economic factors. Our products are sold to more than 6,1006,700 customers, including original equipment manufacturers, or OEMs, and aftermarket distributors and service providers.
Large Installed Product Base with Recurring Aftermarket Revenue Stream. We provide bearings to a large and growing number of applications for which our products have been tested and certified. Our bearing products are approved for over 32,000 applications, many of which are part of aerospace, defense and industrial platforms that can be in service for as long as several decades, thereby requiring continuing aftermarket support. Aftermarket sales of replacement parts for existing equipment platforms represented approximately 56% of our net sales for fiscal 2005.
Proprietary Design and Manufacturing Capabilities. We believe that our design and manufacturing capabilities will allow us to maintain a leadership position as our customers continue to rely on us to develop new bearing solutions that can be manufactured cost effectively.
Disciplined Acquisition Program with History of Successful Integration. We have demonstrated expertise in acquiring and integrating bearing and precision-engineered component manufacturers that have complementary products or distribution channels and provide significant potential for margin enhancement. Since October 1992 we have completed 1213 acquisitions which have significantly broadened our end markets, products, customer base and geographic reach. Most recently, in September 2005, we acquired the Southwest Products Company, a manufacturer of spherical bearings, journal bearings and push-pull controls for military weapon systems and military and commercial aerospace applications.
Experienced Management Team. Our management team possesses extensive managerial experience in the bearing industry, with our top five operating executives averaging over 20 years of bearing industry experience. We intend to retain and attract experienced professionals by leveraging our reputation as a premier provider of precision bearing solutions.
Our Growth Strategy
We intend to grow our business while continuing to focus on specialized markets for highly engineered bearing solutions. Key elements of our growth strategy include:
Continue to Develop Innovative Bearing Solutions. We intend to leverage our design and manufacturing expertise and our extensive customer relationships to continue to develop new products for markets where we believe there are substantial growth opportunities. Our ability to develop new custom engineered products strengthens existing customer relationships and creates new business opportunities for us.
Expand Customer Base and Penetrate End Markets. We continually seek opportunities to penetrate new customers, geographic locations and bearing platforms with existing products or profitable new product opportunities. We intend to continue to expand our sales force, customer base and end markets and have identified a number of attractive growth opportunities domestically and abroad, including current projects in semiconductor machinery, airframe controls and missile guidance systems. In addition, our OEM relationships, coupled with our design expertise, provide us with extensive cross-selling opportunities on platforms that we do not currently supply.
Increase Aftermarket Sales. We intend to increase the percentage of our revenues derived from the replacement market by continuing to implement several initiatives. First, we will continue to seek opportunities to increase our sales to key existing distributors as well as expand our base of third party customers. Second, our new product and new end market initiatives are focused on high-growth platforms, such as 300 millimeter semiconductor manufacturing systems and the U.S. government's Joint Strike Fighter program that we expect will be in service for long periods and therefore create significant demand for replacement parts. Additionally, we will seek opportunities to develop new products that can be used as replacement parts for existing platforms. We believe that increasing our aftermarket sales of replacement parts will further enhance the continuity and predictability of our revenues and increase our profitability.
Pursue Selective Acquisitions. We believe that there will continue to be consolidation within the bearing industry that may present us with acquisition opportunities, particularly within the industrial and aerospace markets. We regularly evaluate opportunities to acquire bearing and precision-engineered component manufacturers which have complementary products, customers or distribution
channels, provide significant potential for margin enhancement and further expand the breadth of our product portfolio.
Whitney & Co., LLC
Whitney & Co., LLC is our major equity sponsor and provides financial consulting and management advisory services to us. Whitney was established in 1946 by John Hay Whitney as one of the first U.S. firms involved in the development of the private equity industry. Today, Whitney remains a private firm owned by investing professionals, and its main activities are to provide private equity and debt capital for middle market growth companies. Whitney manages approximately $4 billion of assets for endowments, foundations and pension plans and is currently investing its fifth outside equity fund, Whitney V, L.P., a fund with committed capital of $1.1 billion.
Our Corporate Profile
RBC Bearings Incorporated is a Delaware corporation, and our principal executive offices are located at One Tribology Center, Oxford, CT 06478. Our telephone number is (203) 267-7001. Our website address iswww.rbcbearings.com. Information on our website is not deemed to be a part of this prospectus.
Amendment or Replacement of Our Senior Credit Facility
In connection with this offering we expect to amend or replace our Senior Credit Facility to provide for lower borrowing costs. The amendment or replacement of the Senior Credit Facility is contingent upon the consummation of the primary portion of this offering, but this offering is not contingent upon the amendment or replacement of the Senior Credit Facility. We are in discussions with multiple lenders regarding alternatives for reducing borrowing costs under our Senior Credit Facility, including replacing or amending the facility. Based on discussions with lenders, we expect that after giving effect to the amendment or replacement of the Senior Credit Facility, we will reduce the interest rate on our LIBOR loans by at least 125 basis points. See "Description of Certain Indebtedness—Senior Credit Facility."
Common stock offered: | |||||
By us | |||||
By the selling stockholders | |||||
Common stock outstanding after the offering | |||||
Use of proceeds | We estimate that | ||||
Risk factors | See "Risk Factors" and other information included in this prospectus for a discussion of factors you should carefully consider before deciding to invest in shares of the common stock. | ||||
Nasdaq National Market symbol | "ROLL" | ||||
The number of shares of our common stock that will be outstanding after this offering as shown above is based on the number of16,976,381 shares outstanding after givingon March 29, 2006, adjusted to give effect to the Pre-Offering Transactions, the exercise of options and warrants for cash by certain selling stockholders pursuant to a net share settlement and this offering, and excludes:
Unless otherwise specifically stated or the context otherwise requires, the information in this prospectus:
stock. See "Use of Proceeds" and "Pre-Offering Transactions.Proceeds."
The summary financial data for the fiscal years ended March 29, 2003, April 3, 2004 and April 2, 2005 have been derived from our historical consolidated financial statements audited by Ernst & Young LLP, independent auditors.registered public accounting firm. The summary financial data for the nine month periods ended January 1, 2005 and December 31, 2005 have been derived from our unaudited consolidated financial statements included elsewhere in this prospectus, which in our opinion contain all adjustments necessary for a fair presentation of the consolidated financial data. Results for interim periods are not necessarily indicative of results that may be expected for a full fiscal year. Historical results are not necessarily indicative of the results expected in the future. See "Use of Proceeds" and "Prospectus Summary—The Offering."
You should read the data presented below together with, and qualified by reference to, "Selected Consolidated Historical Financial Data," "Management's Discussion and Analysis of Financial Condition and Results of Operations" and our consolidated financial statements included elsewhere in this prospectus.
| | Fiscal Year Ended | ||||||||||||
|---|---|---|---|---|---|---|---|---|---|---|---|---|---|
| | March 29, 2003 | April 3, 2004 | April 2, 2005 | ||||||||||
| | | | (Restated)(3) | ||||||||||
| | (in thousands, except share and per share amounts) | ||||||||||||
| Statement of Operations Data: | |||||||||||||
| Net sales(1) | $ | 172,860 | $ | 187,331 | $ | 243,016 | |||||||
| Cost of sales | 124,086 | 135,433 | 174,602 | ||||||||||
| Gross margin | 48,774 | 51,898 | 68,414 | ||||||||||
| Selling, general and administrative | 26,647 | 28,107 | 32,749 | ||||||||||
| Other, net | 1,424 | 1,662 | 3,526 | ||||||||||
| Operating income | 20,703 | 22,129 | 32,139 | ||||||||||
| Interest expense, net | 21,023 | 20,380 | 19,669 | ||||||||||
| Loss (gain) on early extinguishment of debt(2) | (780 | ) | — | 6,950 | |||||||||
| Other non-operating expense (income) | 298 | 16 | (355 | ) | |||||||||
| Income before income taxes | 162 | 1,733 | 5,875 | ||||||||||
| Provision for (benefit from) income taxes | 113 | 1,070 | (1,385 | ) | |||||||||
| Net income | 49 | 663 | 7,260 | ||||||||||
| Preferred stock dividends | (1,313 | ) | (2,144 | ) | (2,280 | ) | |||||||
| Participation rights of preferred stock in undistributed earnings | — | — | (1,142 | ) | |||||||||
| Net income (loss) available to common stockholders | $ | (1,264 | ) | $ | (1,481 | ) | $ | 3,838 | |||||
| Net income (loss) per common share: | |||||||||||||
| Basic: | |||||||||||||
| Class A common stock | $ | (0.20 | ) | $ | (0.24 | ) | $ | 0.62 | |||||
| Class B common stock | $ | (0.20 | ) | $ | (0.24 | ) | $ | 0.62 | |||||
| Diluted: | |||||||||||||
| Class A common stock | $ | (0.20 | ) | $ | (0.24 | ) | $ | 0.40 | |||||
| Class B common stock | $ | (0.20 | ) | $ | (0.24 | ) | $ | 0.00 | |||||
| Weighted average number of common and common equivalent shares outstanding: | |||||||||||||
| Basic: | |||||||||||||
| Class A common stock | 6,188,653 | 6,188,653 | 6,202,365 | ||||||||||
| Class B common stock | 250 | 250 | 250 | ||||||||||
| Diluted: | |||||||||||||
| Class A common stock | 6,188,653 | 6,188,653 | 9,552,579 | ||||||||||
| Class B common stock | 250 | 250 | 1,302,005 | ||||||||||
| | Fiscal Year Ended | Nine Months Ended | ||||||||||||||
|---|---|---|---|---|---|---|---|---|---|---|---|---|---|---|---|---|
| | March 29, 2003 | April 3, 2004 | April 2, 2005 | January 1, 2005 | December 31, 2005(6) | |||||||||||
| | (in thousands, except share and per share amounts) | |||||||||||||||
| Statement of Operations Data: | ||||||||||||||||
| Net sales(1) | $ | 172,860 | $ | 187,331 | $243,016 | $ | 170,731 | $198,758 | ||||||||
| Cost of sales | 124,086 | 135,433 | 174,602 | 123,325 | 139,134 | |||||||||||
| Gross margin | 48,774 | 51,898 | 68,414 | 47,406 | 59,624 | |||||||||||
| Selling, general and administrative(2) | 26,647 | 28,107 | 32,749 | 23,261 | 32,325 | |||||||||||
| Other, net | 1,424 | 1,662 | 3,526 | 2,464 | 1,020 | |||||||||||
| Operating income | 20,703 | 22,129 | 32,139 | 21,681 | 26,279 | |||||||||||
| Interest expense, net | 21,023 | 20,380 | 19,669 | 14,335 | 12,582 | |||||||||||
| Loss (gain) on early extinguishment of debt(3) | (780 | ) | — | 6,950 | 6,956 | 3,771 | ||||||||||
| Other non-operating expense (income) | 298 | 16 | (355 | ) | (98 | ) | — | |||||||||
| Income before income taxes | 162 | 1,733 | 5,875 | 488 | 9,926 | |||||||||||
| Provision for (benefit from) income taxes | 113 | 1,070 | (1,385 | ) | 180 | 3,442 | ||||||||||
| Net income | 49 | 663 | 7,260 | 308 | 6,484 | |||||||||||
| Preferred stock dividends | (1,313 | ) | (2,144 | ) | (2,280 | ) | (1,693 | ) | (893 | ) | ||||||
| Participation rights of preferred stock in undistributed earnings | — | — | (1,142 | ) | (687 | ) | (630 | ) | ||||||||
| Net income (loss) available to common stockholders | $ | (1,264 | ) | $ | (1,481 | ) | $ 3,838 | $ | (2,072 | ) | $ 4,961 | |||||
Net income (loss) per common share:(4) | ||||||||||||||||
| Basic | $ | (0.20 | ) | $ | (0.24 | ) | $ 0.62 | $ | (0.33 | ) | $ 0.43 | |||||
| Diluted | $ | (0.20 | ) | $ | (0.24 | ) | $ 0.35 | $ | (0.33 | ) | $ 0.37 | |||||
| Weighted average common shares:(4) | ||||||||||||||||
| Basic | 6,188,903 | 6,188,903 | 6,202,615 | 6,188,903 | 11,649,073 | |||||||||||
| Diluted | 6,188,903 | 6,188,903 | 10,854,584 | 6,188,903 | 13,307,181 | |||||||||||
Other Financial Data: | ||||||||||||||||
| EBITDA(5) | $ | 29,224 | $ | 31,295 | $ 41,279 | $ | 29,123 | $ 33,417 | ||||||||
| Capital expenditures | 6,522 | 4,951 | 9,526 | 6,604 | 7,772 | |||||||||||
| | Fiscal Year Ended | |||||||||
|---|---|---|---|---|---|---|---|---|---|---|
| | March 29, 2003 | April 3, 2004 | April 2, 2005 | |||||||
| | (in thousands, except share and per share amounts) | |||||||||
| Pro Forma Data:(4) | ||||||||||
| Pro forma net income | $10,765 | |||||||||
| Pro forma net income per common share: | ||||||||||
| Basic | $ 0.70 | |||||||||
| Diluted | $ 0.62 | |||||||||
| Pro forma weighted average number of common and common equivalent shares outstanding: | ||||||||||
| Basic | 15,458,833 | |||||||||
| Diluted | 17,421,506 | |||||||||
Other Financial Data: | ||||||||||
| EBITDA(5) | $ | 29,224 | $ | 31,295 | $41,279 | |||||
| Capital expenditures | 6,522 | 4,951 | 9,526 | |||||||
| | As of April 2, 2005 | ||||||
|---|---|---|---|---|---|---|---|
| | Actual | Pro Forma(4) | |||||
| | (in thousands) | ||||||
| Balance Sheet Data: | |||||||
| Cash | $ | 2,635 | $ | 6,802 | |||
| Working capital | 120,656 | 130,325 | |||||
| Total assets | 250,169 | 261,481 | |||||
| Total debt | 220,079 | 177,130 | |||||
| Total stockholders' equity (deficit) | (7,759 | ) | 46,502 | ||||
| | As of December 31, 2005(6) | ||||||
|---|---|---|---|---|---|---|---|
| | Actual | As Adjusted | |||||
| | (in thousands) | ||||||
| Balance Sheet Data: | |||||||
| Cash | $ | 10,312 | $ | 10,312 | |||
| Working capital | 148,386 | 148,386 | |||||
| Total assets | 271,424 | 271,424 | |||||
| Total debt | 169,030 | 148,868 | |||||
| Total stockholders' equity | 61,972 | 82,134 | |||||
amortization expense, interest expense, net, loss (gain) on early extinguishment of debt and the provision for (benefit from) income taxes and therefore does not necessarily represent an accurate measure of profitability, particularly in situations where a company is highly leveraged or has a disadvantageous tax structure. We use a significant amount of capital assets and depreciation and amortization expense is a necessary element of our costs and ability to generate revenue and therefore its exclusion from EBITDA is a material limitation. We also have a significant amount of debt and interest expense is a necessary element of our costs and ability to generate revenue and therefore its exclusion from EBITDA is a material limitation. We generally incur significant U.S. federal, state and foreign income taxes each year and the provision for (benefit from) income taxes is a necessary element of the our costs and therefore its exclusion from EBITDA is a material limitation. As a result,
EBITDA should be evaluated in conjunction with net income (loss) for a more complete analysis of our profitability, as net income (loss) includes the financial statement impact of these items and is the most directly comparable GAAP operating performance measure to EBITDA. As EBITDA is not defined by GAAP, our definition of EBITDA may differ from and therefore may not be comparable to similarly titled measures used by other companies, thereby limiting its usefulness as a comparative measure. Because of the limitations that EBITDA has as an analytical tool, investors should not consider it in isolation or as a substitute for analysis of our operating results as reported under GAAP.
We use EBITDA as a supplementary non-GAAP operating performance measure to assist with our overall evaluation of our and our subsidiaries' operating performance (including the performance of subsidiary management) relative to outside peer group companies. In addition, we use EBITDA as an operating performance measure in financial presentations to our board of directors, stockholders, the banks participating in our credit facility and rating agencies, among others, as a supplemental non-GAAP operating measure to assist them in their evaluation of our performance. We are also active in mergers, acquisitions and divestitures and use EBITDA as an additional operating performance measure to assess our, our subsidiaries' and potential acquisition target enterprise value and to assist in the overall evaluation of our, our subsidiaries' and potential acquisition target performance on an internal basis and relative to peer group companies. We use EBITDA in conjunction with traditional GAAP operating performance measures as part of our overall assessment of potential valuation and relative performance and therefore do not place undue reliance on EBITDA as our only measure of operating performance. We believe EBITDA is useful for our management and investors as it is a commonly used analytical measurement for comparing company profitability, which eliminates the effects of financing, differing valuations of fixed and intangible assets and tax structure decisions. We believe that EBITDA is specifically relevant to us, due to the different degrees of leverage among our competitors. We have included EBITDA as a supplemental operating performance measure, which should be evaluated by investors in conjunction with the traditional GAAP performance measures for a complete evaluation of our operating performance. The following table provides a reconciliation of net income, the most directly comparable GAAP measure, to EBITDA.
| | Fiscal Year Ended | Nine Months Ended | ||||||||||||||
|---|---|---|---|---|---|---|---|---|---|---|---|---|---|---|---|---|
| | March 29, 2003 | April 3, 2004 | April 2, 2005 | January 1, 2005 | December 31, 2005 | |||||||||||
| | (in thousands) | |||||||||||||||
| Net income | $ | 49 | $ | 663 | $ | 7,260 | $ | 308 | $ | 6,484 | ||||||
| Add: | ||||||||||||||||
| Provision for (benefit from) income taxes | 113 | 1,070 | (1,385 | ) | 180 | 3,442 | ||||||||||
| Interest expense, net | 21,023 | 20,380 | 19,669 | 14,335 | 12,582 | |||||||||||
| Loss (gain) on early extinguishment of debt | (780 | ) | — | 6,950 | 6,956 | 3,771 | ||||||||||
| Depreciation and amortization | 8,819 | 9,182 | 8,785 | 7,344 | 7,138 | |||||||||||
| EBITDA | $ | 29,224 | $ | 31,295 | $ | 41,279 | $ | 29,123 | $ | 33,417 | ||||||
| | Fiscal Year Ended | ||||||||||
|---|---|---|---|---|---|---|---|---|---|---|---|
| | March 29, 2003 | April 3, 2004 | April 2, 2005 | ||||||||
| | (in thousands) | ||||||||||
| Net income | $ | 49 | $ | 663 | $ | 7,260 | |||||
| Add: | |||||||||||
| Provision for (benefit from) income taxes | 113 | 1,070 | (1,385 | ) | |||||||
| Interest expense, net | 21,023 | 20,380 | 19,669 | ||||||||
| Loss (gain) on early extinguishment of debt | (780 | ) | — | 6,950 | |||||||
| Depreciation and amortization | 8,819 | 9,182 | 8,785 | ||||||||
| EBITDA | $ | 29,224 | $ | 31,295 | $ | 41,279 | |||||
Our business, operating results or financial condition could be materially adversely affected by any of the following risks. The trading price of our common stock could decline due to any of these risks, and you may lose all or part of your investment. You should carefully consider these risks before investing in shares of our common stock.
Risk Factors Related to Our Company
The bearing industry is highly competitive, and this competition could reduce our profitability or limit our ability to grow.
The global bearing industry is highly competitive, and we compete with many U.S. and non-U.S. companies, some of which benefit from lower labor costs and fewer regulatory burdens than us. We compete primarily based on product qualifications, product line breadth, service and price. Certain competitors are larger than us or subsidiaries of larger entities and may be better able to manage costs than us or may have greater financial resources than we have. Due to the competitiveness in the bearing industry we may not be able to increase prices for our products to cover increases in our costs, or we may face pressure to reduce prices, which could materially reduce our revenues, gross margin and profitability. Competitive factors, including changes in market penetration, increased price competition and the introduction of new products and technology by existing and new competitors could result in a material reduction in our revenues and profitability.
The loss of a major customer could result in a material reduction in our revenues and profitability.
Our top ten customers generated 32% of our net sales during fiscal 2005 and 34% of our net sales during the nine month period ended December 31, 2005. Accordingly, the loss of one or more of those customers or a substantial decrease in such customers' purchases from us could result in a material reduction in our revenues and profitability.
In addition, the consolidation and combination of defense or other manufacturers may eliminate customers from the industry and/or put downward pricing pressures on sales of component parts. For example, the consolidation that has occurred in the defense industry in recent years has significantly reduced the overall number of defense contractors in the industry. In addition, if one of our customers is acquired or merged with another entity, the new entity may discontinue using us as a supplier because of an existing business relationship with the acquiring company or because it may be more efficient to consolidate certain suppliers within the newly formed enterprise. The significance of the impact that such consolidation may have on our business is difficult to predict because we do not know when or if one or more of our customers will engage in merger or acquisition activity. However, if such activity involved our material customers it could materially impact our revenues and profitability.
Weakness in any of the industries in which our customers operate, as well as the cyclical nature of our customers' businesses generally, could materially reduce our revenues and profitability.
The commercial aerospace, mining and construction equipment and other diversified industrial industries to which we sell our products are, to varying degrees, cyclical and tend to decline in response to overall declines in industrial production. Margins in those industries are highly sensitive to demand cycles, and our customers in those industries historically have tended to delay large capital projects, including expensive maintenance and upgrades, during economic downturns. As a result, our business is also cyclical, and the demand for our products by these customers depends, in part, on overall levels of industrial production, general economic conditions and business confidence levels. Downward economic cycles have affected our customers and reduced sales of our products resulting in reductions in our revenues and net earnings. Any future material weakness in demand in any of these industries could materially reduce our revenues and profitability.
In addition, many of our customers have historically experienced periodic downturns, which often have had a negative effect on demand for our products. For example, the severe downturn in 2001 in
the aerospace industry resulted in deferrals or cancellations in aircraft orders, which reduced the volume and price of orders placed for products used to manufacture commercial aircraft, including our bearings and other individual parts and components we manufacture. Previous industry downturns have negatively affected, and future industry downturns may negatively affect, our net sales, gross margin and net income.
Future reductions or changes in U.S. government spending could negatively affect our business.
In fiscal 2005, 8% of our net sales were made directly, and we estimate that approximately an additional 11% of our net sales were made indirectly, to the U.S. government to support military or other government projects. Our failure to obtain new government contracts, the cancellation of government contracts or reductions in federal budget appropriations regarding our products could result in materially reduced revenue. In addition, the funding of defense programs also competes with non-defense spending of the U.S. government. Our business is sensitive to changes in national and international priorities and the U.S. government budgets. A shift in government defense spending to other programs in which we are not involved or future reductions in U.S. government defense spending generally could materially reduce our revenues, cash flow from operations and profitability. If we, or our prime contractors for which we are a subcontractor, fail to win any particular bid, or we are unable to replace lost business as a result of a cancellation, expiration or completion of a contract, our revenues or cash flow could be reduced.
Fluctuating supply and costs of raw materials and energy resources could materially reduce our revenues, cash flow from operations and profitability.
Our business is dependent on the availability and costs of energy resources and raw materials, particularly steel, generally in the form of stainless and chrome steel, which are commodity steel products. Raw materials represented approximately 30% of our overall costs for fiscal 2005 and the nine month period ended December 31, 2005, the majority of which consisted of steel and related products. The availability and prices of raw materials and energy sources may be subject to curtailment or change due to, among other things, new laws or regulations, suppliers' allocations to other purchasers, interruptions in production by suppliers, changes in exchange rates and worldwide price levels. Although we currently maintain alternative sources for raw materials, our business is subject to the risk of price fluctuations and periodic delays in the delivery of certain raw materials. Disruptions in the supply of raw materials and energy resources could temporarily impair our ability to manufacture our products for our customers or require us to pay higher prices in order to obtain these raw materials or energy resources from other sources, which could thereby affect our net sales and profitability.
For example, we purchase steel at market prices, which during the past 24 monthstwo years have increased to historical highs as a result of a relatively low level of supply and a relatively high level of demand, and we have recently received notices of additional price increases from our suppliers.demand. As a result, we are currently being assessed surcharges on certain of our purchases of steel, and under certain circumstances, we have experienced difficulty in identifying steel for purchase. If we are unable to purchase steel for our operations for a significant period of time, our operations would be disrupted, which could reduce or delay sales of our products, and, in turn, could result in a material reduction in our revenues, cash flow from operations and profitability. In addition, we may be unable to pass on the increased costs of raw materials to our customers, which could materially reduce our cash flow from operations and profitability.
We seek to pass through a significant portion of our additional costs to our customers through steel surcharges or price increases. However, even if we are able to pass these steel surcharges or price increases to our customers, there may be a time lag of up to 12 weeks or more between the time a cost increase goes into effect and our ability to implement surcharges or price increases, particularly for
orders already in our backlog. As a result our gross margin percentage may decline, and we may not be able to implement other price increases for our products. We cannot provide assurances that we will be able
to continue to pass these additional costs on to our customers at all or on a timely basis or that our customers will not seek alternative sources of supply if there are significant or prolonged increases in the price of steel or other raw materials or energy resources.
We may not be able to address technological advances or maintain customer relationships which are necessary to remain competitive within our businesses.
We believe that our customers rigorously evaluate their suppliers on the basis of product quality, price competitiveness, technical expertise, new product innovation, reliability and timeliness of delivery, product design capability, manufacturing expertise, operational flexibility and customer service. Our success will depend on our ability to continue to meet our customers' changing specifications with respect to these criteria. We must remain committed to product research and development, advanced manufacturing techniques and service to remain competitive. We may not be able to address technological advances in metallurgy or in materials science or introduce new products that may be necessary to remain competitive within our businesses, or our competitors may develop products superior to our products. Furthermore, we may be unable to adequately protect any of our own technological developments to produce a sustainable competitive advantage.
Our products are subject to certain approvals, and the loss of such approvals could materially reduce our revenues and profitability.
Essential to servicing the aerospace market is the ability to obtain product approvals. We have in excess of 32,000 product approvals, which enable us to provide products used in virtually all domestic aircraft platforms presently in production or operation. Product approvals are typically issued by the Federal Aviation Administration, or FAA, to designated OEMs who are Production Approval Holders of FAA approved aircraft. These Production Approval Holders provide quality control oversight and generally limit the number of suppliers directly servicing the commercial aerospace aftermarket. Regulations enacted by the FAA provide for an independent process (the Parts Manufacturer Approval, or PMA, process), which enables suppliers who currently sell their products to the Production Approval Holders, to sell products to the aftermarket. We have received over 2,400 PMA application approvals to date. Our foreign sales may be subject to similar approvals. Although we have not lost any material product approvals in the past, we cannot assure you that we will not lose approvals for our products in the future. The loss of product approvals could result in lost sales and materially reduce our revenues and profitability.
Under certain circumstances, the U.S. government has the right to debar or suspend us from acting as a U.S. government contractor or subcontractor, and if we are suspended or debarred from acting as a government supplier for any reason, such an action would materially reduce our revenues and profitability.
In connection with our performance of government contracts, the federal government audits and reviews our performance, pricing practices and compliance with applicable laws, regulations and standards. It is possible that as a result of these audits, our revenues, cash flow or results of operations could be materially reduced as a result of lost sales or penalties. For example, the government could disallow certain costs that it originally reimbursed, and we may be required to refund cash already collected. It is also possible that a government audit, review or investigation could uncover improper or illegal activities that would subject us to civil, criminal and/or administrative sanctions, including, but not limited to, termination of contracts, reimbursement of payments received, fines, forfeiture of profits and suspension or debarment from doing business with federal government agencies. If any allegations of impropriety were made against us, whether or not true, our reputation could be adversely affected. If we were suspended or debarred from contracting with the federal government, or any specific agency, if our reputation was impaired or if the government ceased or significantly decreased the
amount of business it does with us, our revenues and cash flow could be reduced. As a government
contractor, we are also subject to various federal laws, regulations and standards. New laws, regulations or standards or changes to existing laws, regulations or standards could subject us to additional costs of compliance or liabilities and could result in material reductions to our results of operations, cash flow or revenues.
We have outstanding debt, and may incur additional debt in the future for acquisitions or other purposes, which could materially impact our business.
As of April 2,December 31, 2005 ourwe had total outstanding debt was $220.1 million,indebtedness of which $114.2 million was outstanding under our $165.0 million senior credit facility, referred to as our Senior Credit Facility, comprised of a $55.0 million revolving credit facility, or Revolving Credit Facility, and a $110.0 million term loan, or Term Loan, which will be increased by $40.0 million to $150.0 million, in connection with the amendment and restatement of our Senior Credit Facility in connection with the Refinancing Transaction. As of April 2, 2005, on a pro forma basis after$169.0 million. After giving effect to the Pre-Offering Transactions, including the Refinancing Transaction, and this offering and the use of estimated net proceeds therefrom, our total outstanding debt would have been $177.1 million,approximately $148.9 million. See "Use of which $154.2 million would have been outstanding under our $205.0 million amendedProceeds" and restated Senior Credit Facility. See "Management's Discussion and Analysis of Financial Condition and Results of Operations" and "Pre-Offering Transactions—Refinancing Transaction.Operations."
To service our debt, we will require a significant amount of cash. Our ability to generate cash, make scheduled payments or to refinance our obligations depends on our successful financial and operating performance. Our financial and operating performance, cash flow and capital resources depend upon prevailing economic conditions and certain financial, business and other factors, many of which are beyond our control.
We may incur additional indebtedness in the future for acquisitions and other purposes, and the significant debt servicing costs associated with that indebtedness could have significant effects on our operations, including:
The occurrence of any one of these events could materially impact our business, financial condition, results of operations and ability to grow our business.
Restrictions in our indebtedness agreements could limit our growth and our ability to respond to changing conditions.
The Senior Credit Facility our $45.0 million second lien term loan, or Second Lien Term Loan, and our swissSwiss franc 14.0 million Swiss credit facility (approximately $11.6$4.8 million outstanding as of April 2,December 31, 2005), or Swiss Credit Facility, contain a number of restrictive covenants that limit our ability, among other things, to:
In addition, the Senior Credit Facility and the Second Lien Term Loan containcontains other financial covenants requiring us to maintain a minimum fixed charge coverage ratio and maximum senior leverage ratios and to satisfy certain other financial conditions. Our Second Lien Term LoanSenior Credit Facility prohibits us from incurring capital expenditures of more than $10$15 million per year. These restrictions could limit our ability to obtain future financings, make needed capital expenditures, withstand a future downturn in our business or the economy in general or otherwise conduct necessary corporate activities. In connection with the refinancing of our Senior Credit Facility, the amended and restated Senior Credit Facility will incorporate substantially similar restrictive covenants to those in our existing Senior Credit Facility and Second Lien Term Loan.
As of April 2,December 31, 2005, we had no outstanding borrowings of $5.0 million and letters of credit of $20.3$20.6 million under our $55.0 million Revolving Credit Facility. Under the Revolving Credit Facility, we had borrowing availability of $26.1$34.4 million as of April 2,December 31, 2005. Under the revolving credit facility under our Swiss Credit Facility, or Swiss Revolver, we had borrowing availability of approximately $3.5$3.0 million (4.0 million SFr) as of April 2, 2005.
If interest rates increase, interest expense will increase and could materially reduce our profitability and cash flow.
As of April 2, 2005, after giving effect to the offering and the Pre-Offering Transactions, including the Refinancing Transaction, substantially all of our debt will be variable rate debt. On December 31, 2004, we entered into a Rate Cap Transaction Agreement capping LIBOR at 5.00% on a notional amount of $50.0 million. This agreement expires on December 31, 2005. We may
If we amend or may not enter intoreplace our Senior Credit Facility in connection with this offering, we expect that we will be subject to substantially similar agreements in the future. An increase in interest rates will increase our interest expense and could materially reduce our profitability and cash flow and our ability to service our indebtedness and to make distributions to our stockholders. In addition, an increase in interest rates may inhibit our ability to incur additional debt in the future, which may impair our ability to consummate desirable acquisitions. A 1% increase in interest rates would increase our interest expense by approximately $1.8 million over a 12-month period.restrictive covenants as described above. See "Description of Certain Indebtedness—Senior Credit Facility."
Work stoppages and other labor problems could materially reduce our ability to operate our business.
As of April 2,December 31, 2005, approximately 29%26% of our hourly employees in the U.S. and abroad were represented by labor unions. While we believe our relations with our employees are satisfactory, a lengthy strike or other work stoppage at any of our facilities, particularly at some of our larger facilities, could materially reduce our ability to operate our business. We most recently experienced a four-month work stoppage in calendar years 2003-2004 at our Nice Bearings facility. This strike did not materially impact our operations, but we cannot assure you that a work stoppage at one or more of our facilities will not materially impair our ability to operate our business in the future. In addition, any attempt by our employees not currently represented by a union to join a union could result in additional expenses, including with respect to wages, benefits and pension obligations. One of ourWe currently have four collective bargaining agreements covering approximately 50 employees was originally due to expire in July 2004 and was extended to October 29, 2005. Of our remaining four collective bargaining
agreements, one agreement covering approximately 5153 employees will expire in June of 2007, two agreementsone agreement covering approximately 12138 employees will expire in October 2009, one agreement covering approximately 72 employees will expire in January of 2008 and one agreement covering approximately 125113 employees will expire in June 2008. In February 2006 we entered into a shutdown agreement which effectively terminated one collective bargaining agreement covering approximately 43 employees. We expect that the facility will be shutdown in the first quarter of 2008.fiscal 2007. We expect that such shutdown will not be material to our operations or financial results.
Negotiations for the extension of these agreements may result in modifications to the terms of these agreements, and these modifications could cause us to incur increased costs relating to our labor force.
In addition, work stoppages at one or more of our customers or suppliers, including suppliers of transportation services, many of which have large unionized workforces, for labor or other reasons could also cause disruptions to our business that we cannot control, and these disruptions may materially reduce our revenues and profitability.
Our business is capital intensive and may consume cash in excess of cash flow from our operations.
Our ability to remain competitive, sustain our growth and expand our operations largely depends on our cash flow from operations and our access to capital. We intend to fund our cash needs through operating cash flow and borrowings under our Senior Credit Facility. We may require additional equity or debt financing to fund our growth and debt repayment obligations. In addition, we may need
additional capital to fund future acquisitions. Our business may not generate sufficient cash flow, and we may not be able to obtain sufficient funds to enable us to pay our debt obligations and capital expenditures or we may not be able to refinance on commercially reasonable terms, if at all. See "Management's Discussion and Analysis of Financial Condition and Results of Operations—Liquidity and Capital Resources—Liquidity."
Unexpected equipment failures, catastrophic events or capacity constraints may increase our costs and reduce our sales due to production curtailments or shutdowns.
Our manufacturing processes are dependent upon critical pieces of equipment, such as furnaces, continuous casters and rolling equipment, as well as electrical equipment, such as transformers, and this equipment may, on occasion, be out of service as a result of unanticipated failures. In addition to equipment failures, our facilities are also subject to the risk of catastrophic loss due to unanticipated events such as fires, explosions, earthquakes or violent weather conditions. In the future, we may experience material plant shutdowns or periods of reduced production as a result of these types of equipment failures or catastrophes. Interruptions in production capabilities will inevitably increase our production costs and reduce sales and earnings for the affected period.
Certain of our facilities are operating at a single shift with light second and third shifts, and additional demand may require additional shifts and/or capital investments at these facilities. We cannot assure you that we will be able to add additional shifts as needed in a timely way and production constraints may result in lost sales. In certain markets we refrain from making additional capital investments to expand capacity where we believe market expansion in a particular end market is not sustainable or otherwise does not justify the expansion or capital investment. Our assumptions and forecasts regarding market conditions in these end markets may be erroneous and may result in lost earnings, potential sales going to competitors and inhibit our growth.
The occurrence of extraordinary events, such as a major terrorist attack in the U.S., may adversely affect our business, resulting in a decrease in our revenues.
Future terrorist attacks cannot be predicted, and their occurrence can be expected to negatively affect the economy of the U.S. and other countries in which we do business. Such attacks may have a material impact on the markets in which we operate, particularly commercial aerospace, as increased terrorist activity around the world is likely to cause a reduction in air travel. For example, in the period following September 11, 2001, aircraft orders declined significantly and materially reduced our sales to the aerospace market. Similar effects are likely to result if there is a significant increase in terrorist activity around the world, particularly if commercial airliners are again involved in one or more major terrorist incidents. Other kinds of significant terror incidents may also impair our ability to conduct our manufacturing and other business activities for extended periods depending on the nature and severity of the event.
We may not be able to continue to make the acquisitions necessary for us to realize our growth strategy.
The acquisition of businesses that complement or expand our operations has been and continues to be an important element of our business strategy. We cannot assure you that we will be successful in identifying attractive acquisition candidates or completing acquisitions on favorable terms in the future. Our inability to acquire businesses, or to operate them profitably once acquired, could have a material adverse effect on our business, financial position, cash flow and growth.
The costs and difficulties of integrating acquired businesses could impede our future growth.
We cannot assure you that any future acquisition will enhance our financial performance. Our ability to effectively integrate any future acquisitions will depend on, among other things, the adequacy of our implementation plans, the ability of our management to oversee and operate effectively the combined operations and our ability to achieve desired operating efficiencies and sales goals. The
integration of any acquired businesses might cause us to incur unforeseen costs, which would lower our future earnings and would prevent us from realizing the expected benefits of these acquisitions.
Even if we are able to integrate future acquired businesses with our operations successfully, we cannot assure you that we will realize all of the cost savings, synergies or revenue enhancements that we anticipate from such integration or that we will realize such benefits within the expected time frame.
We depend heavily on our senior management and other key personnel, the loss of whom could materially affect our financial performance and prospects.
Our business is managed by a small number of key executive officers, including Dr. Michael J. Hartnett. Our future success will depend on, among other things, our ability to keep the services of these executives and to hire other highly qualified employees at all levels. Dr. Hartnett is the only member of our senior management team with a long-term employment contract. The remainder of our key executives are at-will employees.
We compete with other potential employers for employees, and we may not be successful in hiring and retaining executives and other skilled employees that we need. Our ability to successfully execute our business strategy, market and develop our products and serve our customers could be adversely affected by a shortage of available skilled employees or executives.
Our international operations are subject to risks inherent in such activities.
We have established operations in certain countries outside the U.S., including Mexico, France and Switzerland. Of our 18 facilities, 4 are located outside the U.S., including 2 manufacturing facilities.
Approximately one-fifth21% of our net sales were derived directly or indirectly from sales outside the U.S. during fiscal year 2005 and during the nine month period ended December 31, 2005. We expect that this proportion is likely to increase as we seek to increase our penetration of foreign markets, including through acquisitions, particularly within the aerospace and defense markets. Our foreign operations are subject to the risks inherent in such activities such as: currency devaluations, logistical and communications challenges, costs of complying with a variety of foreign laws and regulations, greater difficulties in protecting and maintaining our rights to intellectual property, difficulty in staffing and managing geographically diverse operations, acts of terrorism or war or other acts that may cause social disruption which are difficult to quantify or predict and general economic conditions in these foreign markets. We are not aware of any proposed material regulatory changes, but our international operations may be negatively impacted by changes in government policies, such as changes in laws and regulations (or the interpretation thereof), restrictions on imports and exports, sources of supply, duties or tariffs, the introduction of measures to control inflation and changes in the rate or method of taxation. To date we have not experienced significant difficulties with the foregoing risks associated with our international operations, however, as the size of our international operations has continued to grow, we expect these risks to become increasingly important to our business operations.
Currency translation risks may have a material impact on our results of operations.
Our Swiss operations utilize the Swiss franc as the functional currency and our French operations utilize the Euro as the functional currency. Foreign currency transaction gains and losses are included in earnings. Foreign currency transaction exposure arises primarily from the transfer of foreign currency from one subsidiary to another within the group and to foreign currency denominated trade receivables. Unrealized currency translation gains and losses are recognized upon translation of the foreign subsidiaries' balance sheets to U.S. dollars. Because our financial statements are denominated in U.S. dollars, changes in currency exchange rates between the U.S. dollar and other currencies have had, and will continue to have, an impact on our earnings. While we monitor exchange rates, we currently do not have exchange rate hedges in place to reduce the risk of an adverse currency exchange movement. Although currency fluctuations have not had a material impact on our financial performance in the past, such fluctuations may affect our financial performance in the future. The impact of future
exchange rate fluctuations on our results of operations cannot be accurately predicted. See "Management's Discussion and Analysis of Financial Condition and Results of Operations—Foreign Currency Exchange Rates."
Our pension plans are underfunded, and we may be required to make significant future contributions to the plans.
As of April 2,December 31, 2005, we maintained noncontributory defined benefit pension plans covering substantially all of our union employees in our Heim division plant in Fairfield, Connecticut, our Nice subsidiary plant in Kulpsville, Pennsylvania, our Bremen subsidiary plant in Plymouth, Indiana and our Tyson subsidiary plant in Glasgow, Kentucky. As of April 2, 2005, our plans were underfunded by $3.4 million, which is the amount by which the accumulated benefit obligations exceed the sum of the fair market value of plans' assets. We are required to make cash contributions to our pension plans to the extent necessary to comply with minimum funding requirements imposed by employee benefit and tax laws. The amount of any such required contributions is determined based on annual actuarial valuation of the plans as performed by the plan's actuaries. The amount of future contributions will depend upon asset returns, then-current discount rates and a number of other factors, and, as a result, the amount we may elect or be required to contribute to our pension plans in the future may increase significantly. Additionally, there is a risk that if the Pension Benefit Guaranty Corporation concludes that its risk with respect to our pension plan may increase unreasonably if the plan continues to operate, if we are unable to satisfy the minimum funding requirement for the plans or if the plans become unable to pay benefits, then the Pension Benefit Guaranty Corporation could terminate the plans and take control of their assets. In such event, we may be required to make an immediate
payment to the Pension Benefit Guaranty Corporation of all or a substantial portion of the underfunding as calculated by the Pension Benefit Guaranty Corporation based upon its own assumptions. The underfunding calculated by the Pension Benefit Guaranty Corporation could be substantially greater than the underfunding we have calculated because, for example, the Pension Benefit Guaranty Corporation may use a significantly lower discount rate. If such payment is not made, then the Pension Benefit Guaranty Corporation could place liens on a material portion of our assets and the assets of any members of our controlled group. Such action could result in a material increase in our pension related expenses and a corresponding reduction in our cash flow and net income. For additional information concerning our pension plans and plan liabilities, see Note 9 to our unaudited consolidated financial statements for the nine months ended December 31, 2005 and Note 13 to our consolidated financial statements for the fiscal year ended April 2, 2005 attached to this prospectus.
We may incur material losses for product liability and recall related claims.
We are subject to a risk of product and recall related liability in the event that the failure of any of our products results in personal injury or death, property damage or does not conform to our customers' specifications. In particular, our products are installed in a number of types of vehicle fleets, including airplanes, trains, automobiles, heavy trucks and farm equipment, many of which are subject to government ordered as well as voluntary recalls by the manufacturer. If one of our products is found to be defective, causes a fleet to be disabled or otherwise results in a product recall, significant claims may be brought against us. Although we have not had any material product liability or recall related claims made against us, and we currently maintain product liability insurance coverage for product liability, although not for recall related claims, we cannot assure you that product liability or recall related claims, if made, would not exceed our insurance coverage limits or would be covered by insurance which, in turn, may result in material losses related to these claims, increased future insurance costs and a corresponding reduction in our cash flow and net income.
Environmental regulations impose substantial costs and limitations on our operations, and environmental compliance may be more costly than we expect.
We are subject to various federal, state and local environmental laws and regulations, including those governing discharges of pollutants into the air and water, the storage, handling and disposal of wastes and the health and safety of employees. These laws and regulations could subject us to material costs and liabilities, including compliance costs, civil and criminal fines imposed for failure to comply with these laws and regulations and litigation costs. We also may be liable under the federal Comprehensive Environmental Response, Compensation, and Liability Act, or similar state laws, for the costs of investigation and clean-up of contamination at facilities currently or formerly owned or operated by us or at other facilities at which we have disposed of hazardous substances. In connection with such contamination, we may also be liable for natural resource damages, government penalties and claims by third parties for personal injury and property damage. Compliance with these laws and regulations may prove to be more limiting and costly than we anticipate. New laws and regulations, stricter enforcement of existing laws and regulations, the discovery of previously unknown contamination or the imposition of new clean-up requirements could require us to incur costs or become the basis for new or increased liabilities that could cause a material increase in our environmental related compliance costs and a corresponding reduction in our cash flow and net income. Investigation and remediation of contamination at some of our sites is ongoing. Actual costs to clean-up these sites may exceed our current estimates. Although we have indemnities for certain pre-closing environmental liabilities from the prior owners in connection with our acquisition of several of our facilities, we cannot assure you that the indemnities will be adequate to cover known or newly discovered pre-closing liabilities.
The interests of certain stockholders, particularly Whitney Investor and Dr. Hartnett, could conflict with those of other holders of our securities.
When this offering is completed, our executive officers, directors and stockholders who beneficially owned more than 5% of our common stock before the completion of this offering, will, in aggregate, beneficially own shares representing approximately 50.9% of our capital stock assuming exercise of options and warrants only by such persons. Whitney RBHC Investor, LLC, or Whitney Investor, and Dr. Hartnett and his affiliates will control 44.7% and 10.8% of our common stock, respectively, assuming exercise of options and warrants only by such persons. In addition, if these stockholders were to choose to act together, or with other significant stockholders, they could control, and will, in any event, have a large degree of influence over, matters submitted to our stockholders for approval, as well as our management and affairs. For example, these persons, if they choose to act together, could control the election of directors and approval of any merger, consolidation or sale of all or substantially all of our assets. This concentration of voting power could delay or prevent an acquisition of our company on terms that other stockholders may desire.
Our intellectual property and other proprietary rights are valuable, and any inability to protect them could adversely affect our business and results of operations; in addition, we may be subject to infringement claims by third parties.
Our ability to compete effectively is dependent upon our ability to protect and preserve the intellectual property and other proprietary rights and materials owned, licensed or otherwise used by us. We have numerous U.S. and foreign patents, U.S. trademark registrations and U.S. copyright registrations. Our issued patents are expected to expire by their own terms at various dates and most such patents will not expire for at least 5 years. We also have U.S. trademark and patent applications pending. We cannot assure you that our pending trademark and patent applications will result in trademark registrations and issued patents, and our failure to secure rights under these applications may limit our ability to protect the intellectual property rights that these applications were intended to cover. Although we have attempted to protect our intellectual property and other proprietary rights both in the United States and in foreign countries through a combination of patent, trademark, copyright and trade secret protection and non-disclosure agreements, these steps may be insufficient to prevent unauthorized use of our intellectual property and other proprietary rights, particularly in foreign countries where the protection available for such intellectual property and other proprietary rights may be limited. To date we are not currently engaged in and have not had any material infringement or other claims pertaining to our intellectual property brought by us or against us in recent years. We cannot assure you that any of our intellectual property rights will not be infringed upon or that our trade secrets will not be misappropriated or otherwise become known to or independently developed by competitors. We may not have adequate remedies available for any such infringement or other unauthorized use. We cannot assure you that any infringement claims asserted by us will not result in our intellectual property being challenged or invalidated, that our intellectual property will be held to be of adequate scope to protect our business or that we will be able to deter current and former employees, contractors or other parties from breaching confidentiality obligations and misappropriating trade secrets. In addition, we may become subject to claims against us which could require us to pay damages or limit our ability to use certain intellectual property and other proprietary rights found to be in violation of a third party's rights, and, in the event such litigation is
successful, we may be unable to use such intellectual property and other proprietary rights at all or on reasonable terms. Regardless of its outcome, any litigation, whether commenced by us or third parties, could be protracted and costly and could result in increased litigation related expenses, the loss of intellectual property rights or payment of money or other damages, which may result in lost sales and reduced cash flow and decrease our net income. See "Business—Intellectual Property."
Cancellation of orders in our backlog of orders could negatively impact our revenues.
As of April 2,December 31, 2005, we had an order backlog of $134.8$152.6 million, which we estimate will be fulfilled within the next 12 months. However, orders included in our backlog are subject to cancellation, delay or other modifications by our customers prior to fulfillment. For these reasons, we cannot assure you that orders included in our backlog will ultimately result in the actual receipt of revenues from such orders.
If we fail to maintain an effective system of internal controls, we may not be able to accurately report our financial results or prevent fraud.
Effective internal controls are necessary for us to provide reliable financial reports and effectively prevent fraud. Any inability to provide reliable financial reports or prevent fraud could harm our business. We are in the process of instituting changes to our internal procedures to satisfy the requirements of the Sarbanes-Oxley Act of 2002, which require management and our auditors to evaluate and assess the effectiveness of our internal controls by March 31, 2007. Implementing these changes may take a significant amount of time and may require specific compliance training of our directors, officers and other personnel. To date we have not detected any material weakness or significant deficiencies in our internal control over financial reporting. However, we are continuing to evaluate and, where appropriate, enhance our policies, procedures and internal controls. If we fail to maintain the adequacy of our internal controls, as such standards are modified, supplemented or amended from time to time, we could be subject to regulatory scrutiny, civil or criminal penalties or shareholder litigation. In addition, failure to maintain adequate internal controls could result in financial statements that do not accurately reflect our financial condition. Inferior internal controls could also cause investors to lose confidence in our reported financial information, which could have a negative effect on the trading price of our stock. We cannot assure you that we will be able to complete the work necessary to fully comply with the requirements of the Sarbanes-Oxley Act or that management or our auditors will conclude that our internal controls are effective.
We will face new challenges and increased costs as a public company.
OurPrior to our initial public offering in August 2005, our management team hashad historically operated our business as a privately held company. We expect that the obligations of being a public company, including substantial public reporting and investor relations obligations, will require significant legal, accounting and other additional expenditures, as well as stock exchange listing requirements, which will place additional demands on our management and may require the hiring of additional personnel. These obligations and related expenses will increasehave increased our operating expenses since our initial public offering and will continue to do so and could divert our management's attention from our operations. We also expect theseThese new rules and regulations may make it more difficult and more expensive for us to obtain director and officer liability insurance, and we may be required to accept reduced policy limits and coverage or incur substantially higher costs to obtain the same or similar coverage. As a result, it may be more difficult for us to attract and retain qualified individuals to serve on our board of directors or as executive officers. We are currently evaluating and monitoring developments with respect to these new rules, and we cannot accurately predict the amount of additional costs we may incur or the timing of such costs, butcosts. For the nine month period ended December 31, 2005, we estimate that we have estimated for purposesincurred approximately $0.9 million of additional costs in connection with our Unaudited Pro Forma Condensed Consolidated Financial Statementsoperation as a public company. We can provide no assurance that such costs would be equal to approximately $1.5 million per year.may not increase significantly in the future, particularly in
connection with the work required for our accountants to certify the adequacy of our internal controls over financial reporting.
Risk Factors Related to this Offeringour Common Stock
Provisions in our charter documents and under Delaware law may prevent or frustrate attempts by our stockholders to change our management and hinder efforts to acquire a controlling interest in us.
Provisions of our certificate of incorporation and bylaws may discourage, delay or prevent a merger, acquisition or other change in control that stockholders may consider favorable, including transactions in which you might otherwise receive a premium for your shares. These provisions may also prevent or frustrate attempts by our stockholders to replace or remove our management. These provisions include:
The affirmative vote of the holders of at least 662/3% of our shares entitled to vote is necessary to amend or repeal the above provisions of our certificate of incorporation. In addition, absent approval of our board of directors, many of our bylaw provisions may only be amended or repealed by the affirmative vote of the holders of at least 662/3% of our shares entitled to vote.
Our certificate of incorporation authorizes the issuance of "blank check" preferred stock with such designations, rights and preferences as may be determined from time to time by our board of directors. Accordingly, the board of directors is empowered, without shareholderstockholder approval, to issue preferred stock with dividend, liquidation, conversion, voting or other rights that could materially adversely affect the voting power or other rights of the holders of our common stock, including purchasers in this offering. Holders of the common stock will not have preemptive rights to subscribe for a pro rata portion of any capital stock which may be issued by us. In the event of issuance, such preferred stock could be utilized, under certain circumstances, as a method of discouraging, delaying or preventing a change in control of RBCI. Although we have no present intention to issue any new shares of preferred stock, we may do so in the future.
In addition, Section 203 of the Delaware General Corporation Law prohibits a publicly held Delaware corporation from engaging in a business combination with an interested stockholder, generally a person which together with its affiliates owns, or within the last three years has owned, 15% of our voting stock, for a period of three years after the date of the transaction in which the person became an interested stockholder, unless the business combination is approved in a prescribed manner. Accordingly, Section 203 may discourage, delay or prevent a change in control of our company.
If you purchase shares of common stock in this offering, you will suffer immediate and substantial dilution of your investment.
Purchasers of common stock in this offering will pay a price per share that substantially exceeds the per share value of our tangible assets after subtracting our liabilities and the per share price paid by our existing stockholders and by persons who exercise currently outstanding options and warrants to acquire our common stock. Accordingly, based on the initial public offering price of $15.00 per share, you will experience immediate and substantial dilution of $13.84 per share, representing the difference between our pro forma net tangible book value per share after giving effect to the Pre-Offering Transactions and this offering at the initial public offering price. If the underwriters exercise their overallotment option, or if outstanding options and warrants to purchase our common stock are exercised, you will experience additional dilution. See "Dilution."
An active trading market for our common stock may not develop.
Prior to this offering, there has been no public market for our common stock. Although our common stock has been approved for quotation on the Nasdaq National Market, an active trading market for our shares may never develop or be sustained following this offering. The initial public offering price for our common stock was determined through negotiations with the underwriters. This initial public offering price may vary from the market price of our common stock after the offering. Investors may not be able to sell their common stock at or above the initial public offering price. We cannot assure you that a market will develop for our common stock or what the market price of our common stock will be. If a market does not develop or is not sustained, it may be difficult for you to sell your shares of common stock at an attractive price or at all. We cannot predict the prices at which our common stock will trade.
If there are substantial sales of our common stock, our stock price could decline.
If our existing stockholders sell a large number of shares of our common stock or the public market perceives that existing stockholders might sell shares of our common stock, the market price of our common stock could decline significantly. Substantially all of the existing holdersAll of our equity securitiesdirectors, executive officers and the selling stockholders will have executed 90-day lock-up agreements for their shares prior to the completion of this offering have executed 180-dayoffering. Our other stockholders, including employee holders of warrants, options and restricted stock will not be executing lock-up agreements (or 90-day lock-up agreements with respect to 2.5% of our pro forma fully diluted shares of common stock) for their shares.agreements. The shares will be eligible for sale pursuant to Rule 144 uponor otherwise subject to the expiration of the lock-up agreements for those persons who are executing such agreements. See "Shares Eligible for Future Sale."
Upon completion of this offering, Whitney Investor will have rights to require us to register its shares of common stock with the SEC. If we register Whitney Investor's shares of common stock following the expiration of the lock-up agreement, Whitney Investor can sell those shares in the public market. See "Related Party Transactions—Amended and Restated Stockholders Agreement—Registration Rights."
Not earlier than 90 days following this offering, we intend to register approximately 3,071,653 shares of common stock that are authorized for issuance under our stock option plans and outstanding warrants. We will also be able to issue 455,668 additional options after this offering under our 2005 Long-Term Incentive Plan. Once we register the shares authorized for issuance under our stock option plans, they can be freely sold in the public market upon issuance, subject to the lock-up agreements referred to above and the restrictions imposed on our affiliates under Rule 144.
DISCLOSURE REGARDING FORWARD-LOOKING STATEMENTS
This prospectus contains "forward-looking statements." All statements other than statements of historical fact are "forward-looking statements" for purposes of federal and state securities laws, including any projections of earnings, revenue or other financial items; any statements of the plans, strategies and objectives of management for future operations; any statements concerning proposed new services or developments; any statements regarding future economic conditions or performance; future growth rates in the markets we serve; increases in foreign sales; supply and cost of raw materials, any statements of belief; and any statements of assumptions underlying any of the foregoing. Forward-looking statements may include the words "may," "estimate," "intend," "continue," "believe," "expect" or "anticipate" and other similar words.
Although we believe that the expectations reflected in any of our forward-looking statements are reasonable, actual results could differ materially from those projected or assumed in any of our forward-looking statements. Our future financial condition and results of operations, as well as any forward-looking statements, are subject to change and to inherent risks and uncertainties, such as those disclosed in this prospectus. Factors that could cause our actual results, performance and achievements or industry results to differ materially from estimates or projections contained in forward-looking statements include, among others, the following:
Additional factors that could cause actual results to differ materially from our forward-looking statements are set forth in this prospectus, including under the headings "Prospectus Summary," "Risk Factors," "Management's Discussion and Analysis of Financial Condition and Results of Operations," "Business" and in our "Summary Financial Data" and our "Unaudited Pro Forma Condensed Consolidated Financial Statements" and related notes. We do not intend, and undertake no obligation, to update any forward-looking statement. The Private Securities Litigation Reform Act of 1995 and Section 27A of the Securities Act do not protect forward-looking statements we make in connection with this offering.
Before deciding whether to invest in our common shares, you should carefully consider the matters set forth under the heading "Risk Factors" and all other information contained in this prospectus. All subsequent written and oral forward-looking statements attributable to us, or persons acting on our behalf, are expressly qualified in their entirety by the cautionary statements.
Assuming a public offering price of $15.00 per share, the midpoint of the range on the front cover of this prospectus, weWe estimate that the net proceeds to us from this offering (withoutwithout exercise of the overallotment option),option, after deducting the underwriting discount and estimated expenses of the offering, will be approximately $85.7$20.0 million. If the underwriters' overallotment option is exercised in full, we estimate that we will receive net proceeds of approximately $96.3$40.9 million. We will not receive any of the proceeds from the sale of shares of common stock by the selling stockholders, including the exercise of options and warrants by them pursuant to a net share settlement.stockholders.
We intend to use thesethe full amount of the net proceeds together with net proceedsfrom this offering described above to prepay outstanding balances under our Term Loan, which were $147.6 million as of approximately $38.3 million from an increase inDecember 31, 2005. For a description of our Term Loan under our amended and restated Senior Credit Facility, to:
Any remaining proceeds will bethe prior year were used to refinance or repay outstanding indebtedness or for general corporate purposes.our then existing indebtedness.
The data included in this prospectus regarding markets, product categories, ranking and percentage of our sales to the aftermarket, including, but not limited to, the size of certain markets, product categories and sales volumes and our position and the positions of our competitors within these markets and product categories, are based on our estimates and definitions, which have been derived from management's knowledge and experience in the areas in which the relevant businesses operate. Estimates for the anticipated rate of growth for the bearing industry have been obtained from a report titledFreedonia Focus on Bearings published in November 2004 by The Freedonia Group, Inc. and obtained by us after a payment by us to The Freedonia Group, Inc. of a licensing fee. We believe that these sources, in each case, provide reasonable estimates. However, market share data is subject to change and cannot always be verified with complete certainty due to limits on the availability and reliability of raw data, the voluntary nature of the data gathering process and other limitations and uncertainties inherent in any statistical survey of market shares. In addition, consumption patterns and customer preferences can and do change. In addition, we may define our markets in a way that may be different from how our competitors or others define their markets. References herein to our being a leader in a certain market or product category refer to our having a leading position based on sales in fiscal year 2005 of bearing products in such market or product category, unless the context otherwise requires.
PRICE RANGE OF OUR COMMON STOCK
Our common stock is quoted on the Nasdaq National Market under the symbol "ROLL." The following table shows the high and low sales prices of our common stock as reported by the Nasdaq National Market during the periods indicated:
| | High | Low | |||||
|---|---|---|---|---|---|---|---|
| Fiscal year ended April 1, 2006 | |||||||
| Second Quarter (beginning on August 10, 2005) | $ | 17.68 | $ | 14.60 | |||
| Third Quarter | 18.27 | 14.20 | |||||
| Fourth Quarter (through March 28, 2006) | 22.24 | 16.23 | |||||
The last reported sale price of our common stock on the Nasdaq National Market on March 28, 2006 was $20.74 per share. As of March 13, 2006, there were 11 holders of record of our common stock.
We have never declared or paid any cash dividends on our common stock and do not expect to pay cash dividends for the foreseeable future. Our current policy is to retain all of our earnings to finance future growth. In addition, covenants in our credit facilities restrict our ability to pay dividends. Any future declaration of dividends will be determined by our board of directors, based upon our earnings, capital requirements, financial condition, debt covenants, tax consequences and other factors deemed relevant by our board of directors.
The following transactions, referred to as the Pre-Offering Transactions, will occur immediately prior to the completion of this offering:
Recapitalization
We currently have three classes of capital stock outstanding: Class B preferred stock, Class A common stock and Class B common stock. Immediately prior to the consummation of this offering, we will effectuate a series of transactions in order to, among other things, simplify our capital structure. Our simplified capital structure will have two classes of authorized capital stock (common stock and preferred stock), of which only shares of common stock will be outstanding after the offering. The recapitalization transaction will involve a number of steps to be effectuated contemporaneously with the consummation of the Refinancing Transaction (discussed below) and this offering. These steps will be as follows:
Stock Split. We will amend and restate our certificate of incorporation to effect a 5-for-2 stock split of our common stock.
Conversion of Class B Preferred Stock. Immediately prior to the consummation of the Recapitalization, all outstanding shares of Class B preferred stock will be converted in accordance with their terms into 1,846,396 (on a post stock split basis) shares of Class A common stock, shares of Class C preferred stock and shares of Class D preferred stock. All shares of Class C and Class D preferred stock will be redeemed with cash or common stock as described below.
Redemption of Class C Preferred Stock. Immediately after the conversion of the Class B preferred stock, we shall use proceeds from this offering and the Refinancing Transaction to redeem all outstanding Class C preferred stock, including any accrued and unpaid dividends, for an aggregate redemption price determined in accordance with our pre-offering certificate of incorporation. Assuming a August 1, 2005 redemption date, the aggregate redemption price of the Class C preferred stock would be approximately $30.5 million. This amount will increase at a rate of approximately 0.02% for each additional day that the Class C preferred stock remains outstanding as a result of preferred dividends which will continue to accrue thereon.
Repurchase of Class D Preferred Stock. Immediately after the conversion of the Class B preferred stock, we shall repurchase all of the outstanding Class D preferred stock for an aggregate repurchase price equal to $8.0 million payable as follows: $4.0 million of the repurchase price shall be paid in cash using proceeds from this offering and the Refinancing Transaction, and $4.0 million shall be paid in shares of our Class A common stock based on the offering price (before giving effect to underwriters' discounts or commissions).
Reclassification of Class A Common Stock and Class B Common Stock. Immediately after the transactions described above, we will amend and restate our certificate of incorporation to provide for, among other things, authorized capital stock of 60.0 million shares of common stock and 10.0 million shares of preferred stock after giving effect to a 5-for-2 stock split. As a result, all of our Class A common stock and Class B common stock (including shares of Class A common stock issued upon conversion of the Class B preferred stock and repurchase of the Class D preferred stock) will be reclassified as common stock, on a one-for-one basis.
Stock Options and Warrants. Following the reclassification of our shares, all outstanding options and warrants to purchase our Class A common stock and Class B common stock will become exercisable into shares of our newly created common stock in accordance with the terms of our stock option plans and stock option and warrant agreements. We will freeze our existing 1998 Stock Option Plan and 2001 Stock Option Plan such that no further awards or grants may be made under them. We will establish a new 2005 Long-Term Incentive Plan which will provide for the issuance of stock options or other equity awards equal to 1,139,170 shares of common stock. Of these options, 683,502 will be awarded to Dr. Hartnett upon the consummation of this offering at the offering price, subject to vesting, and the remainder will be reserved for grants to our employees (other than Dr. Hartnett) at the discretion of our compensation committee. With the exception of options and warrants that are exercised in connection with this offering, substantially all outstanding options and warrants to purchase common stock will be subject to a lock-up period of not less than 180 days (2.5% of our pro forma fully diluted shares of common stock will be subject to a lock-up period of 90 days) following the date of this prospectus. See "Use of Proceeds" and "Related Party Transactions—Pre-Offering Transactions."
Refinancing Transaction
We have entered into a commitment letter with GE Capital to amend and restate our existing Senior Credit Facility to increase borrowings under our Term Loan by $40.0 million and to reduce the interest rate on our Revolving Credit Facility and Term Loan by approximately 1.00%, referred to as the Refinancing Transaction. The Refinancing Transaction is subject to customary terms and conditions, including consummation of this offering. We expect to close the Refinancing Transaction simultaneously with the closing of this offering. The proceeds from the Refinancing Transaction and the proceeds from this offering will be used for the purposes described under "Use of Proceeds."
The following table sets forth our cash and capitalization as of April 2,December 31, 2005 on an actual basis and pro forma basisas adjusted to give effect toto:
This table should be read in conjunction with "Use of Proceeds," "Summary Financial Data," "Selected Consolidated Historical Financial Data" and the historical financial statements and related notes thereto included elsewhere in this prospectus. See also "Management's Discussion and Analysis of Financial Condition and Results of Operations—Liquidity and Capital Resources,"Resources" and "Description of Certain Indebtedness," "Pre-Offering Transactions" and "Unaudited Pro Forma Condensed Consolidated Financial Statements.Indebtedness."
| | As of April 2, 2005 | |||||||||
|---|---|---|---|---|---|---|---|---|---|---|
| | Actual | Pro Forma | ||||||||
| | (in thousands) | |||||||||
| Cash | $ | 2,635 | $ | 6,802 | ||||||
| Debt | ||||||||||
| Term loan | $ | 109,175 | $ | 149,175 | ||||||
| Revolving credit facility(1) | 5,000 | 5,000 | ||||||||
| Discount debentures | 37,949 | — | ||||||||
| Second lien term loan | 45,000 | — | ||||||||
| Other debt(2) | 22,955 | 22,955 | ||||||||
| Total debt | 220,079 | 177,130 | ||||||||
| Stockholders' equity(3) | ||||||||||
| Preferred stock | 2 | — | ||||||||
| Common stock | 62 | 155 | ||||||||
| Additional paid-in capital | 34,252 | 85,293 | ||||||||
| Deferred compensation | (349 | ) | 4,519 | |||||||
| Accumulated other comprehensive loss | (2,532 | ) | (2,532 | ) | ||||||
| Accumulated deficit | (39,194 | ) | (40,933 | ) | ||||||
| Total stockholders' equity (deficit) | (7,759 | ) | 46,502 | |||||||
| Total capitalization | $ | 212,320 | $ | 223,632 | ||||||
| | December 31, 2005 | |||||||||
|---|---|---|---|---|---|---|---|---|---|---|
| | Actual | As Adjusted(3) | ||||||||
| | (in thousands) | |||||||||
| Cash | $ | 10,312 | $ | 10,312 | ||||||
Debt: | ||||||||||
| Senior Credit Facility(1) | $ | 147,625 | $ | 127,463 | ||||||
| Other debt(2) | 21,405 | 21,405 | ||||||||
| Total debt | 169,030 | 148,868 | ||||||||
Stockholders' equity: | ||||||||||
| Common stock | 166 | 180 | ||||||||
| Additional paid-in capital | 98,206 | 118,354 | ||||||||
| Deferred compensation | (158 | ) | (158 | ) | ||||||
| Accumulated other comprehensive loss | (3,532 | ) | (3,532 | ) | ||||||
| Accumulated deficit | (32,710 | ) | (32,710 | ) | ||||||
| Total stockholders' equity | 61,972 | 82,134 | ||||||||
| Total capitalization | $ | 231,002 | $ | 231,002 | ||||||
Our pro forma net tangible book value as of April 2, 2005 was approximately ($65.9) million, or ($7.18) per share of common stock. Pro forma net tangible book value per share represents total tangible assets less total liabilities, divided by the number of outstanding shares of common stock after giving effect to the Pre-Offering Transactions and the exercise of options and warrants pursuant to a net share settlement by the selling stockholders. See "Pre-Offering Transactions." After giving effect to the Pre-Offering Transactions, the exercise of options and warrants by the selling stockholders pursuant to a net share settlement, the sale of the shares of common stock offered by us at an assumed initial public offering price of $15.00 per share, the midpoint of the range on the front cover of this prospectus, after deducting underwriting discounts and estimated offering expenses, and giving effect to the use of proceeds from this offering, the pro forma as adjusted net tangible book value as of April 2, 2005 would have been $18.0 million, or approximately $1.16 per share of common stock. This represents an immediate increase in net tangible book value of $8.34 per share to existing stockholders and an immediate dilution in net tangible book value of $13.84 per share to new investors in this offering. The following table illustrates this dilution on a per share basis:
The following table summarizes, as of April 2, 2005, and, after giving pro forma effect to the Pre-Offering Transactions, the exercise of options and warrants by the selling stockholders pursuant to a net share settlement and this offering as if these transactions had occurred as of such date, the differences between existing stockholders and the new investors with respect to the number of shares of common stock purchased from us, the total consideration paid and the average price per share paid before deducting the underwriting discount and commissions and our estimated offering expenses, at an assumed initial public offering price of $15.00 per share.
| | Shares Purchased | Total Consideration | | ||||||||||
|---|---|---|---|---|---|---|---|---|---|---|---|---|---|
| | Average Price Per Share | ||||||||||||
| | Number | Percent | Amount | Percent | |||||||||
| Existing Stockholders | 9,185,833 | 59.4 | % | $ | 83,936,264 | 47.1 | % | $ | 9.14 | ||||
| New Investors | 6,273,000 | 40.6 | % | 94,095,000 | 52.9 | % | 15.00 | ||||||
| Total | 15,458,833 | 100.0 | % | $ | 178,031,264 | 100.0 | % | ||||||
If the underwriters' overallotment option is exercised in full:
The discussion and tables above assume no exercise of stock options or warrants, or the options to be granted to Dr. Hartnett under our 2005 Long-Term Incentive Plan simultaneously with the closing of this offering, outstanding as of April 2, 2005, other than options and warrants exercised on a net share
settlement basis, in each case by the selling stockholders in connection with this offering. After giving effect to the Pre-Offering Transactions and this offering and the options to be granted to Dr. Hartnett under our 2005 Long-Term Incentive Plan simultaneously with the closing of this offering, we will have options and warrants outstanding to purchase a total of 3,071,653 shares of common stock, with a weighted average exercise price of $5.42 per share. Assuming the exercise in full of these stock options and warrants, the number of shares purchased by existing stockholders would increase to 12,257,486, total consideration paid by them would increase to $100.6 million and the average price per share paid by them would be decreased to $8.20 per share.
UNAUDITED PRO FORMA CONDENSED CONSOLIDATED FINANCIAL STATEMENTS
The following unaudited pro forma condensed consolidated financial statements are based on our historical consolidated financial statements included elsewhere in this prospectus, adjusted to give effect to the following transactions:
The unaudited pro forma condensed consolidated balance sheet as of April 2, 2005 and the unaudited pro forma condensed consolidated statement of operations for the year ended April 2, 2005 give effect to the transactions described above as if they had occurred on April 2, 2005 and April 4, 2004, respectively.
The pro forma adjustments are based upon available information and certain assumptions that we believe are reasonable. The unaudited pro forma condensed consolidated financial statements do not purport to represent what our financial condition or results of operations would actually have been had these transactions in fact occurred as of the dates indicated above or to project our results of operations for these periods indicated or for any other period. This unaudited pro forma condensed consolidated financial information should be read in conjunction with "Prospectus Summary—The Offering," "Use of Proceeds," "Pre-Offering Transactions," "Selected Consolidated Historical Financial Data," "Management's Discussion and Analysis of Financial Condition and Results of Operations" and our consolidated financial statements and related notes appearing elsewhere in this prospectus.
RBC Bearings Incorporated
Unaudited Pro Forma Condensed Consolidated Balance Sheet
April 2, 2005
| | Historical | Pro Forma Adjustments | Pro Forma | ||||||||
|---|---|---|---|---|---|---|---|---|---|---|---|
| | (Restated)(16) | | | ||||||||
| | (in thousands) | ||||||||||
| ASSETS | |||||||||||
| Current assets: | |||||||||||
| Cash | $ | 2,635 | $ | 4,167 | (1)(2)(3) | $ | 6,802 | ||||
| Accounts receivable, net of allowance for doubtful accounts of $628 | 53,967 | 53,967 | |||||||||
| Inventory | 95,654 | 95,654 | |||||||||
| Deferred income taxes | 4,509 | 5,902 | (4)(5) | 10,411 | |||||||
| Prepaid expenses and other current assets | 2,226 | 2,226 | |||||||||
| Total current assets | 158,991 | 10,069 | 169,060 | ||||||||
| Property, plant and equipment, net | 55,343 | 55,343 | |||||||||
| Goodwill | 25,150 | 25,150 | |||||||||
| Intangible assets, net of accumulated amortization of $949 | 3,333 | 3,333 | |||||||||
| Deferred financing costs, net of accumulated amortization of $1,280 | 4,755 | 1,243 | (6) | 5,998 | |||||||
| Other assets | 2,597 | 2,597 | |||||||||
| Total assets | $ | 250,169 | $ | 11,312 | $ | 261,481 | |||||
See accompanying notes.
| | Historical | Pro Forma Adjustments | Pro Forma | |||||||||
|---|---|---|---|---|---|---|---|---|---|---|---|---|
| | (Restated)(16) | | | |||||||||
| | (in thousands, except share and per share amounts) | |||||||||||
| LIABILITIES AND STOCKHOLDERS' EQUITY (DEFICIT) | ||||||||||||
| Current liabilities: | ||||||||||||
| Accounts payable | $ | 19,243 | $ | 19,243 | ||||||||
| Accrued expenses and other current liabilities | 10,621 | 10,621 | ||||||||||
| Current portion of long-term debt | 8,245 | $ | 400 | (7) | 8,645 | |||||||
| Capital lease obligations | 226 | 226 | ||||||||||
| Total current liabilities | 38,335 | 400 | 38,735 | |||||||||
| Long-term debt, less current portion | 211,834 | (43,349 | )(7)(8) | 168,485 | ||||||||
| Capital lease obligations, less current portion | 205 | 205 | ||||||||||
| Other non-current liabilities | 7,554 | 7,554 | ||||||||||
| Total liabilities | 257,928 | (42,949 | ) | 214,979 | ||||||||
| Class C redeemable preferred stock, $0.01 par value; authorized shares: 900,000; none issued and outstanding | — | — | ||||||||||
| Stockholders' equity (deficit): | ||||||||||||
| Class A preferred stock, $0.01 par value; authorized shares: 15,500; none issued and outstanding | — | — | ||||||||||
| Class B exchangeable convertible participating preferred stock, $0.01 par value; authorized shares: 240,000; issued and outstanding shares: 240,000 | 2 | (2 | )(9) | — | ||||||||
| Class D preferred stock, $0.01 par value; authorized shares: 240,000; none issued and outstanding | — | — | ||||||||||
| Class A voting common stock, $0.01 par value; authorized shares: 20,000,000; issued and outstanding shares: 6,202,519 | 62 | (62 | )(9) | — | ||||||||
| Class B super voting common stock, $0.01 par value; authorized shares: 2,500,000; issued and outstanding shares: 250 | — | — | ||||||||||
| Common stock, $0.01 par value; authorized shares: 60,000,000; issued and outstanding shares: 15,458,833 | — | 155 | (9) | 155 | ||||||||
| Preferred stock, $0.01 par value; authorized shares: 10,000,000; none issued and outstanding | — | — | ||||||||||
| Additional paid-in capital | 34,252 | 51,041 | (9) | 85,293 | ||||||||
| Deferred compensation | (349 | ) | 4,868 | (4) | 4,519 | |||||||
| Accumulated other comprehensive loss | (2,532 | ) | (2,532 | ) | ||||||||
| Accumulated deficit | (39,194 | ) | (1,739 | )(5)(10) | (40,933 | ) | ||||||
| Total stockholders' equity (deficit) | (7,759 | ) | 54,261 | 46,502 | ||||||||
| Total liabilities and stockholders' equity (deficit) | $ | 250,169 | $ | 11,312 | $ | 261,481 | ||||||
See accompanying notes.
RBC Bearings IncorporatedUnaudited Pro Forma Condensed Consolidated Statement of OperationsFiscal Year Ended April 2, 2005
| | Historical | Pro Forma Adjustments | Pro Forma | ||||||
|---|---|---|---|---|---|---|---|---|---|
| | (Restated)(16) | | | ||||||
| | (in thousands, except share and per share amounts) | ||||||||
| Net sales | $243,016 | $243,016 | |||||||
| Cost of sales | 174,602 | 174,602 | |||||||
| �� | |||||||||
| Gross margin | 68,414 | 68,414 | |||||||
| Operating expenses: | |||||||||
| Selling, general and administrative | 32,749 | $ 1,500 | (11) | 34,249 | |||||
| Other, net | 3,526 | (474 | )(12) | 3,052 | |||||
| Total operating expenses | 36,275 | 37,301 | |||||||
| Operating income | 32,139 | 31,113 | |||||||
Interest expense, net | 19,669 | (9,389 | )(13) | 10,280 | |||||
| Loss on early extinguishment of debt | 6,950 | 2,773 | (10) | 9,723 | |||||
| Other non-operating (income) | (355) | (355 | ) | ||||||
| Income before income taxes | 5,875 | 11,465 | |||||||
| Provision for (benefit from) income taxes | (1,385) | 2,085 | (14) | 700 | |||||
| Net income | 7,260 | 3,505 | 10,765 | ||||||
| Preferred stock dividends | (2,280) | 2,280 | (15) | — | |||||
| Participation rights of preferred stock in undistributed earnings | (1,142) | 1,142 | (15) | — | |||||
| Net income available to common stockholders | $ 3,838 | $ 6,927 | $ 10,765 | ||||||
| Net income per common share: | |||||||||
| Basic: | |||||||||
| Class A common stock | $ 0.62 | ||||||||
| Class B common stock | $ 0.62 | ||||||||
| Common stock | $ 0.70 | ||||||||
| Diluted: | |||||||||
| Class A common stock | $ 0.40 | ||||||||
| Class B common stock | $ 0.00 | ||||||||
| Common stock | $ 0.62 | ||||||||
| Weighted average common shares: | |||||||||
| Basic: | |||||||||
| Class A common stock | 6,202,365 | ||||||||
| Class B common stock | 250 | ||||||||
| Common stock | 15,458,833 | ||||||||
| Diluted: | |||||||||
| Class A common stock | 9,552,579 | ||||||||
| Class B common stock | 1,302,005 | ||||||||
| Common stock | 17,421,506 | ||||||||
See accompanying notes.
Notes to the unaudited pro forma condensed consolidated financial statements (in thousands, except share and per share amounts):
•exercise of 895,949 employee stock options and warrants by certain selling stockholders pursuant to a net share settlement, resulting in 870,000 newly issued shares of common stock at an assumed public offering price of $15.00 per share;•sale of 6,273,000 shares of common stock with $0.01 par value by us in this offering at an assumed public offering price of $15.00 per share; and•deduction of the underwriting discount and estimated fees and expenses of collectively approximately $8,427. The following table illustrates these adjustments to each related stockholders' equity account. Class B
Preferred
Stock Class A
Common
Stock Common
Stock Additional
Paid-in
Capital Conversion of Class B preferred stock $(2) $ — $ 18 $ (16 ) Redemption of Class C preferred stock — — — (30,536 ) Repurchase of Class D preferred stock — — 3 (4,003 ) Reclassification of Class A common stock and Class B common stock — (62 ) 62 — Exercise of employee stock options and warrants pursuant to a net share settlement — — 9 (9 ) Sale of common stock by us in this offering — — 63 94,032 Deduction of underwriting discount and estimated fees and expenses — — — (8,427 ) Total adjustments $(2) $ (62 ) $ 155 $ 51,041 10.Reflects $1,253 redemption premium and write-off of $613 unamortized bond discount related to the redemption of our 13% Senior Subordinated Discount Debentures, $450 prepayment fee related to repayment of all of our $45,000 Second Lien Term Loan and the write-off of the remaining $457 deferred financing fees.11.Reflects an income statement adjustment for the estimated annual incremental costs of $1,500 to operate as a public company, consisting of the following: (i) an increase in directors and officers insurance premium of approximately $400; (ii) professional services fees incurred in connection with the implementation of Section 404 of the Sarbanes-Oxley Act of approximately $400; (iii) an increase in legal and public company audit fees of approximately $200; (iv) public company listing and investor relations services fees of approximately $200; (v) an increase in compensation expense of approximately $200 for additional accounting personnel; and (vi) financial printing and other professional services fees of approximately $100. These amounts are based on actual market quotations and management's estimates.12.Reflects the elimination of management fees payable to Whitney, which will terminate upon consummation of this offering.13.The following table illustrates the adjustments to interest expense after giving effect to the Pre-Offering Transactions, including the Refinancing Transaction, this offering and the use of proceeds thereof. Fiscal Year Ended
April 2, 2005 Elimination of historical interest expense: Interest on 13% senior subordinated discount debentures $ (5,013 ) Interest on second lien term loan with an average interest rate of 11.2% (3,782 ) Interest on 95/8% senior subordinated notes (2,559 ) Interest on prior and existing senior credit facilities (5,745 ) Amortization of related deferred financing costs and discounts (1,076 ) (18,175 )
Interest on new borrowings:
Interest on $150,000 borrowings under amended and restated Term Loan 8,503 Amortization of related deferred financing costs 283 Net interest expense adjustment $ (9,389 ) For computing interest expense on $150,000 borrowings under our amended and restated Term Loan, we assumed an interest rate of 5.67%. On a pro forma basis as of April 2, 2005 after giving effect to the Pre-Offering Transactions, including the Refinancing Transaction, and this offering, our total outstanding debt would have been $177,130. If our weighted average interest rate increases by 0.125%, our interest expense will increase by $221, lowering net income by $139 at an assumed tax rate of 37.3%.
SELECTED CONSOLIDATED HISTORICAL FINANCIAL DATA
The following table sets forth our selected consolidated historical financial and other data as of the dates and for the periods indicated. The selected financial data as of and for the years ended March 30, 2002, March 29, 2003, April 3, 2004 and April 2, 2005 have been derived from our historical consolidated financial statements audited by Ernst & Young LLP, independent auditors.registered public accounting firm. The selected financial data as of and for the fiscal year ended March 31, 2001 have been derived from our historical consolidated financial statements. The selected financial data for the nine month periods ended January 1, 2005 and December 31, 2005 have been derived from our unaudited consolidated financial statements included elsewhere in this prospectus, which in our opinion contain all adjustments necessary for a fair presentation of the consolidated financial data. Results for interim periods are not necessarily indicative of results that may be expected for a full fiscal year. Historical results are not necessarily indicative of the results expected in the future. You should read the data presented below together with, and qualified by reference to, "Management's Discussion and Analysis of Financial Condition and Results of Operations" and our consolidated financial statements included elsewhere in this prospectus.
| | Fiscal Year Ended | ||||||||||||||||||
|---|---|---|---|---|---|---|---|---|---|---|---|---|---|---|---|---|---|---|---|
| | March 31, 2001 | March 30, 2002 | March 29, 2003 | April 3, 2004 | April 2, 2005 | ||||||||||||||
| | | | | | (Restated)(4) | ||||||||||||||
| | (in thousands, except share and per share amounts) | ||||||||||||||||||
| Statement of Operations Data: | |||||||||||||||||||
| Net sales(1) | $ | 176,435 | $ | 168,331 | $ | 172,860 | $ | 187,331 | $243,016 | ||||||||||
| Cost of sales | 116,245 | 114,575 | 124,086 | 135,433 | 174,602 | ||||||||||||||
| Gross margin | 60,190 | 53,756 | 48,774 | 51,898 | 68,414 | ||||||||||||||
| Selling, general and administrative | 27,043 | 25,641 | 26,647 | 28,107 | 32,749 | ||||||||||||||
| Other, net | 776 | 937 | 1,424 | 1,662 | 3,526 | ||||||||||||||
| Operating income | 32,371 | 27,178 | 20,703 | 22,129 | 32,139 | ||||||||||||||
Interest expense, net | 23,335 | 23,440 | 21,023 | 20,380 | 19,669 | ||||||||||||||
| Financing costs | 3,600 | — | — | — | — | ||||||||||||||
| Loss (gain) on early extinguishment of debt(2) | — | — | (780 | ) | — | 6,950 | |||||||||||||
| Other non-operating expense (income) | 16 | 17 | 298 | 16 | (355 | ) | |||||||||||||
| Income before income taxes | 5,420 | 3,721 | 162 | 1,733 | 5,875 | ||||||||||||||
Provision for (benefit from) income taxes | 2,326 | 2,052 | 113 | 1,070 | (1,385 | ) | |||||||||||||
| Income before extraordinary gain | 3,094 | 1,669 | 49 | 663 | 7,260 | ||||||||||||||
| Extraordinary gain, net | 521 | — | — | — | — | ||||||||||||||
| Net income | 3,615 | 1,669 | 49 | 663 | 7,260 | ||||||||||||||
| Preferred stock dividends | — | — | (1,313 | ) | (2,144 | ) | (2,280 | ) | |||||||||||
| Participation rights of preferred stock in undistributed earnings | — | — | — | — | (1,142 | ) | |||||||||||||
| Net income (loss) available to common stockholders | $ | 3,615 | $ | 1,669 | $ | (1,264 | ) | $ | (1,481 | ) | $ | 3,838 | |||||||
| Net income (loss) per common share: | |||||||||||||||||||
| Basic: | |||||||||||||||||||
| Class A common stock | $ | 1.04 | $ | 0.27 | $ | (0.20 | ) | $ | (0.24 | ) | $ | 0.62 | |||||||
| Class B common stock | $ | 1.04 | $ | 0.27 | $ | (0.20 | ) | $ | (0.24 | ) | $ | 0.62 | |||||||
| Diluted: | |||||||||||||||||||
| Class A common stock | $ | 0.48 | $ | 0.22 | $ | (0.20 | ) | $ | (0.24 | ) | $ | 0.40 | |||||||
| Class B common stock | $ | 0.25 | $ | 0.00 | $ | (0.20 | ) | $ | (0.24 | ) | $ | 0.00 | |||||||
| Weighted average number of common and common equivalent shares outstanding: | |||||||||||||||||||
| Basic: | |||||||||||||||||||
| Class A common stock | 2,788,107 | 6,188,653 | 6,188,653 | 6,188,653 | 6,202,365 | ||||||||||||||
| Class B common stock | 674,573 | 250 | 250 | 250 | 250 | ||||||||||||||
| Diluted: | |||||||||||||||||||
| Class A common stock | 6,045,762 | 7,607,418 | 6,188,653 | 6,188,653 | 9,552,579 | ||||||||||||||
| Class B common stock | 2,775,001 | 1,284,227 | 250 | 250 | 1,302,005 | ||||||||||||||
Pro Forma Data:(3) | |||||||||||||||||||
| Pro forma net income | $ | 10,765 | |||||||||||||||||
| Pro forma net income per common share: | |||||||||||||||||||
| Basic | $ | 0.70 | |||||||||||||||||
| Diluted | $ | 0.62 | |||||||||||||||||
| | Fiscal Year Ended | Nine Months Ended | |||||||||||||||
|---|---|---|---|---|---|---|---|---|---|---|---|---|---|---|---|---|---|
| | March 31, 2001 | March 30, 2002 | March 29, 2003 | April 3, 2004 | April 2, 2005 | January 1, 2005 | December 31, 2005(6) | ||||||||||
| | (in thousands, except share and per share amounts) | ||||||||||||||||
| Statement of Operations Data: | |||||||||||||||||
| Net sales(1) | $176,435 | $168,331 | $172,860 | $187,331 | $243,016 | $170,731 | $198,758 | ||||||||||
| Cost of sales | 116,245 | 114,575 | 124,086 | 135,433 | 174,602 | 123,325 | 139,134 | ||||||||||
| Gross margin | 60,190 | 53,756 | 48,774 | 51,898 | 68,414 | 47,406 | 59,624 | ||||||||||
| Selling, general and administrative(2) | 27,043 | 25,641 | 26,647 | 28,107 | 32,749 | 23,261 | 32,325 | ||||||||||
| Other, net | 776 | 937 | 1,424 | 1,662 | 3,526 | 2,464 | 1,020 | ||||||||||
| Operating income | 32,371 | 27,178 | 20,703 | 22,129 | 32,139 | 21,681 | 26,279 | ||||||||||
| Interest expense, net | 23,335 | 23,440 | 21,023 | 20,380 | 19,669 | 14,335 | 12,582 | ||||||||||
| Financing costs | 3,600 | — | — | — | — | — | — | ||||||||||
| Loss (gain) on early extinguishment of debt(3) | — | — | (780 | ) | — | 6,950 | 6,956 | 3,771 | |||||||||
| Other non-operating expense (income) | 16 | 17 | 298 | 16 | (355 | ) | (98 | ) | — | ||||||||
| Income before income taxes | 5,420 | 3,721 | 162 | 1,733 | 5,875 | 488 | 9,926 | ||||||||||
Provision for (benefit from) income taxes | 2,326 | 2,052 | 113 | 1,070 | (1,385 | ) | 180 | 3,442 | |||||||||
| Income before extraordinary gain | 3,094 | 1,669 | 49 | 663 | 7,260 | 308 | 6,484 | ||||||||||
| Extraordinary gain, net | 521 | — | — | — | — | — | — | ||||||||||
| Net income | 3,615 | 1,669 | 49 | 663 | 7,260 | 308 | 6,484 | ||||||||||
| Preferred stock dividends | — | — | (1,313 | ) | (2,144 | ) | (2,280 | ) | (1,693 | ) | (893 | ) | |||||
| Participation rights of preferred stock in undistributed earnings | — | — | — | — | (1,142 | ) | (687 | ) | (630 | ) | |||||||
| Net income (loss) available to common stockholders | $ 3,615 | $ 1,669 | $ (1,264 | ) | $ (1,481 | ) | $ 3,838 | $ (2,072 | ) | $ 4,961 | |||||||
| Net income (loss) per common share:(4) | |||||||||||||||||
| Basic | $ 1.04 | $ 0.27 | $ (0.20 | ) | $ (0.24 | ) | $ 0.62 | $ (0.33 | ) | $ 0.43 | |||||||
| Diluted | $ 0.41 | $ 0.19 | $ (0.20 | ) | $ (0.24 | ) | $ 0.35 | $ (0.33 | ) | $ 0.37 | |||||||
Weighted average common shares:(4) | |||||||||||||||||
| Basic | 3,462,680 | 6,188,903 | 6,188,903 | 6,188,903 | 6,202,615 | 6,188,903 | 11,649,073 | ||||||||||
| Diluted | 8,820,763 | 8,891,645 | 6,188,903 | 6,188,903 | 10,854,584 | 6,188,903 | 13,307,181 | ||||||||||
Other Financial Data: | |||||||||||||||||
| EBITDA(5) | $ 37,917 | $ 36,266 | $ 29,224 | $ 31,295 | $ 41,279 | $ 29,123 | $ 33,417 | ||||||||||
| Capital expenditures | 6,619 | 5,941 | 6,522 | 4,951 | 9,526 | $ 6,604 | 7,772 | ||||||||||
| | Fiscal Year Ended | |||||||||||||||
|---|---|---|---|---|---|---|---|---|---|---|---|---|---|---|---|---|
| | March 31, 2001 | March 30, 2002 | March 29, 2003 | April 3, 2004 | April 2, 2005 | |||||||||||
| | (in thousands) | |||||||||||||||
| Other Financial Data: | ||||||||||||||||
| EBITDA(5) | $ | 37,917 | $ | 36,266 | $ | 29,224 | $ | 31,295 | $ | 41,279 | ||||||
| Capital expenditures | 6,619 | 5,941 | 6,522 | 4,951 | 9,526 | |||||||||||
| | As of | | | ||||||||||||||||
|---|---|---|---|---|---|---|---|---|---|---|---|---|---|---|---|---|---|---|---|
| | As of April 2, 2005 | ||||||||||||||||||
| | March 31, 2001 | March 30, 2002 | March 29, 2003 | April 3, 2004 | |||||||||||||||
| | Actual | Pro Forma(3) | |||||||||||||||||
| | (in thousands) | ||||||||||||||||||
| Balance Sheet Data: | |||||||||||||||||||
| Cash | $ | 4,071 | $ | 7,185 | $ | 3,553 | $ | 3,250 | $ | 2,635 | $ | 6,802 | |||||||
| Working capital | 56,980 | 70,957 | 89,411 | 105,550 | 120,656 | 130,325 | |||||||||||||
| Total assets | 209,372 | 219,376 | 232,356 | 234,746 | 250,169 | 261,481 | |||||||||||||
| Total debt | 218,249 | 226,713 | 210,933 | 215,224 | 220,079 | 177,130 | |||||||||||||
| Total stockholders' equity (deficit) | (38,134 | ) | (37,567 | ) | (17,649 | ) | (16,285 | ) | (7,759 | ) | 46,502 | ||||||||
| | As of | As of December 31, 2005(6) | ||||||||||||||||||||
|---|---|---|---|---|---|---|---|---|---|---|---|---|---|---|---|---|---|---|---|---|---|---|
| | March 31, 2001 | March 30, 2002 | March 29, 2003 | April 3, 2004 | April 2, 2005 | |||||||||||||||||
| | Actual | As Adjusted | ||||||||||||||||||||
| | (in thousands) | |||||||||||||||||||||
| Balance Sheet Data: | ||||||||||||||||||||||
| Cash | $ | 4,071 | $ | 7,185 | $ | 3,553 | $ | 3,250 | $ | 2,635 | $ | 10,312 | $ | 10,312 | ||||||||
| Working capital | 56,980 | 70,957 | 89,411 | 105,550 | 120,656 | 148,386 | 148,386 | |||||||||||||||
| Total assets | 209,372 | 219,376 | 232,356 | 234,746 | 250,169 | 271,424 | 271,424 | |||||||||||||||
| Total debt | 218,249 | 226,713 | 210,933 | 215,224 | 220,079 | 169,030 | 148,868 | |||||||||||||||
| Total stockholders' equity (deficit) | (38,134 | ) | (37,567 | ) | (17,649 | ) | (16,285 | ) | (7,759 | ) | 61,972 | 82,134 | ||||||||||
therefore its exclusion from EBITDA is a material limitation. We also have a significant amount of debt and interest expense is a necessary element of our costs and ability to generate revenue and therefore its exclusion from EBITDA is a material limitation. We generally incur significant U.S. federal, state and foreign income taxes each year and the provision for (benefit from) income taxes is a necessary element of the our costs and therefore its exclusion from EBITDA is a material limitation. As a result, EBITDA should be evaluated in conjunction with net income (loss) for a more complete analysis of our profitability, as net income (loss) includes the financial statement impact of these items and is the most directly comparable GAAP operating performance measure to EBITDA. As EBITDA is not defined by GAAP, our definition of EBITDA may differ from and therefore may not be comparable to similarly titled measures used by other companies, thereby limiting its usefulness as a comparative measure. Because of the limitations that EBITDA has as an analytical tool, investors should not consider it in isolation or as a substitute for analysis of our operating results as reported under GAAP.
EBITDA as an additional operating performance measure to assess our, our subsidiaries' and potential acquisition target enterprise value and to assist in the overall evaluation of our, our subsidiaries' and potential acquisition target performance on an internal basis and relative to peer group companies. We use EBITDA in conjunction with traditional GAAP operating performance measures as part of our overall assessment of potential valuation and relative performance and therefore do not place undue reliance on EBITDA as our only measure of operating performance. We believe EBITDA is useful for our management and investors as it is a commonly used analytical measurement for comparing company profitability, which eliminates the effects of financing, differing valuations of fixed and intangible assets and tax structure decisions. We believe that EBITDA is specifically relevant to us, due to the different degrees of leverage among our competitors. We have included EBITDA as a supplemental operating performance measure, which should be evaluated by investors in conjunction with the traditional GAAP performance measures for a complete evaluation of our operating performance. The following table provides a reconciliation of net income, the most directly comparable GAAP measure, to EBITDA.
| | Fiscal Year Ended | ||||||||||||||||
|---|---|---|---|---|---|---|---|---|---|---|---|---|---|---|---|---|---|
| | March 31, 2001 | March 30, 2002 | March 29, 2003 | April 3, 2004 | April 2, 2005 | ||||||||||||
| | (in thousands) | ||||||||||||||||
| Net income | $ | 3,615 | $ | 1,669 | $ | 49 | $ | 663 | $ | 7,260 | |||||||
| Add: | |||||||||||||||||
| Provision for (benefit from) income taxes | 2,326 | 2,052 | 113 | 1,070 | (1,385 | ) | |||||||||||
| Interest expense, net | 23,335 | 23,440 | 21,023 | 20,380 | 19,669 | ||||||||||||
| Loss (gain) on early extinguishment of debt | — | — | (780 | ) | — | 6,950 | |||||||||||
| Depreciation and amortization | 8,641 | 9,105 | 8,819 | 9,182 | 8,785 | ||||||||||||
| EBITDA | $ | 37,917 | $ | 36,266 | $ | 29,224 | $ | 31,295 | $ | 41,279 | |||||||
| | Fiscal Year Ended | Nine Months Ended | ||||||||||||||||||||
|---|---|---|---|---|---|---|---|---|---|---|---|---|---|---|---|---|---|---|---|---|---|---|
| | March 31, 2001 | March 30, 2002 | March 29, 2003 | April 3, 2004 | April 2, 2005 | January 1, 2005 | December 31, 2005 | |||||||||||||||
| | (in thousands) | |||||||||||||||||||||
| Net income | $ | 3,615 | $ | 1,669 | $ | 49 | $ | 663 | $ | 7,260 | $ | 308 | $ | 6,484 | ||||||||
| Add: | ||||||||||||||||||||||
| Provision for (benefit from) income taxes | 2,326 | 2,052 | 113 | 1,070 | (1,385 | ) | 180 | 3,442 | ||||||||||||||
| Interest expense, net | 23,335 | 23,440 | 21,023 | 20,380 | 19,669 | 14,335 | 12,582 | |||||||||||||||
| Loss (gain) on early extinguishment of debt | — | — | (780 | ) | — | 6,950 | 6,956 | 3,771 | ||||||||||||||
| Depreciation and amortization | 8,641 | 9,105 | 8,819 | 9,182 | 8,785 | 7,344 | 7,138 | |||||||||||||||
| EBITDA | $ | 37,917 | $ | 36,266 | $ | 29,224 | $ | 31,295 | $ | 41,279 | $ | 29,123 | $ | 33,417 | ||||||||
MANAGEMENT'S DISCUSSION AND ANALYSIS OF
FINANCIAL CONDITION
AND RESULTS OF OPERATIONS
The following discussion should be read in conjunction with the "Selected Consolidated Historical Financial Data," "Description of Certain Indebtedness" and our consolidated financial statements and the related notes included elsewhere in this prospectus. This prospectus contains, in addition to historical information, forward-looking statements that include risks, uncertainties and assumptions. See "Disclosure Regarding Forward-Looking Statements" for information about our presentation of forward-looking information in this prospectus. Factors that could cause such differences include those described under "Risk Factors."
Overview
We are a well known international manufacturer of highly engineered precision plain, roller and ball bearings. Our precision solutions are integral to the manufacture and operation of most machines and mechanical systems, reduce wear to moving parts, facilitate proper power transmission and reduce damage and energy loss caused by friction. While we manufacture products in all major bearing categories, we focus primarily on the higher end of the bearing market where we believe our value added manufacturing and engineering capabilities enable us to differentiate ourselves from our competitors and enhance profitability. We estimate that approximately two-thirds of our net sales during fiscal 2005 and during the nine month period ended December 31, 2005 were generated by products for which we hold the number one or two market position. We have been providing bearing solutions to our customers since 1919. Over the past ten years, under the leadership of our current management team, we have significantly broadened our end markets, products, customer base and geographic reach. We currently operate 16 manufacturing facilities in three countries.
Demand for bearings generally follows the market for products in which bearings are incorporated and the economy as a whole. Purchasers of bearings include industrial equipment and machinery manufacturers, producers of commercial and military aerospace equipment such as missiles and radar systems, agricultural machinery manufacturers, construction and specialized equipment manufacturers and automotive and commercial truck manufacturers. The markets for our products are cyclical, and general market conditions could negatively impact our operating results. We have endeavored to mitigate the cyclicality of our product markets by entering into sole-source relationships and long-term purchase orders, through diversification across multiple market segments within the aerospace and defense and diversified industrial segments, by increasing sales to the aftermarket and by focusing on developing highly customized solutions.
During fiscal 2005 and through the first nine months of fiscal 2006, the world economy continued to emerge from the slowdown experienced from 2000 to 2003, and we experienced favorable conditions across our threetwo major markets: diversified industrial and aerospace and defense. In particular the economy of our diversified industrial market has been driven by strong requirements in non-residential construction, mining and the oil and gas sectors. These conditions have resulted in robust demand for bearings for both OEM and replacement markets. In the aerospace market a very strong recovery began, and we believe it is at its early stages.to mid-stages. Expansion of the commercial aircraft sector, in response to increased passenger demand and the need of the carriers to upgrade the worldwide fleet, drove increased build schedules at Boeing and Airbus. In addition, demand for corporate aircraft remained strong.strong in fiscal 2005 and through the first nine months of fiscal 2006. The defense sector continued to replace and develop its weapons and cargo platforms. This sector demonstrated increased requirements for replacement bearings for combat systems strained by extensive use in harsh environments over the past 31/24 years. For fiscal yearthe nine month period ended December 31, 2005, approximately one-fifth21% of our revenues were derived from sales directly or indirectly outside the U.S. We expect this component of our business to increase in response to our emphasis on continued penetration of foreign markets, particularly those in aerospace and defense. These factors have resulted in favorable customer order volume resulting in total order bookings for fiscal 2005 of $281.8 million, an increase of $91.3 million, or 47.9%, compared to $190.5 million for the
comparable period last year. Excluding our RBC-API unit acquired from The Timken Company in December 2003, total order bookings for fiscal 2005, were $256.2 million, an increase of $68.0 million, or 36.1%, compared to $188.2 million for fiscal 2004.
Approximately 30% of our costs are attributable to raw materials, a majority of which are related to steel and related products. During the past 24 months,two years, steel prices have increased to historically high levels, responding to unprecedented levels of world demand. To date, we have generally been able to pass through these costs to our customers through price increases and the assessment of surcharges, although there can be a time lag of up to 12 weeks.weeks or more.
Competition in specialized bearing markets is based on engineering design, brand, lead times and reliability of product and service. These markets are generally not as price sensitive as the markets for standard bearings.
We have demonstrated expertise in acquiring and integrating bearing and precision-engineered component manufacturers that have complementary products or distribution channels and provide significant potential for margin enhancement. We have consistently increased the profitability of acquired businesses through a process of methods and systems improvement coupled with the introduction of complementary and proprietary new products. Since October 1992 we have completed 1213 acquisitions which have significantly broadened our end markets, products, customer base and geographic reach.
Sources of Revenue
Revenue is generated primarily from sales of bearings to the diversified industrial market and the aerospace market and the defense market.markets. Sales are often made pursuant to sole-source relationships, long-term agreements and purchase orders with our clients. We recognize revenues principally from the sale of products at the point of passage of title, which is at the time of shipment. In certain instances, however, we recognize revenues under the contract method of accounting.
Sales to the diversified industrial market accounted for 64%55% of our net sales for fiscalthe nine month period ended December 31, 2005. Sales to the aerospace and defense markets accounted for 36%45% of our net sales for the same period. We anticipate that sales to the aerospace and defense markets will increase as a percentage of our net sales.
Aftermarket sales of replacement parts for existing equipment platforms represented approximately 56% of our net sales for fiscal 2005. We continue to develop our OEM relationships which have established us as a leading supplier on many important aerospace and defense platforms. Over the past several years, we have experienced increased demand from the replacement parts market, particularly within the aerospace and defense sectors; one of our business strategies has been to increase the proportion of sales derived from this segment. We believe these activities increase the stability of our revenue base, strengthen our brand identity and provide multiple paths for revenue growth.
Approximately one-fifth21% of our net sales were derived from sales directly or indirectly outside the U.S. for fiscal 2005 and for the first nine months of fiscal 2006, an increase from 19% infrom fiscal 2004. We expect that this proportion will increase as we seek to increase our penetration of foreign markets, particularly within the aerospace and defense sectors. In fiscal 2005 and for the nine month period ended December 31, 2005, our top ten customers, sixfour of which were OEMs and the remaining foursix were distributors, generated 32% and 34% of our net sales.sales, respectively. Out of the 32%34% of net sales generated by our top ten customers during fiscalthe nine month period ended December 31, 2005, 19%22% of net sales was generated by our top four customers. No single customer was responsible for generating more than 5%6% of our net sales for the same period.
Cost of Revenues
Cost of sales includes employee compensation and benefits, materials, outside processing, depreciation of manufacturing machinery and equipment, supplies and manufacturing overhead.
During fiscal 2005 and during the first nine months of fiscal 2006, our gross margin was impacted by rising raw material prices, in particular, steel and related products. In response, we have, to date, managed to pass on the majority of these price increases of raw materials to our customers through steel surcharges assessed on, or price increases of, our bearing products. However, we have from time to time experienced a time lag of up to 12 weeks or more in our ability to pass through steel surcharges to our customers, which has negatively impacted our gross margin. We will continue to pass on raw material price increases as competitive conditions allow.
We have not been significantly impacted by recent increases in energy prices because energy costs, the most significant component of which is natural gas used in heat treating operations, represent less than 4% of our overall costs.
We monitor gross margin performance through a process of monthly operation management reviews. We will develop new products to target certain markets allied to our strategies by first understanding volume levels and product pricing and then constructing manufacturing strategies to achieve defined margin objectives. We only pursue product lines where we believe that the developed manufacturing process will yield the targeted margins. Management monitors gross margins of all product lines on a monthly basis to determine which manufacturing processes or prices should be adjusted.
Selling, General and Administrative Expenses
Selling, general and administrative, or SG&A, expenses relate primarily to the compensation and associated costs of selling, general and administrative personnel, professional fees, insurance, facility costs and information technology. We expect SG&A expenses will increase in absolute terms as we increase our sales efforts and incur increased costs related to the anticipated growth of our business and the additional costs associated with operating as a public company.
Results of Operations
The following table sets forth the various components of our consolidated statements of operations, expressed as a percentage of net sales, for the periods indicated that are used in connection with the discussion herein.herein:
| | Fiscal Year Ended | Fiscal Year Ended | Nine Months Ended | |||||||||||||||
|---|---|---|---|---|---|---|---|---|---|---|---|---|---|---|---|---|---|---|
| | March 29, 2003 | April 3, 2004 | April 2, 2005 | March 29, 2003 | April 3, 2004 | April 2, 2005 | January 1, 2005 | December 31, 2005 | ||||||||||
| Statement of Operations Data: | ||||||||||||||||||
| Net sales | 100.0 | % | 100.0 | % | 100.0 | % | 100.0 | % | 100.0 | % | 100.0 | % | 100.0 | % | 100.0 | % | ||
| Gross margin | 28.2 | 27.7 | 28.2 | 28.2 | 27.7 | 28.2 | 27.8 | 30.0 | ||||||||||
| Selling, general and administrative | 15.4 | 15.0 | 13.5 | 15.4 | 15.0 | 13.5 | 13.6 | 16.3 | ||||||||||
| Other, net | 0.8 | 0.9 | 1.5 | 0.8 | 0.9 | 1.5 | 1.5 | 0.5 | ||||||||||
| Operating income | 12.0 | 11.8 | 13.2 | 12.0 | 11.8 | 13.2 | 12.7 | 13.2 | ||||||||||
Interest expense, net | 12.2 | 10.9 | 8.1 | 12.2 | 10.9 | 8.1 | 8.4 | 6.3 | ||||||||||
| Loss (gain) on early extinguishment of debt | (0.5 | ) | — | 2.9 | (0.5 | ) | — | 2.9 | 4.1 | 1.9 | ||||||||
| Other non-operating expense (income) | 0.2 | 0.0 | (0.2 | ) | 0.2 | 0.0 | (0.2 | ) | (0.1 | ) | — | |||||||
| Income before income taxes | 0.1 | 0.9 | 2.4 | 0.1 | 0.9 | 2.4 | 0.3 | 5.0 | ||||||||||
| Provision for (benefit from) income taxes | 0.1 | 0.6 | (0.6 | ) | 0.1 | 0.6 | (0.6 | ) | 0.1 | 1.7 | ||||||||
| Net income | 0.0 | 0.3 | 3.0 | 0.0 | 0.3 | 3.0 | 0.2 | 3.3 | ||||||||||
Segment Information
We have four reportable product segments: Plain Bearings, Roller Bearings, Ball Bearings and Other. Other consists primarily of precision ball screws and machine tool collets. The following table shows our net sales and operating income with respect to each of our reporting segments plus Corporate for the last three fiscal years:years and for the nine months ended January 1, 2005 and December 31, 2005:
| | | Fiscal Year Ended | | Fiscal Year Ended | Nine Months Ended | |||||||||||||||||||||||
|---|---|---|---|---|---|---|---|---|---|---|---|---|---|---|---|---|---|---|---|---|---|---|---|---|---|---|---|---|
| | | March 29, 2003 | April 3, 2004 | April 2, 2005 | | March 29, 2003 | April 3, 2004 | April 2, 2005 | January 1, 2005 | December 31, 2005 | ||||||||||||||||||
| | | (in thousands) | | (in thousands) | ||||||||||||||||||||||||
| Net External Sales | Net External Sales | Net External Sales | ||||||||||||||||||||||||||
| Plain | $ | 67,448 | $ | 77,578 | $ | 93,250 | Plain | $ | 67,448 | $ | 77,578 | $ | 93,250 | $ | 66,650 | $ | 82,078 | |||||||||||
| Roller | 60,788 | 63,106 | 92,281 | Roller | 60,788 | 63,106 | 92,281 | 64,643 | 71,193 | |||||||||||||||||||
| Ball | 34,038 | 35,801 | 41,881 | Ball | 34,038 | 35,801 | 41,881 | 28,357 | 33,239 | |||||||||||||||||||
| Other | 10,586 | 10,846 | 15,604 | Other | 10,586 | 10,846 | 15,604 | 11,081 | 12,248 | |||||||||||||||||||
| Total | $ | 172,860 | $ | 187,331 | $ | 243,016 | Total | $ | 172,860 | $ | 187,331 | $ | 243,016 | $ | 170,731 | $ | 198,758 | |||||||||||
| Operating Income | Operating Income | Operating Income | ||||||||||||||||||||||||||
| Plain | $ | 16,782 | $ | 18,573 | $ | 22,647 | Plain | $ | 16,782 | $ | 18,573 | $ | 22,647 | $ | 16,278 | $ | 21,441 | |||||||||||
| Roller | 8,459 | 11,259 | 17,030 | Roller | 8,459 | 11,259 | 17,030 | 10,550 | 16,660 | |||||||||||||||||||
| Ball | 7,009 | 6,676 | 9,070 | Ball | 7,009 | 6,676 | 9,070 | 5,619 | 7,747 | |||||||||||||||||||
| Other | 1,779 | 378 | 797 | Other | 1,779 | 378 | 797 | 860 | 1,232 | |||||||||||||||||||
| Corporate | (13,326 | ) | (14,757 | ) | (17,405 | ) | Corporate | (13,326 | ) | (14,757 | ) | (17,405 | ) | (11,626 | ) | (20,801 | ) | |||||||||||
| Total | $ | 20,703 | $ | 22,129 | $ | 32,139 | Total | $ | 20,703 | $ | 22,129 | $ | 32,139 | $ | 21,681 | $ | 26,279 | |||||||||||
Geographic Information
The following table summarizes our net sales, by destination, for the periods shown:
| | Fiscal Year Ended | |||||||||
|---|---|---|---|---|---|---|---|---|---|---|
| | March 29, 2003 | April 3, 2004 | April 2, 2005 | |||||||
| | (in thousands) | |||||||||
| Geographic Revenues | ||||||||||
| Domestic | $ | 155,579 | $ | 166,763 | $ | 215,381 | ||||
| Foreign | 17,281 | 20,568 | 27,635 | |||||||
| Total | $ | 172,860 | $ | 187,331 | $ | 243,016 | ||||
| | Fiscal Year Ended | Nine Months Ended | ||||||||||||||
|---|---|---|---|---|---|---|---|---|---|---|---|---|---|---|---|---|
| | March 29, 2003 | April 3, 2004 | April 2, 2005 | January 1, 2005 | December 31, 2005 | |||||||||||
| | (in thousands) | |||||||||||||||
| Geographic Revenues | ||||||||||||||||
| Domestic | $ | 155,579 | $ | 166,763 | $ | 215,381 | $ | 151,158 | $ | 177,003 | ||||||
| Foreign | 17,281 | 20,568 | 27,635 | 19,573 | 21,755 | |||||||||||
| Total | $ | 172,860 | $ | 187,331 | $ | 243,016 | $ | 170,731 | $ | 198,758 | ||||||
For additional information concerning our business segments, see note 10 to our interim unaudited financial statements for the quarterly period ended December 31, 2005 and Note 20 to our Consolidated Financial Statements.Statements for the fiscal year ended April 2, 2005.
Nine Month Period Ended December 31, 2005 Compared to Nine Month Period Ended January 1, 2005
Net Sales. Net sales for the nine month period ended December 31, 2005 were $198.8 million, an increase of $28.1 million, or 16.5%, compared to $170.7 million for the comparable period in fiscal 2005. During the nine month period ended December 31, 2005, we experienced net sales growth in each of our four segments, driven by strong demand across end markets as well as continued efforts to supply new products to existing and new customers. Overall, net sales to diversified industrial customers grew 8.1% in the nine month period of fiscal 2006 compared to the same period last year. This was principally driven by aftermarket and OEM demand in construction, mining, semiconductor and general
industrial applications. Net sales to aerospace and defense customers grew 28.8% in the nine month period of fiscal 2006 compared to the same period last year, driven mainly by commercial and military aerospace aftermarket and OEM demand.
Our Plain Bearing segment achieved net sales of $82.1 million for the nine month period ended December 31, 2005, an increase of $15.4 million, or 23.1%, compared to $66.7 million for the comparable period in the prior year. Net sales to diversified industrial customers accounted for $6.3 million of the increase, driven primarily by strong demand in the construction and mining heavy equipment sectors, general industrial applications and strong aftermarket demand. The commercial and military aerospace market accounted for $9.1 million of the increase due to an increase in airframe and aerospace bearing shipments to aircraft manufacturers and continued demand for aftermarket product.
Our Roller Bearing segment achieved net sales of $71.2 million for the nine month period ended December 31, 2005, an increase of $6.6 million, or 10.2%, compared to $64.6 million for the comparable period in the prior year. $1.9 million of this increase was attributable to sales to customers in the industrial market and from strong demand from mining, construction equipment and general industrial applications. The aerospace and defense market accounted for the remaining $4.7 million of the increase, driven primarily by increasing build rates and maintenance requirements for commercial and military aircraft.
Our Ball Bearing segment achieved net sales of $33.2 million for the nine month period ended December 31, 2005, an increase of $4.8 million, or 16.9%, compared to $28.4 million for the comparable period in the prior year. The increase was driven principally by increased demand from airframe, electro-optical, and satellite and communications applications and increased penetration of the airframe market. Sales to our customers in the industrial market were flat year over year.
Our Other segment, which is focused mainly on the sale of precision ball screws and machine tool collets, achieved net sales of $12.2 million for the nine month period ended December 31, 2005, an increase of $1.1 million, or 9.9%, compared to $11.1 million for the same period last year. This increase was primarily due to increased sales of machine tool collets as a result of increased penetration of the U.S. machine tool collets market and due to increasing overall market demand, both in Europe and the U.S.
Gross Margin. Gross margin was $59.6 million, or 30.0% of net sales, for the nine month period ended December 31, 2005, versus $47.4 million, or 27.8% of net sales, for the comparable period in fiscal 2005. The increase in our gross margin as a percentage of net sales was primarily the result of an overall increase in volume, slightly higher prices and increased manufacturing efficiency.
Selling, General and Administrative. SG&A expenses increased by $9.0 million, or 38.6%, to $32.3 million for the nine month period ended December 31, 2005 compared to $23.3 million for the same period in fiscal 2005. The $9.0 million increase was primarily due to non-recurring compensation expense of $5.2 million, stock option compensation expense of $0.2 million, professional service fees associated with the implementation of Sarbanes-Oxley 404 of $0.3 million, an increase in personnel necessary to support increased volume, higher professional service fees and additional costs associated with being a public company. As a percentage of net sales, SG&A was 16.2% for the nine month period ended December 31, 2005 compared to 13.6% for the comparable period in fiscal 2005. SG&A, excluding non-recurring compensation expense of $5.2 million and stock option compensation expense of $0.2 million, was 13.5% of net sales for the nine month period ended December 31, 2005 compared to 13.4% for the comparable period in fiscal 2005.
Other, net. Other, net for the nine month period ended December 31, 2005 was $1.0 million compared to $2.5 million for the comparable period in fiscal 2005. For the nine month period ended December 31, 2005, other, net included amortization of intangibles of $0.5 million, $0.2 million of non-recurring management fees and $0.3 million of bad debt expense. For the nine month period
ended January 1, 2005, other, net consisted of amortization of intangibles of $0.3 million, $0.3 million of management fees, losses on fixed asset disposals of $1.8 million and $0.1 million of other expenses.
Operating Income. Operating income was $26.3 million, or 13.2% of net sales, for the nine month period ended December 31, 2005 compared to $21.7 million, or 12.7% of net sales, for the nine month period ended January 1, 2005. Operating income excluding stock option expense of $0.2 million, non-recurring compensation expense of $5.2 million, and non-recurring management fees of $0.2 million was $31.9 million or 16.0% of net sales. Operating income for the Plain Bearing segment was $21.4 million for the nine month period ended December 31, 2005, or 26.1% of net sales, compared to $16.3 million for the same period last year, or 24.4% of net sales. The Roller Bearing segment achieved an operating income for the nine month period ended December 31, 2005 of $16.7 million, or 23.5% of net sales, compared to $10.6 million, or 16.4% of net sales, for the nine month period ended January 1, 2005. The Ball Bearing segment achieved an operating income of $7.7 million, or 23.2% of net sales, for the nine month period ended December 31, 2005, compared to $5.6 million, or 19.7% of net sales, for the comparable period in fiscal 2005. The Other segment achieved an operating income of $1.2 million, or 9.8% of net sales, for the nine month period ended December 31, 2005, compared to $0.9 million or 8.1% of net sales, for the comparable period in fiscal 2005. The increase in operating income in each of the segments was driven primarily by an increase in net sales. In addition, operating income as a percentage of net sales increased for each of the segments primarily as a result of leveraging fixed cost base over higher net sales.
Interest Expense, net. Interest expense, net decreased by $1.7 million to $12.6 million for the nine month period ended December 31, 2005, compared to $14.3 million for the nine month period ended January 1, 2005. Amortization of deferred financing costs and debt discount are recorded as a component of net interest expense. Amortization expenses included in interest expense, net were $0.6 million for the nine month period ended December 31, 2005 compared to $0.9 million for the nine month period ended January 1, 2005.
Loss on Early Extinguishment of Debt. For the nine month period ended December 31, 2005, loss on early extinguishment of debt of $3.8 million included $1.6 million for non-cash write-off of deferred financing fees and unamortized bond discount associated with retired debt, $1.3 million of redemption premium associated with the redemption of all of our 13% discount debentures in September 2005, $0.5 million prepayment fees related to the prepayment of all of the outstanding balance under our second lien term loan in August 2005 and $0.4 million in interest expense for the 30-day call period related to the early extinguishment of our 13% discount debentures. For the nine month period ended January 1, 2005, loss on early extinguishment of debt of $7.0 million included $4.3 million for non-cash write-off of deferred financing fees associated with retired debt, $1.8 million of redemption premium and $0.9 million in interest expense for the 30-day call period related to the early extinguishment of our $110.0 million of 95/8% senior subordinated notes in July 2004.
Income Before Income Taxes. Income before taxes was $9.9 million for the nine month period ended December 31, 2005 compared to income before taxes of $0.5 million for the nine month period ended January 1, 2005.
Income Taxes. Income tax expense for the nine month period ended December 31, 2005 was $3.4 million compared to an expense of $0.2 million for the nine month period ended January 1, 2005. The effective income tax rate for the nine month period ended December 31, 2005 was 34.7% compared to an income tax rate of 36.9% for the nine month period ended January 1, 2005. The change in the effective income tax rates from period to period is mostly due to changes in the allocation between domestic and foreign earnings, primarily the result of the loss on early extinguishment of debt and the one-time compensation payment.
Net Income. Net income was $6.5 million for the nine month period ended December 31, 2005 compared to net income of $0.3 million for the nine month period ended January 1, 2005.
Fiscal 2005 Compared to Fiscal 2004
Net Sales. Our net sales for fiscal 2005 were $243.0 million, an increase of $55.7 million, or 29.7%, compared to $187.3 million for fiscal 2004. During fiscal 2005, we experienced net sales growth in each of our four segments, driven by strong demand across our end markets as well as our continued efforts to supply new products to existing and new customers. Overall, we experienced significant growth in net sales to our diversified industrial and aerospace customers, driven principally by increased build rates of industrial machinery and commercial and military aircraft, respectively. We believe these trends will continue for the near future and we believe opportunities exist for our expansion within each of these markets. In particular, we expect to benefit from the current acceleration in aerospace build rates and anticipate that net sales from the aerospace market will represent a larger percentage of our overall net sales going forward.
Our Plain Bearing segment achieved net sales of $93.3 million for fiscal 2005, an increase of $15.7 million, or 20.2%, compared to $77.6 million for the prior year. Net sales to our diversified industrial customers accounted for $9.0 million of the increase, driven primarily by strong demand in the construction and mining heavy equipment sectors, strong aftermarket demand for rail products, and several new product introductions we made during the year targeted at both existing and new customers. The commercial and military aerospace market accounted for $8.2 million of the increase due to an increase in airframe and aerospace engine bearing shipments resulting from better penetration of existing customers and a number of new contract wins as well as recovering build rates and maintenance requirements for commercial aircraft. Direct sales to the defense market decreased by $1.5 million due to exceptionally strong demand in the last six months of fiscal 2004 compared to the same period for fiscal 2005.
Our Roller Bearing segment achieved net sales of $92.3 million for fiscal 2005, an increase of $29.2 million, or 46.2%, compared to $63.1 million for the prior year. $13.2 million of the increase was attributable to the inclusion of a full year of results for the RBC-API business unit which was purchased in December 2003. Excluding RBC-API, net sales for the Roller Bearing segment were $73.0 million for fiscal 2005, an increase of $16.0 million, or 28.1%, compared to $57.0 million for fiscal 2004. $14.8 million of this increase was attributable to sales to our customers in the industrial market, where we have selectively increased our penetration of the class 8 truck market, and benefited from strong demand from mining, construction equipment and general industrial applications. The aerospace market accounted for the remaining $1.2 million of the increase, driven primarily by increasing build rates and maintenance requirements for military aircraft.
Our Ball Bearing segment achieved net sales of $41.9 million for fiscal 2005, an increase of $6.1 million, or 17.0%, compared to $35.8 million for the prior year. $3.4 million of the increase was attributable to sales to our customers in the industrial market, driven primarily by increased demand from semiconductor applications and by increased demand from industrial distributors for aftermarket parts. Commercial and military aerospace accounted for the remaining $2.7 million of the increase, driven principally by increased demand from airframe, electro-optical, and satellite and communications applications and our increased penetration of the airframe market.
Our Other segment, which is focused mainly on the sale of precision ball screws and machine tool collets, achieved net sales of $15.6 million, an increase of $4.8 million, or 43.9%, compared to $10.8 million for the same period last year. This increase was primarily due to increased sales of our machine tool collets as a result of our increased penetration of the U.S. machine tool collet market and due to increasing overall market demand.
Gross Margin. Our gross margin was $68.4 million, or 28.2% of net sales, for fiscal 2005, versus $51.9 million, or 27.7% of net sales, for fiscal 2004. The increase in our gross margin as a percentage of net sales was primarily the result of an overall increase in volume, slightly higher prices, and a shift in mix toward higher margin products, partially offset by increased raw material and labor costs which negatively impacted gross margin by 4.0%. We were able to grow our gross margin percentage through price increases and raw material surcharges to customers which offset the impact of raw material price increases of up to 40%.
�� Selling, General and Administrative. Our SG&A expenses increased by $4.6 million, or 16.5%, to $32.7 million for fiscal 2005 compared to $28.1 million for fiscal 2004. Excluding the RBC-API acquisition, SG&A increased by $4.1 million in fiscal 2005, or 14.7%, compared to fiscal 2004. The $4.1 million increase was primarily due to an increase in personnel necessary to support our increased volume, higher professional service fees and $0.4 million of compensation expense recorded for the intrinsic value of options issued during fiscal 2005. As a percentage of net sales, SG&A declined to 13.5% for fiscal 2005 compared to 15.0% for fiscal 2004. The decline was primarily due to continued control of fixed costs and controlled expansion of headcount. We expect our SG&A to remain relatively
constant as a percentage of net sales over the next few years, including the anticipated costs associated with operating as a public company.
Other, net. Other, net for fiscal 2005 was $3.5 million compared to $1.7 million for fiscal 2004. For fiscal 2005, other, net included an expense of $2.0 million for the disposal of manufacturing fixed assets, $0.5 million of Whitney management fees, $0.5 million of bad debt expense and $0.6 million of other expenses. For fiscal 2004, other, net consisted of $0.5 million of Whitney management fees, fixed asset disposals of $0.2 million, $0.4 million of acquisition costs and $0.5 million of other expenses.
Operating Income. Operating income was $32.1 million, or 13.2% of net sales, for fiscal 2005 compared to $22.1 million, or 11.8% of net sales for fiscal 2004. Operating income for the Plain Bearing segment was $22.6 million, or 24.3% of net sales, compared to the prior year's $18.6 million, or 23.9% of net sales. Our Roller Bearing segment achieved an operating income of $17.0 million, or 18.5% of net sales, compared to $11.3 million, or 17.8% of net sales, for the prior year, owing primarily to the full year inclusion of RBC-API. Our Ball Bearing segment achieved an operating income of $9.1 million, or 21.7% of net sales, for fiscal 2005, compared to $6.7 million, or 18.6% of net sales, for fiscal 2004. Our Other segment achieved an operating income of $0.8 million, or 5.1% of net sales, for fiscal 2005, compared to $0.4 million, or 3.5% of net sales, for fiscal 2004. The increase in operating income in each of our segments was driven primarily by an increase in net sales. In addition, our operating income as a percentage of net sales increased for each of our segments primarily as a result of leveraging our fixed cost base over higher net sales.
Interest Expense, net. Interest expense, net decreased by $0.7 million to $19.7 million for fiscal 2005 compared to $20.4 million for fiscal 2004. Amortization of deferred financing costs and debt discount are recorded as a component of net interest expense. Amortization expenses included in interest expense, net were $1.1 million for fiscal 2005 compared to $1.6 million for fiscal 2004.
Loss on Early Extinguishment of Debt. For fiscal 2005, loss on early extinguishment of debt of $7.0 million included $4.3 million for non-cash write-off of deferred financing fees associated with retired debt, $1.8 million of redemption premium and $0.9 million in interest expense for the 30 day30-day call period related to the early extinguishment of our $110.0 million of 95/8% senior subordinated notes in July of 2004.
Income Before Income Taxes. Income before taxes increased by $4.2 million, to $5.9 million in fiscal 2005 compared to $1.7 million in fiscal 2004 primarily as a result of higher gross margin, partially offset by higher operating expenses, disposal of manufacturing fixed assets, and loss on extinguishment of debt.
Income Taxes. Income tax for fiscal 2005 provided a benefit of $1.4 million compared to an expense of $1.1 million for fiscal 2004. Our effective income tax rate for fiscal 2005 was a benefit of 23.6% compared to an effective rate of 61.7% for fiscal 2004. In fiscal 2005, the income tax benefit was impacted predominantly by the reduction of income tax expense by $3.8 million for the undistributed earnings of our foreign subsidiaries on which income taxes were previously recorded. We have reassessed our needs internationally and have determined that our undistributed foreign earnings of approximately $18.0 million as of April 2, 2005 will be re-invested indefinitely as further described in Note 15 to our consolidated financial statements. Additionally, our effective tax rate for fiscal 2005 was impacted by a foreign tax rate differential of $0.4 million and adjustments of taxes to correspond to tax returns as filed of $0.8 million. Our effective tax rate for fiscal 2004 was impacted predominantly by the adjustments of taxes to correspond to tax returns as filed and other miscellaneous permanent differences. As of April 2, 2005, net operating loss carry forwards were approximately $5.5 million (federal) and $7.0 million (state) to offset future income taxes, which expire at various dates through 2024. Alternative minimum tax credit carry forwards totaled approximately $1.9 million as of April 2, 2005.
Net Income. Net income increased by $6.6 million to $7.3 million for fiscal 2005 compared to $0.7 million for fiscal 2004.
Fiscal 2004 Compared to Fiscal 2003
Net sales.Sales. Our net sales for fiscal 2004 were $187.3 million, an increase of $14.4 million, or 8.4%, compared to $172.9 million for fiscal 2003. We acquired RBC-API in December 2003, which contributed $6.1 million to the Roller Bearing segment in fiscal 2004. Overall we began experiencing increased demand from our diversified industrial and aerospace customers in the fourth quarter of fiscal 2004.
Our Plain Bearing segment achieved net sales of $77.6 million for fiscal 2004, an increase of $10.1 million, or 15.0%, compared to $67.4 million in fiscal 2003. $6.4 million of this increase was due to the inclusion of a full year of net sales for the RBC France business unit which was acquired in December 2002. Net sales to our commercial and military aerospace customers accounted for $4.2 million of the increase due to an increase in aerospace engine bearing shipments, mainly for military applications. Net sales to our diversified industrial customers declined $0.5 million, driven mainly by low industrial activity in the first nine months of the year.
Our Roller Bearing segment achieved net sales of $63.1 million for fiscal 2004, an increase of $2.3 million, or 3.8%, compared to $60.8 million for fiscal 2003. Included in fiscal 2004 were net sales for the RBC-API business unit which was acquired in December 2003. Excluding RBC-API, net sales for the Roller Bearing segment decreased by $3.8 million in fiscal 2004 due principally to the continued contraction in the industrial and heavy truck markets for these bearings in the first nine months of the fiscal year.
Our Ball Bearing segment achieved net sales of $35.8 million for fiscal 2004, an increase of $1.8 million, or 5.2%, compared to $34.0 million for fiscal year 2003. Net sales to our diversified industrial customers accounted for $1.0 million of the increase, driven by increased demand from industrial distributors for aftermarket parts and increased penetration of the industrial distributor market. The remaining $0.8 million of the increase was driven by increased demand for airframe applications.
Our Other segment achieved net sales of $10.8 million for fiscal 2004, an increase of $0.2 million, or 2.5%, compared to $10.6 million for fiscal year 2003. This increase was primarily due to increased sales of our machine tool collets to the machine tool industry.
Gross Margin. Our gross margin was $51.9 million in fiscal 2004, or 27.7% of net sales, versus $48.8 million, or 28.2% of net sales, for fiscal 2003. Gross margins for fiscal 2004 and fiscal 2003 reflected one-time expenses associated with the start-up of our Mexican manufacturing operations, the reengineering of manufacturing operations at our Tyson facility, and the relocation of our Bremen, Indiana manufacturing facility to Plymouth, Indiana. These charges totaled $1.7 million in fiscal 2004 and $2.3 million in fiscal 2003. Excluding these costs, and the additive gross margin in fiscal 2004 from our RBC-API acquisition, our gross margin decreased $0.5 million, primarily the result of a shift in mix toward lower margin products.
Selling, General and Administrative Expenses. SG&A expenses increased by approximately 5.5%, or $1.5 million, to $28.1 million in fiscal 2004 from $26.6 million in fiscal 2003. The increase of $1.5 million was mainly due to the addition of RBC-API in December 2003. Excluding the effects of the RBC-API acquisition in fiscal year 2004, SG&A expenses increased $0.7 million, or 2.6%. As a percentage of net sales, SG&A expenses were 15.0% for fiscal 2004 compared to 15.4% for fiscal 2003.
Other, net. Other, net for fiscal 2004 was $1.7 million compared to $1.4 million for fiscal 2003. Fiscal 2004 expenses consisted of Whitney management fees of $0.5 million, fixed asset disposals of $0.2 million, acquisition expenses of $0.4 million and $0.6 million of other expenses. Fiscal 2003 expenses included Whitney management fees of $0.4 million, fixed asset disposals of $0.9 million
associated with the relocation of our Bremen, Indiana manufacturing facility and $0.2 million of other expenses.
Operating Income. Operating income was $22.1 million, or 11.8% of net sales, for fiscal 2004 compared to $20.7 million, or 12.0% of net sales in fiscal 2003. Operating income for the Plain Bearing segment was $18.6 million, or 23.9% of net sales, compared to the prior year's $16.8 million, or 24.9% of net sales. Our Roller Bearing segment achieved an operating income of $11.3 million, or 17.8% of net sales, compared to the prior year's $8.5 million, or 13.9% of net sales. Our Ball Bearing segment achieved an operating income of $6.7 million, or 18.6% of net sales, compared to the prior year's $7.0 million, or 20.6% of net sales. Our Other segment achieved an operating income of $0.4 million, or 3.5% of net sales, compared to the prior year's $1.8 million, or 16.8% of net sales. Changes in operating income in our Plain Bearing and Roller Bearing segments were driven primarily by changes in net sales. Changes in operating income in our Ball Bearing and Other segments were driven by changes in net sales, offset by increased SG&A expenses and a shift in mix toward lower margin products.
Interest Expense, net. Interest expense, net decreased by $0.6 million to $20.4 million in fiscal 2004 as compared to $21.0 million in fiscal 2003. Amortization of deferred financing costs and debt discount are recorded as a component of net interest expense. Amortization expenses included in interest expense, net were $1.6 million in fiscal 2004 and $3.3 million in fiscal 2003. Excluding the amortization of deferred financing costs and debt discount, interest expense, net increased by $1.1 million.
Gain on Early Extinguishment of Debt. In fiscal 2003 we retired early $28.8 million of debentures which resulted in a gain of $0.8 million.
Income Before Income Taxes. Income before income taxes increased by $1.5 million to $1.7 million in fiscal 2004 from $0.2 million in fiscal 2003. This increase was primarily due to fiscal 2004 higher operating income of $1.4 million.
Income Taxes. Income tax expense was $1.1 million for fiscal 2004 as compared to $0.1 million for the comparable period last year. As a percentage of pre-tax income, the fiscal 2004 effective tax rate was 61.7% compared to 69.8% for fiscal year 2003. For fiscal 2004, the difference between the statutory and effective tax rates was primarily due to the adjustment of taxes to correspond to tax returns filed and other miscellaneous permanent differences. For fiscal 2003 the rate differential related to various
minor permanent differences. As of April 3, 2004, we had net operating loss carryforwards of approximately $14.7$9.9 million to offset future federal and state income taxes, which expire at various dates through 2024. In addition, we had an alternative minimum tax credit carryforwards of approximately $1.6 million as of April 3, 2004.
Net Income. Net income increased $0.6 million in fiscal 2004 to $0.7 million compared to $0.1 million in fiscal 2003.
Liquidity and Capital Resources
Our business is capital intensive. Our capital requirements include manufacturing equipment and materials. In addition, we have historically fueled our growth in part through acquisitions. We have historically met our working capital, capital expenditure requirements and acquisition funding needs through our net cash flows provided by operations, various debt arrangements and sale of equity to private investors.
Liquidity
On June 29, 2004, we entered into the $165.0 million Senior Credit Facility, comprised of a $55.0 million Revolving Credit Facility and a $110.0 million Term Loan. In addition, on June 29, 2004,August 15, 2005, we entered into a $45.0Fifth Amended and Restated Credit Agreement (the "Senior Credit Facility"), among RBCA; the other Credit Parties signatory thereto; General Electric Capital Corporation, a Delaware corporation, for itself, as lender, and as agent for the lenders, concurrently with the closing of our initial public offering. Pursuant to the Senior Credit Facility, we increased our term loan borrowings by approximately $40.0 million Second Lienfrom $110.0 million under the term loan portion of the Senior Credit Facility. The Senior Credit Facility provides a $55.0 million revolving credit agreement (the "Revolving Credit Facility") and a $150.0 million term loan (the "Term Loan"). The principal amount of the Term Loan.Loan shall be repaid in twenty-five (25) consecutive quarterly installments commencing December 31, 2005. As of December 31, 2005, we had repaid $2,375 of principal on the Senior Credit Facility. Each loan is secured by a lien against substantially all of our assets and subjects us to standard affirmative and negative covenants, as well as financial leverage tests. As of April 2,December 31, 2005, we were in compliance with all such covenants andcovenants.
leverage tests. The Second LienRevolving Credit Facility bears interest at a floating rate of either the higher of the base rate on corporate loans or the federal funds rate plus 50 basis points, plus 1.25%; or LIBOR plus 2.50%. We have the right to elect the applicable interest rate on the Revolving Credit Facility. The Term Loan also containsbears interest at a covenant that limits our capital expenditures to $10.0 million per annum and requires that a portionfloating rate of either the higher of the proceeds from this offering is usedbase rate on corporate loans or the federal rate plus 50 basis points, plus 1.50%; or LIBOR plus 2.75%. We have the right to repay outstanding indebtedness underelect the Second Lienapplicable interest rate on the Term Loan. TheAs of December 31, 2005, the weighted average interest rate on the outstanding Senior Credit Facility was 7.04%.
Approximately $20.6 million of the Revolving Credit Facility is being utilized to provide letters of credit to secure RBCA's obligations relating to certain Industrial Development Revenue Bonds and the Second Lien Term Loan bear interest at floating rates.insurance programs. As of April 2, 2005, the blended interest rate for the Senior Credit Facility and the Second Lien Term Loan was equal to 7.6%. As of April 2,December 31, 2005, we had outstanding borrowings of $5.0 million and outstanding letters of credit of $20.3the ability to borrow up to an additional $34.4 million under the Revolving Credit FacilityFacility.
Voluntary prepayment and borrowing availabilitycommitment reductions are permitted in whole or in part, without premium or penalty, subject to minimum prepayment or reduction requirements, provided that voluntary prepayments of $26.1 million. See "Description of Certain Indebtedness—Senior Credit Facility."
Mandatory prepayments in respectLIBOR loans on a date other than the last day of the Term Loan or permanent reductionsrelevant interest period will be subject to the commitmentspayment of customary breakage costs, if any.
In addition, the lenders under the Revolving Credit Facility as applicable, are required in an amountentitled to be paid a fee on unused commitments under that facility at a rate equal to (a) 100%0.50% per annum, payable monthly in arrears. With respect to the letter of credit subfacility, an additional fee, equal to the product of the net cashaverage daily undrawn face amount of all letters of credit issued, guaranteed or supported by risk participation agreements multiplied by a per annum rate equal to the applicable margin applied to LIBOR rate
loans, i.e., 3.0%, is payable monthly in arrears together with any fees and charges incurred by the administrative agent to a letter of credit issuer.
The proceeds from all asset sales and dispositions by RBCI and its subsidiaries, subject to certain exceptions, (b) 100% of the net cash proceeds from extraordinary receipts (including, without limitation, proceeds from certain key-man life policies)initial public offering and (c) 100% of the net cash proceeds from equity issuances by us and our subsidiaries, subject to certain exceptions; provided that in the event of certain qualified public offerings of equity securities by us, net cash proceeds thereof shall be used first to repay our outstanding 13% Senior Subordinated Discount Debentures, or Discount Debentures, until paid in full, second 50% of any remaining proceeds must beadditional Term Loan borrowings were used to repay our Second Lien Term Loan and third, any remaining proceeds, up to 50% may be used to make restricted payments, including redemptionsredeem outstanding debt and all of our commonthen outstanding Class C and Class D preferred stock,stock. Concurrently with the funding, we issued a notice of redemption to the note holders of the 13% senior subordinated discount debentures due June 15, 2009. The requisite funds, approximately $40.2 million, were irrevocably put on deposit with the trustee, Bank of New York, for redemption on September 13, 2005. This amount included a redemption premium of $1.3 million and up to 50% may be used to repayinterest expense for the call period of $0.4 million. These amounts along with $0.9 million of unamortized deferred financing fees and debt discount associated with this debt were recorded as a loss on early extinguishment of debt. We also repaid approximately $45.5 million on our Second Lien Term Loan and any remaining unused balance may be used for general corporate purposes.second lien term loan. This offering will constituteamount included a qualified public offeringprepayment fee of $0.5 million. These amounts along with $0.8 million of unamortized deferred financing fees associated with the second lien term loan debt were recorded as defined undera loss on early extinguishment of debt. Deferred financing fees of $1.3 million were capitalized associated with the Senior Credit Facility. Accordingly, all of the outstanding Discount Debentures will be paid in full out of the proceeds from this offering. In addition, a change of control will result in a default under the Senior Credit Facility and the Second Lien Term Loan. Because this offering is a qualified public offering, as defined in the Senior Credit Facility and the Second Lien Term Loan, this offering will not constitute a change of control under either of these agreements.
On December 8, 2003, Schaublin entered into a bank credit facility, or Swiss Credit Facility, with Credit Suisse providing for 10.0 million Swiss Francs, or approximately $8.0$7.6 million, of term loan, or Swiss Term Loan, and up to 2.0 million Swiss Francs, or approximately $1.6$1.5 million, of revolving credit loans and letters of credit, or the Swiss Revolver. The credit agreement for the Swiss Credit Facility contains affirmative and negative covenants regarding the Schaublin financial position and results of operations and other terms customary to such financings. As of April 2,December 31, 2005, we were in compliance with all such covenants. On November 8, 2004, we amended the Swiss Credit Facility to increase the Swiss Revolver to 4.0 million Swiss Francs, or approximately $3.5$3.0 million. As of April 2,December 31, 2005, $6.2$4.8 million was outstanding under the Swiss Term Loan, and no loans or letters of credit were outstanding under the Swiss Revolver.
In connection with this offering and the Refinancing Transaction, we expect to amend and restateor replace our Senior Credit Facility to provide for additional borrowingslower borrowing costs. We expect that the amended or replaced Senior Credit Facility will contain similar amortization schedules, financial covenants, events of default, negative and affirmative covenants and representations and warranties. The amendment or replacement of the Senior Credit Facility is contingent upon the consummation of the primary portion of this offering, but this offering is not contingent upon the amendment or replacement of the Senior Credit Facility. We are in discussions with multiple lenders regarding alternatives for reducing borrowing costs under our Term LoanSenior Credit Facility, including replacing or amending the facility. Based on discussions with lenders, we expect that after giving effect to the amendment or replacement of the Senior Credit Facility, we will reduce the interest rate on our LIBOR loans by at least 125 basis points. There can be no assurances, however, that capital markets will permit us to replace or amend the facility or that we will be able to achieve such savings. In March 2006, we obtained an amendment to our Senior Credit Facility such that the sale of shares by the selling stockholders pursuant to this offering does not result in an amountevent of $40.0 million. See "Pre-Offering Transactions—Refinancing Transaction."
We will be required to make a cash payment of $5.2 million to our CEO in the first half of fiscal 2006 in connection with the payment of the settlement bonus as described under the heading "Related Party Transactions—Dr. Hartnett Settlement Bonus." We will fund this payment with either cash on hand or borrowingsdefault under our RevolvingSenior Credit Facility.
See "Description of Certain Indebtedness—Senior Credit Facility."
We believe that after giving effect to this offering and the Refinancing Transaction,amendment or replacement of our Senior Credit Facility, our cash and cash equivalents, cash flow from operations and capacity under the Revolving Credit Facility and Swiss Revolver will provide adequate cash to fund our working capital, capital expenditure, debt service and other cash requirements for our existing businesses for the foreseeable future. Our ability to meet future working capital, capital expenditure and debt service requirements will depend on our future financial performance, which will be affected by a range of economic, competitive and business factors, particularly interest rates, cyclical changes in our end markets and prices for steel and our ability to pass through price increases on a timely basis, many of which are outside of our control. In addition, future acquisitions could have a significant impact on our liquidity position and our need for additional funds.
From time to time we evaluate our existing facilities and operations and their strategic importance to us. If we determine that a given facility or operation does not have future strategic importance, we may sell, partially or completely, relocate production lines, consolidate or otherwise dispose of those operations. Although we believe our operations would not be materially impaired by such dispositions, relocations or consolidations, we could incur significant cash or non-cash charges in connection with them.
Cash Flows
Nine Month Period Ended December 31, 2005 Compared to the Nine Month Period Ended January 1, 2005
In the nine month period ended December 31, 2005, we generated cash of $13.2 million from operating activities compared to $4.7 million for the nine month period ended January 1, 2005. The increase of $8.5 million was mainly a result of an increase of $6.2 million in net income, reduced by $2.2 million representing the net effect of non-cash charges such as deferred taxes, loss on early extinguishment of debt and loss on disposal of assets, plus a change in working capital investment of $4.5 million.
Cash used for investing activities for the nine month period ended December 31, 2005 included $7.8 million relating to capital expenditures compared to $6.6 million for the nine month period ended January 1, 2005. Investing activities also included $2.6 million relating to the acquisition of the RBC Southwest Products business.
In the nine month period ended December 31, 2005, we decreased borrowings under the Revolving Credit Facility by $5.0 million, received proceeds from the sale of stock of $92.1 million, used $30.6 million to redeem Class C redeemable preferred stock, used $4.0 million to redeem Class D preferred stock, received $0.3 million from the exercise of stock options and warrants, retired term loans of $45.0 million, retired the 13% senior secured discount debentures of $38.6 million, increased our bank term loan by $41.1 million, made payments on term loans of $3.7 million, used $0.2 million of funds for capital lease obligations and paid $1.3 million of financing fees in connection with our amendment to the Senior Credit Facility.
Fiscal 2005 Compared to Fiscal 2004
In fiscal 2005, we generated cash of $9.9 million from operating activities compared to $7.5 million for fiscal 2004. The increase of $2.4 million was mainly a result of an increase of $6.7 million in net income, net of non-cash charges over fiscal 2004, offset by a change in working capital investment of $4.4 million over fiscal 2004. The change in working capital investment was primarily the result of an increase in accounts receivable due to strong fourth quarter net sales and a build in inventory in the fourth quarter to service increasing demand.
Cash flow from investing activities in fiscal 2005 was in-line with fiscal 2004. Cash required for acquisitions decreased by $5.2 million due to the impact of the RBC-API acquisition in fiscal 2004. Capital expenditures increased $4.6 million in fiscal 2005 compared to fiscal 2004 due to increased investment in manufacturing assets to expand capacity and improvements in leaseholds.
Financing activities used $0.3 million in fiscal 2005 and provided $2.9 million in fiscal 2004, both related to debt refinancing transactions.
Fiscal 2004 Compared to Fiscal 2003
In fiscal 2004, we generated cash of $7.5 million from operating activities compared to $4.0 million for fiscal 2003. The increase of $3.5 million was mainly driven by a decrease in working capital investment of $3.0 million as a result of a decrease in inventory investment of approximately $8.8
$8.8 million and a decrease in prepaids and other assets of approximately $1.3 million offset by an increase of $5.5 million in accounts receivable due to strong fourth quarter net sales and an increase in accounts payable and accrued liabilities of approximately $7.6 million.
Cash flow from investing activities in fiscal 2004 increased by $2.6 million due to higher investment in acquisitions, the RBC-API transaction, over fiscal 2003. Capital expenditures decreased by $1.6 million in fiscal 2004 compared to fiscal 2003.
Financing activities used approximately $1.0 million more in fiscal 2004 than in fiscal 2003 mainly to finance the acquisition of RBC-API.
Capital Expenditures
We expect to make capital expenditures of approximately $12.0 million during fiscal 2006 in connection with our existing business. We intendhave funded our fiscal 2006 capital expenditures, and expect to fund our fiscal 20062007 capital expenditures, principally through existing cash, internally generated funds and borrowings under our Revolving Credit Facility. We generally expect capital expenditures for fiscal 2007 to remain at highersimilar levels thanto those in fiscal 2005 as we invest in new manufacturing capability.2006. We may also make substantial additional capital expenditures in connection with acquisitions. Although there are no present understandings, commitments or agreements with respect to the acquisition of any other businesses, we do evaluate acquisition opportunities regularly.
Obligations and Commitments
The following tables outlinetable outlines what we regard as our significant contractual obligations and commercial commitments as of April 2, 2005, on (a) an actual basis and (b) a pro forma basis after giving effect to this offering, the Pre-Offering Transactions and repayments of indebtedness using the proceeds thereof.December 31, 2005. The tables dotable does not represent all of our contractual obligations and commercial commitments that we have entered into.
| | Payments Due By Period | ||||||||||||||
|---|---|---|---|---|---|---|---|---|---|---|---|---|---|---|---|
| Significant Contractual Obligations | Total | Less than 1 Year | 1 to 3 Years | 3 to 5 Years | More than 5 Years | ||||||||||
| | (in thousands) | ||||||||||||||
| Total debt(1) | $ | 220,079 | $ | 8,245 | $ | 5,315 | $ | 41,188 | $ | 165,331 | |||||
| Capital lease obligations | 431 | 226 | 205 | — | — | ||||||||||
| Operating leases | 13,033 | 2,863 | 4,727 | 2,438 | 3,005 | ||||||||||
| Interest payments(2) | 110,451 | 19,782 | 38,904 | 34,542 | 17,223 | ||||||||||
| Pension and post-retirement benefits(3) | 8,293 | 1,948 | 3,208 | 1,354 | 1,783 | ||||||||||
| Total significant contractual cash obligations | $ | 352,287 | $ | 33,064 | $ | 52,359 | $ | 79,522 | $ | 187,342 | |||||
| | Payments Due By Period | Payments Due By Period | ||||||||||||||||||||||||||||
|---|---|---|---|---|---|---|---|---|---|---|---|---|---|---|---|---|---|---|---|---|---|---|---|---|---|---|---|---|---|---|
| Significant Contractual Obligations | Total | Less than 1 Year | 1 to 3 Years | 3 to 5 Years | More than 5 Years | Total | Less than 1 Year | 1 to 3 Years | 3 to 5 Years | More than 5 Years | ||||||||||||||||||||
| | (in thousands) | (in thousands) | ||||||||||||||||||||||||||||
| Total debt | $ | 177,130 | $ | 8,645 | $ | 6,115 | $ | 4,039 | $ | 158,331 | $ | 169,030 | $ | 3,390 | $ | 6,740 | $ | 4,580 | $ | 154,320 | ||||||||||
| Capital lease obligations | 431 | 226 | 205 | — | — | 466 | 174 | 233 | 46 | 13 | ||||||||||||||||||||
| Operating leases | 13,033 | 2,863 | 4,727 | 2,438 | 3,005 | 13,033 | 2,863 | 4,727 | 2,438 | 3,005 | ||||||||||||||||||||
| Interest payments | 65,659 | 10,774 | 20,846 | 20,190 | 13,849 | 67,465 | 11,964 | 23,307 | 22,657 | 9,537 | ||||||||||||||||||||
| Pension and post-retirement benefits(3) | 8,293 | 1,948 | 3,208 | 1,354 | 1,783 | |||||||||||||||||||||||||
| Pension and postretirement benefits(2) | 8,293 | 1,948 | 3,208 | 1,354 | 1,783 | |||||||||||||||||||||||||
| Total significant contractual cash obligations | $ | 264,546 | $ | 24,456 | $ | 35,101 | $ | 28,021 | $ | 176,968 | $ | 258,287 | $ | 20,339 | $ | 38,215 | $ | 31,075 | $ | 168,658 | ||||||||||
Quarterly Results of Operations
| | | Quarter Ended | | Quarter Ended | |||||||||||||||||||||||||||||||||||||||||||||||||||||||||
|---|---|---|---|---|---|---|---|---|---|---|---|---|---|---|---|---|---|---|---|---|---|---|---|---|---|---|---|---|---|---|---|---|---|---|---|---|---|---|---|---|---|---|---|---|---|---|---|---|---|---|---|---|---|---|---|---|---|---|---|---|---|
| | | June 28, 2003 | Sept 27, 2003 | Dec 27, 2003 | April 3, 2004 | July 3, 2004 | Oct 2, 2004 | Jan 1, 2005 | April 2, 2005 | | June 28, 2003 | Sept. 27, 2003 | Dec. 27, 2003 | April 3, 2004 | July 3, 2004 | Oct. 2, 2004 | Jan. 1, 2005 | April 2, 2005 | July 2, 2005 | Oct. 1, 2005 | Dec. 31, 2005 | ||||||||||||||||||||||||||||||||||||||||
| | | (in thousands, except per share data) | | (in thousands, except per share data) | |||||||||||||||||||||||||||||||||||||||||||||||||||||||||
| Net sales | Net sales | $ | 39,737 | $ | 42,449 | $ | 42,901 | $ | 62,244 | $ | 56,195 | $ | 56,391 | $ | 58,145 | $ | 72,285 | Net sales | $ | 39,737 | $ | 42,449 | $ | 42,901 | $ | 62,244 | $ | 56,195 | $ | 56,391 | $ | 58,145 | $ | 72,285 | $ | 66,001 | $ | 65,367 | $ | 67,390 | |||||||||||||||||||||
| Gross margin | Gross margin | 10,966 | 11,708 | 11,668 | 17,556 | 15,293 | 15,381 | 16,732 | 21,008 | Gross margin | 10,966 | 11,708 | 11,668 | 17,556 | 15,293 | 15,381 | 16,732 | 21,008 | 19,276 | 19,987 | 20,361 | ||||||||||||||||||||||||||||||||||||||||
| Operating income | Operating income | 4,572 | 5,107 | 4,185 | 8,265 | 5,916 | 7,360 | 8,405 | 10,458 | Operating income | 4,572 | 5,107 | 4,185 | 8,265 | 5,916 | 7,360 | 8,405 | 10,458 | 10,398 | 5,093 | 10,788 | ||||||||||||||||||||||||||||||||||||||||
| Net income (loss) | Net income (loss) | $ | (185 | ) | $ | (40 | ) | $ | (720 | ) | $ | 1,608 | $ | (3,822 | ) | $ | 1,668 | $ | 2,462 | $ | 6,952 | Net income (loss) | $ | (185 | ) | $ | (40 | ) | $ | (720 | ) | $ | 1,608 | $ | (3,822 | ) | $ | 1,668 | $ | 2,462 | $ | 6,952 | $ | 3,345 | $ | (1,960 | ) | $ | 5,099 | ||||||||||||
| Net income (loss) per common share: | Net income (loss) per common share: | Net income (loss) per common share: | |||||||||||||||||||||||||||||||||||||||||||||||||||||||||||
| Basic:(2)(3) | Basic(1)(2) | $ | (0.11 | ) | $ | (0.09 | ) | $ | (0.20 | ) | $ | 0.13 | $ | (0.71 | ) | $ | 0.14 | $ | 0.23 | $ | 0.77 | $ | 0.34 | $ | (0.18 | ) | $ | 0.31 | |||||||||||||||||||||||||||||||||
| Class A common stock | $ | (0.11 | ) | $ | (0.09 | ) | $ | (0.20 | ) | $ | 0.13 | $ | (0.71 | ) | $ | 0.14 | $ | 0.23 | $ | 0.77 | Diluted(1)(2) | $ | (0.11 | ) | $ | (0.09 | ) | $ | (0.20 | ) | $ | 0.08 | $ | (0.71 | ) | $ | 0.08 | $ | 0.13 | $ | 0.71 | $ | 0.22 | $ | (0.18 | ) | $ | 0.29 | |||||||||||||
| Class B common stock | $ | (0.11 | ) | $ | (0.09 | ) | $ | (0.20 | ) | $ | 0.13 | $ | (0.71 | ) | $ | 0.14 | $ | 0.23 | $ | 0.77 | |||||||||||||||||||||||||||||||||||||||||
| Diluted:(2)(3) | |||||||||||||||||||||||||||||||||||||||||||||||||||||||||||||
| Class A common stock | $ | (0.11 | ) | $ | (0.09 | ) | $ | (0.20 | ) | $ | 0.09 | $ | (0.71 | ) | $ | 0.09 | $ | 0.15 | $ | 0.71 | |||||||||||||||||||||||||||||||||||||||||
| Class B common stock | $ | (0.11 | ) | $ | (0.09 | ) | $ | (0.20 | ) | $ | 0.00 | $ | (0.71 | ) | $ | 0.00 | $ | 0.00 | $ | 0.00 | |||||||||||||||||||||||||||||||||||||||||
Recent Accounting Pronouncements
In November 2004, the FASB issued SFAS No. 151, "Inventory Costs, an amendment of ARB No. 43, Chapter 4." The amendments made by SFAS No. 151 clarify that abnormal amounts of idle facility expense, freight, handling costs and wasted materials (spoilage) should be recognized as current-period charges and require the allocation of fixed production overheads to inventory based on the normal capacity of the production facilities. The guidance is effective for inventory costs incurred during fiscal years beginning after June 15, 2005. It is not believed that the adoption of SFAS No. 151 will have a material impact on our consolidated financial position, results of operations or cash flows.
In December 2004, the FASB issued SFAS No. 123 (revised 2004), "Share-Based Payment." SFAS No. 123(R) that will require that the compensation cost relating to share-based payment transactions be recognized in financial statements. That cost will be measured based on the fair value of the equity or liability instruments issued. SEAS No. 123(R) covers a wide range of share-based compensation arrangements including share options, restricted share plans, performance-based awards, share appreciation rights and employee share purchase plans. SFAS No. 123(R) replaces FASB Statement No. 123, "Accounting for Stock-Based Compensation", and supersedes APB Opinion No. 25, "Accounting for Stock Issued to Employees." SFAS No. 123, as originally issued in 1995, established as preferable a fair value-based method of accounting for share-based payment transactions with employees. However, that Statement permitted entities the option of continuing to apply the guidance in APB Opinion No. 25 as long as the footnotes to financial statements disclosed what net income would have been had the preferable fair value-based method been used. Public entities will be required
to apply SFAS No. 123(R) as of the beginning of the first fiscal year beginning after June 15, 2005. SFAS No. 123(R) permits public companies to adopt its requirements using one of two methods:
We are required to adopt the pronouncement in fiscal 2007 and have decided to use the "modified prospective" method in applying SFAS No. 123(R). We are currently evaluating these transition methods and determining theits effect on our consolidated results of operations and whether the adoption will result in amounts that are similar to the current pro forma disclosures under SFAS No. 123. For fiscal 2005,2006, we will continue to disclose stock-based compensation information in accordance with SFAS No. 148, "Accounting for Stock-BasedStock Based Compensation—TransitionTransitions and Disclosure—an Amendment of FASB Statement No. 123," and SFAS No. 123.
Critical Accounting Policies
Our discussion and analysis of our financial condition and results of operations are based upon our consolidated financial statements, which have been prepared in accordance with U.S. generally accepted accounting principles. The preparation of these financial statements requires us to make estimates and judgments that affect the reported amounts of assets, liabilities, revenues and expenses and related disclosure of contingent assets and liabilities. On an on-going basis, we evaluate our estimates, including those related to product returns, bad debts, inventories, recoverability of intangible assets, income taxes, financing operations, pensions and other post-retirement benefits and contingencies and litigation. We base our estimates on historical experience and on various other assumptions that are believed to be reasonable under the circumstances, the results of which form the basis for making judgments about the carrying values of assets and liabilities that are not readily apparent from other sources. Actual results may differ from these estimates under different assumptions or conditions.
We believe the following critical accounting policies affect our more significant judgments and estimates used in the preparation of our consolidated financial statements.
Revenue Recognition. We recognize revenue in accordance with SEC Staff Accounting Bulletin 101 "Revenue Recognition in Financial Statements as amended by Staff Accounting Bulletin 104. The SEC requires that the following four basic criteria must be met before the Company recognizeswe recognize revenue:
We recognizes revenue upon the passage of title on the sale of manufactured goods, which is at time of shipment, and under the units-of-delivery method in a limited number of aerospace long-term projects.
Accounts Receivable. We are required to estimate the collectability of our accounts receivable, which requires a considerable amount of judgment in assessing the ultimate realization of these
receivables, including the current credit-worthiness of each customer. Changes in required reserves may occur in the future as conditions in the marketplace change.
Inventory. Inventories are stated at the lower of cost or market value. Cost is principally determined by the first-in, first-out method. We account for inventory under a full absorption method. We record adjustments to the value of inventory based upon past sales history and forecasted plans to sell our inventories. The physical condition, including age and quality, of the inventories is also considered in establishing its valuation. These adjustments are estimates, which could vary significantly, either favorably or unfavorably, from actual requirements if future economic conditions, customer inventory levels or competitive conditions differ from our expectations.
Goodwill and Intangible Assets. We adopted the provisions of SFAS No. 141, "Business Combinations," and Statement of Financial Accounting Standards No. 142, "Goodwill and Other Intangible Assets," ("SFAS No. 142") at the beginning of fiscal 2003. These standards require that all business combinations be accounted for using the purchase method and that goodwill (representing the excess of the amount paid to acquire a company over the estimated fair value of the net assets acquired) and intangible assets with indefinite useful lives not be amortized but instead be tested for impairment annually (performed by us during the fourth quarter of each fiscal year), or when events or circumstances indicate that its value may have declined. This determination of any goodwill impairment is made at the reporting unit level and consists of two steps. First, we determine the fair value of a reporting unit and compare it to our carrying amount. Second, if the carrying amount of the reporting unit exceeds its fair value, an impairment loss is recognized for any excess of the carrying amount of the reporting unit's goodwill over the goodwill's implied fair value. The fair value of our reporting units is calculated by comparing the weighted average of the net present value of future cash flows and a market approach based on our reporting units' carrying value. We utilized a discount rate of 12.1% based on a weighted average cost of capital. The discount rate was derived using an analysis of similar companies which we believe have a comparable level of risk. Although no changes are expected, if the assumptions management makes regarding estimated cash flows are less favorable than expected, we may be required to record an impairment charge in the future. Goodwill had been amortized by the straight-line method over a 40-year period through March 30, 2002. Effective with fiscal 2003, goodwill amortization was suspended in conjunction with the adoption of SFAS No. 142. The determination of impairment for intangible assets with indefinite useful lives is based on a comparison of the fair value of the intangible asset with its carrying value.
Definite-lived intangible assets are being amortized over their useful lives of 5 to 15 years. Also included in intangible assets is an asset relating to our minimum pension liability.
Income Taxes. As part of the process of preparing the consolidated financial statements, we are required to estimate the income taxes in each jurisdiction in which we operate. This process involves estimating the actual current tax liabilities together with assessing temporary differences resulting from the differing treatment of items for tax and financial reporting purposes. These differences result in deferred tax assets and liabilities, which are included in the Consolidated Balance Sheet. We must then assess the likelihood that the deferred tax assets will be recovered, and to the extent that we believe that recovery is not more than likely, we are required to establish a valuation allowance. If a valuation allowance is established or increased during any period, we are required to include this amount as an expense within the tax provision in the Consolidated Statements of Operations. Significant judgment is required in determining our provision for income taxes, deferred tax assets and liabilities and any valuation allowance recognized against net deferred tax assets.
We have determined that a valuation allowance against deferred tax assets is not necessary based on our estimates of taxable income in the jurisdictions that we operate and over the period in which the deferred tax assets will be recoverable. We estimate that we will need to generate approximately $13.2$23.1 million of taxable income in the future to fully realize our net deferred tax asset.
Pension Plans and Post-retirement Health Care. We have noncontributory defined benefit pension plans covering union employees in our Heim division plant in Fairfield, Connecticut, in our Nice subsidiary plant in Kulpsville, Pennsylvania, in our Bremen subsidiary plant in Plymouth, Indiana and in our Tyson subsidiary plant in Glasgow, Kentucky. Our funding policy is to make the minimum annual contribution required by the Employee Retirement Income Security Act of 1974. Plan obligations and annual pension expense are determined by independent actuaries using a number of assumptions provided by us including assumptions about employee demographics, retirement age, compensation levels, pay rates, turnover, expected long-term rate of return on plan assets, discount rate and the amount and timing of claims. Each plan assumption reflects our best estimate of the plan's future experience. The most sensitive assumption in the determination of plan obligations for pensions is the
discount rate. The discount rate used in determining the funded status as of April 2, 2005 and April 3, 2004 was 5.9% and 6.25%, respectively. In developing the overall expected long-term rate of return on plan assets assumption, a building block approach was used in which rates of return in excess of inflation were considered separately for equity securities and debt securities. The excess returns were weighted by the representative target allocation and added along with an appropriate rate of inflation to develop the overall expected long-term rate of return on plan assets assumption.
The discount rate that we use for determining future pension obligations is based on a review of long-term bonds that receive one of the two highest ratings given by a recognized rating agency. The discount rate determined on this basis has decreased from 6.50% at March 29, 2003 to 6.25% at April 3, 2004, and to 5.90% at April 2, 2005.
Lowering the expected long-term rate of return on the assets of our pension plans by 1.00% (from 9.00% to 8.00%) would have increased our pension expense for fiscal 2005 by approximately $108,000. Increasing the expected long-term rate of return on the assets of our pension plans by 1.00% (from 9.00% to 10.00%) would have reduced our pension expense for fiscal 2005 by approximately $108,000.
Lowering the discount rate assumption used to determine net periodic pension cost by 1.00% (from 6.25% to 5.25%) would have increased our pension expense for fiscal 2005 by approximately $205,000. Increasing the discount rate assumption used to determine net periodic pension cost by 1.00% (from 6.25% to 7.25%) would have reduced our pension expense for fiscal 2005 by approximately $165,000.
Lowering the discount rate assumption used to determine the funded status as of April 2, 2005 by 1.00% (from 5.90% to 4.90%) would have increased the projected benefit obligation of our pension plans by approximately $2.1 million. Increasing the discount rate assumption used to determine the funded status as of April 2, 2005 by 1.00% (from 5.90% to 6.90%) would have reduced the projected benefit obligation of our pension plans by approximately $1.8 million.
We recorded a minimum pension liability of $3.4 million and $4.6 million as of April 2, 2005 and April 3, 2004, respectively. This liability represented the amount by which the accumulated benefit obligation exceeded the sum of the fair market value of plan assets. The additional minimum pension liability as of April 2, 2005 and April 3, 2004 of $3.3 million and $4.0 million, respectively, was offset by an intangible asset to the extent of previously unrecognized prior service cost. The intangible assets of $0.6 million and $0.6 million as of April 2, 2005 and April 3, 2004, respectively, were included on the line item entitled "Intangible assets" in our consolidated balance sheet. The remaining amounts of $1.7 million and $2.0 million, net of deferred income taxes of $1.0 million and $1.4 million, respectively, were recorded as a component of stockholders' deficit on the line item titled "Accumulated other comprehensive loss" in our consolidated balance sheet as of April 2, 2005 and April 3, 2004, respectively. The intangible asset in 2005 and 2004 was greater than the unrecognized prior service cost because two of our plans had an unrecognized negative prior service cost.
Our investment program objective is to achieve a rate of return on plan assets which will fund the plan liabilities and provide for required benefits while avoiding undue exposure to risk to the plan and
increases in funding requirements. Our target allocation of plan assets was 100 percent equity investments as of April 2, 2005 and April 3, 2004.
For the benefit of employees at our Heim, West Trenton, Nice, Tyson and Bremen facilities, we sponsor contributory defined benefit health care plans that provide post-retirement medical and life insurance benefits to union employees who have attained certain age and/or service requirements while employed by us. The plans are unfunded and costs are paid as incurred. Post-retirement benefit obligations as of April 2, 2005 and April 3, 2004 were $3.7 million and $4.2 million, respectively, and are included in "Other non-current liabilities" in our consolidated balance sheet.
We use a March 31 measurement date for our plans. We expect to contribute approximately $0.3 million to our post-retirement benefit plans in fiscal year 2006.
On December 8, 2003, the Medicare Prescription Drug Improvement and Modernization Act of 2003 (the "Act") was signed into law. Our prescription drug benefit for all post-retirement plans is capped at a set amount each month, which is paid to the retirees so they can obtain prescription drug coverage. As such, we are not self-insured for prescription drugs, and the Act has no impact on the recorded obligation.
During fiscal 2004, the plans were amended to contractually limit the benefit to be provided for certain groups of current and future retirees. As a result, there is no health care trend associated with these groups. The discount rate used in determining the accumulated post-retirement benefit obligation was 5.9% as of April 2, 2005 and 6.25% as of April 3, 2004. The discount rate used in determining the net periodic benefit cost was 6.25% for fiscal 2005, 6.50% for fiscal 2004 and 7.25% for fiscal 2003.
The discount rate that we use for determining net periodic benefit cost for these benefits is based on a review of long-term bonds that receive one of the two highest ratings given by a recognized rating agency. The discount rate determined on this basis has decreased from 6.50% at March 31, 2003 to 6.25% at April 3, 2004, and to 5.90% at April 2, 2005.
Lowering the discount rate assumption used to determine net periodic benefit cost by 1.00% (from 6.25% to 5.25%) would have increased our post-retirement expense for fiscal 2005 by approximately $25,000. Increasing the discount rate assumption used to determine net periodic benefit cost by 1.00% (from 6.25% to 7.25%) would have reduced our post-retirement expense for fiscal 2005 by approximately $28,000.
Lowering the discount rate assumption used to determine the accumulated post-retirement benefit obligation as of April 2, 2005 by 1.00% (from 5.90% to 4.90%) would have increased the accumulated post-retirement benefit obligation of our post-retirement plans by approximately $425,000. Increasing the discount rate assumption used to determine the accumulated post-retirement benefit obligation, as of April 2, 2005 by 1.00% (from 5.90% to 6.90%) would have reduced the accumulated post-retirement benefit obligation of our post-retirement plans by approximately $357,000.
Stock-Based Compensation. We account for our stock compensation arrangements with employees under the provisions of Accounting Principles Board (APB) Opinion No. 25 "Accounting for Stock Issued to Employees."
We have granted to our employees options and warrants to purchase our common stock at exercise prices determined by our management and board of directors. We record stock-based compensation as necessary to the extent that the deemed value of the stock at the date of grant exceeds the exercise price of the option. These valuations depend upon our determination of the fair value of our stock and can vary based upon the value of our company and liquidity assumptions over time. In the event we issue options at below fair value, we would be required to record an additional charge.
Management employed the intrinsic value method pursuant to APB No. 25 under which compensation cost is recognized only if the exercise price of grants issued is below the fair value of our
common stock at the date of grant as determined by the board of directors. Had compensation cost for option grants and warrant grants to employees been determined based on the fair value at the grant
dates consistent with SFAS No. 123, "Accounting for Stock-Based Compensation," our net income would have been reduced to the following pro forma amounts:
| | | Fiscal Year Ended | | Fiscal Year Ended | Nine Months Ended | ||||||||||||||||||||||||
|---|---|---|---|---|---|---|---|---|---|---|---|---|---|---|---|---|---|---|---|---|---|---|---|---|---|---|---|---|---|
| | | March 29, 2003 | April 3, 2004 | April 2, 2005 | | March 29, 2003 | April 3, 2004 | April 2, 2005 | January 1, 2005 | December 31, 2005 | |||||||||||||||||||
| Net income, as reported | Net income, as reported | $ | 49 | $ | 663 | $ | 7,260 | Net income, as reported | $ | 49 | $ | 663 | $ | 7,260 | $ | 308 | $ | 6,484 | |||||||||||
| Plus: stock-based compensation expense included in reported net income, net of the tax (see further discussion below) | Plus: stock-based compensation expense included in reported net income, net of the tax (see further discussion below) | — | — | 264 | Plus: stock-based compensation expense included in reported net income, net of the tax (see further discussion below) | — | — | 264 | 209 | 136 | |||||||||||||||||||
| Less: stock-based compensation expense determined under fair value method, net of tax | Less: stock-based compensation expense determined under fair value method, net of tax | (56 | ) | (131 | ) | (540 | ) | Less: stock-based compensation expense determined under fair value method, net of tax | (56 | ) | (131 | ) | (540 | ) | (131 | ) | (1,547 | ) | |||||||||||
| Pro forma net income (loss) | Pro forma net income (loss) | $ | (7 | ) | $ | 532 | $ | 6,984 | Pro forma net income (loss) | $ | (7 | ) | $ | 532 | $ | 6,984 | $ | 386 | $ | 5,073 | |||||||||
| Net income (loss) per common share, as reported: | Net income (loss) per common share, as reported: | Net income (loss) per common share, as reported: | |||||||||||||||||||||||||||
| Basic: | Basic | $ | (0.20 | ) | $ | (0.24 | ) | $ | 0.62 | $ | (0.33 | ) | $ | 0.43 | |||||||||||||||
| Class A common stock | $ | (0.20 | ) | $ | (0.24 | ) | $ | 0.62 | Diluted | $ | (0.20 | ) | $ | (0.24 | ) | $ | 0.35 | $ | (0.33 | ) | $ | 0.37 | |||||||
| Class B common stock | $ | (0.20 | ) | $ | (0.24 | ) | $ | 0.62 | |||||||||||||||||||||
| Diluted: | |||||||||||||||||||||||||||||
| Class A common stock | $ | (0.20 | ) | $ | (0.24 | ) | $ | 0.40 | |||||||||||||||||||||
| Class B common stock | $ | (0.20 | ) | $ | (0.24 | ) | $ | 0.00 | |||||||||||||||||||||
| Net income (loss) per common share, pro forma: | Net income (loss) per common share, pro forma: | Net income (loss) per common share, pro forma: | |||||||||||||||||||||||||||
| Basic: | Basic | $ | (0.21 | ) | $ | (0.26 | ) | $ | 0.57 | $ | (0.32 | ) | $ | 0.30 | |||||||||||||||
| Class A common stock | $ | (0.21 | ) | $ | (0.26 | ) | $ | 0.57 | Diluted | $ | (0.21 | ) | $ | (0.26 | ) | $ | 0.33 | $ | (0.32 | ) | $ | 0.27 | |||||||
| Class B common stock | $ | (0.21 | ) | $ | (0.26 | ) | $ | 0.57 | |||||||||||||||||||||
| Diluted: | |||||||||||||||||||||||||||||
| Class A common stock | $ | (0.21 | ) | $ | (0.26 | ) | $ | 0.37 | |||||||||||||||||||||
| Class B common stock | $ | (0.21 | ) | $ | (0.26 | ) | $ | 0.00 | |||||||||||||||||||||
For purposes of the pro forma disclosures, the estimated fair value of the options and warrants is amortized to be expensed over the service period that generally is the option or warrant vesting period. The weighted average fair value per share of options and warrants granted was $8.17 in fiscal 2005, $1.58 in fiscal 2004, and $1.18 in fiscal 2003.2003, and $5.99 and $8.17, respectively, for the nine months ended December 31, 2005 and January 1, 2005.
The fair value for our options and warrants was estimated at the date of grant using the Black-Scholes option pricing model with the following weighted average assumptions:
| | Fiscal Year Ended | Fiscal Year Ended | Nine Months Ended | |||||||||||||||
|---|---|---|---|---|---|---|---|---|---|---|---|---|---|---|---|---|---|---|
| | March 29, 2003 | April 3, 2004 | April 2, 2005 | March 29, 2003 | April 3, 2004 | April 2, 2005 | January 1, 2005 | December 31, 2005 | ||||||||||
| Dividend yield | 0.0 | % | 0.0 | % | 0.0 | % | 0.0 | % | 0.0 | % | 0.0 | % | 0.0 | % | 0.0 | % | ||
| Expected weighted average life | 3.0 | 3.0 | 3.0 | 3.0 | 3.0 | 3.0 | 3.0 | 7.0 | ||||||||||
| Risk-free interest rate | 3.5 | % | 3.5 | % | 3.5 | % | 3.5 | % | 3.5 | % | 3.5 | % | 3.5 | % | 3.5 | % | ||
| Expected volatility | 0.1 | % | 0.1 | % | 0.4 | % | 0.1 | % | 0.1 | % | 0.4 | % | 0.1 | % | 0.3 | % | ||
The Black-Scholes option pricing model was developed for use in estimating the fair value of traded options and warrants which have no vesting restrictions and are fully transferable. In addition, option and warrant valuation models require the input of highly subjective assumptions, including the expected stock price volatility. Because our options and warrants have characteristics significantly different from those of traded options and warrants, and because changes in the subjective input assumptions can materially affect the fair value estimate, the existing models do not necessarily provide a reliable single measure of the fair value of our options and warrants.
On March 29, 2006, we accelerated the vesting of 523,585 stock options whose exercise prices were below our closing stock price on the date the vesting of the options was accelerated. As a result, a charge of approximately $73,000 dollars, net of tax, will be recorded in fiscal 2006. The accelerated vesting of these stock options is intended to eliminate a possible compensation expense associated with these options in future periods due to the adoption of SFAS No. 123(R), "Share-Based Payment."
We awarded 179,575 options to purchase common stock at an exercise price of $8.00 per share during the fiscal year ended April 2, 2005. Contemporaneous with the first option grant on April 4,
2004, we performed a valuation analysis to estimate the fair value of our common stock. We considered each of the valuation methodologies outlined in the AICPA Technical Practice Aid "Valuation of Privately-Held-Company Equity Securities Issued as Compensation" and determined that the market-multiple approach was the most relevant method to use for our company. We employed this approach by focusing on multiples of enterprise value to EBITDA for comparable public companies at the time of the April 4, 2004 grant date. This methodology resulted in an estimate of our enterprise value, from which we subtracted the book value of our outstanding indebtedness and the estimated redemption value of our preferred stock, in order to arrive at an estimate of the value of our common stock. We then estimated a 17% lack of marketability discount to reflect the illiquid nature of private company equity securities such as our common stock. The resulting valuation approximated $8.00 per share and provided the basis for our board's approval of the April 4, 2004 option grant at an exercise price of $8.00 per share. At each of the subsequent seven option grant dates during fiscal year 2005, we relied on the valuation analysis performed as of April 4, 2004 as the basis for our establishing an exercise price of $8.00 per share for each such option grant because management believed the business continued to perform in line with its projections.
In connection with the preparation of our audited financial statements for fiscal year 2005 in anticipation of thisour initial public offering in August 2005, and solely for the purposes of accounting for employee stock-based compensation, we considered whether the stock options granted during fiscal year 2005 had compensatory elements that should be reflected in our financial statements. This review resulted in our determination that the fair value of our common stock as of each of the option grant dates during fiscal year 2005 was likely higher than the $8.00 per share exercise price established for all such options. As a result, we decided to retrospectively estimate the fair value of our common stock as of each option grant date during fiscal year 2005.
In conducting our retrospective analysis, we considered the valuation methodologies that investment banking firms were discussing with us in connection with our preparations for thisour initial public offering. We also considered the likelihood of our proceeding with thisour initial public offering and the changes in our business and capital structure during the course of fiscal 2005. Based on such considerations, we determined that the contemporaneous analysis we performed as of April 4, 2004 should be modified as follows in order to more accurately apply the market-multiple approach in arriving at an estimated fair value of our common stock as of each grant date:
We incorporated these adjustments to the market-multiple approach and performed a retrospective analysis initially as of the April 2004 option grant date, and we determined that the fair value of our common stock approximated $15.00 per share. Given that our annual planning and budgeting cycle
concludes during our fiscal fourth quarter, our financial projections for fiscal years 2005 and 2006 had been recently completed as of the April 2004 option grant date. As of each subsequent option grant
date, we concluded that our actual and expected financial performance as of each such date was in line with our financial projections and that the outlook for our future financial performance had not changed since we originally established our financial projections. As a result, we determined that, as of each option grant date, there was no need to modify our financial projections for fiscal 2005 and 2006. Therefore, any changes in our estimated fair value between option grant dates were driven by changing market factors, including, principally, the valuation multiples for the group of comparable companies and short-term interest rates. During the course of fiscal 2005, the average of the net income based valuation multiples for our group of comparable companies increased modestly. At the same time, short-term interest rates also increased, resulting in an increase in our projected interest expense due to the fact that a high percentage of our debt bears interest at floating rates. This resulted in a corresponding decrease to our projected net earnings. These two market factors largely offset each other and therefore resulted in minimal changes in our estimated fair value between option grant dates. As a result, we determined to use the same fair value of our common stock, $15.00 per share, as of each grant date during fiscal year 2005.
In July 2005, we reviewed our retrospective analysis and further considered whether it met all of the guidelines set forth by the AICPA Technical Practice Aid. Noting the Practice Aid's recommendation to engage an unrelated valuation specialist, we decided to retain Valuation Research Corporation, or VRC, as an independent third party to perform a valuation of our common stock as of each of the option grant dates during fiscal 2005. VRC's independent valuation of our common stock determined that the fair value of our common stock as of each of the option grant dates during fiscal year 2005 exceeded the $8.00 per share as determined in our contemporaneous analysis, but was less than the $15.00 per share as determined in our initial retrospective determination. For purposes of its analysis, VRC used our financial projections for fiscal 2005 and 2006 which, as previously noted, we determined did not need to be modified as of each option grant date. As a result, the different fair value estimates calculated by VRC resulted from VRC employing different methodologies and assumptions compared to those employed by us in our prior analyses, including the following:
valuations, against which to benchmark our valuation of the Company. In addition, VRC used a slightly different benchmarking methodology. Specifically, our analyses used an average of the multiples of the comparable companies whereas VRC applied a premium to the median of the multiples observed for our publicly traded peers to reflect several factors, including our relatively higher margins and growth prospects versus the median of our peers, as determined by VRC.
of each grant date. Our debt balances changed over time, particularly between the June 2004 and August 2004 grant dates due to our debt refinancing which occurred during this period. Our
Class C preferred stock redemption value increased over time due to the accrual of pay-in-kind dividends since it was redeemable at a fixed price plus accrued dividends. Our Class D preferred stock redemption value is calculated based upon our enterprise value rather than a fixed price and, as such, changed over time as a result of changes to the estimates of our enterprise value generally as a result of fluctuations in the valuation multiples of our group of comparable companies. Our contemporaneous analysis valued our common equity by subtracting from enterprise value the book value of our debt and the estimated redemption value of our preferred stock as of the April 2004 grant date. Unlike our contemporaneous analysis and the revised retrospective analysis which considered the VRC report, our initial retrospective analysis took into account a capital structure pro forma as adjusted for the initial public offering, the Pre-Offering Transactions and the use of proceeds thereof.
Based on our thorough review of the independent valuation, we determined that the assumptions and methods employed by VRC were more appropriate and consistent with accepted valuation methods and with the practices recommended in the AICPA Technical Practice Aid than those employed by either our contemporaneous analysis or our initial retrospective analysis. We concluded that it was appropriate to reassess the fair value of our common stock underlying the fiscal 2005 equity awards,
upon analyzing VRC's independent valuation. In accordance with our revised retrospective assessment, the following table sets forth information related to our option grants during fiscal 2005:
| Grant Date | Grant Date | Number of Options Granted | Exercise Price | Fair Value | Intrinsic Value | Deferred Compensation | Grant Date | Number of Options Granted | Exercise Price | Fair Value | Intrinsic Value | Deferred Compensation | |||||||||||||||||
|---|---|---|---|---|---|---|---|---|---|---|---|---|---|---|---|---|---|---|---|---|---|---|---|---|---|---|---|---|---|
| 4/4/04 | 4/4/04 | 50,000 | $8.00 | $ | 11.20 | $ | 3.20 | $ | 160,000 | 4/4/04 | 50,000 | $ | 8.00 | $ | 11.20 | $ | 3.20 | $ | 160,000 | ||||||||||
| 6/6/04 | 6/6/04 | 8,325 | 8.00 | 11.20 | 3.20 | 26,640 | 6/6/04 | 8,325 | 8.00 | 11.20 | 3.20 | 26,640 | |||||||||||||||||
| 8/27/04 | 8/27/04 | 2,500 | 8.00 | 10.80 | 2.80 | 7,000 | 8/27/04 | 2,500 | 8.00 | 10.80 | 2.80 | 7,000 | |||||||||||||||||
| 9/7/04 | 9/7/04 | 31,250 | 8.00 | 11.60 | 3.60 | 112,500 | 9/7/04 | 31,250 | 8.00 | 11.60 | 3.60 | 112,500 | |||||||||||||||||
| 10/12/04 | 10/12/04 | 62,500 | 8.00 | 13.60 | 5.60 | 350,000 | 10/12/04 | 62,500 | 8.00 | 13.60 | 5.60 | 350,000 | |||||||||||||||||
| 11/4/04 | 11/4/04 | 6,250 | 8.00 | 14.40 | 6.40 | 40,000 | 11/4/04 | 6,250 | 8.00 | 14.40 | 6.40 | 40,000 | |||||||||||||||||
| 1/13/05 | 1/13/05 | 12,500 | 8.00 | 11.20 | 3.20 | 40,000 | 1/13/05 | 12,500 | 8.00 | 11.20 | 3.20 | 40,000 | |||||||||||||||||
| 2/17/05 | 2/17/05 | 6,250 | 8.00 | 13.20 | 5.20 | 32,500 | 2/17/05 | 6,250 | 8.00 | 13.20 | 5.20 | 32,500 | |||||||||||||||||
| Total | 179,575 | $ | 768,640 | Total | 179,575 | $ | 768,640 | ||||||||||||||||||||||
As noted above, the same financial projections for fiscal years 2005 and 2006 were used for each valuation assessment date during fiscal 2005. As a result, any changes in our estimated fair value between option grant dates were driven principally by changing market factors, including valuations of comparable public companies, stock price volatilities and interest rates. In addition, the book value of our debt and the estimated redemption value of our preferred stock changed over time due to the reasons stated above. The following is a description of our revised retrospective determination, which considered the VRC analysis, of the fair value of our common stock with respect to each option grant date during fiscal 2005.
April 2004. In retrospectively determining the fair value of our common stock as of April 2004, we noted that the VRC valuation applied multiples of enterprise value to EBITDA, based on a premium to the median enterprise value to EBITDA multiples of a group of comparable companies, to our projected fiscal 2005 and 2006 EBITDA, to arrive at an enterprise value. From this figure, VRC subtracted the book value of our debt and the estimated redemption value of our preferred stock as of April 2004 to arrive at an aggregate common equity value. VRC then applied a 15% lack of marketability discount and divided this figure by the number of diluted shares of our common stock to arrive at a common equity value approximating $11.20 per share. Consistent with the independent valuation, we retrospectively determined that the fair value of our common stock for purposes of the stock option grants in April 2004 approximated $11.20 per share.
June 2004. In retrospectively determining the fair value of our common stock as of June 2004, we evaluated the events that occurred between April 2004 and June 2004. We examined our financial performance since the April 2004 evaluation date and concluded that our past and expected future performance was consistent with our projected operating results and, therefore, it was not necessary to modify our operating projections. In addition, VRC noted that the median valuations of our publicly traded comparable companies remained relatively unchanged between April 2004 and June 2004. Given that minimal changes were made to the underlying assumptions used in the market-multiple approach, consistent with the independent valuation, we determined that the fair value of our common stock for purposes of the stock option grants in June 2004 continued to approximate $11.20 per share.
August 2004. In retrospectively determining the fair value of our common stock as of August 2004, we evaluated the events that occurred between June 2004 and August 2004. We examined our financial performance since the June 2004 evaluation date and concluded that our past and expected future performance was consistent with our projected operating results and, therefore, it was not necessary to modify our operating projections. VRC also noted that the median valuations of our comparable companies improved slightly between June 2004 and August 2004. This expansion in the multiples of our comparable companies resulted in a slight increase in our estimated enterprise value
derived under the market-multiple approach. However, during this period we completed a refinancing of our debt which resulted in a slightly higher debt balance versus the June 2004 grant date. This higher debt balance partially offset the increase in our estimated enterprise value. In addition, VRC determined that it was appropriate to increase the lack of marketability discount factor by 1.00% due primarily to an increase in the median stock price volatility of our publicly traded peers, resulting in a slight reduction in our estimated fair value. As a result of these factors, consistent with the independent valuation, we determined that the fair value of our common stock for purposes of the stock option grants in August 2004 approximated $10.80 per share.
September 2004. In retrospectively determining the fair value of our common stock as of September 2004, we evaluated the events that occurred between August 2004 and September 2004. We examined our financial performance since the August 2004 evaluation date and concluded that our past and expected future performance was consistent with our projected operating results and, therefore, it was not necessary to modify our operating projections. In addition, VRC noted that the median valuations of comparable companies improved slightly between August 2004 and September 2004. This expansion in the multiples of comparable companies resulted in a slight increase in our estimated enterprise value derived under the market-multiple approach. As a result, consistent with the independent valuation, we determined that the fair value of our common stock for purposes of the stock option grants in September 2004 approximated $11.60 per share.
October 2004. In retrospectively determining the fair value of our common stock as of October 2004, we evaluated the events that occurred between September 2004 and October 2004. We examined our financial performance since the September 2004 evaluation date and concluded that our past and expected future performance was consistent with our projected operating results and, therefore, it was not necessary to modify our operating projections. VRC also noted that the median valuations of comparable companies improved between September 2004 and October 2004, and more significantly than the increase in valuation exhibited in the August 2004 to September 2004 time period. As a result, consistent with the independent valuation, we determined that the fair value of our common stock for purposes of the stock option grants in October 2004 approximated $13.60 per share.
November 2004. In retrospectively determining the fair value of our common stock as of November 2004, we evaluated the events that occurred between October 2004 and November 2004. We examined our financial performance since the October 2004 evaluation date and concluded that our past and expected future performance was consistent with our projected operating results and, therefore, it was not necessary to modify our operating projections. VRC also noted that the median valuations of comparable companies improved slightly between October 2004 and November 2004. In addition, VRC determined that it was appropriate to decrease the lack of marketability discount factor by 1.00% due primarily to a reduction in the median stock price volatility of our publicly traded peers, resulting in a slight increase in our estimated fair value. As a result of these factors, consistent with the independent valuation, we determined that the fair value of our common stock for purposes of the stock option grants in November 2004 approximated $14.40 per share.
January 2005. In retrospectively determining the fair value of our common stock as of January 2005, we evaluated the events that occurred between November 2004 and January 2005. We examined our financial performance since the November 2004 evaluation date and concluded that our past and expected future performance was consistent with our projected operating results and, therefore, it was not necessary to modify our operating projections. VRC also noted that the median valuations of comparable companies decreased between November 2004 and January 2005. In addition, VRC determined that it was appropriate to increase the lack of marketability discount factor by 1.00% primarily due to an increase in the median stock price volatility of our group of publicly traded peers, resulting in a reduction in our estimated fair value. As a result of these factors, consistent with the
independent valuation, we determined that the fair value of our common stock for purposes of the stock option grants in January 2005 approximated $11.20 per share.
February 2005. In retrospectively determining the fair value of our common stock as of February 2005, we evaluated the events that occurred between January 2005 and February 2005. We examined our financial performance since the January 2005 evaluation date and concluded that our past and expected future performance was consistent with our projected operating results and, therefore, it was not necessary to modify our operating projections. VRC also noted that the median valuations of our comparable companies increased between January 2005 and February 2005. In addition, VRC determined that it was appropriate to increase the lack of marketability discount factor by 1.00% primarily due to an increase in the median stock price volatility of our group of comparable companies, resulting in a slight reduction in our estimated fair value. As a result of these factors, consistent with the independent valuation, we determined that the fair value of our common stock for purposes of the stock option grants in February 2005 approximated $13.20 per share.
Impact of Inflation and Changes in Prices of Raw Materials and Supplies
To date, inflation in the economy as a whole has not significantly affected our operations. However, we purchase steel at market prices, which during the past 24 monthstwo years have increased to historical highs as a result of a relatively low level of supply and a relatively high level of demand, and we have recently received notices of additional price increases from our suppliers.demand. To date, we have generally been able to pass through these price increases through price increases on our products, the assessment of steel surcharges on our customers or entry into long-term agreements with our customers which often contain escalator provisions tied to our invoiced price of steel. However, even if we are able to pass these steel surcharges or price increases to our customers, there may be a time lag of up to 12 weeks or more between the time a price increase goes into effect and our ability to implement surcharges or prices increases, particularly for orders already in our backlog. As a result, our gross margin percentage may decline, and we may not be able to implement other price increases for our products.
Competitive pressures and the terms of certain of our long-term contracts may require us to absorb at least part of these cost increases, particularly during periods of high inflation. Our principal raw material is 440c and 52100 wire and rod steel (types of stainless and chrome steel), which has historically been readily available. Recently, because of extraordinarily high demand for certain grades of steel, suppliers have in some instances allocated certain types of steel in limited quantities to customers. However, to date, we have never experienced a work stoppage due to a supply shortage. We maintain multiple sources for raw materials including steel and have various supplier agreements. Through sole-source arrangements, supplier agreements and pricing, we have been able to minimize our exposure to fluctuations in raw material prices.
Our suppliers and sources of raw materials are based in the U.S., Europe and Asia. We believe that our sources are adequate for our needs in the foreseeable future, that there exist alternative suppliers for our raw materials and that in most cases readily available alternative materials can be used for most of our raw materials.
Quantitative and Qualitative Disclosure About Market Risk
We are exposed to market risks, which arise during the normal course of business from changes in interest rates and foreign currency exchange rates.
Interest Rates. We are exposed to market risk from changes in the interest rates on a significant portion of our outstanding indebtedness. Outstanding balances under our Senior Credit Facility bear interest at a variable rate based on prime (for any day, a floating rate equal to the higher of (1) the rate publicly posted as the base rate posted by at least 75% of the nation's 30 largest banks or (2) the Federal Funds Rate plus 50 basis points per year) or LIBOR (the London inter-bank offered rate for
deposits in U.S. dollars for the applicable LIBOR Period) ranging from 30 to 120 days as adjusted each interest period. As of April 2,December 31, 2005, based on the aggregate amount of $159.2$147.6 million outstanding under our Senior Credit Facility, and the Second Lien Term Loan, as of such date, a 100 basis point change in interest rates would have changed our interest expense by approximately $1.6$1.5 million per year.
We continually evaluate our exposure On an as adjusted basis after giving effect to interest rate fluctuationsthis offering and follow established policies and procedures to implement strategies designed to manage the amountuse of variable rate indebtedness outstanding at any point in time in an effort to mitigate the effectestimated proceeds therefrom, as of interest rate fluctuations on our earnings and cash flow. On December 31, 2004, we entered into2005, a Rate Cap Transaction Agreement capping LIBOR at 5.0% on a notional amount of $50.0 million. This agreement expires on December 31, 2005.100 basis point change in interest rates would have changed our interest expense by approximately $1.3 million per year.
Interest rate fluctuations affect the fair market value of our fixed rate debt, but with respect to such fixed rate instruments, do not impact our earnings or cash flow.
Foreign Currency Exchange Rates. As a result of increased sales in Europe, our exposure to risk associated with fluctuating currency exchange rates between the U.S. dollar, the Euro and the Swiss Franc has increased. Our Swiss operations utilize the Swiss franc as the functional currency and our French operations utilize the Euro as the functional currency. Foreign currency transaction gains and losses are included in earnings. Approximately 12% of our net sales were denominated in foreign currencies for fiscal 2005 and for the nine month period ended December 31, 2005. We expect that this proportion is likely to increase as we seek to increase our penetration of foreign markets, particularly within the aerospace and defense markets. Foreign currency transaction exposure arises primarily from the transfer of foreign currency from one subsidiary to another within the group, and to foreign currency denominated trade receivables. Unrealized currency translation gains and losses are recognized upon translation of the foreign subsidiaries' balance sheets to U.S. dollars. Because our financial statements are denominated in U.S. dollars, changes in currency exchange rates between the U.S. dollar and other currencies have had, and will continue to have, an impact on our earnings. We currently do not have exchange rate hedges in place to reduce the risk of an adverse currency exchange movement. Although currency fluctuations have not had a material impact on our financial performance in the past, such fluctuations may materially affect our financial performance in the future. The impact of future exchange rate fluctuations on our results of operations cannot be accurately predicted.
Off-Balance Sheet Arrangements
We have no off-balance sheet arrangements.
RBC Bearings Incorporated
We are a well known international manufacturer and marketer of highly engineered precision plain, roller and ball bearings. Bearings, which are integral to the manufacture and operation of most machines and mechanical systems, reduce wear to moving parts, facilitate proper power transmission and reduce damage and energy loss caused by friction. While we manufacture products in all major bearing categories, we focus primarily on highly technical or regulated bearing products for specialized markets that require sophisticated design, testing and manufacturing capabilities. We believe our unique expertise has enabled us to garner leading positions in many of the product markets in which we primarily compete. We estimate that over one-fourth of our net sales are derived from products for which we are the sole supplier and the only manufacturer able to provide the required bearing solution. We believe that being the sole supplier for these products provides us with a competitive advantage due to the lengthy and rigorous certification processes and/or approvals required by a majority of these customers or government agencies, which typically take anywhere from six months to six years to complete, and due to our long track record with most of these customers of delivering high quality and uniquely designed and engineered products in a timely manner. We estimate that approximately two-thirds of our net sales during fiscal 2005 and during the nine month period ended December 31, 2005 were generated by products for which we hold the number one or two market position. We have been providing bearing solutions to our customers since 1919. Over the past ten years, under the leadership of our current management team, we have significantly broadened our end markets, products, customer base and geographic reach. We currently operate 16 manufacturing facilities in three countries.
The Bearing Industry
The bearing industry is a highly fragmented multi-billion dollar market. Purchasers of bearings include producers of commercial and military aerospace equipment, automotive and commercial truck manufacturers, industrial equipment and machinery manufacturers, agricultural machinery manufacturers and construction, mining and specialized equipment manufacturers.
Demand for bearings generally follows the market for products in which bearings are incorporated and the economy as a whole. In general, the bearing industry grew through the 1990's and peaked in 1998. A number of factors, including an economic downturn and reduced capital investment, led to a historic reduction in bearing demand between 1998 and 2002. In 2003, the industry began to experience a turnaround, with bearing shipments increasing over the previous year.
According to The Freedonia Group, Inc., demand for bearings in the U.S. is projected to increase 5.2% per year through 2008. We believe many of the end markets we serve will grow at a higher rate over the comparable period. The increased demand for bearings in the diversified industrial market is being influenced by growth in industrial machinery and equipment shipments and increasing nonresidential construction activity. In addition, increased usage of existing machinery will significantly improve aftermarket demand for replacement bearing products. In the aerospace market, aging of the existing commercial aircraft fleet along with carrier traffic growth is expected to continue to expand demand for our bearing solutions. Lastly, strong growth in the defense market is being influenced by modernization programs necessitating increased spending on new equipment, as well as continued utilization of deployed equipment supporting robust aftermarket demand for replacement bearings.
Our Competitive Strengths
We believe that for the majority of our products, the principal competitive factors affecting our business are product qualifications, product line breadth, service and price. Although some of our current and potential competitors have greater financial, marketing, personnel and other resources than
us, we believe that we are well positioned to compete with regard to each of these factors in each of the markets in which we operate.
Leading Market Positions. We compete in specialized markets where we believe we are often the only supplier with the manufacturing expertise, business plan and engineering resources required to provide the required bearing solution. We estimate that approximately two-thirds of our net sales during fiscal 2005 and during the nine month period ended December 31, 2005 were generated by products for which we hold the number one or two market position. Most of our products undergo lengthy and rigorous customer certification processes and/or approvals, while our aerospace and defense products generally require additional FAA and military certification, respectively. We often participate in our customers' product design and/or certification process which typically takes anywhere from six months to six years to complete, and, in many cases, our bearings are the only products that are certified for use with the product. This is evidenced by our strong customer relationships, many of which are greater than 20 years.
Diversified Revenue Base. We sell a wide array of bearing products to customers across many diverse end markets, each of which is influenced by different fundamental economic factors. Our products are sold both to OEMs and to aftermarket distributors and service providers. In addition, we currently sell our products to more than 6,1006,700 customers, and no single customer represented more than 5%6% of our net sales during fiscal 2005 and the nine month period ended December 31, 2005. Our diversified revenue base mitigates the impact of any single product or customer on our financial performance.
Large Installed Product Base with Recurring Aftermarket Revenue Stream. We provide bearings to a large and growing number of applications for which our products have been tested and certified. Our bearing products are approved for over 32,000 applications, many of which are part of aerospace, defense and industrial platforms that can be in service for as long as several decades, thereby requiring continuing aftermarket support. Many of our products are critical to the performance of the equipment in which they are installed but represent a small percentage of the ongoing maintenance expense of the equipment. Aftermarket sales of replacement parts for existing equipment platforms represented approximately 56% of our net sales for fiscal 2005. We believe we are well positioned to continue to capture recurring revenue from these product lines in the future due to the high customer switching costs and our high service levels associated with most of the equipment in which our products are installed.
Proprietary Design and Manufacturing Capabilities. We believe that our bearing engineering and manufacturing expertise, including our dedicated team of engineers and proprietary manufacturing capabilities, positions us to provide high quality, innovative solutions to our targeted markets in a timely way. We also believe that our design and manufacturing capabilities will allow us to maintain a leadership position as our customers continue to rely on us to develop new bearing solutions that can be manufactured cost effectively. However, our strength in this area is dependent upon our ability to continue to attract and retain skilled engineers, and many of our competitors have more resources than us to devote to human and technology development.
Disciplined Acquisition Program with History of Successful Integration. We have demonstrated expertise in acquiring and integrating bearing and precision-engineered component manufacturers that have complementary products or distribution channels and provide significant potential for margin enhancement. We have consistently increased the profitability of acquired businesses through a process of methods and systems improvement coupled with the introduction of complementary and proprietary new products. Since October 1992 we have completed 1213 acquisitions which have significantly broadened our end markets, products, customer base and geographic reach. However,Most recently, in September 2005, we may find it difficult to identify complementary businesses at attractive pricesacquired the Southwest Products Company, a manufacturer of spherical bearings,
journal bearings and may not be able to successfully integrate any businesses that we do acquire.push-pull controls for military weapon systems and military and commercial aerospace applications.
Experienced Management Team. Our management team possesses extensive managerial experience in the bearing industry, with our top five operating executives averaging over 20 years of bearing industry experience. We intend to retain and attract experienced professionals by leveraging our reputation as a premier provider of precision bearing solutions. However, we cannot assure you that we will be successful in attracting and retaining top management in the future as many of our competitors have more resources than us.
Our Growth Strategy
We intend to grow our business while continuing to focus on specialized markets for highly engineered bearing solutions. Key elements of our growth strategy include:
Continue to Develop Innovative Bearing Solutions. We intend to leverage our design and manufacturing expertise and our extensive customer relationships to continue to develop new products for markets where we believe there are substantial growth opportunities. We analyze new product opportunities carefully by taking into account projected market prices and volumes and expected manufacturing costs, only pursuing new product lines that we believe will achieve our gross margin targets. Recent examples of our new product and process innovation include lightweight aircraft structural components that integrate bearing products for the Airbus series of aircraft, corrosion resistant materials for aircraft bearings and patented new designs that improve the service performance of cam followers for the oil and gas, packaging and material handling industries. Our ability to develop new custom engineered products strengthens existing customer relationships and creates new business opportunities for us.
Expand Customer Base and Penetrate End Markets. We continually seek opportunities to penetrate new customers, geographic locations and bearing platforms with existing products or profitable new product opportunities. For example, we have been expanding our sales to foreign aerospace manufacturers and foreign defense manufacturers that support the U.S. government. In addition, in the last three years we have added sales support in the following 9 locations: Chicago, the greater New York City area, Syracuse, Charlotte, Dallas/Forth Worth, Detroit, Southern California, Montreal, Canada and Paris, France and have been able to increase aftermarket sales in these regions. We currently have sales offices in over 10 other U.S. cities as well as other international locations such as Aachen, Germany, Cheltenham, England and Delemont, Switzerland. We intend to continue to expand our sales force, customer base and end markets and have identified a number of attractive growth opportunities domestically and abroad, including current projects in semiconductor machinery, airframe controls and missile guidance systems. In addition, our OEM relationships, coupled with our design expertise, provide us with extensive cross-selling opportunities on platforms that we do not currently supply.
Increase Aftermarket Sales. Aftermarket sales accounted for approximately 56% of our net sales for fiscal 2005. Such sales included both sales to third party distributors and a portion of our sales to OEMs for replacement bearings. We intend to increase the percentage of our revenues derived from the replacement market by continuing to implement several initiatives. First, we will continue to seek opportunities to increase our sales to key existing distributors as well as expand our base of third party customers. Second, our new product and new end market initiatives are focused on high-growth platforms, such as 300 millimeter semiconductor manufacturing systems and the U.S. government's Joint Strike Fighter program that we expect will be in service for long periods and therefore create significant demand for replacement parts. Additionally, we will seek opportunities to develop new products that can be used as replacement parts for existing platforms. For example, we have been approved recently to supply replacement bearings on the U.S. Navy's fleet of Harrier aircraft. We
believe that increasing our aftermarket sales of replacement parts will further enhance the continuity and predictability of our revenues and increase our profitability.
Pursue Selective Acquisitions. We believe that there will continue to be consolidation within the bearing industry that may present us with acquisition opportunities, particularly within the industrial and aerospace markets. This consolidation is being driven by an ongoing trend among OEMs to utilize fewer suppliers in order to simplify procurement, increase manufacturing efficiency and reduce costs; and, because we are one of the more well known and established suppliers of high quality specialty bearing products, it is a trend that has often worked in our favor. We regularly evaluate opportunities, some of which may be material, to acquire bearing and precision-engineered component manufacturers which have complementary products, customers or distribution channels, provide significant potential for margin enhancement and further expand the breadth of our product portfolio.
Customers and Markets
We serve a broad range of end markets where we can add value with our specialty, precision bearing products and applications. We classify our customers into threetwo principal categories: diversified industrial and aerospace and defense. These principal end markets utilize a large number of both commercial and specialized bearing products. Although we provide a relatively small percentage of total bearing products supplied to each of our overall principal markets, we believe we have leading market positions in many of the specialized bearing product markets in which we primarily compete.
We manufacture bearing products for a wide range of diversified industrial markets, including construction and mining, oil and natural resource extraction, heavy truck, packaging and semiconductor machinery. Nearly all mechanical devices and machinery require bearings to relieve friction where one part moves relative to another. Our products target existing market applications in which our engineering and manufacturing capabilities provide us with a competitive advantage in the marketplace.
Our largest diversified industrial customers include Applied Materials, Caterpillar, Chicago Rawhide, Eaton, Hitachi Construction Machinery, Parker-Hannifin Corporation and various aftermarket distributors including Applied Industrial, Motion Industries and McMaster Carr. We believe that the diversification of our sales among the various markets of the industrial bearings market reduces our exposure to downturns in any individual market. We believe opportunities exist for growth and margin improvement in this market as a result of increasing demand for industrial machinery, the introduction of new products and the expansion of aftermarket sales.
Aerospace Applications
We supply bearings for use in commercial and private aircraft. We supply bearings for many of the commercial aircraft currently operating worldwide and are the primary supplier for many of our product lines. This includes military contractors for airplanes, helicopters and missile systems. Commercial aerospace customers generally require precision products, often of special materials, made to unique designs and specifications. Many of our aerospace bearing products are designed and certified during the original development of the aircraft being served, which often makes us the primary bearing supplier for the life of the aircraft.
Our largest aerospace customers include Airbus, Boeing, General Electric, Lockheed Martin, Raytheon, Rolls Royce, Pratt and Whitney and various aftermarket channels. We estimate that over 60% of commercial aerospace net sales are actually used as replacement parts, as bearings are regularly replaced on aircraft in conjunction with routine maintenance procedures. We believe our strong relationships with OEMs help drive our aftermarket sales since a portion of OEM sales are ultimately
intended for use as replacement parts. We believe that growth and margin expansion in this segment will be driven primarily by expanding our international presence and the refurbishment and maintenance of existing commercial aircraft.
Defense Market (8% of fiscal 2005 net sales)Applications
We manufacture bearing products used by the U.S. Department of Defense and certain foreign governments for use in fighter jets, troop transports, naval vessels, helicopters, gas turbine engines, armored vehicles, guided weaponry and satellites. We manufacture an extensive line of standard products that conform to many domestic military application requirements, as well as customized products designed for unique applications. We specialize in the manufacture of high precision ball and roller bearings, commercial ball bearings and metal-to-metal and self-lubricating plain bearings for the defense market. Our bearing products are manufactured to conform to U.S. military specifications and are typically custom designed during the original product design phase, which often makes us the sole or primary bearing supplier for the life of the product. In addition to products that meet military specifications, these customers often require precision products made of specialized materials to custom designs and specifications. Product approval for use on military equipment is often a lengthy process ranging from six months to six years.
Our largest defense customers include the U.S. Department of Defense and all branches of the U.S. military. Sales consist primarily of replacement bearings on programs for which we are the sole-source supplier. We believe that our current installed base of bearing products and our sophisticated engineering and manufacturing capabilities position us to benefit from growing replacement part demand caused by increased equipment utilization as well as the introduction of new weapons and transport systems. Appropriations for maintenance and repairs for product platforms serviced by us have generally remained relatively stable, even during periods where defense spending was in relative decline, such as the early to mid-1990s. With increased government spending on defense, demands for the repair and maintenance of the product platforms serviced by us have strengthened in the past year.
We have long-term supply agreements that serve to establish the scope of the supply arrangements with many of our larger customers. The primary purpose of these agreements is to allow the customer to secure favorable pricing and capacity while providing us with the opportunity to effectively plan production. The majority of these agreements are for three year terms, however longer terms are occasionally agreed upon. Typically, large OEM customers are in the three-year category while defense contractors and their programs are likely to involve longer terms. These agreements generally establish the price (typically including material escalation), the product being supplied, the term of the agreement, minimum quantities and general terms and conditions. However, shipments are based solely upon the purchase orders placed by the customer under the long-term supply agreement. No single customer represented more than 5%6% of our net sales in fiscal 2005 and the nine month period ended December 31, 2005.
Products
Bearings are employed to fulfill several functions including reduction of friction, transfer of motion and carriage of loads. We design, manufacture and market a broad portfolio of bearing products. The following table provides a summary of our product segments:
| Segment | FY 2005 Sales | Representative Applications | |||||
|---|---|---|---|---|---|---|---|
| Plain Bearings | $ | 93,250 | • | Aircraft engine controls and landing gear | |||
| (38%) | • | Helicopter rotors and missile launchers | |||||
| • | Mining and construction equipment | ||||||
| Roller Bearings | $ | 92,281 | • | Aircraft hydraulics | |||
| (38%) | • | Military and commercial truck chassis | |||||
| • | Packaging machinery and gear pumps | ||||||
| Ball Bearings | $ | 41,881 | • | Radar and night vision systems | |||
| (17%) | • | Airframe control and actuation | |||||
| • | Semiconductor equipment | ||||||
| Other | $ | 15,604 | • | Precision ground ball screws for robotic handling and | |||
| (7%) | missile guidance | ||||||
| • | Collets for machine tools | ||||||
| Segment | Net Sales for the Nine Month Period Ended December 31, 2005 | Representative Applications | ||
|---|---|---|---|---|
| Plain Bearings | $82,078 | • Aircraft engine controls and landing gear | ||
| (41%) | • Helicopter rotors and missile launchers | |||
| • Mining and construction equipment | ||||
| Roller Bearings | $71,193 | • Aircraft hydraulics | ||
| (36%) | • Military and commercial truck chassis | |||
| • Packaging machinery and gear pumps | ||||
| Ball Bearings | $33,239 | • Radar and night vision systems | ||
| (17%) | • Airframe control and actuation | |||
| • Semiconductor equipment | ||||
| Other | $12,248 (6%) | • Precision ground ball screws for robotic handling and missile guidance | ||
| • Collets for machine tools | ||||
Plain Bearings. Plain bearings are primarily used to rectify inevitable misalignments in various mechanical components, such as aircraft controls, helicopter rotors, or in heavy mining and construction equipment. Such misalignments are either due to machining inaccuracies or result when components change position relative to each other. Plain bearings are produced with either self-lubricating or metal-to-metal designs and consist of several sub-classes, including rod end bearings, spherical plain bearings and journal bearings. Sales of plain bearings accounted for 38% of our net sales in fiscal 2005 and 41% of our net sales for the nine month period ended December 31, 2005.
Roller Bearings. Roller bearings are anti-friction products that utilize cylindrical rolling elements. We produce three main designs: tapered roller bearings, needle roller bearings and needle bearing track rollers and cam followers. We produce medium sized tapered roller bearings used primarily in heavy truck axle applications. We offer several needle roller bearing designs that are used in both
industrial applications and certain U.S. military aircraft platforms. These products are generally specified for use where there are high loads and the design is constrained by space considerations. A significant portion of the sales of this product is to the aftermarket. Needle bearing track rollers and cam followers have wide and diversified use in the industrial market and are often prescribed as a primary component in articulated aircraft wings. We believe we are the world's largest producer of aircraft needle bearing track rollers. The sale of roller bearings accounted for 38% of our net sales in fiscal 2005 and 36% of our net sales for the nine month period ended December 31, 2005.
Ball Bearings. Ball bearings are devices which utilize high precision ball elements to reduce friction in high speed applications. We specialize in four main types of ball bearings: high precision aerospace, airframe control, thin section and industrial ball bearings. High precision aerospace bearings are primarily sold to customers in the defense industry that require more technically sophisticated bearing products, such as missile guidance systems, providing higher degrees of fault tolerance given the criticality of the applications in which they are used. Airframe control ball bearings are precision ball bearings that are plated to resist corrosion and are qualified under a military specification. Thin section ball bearings are specialized bearings that use extremely thin cross sections and give specialized machinery manufacturers many advantages. We produce a general line of industrial ball bearings sold
primarily to the aftermarket. Ball bearings accounted for 17% of our net sales in fiscal 2005 and 17% of our net sales for the nine month period ended December 31, 2005.
Other. Our other products consist primarily of precision linear precision products and machine tool collets. Linear products are precision ground ball bearing screws that offer repeatable positioning accuracy in defense, machine tools, robotic handling and semiconductor equipment. We also have several application development programs for linear precision products in progress in guided missile, unmanned aircraft, and "smart bomb" applications. Machine tool collets are cone-shaped metal sleeves, used for holding circular or rodlike pieces in a lathe or other machine, that provide effective part holding and accurate part location during machining operations. Our other products accounted for approximately 7% of our net sales in fiscal 2005 and 6% of our net sales for the nine month period ended December 31, 2005.
Product Design and Development
We produce specialized bearings which are often tailored to the specifications of a customer or application. Our sales professionals are highly experienced engineers who collaborate with our customers on a continual basis to develop bearing solutions. The product development cycle can follow many paths which are dependent on the end market or channel. The process normally takes between 3-6 years from concept to sale depending upon the application and the market. A common route that is used for major OEM projects begins when our design engineers meet with their customer counterparts at the machine design conceptualization stage and work with them through the conclusion of the product development.
Often, at the early stage, a bearing design concept is produced that addresses the expected demands of the application. Environmental demands are many but normally include load, stress, heat, thermal gradients, vibration, lubricant supply, corrosion resistance, with one or two of these environmental constraints being predominant in the design consideration. A bearing design must perform reliably for a period of time specified by the customer's product objectives.
Once a bearing is designed, a mathematical simulation is created to replicate the expected application environment and thus allow optimization with respect to these design variables. Upon conclusion of the design and simulation phase, samples are produced and laboratory testing commences at one of our test laboratories. The purpose of this testing phase is not only to verify the design and the simulation model but also to allow further design improvement where needed. Finally, upon successful field testing by the customer, the product is ready for sale.
For the majority of our products, the culmination of this lengthy process is the receipt of a product approval or certification, generally obtained from either the OEM, the Department of Defense or the FAA which allows us to supply the product to the customer. We currently have in excess of 32,000 such
approvals, which often gives us a significant competitive advantage, and in many of these instances we are the only approved supplier of a given bearing product.
Manufacturing and Operations
Our manufacturing strategies are focused on product reliability, quality and service. Custom and standard products are produced according to manufacturing schedules that ensure maximum availability of popular items for immediate sale while carefully considering the economies of lot production and special products. Capital programs and manufacturing methods development are focused on quality improvement and low production costs. A monthly review of product line production performance assures an environment of continuous attainment of profitability goals.
Capacity. Our plants currently run on a single shift, and light second and third shifts at selected locations, to meet the demands of our customers. We believe that current capacity levels and future
annual estimated capital expenditures on equipment up to approximately 4% of net sales should permit us to effectively meet demand levels for the foreseeable future. We also believe that we have the ability to increase capacity and move to full second or third shifts when required.
Inventory Management. Our increasing emphasis on the distributor/aftermarket sector has required us to maintain greater inventories of a broader range of products than the OEM market historically demanded. We operate an inventory management program designed to balance customer delivery requirements with economically optimal inventory levels. In this program, each product is categorized based on characteristics including order frequency, number of customers and sales volume. Using this classification system, our primary goal is to maintain a sufficient supply of standard items while minimizing warehousing costs. In addition, production cost savings are achieved by optimizing plant scheduling around inventory levels and customer delivery requirements. This leads to more efficient utilization of manufacturing facilities and minimizes plant production changes while maintaining sufficient inventories to service customer needs.
Sales, Marketing and Distribution
Our marketing strategy is aimed at increasing sales within our threetwo primary markets, targeting specific applications in which we can exploit our competitive strengths. To effect this strategy, we seek to expand into geographic areas not previously served by us and we continue to capitalize on new markets and industries for existing and new products. We employ a technically proficient sales force and utilize marketing managers, product managers, customer service representatives and product application engineers in our selling efforts.
We have accelerated the development of our sales force through the hiring of sales personnel with prior bearing industry experience, complemented by an in-house training program. We intend to continue to hire and develop expert sales professionals and strategically locate them to implement our expansion strategy. Today, our direct sales force is located to service North America, Europe and Latin America and is responsible for selling all of our products. This selling model leverages our relationship with key customers and provides opportunities to market multiple product lines to both established and potential customers. We also sell our products through a well-established, global network of industrial and aerospace distributors. This channel primarily provides our products to smaller OEM customers and the end users of bearings that require local inventory and service. In addition, specific larger OEM customers are also serviced through this channel to facilitate requirements for "Just In Time" deliveries or "Kan Ban" systems. Our worldwide distributor network provides our customers with more than 1,500 points of sale for our products. We intend to continue to focus on building distributor sales volume.
The sale of our products is supported by a well-trained and experienced customer service organization. This organization provides customers with instant access to key information regarding their bearing purchase and delivery requirements. We also provide customers with updated information
through our web site, and we have developed on-line integration with specific customers, enabling more efficient ordering and timely order fulfillment for those customers.
We store product inventory in four company-owned and operated warehouses located on the East and West coasts of the U.S., and in France and Switzerland. The inventory is located in these warehouses based on thorough analysis of customer demand to provide superior service and product availability to our customers.
Competition
Our principal competitors include Kaydon Corporation, New Hampshire Ball Bearings and McGill Manufacturing Company, Inc., although we compete with different companies for each of our product lines. We believe that for the majority of our products, the principal competitive factors affecting our
business are product qualifications, product line breadth, service and price. Although some of our current and potential competitors may have greater financial, marketing, personnel and other resources than us, we believe that we are well positioned to compete with regard to each of these factors in each of the markets in which we operate.
Product Qualifications. Many of the products we produce are qualified for the application by the OEM, the U.S. Department of Defense, the FAA or a combination of these agencies. These credentials have been achieved for thousands of distinct items after years of design, testing and improvement. In many cases patent protection presides, in all cases there is strong brand identity and in numerous cases we have the exclusive product for the application.
Product Line Breadth. Our products encompass an extraordinarily broad range of designs which often create a critical mass of complementary bearings and components for our markets. This position allows many of our industrial and aircraft customers the ability for a single manufacturer to provide the engineering service and product breadth needed to achieve a series of OEM design objectives or aftermarket requirements. This ability enhances our value to the OEM considerably while strengthening our overall market position.
Service. Product design, performance, reliability, availability, quality, technical and administrative support are elements that define the service standard for this business. Our customers are sophisticated and demanding, as our products are fundamental and enabling components to the construction or operating of their machinery. We maintain inventory levels of our most popular items for immediate sale and service well over 15,000 voice and electronic contacts per month. Our customers have high expectations regarding product availability, and the primary emphasis of our service efforts is to ensure the widest possible range of available products and delivering them on a timely basis.
Price. We believe our products are priced competitively in the markets we serve. We continually evaluate our manufacturing and other operations to maximize efficiencies in order to reduce costs, eliminate unprofitable products from our portfolio and maximize our profit margins. While we compete with larger bearing manufacturers who direct the majority of their business activities, investments and expertise toward the automotive industries, our sales in this industry are only a small percentage of our business. We invest considerable effort to develop our price to value algorithms and we price to market levels where required by competitive pressures.
Suppliers and Raw Materials
We obtain raw materials, component parts and supplies from a variety of sources and generally from more than one supplier. Our principal raw material is steel. Our suppliers and sources of raw materials are based in the U.S., Europe and Asia. We purchase steel at market prices, which during the past 24 monthstwo years have increased to historical highs as a result of a relatively low level of supply and a relatively high level of demand, and we have recently received notices of additional price increases from our suppliers.demand. To date, we have generally managed to pass through these raw material price
increases to our customers by assessing steel surcharges on, or price increases of, our bearing products. However, we have from time to time experienced a time lag of up to 12 weeks or more in our ability to pass through steel surcharges to our customers which has negatively impacted our gross margins. We will continue to pass on raw material price increases as competitive conditions allow.
Recently becauseBecause of extraordinarily high demand for certain grades of steel, suppliers have in some instances allocated certain types of steel in limited quantities to customers. However, to date, we have never experienced a work stoppage due to a supply shortage. We believe that our sources for raw materials, including steel, are adequate for our needs in the foreseeable future, that there exist alternative suppliers for our raw materials and that in most cases readily available alternative materials can be used for most of our raw materials. However, we cannot provide any assurances of the
availability or the prices thereof. We do not believe that the loss of any one supplier would have a material adverse effect on our financial condition or results of operations.
We have not been significantly impacted by recent increases in energy prices because energy costs, the most significant component of which is natural gas used in heat treating operations, represent less than 4% of our overall costs.
Backlog
As of April 2,December 31, 2005, we had an order backlog of $134.8$152.6 million, as compared to a backlog of $102.4$133.8 million atfor the end of fiscal 2004.same period in the prior year. The amount of backlog includes orders which we estimate will be fulfilled within the next 12 months; however, orders included in our backlog are subject to cancellation, delay or other modifications by our customers prior to fulfillment. We sell many of our products pursuant to contractual agreements, single source relationships or long-term purchase orders, each of which may permit early termination by the customer. However, due to the nature of many of the products supplied by us and the lack of availability of alternative suppliers to meet the demands of such customers' orders in a timely manner, we believe that it is not practical or prudent for most of our customers to shift their bearing business to other suppliers.
Employees
We had approximately 1,1841,224 hourly employees and 501525 salaried employees as of April 2,December 31, 2005, of whom 260261 were employed in our European and Mexican operations. As of December 31, 2005, approximately 903 of our hourly employees, or 74%, were non-unionized. We believe that our employee relations are satisfactory.
We are subject to several collective bargaining agreements covering unionized workers, as follows:
AsOn February 28, 2006, our RBC Nice Bearings, Inc. subsidiary and the United Steelworkers of April 2, 2005, approximately 837America (AFL-CIO) Local 6816-12 entered into a shutdown agreement in connection with our decision to close operations at our Kulpsville, Pennsylvania facility. In connection with the shutdown agreement, the union has agreed to take no action against us in connection with such shutdown. The agreement also addresses closure and other transition issues related to pensions, workers compensation, adjustment assistance and other matters. The production conducted at the Nice facility will be moved to other RBC locations, and we anticipate no material impact on production or our ability to service our customers. We expect that such closure will not materially impact our results of our hourly employees,operations or 71%, were non-unionized.financial condition.
Intellectual Property
We own U.S. and foreign patents and trademark registrations and U.S. copyright registrations, and have U.S. trademark and patent applications pending. We currently have approximately 1015 U.S. patents and patent applications and a few foreign patents. We file patent applications and maintain patents to
protect certain technology, inventions and improvements that are important to the development of our business, and we file trademark applications and maintain trademark registrations to protect product names that have achieved brand-name recognition among our customers. We also rely upon trade secrets, know-how and continuing technological innovation to develop and maintain our competitive
position. We believe our trade-secrets, know-how, innovations and product approvals are significantly more important to the success of our business and ability to maintain our competitive position than our patents. Many of our brands are well recognized by our customers and are considered valuable assets of our business. We currently have approximately 4060 U.S. trademark registrations and applications and a significant number of foreign trademark registrations. We do not believe, however, that any individual item of intellectual property is material to our business. See "Risk Factors."
Regulation
Product Approvals. Essential to servicing the aerospace market is the ability to obtain product approvals. We have in excess of 32,000 product approvals, which enable us to provide products used in virtually all domestic aircraft platforms presently in production or operation. Product approvals are typically issued by the FAA to designated OEMs who are Production Approval Holders of FAA approved aircraft. These Production Approval Holders provide quality control oversight and generally limit the number of suppliers directly servicing the commercial aerospace aftermarket. Regulations enacted by the FAA provide for an independent process (the Parts Manufacturer Approval, or PMA, process), which enables suppliers who currently sell their products to the Production Approval Holders, to sell products to the aftermarket. We have received over 2,400 PMA approvals to date and have approximately 633 active PMA applications in process. The costs of obtaining required product approvals are not directly tracked, but are included in our manufacturing overhead and SG&A costs. We do not directly pass these costs on to our customers, but they are reflected indirectly in our overall product pricing.
With respect to military government contracts, and in accordance with 10 U.S.C. 2534, current DoD regulations (the Department of Defense Federal Acquisition Regulation Supplement, also known as the "DFARS") contain a domestic source preference for ball and roller bearings and bearing components that are manufactured in the United States or Canada. In general, these regulations prohibit the DoD, with limited exceptions, from procuring ball and roller bearings and bearing components unless they are manufactured in the U.S. or Canada. The DoD has only a limited authority to waive this prohibition. This prohibition, however, does not apply to contracts or subcontracts for commercial items, except for when commercial ball and roller bearings are being acquired as end items. It also does not apply to ball and roller bearings manufactured in the U.K. This current domestic source preference is set to expire in October 2005. We do not know whether Congress will take any action to extend this preference beyond this period.
We are subject to various other federal laws, regulations and standards. Although we are not presently aware of any pending legal or regulatory changes that may have a material impact on us, new laws, regulations or standards or changes to existing laws, regulations or standards could subject us to significant additional costs of compliance or liabilities, and could result in material reductions to our results of operations, cash flow or revenues.
Environmental Matters
We are subject to federal, state and local environmental laws and regulations, including those governing discharges of pollutants into the air and water, the storage, handling and disposal of wastes and the health and safety of employees. We also may be liable under the Comprehensive Environmental Response, Compensation, and Liability Act or similar state laws for the costs of investigation and clean-up of contamination at facilities currently or formerly owned or operated by us, or at other facilities at which we have disposed of hazardous substances. In connection with such contamination, we may also be liable for natural resource damages, government penalties and claims by
third parties for personal injury and property damage. Agencies responsible for enforcing these laws have authority to impose significant civil or criminal penalties for non-compliance. We believe we are currently in material compliance with all applicable requirements of environmental laws. We do not anticipate material capital expenditures for environmental controls in fiscal 2006.
Investigation and remediation of contamination is ongoing at some of our sites. In particular, state agencies have been overseeing groundwater monitoring activities at our facilities in Hartsville, South Carolina and Fairfield, Connecticut. At Hartsville, we are monitoring low levels of contaminants in the groundwater caused by former operations. The state will permit us to cease monitoring activities after two consecutive sampling periods demonstrate contaminants are below action levels. In connection with the purchase of our Fairfield, Connecticut facility in 1996, we agreed to assume responsibility for completing clean-up efforts previously initiated by the prior owner. We submitted data to the state that we believe demonstrates that no further remedial action is necessary although the state may require additional clean-up or monitoring. Although there can be no assurance, we do not expect any of those to be material.
We received notice in 2003 from the U.S. EPA that we had been named a potentially responsiblede minimisparty for past disposal of hazardous substances at the Operating Industries, Inc.'s landfill in Monterey, California. Any such disposal would have been conducted prior to our ownership, and we notified the former owners of a potential claim for indemnification pursuant to the terms of our asset purchase agreements. We are currently negotiating ade minimissettlement with the U.S. EPA and expect that any settlement, even if we are unsuccessful in obtaining indemnification, will not be material to our results of operations or to our business.
Properties
Our principal executive offices are located at One Tribology Center, Oxford, Connecticut 06478. We also use this facility for manufacturing our plain bearing products, both Teflon® lined and metal-to-metal, and commercial ball bearings.
In addition, we own facilities in Hartsville, South Carolina; Fairfield, Connecticut; Kulpsville, Pennsylvania; Rancho Dominguez, California; Santa Ana, California; Walterboro, South Carolina; Bremen, Indiana; and Scionzier Cedex, France, as well as a small parcel of real property in Oxford, Connecticut which may be used for expansion of our manufacturing operations at that location. On February 15, 2006, we entered into a Purchase & Sale Agreement for the Kulpsville, Pennsylvania facility with the closing scheduled for March 30, 2006. We also have leases in effect with respect to facilities in the following locations until the following dates: West Trenton, New Jersey, February 10, 2009; Oxford, Connecticut, September 30, 2014; Torrington, Connecticut, December 22, 2006; Plymouth, Indiana, May 15, 2022; Glasgow, Kentucky, June 30, 2005;2010; Delemont, Switzerland, December 31, 2009; Reynosa, Tamaulipas, Mexico, September 20, 2005;2010 plus an expansion lease that is expected to commence its five year term on July 15, 2006; Oklahoma City, Oklahoma, December 31, 2008, Les Ulis Cedex, France, July 1, 2010, and2010; Chatsworth, California, November 11, 2006.2006, and Irwindale, California August 31, 2010.
We believe that our existing property, facilities and equipment are generally in good condition, are well maintained and adequate to carry on our current operations. We also believe that our existing manufacturing facilities have sufficient capacity to meet increased customer demand. Substantially all of our owned domestic properties and most of our other assets are subject to a lien securing our obligations under our Senior Credit Facility and Second Lien Term Loan.Facility.
Legal Proceedings
From time to time, we are involved in litigation and administrative proceedings which arise in the ordinary course of our business. We do not believe that any litigation or proceeding in which we are currently involved, either individually or in the aggregate, is likely to have a material adverse effect on our business, financial condition, operating results, cash flow or prospects.
The following table sets forth certain information concerning our directors and executive officers. Each director is elected for a one-year term or until such person's successor is duly elected and qualified.
| Name | Age | Positions | ||
|---|---|---|---|---|
Dr. Michael J. Hartnett | 60 | Chairman, President and Chief Executive Officer | ||
Daniel A. Bergeron | 46 | Vice President and Chief Financial Officer | ||
Phillip H. Beausoleil | General Manager, ITB and TDC | |||
Thomas C. Crainer | 48 | General Manager, Heim, RBC-API and Schaublin SA | ||
Richard J. Edwards | 50 | Vice President and General Manager, RBC Divisions | ||
Robert Anderson | Director | |||
Richard R. Crowell | Director | |||
Dr. Amir Faghri | 54 | Director | ||
William P. Killian | 70 | Director | ||
Alan B. Levine | 62 | Director | ||
| Dr. Thomas J. O'Brien | 58 | Director | ||
| Michael Stone | Director |
Dr. Michael J. Hartnett has been the President and Chief Executive Officer since April 1992 and Chairman of the board of directors since June 1993. Prior to that, Dr. Hartnett served as Vice President and General Manager of our Industrial Tectonics Bearings Corporation, or ITB, subsidiary from 1990, following eighteen years at The Torrington Company, one of the three largest bearings manufacturers in the U.S. While at Torrington Company, Dr. Hartnett held the position of Vice President and General Manager of the Aerospace Business Unit and was, prior to that, Vice President of the Research and Development Division. Dr. Hartnett holds an undergraduate degree from University of New Haven, a Masters degree from Worcester Polytechnic Institute and a Ph.D. in Applied Mechanics from the University of Connecticut. Dr. Hartnett has also developed numerous patents, authored more than two dozen technical papers and is well known for his contributions to the field of tribology, the study of friction. Dr. Hartnett currently serves as a director of Aftermarket Technology Corp., a publicly-held company in the business of re-manufacturing aftermarket components for automobiles.
Daniel A. Bergeron joined us in May 2003 as Vice President, Finance. On August 5, 2003, he was appointed Vice President and Chief Financial Officer. From November 2002 through May 2003, he served as Vice President and Chief Financial Officer of Allied Healthcare International, Inc., a publicly-held provider of healthcare staffing services. Mr. Bergeron served as Vice President and Chief Financial Officer at Paragon Networks International, Inc., a telecommunications company, from June 2000 to October 2002. From April 1998 to February 2000, he served as Vice President and Chief Financial Officer of Tridex Corporation, a publicly-held software company. From July 1987 to March 1998, Mr. Bergeron held various financial reporting positions with Dorr-Oliver Inc., an international engineering and manufacturing company, including Vice President and Chief Financial Officer from 1994 to March 1998. Mr. Bergeron holds a B.S. in Finance from Northeastern University and a M.B.A. from the University of New Haven.
Phillip H. Beausoleil spent three years as Plant Manager for the SKF Kulpsville, Pennsylvania facility before joining us in 1993 as Plant Manager of the Santa Ana, California division, Transport Dynamics. In 1995, the general manager responsibilities at Industrial Tectonics Bearings, or ITB, in California were given to Mr. Beausoleil. He also spent 23 years at New Hampshire Ball Bearing, the last five years as General Manager of its Astro Division.
Thomas C. Crainer joined us in 1986 as Plant Manager at the ITB division in California and was promoted to General Manager in 1995. In 2000, Mr. Crainer became General Manager for RBC Schaublin. In 2003, he returned to the U.S. to assume additional responsibilities for our Heim Bearings, Engineered Component and Aircraft Products facilities. He had previously been employed for six years at TRW Bearing in Falconer, NY as Manufacturing Supervisor, Production Control Manager and Manufacturing Manager. His undergraduate degree in Business Administration is from St. Bonaventure University. In 1991 he received an M.B.A. from the University of Phoenix.
Richard J. Edwards joined us as Manufacturing Manager for the Hartsville, South Carolina facility in 1990. After holding the positions of Plant Manager for the Hartsville Plant, and Director of Operations for the RBC Divisions, he was named Vice President and General Manager for the RBC Divisions in 1996. Prior to joining us, Mr. Edwards spent six years with the Torrington Company as Materials Manager, and later Plant Superintendent in the Tyger River plant. He holds a Bachelor of Science degree in Management from Arizona State University.
Robert Anderson has been a director since June 1998. Mr. Anderson has served as Chairman Emeritus of Rockwell Corporation since February 1990. He also serves as a director of Aftermarket Technology Corporation and is a member of the Caltech Board of Trustees and a graduate of the Anderson School of the University of California, Los Angeles.
Richard R. Crowell has been a director since June 2002. Mr. Crowell is a Managing Partner of Aurora Capital Group, a private equity investment firm. Prior to establishing Aurora in 1991, Mr. Crowell was a Managing Partner of Acadia Partners, a New York-based investment fund. From 1983 to 1987, he was a Managing Director, Corporate Finance for Drexel Burnham Lambert. He serves on the board of directors of several private companies including Impaxx, Inc., Tartan Textile Services, Inc., Anthony Inc. and ADCO Global, Inc. Mr. Crowell earned a B.A. from the University of California, Santa Cruz and an M.B.A. from the Anderson School of the University of California, Los Angeles.
Dr. Amir Faghri has been a director since July 2004. Dr. Faghri is presently the Dean of the School of Engineering of the University of Connecticut. He joined the university in 1994 as Head of the Mechanical Engineering Department. Dr. Faghri is published extensively in the area of heat transfer and is the sole inventor of six U.S. patents. He has been a consultant for several major research centers, including Los Alamos, Oak Ridge National Laboratories and Intel Corporation. He is a Fellow of ASME. He received a B.S. from Oregon State University and an M.S. and a Ph.D. from the University of California, Berkeley.
William P. Killian has been a director since October 2001. Mr. Killian has reported directly to and advised CEOs of Fortune 500, NYSE corporations on strategy, corporate growth, acquisitions and divestitures for 25 years. From 1986 until his retirement in 2000, Mr. Killian was Corporate Vice President, Development and Strategy for Johnson Controls, Inc. a $20 billion global market leader in automotive systems and facility management and controls. Currently, he serves as a member of the board of directors of Aqua-Chem, Inc. and Premix, Inc. Mr. Killian holds a Bachelor of Chemical Engineering from Georgia Tech and a Master of Engineering Administration from the University of Utah.
Alan B. Levine has been a director and chairman of our audit committee since October 2005. Mr. Levine served as Chief Financial Officer and Director of Virtual Access Networks, Inc. (2001 to 2002) and Chief Financial Officer and Treasurer of Marathon Technologies Corporation (1998 to 2001). He was also a member of the Board of Directors and Audit Committee Chair of MCK Communications before the company's merger in November 2003. Prior to this, Mr. Levine was with Ernst & Young, LLP from 1974 to 1998, and was Partner from 1986 to 1998, where he established and directed the firm's Entrepreneurial Services practice. Today, Mr. Levine leads ABL Associates, a consulting practice dedicated to helping entrepreneurial companies identify and implement strategic initiatives and manage change. He is also a Director on the Board of Nextera Enterprises, a public
company based in Boston, where he serves as Audit Committee Chair. Mr. Levine earned a Bachelor of Arts degree from the University of Vermont. He also holds a Master of Accounting degree from the University of Arizona and is a certified public accountant.
Dr. Thomas J. O'Brien has been a director and audit committee member since February 2006. Dr. O'Brien has served as the Head of the Finance Department at the University of Connecticut since 1999 and as a professor at the University since 1986. Prior to this, Dr. O'Brien held positions at the University of North Carolina—Chapel Hill, Duke University, University of North Carolina—Charlotte and Florida State University. In addition to Dr. O'Brien's distinguished career as a professor, he has also written several books and has co-authored numerous papers and articles covering topics in finance. Dr. O'Brien earned a Bachelor of Arts degree in Economics from Davidson College. He received his MBA from the University of Pennsylvania and holds a Ph.D in Finance from the University of Florida.
Michael Stone has been a director since April 2002. Mr. Stone is a Managing Partner of Whitney. He has been with Whitney since 1989 and has been a senior investor in each of Whitney's outside equity funds. Previously, he was with Bain & Company where he worked with manufacturing and pharmaceutical clients and Bain Capital-owned entities. He received a B.A. from Duke University and a M.B.A. from Harvard Business School. Mr. Stone is a director of several private companies.
Board of Directors
Our board of directors will consistconsists of up to 9 members. We currently have 68 members on our board of directors. A majority of our board of directors are independent. Our directors are elected by our stockholders at aneach annual meeting. Nominees for director are designated by the then constituted board of directors, and stockholders vote on whether each nominee should be elected as a director.
Upon the completion of this offering, our Our board of directors will beis divided into three classes serving staggered three-year terms.terms: Class I consists of Robert Anderson and Michael Stone, Class II consists of William P. Killian, Richard R. Crowell and Alan B. Levine and Class III consists of Dr. Michael J. Hartnett, Dr. Thomas J. O'Brien and Dr. Amir Faghri. Class I, Class II and Class III directors will serve until our annual meetings of stockholders in 2006, 2007 and 2008, respectively. The members of each class of directors will be designated at the time of the consummation of the Pre-Offering Transactions. At each annual meeting of stockholders, directors will be elected to succeed the class of directors whose terms have expired. This classification of our board of directors could have the effect of increasing the length of time necessary to change the composition of a majority of our board of directors. In general, at least two annual meetings of stockholders will be necessary for stockholders to effect a change in a majority of the members of our board of directors. We expect to add an additional board member to serve as an independent financial expert on our audit committee prior to the completion of this offering.
Committees of Our Board of Directors
The standing committees of our board of directors consist of an audit committee, a compensation committee and a corporate governance and nominating committee. Mr. StoneLevine, Dr. Faghri and Dr. HartnettO'Brien currently serve on our audit committee, Messrs. Crowell, Anderson and Killian serve on our compensation committee and Mr. Stone,Levine, Dr. HartnettO'Brien and Dr. Faghri serve on our corporate governance and nominating committee. Within one year of the consummation of this offering, allAll the members of our audit, compensation and corporate governance and nominating and audit committees will beare "independent" as defined by applicable Nasdaq rules. One member of our audit committee will be independent upon consummation of this offering and accordingly one of our current independent directors will be added to our audit committee on or prior to closing, and two members will be independent within 90 days after consummation of this offering.
Audit Committee
The principal duties and responsibilities of our audit committee are as follows:
The audit committee has the power to investigate any matter brought to its attention within the scope of its duties. It also has the authority to retain counsel and advisors to fulfill its responsibilities and duties. We intend to comply with future audit committee requirements as they become applicable to us.
Compensation Committee
The principal duties and responsibilities of our compensation committee are as follows:
Each member of our compensation committee will be an "outside" director as that term is defined in 162(m) of the Internal Revenue Code of 1986, as amended, and a "non-employee" director within the meaning of Rule 16b-3 of the rules under the Securities Exchange Act of 1934.
Corporate Governance and Nominating Committee
The principal duties and responsibilities of our corporate governance and nominating committee are as follows:
Compensation of Directors
IndependentEffective in fiscal 2007, independent members of our board of directors are paid $20,000$50,000 per year, payable quarterly, and are entitled to annual stock option grants at the discretion of the compensation committee of the board of directors for their services. In addition, we expect to revise our compensation policy to provideprovides for payments for service on any board committee and reimbursementsreimbursement for reasonable out-of-pocket expenses incurred in connection with attendance at board meetings or of any committee thereof.
Code of Ethics
Our board of directors has adopted a code of business conduct and ethics applicable to our directors, officers and employees.
Corporate Governance Guidelines
To help discharge its responsibilities, our board of directors will adopthas adopted corporate governance guidelines in accordance with applicable Nasdaq National Market listing standards on significant corporate governance issues prior to the consummation of this offering.issues. These guidelines address such matters as director independence, committee membership and structure, meetings and executive sessions, director selection, retirement and training, among other things.
Limitation on Directors' Liability and Indemnification
Our amended and restated certificate of incorporation will limitlimits the liability of directors to the maximum extent permitted by Delaware law. Delaware law provides that directors of a corporation will not be personally liable for monetary damages for breach of their fiduciary duties as directors, except liability for:
The limitation of liability does not apply to liabilities arising under the federal securities laws and does not affect the availability of equitable remedies such as injunctive relief or rescission.
Our restated certificate of incorporation provides that we will indemnify our directors and officers and may indemnify our employees and other agents to the fullest extent permitted by law. We believe that indemnification under our restated certificate of incorporation covers at least negligence and gross negligence on the part of indemnified parties. Our restated certificate of incorporation also permits us to secure insurance on behalf of any officer, director, employee or other agent for any liability arising out of his or her actions in his or her capacity as an officer, director, employee or other agent.
The limited liability and indemnification provisions in our restated certificate of incorporation may discourage stockholders from bringing a lawsuit against our directors for breach of their fiduciary duty
and may reduce the likelihood of derivative litigation against our directors and officers, even though a derivative action, if successful, might otherwise benefit us and our stockholders. A stockholder's investment in us may be adversely affected to the extent we pay the costs of settlement or damage awards against our directors and officers under these indemnification provisions.
At present, there is no pending litigation or proceeding involving any of our directors, officers or employees in which indemnification is sought, nor are we aware of any threatened litigation that may result in claims for indemnification.
Insofar as indemnification for liabilities arising under the Securities Act may be permitted for directors, officers and controlling persons of us pursuant to the foregoing provisions or otherwise, we have been advised that in the opinion of the Securities and Exchange Commission, or SEC, such indemnification is against public policy as expressed in the Securities Act and is, therefore, unenforceable.
Executive Compensation
The following table sets forth the cash and other compensation paid by us in fiscal 2005, 2004 and 2003 to Dr. Hartnett, our Chairman, President and Chief Executive Officer, and our next four most highly paid executive officers, or the Named Executive Officers.
| | | Annual Compensation | Long-Term Compensation Awards | | |||||||||||||
|---|---|---|---|---|---|---|---|---|---|---|---|---|---|---|---|---|---|
| Name and Principal Position | Fiscal Year | Bonus | Other Annual Compensation | Securities Underlying Options/SARs | All Other Compensation | ||||||||||||
| Dr. Michael J. Hartnett Chairman, President & Chief Executive Officer | 2005 2004 2003 | $ | 591,744 560,442 521,924 | $ | 578,817 481,757 66,547 | $ | 9,211 8,685 11,832 | (b) (b) (b) | — — — | $ | 15,000 15,000 — | (g) (g) | |||||
Phillip H. Beausoleil General Manager, ITB and TDC | 2005 2004 2003 | 206,970 204,269 189,371 | 100,000 50,000 45,000 | — — — | 25,000 — 12,500 | (f) (f) | 7,147 7,605 7,854 | (h) (h) (h) | |||||||||
Daniel A. Bergeron Vice President and Chief Financial Officer | 2005 2004 2003 | 189,000 152,769 — | 40,000 — — | 6,000 6,000 — | (c) (c) | 25,000 — — | (f) | 4,500 — — | (i) | ||||||||
Thomas C. Crainer General Manager, Heim, RBC-API and Schaublin SA | 2005 2004 2003 | 185,000 211,835 224,228 | 42,096 — 37,000 | 12,311 5,702 | (d) (d) (d) | — — 12,500 | (f) | 5,329 5,708 5,329 | (j) (j) (j) | ||||||||
Richard J. Edwards Vice President and General Manager, RBC Divisions | 2005 2004 2003 | 207,741 202,448 172,917 | 30,000 35,000 30,000 | 10,261 12,800 9,573 | (e) (e) (e) | — 25,000 12,500 | (f) (f) | 3,750 — 3,750 | (k) (k) | ||||||||
Option Grants in Last Fiscal Year
The following table provides information with respect to stock options granted to our named executive officers during fiscal 2005:
| | Individual Grants | Potential Realizable Value At Assumed Annual Rates of Stock Price Appreciation for Option Term(b) | Individual Grants | | | | ||||||||||||||||||||||||||||||
|---|---|---|---|---|---|---|---|---|---|---|---|---|---|---|---|---|---|---|---|---|---|---|---|---|---|---|---|---|---|---|---|---|---|---|---|---|
| | Number of Securities Underlying Options/SARs Granted | % of Total Options Granted to Employees in 2005 | | | Number of Securities Underlying Options/SARs Granted | % of Total Options Granted to Employees in 2005(a) | | | Potential Realizable Value At Assumed Annual Rates of Stock Price Appreciation for Option Term(b) | |||||||||||||||||||||||||||
| Name | Exercise or Base Price per Share | | Exercise or Base Price per Share | Expiration Date | ||||||||||||||||||||||||||||||||
| % of Total Options Granted to Employees in 2005 | Expiration Date | 0% | 5% | 10% | % of Total Options Granted to Employees in 2005(a) | 0% | 5% | 10% | ||||||||||||||||||||||||||||
| Daniel A. Bergeron | 25,000 | 13.9 | % | $ | 8.00 | April 4, 2014 | $ | 175,000 | $ | 410,835 | $ | 772,653 | 25,000 | 13.9 | % | $ | 8.00 | April 4, 2014 | $ | 162,500 | $ | 390,174 | $ | 740,232 | ||||||||||||
| Phillip H. Beausoleil | 25,000 | 13.9 | % | $ | 8.00 | April 4, 2014 | 175,000 | 410,835 | 772,653 | 25,000 | 13.9 | % | 8.00 | April 4, 2014 | 162,500 | 390,174 | 740,232 | |||||||||||||||||||
Aggregated Stock Option Exercises in Last Fiscal Year and Fiscal Year-end Option Values
The following table sets forth the number of exercisable and unexercisable options and warrants held by each of the Named Executive Officers as of April 2, 2005. None of our common stock was acquired during fiscal 2005 upon the exercise of stock options and warrants by the Named Executive Officers.
Fiscal Year-End Option and Warrant Values
| | Number of Securities Underlying Unexercised Options and Warrants at Fiscal Year-End | Value of Unexercised In-the-Money Options and Warrants at Fiscal Year-End(a) | Number of Securities Underlying Unexercised Options and Warrants at Fiscal Year-End | Value of Unexercised In-the-Money Options and Warrants at Fiscal Year-End(a) | ||||||||||||||||
|---|---|---|---|---|---|---|---|---|---|---|---|---|---|---|---|---|---|---|---|---|
| Name | ||||||||||||||||||||
| Exercisable | Unexercisable | Exercisable | Unexercisable | Exercisable | Unexercisable | Exercisable | Unexercisable | |||||||||||||
| Dr. Michael J. Hartnett(b) | 1,812,658 | — | $ | 25,907,669 | $ | — | ||||||||||||||
| Dr. Michael J. Hartnett(b) | 1,812,658 | — | $ | 25,001,340 | $ | — | ||||||||||||||
| Daniel A. Bergeron | 16,500 | 8,500 | 115,500 | 59,500 | 16,500 | 8,500 | 107,250 | 55,250 | ||||||||||||
| Phillip H. Beausoleil | 87,625 | 8,500 | 967,425 | 59,500 | 87,625 | 8,500 | 923,613 | 55,250 | ||||||||||||
| Richard J. Edwards | 193,800 | — | 2,452,980 | — | 193,800 | — | 2,356,080 | — | ||||||||||||
| Thomas C. Crainer | 58,100 | — | 661,760 | — | 58,100 | — | 632,710 | — | ||||||||||||
ThereAs of April 2, 2005, there was no public market for any of our common stock underlying the options and warrants reflected on the table.
Securities Authorized for Issuance Under Equity Compensation Plans
The following table summarizes information about securities authorized for issuance under our equity compensation plans and other agreements as of April 2, 2005:
| | | | (c) | |||||||||||
|---|---|---|---|---|---|---|---|---|---|---|---|---|---|---|
| | (a) | (b) | Number of Securities Remaining Available for Future Issuance Under Equity Compensation Plans (Excluding Securities Reflected in Column (a)) | |||||||||||
| Plan Category | Number of Securities to be Issued Upon Exercise of Outstanding Options and Warrants | Weighted Average Exercise Price of Outstanding Options and Warrants | (a) Number of Securities to be Issued Upon Exercise of Outstanding Options and Warrants | (b) Weighted Average Exercise Price of Outstanding Options and Warrants | (c) Number of Securities Remaining Available for Future Issuance Under Equity Compensation Plans (Excluding Securities Reflected in Column (a)) | |||||||||
Equity compensation plans approved by security holders | 303,492 | $ | 11.32 | 842,183 | 303,492 | $ | 11.32 | 842,183 | ||||||
Equity compensation plans not approved by security holders | 1,463,068 | $ | 0.71 | — | 1,463,068 | $ | 0.71 | — | ||||||
Total | 1,766,560 | $ | 2.53 | 842,183 | 1,766,560 | $ | 2.53 | 842,183 | ||||||
Stock Option Plans
1998 Stock Option Plan
Effective February 18, 1998, we adopted the RBC Bearings Incorporated (f/k/a Roller Bearing Holding Company, Inc.) 1998 Stock Option Plan. The terms of the 1998 option plan provide for the grant of options to purchase up to 8,413,900 shares of Class A common stock to officers and employees of, and consultants (including members of the board of directors) to us and our subsidiaries. Options granted may be either incentive stock options (under Section 422 of the Internal Revenue Code) or non-qualified stock options. The 1998 option plan, which expires on December 31, 2008, is to be governed by our board of directors or a committee to which the board delegates its responsibilities. As of April 2, 2005, there were outstanding options to purchase 464,425252,375 shares of Class A common stock granted under the 1998 option plan, all of which were exercisable. The 1998 Stock Option Plan will behas been frozen and no additional stock options will be awarded pursuant to the plan.
The exercise price of options granted under the 1998 option plan shall bewas determined by our board of directors, but in no event less than 100% of the Fair Market Value (as defined in the 1998 option plan) of the Class A common stock on the date of grant. Options granted under the 1998 option plan may be exercised during the period set forth in the agreement pursuant to which the options are granted, but in no event more than ten years following grant.
The number of shares of Class A common stock for which options may be granted under the 1998 option plan shall be increased, andStock Option Plan provides that the number of shares for which outstanding options shall be exercisable, and the exercise price thereof, shall be adjusted upon the happening of stock dividends, stock splits, recapitalizations and certain other capital events regarding our company or the Class A common stock. Upon any merger, consolidation or combination where shares of Class A common stock are converted into cash, securities or other property, outstanding options shall be converted into the right to receive upon exercise the consideration as would have been payable in exchange for the shares of Class A common stock underlying such options had such options been exercised prior to such event. The number and kind of shares holders of options will be entitled to receive will be adjusted in accordance with the terms of the plan in connection with the Pre-Offering Transactions consummated prior to this offering. See "Related Party Transactions—Pre-Offering Transactions."
Options granted under the 1998 option plan are not transferable by the holders thereof except by the laws of descent and distribution. Our board of directors has the right to establish such rules and regulations concerning the 1998 option plan and to make such determinations and interpretations of the terms thereof as it deems necessary or advisable.
2001 Stock Option Plan
The RBC Bearings Incorporated (f/k/a Roller Bearing Holding Company, Inc.) 2001 Stock Option Plan was adopted in fiscal 2002 and amended and restated on October 24, 2003. The terms of the 2001 option plan provide for the grant of options to purchase up to 1,008,553 shares of Class A common stock to our officers and employees of, and consultants (including members of our board of directors) to, us and our subsidiaries selected by the CEO to participate in the plan. Options granted may be either incentive stock options (under Section 422 of the Internal Revenue Code) or non-qualified stock options. The 2001 option plan, which expires in July 2011, is to be governed our board of directors or a committee to which the board of directors delegates its responsibilities. As of April 2, 2005, there were outstanding options to purchase 465,992466,741 shares of Class A common stock granted under the 2001 option plan, 319,325333,741 of which were exercisable. Upon consummation of this offering, theThe 2001 Stock Option Plan will behas been frozen and no additional stock options will be awarded pursuant to the plan.
The exercise price of options granted under the 2001 option plan shall bewas determined by the board of directors, but in no event less than 100% of the Fair Market Value (as defined in the 2001 option plan) of the Class A common stock on the date of grant. Options granted under the 2001 option plan may be exercised during the period set forth in the agreement pursuant to which the options are granted, but in no event more than ten years following grant.
The 2001 Stock Option Plan provides that the number of shares of Class A common stock for which options may be granted under the plan are to be increased, and the number of shares for which outstanding options shall be exercisable, and the exercise price thereof, shall be adjusted upon the happening of stock dividends, stock splits, recapitalizations and certain other capital events regarding our Company or the Class A common stock. Upon any merger, consolidation or combination where shares of Class A common stock are converted into cash securities or other property, outstanding options shall be converted into the right to receive upon exercise the consideration as would have been payable in exchange for the shares of Class A common stock underlying such options had such options been exercised prior to such event. The number and kind of shares holders of options will be entitled to receive will be adjusted in accordance with the terms of the plan in connection with our Pre-Offering Transactions consummated prior to this offering. See "Related Party Transactions—Pre-Offering Transactions."
Options granted under the 2001 option plan are not transferable by the holders thereof except (1) by the laws of descent and distribution, (2) transfers to members of any holder's immediate family (which for purposes of the 2001 option plan shall be limited to the participant's children, grandchildren and spouse), (3) to one or more trusts for the benefit of such family members, or (4) to partnerships or limited liability companies in which such family members and/or trusts are the only partners or members; provided, that options may be transferred pursuant to sections (2) through (4) hereof only if the option expressly so provides, or as otherwise approved by the CEO or the board of directors in their discretion. Our board of directors has the right to establish such rules and regulations concerning the 2001 option plan and to make such determinations and interpretations of the terms thereof as it deems necessary or advisable.
2005 Long-Term Incentive Plan
We will adoptadopted our 2005 Long-Term Incentive Plan effective upon the completion of this offering.our initial public offering in August 2005. The plan provides for grants of stock options, stock appreciation rights, restricted stock and performance awards. Our directors, officers and other employees and persons who engage in services for us are eligible for grants under the plan. The purpose of the plan is to provide these individuals with incentives to maximize stockholder value and otherwise contribute to our success and to enable us to attract, retain and reward the best available persons for positions of responsibility.
1,139,170 shares of our common stock will bewere authorized for issuance under the plan, subject to adjustment in the event of a reorganization, stock split, merger or similar change in our corporate structure or the outstanding shares of common stock. Of this amount, 683,502 options will bewere awarded to Dr. Hartnett at the time of thisour initial public offering in August 2005 at the offering price of $14.50 per share and the remainder will behave been reserved for grants to our employees (other than Dr. Hartnett) at the discretion of our compensation committee. In connection with this offering, we will not be granting anyWe may grant shares of restricted stock.stock to our
employees and directors in the future under the plan. Our compensation committee will administer the plan. Our board also has the authority to administer the plan and to take all actions that the compensation committee is otherwise authorized to take under the plan. The terms and conditions of each award made under the plan, including vesting requirements, will be set forth consistent with the plan in a written agreement with the grantee.
Stock Options. Under the plan, the compensation committee or the board may award grants of incentive stock options and other non-qualified stock options. The compensation committee also has the authority to grant options that will become fully vested and exercisable automatically upon a change in control. The compensation committee may not, however, award to any one person in any calendar year options to purchase common stock equal to more than 10% of the total number of shares authorized under the plan (other than the initial award to Dr. Hartnett discussed above), and it may not award incentive options first exercisable in any calendar year whose underlying shares have a fair market value greater than $100,000 determined at the time of grant.
The compensation committee will determine the exercise price and term of any option in its discretion, however, the exercise price may not be less than 100% of the fair market value of a share of common stock on the date of grant. In the case of any incentive stock option, the option must be exercised within 10 years of the date of grant. The exercise price of an incentive option awarded to a person who owns stock constituting more than 10% of our voting power may not be less than 110% of such fair market value on such date and the option must be exercised within five years of the date of grant.
Restricted Stock. Under the plan, the compensation committee may award restricted stock subject to the conditions and restrictions, and for the duration that it determines in its discretion.
Stock Appreciation Rights. Provided that our common stock is traded on an established securities market, theThe compensation committee may grant stock appreciation rights, or SARs, subject to the terms and conditions contained in the plan. Under the plan, the exercise price of an SAR must equal the fair market value of a share of our common stock on the date the SAR was granted. Upon exercise of a SAR, the grantee will receive an amount in shares of our common stock equal to the difference between the fair market value of a share of common stock on the date of exercise and the exercise price of the SAR, multiplied by the number of shares as to which the SAR is exercised.
Performance Awards. The compensation committee may grant performance awards contingent upon achievement by the grantee or by us, of set goals and objectives regarding specified performance criteria, over a specified performance cycle. Awards may include specific dollar-value target awards, performance units, the value of which is established at the time of grant, and/or performance shares, the value of which is equal to the fair market value of a share of common stock on the date of grant. The value of a performance award may be fixed or fluctuate on the basis of specified performance criteria. A performance award may be paid out in cash and/or shares of common stock or other securities.
Amendment and Termination of the Plan. The board may amend or terminate the plan in its discretion, except that no amendment will become effective without prior approval of our stockholders if such approval is necessary for continued compliance with the performance-based compensation exception of Section 162(m) of the Internal Revenue Code or any stock exchange listing requirements.
If not previously terminated by the board, the plan will terminate on the tenth anniversary of its adoption.
On March 29, 2006, we accelerated vesting with respect to all outstanding options under our existing stock option plans. Such acceleration was approved by our board of directors. See "Management's Discussion and Analysis of Financial Condition and Results of Operations—Critical Accounting Policies—Stock-Based Compensation."
401(k) Plan
We maintain the Roller Bearing Company of America 401(k) Retirement Plan, or the 401(k) Plan, a plan established pursuant to Section 401(k) of the Internal Revenue Code, for the benefit of our non-union employees. All non-union employees who have completed six months of service with us are entitled to participate. Subject to various limits, employees are entitled to defer up to 25% of their annual salary on a pre-tax basis and up to an additional 10% of their annual salary on an after-tax basis. We previously matched 50% of an employee's pre-tax contribution up to 10% of annual salary. Effective October 1, 2001, we suspended matching contributions to the 401(k) Plan. Employees vest in our contributions ratably over three years.
Effective April 3, 2004, we resumed matching contributions to our 401(k) Plan at a rate of 25% of an employee's pre-tax contribution up to 4% of annual salary. We also maintain a smaller 401(k) plan for non-union employees at our Miller bearing facility. We also maintain three 401(k) plans for our union employees. Subject to various limits, union employees are entitled to defer up to 25% of their annual salary on a pre-tax basis. We make employer contributions (matching and, in some cases, non-elective contributions) based on requirements in applicable collective bargaining agreements.
Supplemental Retirement Plan
Effective September 1, 1996, we adopted a non-qualified supplemental retirement plan, or SERP, for a select group of highly compensated and management employees designated by our board of directors. The SERP allows eligible employees to elect to defer until termination of their employment the receipt of up to 25% of their current salary. We make contributions equal to the lesser of 50% of the deferrals or 3.5% of the employee's annual salary, which vest in full after three years of service following the effective date of the SERP. Accounts are paid, either in a lump sum or installments, upon retirement, death or termination of employment. Accounts are generally payable from our general assets although it is intended that we set aside in a "rabbi trust" invested in annuity contracts amounts necessary to pay benefits. Employees' rights to receive payments are subject to the rights of our creditors.
Compensation Committee Interlocks and Insider Participation
The current compensation of our executive officers, other than our Chief Executive Officer's, which was determined in accordance with his employment agreement with us, was determined by our Chief Executive Officer in consultations with our board of directors. Our compensation committee was formed on November 9, 2004, which has undertaken responsibility for oversight with respect to executive compensation issues. See "Management—Committees of our Board of Directors—Compensation Committee." No member of our compensation committee will serve as a member of the board of directors or compensation committee of an entity that has one or more executive officers serving as a member of our board of directors or compensation committee.
Dr. Hartnett Employment Agreement
On December 18, 2000,July 1, 2005, we entered into ana new employment agreement with Dr. Hartnett. Under the terms of the employment agreement, Dr. Hartnett was employed as our Chief Executive Officer. The term of Dr. Hartnett's employment agreement is set to expire on December 17, 2005. We expect to enter into an amended or new employment agreement on substantially similar terms to the current agreement described below.July 1, 2010.
Dr. Hartnett's current agreement providedprovides for a base salary for the fiscal year ended April 2, 20052006 of $591,744.$556,896 before giving effect to a one-time reduction of $180,000 for nine-months in fiscal 2006 described below. Dr. Hartnett's base salary is subject to an automatic annual increase effective December 1 of each year during the term in a percentage amount equal to the greater of (i) five percent (5%) or (ii) the percentage change in the consumer price index for the prior year. Dr. Hartnett is also entitled to an annual performance bonus with respect to each fiscal year during which he remains an employee in an
amount determined as a percentage of Dr. Hartnett's base salary, based on the amount by which our performance exceeds (or fails to meet) EBITDA targets in an operating plan. We expect that Dr. Hartnett's employment agreement will behas been amended in the first half of fiscal 2006 to effectuate the terms of a settlement agreement which, among other things, provides for a one-time special bonus of $5.2 million, a reduction of Dr. Hartnett's base salary in fiscal 2006 by $180,000 and for the payment to Dr. Hartnett of a special cash bonus in the amount of $45,000 for each of fiscal years 2007 through 2010. The settlement agreement also provides for a one-time special bonus of $5.2 million and a one-time reduction in his base salary of $180,000 for nine-months in fiscal 2006. See "Related Party Transactions—Dr. Hartnett Settlement Bonus."
The employment agreement also contains non-competition provisions prohibiting Dr. Hartnett from competing against us during the term of the employment agreement and for two years thereafter without our prior written consent. Dr. Hartnett is also entitled to certain additional benefits (beyond those generally available to our employees) including medical and hospitalization insurance and additional life insurance. We are also required to maintain an apartment in Los Angeles for use by Dr. Hartnett while on business.
Except as described below, since March 29, 2001, we have not been a party to, nor have we currently proposed, any transaction or series of similar transactions in which the amount exceeds $60,000, and in which any director, executive officer, holder of more than 5% of our common stock or any member of the immediate family of any of the foregoing persons had or will have a direct or indirect material interest, other than compensation agreements and other agreements, which are described in the "Management" section of this prospectus. We believe that each of the following transactions, other than the loans to our executives, are on terms no less favorable than we could obtain from an unrelated third party.
Set forth below is a summary of certain agreements and arrangements, as well as other transactions between us and related parties which have taken place during our most recent fiscal year or agreements with respect to transactions entered into in our prior fiscal years among related parties and other material agreements which remain in effect as of April 2, 2005.
Sale of Class B Exchangeable Convertible Participating Preferred Stock
On July 29, 2002, Dr. Hartnett purchased 10,000 shares and Whitney Investor, through an affiliate, purchased 230,000 shares of Class B Exchangeable Convertible Participating Preferred Stock of RBCI in exchange for gross proceeds of $24.0 million, referred to as the 2002 Class B Sale. In connection with the purchase, we paid a closing fee of $750,000, plus fees and expenses of approximately $50,000 in connection with its investment in us, to Whitney, and we amended the terms of our management services agreement with Whitney. Following the closing of the sale, we utilized the proceeds from the sale and certain of our cash on hand to repurchase approximately $30.4 million in principal amount at maturity of our 13% Senior Subordinated Discount Debentures.senior subordinated discount debentures. This repurchase satisfied our obligation to make a scheduled redemption payment relating to such debt in December 2002. For more information on Whitney Investor's beneficial ownership of our equity securities, see "Principal and Selling Stockholders."
The holders of our Class B preferred stock arewere entitled to an 8% per annum accumulating dividend and arewere further entitled to participate in any dividends paid to the holders of shares of our common stock. The Class B preferred stock iswas subject to conversion by us or exchange by the holders thereof. In either situation, each share of Class B preferred stock would yield a number of shares of our Class A common stock determined by reference to a formula set forth in our Amendedthen existing amended and Restated Certificaterestated certificate of Incorporationincorporation (which includesincluded anti-dilution protections), a number of shares of our Class C redeemable preferred stock also determined by reference to a formula set forth in our then existing amended and restated certificate of incorporation and one share of Class D preferred stock. Any holders of Class C preferred stock would behave been entitled to an 8% per annum accumulating dividend. The Class C preferred stock iswas subject to redemption by us at our option but iswas not subject to mandatory redemption. The Class D preferred stock entitlesentitled the holders thereof, upon liquidation, to a payment determined by reference to a formula set forth in our then existing amended and restated certificate of incorporation.
Dr. Hartnett Loan
In connection with a recapitalization which took place in May of 1997, we loaned Dr. Hartnett, our President and Chief Executive Officer, $500,000 to purchase shares of our capital stock. The loan doesdid not bear interest and is due on the earlier of (i) June 23, 2007, (ii) the consummation of a sale of our company or (iii) the consummation of an initial public offering by us. The loan iswas secured by a pledge of Dr. Hartnett's shares of RBCI to us. TheThis loan will bewas repaid in full prior toupon the consummation of this offering.our initial public offering in August 2005.
Dr. Hartnett Settlement Bonus
Letter Agreement
On June 17, 2005 we entered into a Letter Agreement among us, Dr. Hartnett and Whitney which approved the terms of certain pre-offering transactions concurrent with our initial public offering,
including the Pre-Offering Transactions, includingamendment and restatement of our certificate of incorporation, the termination of the Whitney Management Services Agreement upon consummation of thisour initial public offering, the freezing of our existing stock option plans and the approval of our 2005 Long-Term Incentive Plan, and the terms of a Settlement Bonus (as described below) between us and Dr. Hartnett.
Dr. Hartnett Settlement Bonus
Subject to the approval of our senior lenders under our Senior Credit Facility and Second Lien Term Loan, we haveWe agreed to pay Dr. Hartnett a one-time special cash bonus of $5.2 million in the first half of fiscal 2006 to reimburse Dr. Hartnett for taxes owed by him in connection with a previous stock sale by Dr. Hartnett to Whitney. We will be required to taketook a charge equal to approximately $5.2 million in the first halfsecond quarter of 2006. In connection with such transaction, we expect towill receive offsetting cash tax benefits equal to approximately $5.2 million and, accordingly, this transaction is expected toshould be cash neutral to us. Additionally, in connection with such arrangement, Dr. Hartnett's salary iswas reduced by $180,000 for nine-months in fiscal 2006 to compensate us for interest expense to be incurred by us as a result of timing differences between the payment of the $5.2 million to Dr. Hartnett and the offsetting tax benefits. We have also agreed to pay Dr. Hartnett a special cash bonus of $45,000 in each of the fiscal years 2007 through 2010. We and Dr. Hartnett have agreed to make any required amendments to Dr. Hartnett's employment agreement to effectuate this arrangement.
Amended and Restated Stockholders Agreement; Registration Rights
On February 6, 2003, in connection with an investment in us by Dr. Hartnett and Whitney V, L.P., or Whitney V, we entered into an Amended and Restated Stockholders'Stockholders Agreement with Dr. Hartnett, Hartnett Family Investments, L.P., or the Hartnett Partnership, Whitney V and the Whitney Investor. We will amendamended this agreement upon the consummation of our initial public offering to make modifications in order to eliminate provisions related to transfer restrictions, information and observer rights and provisions with respect to seats on our board of directors. We expect that Whitney Investor will have information and observer rights upon the completion of this offering. The stockholders'stockholders agreement also containscontained provisions with respect to registration rights thatrights. The stockholders agreement will remain in place after this offering is consummated. However, we will make other modifications and amendments as a result of thebe terminated upon consummation of the Pre-Offering Transactions. The principal terms of this agreement include:offering.
Piggyback Registration. Whenever we propose to register a public offering of our common stock, upon any request by Dr. Hartnett or Whitney Investor, we are required to include their shares in the offering, subject to customary cutback provisions.
Demand Registration. Commencing on the earlier of (1) 6 months after an effective date of an initial public offering of our common stock and (2) February 6, 2006, the holders of the majority of shares owned by Whitney Investor or permitted transferees shall have the right, on two occasions, to demand that we prepare and file with the Securities and Exchange Commission a registration statement to permit the public offering of the shares owned by those parties demanding such registration. This right will be made subject to a lock-up agreement between Whitney Investor and our underwriters in connection with this offering which will prevent Whitney Investor from exercising this right until the applicable lock-up period of 180 days has either expired or been waived.
We will bear all registration expenses, except underwriting discounts and selling commissions, incurred in connection with the registrations described above. We have agreed with Dr. Hartnett and Whitney Investor (or their permitted transferees) to indemnify each other against certain liabilities, including liabilities under federal and state securities laws.
Class A Preferred Stock Transaction
In February 2003, we raised capital from Dr. Hartnett and Whitney V, an affiliate of Whitney Investor. On February 6, 2003, Dr. Hartnett and Whitney V bought an aggregate of 1,008.41 shares of our Class A preferred stock for $3$3,000 per share, or an aggregate purchase price of approximately $3.0 million. The Class A preferred stock was the most senior of our capital stock in terms of liquidation preference and was entitled to an accrued dividend at 8% per annum. In connection with the sale of the Class A preferred stock, we paid to Whitney closing fees in the amount of $200,000, and reimbursed Whitney for expenses of approximately $35,000 incurred in connection with the purchase. Pursuant to the terms of the Purchase Agreement for the Class A preferred stock, on February 10, 2003, we exercised our option to repurchase such stock for the purchase price plus all accrued dividends. Accordingly, no Class A preferred stock iswas outstanding as of the date hereof.after February 10, 2003. The purpose of this transaction was to provide an infusion to our equity capital and to the equity capital of our subsidiary RBCA in order to cure defaults of certain covenants contained in our credit agreement and in the indentures governing our Discount Debenturesthen outstanding senior subordinated discount debentures and previously outstanding RBCA notes.notes of RBCA. These defaults resulted from RBCA having made certain restricted payments in the fourth quarter of 2002 at a time when it technically was not permitted to do so. Such payments included (1) advances in the amounts of $519,000 and $450,000 that RBCA made to our subsidiary, Schaublin Holding, on December 10, 2002 and December 13, 2002, respectively, in connection with an acquisition by Schaublin of Myonic, and (2) a dividend in the amount of approximately $2.5 million that RBCA made to us on December 13, 2003 for purposes of financing an interest payment due on our Discount Debentures. As a result of the equity infusion, the defaults described above were cured or waived. This transaction was unanimously approved by the disinterested
members of our board of directors and the terms thereof were unanimously determined by such board of directors to have been no less favorable to us than those that could be obtained on the date thereof in arm's-length dealings with a person who was not an affiliate of ours.
Amended and Restated Management Services Agreement
On July 29, 2002, in connection with the investment in us by Dr. Hartnett and an affiliate of Whitney Investor, we entered into an Amended and Restated Management Services Agreement with Whitney. Pursuant to the agreement, Whitney provides us certain services in exchange for an annual advisory fee of approximately $500,000 (subject to reduction upon the occurrence of specified circumstances). In addition, on July 29, 2002 we paid Whitney a one-time fee of approximately $750,000 as a closing fee in connection with Whitney's investment in our Class B preferred stock, plus fees and expenses of approximately $50,000 in connection with its investment in us. Pursuant to the agreement, Whitney agreed to provide and has from time to time provided services which include, but are not limited to, general management consulting services, identification, support, negotiation and analysis of potential acquisitions and dispositions, monitoring compliance with financing agreements, strategic planning including evaluating major strategic alternatives. This agreement will bewas terminated upon consummation of thisour initial public offering on terms agreeable to Whitney and us.in August 2005.
Pre-Offering Transactions Consummated in Connection with Our Initial Public Offering
As of April 2, 2005, prior to giving effect to our 5-for-2 stock split, there were 2,481,007 shares of our Class A common stock and 100 shares of our Class B common stock outstanding. Additionally, as of such date and prior to giving effect to our 5-for-2 stock split, there were outstanding (1) warrants and options to purchase up to an additional 764,494 shares of our Class A common stock, (2) warrants and options to purchase 549,146 shares of our Class B common stock, and (3) 240,000 shares of our Class B exchangeable convertible participating preferred stock, or Class B preferred stock, which waswere convertible into shares of Class A common stock, Class C preferred stock and Class D preferred stock. Dr. Hartnett owned all of our Class B common stock, options and warrants to purchase Class B
common stock, as well as 10,000 shares of our Class B preferred stock. Dr. Hartnett's shares of Class B common stock entitled him majority voting control with respect to our capital stock. The balance of 230,000 shares of Class B preferred stock was held by Whitney Investor.
The following transactions referred to as the Pre-Offering Transactions, will occur immediatelyoccurred prior to the completion of this offering:our initial public offering in August 2005:
Recapitalization
We currently havePrior to the initial public offering in August 2005, we had three classes of capital stock outstanding: Class B preferred stock, Class A common stock and Class B common stock. Immediately priorPrior to the consummation of thisthe initial public offering, we will effectuateeffectuated a series of transactions in order to, among other things, simplify our capital structure. Our simplified capital structure will havehas two classes of authorized capital stock (common stock and preferred stock), of which only shares of common stock will beremained outstanding after theour initial public offering. The recapitalization transaction will involveinvolved a number of steps to bethat were effectuated contemporaneously with the consummation of the Refinancing Transaction (discussed below) and thisour initial public offering. These steps will bewere as follows:
Stock Split. We will amend and restateamended our certificate of incorporation to effect a 5-for-2 stock split of our common stock.
Conversion of Class B Preferred Stock. Immediately prior to the consummation of the Recapitalization,recapitalization, all outstanding shares of Class B preferred stock will bewere converted in accordance with their terms into 1,846,396 (on a post stock split basis) shares of Class A common stock, shares of
Class C preferred stock and shares of Class D preferred stock. All shares of Class C and Class D preferred stock will bewere redeemed with cash or common stock as described below.
Redemption of Class C Preferred Stock. Immediately after the conversion of the Class B preferred stock, we shall useused proceeds from thisour initial public offering and the Refinancing Transactionrefinancing of our Senior Credit Facility to redeem all outstanding Class C preferred stock, including any accrued and unpaid dividends, for an aggregate redemption price determined in accordance with our pre-offering certificate of incorporation. Assuming a August 1, 2005 redemption date, theThe aggregate redemption price of the Class C preferred stock would be approximately $30.5was equal to $30.6 million. This amount will increase at a rate of approximately 0.02% for each additional day that the Class C preferred stock remains outstanding as a result of preferred dividends which will continue to accrue thereon.
Repurchase of Class D Preferred Stock. Immediately after the conversion of the Class B preferred stock, we shall repurchaserepurchased all of the outstanding Class D preferred stock for an aggregate repurchase price equal to $8.0 million payable as follows: $4.0 million of the repurchase price shall be paid in cash using proceeds from thisthe initial public offering and the Refinancing Transaction,refinancing of our Senior Credit Facility, and $4.0 million shall be paid in shares of our Class A common stock based on the initial public offering price of $14.50 per share (before giving effect to underwriters' discounts or commissions)the underwriting discount).
Reclassification of Class A Common Stock and Class B Common Stock. Immediately after the transactions described above, we will amendamended and restaterestated our certificate of incorporation to provide for, among other things, authorized capital stock of 60.0 million shares of common stock and 10.0 million shares of preferred stock after giving effect to a 5-for-2 stock split. As a result, all of our Class A common stock and Class B common stock (including shares of Class A common stock issued upon conversion of the Class B preferred stock and repurchase of the Class D preferred stock) will bewere reclassified as common stock, on a one-for-one basis.
Stock Options and Warrants. Following the reclassification of our shares, all outstanding options and warrants to purchase our Class A common stock and Class B common stock will becomebecame exercisable into shares of our newly created common stock in accordance with the terms of our stock option plans and stock option and warrant agreements. We will freezefroze our existing
1998 Stock Option Plan and 2001 Stock Option Plan such that no further awards or grants may be made under them. We will establishestablished a new 2005 Long-Term Incentive Plan which will provideprovides for the issuance of stock options or other equity awards equal to 1,139,170 shares of common stock. Of these options, 683,502 will bewere awarded to Dr. Hartnett upon the consummation of thisthe initial public offering at the offering price of $14.50 per share, subject to vesting, and the remainder will bewas reserved for grants to our employees (other than Dr. Hartnett) at the discretion of our compensation committee. With the exception of options and warrants that are exercised in connection with this offering, substantially all outstanding options and warrants to purchase common stock held by our employees will be subject to a lock-up period of not less than 180 days (2.5% of our pro forma fully diluted shares of common stock will be subject to a lock-up period of 90 days) following the date of this prospectus. See "Use of Proceeds" and "Pre-Offering Transactions."
Refinancing Transaction
We have entered into a commitment letter with GE Capital to amend and restate our existing Senior Credit Facility to increase borrowings under our Term Loan by $40.0 million and to reduce the interest rate on our Revolving Credit Facility and Term Loan by approximately 1.00%, referred to as the Refinancing Transaction. The Refinancing Transaction is subject to customary terms and conditions, including consummation of this offering. We expect to close the Refinancing Transaction simultaneously with the closing of this offering. The proceeds from the Refinancing Transaction and the proceeds from this offering will be used for the purposes described under "Use of Proceeds."
PRINCIPAL AND SELLING STOCKHOLDERS
Except as set forth in the footnotes below, the following table sets forth information known to us with respect to the beneficial ownership of our common stock as of April 2, 2005March 29, 2006 prior to the offering of common stock contemplated hereby, and as adjusted to reflect the Pre-Offering Transactions and the sale of common stock in this offering including the exercise of options and warrants pursuant to a net share settlementfor cash as described below, by (1) each stockholder known by us to own beneficially more than 5% of our common stock, (2) each of the named executive officers, (3) each of our directors and (4) all of our directors and executive officers as a group. ThePercentages set forth in the table below assumesassume no exercise of the underwriters' overallotment option. Beneficial ownership is determined in accordance with the rules of the SEC. Such rules provide that in computing the number of shares beneficially owned by a person and the percentage ownership of that person, shares of common stock subject to options or warrants held by that person that are currently exercisable or will become exercisable within 60 days after April 2, 2005March 29, 2006 are deemed outstanding. Such shares are not deemed outstanding for purposes of computing percentage ownership of any other person.
Some of the selling stockholders will be selling shares in this offering that they will acquire by exercising options and warrants through a net share settlement.for cash. We will not receive any of the proceeds from the sale of common stock by the selling stockholders in connection with this offering. The selling stockholders acquired the securities being sold in this offering under exemptions from applicable requirements of the Securities Act of 1933.
If the offering price differs from $15.00 per share, the midpoint of the range on the front cover of this prospectus, the 870,000 shares of common stock to be sold by the selling stockholders from the exercise of options and warrants will not change; however the number of options and warrants needed to be exercised pursuant to a net share settlement will be adjusted to reflect the actual offering price.
To the extent that any successor(s) to the selling stockholders wish to sell under this prospectus, we will file a supplement to this prospectus identifying such successor(s) as a selling stockholder.
Dr. Hartnett is offering 295,444 shares, all of which he will acquire upon exercising 303,539 warrants pursuant to a net share settlement. In addition, 405,556 shares will be sold through a limited partnership, Hartnett Family Investments, L.P., of which Dr. Hartnett is a general partner as a result of the exercise of 416,668 warrants to purchase common stock by such partnership pursuant to a net share settlement.
Unless otherwise indicated in the footnotes below (1) the persons and entities named in the table have sole voting and investment power with respect to all shares beneficially owned, subject to community property laws where applicable and (2) unless otherwise indicated, the address of each of the individuals listed in the table is RBC Bearings Incorporated, One Tribology Center, Oxford, CT 06478.
| | Shares Beneficially Owned Prior to the Offering | | Shares Beneficially Owned After the Offering(l) | Shares Beneficially Owned Prior to the Offering | | Shares Beneficially Owned After the Offering | ||||||||||||||||
|---|---|---|---|---|---|---|---|---|---|---|---|---|---|---|---|---|---|---|---|---|---|---|
| Name | Number of Shares Offered(k) | Number of Shares Offered | ||||||||||||||||||||
| Number | Percentage | Number | Percentage | Number | Percentage | Number | Percentage | |||||||||||||||
| Dr. Michael J. Hartnett | 1,484,286 | (e) | 15.3 | % | 295,444 | 1,408,581 | (m) | 8.4 | % | 1,663,725 | (d) | 9.0 | % | 355,000 | 1,308,725 | (h) | 6.7 | % | ||||
| Daniel A. Bergeron | 16,667 | (f) | * | — | 16,667 | * | 25,000 | (e) | * | — | 25,000 | * | ||||||||||
| Phillip H. Beausoleil | 87,792 | (f) | 1.0 | % | 26,000 | 61,079 | * | 69,387 | (e) | * | — | 69,387 | * | |||||||||
| Thomas C. Crainer | 58,100 | (f) | * | 17,000 | 40,634 | * | 40,617 | (e) | * | 3,117 | 37,500 | (h) | * | |||||||||
| Richard J. Edwards | 193,800 | (f) | 2.3 | % | 64,000 | 128,046 | * | 127,984 | (e) | * | — | 127,984 | * | |||||||||
| Robert Anderson | 28,217 | (f) | * | — | 28,217 | * | 32,550 | (e) | * | — | 32,550 | * | ||||||||||
| Richard R. Crowell | 28,217 | (f)(g) | * | — | 28,217 | (g) | * | 76,310 | (e) | * | — | 76,310 | * | |||||||||
| Dr. Amir Faghri | 1,667 | (f) | * | — | 1,667 | * | 5,000 | (e) | * | — | 5,000 | * | ||||||||||
| William P. Killian | 26,409 | (h) | * | — | 26,409 | * | 30,742 | (f) | * | — | 30,742 | * | ||||||||||
| Michael Stone(a)(b) | 7,945,681 | 95.5 | % | 1,030,099 | 6,915,582 | 44.7 | % | |||||||||||||||
| Whitney RBHC Investor, LLC(c)** | 7,945,681 | (i) | 95.5 | % | 1,030,099 | 6,915,582 | 44.7 | % | ||||||||||||||
| Hartnett Family Investments, L.P.** | 416,668 | (j) | 4.8 | % | 405,556 | — | — | |||||||||||||||
| Ronald E. Lemansky** | 84,150 | (f)(g) | 1.0 | % | 27,000 | 56,410 | (g) | * | ||||||||||||||
| Christopher S. Thomas** | 91,250 | (f) | 1.1 | % | 16,000 | 72,702 | * | |||||||||||||||
| Other** | 195,918 | 2.3 | % | 133,901 | 61,496 | * | ||||||||||||||||
| All directors and officers as a group (10 persons)(d) | 10,287,504 | 97.3 | % | 1,838,099 | 8,655,099 | 50.6 | % | |||||||||||||||
| Alan B. Levine | 2,500 | (e) | * | — | 2,500 | * | ||||||||||||||||
| Dr. Thomas J. O'Brien | 400 | (e) | * | — | 400 | * | ||||||||||||||||
| Michael Stone(a)(b) | 5,637,412 | (g) | 33.2 | % | 5,637,412 | — | — | |||||||||||||||
| Whitney RBHC Investor, LLC(c) | 5,637,412 | (g) | 33.2 | % | 5,637,412 | — | — | |||||||||||||||
| All directors and officers as a group (12 persons) | 7,711,627 | 40.8 | % | 5,995,529 | 1,716,098 | 8.6 | % | |||||||||||||||
(a) Mr. Stone maintains his address at c/o Whitney & Co., 177 Broad Street, Stamford, Connecticut, 06901.
(e)
(f) Consists of shares of our Class A common stock or Class A common stock issuable upon exercise of stock options and warrants that are currently exercisable or exercisable within 60 days of April 2, 2005.
(g) Does not reflect 43,760 shares of common stock purchased by Richard R. Crowell from Ronald E. Lemansky in July 2005.
(h)
(i)
(j) Shares of common stock owned by Hartnett Family Investments, L.P., a Delaware limited partnership, whose general partner is Dr. Hartnett. Dr. Hartnett, by virtue of his general partnership interest would be deemed to beneficially own all of the shares of Hartnett Family Investments, L.P.
(k) therein.
(l) Assumes the underwriters' overallotment option is not exercised. In the event that the underwriters' overallotment option is exercised in full, the following persons will sell the additional number of shares set forth after their respective names: Whitney RBHC Investor, LLC (286,982) and Dr. Michael J. Hartnett (194,702).
(m) Includes 201,167 shares of common stock issuable upon exercise of stock options issued to Dr. Hartnett simultaneously with this offering pursuant to our 2005 Long-Term Incentive Plan out of a total of 683,502 such options, one third of which are vested and exercisable within 60 days.
General
Pursuant to the Pre-Offering Transactions which will take place immediately prior to completion of this offering, and upon completion of the offering, we will beWe are authorized to issue 60.0 million shares of common stock, $0.01 par value, and 10.0 million shares of preferred stock, $0.01 par value. In addition, upon completion of this offering, there will beThere is no preferred stock outstanding, as alloutstanding. As of the outstanding preferred stock will be converted intoMarch 29, 2006, there were 16,976,381 shares of common stock or will be redeemed or repurchased with a portion of the net proceeds from this offering or common stock. See "Use of Proceeds"issued and "Related Party Transactions—Pre-Offering Transactions." As of April 2, 2005, prior to giving effect to our 5-for-2 stock split, there were 2,481,007 shares of our Class A common stock and 100 shares of our Class B common stock outstanding. Additionally, as of such date, there were outstanding, (1) warrants and1,319,594 options to purchase up to an additional 764,494 shares of our Class A common stock (2) warrantsoutstanding and options to purchase 549,146 shares of our Class B common stock, and (3) 240,000 shares of our Class B exchangeable convertible participating preferred stock, or Class B preferred stock, which was convertible into shares of Class A common stock, Class C straight preferred stock and Class D straight preferred stock. Dr. Hartnett owned all of our Class B common stock, options and1,004,642 warrants to purchase Class B common stock as well as 10,000 shares of our Class B preferred stock. Dr. Hartnett's shares of Class B common stock entitled him majority voting control with respect to our capital stock. As of April 2, 2005 there were 8 holders of our Class A and Class B common stock. The balance of 230,000 shares of Class B preferred stock was held by Whitney Investor.outstanding. The following description of our capital stock does not purport to be complete and is subject to and qualified in its entirety by our amended and restated certificate of incorporation and bylaws, which are included as exhibits to the Registration Statement of which this prospectus forms a part, and by the provisions of applicable Delaware law.
Common Stock
Upon the completionAs of this offering,March 29, 2006, there will be 15,458,833were 16,976,381 shares of common stock outstanding and 1,139,170 shares reserved for issuance under our 2005 Long-Term Incentive Plan, of which 683,502696,002 options to purchase shares will be issued.were issued, and 443,168 shares available for future issuances as provided for in the plan. In addition, 1,004,642 warrants to purchase common stock were issued and outstanding. Our 1998 and 2001 Stock Option Plans will bewere frozen prior to thisour initial public offering in August 2005, and no additional options or other equity securities will be issued under these plans. The holders of common stock will beare entitled to one vote per share on all matters to be voted upon by the stockholders. Subject to preferences that may be applicable to any outstanding preferred stock, the holders of common stock will beare entitled to receive ratably such dividends, if any, as may be declared from time to time by the board of directors out of funds legally available for that purpose. In the event of a liquidation, dissolution or winding up of our company, the holders of common stock will beare entitled to share ratably in all assets remaining after payment of liabilities, subject to prior distribution rights of preferred stock, if any, then outstanding. The common stock will havehas no preemptive or conversion rights or other subscription rights. There will beare no redemption or sinking fund provisions applicable to the common stock. All outstanding shares of common stock will bein connection with this offering are fully paid and nonassessable, and the shares of common stock to be issued upon the closing of this offering will be fully paid and nonassessable.
Preferred Stock
Pursuant to our amended and restated certificate of incorporation, to be filed prior to the completion of this offering, our board of directors will beis authorized, subject to any limitations prescribed by law, without stockholder approval, from time to time to issue up to an aggregate of 10.0 million shares of preferred stock, $0.01 par value per share, in one or more series, each of the series to have such rights and preferences, including voting rights, dividend rights, conversion rights, redemption privileges and liquidation preferences, as shall be determined by our board of directors.
The rights of the holders of common stock will be subject to, and may be adversely affected by, the rights of holders of any preferred stock that may be issued in the future. Issuance of preferred stock, while providing desirable flexibility in connection with possible acquisitions and other corporate purposes, could have the effect of making it more difficult for others to acquire, or of discouraging others from attempting to acquire, a majority of our outstanding voting stock. We have no present plans to issue any shares of preferred stock.
Delaware Anti-Takeover Law and Charter and Bylaw Provisions
Provisions of Delaware law and our certificate of incorporation and bylaws could make it more difficult to acquire us by means of a tender offer, a proxy contest or otherwise and the removal of incumbent officers and directors. These provisions, summarized below, are expected to discourage types of coercive takeover practices and inadequate takeover bids and to encourage persons seeking to
acquire control of us to first negotiate with us. We believe that the benefits of increased protection of our potential ability to negotiate with the proponent of an unfriendly or unsolicited proposal to acquire or restructure us outweigh the disadvantages of discouraging takeover or acquisition proposals because, among other things, negotiation of these proposals could result in an improvement of their terms.
We are subject to Section 203 of the Delaware General Corporation Law, an anti-takeover law. In general, Section 203 prohibits a publicly held Delaware corporation from engaging in a "business combination" with an "interested stockholder" for a period of three years following the date the person became an interested stockholder, unless (with certain exceptions) the "business combination" or the transaction in which the person became an interested stockholder is approved in a prescribed manner. Generally, a "business combination" includes a merger, asset or stock sale, or other transaction resulting in a financial benefit to the interested stockholder. Generally, an "interested stockholder" is a person who, together with affiliates and associates, owns (or within three years prior to the determination of interested stockholder status, did own) 15% or more of a corporation's voting stock. The existence of this provision would be expected to have an anti-takeover effect with respect to transactions not approved in advance by the board of directors, including discouraging attempts that might result in a premium over the market price for the shares of common stock held by stockholders.
Registration Rights
Subject to limitations contained in our Amended and Restated Stockholders Agreement dated February 6, 2003, between us, Dr. Hartnett, the Hartnett Partnership and Whitney Investor, the holders of the majority of shares owned by Whitney Investor or its affiliates or permitted transferees shall have the right, on two occasions, to demand that we prepare and file with the Securities and Exchange Commission a registration statement to permit the public offering of the shares owned by those parties demanding such registration. This right will be made subject to a lock-up agreement between Whitney Investor and our underwriters in connection with this offering which, unless waived, will prevent Whitney Investor from exercising this right until 180 days after the date of this Prospectus. Whenever we propose to register a public offering of our common stock, upon any request by Dr. Hartnett or Whitney Investor, we are required to include their shares in the offering, subject to customary cutback provisions.
We will bear all registration expenses, except underwriting discounts and selling commissions, incurred in connection with the registrations described above. We have agreed with Dr. Hartnett and Whitney Investor (or their permitted transferees) to indemnify each other against certain liabilities, including liabilities under federal and state securities laws.
Transfer Agent and Registrar
The transfer agent and registrar for the common stock is LaSalle Bank National Association.
DESCRIPTION OF CERTAIN INDEBTEDNESS
Senior Credit Facility
On June 29, 2004, we entered into a senior credit facility totaling $165 million, or theOur Senior Credit Facility summarized below. The following description does not purport to be complete and is qualified in its entirety by reference to the credit agreement, which is available from us upon request.
The Senior Credit Facility consistsinitially consisted of (1) thea 6.5-year $55.0 million Revolving Credit Facility (including the $25.0 million letter of credit subfacility available for the issuance of letters of credit) and (2) thea 6.5-year $110.0 million Term Loan.
On August 15, 2005, we amended and restated our existing Senior Credit Facility to increase our borrowings under our Term Loan by $40.0 million, for a total commitment amount of $150.0 million. This lowered the interest rate on the Term Loan (1) from Base Rate, or the federal funds rate plus 50 basis points, plus 2.50% to Base Rate, or the federal funds rate plus 50 basis points, plus 1.50% or (2) from LIBOR plus 3.75% to LIBOR plus 2.75%. The amended and restated credit agreement requires us to make annual amortization payments (payable in quarterly installments) equal to 1% of the balancetotal amount of the Term Loan commitment in years one through six and the remaining balance is due at maturity in 2010.maturity.
Mandatory prepayments in respect of the Term Loan or permanent reductions to the commitments under theThe Revolving Credit Facility bears interest at a floating rate, and at RBCA's option so long as applicable, are required in an amount equal to, (a) 100%no event of default has occurred or is continuing, of either the higher of the net cash proceeds from all asset sales and dispositions by us and our subsidiaries, subject to certain exceptions, (b) 100% ofbase rate on corporate loans or the net cash proceeds from extraordinary receipts (including, without limitation, proceeds from certain key-man life policies) and (c) 100% offederal funds rate plus 50 basis points, plus 1.25%; or the net cash proceeds from equity issuances by us and our subsidiaries, subject to certain exceptions; provided thatoffered rate for deposits on U.S. Dollars in the event of certain qualified public offerings of equity securities by us, net cash proceeds thereof shall be used first to repay our outstanding Discount Debentures until paid in full; second 50% of any remaining proceeds must be used to repay our Second Lien Term Loan and third, any remaining proceeds, up to 50% may be used to make restricted payments, including redemptions of our common and preferred stock, and up to 50% may be used to repay our Second Lien Term Loan and any remaining unused balance may be usedLondon interbank market for general corporate purposes. This offering will constitute a qualified public offering as defined under the Senior Credit Facility. Accordingly, all of the outstanding Discount Debentures will be paid in full out of the proceeds from this offering.
Voluntary prepayments and commitment reductions are permitted in whole or in part, without premium or penalty, subject to minimum prepayment or reduction requirements, provided that voluntary prepayments of LIBOR loans on a date other than the last day of the relevant interest period will be subjectwhich is published by the British Bankers Association, or LIBOR rate, plus 2.50%. Availability under our Revolving Credit Facility is based on a multiple of our EBITDA and the amount of our indebtedness otherwise outstanding. The Senior Credit Facility has a scheduled maturity date of August 15, 2011, the sixth anniversary of the date of such amendment and restatement.
After giving effect to the paymentAugust 2005 amendment and restatement of customary breakage costs, if any.
Allour Senior Credit Facility, all of our obligations under the Senior Credit Facility will bebecame unconditionally guaranteed by us and each existing and subsequently acquired or organized subsidiary other than foreign subsidiaries after the consummation of this offering.subsidiaries. The obligations under the Term Loan and the Revolving Credit Facility (including the guarantees) are secured by substantially all of our present and future assets and all present and future assets of each guarantor, including but not limited to (1) a first-priority pledge of all of RBCA's outstanding capital stock owned by us, (2) a first-priority pledge of all of the outstanding capital stock owned by us or any guarantor in any domestic subsidiary, (3) a first-priority pledge of 66% and 65.34% of the outstanding capital stock of RBC Schaublin Holdings S.A. and RBC de Mexico S de R. L. de C.V., respectively and (4) a perfected first-priority security interests in all of our present and future assets and the present and future assets of each guarantor, subject to certain limited exceptions.
The Mandatory prepayments in respect of the Term Loan or permanent reductions to the commitments under the Revolving Credit Facility, bears interest at a floating rate, and at RBCA's option so long as no event of default has occurred or is continuing, of either the higherapplicable, are required in an amount equal to, (a) 100% of the base ratenet cash proceeds from all asset sales and dispositions by us and our subsidiaries, subject to certain exceptions, (b) 100% of the net cash proceeds from extraordinary receipts (including, without limitation, proceeds from certain key-man life policies) and (c) 50% of the net cash proceeds from equity issuances by us and our subsidiaries, subject to certain exceptions.
Voluntary prepayments and commitment reductions are permitted in whole or in part, without premium or penalty, subject to minimum prepayment or reduction requirements, provided that voluntary prepayments of LIBOR loans on corporate loans ora date other than the federal funds rate plus 50 basis points, plus 1.75%; or the offered rate for deposits on U.S. Dollars in the London interbank market forlast day of the relevant interest period which is published bywill be subject to the British Bankers Association, or LIBOR rate, plus 3.00%. The Term Loan bears interest at a floating rate, at our option so long as no eventpayment of default has occurred or is continuing, of either the higher of the base rate on corporate loans posted by at least 75% of the nation's 30 largest banks published inThe Wall Street Journal, or Base Rate, or the federal funds rate plus 50 basis points, plus 2.50%; or
LIBOR plus 3.75%. As of April 2, 2005, the blended interest rate on the Senior Credit Facility and Second Lien Term Loan (discussed below) was 7.6%.customary breakage costs, if any.
In addition, the lenders under the Revolving Credit Facility are entitled to be paid a fee on unused commitments under that facility at a rate equal to 0.50% per annum, payable monthly in arrears. With respect to the letter of credit subfacility, an additional fee, equal to the product of the average daily undrawn face amount of all letters of credit issued, guaranteed or supported by risk participation agreements multiplied by a per annum rate equal to the applicable margin applied to LIBOR rate
loans, i.e., 3.0% is payable monthly in arrears together with any fees and charges incurred by the administrative agent to a letter of credit issuer.
During the existence of any default under the credit agreement, the applicable margins applied to all obligations under the senior credit facilities would increase by 2% per year.
The credit agreement documentation contains customary representations and warranties and customary covenants restricting our, and our domestic subsidiaries' ability to, among other things and subject to various exceptions, (1) declare dividends, make distributions or redeem or repurchase capital stock, (2) prepay, redeem or repurchase other debt, (3) incur liens or grant negative pledges, (4) make loans and investments, (5) incur additional indebtedness or guarantees, (6) amend or otherwise alter our organizational documents or any debt and other material agreements, (7) make capital expenditures, (8) engage in mergers, acquisitions and asset sales, (9) conduct transactions with affiliates, (10) alter the nature of our businesses, (11) change our fiscal quarter or our fiscal year, (12) engage in "sale-leaseback" transactions, (13) cancel indebtedness owing to us or our subsidiaries or (14) prohibit restricted subsidiaries from funding dividends or distributions or repaying intercompany loans. We and our subsidiaries also will be required to comply with specified financial covenants (including, without limitation, a leverage ratio and a fixed charge coverage ratio) and various affirmative covenants.
Events of default under the credit agreement include, but are not limited to, (1) our failure to pay principal, interest, fees or other amounts under the credit agreement when due or after expiration of a grace period, (2) any representation or warranty proving to have been materially incorrect when made, (3) covenant defaults, with respect to certain covenants, subject to a grace period, (4) bankruptcy events, (5) a cross default to certain other debt, (6) unsatisfied final judgments over a threshold, (7) a change of control, (8) ERISA defaults and (9) the invalidity or impairment of any loan document or any security interest. In March 2006, we obtained an amendment to our Senior Credit Facility such that the sale of shares by the selling stockholders in this offering does not result in a "Change of Control" and, therefore, an event of default under the Senior Credit Facility.
In addition, the credit agreement includes customary provisions regarding breakage or redeployment costs incurred in connection with prepayments, changes in capital adequacy and capital requirements or their interpretation, illegality, unavailability, reserves without proration or offset and payments free and clear of withholding.
We expect to amend and restate our existing Senior Credit Facility to increase our borrowings under our Term Loan by $40.0 million in connection with the Refinancing Transaction. This would also lower the interest rate on the Term Loan (1) from Base Rate, or the federal funds rate plus 50 basis points, plus 2.50% to Base Rate, or the federal funds rate plus 50 basis points, plus 1.50% or (2) from LIBOR plus 3.75% to LIBOR plus 2.75%. In addition, the maturity of the Term Loan will be extended to the sixth anniversary of the date of such amendment and restatement. The proceeds from the Refinancing Transaction, together with the proceeds from this offering will be used for the purposes describedto prepay outstanding balances under the heading "Use of Proceeds."our Term Loan under our Senior Credit Facility. See "Pre-Offering Transactions—Refinancing Transaction," "Prospectus Summary—The Offering" and "Use of Proceeds."
Second Lien Term Loan
On June 29, 2004, In connection with this offering we entered into a Second Lien Term Loan totaling $45.0 million with a seven year maturity. The Second Lien Term Loan is secured by a second priority security interest in the assets
secured by the Term Loan and the Revolvingexpect to amend or replace our Senior Credit Facility set forth above, pursuant to an intercreditor agreement. The Second Lien Term Loan bears interest at a floating rate, at our option so long as no eventprovide for lower borrowing costs. We expect that the amended or replaced Senior Credit Facility will contain similar amortization schedules, financial covenants, events of default, has occurrednegative and affirmative covenants and representations and warranties described above. The amendment or is continuing, of either the higherreplacement of the Base RateSenior Credit Facility is contingent upon the consummation of the primary portion of this offering. We are in discussions with multiple lenders regarding alternatives for reducing borrowing costs under our Senior Credit Facility, including replacing or amending the federal fundsfacility. Based on discussions with lenders, we expect that after giving effect to the amendment or replacement of the Senior Credit Facility, we will reduce the interest rate plus 50on our LIBOR loans by at least 125 basis points, plus 7.25%;points. There can be no assurances, however, that capital markets will permit us to replace or LIBOR plus 8.50%. All of our outstanding indebtedness underamend the Second Lien Term Loanfacility or that we will be repaid out of the proceeds from this offering and the Refinancing Transaction.able to achieve such savings.
Swiss Credit Facility
On December 8, 2003, Schaublin Holding S.A. entered into a bank credit facility with Credit Suisse Zurich providing for 10.0 million swiss francs or approximately $8.0$7.6 million in term loan, or Swiss Term Loan, and up to 2.0 million swiss francs, or approximately $1.6$1.5 million, of revolving credit
loans and letters of credit, referred to as the Swiss Revolver. We have pledged 99.4% of the present and future share capital of Schaublin (1,366 shares) to the agent under this credit facility to secure Schaublin's obligation thereunder. This credit facility contains customary representation and warranties, affirmative and negative covenants and events of defaults, as well as certain financial covenants applicable solely to Schaublin. The Swiss Term Loan is payable in semi-annual installments ranging from approximately $0.4 million to approximately $1.0 million and matures on March 31, 2009. The Swiss Terms Loan bears interest at variable rates, calculated at LIBOR plus a margin which varies based on debt capacity ratios determined annually, payable quarterly. On November 8, 2004, we amended the Swiss Credit Facility to increase the Swiss Revolver to 4.0 million swiss francs, or approximately $3.5$3.0 million. As of April 2,December 31, 2005, $6.2$4.8 million was outstanding under the Swiss Term Loan, and no loans or letters of credit were outstanding under the Swiss Revolver.
Industrial Revenue Bonds
During fiscal 1995, we entered into a loan agreement with the South Carolina Jobs Economic Development Authority, or SC JEDA, which provides for borrowings up to $10.7 million under two industrial development revenue bonds, or IRBs. During fiscal 1999 we entered into an additional loan agreement with the SC JEDA which provides for borrowings up to $3.0 million under an industrial development revenue bond. Additionally, during fiscal 2000, we entered into a loan agreement with the California Infrastructure and Economic Development Bank, or CIEDB, which provides for borrowings up to $4.8 million under an industrial development revenue bond (the CIEDB Series 1999 IRB). The proceeds from these IRBs are restricted for working capital requirements and capital expenditure purposes.
On March 1, 2002, we retired the unused portion of the SC JEDA Series 1998 IRB of $1.8 million by asking the state of South Carolina to collapse the bond to just the amount of money that had been used, thereby reducing the debt and the restricted marketable securities balances by $1.8 million.
As of April 2,December 31, 2005, $18.3$18.8 million of the proceeds have been expended (including accumulated interest of $1.6$2.1 million), and the remaining $0.01 million is invested by the trustee in marketable securities.
The SC JEDA Series 1994 A IRB, SC JEDA Series 1994 B IRB and the SC JEDA Series 1998 IRB are secured by a letter of credit issued under the letter of credit subfacility under the Revolving Credit Facility. The CIEDB Series 1999 IRB is likewise secured by an irrevocable direct-pay letter of credit issued by one of our existing lenders.
As of April 2,December 31, 2005, we had $16.7 million aggregate principal amount of our industrial revenue bonds outstanding.
SHARES ELIGIBLE FOR FUTURE SALE
Upon completion of this offering, we will have 15,458,83318,405,969 shares of our common stock outstanding.outstanding, based on 16,976,381 shares outstanding as of March 29, 2006. If the underwriters exercise their overallotment option in full, we will have a total of 16,415,05119,466,019 shares of our common stock outstanding. Of theseSubstantially all of our shares, all ofincluding the shares sold in this offering, and shares registered pursuant to any Form S-8, as amended we filed, will be freely tradable without restriction or further registration under the Securities Act, unless such shares are purchased by "affiliates" as that term is defined in Rule 144 under the Securities Act. The remaining shares of common stock held by existing stockholders are "restricted securities" as that term is defined in Rule 144 under the Securities Act, described below.
We cannot make any predictions as to the number of shares that may be sold in the future or the effect, if any, that sales of these shares, or the availability of these shares for future sale, will have on the prevailing market prices of our common stock. Sales of a significant number of shares of our common stock in the public market, or the perception that these sales could occur, could adversely affect prevailing market prices of our common stock and could impair our ability to raise equity capital in the future.
Lock-Up Agreements
We, our executive officers, and directors and substantially all of ourthe selling stockholders option holders and warrant holders have agreed, subject to exceptions, that we or they will not, for a period of not less than 180 days (or 90 days with respect to 2.5% of our pro forma fully diluted shares of common stock) after the date of this prospectus (i) offer, pledge, sell, contract to sell, sell any option or contract to purchase, purchase any option or contract to sell, grant any option, right or warrant for the sale of, or otherwise dispose of or transfer any shares of our common stock or any securities convertible into or exchangeable or exercisable for common stock, or file, or cause to be filed, any registration statement under the Securities Act of 1933, as amended, with respect to any of the foregoing securities, or (ii) enter into any swap or any other agreement or any transaction that transfers, in whole or in part, directly or indirectly, the economic consequence of ownership of the locked-up securities, whether any such swap or transaction is to be settled by delivery of common stock or other securities, in cash or otherwise, without the prior written consent of Merrill Lynch & Co., which may release all or a portion of the shares subject to this lock-up agreement at any time without prior notice.
The 180-day restricted period will be automatically extended if (1) during the last 17 days of the 180-day restricted period the Company issues an earnings release or material news or a material event relating to the Company occurs or (2) prior to the expiration of the 180-day restricted period, the Company announces that it will release earnings results or becomes aware that material news or a material event will occur during the 16-day period beginning on the last day of the 180-day restricted period, in which case the restrictions described above will continue to apply until the expiration of the 18-day period beginning on the issuance of the earnings release or the occurrence of the material news or material event. In addition, the lock-up provision will not restrict broker-dealers from engaging in market making and similar activities conducted in the ordinary course of their business.
Rule 144
In general, under Rule 144, as currently in effect beginning 90 days after the date of this prospectus, a person who has beneficially owned shares of our common stock for at least one year would be entitled to sell within any three-month period a number of shares that does not exceed the greater of: 1% of the number of shares of common stock then outstanding, which will equal approximately 154,588184,060 shares immediately after this offering; or the average weekly trading volume of our common stock during the four calendar weeks preceding the filing of a notice on Form 144 with respect to the sale.
Sales under Rule 144 are also subject to manner of sale provisions and notice requirements and to the availability of current public information about us.
Rule 144(k)
Under Rule 144(k), a person who is not deemed to have been one of our affiliates at any time during the 90 days preceding a sale, and who has beneficially owned the shares proposed to be sold for at least two years, including the holding period of any prior owner other than an affiliate, is entitled to sell the shares without complying with the manner of sale, public information, volume limitation or notice provisions of Rule 144.
Rule 701
Rule 701, as currently in effect, permits resales of shares in reliance upon Rule 144 but without compliance with certain restrictions, including the holding period requirement, of Rule 144. Any of our employees, officers, directors or consultants who purchased shares under a written compensatory plan or contract may be entitled to rely on the resale provisions of Rule 701. Rule 701 permits affiliates to sell their Rule 701 shares under Rule 144 without complying with the holding period requirements of Rule 144. Rule 701 further provides that non-affiliates may sell their shares in reliance on Rule 144 without having to comply with the holding period, public information, volume limitation or notice provisions of Rule 144. All holders of Rule 701 shares who have not satisfied the holding period requirements of Rule 144 are required to wait until 90 days after the date of this prospectus before selling their shares. In addition, substantially all of our shares held by existingdirectors, executive officers and the selling stockholders are subject to lock-up agreements and will only become eligible for sale at the earlier of the expiration of the 180-day90-day lock-up agreements (or 90 days with respect to 2.5% of our pro forma fully diluted shares of common stock) or sooner upon obtaining the prior written consent of Merrill Lynch & Co.
Stock Options
Not sooner than 90 days afterAs of March 29, 2006, options and warrants to purchase a total of 1,966,119 shares were outstanding, as adjusted to give effect to the offering, we intend to file a Registration Statement on Form S-8 registeringexercise of warrants for shares of common stock subject to outstanding options or reserved for future issuance under our stock option plans or warrants. As of April 2, 2005, after giving effect to the Pre-Offering Transactions and the exercise of stock options and warrants pursuant to a net share settlement by the selling stockholders, options to purchase a total 3,071,653 shares would have been outstanding.in connection with this offering. We will also be able to issue 455,668443,168 additional options, after this offeringrestricted stock, SARS or other equity interests permitted under our 2005 Long-Term Incentive Plan. Common stock issued upon exercise of outstanding vested options or warrants, other than common stock issued to our affiliates is available for immediate resale in the open market, subject to the applicable lock-up agreements, as described above, and in compliance with Rule 144. Substantially all of our option holders144 and warrant holdersRule 701. Selling stockholders who are optionholders or warrantholders will execute lock-up agreements of not less than 90 days with the underwriters.
Registration Rights
Beginning 180 days after the date of this offering, Dr. Hartnett, the Hartnett Partnership and Whitney Investor, who collectively will beneficially own 50.9% of our common stock, will be able to require us to conduct a registered public offering of their shares. Whitney Investor has demand rights on two occasions. In addition, Dr. Hartnett and Whitney Investor have piggyback registration rights to have their shares included for sale in subsequent registered offerings of our common stock, subject to customary cut-back provisions. See "Description of Capital Stock—Registration Rights." Registration of such shares under the Securities Act would, except for shares purchased by affiliates, result in such shares becoming freely tradable without restriction under the Securities Act immediately upon the effectiveness of such registration.
MATERIAL U.S. FEDERAL INCOME TAX CONSIDERATIONS FOR NON-U.S. HOLDERS
The following is a summary of the material U.S. federal income and estate tax consequences of the acquisition, ownership and disposition of our common stock by a non-U.S. holder. As used in this summary, the term "non-U.S. holder" means a beneficial owner of our common stock that is not, for United States federal income tax purposes:
An individual may be treated as a resident of the United States in any calendar year for United States federal income tax purposes, instead of a nonresident, by, among other ways, being present in the United States on at least 31 days in that calendar year and for an aggregate of at least 183 days during a three-year period ending in the current calendar year. For purposes of this calculation, an individual would count all of the days present in the current year, one-third of the days present in the immediately preceding year and one-sixth of the days present in the second preceding year. Residents are taxed for U.S. federal income purposes as if they were U.S. citizens.
If a partnership or other pass-through entity (including an entity or arrangement treated as a partnership or other type of pass-through entity for U.S. federal income tax purposes) owns our common stock, the tax treatment of a partner or beneficial owner of the partnership or other pass-through entity may depend upon the status of the partner or beneficial owner and the activities of the partnership or entity and by certain determinations made at the partner or beneficial owner level. Partners and beneficial owners in partnerships or other pass-through entities that own our common stock should consult their own tax advisors as to the particular U.S. federal income and estate tax consequences applicable to them.
This summary does not discuss all of the aspects of U.S. federal income and estate taxation that may be relevant to a non-U.S. holder in light of the non-U.S. holder's particular investment or other circumstances. In particular, this summary only addresses a non-U.S. holder that holds our common stock as a capital asset (generally, investment property) and does not address:
This summary is based on provisions of the U.S. Internal Revenue Code of 1986, as amended, applicable U.S. Treasury regulations and administrative and judicial interpretations, all as in effect or in existence on the date of this prospectus. Subsequent developments in U.S. federal income or estate tax law, including changes in law or differing interpretations, which may be applied retroactively, could have a material effect on the U.S. federal income and estate tax consequences of purchasing, owning and disposing of our common stock as set forth in this summary. Each non-U.S. holder should consult a tax advisor regarding the U.S. federal, state, local and non-U.S. income and other tax consequences of acquiring, holding and disposing of our common stock.
Dividends
We do not anticipate paying cash dividends on our common stock in the foreseeable future. See "Dividend Policy." In the event, however, that we pay dividends on our common stock, we will have to withhold a U.S. federal withholding tax at a rate of 30%, or a lower rate under an applicable income tax treaty, from the gross amount of the dividends paid to a non-U.S. holder. Non-U.S. holders should consult their own tax advisors regarding their entitlement to benefits under a relevant income tax treaty.
In order to claim the benefit of an applicable income tax treaty, a non-U.S. holder will be required to provide a properly executed U.S. Internal Revenue Service Form W-8BEN (or other applicable form) in accordance with the applicable certification and disclosure requirements. Special rules apply to partnerships and other pass-through entities and these certification and disclosure requirements also may apply to beneficial owners of partnerships and other pass-through entities that hold our common stock. A non-U.S. holder that is eligible for a reduced rate of U.S. federal withholding tax under an income tax treaty may obtain a refund or credit of any excess amounts withheld by filing an appropriate claim for a refund with the U.S. Internal Revenue Service. Non-U.S. holders should consult their own tax advisors regarding their entitlement to benefits under a relevant income tax treaty and the manner of claiming the benefits.
Dividends that are effectively connected with a non-U.S. holder's conduct of a trade or business in the United States and, if required by an applicable income tax treaty, are attributable to a permanent establishment maintained by the non-U.S. holder in the United States, will be taxed on a net income basis at the regular graduated rates and in the manner applicable to United States persons. In that case, we will not have to withhold U.S. federal withholding tax if the non-U.S. holder provides a properly executed U.S. Internal Revenue Service Form W-8ECI (or other applicable form) in accordance with the applicable certification and disclosure requirements. In addition, a "branch profits tax" may be imposed at a 30% rate, or a lower rate under an applicable income tax treaty, on dividends received by a foreign corporation that are effectively connected with the conduct by that foreign corporation of a trade or business in the United States.
Gain on Disposition of Common Stock
A non-U.S. holder generally will not be taxed on any gain recognized on a disposition of our common stock unless:
to United States persons (unless an applicable income tax treaty provides otherwise) and, if the non-U.S. holder is a foreign corporation, the "branch profits tax" described above may also apply;
Generally, a corporation is a "U.S. real property holding corporation" if the fair market value of its "U.S. real property interests" equals or exceeds 50% of the sum of the fair market value of its worldwide real property interests plus its other assets used or held for use in a trade or business. The tax relating to stock in a U.S. real property holding corporation generally will not apply to a non-U.S. holder whose holdings, direct and indirect, at all times during the applicable period, constituted 5% or less of our common stock, provided that our common stock was regularly traded on an established securities market. We believe that we are not currently, and we do not anticipate becoming in the future, a U.S. real property holding corporation.
Our common stock has been approved for quotationis quoted on the Nasdaq National Market, a nationally recognized U.S. securities exchange. Although not free from doubt, our common stock should be considered to be regularly traded on an established securities market for any calendar quarter during which it is regularly quoted on the securities exchange by brokers or dealers that hold themselves out to buy or sell our common stock at the quoted price. If we were to be a U.S. real property holding corporation and if our common stock were not considered to be regularly traded on a nationally recognizedan established securities exchangemarket at any time during the applicable calendar year, then a non-5% holder would be taxed for U.S. federal income tax purposes on any gain realized on the disposition of our common stock on a net income basis as if the gain were effectively connected with the conduct of a U.S. trade or business by the non-5% holder during the taxable year and, in such case, the person acquiring our common stock from a non-5% holder generally would have to withhold 10% of the amount of the proceeds from the disposition. Such withholding may be reduced or eliminated pursuant to a withholding certificate issued by the U.S. Internal Revenue Service in accordance with applicable U.S. Treasury regulations. We urge all non-U.S. holders to consult their own tax advisors regarding the application of these rules to them.
Federal Estate Tax
Our common stock that is owned or treated as owned by an individual who is not a U.S. citizen or resident of the United States (as specially defined for U.S. federal estate tax purposes) at the time of death will be included in the individual's gross estate for U.S. federal estate tax purposes, unless an applicable estate tax or other treaty provides otherwise and, therefore, may be subject to U.S. federal estate tax.
Information Reporting and Backup Withholding Tax
Dividends paid to a non-U.S. holder may be subject to U.S. information reporting and backup withholding. A non-U.S. holder will be exempt from backup withholding if the non-U.S. holder provides a properly executed U.S. Internal Revenue Service Form W-8BEN or otherwise meets
documentary evidence requirements for establishing its status as a non-U.S. holder or otherwise establishes an exemption.
The gross proceeds from the disposition of our common stock may be subject to U.S. information reporting and backup withholding. If a non-U.S. holder sells our common stock outside the United States through a non-U.S. office of a non-U.S. broker and the sales proceeds are paid to the non-U.S.
holder outside the United States, then the U.S. backup withholding and information reporting requirements generally will not apply to that payment. However, U.S. information reporting, but not U.S. backup withholding, will apply to a payment of sales proceeds, even if that payment is made outside the United States, if a non-U.S. holder sells our common stock through a non-U.S. office of a broker, such broker does not have documentary evidence in its files that the non-U.S. holder is not a United States person and certain other conditions are met (unless the non-U.S. holder otherwise establishes an exemption) and the broker:
If a non-U.S. holder receives payments of the proceeds from a sale of our common stock to or through a U.S. office of a broker, the payment is subject to both U.S. backup withholding and information reporting unless the non-U.S. holder provides a properly executed U.S. Internal Revenue Service Form W-8BEN certifying that the non-U.S. Holder is not a "United States person" or the non-U.S. holder otherwise establishes an exemption.
A non-U.S. holder generally may obtain a refund of any amounts withheld under the backup withholding rules that exceed the non-U.S. holder's U.S. federal income tax liability by filing a refund claim with the U.S. Internal Revenue Service.
We intend to offer the shares through the underwriters. Merrill Lynch, Pierce, Fenner & Smith Incorporated, KeyBanc Capital Markets, a division of McDonald Investments, Inc., and JefferiesRobert W. Baird & Company, Inc.Co. Incorporated are acting as representatives of the underwriters named below. Subject to the terms and conditions described in a purchase agreement among us, the selling stockholders and the underwriters, we and the selling stockholders have agreed to sell to the underwriters, and the underwriters severally have agreed to purchase from us and the selling stockholders, the number of shares listed opposite their names below.
| Underwriter | Number of Shares | |
|---|---|---|
| Merrill Lynch, Pierce, Fenner & Smith Incorporated | ||
| KeyBanc Capital Markets, a division of McDonald Investments, Inc. | ||
| Total | ||
The underwriters have agreed to purchase all of the shares sold under the purchase agreement if any of these shares are purchased. If an underwriter defaults, the purchase agreement provides that the purchase commitments of the nondefaulting underwriters may be increased or the purchase agreement may be terminated.
We and the selling stockholders have agreed to indemnify the underwriters against certain liabilities, including liabilities under the Securities Act, or to contribute to payments the underwriters may be required to make in respect of those liabilities.
The underwriters are offering the shares, subject to prior sale, when, as and if issued to and accepted by them, subject to approval of legal matters by their counsel, including the validity of the shares, and other conditions contained in the purchase agreement, such as the receipt by the underwriters of officer's certificates and legal opinions. The underwriters reserve the right to withdraw, cancel or modify offers to the public and to reject orders in whole or in part.
Commissions and Discounts
The representatives have advised us and the selling stockholders that the underwriters propose initially to offer the shares to the public at the initial public offering price on the cover page of this prospectus and to dealers at that price less a concession not in excess of $ per share. The underwriters may allow, and the dealers may reallow, a discount not in excess of $ per share to other dealers. After the initial public offering, the public offering price, concession and discount may be changed.
The following table shows the public offering price, underwriting discount and proceeds before expenses to us and the selling stockholders. The information assumes either no exercise or full exercise by the underwriters of their overallotment option.
| | Per Share | Without Option | With Option | ||||||
|---|---|---|---|---|---|---|---|---|---|
| Public offering price | $ | $ | $ | ||||||
| Underwriting discount | $ | $ | $ | ||||||
| Proceeds, before expenses, to us | $ | $ | $ | ||||||
| Proceeds, before expenses, to the selling stockholders | $ | $ | $ | ||||||
The expenses of the offering, not including the underwriting discount, are estimated at $1.8$1.1 million and are payable by us. We will be reimbursed for a certain portion of the offering expenses by the underwriters.
Overallotment Option
We and the selling stockholders have granted options to the underwriters to purchase up to an aggregate of 1,243,2001,060,050 additional shares of our common stock from us at the public offering price less the underwriting discount, consisting of 761,516 shares from us and 481,684 shares from the selling stockholders.discount. The underwriters may exercise this option for 30 days from the date of this prospectus solely to cover any overallotments. If the underwriters exercise this option, each will be obligated, subject to conditions contained in the underwriting agreement, to purchase a number of additional shares proportionate to that underwriter's initial amount reflected in the above table.
No Sales of Similar Securities
We, our executive officers, directors and directors, substantially all of the selling stockholders option holders and warrant holders have agreed, withsubject to exceptions, not to sell or transfer any common stock for 180 days (or 90 days with respect to 2.5% of our pro forma fully diluted shares of common stock) after the date of this prospectus without first obtaining the written consent of Merrill Lynch. Specifically, we and these other individuals have agreed not to directly or indirectly:
This lock-up provision applies to common stock and to securities convertible into or exchangeable or exercisable for or repayable with common stock. It also applies to common stock owned now or acquired later by the person executing the agreement or for which the person executing the agreement later acquires the power of disposition. The 180-day restricted period will be automatically extended if (1) during the last 17 days of the 180-day restricted period we issue an earnings release or material news or a material event relating to us occurs or (2) prior to the expiration of the 180-day restricted period, we announce that we will release earnings results or becomes aware that material news or a material event will occur during the 16-day period beginning on the last day of the 180-day restricted period, in which case the restrictions described above will continue to apply until the expiration of the 18-day period beginning on the issuance of the earnings release or the occurrence of the material news or material event. In addition, the lock-up provision will not restrict broker-dealers from engaging in market making and similar activities conducted in the ordinary course of their business.
Merrill Lynch has informed us that while it does not currently expect to release the entities or persons bound by the lock-up arrangements, including affiliates, prior to the end of the lock-up period, it retains the right to do so at any time without notice at its sole discretion.
Stock Exchange ListingQuotation on the Nasdaq National Market
Our shares of common stock have been approved for quotationare quoted on the Nasdaq National Market under the symbol "ROLL." In order to meet the requirements for listing on the exchange, the underwriters may be required to undertake to sell a minimum number of shares to a minimum number of beneficial owners as required by Nasdaq.
Before this offering, there has been no public market for our common stock. The initial public offering price will be determined through negotiations among us, the selling stockholders and the
representatives. In addition to prevailing market conditions, the factors to be considered in determining the initial public offering price are:
An active trading market for the shares may not develop. It is also possible that after the offering the shares will not trade in the public market at or above the initial public offering price.
The underwriters do not expect to sell more than 5% of the shares in the aggregate to accounts over which they exercise discretionary authority.
Price Stabilization and Short Positions and Penalty Bids
Until the distribution of the shares is completed, SEC rules may limit underwriters and selling group members from bidding for and purchasing our common stock. However, the representatives may
engage in transactions that stabilize the price of the common stock, such as bids or purchases to peg, fix or maintain that price.
If the underwriters create a short position in the common stock in connection with the offering, i.e., if they sell more shares than are listed on the cover of this prospectus, the representatives may reduce that short position by purchasing shares in the open market. The representatives may also elect to reduce any short position by exercising all or part of the overallotment option described above. Purchases of the common stock to stabilize its price or to reduce a short position may cause the price of the common stock to be higher than it might be in the absence of such purchases.
The representatives may also impose a penalty bid on underwriters and selling group members. This means that if the representatives purchase shares in the open market to reduce the underwriters' short position or to stabilize the price of such shares, they may reclaim the amount of the selling concession from the underwriters and selling group members who sold those shares. The imposition of a penalty bid may also affect the price of the shares in that it discourages resales of those shares.
Neither we nor any of the underwriters makes any representation or prediction as to the direction or magnitude of any effect that the transactions described above may have on the price of the common stock. In addition, neither we nor any of the underwriters makes any representation that the representatives will engage in these transactions or that these transactions, once commenced, will not be discontinued without notice.
Passive Market Making
In connection with this offering, underwriters and selling group members may engage in passive market making transactions in the common stock on the Nasdaq National Market in accordance with Rule 103 of Regulation M under the Exchange Act during a period before the commencement of offers or sales of common stock and extending through the completion of distribution. A passive market maker must display its bid at a price not in excess of the highest independent bid of that security. However, if all independent bids are lowered below the passive market maker's bid, that bid must then be lowered when specified purchase limits are exceeded.
Selling Restrictions
European Economic Area
Each underwriterIn relation to each Member State of the European Economic Area which has agreed that (i) it has not offered or sold, and priorimplemented the Prospectus Directive (each a "Relevant Member State") an offer to the six months afterpublic of any shares which are the date of issuesubject of the shares willoffering contemplated by this prospectus may not offer or sell any shares to personsbe made in the United Kingdomthat Relevant Member State except to persons whose ordinary activities involve them in acquiring, holding, managing or disposing of investments (as principal or agent) for purposes of their businesses or otherwise in circumstances which have not resulted and will not result inthat an offer to the public in that Relevant Member State of any shares may be made at any time under the United Kingdomfollowing exemptions under the Prospectus Directive, if they have been implemented in that Relevant Member State:
(a) to legal entities which are authorized or regulated to operate in the financial markets or, if not so authorized or regulated, whose corporate purpose is solely to invest in securities;
(b) to any legal entity which two or more of (1) an average of at least 250 employees during the last financial year; (2) a total balance sheet of more than €43,000,000 and (3) an annual net turnover of more than €50,000,000, as shown in its last annual or consolidated accounts;
(c) by the underwriters to fewer than 100 natural or legal persons (other than qualified investors as defined in the Prospectus Directive) subject to obtaining the prior consent of Merrill Lynch for any such offer; or
(d) in any other circumstances falling within the meaningArticle 3(2) of the Public OffersProspectus Directive,
provided that no such offer of Securities Regulations 1995, (ii) it has complied, and will comply with, all applicable provisionsshares shall result in a requirement for the publication by RBC Bearings Incorporated or any underwriter of a prospectus pursuant to Article 3 of the Financial Services and Markets Act 2000Prospectus Directive.
For the purposes of Great Britain ("FSMA") with respectthis provision, the expression an "offer to anything done by itthe public" in relation to theany shares in from or otherwise involvingany Relevant Member State means the Unitedcommunication in any form and by any means of sufficient information on the terms of the offer and any shares to be offered so as to enable an investor to
Kingdomdecide to purchase any shares, as the same may be varied in that Member State by any measure implementing the Prospectus Directive in that Member State and (iii)the expression "Prospectus Directive" means Directive 2003/71/EC and includes any relevant implementing measure in each Relevant Member State.
France
No prospectus (including any amendment, supplement or replacement thereto) has been prepared in connection with the offering of the shares that has been approved by the Autorité des marchés financiers or by the competent authority of another State that is a contracting party to the Agreement on the European Economic Area and notified to the Autorité des marchés financiers; no shares have been offered or sold nor will be offered or sold, directly or indirectly, to the public in France; the prospectus or any other offering material relating to the shares have not been distributed or caused to be distributed and will not be distributed or caused to be distributed to the public in France; such offers, sales and distributions have been and shall only be made in France to persons licensed to provide the investment service of portfolio management for the account of third parties, qualified investors (investisseurs qualifiés) and/or a restricted circle of investors (cercle restreint d'investisseurs), in each case investing for their own account, all as defined in Articles L. 411-2, D. 411-1, D. 411-2, D. 734-1, D. 744-1, D. 754-1 and D. 764-1 of the Code monétaire et financier. The direct or indirect distribution to the public in France of any so acquired shares may be made only as provided by Articles L. 411-1, L. 411-2, L. 412-1 and L. 621-8 to L. 621-8-3 of the Code monétaire et financier and applicable regulations thereunder.
United Kingdom
Each underwriter has agreed that:
(i) it has only communicated or caused to be communicated and will only communicate or cause to be communicated any invitation or inducement to engage in investment activity (within the meaning of section 21 of the FSMA)Financial Services and Markets Act 2000 (the "FSMA") received by it in connection with the issue or sale of any shares in circumstances in which section 21(1) of the FSMA does not apply to the issuer.Company; and
(ii) it has complied and will comply with all applicable provisions of the FSMA with respect to anything done by it in relation to any shares in, from or otherwise involving the United Kingdom.
Italy
The shares have not been, and will not be, offered or sold directly or indirectly in Italy or to a resident of Italy other than to a Professional Investor as defined by Articles 25 and 31(2) of Regulation No. 11522 (each such person, but excluding individual persons referred to in Article 31(2) of Regulation No. 11522, management companies (societa di gestione del risparmio or "SGRs") authorized to manage individual portfolios on behalf of third parties, and fiduciary companies authorized to manage individual portfolios pursuant to Article 60 of the Eurosim Decree) or to a "qualified investor" as defined in Article 2(1)(e) of EU Directive No. 71/2003, and in compliance with the forms and procedures provided therein. Any such offer or sale or any distribution of this prospectus or any rendering of advice in respect of an investment in the shares within Italy must be conducted either by securities dealing firms ("SIMs") or by authorized banks or investment firms, as described in Decree No. 58 and Regulation No. 11522 or financial companies enrolled in the special register provided for under Article 107 of Decree No. 385 to the extent duly authorized to engage in the placement and/or underwriting of financial instruments in Italy in accordance with the relevant provisions of Decree No. 58.
Switzerland
This prospectus does not constitute an issue prospectus pursuant to Art. 652a of the Swiss Code of Obligations. The shares will not be listed on the SWX Swiss Exchange and, therefore, the prospectus does not comply with the disclosure standards of the Listing Rules of the SWX Swiss Exchange. Accordingly, the shares may not be offered to the public in or from Switzerland, but only to a selected and limited group of investors, which do not subscribe the shares with a view to distribution to the public. The investors will be individually approached by the underwriters from time to time.
This prospectus is personal to each offeree and does not constitute an offer to any other person. The prospectus may only be used by those persons to whom it has been handed out in connection with the offer described herein and may neither directly nor indirectly be distributed or made available to other persons without the express consent of the Company. It may not be used in connection with any other offer and shall in particular not be copied and/or distributed to the public in Switzerland.
InternetElectronic Distribution
Merrill Lynch will be facilitating Internet distribution for this offering to certain of its Internet subscription customers. Merrill Lynch intends to allocate a limited number of shares for sale to its online brokerage customers. An electronic prospectus is available on the Internet Web site maintained by Merrill Lynch. Other than the prospectus in electronic format, the information on the Merrill Lynch Web site is not part of this prospectus.
Other Relationships
Some of the underwriters and their affiliates have engaged in, and may in the future engage in, investment banking and other commercial dealings in the ordinary course of business with us. They have received customary fees and commissions for these transactions.
The validity of the common stock offered hereby will be passed upon for us by Kirkland & Ellis LLP, New York, New York. Certain legal matters will be passed upon for the underwriters by Fried, Frank, Harris, Shriver & Jacobson LLP, New York, New York.
The consolidated financial statements of RBC Bearings Incorporated at April 2, 2005 and April 3, 2004, and for each of the three years in the period ended April 2, 2005, appearing in this Prospectus and Registration Statement have been audited by Ernst & Young LLP, independent registered public accounting firm, as set forth in their report thereon appearing elsewhere herein, and are included in reliance upon such report given on the authority of such firm as experts in accounting and auditing.
Valuation Research Corporation, in a consent filed with the Registration Statement, of which this prospectus is a part, has consented to the use of its name in this prospectus and to the reference to Valuation Research Corporation under the heading "Experts" in this prospectus. We retained Valuation Research Corporation, an independent valuation firm, to conduct an independent valuation analysis of the fair value of our common stock at each stock option grant date during fiscal 2005 on a retrospective basis for the purpose of assisting us with respect to our determination of a stock-based compensation expense, and we referred to its expertise based on the reputation and experience of said firm in valuation matters.
WHERE YOU CAN FIND ADDITIONAL INFORMATION
We have filed a registration statement on Form S-1, including relevant exhibits and schedules, under the Securities Act with the SEC for the common stock we are offering by this prospectus. This prospectus, which contains a part of the registration statement, does not include all of the information contained in the registration statement. You should read the registration statement and its exhibits for additional information. Statements in this prospectus as to the contents of any contract, agreement or other document referred to are not necessarily complete. In each instance, reference is made to the copy of such document or contract filed as an exhibit to the registration statement, and each such statement is qualified in all respects by such reference. As a result of this offering, we will also beWe are required to file annual, quarterly and current reports, proxy statements and other information with the SEC.
You may read and copy all or any portion of the registration statement or any reports, statements or other information that we file at the SEC's Public Reference Room at 100 F Street, N.E., Room 1024, Washington D.C. 20549. You can request copies of these documents, upon payment of a duplicating fee, by writing to the Securities and Exchange Commission. Please call the SEC at 1-800-SEC-0330 for further information on the operation of the Public Reference Room. Our SEC filings, including the registration statement, are also available to the public on the Internet at the SEC's web site athttp://www.sec.gov.
RBC Bearings Incorporated
Index to Consolidated Financial Statements
| Report of Independent Registered Public Accounting Firm | F-2 | |
Consolidated Balance Sheets as of April 2, 2005 and April 3, 2004 | F-3 | |
Consolidated Statements of Operations for the years ended April 2, 2005, April 3, 2004 and March 29, 2003 | ||
Consolidated Statements of Stockholders' Deficit and Comprehensive Income (Loss) for the years ended April 2, 2005, April 3, 2004 and March 29, 2003 | ||
Consolidated Statements of Cash Flows for the years ended April 2, 2005, April 3, 2004 and March 29, 2003 | ||
Notes to Consolidated Financial Statements | ||
| Consolidated Balance Sheets as of December 31, 2005 and April 2, 2005 | F-41 | |
Consolidated Statements of Operations for the nine months ended December 31, 2005 and January 1, 2005 | F-43 | |
| Consolidated Statements of Stockholders' Deficit and Comprehensive Income (Loss) for the nine months ended December 31, 2005 and January 1, 2005 | F-44 | |
| Consolidated Statements of Cash Flows for the nine months ended December 31, 2005 and January 1, 2005 | F-45 | |
| Notes to Unaudited Interim Consolidated Financial Statements | F-46 to F-59 | |
| Schedule |
REPORT OF INDEPENDENT REGISTERED PUBLIC ACCOUNTING FIRM
To the Board of Directors and Stockholders
RBC Bearings Incorporated
We have audited the accompanying consolidated balance sheets of RBC Bearings Incorporated as of April 2, 2005 and April 3, 2004, and the related consolidated statements of operations, stockholders' deficit and comprehensive income (loss), and cash flows for each of the three years in the period ended April 2, 2005. Our audits also included the financial statement schedule on page F-42.F-60. These financial statements and schedule are the responsibility of the Company's management. Our responsibility is to express an opinion on these financial statements and schedule based on our audits.
We conducted our audits in accordance with the standards of the Public Company Accounting Oversight Board (United States). Those standards require that we plan and perform the audit to obtain reasonable assurance about whether the financial statements are free of material misstatement. We were not engaged to perform an audit of the Company's internal control over financial reporting. Our audits included consideration of internal control over financial reporting as a basis for designing audit procedures that are appropriate in the circumstances, but not for the purpose of expressing an opinion on the effectiveness of the Company's internal control over financial reporting. Accordingly, we express no such opinion. An audit also includes examining, on a test basis, evidence supporting the amounts and disclosures in the financial statements, assessing the accounting principles used and significant estimates made by management, and evaluating the overall financial statement presentation. We believe that our audits provide a reasonable basis for our opinion.
In our opinion, the financial statements referred to above present fairly, in all material respects, the consolidated financial position of RBC Bearings Incorporated at April 2, 2005 and April 3, 2004, and the consolidated results of its operations and its cash flows for each of the three years in the period ended April 2, 2005, in conformity with U.S. generally accepted accounting principles. Also, in our opinion, the related financial statement schedule, when considered in relation to the basic financial statements taken as a whole, presents fairly in all material respects the information set forth therein.
Ernst & Young LLP
| /s/ Ernst & Young LLP |
Hartford, Connecticut
June 10, 2005, except for Note 21
as to which the date is July 19, 2005, Note 22 as to which the date is June 13, 2005 and
Note 2322 as to which this date is
July , 2005
The foregoing report is in the form that will be signed upon the completion of the stock split described in Note 23 to the consolidated financial statements.
/s/ Ernst & Young LLP
Hartford, ConnecticutJuly 20,August 2, 2005
RBC Bearings Incorporated
Consolidated Balance Sheets
(dollars in thousands, except share and per share data)
| | April 2, 2005 | April 3, 2004 | |||||||||||||||
|---|---|---|---|---|---|---|---|---|---|---|---|---|---|---|---|---|---|
| | | (Restated —Note 21) | | | April 2, 2005 | April 3, 2004 | |||||||||||
| ASSETS | ASSETS | ASSETS | |||||||||||||||
Current assets: | Current assets: | Current assets: | |||||||||||||||
| Cash | $ | 2,635 | $ | 3,250 | Cash | $ | 2,635 | $ | 3,250 | ||||||||
| Accounts receivable, net of allowance for doubtful accounts of $628 in 2005 and $770 in 2004 | 53,967 | 44,516 | Accounts receivable, net of allowance for doubtful accounts of $628 in 2005 and $770 in 2004 | 53,967 | 44,516 | ||||||||||||
| Inventory | 95,654 | 90,504 | Inventory | 95,654 | 90,504 | ||||||||||||
| Deferred income taxes | 4,509 | 2,342 | Deferred income taxes | 4,509 | 2,342 | ||||||||||||
| Prepaid expenses and other current assets | 2,226 | 2,454 | Prepaid expenses and other current assets | 2,226 | 2,454 | ||||||||||||
| Total current assets | 158,991 | 143,066 | Total current assets | 158,991 | 143,066 | ||||||||||||
| Property, plant and equipment, net | Property, plant and equipment, net | 55,343 | 56,249 | Property, plant and equipment, net | 55,343 | 56,249 | |||||||||||
| Goodwill | Goodwill | 25,150 | 25,150 | Goodwill | 25,150 | 25,150 | |||||||||||
| Intangible assets, net of accumulated amortization of $949 in 2005 and $449 in 2004 | Intangible assets, net of accumulated amortization of $949 in 2005 and $449 in 2004 | 3,333 | 2,853 | Intangible assets, net of accumulated amortization of $949 in 2005 and $449 in 2004 | 3,333 | 2,853 | |||||||||||
| Deferred financing costs, net of accumulated amortization of $1,280 in 2005 and $7,849 in 2004 | Deferred financing costs, net of accumulated amortization of $1,280 in 2005 and $7,849 in 2004 | 4,755 | 5,628 | Deferred financing costs, net of accumulated amortization of $1,280 in 2005 and $7,849 in 2004 | 4,755 | 5,628 | |||||||||||
| Other assets | Other assets | 2,597 | 1,800 | Other assets | 2,597 | 1,800 | |||||||||||
| Total assets | $ | 250,169 | $ | 234,746 | Total assets | $ | 250,169 | $ | 234,746 | ||||||||
LIABILITIES AND STOCKHOLDERS' DEFICIT | |||||||||||||||||
Current liabilities: | |||||||||||||||||
| Accounts payable | $ | 19,243 | $ | 13,618 | |||||||||||||
| Accrued expenses and other current liabilities | 10,621 | 13,276 | |||||||||||||||
| Current portion of long-term debt | 8,245 | 10,421 | |||||||||||||||
| Capital lease obligations | 226 | 201 | |||||||||||||||
| Total current liabilities | 38,335 | 37,516 | |||||||||||||||
| Long-term debt, less current portion | 211,834 | 204,803 | |||||||||||||||
| Capital lease obligations, less current portion | 205 | 225 | |||||||||||||||
| Other non-current liabilities | 7,554 | 8,487 | |||||||||||||||
| Total liabilities | 257,928 | 251,031 | |||||||||||||||
Commitments and contingencies (Note 17) | — | — | |||||||||||||||
Class C redeemable preferred stock, $.01 par value; authorized shares: 900,000 in 2005 and 2004; none issued and outstanding | — | — | |||||||||||||||
Stockholders' deficit: | |||||||||||||||||
| Class A preferred stock, $.01 par value; authorized shares: 15,500 in 2005 and 2004; none issued and outstanding | — | — | |||||||||||||||
| Class B exchangeable convertible participating preferred stock, $.01 par value; authorized shares: 240,000 in 2005 and 2004; issued and outstanding shares: 240,000 in 2005 and 2004 | 2 | 2 | |||||||||||||||
| Class D preferred stock, $.01 par value; authorized shares: 240,000 in 2005 and 2004; none issued and outstanding | — | — | |||||||||||||||
| Class A voting common stock, $.01 par value; authorized shares: 20,000,000 in 2005 and 2004; issued and outstanding shares: 6,202,519 in 2005 and 6,188,653 in 2004 | 62 | 62 | |||||||||||||||
| Class B super voting common stock, $.01 par value; authorized shares: 2,500,000 in 2005 and 2004; issued and outstanding shares: 250 in 2005 and 2004 | — | — | |||||||||||||||
| Additional paid-in capital | 34,252 | 33,448 | |||||||||||||||
| Deferred compensation | (349 | ) | — | ||||||||||||||
| Accumulated other comprehensive loss | (2,532 | ) | (3,343 | ) | |||||||||||||
| Accumulated deficit | (39,194 | ) | (46,454 | ) | |||||||||||||
| Total stockholders' deficit | (7,759 | ) | (16,285 | ) | |||||||||||||
| Total liabilities and stockholders' deficit | $ | 250,169 | $ | 234,746 | |||||||||||||
See accompanying notes.
RBC Bearings Incorporated
Consolidated Balance Sheets (continued)
(dollars in thousands, except share and per share data)
| | April 2, 2005 | April 3, 2004 | |||||||
|---|---|---|---|---|---|---|---|---|---|
| LIABILITIES AND STOCKHOLDERS' DEFICIT | |||||||||
| Current liabilities: | |||||||||
| Accounts payable | $ | 19,243 | $ | 13,618 | |||||
| Accrued expenses and other current liabilities | 10,621 | 13,276 | |||||||
| Current portion of long-term debt | 8,245 | 10,421 | |||||||
| Capital lease obligations | 226 | 201 | |||||||
| Total current liabilities | 38,335 | 37,516 | |||||||
| Long-term debt, less current portion | 211,834 | 204,803 | |||||||
| Capital lease obligations, less current portion | 205 | 225 | |||||||
| Other non-current liabilities | 7,554 | 8,487 | |||||||
| Total liabilities | 257,928 | 251,031 | |||||||
Commitments and contingencies (Note 17) | — | — | |||||||
Stockholders' deficit: | |||||||||
| Class A preferred stock, $.01 par value; authorized shares: 15,500 in 2005 and 2004; none issued and outstanding | — | — | |||||||
| Class B exchangeable convertible participating preferred stock, $.01 par value; authorized shares: 240,000 in 2005 and 2004; issued and outstanding shares: 240,000 in 2005 and 2004 | 2 | 2 | |||||||
| Class C redeemable preferred stock, $.01 par value; authorized shares: 900,000 in 2005 and 2004; none issued and outstanding | — | — | |||||||
| Class D preferred stock, $.01 par value; authorized shares: 240,000 in 2005 and 2004; none issued and outstanding | — | — | |||||||
| Class A voting common stock, $.01 par value; authorized shares: 20,000,000 in 2005 and 2004; issued and outstanding shares: 6,202,519 in 2005 and 6,188,653 in 2004 | 62 | 62 | |||||||
| Class B super voting common stock, $.01 par value; authorized shares: 2,500,000 in 2005 and 2004; issued and outstanding shares: 250 in 2005 and 2004 | — | — | |||||||
| Additional paid-in capital | 34,252 | 33,448 | |||||||
| Deferred compensation | (349 | ) | — | ||||||
| Accumulated other comprehensive loss | (2,532 | ) | (3,343 | ) | |||||
| Accumulated deficit | (39,194 | ) | (46,454 | ) | |||||
| Total stockholders' deficit | (7,759 | ) | (16,285 | ) | |||||
| Total liabilities and stockholders' deficit | $ | 250,169 | $ | 234,746 | |||||
See accompanying notes.
RBC Bearings Incorporated
Consolidated Statements of Operations
(dollars in thousands, except share and per share data)
| | Fiscal Year Ended | ||||||||||||||||||||||||
|---|---|---|---|---|---|---|---|---|---|---|---|---|---|---|---|---|---|---|---|---|---|---|---|---|---|
| | | April 2, 2005 | April 3, 2004 (53 weeks) | March 29, 2003 | | Fiscal Year Ended | |||||||||||||||||||
| | | (Restated —Note 21) | | | | April 2, 2005 | April 3, 2004 (53 weeks) | March 29, 2003 | |||||||||||||||||
| Net sales | Net sales | $ | 243,016 | $ | 187,331 | $ | 172,860 | Net sales | $ | 243,016 | $ | 187,331 | $ | 172,860 | |||||||||||
| Cost of sales | Cost of sales | 174,602 | 135,433 | 124,086 | Cost of sales | 174,602 | 135,433 | 124,086 | |||||||||||||||||
| Gross margin | 68,414 | 51,898 | 48,774 | Gross margin | 68,414 | 51,898 | 48,774 | ||||||||||||||||||
| Operating expenses: | Operating expenses: | Operating expenses: | |||||||||||||||||||||||
| Selling, general and administrative | 32,749 | 28,107 | 26,647 | ||||||||||||||||||||||
| Other, net | 3,526 | 1,662 | 1,424 | ||||||||||||||||||||||
| Selling, general and administrative | Selling, general and administrative | 32,749 | 28,107 | 26,647 | |||||||||||||||||||||
| Other, net | Other, net | 3,526 | 1,662 | 1,424 | |||||||||||||||||||||
| Total operating expenses | 36,275 | 29,769 | 28,071 | Total operating expenses | 36,275 | 29,769 | 28,071 | ||||||||||||||||||
| Operating income | 32,139 | 22,129 | 20,703 | Operating income | 32,139 | 22,129 | 20,703 | ||||||||||||||||||
Interest expense, net | Interest expense, net | 19,669 | 20,380 | 21,023 | Interest expense, net | 19,669 | 20,380 | 21,023 | |||||||||||||||||
| Loss (gain) on early extinguishment of debt | Loss (gain) on early extinguishment of debt | 6,950 | — | (780 | ) | Loss (gain) on early extinguishment of debt | 6,950 | — | (780 | ) | |||||||||||||||
| Other non-operating expense (income) | Other non-operating expense (income) | (355 | ) | 16 | 298 | Other non-operating expense (income) | (355 | ) | 16 | 298 | |||||||||||||||
| Income before income taxes | 5,875 | 1,733 | 162 | Income before income taxes | 5,875 | 1,733 | 162 | ||||||||||||||||||
| Provision for (benefit from) income taxes | Provision for (benefit from) income taxes | (1,385 | ) | 1,070 | 113 | Provision for (benefit from) income taxes | (1,385 | ) | 1,070 | 113 | |||||||||||||||
| Net income | 7,260 | 663 | 49 | Net income | 7,260 | 663 | 49 | ||||||||||||||||||
Preferred stock dividends | Preferred stock dividends | (2,280 | ) | (2,144 | ) | (1,313 | ) | Preferred stock dividends | (2,280 | ) | (2,144 | ) | (1,313 | ) | |||||||||||
| Participation rights of preferred stock in undistributed earnings | Participation rights of preferred stock in undistributed earnings | (1,142 | ) | — | — | Participation rights of preferred stock in undistributed earnings | (1,142 | ) | — | — | |||||||||||||||
| Net income (loss) available to common stockholders | $ | 3,838 | $ | (1,481 | ) | $ | (1,264 | ) | Net income (loss) available to common stockholders | $ | 3,838 | $ | (1,481 | ) | $ | (1,264 | ) | ||||||||
Net income (loss) per common share: | Net income (loss) per common share: | Net income (loss) per common share: | |||||||||||||||||||||||
| Basic: | Basic | $ | 0.62 | $ | (0.24 | ) | $ | (0.20 | ) | ||||||||||||||||
| Class A common stock | $ | 0.62 | $ | (0.24 | ) | $ | (0.20 | ) | Diluted | $ | 0.35 | $ | (0.24 | ) | $ | (0.20 | ) | ||||||||
| Class B common stock | $ | 0.62 | $ | (0.24 | ) | $ | (0.20 | ) | |||||||||||||||||
| Diluted: | |||||||||||||||||||||||||
| Class A common stock | $ | 0.40 | $ | (0.24 | ) | $ | (0.20 | ) | |||||||||||||||||
| Class B common stock | $ | 0.00 | $ | (0.24 | ) | $ | (0.20 | ) | |||||||||||||||||
| Weighted average common shares: | Weighted average common shares: | Weighted average common shares: | |||||||||||||||||||||||
| Basic: | Basic | 6,202,615 | 6,188,903 | 6,188,903 | |||||||||||||||||||||
| Class A common stock | 6,202,365 | 6,188,653 | 6,188,653 | Diluted | 10,854,584 | 6,188,903 | 6,188,903 | ||||||||||||||||||
| Class B common stock | 250 | 250 | 250 | ||||||||||||||||||||||
| Diluted: | |||||||||||||||||||||||||
| Class A common stock | 9,552,579 | 6,188,653 | 6,188,653 | ||||||||||||||||||||||
| Class B common stock | 1,302,005 | 250 | 250 | ||||||||||||||||||||||
See accompanying notes.
RBC Bearings Incorporated
Consolidated Statements of Stockholders' Deficit and Comprehensive Income (Loss)
(dollars in thousands)(Restated for Fiscal Year Ended April 2, 2005—Note 21)
| | Preferred Stock | Common Stock | | | | | | | ||||||||||||||||||||||||||||||||||||||||||||||||||
|---|---|---|---|---|---|---|---|---|---|---|---|---|---|---|---|---|---|---|---|---|---|---|---|---|---|---|---|---|---|---|---|---|---|---|---|---|---|---|---|---|---|---|---|---|---|---|---|---|---|---|---|---|---|---|---|---|---|---|
| | | | Accumulated Other Comprehensive Loss | | | | Preferred Stock | Common Stock | | | Accumulated Other Comprehensive Loss | | | | ||||||||||||||||||||||||||||||||||||||||||||
| | Additional Paid-in Capital | Deferred Compensation | Accumulated Deficit | Total Stockholders' Deficit | Comprehensive Income/ (Loss) | Additional Paid-in Capital | Deferred Compensation | Accumulated Deficit | Total Stockholders' Deficit | Comprehensive Income/ (Loss) | ||||||||||||||||||||||||||||||||||||||||||||||||
| | Shares | Amount | Shares | Amount | Accumulated Other Comprehensive Loss | Shares | Amount | Shares | Amount | Accumulated Other Comprehensive Loss | ||||||||||||||||||||||||||||||||||||||||||||||||
| Balance at March 30, 2002 | — | $ | — | 6,188,903 | $ | 62 | $ | 10,561 | $ | — | $ | (1,024 | ) | $ | (47,166 | ) | $ | (37,567 | ) | — | $ | — | 6,188,903 | $ | 62 | $ | 10,561 | $ | — | $ | (1,024 | ) | $ | (47,166 | ) | $ | (37,567 | ) | ||||||||||||||||||||
| Net income | — | — | — | — | 49 | 49 | $ | 49 | — | — | — | — | — | — | — | 49 | 49 | $ | 49 | |||||||||||||||||||||||||||||||||||||||
| Issuance of Class B preferred stock | 240,000 | 2 | — | — | 22,887 | — | — | — | 22,889 | 240,000 | 2 | — | — | 22,887 | — | — | — | 22,889 | ||||||||||||||||||||||||||||||||||||||||
| Issuance of Class A preferred stock | — | — | — | — | 3,025 | — | — | — | 3,025 | — | — | — | — | 3,025 | — | — | — | 3,025 | ||||||||||||||||||||||||||||||||||||||||
| Repurchase of Class A preferred stock | — | — | — | — | (3,025 | ) | — | — | — | (3,025 | ) | — | — | — | — | (3,025 | ) | — | — | — | (3,025 | ) | ||||||||||||||||||||||||||||||||||||
| Currency translation adjustments | — | — | — | — | — | — | (1,455 | ) | — | (1,455 | ) | (1,455 | ) | — | — | — | — | — | — | (1,455 | ) | — | (1,455 | ) | (1,455 | ) | ||||||||||||||||||||||||||||||||
| Minimum pension liability adjustment, net of taxes of $1,043 | — | — | — | — | — | — | (1,565 | ) | — | (1,565 | ) | (1,565 | ) | — | — | — | — | — | — | (1,565 | ) | — | (1,565 | ) | (1,565 | ) | ||||||||||||||||||||||||||||||||
| Comprehensive loss | $ | (2,971 | ) | $ | (2,971 | ) | ||||||||||||||||||||||||||||||||||||||||||||||||||||
Balance at March 29, 2003 | 240,000 | 2 | 6,188,903 | 62 | 33,448 | — | (4,044 | ) | (47,117 | ) | (17,649 | ) | 240,000 | 2 | 6,188,903 | 62 | 33,448 | — | (4,044 | ) | (47,117 | ) | (17,649 | ) | ||||||||||||||||||||||||||||||||||
| Net income (53 weeks) | — | — | — | — | — | — | — | 663 | 663 | $ | 663 | — | — | — | — | — | — | — | 663 | 663 | $ | 663 | ||||||||||||||||||||||||||||||||||||
| Currency translation adjustments | — | — | — | — | — | — | 63 | — | 63 | 63 | — | — | — | — | — | — | 63 | — | 63 | 63 | ||||||||||||||||||||||||||||||||||||||
| Minimum pension liability adjustment, net of taxes of $425 | — | — | — | — | — | — | 638 | — | 638 | 638 | — | — | — | — | — | — | 638 | — | 638 | 638 | ||||||||||||||||||||||||||||||||||||||
| Comprehensive income | $ | 1,364 | $ | 1,364 | ||||||||||||||||||||||||||||||||||||||||||||||||||||||
Balance at April 3, 2004 | 240,000 | 2 | 6,188,903 | 62 | 33,448 | — | (3,343 | ) | (46,454 | ) | (16,285 | ) | 240,000 | 2 | 6,188,903 | 62 | 33,448 | — | (3,343 | ) | (46,454 | ) | (16,285 | ) | ||||||||||||||||||||||||||||||||||
| Net income | — | — | — | — | — | — | — | 7,260 | 7,260 | $ | 7,260 | — | — | — | — | — | — | — | 7,260 | 7,260 | $ | 7,260 | ||||||||||||||||||||||||||||||||||||
| Grants of options to purchase Class A common stock at below fair market value | — | — | — | — | 769 | (769 | ) | — | — | — | — | — | — | — | 769 | (769 | ) | — | — | — | ||||||||||||||||||||||||||||||||||||||
| Amortization of deferred stock compensation | — | — | — | — | — | 420 | — | — | 420 | — | — | — | — | — | 420 | — | — | 420 | ||||||||||||||||||||||||||||||||||||||||
| Exercise of stock options | — | — | 13,866 | — | 35 | — | — | — | 35 | — | — | 13,866 | — | 35 | — | — | — | 35 | ||||||||||||||||||||||||||||||||||||||||
| Currency translation adjustments | — | — | — | — | — | — | 488 | — | 488 | 488 | — | — | — | — | — | — | 488 | — | 488 | 488 | ||||||||||||||||||||||||||||||||||||||
| Minimum pension liability adjustment, net of taxes of $338 | — | — | — | — | — | — | 323 | — | 323 | 323 | — | — | — | — | — | — | 323 | — | 323 | 323 | ||||||||||||||||||||||||||||||||||||||
| Comprehensive income | $ | 8,071 | $ | 8,071 | ||||||||||||||||||||||||||||||||||||||||||||||||||||||
| Balance at April 2, 2005 | 240,000 | $ | 2 | 6,202,769 | $ | 62 | $ | 34,252 | $ | (349 | ) | $ | (2,532 | ) | $ | (39,194 | ) | $ | (7,759 | ) | 240,000 | $ | 2 | 6,202,769 | $ | 62 | $ | 34,252 | $ | (349 | ) | $ | (2,532 | ) | $ | (39,194 | ) | $ | (7,759 | ) | ||||||||||||||||||
See accompanying notes.
RBC Bearings Incorporated
Consolidated Statements of Cash Flows
(dollars in thousands)
| | Fiscal Year Ended | |||||||||||||||||||||||
|---|---|---|---|---|---|---|---|---|---|---|---|---|---|---|---|---|---|---|---|---|---|---|---|---|
| | | April 2, 2005 | April 3, 2004 (53 weeks) | March 29, 2003 | | Fiscal Year Ended | ||||||||||||||||||
| | | (Restated— Note 21) | | | | April 2, 2005 | April 3, 2004 (53 weeks) | March 29, 2003 | ||||||||||||||||
| Cash flows from operating activities: | Cash flows from operating activities: | Cash flows from operating activities: | ||||||||||||||||||||||
| Net income | Net income | $ | 7,260 | $ | 663 | $ | 49 | Net income | $ | 7,260 | $ | 663 | $ | 49 | ||||||||||
| Adjustments to reconcile net income to net cash provided by operating activities: | Adjustments to reconcile net income to net cash provided by operating activities: | Adjustments to reconcile net income to net cash provided by operating activities: | ||||||||||||||||||||||
| Depreciation | 8,285 | 8,838 | 8,714 | Depreciation | 8,285 | 8,838 | 8,714 | |||||||||||||||||
| Deferred income taxes (benefit) | (3,113 | ) | 2,219 | 401 | Deferred income taxes (benefit) | (3,113 | ) | 2,219 | 401 | |||||||||||||||
| Amortization of intangible assets | 500 | 344 | 105 | Amortization of intangible assets | 500 | 344 | 105 | |||||||||||||||||
| Amortization of deferred financing costs and debt discount | 1,113 | 1,580 | 3,304 | Amortization of deferred financing costs and debt discount | 1,113 | 1,580 | 3,304 | |||||||||||||||||
| Amortization of deferred stock compensation | 420 | — | — | Amortization of deferred stock compensation | 420 | — | — | |||||||||||||||||
| Loss on disposition of assets | 1,778 | 236 | 858 | Loss on disposition of assets | 1,778 | 236 | 858 | |||||||||||||||||
| Loss (gain) on early extinguishment of debt (non-cash portion) | 4,303 | — | — | Loss (gain) on early extinguishment of debt (non-cash portion) | 4,303 | — | — | |||||||||||||||||
| Other | 21 | — | 28 | Other | 21 | — | 28 | |||||||||||||||||
| Changes in operating assets and liabilities, net of acquisitions: | Changes in operating assets and liabilities, net of acquisitions: | |||||||||||||||||||||||
| Accounts receivable | (9,251 | ) | (4,447 | ) | 1,032 | Accounts receivable | (9,251 | ) | (4,447 | ) | 1,032 | |||||||||||||
| Inventory | (4,725 | ) | 44 | (8,713 | ) | Inventory | (4,725 | ) | 44 | (8,713 | ) | |||||||||||||
| Prepaid expenses and other current assets | 232 | 652 | (688 | ) | Prepaid expenses and other current assets | 232 | 652 | (688 | ) | |||||||||||||||
| Other non-current assets | (377 | ) | 2,718 | (2,631 | ) | Other non-current assets | (377 | ) | 2,718 | (2,631 | ) | |||||||||||||
| Accounts payable | 5,451 | (309 | ) | (1,009 | ) | Accounts payable | 5,451 | (309 | ) | (1,009 | ) | |||||||||||||
| Accrued expenses and other current liabilities | (1,879 | ) | (5,507 | ) | 1,693 | Accrued expenses and other current liabilities | (1,879 | ) | (5,507 | ) | 1,693 | |||||||||||||
| Other non-current liabilities | (150 | ) | 513 | 880 | Other non-current liabilities | (150 | ) | 513 | 880 | |||||||||||||||
| Net cash provided by operating activities | 9,868 | 7,544 | 4,023 | Net cash provided by operating activities | 9,868 | 7,544 | 4,023 | |||||||||||||||||
Cash flows from investing activities: | Cash flows from investing activities: | Cash flows from investing activities: | ||||||||||||||||||||||
| Acquisition of businesses, net of cash acquired | Acquisition of businesses, net of cash acquired | (755 | ) | (5,944 | ) | (2,822 | ) | Acquisition of businesses, net of cash acquired | (755 | ) | (5,944 | ) | (2,822 | ) | ||||||||||
| Purchase of property, plant and equipment | Purchase of property, plant and equipment | (9,526 | ) | (4,951 | ) | (6,522 | ) | Purchase of property, plant and equipment | (9,526 | ) | (4,951 | ) | (6,522 | ) | ||||||||||
| Proceeds from sale of assets | Proceeds from sale of assets | 274 | — | — | Proceeds from sale of assets | 274 | — | — | ||||||||||||||||
| Other | Other | — | 101 | 1,143 | Other | — | 101 | 1,143 | ||||||||||||||||
| Net cash used in investing activities | (10,007 | ) | (10,794 | ) | (8,201 | ) | Net cash used in investing activities | (10,007 | ) | (10,794 | ) | (8,201 | ) | |||||||||||
Cash flows from financing activities: | Cash flows from financing activities: | Cash flows from financing activities: | ||||||||||||||||||||||
| Net (decrease) increase in revolving credit facility | Net (decrease) increase in revolving credit facility | 2,500 | (6,083 | ) | (20,018 | ) | Net (decrease) increase in revolving credit facility | 2,500 | (6,083 | ) | (20,018 | ) | ||||||||||||
| Issuance of Class B preferred stock, net of fees | Issuance of Class B preferred stock, net of fees | — | — | 22,889 | Issuance of Class B preferred stock, net of fees | — | — | 22,889 | ||||||||||||||||
| Retirement of senior secured discount debentures | Retirement of senior secured discount debentures | — | — | (28,766 | ) | Retirement of senior secured discount debentures | — | — | (28,766 | ) | ||||||||||||||
| Issuance of Class A preferred stock | Issuance of Class A preferred stock | — | — | 3,025 | Issuance of Class A preferred stock | — | — | 3,025 | ||||||||||||||||
| Repurchase of Class A preferred stock | Repurchase of Class A preferred stock | — | — | (3,025 | ) | Repurchase of Class A preferred stock | — | — | (3,025 | ) | ||||||||||||||
| Proceeds from exercise of stock options | Proceeds from exercise of stock options | 35 | — | — | Proceeds from exercise of stock options | 35 | — | — | ||||||||||||||||
| Retirement of senior subordinated notes payable | Retirement of senior subordinated notes payable | (110,000 | ) | — | — | Retirement of senior subordinated notes payable | (110,000 | ) | — | — | ||||||||||||||
| Proceeds from new credit facility | Proceeds from new credit facility | 155,000 | — | — | Proceeds from new credit facility | 155,000 | — | — | ||||||||||||||||
| Proceeds from senior credit facility | Proceeds from senior credit facility | — | 10,000 | 40,664 | Proceeds from senior credit facility | — | 10,000 | 40,664 | ||||||||||||||||
| Payments on term loans | Payments on term loans | (43,190 | ) | (7,741 | ) | (5,328 | ) | Payments on term loans | (43,190 | ) | (7,741 | ) | (5,328 | ) | ||||||||||
| Principal payments on capital lease obligations | Principal payments on capital lease obligations | (282 | ) | (173 | ) | (457 | ) | Principal payments on capital lease obligations | (282 | ) | (173 | ) | (457 | ) | ||||||||||
| Restructure of foreign debt | Restructure of foreign debt | — | — | 7,127 | Restructure of foreign debt | — | — | 7,127 | ||||||||||||||||
| Financing fees paid in connection with senior credit facility | Financing fees paid in connection with senior credit facility | (4,400 | ) | (1,090 | ) | (3,226 | ) | Financing fees paid in connection with senior credit facility | (4,400 | ) | (1,090 | ) | (3,226 | ) | ||||||||||
| Proceeds from Swiss credit facility | Proceeds from Swiss credit facility | — | 7,971 | — | Proceeds from Swiss credit facility | — | 7,971 | — | ||||||||||||||||
| Retirement of RBCA's senior credit facility | Retirement of RBCA's senior credit facility | — | — | (10,974 | ) | Retirement of RBCA's senior credit facility | — | — | (10,974 | ) | ||||||||||||||
| Net cash provided by (used in) financing activities | (337 | ) | 2,884 | 1,911 | Net cash provided by (used in) financing activities | (337 | ) | 2,884 | 1,911 | |||||||||||||||
| Effect of exchange rate changes on cash | Effect of exchange rate changes on cash | (139 | ) | 63 | (1,365 | ) | Effect of exchange rate changes on cash | (139 | ) | 63 | (1,365 | ) | ||||||||||||
Cash and cash equivalents: | Cash and cash equivalents: | Cash and cash equivalents: | ||||||||||||||||||||||
| Decrease during the year | Decrease during the year | (615 | ) | (303 | ) | (3,632 | ) | Decrease during the year | (615 | ) | (303 | ) | (3,632 | ) | ||||||||||
| Cash, at beginning of year | Cash, at beginning of year | 3,250 | 3,553 | 7,185 | Cash, at beginning of year | 3,250 | 3,553 | 7,185 | ||||||||||||||||
| Cash, at end of year | Cash, at end of year | $ | 2,635 | $ | 3,250 | $ | 3,553 | Cash, at end of year | $ | 2,635 | $ | 3,250 | $ | 3,553 | ||||||||||
Supplemental disclosures of cash flow information: | Supplemental disclosures of cash flow information: | Supplemental disclosures of cash flow information: | ||||||||||||||||||||||
| Cash paid during the year for: | Cash paid during the year for: | Cash paid during the year for: | ||||||||||||||||||||||
| Interest | $ | 20,301 | $ | 19,073 | $ | 15,745 | Interest | $ | 20,301 | $ | 19,073 | $ | 15,745 | |||||||||||
| Income taxes | $ | 207 | $ | 321 | $ | 671 | Income taxes | $ | 207 | $ | 321 | $ | 671 | |||||||||||
See accompanying notes.
RBC Bearings Incorporated
Notes to Consolidated Financial Statements
(dollars in thousands, except share and per share data)
1. Organization and Business
RBC Bearings Incorporated ("Company", collectively with its subsidiaries), is a Delaware corporation. The Company operates in four reportable business segments—roller bearings, plain bearings, ball bearings, other and corporate—in which it manufactures roller bearing components and assembled parts and designs and manufactures high-precision roller and ball bearings. The Company sells to a wide variety of original equipment manufacturers ("OEMs") and distributors who are widely dispersed geographically. In fiscal 2005, 2004 and 2003, no one customer accounted for more than 5.0% of the Company's sales. The Company's segments are further discussed in Note 20.
2. Summary of Significant Accounting Policies
General
The consolidated financial statements include the accounts of RBC Bearings Incorporated, Roller Bearing Company of America, Inc. ("RBCA") and its wholly-owned subsidiaries, Industrial Tectonics Bearings Corporation ("ITB"), RBC Linear Precision Products, Inc. ("LPP"), RBC Nice Bearings, Inc. ("Nice"), Bremen Bearings, Inc. ("Bremen"), Miller Bearings, Inc. ("Miller"), Tyson Bearings., Inc. ("Tyson"), Schaublin, RBC de Mexico ("Mexico"), RBC Oklahoma, Inc. ("RBC Oklahoma") and RBC Aircraft Products, Inc. ("API"), as well as its Transport Dynamics ("TDC"), Heim ("Heim") and Engineered Components ("ECD") and US Bearings ("USB") divisions. All material intercompany balances and transactions have been eliminated in consolidation.
The Company has a fiscal year consisting of 52 or 53 weeks, ending on the Saturday closest to March 31. Based on this policy, fiscal years 2005 and 2003 contained 52 weeks and fiscal year 2004 contained 53 weeks.
Cash and Cash Equivalents
The Company considers all highly liquid investments purchased with an original maturity of three months or less to be cash equivalents.
Inventory
Inventories are stated at the lower of cost or market, using the first-in, first-out method.
Shipping and Handling
The sales price billed to customers includes the costs associated with shipping and handling, which is included in net sales. The costs to the Company for shipping and handling are included in cost of sales.
Property, Plant and Equipment
Property, plant and equipment are recorded at cost. Depreciation and amortization of property, plant and equipment, including equipment under capital leases, is provided for by the straight-line method over the estimated useful lives of the respective assets or the lease term, if shorter. Amortization of assets under capital leases is reported within depreciation and amortization. The cost of equipment under capital leases is equal to the lower of the net present value of the minimum lease
payments or the fair market value of the leased equipment at the inception of the lease. Expenditures for normal maintenance and repairs are charged to expense as incurred.
The estimated useful lives of the Company's property, plant and equipment follows:
| Buildings | ||
| Machinery and equipment | ||
| Leasehold improvements | Shorter of the term of lease or estimated useful life |
Recognition of Revenue and Accounts Receivable and Concentration of Credit Risk
The Company recognizes revenue only after the following four basic criteria are met:
Revenue is recognized upon the passage of title, which is at the time of shipment. Accounts receivable, net of applicable allowances, is recorded when goods are shipped.
The Company sells to a large number of OEMs and distributors who service the aftermarket. The Company's credit risk associated with accounts receivable is minimized due to its customer base and wide geographic dispersion. The Company performs ongoing credit evaluations of its customers' financial condition and generally does not require collateral or charge interest on outstanding amounts. At April 2, 2005 and April 3, 2004, the Company had no significant concentrations of credit risk.
Allowance for Doubtful Accounts
The Company maintains an allowance for doubtful accounts for estimated losses resulting from the inability of its customers to make required payments. The Company reviews the collectibility of its receivables on an ongoing basis taking into account a combination of factors. The Company reviews potential problems, such as past due accounts, a bankruptcy filing or deterioration in the customer's financial condition, to ensure the Company is adequately accrued for potential loss. Accounts are considered past due based on when payment was originally due. If a customer's situation changes, such as a bankruptcy or creditworthiness, or there is a change in the current economic climate, the Company may modify its estimate of the allowance for doubtful accounts. The Company will write-off accounts receivable after reasonable collection efforts have been made and the accounts are deemed uncollectible.
Goodwill and Amortizable Intangible Assets
Goodwill (representing the excess of the amount paid to acquire a company over the estimated fair value of the net assets acquired) and intangible assets with indefinite useful lives are not amortized but instead are tested for impairment annually, or when events or circumstances indicate that its value may
have declined. Impairment exists when the carrying amount of goodwill exceeds its fair market value. The Company's goodwill impairment test is performed by comparing the net present value of projected cash flows to the carrying value of goodwill. The Company utilizes discount rates determined by management to be similar with the level of risk in its current business model. The Company performs the annual impairment testing during the fourth quarter of each fiscal year and has determined that, to date, no impairment of goodwill exists. Although no changes are expected, if the actual results of the Company are less favorable than the assumptions the Company makes regarding estimated cash flows, the Company may be required to record an impairment charge in the future.
Definite-lived intangible assets are being amortized on a straight-line basis over their estimated useful lives of 5 to 15 years. Also included in intangible assets is an asset relating to the Company's minimum pension liability, as further described in Note 13.
Deferred Financing Costs
Deferred financing costs are amortized by the effective interest method over the lives of the related credit agreements (5 to 23 years).
Income Taxes
The Company accounts for income taxes using the liability method, which requires it to recognize a current tax liability or asset for current taxes payable or refundable and a deferred tax liability or asset for the estimated future tax effects of temporary differences between the financial statement and tax reporting bases of assets and liabilities to the extent that they are realizable. Deferred tax expense (benefit) results from the net change in deferred tax assets and liabilities during the year.
Temporary differences relate primarily to the timing of deductions for depreciation, goodwill amortization relating to the acquisition of operating divisions, basis differences arising from acquisition accounting, pension and retirement benefits, and various accrued and prepaid expenses. Deferred tax assets and liabilities are recorded at the rates expected to be in effect when the temporary differences are expected to reverse.
Net Income (Loss) Per Common Share
Basic net income (loss) per common share for both Class A and Class B common stock is computed by dividing net income (loss) available to common stockholders for each class of(both Class A and Class B common stockstockholders share equally in net income (loss)) by the weighted-average number of common shares outstanding for each class of common stock.outstanding. The Company also has outstanding Class B convertible participating preferred stock (the Class B preferred stock participates in all undistributed earnings with the Class A and Class B common stock). The Company allocates earnings to Class Acommon stockholders and the Class B commonconvertible participating preferred stockholders under the two-class method as required by Emerging Issues Task Force Issue No. 03-6, "Participating Securities and the Two-Class Method under FASB Statement No. 128." The two-class method is an earnings allocation method under which basic net income per share is calculated for the Company's Class A and Class B common stock and its Class B convertible participating preferred stock considering both accrued preferred stock dividends and participation rights in undistributed earnings as if all such earnings had been distributed during the year. Since the Company's Class B convertible participating preferred stock is not contractually
is not contractually responsible to share in the Company's losses, in applying the two-class method to compute basic net income per common share, no allocation is made to the Class B preferred stock if a net loss exists or if an undistributed net loss results from reducing net income by the accrued preferred stock dividends.
Diluted net income (loss) per common share for the Class A common stock is computed by dividing net income (loss) by the sum of the weighted-average number of Class A common shares, dilutive Class A common share equivalents then outstanding using the treasury stock method and the assumed conversion of the Class B convertible participating preferred stock to Class A common shares (if-converted method). If the if-converted method is anti-dilutive (that is, the if-converted method results in a higher net income per common share amount than basic net income per share calculated under the two-class method), then the two-class method is used to compute diluted net income (loss) per Class A common share, including the effect of Class A common share equivalents. Diluted net income (loss) per common share for the Class B common stock is computed under the two-class method, including the effect of Class B common share equivalents. Common share equivalents consist of the incremental Class A and Class B common shares issuable upon the exercise of stock options and warrants.
If the above calculations result in a net loss available to Class A and Class B common stockholders (due to a net loss for the period or the effect of accrued preferred stock dividends) and if the effect of including common shares equivalents and the assumed conversion of preferred stock, or use of the two-class method, is anti-dilutive, then diluted net loss per Class A and Class B common share will equal basic net loss per Class A and Class B common share.
The table below reflects the calculation of weighted-average shares outstanding for each year presented as well as the computation of basic and diluted net income (loss) per common share:
| | Fiscal Year Ended | ||||||||||
|---|---|---|---|---|---|---|---|---|---|---|---|
| | April 2, 2005 | April 3, 2004 (53 weeks) | March 29, 2003 | ||||||||
| Numerator: | |||||||||||
| Net income | $ | 7,260 | $ | 663 | $ | 49 | |||||
| Preferred stock dividends | (2,280 | ) | (2,144 | ) | (1,313 | ) | |||||
| Participation rights of preferred stock in undistributed earnings* | (1,142 | ) | — | — | |||||||
| Numerator for basic and diluted net income (loss) per common share—income (loss) available to common stockholders under the two-class method(a) | 3,838 | (1,481 | ) | (1,264 | ) | ||||||
| Preferred stock dividends and participation rights of preferred stock | 3,422 | 2,144 | 1,313 | ||||||||
| Numerator for diluted net income (loss) per common share—income (loss) available to common stockholders after assumed conversion of preferred stock(b) | $ | 7,260 | $ | 663 | $ | 49 | |||||
| Allocation of (a): | |||||||||||
| Class A common stock | $ | 3,838 | $ | (1,481 | ) | $ | (1,264 | ) | |||
| Class B common stock | ** | ** | ** | ||||||||
| $ | 3,838 | $ | (1,481 | ) | $ | (1,264 | ) | ||||
| Allocation of (b): | |||||||||||
| Class A common stock | $ | 7,260 | $ | 663 | $ | 49 | |||||
| Class B common stock | ** | ** | ** | ||||||||
| $ | 7,260 | $ | 663 | $ | 49 | ||||||
| | Fiscal Year Ended | ||||||||||
|---|---|---|---|---|---|---|---|---|---|---|---|
| | April 2, 2005 | April 3, 2004 (53 weeks) | March 29, 2003 | ||||||||
| Numerator: | |||||||||||
| Net income | $ | 7,260 | $ | 663 | $ | 49 | |||||
| Preferred stock dividends | (2,280 | ) | (2,144 | ) | (1,313 | ) | |||||
| Participation rights of preferred stock in undistributed earnings* | (1,142 | ) | — | — | |||||||
| Numerator for basic and diluted net income (loss) per common share—income (loss) available to common stockholders under the two-class method | 3,838 | (1,481 | ) | (1,264 | ) | ||||||
| Preferred stock dividends and participation rights of preferred stock | 3,422 | 2,144 | 1,313 | ||||||||
| Numerator for diluted net income (loss) per common share—income (loss) available to common stockholders after assumed conversion of preferred stock | $ | 7,260 | $ | 663 | $ | 49 | |||||
| Denominator: | |||||||||||
| Denominator for basic net income (loss) per common share—weighted-average shares(c) | 6,202,615 | 6,188,903 | 6,188,903 | ||||||||
| Effect of dilution due to employee stock options and warrants | 2,805,574 | 2,185,327 | 2,703,079 | ||||||||
| Effect of dilution due to convertible preferred stock | 1,846,395 | 1,846,395 | 1,229,245 | ||||||||
| Denominator for diluted net income (loss) per common share—adjusted weighted-average shares(d) | 10,854,584 | 10,220,625 | 10,121,227 | ||||||||
| Allocation of (c): | |||||||||||
| Class A common stock | 6,202,365 | 6,188,653 | 6,188,653 | ||||||||
| Class B common stock | 250 | 250 | 250 | ||||||||
| 6,202,615 | 6,188,903 | 6,188,903 | |||||||||
| Allocation of (d): | |||||||||||
| Class A common stock | 9,552,579 | 9,180,837 | 8,837,000 | ||||||||
| Class B common stock | 1,302,005 | 1,039,788 | 1,284,227 | ||||||||
| 10,854,584 | 10,220,625 | 10,121,227 | |||||||||
| Basic net income (loss) per common share: | |||||||||||
| Class A common stock | $ | 0.62 | $ | (0.24 | ) | $ | (0.20 | ) | |||
| Class B common stock | $ | 0.62 | $ | (0.24 | ) | $ | (0.20 | ) | |||
| Diluted net income (loss) per common share: | |||||||||||
| Class A common stock | $ | 0.40 | $ | (0.24 | ) | $ | (0.20 | ) | |||
| Class B common stock | $ | 0.00 | $ | (0.24 | ) | $ | (0.20 | ) | |||
| | Fiscal Year Ended | ||||||||||
|---|---|---|---|---|---|---|---|---|---|---|---|
| | April 2, 2005 | April 3, 2004 (53 weeks) | March 29, 2003 | ||||||||
| Denominator: | |||||||||||
| Denominator for basic net income (loss) per common share—weighted-average shares | 6,202,615 | 6,188,903 | 6,188,903 | ||||||||
| Effect of dilution due to employee stock options and warrants | 2,805,574 | 2,185,327 | 2,703,079 | ||||||||
| Effect of dilution due to convertible preferred stock | 1,846,395 | 1,846,395 | 1,229,245 | ||||||||
| Denominator for diluted net income (loss) per common share—adjusted weighted-average shares | 10,854,584 | 10,220,625 | 10,121,227 | ||||||||
| Basic net income (loss) per common share | $ | 0.62 | $ | (0.24 | ) | $ | (0.20 | ) | |||
| Diluted net income (loss) per common share | $ | 0.35 | $ | (0.24 | ) | $ | (0.20 | ) | |||
For additional disclosures regarding the outstanding preferred stock and the employee stock options and warrants, see Note 16.
Use of Estimates
The preparation of financial statements in conformity with generally accepted accounting principles requires management to make estimates and assumptions that affect the reported amounts of assets and liabilities, and disclosure of contingent assets and liabilities, at the date of the financial statements,
and the reported amounts of revenues and expenses during the reporting period. Actual results could differ from those estimates. Estimates are used for, but not limited to, the accounting for the allowance for doubtful accounts, valuation of inventories, accrued expenses, depreciation and amortization, income taxes and tax valuation reserves, pension and post-retirement obligations and the valuation of options and warrants.
Impairment of Long-Lived Assets
The Company assesses the net realizable value of its long-lived assets and evaluates such assets for impairment whenever indicators of impairment are present.
For amortizable long-lived assets to be held and used, if indicators of impairment are present, management determines whether the sum of the estimated undiscounted future cash flows are less than the carrying amount. The amount of asset impairment, if any, is based on the excess of the carrying amount over its fair value, which is estimated based on projected discounted future operating cash flows using a discount rate reflecting the Company's average cost of funds. To date, no indicators of impairment exist.
Long-lived assets to be disposed of by sale or other means are reported at the lower of carrying amount or fair value, less costs to sell.
Foreign Currency Translation and Transactions
Assets and liabilities of the Company's foreign operations are translated into U.S. dollars using the exchange rate in effect at the balance sheet date. Results of operations are translated using the average exchange rate prevailing throughout the period. The effects of exchange rate fluctuations on translating foreign currency assets and liabilities into U.S. dollars are included in accumulated other comprehensive loss, while gains and losses resulting from foreign currency transactions, which were not material for any of the fiscal years presented, are included in selling, general and administrative expenses. Net income of the Company's foreign operations for fiscal 2005, 2004 and 2003 amounted to $2,148, $2,242 and $3,068, respectively. Net assets of the Company's foreign operations were $24,368 and $22,960 at April 2, 2005 and April 3, 2004, respectively.
Fair Value of Financial Instruments
The carrying amounts reported in the balance sheet for cash, accounts receivable, prepaids and other current assets, and accounts payable and accruals approximate their fair value.
The carrying amounts of the Company's Senior Subordinatedsenior subordinated notes payable and discount debentures approximate fair value and are estimated based on the quoted market price of similar debt instruments. The carrying amounts of the Company's borrowings under its New Credit Facility, Senior Credit Facility, Swiss Credit Facility and Industrial Development Revenue Bonds approximate fair value, as these obligations have interest rates which vary in conjunction with current market conditions.
Early Extinguishment of Debt
Statement of Financial Accounting Standards ("SFAS") No. 145, "Rescission of FASB Statements No. 4, 44 and 64, Amendment of FASB Statement No. 13 and Technical Corrections", addresses the reporting of gains and losses resulting from the extinguishment of debt, accounting for sale-leaseback transactions and rescinds or amends other existing authoritative pronouncements. SFAS No. 145 requires that any gain or loss on extinguishment of debt that does not meet the criteria of Accounting Principles Board Opinion ("APB") No. 30 for classification as an extraordinary item shall not be classified as extraordinary and shall be included in earnings from continuing operations. The (loss) gain on early extinguishment of debt in fiscal year 2005 and 2003, respectively, have been classified as non-operating income in the accompanying consolidated statements of operations.
Accumulated Other Comprehensive Loss
The components of comprehensive income (loss) that relate to the Company are net income, foreign currency translation adjustments and pension plan additional minimum liability, all of which are presented in the consolidated statements of stockholders' deficit and comprehensive income (loss).
The following summarizes the activity within each component of accumulated other comprehensive income (loss):
| | Currency Translation | Minimum Pension Liability | Total | |||||||
|---|---|---|---|---|---|---|---|---|---|---|
| Balance at March 30, 2002 | $ | 88 | $ | (1,112 | ) | $ | (1,024 | ) | ||
| Currency translation | (1,455 | ) | — | (1,455 | ) | |||||
| Minimum pension liability | — | (1,565 | ) | (1,565 | ) | |||||
| Balance at March 29, 2003 | (1,367 | ) | (2,677 | ) | (4,044 | ) | ||||
| Currency translation | 63 | — | 63 | |||||||
| Minimum pension liability | — | 638 | 638 | |||||||
| Balance at April 3, 2004 | (1,304 | ) | (2,039 | ) | (3,343 | ) | ||||
| Currency translation | 488 | — | 488 | |||||||
| Minimum pension liability | — | 323 | 323 | |||||||
| Balance at April 2, 2005 | $ | (816 | ) | $ | (1,716 | ) | $ | (2,532 | ) | |
Stock-Based Compensation
The Company accounts for options and warrants granted to employees using the intrinsic value method pursuant to APB No. 25, "Accounting for Stock Issued to Employees," under which compensation cost is recognized only if the exercise price of grants issued is below the fair market value of the Company's common stock at the date of grant. Had compensation cost for these grants been determined based on the fair value at the grant dates consistent with SFAS No. 123, "Accounting
for Stock-Based Compensation," the Company's net income would have been reduced to the following pro forma amounts:
| | | Fiscal Year Ended | Fiscal Year Ended | |||||||||||||||||||
|---|---|---|---|---|---|---|---|---|---|---|---|---|---|---|---|---|---|---|---|---|---|---|
| | | April 2, 2005 | April 3, 2004 | March 29, 2003 | April 2, 2005 | April 3, 2004 | March 29, 2003 | |||||||||||||||
| Net income, as reported | Net income, as reported | $ | 7,260 | $ | 663 | $ | 49 | $ | 7,260 | $ | 663 | $ | 49 | |||||||||
| Plus: stock-based compensation expense included in reported net income, net of tax | Plus: stock-based compensation expense included in reported net income, net of tax | 264 | — | — | 264 | — | — | |||||||||||||||
| Less: stock-based compensation expense determined under fair value method, net of tax | Less: stock-based compensation expense determined under fair value method, net of tax | (540 | ) | (131 | ) | (56 | ) | (540 | ) | (131 | ) | (56 | ) | |||||||||
| Pro forma net income (loss) | Pro forma net income (loss) | $ | 6,984 | $ | 532 | $ | (7 | ) | $ | 6,984 | $ | 532 | $ | (7 | ) | |||||||
| Net income (loss) per common share, as reported: | Net income (loss) per common share, as reported: | |||||||||||||||||||||
| Basic: | ||||||||||||||||||||||
| Class A common stock | $ | 0.62 | $ | (0.24 | ) | $ | (0.20 | ) | ||||||||||||||
| Class B common stock | $ | 0.62 | $ | (0.24 | ) | $ | (0.20 | ) | ||||||||||||||
| Diluted: | ||||||||||||||||||||||
| Class A common stock | $ | 0.40 | $ | (0.24 | ) | $ | (0.20 | ) | ||||||||||||||
| Class B common stock | $ | 0.00 | $ | (0.24 | ) | $ | (0.20 | ) | ||||||||||||||
| Basic | $ | 0.62 | $ | (0.24 | ) | $ | (0.20 | ) | ||||||||||||||
| Diluted | $ | 0.35 | $ | (0.24 | ) | $ | (0.20 | ) | ||||||||||||||
| Net income (loss) per common share, pro forma: | Net income (loss) per common share, pro forma: | |||||||||||||||||||||
| Basic: | ||||||||||||||||||||||
| Class A common stock | $ | 0.57 | $ | (0.26 | ) | $ | (0.21 | ) | ||||||||||||||
| Class B common stock | $ | 0.57 | $ | (0.26 | ) | $ | (0.21 | ) | ||||||||||||||
| Diluted: | ||||||||||||||||||||||
| Class A common stock | $ | 0.37 | $ | (0.26 | ) | $ | (0.21 | ) | ||||||||||||||
| Class B common stock | $ | 0.00 | $ | (0.26 | ) | $ | (0.21 | ) | ||||||||||||||
| Basic | $ | 0.57 | $ | (0.26 | ) | $ | (0.21 | ) | ||||||||||||||
| Diluted | $ | 0.33 | $ | (0.26 | ) | $ | (0.21 | ) | ||||||||||||||
For purposes of the pro forma disclosures, the estimated fair value of the options and warrants is amortized to expense over the service period that generally is the option or warrant vesting period. The weighted average fair value per share of options and warrants granted was $8.17 in fiscal 2005, $1.58 in fiscal 2004 and $1.18 in fiscal 2003.
The fair value for the Company's options and warrants was estimated at the date of grant using the Black-Scholes option pricing model with the following weighted-average assumptions.
| | Fiscal Year Ended | ||||||
|---|---|---|---|---|---|---|---|
| | April 2, 2005 | April 3, 2004 | March 29, 2003 | ||||
| Dividend yield | 0.0 | % | 0.0 | % | 0.0 | % | |
| Expected weighted-average life | 3.0 | 3.0 | 3.0 | ||||
| Risk-free interest rate | 3.5 | % | 3.5 | % | 3.5 | % | |
| Expected volatility | 0.4 | % | 0.1 | % | 0.1 | % | |
The Black-Scholes option pricing model was developed for use in estimating the fair value of traded options and warrants which have no vesting restrictions and are fully transferable. In addition,
option and warrant valuation models require the input of highly subjective assumptions, including the expected stock price volatility. Because our warrants have characteristics significantly different from those of traded options and warrants, and because changes in the subjective input assumptions can materially affect the fair value estimate, the existing models do not necessarily provide a reliable single measure of the fair value of its options and warrants.
Recent Accounting Pronouncements
In November 2004, the Financial Accounting Standards Board ("FASB") issued SFAS No. 151, "Inventory Costs, an amendment of ARB No. 43, Chapter 4." The amendments made by SFAS No. 151 clarify that abnormal amounts of idle facility expense, freight, handling costs, and wasted materials (spoilage) should be recognized as current-period charges and require the allocation of fixed production overheads to inventory based on the normal capacity of the production facilities. The guidance is effective for inventory costs incurred during fiscal years beginning after June 15, 2005. It is not believed that the adoption of SFAS No. 151 will have a material impact on the consolidated financial position, results of operations or cash flows of the Company.
In December 2004, the FASB issued SFAS No. 123 (revised 2004), "Share-Based Payment." SFAS No. 123(R) will require that the compensation cost relating to share-based payment transactions be recognized in financial statements. That cost will be measured based on the fair value of the equity or liability instruments issued. SEAS No. 123(R) covers a wide range of share-based compensation arrangements including share options, restricted share plans, performance-based awards, share appreciation rights, and employee share purchase plans. SFAS No. 123(R) replaces FASB Statement No. 123, "Accounting for Stock-Based Compensation", and supersedes APB Opinion No. 25, "Accounting for Stock Issued to Employees." SFAS No. 123, as originally issued in 1995, established as preferable a fair value-based method of accounting for share-based payment transactions with employees. However, that Statement permitted entities the option of continuing to apply the guidance in APB Opinion No. 25, as long as the footnotes to financial statements disclosed what net income
would have been had the preferable fair value-based method been used. Public entities will be required to apply SFAS No. 123(R) as of the beginning of the first fiscal year beginning after June 15, 2005. SFAS No. 123(R) permits public companies to adopt its requirements using one of two methods:
The Company is currently evaluating these transition methods and determining the effect on the Company's consolidated results of operations and whether the adoption will result in amounts that are similar to the current pro forma disclosures under SFAS No. 123. For fiscal 2005, the Company will
continue to disclose stock-based compensation information in accordance with SFAS No. 148, "Accounting for Stock-Based Compensation—Transition and Disclosure—an Amendment of FASB Statement No. 123," and SFAS No. 123.
3. Acquisitions
Effective December 22, 2004, RBCA purchased certain net assets of the US Bearings division of Network Electronic Corporation, a manufacturer of lined and unlined spherical, rod-end and other specialty bearings located in Chatsworth, California. The total consideration paid was $1,228. The purchase price allocation is as follows: inventory ($522), property, plant and equipment ($585), intangible assets ($438) and accrued expenses ($317). All of the products associated with the acquisition are complementary with products already provided by other Company businesses. US Bearings is included in the plain bearings reportable segment.
Effective December 22, 2003, API, a wholly-owned subsidiary of RBCA, purchased the airframe control bearing business of The Timken Company, located in Torrington, CT. The total consideration paid was $5,471 after the final purchase price adjustment of $473 in 2005. The purchase price allocation is as follows: accounts receivable ($379), inventory ($3,911), property, plant and equipment ($2,439), intangible assets ($1,136) and accrued expenses ($2,394). The products associated with the acquisition are complementary with products already provided by other Company businesses. API is included in the roller bearings reportable segment.
In a transaction effective in December 2002, RBCA, through its wholly-owned subsidiary, Schaublin, SA, purchased all of the outstanding capital stock of myonic SAS ("Myonic"). The capital stock of Myonic was purchased from myonic AG, a Swiss corporation. Myonic is engaged in the sale of bearings manufactured by Schaublin and third parties. The total consideration paid by the Company was $2,822, of which $1,722 was allocated to goodwill, which is expected to be deductible for income tax purposes. The corporate name of Myonic has since been changed to RBC France SAS. RBC France is included in the plain bearings reportable segment.
The results of operations subsequent to the effective dates of the acquisitions are included in the results of operations of the Company. Unaudited pro forma consolidated results of operations of the Company, based upon pre-acquisition unaudited historical information provided for the years ended April 2, 2005, April 3, 2004 and March 29, 2003, as if the USB, API and Myonic acquisitions took place on March 31, 2002, are as follows:
| | | Fiscal Year Ended | Fiscal Year Ended | |||||||||||||||||
|---|---|---|---|---|---|---|---|---|---|---|---|---|---|---|---|---|---|---|---|---|
| | | April 2, 2005 | April 3, 2004 | March 29, 2003 | April 2, 2005 | April 3, 2004 | March 29, 2003 | |||||||||||||
| Net sales | Net sales | $ | 244,566 | $ | 211,451 | $ | 209,867 | $ | 244,566 | $ | 211,451 | $ | 209,867 | |||||||
| Net income | Net income | $ | 7,352 | $ | 3,290 | $ | 4,081 | $ | 7,352 | $ | 3,290 | $ | 4,081 | |||||||
| Net income per common share: | Net income per common share: | |||||||||||||||||||
| Basic: | ||||||||||||||||||||
| Class A common stock | $ | 0.63 | $ | 0.14 | $ | 0.34 | ||||||||||||||
| Class B common stock | $ | 0.63 | $ | 0.14 | $ | 0.34 | ||||||||||||||
| Diluted: | ||||||||||||||||||||
| Class A common stock | $ | 0.41 | $ | 0.10 | $ | 0.24 | ||||||||||||||
| Class B common stock | $ | 0.00 | $ | 0.00 | $ | 0.00 | ||||||||||||||
| Basic | $ | 0.63 | $ | 0.14 | $ | 0.34 | ||||||||||||||
| Diluted | $ | 0.36 | $ | 0.09 | $ | 0.21 | ||||||||||||||
4. Allowance for Doubtful Accounts
The activity in the allowance for doubtful accounts consists of the following:
| Fiscal Year Ended | Balance at Beginning of Year | Additions | Write-offs | Balance at End of Year | ||||||||
|---|---|---|---|---|---|---|---|---|---|---|---|---|
| April 2, 2005 | $ | 770 | $ | 472 | $ | (614 | ) | $ | 628 | |||
| April 3, 2004 | 744 | 378 | (352 | ) | 770 | |||||||
| March 29, 2003 | 621 | 123 | — | 744 | ||||||||
5. Inventory
Inventory consists of the following:
| | April 2, 2005 | April 3, 2004 | ||||
|---|---|---|---|---|---|---|
| Raw materials | $ | 5,598 | $ | 3,611 | ||
| Work in process | 27,959 | 25,798 | ||||
| Finished goods | 62,097 | 61,095 | ||||
| $ | 95,654 | $ | 90,504 | |||
6. Property, Plant and Equipment
Property, plant and equipment consist of the following:
| | April 2, 2005 | April 3, 2004 | ||||
|---|---|---|---|---|---|---|
| Land | $ | 7,176 | $ | 6,983 | ||
| Buildings and improvements | 16,136 | 15,492 | ||||
| Machinery and equipment | 108,701 | 105,143 | ||||
| 132,013 | 127,618 | |||||
| Less: accumulated depreciation and amortization | 76,670 | 71,369 | ||||
| $ | 55,343 | $ | 56,249 | |||
7. Disposal of Fixed Assets
During the year ended April 2, 2005, the Company had a non-cash charge of $1,778 on the loss on sale and disposal of property, plant and equipment related to the consolidation of production lines and outsourcing certain components to low-cost producers. During the years ended April 3, 2004 and March 29, 2003, the Company had non-cash charges of $236 and $858, respectively, on the loss on disposal of property, plant and equipment related to the consolidation of production lines. All amounts were classified as an "other, net" operating expense in the consolidated statements of operations.
8. Goodwill and Amortizable Intangible Assets
Goodwill balances, by segment, consist of the following:
| | April 2, 2005 | April 3, 2004 | ||||
|---|---|---|---|---|---|---|
| Roller | $ | 15,673 | $ | 15,673 | ||
| Plain | 9,477 | 9,477 | ||||
| $ | 25,150 | $ | 25,150 | |||
The Company's definite-lived intangible assets, consisting primarily of acquired distribution agreements and customer lists, are amortized over their estimated useful lives of 5 to 15 years. Also included in intangible assets is an asset relating to the Company's minimum pension liability, as further described in Note 13.
Amortization expense for definite-lived intangible assets during fiscal year 2005, 2004 and 2003 was $500, $344 and $105, respectively. Estimated amortization expense for the five succeeding fiscal years and thereafter is as follows:
| 2006 | $ | 598 | |
| 2007 | 561 | ||
| 2008 | 452 | ||
| 2009 | 212 | ||
| 2010 | 204 | ||
| 2011 and thereafter | 744 |
9. Accrued Expenses and Other Current Liabilities
The significant components of accrued expenses and other current liabilities are as follows:
| | April 2, 2005 | April 3, 2004 | ||||
|---|---|---|---|---|---|---|
| Employee compensation and related benefits | $ | 3,150 | $ | 3,782 | ||
| Interest | 3,140 | 4,742 | ||||
| Other | 4,331 | 4,752 | ||||
| $ | 10,621 | $ | 13,276 | |||
10. Debt
During fiscal 1998, the Company issued $110,000 aggregate principal amount of 95/8% Senior Subordinated Notessenior subordinated notes due 2007 ("Notes"). The Notes paid interest semi-annually and had an original maturity date of June 15, 2007, but could be redeemed at the Company's option earlier under certain conditions specified in the indenture (the "Indenture") pursuant to which the Notes were issued. The Notes were unsecured and subordinate to all existing and future Senior Indebtedness (as defined in the Indenture) of the Company. The Notes were fully, unconditionally and irrevocably guaranteed jointly and severally, on a senior subordinated basis, by each of the domestic wholly-owned subsidiaries of RBCA. The Notes were repaid on June 29, 2004.
During fiscal 1998, the Company issued $40,000 of Senior Subordinated Discount Debenturessenior subordinated discount debentures ("Debentures") due in 2009, which had an aggregate principal amount at maturity of $74,882. During fiscal 2003, the Company made principal payments on this debt of $30,400. At April 2, 2005, the principal amount due at maturity is $38,562. The Debentures accrue interest at 13% per annum, payable semi-annually, and mature on June 15, 2009. The Debentures are callable at any point at a premium to the principal amount declining to par at the end of June 2008. Additionally, the Company may, at any time at its option, redeem the Debentures, in whole or in part, with the net cash proceeds from one or more public equity offerings by the Company. The Debentures are senior secured obligations of the Company, senior in right of payment to all existing and future subordinated indebtedness of the Company. The Debentures are secured by all of the outstanding common stock of RBCA.
RBCA and its domestic subsidiaries entered into a $94,000 senior secured credit facility ("Senior Credit Facility"), dated May 30, 2002, with General Electric Capital Corporation, as agent and lender, Congress Financial Corporation (Western), as lender, GECC Capital Markets Group, as lead arranger, and other lenders signatory thereto from time to time, consisting of a $40,000 term loan ("Term Loans") and a $54,000 revolving credit facility ("Revolving Credit Facility"). This credit facility was amended and restated on December 19, 2003 to add a further $10,000 term loan ("Term Loan B"). In connection with this credit facility, RBCA and its domestic subsidiaries granted liens and mortgages on substantially all of their existing and future personal and real property. In addition, RBCA pledged all of its capital stock in its domestic subsidiaries and a portion of its capital stock in its directly-owned foreign subsidiaries.
The proceeds from the Term Loans were used to pay off RBCA's senior credit facility, dated June 23, 1997, by and between RBCA, Credit Suisse First Boston, as administrative agent, and the
lenders thereto, to pay fees and expenses with respect to the new credit facility and for other corporate purposes. The Revolving Credit Facility was available for issuances of letters of credit of up to $25,000 and for loans in connection with acquisitions, working capital needs or other general corporate purposes.
On June 19, 2003, RBCA further amended and restated the Senior Credit Facility in order to increase its liquidity and to facilitate the funding of RBCA's foreign operations. The Senior Credit Facility included a structure under which RBCA could include certain of its foreign assets within the "collateral borrowing base" that sets forth the amounts that RBCA could borrow under its Revolving Credit Facility. As part of this amendment, RBCA created intercompany loan and asset pledge arrangements (including pledges of certain foreign assets) that were all ultimately assigned to the lenders as further collateral to secure the borrowings under the Senior Credit Facility.
The Senior Credit Facility was secured by substantially all of the Company's assets. Under the terms of the Senior Credit Facility, the Company was required to comply with various operational and financial covenants, including minimum EBITDA, minimum fixed charge coverage, total interest coverage and maximum leverage ratio, as defined in the credit agreements.
In addition, the Senior Credit Facility placed limitations on the Company's capital expenditures in any fiscal year, restricted its ability to pay dividends, required the Company to obtain the lenders' consents to certain acquisitions and contained mandatory prepayment provisions which included prepayments from the sale of the Company's stock and 50% of excess cash flow, as defined. The Senior Credit Facility was refinanced on June 29, 2004.
On June 29, 2004, the Company closed a $210,000 debt refinancing agreement (the "New Credit Facility") led and arranged by General Electric Capital Corporation. The agreement provides a $55,000 revolving credit agreement (the "New Revolving Credit Facility"), a $110,000 term loan (the "New Term Loan"), and a $45,000 second lien term loan (the "SCIL Loan"). Each loan is secured by a lien against substantially all of the assets of the Company and subjects the Company to standard affirmative and negative covenants, as well as financial leverage tests. The proceeds were used to refinance the Senior Credit Facility and to redeem outstanding debt. Most notably, concurrently with funding, the Company issued a notice of redemption to the noteholders of the 95/8% Senior Subordinated Notessenior subordinated notes issued pursuant to an indenture and due June 15, 2007. The requisite funds, approximately $113,000 (101.6041% of the principal amount), were irrevocably put on deposit with the trustee, Bank of New York, for redemption July 29, 2004. This amount included a redemption premium of $1,765 that was recorded as a loss on extinguishment of debt, as was $4,303 in unamortized deferred finance fees associated with this debt and $882 in interest expense during the call period. Deferred finance fees of $4,400 were capitalized associated with the new debt refinancing arrangement.
Approximately $20,300 of the New Revolving Credit Facility is being utilized to provide letters of credit to secure RBCA's obligations relating to certain Industrial Development Revenue Bonds and insurance programs. As of April 2, 2005, RBCA had the ability to borrow up to an additional $26,095 under the New Revolving Credit Facility.
The New Revolving Credit Facility bears interest at a floating rate of either the higher of the base rate on corporate loans or the federal funds rate plus 50 basis points, plus 1.75%; or LIBOR plus 3.00%. The Company has the right to elect the applicable interest rate on the New Revolving Credit
Facility. The New Term Loan bears interest at a floating rate of either the higher of the base rate on corporate loans or the federal funds rate plus 50 basis points, plus 2.50%; or LIBOR plus 3.75%. The Company has the right to elect the applicable interest rate on the New Term Loan. The SCIL Loan bears interest at a floating rate of either the higher of the base rate on corporate loans or the federal funds rate plus 50 basis points, plus 7.25%; or LIBOR plus 8.50%. The Company has the right to elect the applicable interest rate on the SCIL Loan. As of April 2, 2005, the blended interest rate on the outstanding New Credit Facility was 7.57%.
On December 8, 2003, Schaublin entered into a bank credit facility (the "Swiss Credit Facility") with Credit Suisse providing for 10,000 swiss francs, or approximately $7,971, of term loans (the "Swiss Term Loans") and up to 2,000 swiss francs, or approximately $1,600, of revolving credit loans and letters of credit (the "Swiss Revolving Credit Facility"). RBCA pledged 99.4% of the present and future share capital of Schaublin (1,366 shares) against this facility. On November 8, 2004, Schaublin amended the Swiss Credit Facility to increase the Swiss Revolving Credit Facility to 4,000 swiss francs, or approximately $3,500. Borrowings under the Swiss Credit Facility bear interest at a floating rate of LIBOR plus 2.25%. As of April 2, 2005, there were no borrowings outstanding under the Swiss Revolving Credit Facility.
In connection with the purchase of Tyson, the Company entered into a loan for $1,072 with the former owner of Tyson for the purchase of certain leasehold improvements, which are included in property, plant and equipment. This loan bears interest at 9.0% and is paid monthly. The term of the loan is for 75 months and ends in June 2005.
During fiscal 1995, the Company entered into a loan agreement with the South Carolina Jobs Economic Development Authority ("SC JEDA") which provides for borrowings up to $10,700 under two industrial development revenue bonds (Series 1994 A and B) and, during fiscal 1999, the Company entered into an additional loan agreement with the SC JEDA which provides for borrowings up to $3,000 under an industrial development revenue bond (Series 1998). The interest rate is variable and based on the 90-day U.S. Treasury Bill rate. Additionally, during fiscal 2000, the Company entered into a loan agreement with the California Infrastructure and Economic Development Bank which provides for borrowings up to $4,800 under an industrial development revenue bond (Series 1999) (collectively, "Bonds"). The interest rate on the Bonds is variable and based on the Bond Market Association 7-day Municipal Swap Index. The proceeds from the Bonds are restricted for working capital requirements and capital expenditure purposes. On March 1, 2002, the Company retired the unused portion of the Series 1998 bonds of $1,845. As of April 2, 2005, $18,254 of the proceeds have been expended (including accumulated interest of $1,611), and the remaining $12 is invested by the trustee in marketable securities. The Series 1994 A and B bonds and the Series 1998 bonds are secured by an irrevocable direct-pay letter of credit issued by one of the Company's lenders. The letter of credit is equal to the aggregate principal amount of the bonds plus not less than forty-five days' interest thereon, calculated at 12% per annum ($12,026 at April 2, 2005). The Series 1999 bonds are likewise secured by an irrevocable direct-pay letter of credit issued by one of the Company's lenders. The Company's obligation to its lenders is secured pursuant to the provisions of the Credit Facility and is equal to the aggregate principal amount of the bonds plus not less than fifty days' interest thereon, calculated at 12% per annum ($4,879 at April 2, 2005).
The balances payable under all borrowing facilities are as follows:
| | April 2, 2005 | April 3, 2004 | April 2, 2005 | April 3, 2004 | ||||||||
|---|---|---|---|---|---|---|---|---|---|---|---|---|
| 95/8% Senior Subordinated Notes Payable | $ | — | $ | 110,000 | $ | — | $ | 110,000 | ||||
| 13% Senior Subordinated Discount Debentures | 37,949 | 37,806 | 37,949 | 37,806 | ||||||||
| New Credit Facility | ||||||||||||
| New Term Loan, payable in quarterly installments of $275, commencing October 1, 2004, with final payment of $103,125 due December 29, 2010; bears interest at variable rates (weighted average interest rate was 6.21% for the fiscal year ended April 2, 2005), payable monthly and upon maturity at prime or LIBOR, plus an applicable margin, at the Company's election | 109,175 | — | 109,175 | — | ||||||||
| SCIL Loan, payable June 29, 2011; bears interest at variable rates (weighted average interest rate was 11.21% for the fiscal year ended April 2, 2005), payable monthly and upon maturity at prime or LIBOR, plus an applicable margin, at the Company's election. | 45,000 | — | 45,000 | — | ||||||||
| New Revolving Credit Facility; bears interest at variable rates (weighted average interest rate was 7.29% for the fiscal year ended April 2, 2005), payable monthly and upon maturity at prime or LIBOR, plus an applicable margin, at the Company's election | 5,000 | — | 5,000 | — | ||||||||
| Senior Credit Facility | ||||||||||||
| Term Loans, payable in quarterly installments of $1,428, commencing September 30, 2002, with final payment of $12,857 due May 30, 2007; bears interest at variable rates (weighted average interest rate was 4.61% for the fiscal year ended April 3, 2004), payable monthly and upon maturity at prime or LIBOR, at the Company's election | — | 30,000 | — | 30,000 | ||||||||
| Term Loan B, payable May 30, 2007; bears interest at variable rates (weighted average interest rate was 4.24% for the fiscal year ended April 3, 2004), payable monthly and upon maturity at prime or LIBOR, at the Company's election | — | 10,085 | — | 10,085 | ||||||||
| Revolving Credit Facility (weighted average interest rate was 3.81% for the fiscal year ended April 3, 2004) | — | 2,500 | — | 2,500 | ||||||||
| Swiss Credit Facility | ||||||||||||
| Term Loan, payable in semi-annual installments ranging from approximately $400, commencing March 31, 2004, to approximately $1,000 from September 30, 2005, with final payment due March 31, 2009; bears interest at variable rates (weighted average interest rate was 3.84% and 3.49% for the fiscal years ended April 2, 2005 and April 3, 2004, respectively), plus an applicable margin, payable quarterly | 6,233 | 7,480 | 6,233 | 7,480 | ||||||||
| Other Loans | 67 | 698 | 67 | 698 | ||||||||
| Industrial Development Revenue Bonds | ||||||||||||
| Series 1994 A, due in annual installments of $180 beginning September 1, 2006, graduating to $815 on September 1, 2014, with final payment due on September 1, 2017; bears interest at a variable rate (weighted average interest rate was 1.79% and 1.43% for the fiscal years ended April 2, 2005 and April 3, 2004, respectively), payable monthly through December 2017 | $ | 7,700 | $ | 7,700 | $ | 7,700 | $ | 7,700 | ||||
| Series 1994 B, bears interest at a variable rate (weighted average interest rate was 1.79% and 1.43% for the fiscal years ended April 2, 2005 and April 3, 2004, respectively), payable monthly through December 2017 | 3,000 | 3,000 | 3,000 | 3,000 | ||||||||
| Series 1998, bears interest at variable rates (weighted average interest rate was 4.40% and 3.81% for the fiscal years ended April 2, 2005 and April 3, 2004, respectively), payable monthly through December 2021. | 1,155 | 1,155 | 1,155 | 1,155 | ||||||||
| Series 1999, bearing interest at variable rates (weighted average interest rate was 3.57% and 3.30% for the fiscal years ended April 2, 2005 and April 3, 2004, respectively), payable monthly through April 2024 | 4,800 | 4,800 | 4,800 | 4,800 | ||||||||
| Total Debt | 220,079 | 215,224 | 220,079 | 215,224 | ||||||||
| Less: Current Portion | 8,245 | 10,421 | 8,245 | 10,421 | ||||||||
| Long-Term Debt | $ | 211,834 | $ | 204,803 | $ | 211,834 | $ | 204,803 | ||||
The current portion of long-term debt as of April 2, 2005 and April 3, 2004 includes $5,000 and $2,500, respectively, of borrowings on the revolving credit facilities.
The Company's exposure to interest rate risk is derived from its outstanding variable-rate debt obligations which primarily consist of the New Credit Facility. The Company is subject to fluctuating interest rates on $182.1 million of debt. In December 2004, RBCA entered into an interest rate cap agreement with LaSalle Bank on $50 million of notes payable. The agreement caps the LIBOR interest rate at five percent and matures on December 31, 2005. The interest rate cap agreement is being accounted for as an economic hedge, with the change in fair market value being applied to operations. There was no material impact on the financial statements of the Company for the year ended April 2, 2005 of the interest rate cap agreement. At April 2, 2005 and April 3, 2004, the weighted average interest rate on the Company's debt was approximately 8.54% and 8.60%, respectively.
Maturities of debt during each of the following five fiscal years and thereafter are as follows:
| 2006 | $ | 8,245 | |
| 2007 | 2,761 | ||
| 2008 | 2,554 | ||
| 2009 | 2,139 | ||
| 2010 | 39,049 | ||
| Thereafter | 165,331 |
11. Obligations Under Capital Leases
Machinery and equipment additions under capital leases amounted to $270, $458 and $0 in fiscal 2005, 2004 and 2003, respectively. The average imputed rate of interest on capital leases at each year end is 5.9%, 4.4% and 7.0% in fiscal 2005, 2004 and 2003, respectively.
Included in property, plant and equipment are the following assets held under capital leases:
| | April 2, 2005 | April 3, 2004 | |||||
|---|---|---|---|---|---|---|---|
| Machinery and equipment | $ | 5,227 | $ | 6,512 | |||
| Accumulated depreciation | (4,520 | ) | (5,612 | ) | |||
| $ | 707 | $ | 900 | ||||
Future minimum lease payments under capital leases at April 2, 2005 are as follows:
| 2006 | $ | 245 | ||
| 2007 | 204 | |||
| 2008 | 11 | |||
| Total minimum lease payments | 460 | |||
| Less: amount representing interest | 29 | |||
| Present value of net minimum lease payments | 431 | |||
| Less: current maturities | 226 | |||
| Non-current capital lease obligations | $ | 205 | ||
12. Other Non-Current Liabilities
The significant components of other non-current liabilities consist of:
| | April 2, 2005 | April 3, 2004 | ||||
|---|---|---|---|---|---|---|
| Additional minimum pension liability | $ | 3,299 | $ | 3,979 | ||
| Other post-retirement benefits | 2,826 | 2,995 | ||||
| Other | 1,429 | 1,513 | ||||
| $ | 7,554 | $ | 8,487 | |||
13. Pension Plans
At April 2, 2005, the Company has noncontributory defined benefit pension plans covering union employees in its Heim division plant in Fairfield, Connecticut, its Nice subsidiary plant in Kulpsville, Pennsylvania, its Bremen subsidiary plant in Plymouth, Indiana and its Tyson subsidiary plant in Glasgow, Kentucky.
Plan assets are comprised primarily of equity securities. The plans provide benefits of stated amounts based on a combination of an employee's age and years of service. The Company uses a December 31 measurement date for its plans. The Company expects to contribute approximately $1,700 to its pension plans in fiscal year 2006.
The following table sets forth net periodic benefit cost of the Company's plans for the three fiscal years in the period ended April 2, 2005:
| | Fiscal Year Ended | ||||||||||
|---|---|---|---|---|---|---|---|---|---|---|---|
| | April 2, 2005 | April 3, 2004 | March 29, 2003 | ||||||||
| Components of net periodic benefit cost: | |||||||||||
| Service cost | $ | 507 | $ | 497 | $ | 361 | |||||
| Interest cost | 944 | 923 | 894 | ||||||||
| Expected return on plan assets | (972 | ) | (803 | ) | (912 | ) | |||||
| Amortization of prior service cost | 19 | 19 | (4 | ) | |||||||
| Amortization of losses | 239 | 343 | 108 | ||||||||
| Net periodic benefit cost | $ | 737 | $ | 979 | $ | 447 | |||||
The following tables set forth the funded status of the Company's defined benefit pension plans, the amount recognized in the balance sheet at April 2, 2005 and April 3, 2004, and the principal weighted-average assumptions inherent in their determination:
| | April 2, 2005 | April 3, 2004 | ||||||
|---|---|---|---|---|---|---|---|---|
| Change in benefit obligation: | ||||||||
| Benefit obligation at beginning of year | $ | 15,420 | $ | 14,420 | ||||
| Service cost | 507 | 497 | ||||||
| Interest cost | 944 | 923 | ||||||
| Plan amendments | 160 | 246 | ||||||
| Actuarial loss | 48 | 117 | ||||||
| Benefits paid | (844 | ) | (783 | ) | ||||
| Benefit obligation at end of year | 16,235 | 15,420 | ||||||
Change in plan assets: | ||||||||
| Fair value of plan assets at beginning of year | 10,789 | 9,143 | ||||||
| Actual return on plan assets | 1,603 | 1,760 | ||||||
| Employer contributions | 1,250 | 669 | ||||||
| Benefits paid | (844 | ) | (783 | ) | ||||
| Fair value of plan assets at end of year | 12,798 | 10,789 | ||||||
Reconciliation of funded status at end of year: | ||||||||
| Underfunded status | (3,437 | ) | (4,631 | ) | ||||
| Unrecognized prior service cost | 444 | 302 | ||||||
| Unrecognized actuarial net loss | 2,855 | 3,677 | ||||||
| Net amount recognized in the balance sheet | $ | (138 | ) | $ | (652 | ) | ||
Amounts recognized in the balance sheet: | ||||||||
| Minimum pension liability | $ | (3,437 | ) | $ | (4,631 | ) | ||
| Intangible asset | 562 | 583 | ||||||
| Accumulated other comprehensive loss | 2,737 | 3,396 | ||||||
| Net amount recognized in the balance sheet | $ | (138 | ) | $ | (652 | ) | ||
Benefits under the union plans are not a function of employees' salaries; thus, the accumulated benefit obligation equals the projected benefit obligation.
The assumptions used in determining the net periodic benefit cost information are as follows:
| | FY2005 | FY2004 | FY2003 | FY2005 | FY2004 | FY2003 | |||||||
|---|---|---|---|---|---|---|---|---|---|---|---|---|---|
| Discount rate | 6.25 | % | 6.50 | % | 7.25 | % | 6.25% | 6.50% | 7.25% | ||||
| Expected long-term rate of return on plan assets | 9.00 | % | 9.00 | % | 9.00 | % | 9.00% | 9.00% | 9.00% |
The discount rate used in determining the funded status as of April 2, 2005 and April 3, 2004 is 5.9% and 6.25%, respectively.
In developing the overall expected long-term return on plan assets assumption, a building block approach was used in which rates of return in excess of inflation were considered separately for equity securities and debt securities. The excess returns were weighted by the representative target allocation and added along with an appropriate rate of inflation to develop the overall expected long-term return on plan assets assumption.
The Company recorded a minimum pension liability of $3,437 and $4,631 at April 2, 2005 and April 3, 2004, respectively. This liability represents the amount by which the accumulated benefit obligation exceeds the sum of the fair market value of plan assets. The additional minimum pension liability at April 2, 2005 and April 3, 2004 of $3,299 and $3,979, respectively, is offset by an intangible asset to the extent of previously unrecognized prior service cost. The intangible assets of $562 and $583 at April 2, 2005 and April 3, 2004, respectively, are included on the line item entitled "Intangible assets" in the consolidated balance sheet. The remaining amounts of $1,716 and $2,039, net of deferred income taxes of $1,021 and $1,359, respectively, are recorded as a component of stockholders' deficit on the line item titled "Accumulated other comprehensive loss" in the consolidated balance sheet at April 2, 2005 and April 3, 2004, respectively. The intangible asset in 2005 and 2004 is greater than the unrecognized prior service cost because two of the Company's plans have an unrecognized negative prior service cost.
The Company's investment program objective is to achieve a rate of return on plan assets which will fund the plan liabilities and provide for required benefits while avoiding undue exposure to risk to the plan and increases in funding requirements. The Company's target allocation of plan assets was 100 percent equity investments at April 2, 2005 and April 3, 2004.
The following benefit payments, which reflect future service as appropriate, are expected to be paid. The benefit payments are based on the same assumptions used to measure the Company's benefit obligation at the end of fiscal 2005.
| 2006 | $ | 823 | $ | 823 | ||
| 2007 | 866 | 866 | ||||
| 2008 | 869 | 869 | ||||
| 2009 | 918 | 918 | ||||
| 2010 | 1,003 | 1,003 | ||||
| 2011–2016 | 6,326 | |||||
| 2011-2016 | 6,326 | |||||
In addition, the Company has a defined contribution plan under Section 401(k) of the Internal Revenue Code for all of its employees not covered by a collective bargaining agreement. The plan is funded by eligible participants through employee contributions and by Company contributions equal to a percentage of eligible employee compensation. Effective October 1, 2001, the Company suspended
matching contributions to this plan. Effective April 4, 2004, the Company resumed a program of employer matching contributions to this plan. Employer contributions under this plan amounted to $355 in fiscal 2005.
Effective September 1, 1996, the Company adopted a non-qualified Supplemental Executive Retirement Plan ("SERP") for a select group of highly compensated management employees designated by the Board of Directors of the Company. The SERP allows eligible employees to elect to defer, until termination of their employment, the receipt of up to 25% of their current salary. The Company makes contributions equal to the lesser of 50% of the deferrals, or 3.5% of the employees' annual salary, which vest in full after three years of service following the effective date of the SERP. Employer contributions under this plan amounted to $67, $58, and $52 in fiscal 2005, 2004 and 2003, respectively.
14. Post-retirement Health Care and Life Insurance Benefits
The Company, for the benefit of employees at its Heim, West Trenton, Nice, Tyson and Bremen facilities, sponsors contributory defined benefit health care plans that provide post-retirement medical and life insurance benefits to union employees who have attained certain age and/or service requirements while employed by the Company. The plans are unfunded and costs are paid as incurred. Post-retirement benefit obligations are included in "Other non-current liabilities" in the consolidated balance sheet.
The Company uses a March 31 measurement date for its plans. The Company expects to contribute approximately $250 to its post-retirement benefit plans in fiscal year 2006.
On December 8, 2003, the Medicare Prescription Drug Improvement and Modernization Act of 2003 (the "Act") was signed into law. The Company's prescription drug benefit for all post-retirement plans is capped at a set amount each month, which is paid to the retirees so they can obtain prescription drug coverage. As such, the Company is not self-insured for prescription drugs and the Act has no impact on the recorded obligation.
Information with respect to the post-retirement medical and life insurance plans follows:
| | April 2, 2005 | April 3, 2004 | |||||
|---|---|---|---|---|---|---|---|
| Accumulated benefit obligation at beginning of year | $ | 4,163 | $ | 4,995 | |||
| Service cost | 121 | 238 | |||||
| Interest cost | 217 | 249 | |||||
| Plan amendments | (482 | ) | (1,300 | ) | |||
| Actuarial loss | (119 | ) | 317 | ||||
| Benefits paid | (172 | ) | (336 | ) | |||
| Accumulated benefit obligation at end of year | 3,728 | 4,163 | |||||
| Unrecognized prior service cost | 643 | 658 | |||||
| Unrecognized net loss | (1,545 | ) | (1,826 | ) | |||
| $ | 2,826 | $ | 2,995 | ||||
Components of net periodic post-retirement benefit cost are as follows:
| | Fiscal Year Ended | |||||||||
|---|---|---|---|---|---|---|---|---|---|---|
| | April 2, 2005 | April 3, 2004 | March 29, 2003 | |||||||
| Service cost | $ | 121 | $ | 238 | $ | 55 | ||||
| Interest cost | 217 | 249 | 319 | |||||||
| Prior service cost amortization | (496 | ) | (481 | ) | (71 | ) | ||||
| Amount of loss recognized | 161 | 172 | 91 | |||||||
| $ | 3 | $ | 178 | $ | 394 | |||||
During fiscal 2004, the plans were amended to contractually limit the benefit to be provided for certain groups of current and future retirees. As a result, there is no health care trend associated with these groups. The discount rate used in determining the accumulated post-retirement benefit obligation was 5.9% at April 2, 2005 and 6.25% at April 3, 2004. The discount rate used in determining the net periodic benefit cost was 6.25% for fiscal 2005, 6.50% for fiscal 2004 and 7.25% for fiscal year 2003.
The following benefit payments, which reflect future service as appropriate, are expected to be paid. The benefit payments are based on the same assumptions used to measure the Company's benefit obligation at the end of fiscal 2005.
| 2006 | $ | 250 | $ | 250 | ||
| 2007 | 252 | 252 | ||||
| 2008 | 265 | 265 | ||||
| 2009 | 286 | 286 | ||||
| 2010 | 314 | 314 | ||||
| 2011–2016 | 1,625 | |||||
| 2011-2016 | 1,625 | |||||
15. Income Taxes
Income (loss) before income taxes for the Company's domestic and foreign operations are as follows:
| | Fiscal Year Ended | |||||||||
|---|---|---|---|---|---|---|---|---|---|---|
| | April 2, 2005 | April 3, 2004 | March 29, 2003 | |||||||
| Domestic | $ | 3,278 | $ | (860 | ) | $ | (3,182 | ) | ||
| Foreign | 2,597 | 2,593 | 3,344 | |||||||
| $ | 5,875 | $ | 1,733 | $ | 162 | |||||
The provision for (benefit from) income taxes consists of the following:
| | Fiscal Year Ended | ||||||||||
|---|---|---|---|---|---|---|---|---|---|---|---|
| | April 2, 2005 | April 3, 2004 | March 29, 2003 | ||||||||
| Current: | |||||||||||
| Federal | $ | 915 | $ | (1,299 | ) | $ | (493 | ) | |||
| State | 364 | (201 | ) | (71 | ) | ||||||
| Foreign | 449 | 351 | 276 | ||||||||
| 1,728 | (1,149 | ) | (288 | ) | |||||||
Deferred: | |||||||||||
| Federal | (2,644 | ) | 1,921 | 352 | |||||||
| State | (469 | ) | 298 | 49 | |||||||
| (3,113 | ) | 2,219 | 401 | ||||||||
| Total | $ | (1,385 | ) | $ | 1,070 | $ | 113 | ||||
A reconciliation of income taxes computed using the U.S. federal statutory rate to that reflected in operations follows:
| | Fiscal Year Ended | |||||||||
|---|---|---|---|---|---|---|---|---|---|---|
| | April 2, 2005 | April 3, 2004 | March 29, 2003 | |||||||
| Income taxes using U.S. federal statutory rate | $ | 1,998 | $ | 589 | $ | 55 | ||||
| State income taxes, net of federal benefit | (66 | ) | 58 | (13 | ) | |||||
| Officer's life insurance | 44 | 59 | 57 | |||||||
| Meals and entertainment | 55 | 38 | 61 | |||||||
| ETI benefit | (66 | ) | (70 | ) | (70 | ) | ||||
| Adjustment of taxes to tax returns as filed | 849 | 225 | (1 | ) | ||||||
| Foreign rate differential | (434 | ) | — | — | ||||||
| Impact of indefinite postponement of remittances of undistributed earnings of foreign subsidiaries | (3,781 | ) | — | — | ||||||
| Other | 16 | 171 | 24 | |||||||
| $ | (1,385 | ) | $ | 1,070 | $ | 113 | ||||
Net deferred tax assets consist of the following:
| | | April 2, 2005 | April 3, 2004 | | April 2, 2005 | April 3, 2004 | ||||||||||
|---|---|---|---|---|---|---|---|---|---|---|---|---|---|---|---|---|
| Deferred tax assets: | Deferred tax assets: | Deferred tax assets: | ||||||||||||||
| Post-retirement benefits | $ | 990 | $ | 1,117 | Post-retirement benefits | $ | 990 | $ | 1,117 | |||||||
| Employee compensation accruals | 731 | 769 | Employee compensation accruals | 731 | 769 | |||||||||||
| Alternative minimum tax credits | 1,912 | 1,558 | Alternative minimum tax credits | 1,912 | 1,558 | |||||||||||
| Net operating losses | 2,100 | 3,694 | Net operating losses | 2,100 | 3,694 | |||||||||||
| Inventory | 3,492 | 2,133 | Inventory | 3,492 | 2,133 | |||||||||||
| Stock warrants | 2,103 | 2,103 | Stock warrants | 2,103 | 2,103 | |||||||||||
| Pension | 1,021 | 1,359 | Pension | 1,021 | 1,359 | |||||||||||
| Other | 1,214 | 1,150 | Other | 1,214 | 1,150 | |||||||||||
| Total deferred tax assets | 13,563 | 13,883 | ||||||||||||||
| Total deferred tax assets | Total deferred tax assets | 13,563 | 13,883 | |||||||||||||
Deferred tax liabilities: | Deferred tax liabilities: | Deferred tax liabilities: | ||||||||||||||
| Property, plant and equipment | (6,555 | ) | (6,743 | ) | Property, plant and equipment | (6,555 | ) | (6,743 | ) | |||||||
| Unremitted foreign earnings | — | (3,781 | ) | Unremitted foreign earnings | — | (3,781 | ) | |||||||||
| Amortizaton of goodwill | (1,836 | ) | (964 | ) | Amortization of goodwill | (1,836 | ) | (964 | ) | |||||||
| Total deferred tax liabilities | (8,391 | ) | (11,488 | ) | Total deferred tax liabilities | (8,391 | ) | (11,488 | ) | |||||||
| Net deferred tax assets | $ | 5,172 | $ | 2,395 | Net deferred tax assets | $ | 5,172 | $ | 2,395 | |||||||
The Company has reduced income tax expense by $3,781 in fiscal 2005 for the undistributed earnings of its foreign subsidiaries on which U.S. income taxes were previously recorded. The Company has reassessed its needs internationally and has determined that, despite the benefits introduced by the American Jobs Creation Act of 2004, its undistributed foreign earnings of approximately $18,000 at April 2, 2005 will be re-invested indefinitely based upon the need for cash in its foreign operations, potential foreign acquisitions and the Company's inability to remit cash back to the United States under its current foreign debt obligations. The amount of unrecognized deferred tax liability relating to undistributed foreign earnings at April 2, 2005 is approximately $4,232.
At April 2, 2005, the Company has federal and state net operating loss carryforwards of approximately $5,519 and $6,953, respectively, to offset future income taxes, which expire at various dates through 2024. In addition, the Company has alternative minimum tax credit carryforwards of approximately $1,912. The net operating loss carryforwards may be subject to certain limitations provided in IRC Sections 382 and 383. The Company's tax returns are subject to review and examination by various taxing authorities, which could result in changes to accrued tax estimates.
16. Stockholders' Deficit
Class A Preferred Stock. The Class A Preferred Stock is the most senior of the Company's capital stock for the purposes of the payment of dividends and distributions upon a liquidation or deemed liquidation event. The holders of Class A Preferred Stock are entitled to an accrued dividend at a rate of 8% per annum payable when and if declared by the Company's board of directors. As of April 2,
2005, no dividends have accrued on the Class A Preferred Stock. The stated value of the Class A Preferred Stock is $3,000 per share. Except to the extent required by law, holders of Class A Preferred Stock have no voting rights.
Class B Exchangeable Convertible Participating Preferred Stock. The Class B Preferred Stock ranks junior to the Class A Preferred Stock, is on par with the Class C Preferred Stock, and is senior to all other classes of stock with respect to payment of dividends. The Class B Preferred Stock ranks junior to the Class A Preferred Stock, and is senior to all other classes of stock with respect to distributions upon a liquidation or deemed liquidation event.
The Class B Preferred Stock is subject to conversion by the Company or exchange by the holders thereof. In either situation, each share of Class B Preferred Stock would yield upon conversion (i) a number of shares of Class A Common Stock determined by multiplying the number of shares of Class B Preferred Stock to be converted by the stated value of the Class B Preferred Stock and dividing the result by the conversion price then in effect, (ii) a number of shares of Class C Preferred Stock determined by multiplying the number of Class B Preferred Stock to be converted by the sum of the stated value of the shares and the amount of all unpaid dividends thereon and dividing the result by the stated value of the Class C Preferred Stock, and (iii) one share of Class D Preferred Stock. The stated value of the Class B Preferred Stock is $100 per share. The Class B Preferred Stock is subject to mandatory conversion upon the consummation of an Initial Public Offering or an Organic Transaction (each as defined in the Company's Amended and Restated Certificate of Incorporation). Diluted net income (loss) per share reflects the assumed conversion of the Class B Preferred Stock.
The Class B Preferred Stock entitles the holders thereof, upon a liquidation or deemed liquidation event, to a payment of its stated value plus an amount determined by reference to a formula set forth in the Company's Amended and Restated Certificate of Incorporation. The holders of Class B Preferred Stock are entitled to an accrued dividend at a rate of 8% per annum payable when and if declared by the Company's board of directors. Such dividends shall accrue whether or not they have been declared and whether or not there are profits. The holders of Class B Preferred Stock are further entitled to participate in any dividends paid to the holders of shares of Common Stock. As of April 2, 2005, the amount of accumulated undeclared and unpaid dividends on the Class B Preferred Stock equaled approximately $5.7 million. Except to the extent required by law, holders of Class B Preferred Stock have no voting rights.
During July 2002, two investors in the Company purchased an aggregate of 240,000 shares of its Class B Exchangeable Convertible Participating Preferred Stock in exchange for gross proceeds of $24,000. In connection with the purchase, the Company paid a fee of $750 to one of the investors and amended the terms of the Whitney (a related party) management services agreement. Following the closing of the sale, the Company utilized the proceeds from the sale and certain of the Company's cash on hand to repurchase approximately $30,400 (Note 10) in principal amount at maturity of certain debt. This repurchase satisfied the Company's obligation to make a scheduled redemption payment relating to such debt. The Company recognized a pre-tax gain on the extinguishment of this debt obligation of approximately $780, net of transaction expenses of $406, during fiscal 2003, which has been recorded as non-operating income.
Class C Redeemable Preferred Stock. The Class C Preferred Stock ranks junior to the Class A Preferred Stock, on par with the Class B Preferred Stock, and senior to all other classes of stock with respect to payment of dividends. The Class C Preferred Stock ranks junior to the Class A Preferred Stock and Class B Preferred Stock, and senior to all other classes of stock with respect to distributions upon a liquidation or deemed liquidation event.
The holders of Class C Preferred Stock are entitled to an accrued dividend at a rate of 8% per annum payable when and if declared by the Company's board of directors. As of April 2, 2005, no dividends have accrued on the Class C Preferred Stock. The Class C Preferred Stock is subject to redemption by the Company at its option. If shares of Class C Preferred Stock are issued in exchange for shares of Class B Preferred Stock, the Company is required to redeem such shares no later than one business day following the day of such issuance. The stated value of the Class C Preferred Stock is $100 per share. Except to the extent required by law, holders of Class C Preferred Stock have no voting rights.
Class D Preferred Stock. The Class D Preferred Stock ranks junior to the Class A Preferred Stock, Class B Preferred Stock and Class C Preferred Stock, and senior to all other classes of stock with respect to the payment of dividends and distributions upon a liquidation or deemed liquidation event. The Class D Preferred Stock entitles the holders thereof, upon a liquidation or deemed liquidation event, to a payment determined by reference to a formula set forth in the Company's Amended and Restated Certificate of Incorporation. Except to the extent required by law, holders of Class D Preferred Stock have no voting rights.
Class A and Class B Common Stock. The Company has 6,202,519 shares of Class A Common Stock outstanding held by 7 holders, and 250 shares of Class B Common Stock outstanding held by Dr. Michael J. Hartnett, the Company's founder and Chief Executive Officer. In addition, as of April 2, 2005, there were outstanding warrants and options to purchase up to an additional 1,911,235 shares of the Company's Class A Common Stock and 1,372,865 shares of Class B Common Stock.
Holders of Class A Common Stock are entitled to one vote per share. Until certain events occur, the holders of Class B Common Stock are entitled to 51% of the voting power of the Company's issued and outstanding common stock.
Stock Option Plans
2001 Stock Option Plan
The RBC Bearings Incorporated (f/k/a Roller Bearing Holding Company, Inc.) 2001 Stock Option Plan was adopted in fiscal 2002 and amended and restated on October 24, 2003. The terms of the 2001 option plan provide for the grant of options or warrants to purchase up to 1,008,553 shares of Class A Common Stock to officers and employees of, and consultants (including members of the Company's board of directors) of, the Company and its subsidiaries selected by the CEO to participate in the plan. Options granted may be either incentive stock options (under Section 422 of the Internal Revenue Code) or non-qualified stock options. The 2001 option plan, which expires in July 2011, is governed by the Company's board of directors, or a committee to which the board delegates its responsibilities.
1998 Stock Option Plan
Effective February 18, 1998, the Company adopted the RBC Bearings Incorporated (f/k/a Roller Bearing Holding Company, Inc.) 1998 Stock Option Plan. The terms of the 1998 option plan provide for the grant of options or warrants to purchase up to 8,413,990 shares of Class A Common Stock to officers and employees of, and consultants (including members of the Company's board of directors) to, the Company and its subsidiaries. Options granted may be either incentive stock options (under Section 422 of the Internal Revenue Code) or non-qualified stock options. The 1998 option plan, which expires on December 31, 2008, is governed by the Company's board of directors or a committee to which the board delegates its responsibilities.
The exercise price of options granted under the 2001 and 1998 option plans is determined by the board of directors, but in no event is less than 100% of the fair market value of the Class A Common Stock.
A summary of the status of the Company's warrants and stock options outstanding as of April 2, 2005, April 3, 2004 and March 29, 2003, and changes during the years ended on those dates, is presented below:
| | Number Of Class A Common Stock Warrants/Options | Weighted Average Exercise Price | Number Of Class A Common Stock Warrants/Options | Weighted Average Exercise Price | ||||||
|---|---|---|---|---|---|---|---|---|---|---|
| Outstanding, March 30, 2002 | 1,511,942 | $ | 0.75 | 1,511,942 | $ | 0.75 | ||||
| Awarded fiscal 2003 | 285,243 | 12.00 | 285,243 | 12.00 | ||||||
| Cancelled fiscal 2003 | (78,800 | ) | 9.98 | (78,800 | ) | 9.98 | ||||
| Outstanding, March 29, 2003 | 1,718,385 | 2.12 | 1,718,385 | 2.12 | ||||||
| Awarded fiscal 2004 | 93,250 | 9.80 | 93,250 | 9.80 | ||||||
| Cancelled fiscal 2004 | (45,075 | ) | 4.81 | (45,075 | ) | 4.81 | ||||
| Outstanding, April 3, 2004 | 1,766,560 | 2.46 | 1,766,560 | 2.46 | ||||||
| Awarded fiscal 2005 | 179,575 | 8.00 | 179,575 | 8.00 | ||||||
| Exercised fiscal 2005 | (13,866 | ) | 2.49 | (13,866 | ) | 2.49 | ||||
| Cancelled fiscal 2005 | (21,034 | ) | 8.07 | (21,034 | ) | 8.07 | ||||
| Outstanding, April 2, 2005 | 1,911,235 | 2.98 | 1,911,235 | 2.98 | ||||||
Certain members of management left the Company during fiscal 2003 without exercising the vested portion of 41,025 Class A warrants and, accordingly, the warrants were cancelled.
The Company has also issued warrants to purchase 1,372,865 shares of Class B Supervoting Common Stock to Dr. Hartnett, the Company's CEO. There has been no warrant activity with respect to the Class B Supervoting Common Stock during fiscal 2005, 2004 and 2003.
The Company has awarded 179,575 options to purchase Class A Common Stock at an exercise price of $8.00 during the year ended April 2, 2005. Determining the fair value of the Company's Class A Common Stock requires making subjective and complex judgments and estimates. The Company employed the market approach to estimate the enterprise value. The market approach
involves applying an appropriate market multiple, compared to like public companies in the Company's
industry, to the operating performance for the twelve months ended April 3, 2004 and the actual and projected operating performance for the twelve months ended April 2, 2005. The options awarded during the year ended April 2, 2005 were based on this valuation and approved by the Company's board of directors.
The Company has reassessed the value of its Class A Common Stock given the significant improvement in the Company's operating performance during the fiscal year ended April 2, 2005 as well as the pending initial public offering. This retrospective review indicated that the fair value of the Class A Common Stock was in excess of the option exercise price ($8.00 per share) at the various grant dates (see Note 21).dates. As a result, deferred compensation of $769,000 was recorded for the intrinsic value of the stock (based on the 179,575 options granted during fiscal 2005), which is being amortized over the vesting period. During the fiscal year ended April 2, 2005, approximately $420,000 was recorded as compensation expense.
The following table summarizes information about stock options and warrants outstanding at April 2, 2005:
| Exercise Price and Weighted Average Exercise Price | Options/Warrants Outstanding | Weighted Average Contractual Life | Options/Warrants Exercisable | Options/Warrants Outstanding | Weighted Average Contractual Life | Options/Warrants Exercisable | ||||||
|---|---|---|---|---|---|---|---|---|---|---|---|---|
| Class A | ||||||||||||
| $0.40 | 1,192,118 | 2.3 years | 1,192,118 | 1,192,118 | 2.3 years | 1,192,118 | ||||||
| $2.06 | 252,375 | 2.8 years | 252,375 | 252,375 | 2.8 years | 252,375 | ||||||
| $12.00 | 253,992 | 7.5 years | 237,324 | 253,992 | 7.5 years | 237,324 | ||||||
| $8.00 | 203,750 | 8.5 years | 101,250 | 203,750 | 8.5 years | 101,250 | ||||||
| $3.20 | 9,000 | 8.5 years | 6,000 | 9,000 | 8.5 years | 6,000 | ||||||
| 1,911,235 | 1,789,067 | 1,911,235 | 1,789,067 | |||||||||
Class B | ||||||||||||
| $0.40 | 1,060,365 | 2.3 years | 1,060,365 | 1,060,365 | 2.3 years | 1,060,365 | ||||||
| $2.06 | 312,500 | 2.3 years | 312,500 | 312,500 | 2.3 years | 312,500 | ||||||
| 1,372,865 | 1,372,865 | 1,372,865 | 1,372,865 | |||||||||
17. Commitments and Contingencies
The Company leases factory facilities under non-cancelable operating leases, which expire on various dates through February 2009, with rental expense aggregating $2,045, $1,801 and $1,657 in fiscal 2005, 2004 and 2003, respectively.
The Company also has non-cancelable operating leases for transportation, computer and office equipment, which expire at various dates. Rental expense for fiscal 2005, 2004 and 2003 aggregated $1,172, $579 and $747, respectively.
The aggregate future minimum lease payments under operating leases are as follows:
| 2006 | $ | 2,863 | |
| 2007 | 2,640 | ||
| 2008 | 2,087 | ||
| 2009 | 1,940 | ||
| 2010 | 498 | ||
| Thereafter | 3,005 | ||
| $ | 13,033 | ||
The Company entered into an agreement with Whitney, a related party, whereby a quarterly management services fee is paid for certain consulting and management advisory services, as directed by the board of directors of the Company and agreed to by Whitney. Such ongoing fees aggregated $450, $450 and $375 for fiscal 2005, 2004 and 2003, respectively. At both April 2, 2005 and April 3, 2004, amounts payable to Whitney were $338.
As of April 2, 2005, approximately 29% of the Company's hourly employees in the U.S. and abroad were represented by labor unions. One of the collective bargaining agreements covering approximately 50 employees (4.2% of the Company's hourly employees) expires in October 2005.
The Company enters into government contracts and subcontracts that are subject to audit by the government. In the opinion of the Company's management, the results of such audits, if any, are not expected to have a material impact on the financial condition or results of operations of the Company.
The Company is subject to federal, state and local environmental laws and regulations, including those governing discharges of pollutants into the air and water, the storage, handling and disposal of wastes and the health and safety of employees. The Company also may be liable under the Comprehensive Environmental Response, Compensation, and Liability Act or similar state laws for the costs of investigation and cleanup of contamination at facilities currently or formerly owned or operated by the Company, or at other facilities at which the Company may have disposed of hazardous substances. In connection with such contamination, the Company may also be liable for natural resource damages, government penalties and claims by third parties for personal injury and property damage. Agencies responsible for enforcing these laws have authority to impose significant civil or criminal penalties for non-compliance. The Company believes it is currently in material compliance with all applicable requirements of environmental laws. The Company does not anticipate material capital expenditures for environmental controls in fiscal years 2006 or 2007.
Investigation and remediation of contamination is ongoing at some of the Company's sites. In particular, state agencies have been overseeing groundwater monitoring activities at the Company's facilities in Hartsville, South Carolina and Fairfield, Connecticut. At Hartsville, the Company is monitoring low levels of contaminants in the groundwater caused by former operations. The state will permit the Company to cease monitoring activities after two consecutive sampling periods demonstrate contaminants are below action levels. In connection with the purchase of the Fairfield, Connecticut facility in 1996, the Company agreed to assume responsibility for completing clean-up efforts previously initiated by the prior owner. The Company submitted data to the state that the Company believes
demonstrates that no further remedial action is necessary, although the state may require additional clean-up or monitoring. Although there can be no assurance, the Company does not expect any of those to be material.
The Company received notice in 2003 from the U.S. Environmental Protection Agency that the Company had been named a potentially responsiblede minimis party for past disposal of hazardous substances at the Operating Industries, Inc. Landfill in Monterey, Calif. Any such disposal would have been conducted prior to the Company's ownership, and the Company notified the former owners of a potential claim for indemnification based on the indemnity described above. The Company is currently negotiating ade minimis settlement with the U.S. Environmental Protection Agency and expects that any settlement, even if the Company is unsuccessful in obtaining indemnification, will not be material to its financial position or results of operations.
There are various claims and legal proceedings against the Company relating to its operations in the normal course of business, none of which the Company believes is material to its financial position or results of operations. The Company currently maintains insurance coverage for product liability claims.
18. Other Expense, Net
Other expense, net is comprised of the following:
| | Fiscal Year Ended | ||||||||
|---|---|---|---|---|---|---|---|---|---|
| | April 2, 2005 | April 3, 2004 | March 29, 2003 | ||||||
| Management fees | $ | 474 | $ | 525 | $ | 375 | |||
| Loss on disposition of assets | 1,989 | 236 | 858 | ||||||
| Write-off of acquisition costs | — | 399 | — | ||||||
| Provision for doubtful accounts | 472 | 378 | 123 | ||||||
| Other expense | 591 | 124 | 68 | ||||||
| $ | 3,526 | $ | 1,662 | $ | 1,424 | ||||
19. Related Party Transactions
The Company has loaned Dr. Michael J. Hartnett, President and Chief Executive Officer of the Company and RBCA, $500 to purchase shares of capital stock of the Company. The loan does not bear interest and is due on the earlier of (i) June 23, 2007, (ii) the consummation of a sale of the Company or (iii) the consummation of an initial public offering of the Company. The loan is secured by a pledge of Dr. Hartnett's shares in the Company.
20. Reportable Segments
The Company operates through operating segments for which separate financial information is available, and for which operating results are evaluated regularly by the Company's chief operating decision maker in determining resource allocation and assessing performance. Those operating segments with similar economic characteristics and that meet all other required criteria, including
nature of the products and production processes, distribution patterns and classes of customers, are aggregated as reportable segments. Certain other operating segments do not exhibit the common attributes mentioned above and do not meet the quantitative thresholds for separate disclosure, and their information is combined and disclosed as "Other". There is also a segment reflecting corporate charges.
The Company has four reportable business segments engaged in the manufacture and sale of the following:
Roller Bearings. Roller bearings are anti-friction bearings that use rollers instead of balls. The Company manufactures four basic types of roller bearings: heavy duty needle roller bearings with inner rings, tapered roller bearings, track rollers and aircraft roller bearings.
Plain Bearings. Plain bearings are produced with either self-lubricating or metal-to-metal designs and consist of several sub-classes, including rod end bearings, spherical plain bearings and journal bearings. Unlike ball bearings, which are used in high-speed rotational applications, plain bearings are primarily used to rectify inevitable misalignments in various mechanical components.
Ball Bearings. The Company manufactures four basic types of ball bearings: high precision aerospace, airframe control, thin section and commercial ball bearings which are used in high-speed rotational applications,
Other. Other consists of two minor operating locations that do not fall into the above segmented categories. The Company produces precision ground ball bearing screws at its Linear Precision Products (LPP) plant that offer repeatable positioning accuracy in machine tools, transfer lines, robotic handling and semiconductor equipment. The Company's Schaublin location produces precision machine tool collets that provide effective part holding and accurate part location during machining operations.
Corporate. Corporate consists of expenses incurred at the corporate office.
The accounting policies of the reportable segments are the same as those described in Note 2. Segment performance is evaluated based on segment net sales, operating income and total assets. Items not allocated to segment operating income include corporate administrative expenses and certain other
amounts. Identifiable assets by reportable segment consist of those directly identified with the segment's operations. Corporate assets consist of cash, fixed assets and certain prepaid expenses.
| | | Fiscal Year Ended | | Fiscal Year Ended | ||||||||||||||||||
|---|---|---|---|---|---|---|---|---|---|---|---|---|---|---|---|---|---|---|---|---|---|---|
| | | April 2, 2005 | April 3, 2004 | March 29, 2003 | | April 2, 2005 | April 3, 2004 | March 29, 2003 | ||||||||||||||
| Net External Sales | Net External Sales | Net External Sales | ||||||||||||||||||||
| Roller | $ | 92,281 | $ | 63,106 | $ | 60,788 | Roller | $ | 92,281 | $ | 63,106 | $ | 60,788 | |||||||||
| Plain | 93,250 | 77,578 | 67,448 | Plain | 93,250 | 77,578 | 67,448 | |||||||||||||||
| Ball | 41,881 | 35,801 | 34,038 | Ball | 41,881 | 35,801 | 34,038 | |||||||||||||||
| Other | 15,604 | 10,846 | 10,586 | Other | 15,604 | 10,846 | 10,586 | |||||||||||||||
| $ | 243,016 | $ | 187,331 | $ | 172,860 | $ | 243,016 | $ | 187,331 | $ | 172,860 | |||||||||||
| Operating Income | Operating Income | Operating Income | ||||||||||||||||||||
| Roller | $ | 17,030 | $ | 11,259 | $ | 8,459 | Roller | $ | 17,030 | $ | 11,259 | $ | 8,459 | |||||||||
| Plain | 22,647 | 18,573 | 16,782 | Plain | 22,647 | 18,573 | 16,782 | |||||||||||||||
| Ball | 9,070 | 6,676 | 7,009 | Ball | 9,070 | 6,676 | 7,009 | |||||||||||||||
| Other | 797 | 378 | 1,779 | Other | 797 | 378 | 1,779 | |||||||||||||||
| Corporate | (17,405 | ) | (14,757 | ) | (13,326 | ) | Corporate | (17,405 | ) | (14,757 | ) | (13,326 | ) | |||||||||
| $ | 32,139 | $ | 22,129 | $ | 20,703 | $ | 32,139 | $ | 22,129 | $ | 20,703 | |||||||||||
| Total Assets | Total Assets | Total Assets | ||||||||||||||||||||
| Roller | $ | 43,113 | $ | 36,784 | $ | 33,029 | Roller | $ | 43,113 | $ | 36,784 | $ | 33,029 | |||||||||
| Plain | 115,930 | 104,824 | 99,058 | Plain | 115,930 | 104,824 | 99,058 | |||||||||||||||
| Ball | 26,438 | 21,145 | 20,440 | Ball | 26,438 | 21,145 | 20,440 | |||||||||||||||
| Other | 8,287 | 6,689 | 8,206 | Other | 8,287 | 6,689 | 8,206 | |||||||||||||||
| Corporate | 56,401 | 65,304 | 71,623 | Corporate | 56,401 | 65,304 | 71,623 | |||||||||||||||
| $ | 250,169 | $ | 234,746 | $ | 232,356 | $ | 250,169 | $ | 234,746 | $ | 232,356 | |||||||||||
| Capital Expenditures | Capital Expenditures | Capital Expenditures | ||||||||||||||||||||
| Roller | $ | 3,496 | $ | 2,108 | $ | 2,201 | Roller | $ | 3,496 | $ | 2,108 | $ | 2,201 | |||||||||
| Plain | 2,669 | 1,535 | 2,187 | Plain | 2,669 | 1,535 | 2,187 | |||||||||||||||
| Ball | 936 | 795 | 563 | Ball | 936 | 795 | 563 | |||||||||||||||
| Other | 784 | 349 | 420 | Other | 784 | 349 | 420 | |||||||||||||||
| Corporate | 1,641 | 164 | 1,151 | Corporate | 1,641 | 164 | 1,151 | |||||||||||||||
| $ | 9,526 | $ | 4,951 | $ | 6,522 | $ | 9,526 | $ | 4,951 | $ | 6,522 | |||||||||||
Depreciation & Amortization | Depreciation & Amortization | |||||||||||||||||||||
| Roller | $ | 2,618 | $ | 2,453 | $ | 2,298 | ||||||||||||||||
| Plain | 2,501 | 2,568 | 2,341 | |||||||||||||||||||
| Ball | 1,300 | 1,549 | 1,638 | |||||||||||||||||||
| Other | 1,281 | 1,178 | 956 | |||||||||||||||||||
| Corporate | 1,085 | 1,434 | 1,586 | |||||||||||||||||||
| $ | 8,785 | $ | 9,182 | $ | 8,819 | |||||||||||||||||
| Depreciation & Amortization | ||||||||||||||||||||||
| Roller | $ | 2,618 | $ | 2,453 | $ | 2,298 | ||||||||||||||||
| Plain | 2,501 | 2,568 | 2,341 | |||||||||||||||||||
| Ball | 1,300 | 1,549 | 1,638 | |||||||||||||||||||
| Other | 1,281 | 1,178 | 956 | |||||||||||||||||||
| Corporate | 1,085 | 1,434 | 1,586 | |||||||||||||||||||
| $ | 8,785 | $ | 9,182 | $ | 8,819 | |||||||||||||||||
| Geographic External Sales | Geographic External Sales | Geographic External Sales | ||||||||||||||||||||
| Domestic | $ | 215,381 | $ | 166,763 | $ | 155,579 | Domestic | $ | 215,381 | $ | 166,763 | $ | 155,579 | |||||||||
| Foreign | 27,635 | 20,568 | 17,281 | Foreign | 27,635 | 20,568 | 17,281 | |||||||||||||||
| $ | 243,016 | $ | 187,331 | $ | 172,860 | $ | 243,016 | $ | 187,331 | $ | 172,860 | |||||||||||
| Geographic Long-Lived Assets | Geographic Long-Lived Assets | Geographic Long-Lived Assets | ||||||||||||||||||||
| Domestic | $ | 52,566 | $ | 52,956 | $ | 53,798 | Domestic | $ | 52,566 | $ | 52,956 | $ | 53,798 | |||||||||
| Foreign | 2,777 | 3,293 | 3,974 | Foreign | 2,777 | 3,293 | 3,974 | |||||||||||||||
| $ | 55,343 | $ | 56,249 | $ | 57,772 | $ | 55,343 | $ | 56,249 | $ | 57,772 | |||||||||||
| Intersegment Sales | Intersegment Sales | Intersegment Sales | ||||||||||||||||||||
| Roller | $ | 7,275 | $ | 1,669 | $ | 1,818 | Roller | $ | 7,275 | $ | 1,669 | $ | 1,818 | |||||||||
| Plain | 1,982 | 880 | 1,787 | Plain | 1,982 | 880 | 1,787 | |||||||||||||||
| Ball | 4,073 | 397 | 18 | Ball | 4,073 | 397 | 18 | |||||||||||||||
| Other | 10,147 | 6,349 | 5,135 | Other | 10,147 | 6,349 | 5,135 | |||||||||||||||
| $ | 23,477 | $ | 9,295 | $ | 8,758 | $ | 23,477 | $ | 9,295 | $ | 8,758 | |||||||||||
All intersegment sales are eliminated in consolidation.
21. Restatement
The Company has historically determined the fair value of its common stock, for purposes of calculating stock-based compensation under APB No. 25, based on internal valuations. Subsequent to the close of fiscal year 2005, the Company considered whether an independent third-party valuation of its common stock would provide a more appropriate estimate of fair value. Accordingly, the Company obtained, on July 19, 2005, an independent third-party valuation of its common stock as of each of the stock option grant dates during fiscal year 2005. After a thorough review of the independent third-party valuation, the Company concluded that the assumptions and methods employed in the third-party valuation were more appropriate and consistent with accepted valuation methods than the internal valuations prepared by Company management. Accordingly, based on the results of these third-party valuations, the Company restated deferred stock compensation and stock compensation expense for fiscal year 2005.
The restatement had the following effect on fiscal year 2005 net income and net income per share of common share:
22. Subsequent Event—One-time Special Cash Bonus to CEO
On June 13, 2005, subject to the approval of the Company's senior lenders under the New Credit Facility and Second Lien Term Loan, the Board of Directors agreed to pay the CEO a one-time special cash bonus of $5.2 million on or prior to June 30, 2005 to reimburse the CEO for taxes owed by him in connection with a previous stock sale by the CEO to Whitney. As such, the Company will record a charge of $5.2 million in the first quarter of 2005.fiscal 2006. In connection with such transaction, the Company will receive offsetting cash tax benefits of approximately $5.2 million.
23.22. Subsequent Event—Stock Split
Prior to the completion ofOn August 2, 2005, the Company's planned initial public offering, the Company intends to effectBoard of Directors approved a 5-for-2 stock split of its common stock. All share and per share information in the consolidated financial statements has been retroactively restated to reflect the stock split for all years presented.
RBC Bearings Incorporated
Consolidated Balance Sheets
(dollars in thousands, except share and per share data)
| | December 31, 2005 (Unaudited) | April 2, 2005 | ||||||
|---|---|---|---|---|---|---|---|---|
| ASSETS | ||||||||
| Current assets: | ||||||||
| Cash | $ | 10,312 | $ | 2,635 | ||||
| Accounts receivable, net | 46,722 | 53,967 | ||||||
| Inventory | 105,104 | 95,654 | ||||||
| Deferred income taxes | 13,562 | 4,509 | ||||||
| Prepaid expenses and other current assets | 2,325 | 2,226 | ||||||
| Total current assets | 178,025 | 158,991 | ||||||
| Property, plant and equipment, net | 57,497 | 55,343 | ||||||
| Goodwill | 25,150 | 25,150 | ||||||
| Intangible assets, net of accumulated amortization of $1,446 at December 31, 2005 and $949 at April 2, 2005 | 4,334 | 3,333 | ||||||
| Deferred financing costs, net of accumulated amortization of $1,082 at December 31, 2005 and $1,280 at April 2, 2005 | 4,420 | 4,755 | ||||||
| Other assets | 1,998 | 2,597 | ||||||
| Total assets | $ | 271,424 | $ | 250,169 | ||||
See notes to unaudited interim consolidated financial statements.
Schedule II-ValuationRBC Bearings Incorporated
Consolidated Balance Sheets
(dollars in thousands, except share and Qualifying Accountsper share data)
| | December 31, 2005 (Unaudited) | April 2, 2005 | |||||||
|---|---|---|---|---|---|---|---|---|---|
| LIABILITIES AND STOCKHOLDERS' EQUITY (DEFICIT) | |||||||||
| Current liabilities: | |||||||||
| Accounts payable | $ | 17,744 | $ | 19,243 | |||||
| Accrued expenses and other current liabilities | 8,331 | 10,621 | |||||||
| Current portion of long-term debt | 3,390 | 8,245 | |||||||
| Capital lease obligations | 174 | 226 | |||||||
| Total current liabilities | 29,639 | 38,335 | |||||||
| Long-term debt, less current portion | 165,640 | 211,834 | |||||||
| Capital lease obligations, less current portion | 292 | 205 | |||||||
| Other non-current liabilities | 13,881 | 7,554 | |||||||
| Total liabilities | 209,452 | 257,928 | |||||||
| Stockholders' equity (deficit): | |||||||||
| Class A preferred stock, $.01 par value; authorized shares: 15,500 at April 2, 2005; none at December 31, 2005; none issued and outstanding | — | — | |||||||
| Class B exchangeable convertible participating preferred stock, $.01 par value; authorized shares: 240,000 at April 2, 2005; none at December 31, 2005; issued and outstanding shares: 240,000 at April 2, 2005 | — | 2 | |||||||
| Class C redeemable preferred stock, $.01 par value; authorized shares: 900,000 at April 2, 2005; none at December 31, 2005; none issued and outstanding | — | — | |||||||
| Class D preferred stock, $.01 par value; authorized shares: 240,000 at April 2, 2005; none at December 31, 2005; none issued and outstanding | — | — | |||||||
| Class A voting common stock, $.01 par value; authorized shares: 20,000,000 at April 2, 2005; none at December 31, 2005; issued and outstanding shares: 6,202,519 at April 2, 2005 | — | 62 | |||||||
| Class B super voting common stock, $.01 par value; authorized shares: 2,500,000 at April 2, 2005; none at December 31, 2005; issued and outstanding shares: 250 at April 2, 2005 | — | — | |||||||
| Common Stock, $.01 par value; authorized shares: 60,000,000 at December 31, 2005; issued and outstanding shares: 16,631,213 at December 31, 2005 | 166 | — | |||||||
| Additional paid-in capital | 98,206 | 34,252 | |||||||
| Deferred compensation | (158 | ) | (349 | ) | |||||
| Accumulated other comprehensive loss | (3,532 | ) | (2,532 | ) | |||||
| Accumulated deficit | (32,710 | ) | (39,194 | ) | |||||
| Total stockholders' equity (deficit) | 61,972 | (7,759 | ) | ||||||
| Total liabilities and stockholders' equity (deficit) | $ | 271,424 | $ | 250,169 | |||||
See notes to unaudited interim consolidated financial statements.
RBC Bearings Incorporated
Consolidated Statements of Operations
(dollars in thousands, except share and per share data)
(Unaudited)
| | Nine Months Ended | |||||||
|---|---|---|---|---|---|---|---|---|
| | December 31, 2005 | January 1, 2005 | ||||||
| Net sales | $ | 198,758 | $ | 170,731 | ||||
| Cost of sales | 139,134 | 123,325 | ||||||
| Gross margin | 59,624 | 47,406 | ||||||
| Operating expenses: | ||||||||
| Selling, general and administrative | 32,325 | 23,261 | ||||||
| Other, net | 1,020 | 2,464 | ||||||
| Total operating expenses | 33,345 | 25,725 | ||||||
| Operating income | 26,279 | 21,681 | ||||||
| Interest expense, net | 12,582 | 14,335 | ||||||
| Loss on early extinguishment of debt | 3,771 | 6,956 | ||||||
| Other non-operating income | — | (98 | ) | |||||
| Income before income taxes | 9,926 | 488 | ||||||
| Provision for income taxes | 3,442 | 180 | ||||||
| Net income | 6,484 | 308 | ||||||
| Preferred stock dividends | (893 | ) | (1,693 | ) | ||||
| Participation rights of preferred stock in undistributed earnings | (630 | ) | (687 | ) | ||||
| Net income (loss) available to common stockholders | $ | 4,961 | $ | (2,072 | ) | |||
| Net income (loss) per common share: | ||||||||
| Basic | $ | 0.43 | $ | (0.33 | ) | |||
| Diluted | $ | 0.37 | $ | (0.33 | ) | |||
| Weighted average common shares: | ||||||||
| Basic | 11,649,073 | 6,188,903 | ||||||
| Diluted | 13,307,181 | 6,188,903 | ||||||
See notes to unaudited interim consolidated financial statements.
RBC Bearings Incorporated
Consolidated Statements of Stockholders' Deficit and Comprehensive Income (Loss)
(dollars in thousands)
(Unaudited)
| | Class B Preferred Stock | Class C Preferred Stock | Class D Preferred Stock | Common Stock | | | Accumulated Other Comprehensive Loss | | | | |||||||||||||||||||||||||||||
|---|---|---|---|---|---|---|---|---|---|---|---|---|---|---|---|---|---|---|---|---|---|---|---|---|---|---|---|---|---|---|---|---|---|---|---|---|---|---|---|
| | Additional Paid-in Capital | Deferred Compensation | Accumulated Deficit | Total Stockholders' Deficit | Comprehensive Income/ (Loss) | ||||||||||||||||||||||||||||||||||
| | Shares | Amount | Shares | Amount | Shares | Amount | Shares | Amount | |||||||||||||||||||||||||||||||
| Balance at April 3, 2004 | 240,000 | $ | 2 | — | $ | — | — | $ | — | 6,188,903 | $ | 62 | $ | 33,448 | $ | — | $ | (3,343 | ) | $ | (46,454 | ) | $ | (16,285 | ) | ||||||||||||||
| Net income | — | — | — | — | — | — | — | — | — | — | — | 7,260 | 7,260 | $ | 7,260 | ||||||||||||||||||||||||
| Stock compensation charge for options granted at below fair market value | — | — | — | — | — | — | — | — | 769 | (769 | ) | — | — | — | |||||||||||||||||||||||||
| Amortization of deferred stock compensation | — | — | — | — | — | — | — | — | — | 420 | — | — | 420 | ||||||||||||||||||||||||||
| Exercise of common stock options and warrants | — | — | — | — | — | — | 13,866 | — | 35 | — | — | — | 35 | ||||||||||||||||||||||||||
| Currency translation adjustments | — | — | — | — | — | — | — | — | — | — | 488 | 488 | 488 | ||||||||||||||||||||||||||
| Minimum pension liability adjustment, net of taxes of $338 | — | — | — | — | — | — | — | — | — | — | 323 | — | 323 | 323 | |||||||||||||||||||||||||
| Comprehensive income | $ | 8,071 | |||||||||||||||||||||||||||||||||||||
| Balance at April 2, 2005 | 240,000 | 2 | — | — | — | — | 6,202,769 | 62 | 34,252 | (349 | ) | (2,532 | ) | (39,194 | ) | (7,759 | ) | ||||||||||||||||||||||
| Net income | — | — | — | — | — | — | — | — | — | — | — | 6,484 | 6,484 | $ | 6,484 | ||||||||||||||||||||||||
| Stock compensation charge for options granted at below fair market value | — | — | — | — | — | — | — | — | 16 | (16 | ) | — | — | — | |||||||||||||||||||||||||
| Amortization of deferred stock compensation | — | — | — | — | — | — | — | — | — | 207 | — | — | 207 | ||||||||||||||||||||||||||
| Conversion of Class B preferred stock. | (240,000 | ) | (2 | ) | 306,298 | 3 | 240,000 | 2 | 1,846,396 | 19 | (22 | ) | — | — | — | — | |||||||||||||||||||||||
| Redemption of Class C preferred stock | — | — | (306,298 | ) | (3 | ) | (30,627 | ) | — | — | — | (30,630 | ) | ||||||||||||||||||||||||||
| Redemption of Class D preferred stock | (240,000 | ) | (2 | ) | 275,863 | 3 | (4,001 | ) | (4,000 | ) | |||||||||||||||||||||||||||||
| Net proceeds from issuance of common stock | — | — | — | — | — | — | 7,034,516 | 70 | 92,058 | — | — | — | 92,128 | ||||||||||||||||||||||||||
| Exercise of common stock options and warrants | — | — | — | — | — | — | 62,634 | — | 284 | — | — | — | 284 | ||||||||||||||||||||||||||
| Cashless exercise of common stock options and warrants | — | — | — | — | — | — | 1,209,035 | 12 | (12 | ) | — | — | — | — | |||||||||||||||||||||||||
| Income tax benefit on exercise of non-qualified common stock options and warrants | — | — | — | — | — | — | — | — | 6,258 | — | — | — | 6,258 | ||||||||||||||||||||||||||
| Currency translation adjustments | — | — | — | — | — | — | — | — | — | — | (588 | ) | — | (588 | ) | (588 | ) | ||||||||||||||||||||||
| Minimum pension liability adjustment, net of taxes of $245 | — | — | — | — | — | — | — | — | — | — | (412 | ) | — | (412 | ) | (412 | ) | ||||||||||||||||||||||
| Comprehensive income | $ | 5,484 | |||||||||||||||||||||||||||||||||||||
| Balance at December 31, 2005 (unaudited) | — | $ | — | — | $ | — | — | $ | — | 16,631,213 | $ | 166 | $ | 98,206 | $ | (158 | ) | $ | (3,532 | ) | $ | (32,710 | ) | $ | 61,972 | ||||||||||||||
See notes to unaudited interim consolidated financial statements.
RBC Bearings Incorporated
Consolidated Statements of Cash Flows
(dollars in thousands)
(Unaudited)
| | Nine Months Ended | ||||||||
|---|---|---|---|---|---|---|---|---|---|
| | December 31, 2005 | January 1, 2005 | |||||||
| Cash flows from operating activities: | |||||||||
| Net income | $ | 6,484 | $ | 308 | |||||
| Adjustments to reconcile net income to net cash provided by operating activities: | |||||||||
| Depreciation | 6,641 | 6,997 | |||||||
| Deferred income taxes | 2,870 | (68 | ) | ||||||
| Amortization of intangible assets | 497 | 347 | |||||||
| Amortization of deferred financing costs and debt discount | 642 | 898 | |||||||
| Amortization of deferred stock compensation | 207 | 332 | |||||||
| Loss on disposition of assets | 30 | 1,841 | |||||||
| Loss on early extinguishment of debt (non-cash portion) | 1,536 | 4,303 | |||||||
| Other | 12 | 12 | |||||||
| Changes in operating assets and liabilities, net of acquisitions: | |||||||||
| Accounts receivable | 7,011 | (1,263 | ) | ||||||
| Inventory | (9,859 | ) | (6,767 | ) | |||||
| Prepaid expenses and other current assets | 373 | (1,222 | ) | ||||||
| Other non-current assets | (119 | ) | 169 | ||||||
| Accounts payable | (1,006 | ) | 4,337 | ||||||
| Accrued expenses and other current liabilities | (3,186 | ) | (3,623 | ) | |||||
| Other non-current liabilities | 1,031 | (1,896 | ) | ||||||
| Net cash provided by operating activities | 13,164 | 4,705 | |||||||
Cash flows from investing activities: | |||||||||
| Purchase of property, plant and equipment | (7,772 | ) | (6,604 | ) | |||||
| Acquisition of business | (2,602 | ) | (1,228 | ) | |||||
| Proceeds from sale of assets | 27 | 110 | |||||||
| Net cash used in investing activities | (10,347 | ) | (7,722 | ) | |||||
Cash flows from financing activities: | |||||||||
| Net increase (decrease) in revolving credit facility | (5,000 | ) | 2,890 | ||||||
| Net proceeds from sale of common stock in initial public offering | 92,128 | — | |||||||
| Redemption of Class C redeemable preferred stock | (30,630 | ) | — | ||||||
| Redemption of Class D preferred stock | (4,000 | ) | — | ||||||
| Exercise of stock options and warrants | 285 | — | |||||||
| Retirement of senior subordinated notes | — | (110,000 | ) | ||||||
| Proceeds from term loans | 41,100 | 155,000 | |||||||
| Retirement of term loans | (45,000 | ) | (40,000 | ) | |||||
| Retirement of senior subordinated discount debentures | (38,562 | ) | — | ||||||
| Payments of bank term loan | (3,703 | ) | (1,750 | ) | |||||
| Principal payments on capital lease obligations | (190 | ) | (211 | ) | |||||
| Financing fees paid in connection with senior credit facility | (1,312 | ) | (4,500 | ) | |||||
| Net cash provided by financing activities | 5,116 | 1,429 | |||||||
| Effect of exchange rate changes on cash | (256 | ) | 41 | ||||||
| Cash and cash equivalents: | |||||||||
| Increase (decrease) during the period | 7,677 | (1,547 | ) | ||||||
| Cash, at beginning of period | 2,635 | 3,250 | |||||||
| Cash, at end of period | $ | 10,312 | $ | 1,703 | |||||
| Supplemental disclosures of cash flow information: | |||||||||
| Cash paid during the period for: | |||||||||
| Interest | $ | 14,066 | $ | 17,307 | |||||
| Income taxes | $ | 886 | $ | 224 | |||||
See notes to unaudited interim consolidated financial statements.
Notes to Unaudited Interim Consolidated Financial Statements
(dollars in thousands, except share and per share data)
The consolidated financial statements included herein have been prepared by RBC Bearings Incorporated, a Delaware corporation (collectively with its subsidiaries, the "Company"), without audit, pursuant to the rules and regulations of the Securities and Exchange Commission. The fiscal year end balance sheet data have been derived from the Company's audited financial statements, but do not include all disclosures required by generally accepted accounting principles in the United States. The interim financial statements furnished with this report have been prepared on a consistent basis with the Company's audited financial statements and notes thereto included herein for the fiscal year ended April 2, 2005.
As previously disclosed on Form 8-K filed by the Company on August 15, 2005, pursuant to the Purchase Agreement (the "Purchase Agreement") with Merrill Lynch & Co., Merrill Lynch, Pierce, Fenner & Smith Incorporated, KeyBanc Capital Markets and Jefferies & Company, Inc., the Company and the selling stockholders sold 10,531,200 shares of the Company's common stock on August 15, 2005 (see Note 13).
The consolidated financial statements include the accounts of RBC Bearings Incorporated, Roller Bearing Company of America, Inc. ("RBCA") and its wholly-owned subsidiaries, Industrial Tectonics Bearings Corporation ("ITB"), RBC Linear Precision Products, Inc. ("LPP"), RBC Nice Bearings, Inc. ("Nice"), RBC Precision Products—Bremen, Inc. ("Miller"), RBC Precision Products—Plymouth, Inc. ("Bremen"), Tyson Bearings, Inc. ("Tyson"), Schaublin Holdings S.A. and its wholly-owned subsidiaries ("Schaublin"), RBC de Mexico ("Mexico"), RBC Oklahoma, Inc. ("RBC Oklahoma"), RBC Aircraft Products, Inc. ("API"), and RBC Southwest Products, Inc. ("SWP") as well as its Transport Dynamics ("TDC"), Heim ("Heim"), Engineered Components ("ECD") and U.S. Bearings ("USB") divisions. All material intercompany balances and transactions have been eliminated in consolidation.
These statements reflect all adjustments, consisting only of items of a normal recurring nature, which are, in the opinion of management, necessary for the fair presentation of the consolidated financial condition and consolidated results of operations for the interim periods presented. These financial statements should be read in conjunction with the Company's audited financial statements and notes thereto included herein.
The Company operates in four reportable business segments—roller bearings, plain bearings, ball bearings, other and corporate—in which it manufactures roller bearing components and assembled parts and designs and manufactures high-precision roller and ball bearings. The Company sells to a wide variety of original equipment manufacturers ("OEMs") and distributors who are widely dispersed geographically.
The results of operations for the nine month period ended December 31, 2005 are not necessarily indicative of the operating results for the full year. Amounts shown are in thousands, unless otherwise indicated.
1. Acquisition
Effective September 2, 2005, SWP purchased certain assets of the Southwest Products Company, a manufacturer of spherical bearings, journal bearings, and push-pull controls for military weapon systems and military and commercial aerospace applications located in Irwindale, California. The total consideration paid was approximately $2,602. The products associated with the acquisition are complementary with products already provided by other Company businesses. Southwest Products Company is included in the Plain Bearing reportable segment.
2. Net Income (Loss) Per Common Share
Basic net income (loss) per common share is computed by dividing net income (loss) available to common stockholders (both Class A and Class B common stockholders share equally in net income (loss)) by the weighted average number of common shares outstanding. Prior to August 15, 2005, the Company also had outstanding Class B convertible participating preferred stock (the Class B preferred stock participated in all undistributed earnings with the common stock). The Company allocated earnings to the common stockholders and the Class B convertible participating preferred stockholders under the two-class method as required by Emerging Issues Task Force Issue No. 03-6, "Participating Securities and the Two-Class Method under FASB Statement No. 128." The two-class method is an earnings allocation method under which basic net income per share is calculated for the Company's common stock and its Class B convertible participating preferred stock considering both accrued preferred stock dividends and participation rights in undistributed earnings as if all such earnings had been distributed during the year. Since the Company's Class B convertible participating preferred stock was not contractually responsible to share in the Company's losses, in applying the two-class method to compute basic net income per common share, no allocation was made to the Class B preferred stock if a net loss existed or if an undistributed net loss resulted from reducing net income by the accrued preferred stock dividends.
Diluted net income (loss) per common share is computed by dividing net income (loss) by the sum of the weighted average number of common shares, dilutive common share equivalents then outstanding using the treasury stock method and, prior to August 15, 2005, the assumed conversion of the Class B convertible participating preferred stock to common shares (if-converted method). If the if-converted method was anti-dilutive (that is, the if-converted method resulted in a higher net income per common share amount than basic net income per share calculated under the two-class method), then the two-class method was used to compute diluted net income (loss) per common share, including the effect of common share equivalents. Common share equivalents consist of the incremental common shares issuable upon the exercise of stock options and warrants.
If the above calculations resulted in a net loss available to common stockholders (due to a net loss for the period or the effect of accrued preferred stock dividends) and if the effect of including common share equivalents and the assumed conversion of preferred stock, or use of the two-class method, was anti-dilutive, then diluted net loss per common share would equal basic net loss per common share.
The table below reflects the calculation of weighted average shares outstanding for each period presented as well as the computation of basic and diluted net income (loss) per common share:
| | Nine Months Ended | |||||||
|---|---|---|---|---|---|---|---|---|
| | December 31, 2005 | January 1, 2005 | ||||||
| Numerator: | ||||||||
| Net income | $ | 6,484 | $ | 308 | ||||
| Preferred stock dividends* | (893 | ) | (1,693 | ) | ||||
| Participation rights of preferred stock in undistributed earnings** | (630 | ) | (687 | ) | ||||
| Numerator for basic and diluted net income per common share—income (loss) available to common stockholders under the two-class method | 4,961 | (2,072 | ) | |||||
| Preferred stock dividends and participation rights of preferred stock | 1,523 | 2,380 | ||||||
| Numerator for diluted net income per common share—income available to common stockholders after assumed conversion of preferred stock | $ | 6,484 | $ | 308 | ||||
| Denominator: | ||||||||
| Denominator for basic net income (loss) per common share—weighted-average shares | 11,649,073 | 6,188,903 | ||||||
| Effect of dilution due to employee stock options and warrants | 785,636 | 2,810,892 | ||||||
| Effect of dilution due to convertible preferred stock* | 872,472 | 1,846,395 | ||||||
| Denominator for diluted net income (loss) per common share—adjusted weighted-average shares | 13,307,181 | 10,846,190 | ||||||
| Basic net income (loss) per common share | $ | 0.43 | ($ | 0.33 | ) | |||
| Diluted net income (loss) per common share | $ | 0.37 | ($ | 0.33 | ) | |||
3. Inventory
Inventories are stated at the lower of cost or market, using the first-in, first-out method, and are summarized below:
| | December 31, 2005 | April 2, 2005 | ||||
|---|---|---|---|---|---|---|
| Raw materials | $ | 8,159 | $ | 5,598 | ||
| Work in process | 29,618 | 27,959 | ||||
| Finished goods | 67,327 | 62,097 | ||||
| $ | 105,104 | $ | 95,654 | |||
4. Comprehensive Income
The components of comprehensive income that relate to the Company are net income, foreign currency translation adjustments and minimum pension liability. Total comprehensive income is as follows:
| | Nine Months Ended | |||||
|---|---|---|---|---|---|---|
| | December 31, 2005 | January 1, 2005 | ||||
| Net income | $ | 6,484 | $ | 308 | ||
| Foreign currency translation adjustments | (588 | ) | 914 | |||
| Minimum pension liability | (412 | ) | — | |||
| Total comprehensive income | $ | 5,484 | $ | 1,222 | ||
5. Stock Based Compensation
The Company accounts for options and warrants granted to employees using the intrinsic value method pursuant to APB No. 25, "Accounting for Stock Issued to Employees," under which compensation cost is recognized only if the exercise price of grants issued is below the fair market value of the Company's common stock at the date of grant. Had compensation cost for these grants been determined based on the fair value at the grant dates consistent with SFAS No. 123, "Accounting
for Stock Based Compensation," the Company's net income would have been reduced to the following pro forma amounts:
| | Nine Months Ended | |||||||
|---|---|---|---|---|---|---|---|---|
| | December 31, 2005 | January 1, 2005 | ||||||
| Net income, as reported | $ | 6,484 | $ | 308 | ||||
| Plus: stock-based compensation expense included in reported net income, net of tax | 136 | 209 | ||||||
| Less: stock-based compensation expense determined under fair value method, net of tax | (1,547 | ) | (131 | ) | ||||
| Pro forma net income | $ | 5,073 | $ | 386 | ||||
| Net income (loss) per common share, as reported: | ||||||||
| Basic | $ | 0.43 | $ | (0.33 | ) | |||
| Diluted | $ | 0.37 | $ | (0.33 | ) | |||
| Net income (loss) per common share, pro forma: | ||||||||
| Basic | $ | 0.30 | $ | (0.32 | ) | |||
| Diluted | $ | 0.27 | $ | (0.32 | ) | |||
The fair value for the Company's options and warrants was estimated at the date of grant using the Black Scholes option pricing model with the following weighted average assumptions.
| | Nine Months Ended | ||||
|---|---|---|---|---|---|
| | December 31, 2005 | January 1, 2005 | |||
| Dividend yield | 0.0 | % | 0.0 | % | |
| Expected weighted-average life | 7.0 | 3.0 | |||
| Risk-free interest rate | 3.5 | % | 3.5 | % | |
| Expected volatility | 0.3 | % | 0.1 | % | |
The Black-Scholes option pricing model was developed for use in estimating the fair value of traded options and warrants which have no vesting restrictions and are fully transferable. In addition, option and warrant valuation models require the input of highly subjective assumptions, including the expected stock price volatility. Because the Company's warrants have characteristics significantly different from those of traded options and warrants, and because changes in the subjective input assumptions can materially affect the fair value estimate, the existing models do not necessarily provide a reliable single measure of the fair value of its options and warrants.
6. Debt
On June 29, 2004, the Company closed a $210,000 debt refinancing agreement (the "Credit Facility") led and arranged by General Electric Capital Corporation. The agreement provided a $55,000 revolving credit agreement (the "Revolving Credit Facility"), a $110,000 term loan (the "Term Loan"), and a $45,000 second lien term loan (the "SCIL Loan"). Each loan was secured by a lien against substantially all of the assets of the Company and subjected the Company to standard affirmative and
negative covenants, as well as financial leverage tests. The proceeds were used to refinance the then existing senior credit facility and to redeem outstanding debt. Most notably, concurrently with funding, the Company issued a notice of redemption to the noteholders of the 95/8% senior subordinated notes issued pursuant to an indenture and due June 15, 2007. The requisite funds, approximately $113,000 (101.6041% of the principal amount), were irrevocably put on deposit with the trustee, Bank of New York, for redemption on July 29, 2004. This amount included a redemption premium of $1,765 that was recorded as a loss on extinguishment of debt, as was $4,297 in unamortized deferred finance fees associated with this debt and $882 in interest expense during the call period. Deferred finance fees of $4,516 were capitalized associated with the new debt refinancing arrangement.
The Revolving Credit Facility bore interest at a floating rate of either the higher of the base rate on corporate loans or the federal funds rate plus 50 basis points, plus 1.75%; or LIBOR plus 3.00%. The Company had the right to elect the applicable interest rate on the Revolving Credit Facility. The Term Loan bore interest at a floating rate of either the higher of the base rate on corporate loans or the federal funds rate plus 50 basis points, plus 2.50%; or LIBOR plus 3.75%. The Company had the right to elect the applicable interest rate on the Term Loan. The SCIL Loan bore interest at a floating rate of either the higher of the base rate on corporate loans or the federal funds rate plus 50 basis points, plus 7.25%; or LIBOR plus 8.50%. The Company had the right to elect the applicable interest rate on the SCIL Loan.
On August 15, 2005, the Company entered into a Fifth Amended and Restated Credit Agreement (the "Amended Credit Agreement"), among RBCA; the other Credit Parties signatory thereto; General Electric Capital Corporation, a Delaware corporation, for itself, as lender, and as agent for the lenders, concurrently with the closing of the Company's initial public offering. Pursuant to the Amended Credit Agreement, the Company increased its term loan borrowings by approximately $40,000 from $110,000 under the term loan portion of the Amended Credit Agreement. The Amended Credit Agreement provides a $55,000 revolving credit agreement (the "Amended Revolving Credit Facility") and a $150,000 term loan (the "Amended Term Loan"). The principal amount of the Amended Term Loan will be repaid in twenty-five (25) consecutive quarterly installments commencing December 31, 2005. As of December 31, 2005, the Company had repaid $2,375 of principal on the Amended Term Loan. Each loan is secured by a lien against substantially all of the assets of the Company and subjects the Company to standard affirmative and negative covenants, as well as financial leverage tests. As of December 31, 2005, the Company was in compliance with all such covenants.
The Amended Revolving Credit Facility bears interest at a floating rate of either the higher of the base rate on corporate loans or the federal funds rate plus 50 basis points, plus 1.25%; or LIBOR plus 2.50%. The Company has the right to elect the applicable interest rate on the Amended Revolving Credit Facility. The Amended Term Loan bears interest at a floating rate of either the higher of the base rate on corporate loans or the federal rate plus 50 basis points, plus 1.50%; or LIBOR plus 2.75%. The Company has the right to elect the applicable interest rate on the Amended Term Loan. As of December 31, 2005, the weighted average interest rate on the outstanding Amended Credit Facility was 7.04%.
Approximately $20,613 of the Amended Revolving Credit Facility is being utilized to provide letters of credit to secure RBCA's obligations relating to certain Industrial Development Revenue
Bonds and insurance programs. As of December 31, 2005, the Company had the ability to borrow up to an additional $34,387 under the Amended Revolving Credit Facility.
The proceeds of the initial public offering and additional term loan borrowings under the Amended Credit Agreement were used to redeem outstanding debt. Concurrently with the funding, the Company issued a notice of redemption to the note holders of the 13% senior subordinated discount debentures due June 15, 2009. The requisite funds, approximately $40,235, were irrevocably put on deposit with the trustee, Bank of New York, for redemption and were subsequently redeemed on September 13, 2005. This amount included a redemption premium of $1,253, a prepayment fee of $3, and interest expense for the call period of $418. These amounts along with $851 of unamortized deferred finance fees and debt discount associated with this debt were recorded as a loss on extinguishment of debt. The Company also repaid approximately $45,479 on its SCIL loan, representing all of the outstanding balance under such loan. This amount included a pre-payment fee of $450 and expenses of $29. These amounts along with $767 of unamortized deferred finance fees associated with the SCIL debt were recorded as a loss in extinguishment of debt. Deferred financing fees of $1,312 were capitalized associated with the Amended Credit Agreement.
The balances payable under all borrowing facilities are as follows:
| | December 31, 2005 | April 2, 2005 | ||||
|---|---|---|---|---|---|---|
| 13% Senior Subordinated Discount Debentures | $ | — | $ | 37,949 | ||
Credit Facility | ||||||
| Term Loan (replaced with Amended Credit Agreement) | — | 109,175 | ||||
| SCIL Loan (paid as discussed above) | — | 45,000 | ||||
| Revolving Credit Facility (replaced with Amended Credit Agreement) | — | 5,000 | ||||
Amended Credit Agreement | ||||||
| Amended Term Loan, payable in quarterly installments of $375, commencing December 31, 2005, with final payment of $141,375 due July 1, 2011; bears interest at variable rates, payable monthly and upon maturity at prime or LIBOR, plus an applicable margin, at the Company's election | 147,625 | — | ||||
| Amended Revolving Credit Facility; bears interest at variable rates, payable monthly and upon maturity at prime or LIBOR, plus an applicable margin, at the Company's election | — | — | ||||
Swiss Credit Facility | ||||||
| Term Loan, payable in semi-annual installments ranging from approximately $400, commencing March 31, 2004, to approximately $1,000 from September 30, 2005, with final payment due March 31, 2009; bears interest at variable rates, plus an applicable margin, payable quarterly | 4,750 | 6,233 | ||||
Other Loans | — | 67 | ||||
Industrial Development Revenue Bonds | ||||||
| Series 1994 A, due in annual installments of $180 beginning September 1, 2006, graduating to $815 on September 1, 2014, with final payment due on September 1, 2017; bears interest at a variable rate, payable monthly through September 2017 | 7,700 | 7,700 | ||||
| Series 1994 B, bears interest at a variable rate, payable monthly through December 2017 | 3,000 | 3,000 | ||||
| Series 1998, bears interest at variable rates, payable monthly through December 2021 | 1,155 | 1,155 | ||||
| Series 1999, bearing interest at variable rates, payable monthly through April 2024 | 4,800 | 4,800 | ||||
| Total Debt | 169,030 | 220,079 | ||||
| Less: Current Portion | 3,390 | 8,245 | ||||
| Long-Term Debt | $ | 165,640 | $ | 211,834 | ||
The current portion of long-term debt as of December 31, 2005 and April 2, 2005 includes $0 and $5,000, respectively, of borrowings on the revolving credit facilities.
7. Disposal of Fixed Assets
During the nine month periods ended December 31, 2005 and January 1, 2005, the Company had a non-cash charge of $30 and $1,841, respectively, on the loss on sale and disposal of property, plant and equipment related to the consolidation of production lines and outsourcing certain components to low-cost producers.
8. Income Taxes
The effective income tax rates for the nine month periods ended December 31, 2005 and January 1, 2005 were 34.7% and 36.9%, respectively.
The change in the effective income tax rates from period to period is mostly due to changes in the allocation between domestic and foreign earnings, primarily the result of the loss on early extinguishment of debt and the one-time special compensation payment (see Note 11).
9. Pension and Postretirement Plans
The Company has noncontributory defined benefit pension plans covering union employees in its Heim division plant in Fairfield, Connecticut, its Nice subsidiary plant in Kulpsville, Pennsylvania, its Bremen subsidiary plant in Plymouth, Indiana and its Tyson subsidiary plant in Glasgow, Kentucky.
The following tables illustrate the components of net periodic benefit cost for the Company's pension and other postretirement benefits.
| | Pension Benefits Nine Months Ended | |||||||
|---|---|---|---|---|---|---|---|---|
| | December 31, 2005 | January 1, 2005 | ||||||
| Components of net periodic benefit cost: | ||||||||
| Service cost | $ | 432 | $ | 381 | ||||
| Interest cost | 739 | 708 | ||||||
| Expected return on plan assets | (849 | ) | (729 | ) | ||||
| Amortization of losses | 186 | 194 | ||||||
| Total net periodic benefit cost | $ | 508 | $ | 554 | ||||
| | Other Postretirement Benefits Nine Months Ended | |||||||
|---|---|---|---|---|---|---|---|---|
| | December 31, 2005 | January 1, 2005 | ||||||
| Components of net periodic benefit cost: | ||||||||
| Service cost | $ | 168 | $ | 168 | ||||
| Interest cost | 186 | 186 | ||||||
| Prior service cost amortization | (314 | ) | (314 | ) | ||||
| Amount of loss recognized | 123 | 123 | ||||||
| Total net periodic benefit cost | $ | 163 | $ | 163 | ||||
10. Reportable Segments
The Company operates through operating segments for which separate financial information is available, and for which operating results are evaluated regularly by the Company's chief operating decision maker in determining resource allocation and assessing performance. Those operating segments with similar economic characteristics and that meet all other required criteria, including nature of the products and production processes, distribution patterns and classes of customers, are aggregated as reportable segments. Certain other operating segments do not exhibit the common attributes mentioned above and do not meet the quantitative thresholds for separate disclosure, and their information is combined and disclosed as "Other". There is also a segment reflecting corporate charges.
The Company has four reportable business segments engaged in the manufacture and sale of the following:
Roller Bearings. Roller bearings are anti-friction bearings that use rollers instead of balls. The Company manufactures four basic types of roller bearings: heavy duty needle roller bearings with inner rings, tapered roller bearings, track rollers and aircraft roller bearings.
Plain Bearings. Plain bearings are produced with either self-lubricating or metal-to-metal designs and consist of several sub-classes, including rod end bearings, spherical plain bearings and journal bearings. Unlike ball bearings, which are used in high-speed rotational applications, plain bearings are primarily used to rectify inevitable misalignments in various mechanical components.
Ball Bearings. The Company manufactures four basic types of ball bearings: high precision aerospace, airframe control, thin section and commercial ball bearings which are used in high-speed rotational applications.
Other. Other consists of two minor operating locations that do not fall into the above segmented categories. The Company produces precision ground ball bearing screws at its Linear Precision Products (LPP) plant that offer repeatable positioning accuracy in machine tools, transfer lines, robotic handling and semiconductor equipment. The Company's Schaublin location produces precision machine tool collets that provide effective part holding and accurate part location during machining operations.
Corporate. Corporate consists of expenses incurred at the corporate office.
Segment performance is evaluated based on segment net sales and operating income. Items not allocated to segment operating income include corporate administrative expenses and certain other amounts.
| | Nine Months Ended | ||||||
|---|---|---|---|---|---|---|---|
| | December 31, 2005 | January 1, 2005 | |||||
| Net External Sales | |||||||
| Roller | $ | 71,193 | $ | 64,643 | |||
| Plain | 82,078 | 66,650 | |||||
| Ball | 33,239 | 28,357 | |||||
| Other | 12,248 | 11,081 | |||||
| $ | 198,758 | $ | 170,731 | ||||
| Operating Income | |||||||
| Roller | $ | 16,660 | $ | 10,550 | |||
| Plain | 21,441 | 16,278 | |||||
| Ball | 7,747 | 5,619 | |||||
| Other | 1,232 | 860 | |||||
| Corporate | (20,801 | ) | (11,626 | ) | |||
| $ | 26,279 | $ | 21,681 | ||||
| Geographic External Sales | |||||||
| Domestic | $ | 177,003 | $ | 151,158 | |||
| Foreign | 21,755 | 19,573 | |||||
| $ | 198,758 | $ | 170,731 | ||||
| Intersegment Sales | |||||||
| Roller | $ | 6,751 | $ | 4,821 | |||
| Plain | 635 | 1,628 | |||||
| Ball | 3,980 | 2,695 | |||||
| Other | 9,633 | 7,171 | |||||
| $ | 20,999 | $ | 16,315 | ||||
All intersegment sales are eliminated in consolidation.
11. Related Party Transactions
In June 1997, the Company loaned Dr. Michael J. Hartnett, President and Chief Executive Officer of the Company, $500 to purchase shares of capital stock of the Company. This loan was repaid to the Company on August 15, 2005.
On June 13, 2005, subject to the approval of the Company's senior lenders under the Credit Facility and Second Lien Term Loan, which was subsequently obtained, the Board of Directors agreed to pay the CEO a one-time special compensation payment of $5,200 to reimburse the CEO for taxes
owed by him in connection with a previous stock sale by the CEO to Whitney. The Company's senior lenders approved the payment on July 13, 2005. As such, the Company recorded a charge of $5,200 (classified as selling, general and administrative expense) in the second quarter of fiscal 2006. In connection with such transaction, the Company will receive a tax deduction of approximately $5,200.
12. Recent Accounting Pronouncements
In November 2004, the Financial Accounting Standards Board ("FASB") issued SFAS No. 151, "Inventory Costs, an amendment of ARB No. 43, Chapter 4." The amendments made by SFAS No. 151 clarify that abnormal amounts of idle facility expense, freight, handling costs, and wasted materials (spoilage) should be recognized as current-period charges and require the allocation of fixed production overheads to inventory based on the normal capacity of the production facilities. The guidance is effective for inventory costs incurred during fiscal years beginning after June 15, 2005. It is not believed that the adoption of SFAS No. 151 will have a material impact on the consolidated financial position, results of operations or cash flows of the Company.
In December 2004, the FASB issued SFAS No. 123 (revised 2004), "Share-Based Payment." SFAS No. 123(R) requires the compensation cost relating to share-based payment transactions be recognized in financial statements. That cost will be measured based on the fair value of the equity or liability instruments issued. SFAS No. 123(R) covers a wide range of share-based compensation arrangements including share options, restricted share plans, performance-based awards, share appreciation rights, and employee share purchase plans. SFAS No. 123(R) replaces FASB Statement No. 123, "Accounting for Stock-Based Compensation", and supersedes APB Opinion No. 25, "Accounting for Stock Issued to Employees." SFAS No. 123, as originally issued in 1995, established as preferable a fair value-based method of accounting for share-based payment transactions with employees. However, that Statement permitted entities the option of continuing to apply the guidance in APB Opinion No. 25, as long as the footnotes to financial statements disclosed what net income would have been had the preferable fair value-based method been used. Public entities are required to apply SFAS No. 123(R) as of the beginning of the first fiscal year beginning after June 15, 2005. SFAS No. 123(R) permits public companies to adopt its requirements using one of two methods:
The Company is required to adopt the pronouncement in fiscal 2007 and has decided to use the "modified prospective" method in applying SFAS No. 123(R). The Company is currently evaluating the effect on its consolidated results of operations and whether the adoption will result in amounts that are similar to the current pro forma disclosures under SFAS No. 123. For fiscal 2006, the Company will
continue to disclose stock-based compensation information in accordance with SFAS No. 148, "Accounting for Stock-Based Compensation—Transition and Disclosure—an Amendment of FASB Statement No. 123," and SFAS No. 123.
13. Initial Public Offering, Debt Refinancing and Other Transactions
On August 2, 2005, the Company's Board of Directors approved a 5-for-2 stock split of its common stock. All share and per share information in the consolidated financial statements has been retroactively restated to reflect the stock split for all periods presented.
On August 15, 2005, pursuant to the Purchase Agreement (the "Purchase Agreement") with Merrill Lynch & Co., Merrill Lynch, Pierce, Fenner & Smith Incorporated, KeyBanc Capital Markets and Jefferies & Company, Inc., the Company and the selling stockholders sold 10,531,200 shares of the Company's common stock (3,496,684 sold by the selling stockholders). The offering yielded aggregate net proceeds to the Company of $92,128 after payment of the underwriting discount and offering expenses. After redemption of the Company's Class C and Class D preferred stock for $34,630, the net proceeds to the Company were $57,498. Immediately prior to the consummation of the initial public offering, all outstanding shares of Class B preferred stock were converted in accordance with their terms into 1,846,396 shares of Class A common stock, 306,298 shares of Class C preferred stock and 240,000 shares of Class D preferred stock. All shares of Class C and Class D preferred stock were redeemed with cash or common stock as described in the subsequent paragraph and all shares of Class A and Class B common stock were reclassified as common stock on a one-for-one basis. In connection with the initial public offering, the Company filed an Amended and Restated Certificate of Incorporation (the "Amendment"). The Amendment increased the Company's authorized capital stock to 70,000,000 shares, (i) 60,000,000 of which is common stock, $0.01 par value per share, and (ii) 10,000,000 of which is preferred stock, $0.01 par value per share.
The proceeds of the offering and additional term loan borrowings under the Amended Credit Agreement (as discussed in Note 6) were used as follows: (1) to redeem all of the Company's outstanding 13% senior subordinated discount debentures by payment to the Bank of New York, as trustee for the holders of debentures, of a total payoff amount of approximately $40,000; (2) to redeem 293,536 shares of Class C Preferred Stock held by Whitney RBCH Investor, LLC ("Whitney") for an aggregate redemption price of $29,354; (3) to redeem 12,762 shares of Class C Preferred Stock held by Dr. Michael Hartnett for an aggregate redemption price of $1,276; (4) to repurchase 230,000 shares of Class D Preferred Stock held by Whitney for an aggregate repurchase price of $7,667, of which $3,833 was paid in cash out of the proceeds of the offering and term loan borrowings and the balance of which was paid by issuance of 264,368 shares of Common Stock; (5) to repurchase 10,000 shares of Class D Preferred Stock held by Hartnett for an aggregate repurchase price of $333, of which $167 was paid in cash out of the proceeds of the offering and term loan borrowings, and the balance of which was paid by issuance of 11,495 shares of Common Stock; (6) to repay approximately $45,500 of indebtedness under the Company's second lien term loan credit facility, which represented repayment in full of all amounts owing under such facility, plus approximately $1,400 in fees and expenses in connection with such repayment and amendment; (7) to pay approximately $5,000 in mandatory prepayments under the Company's credit facility in connection with the initial public offering;
and (8) to pay $2,732 in legal, printing, accounting and other miscellaneous expenses payable in connection with the initial public offering.
In addition, the Company paid monitoring fees of approximately $50 and expense reimbursements of approximately $12 pursuant to the Management Agreement with an affiliate of Whitney, and upon such payment the Management Agreement was terminated.
SCHEDULE II—VALUATION AND QUALIFYING ACCOUNTS
Allowance for Doubtful Accounts
The activity in the allowance for doubtful accounts consists of the following:
| Fiscal Year Ended | Balance at Beginning of Year | Additions | Write-offs | Balance at End of Year | ||||||||
|---|---|---|---|---|---|---|---|---|---|---|---|---|
| April 2, 2005 | $ | 770 | $ | 472 | $ | (614 | ) | $ | 628 | |||
| April 3, 2004 | 744 | 378 | (352 | ) | 770 | |||||||
| March 29, 2003 | 621 | 123 | — | 744 | ||||||||
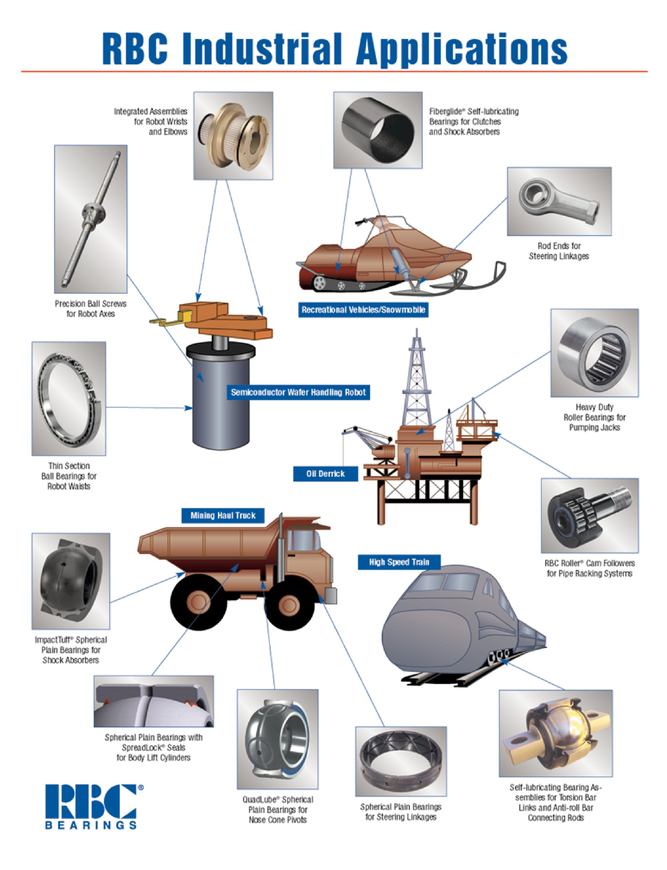
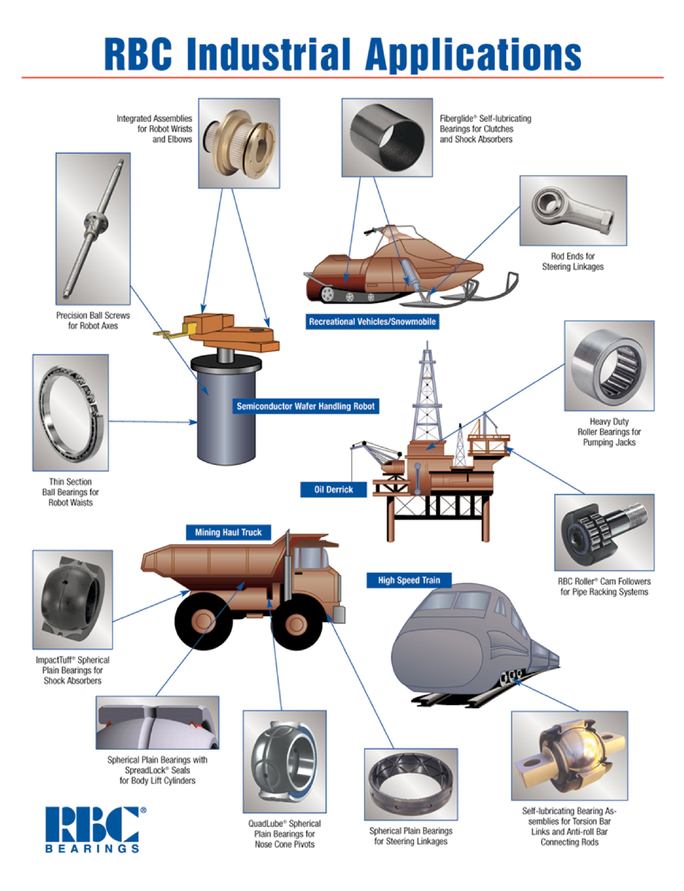
Through and including , 2005 (the 25th day after the date of this prospectus), all dealers effecting transactions in these securities, whether or not participating in this offering, may be required to deliver a prospectus. This is in addition to the dealers' obligation to deliver a prospectus when acting as underwriters and with respect to their unsold allotments or subscriptions.
8,288,0007,067,000 Shares
Common Stock
PROSPECTUS
Merrill Lynch & Co.
KeyBanc Capital Markets
JefferiesRobert W. Baird & Company, Inc.Co.
, 20052006
INFORMATION NOT REQUIRED IN PROSPECTUS
Item 13. Other Expenses of Issuance and Distribution
The following table sets forth the costs and expenses, other than underwriting discounts and commissions, payable by RBC Bearings Incorporated in connection with the offer and sale of the securities being registered. All amounts are estimates except the SEC registration fee and the NASD filing fee.
| SEC registration fee | $ | 17,949.16 | $ | 17,104.92 | ||
| NASD filing fee | 15,538.00 | 16,486.00 | ||||
| Nasdaq National Market listing fee | * | |||||
| Transfer Agent's Fee | * | |||||
| Printing and engraving costs | * | |||||
| Legal fees and expenses | * | |||||
| Accounting fees and expenses | * | |||||
| Additional Director's & Officer's Insurance Premium | * | |||||
| Miscellaneous | * | |||||
| Total | $ | �� | $ | |||
Item 14. Indemnification of Directors and Officers
Delaware. The General Corporation Law of the State of Delaware ("DGCL") authorizes corporations to limit or eliminate the personal liability of directors to corporations and their stockholders for monetary damages for breaches of directors' fiduciary duties. The certificates of incorporation of the Delaware registrants include a provision that eliminates the personal liability of directors for monetary damages for actions taken as a director, except for liability for breach of duty of loyalty; for acts or omissions not in good faith or involving intentional misconduct or knowing violation of law; under Section 174 of the DGCL (unlawful dividends and stock repurchases); or for transactions from which the director derived improper personal benefit.
The certificates of incorporation of the Delaware registrants provide that these registrants must indemnify their directors and officers to the fullest extent authorized by the DGCL and must also pay expenses incurred in defending any such proceeding in advance of its final disposition upon delivery of an undertaking, by or on behalf of an indemnified person, to repay all amounts so advanced if it should be determined ultimately that such person is not entitled to be indemnified under this section or otherwise.
The indemnification rights set forth above shall not be exclusive of any other right which an indemnified person may have or hereafter acquire under any statute, provision of our certificate of incorporation, our by laws, agreement, vote of stockholders or disinterested directors or otherwise.
The purchase agreement to be entered into between RBC Bearings Incorporated and the underwriters in connection with this offering will include provisions pursuant to which the underwriters indemnify the directors and officers of RBC Bearings Incorporated.
RBC Bearings Incorporated maintains insurance to protect itself and its directors and, officers and those of its subsidiaries against any such expense, liability or loss, whether or not it would have the power to indemnify them against such expense, liability or loss under applicable law.
II-1
Item 15. Recent Sales of Unregistered Securities
Set forth in chronological order is information regarding all securities sold and employee stock options granted since April 1, 2002 by us. Also included is the consideration, if any, received for such securities, and information relating to the section of the Securities Act of 1933, as amended, and the
II-1
rules of the Securities and Exchange Commission pursuant to which the following issuances were exempt from registration. None of these securities were issued under the Securities Act. No award of options involved any sale under the Securities Act. No sale of securities involved the use of an underwriter and no commissions were paid in connection with the sales of any securities. All shares amounts set forth in this Item 15 are prior to giving effect to our 5-for-2 stock split which will be completed prior to the consummation of this offering.
1. At various times during the period from April 2002 through July 2005, we granted options pursuant to our 2001 Stock Option Plan, as amended, to purchase an aggregate of 181,396.5186,697 shares of our Class A Common Stock to employees and directors at exercise prices of $8.00, $20.00 and $30.00.
Following the reclassification of our shares, all outstanding options to purchase our Class A Common Stock will becomebecame exercisable into shares of our newly created common stock in accordance with the terms of our 2001 Stock Option Plan, as amended. With the exception of options that are exercised in connection with this offering, we expect that substantially all outstanding options to purchase common stock held by our employees will be subject to a lock-up period of not less than 180 days following the date of this prospectus.
2. During fiscal year 2005, upon the exercise of options granted pursuant to our 2001 Stock Option Plan, as amended, we issued 16,05613,866 shares of our Class A Common Stock for an aggregate purchase price of $34,542.80 to one of our former directors and his affiliates.
3. During fiscal year 2005, upon the exercise of options granted pursuant to our 1998 Stock Option Plan, as amended, we issued 10,000 shares of our Class A Common Stock for an aggregate purchase price of $134,347.70 to one of our employees and, upon the exercise of warrants pursuant to a warrant agreeementagreement between us and such employee, we issued 7,504 shares of our Class A Common Stock for an aggregate purchase price of $74,987.47 to the employee.
4. On July 29, 2002, we issued and sold 240,000 shares of Class B Exchangeable Convertible Participating Preferred Stock of RBCI for an aggregate purchase price of $24.0 million to Dr. Hartnett and an affiliate of Whitney RBHC Investor, LLC.
5. On February 6, 2003, we issued and sold 1,008.41 shares of Class A preferred stock for $3$3,000.00 per share, or an aggregate purchase price of approximately $3.0 million to Dr. Hartnett and an affiliate of Whitney RBHC Investor, LLC. On February 10, 2002, we exercised our option to repurchase such stock for the purchase price plus all accrued dividends. Accordingly, no Class A preferred stock is outstanding as of the date hereof.
The issuances of the securities described in paragraph 1 were exempt from registration under the Securities Act under Rule 701, as transactions pursuant to compensatory benefit plans and contracts relating to compensation as provided under such Rule 701. The recipients of such options and common stock were our employees and directors, who received the securities under our compensatory benefit plans or a contract relating to compensation. Appropriate legends were affixed to the share certificates issued in such transactions. All recipients either received adequate information from us or had adequate access, through their employment with us or otherwise, to information about us.
The issuances of the securities described in paragraphs 2 through 5 were exempt from registration under the Securities Act in reliance on Section 4(2) because the issuance of securities to recipients did not involve a public offering. The recipients of securities in each such transaction represented their intention to acquire the securities for investment only and not with a view to resale or distribution
II-2
thereof, and appropriate legends were affixed to share certificates and warrants issued in such transactions. Each of the recipients of securities in the transactions described in paragraphs 2 through 5 were accredited persons and had adequate access, through employment, business or other relationships, to information about us.
II-2
Item 16. Exhibits and Financial Statement Schedules
| 1.1 | Form of Purchase Agreement.* | |
3.1 | Amended and Restated Certificate of Incorporation of RBC Bearings Incorporated dated | |
3.3 | Bylaws of RBC Bearings | |
4.3 | Form of stock certificate for common | |
5.1 | Form of Opinion of Kirkland & Ellis LLP.* | |
10.1 | Fifth Amended and Restated Credit Agreement, dated as of | |
10.2 | Stock Option Plan of RBC Bearings Incorporated (f/k/a Roller Bearing Holding Company, Inc.), dated as of February 18, 1998 with form of | |
10.3 | Form of Stock Transfer Restriction Agreement between RBC Bearings Incorporated (f/k/a Roller Bearing Holding Company, Inc.) and certain of its | |
10.4 | Amended and Restated 2001 Stock Option Plan of RBC Bearings Incorporated (f/k/a Roller Bearing Holding Company, Inc.), dated October 24, | |
10.5 | Form of 2005 Long Term Equity Incentive | |
10.6 | Agreement of Lease between Robear West Trenton Associates, L.P. and Roller Bearing Company of America, Inc., dated February 10, 1999, for West Trenton, New Jersey | |
10.7 | First Amendment to Office Lease, dated July 26, 2004, between Robear West Trenton Associates, L.P. and Roller Bearing Company of America, Inc. | |
10.8 | Indenture of Lease dated March 31, 2004 between Roller Bearing Company of America, Inc., and Raymond Hunicke, LLC, a Connecticut limited liability | |
II-3
10.9 | Executed counterpart of the Pledge and Security Agreement, dated as of September 1, 1994, between Roller Bearing Company of America, Inc., Heller Financial, Inc. and Mark Twain | |
10.10 | Loan Agreement, dated as of September 1, 1994, between the South Carolina Job—Economic Development Authority and Roller Bearing Company of America, Inc. with respect to the Series 1994A | |
10.11 | ||
Trust Indenture, dated as of September 1, 1994, between the South Carolina Job—Economic Development Authority and Mark Twain Bank, as Trustee, with respect to the Series 1994A | ||
10.12 | Loan Agreement, dated as of September 1, 1994, between the South Carolina Job—Economic Development Authority and Roller Bearing Company of America, Inc., with respect to the Series 1994B | |
10.13 | Trust Indenture, dated as of September 1, 1994, between the South Carolina Job—Economic Development Authority and Mark Twain Bank, as Trustee, with respect to the Series 1994B | |
10.14 |
II-3
| Collective Bargaining Agreement between Heim, the International Union, United Automobile, Aerospace and Agricultural Implement Workers of America, U.A.W., and Amalgamated Local 376, U.A.W., expires January 31, | ||
10.15 | ||
Collective Bargaining Agreement between Roller Bearing Company of America, Inc. and the International Union U.A.W. and its Local 502, expires June 30, | ||
10.16 | Collective Bargaining Agreement between Tyson Bearing Company, Inc. and the United Steelworkers of America, AFL-CIO, Local 7461-01, expires June 13, | |
10.17 | Employment Agreement, | |
10.18 | Amended and Restated Promissory Note, dated as of December 15, 2000, for $500,000, made by Michael J. Hartnett, Ph.D. and payable to Roller Bearing Company of America, | |
10.19 | Loan Agreement, dated as of April 1, 1999, by and between California Infrastructure and Economic Development Bank and Roller Bearing Company of America, | |
10.20 | Indenture Of Trust, dated as of April 1, 1999, between California Infrastructure and Economic Development Bank and U.S. Bank Trust National Association, as | |
II-4
10.21 | Tax Regulatory Agreement, dated as of April 1, 1999, by and among California Infrastructure and Economic Development Bank, U.S. Bank Trust National Association, as Trustee, and Roller Bearing Company of America, | |
10.22 | Lease Agreement, dated as of December 17, 1999, between Schaublin SA and RBC Schaublin | |
10.23 | Lease by and among ABCS Properties, LLC, Michael H. Short and Lynn C. Short and Bremen Bearings, Inc. dated August 31, | |
10.24 | Guarantee dated | |
10.25 | Security Agreement, dated May 30, 2002, by and among Roller Bearing Company of America, Inc., certain of its domestic subsidiaries, General Electric Capital Corporation, as agent and Lender. | |
10.26 | Pledge Agreement, dated May 30, 2002, by and among Roller Bearing Company of America, Inc., certain of its domestic subsidiaries, General Electric Capital Corporation, as agent and Lender. | |
10.27 | Pledge Agreement, dated | |
10.28 | Master Reaffirmation, dated | |
10.29 | ||
Master Reaffirmation and Amendment to Loan Documents, dated June 29, 2004, by and among Roller Bearing Company of America, Inc., certain of its domestic subsidiaries, General Electric Capital Corporation, as agent and Lender. | ||
10.30 |
II-4
Lease Agreement dated May 17, 2004 by and between Shadowmoss Properties, LLC, a South Carolina limited liability company and Roller Bearing Company of America, | ||
10.31 | Credit Agreement, dated December 8, 2003, between Credit Suisse and Schaublin | |
10.32 | Amendment No. 1 to Credit Agreement, dated November 8, 2004, between Credit Suisse and Schaublin | |
10.33 | Letter Agreement by and among RBC Bearings Incorporated, Roller Bearing Company of America, Inc. Whitney & Co. and Dr. Michael J. Hartnett dated June 17, 2005. | |
10.34 | Second Amended and Restated Stockholders' Agreement by and among RBC Bearings Incorporated, Whitney RBHC Investors, LLC, Whitney V.L.P., Dr. Michael J. Hartnett and Hartnett Family Investments, L.P. dated February 6, 2003 filed as Exhibit 10.37 to Amendment No. 4 to the Registration Statement dated August 9, 2005 is hereby incorporated by reference herein. | |
II-5
10.35 | Amendment No. 1 dated August 13, 2005 to the Second Amended and Restated Stockholders' Agreement by and among RBC Bearings Incorporated, Whitney RBHC Investors, LLC, Whitney V.L.P., Dr. Michael J. Hartnett and Hartnett Family Investments, L.P. dated February 6, 2003, filed as Exhibit 10.38 to Amendment No. 4 to the Registration Statement dated August 9, 2005 is hereby incorporated by reference herein. | |
10.36 | Purchase Agreement dated August 9, 2005 filed as Exhibit 1.1 on Form 8-K dated August 15, 2005 is hereby incorporated by reference herein. | |
14.1 | Code of Ethics of the | |
21.2 | Subsidiaries of the Registrant. | |
23.1 | Consent of Ernst & Young LLP.** | |
23.2 | Consent of Kirkland & Ellis LLP (included in Exhibit 5.1).* | |
23.3 | Consent of Valuation Research Corporation. | |
23.4 | Consent of The Freedonia Group, Incorporated. | |
24.1 | Powers of Attorney. |
(b)
Schedule II-ValuationII—Valuation and Qualifying Accounts
The schedule entitled "Schedule II—Valuation and Qualifying Accounts" set forth on page F-39F-60 of the Company's Consolidated Financial Statements is hereby incorporated by reference herein.
II-6
II-5II-7
Pursuant to the requirements of the Securities Act, as amended, the registrant has duly caused this Amendment No. 21 to the Registration Statement to be signed on its behalf by the undersigned, thereunto duly authorized, in Oxford, Connecticut on July 26, 2005.March 29, 2006.
| RBC BEARINGS INCORPORATED | ||||
By: | /s/ DANIEL A. BERGERON | |||
Name: | Daniel A. Bergeron | |||
| Title: | Chief Financial Officer | |||
Pursuant to the requirements of the Securities Act, this Amendment No. 21 to the Registration Statement has been signed by the following persons in the capacities indicated on July 26, 2005.March 29, 2006.
| Signature | Title | |
|---|---|---|
* Dr. Michael J. Hartnett | Chief Executive Officer (Principal Executive Officer and Chairman) | |
/s/ DANIEL A. BERGERON Daniel A. Bergeron | Chief Financial Officer (Principal Financial and Accounting Officer) | |
* Robert Anderson | Director | |
* Richard R. Crowell | Director | |
* William P. Killian | Director | |
* Michael Stone | Director | |
* Dr. Alan B. Levine | Director | |
II-8
* Dr. Amir Faghri | Director | |
* Dr. Thomas J. O'Brien | Director |
*By: | /s/ DANIEL A. BERGERON Daniel A. Bergeron as attorney-in-fact |
II-6II-9
1.1 | Form of Purchase Agreement.* | |
3.1 | ||
3.3 | Bylaws of RBC Bearings | |
4.3 | Form of stock certificate for common | |
5.1 | Form of Opinion of Kirkland & Ellis LLP. | |
10.1 | Fifth Amended and Restated Credit Agreement, dated as of | |
10.2 | Stock Option Plan of RBC Bearings Incorporated (f/k/a Roller Bearing Holding Company, Inc.), dated as of February 18, 1998 with form of | |
10.3 | Form of Stock Transfer Restriction Agreement between RBC Bearings Incorporated (f/k/a Roller Bearing Holding Company, Inc.) and certain of its | |
10.4 | Amended and Restated 2001 Stock Option Plan of RBC Bearings Incorporated (f/k/a Roller Bearing Holding Company, Inc.), dated October 24, | |
10.5 | Form of 2005 Long Term Equity Incentive | |
10.6 | Agreement of Lease between Robear West Trenton Associates, L.P. and Roller Bearing Company of America, Inc., dated February 10, 1999, for West Trenton, New Jersey | |
10.7 | First Amendment to Office Lease, dated July 26, 2004, between Robear West Trenton Associates, L.P. and Roller Bearing Company of America, Inc. | |
10.8 | Indenture of Lease dated March 31, 2004 between Roller Bearing Company of America, Inc., and Raymond Hunicke, LLC, a Connecticut limited liability | |
10.9 | Executed counterpart of the Pledge and Security Agreement, dated as of September 1, 1994, between Roller Bearing Company of America, Inc., Heller Financial, Inc. and Mark Twain | |
10.10 | Loan Agreement, dated as of September 1, 1994, between the South Carolina Job—Economic Development Authority and Roller Bearing Company of America, Inc. with respect to the Series 1994A | |
10.11 | ||
Trust Indenture, dated as of September 1, 1994, between the South Carolina Job—Economic Development Authority and Mark Twain Bank, as Trustee, with respect to the Series 1994A | ||
10.12 | Loan Agreement, dated as of September 1, 1994, between the South Carolina Job—Economic Development Authority and Roller Bearing Company of America, Inc., with respect to the Series 1994B | |
10.13 | Trust Indenture, dated as of September 1, 1994, between the South Carolina Job—Economic Development Authority and Mark Twain Bank, as Trustee, with respect to the Series 1994B | |
10.14 | Collective Bargaining Agreement between Heim, the International Union, United Automobile, Aerospace and Agricultural Implement Workers of America, U.A.W., and Amalgamated Local 376, U.A.W., expires January 31, | |
10.15 | ||
Collective Bargaining Agreement between Roller Bearing Company of America, Inc. and the International Union U.A.W. and its Local 502, expires June 30, | ||
10.16 | Collective Bargaining Agreement between Tyson Bearing Company, Inc. and the United Steelworkers of America, AFL-CIO, Local 7461-01, expires June 13, | |
10.17 | Employment Agreement, | |
10.18 | Amended and Restated Promissory Note, dated as of December 15, 2000, for $500,000, made by Michael J. Hartnett, Ph.D. and payable to Roller Bearing Company of America, | |
10.19 | Loan Agreement, dated as of April 1, 1999, by and between California Infrastructure and Economic Development Bank and Roller Bearing Company of America, | |
10.20 | Indenture Of Trust, dated as of April 1, 1999, between California Infrastructure and Economic Development Bank and U.S. Bank Trust National Association, as | |
10.21 | Tax Regulatory Agreement, dated as of April 1, 1999, by and among California Infrastructure and Economic Development Bank, U.S. Bank Trust National Association, as Trustee, and Roller Bearing Company of America, | |
10.22 | Lease Agreement, dated as of December 17, 1999, between Schaublin SA and RBC Schaublin | |
10.23 | Lease by and among ABCS Properties, LLC, Michael H. Short and Lynn C. Short and Bremen Bearings, Inc. dated August 31, | |
10.24 | Guarantee dated | |
10.25 | Security Agreement, dated May 30, 2002, by and among Roller Bearing Company of America, Inc., certain of its domestic subsidiaries, General Electric Capital Corporation, as agent and Lender. | |
10.26 | Pledge Agreement, dated May 30, 2002, by and among Roller Bearing Company of America, Inc., certain of its domestic subsidiaries, General Electric Capital Corporation, as agent and Lender. | |
10.27 | Pledge Agreement, dated | |
10.28 | Master Reaffirmation, dated | |
10.29 | ||
Master Reaffirmation and Amendment to Loan Documents, dated June 29, 2004, by and among Roller Bearing Company of America, Inc., certain of its domestic subsidiaries, General Electric Capital Corporation, as agent and Lender. | ||
10.30 | Lease Agreement dated May 17, 2004 by and between Shadowmoss Properties, LLC, a South Carolina limited liability company and Roller Bearing Company of America, | |
10.31 | Credit Agreement, dated December 8, 2003, between Credit Suisse and Schaublin | |
10.32 | Amendment No. 1 to Credit Agreement, dated November 8, 2004, between Credit Suisse and Schaublin | |
10.33 | Letter Agreement by and among RBC Bearings Incorporated, Roller Bearing Company of America, Inc. Whitney & Co. and Dr. Michael J. Hartnett dated June 17, 2005. | |
10.34 | Second Amended and Restated Stockholders' Agreement by and among RBC Bearings Incorporated, Whitney RBHC Investors, LLC, Whitney V.L.P., Dr. Michael J. Hartnett and Hartnett Family Investments, L.P. dated February 6, 2003 filed as Exhibit 10.37 to Amendment No. 4 to the | |
10.35 | Amendment No. 1 dated August 13, 2005 to the Second Amended and Restated Stockholders' Agreement by and among RBC Bearings Incorporated, Whitney RBHC Investors, LLC, Whitney V.L.P., Dr. Michael J. Hartnett and Hartnett Family Investments, L.P. dated February 6, 2003, filed as Exhibit 10.38 to Amendment No. 4 to the Registration Statement dated August 9, 2005 is hereby incorporated by reference herein. | |
10.36 | Purchase Agreement dated August 9, 2005 filed as Exhibit 1.1 on Form 8-K dated August 15, 2005 is hereby incorporated by reference herein. | |
14.1 | Code of Ethics of the Registrant filed as Exhibit 14 to Form 10-Q dated February 14, 2006 is hereby incorporated by reference herein. | |
21.2 | Subsidiaries of the Registrant. | |
23.1 | Consent of Ernst & Young LLP.** | |
23.2 | Consent of Kirkland & Ellis LLP (included in Exhibit 5.1).* | |
23.3 | Consent of Valuation Research Corporation. | |
23.4 | Consent of The Freedonia Group, Incorporated. | |
24.1 | Powers of Attorney. |