
As filed with the Securities and Exchange Commission on May 1,31, 2006
Registration No. 333-132703
UNITED STATES
SECURITIES AND EXCHANGE COMMISSION
Washington, D.C. 20549
Amendment No. 13 to
FORM S-1
REGISTRATION STATEMENT
UNDER
THE SECURITIES ACT OF 1933
HOUSTON WIRE & CABLE COMPANY
(Exact name of registrant as specified in its charter)
| Delaware (State or other jurisdiction of incorporation or organization) | 5063 (Primary Standard Industrial Classification Code Number) | 36-4151663 (I.R.S. Employer Identification No.) |
10201 North Loop East
Houston, TX 77029
(713) 609-2100
(Address, including zip code, and telephone number,
including area code, of registrant's principal executive offices)
Charles A. Sorrentino President and Chief Executive Officer Houston Wire & Cable Company 10201 North Loop East Houston, TX 77029 (713) 609-2100 (Address, including zip code, and telephone number, including area code, of registrant's principal executive offices) |
Copies to: | ||
| Robert J. Minkus Richard T. Miller Schiff Hardin LLP 6600 Sears Tower Chicago, Illinois 60606 | Larry A. Barden Robert L. Verigan Sidley Austin LLP 1 S. Dearborn Street Chicago, Illinois 60603 | |
Approximate date of commencement of proposed sale to the public: As soon as practicable after this Registration Statement becomes effective.
If any of the securities being registered on this Form are to be offered on a delayed or continuous basis pursuant to Rule 415 under the Securities Act of 1933, check the following box. o
If this Form is filed to register additional securities for an offering pursuant to Rule 462(b) under the Securities Act, check the following box and list the Securities Act registration statement number of the earlier effective registration statement for the same offering. o
If this Form is a post-effective amendment filed pursuant to Rule 462(c) under the Securities Act, check the following box and list the Securities Act registration statement number of the earlier effective registration statement for the same offering. o
If this Form is a post-effective amendment filed pursuant to Rule 462(d) under the Securities Act, check the following box and list the Securities Act registration statement number of the earlier effective registration statement for the same offering. o
CALCULATION OF REGISTRATION FEE
| Title of Each Class of Securities to be Registered | Proposed Maximum Aggregate Offering Price(1) | Amount of Registration Fee(2) | Proposed Maximum Aggregate Offering Price(1) | Amount of Registration Fee(2) | ||||
|---|---|---|---|---|---|---|---|---|
| Common Stock, par value $.001 per share | $112,700,000 | $12,059(3) | $136,850,000 | $14,643(3) |
The registrant hereby amends this registration statement on such date or dates as may be necessary to delay its effective date until the registrant shall file a further amendment which specifically states that this registration statement shall thereafter become effective in accordance with Section 8(a) of the Securities Act of 1933 or until the registration statement shall become effective on such date as the Commission, acting pursuant to said Section 8(a), shall determine.
The information in this preliminary prospectus is not complete and may be changed. We may not sell these securities until the registration statement filed with the Securities and Exchange Commission is effective. This preliminary prospectus is not an offer to sell, and we are not soliciting an offer to buy, these securities in any state where the offer or sale is not permitted.
SUBJECT TO COMPLETION, DATED ,MAY 31, 2006
Prospectus
Common Stock
This is the initial public offering of common stock of Houston Wire & Cable Company. We are selling 4,250,000 shares of common stock, and the selling stockholders identified in this prospectus are selling an additional 4,250,000 shares. We will not receive any of the proceeds from the sale of the shares by the selling stockholders. The estimated initial public offering price is between $$12.00 and $$14.00 per share.
Prior to this offering, there has been no public market for our common stock. We intend to have our common stock listed for quotation on The Nasdaq National Market under the symbol "HWCC."
Investing in our common stock involves a high degree of risk. See "Risk Factors" beginning on page 9 of this prospectus.
Neither the Securities and Exchange Commission nor any state securities commission has approved or disapproved of these securities or passed upon the adequacy or accuracy of this prospectus. Any representation to the contrary is a criminal offense.
| | Per Share | Total | ||||
|---|---|---|---|---|---|---|
| Public offering price | $ | $ | ||||
| Underwriting discount | $ | $ | ||||
| Offering proceeds to us, before expenses | $ | $ | ||||
| Offering proceeds to selling stockholders, before expenses | $ | $ | ||||
Certain of the selling stockholders have granted the underwriters an option for a period of 30 days to purchase up to 1,275,000 additional shares of our common stock on the same terms and conditions set forth above to cover over-allotments, if any.
The underwriters expect to deliver the shares of common stock to purchasers on or about , 2006.
William Blair & Company | Robert W. Baird & Co. | |
BB&T Capital Markets | ||
The date of this prospectus is , 2006.

| | Page | |
|---|---|---|
| Prospectus Summary | 1 | |
| Risk Factors | 9 | |
| Forward-Looking Statements | 15 | |
| Use of Proceeds | 16 | |
| Dividend Policy | 16 | |
| Capitalization | 17 | |
| Dilution | 18 | |
| Selected Consolidated Financial Data | 19 | |
| Management's Discussion and Analysis of Financial Condition and Results of Operations | 21 | |
| Business | ||
| Management | ||
| Principal and Selling Stockholders | ||
| Relationships and Transactions with Related Parties | ||
| Description of Capital Stock, Certificate of Incorporation and By-laws | ||
| Shares Eligible for Future Sale | ||
| Underwriting | ||
| Legal Matters | ||
| Experts | ||
| Where You Can Find More Information | ||
| Index to Consolidated Financial Statements | F-1 |
You should rely only on the information contained in this prospectus. We have not authorized anyone to provide you with information different from that contained in this prospectus. Offers to sell, and solicitations of offers to buy, shares of our common stock are being made only in jurisdictions where offers and sales are permitted. The information contained in this prospectus is accurate only as of the date of this prospectus, regardless of the time of delivery of this prospectus or of any sale of our common stock.
This summary highlights selected information contained elsewhere in this prospectus. Because this is only a summary, it does not contain all the information that you should consider before investing in our common stock. You should read the entire prospectus carefully, especially "Risk Factors" beginning on page 9 and our consolidated financial statements and related notes, before making an investment decision.
Our Business
We are one of the largest distributors of specialty wire and cable and related services to the U.S. electrical distribution market. During 2005, we served approximately 2,600 customers, including eachvirtually all of the top 200 electrical distributors in the U.S. We have strong relationships with leading wire and cable manufacturers and provide them with efficient access to the fragmented electrical distribution market. During 2005, we distributed approximately 20,000 SKUs (stock-keeping units) to over 8,300 customer locations nationwide from eleven strategically located distribution centers in ten states. We are focused on providing our electrical distributor customers with a single-source solution for specialty wire and cable and related services by offering a large selection of in-stock items, exceptional customer service and high levels of product expertise.
We offer products in most categories of specialty wire and cable, including:
We also offer private branded products, including our LifeGuard™ low-smoke, zero-halogen cable. Low-smoke, zero halogen products are made with compounds that produce no halogen gases and very little smoke while under combustion.
In addition to our product offerings, we provide comprehensive value-added services including: standard same day shipment from our extensive inventory and distribution network; application engineering support through our knowledgeable sales and technical support staff; custom cutting of wire and cable to exact specifications; inventory management programs that provide job-specific asset management and just-in-time delivery; job-site delivery and logistics support; 24/7/365 customer service provided by our own employees; and customized internet-based ordering capabilities.
We were founded in 1975 and have a long history of reliable customer service, broad product selection and strong product expertise. In 1987, we completed an initial public offering and were subsequently purchased in 1989 by ALLTEL Corporation. In 1997, we were purchased by an investment fund affiliated with Code Hennessy & Simmons LLC. During our 31 year history, we have successfully expanded our business from one original location in Houston, Texas to eleven strategic locations nationwide.
In 2000, we acquired our largest direct competitor, the Futronix division of Kent Electronics Corporation. In 2003, we implemented a new sales and marketing strategy to expand our sales force, introduce new private branded products and work in concert with our distributor customers to generate demand from end-users in our targeted markets, including the utility, industrial and infrastructure markets. As part of this initiative, we are partnering with our distributor customers and strengthening our relationships with project and specifying engineers to stimulate demand for our specialty wire and cable. With this sales and marketing strategy, we have achieved strong financial and operating growth. Our revenue has increased from $149.1 million in 2003 to $214.0 million in 2005, a compound annual growth rate (CAGR) of 19.8%. During the same period, our operating income increased from $4.7 million to $22.1$22.8 million, a CAGR of 116.9%120.2%.
Industry Overview
We operate within the U.S. electrical distribution market, whichElectrical Wholesaling magazine estimates had industry-wide sales of $74.3 billion in 2005 and will grow 7.9% to $80.2 billion in 2006. Electrical distribution has historically been a growing segment of the industrial distribution industry, with a CAGR of 5.1% over the last 20 years.
Within the electrical distribution industry, our business focuses on specialty wire and cable. According to the U.S. Census Bureau, the total value of manufacturers' shipments of specialty wire and cable totaled approximately $7.0 billion in 2004. The sales channel for specialty wire and cable depends on a number of factors, including order type, product selection, service level expectations, inventory management and delivery requirements. The greater the need for customization and high service levels, the more likely the transaction will involve a specialty wire and cable distributor such as us.
In certain circumstances, manufacturers of specialty wire and cable sell their products directly to the end-user. These transactions typically consist of a bulk volume of wire and cable, involve little or no customized services and may require long lead times between order and delivery. More frequently, an electrical distributor serves as the sales channel directly between the manufacturer and the contractor or end-user. The typical sale by an electrical distributor may involve a commonly purchased item that is specifically designated by the end-user and shipped from stock along with a variety of other electrical products. For customers requiring highly specialized wire and cable, custom cut lengths, technical expertise, short lead times or additional services, electrical distributors will generally source products from a specialty wire and cable distributor. We believe that the increasing complexity of specialty wire and cable specifications and the growing need for just-in-time delivery and logistics support will spur further growth in purchases through specialty wire and cable distributors.
Our business is driven, in part, by the strength, growth prospects and activity in the end-markets in which our products are used. We have targeted three of these markets—the utility, industrial and infrastructure markets—in our recent sales and marketing initiatives.
Utility Market. The utility market includes large investor-owned utilities, rural cooperatives and municipal power authorities. We are positioned to benefit from expenditures for new power generation needed to satisfy a growing population with increasing energy demands and to comply with federal mandates to reduce toxic outputs from power generating facilities.
Industrial Market. The industrial market is one of the largest segments of the U.S. economy, comprised of a diverse base of manufacturing and production companies. We help our electrical distributor customers provide specialty wire and cable to industrial companies with large, complex plant maintenance, repair and operations ("MRO") requirements and for new capital projects.
Infrastructure Market. We believe that significant infrastructure improvements and additions will be needed over the next several years. According to a September 2004 Industrial Information Resources report, engineering and construction firms were awarded more than 1,350 active capital projects in the U.S. with a total investment value representing approximately $221 billion. We are assisting our customers to further
penetrate the engineering and construction market by working with application engineers to drive specialty wire and cable specifications in large construction projects.
Beginning in 2003, we led the development and marketing of select private label products, including LifeGuard™, a low-smoke, zero-halogen cable product line. We sell our LifeGuard™ product across all of our end-markets.
LifeGuard™ Market Opportunity. We believe that the market for low-smoke, zero-halogen products is in its infancy in the U.S. and represents a significant market opportunity. Low-smoke, zero-halogen cables, which have been used extensively in Europe and Asia for many years, provide significant flame resistance, minimal smoke production and substantially reduced toxicity and corrosiveness when burned, as compared to traditional wire and cable. Our LifeGuard™ cable is designed for applications where a high degree of equipment protection and safety and environmental protection is required. Since its introduction in 2003, our LifeGuard™ line of cable has shown strong early signs of acceptance.
Competitive Strengths
We are a nationally recognized, full-service distributor of specialty wire and cable and related services. Through eleven strategic locations across the United States with over 450,000 square feet of warehouse space, we provide same day shipment to a broad customer base including, among others, Border States Electric Supply, Consolidated Electrical Distributors, Inc., GE Supply Company, Graybar Electric Company, Inc., Hughes Supply, Inc., Mayer Electric Supply Company, Inc., Rexel, Inc., The Reynolds Company, Sonepar USA and WESCO Distribution, Inc. We operate in a highly fragmented market, and we believe that the following competitive strengths have helped us achieve our leading position in the market and a strong reputation among manufacturers and customers:
period from 22.8% to 26.0%. In addition, by leveraging our national infrastructure and implementing back-office initiatives, we have decreased our operating expenses as a percentage of revenue from 18.0% in 2001 to 15.4% in 2005.2005 and 13.6% for the quarter ended March 31, 2006.
Risk Factors
An investment in our common stock involves risks. For a discussion of factors you should consider before deciding to invest in our common stock, we refer you to "Risk Factors" and the following summary:
Growth Strategies
Since implementing our new sales and marketing strategy in 2003, our revenue has increased from $149.1 million in 2003 to $214.0 million in 2005, and our operating income has increased from $4.7 million to $22.8 million. We intend to continue to leverage our competitive strengths and pursue select strategic initiatives to drive growth in revenue and profit.
demand from their customers. In select target markets, we are assisting our customers in forming relationships with project and specifying engineers to create demand for our specialty wire and cable.
Our Corporate Information
We were incorporated in Delaware in 1997 under the name "HWC Holding Corporation" to acquire our operating subsidiary, then named Houston Wire & Cable Company, which was founded in 1975 and incorporated in Delaware in 1985. In 2006, we changed the name of our operating subsidiary and adopted the Houston Wire & Cable Company name for ourselves. Our corporate and executive offices are located at 10201 North Loop East, Houston, Texas 77029, and our telephone number at that address is (713) 609-2100. We maintain a website at www.houwire.com. The information contained in our website is not a part of, and is not incorporated by reference into, this prospectus.
| Common stock offered by us | 4,250,000 shares | |
Common stock offered by the selling stockholders | 4,250,000 shares | |
Common stock to be outstanding after this offering | 20,867,172 shares | |
Use of proceeds | We intend to use the net proceeds from this offering to repay a portion of our outstanding debt. We will not receive any of the proceeds from the sale of common stock by the selling stockholders. See "Use of Proceeds." | |
Proposed Nasdaq National Market symbol | "HWCC" |
The number of shares of common stock to be outstanding after this offering is based on 8,862,49216,617,172 shares outstanding as of April 28,May 15, 2006 and excludes:
Unless otherwise indicated, all information contained in this prospectus:
Summary Consolidated Financial and Other Data
The following table presents a summary of our historical financial information. When you read this summary consolidated financial data, it is important that you read along with it the historical financial statements and related notes, as well as the sections titled "Selected Consolidated Financial Data" and "Management's Discussion and Analysis of Financial Condition and Results of Operations," included elsewhere in this prospectus.
| | | Year Ended December 31, | | Year Ended December 31, | Three Months Ended March 31, | ||||||||||||||||||||||
|---|---|---|---|---|---|---|---|---|---|---|---|---|---|---|---|---|---|---|---|---|---|---|---|---|---|---|---|
| | | 2003 | 2004 | 2005 | | 2003 | 2004 | 2005 | 2005 | 2006 | |||||||||||||||||
| | | (Dollars in thousands, except per share data) | | (Dollars in thousands, except per share data) | |||||||||||||||||||||||
| CONSOLIDATED STATEMENT OF INCOME DATA: | CONSOLIDATED STATEMENT OF INCOME DATA: | CONSOLIDATED STATEMENT OF INCOME DATA: | |||||||||||||||||||||||||
| Sales | Sales | $ | 149,084 | $ | 172,723 | $ | 213,957 | Sales | $ | 149,084 | $ | 172,723 | $ | 213,957 | $ | 43,106 | $ | 66,428 | |||||||||
| Cost of sales | Cost of sales | 113,959 | 131,419 | 158,240 | Cost of sales | 113,959 | 131,419 | 158,240 | 31,949 | 48,437 | |||||||||||||||||
| Gross profit | Gross profit | 35,125 | 41,304 | 55,717 | Gross profit | 35,125 | 41,304 | 55,717 | 11,157 | 17,991 | |||||||||||||||||
| Operating expenses: | Operating expenses: | Operating expenses: | |||||||||||||||||||||||||
| Salaries and commissions | 14,588 | 16,665 | 18,707 | Salaries and commissions | 14,588 | 16,665 | 18,707 | 4,289 | 5,072 | ||||||||||||||||||
| Other operating expenses | 13,857 | 12,392 | 14,016 | Other operating expenses | 13,857 | 12,392 | 14,016 | 3,408 | 3,748 | ||||||||||||||||||
| Management fee(1) | 502 | 501 | 500 | Management fee(1) | 502 | 501 | 500 | 125 | 125 | ||||||||||||||||||
| Litigation settlement | — | (650 | ) | (672 | ) | Litigation settlement | — | (650 | ) | (672 | ) | (672 | ) | — | |||||||||||||
| Depreciation and amortization | 1,481 | 876 | 398 | Depreciation and amortization | 1,481 | 876 | 398 | 110 | 93 | ||||||||||||||||||
| Total operating expenses | Total operating expenses | 30,428 | 29,784 | 32,949 | Total operating expenses | 30,428 | 29,784 | 32,949 | 7,260 | 9,038 | |||||||||||||||||
| Operating income | Operating income | 4,697 | 11,520 | 22,768 | Operating income | 4,697 | 11,520 | 22,768 | 3,897 | 8,953 | |||||||||||||||||
| Interest expense | Interest expense | 4,186 | 3,544 | 2,955 | Interest expense | 4,186 | 3,544 | 2,955 | 713 | 1,054 | |||||||||||||||||
| Income before income taxes | Income before income taxes | 511 | 7,976 | 19,813 | Income before income taxes | 511 | 7,976 | 19,813 | 3,184 | 7,899 | |||||||||||||||||
| Income tax provision | Income tax provision | 295 | 3,167 | 7,299 | Income tax provision | 295 | 3,167 | 7,299 | 1,173 | 3,097 | |||||||||||||||||
| Net income | Net income | $ | 216 | $ | 4,809 | $ | 12,514 | Net income | $ | 216 | $ | 4,809 | $ | 12,514 | $ | 2,011 | $ | 4,802 | |||||||||
Net income per share: | Net income per share: | Net income per share: | |||||||||||||||||||||||||
| Basic | $ | 0.02 | $ | 0.55 | $ | 1.41 | Basic | $ | 0.01 | $ | 0.29 | $ | 0.75 | $ | 0.12 | $ | 0.29 | ||||||||||
| Diluted | $ | 0.02 | $ | 0.55 | $ | 1.40 | Diluted | $ | 0.01 | $ | 0.29 | $ | 0.75 | $ | 0.12 | $ | 0.29 | ||||||||||
| Weighted average shares outstanding: | Weighted average shares outstanding: | Weighted average shares outstanding: | |||||||||||||||||||||||||
| Basic | 8,711,509 | 8,720,248 | 8,856,892 | Basic | 16,334,079 | 16,350,465 | 16,606,673 | 16,606,673 | 16,613,702 | ||||||||||||||||||
| Diluted | 8,802,248 | 8,810,987 | 8,937,228 | Diluted | 16,504,215 | 16,520,601 | 16,757,303 | 16,697,153 | 16,710,098 | ||||||||||||||||||
PRO FORMA STATEMENT OF INCOME DATA(2): | PRO FORMA STATEMENT OF INCOME DATA(2): | PRO FORMA STATEMENT OF INCOME DATA(2): | |||||||||||||||||||||||||
| Pro forma operating income | Pro forma operating income | $ | Pro forma operating income | $ | 23,268 | $ | 4,022 | $ | 9,078 | ||||||||||||||||||
| Pro forma net income | Pro forma net income | $ | Pro forma net income | $ | 14,416 | $ | 2,478 | $ | 5,384 | ||||||||||||||||||
| Pro forma net income per share: | Pro forma net income per share: | Pro forma net income per share: | |||||||||||||||||||||||||
| Basic | $ | Basic | $ | 0.69 | $ | 0.12 | $ | 0.26 | |||||||||||||||||||
| Diluted | $ | Diluted | $ | 0.69 | $ | 0.12 | $ | 0.26 | |||||||||||||||||||
| Pro forma weighted average shares outstanding: | Pro forma weighted average shares outstanding: | Pro forma weighted average shares outstanding: | |||||||||||||||||||||||||
| Basic | Basic | 20,856,673 | 20,856,673 | 20,863,702 | |||||||||||||||||||||||
| Diluted | Diluted | 21,007,303 | 20,947,153 | 20,960,098 | |||||||||||||||||||||||
ADDITIONAL DATA: | ADDITIONAL DATA: | ADDITIONAL DATA: | |||||||||||||||||||||||||
| Capital expenditures | Capital expenditures | $ | 290 | $ | 208 | $ | 329 | Capital expenditures | $ | 290 | $ | 208 | $ | 329 | $ | 86 | $ | 104 | |||||||||
| Average number of employees | Average number of employees | 266 | 267 | 274 | Average number of employees | 266 | 267 | 274 | 278 | 271 | |||||||||||||||||
As of March 31, 2006 | ||||||
|---|---|---|---|---|---|---|
| | Actual | As adjusted(3) | ||||
| | (Dollars in thousands) | |||||
| CONSOLIDATED BALANCE SHEET DATA: | ||||||
| Cash and cash equivalents | $ | — | $ | — | ||
| Accounts receivable, net | $ | 39,914 | $ | 39,914 | ||
| Inventories, net | $ | 40,065 | $ | 40,065 | ||
| Total assets | $ | 88,657 | $ | 88,657 | ||
| Book overdraft(4) | $ | 2,093 | $ | 2,093 | ||
| Total debt(5) | $ | 57,726 | $ | 7,843 | ||
| Stockholders' equity(5) | $ | 5,597 | $ | 55,480 | ||
Investing in our common stock involves a high degree of risk. You should carefully consider the following factors, as well as other information contained in this prospectus, before deciding to invest in shares of our common stock. The trading price of our common stock could decline due to any of these risks, and you may lose all or part of your investment in our common stock.
Risks Relating to Our Business and Industry
Downturns in capital spending and cyclicality in certain of the markets we serve could have a material adverse effect on our financial condition and results of operations.
The majority of our products are used in the construction, maintenance and operation of facilities, plants and projects in the communications, energy, engineering and construction, general manufacturing, infrastructure, petrochemical, transportation, utility and wastewater treatment industries. The demand for our products and services depends to a large degree on the capital spending levels of end-users in these markets. Many of these end-users defer capital expenditures or cancel projects during economic downturns. In addition, certain of the markets we serve are cyclical, which affects capital spending by end-users in these industries. A downturn in the general economy, or in one or more of the end-markets for our specialty wire and cable, could have a material adverse effect on our financial condition and results of operations.
We have risks associated with inventory.
Our business requires us to maintain substantial levels of inventory. We must identify the right mix and quantity of products to keep in our inventory to meet customer orders. Failure to do so could adversely affect our sales and earnings. However, if our inventory levels are too high, we are at risk that an unexpected change in circumstances, such as a shift in market demand, drop in prices, or default or loss of a customer, could have a material adverse impact on the net realizable value of our inventory.
Our operating results may be affected by fluctuations in commodity prices.
Copper and petrochemical products are components of the wire and cable we sell. Fluctuations in the costs of these and other commodities have historically affected our operating results. To the extent higher commodity prices result in increases in the costs we pay for our products, we attempt to reflect the increase in the prices we charge our customers. While we historically have been able to pass most of these cost increases on to our customers, to the extent we are unable to do so in the future, it could have a material adverse effect on our operating results. In addition, as commodity costs increase, our customers may delay or decrease their purchases of our wire and cable, which could adversely affect the demand for our products. To the extent commodity prices decline, the net realizable value of our existing inventory could be reduced, and our gross profits could be adversely affected.
If we are unable to maintain our relationships with our electrical distributor customers, it could have a material adverse effect on our financial results.
We rely primarily on electrical distributors to purchase our wire and cable. The number, size, business strategy and operations of these electrical distributors vary widely from market to market. The success of our sales and distribution channels depends heavily on our successful cooperation with these electrical distributors in each of our various markets.
In 2005, our ten largest customers accounted for approximately 44% of our sales, and our largest customer accounted for approximately 11% of our sales. If we were to lose one or more of our large electrical distributor customers, or if one or more of our large electrical distributor customers were to significantly reduce the amount of specialty wire and cable they purchase from us, and we were unable to replace the lost sales on similar terms, we could experience a significant loss of revenue and profits. In
addition, if one or more of our key electrical distributor customers failed or were unable to pay, we could experience a write-off or write-down of the related receivables, which could adversely affect our earnings. We participate in a number of national marketing groups and engage in joint promotional sales activities with the electrical distributor members of those groups. Any permanent exclusion of us from, or refusal to allow us to participate in, such national marketing groups could have a material adverse effect on our sales and our results of operations.
An inability to obtain the products that we distribute could result in lost revenues and reduced profits and damage our relationships with customers.
We currently source products from approximatelymore than 150 suppliers. However, we have adopted a strategy to concentrate our purchases with a small number of suppliers in order to maximize product quality, delivery dependability, purchasing efficiencies and supplier incentives. As a result, in 2005 over 55% of our annual purchases came from three suppliers. If any of these suppliers changed its sales strategy to reduce its reliance on distributors, or decided to terminate its business relationship with us, our sales and earnings would be adversely affected unless and until we were able to establish relationships with suppliers of comparable products. In addition, if we are not able to obtain the products we distribute from either our current suppliers or other competitive sources, we could experience a loss of revenues, reduction in margins and damage to our relationships with our customers. Supply shortages may occur as a result of unanticipated demand or production cutbacks, shortages of raw materials, labor disputes or weather conditions affecting products or shipments, transportation disruptions or other reasons beyond our control. When shortages occur, specialty wire and cable suppliers often allocate products among distributors, and our allocations might not be adequate to meet our customers' needs.
Loss of key personnel or our inability to attract and retain new qualified personnel could hurt our ability to operate and grow successfully.
Our success is highly dependent upon the services of Charles Sorrentino, our President and Chief Executive Officer, Nicol Graham, our Chief Financial Officer, and James Pokluda, our Vice President of Marketing and Merchandising. Our success will continue to depend to a significant extent on our executive officers and key management and sales personnel. We do not have key man life insurance covering any of our executive officers. We may not be able to retain our executive officers and key personnel or attract additional qualified management and sales personnel. The loss of any of our executive officers or our other key management and sales personnel or our inability to recruit and retain qualified personnel could hurt our ability to operate and make it difficult to execute our growth strategies.
A change in vendor rebate programs could adversely affect our gross margins and results of operations.
The terms on which we purchase products from many of our suppliers entitle us to receive a rebate based on the volume of our purchases. These rebates effectively reduce our costs for products. If market conditions change, suppliers may adversely change the terms of some or all of these programs. These changes may lower our gross margins on products we sell and may have an adverse effect on our operating income.
We have had limited experience with our private branded products and cannot guarantee that our private branded products will continue to gain market acceptance.
An important element of our growth strategy is the continued development and market acceptance of our LifeGuard™ line of low-smoke, zero-halogen cable and other products sold under our private brands. Our success with our private branded products, however, depends on our ability to market these products in the appropriate channels and, ultimately, on the acceptance of these products in the markets we serve. We have only been selling LifeGuard™ cable since 2003, and our efforts to develop and market new private branded products might not be successful. Further demand for our products could diminish as a result of a competitor's introduction of higher quality, better performing or lower cost products in the marketplace. In
addition, the low-smoke, zero-halogen properties of our LifeGuard™ line of cable products depend on a highly-engineered petrochemical material. If there is not an adequate supply of this material, we may be unable to have our LifeGuard™ products manufactured, or our LifeGuard™ products may be available only at a higher cost or after a long delay. If we cannot sustain the growth in demand for our LifeGuard™ products, if we cannot have those products manufactured on acceptable terms or if we do not develop additional private branded products, we will be unable to realize fully our growth strategy.
If we encounter difficulties with our management information systems, we would experience problems managing our business.
We believe our management information systems are a competitive advantage in maintaining our leadership position in the specialty wire and cable distribution industry. We rely upon our management information systems to manage and replenish inventory, fill and ship orders on a timely basis and coordinate our sales and marketing activities. If we experience problems with our management information systems, we could experience product shortages, diminished inventory control or an increase in accounts receivable. Any failure by us to maintain our management information systems could adversely impact our ability to attract and serve customers and would cause us to incur higher operating costs and experience reduced profitability.
An increase in competition could decrease sales or earnings.
We operate in a highly competitive industry. We compete directly with national, regional and local providers of specialty wire and cable. Competition is primarily focused in the local service area and is generally based on product line breadth, product availability, service capabilities and price. Some of our existing competitors have, and new market entrants may have, greater financial and marketing resources than we do. To the extent existing or future competitors seek to gain or retain market share by reducing prices, we may be required to lower our prices, thereby adversely affecting our financial results. Existing or future competitors also may seek to compete with us for acquisitions, which could have the effect of increasing the price and reducing the number of suitable acquisitions. Other companies, including our current electrical distributor customers, could seek to compete directly with our private branded products, which could adversely affect our sales of those products and ultimately our financial results. Our existing electrical distributor customers, as well as suppliers, could seek to compete with us by offering services similar to ours, which could adversely affect our market share and our financial results. In addition, competitive pressures resulting from the industry trend toward consolidation could adversely affect our growth and profit margins.
We may be subject to product liability claims that could be costly and time consuming.
We sell specialty wire and cable that has been manufactured by third parties. As a result, from time to time we have been named as defendants in lawsuits alleging that these products caused physical injury or injury to property. We rely on product warranties and indemnities from the product manufacturers, as well as insurance that we maintain, to protect us from these claims. However, manufacturers' warranties and indemnities are typically limited in duration and scope and may not cover all claims that might be asserted. Moreover, our insurance coverage may not be available or may not be adequate to cover every claim asserted or the entire amount of every claim.
Being a public company will increase our administrative costs and divert management time and attention, particularly to comply with regulatory requirements implemented by the Securities and Exchange Commission and The Nasdaq National Market.
As a public company, we will incur significant legal, accounting and other costs that we did not incur as a private company. We will incur all of the internal and external costs of preparing and distributing periodic public reports required under the securities laws and to comply with the Sarbanes-Oxley Act of 2002 and other rules and regulations that the Securities and Exchange Commission, or the SEC, and The Nasdaq National Market, or Nasdaq, have adopted. We expect these additional costs to be in the range of
$1.25 million to $$1.75 million per year. In addition to increasing costs, we expect our compliance efforts will make some activities more time-consuming and divert management time and attention away from our core business. We will need to expand our operational and financial systems and controls as part of our compliance efforts. We also expect that being a public company will make it more difficult and more expensive for us to obtain director and officer liability insurance and may require us to accept reduced coverage or incur substantially higher costs to maintain our current level of coverage.
We intend to take advantage of "grace periods" for newly public companies under certain SEC and Nasdaq rules and regulations, which grace periods will provide us a short period of time after we become a public company before we are required to be in full compliance with these rules and regulations. For example, upon the consummation of this offering, we will not be in full compliance with the SEC and Nasdaq requirements that a majority of our board members and all of our audit committee members be "independent." Our ability to satisfy the various requirements before the expiration of the applicable grace periods will depend largely on our ability to attract and retain qualified independent members of our board of directors, particularly to serve on our audit committee. If we fail to satisfy these requirements before the expiration of the applicable grace periods, our common stock may be delisted from Nasdaq, which would cause a decline in the trading price of our common stock and impair the ability of the holders of our common stock to sell and buy our common stock in a public market.
If we fail to maintain an effective system of internal controls, we may not be able to accurately report our financial results or prevent fraud. As a result, current and potential stockholders could lose confidence in our financial reporting, which would harm the trading price of our stock.
Effective internal controls are necessary for us to provide reliable financial reports and prevent fraud. Any failure to implement required new or improved controls, or difficulties encountered in their implementation, could harm our operating results or cause us to fail to meet our reporting obligations. Inadequate internal controls could also cause investors to lose confidence in our reported financial information, which could have a negative effect on the trading price of our stock.
We may not be able to successfully identify acquisition candidates, effectively integrate newly acquired businesses into our operations or achieve expected profitability from our acquisitions.
To supplement our growth, we intend to selectively pursue acquisition opportunities. If we are not successful in finding attractive acquisition candidates that we can acquire on satisfactory terms, or if we cannot complete those acquisitions that we identify, we will not be able to realize the benefit of this growth strategy.
Acquisitions involve numerous possible risks, including unforeseen difficulties in integrating operations, technologies, services, accounting and personnel; the diversion of financial and management resources from existing operations; unforeseen difficulties related to entering geographic regions or target markets where we do not have prior experience; the potential loss of key employees; and the inability to generate sufficient profits to offset acquisition or investment-related expenses. If we finance acquisitions by issuing equity securities or securities convertible into equity securities, our existing stockholders could be diluted, which, in turn, could adversely affect the market price of our stock. If we finance an acquisition with debt, it could result in higher leverage and interest costs. As a result, if we fail to evaluate and execute acquisitions properly, we might not achieve the anticipated benefits of these acquisitions, and we may incur costs in excess of what we anticipate.
Risks Relating to this Offering
Our common stock has no prior public market, and our stock price may decline after this offering.
Prior to this offering, there has been no public market for our common stock. We cannot assure you that an active trading market for our common stock will develop or be sustained after this offering. The initial
public offering price for our common stock will be determined by negotiations between the representatives of the underwriters, the selling stockholders and us. The initial public offering price may not correspond to the price at which our common stock will trade in the public market subsequent to this offering, and the price of our common stock available in the public market may not reflect our actual financial performance.
The market price of our common stock could be subject to significant fluctuations after this offering. Among the factors that could affect our stock price are:
The stock markets, in general, periodically experience volatility that is sometimes unrelated to the operating performance of particular companies. These broad market fluctuations may cause the trading price of our common stock to decline. In particular, you may not be able to resell your shares at or above the initial public offering price.
If securities or industry analysts do not publish research or reports about our business or publish negative research, or our results are below analysts' estimates, our stock price and trading volume could decline.
The trading market for our common stock may depend on the research and reports that industry or securities analysts publish about us or our business. We do not have any control over these analysts. If one or more of the analysts who cover us downgrade our stock or our results are below analysts' estimates, our stock price would likely decline. If one or more of these analysts cease coverage of our company or fail to regularly publish reports on us, we could lose visibility in the financial markets, which in turn could cause our stock price or trading volume to decline.
Our current principal stockholder will continue to have significant influence over us after this offering, and they could delay, deter or prevent a change of control or other business combination or otherwise cause us to take actions with which you may disagree.
Upon the closing of this offering, Code, Hennessy & Simmons II, L.P. will beneficially own approximately %43% of our outstanding common stock. In addition, two members of our board, Peter M. Gotsch and Robert G. Hogan, may be considered affiliates of Code, Hennessy & Simmons. As a result, Code, Hennessy & Simmons and its affiliates will have significant influence over our decision to enter into any corporate transaction and may have the ability to prevent any transaction that requires the approval of stockholders, regardless of whether other stockholders believe that the transaction is in their own best interests. This concentration of voting power could have the effect of delaying, deterring or preventing a change of control or other business combination that might otherwise be beneficial to our stockholders.
Shares eligible for public sale after this offering could adversely affect our stock price.
The shares of our common stock outstanding prior to this offering will be eligible for sale in the public market at various times in the future. The 8,500,000 shares of our common stock sold in this offering will be available for resale immediately. Sales of a substantial number of shares of our common stock in the public market following this offering, or the perception that these sales could occur, could cause the market price of our common stock to decline. We, all of our officers and directors and our stockholders have agreed, subject to limited exceptions, not to sell any shares of our common stock for a period of 180 days after the date of this prospectus without the prior written consent of William Blair & Company, L.L.C. Upon expiration of the lock-up period described above, and subject to the provisions of Rule 144, an additional 12,367,172 restricted shares will be available for sale in the public market.
Your percentage ownership in us may be diluted by future issuances of capital stock, which could reduce your influence over matters on which stockholders vote and be dilutive to earnings.
Following the closing of this offering, our board of directors haswill have the authority, without action or vote of our stockholders, except as required by Nasdaq, to issue all or any part of our authorized but unissued shares of common or preferred stock, including shares issuable upon the exercise of options. Our certificate of incorporation authorizes 100,000,000 shares of common stock and 5,000,000 shares of preferred stock. Following the initial public offering, 79,132,828 shares of common stock and 5,000,000 shares of preferred stock will be authorized but unissued. Issuances of common or preferred stock would reduce your influence over matters on which our stockholders vote and could be dilutive to earnings.
As a new investor, you will experience immediate and substantial dilution.
The initial public offering price of the common stock being sold in this offering is considerably more than the net tangible book value per share of our outstanding common stock. Accordingly, investors purchasing shares of common stock in this offering will pay a price per share that substantially exceeds, on a per share basis, the value of our tangible assets after subtracting liabilities. Investors will suffer additional dilution to the extent outstanding stock options are exercised and to the extent we issue any stock or options to our employees under our 2006 stock plan.
We might need to raise capital, which might not be available.
We may require additional equity or debt financing for additional working capital for expansion, to consummate an acquisition or if we suffer losses. In the event additional financing is unavailable to us, we may be unable to expand or make acquisitions and our stock price may decline. If we need additional capital as a result of significant losses and additional financing is unavailable to us, we may default under covenants contained in our loan agreements and we may need to sell assets.
Provisions in our charter documents and under Delaware law could discourage a takeover that stockholders may consider favorable.
Provisions in our certificate of incorporation and by-laws may have the effect of delaying or preventing a change of control or changes in our management. In addition, as a Delaware corporation, we are subject to certain Delaware anti-takeover provisions, including restrictions on our ability to engage in a business combination with any holder of 15% or more of our capital stock. Our board of directors could rely on Delaware law to prevent or delay an acquisition of us.
The matters discussed in this prospectus that are forward-looking statements are based on current management expectations that involve substantial risks and uncertainties, which could cause actual results to differ materially from the results expressed in, or implied by, these forward-looking statements. These statements can be identified by the fact that they do not relate strictly to historical or current facts. They use words such as "aim," "anticipate," "believe," "could," "estimate," "expect," "intend," "may," "plan," "project," "should," "will be," "will continue," "will likely result," "would" and other words and terms of similar meaning in conjunction with a discussion of future operating or financial performance. You should read statements that contain these words carefully, because they discuss our future expectations, contain projections of our future results of operations or of our financial position or state other "forward-looking" information.
The factors listed under "Risk Factors," as well as any cautionary language in this prospectus, provide examples of risks, uncertainties and events that may cause our actual results to differ materially from the expectations we describe in our forward-looking statements. Although we believe that our expectations are based on reasonable assumptions, actual results may differ materially from those in the forward looking statements as a result of various factors, including, but not limited to, those described above under the heading "Risk Factors" and elsewhere in this prospectus. Before you invest in our common stock, you should read this prospectus completely and with the understanding that our actual future results may be materially different from what we expect.
Forward-looking statements speak only as of the date of this prospectus. Except as required under federal securities laws and the rules and regulations of the SEC, we do not have any intention, and do not undertake, to update any forward-looking statements to reflect events or circumstances arising after the date of this prospectus, whether as a result of new information, future events or otherwise. As a result of these risks and uncertainties, readers are cautioned not to place undue reliance on the forward-looking statements included in this prospectus or that may be made elsewhere from time to time by, or on behalf of, us. All forward-looking statements attributable to us are expressly qualified by these cautionary statements.
We estimate that our net proceeds from the sale of shares by us in this offering will be approximately $$49.9 million, based on the assumed initial public offering price of $$13.00 per share, the mid-point of the range on the cover of this prospectus, and after deducting the underwriting discount and estimated offering expenses payable by us. We will not receive any proceeds from the sale of shares by the selling stockholders. A $1.00 increase (decrease) in the assumed initial public offering price of $13.00 per share would increase (decrease) the net proceeds to us from this offering by approximately $4.0 million, assuming the number of shares offered by us, as set forth on the cover page of this prospectus, remains the same and after deducting the estimated underwriting discounts and estimated offering expenses payable by us. Any increase (decrease) in the net proceeds would result in our paying down more (less) of the outstanding balance under the revolving loan.
We intend to use the net proceeds we receive from this offering to reduce existing indebtedness under our current credit facility, including repaying $ of the Term A Note due May 1, 2007, $$9.4 million of the Term B Note due May 1, 2007 and paying down $$40.5 million of the outstanding balance under our revolving facility,loan, which expires May 1, 2007. The Term B Note bears interest at 1.25% over the lender's base rate, and the Term A Note and the revolving loan bearbears interest at 0.25% over the lender's base rate. In accordance with our credit agreement, we have converted a portion of these borrowings to LIBOR loans, which bear interest, in the case of the Term B Note, at 2.75% over LIBOR and, in the case of the Term A Note and our revolving facility,loan, at 1.75% over LIBOR. Amounts repaid under the revolving credit facilityloan may be redrawn from time to time for general corporate purposes, including acquisitions. In the last 12 months, we borrowed under our revolving credit facilityloan to pay a $20.0 million special dividend and to fund working capital.
We paid a special dividend aggregating $20.0 million on our common stock on December 30, 2005. However, we do not anticipate paying dividends after the closing of this offering, and our board of directors currently intends to retain any future earnings for reinvestment in our business. In any event, any determination to pay dividends will be at the discretion of our board of directors and will be dependent upon our results of operations and cash flows, our financial position and capital requirements, general business conditions, legal, tax, regulatory and any contractual restrictions on the payment of dividends, including the restrictions contained in the agreements governing our outstanding indebtedness and any other factors our board of directors deems relevant.
As a holding company, our only source of funds to pay dividends is distributions from our operating subsidiary. Under our credit facility, our operating subsidiary may only pay us dividends for specified purposes, which do not include enabling us to pay dividends on our common stock.
The following table sets forth our book overdraft, current portion of long-term obligations and consolidated capitalization as of DecemberMarch 31, 2005:2006:
You should read the data set forth below in conjunction with "Management's Discussion and Analysis of Financial Condition and Results of Operations" and the consolidated financial statements and accompanying notes included elsewhere in this prospectus.
| | | As of December 31, 2005 | | As of March 31, 2006 | |||||||||||
|---|---|---|---|---|---|---|---|---|---|---|---|---|---|---|---|
| | | Actual | As Adjusted(1) | | Actual | As Adjusted(1) | |||||||||
| | | (In thousands, except share data) | | (In thousands, except share data) | |||||||||||
| Book overdraft | Book overdraft | $ | 2,119 | $ | Book overdraft | $ | 2,093 | $ | 2,093 | ||||||
| Current portion of long-term obligations | Current portion of long-term obligations | $ | 3,468 | $ | Current portion of long-term obligations | $ | 3,783 | $ | 450 | ||||||
| Long-term obligations: | Long-term obligations: | Long-term obligations: | |||||||||||||
| Revolving loan | $ | 46,906 | Revolving loan | $ | 43,857 | $ | 3,418 | ||||||||
| Term A loan | 4,088 | Term A loan | 3,975 | 3,975 | |||||||||||
| Term B loan | 6,944 | Term B loan | 6,111 | — | |||||||||||
| 57,938 | 53,943 | 7,393 | |||||||||||||
| Stockholders' equity: | Stockholders' equity: | Stockholders' equity: | |||||||||||||
| Common stock, par value .001 per share, 10,000,000 shares authorized; 8,856,892 shares issued and outstanding; shares issued and outstanding, as adjusted | 9 | Common stock, par value $.001 per share, 100,000,000 shares authorized; 16,617,172 shares issued and outstanding; 20,867,172 shares issued and outstanding, as adjusted | 17 | 21 | |||||||||||
| Additional paid-in-capital | 1,310 | Additional paid-in-capital | 796 | 50,675 | |||||||||||
| Unearned compensation | (559 | ) | Retained earnings | 4,802 | 4,802 | ||||||||||
| Retained earnings | — | Treasury shares, at cost | (18 | ) | (18 | ) | |||||||||
| Treasury shares, at cost | (18 | ) | |||||||||||||
| Total stockholders' equity | Total stockholders' equity | 742 | Total stockholders' equity | 5,597 | 55,480 | ||||||||||
| Total capitalization | Total capitalization | $ | 58,680 | $ | Total capitalization | $ | 59,540 | $ | 62,873 | ||||||
Our net tangible book value as of DecemberMarch 31, 20052006 was ($2.3)$2.6 million, or ($0.25)$0.16 per share of common stock. Net tangible book value per share is determined by dividing our net tangible book value, which is total tangible assets less total liabilities, by the aggregate number of shares of common stock outstanding. Tangible assets represent total assets excluding goodwill and other intangible assets. Dilution in net tangible book value per share represents the difference between the amount per share paid by purchasers of shares of our common stock in this offering and the as adjusted net tangible book value per share of our common stock immediately afterwards. After giving effect to our sale of shares of common stock in this offering at an assumed initial public offering price of $$13.00 per share, our as adjusted net tangible book value at DecemberMarch 31, 20052006 would have been $$52.5 million, or $$2.51 per share. This represents an immediate increase in net tangible book value of $$2.35 per share to our existing stockholders and an immediate dilution of $$10.49 per share to new investors purchasing shares of common stock in this offering. The following table illustrates this dilution per share:
| Assumed initial public offering price per share of common stock | $ | 13.00 | |||||
| Net tangible book value per share as of March 31, 2006 | $ | 0.16 | |||||
| Per share increase attributable to new investors | 2.35 | ||||||
| As adjusted net tangible book value per share after the offering | 2.51 | ||||||
| Dilution per share to new investors | 10.49 | ||||||
A $1.00 increase (decrease) in the assumed initial public offering price of $13.00 per share, assuming the number of shares offered by us, as set forth on the cover page of this prospectus, remains the same, would increase (decrease) our net tangible book value after this offering by approximately $4.0 million and the dilution per share to new investors by $0.19, in each case assuming the number of shares offered by us, as set forth on the cover page of this prospectus, remains the same and after deducting the estimated underwriting discounts and estimated offering expenses payable by us.
The following table summarizes, as of DecemberMarch 31, 2005,2006, on an as adjusted basis, the number of shares of common stock purchased or to be purchased from us, the total consideration paid or to be paid to us and the average price per share paid or to be paid by existing stockholders and by new investors purchasing shares of common stock in this offering, before deducting the underwriting discount and estimated offering expenses payable by us.
| | Shares Purchased | Total Consideration | | |||||||||
|---|---|---|---|---|---|---|---|---|---|---|---|---|
| | Average Price Per Share | |||||||||||
| | Number | Percentage | Amount | Percentage | ||||||||
| Existing stockholders | 16,617,172 | 79.6 | % | $ | 5,098,000 | 8.4 | % | $ | 0.31 | |||
| New investors(1) | 4,250,000 | 20.4 | 55,250,000 | 91.6 | $ | 13.00 | ||||||
| Total | 20,867,172 | 100.0 | % | $ | 60,348,000 | 100.0 | % | |||||
The above discussion and table assume no exercise of stock options after DecemberMarch 31, 2005.2006. As of DecemberMarch 31, 2005,2006, we had outstanding options to purchase a total of 245,065 shares of common stock at a weighted average price of $$1.33 a share. If all such options had been exercised as of DecemberMarch 31, 2005,2006, adjusted net tangible book value per share would be $$2.50 and dilution to new investors would be $$10.50 per share. To the extent any additional options are granted and exercised, there may be additional economic dilution to new investors.
In addition, we may choose to raise additional capital due to market conditions or strategic considerations, even if we believe we have sufficient funds for our current or future operating plans. To the extent that we raise additional capital through the sale of equity or convertible debt securities, the issuance of these securities could result in further dilution to our stockholders.
SELECTED CONSOLIDATED FINANCIAL DATA
You should read the following selected financial information together with our financial statements and the related notes appearing at the end of this prospectus and the "Management's Discussion and Analysis of Financial Condition and Results of Operations" section of this prospectus. We have derived the statement of income data for the three months ended March 31, 2005 and 2006 and the balance sheet data at March 31, 2006 from our unaudited financial statements, which are included in this prospectus. The unaudited financial statements have been prepared on the same basis as the audited financial statements and, in the opinion of management, include all adjustments, consisting of only normal recurring adjustments, necessary for a fair presentation of the information set forth therein. We have derived the statement of income data for each of the years ended December 31, 2003, 2004 and 2005, and the balance sheet information at December 31, 2004 and December 31, 2005 from our audited financial statements, which are included in this prospectus. We have derived the statementsstatement of income data for the years ended December 31, 2001 and December 31, 2002, and the balance sheet data at December 31, 2001, 2002 and 2003 from our audited financial statements, which are not included in this prospectus.
| | | Year Ended December 31, | | Year Ended December 31, | Three Months Ended March 31, | ||||||||||||||||||||||||||||||||||
|---|---|---|---|---|---|---|---|---|---|---|---|---|---|---|---|---|---|---|---|---|---|---|---|---|---|---|---|---|---|---|---|---|---|---|---|---|---|---|---|
| | | 2001 | 2002 | 2003 | 2004 | 2005 | | 2001 | 2002 | 2003 | 2004 | 2005 | 2005 | 2006 | |||||||||||||||||||||||||
| | | (Dollars in thousands, except per share data) | | (Dollars in thousands, except per share data) | |||||||||||||||||||||||||||||||||||
| CONSOLIDATED STATEMENT OF INCOME DATA: | CONSOLIDATED STATEMENT OF INCOME DATA: | CONSOLIDATED STATEMENT OF INCOME DATA: | |||||||||||||||||||||||||||||||||||||
| Sales | Sales | $ | 189,688 | $ | 158,230 | $ | 149,084 | $ | 172,723 | $ | 213,957 | Sales | $ | 189,688 | $ | 158,230 | $ | 149,084 | $ | 172,723 | $ | 213,957 | $ | 43,106 | $ | 66,428 | |||||||||||||
| Cost of sales | Cost of sales | 146,430 | 120,839 | 113,959 | 131,419 | 158,240 | Cost of sales | 146,430 | 120,839 | 113,959 | 131,419 | 158,240 | 31,949 | 48,437 | |||||||||||||||||||||||||
| Gross profit | Gross profit | 43,258 | 37,391 | 35,125 | 41,304 | 55,717 | Gross profit | 43,258 | 37,391 | 35,125 | 41,304 | 55,717 | 11,157 | 17,991 | |||||||||||||||||||||||||
| Operating expenses: | Operating expenses: | Operating expenses: | |||||||||||||||||||||||||||||||||||||
| Salaries and commissions | 17,786 | 15,190 | 14,588 | 16,665 | 18,707 | Salaries and commissions | 17,786 | 15,190 | 14,588 | 16,665 | 18,707 | 4,289 | 5,072 | ||||||||||||||||||||||||||
| Other operating expenses | 13,800 | 12,846 | 13,857 | 12,392 | 14,016 | Other operating expenses | 13,800 | 12,846 | 13,857 | 12,392 | 14,016 | 3,408 | 3,748 | ||||||||||||||||||||||||||
| Management fee(1) | 507 | 504 | 502 | 501 | 500 | Management fee(1) | 507 | 504 | 502 | 501 | 500 | 125 | 125 | ||||||||||||||||||||||||||
| Litigation settlements | 124 | 49 | — | (650 | ) | (672 | ) | Litigation settlements | 124 | 49 | — | (650 | ) | (672 | ) | (672 | ) | — | |||||||||||||||||||||
| Depreciation and amortization | 1,889 | 1,688 | 1,481 | 876 | 398 | Depreciation and amortization | 1,889 | 1,688 | 1,481 | 876 | 398 | 110 | 93 | ||||||||||||||||||||||||||
| Total operating expenses | Total operating expenses | 34,106 | 30,277 | 30,428 | 29,784 | 32,949 | Total operating expenses | 34,106 | 30,277 | 30,428 | 29,784 | 32,949 | 7,260 | 9,038 | |||||||||||||||||||||||||
| Operating income | Operating income | 9,152 | 7,114 | 4,697 | 11,520 | 22,768 | Operating income | 9,152 | 7,114 | 4,697 | 11,520 | 22,768 | 3,897 | 8,953 | |||||||||||||||||||||||||
| Interest expense | Interest expense | 5,965 | 4,360 | 4,186 | 3,544 | 2,955 | Interest expense | 5,965 | 4,360 | 4,186 | 3,544 | 2,955 | 713 | 1,054 | |||||||||||||||||||||||||
| Income before income taxes | Income before income taxes | 3,187 | 2,754 | 511 | 7,976 | 19,813 | Income before income taxes | 3,187 | 2,754 | 511 | 7,976 | 19,813 | 3,184 | 7,899 | |||||||||||||||||||||||||
| Income tax provision | Income tax provision | 130 | 290 | 295 | 3,167 | 7,299 | Income tax provision | 130 | 290 | 295 | 3,167 | 7,299 | 1,173 | 3,097 | |||||||||||||||||||||||||
| Net income | Net income | $ | 3,057 | $ | 2,464 | $ | 216 | $ | 4,809 | $ | 12,514 | Net income | $ | 3,057 | $ | 2,464 | $ | 216 | $ | 4,809 | $ | 12,514 | $ | 2,011 | $ | 4,802 | |||||||||||||
Net income per share: | Net income per share: | Net income per share: | |||||||||||||||||||||||||||||||||||||
| Basic | $ | 0.36 | $ | 0.28 | $ | 0.02 | $ | 0.55 | $ | 1.41 | Basic | $ | 0.19 | $ | 0.15 | $ | 0.01 | $ | 0.29 | $ | 0.75 | $ | 0.12 | $ | 0.29 | ||||||||||||||
| Diluted | $ | 0.36 | $ | 0.28 | $ | 0.02 | $ | 0.55 | $ | 1.40 | Diluted | $ | 0.19 | $ | 0.15 | $ | 0.01 | $ | 0.29 | $ | 0.75 | $ | 0.12 | $ | 0.29 | ||||||||||||||
| Weighted average shares outstanding: | Weighted average shares outstanding: | Weighted average shares outstanding: | |||||||||||||||||||||||||||||||||||||
| Basic | 8,590,877 | 8,711,400 | 8,711,509 | 8,720,248 | 8,856,892 | Basic | 16,107,894 | 16,333,875 | 16,334,079 | 16,350,465 | 16,606,673 | 16,606,673 | 16,613,702 | ||||||||||||||||||||||||||
| Diluted | 8,590,877 | 8,802,139 | 8,802,248 | 8,810,987 | 8,937,228 | Diluted | 16,107,894 | 16,504,011 | 16,504,215 | 16,520,601 | 16,757,303 | 16,697,153 | 16,710,098 | ||||||||||||||||||||||||||
PRO FORMA STATEMENT OF INCOME DATA(2): | PRO FORMA STATEMENT OF INCOME DATA(2): | PRO FORMA STATEMENT OF INCOME DATA(2): | |||||||||||||||||||||||||||||||||||||
| Pro forma operating income | Pro forma operating income | $ | Pro forma operating income | $ | 23,268 | $ | 4,022 | $ | 9,078 | ||||||||||||||||||||||||||||||
| Pro forma net income | Pro forma net income | $ | Pro forma net income | $ | 14,416 | $ | 2,478 | $ | 5,384 | ||||||||||||||||||||||||||||||
| Pro forma net income per share: | Pro forma net income per share: | Pro forma net income per share: | |||||||||||||||||||||||||||||||||||||
| Basic | $ | Basic | $ | 0.69 | $ | 0.12 | $ | 0.26 | |||||||||||||||||||||||||||||||
| Diluted | $ | Diluted | $ | 0.69 | $ | 0.12 | $ | 0.26 | |||||||||||||||||||||||||||||||
| Pro forma weighted average shares outstanding: | Pro forma weighted average shares outstanding: | Pro forma weighted average shares outstanding: | |||||||||||||||||||||||||||||||||||||
| Basic | Basic | 20,856,673 | 20,856,673 | 20,863,702 | |||||||||||||||||||||||||||||||||||
| Diluted | Diluted | 21,007,303 | 20,947,153 | 20,960,098 | |||||||||||||||||||||||||||||||||||
ADDITIONAL DATA: | ADDITIONAL DATA: | ADDITIONAL DATA: | |||||||||||||||||||||||||||||||||||||
| Capital expenditures (excluding acquisitions) | Capital expenditures (excluding acquisitions) | $ | 727 | $ | 377 | $ | 290 | $ | 208 | $ | 329 | Capital expenditures (excluding acquisitions) | $ | 727 | $ | 377 | $ | 290 | $ | 208 | $ | 329 | $ | 86 | $ | 104 | |||||||||||||
| Average number of employees | Average number of employees | 320 | 291 | 266 | 267 | 274 | Average number of employees | 320 | 291 | 266 | 267 | 274 | 278 | 271 | |||||||||||||||||||||||||
| | As of December 31, | As of December 31, 2005, as adjusted(3) | As of December 31, | As of March 31, 2006 | ||||||||||||||||||||||||||||||||||
|---|---|---|---|---|---|---|---|---|---|---|---|---|---|---|---|---|---|---|---|---|---|---|---|---|---|---|---|---|---|---|---|---|---|---|---|---|---|---|
| | 2001 | 2002 | 2003 | 2004 | 2005 | 2001 | 2002 | 2003 | 2004 | 2005 | Actual | As adjusted(3) | ||||||||||||||||||||||||||
| | (Dollars in thousands) | (Dollars in thousands) | ||||||||||||||||||||||||||||||||||||
| CONSOLIDATED BALANCE SHEET DATA: | ||||||||||||||||||||||||||||||||||||||
| Cash and cash equivalents | $ | — | $ | — | $ | — | $ | — | $ | — | $ | — | $ | — | $ | — | $ | — | $ | — | $ | — | $ | — | ||||||||||||||
| Accounts receivable, net | 24,662 | 20,923 | 21,644 | 27,541 | 41,778 | 24,662 | 20,923 | 21,644 | 27,541 | 41,778 | 39,914 | 39,914 | ||||||||||||||||||||||||||
| Inventories, net | 38,186 | 34,726 | 26,905 | 29,836 | 31,306 | 38,186 | 34,726 | 26,905 | 29,836 | 31,306 | 40,065 | 40,065 | ||||||||||||||||||||||||||
| Total assets | 75,931 | 66,927 | 58,455 | 66,193 | 81,710 | 75,931 | 66,927 | 58,455 | 66,193 | 81,710 | 88,657 | 88,657 | ||||||||||||||||||||||||||
| Book overdraft(4) | 1,247 | 389 | 174 | 1,341 | 2,119 | 1,247 | 389 | 174 | 1,341 | 2,119 | 2,093 | 2,093 | ||||||||||||||||||||||||||
| Total debt | 59,389 | 55,668 | 46,548 | 43,752 | 61,406 | 59,389 | 55,668 | 46,548 | 43,752 | 61,406 | 57,726 | 7,843 | ||||||||||||||||||||||||||
| Stockholders' equity(5) | 684 | 3,148 | 3,364 | 8,228 | 742 | 684 | 3,148 | 3,364 | 8,228 | 742 | 5,597 | 55,480 | ||||||||||||||||||||||||||
MANAGEMENT'S DISCUSSION AND ANALYSIS OF
FINANCIAL CONDITION AND RESULTS OF OPERATIONS
You should read the following discussion in conjunction with our consolidated financial statements and related notes appearing elsewhere in this prospectus. The following discussion of our historical consolidated financial statements covers periods before consummation of this offering and the application of the proceeds. Accordingly, the discussion does not reflect the impact that this offering will have on us. See the information provided in "Risk Factors," "Capitalization," "—Liquidity and Capital Resources" and elsewhere in this prospectus for further discussion relating to the impact of this offering on us. In addition to historical information, this discussion contains forward-looking statements that involve risks, uncertainties and assumptions that could cause actual results to differ materially from our expectations. Factors that could cause such differences include those described in "Risk Factors" and elsewhere in this prospectus. Certain tabular information will not foot due to rounding.
Overview
Since our founding over 30 years ago, we have grown to be one of the largest distributors of specialty wire and cable and related services to the U.S. electrical distribution market. Today, we serve over 2,600 customers, including each of the top 200 electrical distributors in the U.S. Our specialty wire and cable is primarily used in maintenance, repair and operations ("MRO") related projects and is increasingly purchased for larger scale projects in the communications, energy, engineering and construction, general manufacturing, infrastructure, petrochemical, transportation, utility and wastewater treatment industries.
In 2000, we acquired our largest competitor, the Futronix division of Kent Electronics Corporation. Since that time, we have pursued a number of initiatives designed to improve our operating efficiencies and increase our share of the fragmented market for specialty wire and cable. We integrated the Futronix business into our own and rationalized inventory, facilities and low-margin customer relationships. We have made substantial investments in warehouse facilities and information systems in order to enhance our ability to provide customers with comprehensive value-added services, including application engineering support, inventory management, custom cut capabilities and 24/7/365 customer service, order fulfillment and shipping. During the years 2001 through 2003, the U.S. electrical distribution market was adversely affected by the general slowdown of the economy. In response to these economic conditions, we increased our focus on achieving operating efficiencies by leveraging our investments in our centralized back-office administration and purchasing, investing in a scalable information technology platform and implementing automated warehouse operations and electronic product tracking. This focus has assisted us in increasing our operating income margin from 4.8% in 2001 to 10.6% in 2005.
Since 2003, the U.S. electrical distribution market has experienced increased demand, as large industrial and commercial companies have increased capital spending to "catch-up" on deferred maintenance and upgrade and expand infrastructure. According toElectrical Wholesaling magazine, , the U.S. electrical distribution market is estimated to have grown from approximately $60.6 billion of industry-wide sales in 2003 to $74.3 billion in 2005, and is expected to grow 7.9% to $80.2 billion in 2006. At the same time as the electrical distribution market began to recover, we implemented a new sales and marketing strategy that focuses on working in concert with our distributor customers to generate demand from end-users in our targeted markets and to strengthen relationships with project and specifying engineers to stimulate demand for our specialty wire and cable. In addition, we have significantly increased the size of our sales force since 2003, and as of AprilMay 1, 2006 we had 142141 sales employees. In 2003, we introduced our LifeGuard™ line of low-smoke, zero-halogen cable products which, due to their highly engineered specifications and safety benefits, generate higher margins for us than traditional cable products. As a result of our new sales and marketing initiatives, as well as general market growth, our revenue has increased at a CAGR of 19.8% over the past three years, from $149.1 million in 2003 to $214.0 million in 2005.
Our revenue is driven in part by the level of capital spending within the end-markets we serve. Because many of these end-markets defer capital expenditures during periods of economic downturns, our business has experienced cyclicality from time to time. We believe that our revenues will continue to be impacted by fluctuations in capital spending and by our ability to drive demand through our sales and marketing initiatives and the continued development and marketing of our private branded products, such as LifeGuard™.
Our direct costs will continue to be influenced significantly by the prices we pay our suppliers to procure the products we distribute to our customers. Changes in these costs may result, for example, from increases or decreases in raw material costs, changes in our relationships with suppliers or changes in vendor rebates. Our operating expenses will continue to be affected by our investment in sales, marketing and customer support personnel and commissions paid to our sales force for revenue generated. Some of our operating expenses are related to our fixed infrastructure, including rent, utilities, administrative salaries, maintenance, insurance and supplies. To meet our customers' needs for an extensive product offering and short delivery times, we will need to continue to maintain adequate inventory levels. Our ability to obtain this inventory will depend, in part, on our relationships with suppliers.
Changes in Connection with Becoming a Public Company
As a public company, we expect that we will incur significant additional operating expenses such as increased audit fees, professional fees, directors' and officers' insurance costs, compensation for our board of directors, and expenses related to hiring additional personnel and expanding our administrative functions. Many of these expenses were not incurred or were incurred at a lower level by us as a private company and are not included in our prior results of operations. We began to incur certain of these expenses during 2006, and we expect that these expenses will continue to increase. We expect these additional expenses to be in the range of $$1.25 million to $$1.75 million per year.
Following the offering, we will no longer be subject to the annual $500,000 management fee that we pay to an affiliate of Code, Hennessy & Simmons.
On December 30, 2005, we paid a special dividend of $20.0 million to our common stockholders and funded the payment by borrowing under our existing credit facilities.facility. Due to the interest payable on these borrowings, our net earnings, and earnings per share, in 2006 will be lower than they would have been had we not paid the special dividend. We intend to use our net proceeds from this offering to repay a portion of our outstanding indebtedness.
Critical Accounting Policies
Critical accounting policies are those that both are important to the accurate portrayal of a company's financial condition and results, and require subjective or complex judgments, often as a result of the need to make estimates about the effect of matters that are inherently uncertain.
In order to prepare financial statements that conform to accounting principles generally accepted in the United States, commonly referred to as GAAP, we make estimates and assumptions that affect the amounts reported in our financial statements and accompanying notes. Certain estimates are particularly sensitive due to their significance to the financial statements and the possibility that future events may be significantly different from our expectations.
We have identified the following accounting policies as those that require us to make the most subjective or complex judgments in order to fairly present our consolidated financial position and results of operations. Actual results in these areas could differ materially from management's estimates under different assumptions and conditions.
Allowance for Doubtful Accounts
We maintain an allowance for doubtful accounts receivable for estimated losses resulting from the inability of our customers to make required payments. We perform periodic credit evaluations of our customers and typically do not require collateral. Consistent with industry practices, we require payment from most customers within 30 days of invoice date. We have an estimation procedure, based on historical data and recent changes in the aging of these receivables, that we use to record reserves throughout the year. In the last five years, write-offs against our allowance for doubtful accounts have averaged approximately $165,000 per year. A 20% change in our estimate at December 31, 2005 would have resulted in a change in income before income taxes of $89,000 for the year ended December 31, 2005.
Inventory Obsolescence
We continually monitor our inventory levels at each of our distribution locations. Our reserve for inventory obsolescence is based on the age of the inventory, movements of our inventory over the prior eighteen months and the experience of our purchasing and sales departments in estimating demand for the product in the succeeding year.year. Our inventories are generally not susceptible to technological obsolescence. A 20% change in our estimate at December 31, 2005 would have resulted in a change in income before income taxes of $382,000 for the year ended December 31, 2005.
Goodwill
Goodwill represents the excess of the amount we paid to acquire businesses over the estimated fair value of tangible assets and identifiable intangible assets acquired, less liabilities assumed. At December 31, 2005, our net goodwill balance was $3.0 million, representing 3.7% of our total assets.
In 2002, we adopted the provisions of Statement of Financial Accounting Standards No. 142,Goodwill and Other Intangible Assets ("SFAS 142"). Under SFAS 142, we test goodwill for impairment annually, or more frequently if indications of possible impairment exist, by applying a fair value-based test.
In October 2005, we performed our annual goodwill impairment tests for goodwill and other indefinite-lived intangible assets, and, as a result of this test, we believe the goodwill on our balance sheet is not impaired.
If circumstances change or events occur to indicate that our fair market value has fallen below book value, we will compare the estimated fair value of the goodwill to its carrying value. If the carrying value of goodwill exceeds the estimated fair value of goodwill, we will recognize the difference as an impairment loss in operating income.
Vendor Rebates
Many of our arrangements with our vendors entitle us to receive a rebate of a specified amount when we achieve any of a number of measures, generally related to the volume of purchases from the vendor. We account for these rebates as a reduction of the prices of the vendor's products, which reduces inventory until we sell the product, at which time these rebates reduce cost of sales. Throughout the year, we estimate the amount of rebates earned based on our purchases to date and our estimate of purchases to be made for the remainder of the year relative to the purchase levels that mark our progress toward earning the rebates. We continually revise these estimates to reflect actual purchase levels. A 20% change in our estimate of total rebates earned during 2005 would have resulted in a change in income before income taxes of $580,000 for the year ended December 31, 2005.
New Accounting Pronouncements
On December 16, 2004, the Financial Accounting Standards Board ("FASB") issued FASB Statement No. 123 (revised 2004) ("FASSFAS 123(R)"),Share-Based Payment, which is a revision of SFAS 123,Accounting
Accounting for Stock-Based Compensation. Generally, the approach to accounting for share-based payments in FASSFAS 123(R) is similar to the approach described in SFAS 123. However, FASSFAS 123(R) requires all share-based payments to employees, including grants of employee stock options, to be recognized in the financial statements based on their fair values. As such, pro forma disclosure is no longer an alternative to financial statement recognition. We adopted FASSFAS 123(R) effective January 1, 2006.2006 using the prospective transition method. The adoption of FASSFAS 123(R) isdid not expected to have a material effect on our consolidated financial position, cash flows or results of operations.
Sales
We generate most of our sales by providing specialty wire and cable to our customers. We also collect sales through freight charges. We recognize revenue upon shipment of our products to customers from our distribution centers or directly from our suppliers. Sales incentives earned by customers are accrued in the same month as the shipment is invoiced.
Cost of Sales
Cost of sales consists primarily of the average cost of the specialty wire and cable that we sell. We also incur shipping and handling costs in the normal course of business. Cost of sales also reflects cash discounts for prompt payment to vendors and vendor rebates generally related to annual purchase targets.
Operating Expenses
Operating expenses include all expenses incurred to receive, sell and ship product and administer the operations of our company.
Salaries and Commissions. Salary expense includes the base compensation, and any overtime earned by hourly personnel, for all sales, administrative and warehouse employees. Commission expense is earned by inside sales personnel based on gross profit dollars generated, by field sales personnel from generating sales and meeting various personal objectives, by sales, national and project managers for driving the sales process, by regional managers based on the profitability of their branches and by corporate managers based on the profitability of the company.
Other Operating Expenses. Other operating expenses include all other expenses, except for salaries and commissions, management fees and depreciation and amortization. This includes all payroll taxes, health insurance, traveling expenses, advertising, management information system expenses, facility rent and maintenance and all distribution expenses such as packaging, reels, and repair and maintenance of equipment and facilities.
Management Fee. The management fee consists of expenses that we pay to CHS Management II, L.P. for certain management and advisory services. This management fee arrangement will be cancelled upon the completion of the offering.
Litigation Settlements. Litigation settlements reflect the funds received from the settlement of a lawsuit against two vendors in 2004 and from a court award in 2005 related to a claim for breach of contract that occurred under the previous ownership.
Depreciation and Amortization. We incur depreciation and amortization expenses for costs related to the capitalization of property and equipment on a straight-line basis over the estimated useful lives of the assets, which range from three to 30 years. We amortize leasehold improvements over their estimated useful life or the remaining lease term.term, whichever is shorter. A non-compete agreement arising from the 2000 acquisition of Futronix was amortized over its four-year term.
Interest Expense
Interest expense consists primarily of interest we pay on our debt. The decrease in interest expense in 2005 resulted from payments made in 2004 and 2005 on our junior subordinated promissory notes, which
bore interest at a rate of 14.0% per annum. Interest expense will increaseincreased in the first halfquarter of 2006 due to the additional debt incurred to finance the payment of the special dividend in December 2005. See "Use of Proceeds."
Results of Operations
The following discussion compares our results of operations for the quarters ended March 31, 2006 and 2005 and the years ended December 31, 2005, 2004 and 2003.
The following table shows, for the periods indicated, information derived from our consolidated statements of income, expressed as a percentage of sales for the period presented.
| | | Year Ended December 31, | | Year Ended December 31, | Quarter Ended March 31, | |||||||||||||||||
|---|---|---|---|---|---|---|---|---|---|---|---|---|---|---|---|---|---|---|---|---|---|---|
| | | 2003 | 2004 | 2005 | | 2003 | 2004 | 2005 | 2005 | 2006 | ||||||||||||
| Sales | Sales | 100.0 | % | 100.0 | % | 100.0 | % | Sales | 100.0 | % | 100.0 | % | 100.0 | % | 100.0 | % | 100.0 | % | ||||
| Cost of sales | Cost of sales | 76.4 | % | 76.1 | % | 74.0 | % | Cost of sales | 76.4 | % | 76.1 | % | 74.0 | % | 74.1 | % | 72.9 | % | ||||
| Gross profit | Gross profit | 23.6 | % | 23.9 | % | 26.0 | % | Gross profit | 23.6 | % | 23.9 | % | 26.0 | % | 25.9 | % | 27.1 | % | ||||
| Operating expenses: | Operating expenses: | Operating expenses: | ||||||||||||||||||||
| Salaries and commissions | 9.8 | % | 9.6 | % | 8.7 | % | Salaries and commissions | 9.8 | % | 9.6 | % | 8.7 | % | 9.9 | % | 7.6 | % | |||||
| Other operating expenses | 9.3 | % | 7.2 | % | 6.6 | % | Other operating expenses | 9.3 | % | 7.2 | % | 6.6 | % | 7.9 | % | 5.6 | % | |||||
| Management fee | 0.3 | % | 0.3 | % | 0.2 | % | Management fee | 0.3 | % | 0.3 | % | 0.2 | % | 0.3 | % | 0.2 | % | |||||
| Litigation settlements | 0.0 | % | (0.4 | %) | (0.3 | %) | Litigation settlements | 0.0 | % | (0.4 | %) | (0.3 | %) | (1.6 | %) | 0.0 | % | |||||
| Depreciation and amortization | 1.0 | % | 0.5 | % | 0.2 | % | Depreciation and amortization | 1.0 | % | 0.5 | % | 0.2 | % | 0.3 | % | 0.1 | % | |||||
| Total operating expenses | 20.4 | % | 17.2 | % | 15.4 | % | Total operating expenses | 20.4 | % | 17.2 | % | 15.4 | % | 16.8 | % | 13.6 | % | |||||
| Operating income | Operating income | 3.2 | % | 6.7 | % | 10.6 | % | Operating income | 3.2 | % | 6.7 | % | 10.6 | % | 9.0 | % | 13.5 | % | ||||
| Interest expense | Interest expense | 2.8 | % | 2.1 | % | 1.4 | % | Interest expense | 2.8 | % | 2.1 | % | 1.4 | % | 1.7 | % | 1.6 | % | ||||
| Income before income taxes | Income before income taxes | 0.3 | % | 4.6 | % | 9.3 | % | Income before income taxes | 0.3 | % | 4.6 | % | 9.3 | % | 7.4 | % | 11.9 | % | ||||
| Income tax provision | Income tax provision | 0.2 | % | 1.8 | % | 3.4 | % | Income tax provision | 0.2 | % | 1.8 | % | 3.4 | % | 2.7 | % | 4.7 | % | ||||
| Net income | Net income | 0.1 | % | 2.8 | % | 5.8 | % | Net income | 0.1 | % | 2.8 | % | 5.8 | % | 4.7 | % | 7.2 | % | ||||
Comparison of Quarters Ended March 31, 2006 and 2005
Sales
Our sales were $66.4 million for the three months ended March 31, 2006, an increase of $23.3 million, or 54.1%, compared to sales of $43.1 million for the comparable period in 2005. The increase reflected increased demand due to strong capital spending across a wide array of end markets, increased MRO spending which continued from the second half of 2005, an increase in product prices and the increased sales of the LifeGuard™ product line. The branches serving the Gulf Coast region had the highest increase in sales, due to product needed for damage repairs and rebuilding from the two hurricanes.
Cost of Sales
Cost of sales was $48.4 million for the three months ended March 31, 2006, an increase of $16.5 million, or 51.6%, compared to cost of sales of $31.9 million for the comparable period in 2005. The increase reflects increases in demand for our products.
Gross Profit
Gross profit was $18.0 million for the three months ended March 31, 2006, an increase of $6.8 million, or 61.3%, compared to gross profit of $11.2 million for the comparable period in 2005. This increase was due primarily to higher sales volume and an increase in our gross margin from 25.9% to 27.1%. The margin increase is attributed to an increase in the percentage of sales volume shipped from inventory held in our distribution centers of 72.6% in 2006 compared to 71.0% in 2005, and an increase in sales of higher margin products. Shipments from inventory held in our distribution centers generally represent smaller orders and command a higher level of gross margin than direct shipments from suppliers and cross-dock shipments.
Operating Expenses
Operating expenses were $9.0 million for the three months ended March 31, 2006, an increase of $1.8 million, or 24.5%, compared to operating expenses of $7.3 million for the comparable period in 2005. This increase was due to the specific factors discussed below.
Salaries and Commissions. Salaries and commissions were $5.1 million for the three months ended March 31, 2006, an increase of $0.8 million, or 18.3%, compared to salaries and commission expenses of $4.3 million for the comparable period in 2005. Almost all of this increase, $0.7 million, was due to higher commissions due to increased sales and gross profit. Salaries and commissions as a percentage of sales decreased from 9.9% in 2005 to 7.6% in 2006.
Other Operating Expenses. Other operating expenses were $3.7 million for the three months ended March 31, 2006, an increase of $0.3 million, or 10.0%, compared to other operating expenses of $3.4 million for the comparable period in 2005. The increase in operating expenses is related to administrative costs, including additional professional fees and additional warehousing expenses, including supplies and equipment. Other operating expenses as a percentage of sales have decreased from 7.9% in 2005 to 5.6% in 2006.
Management Fee. Management fee expenses were flat at $0.1 million for the three months ended March 31, 2006 and 2005. Following this offering, we will no longer pay any management fee to CHS Management II, L.P.
Litigation Settlement. There was no litigation settlement for the three months ended March 31, 2006 and a $0.7 million litigation settlement for the comparable period in 2005.
Depreciation and Amortization. Depreciation and amortization expenses were flat at $0.1 million for the three months ended March 31, 2006 and 2005.
Interest Expense
Interest expense was $1.1 million for the three months ended March 31, 2006, an increase of $0.3 million, or 47.8%, compared to interest expense of $0.7 million for the comparable period in 2005. The increase was primarily due to the increase in debt in December 2005 to pay a special $20.0 million dividend.
Income Tax Expense
Our effective income tax rate increased from 36.8% in the three months ended March 31, 2005 to 39.2% in the three months ended March 31, 2006. This was primarily due to an increase in the state tax rate in the current period and the non-taxable nature of a litigation settlement in the prior period.
Comparison of Years Ended December 31, 2005 and 2004
Sales
Our sales were $214.0 million in 2005, an increase of $41.2 million, or 23.9%, compared to sales of $172.7 million in 2004. The increase is the result of greater demand for our products, spurred by a higher
level of capital spending in a number of end-markets, including investments by utilities in new power generation projects and facility upgrades, increased MRO spending and increased sales of our LifeGuard™ product. Sales of control and power cable, our largest product family, increased by $17.0 million, or 30%, from $56.4 million in 2004 to $73.4 million in 2005. Sales also benefited from the addition of 13 sales personnel in 2005 and from the efforts of our field sales force to track new construction and MRO projects to get our products included in specifications. Sales increased by more than 20% in every region we served except the Northeast, where general economic activity remained slower than in the rest of the country. We estimate that we benefited by approximately $5.0 to $6.0 million in sales as a result of the Gulf Coast hurricanes in the second half of 2005.
Cost of Sales
Cost of sales was $158.2 million in 2005, an increase of $26.8 million, or 20.4%, compared to cost of sales of $131.4 million in 2004. The increase was primarily due to the increase in demand for our products mentioned above. The increase also resulted in part from an increase in freight costs of $0.9 million in 2005
over 2004. Partially offsetting these increases were vendor rebates and discounts for prompt payment totaling $1.7 million more in 2005 than in 2004 and an inventory obsolescence credit of $0.2 million in 2005, as compared to a charge of $0.7 million in 2004, reflecting our success in selling some older, reserved inventory.
Gross Profit
Gross profit increased $14.4 million, or 34.9%, to $55.7 million in 2005 from $41.3 million in 2004, due primarily to increased sales. Gross profit as a percentage of net sales, commonly referred to as gross margin, increased to 26.0% in 2005 compared to 23.9% for 2004. This increase was due mainly to a more favorable product mix, including a greater proportion of higher margin items and increased vendor rebates. Improved inventory profiles allowed us to increase the percentage of sales volume shipped from inventory held in our distribution centers from 68.1% in 2004 to 69.5% in 2005. Shipments from inventory held in our distribution centers generally represent smaller orders and command a higher level of gross margin. Also contributing to this increase was the inventory obsolescence credit described above.
Operating Expenses
Operating expenses were $32.9 million in 2005, an increase of $3.1 million, or 10.4%, compared to operating expenses of $29.8 million in 2004. This increase was attributable to the specific factors discussed below.
Salaries and Commissions. Salaries and commissions increased $2.0 million, or 12.3%, to $18.7 million in 2005 from $16.7 million in 2004. This increase consists of a $0.7 million increase in salaries due to pay increases and additional personnel and a $1.3 million increase in commission expense, reflecting the higher level of sales. Salaries and commissions as a percentage of net sales decreased to 8.7% in 2005 from 9.6% in 2004, as sales increased at a faster rate than personnel additions and commission payments.
Other Operating Expenses. Other operating expenses increased $1.6 million, or 13.1%, to $14.0 million in 2005 from $12.4 million in 2004. The increase in other operating expenses is due to expenditures for advertising to support the growth in the sales volume, administrative costs, including payroll taxes and medical and dental costs, and warehousing costs, including supplies and equipment. While other operating expenses increased in 2005 from 2004, other operating expenses as a percentage of net sales decreased to 6.6% in 2005 from 7.2% in 2004 due to our ability to leverage infrastructure costs.
Management Fee. Management fee expenses were consistent at $0.5 million in 2005 and 2004. Following this offering, we will no longer pay an annual management fee to CHS Management II, L.P.
Litigation Settlement. We realized a litigation settlement benefit of $0.7 million in 2005, an increase of $22,000 or 3.4% compared to the benefit received in 2004. The 2005 litigation settlement resulted from a
court award involving the seller indemnification provisions of the 1997 purchase agreement by which our current owners acquired us.
Depreciation and Amortization. Depreciation and amortization expense was $0.4 million in 2005, a decrease of $0.5 million, or 54.6%, compared to $0.9 million in 2004. This decrease was primarily due to the charge in 2004 of $0.3 million for the unamortized balance of a non-compete agreement (relating to the 2000 Futronix acquisition) that was fully amortized in 2004.
Interest Expense
Interest expense decreased $0.6 million, or 16.6%, to $3.0 million in 2005 from $3.5 million in 2004. An increase in our average debt outstanding was more than offset by the effect of a decrease in our effective interest rate to 7.2% in 2005 from 7.9% in 2004. The decrease in the effective interest rate was primarily due to a reduction in the outstanding amount of the junior subordinated notes, which had a 14.0% interest rate.
Income Tax Expense
Our effective income tax rate decreased from 39.7% in 2004 to 36.8% in 2005 primarily due to an increase in deferred tax assets as a result of an increase in the federal rate from 34% to 35% and the non-taxable nature of the litigation settlement.
Comparison of Years Ended December 31, 2004 and 2003
Sales. Sales were $172.7 million in 2004, an increase of $23.6 million, or 15.9%, compared to sales of $149.1 million in 2003. The increase was primarily due to the general increase in demand throughout the electrical distribution market, increased spending in the utility markets for new power generation projects and facility upgrades, increased MRO work and increased sales of our LifeGuard™ product.
Cost of Sales. Cost of sales was $131.4 million in 2004, an increase of $17.5 million, or 15.3%, compared to cost of sales of $114.0 million in 2003. The increase was primarily due to the increase in sales volume. The provision for inventory obsolescence increased by $0.5 million as a result of higher levels of older inventory, and freight costs increased by $0.4 million as a result of increased sales volume. These increases were offset by $1.0 million of additional discounts for prompt payment and vendor rebates due to higher sales volume and enhanced vendor rebate agreements.
Gross Profit. Gross profit increased $6.2 million, or 17.6%, to $41.3 million in 2004 from $35.1 million in 2003, due to increased sales. Gross margin increased slightly to 23.9% in 2004 compared to 23.6% for 2003. This increase was due primarily to enhanced product margins, higher discounts for prompt payment and larger vendor rebates, partially offset by higher inventory obsolescence charges and freight expenses.
Operating Expenses. Overall operating expenses decreased from $30.4 million in 2003 to $29.8 million in 2004. Excluding the recovery of the litigation settlement of $0.7 million in 2004, operating expenses would have remained relatively flat. Specific changes in the major components are discussed below.
Salaries and Commissions. Salaries and commissions increased $2.1 million, or 14.2%, to $16.7 million in 2004 from $14.6 million in 2003. This increase reflects a $0.6 million rise in salaries due to rate changes for existing employees, overtime and additional personnel and additional commission expense of $1.5 million as sales and gross profit increased. Salaries and commissions as a percentage of net sales decreased to 9.6% in 2004 from 9.8% in 2003 as sales increased at a faster rate than personnel additions and commission payments.
Other Operating Expenses. Other operating expenses decreased $1.5 million, or 10.6%, to $12.4 million in 2004 from $13.9 million in 2003. The decrease in other operating expenses is due primarily
to a reduction of $1.2 million in legal and professional fees, reflecting reduced litigation activity in 2004, and a $0.3 million decrease in other administrative, sales and warehouse expenses. Other operating expenses as a percentage of net sales decreased to 7.2% in 2004 from 9.3% in 2003, reflecting strict cost controls, the decrease in legal and professional fees and the increase in sales.
Management Fee. Management fee expenses were consistent at $0.5 million in 2004 and 2003.
Litigation Settlements. We realized a litigation settlement benefit of $0.7 million in 2004, compared to no litigation settlement benefit in 2003. The litigation settlement was received from two vendors against which we had filed suit.
Depreciation and Amortization. Depreciation and amortization expense was $0.9 million in 2004, a decrease of $0.6 million, or 40.9%, compared to $1.5 million in 2003. This decrease was primarily due to a $0.4 million decrease in the amortization of a non-compete agreement, which was fully amortized in the second quarter of 2004.
Interest Expense
Interest expense decreased $0.6 million, or 15.3%, to $3.5 million in 2004 from $4.2 million in 2003. This decrease reflects a reduction in our average debt outstanding, as our effective interest rates were flat from 2003 to 2004. Average debt decreased, as we used cash generated from operations to pay down debt.
Income Tax Expense
Our effective income tax rate decreased substantially from 57.7% in 2003 to 39.7% in 2004 primarily due to the substantially lower income before taxes in 2003 in relation to the level of state income taxes and non-deductible items.
Quarterly Results
The following table presents our unaudited quarterly results of operations for each of our last eightnine quarters ended DecemberMarch 31, 2005.2006. You should read the following table in conjunction with the consolidated financial statements and related notes contained elsewhere in this prospectus. We have prepared the unaudited information on the same basis as our audited consolidated financial statements. Results of operations for any quarter are not necessarily indicative of results for any future quarters or for a full year. HurricaneWe estimate that hurricane activities in the summer and fall of 2005 resulted in increased sales of approximately $5.0 to $6.0 million in the third and fourth quarters of 2005. We do not anticipate that hurricanes will have a similar impact during the same periods in 2006.
| | | Quarter Ended | | Quarter Ended | |||||||||||||||||||||||||||||||||||||||||||||||||||
|---|---|---|---|---|---|---|---|---|---|---|---|---|---|---|---|---|---|---|---|---|---|---|---|---|---|---|---|---|---|---|---|---|---|---|---|---|---|---|---|---|---|---|---|---|---|---|---|---|---|---|---|---|---|---|---|
| | | March 31, 2004 | June 30, 2004 | September 30, 2004 | December 31, 2004 | March 31, 2005 | June 30, 2005 | September 30, 2005 | December 31, 2005 | | March 31, 2004 | June 30, 2004 | September 30, 2004 | December 31, 2004 | March 31, 2005 | June 30, 2005 | September 30, 2005 | December 31, 2005 | March 31, 2006 | ||||||||||||||||||||||||||||||||||||
| | | (In thousands) | | (In thousands) | |||||||||||||||||||||||||||||||||||||||||||||||||||
| CONSOLIDATED STATEMENT OF INCOME: | CONSOLIDATED STATEMENT OF INCOME: | CONSOLIDATED STATEMENT OF INCOME: | |||||||||||||||||||||||||||||||||||||||||||||||||||||
| Sales | Sales | $ | 42,708 | $ | 41,825 | $ | 44,515 | $ | 43,675 | $ | 43,106 | $ | 46,652 | $ | 58,321 | $ | 65,878 | Sales | $ | 42,708 | $ | 41,825 | $ | 44,515 | $ | 43,675 | $ | 43,106 | $ | 46,652 | $ | 58,321 | $ | 65,878 | $ | 66,428 | |||||||||||||||||||
| Cost of sales | Cost of sales | 32,673 | 31,668 | 33,404 | 33,674 | 31,949 | 34,599 | 43,185 | 48,507 | Cost of sales | 32,673 | 31,668 | 33,404 | 33,674 | 31,949 | 34,599 | 43,185 | 48,507 | 48,437 | ||||||||||||||||||||||||||||||||||||
| Gross profit | Gross profit | 10,035 | 10,157 | 11,111 | 10,001 | 11,157 | 12,053 | 15,136 | 17,371 | Gross profit | 10,035 | 10,157 | 11,111 | 10,001 | 11,157 | 12,053 | 15,136 | 17,371 | 17,991 | ||||||||||||||||||||||||||||||||||||
| Operating expenses: | Operating expenses: | Operating expenses: | |||||||||||||||||||||||||||||||||||||||||||||||||||||
| Salaries and commissions | 3,996 | 3,960 | 4,171 | 4,538 | 4,289 | 4,413 | 4,761 | 5,244 | Salaries and commissions | 3,996 | 3,960 | 4,171 | 4,538 | 4,289 | 4,413 | 4,761 | 5,244 | 5,072 | |||||||||||||||||||||||||||||||||||||
| Other operating expenses | 3,262 | 3,385 | 3,120 | 2,625 | 3,408 | 3,133 | 3,250 | 4,225 | Other operating expenses | 3,262 | 3,385 | 3,120 | 2,625 | 3,408 | 3,133 | 3,250 | 4,225 | 3,748 | |||||||||||||||||||||||||||||||||||||
| Management fee | 125 | 125 | 126 | 125 | 125 | 125 | 125 | 125 | Management fee | 125 | 125 | 126 | 125 | 125 | 125 | 125 | 125 | 125 | |||||||||||||||||||||||||||||||||||||
| Litigation settlements | (450 | ) | (200 | ) | — | — | (672 | ) | — | — | — | Litigation settlements | (450 | ) | (200 | ) | — | — | (672 | ) | — | — | — | — | |||||||||||||||||||||||||||||||
| Depreciation and amortization | 357 | 294 | 169 | 56 | 110 | 111 | 111 | 66 | Depreciation and amortization | 357 | 294 | 169 | 56 | 110 | 111 | 111 | 66 | 93 | |||||||||||||||||||||||||||||||||||||
| Total operating expenses | 7,290 | 7,564 | 7,586 | 7,344 | 7,260 | 7,782 | 8,247 | 9,660 | Total operating expenses | 7,290 | 7,564 | 7,586 | 7,344 | 7,260 | 7,782 | 8,247 | 9,660 | 9,038 | |||||||||||||||||||||||||||||||||||||
| Operating income | Operating income | 2,745 | 2,593 | 3,525 | 2,657 | 3,897 | 4,271 | 6,889 | 7,711 | Operating income | 2,745 | 2,593 | 3,525 | 2,657 | 3,897 | 4,271 | 6,889 | 7,711 | 8,953 | ||||||||||||||||||||||||||||||||||||
| Interest expense | Interest expense | 919 | 864 | 866 | 895 | 713 | 724 | 708 | 810 | Interest expense | 919 | 864 | 866 | 895 | 713 | 724 | 708 | 810 | 1,054 | ||||||||||||||||||||||||||||||||||||
| Income before income taxes | Income before income taxes | 1,826 | 1,729 | 2,659 | 1,762 | 3,184 | 3,547 | 6,181 | 6,901 | Income before income taxes | 1,826 | 1,729 | 2,659 | 1,762 | 3,184 | 3,547 | 6,181 | 6,901 | 7,899 | ||||||||||||||||||||||||||||||||||||
| Income tax provision | Income tax provision | 717 | 697 | 1,034 | 719 | 1,173 | 1,307 | 2,277 | 2,542 | Income tax provision | 717 | 697 | 1,034 | 719 | 1,173 | 1,307 | 2,277 | 2,542 | 3,097 | ||||||||||||||||||||||||||||||||||||
| Net income | Net income | $ | 1,109 | $ | 1,032 | $ | 1,625 | $ | 1,043 | $ | 2,011 | $ | 2,240 | $ | 3,904 | $ | 4,359 | Net income | $ | 1,109 | $ | 1,032 | $ | 1,625 | $ | 1,043 | $ | 2,011 | $ | 2,240 | $ | 3,904 | $ | 4,359 | $ | 4,802 | |||||||||||||||||||
Impact of Inflation and Commodity Prices
Our results of operations are affected by changes in the inflation rate and commodity prices. Moreover, because copper and petrochemical products are components of the wire and cable we sell, fluctuations in the costs of these and other commodities have historically affected our operating results. To the extent we are unable to pass on to our customers cost increases due to inflation or rising commodity prices, it could adversely affect our operating results.
Liquidity and Capital Resources
Our primary capital needs are for working capital obligations and other general corporate purposes, including acquisitions and capital expenditures. Our primary sources of working capital are cash from operations supplemented by bank borrowings. We have funded our capital expenditures through cash from operations. Our working capital amounted to $52.4 million at March 31, 2006, compared to working capital of $51.4 million at December 31, 2005, compared toand working capital of $44.9 million at December 31, 2004.
Working capital increased in 2005 primarily due to (i) higher accounts receivable, which increased $14.2 million over 2004 as a result of improved sales, and (ii) greater inventory, which increased $1.5 million over 2004 as a result of demand for more product. These increases were offset by (i) higher accounts payable, which increased $3.2 million over 2004 as a result of our increased purchases, (ii) an increase in taxes payable, which increased $0.8 million due to increased profitability and (iii) an increase in current debt as a result of $3.5 million of term debt that became due.
Liquidity is defined as the ability to generate adequate amounts of cash to meet the current need for cash. We assess our liquidity in terms of our ability to generate cash to fund our operating activities. Significant factors which could affect liquidity include the following:
Comparison of Quarters Ended March 31, 2006 and 2005
Our net cash provided by operations for the three months ended March 31, 2006, was $4.0 million compared to $5.0 million in the prior comparable period. As sales of product increased significantly in 2006 versus 2005, our cash flow demands moved in several areas. Cash from net income increased from $2.0 million in the first quarter of 2005 to $4.8 million in the first quarter of 2006, but this was offset by an increase in inventory investment of $7.8 million during the 2006 period as sales increased and product costs increased. Accounts receivable decreased by $1.0 million. Offsetting these were increases in accounts payable and accrued liabilities of $3.2 million and taxes payable of $1.2 million.
Net cash used in investing activities was $0.1 million in both periods. The demand for additional capital resources to accommodate our operations remains low.
Net cash used in financing activities was $3.9 million in the first quarter of 2006, compared to $4.9 million in the comparable 2005 period. This change was primarily due to the decrease in the level of pay downs on our revolving debt facility and scheduled principal payments of $0.6 million on our Term A and Term B loans.
Comparison of Years Ended December 31, 2005 and 2004
Our net cash used by operating activities was $3.8 million for 2005 compared to net cash provided of $12.0 million for 2004. The cash used in operations in 2005 was primarily due to the decrease in the book overdraft of $5.9 million, an increase in accounts receivable of $14.3 million and an increase in inventory of $1.3 million. This was offset in 2005 by net income of $12.5 million and increases in accounts payable and income taxes payable of $3.2 million and $0.8 million, respectively. These changes were primarily due to the increase in sales in 2005 over 2004 levels. Depreciation and amortization decreased by $0.5 million, including a decrease of $0.3 million due to the absence in 2005 of a charge for a non-compete agreement that was fully amortized in 2004.
Net cash used in investing activities for 2005 was $0.3 million compared to $0.2 million for 2004. The investing activities were for capital expenditures, which have remained relatively constant over the past three years.
Net cash provided by financing activities for 2005 was $4.1 million compared to net cash used of $11.8 million for 2004. The difference was primarily due to the borrowing of additional funds in 2005 to finance a $20.0 million special dividend payment, while in 2004, we repaid $14.0 million of our junior subordinated promissory notes.
Comparison of Years Ended December 31, 2004 and 2003
Our net cash provided by operating activities remained relatively constant at $12.0 million from 2003 to 2004, even though operating income improved by $6.8 million, from $4.7 million in 2003 to $11.5 million in 2004, reflecting our revenue growth and improved operating expense margins. Additional cash was needed to fund accounts receivable and inventory, up $6.2 million and $3.6 million, respectively, in 2004 from 2003, due to the increased sales volume. The additional cash requirements in 2004 were funded by an increase in book overdraft of $7.9 million, an increase in trade accounts payable of $1.7 million and an increase in accrued and other current liabilities of $2.8 million. Depreciation and amortization decreased $0.6 million to $0.9 million in 2004 from $1.5 million in 2003. Most of this decrease can be attributed to the reduction of the amortization of the non-compete agreement from $0.8 million in 2003 to $0.3 million in 2004 which became fully amortized in the second quarter of 2004.
Net cash used in investing activities for 2004 was $0.2 million compared to $0.3 million for 2003.
Net cash used in financing activities for 2004 was $11.8 million compared to $12.0 million for 2003. In 2004 we made repayments on our junior subordinated promissory notes of $14.0 million and had net borrowings of $2.1 million, while in 2003 we made net payments on our revolving loan of $8.0 million and repaid a Term A loan of $3.8 million.
Indebtedness
Our principal source of liquidity at DecemberMarch 31, 20052006 was working capital of $51.4$52.4 million compared to $44.9$51.4 million at December 31, 2004.2005. We also had available borrowing capacity in the amount of $11.1 million at March 31, 2006 and $1.5 million at December 31, 2005 and $11.1 million at December 31, 2004 under our loan and security agreement with Bank of America and another syndication lender. Upon the completion of this offering, we will repay approximately $$49.9 million of our outstanding debt, providing us with $$51.6 million of available commitment under our exitingexisting revolving credit facility.facility, based on amounts outstanding as of March 31, 2006.
We believe that, following the repayment of debt after our offering, we will have adequate availability of capital to fund our present operations, meet our commitments on our existing debt, and fund anticipated growth over the next twelve months, including expansion in existing and targeted market areas. We continually seek potential acquisitions and from time to time hold discussions with acquisition candidates. If suitable acquisition opportunities or working capital needs arise that would require additional financing, we believe that our financial position and earnings history provide a solid base for obtaining additional financing
resources at competitive rates and terms. Additionally, we may issue additional shares of common or preferred stock to raise funds.
Loan and Security Agreement
We have a loan and security agreement with Bank of America and another lender. The lenders have a security interest in all of our assets, including accounts receivable and inventory. The agreement consists of:
The agreement matures on May 1, 2007. We expect to be able to refinance our loan agreement at that time.
Portions of the outstanding loans may be converted to LIBOR loans in minimum amounts ranging between $100,000 to $1 million and integral multiples of $100,000. Upon such conversion, interest is payable at LIBOR plus 1.75% for the revolving and the Term A loans and at LIBOR plus 2.75% for the Term B loan. We have entered into a series of one-month LIBOR loans, which, upon maturity, are either rolled back into the revolving loan or renewed under a new LIBOR contract.
Covenants in the loan agreement require us to maintain certain minimum financial ratios, restrict our ability to pay dividends and make capital expenditures and require us to use 75% of our excess cash flow to reduce outstanding borrowings. Additionally, we are obligated to pay an unused facility fee on the unused portion of the loan commitment. As of DecemberMarch 31, 2005,2006, we were in compliance with all financial covenants and paid approximately $69,000 for the unused facility for the year ended December 31, 2005.
Junior Subordinated Promissory Notes
In 1997, we issued approximately $9.0 million of junior subordinated promissory notes, which bore interest at a rate of 14.0% per annum. On May 22 of each year, accrued interest was rolled into the principal amount of the notes. The principal amount of the notes, together with all unpaid accrued interest, was due and payable on May 22, 2007. On May 13, 2004 and December 30, 2004, we made equal payments of $7.0 million to reduce the borrowings under the notes. On June 1, 2005, we paid an additional $6.0 million to reduce the borrowings, and we paid the remaining balance of all principal and interest due of $4.3 million on November 10, 2005.
Contractual Obligations
The following table describes our cash commitments to settle contractual obligations as of December 31, 2005.
| | | Total | Less than 1 year | 1-3 years | 3-5 years | More than 5 years | | Total | Less than 1 year | 1-3 years | 3-5 years | More than 5 years | ||||||||||||||||||||
|---|---|---|---|---|---|---|---|---|---|---|---|---|---|---|---|---|---|---|---|---|---|---|---|---|---|---|---|---|---|---|---|---|
| | | (In thousands) | | (In thousands) | ||||||||||||||||||||||||||||
| Term loans and loans payable | Term loans and loans payable | $ | 61,406 | $ | 3,468 | $ | 57,938 | — | — | Term loans and loans payable | $ | 61,406 | $ | 3,468 | $ | 57,938 | $ | — | $ | — | ||||||||||||
| Operating lease obligations | Operating lease obligations | 10,410 | 1,759 | 3,338 | $ | 2,704 | $ | 2,609 | Operating lease obligations | 10,410 | 1,759 | 3,338 | 2,704 | 2,609 | ||||||||||||||||||
| Non-cancellable purchase obligations(1) | Non-cancellable purchase obligations(1) | 31,686 | 31,686 | — | — | — | Non-cancellable purchase obligations(1) | 31,686 | 31,686 | — | — | — | ||||||||||||||||||||
| Total | $ | 103,502 | $ | 36,913 | $ | 61,276 | $ | 2,704 | $ | 2,609 | Total | $ | 103,502 | $ | 36,913 | $ | 61,276 | $ | 2,704 | $ | 2,609 | |||||||||||
Capital Expenditures
We have made capital expenditures of $0.1 million in the three months ended March 31, 2006 and $0.3 million, $0.2 million and $0.3 million in the years ended December 31, 2005, 2004 and 2003, respectively.
Off-Balance Sheet Arrangements
We have no off-balance sheet arrangements.
Financial Derivatives
We have no financial derivatives.
Market Risk Management
We are exposed to market risks arising from changes in market prices, including movements in interest rates and commodity prices.
Interest Rate Risk
Our variable interest rate debt is sensitive to changes in the general level of interest rates. At DecemberMarch 31, 2005,2006, the weighted average interest rate on our $61.4$57.7 million of variable interest debt was approximately 7.2%6.8%.
While our variable rate debt obligations expose us to the risk of rising interest rates, management does not believe that the potential exposure is material to our overall financial performance or results of operations. Based on DecemberMarch 31, 20052006 borrowing levels, a 1.0% increase or decrease in current market interest rates would have a $0.6 million effect on our statements of operations.operations over a twelve-month period.
Foreign Currency Exchange Rate Risk
Our product is all invoiced in U.S. dollars. Accordingly, we do not believe we are exposed to foreign exchange rate risk.
Overview
We are one of the largest distributors of specialty wire and cable and related services to the U.S. electrical distribution market. During 2005, we served approximately 2,600 customers, including each of the top 200 electrical distributors in the U.S. We have strong relationships with leading wire and cable manufacturers and provide them with efficient access to the fragmented electrical distribution market. During 2005, we distributed approximately 20,000 SKUs (stock-keeping units) to over 8,300 customer locations nationwide from eleven strategically located distribution centers in ten states. We are focused on providing our electrical distributor customers with a single-source solution for specialty wire and cable by offering a large selection of in-stock items, exceptional customer service and high levels of product expertise.
We offer products in most categories of specialty wire and cable, including: continuous and interlocked armor cable; control and power cable; electronic wire and cable; flexible and portable cords; instrumentation and thermocouple cable; lead and high temperature cable; medium voltage cable; and premise and category wire and cable. We also offer private branded products, including our LifeGuard™ low-smoke, zero-halogen cable. Our specialty wire and cable is primarily used in maintenance, repair and operations ("MRO") related projects and is increasingly purchased for larger-scale projects in the utility, industrial and infrastructure markets. Our specialty wire and cable is used within a diverse range of industries, including the communications, energy, engineering and construction, general manufacturing, infrastructure, petrochemical, transportation, utility and wastewater treatment industries.
Our value-added services include:
Our wide product selection and specialized services support our position in the supply chain between wire and cable manufacturers and electrical distributors and their customers. Offering the breadth and depth of specialty wire and cable that we do requires significant warehousing resources and a large number of SKUs. An electrical distributor, however, typically sells a wide variety of electrical products ranging from lighting to MRO supplies, and only a small percentage of these items representrepresents specialty wire and cable. In addition, given their bulk and weight, specialty wire and cable require a disproportionately high percentage of warehouse space and materials handling capabilities compared to the sales volume they generate for an electrical distributor. Instead of dedicating larger amounts of warehouse and other resources to specialty wire and cable, our distributor customers rely on us to supply much of their specialty wire and cable. At the other end of the supply chain, while manufacturers may have the space and capabilities to maintain a large supply of inventory, we do not believe that any single manufacturer has the breadth of product that we offer. More importantly, manufacturers historically have not offered the services that our customers need, such as complementarycomplimentary custom cutting and same day shipment, and do not have multiple distribution locations across the nation. As a result, we believe that we serve an important role in the supply chain for specialty wire and cable and that it would be uneconomical for manufacturers or electrical distributors to compete with us, given our nationwide product and service capabilities.
We were founded in 1975 and have a long history of reliable customer service, broad product selection and strong product expertise. In 1987, we completed an initial public offering and were subsequently purchased in 1989 by ALLTEL Corporation. In 1997, we were purchased by investment funds affiliated with Code, Hennessy & Simmons. During our 31 year history, we have successfully expanded our business from one original location in Houston, Texas to eleven strategic locations nationwide.
In 2000, we acquired our largest direct competitor, the Futronix division of Kent Electronics Corporation. In 2003, we implemented a new sales and marketing strategy to expand our sales force, to introduce new private branded products and to work in concert with our distributor customers to generate demand from end-users in our targeted markets, including the utility, industrial and infrastructure markets. As part of this initiative, we are partnering with our distributor customers and strengthening our relationships with project and specifying engineers to generate demand for our specialty wire and cable. For example, in the utility markets, we seek to capitalize on increased spending on new power generation assets and environmental compliance initiatives. In addition, in the engineering and construction market we work with specifying engineers to drive specialty wire and cable specifications in large capital projects and market our cable management program as a tool to manage wire and cable at those projects.
Based on the new sales and marketing strategy that we implemented in 2003, we have achieved strong financial and operating growth. Our revenue has increased from $149.1 million in 2003 to $214.0 million in 2005, a compound annual growth rate (CAGR) of 19.8%. During the same period, our operating income increased from $4.7 million to $22.8 million, a CAGR of 120.0%. We have improved operating leverage in our business, with operating expenses as a percentage of sales decreasing from 20.4% in 2003 to 15.4% in 2005.2005 and 13.6% for the quarter ended March 31, 2006. In 2004, our employees outperformed industry averages, as reported by the National Association of Electrical Distributors ("NAED"), with sales per employee of $647,000$645,000 compared to the industry average of $378,000. We believe our success is tied, in part, to our high levels of customer satisfaction, service and retention. A customer survey conducted in 2003 showed our customer satisfaction rating to be 94.0%. In 2005, we achieved on-time shipment rates and order accuracy of 99.9%. We intend to continue to leverage our strengths to pursue our strategic growth initiatives.
Industry Overview
We operate within the U.S. electrical distribution market, whichElectrical Wholesaling Magazine magazine estimates had industry-wide sales of $74.3 billion in 2005 and will grow 7.9% to $80.2 billion in 2006. Electrical distribution has historically been a growing segment of the industrial distribution industry, with a CAGR of 5.1% over the last 20 years.
Within the electrical distribution industry, our business focuses on specialty wire and cable. According to the U.S. Census Bureau, the total value of manufacturers' shipments of specialty wire and cable totaled approximately $7.0 billion in 2004. The specialty wire and cable we sell generally consists of continuous and interlocked armor cable; control and power cable; electronic wire and cable; flexible and portable cords; instrumentation and thermocouple cable; lead and high temperature cable; medium voltage cable; and premise and category wire and cable. These products are often highly engineered and require sophisticated knowledge to insure proper application. Examples of primary end-markets for specialty wire and cable include the communications, energy, engineering and construction, general manufacturing, infrastructure, petrochemical, transportation, utility and wastewater treatment industries.
The sales channel for specialty wire and cable depends on a number of factors, including order type, product selection, service level expectations, inventory management and delivery requirements. The greater the need for customization and high service levels (represented by the right side of the following diagram), the more likely the transaction will involve a specialty wire and cable distributor such as us.
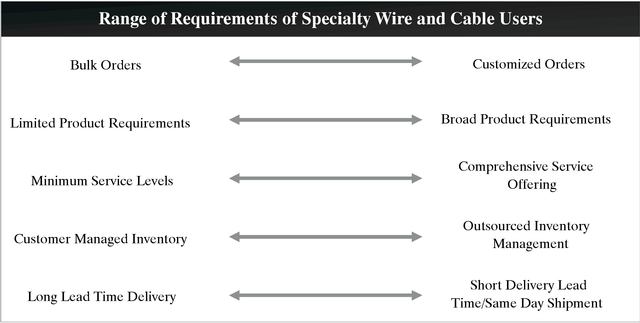
In certain circumstances, manufacturers of specialty wire and cable sell their products directly to the end-user. These transactions typically consist of a bulk volume of wire and cable, involve little or no customized services and may require long lead times between order and delivery. An example of this type of transaction would be the purchase of full reels of cable with manufacturing lead times ranging from 8 to 16 weeks after receipt of the order. More frequently, an electrical distributor serves as the sales channel directly between the manufacturer and the contractor or end-user. The typical sale by an electrical distributor may involve a commonly purchased item that is specifically designated by the end-user and shipped from stock along with a variety of other electrical products. It is generally most economical for electrical distributors to carry in their inventories only those wire and cable SKUs that are commonly ordered and do not require high levels of specialized knowledge or services.
For customers requiring highly specialized wire and cable, custom cut lengths, technical expertise, short lead times or additional services, electrical distributors will generally source products from a specialty wire and cable distributor. We believe that the increasing complexity of specialty wire and cable specifications and the growing need for just-in-time delivery and logistics support will drive further growth in purchases through specialty wire and cable distributors.
Because sales of specialty wire and cable typically represent a relatively small portion of the revenue generated by our electrical distribution customers, our customers often rely on us to make the investments needed to support their specialty wire and cable sales. Given the bulk and weight of specialty wire and cable, stocking a comprehensive offering of specialty wire and cable to meet diverse product demand requires a disproportionately high percentage of warehouse space and materials handling capabilities for our customers, compared to the sales volume that they generate from these products. Electrical distributors typically do not have a high enough demand for specialty wire and cable to turn inventory cost-effectively. Instead of dedicating a larger amount of warehouse space to inventory and making the investments in employee training, same day shipment capabilities for specialty wire and cable, end-user support, and information technology needed to maintain industry leading levels of service, our electrical distribution customers rely on us to play this important role in the supply chain and to be a single source solution.
Targeted Markets
Our business is driven, in part, by the strength, growth prospects and activity in the end-markets in which our products are used. We have targeted three of these markets—the utility, industrial and infrastructure markets—in our recent sales and marketing initiatives.
Utility Market. The utility market includes large investor-owned utilities, rural cooperatives and municipal power authorities. While we do not distribute the power lines used for the transmission of electricity, we sell many products used in a power plant and in the related pollution control equipment. As such we are positioned to benefit from expenditures for new power generation needed to satisfy a growing population with increasing energy demands and to comply with federal mandates to reduce toxic outputs from power generating facilities. We expect to benefit from this trend as our customers utilize our cable management services to support the distribution of specialty wire and cable required for the construction of new power plants and upgrading of existing power plants. For example, large coal-fired utility plants across the U.S. may be retrofitted with flue gas desulphurization systems (commonly referred to as scrubbers) to comply with pollution-control initiatives. This type of project requires the specialty instrumentation, power and control products that we distribute.
Industrial Market. The industrial market is one of the largest segments of the U.S. economy, comprised of a diverse base of manufacturing and production companies. We help our electrical distributor customers provide specialty wire and cable to industrial companies with large, complex plant maintenance, repair and operations requirements and for new capital projects. We offer specialty wire and cable that is specifically designed for a variety of industrial applications, and we are benefiting from accelerated capital spending due to economic expansion and a catch-up of deferred maintenance. For example, in petrochemical and other harsh-environment operations, we distribute specialty cables specifically designed to endure exposure to caustic materials or extreme temperatures.
Infrastructure Market. We believe that significant infrastructure improvements and additions will be needed over the next several years. For example, the Congressional Budget Office ("CBO") anticipates an increase in spending over the next two decades in the U.S. for drinking water systems and wastewater infrastructure and estimates that, for the years 2000 to 2019, annual costs for investment will average between $25.0$24.6 billion and $41.0 billion. We expect to benefit from this trend given that the specialty wire and cable we distribute are used in the construction of wastewater treatment facilities. According to a September 2004 Industrial Information Resources report, engineering and construction firms were awarded more than 1,350 active capital projects in the U.S. with a total investment value representing approximately $221 billion. We are assisting our customers to further penetrate the engineering and construction market by working with application engineers to drive specialty wire and cable specifications in large construction projects.
LifeGuard™ Market Opportunity
We believe that the market for low-smoke, zero-halogen products is in its infancy in the U.S. and represents a significant market opportunity across our targeted markets. Low-smoke, zero-halogen cables have been used extensively in Europe and Asia for many years. We led the development and marketing of low-smoke, zero-halogen cable in the U.S., and since its introduction in 2003, our LifeGuard™ line of cable has shown strong early signs of acceptance. In addition to other threats, when traditional cable burns, the acid gases produced are particularly destructive to electronic equipment, which represents a significant investment for many businesses. In contrast, low-smoke, zero-halogen compounds provide significant flame resistance, minimal smoke production and substantially reduced toxicity and corrosiveness when burned, as compared to traditional wire and cable.
Our LifeGuard™ cable has been accepted for use by over 300 end-users, including leading engineering and construction firms, and is increasingly included in specifications for utility, data center and industrial related projects. LifeGuard™ can be used in harsh environments for power, control and lighting circuits in a broad range of commercial, industrial and utility applications. We are currently marketing LifeGuard™ to the utility industry for use in power generation and co-generation; to industrial plants for petrochemical, pharmaceutical and wastewater treatment related uses; to general industry for use in data centers, such as computer rooms, switching centers and central offices; and to the engineering and construction market for use in highly populated facilities such as multi-story buildings, schools, hotels, hospitals, sports centers, airports and mass transit stations.
Competitive Strengths
We are a nationally recognized, full-service distributor of specialty wire and cable and related services. Through eleven strategic locations across the United States and over 450,000 square feet of warehouse space, we provide same-day shipment to a broad customer base including, among others, Border States Electric Supply, Consolidated Electrical Distributors, Inc., GE Supply Company, Graybar Electric Company, Inc., Hughes Supply, Inc., Mayer Electric Supply Company Inc., Rexel, Inc., The Reynolds Company, Sonepar USA and WESCO Distribution, Inc. We operate in a highly fragmented market, and we believe that the following competitive strengths have helped us achieve our leading position in the market and a strong reputation among manufacturers and customers.
Comprehensive Value-Added Services and Product Expertise
Our business model focuses on providing our customers with comprehensive value-added services and high levels of expertise across a broad range of our suppliers' products. Our services are designed to provide maximum efficiency and flexibility for our customers and include extensive product knowledge and application engineering support, inventory management, custom cut capabilities and 24/7/365 customer service. We help our customers achieve efficient and effective procurement of specialty wire and cable on terms that typically include short lead times and the ability to ship a high percentage of the products ordered within 24 hours. Critical to our success is our application engineering support, in which our knowledgeable sales people help customers match products based on intended use, cost and performance specifications. We have developed the expertise, infrastructure and relationships to provide extensive customer service that we believe would be costly to build and support without the scale we have achieved.
Strength and Tenure of Specialized Sales Force
We have invested in developing a sales force of highly knowledgeable professionals with considerable industry expertise. As of December 31, 2005,May 1, 2006, our sales force consisted of 40 field sales personnel and 8482 inside sales and technical support personnel. The size of our field sales force has increased significantly since 2003. We have an experienced sales force that is aligned according to targeted industries, geography and select customer relationships. Our sales personnel receive ongoing, comprehensive training about innovations in specialty wire and cable as well as changes affecting our targeted markets. We use a consultative selling approach that leverages our extensive product expertise and knowledge of our customers' needs in the markets in which the products are used. Our sales effort is designed to augment the sales efforts of manufacturers as well as those of our distributor customers. We believe that our sales approach results in increased demand for the products we distribute and maximizes our reputation as a highly knowledgeable source of specialty wire and cable information.
First-Mover Advantage with LifeGuard™ Cable
We believe we have established a first-mover advantage in the U.S. with our LifeGuard™ line of low-smoke, zero-halogen cable products. We led the development and marketing of low-smoke, zero-halogen cable in the U.S., and since its introduction in 2003, our LifeGuard™ line of cable has shown strong early signs of acceptance. We believe our LifeGuard line of cable has the potential to become the industry standard in the U.S. for low-smoke, zero-halogen cable needs. Our LifeGuard™ line of cable has been accepted for use by over 300 end-users, including leading engineering and construction firms, and is increasingly included in specifications for utility, data center and industrial related projects. We have identified a substantial potential market for these products and believe that our early entrance into the market provides us with a significant competitive advantage.
Operating Leverage
Our ability to offer a high level of customer service is due in part to our highly efficient and effective operations that leverage centralized back-office administration and purchasing, a scalable information technology platform, automated warehouse operations and electronic product tracking. The products we carry are bar-coded with exact product specifications and length and tracked on a real-time basis in our system, which allows us to cost-effectively route orders to our warehouses across the country based on delivery distance, availability and quantity of product. Our process minimizes waste by targeting specific locations and reels for optimal custom cut orders. Efficient purchasing and management of our products have helped us increase our average inventory turns from 3.18 in 2001 to 4.63 in 2005 and improved our gross margin during the same period from 22.8% to 26.0%. In addition, by leveraging our national infrastructure and implementing back-office initiatives, we have decreased our operating expenses as a percentage of revenue from 18.0% in 2001 to 15.4% in 2005.2005 and 13.6% for the quarter ended March 31, 2006. Notably, we achieved much of this improvement during a period of general economic slowdown from 2001 to 2003. Based on data for 2004 reflected in the 2005 Performance Analysis Report (PAR) published by the NAED, we compare favorably to the electrical distribution industry averages across several metrics, including average sales per employee of $647,000$645,000 versus $378,000 for the industry.
Extensive Product Offering and Strong Supplier Relationships
In 2005, we sold over 20,000 SKUs, representing a broad and deep selection of high-quality specialty wire and cable. Our products include national brands of continuous and interlocked armor cable; control and power cable; electronic wire and cable; flexible and portable cords; instrumentation and thermocouple cable; lead and high temperature cable; medium voltage cable; and premise and category wire and cable. We also offer several products under our private brands, including our LifeGuard™ line of low-smoke, zero-halogen cable. Our strategy is to maintain a wide breadth and depth of inventory, allowing us to ship a high percentage of the products ordered within 24 hours. We believe that our vast product offering and value-added services are significant factors in attracting and retaining many of our customers. In addition, we have strong, often decades-long, relationships with large wire and cable manufacturers such as Belden CDT, General Cable Corp., Nexans, Service Wire Company and Southwire Company. Because of our national scale, market leadership position and specialized services, we believe we provide an important function in the supply chain and are critical to our suppliers' sales efforts. We also believe that our strategic decision to concentrate our purchases with our top suppliers allows us to solidify our relationships with these vendors while optimizing our vendor rebates.
Strong and Diversified Customer Base
During 2005, we served approximately 2,600 customers, including eachvirtually all of the top 200 electrical distributors in the U.S. We have experienced exceptional customer retention, and we believe that we are the primary supplier of specialty wire and cable to a majority of our customers. Each of our top ten customers in 2005 (or their predecessors) has purchased products from us every year over the last decade. Our direct customers are electrical distributors, and our products are used within a diverse range of industries including, the communications, energy, engineering and construction, general manufacturing, infrastructure, petrochemical, transportation, utility and wastewater treatment industries. We believe that the strength of our broad customer relationships provides us with a significant competitive advantage.
Experienced Management Team
Our highly experienced team of executive officers and key management has an average tenure with us of over 13 years. This continuity strengthens our relationships with our customers and suppliers and enables us to provide our customers with a high level of product and industry expertise. Our management team is led by our President and Chief Executive Officer, Charles Sorrentino, who joined us in 1998. Working with Mr. Sorrentino is a team of industry veterans who have been instrumental to our strong growth and success to
date and will enable us to leverage our competitive strengths and pursue further strategic growth opportunities. Following this offering, assuming exercise in full of the underwriters' over-allotment option, our management team will own %8.9% of our outstanding shares and will hold options to purchase 165,376 additional shares.
Growth Strategies
Since implementing our new sales and marketing strategy in 2003, our revenue has increased from $149.1 million in 2003 to $214.0 million in 2005, and our operating income has increased from $4.7 million to $22.8 million. We intend to continue to leverage our competitive strengths and pursue select strategic initiatives to drive growth in revenue and profit.
Generate Demand from Targeted Markets
During 2003, we realigned our sales efforts to work in concert with our distributor customers to generate demand directly from end-users in our targeted markets, including the utility, industrial and infrastructure markets. We believe that our sales and marketing programs and product application expertise can help our distributor customers drive demand from their customers. In select target markets, we are assisting our customers in forming relationships with project and specifying engineers to create demand for our specialty wire and cable. For example, in the utility market, we are positioned to capitalize on the increased spending on new power generation assets and environmental compliance initiatives. Additionally, we are marketing our cable management program to the engineering and construction market as a tool to manage supplies at large capital projects. We also believe that many of these new relationships have been awarded to us based on the range of value added services that we are able to provide. We believe that our ability to help generate demand and manage the logistics of delivering our specialty wire and cable increases the value we bring to our customers and suppliers alike. We believe that the relationships we have developed with specifying engineers enhance our role in the sales and marketing process and establishedestablish a platform to accelerate sales of our private branded products through our distribution channels.
Expand Our Sales Force
As part of our ongoing strategy to penetrate new markets, we expect to continue to expand our sales force and further focus our sales and marketing efforts on supporting our distributor customers in our targeted markets. We typically hire experienced personnel for our sales force, and since 2003 we have significantly increased the number of our field sales personnel. Based on industry data from the NAED's PAR Report, our sales personnel outperformed industry averages in 2004 with average sales per sales employee of $1.5 million versus $836,000 for the industry. We believe we are in the early stages of penetrating additional sales channel opportunities in targeted markets and will continue to add specialized sales personnel to generate demand for our products.
Increase Sales of Private Branded Products
Beginning in 2003, we spearheaded the development and marketing of select private branded products, including LifeGuard™, a low-smoke, zero-halogen line of cable; Houwire®, a low-cost sound and security wire; and DataGuard™, a high-end electronic cable product line. Low-smoke, zero-halogen cables have been used extensively in Europe and Asia for many years. While we are still in the early stages of selling these product lines, we believe the possible markets for these products are significant. Since its introduction in 2003, our LifeGuard™ line of cable has shown strong early signs of acceptance and has been accepted for use by over 300 end-users, including leading engineering and construction firms, and is increasingly included in specifications for utility, data center and industrial related projects.
Focus on Efficient Operations and Cost Control
We seek ways to reduce costs, increase efficiency and ultimately enhance our ability to serve our customers. For example, we continuously measure our performance and implement best practices across our organization to improve our operations. We tie a portion of our manager compensation to profitable growth. In addition, we have invested in highly flexible and scalable information systems, which have been instrumental to the efficient integration of our sales, distribution and logistics capabilities. Improvements in our inventory management have created capacity in our warehouses that can be used to support our continued growth. We believe that our dedicated focus on efficient operations and scalable technology will help us drive productivity improvements and cost savings in the future.
Selectively Pursue Acquisition Opportunities
Our senior management team has experience in identifying and integrating acquisition targets. In 2000, we acquired our largest direct competitor, Futronix, from Kent Electronics. Following the acquisition we successfully integrated operations, including the elimination of seven of the Futronix warehouses. While we are not dependent on acquisitions to achieve our growth plan, we will selectively pursue acquisitions that leverage our established infrastructure and allow us to strategically address select target markets, grow our product and service offering, expand geographically and leverage our efficient distribution and operations platform. Given the fragmented nature of our industry, we believe that we will have compelling acquisition opportunities in the future.
Products
Through our relationships with many of the large wire and cable manufacturers, we have access to a full spectrum of specialty wire and cable, allowing us to consistently meet the needs of our customers. Our focus is on specialty wire and cable that is engineered for specific usage and supplies critical power and data to end-users across diverse markets. We custom cut our wire and cable to exact specifications so that they can be installed as soon as they arrive at the destination. Our product strategy is to carry an extensive array of specialty wire and cable to meet the diverse, dynamic and time-sensitive needs of our customers. In addition, our infrastructure is designed to respond to short lead times with high levels of product availability and same day shipment.
Product Categories. We distribute a wide array of wire and cable types for a host of applications, including:
for energizing mobile mining equipment, diesel electric locomotives, lifting magnets, cranes and loaders, as well as for portable power distribution for tools, equipment, small motors and machinery.
Our Private Branded Products. We also sell our own private branded products, LifeGuard™, DataGuard™ and Houwire®, across many of the product categories identified above.
applications in both industrial plants and commercial facilities. These competitively priced items have helped to position us for additional penetration into the broad and expanding sound and security market.
Services
In addition to the broad selection of specialty wire and cable that we distribute, we offer a wide array of value-added services to our customers to assist them with their wire and cable requirements. These services allow customers to use our industry expertise to efficiently manage their wire and cable requirements with improved service and minimal waste and expense.
We believe our inventory depth and breadth, distribution capabilities and value-added services are critical to our customers' wire and cable procurement needs and significantly reduce their cost by:
Our value-added services include the following:
Customers
During 2005, we served approximately 2,600 customers, including eachvirtually all of the top 200 U.S. electrical distributors, representing over 8,300 customer locations nationwide. All of our top ten customers (or their predecessors) have been customers for more than a decade.
Our top 10 customers in 2005 were:
| Border States Electric Supply | Mayer Electric Supply Company, Inc. | |
| Consolidated Electrical Distributors, Inc. | Rexel, Inc. | |
| GE Supply Company | The Reynolds Company | |
| Graybar Electric Company, Inc. | Sonepar USA | |
| Hughes Supply, Inc. | WESCO Distribution, Inc. |
Our customers' primary end-markets include the communications, energy, engineering and construction, general manufacturing, infrastructure, petrochemical, transportation, utility and wastewater treatment industries. While downturns or cyclicality in the markets our distributor customers serve could affect our business, we believe that the market and geographic diversity of our end-users helps to mitigate risks associated with regional or sector-specific cycles. In 2005, our largest customer, WESCO Distribution, represented approximately 11% of our sales.
Suppliers
We obtain products from most of the leading wire and cable suppliers. We believe we have strong relationships with our top suppliers. Although we believe that alternative sources are available for the majority of our wire and cable products, we have strategically concentrated our purchases with three leading suppliers in order to maximize product quality, delivery dependability, purchasing efficiencies, and supplier incentives. As a result, in 2005 approximately 55% of our annual purchases came from three suppliers. We do not believe we are dependent on any one supplier for any of our wire and cable products.
Our top five suppliers in 2005 were Belden CDT, General Cable Corp., Nexans, Service Wire Company and Southwire Company. Products we purchased from Belden CDT and General Cable Corp. each generated more than 10% of our sales in 2005.
We believe that our national distribution presence and value-added services make us an essential partner in the supply chain for our suppliers. In addition, we believe our role in the supply chain, through our national distribution channel and value-added services, provides our suppliers cost savings by:
Sales and Marketing
Sales Strategy
The primary objectives of our sales process are (i) to continue to generate market awareness, (ii) to identify profitable specialty wire and cable markets and (iii) to penetrate targeted markets through cost benefit analyses and customized service offerings. Our sales force is trained to identify the needs of our customers and develop a single-source wire and cable solution that meets their needs while creating a competitive advantage for us.
Sales Organization
In order to meet our growth initiatives and manage the corresponding increased contact with customers, we invested heavily in sales resources (including significantly increasing the size of our field sales force from 2003 to 2005). We have also transformed our compensation programs to drive a more proactive sales process. For example, we have realigned the incentives for our field sales force by tying more than 50% of commissions to sales to new customers. Our inside sales force compensation structure focuses on monthly adjusted gross profit dollars and margin percentage targets.
We have expanded our sales channels to support our electrical distributor customers as "channel partners" to penetrate our targeted markets, including the utility, industrial and infrastructure markets. In cooperation with these distributors, we are implementing a "pull-through" sales strategy to increase demand for our products and services among selected end-users.
As of AprilMay 1, 2006, our sales and marketing staff consisted of approximately 142141 employees. We market our specialty wire and cable through an inside sales force located throughout our regional offices and a field sales force located in key geographic markets throughout the U.S. By operating under a decentralized process, regional managers are able to adapt quickly to market-specific occurrences, allowing us to compete effectively with local competitors. We believe the breadth and depth of our sales force is critical to serving our fragmented and diverse customer and end-user base.
Our field sales force focuses on developing demand for our products. In addition to adding field sales resources, since 2003 we have reorganized our sales organization to service our customer base more effectively and to penetrate new and larger end-markets. Our sales force optimization plan has involved:
Our inside sales force's primary objective is to maintain, service and develop existing accounts. Our inside sales personnel assist customers and end-users with selecting the appropriate wire and cable products based on intended use, cost and performance specifications. With our national presence, the inside sales force also has the ability to designate the distribution facility that will process a customer's order, which helps to reduce freight charges and transportation time. In addition to assisting customers with proper product selection, our inside sales personnel facilitate the designation of our products in project specifications, increasing the utilization of our products. Part of our inside sales force consists of our National Service Center, or NSC, an outbound call center located in Houston, Texas, that is focused on developing smaller or less active accounts. The NSC cultivates our customers using a cost effective and consistently applied sales and marketing process. We believe the NSC represents a valuable, hands-on and profitable training ground for the development of our current and future sales force.
Through the NSC, we offer continuous in-depth training for our entry-level sales personnel. In addition to our NSC training, we offer our sales force extensive training and education, including training on ISO 9001:2000 standard sales-related procedures, a "hands on" multi-department orientation, an in-house wire school facilitated by in-house experts and factory engineers, and attendance at the "Belden College of Wire Knowledge" at Belden CDT's manufacturing facility. All sales professionals are educated on our regimented sales process with complete protocols, requirements and controls.
Marketing
As a result of the initiatives we adopted in 2003, we have augmented our marketing activities and functions by:
Our marketing materials include a master catalog, targeted mini-catalogs, product brochures, direct mail and an online presence that includes an e-catalog, company overview and LifeGuard™ cable informational videos. The extranet access we provide allows customers to obtain custom pricing, inventory availability and information on shipping and order-tracking. We also regularly participate in trade shows.
We employ database mining techniques to identify new business development opportunities and customers. We utilize our own data as well as third-party provided data. Our database contains over 18,000 contacts from 8,300 local accounts at electrical distributors nationwide and an additional 5,0004,800 plus contacts of engineering and procurement professionals. We believe we possess one of the largest databases of contact information for electrical distributors of specialty wire and cable in the U.S.
We, like many of our customers, are members of various industry marketing groups that represent hundreds of electrical distributors across the U.S. As a supplier member of these groups, we are recognized as
a preferred supplier to these customers. We believe that our relationships with these groups are strong. We also maintain direct relationships with all of our customers who are distributor members of these groups.
Operations & Facilities
Purchasing
To maximize purchasing efficiencies, we utilize a centralized purchasing function located at our corporate headquarters in Houston, Texas, which manages each distribution facility's unique product profile and inventory levels. The purchasing department is led by the Vice President of Marketing and Merchandising, who oversees a Director of Purchasing, senior buyers who are responsible for purchasing specific product groups, length allocation specialists, who are responsible for efficient reel selection, and a logistics and product analyst, who is responsible for inventory optimization initiatives. Additionally, the corporate market managers and sales personnel provide feedback on product lines to the Vice President of Marketing and Merchandising and the Director of Purchasing. Our ability to consolidate demand and purchase large quantities of wire and cable provides substantial manufacturing scale for our suppliers and results in competitive prices including attractive rebate programs.
Our centralized purchasing function is supported by our ERP system, which notifies the senior buyers of required inventory purchases through the use of a real-time inventory forecasting system. Under this system all inventory items have a classification based on sales frequency, which is customized for every SKU. Based on a particular item's classification, demand analysis is developed from usage history, minimum acceptable safety stock and projected manufacturing lead times.
Logistics
Our logistics process is highly automated through an ERP system that enables the seamless integration of operating functions. In 1999, we implemented a radio frequency bar-coded inventory system. This bar-coding system has facilitated our length allocation process, which audits all customers' orders prior to their release into the distribution facilities and subsequently directs warehouse personnel to particular reels for cut-to-length orders. This process reduces wire and cable remnants, ensures accuracy and maintains our real-time inventory system for sales personnel.
We process customers' orders the same day they are received. Our strategically located distribution centers generally allow for ground delivery nationwide within 24 hours of shipment. Orders are delivered through a variety of distribution methods, including less-than-truck-load, truck-load, air or parcel service providers, direct from supplier and cross-dock shipments. Freight costs are typically borne by our customers. Due to our shipment volume, we have preferred pricing relationships with most carriers.
Facilities
Combined, our nine company-operated facilities have approximately 500,000 square feet of total space and approximately 450,000 square feet of warehouse space. Our Houston, Texas facility is certified to ISO 9001:2000 standards and our eight other facilities follow these certified ISO procedures. Our facilities have capacity to accommodate substantial additional sales volume.
The following table sets forth information about our executive offices and our warehouse facilities as of April 28,May 1, 2006.
| Location | Total Square Feet | Warehouse Square Feet | Owned/Leased | Lease Expiration Date | ||||
|---|---|---|---|---|---|---|---|---|
| Houston, TX | 166,720 | 136,720 | Owned | n/a | ||||
| Chicago, IL | 67,448 | 62,378 | Leased | August 8, 2013 | ||||
| Philadelphia, PA | 60,000 | 54,500 | Leased | December 31, 2011 | ||||
| Los Angeles, CA | 52,901 | 47,036 | Leased | November 14, 2009 | ||||
| Atlanta, GA | 50,733 | 47,483 | Leased | September 30, 2009 | ||||
| Charlotte, NC | 44,159 | 38,892 | Leased | June 30, 2015 | ||||
| Tampa, FL | 36,991 | 32,589 | Leased | March 31, 2013 | ||||
| Baton Rouge, LA | 22,200 | 19,700 | Leased | September 30, 2009 | ||||
| Seattle, WA | 15,240 | 13,740 | Leased | March 31, 2007 | ||||
| Total | 516,392 | 453,038 | ||||||
We own our Houston, Texas facility, which serves as a regional distribution center as well as our corporate headquarters. Constructed in 1995 on 11.5 acres, the facility houses all centralized and back office functions such as finance, marketing, purchasing, human resources and information technology. Our Houston headquarters is pledged as collateral to our senior lenders. We believe that our properties are in good operating condition and adequately serve our current business operations.
As a test of potential new markets and to augment our distribution network, we contract with two third party logistics firms. The location of and services provided by these third party logistics firms are as follows:
Information Systems and Technology
We utilize scalable information systems and technology to provide support for all of our operations. We utilize a proprietary state-of-the-industry ERP system. Over the years, the system has been upgraded and customized for our operations and allows for the seamless integration of financial, operational and administrative functions. Each of our locations is connected to our computer networks through dedicated data lines. These systems are protected by the support of recognized security systems, and we maintain a disaster recovery system that provides for the back-up of our data.
Our automated bar-coded inventory system allows us to track and manage our inventory on a real-time basis. With more thanapproximately 45,000 reels across eleven distribution facilities at any given time, our information technology systems allow complete traceability of our products through the entire supply chain from our suppliers to delivery to our customers. We also developed a proprietary cable management system that allows our customers to review online the wire and cable products designated for specific projects, release orders for shipment and review previous shipments.
In 2004, we augmented our ERP system with the implementation of a CRM platform for customer relationship and sales force management, which allows for advanced customer management in a secure environment.
We have an experienced and dedicated information technology department, including on-site programmers and other network professionals.
Employees
As of AprilMay 1, 2006, we had 275274 employees, the majority of whom are sales or warehouse personnel.
None of our employees is represented by a labor union or covered by a collective bargaining agreement. We believe that our employee relations are good.
Competition
Like the general U.S. electrical distribution market, the specialty wire and cable market is highly competitive and fragmented, with over 200 specialty wire and cable distributors serving this market. The product offerings and levels of service provided by the other specialty wire and cable distributors with which we compete vary widely. We primarily compete with other wire and cable distributors on a regional and local basis. Most of our direct competitors are smaller companies that focus on a specific geographical area or feature a select product offering, such as surplus wire. In addition to the direct competition with other specialty wire and cable distributors, we also face, on a much more limited basis, competition with the hundreds of electrical distributors and manufacturers that sell products directly or through multiple distribution channels to end-users or other resellers. In the markets that we serve, competition is primarily based on product line breadth, quality, product availability, service capabilities and price.
Government Regulations
We are subject to regulation by various federal, state and local agencies. These agencies include the Environmental Protection Agency, Department of Transportation, Interstate Commerce Commission, Occupational Safety and Health Administration, Department of Labor and Equal Employment Opportunity Commission. We believe we are in compliance in all material respects with existing applicable statutes and regulations affecting environmental issues and our employment, workplace health and workplace safety practices.
Litigation
From time to time, we are involved in lawsuits that are brought against us in the normal course of business. We are not currently a party to any legal proceedings that we expect, either individually or in the aggregate, to have a material adverse effect on our business or financial condition. We, along with many other defendants, have been named in a number of lawsuits in the state courts of North Dakota alleging that certain wire and cable which may have contained asbestos caused injury to the plaintiffs who were exposed to this wire and cable. These lawsuits are individual personal injury suits that seek unspecified amounts of money damages as the sole remedy. It is not clear whether the alleged injuries occurred as a result of the wire and cable in question or whether we, in fact, distributed the wire and cable alleged to have caused any injuries. In addition, we did not manufacture any of the wire and cable at issue, and we would rely on any warranties from the manufacturers of such cable if it were determined that any of the wire or cable that we distributed contained asbestos which caused injury to any of these plaintiffs. In connection with ALLTEL's sale of our company in 1997, ALLTEL provided indemnities with respect to costs and damages associated with these claims that we believe we could enforce if our insurance coverage proves inadequate. In addition, we maintain general liability insurance that has applied to these claims. To date, all costs associated with these claims have been covered by the applicable insurance policies and all defense of these claims has been handled by the applicable insurance companies.
Executive Officers and Directors
The following table sets forth information about our executive officers and directors and their ages as of March 24,May 1, 2006.
| Name | Age | Title | ||
|---|---|---|---|---|
| Charles A. Sorrentino | 61 | President, Chief Executive Officer and Director | ||
| Nicol G. Graham | 53 | Chief Financial Officer, Treasurer and Secretary | ||
| Peter M. Gotsch | Chairman of the Board of Directors | |||
| Robert G. Hogan | 38 | Director | ||
| Wilson B. Sexton | 69 | Director |
We expect to appoint additional directors who are not affiliated with us or any of our stockholders to our board of directors within twelve months of the closing of this offering, so that a majority of our board will be independent directors.
Charles A. Sorrentino
President, Chief Executive Officer and Director
Mr. Sorrentino joined us as President and Chief Executive Officer in 1998. Prior to joining us, Mr. Sorrentino served as President of Pameco Corporation, a national heating, ventilation, air conditioning and refrigeration distributor, from 1994 to 1998. Pameco was a $600 million distributor that was listed on the New York Stock Exchange following an initial public offering in 1997 and was later merged into a larger company. Prior to working with Pameco, Mr. Sorrentino served with PepsiCo, Inc. for nine years. During this time, he held a variety of positions, including Subsidiary President, Division Vice President and Region Vice President. After completing college, Mr. Sorrentino served twelve years with United Technologies (Sundstrand Corporation), a NYSE-listed manufacturer of industrial, heating and air conditioning components in a variety of engineering, sales, marketing and executive management functions. Mr. Sorrentino earned a M.B.A. from the University of Chicago and a B.S. in Mechanical Engineering from Southern Illinois University. He also served in the United States Marine Corps.
Nicol G. Graham
Chief Financial Officer, Treasurer and Secretary
Mr. Graham has served as our Chief Financial Officer since 1997. He oversees our financial reporting and analysis, accounting, tax, risk management, compliance, and administration functions. He joined us in 1984 as Controller and has held various financial management positions. He is a registered CPA in the U.S. and a Chartered Accountant in his native Scotland.
Peter M. Gotsch
Chairman of the Board of Directors
Mr. Gotsch has served as a member of our Board of Directors since 1997. He has been a member of Code Hennessy & Simmons LLC since 1997 and employed by its affiliates since 1989. He holds a B.A. degree from St. Olaf College and an M.B.A. from Northwestern University. He currently serves as the Chairman of the Board of The Hillman Companies, Inc. and on the Board of Directors of Beacon Roofing Supply, Inc.
Robert G. Hogan
Director
Mr. Hogan has served as a member of our Board of Directors since 2005. He joined Code Hennessy & Simmons LLC in 2000 and has been a Vice President since 2003. He holds a B.A. degree from the University of Notre Dame and an M.B.A. from Northwestern University.
Wilson B. Sexton
Director
Mr. Sexton joined our Board of Directors in May 2006. He has been the Chairman of the Board and a director of SCP Pool Corporation since 1993. From January 1999 to May 2001, Mr. Sexton also served as Chief Executive Officer of SCP Pool Corporation. Mr. Sexton is a Certified Public Accountant and holds a B.B.A. degree from Southern Methodist University. He is currently on the Board of Directors of Beacon Roofing Supply, Inc.
Other Key Management
| Name | Age | Title | ||
|---|---|---|---|---|
| James L. Pokluda III | 41 | Vice President, Marketing and Merchandising | ||
| Christopher R. McLeod | 44 | Vice President, Logistics | ||
| Marcus L. Jones | Vice President, Southeast Region | |||
| Gregory J. Donato | 41 | Vice President, Northeast Region | ||
| Eric S. Blankenship | 54 | Vice President, National Business Development | ||
| Eric W. Davis | 44 | Vice President and Controller | ||
| Carol M. Sims | 46 | Director, Human Resources | ||
| Marilyn J. McMahon | Director, Information Services |
James L. Pokluda III
Vice President, Marketing and Merchandising
Mr. Pokluda assumed his current role in 2003 and is responsible for all marketing, merchandising, and purchasing activities. Mr. Pokluda joined us in 1987 as an Account Manager and was our leading salesperson for the three consecutive years prior to his promotion to General Manager of the Southern Region in 1995. In 2000, Mr. Pokluda assumed the role of Regional Vice President and between 1995 and 2001 his profit and loss responsibility was expanded to include our Western and South-Central regions. In 2001, he became our Vice President of Marketing. Mr. Pokluda is a graduate of the College of Engineering at Texas A&M University and regularly participates in executive education at the Graduate Schools of Business at the University of Chicago, Rice University, and MIT.
Christopher R. McLeod
Vice President, Logistics
Mr. McLeod joined us in 2001 as Director of Logistics and was promoted to Vice President of Logistics in December 2001. He is responsible for our nine distribution facilities and our arrangements with our two third-party logistics providers, transportation management, safety programs and ISO practices. Prior to joining us, Mr. McLeod was a Managing Director at FedEx Logistics where he managed the Dell Computer account. Additionally he has held several logistics positions at Kimberly Clark-Tecnol, Tandy Corporation, and Pier 1 Imports. Mr. McLeod is a graduate of Sam Houston State University and received an MBA with honors from Regis University. He has also completed an executive training program at Texas Christian University—M.J. Neely School of Business.
Marcus L. Jones
Vice President, Southeast Region
Mr. Jones joined us in 1999 as the Regional Manager of our Charlotte, North Carolina facility. In 2000, he was promoted to Regional Vice President and effectively managed the integration of Futronix's Southern Region. Prior to joining us, Mr. Jones worked ten years for Rockwell Automation Allen-Bradley. At Rockwell, he had a variety of responsibilities including area management, product development, mergers and acquisitions, and market channel development. He has also served as a national distribution manager for Texas Instruments Inc. Mr. Jones is a graduate of the University of North Carolina at Charlotte.
Gregory J. Donato
Vice President, Northeast Region
Mr. Donato joined us as a District Sales Manager in 1993. In 2000, he assumed the responsibility of Regional Vice President with profit and loss accountability for 23 states covering the Northeast and Midwest regions. Prior to joining us, Mr. Donato served as electrical sales manager for Fairmont Supply Company, then a wholly-owned subsidiary of E.I. DuPont de Nemours & Company. Mr. Donato worked at Fairmont Supply for six years. Mr. Donato is a graduate of Widener University. He has completed additional executive training programs at the University of Michigan, MIT Sloan School of Management and Villanova University.
Eric S. Blankenship
Vice President, National Business Development
Mr. Blankenship has served as our Vice President, National Business Development since 1999. He began his career with us as an inside sales professional in our Charlotte, North Carolina facility in 1980, and was later promoted to inside sales manager in 1989. He achieved Salesperson of the Year honors from 1986 through 1988. From 1989 to 1993, he served as the general manager for the Charlotte, North Carolina and Baton Rouge, Louisiana facilities. Immediately prior to his current position, Mr. Blankenship was Vice President, Sales and Marketing from 1993 to 1999. Mr. Blankenship is a graduate of the University of South Alabama.
Eric W. Davis
Vice President and Controller
Mr. Davis has served as our Vice President and Controller since 2002. Mr. Davis joined us in 1993 and has held several accounting and management positions. From 1990 to 1993, Mr. Davis was employed by American Exploration Company as a Senior Internal Auditor. From 1988 to 1990, Mr. Davis was employed by Arthur Andersen. Mr. Davis became a CPA in 1991. Mr. Davis received his BS and MBA from the University of Houston—Clear Lake, and served in the U.S. Army.
Carol M. Sims
Director, Human Resources
Ms. Sims has served as our Director of Human Resources since 1994. In this position she is responsible for all personnel-related activities. Ms. Sims joined us in 1984 as an Executive Secretary. Ms. Sims received her Senior Professional Human Resources certification in 1993.2006.
Marilyn J. McMahon
Director, Information Services
Ms. McMahon joined us as our Data Processing Manager in 1994, and was promoted to Director, Information Services in 1999. In her current position, she is responsible for our information and communication systems. Prior to joining us, Ms. McMahon was an information technology consultant, managing software and programming projects from 1989 to 1994. From 1980 to 1989, she was a Programmer
Analyst and Project Leader at the Richmond Tank Car Company and Igloo Corporation. Ms. McMahon attended Loyola University and has participated in three years of technical training at IBM Corporation. She recently attended the Leadership Training program at Rice University.
Board Composition
Our board of directors currently consists of threefour directors. We intend to elect a fourth director, who will be independent, to the board of directors prior to the closing of this offering. Each director is elected for a term of one year and serves until a successor is duly elected and qualified or until his or her death,
resignation or removal. There are no family relationships between any of our directors or executive officers. Our executive officers are elected by and serve at the discretion of the board of directors.
Committees of Board of Directors
Prior to the closing of this offering, theThe board of directors will establishhas established three committees,committees: the audit committee, compensation committee and nominating and corporate governance committee. In the future, the board may also establish other committees to assist in the discharge of its responsibilities.
The audit committee will select the independent auditors to be nominated for election by the stockholders and review the independence of these auditors, approve the scope of the annual audit activities of the independent auditors, approve the audit fee payable to the independent auditors and review thesethe audit results with the independent auditors. The audit committee is comprised of .Messrs. Gotsch, Hogan and Sexton. Within a year following this offering, subject to Nasdaq's applicable transition rules, the audit committee will be comprised solely of directors who meet the independence requirements established by Nasdaq and applicable law. Ernst & Young LLP currently serves as our independent registered public accounting firm.
The duties of the compensation committee will be to provide a general review of our compensation and benefit plans to ensure that they meet our objectives. In addition, the compensation committee will review the chief executive officer's recommendations on compensation of our executive officers and make recommendations for adopting and changing major compensation policies and practices. The compensation committee will report its recommendations to the full board of directors for approval and authorization. It will also fix the annual compensation of the chief executive officer and administer our stock plans. The compensation committee is expected, after additional independent board members are identified and elected, to be comprised of at least three independent directors who are also non-employee directors (as defined in Rule 16b-3 under the Securities Exchange Act) and outside directors (as defined in Section 162(m) of the Internal Revenue Code) who do not have "interlocking" or other relationships with us that would detract from their independence as committee members. The members of the compensation committee are .Messrs. Gotsch, Hogan and Sexton.
The nominating and corporate governance committee will be responsible for identifying and recommending potential candidates qualified to become board members, recommending directors for appointment to board committees and developing and recommending to the board a set of corporate governance principles. The nominating and corporate governance committee is comprised of .Messrs. Gotsch, Hogan and Sexton.
Director Compensation
Independent members of the board of directors receive an annual retainer of $30,000. All directors are also entitled to receive $1,500 for each board meeting attended and $1,000 for each committee meeting. The chairman of each of the audit committee and compensation committee will be entitled to receive an additional $5,000 per year. All fees may be paid in cash or shares of our common stock, at the choice of the director.
In addition, upon election to the board, each independent director will receive a one-time grant of an option exercisable for 15,000 shares of our common stock. In connection with his election to the board, upon
the closing of this offering Mr. Sexton will receive an option exercisable for 15,000 shares of our common stock at a per share exercise price equal to the initial public offering price. Upon reelection, independent directors will also receive an annual grant of an option exercisable for 5,000 shares. All options become exercisable one year after the date of grant. Exercise prices will be set at fair market value at the date of grant.
We reimburse members of our board of directors for any out-of-pocket expenses they incur in connection with services provided as directors.
Executive Compensation
The following table sets forth information concerning the compensation for 2005 of our Chief Executive Officer and our other most highly compensated executive officer who was serving at the end of our last fiscal year. For ease of reference, we collectively refer to these executive officers throughout this section as our "named executive officers."
Summary Compensation Table
| | | Annual Compensation | Long Term Compensation Awards | | | Annual Compensation | Long Term Compensation Awards | | ||||||||||||||||||||||||||||||
|---|---|---|---|---|---|---|---|---|---|---|---|---|---|---|---|---|---|---|---|---|---|---|---|---|---|---|---|---|---|---|---|---|---|---|---|---|---|---|
| Name and Principal Position as of December 31, 2005 | Year | Salary ($) | Bonus ($) | Other Annual Compensation ($) | Restricted Stock Awards ($) | Securities Underlying Options (#) | All Other Compensation ($) | Year | Salary ($) | Bonus ($) | Other Annual Compensation ($) | Restricted Stock Awards ($) | Securities Underlying Options (#) | All Other Compensation ($) | ||||||||||||||||||||||||
| Charles A. Sorrentino, President and Chief Executive Officer | 2005 | $ | 300,000 | $ | 200,000 | $ | 6,550 | — | — | $ | 7,668 | (1) | 2005 | $ | 300,000 | $ | 200,000 | $ | 6,550 | — | — | $ | 7,668 | (1) | ||||||||||||||
Nicol G. Graham, Chief Financial Officer | 2005 | $ | 159,000 | $ | 47,700 | $ | 1,698 | — | 5,000 | $ | 3,221 | (2) | 2005 | $ | 159,000 | $ | 47,700 | $ | 1,698 | — | 9,375 | $ | 3,221 | (2) | ||||||||||||||
Option Grants
The following table sets forth information regarding stock options we granted to our named executive officers during our last fiscal year.
Option Grants in 2005
| | | | | | Potential Realizable Value at Assumed Annual Rates of Stock Price Appreciation for Option Term(1) | | | | | Potential Realizable Value at Assumed Annual Rates of Stock Price Appreciation for Option Term(1) | ||||||||||||||||
|---|---|---|---|---|---|---|---|---|---|---|---|---|---|---|---|---|---|---|---|---|---|---|---|---|---|---|
| | | Percent of Total Options Granted to Employees in Fiscal Year | | | | Percent of Total Options Granted to Employees in Fiscal Year | | | ||||||||||||||||||
| | Number of Securities Underlying Options Granted | | | Number of Securities Underlying Options Granted | | | ||||||||||||||||||||
| Name | Percent of Total Options Granted to Employees in Fiscal Year | Expiration Date | Percent of Total Options Granted to Employees in Fiscal Year | Expiration Date | ||||||||||||||||||||||
| Percent of Total Options Granted to Employees in Fiscal Year | 10% | 5% | Percent of Total Options Granted to Employees in Fiscal Year | 10% | ||||||||||||||||||||||
| Charles A. Sorrentino | — | — | — | — | — | — | — | — | ||||||||||||||||||
| Nicol G. Graham | 5,000 | (2) | 10.2 | 12/30/15 | 9,375 | (2) | 10.2 | 12/30/15 | $ | 121,594 | ||||||||||||||||
Option Exercises and Fiscal Year-End Option Values
The following table sets forth information for the named executive officers concerning stock option exercises during our last fiscal year and options outstanding at the end of our last fiscal year. None of the named executive officers acquired any shares upon the exercise of outstanding options in 2005.
Aggregate Option Exercises in Fiscal 2005 and
Fiscal Year-End Option Values
| | | | Number of Securities Underlying Unexercised Options at Fiscal Year End | | | | | Number of Securities Underlying Unexercised Options at Fiscal Year End | | | |||||||||||||||||
|---|---|---|---|---|---|---|---|---|---|---|---|---|---|---|---|---|---|---|---|---|---|---|---|---|---|---|---|
| | | | Value of Unexercised In-the-Money Options at Fiscal Year End(1) | | | Value of Unexercised In-the-Money Options at Fiscal Year End(1) | |||||||||||||||||||||
| Name | Shares Acquired on Exercise | Value Realized | Shares Acquired on Exercise | Value Realized | |||||||||||||||||||||||
| Exercisable | Unexercisable | Exercisable | Unexercisable | Exercisable | Unexercisable | Exercisable | Unexercisable | ||||||||||||||||||||
| Charles A. Sorrentino | — | — | — | — | — | — | — | — | — | — | — | — | |||||||||||||||
| Nicol G. Graham | — | — | — | 6,200 | — | $ | 4,800 | — | — | 5,250 | 11,625 | $ | 11,200 | $ | 4,800 | ||||||||||||
Employment Arrangements
We entered into an employment agreement dated April 26, 2006 with Mr. Sorrentino, our President and Chief Executive Officer, with a term that extends through April 26, 2011. It provides for a base salary of $425,000 per year, subject to annual reviews and increases (but not decreases) by our board. Mr. Sorrentino's
employment agreement also entitles him to an annual bonus of up to 100% of base salary, depending on whether we reach the performance target that the board sets near the beginning of each fiscal year. The bonus varies from 0% of base salary (if we achieve less than 85% of the target for that fiscal year) to 100% of base salary (if we achieve 115% or more of the target for that year). Between 85% and 115% of the target, the bonus varies on a straight-line basis. Mr. Sorrentino's other compensation includes reimbursement for reasonable business expenses, the employment benefits generally available to our executives, four weeks of vacation per year and a car allowance of $1,000 per month, and he may participate in our 2006 Stock Plan, which is summarized under "—2006 Stock Plan" below. Under his employment agreement, Mr. Sorrentino is entitled to severance equal to two years base salary if we terminate his employment without cause, or if he terminates his employment for good reason, as those terms are defined in his employment agreement. The employment agreement limits Mr. Sorrentino's ability to compete with us for two years after his employment ends.
Each of our other executive officers is elected by and serves at the discretion of the board of directors.
Compensation Committee Interlocks and Insider Participation
We will establish a compensation committee, and we expect that, after additional independent board members are identified and elected, theour compensation committee will consist of at least three independent directors who are also non-employee directors (as defined in Rule 16b-3 under the Securities Exchange Act) and outside directors (as defined in Rule 162(m) of the Internal Revenue Code) who do not have "interlocking" or other relationships with us that would detract from their independence as committee members.
Stock Plans
Equity Compensation Plan Information
| | (a) | (b) | (c) | ||||
|---|---|---|---|---|---|---|---|
| Plan Category | Number of Securities to be Issued upon Exercise of Outstanding Options, Warrants and Rights | Weighted-Average Price of Outstanding Options, Warrants and Rights | Number of Securities Remaining Available for Issuance under Equity Compensation Plans (Excluding Securities Reflected in Column (a)) | ||||
| Equity compensation plans approved by security holders | 15,000 | $ | 13.00 | (1) | 1,785,000 | ||
| Equity compensation plans not approved by security holders | 245,065 | $ | 1.33 | — | |||
2000 Stock Plan
Our 2000 Stock Plan was established by the board of directors, effective February 17, 2000, in order to provide for grants of stock options and awards to our key employees and directors. The purpose of the grants and awards is to provide incentives for increased profitability and to provide key employees and directors with a greater interest in our business. We will make any future stock-based awards under our new 2006 Stock Plan.
Plan Administration. The 2000 plan is administered by our board, which has delegated administration to the compensation committee. The committee has full authority to select the key employees and directors who receive option grants and stock awards, and to determine the amount and the terms and conditions of each grant or award.
Number of Shares of Common Stock. The number of shares of our common stock that may be issued under the 2000 plan is 100,000.468,750. The maximum number of shares issuable as incentives to any employee or director in any calendar year is 25,000.46,875. Shares issuable under the 2000 plan may be authorized but unissued shares or treasury shares. If any grant or award expires, terminates or is forfeited, the shares subject to the grant or award will again be available for issuance. No grant or award may be granted after February 17, 2010. We will not make any further grants under the 2000 plan following this offering.
Grants of Stock Options. The committee is authorized to grant non-qualified or incentive stock options to selected key employees and non-qualified stock options to non-employee directors. The committee sets the terms and conditions applicable to the options, including the exercise price, type of option, and the number of shares subject to the option. The duration of any option may not exceed 10 years from the grant date. In addition, an incentive stock option is subject to the following rules: (i) the aggregate fair market value (determined at the time the option is granted) of the shares of common stock with respect to which incentive stock options are exercisable for the first time by an employee during any calendar year (under all of our stock option plans) cannot exceed $100,000; and (ii) if an incentive stock option is granted to an employee who owns stock possessing more than 10% of the total combined voting power of all classes of our stock, the exercise price will be at least 110% of the closing price of our stock on the grant date and the option will expire no later than five years from the grant date. Without the board's approval, no shares acquired upon the exercise of an incentive stock option may be sold or otherwise disposed of by the employee within two years from the grant date of the option and within one year from the exercise date.
Grants of Stock Awards. The committee is authorized to grant stock awards to key employees and directors. The award granted to any employee or director shall be for the number of shares, and subject to such vesting requirements, restrictions and other terms and conditions, as the committee shall determine in its discretion.
Payment of Option Exercise Price and Withholding Taxes. The committee may permit an option holder to pay the exercise price of an option by one or more of the following methods: cash; delivery of previously-acquired shares of our stock; retention by the company of shares that would have otherwise been issued upon the option's exercise; such other methods as deemed appropriate by the committee (such as a loan from the company); or a combination of the foregoing as approved by the committee. The committee may permit an employee to pay the minimum amount of any required withholding tax arising in connection with any stock award or option exercise by delivery of previously-acquired shares of our stock or retention by the company of shares that would have otherwise been acquired pursuant to the stock award or upon option exercise.
Extraordinary Transactions. If we merge or consolidate with another corporation, or if another entity acquirersacquires our property or stock, or in the event of a reorganization or liquidation, or in the event of any other extraordinary transaction, the committee or the board of the surviving entity may provide for the continuation of any award previously granted under the 2000 plan or for any other adjustments. These other adjustments include, but are not limited to, requiring (i) that cash be paid in lieu of an option in an amount equal to the difference between the fair market value of the shares covered by the option and the option exercise price; (ii) that an option be converted into other property; or (iii) that an option must be exercised within a specified period following written notice.
Amendment or Termination of the Plan. The board may amend or terminate the 2000 plan at any time as long as the amendment or termination does not adversely affect the rights of any employee or director under any option or award agreement without his or her written consent.
2006 Stock Plan
Our stockholders recently approved our 2006 Stock Plan. We intend to make awards of stock options and restricted stock under the 2006 plan to key employees and directors. We want to recognize the contributions
made by our key employees, provide them with additional incentives to devote themselves to our future success and improve our ability to attract and retain employees. We also want to provide additional incentives to members of our board of directors to serve on the board and dedicate themselves to our future success.
Plan Administration. The 2006 plan will be administered by our board, which has authority to delegate administration to the compensation committee so long as the committee is comprised of two or more directors who satisfy the "non-employee director" definition under Rule 16b-3 of the Securities Exchange Act and the "outside director" definition under Section 162(m) of the Internal Revenue Code. Until such time as the board has two members who are both non-employee directors and outside directors, the committee may be composed otherwise. The board or committee, as applicable, has full authority to select the individuals who will receive awards under the 2006 plan, determine the form and amount of each of the awards to be granted, and establish the terms and conditions of awards. To the extent the board delegates its authority, references in this summary to the board mean the committee. The board has delegated its authority under the 2006 plan to the compensation committee.
Number of Shares of Common Stock. The number of shares of our common stock that may be issued under the 2006 plan is .1,800,000. Of these shares: (i) the maximum number issuable as stock options to any employee in any calendar year is ,500,000, (ii) the maximum number issuable as incentive stock options is ,1,800,000, and (iii) the maximum number that may be used for restricted stock awards is .1,800,000.
Shares issuable under the 2006 plan may be authorized but unissued shares or treasury shares. If any award expires, terminates or is forfeited or cancelled for any reason, the shares subject to the award will again be available for issuance. In addition, any shares subject to an award that are delivered to or withheld by us as payment for an award or for withholding taxes due in connection with an award will again be available for issuance, and only the net number of shares delivered to the participant will count toward the
number of shares issued under the 2006 plan. The number of shares issuable under the 2006 plan is subject to adjustment in the event of any reorganization, recapitalization, stock split or dividend, merger, consolidation, split-up, spin-off, combination, subdivision or any similar corporate transaction. In each case, the board has the discretion to make adjustments it deems necessary to preserve the intended benefits under the 2006 plan.
Term of Plan. Our board can grant awards under the 2006 plan for 10 years following its adoption, or until March 23, 2016. Awards outstanding on that date will continue to be subject to the terms of the plan.
Awards to Employees. The 2006 plan provides for discretionary awards of stock options and restricted stock to selected employees and directors.
Stock Options. Our board may grant non-qualified or incentive stock options to selected employees and non-qualified stock options to non-employee directors. The board may set the terms and conditions applicable to the options, including the exercise price of the option, type of option and the number of shares subject to the option. In any event, each option will expire 10 years from the date of grant.
In addition, an incentive stock option is subject to the following rules: (i) the aggregate fair market value (determined at the time the option is granted) of the shares of common stock with respect to which incentive stock options are exercisable for the first time by an employee during any calendar year (under all of our stock option plans) cannot exceed $100,000, and, if this limitation is exceeded, the portion of the incentive stock option that does not exceed this dollar limit will be an incentive stock option and the remainder will be a non-qualified stock option; and (ii) if an incentive stock option is granted to an employee who owns stock possessing more than 10% of the total combined voting power of all classes of our stock, the exercise price will be 110% of the closing price of our stock on the date of grant and the incentive stock option will expire no later than five years from the date of grant.
Restricted Stock. Our board may grant restricted stock awards to directors and selected employees, either for no consideration or for such appropriate consideration as the board determines. The board has the
discretion to determine the number of shares awarded and the restrictions, terms and conditions of the award. Subject to the restrictions, the recipient of an award will be a stockholder with respect to the shares awarded to him or her and will have the rights of a stockholder with respect to the shares, including the right to vote the shares and receive dividends, if any, on the shares.
Our board may establish, as restrictions on the stock, performance goals and targets for participants, which lapse if we achieve the performance goals and targets for the designated performance period. The performance goals may be based on one or more business criteria. Performance goals may be absolute in their terms or measured against or in relationship to the performance of other companies or indices selected by the board.
Payment of Stock Options and Withholding Taxes. Our board may permit a participant to pay the exercise price of an option or pay for restricted stock by one or more of the following methods: cash; cash received from a broker dealerbroker-dealer to whom the employee has submitted an exercise notice and irrevocable instructions to deliver to us the sales proceeds from the sale of the shares subject to the award to pay the exercise price; delivery of previously acquired shares of stock that are acceptable to the board; or certification of ownership by attestation of these previously acquired shares. Our board may permit an employee to pay the minimum amount of any required withholding tax by using one or more of the payment methods described above, and/or by directing us to withhold shares otherwise issuable in connection with the award.
Provisions Relating to a Change in Control. If there is a change in control (as defined in the 2006 plan), all outstanding awards will become fully exercisable and all restrictions applicable to any awards will terminate or lapse. In addition, our board has sole discretion to provide for the purchase of outstanding stock options for cash equal to the difference between the exercise price and the then fair market value of the common stock subject to the option, make adjustments to any outstanding awards as the board deems
appropriate to reflect the change in control, and cause any awards to be assumed by the acquiring or surviving corporation.
Amendment of Award Agreements; Amendment and Termination of the Plan. Our board may amend any award agreement, and may amend or terminate the 2006 plan, at any time, as long as the amendment or termination does not adversely affect the rights of any participant under any agreement in any material way without the written consent of the participant, unless the amendment or termination is required by law, regulation or stock exchange rule. No amendment to the 2006 plan or any award agreement will permit the repricing of stock options.
PRINCIPAL AND SELLING STOCKHOLDERS
The following table sets forth information regarding the beneficial ownership of our common stock as of April 28,May 15, 2006, and as adjusted to reflect the sale of the shares of common stock offered in this offering for:
Unless otherwise indicated below, to our knowledge, all persons listed below have sole voting and investment power with respect to their shares of common stock, except to the extent authority is shared by spouses under applicable law. Unless otherwise indicated below, each entity or person listed below maintains an address c/o Houston Wire & Cable Company, 10201 North Loop East, Houston, Texas 77029.
The number of shares beneficially owned by each stockholder is determined under rules promulgated by the SEC. The information is not necessarily indicative of beneficial ownership for any other purpose. Under these rules, beneficial ownership includes any shares as to which the individual or entity has sole or shared voting or investment power and any shares as to which the individual or entity has the right to acquire beneficial ownership within 60 days after April 28,May 15, 2006 through the exercise of any stock option, warrant or other right. The inclusion in the following table of those shares, however, does not constitute an admission that the named stockholder is a direct or indirect beneficial owner.
| | Beneficial Ownership Prior to Offering | | Beneficial Ownership After Offering | Beneficial Ownership Prior to Offering | | Beneficial Ownership After Offering (Assuming No Exercise of Over- Allotment Option) | | Beneficial Ownership After Offering (Assuming Over-Allotment Option Is Exercised In Full) | |||||||||||||||||||
|---|---|---|---|---|---|---|---|---|---|---|---|---|---|---|---|---|---|---|---|---|---|---|---|---|---|---|---|
| | Common Stock | | Common Stock | Common Stock | | Common Stock | Shares Offered in Over- Allotment (If Exercised) | Common Stock | |||||||||||||||||||
| Beneficial Owners | Number of Shares | Percentage | Shares Offered Hereby(5) | Number of Shares | Percentage | ||||||||||||||||||||||
| Beneficial Owner | Number of Shares | Percentage | Shares Offered Hereby | Number of Shares | Percentage | Shares Offered in Over- Allotment (If Exercised) | Number of Shares | Percentage | |||||||||||||||||||
| 5% Stockholders | |||||||||||||||||||||||||||
| Code, Hennessy & Simmons II, L.P.(1) | 6,773,774 | 76.4 | % | 12,700,821 | 76.4 | % | 3,780,249 | 8,920,572 | 42.7 | % | 1,011,858 | 7,908,714 | 37.9 | % | |||||||||||||
Executive Officers and Directors | |||||||||||||||||||||||||||
| Charles A. Sorrentino | 855,700 | 9.7 | % | 1,604,438 | 9.7 | % | — | 1,604,438 | 7.7 | % | 100,000 | 1,504,438 | 7.2 | % | |||||||||||||
| Nicol G. Graham(2) | 113,080 | 1.3 | % | 212,025 | 1.3 | % | — | 212,025 | 1.0 | % | 13,000 | 199,025 | * | ||||||||||||||
| Peter M. Gotsch(3) | 6,773,774 | 76.4 | % | 12,700,821 | 76.4 | % | 3,780,249 | 8,920,572 | 42.7 | % | 1,011,858 | 7,908,714 | 37.9 | % | |||||||||||||
| Robert G. Hogan | — | — | — | — | — | — | — | — | — | ||||||||||||||||||
| All directors and executive officers as a group (4 persons) | 7,742,554 | 87.4 | % | ||||||||||||||||||||||||
Other selling stockholders(4) | |||||||||||||||||||||||||||
| Wilson B. Sexton | — | — | — | — | — | — | — | — | |||||||||||||||||||
| All directors and executive officers as a group (5 persons) | 14,517,284 | 87.4 | % | 3,780,249 | 10,737,035 | 51.5 | % | 1,124,858 | 9,612,177 | 46.1 | % | ||||||||||||||||
Other Selling Stockholders | |||||||||||||||||
| Eric S. Blankenship(4) | 176,550 | 1.1 | % | — | 176,550 | * | 25,695 | 150,855 | * | ||||||||
| Katherine Blankenship IRA—Chase Bank | 35,475 | * | — | 35,475 | * | 5,322 | 30,153 | * | |||||||||
| Allan Coleman | 345,252 | 2.1 | % | 102,760 | 242,492 | 1.2 | % | 27,506 | 214,986 | 1.0 | % | ||||||
| Jeffrey Fisher | 2,625 | * | — | 2,625 | * | 394 | 2,231 | * | |||||||||
| Marcus George | 11,250 | * | 3,250 | 8,000 | * | — | 8,000 | * | |||||||||
| Heller Financial, Inc. | 31,800 | * | 9,465 | 22,335 | * | 2,534 | 19,801 | * | |||||||||
| Tracy A. Hogan | 3,177 | * | 946 | 2,231 | * | 254 | 1,977 | * | |||||||||
| HW Investors | 102,424 | * | 22,534 | 79,890 | * | — | 79,890 | * | |||||||||
| Michael Keesey | 7,500 | * | 1,875 | 5,625 | * | — | 5,625 | * | |||||||||
| Peter Leeb | 345,252 | 2.1 | % | 102,760 | 242,492 | 1.2 | % | 27,506 | 214,986 | 1.0 | % | ||||||
| John E. Myers | 756,874 | 4.6 | % | 225,275 | 531,599 | 2.5 | % | 60,300 | 471,299 | 2.3 | % | ||||||
| Terry S. Stallard | 2,625 | * | — | 2,625 | * | 394 | 2,231 | * | |||||||||
| Paige Walsh | 2,974 | * | 886 | 2,088 | * | 237 | 1,851 | * |
RELATIONSHIPS AND TRANSACTIONS WITH RELATED PARTIES
Executive Officers and Directors
We have entered into various restricted securities agreements with eight current employees, including Charles A. Sorrentino, whose agreement is dated December 31, 1998 and amended June 28, 2000 and April 26, 2006, and Nicol G. Graham, whose agreement is dated September 11, 1997. The agreements apply to any shares of our stock that the employees own or acquire, including shares issued upon exercise of options. Although a number of the provisions of these agreements will terminate upon completion of this offering, other provisions will remain in effect, including certain limitations on the employees' right to sell shares in the open market and, in some of the agreements including those of Mr. Sorrentino and Mr. Graham, rights to include their shares of our common stock in future registration statements that we file. The agreements with Messrs. Sorrentino and Graham may be terminated upon the mutual agreement of the Company,us, Code,
Hennessy & Simmons II, L.P. and the executive or another holder of 70% or more of the securities issued to the executive. In addition, the agreements terminate automatically upon a sale of the Company,our company, other than in a public offering. The agreements contain rights in favor of us and Code, Hennessy & Simmons II, L.P. to repurchase shares held by these employees upon termination of employment and are otherwise similar to provisions contained in our Investor Securities Agreement and are summarized under "—Investor Securities Agreement" below.
Peter M. Gotsch is a limited partner of CHS Management II, L.P., which receives a management fee from one of our subsidiaries, as described below. This fee is being paid pursuant to a management agreement, which is being terminated in connection with this offering.
Relationship with Code, Hennessy & Simmons II, L.P.
We entered into a management agreement in 1997 with CHS Management II, L.P., which is an affiliate of Code, Hennessy & Simmons II, L.P., our largest stockholder. The management agreement provides for CHS Management II to provide us with management services, for which we pay to CHS Management II an annual management fee of $500,000 in monthly installments. The management agreement also provides for us to reimburse CHS Management II for reasonable direct expenses incurred in providing management services to us. The management agreement is being terminated in connection with this offering.
In connection with this offering, we will enter into a registration rights agreement with Code, Hennessy & Simmons II, L.P. The agreement will provide that, at the request of Code, Hennessy & Simmons II, L.P., we will register under the Securities Act any shares of common stock currently held or later acquired by Code, Hennessy & Simmons II, L.P. for sale in accordance with its intended method of disposition. Code, Hennessy & Simmons II, L.P. also will have the right to include the shares of our common stock that it holds in registrations of common stock that we initiate on our own behalf or on behalf of other stockholders. See "Description of Capital Stock, Certificate of Incorporation and By-Laws—Registration Rights."
Investor Securities Agreement
In 1997, we entered into an Investor Securities Agreement with Code, Hennessy & Simmons II, L.P. and all of our non-employee stockholders to provide for certain restrictions on the disposition of our common
stock and to agree to other matters regarding the ownership and transfer of our shares, including rights of first refusal in favor of us and Code, Hennessy & Simmons II, L.P. and restrictions on transfer without board approval or to a competitor. Although a number of the provisions in the Investor Securities Agreement will terminate upon completion of this offering, other provisions will remain in effect. The Investor Securities Agreement may be terminated upon the mutual agreement of the Companyus and the holders of more than 70% of our outstanding shares of common stock. It also terminates automatically upon a sale of the Companyour company other than in a public offering.
The stockholders who are parties to the Investor Securities Agreement have registration rights similar to those we granted to Mr.Messrs. Sorrentino and Graham and to certain other current and former employees under their restricted securities agreements. These rights provide that, if we propose to file a registration statement with the SEC registering shares of our common stock, then the stockholders having registration rights may require us to include shares owned by them in the registration. If the registration includes shares offered by Code, Hennessy & Simmons II, L.P., then each stockholder may include the same percentage of his or her shares as Code Hennessy & Simmons is including of its shares. Our obligation to register shares is subject to certain limitations. Among other things, if any stockholder exercises this registration right, then we may elect not to proceed with the registration. If any underwriter advises us that the number of shares requested to be included in the registration would adversely affect the offering, then we may reduce the number of shares offered by stockholders that are included in the registration. We must pay all expenses incurred in connection
with the registration, except that the selling stockholders must bear the underwriting and brokerage discounts and commissions on the sale of their shares and the fees of their own lawyers, accountants and other advisers.
The parties to the Investor Securities Agreement, as well as all employees having restricted securities agreements, have agreed to limit their sales of our stock in the open market for as long as Code, Hennessy & Simmons II, L.P. continues to own more than 30% of our outstanding stock. These limitations apply to any calendar quarter during which we are subject to a standstill agreement with underwriters, and to the immediately following calendar quarter. A standstill agreement is an agreement we enter into in connection with any public offering or other public sale of our stock that limits our right to offer or sell our stock except in such offering or sale. The provisions of the Investor Securities Agreements and restricted securities agreements effectively limit the aggregate number of shares of our stock that may be sold during the relevant calendar quarters by all current stockholders to 1% of our outstanding common stock.
Indebtedness and Payments to Related Parties
In 1997, we issued approximately $9.0 million of 14.0% junior subordinated promissory notes due 2007 to certain of our stockholders and officers, including Code, Hennessy & Simmons II, L.P. and Nicol G. Graham. We repaid a portion of these notes in 2004 and the balance in 2005. In 2005 we paid interest on these notes to Code, Hennessy & Simmons II, L.P. and Mr. Graham in the amounts of $5,570,000 and $88,000, respectively. There is currently no indebtedness to related parties.
In December 2005, we declared a $20.0 million special dividend in order to provide a return on investment to our stockholders, to whom we had not previously paid any dividends. We were under no contractual or other obligation to distribute the dividend. We distributed the dividend to our stockholders in proportion to their ownership percentages of our stock. Accordingly, Code, Hennessy & Simmons II, L.P. received a dividend payment of $15,296,052, Mr. Sorrentino received a dividend payment of $1,932,281 and Mr. Graham received a dividend payment of $249,026. We borrowed substantially all of the funds needed to pay the dividend under our revolving credit facility, which is with lenders that are not related to us.
DESCRIPTION OF CAPITAL STOCK,
CERTIFICATE OF INCORPORATION AND BY-LAWS
General Matters
Effective March 23, 2006, ourOur authorized capital stock consists of 100,000,000 shares of common stock and 5,000,000 shares of undesignated preferred stock. Prior to this offering, we had outstanding 8,862,49216,617,172 shares of common stock and approximately 2526 stockholders of record.
Upon closing of this offering, we will have 20,867,172 shares of common stock, options to purchase 260,065 shares of common stock and no shares of preferred stock outstanding. The following summary describes all material provisions of our capital stock. We urge you to read our certificate of incorporation and our by-laws, which are included as exhibits to the registration statement of which this prospectus forms a part.
Our certificate of incorporation and by-laws contain provisions that are intended to enhance the likelihood of continuity and stability in the composition of the board of directors and which may have the effect of delaying, deferring or preventing a future takeover or change in control of our company unless the takeover or change in control is approved by our board of directors.
These provisions include elimination of stockholder action by written consents, elimination of the ability of stockholders to call special meetings and advance notice procedures for stockholder proposals.
Common Stock
Shares of our common stock have the following rights, preferences and privileges:
We intend to list our common stock for quotation on The Nasdaq National Market under the symbol "HWCC".
Preferred Stock
Our amended and restated certificate of incorporation provides that the board of directors has the authority, without action by the stockholders, to designate and issue up to 5,000,000 shares of preferred stock in one or more classes or series and to fix for each class or series the powers, rights, preferences and privileges of each series of preferred stock, including dividend rights, conversion rights, voting rights, terms of redemption, liquidation preferences and the number of shares constituting any class or series, which may be greater than the rights of the holders of the common stock. There will be no shares of preferred stock outstanding immediately after the closing of this offering. Any issuance of shares of preferred stock could adversely affect the voting power of holders of common stock, and the likelihood that the holders will receive dividend payments and payments upon liquidation could have the effect of delaying, deferring or preventing a change in control. We have no present plans to issue any shares of preferred stock.
Registration Rights
In connection with this offering, we will enter into a registration rights agreement with Code, Hennessy & Simmons II, L.P. The agreement will provide that, upon the request of Code, Hennessy & Simmons, we will register under the Securities Act any of the shares of our common stock held by Code, Hennessy & Simmons for sale in accordance with Code, Hennessy & Simmons' intended method of disposition, and will take other actions as are necessary to permit the sale of the shares in various jurisdictions. Our obligation to register the shares and take other actions is subject to certain restrictions on, among other things, the frequency of requested registrations, the number of shares to be registered and the duration of these rights. For a period of seven years following completion of this offering, Code, Hennessy & Simmons may demand registration not more than twice in any twelve-month period, as long as the demand covers a specified minimum number of shares and Code, Hennessy & Simmons (along with its transferees) owns at least 5% of our common stock. Code, Hennessy & Simmons' right to demand registration is subject to certain conditions, including the release from or expiration of the 180-day lockup agreement with our underwriters. Code, Hennessy & Simmons also has the right, for a period of seven years following completion of this offering, to include any or all of the shares of our common stock it owns in other registrations of our common stock (whether those registrations are initiated by us or by other stockholders). We will pay all expenses in connection with a registration made on Code, Hennessy & Simmons' demand or if Code, Hennessy & Simmons exercises its rights to include shares in a registration statement initiated by us or a third party, except that Code, Hennessy & Simmons will pay the underwriting discount. Upon notice, Code, Hennessy & Simmons may transfer its rights under the registration rights agreement to purchasers or transferees of at least (i) 20% or more of the initial shares of common stock owned by Code, Hennessy & Simmons or (ii) if less, all of the remaining shares owned by Code, Hennessy & Simmons under certain circumstances. The registration rights agreement will contain indemnification and contribution provisions (i) by Code, Hennessy & Simmons for our benefit and the benefit of related persons and (ii) by us for the benefit of Code, Hennessy & Simmons and related persons, as well as any underwriter.
Our Investor Securities Agreement and restricted securities agreements with current and former employees give some of our existing stockholders the right to include their shares of common stock in any registration we file with the SEC. See "Relationships and Transactions with Related Parties."
Other Provisions of Our Certificate of Incorporation and By-Laws
Elimination of Stockholder Action through Written Consent. Our certificate of incorporation and by-laws provide that stockholder action can be taken only at an annual or special meeting of stockholders and cannot be taken by written consent in lieu of a meeting.
Elimination of the Ability to Call Special Meetings. Our certificate of incorporation and by-laws provide that, except as otherwise required by law, special meetings of our stockholders can only be called pursuant to a resolution adopted by a majority of our board of directors or by our chief executive officer or the chairman of our board of directors. Stockholders are not permitted to call a special meeting or to require our board to call a special meeting.
Advance Notice Procedures for Stockholder Proposals. Our by-laws establish an advance notice procedure for stockholder proposals to be brought before an annual meeting of our stockholders, including proposed nominations of persons for election to our board. Stockholders at our annual meeting may only consider proposals or nominations specified in the notice of meeting or brought before the meeting by or at the direction of our board or by a stockholder who was a stockholder of record on the record date for the meeting and upon giving of notice and provided that the stockholder has given to our secretary timely written notice, in proper form, of the stockholder's intention to bring that business before the meeting. Although our by-laws do not give our board the power to approve or disapprove stockholder nominations of candidates or proposals regarding other business to be conducted at a special or annual meeting, our by-laws may have the effect of precluding the conduct of some business at a meeting if the proper procedures are not followed or may discourage or defer a potential acquirer from conducting a solicitation of proxies to elect its own slate of directors or otherwise attempting to obtain control of us.
Anti-Takeover Effects of Delaware Law
Following the completion of this offering, we will be subject to provisions of the Delaware General Corporation Law that prohibit a publicly-held Delaware corporation from engaging in any "business combination" transaction with any "interested stockholder" for a period of three years after the date on which the person became an "interested stockholder," unless:
A "business combination" is defined to include mergers, asset sales and other transactions resulting in financial benefit to a stockholder. In general, an "interested stockholder" is a person who, together with affiliates and associates, owns 15% or more of a corporation's voting stock or within the past three years owned 15% or more of a corporation's voting stock. However, in the case of our company, Code Hennessy & Simmons and its affiliates will not be deemed to be "interested stockholders" regardless of the percentage of our voting stock owned by them. The statute could prohibit or delay mergers or other takeover or change in control attempts with respect to us and, accordingly, may discourage attempts to acquire us.
Limitations on Liability and Indemnification of Officers and Directors
Our certificate of incorporation and by-laws limit the liability of our directors to the fullest extent permitted by the Delaware General Corporation Law and provide that we will indemnify our officers and
directors to the fullest extent permitted by this law. We expect to increase our directors' and officers' liability insurance coverage prior to the completion of this offering.
Transfer Agent and Registrar
The transfer agent and registrar for our common stock is American Stock Transfer & Trust Company and its telephone number is .800-937-5449.
SHARES ELIGIBLE FOR FUTURE SALE
The sale of a substantial amount of our common stock in the public market after this offering could adversely affect the prevailing market price of our common stock. Furthermore, because all of our common stock outstanding prior to the consummation of this offering will be subject to the contractual and legal restrictions on resale described below, the sale of a substantial amount of common stock in the public market after these restrictions lapse could adversely affect the prevailing market price of our common stock and our ability to raise equity capital in the future.
Upon completion of this offering, we expect to have outstanding an aggregate of 20,867,172 shares of common stock, assuming no exercise of outstanding options. Of these shares, all of the shares sold in this offering will be freely tradable without restriction or further registration under the Securities Act, unless the shares are purchased by "affiliates" as that term is defined in Rule 144 under the Securities Act. Any shares purchased by an affiliate may not be resold except pursuant to an effective registration statement or an applicable exemption from registration, including an exemption under Rule 144 of the Securities Act. The remaining shares of common stock held by existing stockholders are "restricted securities" as that term is defined in Rule 144 under the Securities Act. These restricted securities may be sold in the public market only if they are registered or if they qualify for an exemption from registration under Rule 144 or Rule 701 under the Securities Act. These rules are summarized below.
Upon the expiration of the lock-up agreements described below 180 days after the date of this prospectus, and subject to the provisions of Rule 144, an additional 12,367,172 restricted shares will be available for sale in the public market. The sale of these restricted securities is subject, in the case of shares held by affiliates, to the volume restrictions contained in Rule 144.
Lock-Up Agreements
We, our directors and executive officers and our stockholders are subject to lock-up agreements with the underwriters. Under these agreements, subject to limited exceptions, neither we nor any of our directors or executive officers or these stockholders may dispose of, hedge or otherwise transfer the economic consequences of ownership of any shares of common stock or securities convertible into or exchangeable or exercisable for shares of common stock. These restrictions will be in effect for a period of 180 days after the date of this prospectus. At any time and without notice, William Blair & Company, L.L.C. may, in its sole discretion, release all or some of the securities from these lock-up agreements. Certain transfers or dispositions can be made sooner, provided the transferee becomes bound to the terms of the lock-up.
In addition, following this offering, some of our stockholders will be subject to restrictions on transfer of their shares under our Investor Securities Agreement and restricted securities agreements. See "Relationships and Transactions with Related Parties."
Rule 144
In general, under Rule 144 as currently in effect, beginning 90 days after the date of this prospectus, a person who has beneficially owned shares of our common stock for at least one year from the later of the
date those shares of common stock were acquired from us or from an affiliate of ours would be entitled to sell within any three-month period a number of shares that does not exceed the greater of:
Sales of shares of common stock under Rule 144 may also be subject to manner of sale provisions and notice requirements and will be subject to the availability of current public information about us.
Rule 144(k)
Under Rule 144(k), a person who is not one of our affiliates at any time during the three months preceding a sale, and who has beneficially owned the shares proposed to be sold for at least two years from the later of the date these shares of common stock were acquired from us or from an affiliate of ours, including the holding period of any prior owner other than an affiliate, is entitled to sell those shares without complying with the manner of sale, public information, volume limitation or notice provisions of Rule 144. Therefore, upon expiration of the lock-up agreements, those shares may be sold immediately.
Rule 701
In general, under Rule 701 of the Securities Act, each of our employees, consultants or advisors who purchased shares from us in connection with a compensatory stock plan or other written agreement is eligible to resell those shares 90 days after the effective date of this offering in reliance on Rule 144, but without compliance with some of the restrictions, including the holding period, contained in Rule 144.
No precise prediction can be made as to the effect, if any, that market sales of shares or the availability of shares for sale will have on the market price of our common stock prevailing from time to time. We are unable to estimate the number of our shares that may be sold in the public market pursuant to Rule 144 or Rule 701 because this will depend on the market price of our common stock, the personal circumstances of the sellers and other factors. Nevertheless, sales of significant amounts of our common stock in the public market could adversely affect the market price of our common stock.
Stock Plans
We intend to file a registration statement or statements on Form S-8 under the Securities Act covering 2,045,065 shares of common stock reserved for issuance under our 2006 stock plan and pursuant to all option grants made prior to this offering under the 2000 stock plan. Subject to lock-up arrangements, these registration statements are expected to be filed as soon as practicable after the closing date of this offering. Shares issued upon the exercise of stock options after the effective date of the applicable Form S-8 registration statement will be eligible for resale in the public market without restriction, subject to Rule 144 limitations applicable to affiliates and the lock-up agreements described above.
Registration Rights
Following this offering, some of our stockholders will, under some circumstances, have the right to require us to register their shares for future sale. See "Description of Capital Stock, Certificate of Incorporation and By-Laws—Registration Rights."
The underwriters named below have severally agreed, subject to the terms and conditions set forth in the underwriting agreement by and among the underwriters, the selling stockholders and us, to purchase from us and the selling stockholders the respective number of shares of common stock set forth opposite each underwriter's name in the table below. William Blair & Company, L.L.C. is acting as Sole Book-Running Manager, Robert W. Baird & Co. Incorporated is acting as Co-Lead Manager and BB&T Capital Markets, a division of Scott & Stringfellow, Inc., is acting as Co-Manager for this offering.
| Underwriter | Number of Shares | ||
|---|---|---|---|
| William Blair & Company, L.L.C. | |||
| Robert W. Baird & Co. Incorporated | |||
| BB&T Capital Markets, a division of Scott & Stringfellow, Inc. | |||
| Total | 8,500,000 | ||
This offering will be underwritten on a firm commitment basis. In the underwriting agreement, the underwriters have agreed, subject to the terms and conditions set forth therein, to purchase the shares of common stock being sold pursuant to this prospectus at a price per share equal to the public offering price less the underwriting discount specified on the cover page of this prospectus. According to the terms of the underwriting agreement, the underwriters either will purchase all of the shares or none of them. In the event of default by any underwriter, in certain circumstances, the purchase commitments of the non-defaulting underwriters may be increased or the underwriting agreement may be terminated.
The representative of the underwriters has advised us that the underwriters propose to offer the common stock to the public initially at the public offering price set forth on the cover page of this prospectus and to selected dealers at such price less a concession of not more than $ per share. The underwriters may allow, and such dealers may re-allow, a concession not in excess of $ per share to certain other dealers. The underwriters will offer the shares subject to prior sale and subject to receipt and acceptance of the shares by the underwriters. The underwriters may reject any order to purchase shares in whole or in part. The underwriters expect that we will deliver the shares to the underwriters through the facilities of The Depository Trust Company in New York, New York on or about , 2006. At that time, the underwriters will pay us for the shares in immediately available funds. After commencement of the public offering, the representative may change the public offering price and other selling terms.
Certain of the selling stockholders have granted the underwriters an option, exercisable within 30 days after the date of this prospectus, to purchase up to an aggregate of 1,275,000 additional shares of common stock at the same price per share to be paid by the underwriters for the other shares offered hereby solely for the purpose of covering over-allotments, if any. If the underwriters purchase any such additional shares pursuant to this option, each of the underwriters will be committed to purchase such additional shares in approximately the same proportion as set forth in the table above. The underwriters may exercise the option only for the purpose of covering excess sales, if any, made in connection with the distribution of the shares of common stock offered hereby. The underwriters will offer any additional shares that they purchase on the terms described in the preceding paragraph.
The underwriters have reserved for sale, at the initial public offering price, up to 425,000 shares of common stock in this offering for our employees.directors, officers, employees and related persons of our company and Code Hennessy & Simmons LLC. Those receiving these reserved shares will not be subject to lock-up agreements by virtue of their having purchased such shares (though an officer or employee could otherwise be subject to a lock-up agreement as an executive officer or optionholder). Purchases of the reserved shares would reduce the number of shares available for sale to the general public. The underwriters will offer any reserved shares which are not so purchased to the general public on the same terms as the other shares being sold in this offering.
The following table summarizes the compensation to be paid by us and the selling stockholders to the underwriters. This information assumes either no exercise or full exercise by the underwriters of their over-allotment option:
| | Per Share | Without Over-Allotment | With Over-Allotment | ||||||
|---|---|---|---|---|---|---|---|---|---|
| Public | $ | $ | $ | ||||||
| Underwriting discount paid by us | $ | $ | $ | ||||||
| Underwriting discount paid by selling stockholders | $ | $ | $ | ||||||
| Proceeds, before expenses, to us | $ | $ | $ | ||||||
| Proceeds to selling stockholders | $ | $ | $ | ||||||
We estimate that our total expenses for this offering, excluding the underwriting discount, will be approximately $$1.5 million.
We and each of our directors, executive officers and our stockholders have agreed, subject to limited exceptions described below, for a period of 180 days after the date of this prospectus, not to, without the prior written consent of William Blair & Company, L.L.C.:
The 180-day lock-up period will be extended if (1) we release earnings results or material news or a material event relating to our company occurs during the last 17 days of the lock-up period, or (2) prior to the expiration of the lock-up period, we announce that we will release earnings results during the 16-day period beginning on the last day of the lock-up period. In either case, the lock-up period will be extended for 18 days after the date of the release of the earnings results or the occurrence of the material news or material event.
This agreement does not extend to transfers or dispositions (i) by gift, (ii) by will or intestate succession to immediate family members, or (iii) to any trust for the direct or indirect benefit of the transferor or his or her immediate family, provided in each case that the recipient of those shares agrees to be bound by the foregoing restrictions for the duration of the 180 days. In determining whether to consent to a transaction prohibited by these restrictions, William Blair & Company, L.L.C. will take into account various factors, including the number of shares requested to be sold, the anticipated manner and timing of sale, the potential impact of the sale on the market for the common stock, the restrictions on publication of research reports that would be imposed by the rules of the National Association of Securities Dealers, Inc. and market conditions generally. We may grant options and issue common stock under existing stock option plans and issue unregistered shares in connection with any outstanding convertible securities or options during the lock-up period. For more information, see "Shares Eligible for Future Sale."
We and certain of the selling stockholders have agreed to indemnify the underwriters and their controlling persons against certain liabilities for misstatements in the registration statement of which this prospectus forms a part, including liabilities under the Securities Act, or to contribute to payments the underwriters may be required to make in respect thereof.
The representative has informed us that, without client authorization, the underwriters will not confirm without client authorization, sales to their client accounts as to which they have discretionary authority. The representative has also
informed us that the underwriters intend to deliver all copies of this prospectus via electronic means, via hand delivery or through mail or courier services and only printed forms of the prospectus are intended to be used.
In connection with this offering, the underwriters and other persons participating in this offering may engage in transactions which affect the market price of the common stock. These may include stabilizing and over-allotment transactions and purchases to cover syndicate short positions. Stabilizing transactions consist of bids or purchases for the purpose of pegging, fixing or maintaining the price of the common stock. An over-allotment involves selling more shares of common stock in this offering than are specified on the cover page of this prospectus, which results in a syndicate short position. The underwriters may cover this short position by purchasing common stock in the open market or by exercising all or part of their over-allotment option. In addition, the representative may impose a penalty bid. This allows the representative to reclaim the selling concession allowed to an underwriter or selling group member if shares of common stock sold by such underwriter or selling group member in this offering are repurchased by the representative in stabilizing or syndicate short covering transactions. These transactions, which may be effected on the Nasdaq National Market or otherwise, may stabilize, maintain or otherwise affect the market price of the common stock and could cause the price to be higher than it would be without these transactions. The underwriters and other participants in this offering are not required to engage in any of these activities and may discontinue any of these activities at any time without notice. We and the underwriters make no representation or prediction as to whether the underwriters will engage in such transactions or choose to discontinue any transactions engaged in or as to the direction or magnitude of any effect that these transactions may have on the price of the common stock.
Prior to this offering, there has been no public market for our common stock. Consequently, we, the selling stockholders and the representative of the underwriters have negotiated to determine the initial public offering price. We and they have considered current market conditions, our operating results in recent periods, the market capitalization of other companies in our industry and estimates of our potential.
We will applyhave applied to have our common stock approved for quotation on the Nasdaq National Market and have reserved the ticker symbol "HWCC."
In the ordinary course of business, some of the underwriters and their affiliates may in the future provide investment banking, commercial banking and other services to us for which they may receive customary fees or other compensation.
The validity of the issuance of the shares of common stock offered hereby has been passed upon for us by Schiff Hardin LLP, Chicago, Illinois. Four partners of Schiff Hardin LLP are partners in a general partnership that is a limited partner in Code, Hennessy & Simmons II, L.P. and may be deemed to have an aggregate economic interest of $852,185 in our shares, having an aggregate value $ , assuming an initial public offering price of $$13.00 per share. In addition, two of these partners are partners in HW Investors, a general partnership that owns 102,424 shares of our common stock.stock and is a selling stockholder. Legal matters in connection with this offering will be passed upon for the underwriters by Sidley Austin LLP, Chicago, Illinois.
Ernst & Young LLP, independent registered public accounting firm, has audited our consolidated financial statements and schedule at December 31, 2005 and December 31, 2004 and for each of the three years in the period ended December 31, 2005, as set forth in their reports. We have included our financial statements and schedule in the prospectus and elsewhere in the registration statement in reliance on Ernst & Young LLP's reports, given on their authority as experts in accounting and auditing.
WHERE YOU CAN FIND MORE INFORMATION
We have filed with the SEC a registration statement on Form S-1, including exhibits and schedules, under the Securities Act with respect to the common stock to be sold in this offering. This prospectus, which constitutes a part of the registration statement, does not contain all of the information set forth in the registration statement or the exhibits and schedules that are part of the registration statement. For further information about us and our common stock, you should refer to the registration statement.
You may read, without charge, and copy, at prescribed rates, all or any portion of the registration statement or any reports, statements or other information in the files at the public reference room at the SEC's principal office at 100 F Street, N.E., Washington, D.C., 20549. You can request copies of these documents upon payment of a duplicating fee by writing to the SEC. You may call the SEC at 1-800-SEC-0330 for further information on the operation of its public reference room. Our filings, including the registration statement, will also be available to you on the internet website maintained by the SEC at http://www.sec.gov.
As a result of this offering, we will become subject to the information and reporting requirements of the Securities Exchange Act and will file annual, quarterly and current reports, proxy statements and other information with the SEC. You can request copies of these documents, for a copying fee, by writing to the SEC. We intend to furnish our stockholders with annual reports containing financial statements audited by our independent auditors.
INDEX TO CONSOLIDATED FINANCIAL STATEMENTS
| | Page | |
|---|---|---|
| Report of Independent Registered Public Accounting Firm | F-2 | |
| Consolidated Balance Sheets as of March 31, 2006 (unaudited), December 31, 2005, and December 31, 2004 | F-3 | |
| Consolidated Statements of Income for the three months ended March 31, 2006 and 2005 (unaudited), and the years ended December 31, 2005, December 31, 2004 and December 31, 2003 | F-4 | |
| Consolidated Statements of Stockholders' Equity for the three months ended March 31, 2006 (unaudited), and the years ended December 31, 2005, December 31, 2004 and December 31, 2003 | F-5 | |
| Consolidated Statements of Cash Flows for the three months ended March 31, 2006 and 2005 (unaudited), and the years ended December 31, 2005, December 31, 2004 and December 31, 2003 | F-6 | |
| Notes to Consolidated Financial Statements | F-7 |
Report of Independent Registered Public Accounting Firm
The Board of Directors and Stockholders
Houston Wire & Cable Company
We have audited the accompanying consolidated balance sheets of Houston Wire & Cable Company (formerly HWC Holding Corporation) as of December 31, 2005 and 2004, and the related consolidated statements of income, stockholders' equity, and cash flows for each of the three years in the period ended December 31, 2005. These financial statements are the responsibility of the Company's management. Our responsibility is to express an opinion on these financial statements based on our audits.
We conducted our audits in accordance with the standards of the Public Company Accounting Oversight Board (United States). Those standards require that we plan and perform the audit to obtain reasonable assurance about whether the financial statements are free of material misstatement. We were not engaged to perform an audit of the Company's internal control over financial reporting. Our audits included consideration of internal control over financial reporting as a basis for designing audit procedures that are appropriate in the circumstances, but not for the purpose of expressing an opinion on the effectiveness of the Company's internal control over financial reporting. Accordingly, we express no such opinion. An audit also includes examining, on a test basis, evidence supporting the amounts and disclosures in the financial statements, assessing the accounting principles used and significant estimates made by management, and evaluating the overall financial statement presentation. We believe that our audits provide a reasonable basis for our opinion.
In our opinion, the financial statements referred to above present fairly, in all material respects, the consolidated financial position of Houston Wire & Cable Company at December 31, 2005 and 2004, and the consolidated results of its operations and its cash flows for each of the three years in the period ended December 31, 2005, in conformity with U.S. generally accepted accounting principles.
/s/ Ernst & Young LLP
Houston, Texas
March 23, 2006, except for Note 9
as to which the date is
May 16, 2006
Houston Wire & Cable Company
Consolidated Balance Sheets
| | | | December 31, | ||||||||||||||||
|---|---|---|---|---|---|---|---|---|---|---|---|---|---|---|---|---|---|---|---|
| | | March 31, 2006 | |||||||||||||||||
| | | December 31, | | 2005 | 2004 | ||||||||||||||
| | | 2005 | 2004 | | (unaudited) | | | ||||||||||||
| | | (In thousands, except share data) | | (In thousands, except share data) | |||||||||||||||
| Assets | Assets | Assets | |||||||||||||||||
| Current assets: | Current assets: | Current assets: | |||||||||||||||||
| Accounts receivable, net | $ | 41,778 | $ | 27,541 | Accounts receivable, net | $ | 39,914 | $ | 41,778 | $ | 27,541 | ||||||||
| Inventories, net | 31,306 | 29,836 | Inventories, net | 40,065 | 31,306 | 29,836 | |||||||||||||
| Deferred income taxes | 826 | 1,343 | Deferred income taxes | 1,121 | 826 | 1,343 | |||||||||||||
| Prepaid expenses | 490 | 416 | Prepaid expenses | 448 | 490 | 416 | |||||||||||||
| Total current assets | Total current assets | 74,400 | 59,136 | Total current assets | 81,548 | 74,400 | 59,136 | ||||||||||||
Property and equipment, net | Property and equipment, net | 2,733 | 2,803 | Property and equipment, net | 2,743 | 2,733 | 2,803 | ||||||||||||
Goodwill | Goodwill | 2,996 | 2,996 | Goodwill | 2,996 | 2,996 | 2,996 | ||||||||||||
| Deferred income taxes | Deferred income taxes | 1,146 | 927 | Deferred income taxes | 800 | 1,146 | 927 | ||||||||||||
| Other assets | Other assets | 435 | 331 | Other assets | 570 | 435 | 331 | ||||||||||||
| Total assets | Total assets | $ | 81,710 | $ | 66,193 | Total assets | $ | 88,657 | $ | 81,710 | $ | 66,193 | |||||||
Liabilities and stockholders' equity | Liabilities and stockholders' equity | Liabilities and stockholders' equity | |||||||||||||||||
| Current liabilities: | Current liabilities: | Current liabilities: | |||||||||||||||||
| Book overdraft | $ | 2,119 | $ | 1,341 | Book overdraft | $ | 2,093 | $ | 2,119 | $ | 1,341 | ||||||||
| Trade accounts payable | 8,268 | 5,115 | Trade accounts payable | 11,277 | 8,268 | 5,115 | |||||||||||||
| Accrued and other current liabilities | 8,351 | 7,686 | Accrued and other current liabilities | 8,720 | 8,351 | 7,686 | |||||||||||||
| Income taxes payable | 824 | 71 | Income taxes payable | 3,244 | 824 | 71 | |||||||||||||
| Current portion of long-term obligations | 3,468 | — | Current portion of long-term obligations | 3,783 | 3,468 | — | |||||||||||||
| Total current liabilities | Total current liabilities | 23,030 | 14,213 | Total current liabilities | 29,117 | 23,030 | 14,213 | ||||||||||||
Long-term obligations | Long-term obligations | 57,938 | 34,193 | Long-term obligations | 53,943 | 57,938 | 34,193 | ||||||||||||
| Junior Subordinated Promissory Notes | Junior Subordinated Promissory Notes | — | 9,559 | Junior Subordinated Promissory Notes | — | — | 9,559 | ||||||||||||
| Stockholders' equity: | Stockholders' equity: | Stockholders' equity: | |||||||||||||||||
| Common stock, $.01 par value; 10,000,000 shares authorized; 8,856,892 issued and outstanding at December 31, 2005 and 2004 | 9 | 9 | Common stock, $.001 par value; 100,000,000 shares authorized; 16,617,172 shares issued and outstanding at March 31, 2006 and 16,606,673 at December 31, 2005 and 2004 | 17 | 17 | 17 | |||||||||||||
| Additional paid-in capital | 1,310 | 5,101 | Additional paid-in capital | 796 | 1,302 | 5,093 | |||||||||||||
| Unearned compensation | (559 | ) | — | Unearned stock compensation | — | (559 | ) | — | |||||||||||
| Retained earnings | — | 3,136 | Retained earnings | 4,802 | — | 3,136 | |||||||||||||
| Treasury shares, at cost | (18 | ) | (18 | ) | Treasury shares, at cost | (18 | ) | (18 | ) | (18 | ) | ||||||||
| Total stockholders' equity | Total stockholders' equity | 742 | 8,228 | Total stockholders' equity | 5,597 | 742 | 8,228 | ||||||||||||
| Total liabilities and stockholders' equity | Total liabilities and stockholders' equity | $ | 81,710 | $ | 66,193 | Total liabilities and stockholders' equity | $ | 88,657 | $ | 81,710 | $ | 66,193 | |||||||
The accompanying notes are an integral part of these consolidated financial statements.
Houston Wire & Cable Company
Consolidated Statements of Income
| | | Three Months Ended March 31, | Year Ended December 31, | ||||||||||||||||||||||||
|---|---|---|---|---|---|---|---|---|---|---|---|---|---|---|---|---|---|---|---|---|---|---|---|---|---|---|---|
| | | Year ended December 31, | | 2006 | 2005 | 2005 | 2004 | 2003 | |||||||||||||||||||
| | | 2005 | 2004 | 2003 | | (unaudited) | | | | ||||||||||||||||||
| | | (In thousands, except per share data) | | (In thousands, except share data) | |||||||||||||||||||||||
| Sales | Sales | $ | 213,957 | $ | 172,723 | $ | 149,084 | Sales | $ | 66,428 | $ | 43,106 | $ | 213,957 | $ | 172,723 | $ | 149,084 | |||||||||
| Cost of sales | Cost of sales | 158,240 | 131,419 | 113,959 | Cost of sales | 48,437 | 31,949 | 158,240 | 131,419 | 113,959 | |||||||||||||||||
| Gross profit | Gross profit | 55,717 | 41,304 | 35,125 | Gross profit | 17,991 | 11,157 | 55,717 | 41,304 | 35,125 | |||||||||||||||||
Operating expenses: | Operating expenses: | Operating expenses: | |||||||||||||||||||||||||
| Salaries and commissions | 18,707 | 16,665 | 14,588 | Salaries and commissions | 5,072 | 4,289 | 18,707 | 16,665 | 14,588 | ||||||||||||||||||
| Other operating expenses | 14,016 | 12,392 | 13,857 | Other operating expenses | 3,748 | 3,408 | 14,016 | 12,392 | 13,857 | ||||||||||||||||||
| Management fee to stockholder | 500 | 501 | 502 | Management fee to stockholder | 125 | 125 | 500 | 501 | 502 | ||||||||||||||||||
| Litigation settlements | (672 | ) | (650 | ) | — | Litigation settlements | — | (672 | ) | (672 | ) | (650 | ) | — | |||||||||||||
| Depreciation and amortization | 398 | 876 | 1,481 | Depreciation and amortization | 93 | 110 | 398 | 876 | 1,481 | ||||||||||||||||||
| 32,949 | 29,784 | 30,428 | 9,038 | 7,260 | 32,949 | 29,784 | 30,428 | ||||||||||||||||||||
| Operating income | Operating income | 22,768 | 11,520 | 4,697 | Operating income | 8,953 | 3,897 | 22,768 | 11,520 | 4,697 | |||||||||||||||||
| Interest expense | Interest expense | (2,955 | ) | (3,544 | ) | (4,186 | ) | Interest expense | 1,054 | 713 | 2,955 | 3,544 | 4,186 | ||||||||||||||
| Income before income taxes | Income before income taxes | 19,813 | 7,976 | 511 | Income before income taxes | 7,899 | 3,184 | 19,813 | 7,976 | 511 | |||||||||||||||||
| Income tax provision | Income tax provision | 7,299 | 3,167 | 295 | Income tax provision | 3,097 | 1,173 | 7,299 | 3,167 | 295 | |||||||||||||||||
| Net income | Net income | $ | 12,514 | $ | 4,809 | $ | 216 | Net income | $ | 4,802 | $ | 2,011 | $ | 12,514 | $ | 4,809 | $ | 216 | |||||||||
Earnings per share: | Earnings per share: | Earnings per share: | |||||||||||||||||||||||||
| Basic | $ | 1.41 | $ | 0.55 | $ | 0.02 | Basic | $ | 0.29 | $ | 0.12 | $ | 0.75 | $ | 0.29 | $ | 0.01 | ||||||||||
| Diluted | $ | 1.40 | $ | 0.55 | $ | 0.02 | Diluted | $ | 0.29 | $ | 0.12 | $ | 0.75 | $ | 0.29 | $ | 0.01 | ||||||||||
| Weighted average common shares outstanding: | Weighted average common shares outstanding: | Weighted average common shares outstanding: | |||||||||||||||||||||||||
| Basic | 8,856,892 | 8,720,248 | 8,711,509 | Basic | 16,613,702 | 16,606,673 | 16,606,673 | 16,350,465 | 16,334,079 | ||||||||||||||||||
| Diluted | 8,937,228 | 8,810,987 | 8,802,248 | Diluted | 16,710,098 | 16,697,153 | 16,757,303 | 16,520,601 | 16,504,215 | ||||||||||||||||||
The accompanying notes are an integral part of these consolidated financial statements.
Houston Wire & Cable Company
Consolidated Statements of Stockholders' Equity
| | Common Stock | | | | Treasury Stock | | ||||||||||||||||||
|---|---|---|---|---|---|---|---|---|---|---|---|---|---|---|---|---|---|---|---|---|---|---|---|---|
| | Additional Paid-In Capital | Unearned Compensation | Retained Earnings (Deficit) | Total Stockholders' Equity | ||||||||||||||||||||
| | Shares | Amount | Shares | Amount | ||||||||||||||||||||
| | (In thousands, except per share data) | |||||||||||||||||||||||
| Balance at December 31, 2002 | 8,716,309 | $ | 9 | 5,046 | — | $ | (1,889 | ) | 4,800 | $ | 18 | ) | $ | 3,148 | ||||||||||
| Net income | — | — | — | — | 216 | — | — | 216 | ||||||||||||||||
| Balance at December 31, 2003 | 8,716,309 | 9 | 5,046 | — | (1,673 | ) | 4,800 | (18 | ) | 3,364 | ||||||||||||||
| Exercise of stock options | 145,383 | — | 55 | — | — | — | — | 55 | ||||||||||||||||
| Net income | — | — | — | — | 4,809 | — | — | 4,809 | ||||||||||||||||
| Balance at December 31, 2004 | 8,861,692 | 9 | 5,101 | — | 3,136 | 4,800 | (18 | ) | 8,228 | |||||||||||||||
| Net income | — | — | — | — | 12,514 | — | — | 12,514 | ||||||||||||||||
| Issuance of stock options | — | — | 559 | (559 | ) | — | — | — | — | |||||||||||||||
| Dividend paid | — | — | (4,350 | ) | — | (15,650 | ) | — | — | (20,000 | ) | |||||||||||||
| Balance at December 31, 2005 | 8,861,692 | $ | 9 | $ | 1,310 | $ | (559 | ) | $ | — | 4,800 | $ | (18 | ) | $ | 742 | ||||||||
| | Common Stock | | | | Treasury Stock | | ||||||||||||||||||
|---|---|---|---|---|---|---|---|---|---|---|---|---|---|---|---|---|---|---|---|---|---|---|---|---|
| | Additional Paid-In Capital | Unearned Stock Compensation | Retained Earnings (Deficit) | Total Stockholders' Equity | ||||||||||||||||||||
| | Shares | Amount | Shares | Amount | ||||||||||||||||||||
| | (In thousands, except per share data) | |||||||||||||||||||||||
| Balance at December 31, 2002 | 16,343,078 | $ | 16 | 5,039 | $ | — | $ | (1,889 | ) | 9,000 | $ | (18 | ) | $ | 3,148 | |||||||||
| Net income | — | — | — | — | 216 | — | — | 216 | ||||||||||||||||
| Balance at December 31, 2003 | 16,343,078 | 16 | 5,039 | — | (1,673 | ) | 9,000 | (18 | ) | 3,364 | ||||||||||||||
| Exercise of stock options | 272,594 | 1 | 54 | — | — | — | — | 55 | ||||||||||||||||
| Net income | — | — | — | — | 4,809 | — | — | 4,809 | ||||||||||||||||
| Balance at December 31, 2004 | 16,615,672 | 17 | 5,093 | — | 3,136 | 9,000 | (18 | ) | 8,228 | |||||||||||||||
| Net income | — | — | — | — | 12,514 | — | — | 12,514 | ||||||||||||||||
| Issuance of stock options | — | — | 559 | (559 | ) | — | — | — | — | |||||||||||||||
| Dividend paid | — | — | (4,350 | ) | — | (15,650 | ) | — | — | (20,000 | ) | |||||||||||||
| Balance at December 31, 2005 | 16,615,672 | 17 | 1,302 | (559 | ) | — | 9,000 | (18 | ) | 742 | ||||||||||||||
| Net income (unaudited) | — | — | — | — | 4,802 | — | — | 4,802 | ||||||||||||||||
| Excess tax benefit for stock options (unaudited) | — | — | 20 | — | — | — | — | 20 | ||||||||||||||||
| Exercise of stock options (unaudited) | 10,500 | — | 6 | — | — | — | — | 6 | ||||||||||||||||
| Reclassification for adoption of SFAS 123(R) (unaudited) | — | — | (559 | ) | 559 | — | — | — | — | |||||||||||||||
| Amortization of unearned stock compensation (unaudited) | — | — | 27 | — | — | — | — | 27 | ||||||||||||||||
| Balance at March 31, 2006 (unaudited) | 16,626,172 | $ | 17 | $ | 796 | $ | — | $ | 4,802 | 9,000 | $ | (18 | ) | $ | 5,597 | |||||||||
The accompanying notes are an integral part of these consolidated financial statements.
Houston Wire & Cable Company
Consolidated Statements of Cash Flows
| | | Three Months Ended March 31, | Year Ended December 31, | |||||||||||||||||||||||||||
|---|---|---|---|---|---|---|---|---|---|---|---|---|---|---|---|---|---|---|---|---|---|---|---|---|---|---|---|---|---|---|
| | | Year ended December 31, | | 2006 | 2005 | 2005 | 2004 | 2003 | ||||||||||||||||||||||
| | | 2005 | 2004 | 2003 | | (unaudited) | | | | |||||||||||||||||||||
| | | (In thousands) | | (In thousands) | ||||||||||||||||||||||||||
| Operating activities | Operating activities | Operating activities | ||||||||||||||||||||||||||||
| Net income | Net income | $ | 12,514 | $ | 4,809 | $ | 216 | Net income | $ | 4,802 | $ | 2,011 | $ | 12,514 | $ | 4,809 | $ | 216 | ||||||||||||
| Adjustments to reconcile net income to net cash provided by (used in) operating activities: | Adjustments to reconcile net income to net cash provided by (used in) operating activities: | Adjustments to reconcile net income to net cash provided by (used in) operating activities: | ||||||||||||||||||||||||||||
| Depreciation and amortization | 93 | 110 | 398 | 876 | 1,481 | |||||||||||||||||||||||||
| Depreciation and amortization | 398 | 876 | 1,481 | Amortization of capitalized loan costs | 76 | 31 | 124 | 125 | 286 | |||||||||||||||||||||
| Amortization of capitalized loan costs | 124 | 125 | 286 | Amortization of unearned stock compensation | 27 | — | — | — | — | |||||||||||||||||||||
| Deferred interest | — | 2,344 | 2,605 | Deferred interest | — | 289 | — | 2,344 | 2,605 | |||||||||||||||||||||
| Provision for doubtful accounts | 13 | 304 | 171 | Provision for doubtful accounts | — | 23 | 13 | 304 | 171 | |||||||||||||||||||||
| Provision for inventory obsolescence | (196 | ) | 696 | 173 | Provision for inventory obsolescence | (75 | ) | (49 | ) | (196 | ) | 696 | 173 | |||||||||||||||||
| (Gain) loss on disposals of property and equipment | (11 | ) | 2 | 4 | (Gain) loss on disposals of property and equipment | — | (5 | ) | (11 | ) | 2 | 4 | ||||||||||||||||||
| Deferred income taxes | 298 | 387 | 218 | Deferred income taxes | 51 | (151 | ) | 298 | 387 | 218 | ||||||||||||||||||||
| Changes in operating assets and liabilities: | Changes in operating assets and liabilities: | |||||||||||||||||||||||||||||
| Accounts receivable | (14,250 | ) | (6,201 | ) | (892 | ) | Accounts receivable | 1,864 | 2,895 | (14,250 | ) | (6,201 | ) | (892 | ) | |||||||||||||||
| Inventories | (1,274 | ) | (3,627 | ) | 7,648 | Inventories | (8,684 | ) | (872 | ) | (1,274 | ) | (3,627 | ) | 7,648 | |||||||||||||||
| Prepaid expenses | (74 | ) | (63 | ) | (55 | ) | Prepaid expenses | 42 | (198 | ) | (74 | ) | (63 | ) | (55 | ) | ||||||||||||||
| Other assets | 10 | (30 | ) | (1 | ) | Other assets | 3 | (10 | ) | 10 | (30 | ) | (1 | ) | ||||||||||||||||
| Book overdraft | (5,944 | ) | 7,889 | (215 | ) | Book overdraft | (26 | ) | (417 | ) | (5,944 | ) | 7,889 | (215 | ) | |||||||||||||||
| Trade accounts payable | 3,153 | 1,671 | 310 | Trade accounts payable | 3,009 | 1,787 | 3,153 | 1,671 | 310 | |||||||||||||||||||||
| Accrued and other current liabilities | 665 | 2,761 | 337 | Accrued and other current liabilities | 369 | (1,658 | ) | 665 | 2,761 | 337 | ||||||||||||||||||||
| Income taxes payable | 753 | 71 | — | Income taxes payable | 2,420 | 1,232 | 753 | 71 | — | |||||||||||||||||||||
| Net cash provided by (used in) operating activities | Net cash provided by (used in) operating activities | (3,821 | ) | 12,014 | 12,286 | Net cash provided by (used in) operating activities | 3,971 | 5,018 | (3,821 | ) | 12,014 | 12,286 | ||||||||||||||||||
| Investing activities | Investing activities | Investing activities | ||||||||||||||||||||||||||||
| Expenditures for property, plant, and equipment | (329 | ) | (208 | ) | (290 | ) | Expenditures for property, plant, and equipment | (104 | ) | (86 | ) | (329 | ) | (208 | ) | (290 | ) | |||||||||||||
| Proceeds from disposals of property and equipment | 12 | 1 | 4 | Proceeds from disposals of property and equipment | — | 5 | 12 | 1 | 4 | |||||||||||||||||||||
| Net cash used in investing activities | (317 | ) | (207 | ) | (286 | ) | Net cash used in investing activities | (104 | ) | (81 | ) | (317 | ) | (207 | ) | (286 | ) | |||||||||||||
| Financing activities | Financing activities | Financing activities | ||||||||||||||||||||||||||||
| Borrowings on revolver | 225,022 | 177,428 | 142,555 | Borrowings on revolver | 65,850 | 39,978 | 225,022 | 177,428 | 142,555 | |||||||||||||||||||||
| Payments on revolver | (205,587 | ) | (175,290 | ) | (150,530 | ) | Payments on revolver | (68,899 | ) | (44,915 | ) | (205,587 | ) | (175,290 | ) | (150,530 | ) | |||||||||||||
| Borrowings on long-term obligations | 14,500 | — | — | Borrowings on long-term obligations | — | — | 14,500 | — | — | |||||||||||||||||||||
| Payments on long-term obligations | — | — | (3,750 | ) | Payments on long-term obligations | (631 | ) | — | — | — | (3,750 | ) | ||||||||||||||||||
| Payments on junior subordinated debt | (9,559 | ) | (14,000 | ) | — | Payments on junior subordinated debt | — | — | (9,559 | ) | (14,000 | ) | — | |||||||||||||||||
| Payments for financing costs | (238 | ) | — | (275 | ) | Payments for financing costs | — | — | (238 | ) | — | (275 | ) | |||||||||||||||||
| Proceeds from exercise of stock options | — | 55 | — | Proceeds from exercise of stock options | 6 | — | — | 55 | — | |||||||||||||||||||||
| Dividends paid | (20,000 | ) | — | — | Dividends paid | — | — | (20,000 | ) | — | — | |||||||||||||||||||
| Payment of offering costs | (213 | ) | — | — | — | — | ||||||||||||||||||||||||
| Excess tax benefit for options | 20 | — | — | — | — | |||||||||||||||||||||||||
| Net cash provided by (used in) financing activities | Net cash provided by (used in) financing activities | 4,138 | (11,807 | ) | (12,000 | ) | Net cash provided by (used in) financing activities | (3,867 | ) | (4,937 | ) | 4,138 | (11,807 | ) | (12,000 | ) | ||||||||||||||
| Net change in cash | Net change in cash | — | — | — | Net change in cash | — | — | — | — | — | ||||||||||||||||||||
| Cash at beginning of year | — | — | — | |||||||||||||||||||||||||||
| Cash at beginning of period | Cash at beginning of period | — | — | — | — | — | ||||||||||||||||||||||||
| Cash at end of year | $ | — | $ | — | $ | — | ||||||||||||||||||||||||
| Cash at end of period | Cash at end of period | $ | — | $ | — | $ | — | $ | — | $ | — | |||||||||||||||||||
| Supplemental disclosures | Supplemental disclosures | Supplemental disclosures | ||||||||||||||||||||||||||||
| Cash paid during the year for interest | $ | 1,910 | $ | 1,044 | $ | 1,358 | Cash paid during the period for interest | $ | 981 | $ | 379 | $ | 1,910 | $ | 1,044 | $ | 1,358 | |||||||||||||
| Cash paid during the year for taxes | $ | 6,356 | $ | 2,637 | $ | 101 | Cash paid (received) during the period for income taxes | $ | 615 | $ | (1 | ) | $ | 6,356 | $ | 2,637 | $ | 101 | ||||||||||||
The accompanying notes are an integral part of these consolidated financial statements.
Notes to Consolidated Financial Statements
(in thousands, except per share data)
1. Organization and Summary of Significant Accounting Policies
Description of Business
Houston Wire & Cable Company ("HWC" or the "Company") through its wholly owned subsidiaries, HWC Wire & Cable Company, Advantage Wire & Cable and Cable Management Services Inc., distributes specialty electrical wire and cable to the U.S. electrical distribution market through eleven locations in ten states throughout the United States. The Company has no other business activity.
Basis of Presentation
The consolidated financial statements as of March 31, 2006 and for the three months ended March 31, 2006 and 2005 have been prepared in accordance with generally accepted accounting principles for interim financial information and Article 10 of Regulation S-X. Accordingly, they do not include all of the information and footnotes required by U.S. generally accepted accounting principles for complete financial statements. In the opinion of management, all adjustments, consisting only of normal recurring accruals, considered necessary for a fair presentation of the results of these interim periods have been included. The results of operations for the three months ended March 31, 2006 are not necessarily indicative of the results that may be expected for the full year. All financial statement amounts and disclosures related to the three month periods ended March 31, 2006 and 2005 are unaudited.
On March 23, 2006, HWC Holding Corporation amended its certificate of incorporation to change its name to Houston Wire & Cable Company and to increase its authorized capital stock from 10,000 shares of common stock to 100,000 shares of common stock and 5,000 shares of preferred stock. All references to authorized shares in the accompanying consolidated financial statements have been retroactively restated for such increase in authorized shares. Also on March 23, 2006 the Company's operating subsidiary, formerly Houston Wire & Cable Company, changed its name to HWC Wire & Cable Company.
Principles of Consolidation
The consolidated financial statements include the accounts of the Company and its subsidiaries and have been prepared following accounting principles generally accepted in the United States ("GAAP") and the requirements of the Securities and Exchange Commission ("SEC"). The financial statements include all normal and recurring adjustments that are necessary for a fair presentation of the Company's financial position and operating results. All significant inter-company balances and transactions have been eliminated.
Use of Estimates
The preparation of the financial statements in conformity with accounting principles generally accepted in the United StatesGAAP requires management to make estimates and assumptions that affect the amounts reported in the financial statements and accompanying notes. The most significant estimates are those relating to the allowance for doubtful accounts, the inventory obsolescence reserve and the reserve for returns and allowances. These estimates are continually reviewed and adjusted as necessary, but actual results could differ from those estimates.
Earnings Per Share
In accordance with Statement of Financial Accounting Standards ("SFAS") 128,Earnings per Share, basic earnings per share is calculated by dividing net income by the weighted average number of common shares outstanding. Diluted earnings per share include the dilutive effects of stock option awards.
The following reconciles the numerator and denominator used in the calculation of earnings per share:
| | Year ended December 31 | |||||||||
|---|---|---|---|---|---|---|---|---|---|---|
| | 2005 | 2004 | 2003 | |||||||
| Numerator: | ||||||||||
| Net income | $ | 12,514 | $ | 4,809 | $ | 216 | ||||
| Effect of dilutive securities | — | — | — | |||||||
| Numerator for net income | $ | 12,514 | $ | 4,809 | $ | 216 | ||||
| Denominator: | ||||||||||
| Weighted average common shares | 8,857 | 8,720 | 8,712 | |||||||
| Effect of dilutive securities | 80 | 91 | 90 | |||||||
| Denominator for net income | 8,937 | 8,811 | 8,802 | |||||||
| | Three Months Ended March 31, | Year Ended December 31, | ||||||||||||||
|---|---|---|---|---|---|---|---|---|---|---|---|---|---|---|---|---|
| | 2006 | 2005 | 2005 | 2004 | 2003 | |||||||||||
| | (unaudited) | | | | ||||||||||||
| Numerator: | ||||||||||||||||
| Net income for basic earnings per share | $ | 4,802 | $ | 2,011 | $ | 12,514 | $ | 4,809 | $ | 216 | ||||||
| Effect of dilutive securities | — | — | — | — | — | |||||||||||
| Numerator for diluted earnings per share | $ | 4,802 | $ | 2,011 | $ | 12,514 | $ | 4,809 | $ | 216 | ||||||
| Denominator: | ||||||||||||||||
| Weighted average common shares for basic earnings per share | 16,614 | 16,607 | 16,607 | 16,350 | 16,334 | |||||||||||
| Effect of dilutive securities | 96 | 90 | 150 | 171 | 170 | |||||||||||
| Denominator for diluted earnings per share | 16,710 | 16,697 | 16,757 | 16,521 | 16,504 | |||||||||||
Accounts Receivable
Accounts receivable consists primarily of receivables from customers, less an allowance for doubtful accounts of $447 at March 31, 2006 and $447 and $475 at December 31, 2005 and 2004, respectively. Consistent with industry practices, we normally require payment from our customers within 30 days. The Company has no contractual repurchase arrangements with its customers.
Inventories
Inventories consist of goods purchased for resale and are carried at the lower of cost, using the average cost method, or market and consist primarily of goods purchased for resale, less a reserve for obsolescence and unusable items. The reserve for inventory is based upon a number of factors, including the experience of the purchasing and sales departments, age of the inventory, new product offerings, and other factors. Management believes that the reserve for inventory may periodically require adjustment as the factors identified above change. The inventory reserve was $1,909 at March 31, 2006 and $1,908 and $2,374 at December 31, 2005 and 2004, respectively.
Vendor Rebates
We account for vendor rebates in accordance with the Emerging Issues Task Force Issue 02-16,Accounting by a Customer (Including a Reseller) for Certain Consideration Received from a Vendor. Many of our arrangements with our vendors provide for us to receive a rebate of a specified amount of consideration, payable to us when we achieve any of a number of measures, generally related to the volume level of purchases from our vendors. We account for such rebates as a reduction of the prices of the vendor's products and therefore as a reduction of inventory until we sell the product, at which time such rebates reduce cost of sales in the income statement. Throughout the year, we estimate the amount of the rebate earned based on our estimate of purchases to date relative to the purchase levels that mark our progress toward earning the rebates. We continually revise these estimates to reflect actual rebates earned based on actual purchase levels.
Other Assets
Other assets include deferred financing costs of approximately $1,716. The capitalized loan costs are amortized on a straight-line basis over the contractual life of the related debt agreement, which approximates the effective interest method.method, and such amortization expense is included in interest expense in the accompanying consolidated statements of income. Accumulated amortization at March 31, 2006, December 31, 2005 and 2004, was approximately $1,388, $1,313 and $1,189, respectively.
Estimated future amortization expense for capitalized loan costs through the maturity of the agreement in 2007 are $303 in 2006 and $100 in 2007.
A $3,000 non-compete agreement is also included in other assets. The non-compete agreement was amortized on a straight-line basis over its four-year term through 2004 when it was fully amortized. Amortization expense was $312 for the year ended December 31, 2004 and $750 for the year ended December 31, 2003.
Property and Equipment
The Company provides for depreciation on a straight-line method over the following estimated useful lives:
| Buildings | 30 years | |
| Machinery and equipment | 3 to 5 years |
Leasehold improvements are depreciated over their estimated life or the term of the lease, whichever is shorter. Depreciation expense was approximately $398, $564 and $731 for the years ended December 31, 2005, 2004 and 2003, respectively.
Goodwill
The Company accounts for goodwill under the provisions of SFAS No. 142,Goodwill and Other Intangible Assets ("SFAS 142"). Under SFAS 142, goodwill is not amortized but is reviewed annually for impairment, or more frequently if indications of possible impairment exist, by applying a fair value-based test. The Company completes the required annual assessment as of October 1 of each year. The Company has performed the requisite impairment tests for goodwill and other indefinite-lived intangible assets and has determined that goodwill was not impaired.
Segment Reporting
SFAS No. 131,Disclosures about Segments of an Enterprise and Related Information,establishes standards for the way that public companies report information about operating segments in annual financial statements and for related disclosures about products and services, geographic areas and major customers. The Company operates in a single operating and reporting segment, sales of specialty electric wire and cable.
Self Insurance
The Company retains certain self-insurance risks for both health benefits and property and casualty insurance programs. The Company limits its exposure to these self insurance risks by maintaining excess and aggregate liability coverage. Self insurance reserves are established based on claims filed and estimates of
claims incurred but not reported. The estimates are based on information provided to the Company by its claims administrators.
Advertising Costs
Advertising costs are expensed when incurred. Advertising expenses were $610, $319 and $310 for the years ended December 31, 2005, 2004, and 2003, respectively.
Revenue Recognition
The Company recognizes revenue in accordance with SEC Staff Accounting Bulletin ("SAB") 104,Revenue Recognition in Financial Statements, and the appropriate amendments. SAB 104 requires that four basic criteria must be met before we can recognize revenue:
The Company records revenue when customers take delivery of products. Customers may pick up products at any warehouse location, or products may be delivered via third party carriers. Products shipped via third party carriers are considered delivered based on the shipping terms, which are generally FOB shipping point. Normal payment terms are net 30 days. Customers are permitted to return product only on a case-by-case basis. Product exchanges are handled as a credit, with the replacement parts being re-invoiced to the customer. The Company has no installation obligations.
The Company may offer volume rebates, which are accrued monthly as an adjustment to net sales. Customer returns are recorded as an adjustment to net sales. In the past, customer returns have not been material.
Shipping and Handling
The Company incurs shipping and handling costs in the normal course of business. Freight amounts invoiced to customers are included as sales and freight charges are included as a component of cost of sales.
Credit Risk
The Company's customers are located primarily throughout the United States. One customer accounted for approximately 11%, 10% and 9% of the Company's sales in 2005, 2004 and 2003, respectively. The Company performs periodic credit evaluations of its customers and generally does not require collateral. Credit losses have been within management's expectations.
Financial Instruments
The carrying values of the accounts receivable, trade accounts payable and accrued and other current liabilities approximate fair value, due to the short maturity of these instruments. The carrying amount of long term debt approximates fair value as it bears interest at variable rates.
Stock-Based Compensation
Under the provisions of SFAS 123,Accounting for Stock-Based Compensation ("SFAS 123"), companies may account for employee stock options using either (i) SFAS 123's fair value method or (ii) the intrinsic value method provided by Accounting Principles Board Opinion 25,Accounting for Stock Issued to Employees ("APB 25"). Under the SFAS 123 fair value method, companies recognize compensation expense related to employee stock options based on the fair value of the options on the grant date as estimated by an option pricing model. The intrinsic value method prescribed by APB 25 requires recognition of compensation expense over the option vesting period when the exercise price of the granted options is less than the stock's fair market price on the grant date.
ThePrior to January 1, 2006, the Company accountsaccounted for its employee stock options under the intrinsic value method described by APB 25. Accordingly, the Company doesdid not record compensation expense for options issued with an exercise price equal to the stock's fair market price on the grant date. Additionally, the stock compensation expense recorded in 2005 for the stock options granted below the Company's estimate of its stock's fair
market value was less than $1, as those options were granted on December 30, 2005. As a result of this grant, the Company recorded $559 of unearned compensation that will be amortized over the vesting period of five years.
If the Company had accounted for stock-based compensation prior to January 1, 2006 using the fair value method described in SFAS 123, the Company's net income and earnings per share would have been reduced to the pro-forma amounts below:
| | | Year Ended December 31, | | Year Ended December 31, | ||||||||||||||||
|---|---|---|---|---|---|---|---|---|---|---|---|---|---|---|---|---|---|---|---|---|
| | | 2005 | 2004 | 2003 | | 2005 | 2004 | 2003 | ||||||||||||
| Reported net income | Reported net income | $ | 12,514 | $ | 4,809 | $ | 216 | Reported net income | $ | 12,514 | $ | 4,809 | $ | 216 | ||||||
| Deduct: Stock-based employee compensation expense determined under fair value method for all awards, net of tax effect | Deduct: Stock-based employee compensation expense determined under fair value method for all awards, net of tax effect | (1 | ) | (1 | ) | — | Deduct: Stock-based employee compensation expense determined under fair value method for all awards, net of tax effect | (1 | ) | (1 | ) | — | ||||||||
| Pro-forma net income | Pro-forma net income | $ | 12,513 | $ | 4,808 | $ | 216 | Pro-forma net income | $ | 12,513 | $ | 4,808 | $ | 216 | ||||||
| Basic earnings per share: | Basic earnings per share: | Basic earnings per share: | ||||||||||||||||||
| As reported | $ | 1.41 | $ | 0.55 | $ | 0.02 | As reported | $ | 0.75 | $ | 0.29 | $ | 0.01 | |||||||
| Pro-forma | $ | 1.41 | $ | 0.55 | $ | 0.02 | Pro-forma | $ | 0.75 | $ | 0.29 | $ | 0.01 | |||||||
| Diluted earnings per share: | Diluted earnings per share: | Diluted earnings per share: | ||||||||||||||||||
| As reported | $ | 1.40 | $ | 0.55 | $ | 0.02 | As reported | $ | 0.75 | $ | 0.29 | $ | 0.01 | |||||||
| Pro-forma | $ | 1.40 | $ | 0.55 | $ | 0.02 | Pro-forma | $ | 0.75 | $ | 0.29 | $ | 0.01 | |||||||
For purposes of pro-forma disclosures prior to January 1, 2006, the estimated fair value of employee options iswas ratably expensed over the options' vesting period. We estimated the fair value of these options at the grant date using the minimum value option pricing model with the following weighted average assumptions:
| | December 31, | Year Ended December 31, | ||||||||
|---|---|---|---|---|---|---|---|---|---|---|
| | 2005 | 2004 | 2005 | 2004 | ||||||
| Risk-free interest rate | 4.33 | % | 3.13 | % | 4.33 | % | 3.13 | % | ||
| Expected dividend yield | 0.0 | % | 0.0 | % | 0.0 | % | 0.0 | % | ||
| Weighted average expected life | 5.0 years | 5.0 years | 5.0 years | 5.0 years | ||||||
In December 2004, the FASB issued SFAS 123(R),Share-Based Payment.Payment ("SFAS 123(R)"). This new standard will requirerequires companies to recognize compensation cost for stock options and other stock-based awards based on their fair value as measured on the grant date. The new standard prohibits companies from accounting for stock-based compensation under the provisions of APB 25.
TheEffective January 1, 2006 the Company adopted SFAS 123(R) effective January 1, 2006 and is currently in the process of implementing the provisions of the statement. The Company is required to useusing the prospective transition method and, therefore, the impact on the Company's net income will includesubsequent to January 1, 2006 includes the remaining amortization of the intrinsic value of existing stock-based awards discussed above, plus the fair value of any future grants. The Company expects such expense to total approximately $112 for the year ending December 31, 2006 if no additional grants are issued. See Note 7 for additional information.
Income Taxes
Deferred income taxes are determined by the liability method in accordance with SFAS No. 109,Accounting for Income Taxes. Under this method, deferred tax assets and liabilities are determined based on differences between the carrying amounts of assets and liabilities for financial reporting purposes and the amounts used for income tax purposes and are measured using the enacted tax rates and laws that will be in effect when the differences are expected to reverse.
2. Detail of Selected Balance Sheet Accounts
The following selected financial data as of December 31, 2005 and 2004 has been derived from our audited financial statements.
Property and Equipment
Property and equipment are stated at cost and consist of the following at:
| | | December 31, | |||||||||||||
|---|---|---|---|---|---|---|---|---|---|---|---|---|---|---|---|
| | March 31, 2006 | ||||||||||||||
| | December 31, | 2005 | 2004 | ||||||||||||
| | 2005 | 2004 | (unaudited) | | | ||||||||||
| Land | $ | 617 | $ | 617 | $ | 617 | $ | 617 | $ | 617 | |||||
| Buildings | 2,057 | 2,057 | 2,057 | 2,057 | 2,057 | ||||||||||
| Machinery and equipment | 4,613 | 4,316 | 4,717 | 4,613 | 4,316 | ||||||||||
| 7,287 | 6,990 | 7,391 | 7,287 | 6,990 | |||||||||||
| Less accumulated depreciation | 4,554 | 4,187 | 4,648 | 4,554 | 4,187 | ||||||||||
| $ | 2,733 | $ | 2,803 | $ | 2,743 | $ | 2,733 | $ | 2,803 | ||||||
Accrued and Other Current Liabilities
| | | December 31, | |||||||||||||
|---|---|---|---|---|---|---|---|---|---|---|---|---|---|---|---|
| | March 31, 2006 | ||||||||||||||
| | December 31, | 2005 | 2004 | ||||||||||||
| | 2005 | 2004 | (unaudited) | | | ||||||||||
| Customer rebates | $ | 2,292 | $ | 1,656 | $ | 1,015 | $ | 2,292 | $ | 1,656 | |||||
| Payroll, commissions, and bonuses | 2,096 | 1,508 | 1,455 | 2,096 | 1,508 | ||||||||||
| Accrued inventory purchases | 900 | 910 | 1,745 | 900 | 910 | ||||||||||
| Other | 3,063 | 3,612 | 4,505 | 3,063 | 3,612 | ||||||||||
| $ | 8,351 | $ | 7,686 | $ | 8,720 | $ | 8,351 | $ | 7,686 | ||||||
3. Long-Term Obligations
HWC Wire & Cable Company has a loan and security agreement ("Agreement") with Bank of America and one other syndication bank ("Lender"). The Agreement is guaranteed by HWC through the pledging of its interest in the capital stock of HWC Wire & Cable Company. Additionally, theHWC Wire & Cable Company has provided to the Lender a security interest in all of its assets, including accounts receivable inventory, and all assets owned by the Company and HWC Wire & Cable Company.inventory. The Agreement, which matures May 1, 2007, consists of a $4,500 term loan A commitment ("Term A") and a $10,000 term loan B commitment ("Term B") with
scheduled principal installments and interest at the Lender's base interest rate plus 0.25% and 1.25% respectively, and a $55,000 revolving loan ("Revolver") with interest at the Lender's base interest rate plus 0.25%.
Portions of the outstanding loans under the Agreement may be converted to LIBOR loans in minimum amounts of $1,000 and integral multiples of $100. Upon such conversion, interest is payable at LIBOR plus 1.75% for the Revolver and the Term A loan and at LIBOR plus 2.75% for the Term B loan. The Company has entered into a series of one-month LIBOR loans, which upon maturity are either rolled back into the Revolver or renewed under a new LIBOR contract.
The Agreement includes, among other things, covenants that require the Company to maintain certain minimum financial ratios. Additionally, the Agreement allows the Company to pay dividends not to exceed $20,000, limits capital expenditures and requires that 75% of the Excess Cash Flow (as defined) commencing with the fiscal year ending December 31, 2006, be paid to the Lender. In addition, monthly principal repayments effective February 1, 2006 through the maturity date are required for the Term A and Term B loans in the amounts of $38 and $278, respectively. The Company is in compliance with the financial covenants governing its indebtedness.
In 1997, the Company issued approximately $9,000 of Junior Subordinated Promissory Notes (the "Notes"), which bore interest at a rate of 14% per annum to certain stockholders and officers of the Company. On May 22 of each year, accrued interest was rolled into the principal amount of the Notes. The principal amount of the Notes, together with all unpaid interest accrued was due and payable on May 22, 2007.
On May 13, 2004, and on December 30, 2004, the Company made equal payments of $7,000 to reduce the borrowings under the Notes. Substantially all of the December 30, 2004 $7,000 payment had not cleared the Company's operating bank account at December 31, 2004, which resulted in an increase in the Company's book overdraft of approximately $6,722. Since the book overdraft was funded by the Company's Revolver in January 2005, this book overdraft has been included in long-term obligations in the accompanying consolidated balance sheet at December 31, 2004.
On June 1, 2005 the Company made an additional payment of $6,000 and paid, on November 10, 2005 paid the remaining balance of all principal and interest due in the amount of approximately $4,319.
The Company's borrowings and related weighted average interest rates consisted of the following:
| | | 2005 Weighted Average Interest Rate | December 31, | ||||||||||||||||
|---|---|---|---|---|---|---|---|---|---|---|---|---|---|---|---|---|---|---|---|
| | | December 31, | March 31, 2006 | ||||||||||||||||
| | Weighted Average Interest Rate | 2005 | 2005 Weighted Average Interest Rate | 2004 | |||||||||||||||
| | 2005 | 2004 | (unaudited) | | | ||||||||||||||
| Revolver loan | 7.06 | % | $ | 46,906 | $ | 27,471 | $ | 43,857 | 7.06 | % | $ | 27,471 | |||||||
| Note payment book overdraft | — | 6,722 | — | 6,722 | |||||||||||||||
| Term A loan | 7.50 | % | 4,500 | — | 4,425 | 7.50 | % | 4,500 | — | ||||||||||
| Term B loan | 8.50 | % | 10,000 | — | 9,444 | 8.50 | % | 10,000 | — | ||||||||||
| 61,406 | 34,193 | 57,726 | 61,406 | 34,193 | |||||||||||||||
| Junior subordinated notes | 14.00 | % | — | 9,559 | — | 14.00 | % | — | 9,559 | ||||||||||
| 61,406 | 43,752 | 57,726 | 61,406 | 43,752 | |||||||||||||||
| Less current portion | 3,468 | — | 3,783 | 3,468 | — | ||||||||||||||
| Long term obligations | $ | 57,938 | $ | 43,752 | $ | 53,943 | $ | 57,938 | $ | 43,752 | |||||||||
During 2005, the Company had an average available borrowing capacity of approximately $9,290. This average was computed from the monthly borrowing base certificates prepared for the Company's Lender. At December 31, 2005 the Company had available borrowing capacity of approximately $1,459 under the terms of the Agreement. Under the Agreement, the Company is obligated to pay an unused facility fee of 0.5%0.375% computed on a daily basis. During the years ended December 31, 2005, 2004 and 2003, the Company incurred and paid approximately $69, $91, and $130, respectively, for the unused facility.
Principal repayment obligations for succeeding fiscal years are as follows:
| 2006 | $ | 3,468 | |
| 2007 | 57,938 | ||
| Total | $ | 61,406 | |
Notes to Consolidated Financial Statements
(in thousands, except per share data)
4. Income Taxes
The provision (benefit) for income taxes consists of:
| | Year Ended December 31, | Year Ended December 31, | ||||||||||||||||||
|---|---|---|---|---|---|---|---|---|---|---|---|---|---|---|---|---|---|---|---|---|
| | 2005 | 2004 | 2003 | 2005 | 2004 | 2003 | ||||||||||||||
| Current: | ||||||||||||||||||||
| Federal | $ | 6,070 | $ | 2,420 | $ | — | $ | 6,070 | $ | 2,420 | $ | — | ||||||||
| State | 931 | 360 | 77 | 931 | 360 | 77 | ||||||||||||||
| Total | 7,001 | 2,780 | 77 | |||||||||||||||||
| Total current | 7,001 | 2,780 | 77 | |||||||||||||||||
Deferred: | ||||||||||||||||||||
| Federal | 294 | 392 | 225 | 294 | 392 | 225 | ||||||||||||||
| State | 4 | (5 | ) | (7 | ) | 4 | (5 | ) | (7 | ) | ||||||||||
| 298 | 387 | 218 | ||||||||||||||||||
| Total deferred | 298 | 387 | 218 | |||||||||||||||||
| Total | $ | 7,299 | $ | 3,167 | $ | 295 | $ | 7,299 | $ | 3,167 | $ | 295 | ||||||||
A reconciliation of the U.S. Federal statutory tax rate to the effective tax rate on income before taxes is as follows:
| | Year ended December 31, | ||||||
|---|---|---|---|---|---|---|---|
| | 2005 | 2004 | 2003 | ||||
| Federal statutory rate | 35.0 | % | 34.0 | % | 34.0 | % | |
| State taxes, net of federal benefit | 3.6 | % | 3.9 | % | 7.8 | % | |
| Non-deductible items | 0.5 | % | 1.8 | % | 15.9 | % | |
Litigation settlement | (1.2 | )% | — | — | |||
| Other | (1.1 | )% | — | — | |||
| Total effective tax rate | 36.8 | % | 39.7 | % | 57.7 | % | |
Significant components of the Company's deferred tax assets were as follows:
| | Year Ended December 31, | ||||||
|---|---|---|---|---|---|---|---|
| | 2005 | 2004 | |||||
| Deferred tax assets: | |||||||
| Property and equipment | $ | 584 | $ | 600 | |||
| Goodwill | 242 | 327 | |||||
| Uniform capitalization adjustment | 390 | 406 | |||||
| Inventory reserve | 523 | 675 | |||||
| Capital loss carryover | 48 | 48 | |||||
| Allowance for doubtful accounts | 172 | 176 | |||||
| Other | 61 | 86 | |||||
| Total deferred tax assets | 2,020 | 2,318 | |||||
| Less valuation allowance | 48 | 48 | |||||
| Net deferred tax assets | $ | 1,972 | $ | 2,270 | |||
The Company has a U.S. capital loss carryover of approximately $130 at December 31, 2005, that, if not utilized, will expire beginning 2007. The Company has provided a valuation allowance against this U.S capital loss carryover since it does not believe that it is more likely than not that this deferred tax asset will be realized prior to its expiration.
5. Related-Party Transactions
HWC has a management services agreement with an affiliate of the majority stockholder of the Company that provides for the payment of monthly management fees of approximately $42 and the reimbursement of certain expenses. Management fees and expenses of $500, $501, and $502, were incurred and paid under this agreement for the years ended December 31, 2005, 2004 and 2003, respectively.
As discussed in Note 3 above, the Company issued Junior Subordinated Promissory Notes in 1997. These Notes were held by the majority stockholder and certain other stockholders and officers of the Company.
6. Employee Benefit Plans
A combination profit-sharing plan and salary deferral plan (the "Plan") is provided for the benefit of HWC's employees. Employees who are eligible to participate in the Plan can contribute a percentage of their base compensation, up to the maximum percentage allowable not to exceed the limits of Internal Revenue Code Sections 401(k), 404, and 415, subject to the IRS-imposed dollar limit. Employee contributions are invested in certain equity and fixed-income securities, based on employee elections. Effective January 1, 2005, the Board of Directors approved a Company match of an employee's contributions up to a maximum of 50% of the employee's first 4% of contributions. During 2005 the Company's match was $238. Effective January 1, 2006, the Company's match increased to 50% of the employee's first 5% of contributions.
7. Stock Option Plan and Dividends
Stock options represent the right to purchase shares of common stock at a price that is fixed on the day the options are granted (the grant date). The table below summarizes the stock option activity for the past three years:years ended December 31, 2005, 2004 and 2003:
| | 2005 | Weighted Average Exercise Price | 2004 | Weighted Average Exercise Price | 2003 | Weighted Average Exercise Price | 2005 | Weighted Average Exercise Price | 2004 | Weighted Average Exercise Price | 2003 | Weighted Average Exercise Price | ||||||||||||||||||||||
|---|---|---|---|---|---|---|---|---|---|---|---|---|---|---|---|---|---|---|---|---|---|---|---|---|---|---|---|---|---|---|---|---|---|---|
| Outstanding—Beginning of year | 89,300 | $ | 1.00 | 211,683 | $ | 0.57 | 211,683 | $ | 0.57 | 167 | $ | 0.53 | 397 | $ | 0.30 | 397 | $ | 0.30 | ||||||||||||||||
| Granted | 49,000 | 5.00 | 32,000 | 1.00 | — | — | 92 | 2.67 | 60 | 0.53 | — | — | ||||||||||||||||||||||
| Exercised | — | — | (145,383 | ) | 0.38 | — | — | — | — | (273 | ) | 0.20 | — | — | ||||||||||||||||||||
| Forfeitures | (2,000 | ) | 1.00 | (9,000 | ) | 1.00 | — | — | (3 | ) | 0.53 | (17 | ) | 0.53 | — | — | ||||||||||||||||||
| Outstanding—End of year | 136,300 | $ | 2.44 | 89,300 | $ | 1.00 | 211,683 | $ | 0.57 | 256 | $ | 1.30 | 167 | $ | 0.53 | 397 | $ | 0.30 | ||||||||||||||||
| Exercisable—End of year | 52,300 | 35,300 | 165,283 | 98 | 66 | 310 | ||||||||||||||||||||||||||||
| Weighted average fair value of options granted during the year | $ | 12.37 | $ | 0.14 | — | $ | 6.60 | $ | 0.07 | — | ||||||||||||||||||||||||
The table below summarizes information about stock options outstanding and exercisable at December 31, 2005:
| | | Outstanding Stock Options | Exercisable Stock Options | | Outstanding Stock Options | Exercisable Stock Options | ||||||||
|---|---|---|---|---|---|---|---|---|---|---|---|---|---|---|
| Exercise Prices | Exercise Prices | Shares | Weighted Average Remaining Contractual Life (years) | Shares | Exercise Prices | Shares | Weighted Average Remaining Contractual Life (years) | Shares | ||||||
| $ | 1.00 | 87,300 | 5.98 | 52,300 | 0.53 | 164 | 5.98 | 98 | ||||||
| $ | 5.00 | 49,000 | 10.00 | — | 2.67 | 92 | 10.00 | — | ||||||
| $ | 2.44 | 136,300 | 7.43 | 52,300 | 1.30 | 256 | 7.43 | 98 | ||||||
In 2000, the Company adopted a stock option plan (the "2000 Plan") to provide incentives for certain key employees and directors through awards and the exercise of options. The 2000 Plan provides for options to be granted at the fair market value of the Company's common stock at the date of the grant and may be either nonqualified stock options or incentive stock options as defined by Section 422 of the Internal Revenue Code of 1986 (the "Code"), as amended.
The 2000 Plan was amended on December 30, 2005, increasing the maximum number of shares available to be issued to designated participants from 100,000188 shares to 250,000469 shares. The maximum number of shares available to any one participant is 25,00047 shares in any one calendar year.
In 1998, the Company adopted a stock option plan (the "1998 Plan") to provide incentives for certain key employees and directors through awards and the exercise of options. The 1998 Plan provides for options to be granted at the fair market value of the Company's common stock on the date of grant and may be either nonqualified stock options or incentive stock options as defined by Section 422 of the Code, as amended. On October 29, 2000, the 1998 Plan was amended to increase the number of shares available to be issued from 106,667200 shares to 451,850847 shares. The maximum number of shares available to any one participant increased from 96,000180 shares to 150,000281 shares in any one calendar year.
On December 29, 2005, the Directors of the Company declared a dividend on the Company's shares of common stock in the amount of approximately $2.26$1.21 per share for an aggregate dividend of $20 million. This dividend was paid to the holders of record of its common stock on December 30, 2005.
On March 23, 2006, the Company adopted the 2006 Stock Plan to provide incentives for certain key employees and directors through awards and the exercise of options. The 2006 Stock Plan provides for options to be granted at the fair market value of the Company's common stock at the date of grant and may be either nonqualified stock options or incentive stock options as defined by Section 422 of the Code. Under the 2006 Stock Plan a maximum of 1,800 shares may be issued to designated participants. The maximum number of shares available to any one participant in any one calendar year is 500.
Adoption of SFAS 123(R) (unaudited)
The Company has granted options to purchase its common stock to employees and directors of the Company under various stock option plans at no less than the fair market value of the underlying stock on the date of grant. These options are granted for a term not exceeding ten years and are forfeited in the event the employee or director terminates, other than by retirement, his or her employment or relationship with the Company. These options generally vest over three to five years. All option plans contain anti-dilutive provisions that permit an adjustment of the number of shares of the Company's common stock represented by each option for any change in capitalization.
The Company adopted the fair value recognition provisions of SFAS 123(R) on January 1, 2006, using the prospective transition method. The fair value of the options granted after January 1, 2006, will be estimated using a Black-Scholes option-pricing model and amortized to expense over the options' vesting period. Prior to adoption of SFAS 123(R), the Company accounted for stock based payments under the recognition and measurement provisions of APB 25, and related Interpretations, as permitted by SFAS 123. Under the prospective transition method, compensation cost recognized beginning in 2006 includes: (a) compensation cost for all stock based payments granted prior to, but not yet vested as of January 1, 2006, based on the remaining amortization of the intrinsic value of such stock based awards, and (b) compensation cost for all stock based payments granted subsequent to January 1, 2006, based on the grant-date fair value estimated in accordance with the provisions of SFAS 123(R). Results for prior periods have not been restated.
As there were no grants of stock options during the three months ended March 31, 2006 and the Company adopted SFAS 123(R) using the prospective transition method, there was no effect on the Company's income before income taxes and net income for the three months ended March 31, 2006, as a result of adopting SFAS 123(R) instead of continuing to account for stock based compensation under APB 25. Total stock compensation expense for the three months ended March 31, 2006 was $28.
Prior to the adoption of SFAS 123(R), the Company presented all tax benefits of deductions resulting from the exercise of stock options as operating cash flows in the Statement of Cash Flows. SFAS 123(R) requires the cash flows resulting from the tax benefits resulting from tax deductions in excess of the compensation cost recognized for those options (excess tax benefits) to be classified as financing cash flows.
For the three months ended March 31, 2006, the Company granted no additional stock options. The fair value of each option awarded is estimated on the date of grant using a Black-Scholes option-pricing model. Expected volatilities will be based on historical volatility on the Company's stock and the historical volatility of the stock of similar companies, and other factors. The Company will use historical data to estimate option exercises and employee terminations within the valuation model. The expected life of options granted will
represent the period of time that options granted are expected to be outstanding. The risk-free rate for periods within the life of the option will be based on the U.S. Treasury yield curve in effect at the time of grant.
The following table presents a summary of the Company's stock options outstanding at and stock option activity during the three months ended March 31, 2006 ("Price" reflects the weighted average exercise price per share):
| | Options | Price | Weighted Average Remaining Contractual Term | Aggregate Intrinsic Value | |||||||
|---|---|---|---|---|---|---|---|---|---|---|---|
| Outstanding, beginning of year | 256 | $ | 1.30 | ||||||||
| Granted | — | — | |||||||||
| Exercised(1) | (11 | ) | $ | 0.53 | |||||||
| Forfeited | — | ||||||||||
| Expired | — | ||||||||||
| Outstanding, March 31, 2006 | 245 | $ | 1.33 | 7.20 | $ | 2,859 | |||||
| Exercisable, March 31, 2006 | 121 | $ | 0.53 | 5.29 | $ | 1,503 | |||||
| Weighted average fair value per option granted | $ | — | |||||||||
The total intrinsic value of options exercised during the three months ended March 31, 2006 was $131.
A summary of the Company's nonvested options at December 31, 2005, and changes during the three months ended March 31, 2006, is presented below:
| | Options | Weighted Average Grant Date Fair Value | ||||
|---|---|---|---|---|---|---|
| Nonvested, beginning of period | 158 | $ | 3.87 | |||
| Granted | — | — | ||||
| Vested | (34 | ) | $ | (0.07 | ) | |
| Forfeited | (— | ) | — | |||
| Nonvested, March 31, 2006 | 124 | $ | 4.91 | |||
Vesting dates range from December 31, 2006 to December 31, 2010, and expiration dates range from June 26, 2010 to December 31, 2015 at exercise prices and average contractual lives as follows:
| Exercise Prices | Outstanding as of 3/31/06 | Weighted Average Remaining Contractual Life | Exercisable as of 3/31/06 | |||
|---|---|---|---|---|---|---|
| $0.53 | 153 | 5.67 | 121 | |||
| $2.67 | 92 | 9.75 | 0 | |||
| 245 | 121 | |||||
As of March 31, 2006, there was $531 of total unrecognized compensation cost related to nonvested share-based compensation arrangements. The cost is expected to be recognized over a weighted average period of approximately five years. There were 1.8 million shares available for future grants under the various option plans at March 31, 2006.
8. Commitments and Contingencies
The Company has entered into operating leases, primarily for warehouse and office facilities. These operating leases frequently include renewal options at the fair rental value at that time. For leases with step rent provisions, whereby the rental payments increase incrementally over the life of the lease, we recognize the total minimum lease payments on a straight line basis over the minimum lease term. Rent expense was approximately $1,611 in 2005, $1,632 in 2004 and $1,638 in 2003. Future minimum lease payments under
non-cancelable operating leases with initial terms of one year or more consisted of the following at December 31, 2005:
| 2006 | $ | 1,759 | |
| 2007 | 1,668 | ||
| 2008 | 1,670 | ||
| 2009 | 1,591 | ||
| 2010 | 1,113 | ||
| Thereafter | 2,609 | ||
| Total minimum lease payments | $ | 10,410 | |
The Company had aggregate purchase commitments for inventory of approximately $31,686 at December 31, 2005.
During 2004, HWC settled a lawsuit with a vendor, in regards to a prior inventory purchase, which resulted in the receipt of $650, which is included in litigation settlements in the accompanying 2004 statement of income.
In September 2000, HWC lost a court case brought by a vendor for alleged breach of contract. The jury found in favor of the vendor and awarded the vendor the sum of $1,300 plus accrued interest, which totaled approximately $1,600. The breach of contract occurred prior to the acquisition of the Company from its previous owner ("ALLTEL"). HWC contendscontended that this liability should be borne by ALLTEL. In 2001, HWC filed suit against ALLTEL under the terms of the purchase agreement, in which HWC is to be indemnified by ALLTEL for any liability either disclosed or undisclosed in the agreement of sale. In October 2004, the court rendered its verdict on the suit. HWC was awarded approximately $672 for ALLTEL's breach under one portion of the suit which amount was received in January 2005 and included in litigation settlements in the accompanying 2005 statement of income, while the court found in favor of ALLTEL on the second portion of the suit. HWC appealed the decision on the second portion of the suit, but this decision was affirmed by the Illinois Appellate Court in March 2006.
HWC, along with many other defendants, have been named in a number of lawsuits in the state courts of North Dakota alleging that certain wire and cable which may have contained asbestos caused injury to the plaintiffs who were exposed to this wire and cable. These lawsuits are individual personal injury suits that seek unspecified amounts of money damages as the sole remedy. It is not clear whether the alleged injuries occurred as a result of the wire and cable in question or whether HWC, in fact, distributed the wire and cable alleged to have caused any injuries. In addition, HWC did not manufacture any of the wire and cable at issue, and HWC would rely on any warranties from the manufacturers of such cable if it were determined that any
of the wire or cable that HWC distributed contained asbestos which caused injury to any of these plaintiffs. In connection with ALLTEL's sale of the company in 1997, ALLTEL provided indemnities with respect to costs and damages associated with these claims that HWC believes it could enforce if its insurance coverage proves inadequate. In addition, HWC maintains general liability insurance that has applied to these claims. To date, all costs associated with these claims have been covered by the applicable insurance policies and all defense of these claims has been handled by the applicable insurance companies.
In addition to the foregoing cases, there are no legal proceedings pending against or involving the Company that, in management's opinion, based on the current known facts and circumstances, are expected to
have a material adverse effect on the Company's consolidated financial position, cash flows, or results from operations.
9. Subsequent Event
On March 23,May 16, 2006, HWC Holding Corporation changedthe Company effected a 1.875-for-1 stock split for its name to Houston Wire & Cable Companyoutstanding common stock in the form of a stock dividend. All stockholder equity balances and disclosures in the Company's operating subsidiary, Houston Wire & Cable Company, changed its name to HWC Wire & Cable Company.accompanying consolidated financial statements have been retroactively restated for such stock split.
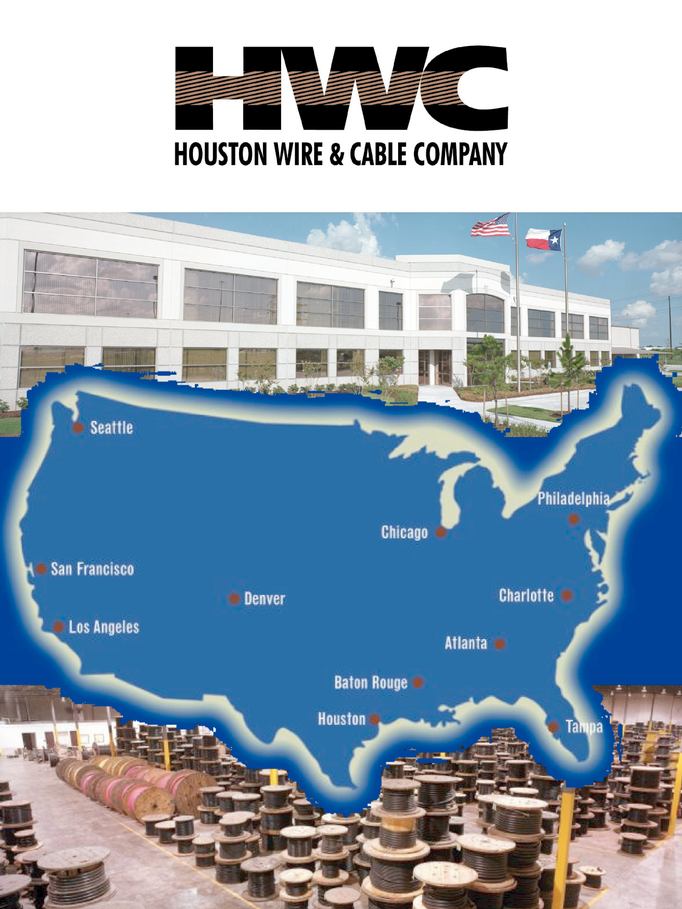
Common Stock
PROSPECTUS
, 2006
William Blair & Company | Robert W. Baird & Co. | |
BB&T Capital Markets | ||
Until , 2006, all dealers that buy, sell or trade in our common stock, whether or not participating in this offering, may be required to deliver a prospectus. This is in addition to the dealers' obligation to deliver a prospectus when acting as underwriters and with respect to their unsold allotments or subscriptions.
PART II
INFORMATION NOT REQUIRED IN PROSPECTUS
Item 13. Other Expenses of Issuance and Distribution
The following table sets forth all the costs and expenses, other than underwriting discounts, payable in connection with the issuance and distribution of the common stock being registered. Except as otherwise noted, the registrant will pay all of those amounts. All amounts shown below are estimates, except the registration fee:
| Registration fee of Securities and Exchange Commission | $ | 12,059 | |
| NASD filing fee | 11,770 | ||
| Accountants' fees and expenses | * | ||
| Legal fees and expenses | * | ||
| Printing expenses | * | ||
| Transfer agent fees and expenses | * | ||
| Nasdaq National Market fee | * | ||
| Blue sky fees, expenses and legal fees | * | ||
| Miscellaneous | * | ||
| TOTAL | $ | * | |
| Registration fee of Securities and Exchange Commission | $ | 14,463 | |
| NASD filing fee | 14,185 | ||
| Accountants' fees and expenses | 600,000 | ||
| Legal fees and expenses | 600,000 | ||
| Printing expenses | 150,000 | ||
| Transfer agent fees and expenses | 5,000 | ||
| Nasdaq National Market fee | 100,000 | ||
| Miscellaneous | 11,352 | ||
| TOTAL | $ | 1,500,000 | |
Item 14. Indemnification of Directors and Officers
Section 102 of the Delaware General Corporation Law allows a corporation to eliminate the personal liability of a director to the corporation or its stockholders for monetary damages for breach of fiduciary duty as a director, except in cases where the director breached his or her duty of loyalty to the corporation or its stockholders, failed to act in good faith, engaged in intentional misconduct or a knowing violation of the law, willfully or negligently authorized the unlawful payment of a dividend or approved an unlawful stock redemption or repurchase or obtained an improper personal benefit. The registrant's certificate of incorporation contains a provision which eliminates directors' personal liability as set forth above.
The registrant's certificate of incorporation and bylaws provide in effect that the registrant shall indemnify its directors and officers to the full extent permitted by the Delaware law. Section 145 of the Delaware law provides that a Delaware corporation has the power to indemnify its directors, officers, employees and agents in certain circumstances. Subsection (a) of Section 145 of the Delaware law empowers a corporation to indemnify any director, officer, employee or agent, or former director, officer, employee or agent, who was or is a party or is threatened to be made a party to any threatened, pending or completed action, suit or proceeding, whether civil, criminal, administrative or investigative (other than an action by or in the right of the corporation), against expenses (including attorneys' fees), judgments, fines and amounts paid in settlement actually and reasonably incurred in connection with such action, suit or proceeding provided that such director, officer, employee or agent acted in good faith and in a manner he or she reasonably believed to be in or not opposed to the best interests of the corporation, and, with respect to any criminal action or proceeding, provided that such director, officer, employee or agent had no reasonable cause to believe that his or her conduct was unlawful.
Subsection (b) of Section 145 of the Delaware law empowers a corporation to indemnify any director, officer, employee or agent, or former director, officer, employee or agent, who was or is a party or is threatened to be made a party to any threatened, pending or completed action or suit by or in the right of the corporation to procure a judgment in its favor by reason of the fact that such person acted in any of the capacities set forth above, against expenses (including attorneys' fees) actually and reasonably incurred in
II-1
connection with the defense or settlement of such action or suit provided that such person acted in good faith and in a manner he or she reasonably believed to be in or not opposed to the best interests of the corporation, except that no indemnification may be made in respect of any claim, issue or matter as to which such person
II-1
shall have been adjudged to be liable to the corporation unless and only to the extent that the Court of Chancery shall determine that despite the adjudication of liability such person is fairly and reasonably entitled to indemnity for such expenses which the court shall deem proper.
Section 145 further provides that to the extent that a director or officer or employee of a corporation has been successful in the defense of any action, suit or proceeding referred to in subsections (a) and (b) or in the defense of any claim, issue or matter therein, he or she shall be indemnified against expenses (including attorneys' fees) actually and reasonably incurred by him or her in connection therewith; that indemnification provided by Section 145 shall not be deemed exclusive of any other rights to which the party seeking indemnification may be entitled; and the corporation is empowered to purchase and maintain insurance on behalf of a director, officer, employee or agent of the corporation against any liability asserted against him or her or incurred by him or her in any such capacity or arising out of his or her status as such whether or not the corporation would have the power to indemnify him or her against such liabilities under Section 145; and that, unless indemnification is ordered by a court, the determination that indemnification under subsections (a) and (b) of Section 145 is proper because the director, officer, employee or agent has met the applicable standard of conduct under such subsections shall be made by (1) a majority vote of the directors who are not parties to such action, suit or proceeding, even though less than a quorum, or (2) if there are no such directors, or if such directors so direct, by independent legal counsel in a written opinion, or (3) by the stockholders.
The registrant has in effect insurance policies for general officers' and directors' liability insurance covering all of its officers and directors.
Item 15. Recent Sales of Unregistered Securities
During the three years preceding the filing of this registration statement, the only securities we issued were stock options granted to our employees under our stock option plans and shares of our common stock upon the exercise of outstanding options. None of these transactions was registered under the Securities Act, as amended.
The following represents the common stock we issued in the three years preceding the filing of this registration statement upon the exercise of outstanding options (all share numbers in this Item 15 are before the proposedrecent 1.875-for-1 stock split):
| Buyer | Date of Sale | Amount of Securities Sold | Consideration | ||||
|---|---|---|---|---|---|---|---|
| Charles A. Sorrentino | 12/10/04 | 145,183 | $ | 54,443.63 | |||
| David M. Cathcart | 12/14/04 | 200 | 200.00 | ||||
| Jeffrey Fisher | 1/27/06 | 1,400 | 1,400.00 | ||||
| Nicol G. Graham | 1/31/06 | 2,800 | 2,800.00 | ||||
| Terry Smith-Stallard | 2/3/06 | 1,400 | 1,400.00 | ||||
On January 1, 2004, we granted certain of our employees options to purchase an aggregate of 32,000 shares of our common stock with an aggregate exercise price of $32,000. On December 31, 2005, we granted certain of our employees options to purchase an aggregate of 49,000 shares of our common stock with an aggregate exercise price of $245,000.
None of these transactions involved any underwriters, underwriting discounts or commissions, or any public offering, and the registrant believes that each transaction was exempt from the registration requirements of the Securities Act by virtue of Rule 701 pursuant to compensatory benefit plans and contracts relating to compensation.
II-2
Item 16. Exhibits and Financial Statement Schedules
(a) The Exhibits filed herewith are set forth on the Index to Exhibits filed as a part of this Registration Statement on page II-5II-6 hereof.
The undersigned registrant hereby undertakes:
(1) That, for the purpose of determining liability under the Securities Act of 1933 to any purchaser, if the registrant is subject to Rule 430C, each prospectus filed pursuant to Rule 424(b) as part of a registration statement relating to an offering, other than registration statements relying on Rule 430B or other than prospectuses filed in reliance on Rule 430A, shall be deemed to be part of and included in the registration statement as of the date it is first used after effectiveness; provided, however, that no statement made in a registration statement or prospectus that is part of the registration statement or made in a document incorporated or deemed incorporated by reference into the registration statement or prospectus that is part of the registration statement will, as to a purchaser with a time of contract of sale prior to such first use, supersede or modify any statement that was made in the registration statement or prospectus that was part of the registration statement or made in any such document immediately prior to such date of first use.
(2) That, for the purpose of determining liability of the registrant under the Securities Act of 1933 to any purchaser in the initial distribution of the securities:
The undersigned registrant undertakes that in a primary offering of securities of the undersigned registrant pursuant to this registration statement, regardless of the underwriting method used to sell the securities to the purchaser, if the securities are offered or sold to such purchaser by means of any of the following communications, the undersigned registrant will be a seller to the purchaser and will be considered to offer or sell such securities to such purchaser:
(i) Any preliminary prospectus or prospectus of the undersigned registrant relating to the offering required to be filed pursuant to Rule 424;
(ii) Any free writing prospectus relating to the offering prepared by or on behalf of the undersigned registrant or used or referred to by the undersigned registrant;
(iii) The portion of any other free writing prospectus relating to the offering containing material information about the undersigned registrant or its securities provided by or on behalf of the undersigned registrant; and
(iv) Any other communication that is an offer in the offering made by the undersigned registrant to the purchaser.
The undersigned registrant hereby undertakes to provide to the underwriters at the closing specified in the underwriting agreement, certificates in such denominations and registered in such names as required by the underwriters to permit prompt delivery to each purchaser.
Insofar as indemnification for liabilities arising under the Securities Act of 1933 may be permitted to directors, officers and controlling persons of the registrant pursuant to the provisions described under Item 14 above, or otherwise, the registrant has been advised that in the opinion of the Securities and Exchange Commission such indemnification is against public policy as expressed in the Act and, therefore, unenforceable. In the event a claim for indemnification against such liabilities (other than the payment by the registrant of expenses incurred or paid by a director, officer or controlling person of the registrant in the successful defense of any action, suit or proceeding) is asserted by such director, officer or controlling person
II-3
in connection with the securities being registered, the registrant will, unless in the opinion of its counsel the matter has been settled by controlling precedent, submit to a court of appropriate jurisdiction the question whether such indemnification by it is against public policy as expressed in the Act and will be governed by the final adjudication of such issue.
The undersigned registrant hereby undertakes:
(1) For purposes of determining any liability under the Securities Act of 1933, the information omitted from the form of prospectus filed as part of this Registration Statement in reliance upon Rule 430A and contained in a form of prospectus filed by the registrant pursuant to Rule 424(b)(1) or (4) or 497(h) under the Securities Act shall be deemed to be part of this Registration Statement as of the time it was declared effective.
(2) For the purpose of determining any liability under the Securities Act of 1933, each post-effective amendment that contains a form of prospectus shall be deemed to be a new Registration Statement relating to the securities offered therein, and the offering of such securities at that time shall be deemed to be the initial bona fide offering thereof.
II-4
Pursuant to the requirements of the Securities Act of 1933, as amended, the registrant has duly caused this Amendment No. 13 to the Registration Statement to be signed on its behalf by the undersigned, thereunto duly authorized, in the City of Houston, State of Texas, on this 28th31st day of April,May, 2006.
| HOUSTON WIRE & CABLE COMPANY (Registrant) | |||
By: | /s/ NICOL G. GRAHAM | ||
| Nicol G. Graham Chief Financial Officer, Treasurer and Secretary | |||
Pursuant to the requirements of the Securities Act of 1933, this Amendment No. 13 to the Registration Statement has been signed by the following persons in the capacities and on the dates indicated.
| SIGNATURE | TITLE | DATE | ||
|---|---|---|---|---|
| /s/ CHARLES A. SORRENTINO Charles A. Sorrentino | President, Chief Executive Officer and Director | |||
/s/ NICOL G. GRAHAM Nicol G. Graham | Chief Financial Officer, Treasurer and Secretary (Chief Accounting Officer) | |||
/s/ PETER M. GOTSCH* Peter M. Gotsch | Director | |||
/s/ ROBERT G. HOGAN* Robert G. Hogan | Director | |||
/s/ WILSON B. SEXTON* Wilson B. Sexton | Director | May 31, 2006 |
*By: | /s/ CHARLES A. SORRENTINO Charles A. Sorrentino, Attorney-in-Fact |
II-5
| | EXHIBIT NUMBER | EXHIBIT | |
|---|---|---|---|
| 1.1 | Form of Underwriting | ||
| 3.1 | Amended and Restated Certificate of Incorporation of Houston Wire & Cable | ||
| 3.2 | By-Laws of Houston Wire & Cable | ||
| 4.1 | Form of Specimen Common Stock Certificate of Houston Wire & Cable Company* | ||
| 5.1 | Opinion of Schiff Hardin | ||
| 10.1 | Form of Registration Rights Agreement by and between Houston Wire & Cable Company and Code, Hennessy & Simmons II, L.P.** | ||
| 10.2 | Houston Wire & Cable Company 2000 Stock | ||
| 10.3 | Form of Houston Wire & Cable Company 2006 Stock | ||
| 10.4 | Amended and Restated Loan and Security Agreement, dated as of May 22, 2000, by and among various specified lenders, Fleet Capital Corporation (now Bank of America, Inc.) and HWC Holding Company (now Houston Wire & Cable Company)** | ||
| 10.5 | First Amendment to Amended and Restated Loan Agreement, dated as of July 13, | ||
| 10.6 | Second Amendment to Amended and Restated Loan Agreement, dated as of May 30, | ||
| 10.7 | Third Amendment to Amended and Restated Loan Agreement, dated as of October 22, | ||
| 10.8 | Fourth Amendment to Amended and Restated Loan Agreement, dated as of December 31, | ||
| 10.9 | Fifth Amendment to Amended and Restated Loan Agreement, dated as of November 19, | ||
| 10.10 | Sixth Amendment to Amended and Restated Loan Agreement, dated as of May 26, | ||
| 10.11 | Seventh Amendment to Amended and Restated Loan Agreement, dated as of December 14, | ||
| 10.12 | Eighth Amendment to Amended and Restated Loan Agreement, dated as of December 30, | ||
| 10.13 | Termination Agreement, dated as of March 23, 2006, by and between HWC Wire & Cable Company and CHS Management II, L.P.** | ||
| 10.14 | Employment Agreement, dated as of April 26, 2006, by and between Charles A. Sorrentino and Houston Wire & Cable Company** | ||
| 10.15 | Form of Executive Securities Agreement by and among Code, Hennessy & Simmons II, L.P., HWC Holding Corporation (now Houston Wire & Cable Company) and Executive (referred to herein as the "restricted securities agreement")** | ||
| 10.16 | Investor Securities Agreement, dated as of May 22, 1997, by and among Code, Hennessy & Simmons II, L.P., HWC Holding Corporation (now Houston Wire & Cable Company) and various specified investors** | ||
| 10.17 | Executive Securities Agreement, dated as of December 31, 1998, and amended as of June 28, 2000, and April 26, 2006, by and among Code, Hennessy & Simmons II, L.P., HWC Holding Corporation (now Houston Wire & Cable Company) and Charles A. Sorrentino** | ||
| 10.18 | Executive Securities Agreement, dated as of September 11, 1997, by and among Code, Hennessy & Simmons II, L.P., HWC Holding Corporation (now Houston Wire & Cable Company) and Nicol G. Graham** | ||
| 21.1 | Subsidiaries of Houston Wire & Cable | ||
| 23.1 | Consent of Ernst & Young LLP, Independent Registered Public | ||
| 23.2 | Consent of Schiff Hardin LLP (contained in their opinion filed as Exhibit 5.1) | ||
| 24.1 | Powers of Attorney for Messrs. Sorrentino, Graham, Gotsch and Hogan (contained on the signature | ||
| 24.2 | Power of Attorney for Mr. Sexton** |
II-6