
Use these links to rapidly review the document
TABLE OF CONTENTS
INDEX TO FINANCIAL STATEMENTS
As filed with the Securities and Exchange Commission on July 23,August 27, 2010
Registration No. 333-166550
UNITED STATES
SECURITIES AND EXCHANGE COMMISSION
Washington, D.C. 20549
AMENDMENT NO. 34
TO
FORM S-1
REGISTRATION STATEMENT
UNDER
THE SECURITIES ACT OF 1933
Rhino Resource Partners LP
(Exact Name of Registrant as Specified in Its Charter)
| Delaware (State or Other Jurisdiction of Incorporation or Organization) | 1221 (Primary Standard Industrial Classification Code Number) | 27-2377517 (I.R.S. Employer Identification Number) |
424 Lewis Hargett Circle, Suite 250
Lexington, Kentucky 40503
(859) 389-6500
(Address, Including Zip Code, and Telephone Number, Including
Area Code, of Registrant's Principal Executive Offices)
David G. Zatezalo
424 Lewis Hargett Circle, Suite 250
Lexington, Kentucky 40503
(859) 389-6500
(Name, Address, Including Zip Code, and Telephone Number, Including Area Code, of Agent for Service)
| Copies to: | ||
Mike Rosenwasser Brenda K. Lenahan Vinson & Elkins L.L.P. 666 Fifth Avenue, 26th Floor New York, New York 10103 Tel: (212) 237-0000 Fax: (212) 237-0100 | Charles E. Carpenter Sean T. Wheeler Latham & Watkins LLP 885 Third Avenue New York, New York 10022 Tel: (212) 906-1200 Fax: (212) 751-4864 | |
Approximate date of commencement of proposed sale to the public:
As soon as practicable after this Registration Statement becomes effective.
If any of the securities being registered on this Form are to be offered on a delayed or continuous basis pursuant to Rule 415 under the Securities Act of 1933, check the following box. o
If this Form is filed to register additional securities for an offering pursuant to Rule 462(b) under the Securities Act, check the following box and list the Securities Act registration statement number of the earlier effective registration statement for the same offering. o
If this Form is a post-effective amendment filed pursuant to Rule 462(c) under the Securities Act, check the following box and list the Securities Act registration statement number of the earlier effective registration statement for the same offering. o
If this Form is a post-effective amendment filed pursuant to Rule 462(d) under the Securities Act, check the following box and list the Securities Act registration statement number of the earlier effective registration statement for the same offering. o
Indicate by check mark whether the registrant is a large accelerated filer, an accelerated filer, a non-accelerated filer, or a smaller reporting company. See definitions of "large accelerated filer," "accelerated filer," and "smaller reporting company" in Rule 12b-2 of the Exchange Act. (Check one):
| Large accelerated filer o | Accelerated filer o | Non-accelerated filer ý (Do not check if a smaller reporting company) | Smaller reporting company o |
The registrant hereby amends this registration statement on such date or dates as may be necessary to delay its effective date until the registrant shall file a further amendment which specifically states that this registration statement shall thereafter become effective in accordance with Section 8(a) of the Securities Act of 1933 or until the registration statement shall become effective on such date as the Securities and Exchange Commission, acting pursuant to said Section 8(a), may determine.
The information in this preliminary prospectus is not complete and may be changed. We may not sell these securities until the registration statement filed with the Securities and Exchange Commission becomes effective. This preliminary prospectus is not an offer to sell these securities and we are not soliciting an offer to buy these securities in any jurisdiction where the offer or sale is not permitted.
Subject to Completion, Dated July 23,August 27, 2010
PROSPECTUS
3,750,0003,244,000 Common Units
Representing Limited Partner Interests
This is our initial public offering. We are offering 3,750,0003,244,000 common units. We have been approved to list our common units on the New York Stock Exchange under the symbol "RNO."
Prior to this offering, there has been no public market for our common units. We anticipate that the initial public offering price will be between $19.00 and $21.00 per common unit.
You should consider the risks which we have described in "Risk Factors" beginning on page 23 before buying our common units.
These risks include the following:
In order to comply with certain U.S. laws relating to the ownership of interests in mineral leases on federal lands, we require an owner of our units to be an "eligible citizen." If you are not an eligible citizen, your common units will be subject to redemption. Please read "The Partnership Agreement—Ineligible Citizens; Redemption."
| | Per Common Unit | Total | |||||
|---|---|---|---|---|---|---|---|
Public offering price | $ | $ | |||||
Underwriting discount | $ | $ | |||||
Proceeds, before offering expenses, to us | $ | $ | |||||
The underwriters may purchase up to an additional 562,500486,600 common units from us at the public offering price, less the underwriting discount, within 30 days from the date of this prospectus to cover over-allotments.
Neither the Securities and Exchange Commission nor any state securities commission has approved or disapproved of these securities or determined if this prospectus is truthful or complete. Any representation to the contrary is a criminal offense.
The underwriters expect to deliver the common units to purchasers on or about , 2010.
RAYMOND JAMES
RBC CAPITAL MARKETS
STIFEL NICOLAUS WEISEL
The date of this prospectus is , 2010.
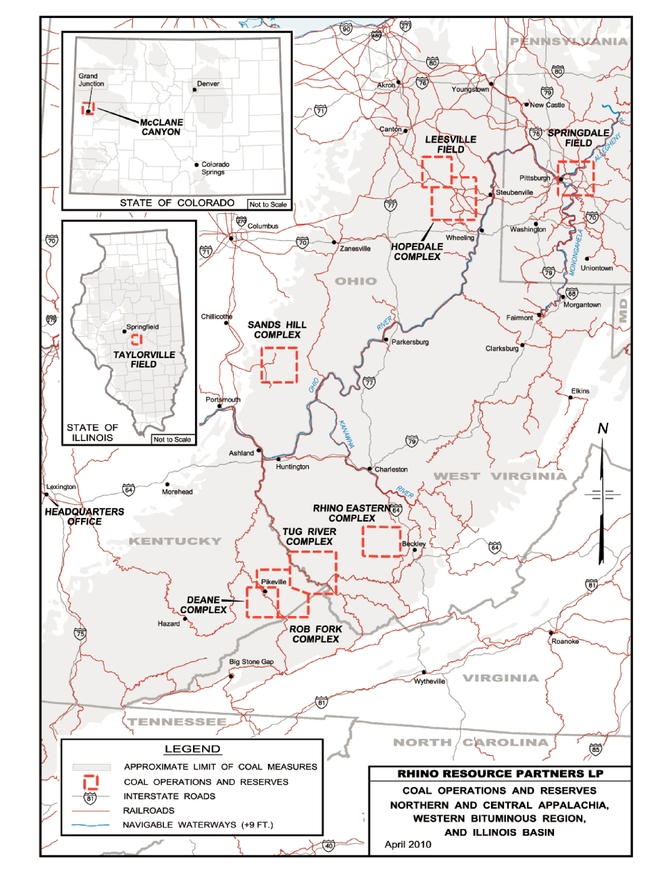

The map above does not reflect our acquisition in August 2010 of certain mining assets located in Emery and Carbon Counties, Utah.
Summary | 1 | |
Risk Factors | 23 | |
Use of Proceeds | ||
Capitalization | ||
Dilution | ||
Cash Distribution Policy and Restrictions on Distributions | ||
Provisions of Our Partnership Agreement Relating to Cash Distributions | 77 | |
Selected Historical Consolidated and Pro Forma Condensed Consolidated Financial and Operating Data | 94 | |
Management's Discussion and Analysis of Financial Condition and Results of Operations | 98 | |
The Coal Industry | ||
Business | ||
Management | ||
Executive Officer Compensation | 194 | |
Security Ownership of Certain Beneficial Owners and Management | 210 | |
Certain Relationships and Related Party Transactions | 211 | |
Conflicts of Interest and Fiduciary Duties | 214 | |
Description of the Common Units | 224 | |
The Partnership Agreement | 227 | |
Units Eligible for Future Sale | 244 | |
Material Tax Consequences | 246 | |
Investment in Rhino Resource Partners LP by Employee Benefit Plans | 269 | |
Underwriting | 271 | |
Validity of Our Common Units | 276 | |
Experts | 276 | |
Where You Can Find More Information | 277 | |
Forward-Looking Statements | 277 | |
Index to Financial Statements | F-1 | |
Appendix A—Form of First Amended and Restated Agreement of Limited Partnership of Rhino Resource Partners LP | A-1 | |
Appendix B—Application for Transfer of Common Units | B-1 | |
Appendix C—Glossary of Terms | C-1 |
You should rely only on the information contained in this prospectus, any free writing prospectus prepared by or on behalf of us or any other information to which we have referred you in connection with this offering. We have not, and the underwriters have not, authorized any other person to provide you with information different from that contained in this prospectus. Neither the delivery of this prospectus nor sale of our common units means that information contained in this prospectus is correct after the date of this prospectus. This
i
prospectus is not an offer to sell or solicitation of an offer to buy our common units in any circumstances under which the offer or solicitation is unlawful.
Until , 2010 (25 days after the date of this prospectus), all dealers that buy, sell or trade our common units, whether or not participating in this offering, may be required to deliver a prospectus. This is in addition to the dealers' obligation to deliver a prospectus when acting as underwriters and with respect to their unsold allotments or subscriptions.
ii
This summary highlights information contained elsewhere in this prospectus. You should read the entire prospectus carefully, including the historical and pro forma consolidated financial statements and the notes to those financial statements, before investing in our common units. The information presented in this prospectus assumes that the underwriters' option to purchase additional common units is not exercised unless otherwise noted. You should read "Risk Factors" beginning on page 23 for information about important risks that you should consider before buying our common units.
References in this prospectus to "Rhino Resource Partners LP," "we," "our," "us" or like terms when used in a historical context refer to the business of our predecessor, Rhino Energy LLC and its subsidiaries, that is being contributed to Rhino Resource Partners LP in connection with this offering, except that, unless otherwise specified, references to our proven and probable reserves, non-reserve coal deposits and coal production do not include the reserves and deposits owned by or the production of Rhino Eastern LLC, a joint venture in which we have a 51% membership interest and for which we serve as manager. When used in the present tense or prospectively, those terms refer to Rhino Resource Partners LP and its subsidiaries. References in this prospectus to "Wexford" refer to Wexford Capital LP, our sponsor, and its affiliates and principals. We include a glossary of some of the terms used in this prospectus as Appendix C.
Rhino Resource Partners LP
We are a growth-oriented Delaware limited partnership formed to control and operate coal properties and related assets. We produce, process and sell high quality coal of various steam and metallurgical grades. We market our steam coal primarily to electric utility companies as fuel for their steam-powered generators. Customers for our metallurgical coal are primarily steel and coke producers who use our coal to produce coke, which is used as a raw material in the steel manufacturing process.
Our primary business objective is to make quarterly cash distributions to our unitholders at our minimum quarterly distribution and, over time, increase our quarterly cash distributions. Initially, we will pay our common unitholders distributions of $0.445 per common unit per quarter, or $1.78 per common unit annually, to the extent we have sufficient cash from our operations after establishment of cash reserves and payment of fees and expenses, including payments to our general partner and its affiliates, before we pay any distributions to our subordinated unitholders.
For the year ended December 31, 2009, we generated revenues of approximately $419.8 million and net income of approximately $19.5 million. For the threesix months ended March 31,June 30, 2010, we generated revenues of approximately $66.6$145.0 million and net income of approximately $6.5$13.7 million. As of July 13,August 23, 2010, we had sales commitments for approximately 99%97% and 80%69% of our estimated coal production (including purchased coal to supplement production and excluding results from the joint venture) for the year ending December 31, 2010 and the twelve months ending JuneSeptember 30, 2011, respectively.
We have a geographically diverse asset base with coal reserves located in Central Appalachia, Northern Appalachia, the Illinois Basin and the Western Bituminous region. As of March 31, 2010, we controlled an estimated 285.4 million tons of proven and probable coal reserves, consisting of an estimated 272.9 million tons of steam coal and an estimated 12.5 million tons of metallurgical coal. In addition, as of March 31, 2010, we controlled an estimated 122.2 million tons of non-reserve coal deposits. As of March 31, 2010, Rhino Eastern LLC, a joint venture in which we have a 51% membership interest and for which we serve as manager, controlled an estimated 22.4 million tons of proven and probable coal reserves at the Rhino Eastern mining complex located in Central Appalachia, consisting entirely of premium mid-vol and low-vol metallurgical coal, and an estimated 34.3 million tons of non-reserve coal deposits. Our and the joint venture's proven and probable coal reserves and non-reserve coal deposits were the same in all material respects as of December 31, 2009. We currently operate twelveeleven mines, including sevensix underground and five surface mines, located in Kentucky, Ohio, Colorado and West Virginia. In addition, our joint venture currently operates one underground mine in West Virginia. The number of mines that we operate may vary from time to time depending on a number of factors, including the existing demand for and price of coal, depletion of economically recoverable reserves and availability of experienced labor. Excluding results from the joint venture, for the year ended December 31, 2009, we produced approximately 4.7 million tons of coal, purchased approximately 2.0 million tons of coal and sold approximately 6.7 million tons of coal, approximately 99% of which were pursuant to supply contracts. Excluding results from the joint venture, for the threesix months ended March 31,June 30, 2010, we produced approximately 1.02.1 million tons of coal and sold approximately 0.92.0 million tons of coal, approximately 99%97% of which were pursuant to supply contracts. Additionally, the joint venture produced and sold approximately 0.2 million tons and approximately 0.1 million tons of premium mid-vol metallurgical coal for the year ended December 31, 2009 and the threesix months ended March 31,June 30, 2010, respectively.
Since our predecessor's formation in 2003, we have significantly grown our coal reserves. Since April 2003, we have completed numerous coal asset acquisitions with a total purchase price of approximately $208.3 million. Through these acquisitions and coal lease transactions, we have substantially increased$223.3 million, including our proven and probable coal reserves and non-reserve coal deposits. We expect to complete the acquisition in August 2010 of certain mining assets of C.W. Mining Company out of bankruptcy for approximately $15.0 million.bankruptcy. The assets to be acquired are located in Emery and Carbon Counties, Utah and include coal reserves and non-reserve coal deposits, underground mining equipment and infrastructure, an overland belt conveyor system, a loading facility and support facilities. We intend to fund the asset acquisition with borrowings underThrough these acquisitions and coal lease transactions, we have substantially increased our credit agreement.proven and probable coal reserves and non-reserve coal deposits.
In addition, we have successfully grown our production through internal development projects. Between 2004 and 2006, we invested approximately $19.0 million in the Hopedale mine located in Northern Appalachia to develop the estimated 18.5 million tons of proven and probable coal reserves at the mine. The Hopedale mine produced approximately 1.5 million tons of coal for the year ended December 31, 2009 and approximately 0.30.7 million tons of coal for the threesix months ended March 31,June 30, 2010. In 2007, we completed initial development of Mine 28, a new underground high-vol metallurgical coal mine at the Rob Fork mining complex located in Central Appalachia. We finished additional development work on Mine 28 in 2009, which completes all major foreseen development projects for the life of these reserves. Mine 28 produced approximately 0.4 million tons of metallurgical coal for the year ended December 31, 2009 and approximately 0.10.2 million tons of metallurgical coal for the threesix months ended March 31,June 30, 2010. As of March 31, 2010, we also controlled or managed a significant amount of
undeveloped proven and probable coal reserves. These reserves can be developed and produced over time as
industry and regional conditions permit. We believe our existing asset base will continue to provide attractive internal growth projects.
The following table summarizes our and the joint venture's mining complexes, production and reserves by region:
| | | | Production for the (2) | Proven and Probable Reserves as of March 31, 2010 (3) | | | Production for the (2) | Proven and Probable Reserves as of March 31, 2010 (3) | ||||||||||||||||||||||||||||||
|---|---|---|---|---|---|---|---|---|---|---|---|---|---|---|---|---|---|---|---|---|---|---|---|---|---|---|---|---|---|---|---|---|---|---|---|---|---|---|
| | | Type of Production (1) | Year Ended December 31, 2009 | Three Months Ended March 31, 2010 | | Type of Production (1) | Year Ended December 31, 2009 | Six Months Ended June 30, 2010 | ||||||||||||||||||||||||||||||
| Region | Region | Total | Steam | Metallurgical | Region | Total | Steam | Metallurgical | ||||||||||||||||||||||||||||||
| | | | (in million tons) | | | (in million tons) | ||||||||||||||||||||||||||||||||
Central Appalachia | Central Appalachia | Central Appalachia | ||||||||||||||||||||||||||||||||||||
Tug River Complex (KY, WV) | Tug River Complex (KY, WV) | U, S | 0.5 | 0.1 | 34.8 | 28.8 | 6.0 | Tug River Complex (KY, WV) | U, S | 0.5 | 0.2 | 34.8 | 28.8 | 6.0 | ||||||||||||||||||||||||
Rob Fork Complex (KY) | Rob Fork Complex (KY) | U, S | 1.2 | 0.3 | 26.2 | 19.7 | 6.5 | Rob Fork Complex (KY) | U, S | 1.2 | 0.5 | 26.2 | 19.7 | 6.5 | ||||||||||||||||||||||||
Deane Complex (KY) | Deane Complex (KY) | U | 0.6 | 0.1 | 40.8 | 40.8 | — | Deane Complex (KY) | U | 0.6 | 0.2 | 40.8 | 40.8 | — | ||||||||||||||||||||||||
Northern Appalachia | Northern Appalachia | Northern Appalachia | ||||||||||||||||||||||||||||||||||||
Hopedale Complex (OH) | Hopedale Complex (OH) | U | 1.5 | 0.3 | 18.5 | 18.5 | — | Hopedale Complex (OH) | U | 1.5 | 0.7 | 18.5 | 18.5 | — | ||||||||||||||||||||||||
Sands Hill Complex (OH) | Sands Hill Complex (OH) | S | 0.7 | 0.2 | 8.6 | 8.6 | — | Sands Hill Complex (OH) | S | 0.7 | 0.3 | 8.6 | 8.6 | — | ||||||||||||||||||||||||
Leesville Field (OH) | Leesville Field (OH) | U | — | — | 26.8 | 26.8 | — | Leesville Field (OH) | U | — | — | 26.8 | 26.8 | — | ||||||||||||||||||||||||
Springdale Field (PA) | Springdale Field (PA) | U | — | — | 13.8 | 13.8 | — | Springdale Field (PA) | U | — | — | 13.8 | 13.8 | — | ||||||||||||||||||||||||
Illinois Basin | Illinois Basin | Illinois Basin | ||||||||||||||||||||||||||||||||||||
Taylorville Field (IL) | Taylorville Field (IL) | U | — | — | 109.5 | 109.5 | — | Taylorville Field (IL) | U | — | — | 109.5 | 109.5 | — | ||||||||||||||||||||||||
Western Bituminous | Western Bituminous | Western Bituminous | ||||||||||||||||||||||||||||||||||||
McClane Canyon Mine (CO) | McClane Canyon Mine (CO) | U | 0.3 | 0.1 | 6.4 | 6.4 | — | McClane Canyon Mine (CO) | U | 0.3 | 0.1 | 6.4 | 6.4 | — | ||||||||||||||||||||||||
Total | 4.7 | 1.0 | 285.4 | 272.9 | 12.5 | Total | 4.7 | 2.1 | 285.4 | 272.9 | 12.5 | |||||||||||||||||||||||||||
Central Appalachia | Central Appalachia | Central Appalachia | ||||||||||||||||||||||||||||||||||||
Rhino Eastern Complex (WV) (4) | Rhino Eastern Complex (WV) (4) | U | 0.2 | 0.1 | 22.4 | — | 22.4 | Rhino Eastern Complex (WV) (4) | U | 0.2 | 0.1 | 22.4 | — | 22.4 | ||||||||||||||||||||||||
Our principal business strategy is to safely, efficiently and profitably produce and sell both steam and metallurgical coal from our diverse asset base in order to maintain and, over time, increase our quarterly cash distributions. Our plan for executing this strategy includes the following key components:
We believe the following competitive strengths will enable us to successfully execute our business strategy:
For a more detailed description of our business strategies and competitive strengths, please read "Business—Our Business Strategy" and "—Our Competitive Strengths."
Our consolidated financial statements forcovering the three monthsone month ended and six months ended June 30,July 31, 2010 are not prepared yet.yet prepared. Our expectations with respect to our results for the periods discussed belowthat period are based upon management estimates. Our actual results may differ from these estimates.
We expect to reportgenerate total revenues and net income for the threeone month ended July 31, 2010 that are similar to our average monthly total revenues and net income during the six months ended June 30, 2010 that were slightly higher than for the three months ended March 31, 2010, due to slight increases in total coal sales volumes and coal prices. We expect that our costs of operations have increased slightly as a result of an increase in purchased coal costs, which we incurred in order to2010.
supplement production while transitioning underground operations in Central Appalachia to better enable us to take advantage of favorable pricing for metallurgical coal. Nonetheless, we expect that our increased revenues will offset our increased costs, resulting in greater net income for three months ended June 30, 2010 than for the three months ended March 31, 2010.
Risk Factors
An investment in our common units involves risks. You should carefully consider the following risk factors, those other risks described in "Risk Factors" and the other information in this prospectus, before deciding whether to invest in our common units. The following risks are discussed in more detail in "Risk Factors" beginning on page 23.
We are managed and operated by the board of directors and executive officers of our general partner, Rhino GP LLC. Following this offering, approximately 69.8%73.8% of our outstanding common units and all of our outstanding subordinated units and incentive distribution rights will be owned by Wexford. As a result of owning our general partner, Wexford will have the right to appoint all members of the board of directors of our general partner, including the independent directors. Our unitholders will not be entitled to elect our general partner or its directors or otherwise directly participate in our management or operation. For more information about the executive officers and directors of our general partner, please read "Management."
Following the consummation of this offering, neither our general partner nor Wexford will receive any management fee or other compensation in connection with our general partner's management of our business, but webusiness. Our general partner, however, may receive incentive fees resulting from holding the incentive distribution rights. Please see "Provisions of our Partnership Agreement Relating to Cash Distributions—Distributions of Available Cash—General Partner Interest and Incentive Distribution Rights." We will reimburse our general partner and its affiliates, including Wexford, for all expenses they incur and payments they make on our behalf. Our partnership agreement does not set a limit on the amount of expenses for which our general partner and its affiliates may be reimbursed. These expenses include salary, bonus, incentive compensation and other amounts paid to persons who perform services for us or on our behalf and expenses allocated to our general partner by its affiliates. Our partnership agreement provides that our general partner will determine in good faith the expenses that are allocable to us.
In order to maximize operational flexibility, our operations will be conducted through, and our operating assets will be owned by, our wholly owned subsidiary, Rhino Energy LLC, and its subsidiaries. Rhino Resource Partners LP does not have any employees. All of the employees that conduct our business are employed by our general partner or our subsidiaries.
Wexford Capital LP, or Wexford Capital, is a Securities and Exchange Commission, or SEC, registered investment advisor. Wexford Capital, which was formed in 1994, manages a series of investment funds and has over $6.0 billion of assets under management.
Conflicts of Interest and Fiduciary Duties
Our general partner has a legal duty to manage us in a manner beneficial to holders of our common and subordinated units. This legal duty is commonly referred to as a "fiduciary duty." However, the officers and directors of our general partner also have fiduciary duties to manage our general partner in a manner beneficial to Wexford. As a result, conflicts of interest may arise in the future between us and our unitholders, on the one hand, and Wexford and our general partner, on the other hand.
Delaware law provides that Delaware limited partnerships may, in their partnership agreements, restrict or expand the fiduciary duties owed by the general partner to limited partners and the partnership. Our partnership agreement limits the liability of, and reduces the fiduciary duties owed by, our general partner to our common unitholders. Our partnership agreement also restricts the remedies available to our unitholders for actions that might otherwise constitute a breach of fiduciary duty by our general partner. By purchasing a common unit, a unitholder is treated as having consented to various actions and potential conflicts of interest contemplated in the partnership agreement that might otherwise be considered a breach of fiduciary or other duties under applicable state law.
For a more detailed description of the conflicts of interest and the fiduciary duties of our general partner, please read "Conflicts of Interest and Fiduciary Duties." For a description of other relationships with our affiliates, please read "Certain Relationships and Related Party Transactions."
Our principal executive offices are located at 424 Lewis Hargett Circle, Suite 250, Lexington, Kentucky. Our phone number is (859) 389-6500. Our website address will behttp://rhinolp.com. We intend to make our periodic reports and other information filed with or furnished to the SEC available, free of charge, through our website, as soon as reasonably practicable after those reports and other information are electronically filed with or furnished to the SEC. Information on our website or any other website is not incorporated by reference into this prospectus and does not constitute a part of this prospectus.
We are a Delaware limited partnership formed in April 2010 by Wexford to own and operate the business that has historically been conducted by Rhino Energy LLC.
In connection with the closing of this offering, the following will occur:
562,500486,600 common units to Rhino Energy Holdings LLC at the expiration of the option. If the underwriters exercise their option to purchase up to 562,500486,600 additional common units, the number of common units purchased by the underwriters pursuant to such exercise will be sold to the public instead of being issued to Rhino Energy Holdings LLC. The net proceeds from any exercise of the underwriters' option to purchase additional common units (approximately $10.5$9.1 million based on an assumed initial offering price of $20.00 per common unit, if exercised in full, after deducting the estimated underwriting discount and offering expenses payable by us) will be used to reimburse Rhino Energy Holdings LLC for capital expenditures it incurred with respect to the assets contributed to us.
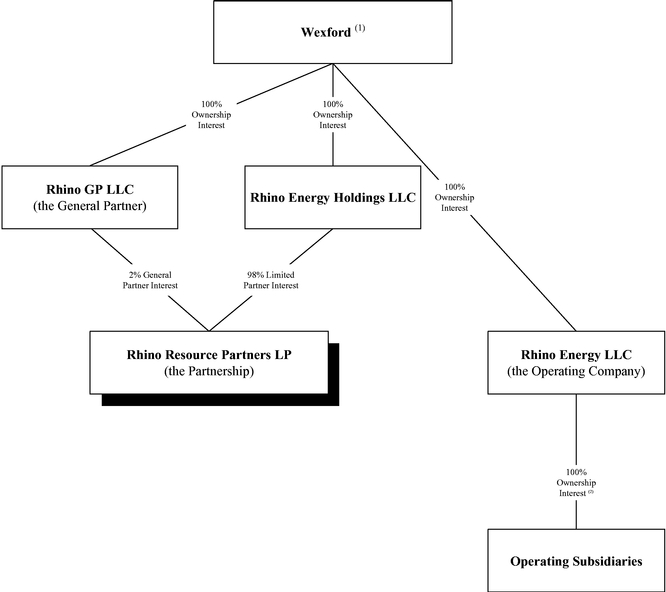
The following is a simplified diagram of our ownership structure before this offering.
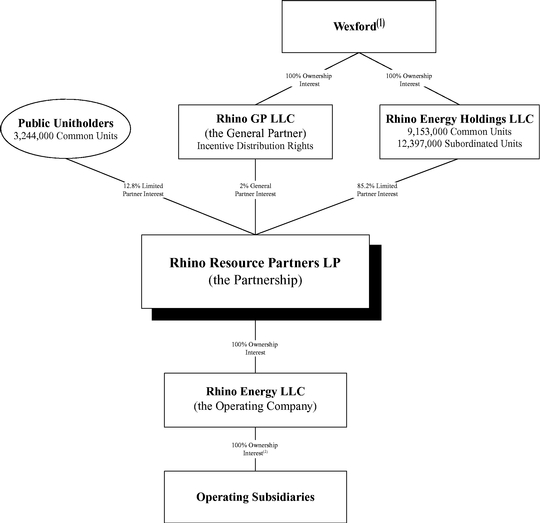
The following is a simplified diagram of our ownership structure after giving effect to this offering and the related transactions.
Public Common Units | % | ||||
Interests of Wexford: | |||||
Common Units | % | ||||
Subordinated Units | 49.0 | % | |||
General Partner Interest | 2.0 | % | |||
| 100.0 | % | ||||

The Offering
| Common units offered to the public | ||
Units outstanding after this offering | 12,397,000 common units and 12,397,000 subordinated units, each representing a 49.0% limited partner interest in us. If the underwriters do not exercise their option to purchase additional common units, we will issue | |
Use of proceeds | We intend to use the estimated net proceeds of approximately | |
The net proceeds from any exercise of the underwriters' option to purchase additional common units (approximately | ||
Please read "Use of Proceeds." |
| Cash distributions | We will make a minimum quarterly distribution of $0.445 per common unit (or $1.78 per common unit on an annualized basis) to the extent we have sufficient cash from operations after establishment of cash reserves and payment of costs and expenses, including reimbursement of expenses to our general partner and its affiliates. These expenses include salary, bonus, incentive compensation and other amounts paid to persons who perform services for us or on our behalf and expenses allocated to our general partner by its affiliates. Our partnership agreement does not set a limit on the amount of cash reserves that our general partner may establish or the amount of expenses for which our general partner and its affiliates may be reimbursed. Our ability to pay cash distributions at the minimum quarterly distribution rate is subject to various restrictions and other factors described in more detail under "Cash Distribution Policy and Restrictions on Distributions." | |
For the first quarter that we are publicly traded, we will pay investors in this offering a prorated distribution covering the period from the completion of this offering through September 30, 2010, based on the actual length of that period. | ||
Our partnership agreement requires us to distribute all of our available cash each quarter in the following manner: | ||
• first, 98.0% to the holders of common units and 2.0% to our general partner, until each common unit has received the minimum quarterly distribution of $0.445 plus any arrearages from prior quarters; | ||
• second, 98.0% to the holders of subordinated units and 2.0% to our general partner, until each subordinated unit has received the minimum quarterly distribution of $0.445; and | ||
• third, 98.0% to all unitholders, pro rata, and 2.0% to our general partner, until each unit has received a distribution of $0.51175. | ||
If cash distributions to our unitholders exceed $0.51175 per unit in any quarter, our unitholders and our general partner will receive distributions according to the following percentage allocations: |
| | Marginal Percentage Interest in Distributions | |||||||
|---|---|---|---|---|---|---|---|---|
| Total Quarterly Distribution | | General Partner | ||||||
| Target Amount | Unitholders | |||||||
above $0.51175 up to $0.55625 | 85.0 | % | 15.0 | % | ||||
above $0.55625 up to $0.6675 | 75.0 | % | 25.0 | % | ||||
above $0.6675 | 50.0 | % | 50.0 | % | ||||
| The percentage interests shown for our general partner include its 2.0% general partner interest. We refer to the additional increasing distributions to our general partner as "incentive distributions." We view these distributions as an incentive fee providing our general partner with a direct financial incentive to expand the profitability of our business to enable us to increase distributions to our limited partners. Please read "Provisions of Our Partnership Agreement Relating to Cash Distributions—Distributions of Available Cash—General Partner Interest and Incentive Distribution Rights." | ||
Pro forma cash available for distribution generated during the year ended December 31, 2009 and the twelve months ended | ||
We believe, based on our financial forecast and related assumptions included in "Cash Distribution Policy and Restrictions on Distributions—Pro Forma and Forecasted Results of Operations and Cash Available for Distribution," that we will have sufficient available cash to pay the minimum quarterly distribution of $0.445 on all of our units and the corresponding distribution on our general partner's 2.0% interest for each quarter in the twelve months ending |
| Subordinated units | Wexford will initially own all of our subordinated units. The principal difference between our common and subordinated units is that in any quarter during the subordination period, the subordinated units will not be entitled to receive any distribution until the common units have received the minimum quarterly distribution plus any arrearages in the payment of the minimum quarterly distribution from prior quarters. Subordinated units will not accrue arrearages. | |
Conversion of subordinated units | The subordination period will end on the first business day after we have earned and paid at least (1) $1.78 (the minimum quarterly distribution on an annualized basis) on each outstanding unit and the corresponding distribution on our general partner's 2.0% interest for each of three consecutive, non-overlapping four quarter periods ending on or after | |
The subordination period also will end upon the removal of our general partner other than for cause if no subordinated units or common units held by the holders of subordinated units or their affiliates are voted in favor of that removal. | ||
When the subordination period ends, all subordinated units will convert into common units on a one-for-one basis, and all common units thereafter will no longer be entitled to arrearages. Please read "Provisions of Our Partnership Agreement Relating to Cash Distributions—Subordination Period." | ||
Ineligible citizens and redemption | Only eligible citizens (meaning a person or entity qualified to hold an interest in mineral leases on federal lands) will be entitled to receive distributions or be allocated income or loss from us. If a transferee or a unitholder, as the case may be, does not properly complete the transfer application or any required recertification, for any reason, the transferee or unitholder will have no right to vote its units on any matter and we have the right to redeem such units at a price which is equal to the lower of the transferee's or unitholder's purchase price or the then-current market price of such units. The redemption price will be paid in cash or by delivery of a promissory note, as determined by our general partner. Please read "Description of the Common Units—Transfer of Common Units" and "The Partnership Agreement—Ineligible Citizens; Redemption." |
| General partner's right to reset the target distribution levels | Our general partner, as the initial holder of our incentive distribution rights, has the right, at any time when there are no subordinated units outstanding and it has received incentive distributions at the highest level to which it is entitled (48.0%, in addition to distributions paid on its 2.0% general partner interest) for each of the prior four consecutive fiscal quarters, to reset the initial target distribution levels at higher levels based on our cash distributions at the time of the exercise of the reset election. If our general partner transfers all or a portion of our incentive distribution rights in the future, then the holder or holders of a majority of our incentive distribution rights will be entitled to exercise this right. The following assumes that our general partner holds all of the incentive distribution rights at the time that a reset election is made. Following a reset election, the minimum quarterly distribution will be adjusted to equal the reset minimum quarterly distribution, and the target distribution levels will be reset to correspondingly higher levels based on the same percentage increases above the reset minimum quarterly distribution. | |
If our general partner elects to reset the target distribution levels, it will be entitled to receive common units and to retain its then-current general partner interest. The number of common units to be issued to our general partner will equal the number of common units which would have entitled the holder to an average aggregate quarterly cash distribution in the prior two quarters equal to the average of the distributions to our general partner on the incentive distribution rights in the prior two quarters. Please read "Provisions of Our Partnership Agreement Relating to Cash Distributions—General Partner's Right to Reset Incentive Distribution Levels." | ||
Issuance of additional units | Our partnership agreement authorizes us to issue an unlimited number of additional units without the approval of our unitholders. Please read "Units Eligible for Future Sale" and "The Partnership Agreement—Issuance of Additional Interests." |
| Limited voting rights | Our general partner will manage and operate us. Unlike the holders of common stock in a corporation, our unitholders will have only limited voting rights on matters affecting our business. Our unitholders will have no right to elect our general partner or its directors on an annual or other continuing basis. Our general partner may not be removed except by a vote of the holders of at least 662/3% of the outstanding units, including any units owned by our general partner and its affiliates, voting together as a single class. Upon consummation of this offering, Wexford will own an aggregate of | |
Limited call right | If at any time our general partner and its affiliates own more than 90% of the outstanding common units, our general partner has the right, but not the obligation, to purchase all of the remaining common units at a price equal to the greater of (1) the average of the daily closing price of the common units over the 20 trading days preceding the date three days before notice of exercise of the call right is first mailed and (2) the highest per-unit price paid by our general partner or any of its affiliates for common units during the 90-day period preceding the date such notice is first mailed. If our general partner and its affiliates reduce their ownership percentage to below 70% of the outstanding common units, the ownership threshold to exercise the limited call right will be reduced to 80%. Please read "The Partnership Agreement—Limited Call Right." | |
Estimated ratio of taxable income to distributions | We estimate that if you own the common units you purchase in this offering through the record date for distributions for the period ending December 31, 2012, you will be allocated, on a cumulative basis, an amount of federal taxable income for that period that will be approximately 40.0% of the cash distributed to you with respect to that period. For example, if you receive an annual distribution of $1.78 per unit, we estimate that your average allocable federal taxable income per year will be no more than approximately $0.72 per unit. Thereafter, the ratio of allocable taxable income to cash distributions to you could substantially increase. Please read "Material Tax Consequences—Tax Consequences of Unit Ownership—Ratio of Taxable Income to Distributions" for the basis of this estimate. |
| Material federal income tax consequences | For a discussion of the material federal income tax consequences that may be relevant to prospective unitholders who are individual citizens or residents of the United States, please read "Material Tax Consequences." | |
Exchange listing | We have been approved to list our common units on the New York Stock Exchange, or NYSE, under the symbol "RNO." |
Summary Historical Consolidated and Condensed Consolidated and Pro Forma Condensed Consolidated Financial and Operating Data
The following table presents summary historical consolidated financial and operating data of our predecessor, Rhino Energy LLC, as of the dates and for the periods indicated. The summary historical consolidated financial data presented as of December 31, 2007 is derived from the audited historical consolidated statement of financial position of Rhino Energy LLC that is not included in this prospectus. The summary historical consolidated financial data presented as of December 31, 2008 and 2009 and for the years ended December 31, 2007, 2008 and 2009 is derived from the audited historical consolidated financial statements of Rhino Energy LLC that are included elsewhere in this prospectus. The historical consolidated financial data as of and for the year ended December 31, 2008 was restated to reflect certain selling, general and administrative expenses within the statement of operations, rather than as a distribution to members in the statement of financial position. The summary historical consolidated financial data presented as of March 31,June 30, 2010 and for the threesix months ended March 31,June 30, 2009 and 2010 is derived from the unaudited historical condensed consolidated financial statements of Rhino Energy LLC that are included elsewhere in this prospectus. The summary historical condensed consolidated financial data presented as of March 31,June 30, 2009 is derived from our predecessor's accounting records, which are unaudited.
The summary pro forma condensed consolidated financial data presented for the year ended December 31, 2009 and as of and for the threesix months ended March 31,June 30, 2010 is derived from our unaudited pro forma condensed consolidated financial statements included elsewhere in this prospectus. Our unaudited pro forma condensed consolidated financial statements give pro forma effect to:
The unaudited pro forma condensed consolidated statement of financial position assumes the items listed above occurred as of March 31,June 30, 2010. The unaudited pro forma condensed consolidated statements of operations data for the year ended December 31, 2009 and for the threesix months ended March 31,June 30, 2010 assume the items listed above occurred as of January 1, 2009. We have not given pro forma effect to incremental selling, general and administrative expenses of approximately $3.0 million that we expect to incur as a result of being a publicly traded partnership.
For a detailed discussion of the summary historical consolidated financial information contained in the following table, please read "Management's Discussion and Analysis of Financial Condition and Results of Operations." The following table should also be read in conjunction with "Use of Proceeds," "Business—Our History" and the audited historical consolidated financial statements of Rhino Energy LLC and our unaudited pro forma condensed consolidated financial statements included elsewhere in this prospectus. Among other things,
the historical consolidated and unaudited pro forma condensed consolidated financial
statements include more detailed information regarding the basis of presentation for the information in the following table.
The following table presents a non-GAAP financial measure, EBITDA, which we use in our business as it is an important supplemental measure of our performance and liquidity. EBITDA represents net income before interest expense, income taxes and depreciation, depletion and amortization. This measure is not calculated or presented in accordance with generally accepted accounting principles, or GAAP. We explain this measure under"—Non-GAAP Financial Measure" and reconcile it to its most directly comparable financial measures calculated and presented in accordance with GAAP.
| | | Rhino Energy LLC Historical | | | | Rhino Energy LLC Historical | | | ||||||||||||||||||||||||||||||||||||||
|---|---|---|---|---|---|---|---|---|---|---|---|---|---|---|---|---|---|---|---|---|---|---|---|---|---|---|---|---|---|---|---|---|---|---|---|---|---|---|---|---|---|---|---|---|---|---|
| | | Consolidated | Condensed Consolidated | Rhino Resource Partners LP Pro Forma Condensed Consolidated | | Consolidated | Condensed Consolidated | Rhino Resource Partners LP Pro Forma Condensed Consolidated | ||||||||||||||||||||||||||||||||||||||
| | | Year Ended December 31, | Three Months Ended March 31, | Year Ended December 31, | Three Months Ended March 31, | | Year Ended December 31, | Six Months Ended June 30, | Year Ended December 31, | Six Months Ended June 30, | ||||||||||||||||||||||||||||||||||||
| | | | 2008 (as restated) | | | | 2008 (as restated) | | ||||||||||||||||||||||||||||||||||||||
| | | 2007 | 2009 | 2009 | 2010 | 2009 | 2010 | | 2007 | 2009 | 2009 | 2010 | 2009 | 2010 | ||||||||||||||||||||||||||||||||
| | | (in thousands, except per unit data) | | (in thousands, except per unit data) | ||||||||||||||||||||||||||||||||||||||||||
Statement of Operations Data: | Statement of Operations Data: | Statement of Operations Data: | ||||||||||||||||||||||||||||||||||||||||||||
Total revenues | Total revenues | $ | 403,452 | $ | 438,924 | $ | 419,790 | $ | 116,706 | $ | 66,603 | $ | 419,790 | $ | 66,603 | Total revenues | $ | 403,452 | $ | 438,924 | $ | 419,790 | $ | 226,095 | $ | 145,031 | $ | 419,790 | $ | 145,031 | ||||||||||||||||
Costs and expenses: | Costs and expenses: | Costs and expenses: | ||||||||||||||||||||||||||||||||||||||||||||
Cost of operations (exclusive of depreciation, depletion and amortization shown separately below) | 318,405 | 364,912 | 336,335 | 98,317 | 46,352 | 336,335 | 46,352 | Cost of operations (exclusive of depreciation, depletion and amortization shown separately below) | 318,405 | 364,912 | 336,335 | 183,518 | 104,192 | 336,335 | 104,192 | |||||||||||||||||||||||||||||||
Freight and handling costs | 4,021 | 10,223 | 3,990 | 938 | 673 | 3,990 | 673 | Freight and handling costs | 4,021 | 10,223 | 3,990 | 1,976 | 1,444 | 3,990 | 1,444 | |||||||||||||||||||||||||||||||
Depreciation, depletion and amortization | 30,750 | 36,428 | 36,279 | 9,974 | 7,765 | 36,279 | 7,765 | Depreciation, depletion and amortization | 30,750 | 36,428 | 36,279 | 19,872 | 15,803 | 36,279 | 15,803 | |||||||||||||||||||||||||||||||
Selling, general and administrative (exclusive of depreciation, depletion and amortization shown separately above) | 15,370 | 19,042 | 16,754 | 4,376 | 3,678 | 16,754 | 3,678 | Selling, general and administrative (exclusive of depreciation, depletion and amortization shown separately above) | 15,370 | 19,042 | 16,754 | 8,989 | 7,604 | 16,754 | 7,604 | |||||||||||||||||||||||||||||||
(Gain) loss on sale of assets | (944 | ) | 451 | 1,710 | — | (1 | ) | 1,710 | (1 | ) | (Gain) loss on sale of assets | (944 | ) | 451 | 1,710 | 1,288 | (47 | ) | 1,710 | (47 | ) | |||||||||||||||||||||||||
Income from operations | Income from operations | 35,849 | 7,868 | 24,721 | 3,101 | 8,136 | 24,721 | 8,136 | Income from operations | 35,849 | 7,868 | 24,721 | 10,452 | 16,035 | 24,721 | 16,035 | ||||||||||||||||||||||||||||||
Interest and other income (expense): | Interest and other income (expense): | Interest and other income (expense): | ||||||||||||||||||||||||||||||||||||||||||||
Interest expense | (5,579 | ) | (5,501 | ) | (6,222 | ) | (1,170 | ) | (1,471 | ) | (4,291 | ) | (992 | ) | Interest expense | (5,579 | ) | (5,501 | ) | (6,222 | ) | (2,891 | ) | (2,781 | ) | (4,271 | ) | (1,875 | ) | |||||||||||||||||
Interest income | 317 | 149 | 71 | 87 | 8 | 71 | 8 | Interest income | 317 | 149 | 71 | 69 | 18 | 71 | 18 | |||||||||||||||||||||||||||||||
Equity in net income (loss) of unconsolidated affiliate(1) | — | (1,587 | ) | 893 | (43 | ) | (130 | ) | 893 | (130 | ) | Equity in net income (loss) of unconsolidated affiliate(1) | — | (1,587 | ) | 893 | (268 | ) | 414 | 893 | 414 | |||||||||||||||||||||||||
Total interest and other income (expense) | Total interest and other income (expense) | (5,263 | ) | (6,939 | ) | (5,259 | ) | (1,125 | ) | (1,592 | ) | (3,327 | ) | (1,114 | ) | Total interest and other income (expense) | (5,263 | ) | (6,939 | ) | (5,259 | ) | (3,089 | ) | (2,349 | ) | (3,307 | ) | (1,443 | ) | ||||||||||||||||
Income tax benefit | Income tax benefit | (126 | ) | — | — | — | — | — | — | Income tax benefit | (126 | ) | — | — | — | — | — | — | ||||||||||||||||||||||||||||
Net income | Net income | $ | 30,714 | $ | 929 | $ | 19,462 | $ | 1,976 | $ | 6,544 | $ | 21,394 | $ | 7,023 | Net income | $ | 30,714 | $ | 929 | $ | 19,462 | $ | 7,362 | $ | 13,686 | $ | 21,413 | $ | 14,592 | ||||||||||||||||
Net income per limited partner unit, basic: | Net income per limited partner unit, basic: | Net income per limited partner unit, basic: | ||||||||||||||||||||||||||||||||||||||||||||
Common units | $ | 1.306 | $ | 0.360 | Common units | $ | 1.306 | $ | 0.581 | |||||||||||||||||||||||||||||||||||||
Subordinated units | $ | 0.385 | $ | 0.196 | Subordinated units | $ | 0.387 | $ | 0.573 | |||||||||||||||||||||||||||||||||||||
Net income per limited partner unit, diluted: | Net income per limited partner unit, diluted: | Net income per limited partner unit, diluted: | ||||||||||||||||||||||||||||||||||||||||||||
Common units | $ | 1.304 | $ | 0.358 | Common units | $ | 1.305 | $ | 0.578 | |||||||||||||||||||||||||||||||||||||
Subordinated units | $ | 0.385 | $ | 0.196 | Subordinated units | $ | 0.387 | $ | 0.573 | |||||||||||||||||||||||||||||||||||||
Weighted average number of limited partner units outstanding, basic: | Weighted average number of limited partner units outstanding, basic: | Weighted average number of limited partner units outstanding, basic: | ||||||||||||||||||||||||||||||||||||||||||||
Common units | 12,397,000 | 12,397,000 | Common units | 12,397,000 | 12,397,000 | |||||||||||||||||||||||||||||||||||||||||
Subordinated units | 12,397,000 | 12,397,000 | Subordinated units | 12,397,000 | 12,397,000 | |||||||||||||||||||||||||||||||||||||||||
Weighted average number of limited partner units outstanding, diluted: | Weighted average number of limited partner units outstanding, diluted: | Weighted average number of limited partner units outstanding, diluted: | ||||||||||||||||||||||||||||||||||||||||||||
Common units | 12,411,479 | 12,447,417 | Common units | 12,410,073 | 12,445,073 | |||||||||||||||||||||||||||||||||||||||||
Subordinated units | 12,397,000 | 12,397,000 | Subordinated units | 12,397,000 | 12,397,000 | |||||||||||||||||||||||||||||||||||||||||
| | | Rhino Energy LLC Historical | | | | Rhino Energy LLC Historical | | | ||||||||||||||||||||||||||||||||||||||
|---|---|---|---|---|---|---|---|---|---|---|---|---|---|---|---|---|---|---|---|---|---|---|---|---|---|---|---|---|---|---|---|---|---|---|---|---|---|---|---|---|---|---|---|---|---|---|
| | | Consolidated | Condensed Consolidated | Rhino Resource Partners LP Pro Forma Condensed Consolidated | | Consolidated | Condensed Consolidated | Rhino Resource Partners LP Pro Forma Condensed Consolidated | ||||||||||||||||||||||||||||||||||||||
| | | Year Ended December 31, | Three Months Ended March 31, | Year Ended December 31, | Three Months Ended March 31, | | Year Ended December 31, | Six Months Ended June 30, | Year Ended December 31, | Six Months Ended June 30, | ||||||||||||||||||||||||||||||||||||
| | | | 2008 (as restated) | | | | 2008 (as restated) | | ||||||||||||||||||||||||||||||||||||||
| | | 2007 | 2009 | 2009 | 2010 | 2009 | 2010 | | 2007 | 2009 | 2009 | 2010 | 2009 | 2010 | ||||||||||||||||||||||||||||||||
| | | (in thousands, except per ton data) | | (in thousands, except per ton data) | ||||||||||||||||||||||||||||||||||||||||||
Statement of Cash Flows Data: | Statement of Cash Flows Data: | Statement of Cash Flows Data: | ||||||||||||||||||||||||||||||||||||||||||||
Net cash provided by (used in): | Net cash provided by (used in): | Net cash provided by (used in): | ||||||||||||||||||||||||||||||||||||||||||||
Operating activities | $ | 52,493 | $ | 57,211 | $ | 41,495 | $ | 3,274 | $ | 4,555 | Operating activities | $ | 52,493 | $ | 57,211 | $ | 41,495 | $ | 20,222 | $ | 24,871 | |||||||||||||||||||||||||
Investing activities | $ | (28,098 | ) | $ | (106,638 | ) | $ | (27,345 | ) | $ | (11,732 | ) | $ | (6,541 | ) | Investing activities | $ | (28,098 | ) | $ | (106,638 | ) | $ | (27,345 | ) | $ | (19,424 | ) | $ | (11,588 | ) | |||||||||||||||
Financing activities | $ | (21,192 | ) | $ | 47,781 | $ | (15,401 | ) | $ | 7,028 | $ | 1,647 | Financing activities | $ | (21,192 | ) | $ | 47,781 | $ | (15,401 | ) | $ | (2,292 | ) | $ | (13,781 | ) | |||||||||||||||||||
Other Financial Data: | Other Financial Data: | Other Financial Data: | ||||||||||||||||||||||||||||||||||||||||||||
EBITDA | EBITDA | $ | 66,917 | $ | 42,858 | $ | 61,964 | $ | 13,119 | $ | 15,779 | $ | 61,964 | $ | 15,779 | EBITDA | $ | 66,917 | $ | 42,858 | $ | 61,964 | $ | 30,125 | $ | 32,270 | $ | 61,964 | $ | 32,270 | ||||||||||||||||
Capital expenditures (1) | Capital expenditures (1) | $ | 32,773 | $ | 92,741 | $ | 29,657 | $ | 10,965 | $ | 6,637 | $ | 29,657 | $ | 6,637 | Capital expenditures (1) | $ | 32,773 | $ | 92,741 | $ | 29,657 | $ | 18,825 | $ | 11,498 | $ | 29,657 | $ | 11,498 | ||||||||||||||||
Balance Sheet Data (at period end): | Balance Sheet Data (at period end): | Balance Sheet Data (at period end): | ||||||||||||||||||||||||||||||||||||||||||||
Cash and cash equivalents | Cash and cash equivalents | $ | 3,583 | $ | 1,937 | $ | 687 | $ | 508 | $ | 347 | $ | 687 | $ | 347 | Cash and cash equivalents | $ | 3,583 | $ | 1,937 | $ | 687 | $ | 443 | $ | 188 | $ | 188 | ||||||||||||||||||
Property and equipment, net | Property and equipment, net | $ | 211,657 | $ | 282,863 | $ | 270,680 | $ | 283,685 | $ | 269,603 | $ | 270,680 | $ | 269,603 | Property and equipment, net | $ | 211,657 | $ | 282,863 | $ | 270,680 | $ | 278,124 | $ | 266,357 | $ | 266,357 | ||||||||||||||||||
Total assets | Total assets | $ | 275,992 | $ | 352,536 | $ | 339,985 | $ | 369,112 | $ | 347,488 | $ | 339,985 | $ | 347,488 | Total assets | $ | 275,992 | $ | 352,536 | $ | 339,985 | $ | 350,652 | $ | 340,897 | $ | 340,897 | ||||||||||||||||||
Total liabilities | Total liabilities | $ | 158,152 | $ | 234,225 | $ | 201,584 | $ | 248,825 | $ | 202,543 | $ | 134,634 | $ | 135,593 | Total liabilities | $ | 158,152 | $ | 234,225 | $ | 201,584 | $ | 225,027 | $ | 188,811 | $ | 121,178 | ||||||||||||||||||
Total debt | Total debt | $ | 83,954 | $ | 138,027 | $ | 122,137 | $ | 145,107 | $ | 123,833 | $ | 55,187 | $ | 56,883 | Total debt | $ | 83,954 | $ | 138,027 | $ | 122,137 | $ | 137,146 | $ | 108,454 | $ | 40,821 | ||||||||||||||||||
Members'/partners' equity | Members'/partners' equity | $ | 117,841 | $ | 118,311 | $ | 138,401 | $ | 120,287 | $ | 144,944 | $ | 205,351 | $ | 211,894 | Members'/partners' equity | $ | 117,841 | $ | 118,311 | $ | 138,401 | $ | 125,625 | $ | 152,086 | $ | 219,719 | ||||||||||||||||||
Operating Data (2): | Operating Data (2): | Operating Data (2): | ||||||||||||||||||||||||||||||||||||||||||||
Tons of coal sold | Tons of coal sold | 8,159 | 7,977 | 6,699 | 1,939 | 949 | 6,699 | 949 | Tons of coal sold | 8,159 | 7,977 | 6,699 | 3,696 | 2,042 | 6,699 | 2,042 | ||||||||||||||||||||||||||||||
Tons of coal produced/purchased | Tons of coal produced/purchased | 8,024 | 8,017 | 6,732 | 1,991 | 1,044 | 6,732 | 1,044 | Tons of coal produced/purchased | 8,024 | 8,017 | 6,732 | 3,742 | 2,176 | 6,732 | 2,176 | ||||||||||||||||||||||||||||||
Coal revenues per ton (3) | Coal revenues per ton (3) | $ | 48.30 | $ | 51.25 | $ | 59.98 | $ | 58.33 | $ | 65.98 | $ | 59.98 | $ | 65.98 | Coal revenues per ton (3) | $ | 48.30 | $ | 51.25 | $ | 59.98 | $ | 59.06 | $ | 66.96 | $ | 59.98 | $ | 66.96 | ||||||||||||||||
Cost of operations per ton (4) | Cost of operations per ton (4) | $ | 39.02 | $ | 45.75 | $ | 50.21 | $ | 50.69 | $ | 48.82 | $ | 50.21 | $ | 48.82 | Cost of operations per ton (4) | $ | 39.02 | $ | 45.75 | $ | 50.21 | $ | 49.66 | $ | 51.02 | $ | 50.21 | $ | 51.02 | ||||||||||||||||
| | | Rhino Energy LLC Historical | | Rhino Energy LLC Historical | ||||||||||||||||||||||||||||||
|---|---|---|---|---|---|---|---|---|---|---|---|---|---|---|---|---|---|---|---|---|---|---|---|---|---|---|---|---|---|---|---|---|---|---|
| | | Consolidated | Condensed Consolidated | | Consolidated | Condensed Consolidated | ||||||||||||||||||||||||||||
| | | Year Ended December 31, | Three Months Ended March 31, | | Year Ended December 31, | Six Months Ended June 30, | ||||||||||||||||||||||||||||
| | | 2007 | 2008 | 2009 | 2009 | 2010 | | 2007 | 2008 | 2009 | 2009 | 2010 | ||||||||||||||||||||||
| | | (in thousands) | | (in thousands) | ||||||||||||||||||||||||||||||
Reconciliation of total capital expenditures to net cash used for capital expenditures: | Reconciliation of total capital expenditures to net cash used for capital expenditures: | Reconciliation of total capital expenditures to net cash used for capital expenditures: | ||||||||||||||||||||||||||||||||
Additions to property, plant and equipment | Additions to property, plant and equipment | $ | 14,599 | $ | 78,076 | $ | 27,836 | $ | 9,144 | $ | 6,637 | Additions to property, plant and equipment | $ | 14,599 | $ | 78,076 | $ | 27,836 | $ | 17,004 | $ | 11,440 | ||||||||||||
Acquisitions of coal companies and coal properties | Acquisitions of coal companies and coal properties | 18,174 | 14,665 | 1,821 | 1,821 | — | Acquisitions of coal companies and coal properties | 18,174 | 14,665 | — | — | 58 | ||||||||||||||||||||||
Acquisition of roof bolt manufacturing company | Acquisition of roof bolt manufacturing company | — | — | 1,821 | 1,821 | — | ||||||||||||||||||||||||||||
Net cash used for capital expenditures | Net cash used for capital expenditures | 32,773 | 92,741 | 29,657 | 10,965 | 6,637 | Net cash used for capital expenditures | 32,773 | 92,741 | 29,657 | 18,825 | 11,498 | ||||||||||||||||||||||
Plus: | Plus: | Plus: | ||||||||||||||||||||||||||||||||
Additions to property, plant and equipment financed through long-term borrowings | — | — | — | — | — | Additions to property, plant and equipment financed through long-term borrowings | — | — | — | — | — | |||||||||||||||||||||||
Total capital expenditures | Total capital expenditures | $ | 32,773 | $ | 92,741 | $ | 29,657 | $ | 10,965 | $ | 6,637 | Total capital expenditures | $ | 32,773 | $ | 92,741 | $ | 29,657 | $ | 18,825 | $ | 11,498 | ||||||||||||
EBITDA is used as a supplemental financial measure by management and by external users of our financial statements, such as investors, to assess:
EBITDA should not be considered an alternative to net income, income from operations, cash flows from operating activities or any other measure of financial performance or liquidity presented in accordance with GAAP. EBITDA excludes some, but not all, items that affect net income, income from operations and cash flows from operating activities, and these measures may vary among other companies.
EBITDA as presented below may not be comparable to similarly titled measures of other companies. The following table presents a reconciliation of EBITDA to the most directly comparable GAAP financial measures, on a historical basis and pro forma basis, as applicable, for each of the periods indicated.indicated:
| | | Rhino Energy LLC Historical | | | | Rhino Energy LLC Historical | | | ||||||||||||||||||||||||||||||||||||||
|---|---|---|---|---|---|---|---|---|---|---|---|---|---|---|---|---|---|---|---|---|---|---|---|---|---|---|---|---|---|---|---|---|---|---|---|---|---|---|---|---|---|---|---|---|---|---|
| | | Consolidated | Condensed Consolidated | Rhino Resource Partners LP Pro Forma Condensed Consolidated | | Consolidated | Condensed Consolidated | Rhino Resource Partners LP Pro Forma Condensed Consolidated | ||||||||||||||||||||||||||||||||||||||
| | | Year Ended December 31, | Three Months Ended March 31, | Year Ended December 31, | Three Months Ended March 31, | | Year Ended December 31, | Six Months Ended June 30, | Year Ended December 31, | Six Months Ended June 30, | ||||||||||||||||||||||||||||||||||||
| | | | 2008 (as restated) | | | | 2008 (as restated) | | ||||||||||||||||||||||||||||||||||||||
| | | 2007 | 2009 | 2009 | 2010 | 2009 | 2010 | | 2007 | 2009 | 2009 | 2010 | 2009 | 2010 | ||||||||||||||||||||||||||||||||
| | | (in thousands) | | (in thousands) | ||||||||||||||||||||||||||||||||||||||||||
Reconciliation of EBITDA to net income: | Reconciliation of EBITDA to net income: | Reconciliation of EBITDA to net income: | ||||||||||||||||||||||||||||||||||||||||||||
Net income | Net income | $ | 30,714 | $ | 929 | $ | 19,462 | $ | 1,976 | $ | 6,544 | $ | 21,394 | $ | 7,023 | Net income | $ | 30,714 | $ | 929 | $ | 19,462 | $ | 7,362 | $ | 13,686 | $ | 21,413 | $ | 14,592 | ||||||||||||||||
Plus: | Plus: | Plus: | ||||||||||||||||||||||||||||||||||||||||||||
Depreciation, depletion and amortization | 30,750 | 36,428 | 36,279 | 9,974 | 7,765 | 36,279 | 7,765 | Depreciation, depletion and amortization | 30,750 | 36,428 | 36,279 | 19,872 | 15,803 | 36,279 | 15,803 | |||||||||||||||||||||||||||||||
Interest expense | 5,579 | 5,501 | 6,222 | 1,170 | 1,471 | 4,291 | 992 | Interest expense | 5,579 | 5,501 | 6,222 | 2,891 | 2,781 | 4,271 | 1,875 | |||||||||||||||||||||||||||||||
Less: | Less: | Less: | ||||||||||||||||||||||||||||||||||||||||||||
Income tax benefit | 126 | — | — | — | — | — | — | Income tax benefit | 126 | — | — | — | — | — | — | |||||||||||||||||||||||||||||||
EBITDA | EBITDA | $ | 66,917 | $ | 42,858 | $ | 61,964 | $ | 13,119 | $ | 15,779 | $ | 61,964 | $ | 15,779 | EBITDA | $ | 66,917 | $ | 42,858 | $ | 61,964 | $ | 30,125 | $ | 32,270 | $ | 61,964 | $ | 32,270 | ||||||||||||||||
| | | Rhino Energy LLC Historical | | Rhino Energy LLC Historical | ||||||||||||||||||||||||||||||
|---|---|---|---|---|---|---|---|---|---|---|---|---|---|---|---|---|---|---|---|---|---|---|---|---|---|---|---|---|---|---|---|---|---|---|
| | | Consolidated | Condensed Consolidated | | Consolidated | Condensed Consolidated | ||||||||||||||||||||||||||||
| | | Year Ended December 31, | Three Months Ended March 31, | | Year Ended December 31, | Six Months Ended June 30, | ||||||||||||||||||||||||||||
| | | | 2008 (as restated) | | | | 2008 (as restated) | | ||||||||||||||||||||||||||
| | | 2007 | 2009 | 2009 | 2010 | | 2007 | 2009 | 2009 | 2010 | ||||||||||||||||||||||||
| | | (in thousands) | | (in thousands) | ||||||||||||||||||||||||||||||
Reconciliation of EBITDA to net cash provided by operating activities: | Reconciliation of EBITDA to net cash provided by operating activities: | Reconciliation of EBITDA to net cash provided by operating activities: | ||||||||||||||||||||||||||||||||
Net cash provided by operating activities | Net cash provided by operating activities | $ | 52,493 | $ | 57,211 | $ | 41,495 | $ | 3,274 | $ | 4,555 | Net cash provided by operating activities | $ | 52,493 | $ | 57,211 | $ | 41,495 | $ | 20,222 | $ | 24,871 | ||||||||||||
Plus: | Plus: | Plus: | ||||||||||||||||||||||||||||||||
Increase in net operating assets | 10,553 | — | 17,190 | 9,601 | 10,828 | Increase in net operating assets | 10,553 | — | 17,190 | 10,290 | 5,827 | |||||||||||||||||||||||
Decrease in provision for doubtful accounts | 175 | — | — | — | — | Decrease in provision for doubtful accounts | 175 | — | — | — | — | |||||||||||||||||||||||
Gain on sale of assets | 944 | — | — | — | 1 | Gain on sale of assets | 944 | — | — | 47 | ||||||||||||||||||||||||
Gain on retirement of advance royalties | 115 | — | — | — | — | Gain on retirement of advance royalties | 115 | — | — | 77 | — | |||||||||||||||||||||||
Interest expense | 5,579 | 5,501 | 6,222 | 1,170 | 1,471 | Interest expense | 5,579 | 5,501 | 6,222 | 2,891 | 2,781 | |||||||||||||||||||||||
Settlement of litigation | — | — | 1,773 | — | — | Settlement of litigation | — | — | 1,773 | — | — | |||||||||||||||||||||||
Equity in net income of unconsolidated affiliate | — | — | 893 | — | — | Equity in net income of unconsolidated affiliate | — | — | 893 | — | 414 | |||||||||||||||||||||||
Less: | Less: | Less: | ||||||||||||||||||||||||||||||||
Decrease in net operating assets | — | 10,440 | — | — | — | Decrease in net operating assets | — | 10,440 | — | — | — | |||||||||||||||||||||||
Accretion on interest-free debt | 360 | 569 | 200 | 44 | 49 | Accretion on interest-free debt | 360 | 569 | 200 | 193 | 98 | |||||||||||||||||||||||
Amortization of advance royalties | 700 | 471 | 215 | 83 | 276 | Amortization of advance royalties | 700 | 471 | 215 | 156 | 374 | |||||||||||||||||||||||
Increase in provision for doubtful accounts | — | — | 19 | — | — | Increase in provision for doubtful accounts | — | — | 19 | — | — | |||||||||||||||||||||||
Loss on sale of assets | — | 451 | 1,710 | — | — | Loss on sale of assets | — | 451 | 1,710 | 1,288 | — | |||||||||||||||||||||||
Loss on retirement of advance royalties | — | 45 | 712 | — | 78 | Loss on retirement of advance royalties | — | 45 | 712 | — | 113 | |||||||||||||||||||||||
Income tax benefit | 126 | — | — | — | — | Income tax benefit | 126 | — | — | — | — | |||||||||||||||||||||||
Accretion on asset retirement obligations | 1,757 | 2,709 | 2,753 | 756 | 542 | Accretion on asset retirement obligations | 1,757 | 2,709 | 2,753 | 1,450 | 1,085 | |||||||||||||||||||||||
Equity in net loss of unconsolidated affiliate | — | 1,587 | — | 43 | 130 | Equity in net loss of unconsolidated affiliate | — | 1,587 | — | 268 | — | |||||||||||||||||||||||
Payment of abandoned public offering expenses (a) | — | 3,582 | — | — | — | Payment of abandoned public offering expenses (a) | — | 3,582 | — | — | — | |||||||||||||||||||||||
EBITDA | EBITDA | $ | 66,917 | $ | 42,858 | $ | 61,964 | $ | 13,119 | $ | 15,779 | EBITDA | $ | 66,917 | $ | 42,858 | $ | 61,964 | $ | 30,125 | $ | 32,270 | ||||||||||||
Limited partner interests are inherently different from the capital stock of a corporation, although many of the business risks to which we are subject are similar to those that would be faced by a corporation engaged in a similar business. You should carefully consider the following risk factors together with all of the other information included in this prospectus in evaluating an investment in our common units.
If any of the following risks were to occur, our business, financial condition, results of operations and cash available for distribution could be materially adversely affected. In that case, we might not be able to make distributions on our common units, the trading price of our common units could decline, and you could lose all or part of your investment.
Risks Inherent in Our Business
We may not have sufficient cash to enable us to pay the minimum quarterly distribution on our common units following establishment of cash reserves and payment of costs and expenses, including reimbursement of expenses to our general partner.
We may not have sufficient cash each quarter to pay the full amount of our minimum quarterly distribution of $0.445 per unit, or $1.78 per unit per year, which will require us to have available cash of approximately $11.3 million per quarter, or $45.0 million per year, based on the number of common and subordinated units and the general partner interest to be outstanding after the completion of this offering. The amount of cash we can distribute on our common and subordinated units principally depends upon the amount of cash we generate from our operations, which will fluctuate from quarter to quarter based on, among other things:
For a description of additional restrictions and factors that may affect our ability to pay cash distributions, please read "Cash Distribution Policy and Restrictions on Distributions."
We must generate approximately $45.0 million of available cash from operating surplus to pay the minimum quarterly distribution for four quarters on all of our common units and subordinated units that will be outstanding immediately after this offering and the corresponding distribution on our general partner interest. For the year ended December 31, 2009 and the twelve months ended March 31,June 30, 2010, we would have generated approximately $33.4$11.6 million and $39.3$1.5 million, respectively, less than the amount of available cash from operating surplus respectively, and would have been ableneeded to pay the full minimum quarterly distribution on all of our common units, but only approximately 48.3% and 74.8%, respectively, of the minimum quarterly distribution on ouras a whole, including subordinated units, during those periods.
We must generate approximately $45.0 million (or approximately $11.3 million per quarter) of available cash to pay the minimum quarterly distribution for four quarters on all of our common units and subordinated units that will be outstanding immediately after this offering and the corresponding distribution on our general partner interest. We did not generate $45.0 million of available cash from operating surplus during the year ended December 31, 2009 or the twelve months ended March 31,June 30, 2010. The amount of available cash from operating surplus we generated with respect to those periods was approximately $33.4 million and $39.3$43.6 million, respectively. Asrespectively, or approximately $11.6 million and $1.5 million, respectively, less than the amount needed to pay the full minimum quarterly distribution on all units as a result, forwhole, including subordinated units. For those periods, we would have generated aggregate available cash sufficient to pay 100% of the aggregate minimum quarterly distribution on our common units, but only approximately 48.3%48.4% and 74.8%93.5%, respectively, of the minimum quarterly distribution on our subordinated units during those periods. We have not usedcalculated available cash on a quarter-by-quarter estimatesbasis for each quarter in the year ended December 31, 2009 andor the twelve months ended March 31,June 30, 2010 to determine if we would have generated available cash sufficient to pay the minimum quarterly distribution for each quarter during those periods.
The assumptions underlying our forecast of cash available for distribution included in "Cash Distribution Policy and Restrictions on Distributions" are inherently uncertain and subject to significant business, economic, financial, regulatory and competitive risks and uncertainties that could cause cash available for distribution to differ materially from those estimated.
We would have generated sufficient cash available for distribution to pay 100% of the minimum quarterly distribution on all of our common units during the year ended December 31, 2009 and the twelve months ended March 31,June 30, 2010, but only approximately 48.3%48.4% and 74.8%93.5%, respectively, of the minimum quarterly distribution on our subordinated units during those periods. The forecast of cash available for distribution set forth in "Cash Distribution Policy and Restrictions on Distributions" includes our forecast of our results of operations and cash available for distribution for the twelve months ending JuneSeptember 30, 2011. Our ability to pay the full minimum quarterly distribution in the forecast period is based on a number of assumptions that
may not prove to be correct, which are discussed in "Cash Distribution Policy and Restrictions on Distributions." These assumptions include, but are not limited to, the following:
Our forecast of cash available for distribution has been prepared by management, and we have not received an opinion or report on it from any independent registered public accountants. The assumptions underlying our forecast of cash available for distribution are inherently uncertain and are subject to significant business, economic, financial, regulatory and competitive risks and uncertainties that could cause cash available for distribution to differ materially from that which is forecasted. If we do not achieve our forecasted results, we may not be able to pay the minimum quarterly distribution or any amount on our common units or subordinated units, in which event the market price of our common units may decline materially. Please read "Cash Distribution Policy and Restrictions on Distributions."
A decline in coal prices could adversely affect our results of operations and cash available for distribution to our unitholders.
Our results of operations and the value of our coal reserves are significantly dependent upon the prices we receive for our coal as well as our ability to improve productivity and control costs. The prices we receive for coal depend upon factors beyond our control, including:
Any adverse change in these factors could result in weaker demand and lower prices for our products. In addition, the recent global economic downturn, particularly with respect to the U.S. economy, coupled with the global financial and credit market disruptions, have had an impact on the coal industry generally and may continue to do so until economic conditions improve. The demand for electricity in the United States decreased during 2009 as compared to 2008, which led to a decline in the demand for and prices of coal. The demand for electricity may remain at low levels or further decline if economic conditions remain weak. If these trends continue, we may not be able to sell all of the coal we are capable of producing or sell our coal at prices comparable to recent years. Recent low prices for natural gas, which is a substitute for coal generated power, may also lead to continued decreased coal consumption by electricity-generating utilities. A substantial or extended decline in the prices we receive for our coal supply contracts could materially and adversely affect our results of operations.
We could be negatively impacted by the competitiveness of the global markets in which we compete and declines in the market demand for coal.
We compete with coal producers in various regions of the United States and overseas for domestic and international sales. The domestic demand for, and prices of, our coal primarily depend on coal consumption patterns of the domestic electric utility industry and the domestic steel industry. Consumption by the domestic electric utility industry is affected by the demand for electricity, environmental and other governmental regulations, technological developments and the price of competing coal and alternative fuel sources, such as natural gas, nuclear, hydroelectric power and other renewable energy sources. Consumption by the domestic steel industry is primarily affected by economic growth and the demand for steel used in construction as well as appliances and automobiles. In recent years, the competitive environment for coal was impacted by sustained growth in a number of the largest markets in the world, including the United States, China, Japan and India, where demand for both electricity and steel have supported prices for steam and metallurgical coal. The economic stability of these markets has a significant effect on the demand for coal and the level of competition in supplying these markets. The cost of ocean transportation and the value of the U.S. dollar in relation to foreign currencies significantly impact the relative attractiveness of our coal as we compete on price with foreign coal producing sources. During the last several years, the U.S. coal industry has experienced increased consolidation, which has contributed to the industry becoming more competitive. Increased competition by coal producers or producers of alternate fuels could decrease the demand for, or pricing of, or both, for our coal, adversely impacting our results of operations and cash available for distribution.
Portions of our coal reserves possess quality characteristics that enable us to mine, process and market them as either metallurgical coal or high quality steam coal, depending on prevailing market conditions. A decline in the metallurgical market relative to the steam market could cause us to shift coal from the metallurgical market to the steam market, potentially reducing the price we could obtain for this coal and adversely impacting our cash flows, results of operations and cash available for distribution.
Our mining operations are subject to extensive and costly environmental laws and regulations, and such current and future laws and regulations could materially increase our operating costs or limit our ability to produce and sell coal.
The coal mining industry is subject to numerous and extensive federal, state and local environmental laws and regulations, including laws and regulations pertaining to permitting and
licensing requirements, air quality standards, plant and wildlife protection, reclamation and restoration of mining properties, the discharge of materials into the environment, the storage, treatment and disposal of wastes, protection of wetlands, surface subsidence from underground mining and the effects that mining has on groundwater quality and availability. The costs, liabilities and requirements associated with these laws and regulations are significant and time-consuming and may delay commencement or continuation of our operations. Moreover, the possibility exists that new laws or regulations (or new judicial interpretations or enforcement policies of existing laws and regulations) could materially affect our mining operations, results of operations and cash available for distribution to our unitholders, either through direct impacts such as those regulating our existing mining operations, or indirect impacts such as those that discourage or limit our customers' use of coal. Although we believe that we are in substantial compliance with existing laws and regulations, we may, in the future, experience violations that would subject us to administrative, civil and criminal penalties and a range of other possible sanctions. The enforcement of laws and regulations governing the coal mining industry has
increased substantially. As a result, the consequences for any noncompliance may become more significant in the future.
Our operations use petroleum products, coal processing chemicals and other materials that may be considered "hazardous materials" under applicable environmental laws and have the potential to generate other materials, all of which may affect runoff or drainage water. In the event of environmental contamination or a release of these materials, we could become subject to claims for toxic torts, natural resource damages and other damages and for the investigation and clean up of soil, surface water, groundwater, and other media, as well as abandoned and closed mines located on property we operate. Such claims may arise out of conditions at sites that we currently own or operate, as well as at sites that we previously owned or operated, or may acquire.
The government extensively regulates our mining operations, especially with respect to mine safety and health, which imposes significant actual and potential costs on us, and future regulation could increase those costs or limit our ability to produce coal.
Coal mining is subject to inherent risks to safety and health. As a result, the coal mining industry is subject to stringent safety and health standards. Recent fatal mining accidents in West Virginia have received national attention and have led to responses at the state and national levels that have resulted in increased scrutiny of coal mining operations, particularly underground mining operations. More stringent state and federal mine safety laws and regulations have included increased sanctions for non-compliance. Moreover, workplace accidents are likely to result in more stringent enforcement and possibly the passage of new laws and regulations.
In 2006, the Federal Mine Improvement and New Emergency Response Act of 2006, or the MINER Act, was enacted. The MINER Act significantly amended the Federal Mine Safety and Health Act of 1977, or the Mine Act, imposing more extensive and stringent compliance standards, increasing criminal penalties and establishing a maximum civil penalty for non-compliance, and expanding the scope of federal oversight, inspection, and enforcement activities. Following the passage of the MINER Act, the U.S. Mine Safety and Health Administration, or MSHA, issued new or more stringent rules and policies on a variety of topics, including:
Subsequent to passage of the MINER Act, Illinois, Kentucky, Pennsylvania, Ohio and West Virginia have enacted legislation addressing issues such as mine safety and accident reporting, increased civil and criminal penalties, and increased inspections and oversight. Other states may pass similar legislation in the future. Also, additional federal and state legislation that further increase mine safety regulation, inspection and enforcement, particularly with respect to
underground mining operations, has been considered in light of recent fatal mine accidents. Further workplace accidents are likely to also result in more stringent enforcement and possibly the passage of new laws and regulations.
Although we are unable to quantify the full impact, implementing and complying with these new laws and regulations could have an adverse impact on our results of operations and cash available for distribution to our unitholders and could result in harsher sanctions in the event of any violations. Please read "Business—Regulation and Laws."
Penalties, fines or sanctions levied by MSHA could have a material adverse effect on our business, results of operations and cash available for distribution. Our Mine 28 recently received a number of notices of violation from MSHA.
Surface and underground mines like ours are continuously inspected by MSHA, which often leads to notices of violation. Recently, MSHA has been conducting more frequent and more comprehensive inspections.
Recently, our Mine 28 was included on a list of forty eight48 mines that would have faced "pattern of violation" sanctions had the owners/operators of such mines not contested the notices of violation. This list was publicly released by U.S. Representative George Miller on April 14, 2010. MSHA inspected Mine 28 again promptly thereafter, and issued additional notices of violation. As a result of these and future inspections and alleged violations, we could be subject to material fines, penalties or sanctions. Mine 28, as well as any of our other mines, could be subject to a temporary or extended shut down as a result of an alleged MSHA violation. Any such penalties, fines or sanctions could have a material adverse effect on our business, results of operations and cash available for distribution.
We may be unable to obtain and/or renew permits necessary for our operations, which could prevent us from mining certain reserves.
Numerous governmental permits and approvals are required for mining operations, and we can face delays, challenges to, and difficulties in acquiring, maintaining or renewing necessary permits and approvals, including environmental permits. The permitting rules, and the interpretations of these rules, are complex, change frequently, and are often subject to discretionary interpretations by regulators, all of which may make compliance more difficult or
impractical, and may possibly preclude the continuance of ongoing mining operations or the development of future mining operations. In addition, the public has certain statutory rights to comment upon and otherwise impact the permitting process, including through court intervention. Over the past few years, the length of time needed to bring a new surface mine into production has increased because of the increased time required to obtain necessary permits. The slowing pace at which permits are issued or renewed for new and existing mines has materially impacted production in certain regions, primarily in Central Appalachia, but could also affect Northern Appalachia and other regions in the future.
Individual or general permits under Section 404 of the federal Clean Water Act, or the CWA, are required to discharge dredged or fill material into waters of the United States. Surface coal mining operators obtain such permits to authorize such activities as the creation of slurry ponds, stream impoundments, and valley fills. The U.S. Army Corps of Engineers, or the Corps, is authorized to issue "nationwide" permits for specific categories of activities that are similar in nature and that are determined to have minimal adverse environmental effects. Nationwide Permit 21, or NWP 21, authorizes the disposal of dredged or fill material from mining activities into the waters of the United States. However on June 17, 2010, the Corps suspended the use of
NWP 21, but NWP 21 authorizations already granted remain in effect. Individual Section 404 permits for valley fill surface mining activities, which we also currently utilize, are subject to legal uncertainties. On March 23, 2007, the United States District Court for the Southern District of West Virginia rescinded several individual Section 404 permits issued to other mining operations based on a finding that the Corps issued the permits in violation of the CWA and the National Environmental Policy Act, or NEPA. This decision is currently on appeal to the United States Court of Appeals for the Fourth Circuit. Additionally, on March 26, 2010, the U.S. Environmental Protection Agency, or EPA, announced a proposal to exercise its Section 404(c) "veto" power with regard to the Spruce No. 1 Surface Mine in West Virginia, which was previously permitted in 2007. This would be the first time the EPA's Section 404(c) "veto" power would be applied to a previously permitted project. Moreover, on April 1, 2010, the EPA issued interim final guidance substantially revising the environmental review of Section 402 and Section 404 permits by state and federal agencies. Please read "Business—Regulation and Laws—Clean Water Act" for a discussion of recent litigation and regulatory developments related to the CWA. An inability to conduct our mining operations pursuant to applicable permits would reduce our production and cash flows, which could limit our ability to make distributions to our unitholders.
Our mining operations are subject to operating risks that could adversely affect production levels and operating costs.
Our mining operations are subject to conditions and events beyond our control that could disrupt operations, resulting in decreased production levels and increased costs.
These risks include:
Any of these conditions may increase the cost of mining and delay or halt production at particular mines for varying lengths of time, which in turn could adversely affect our results of operations and cash available for distribution to our unitholders.
Mining accidents present a risk of various potential liabilities depending on the nature of the accident, the location, the proximity of employees or other persons to the accident scene and a range of other factors. Possible liabilities arising from a mining accident include workmen's compensation claims or civil lawsuits for workplace injuries, claims for personal injury or property damage by people living or working nearby and fines and penalties including possible criminal enforcement against us and certain of our employees. In addition, a significant accident that results in a mine shut-down could give rise to liabilities for failure to meet the requirements of coal-supply agreements especially if the counterparties dispute our invocation of the force majeure provisions of those agreements. We maintain insurance coverage as a strategy to mitigate the risks of certain of these liabilities, including business interruption insurance, but those policies are subject to various exclusions and limitations and we cannot assure you that we will receive coverage under those policies for any personal injury, property damage or business interruption claims that may arise out of such an accident. Moreover, certain potential liabilities such as fines and penalties are not insurable risks. Thus, a serious mine accident may result in material liabilities that adversely affect our results of operations and cash available for distribution.
Fluctuations in transportation costs or disruptions in transportation services could increase competition or impair our ability to supply coal to our customers, which could adversely affect our results of operations and cash available for distribution to our unitholders.
Transportation costs represent a significant portion of the total cost of coal for our customers and, as a result, the cost of transportation is a critical factor in a customer's purchasing decision. Increases in transportation costs could make coal a less competitive energy source or could make our coal production less competitive than coal produced from other sources.
Significant decreases in transportation costs could result in increased competition from coal producers in other regions. For instance, coordination of the many eastern U.S. coal loading facilities, the large number of small shipments, the steeper average grades of the terrain and a more unionized workforce are all issues that combine to make shipments originating in the eastern United States inherently more expensive on a per-mile basis than shipments originating in the western United States. Historically, high coal transportation rates from the western coal producing regions limited the use of western coal in certain eastern markets. The increased competition could have an adverse effect on our results of operations and cash available for distribution to our unitholders.
We depend primarily upon railroads, barges and trucks to deliver coal to our customers. Disruption of any of these services due to weather-related problems, strikes, lockouts, accidents, mechanical difficulties and other events could temporarily impair our ability to supply coal to our customers, which could adversely affect our results of operations and cash available for distribution to our unitholders.
In recent years, the states of Kentucky and West Virginia have increased enforcement of weight limits on coal trucks on their public roads. It is possible that other states may modify their laws to limit truck weight limits. Such legislation and enforcement efforts could result in shipment delays and increased costs. An increase in transportation costs could have an adverse effect on our ability to increase or to maintain production and could adversely affect our results of operations and cash available for distribution.
A shortage of skilled labor in the mining industry could reduce productivity and increase operating costs, which could adversely affect our results of operations and cash available for distribution to our unitholders.
Efficient coal mining using modern techniques and equipment requires skilled laborers. The coal industry is experiencing a shortage of skilled labor as well as rising labor and benefit costs, due in large part to demographic changes as existing miners retire at a faster rate than new miners are entering the workforce. If the shortage of experienced labor continues or worsens or coal producers are unable to train enough skilled laborers, there could be an adverse impact on labor productivity, an increase in our costs and our ability to expand production may be limited. If coal prices decrease or our labor prices increase, our results of operations and cash available for distribution to our unitholders could be adversely affected.
Unexpected increases in raw material costs, such as steel, diesel fuel and explosives could adversely affect our results of operations.
Our coal mining operations are affected by commodity prices. We use significant amounts of steel, diesel fuel, explosives and other raw materials in our mining operations, and volatility in the prices for these raw materials could have a material adverse effect on our operations. We typically hedge our exposure to commodity prices, such as diesel fuel and explosives, through forward purchase contracts with our suppliers. Steel prices and the prices of scrap steel, natural gas and coking coal consumed in the production of iron and steel fluctuate significantly and may change unexpectedly. For example, steel prices have recently increased. Additionally, a limited number of suppliers exist for explosives, and any of these suppliers may divert their products to other industries. Shortages in raw materials used in the manufacturing of explosives, which, in some cases, do not have ready substitutes, or the cancellation of supply contracts under which these raw materials are obtained, could increase the prices and limit the ability of our contractors to obtain these supplies. Future volatility in the price of steel, diesel fuel, explosives or other raw materials will impact our operating expenses and could adversely affect our results of operations and cash available for distribution.
If we are not able to acquire replacement coal reserves that are economically recoverable, our results of operations and cash available for distribution to our unitholders could be adversely affected.
Our results of operations and cash available for distribution to our unitholders depend substantially on obtaining coal reserves that have geological characteristics that enable them to be mined at competitive costs and to meet the coal quality needed by our customers. Because we deplete our reserves as we mine coal, our future success and growth will depend, in part, upon our ability to acquire additional coal reserves that are economically recoverable. If we fail to
acquire or develop additional reserves, our existing reserves will eventually be depleted. Replacement reserves may not be available when required or, if available, may not be capable of being mined at costs comparable to those characteristic of the depleting mines. We may not be able to accurately assess the geological characteristics of any reserves that we acquire, which may adversely affect our results of operations and cash available for distribution to our unitholders. Exhaustion of reserves at particular mines with certain valuable coal characteristics also may have an adverse effect on our operating results that is disproportionate to the percentage of overall production represented by such mines. Our ability to obtain other reserves in the future could be limited by restrictions under our existing or future debt agreements, competition from other coal companies for attractive properties, the lack of suitable acquisition candidates or the inability to acquire coal properties on commercially reasonable terms.
Inaccuracies in our estimates of coal reserves and non-reserve coal deposits could result in lower than expected revenues and higher than expected costs.
We base our and the joint venture's coal reserve and non-reserve coal deposit estimates on engineering, economic and geological data assembled and analyzed by our staff, which is periodically audited by independent engineering firms. These estimates are also based on the expected cost of production and projected sale prices and assumptions concerning the permitability and advances in mining technology. The estimates of coal reserves and non-reserve coal deposits as to both quantity and quality are periodically updated to reflect the production of coal from the reserves, updated geologic models and mining recovery data, recently acquired coal reserves and estimated costs of production and sales prices. There are numerous factors and assumptions inherent in estimating quantities and qualities of coal reserves and non-reserve coal deposits and costs to mine recoverable reserves, including many factors beyond our control. Estimates of economically recoverable coal reserves necessarily depend upon a number of variable factors and assumptions, all of which may vary considerably from actual results. These factors and assumptions relate to:
For these reasons, estimates of the quantities and qualities of the economically recoverable coal attributable to any particular group of properties, classifications of coal reserves and non-reserve coal deposits based on risk of recovery, estimated cost of production and estimates of net cash flows expected from particular reserves as prepared by different engineers or by the
same engineers at different times may vary materially due to changes in the above factors and assumptions. Actual production from identified coal reserve and non-reserve coal deposit areas or properties and revenues and expenditures associated with our and the joint venture's mining operations may vary materially from estimates. Accordingly, these estimates may not reflect our and the joint venture's actual coal reserves or non-reserve coal deposits. Any inaccuracy in our estimates related to our and the joint venture's coal reserves and non-reserve coal deposits could result in lower than expected revenues and higher than expected costs, which could have a material adverse effect on our ability to make cash distributions.
The amount of estimated maintenance capital expenditures our general partner is required to deduct from operating surplus each quarter could increase in the future, resulting in a decrease in available cash from operating surplus that could be distributed to our unitholders.
Our partnership agreement requires our general partner to deduct from operating surplus each quarter estimated maintenance capital expenditures as opposed to actual maintenance capital expenditures in order to reduce disparities in operating surplus caused by fluctuating maintenance capital expenditures, such as reserve replacement costs or refurbishment or replacement of mine equipment. Our initial annual estimated maintenance capital expenditures for purposes of calculating operating surplus will be approximately $15.5$18.6 million. This amount is based on our current estimates of the amounts of expenditures we will be required to make in the future to maintain our long-term operating capacity, which we believe to be reasonable. Our partnership agreement does not cap the amount of maintenance capital expenditures that our general partner may estimate. This amount has been taken into consideration in calculating our forecasted cash available for distribution in "Cash Distribution Policy and Restrictions on Distributions." The initial amount of our estimated maintenance capital expenditures may be more than our initial actual maintenance capital expenditures, which will reduce the amount of available cash from operating surplus that we would otherwise have available for distribution to unitholders. The amount of estimated maintenance capital expenditures deducted from operating surplus is subject to review and change by the board of directors of our general partner at least once a year, with any change approved by the conflicts committee. In addition to estimated maintenance capital expenditures, reimbursement of expenses incurred by our general partner and its affiliates will reduce the amount of available cash from operating surplus that we would otherwise have available for distribution to our unitholders. Please see "Risks Inherent in an Investment in Us—Cost reimbursements due to our general partner and its affiliates for services provided to us or on our behalf will reduce cash available for distribution to our unitholders. The amount and timing of such reimbursements will be determined by our general partner."
Existing and future laws and regulations regulating the emission of sulfur dioxide and other compounds could affect coal consumers and as a result reduce the demand for our coal. A reduction in demand for our coal could adversely affect our results of operations and cash available for distribution to our unitholders.
Federal, state and local laws and regulations extensively regulate the amount of sulfur dioxide, particulate matter, nitrogen oxides, mercury and other compounds emitted into the air from electric power plants and other consumers of our coal. These laws and regulations can require significant emission control expenditures, and various new and proposed laws and regulations may require further emission reductions and associated emission control expenditures. A certain portion of our coal has a medium to high sulfur content, which results in increased sulfur dioxide emissions when combusted and therefore the use of our coal imposes certain additional costs on customers. Accordingly, these laws and regulations may affect demand and prices for our higher sulfur coal. Please read "Business—Regulation and Laws."
Federal and state laws restricting the emissions of greenhouse gases in areas where we conduct our business or sell our coal could adversely affect our operations and demand for our coal.
Recent scientific studies have suggested that emissions of certain gases, commonly referred to as "greenhouse gases" and including carbon dioxide and methane, may be contributing to warming of the Earth's atmosphere. In response to such studies, the U.S. Congress is considering legislation to reduce emissions of greenhouse gases. Many states have already taken legal measures to reduce emissions of greenhouse gases, primarily through the development of regional greenhouse gas cap-and-trade programs.
In the wake of the Supreme Court's April 2, 2007 decision inMassachusetts, et al. v. EPA, which held that greenhouse gases fall under the definition of "air pollutant" in the federal Clean Air Act, or CAA, in December 2009, the Environmental Protection Agency, or EPA, issued a final rule declaring that six greenhouse gases, including carbon dioxide and methane, "endanger both the public health and the public welfare of current and future generations." The issuance of this "endangerment finding" allows the EPA to begin regulating greenhouse gas emissions under existing provisions of the federal CAA. In late September and early October 2009, in anticipation of the issuance of the endangerment finding, the EPA officially proposed two sets of rules regarding possible future regulation of greenhouse gas emissions under the CAA. One of these proposals would require the use of the best available control technology for greenhouse gas emissions whenever certain stationary sources, such as power plants, are built or significantly modified.
The permitting of new coal-fired power plants has also recently been contested by state regulators and environmental organizations for concerns related to greenhouse gas emissions from the new plants. In October 2007, state regulators in Kansas became the first to deny an air emissions construction permit for a new coal-fired power plant based on the plant's projected emissions of carbon dioxide. Other state regulatory authorities have also rejected the construction of new coal-fired power plants based on the uncertainty surrounding the potential costs associated with greenhouse gas emissions from these plants under future laws limiting the emissions of carbon dioxide. In addition, several permits issued to new coal-fired power plants without limits on greenhouse gas emissions have been appealed to EPA's Environmental Appeals Board.
As a result of these current and proposed laws, regulations and trends, electricity generators may elect to switch to other fuels that generate less greenhouse gas emissions, possibly further reducing demand for our coal, which could adversely affect our results of operations and cash available for distribution to our unitholders. Please read "Business—Regulation and Laws—Carbon Dioxide Emissions."
Federal and state laws require bonds to secure our obligations to reclaim mined property. Our inability to acquire or failure to maintain, obtain or renew these surety bonds could have an adverse effect on our ability to produce coal, which could adversely affect our results of operations and cash available for distribution to our unitholders.
We are required under federal and state laws to place and maintain bonds to secure our obligations to repair and return property to its approximate original state after it has been mined (often referred to as "reclamation") and to satisfy other miscellaneous obligations. Federal and state governments could increase bonding requirements in the future. Certain business transactions, such as coal leases and other obligations, may also require bonding. We may have difficulty procuring or maintaining our surety bonds. Our bond issuers may demand higher fees, additional collateral, including supporting letters of credit or posting cash collateral, or other
terms less favorable to us upon those renewals. The failure to maintain or the inability to acquire sufficient surety bonds, as required by state and federal laws, could subject us to fines and penalties as well as the loss of our mining permits. Such failure could result from a variety of factors, including:
We maintain surety bonds with third parties for reclamation expenses and other miscellaneous obligations. It is possible that we may in the future have difficulty maintaining our surety bonds for mine reclamation. Due to current economic conditions and the volatility of the financial markets, surety bond providers may be less willing to provide us with surety bonds or maintain existing surety bonds or may demand terms that are less favorable to us than the terms we currently receive. We may have greater difficulty satisfying the liquidity requirements under our existing surety bond contracts. As of March 31,June 30, 2010, we had $65.8$65.9 million in reclamation surety bonds, secured by $18.5$18.2 million in letters of credit outstanding under our credit agreement. Our credit agreement provides for a $200 million working capital revolving credit agreement, of which up to $50.0 million may be used for letters of credit. If we do not maintain sufficient borrowing capacity under our revolving credit agreement for additional letters of credit, we may be unable to obtain or renew surety bonds required for our mining operations. For more information, please read "Management's Discussion and Analysis of Financial Condition and Results of Operations—Liquidity and Capital Resources—Credit Agreement." If we do not maintain sufficient borrowing capacity or have other resources to satisfy our surety and bonding requirements, our operations and cash available for distribution to our unitholders could be adversely affected.
We depend on a few customers for a significant portion of our revenues. If a substantial portion of our supply contracts terminate or if any of these customers were to significantly reduce their purchases of coal from us, and we are unable to successfully renegotiate or replace these contracts on comparable terms, then our results of operations and cash available for distribution to our unitholders could be adversely affected.
We sell a material portion of our coal under supply contracts. As of July 13,August 23, 2010 we had sales commitments for approximately 99%97% and 80%69% of our estimated coal production (including purchased coal to supplement our production and excluding results from the joint venture) for the year ending December 31, 2010 and the twelve months ending JuneSeptember 30, 2011, respectively. When our current contracts with customers expire, our customers may decide not to extend or enter into new contracts. As of July 13,August 23, 2010, we had supply contracts for commitments that expire between JulyDecember 31, 2010 and December 31, 2014.2013. Of these committed tons, under the terms of the supply contracts, we will ship 20%22% during the remainder of 2010, 36% in 2011, 26% in 2011, 24%2012 and 16% in 2012, 21% in 2013 and 9% in 2014.2013. We derived approximately 85%85.0% and 86%81.1% of our total revenues from coal sales (excluding results from the joint venture) to our ten largest customers for the year ended December 31, 2009 and the threesix months ended March 31,June 30, 2010, respectively, with affiliates of our top three customers accounting for approximately 52.2% and approximately 48.6%44.1% of our coal sales revenues for the year ended December 31, 2009 and the threesix months ended March 31,June 30, 2010, respectively.
In the absence of long-term contracts, our customers may decide to purchase fewer tons of coal than in the past or on different terms, including different pricing terms. Negotiations to
extend existing contracts or enter into new long-term contracts with those and other customers may not be successful, and those customers may not continue to purchase coal from us under long-term coal supply contracts or may significantly reduce their purchases of coal from us. Due to the recent volatility in the market prices for metallurgical coal, there has been a recent trend towards quarterly supply contracts. As a result, customers may be less willing to enter into long-term coal supply contracts for our metallurgical coal. In addition, interruption in the purchases by or operations of our principal customers could significantly affect our results of operations and cash available for distribution. Unscheduled maintenance outages at our customers' power plants and unseasonably moderate weather are examples of conditions that might cause our customers to reduce their purchases. Our mines may have difficulty identifying alternative purchasers of their coal if their existing customers suspend or terminate their purchases. The amount and terms of sales of coal produced from our Rhino Eastern mining complex are controlled by an affiliate of Patriot pursuant to the joint venture agreement. We
cannot guarantee that Patriot will be successful in obtaining coal supply contracts at favorable prices, if at all, which could have a material adverse effect on our results of operations and cash available for distribution to our unitholders. For additional information relating to these contracts, please read "Business—Customers—Coal Supply Contracts."
Any change in consumption patterns by utilities away from the use of coal, such as resulting from current low natural gas prices, could affect our ability to sell the coal we produce, which could adversely affect our results of operations and cash available for distribution to our unitholders.
Excluding results from the joint venture, steam coal accounted for approximately 95% of our coal sales volume for the year ended December 31, 2009 and approximately 86%85% of our coal sales volume for the threesix months ended March 31,June 30, 2010. The majority of our sales of steam coal for the year ended December 31, 2009 and the threesix months ended March 31,June 30, 2010 were to electric utilities for use primarily as fuel for domestic electricity consumption. According to the U.S. Department of Energy's Energy Information Administration, the domestic electric utility industry accounted for approximately 94% of domestic coal consumption in 2009. The amount of coal consumed by the domestic electric utility industry is affected primarily by the overall demand for electricity, environmental and other governmental regulations, and the price and availability of competing fuels for power plants such as nuclear, natural gas and oil as well as alternative sources of energy. We compete generally with producers of other fuels, such as natural gas and oil. A decline in price for these fuels, could cause demand for coal to decrease and adversely affect the price of our coal. For example, low natural gas prices have led, in some instances, to decreased coal consumption by electricity-generating utilities. If alternative energy sources, such as nuclear, hydroelectric, wind or solar, become more cost-competitive on an overall basis, demand for coal could decrease and the price of coal could be materially and adversely affected. Further, legislation requiring, subsidizing or providing tax benefit for the use of alternative energy sources and fuels, or legislation providing financing or incentives to encourage continuing technological advances in this area, could further enable alternative energy sources to become more competitive with coal. A decrease in coal consumption by the domestic electric utility industry could adversely affect the price of coal, which could materially adversely affect our results of operations and cash available for distribution to our unitholders.
Certain provisions in our long-term supply contracts may provide limited protection during adverse economic conditions, may result in economic penalties to us or permit the customer to terminate the contract.
Price adjustment, "price re-opener" and other similar provisions in our supply contracts may reduce the protection from short-term coal price volatility traditionally provided by such contracts. As of July 22, 2010, one of our coal supply contracts relating to sales commitments for
our estimated coal production through 2014 containedPrice re-opener provisions that allow for the purchase price to be renegotiated at periodic intervals. This price re-opener provision requirestypically require the parties to agree on a new price. Failure of the parties to agree on a price under thea price re-opener provision can lead to termination of the contract. Any adjustment or renegotiations leading to a significantly lower contract price could adversely affect our results of operations and cash available for distribution to our unitholders. We are currently renegotiating the purchase price pursuant to this price re-opener provision. If we fail to agree on a new price prior to October 1, 2010, this coal supply contract will terminate.
Coal supply contracts also typically contain force majeure provisions allowing temporary suspension of performance by us or our customers during the duration of specified events beyond the control of the affected party. Most of our coal supply contracts also contain provisions requiring us to deliver coal meeting quality thresholds for certain characteristics such as Btu, sulfur content, ash content, hardness and ash fusion temperature. Failure to meet these specifications could result in economic penalties, including price adjustments, the rejection of deliveries or termination of the contracts. In addition, certain of our supply contracts permit the customer to terminate the agreement in the event of changes in regulations affecting our industry that increase the price of coal beyond a specified limit.
Disruption in supplies of coal produced by contractors operating at our mines could temporarily impair our ability to fill our customers' orders or increase our costs.
We at times use contractors to operate certain of our mines. For both the year ended December 31, 2009 and the threesix months ended March 31,June 30, 2010, approximately 4% of our total coal production was from contractor-operated mines. Disruption in our supply of coal produced by these contractors and outside vendors could temporarily impair our ability to fill our customers' orders or require us to pay higher prices in order to obtain the required coal from other sources. Operational difficulties at contractor-operated mines, changes in demand for contract miners from other coal producers and other factors beyond our control could affect the availability, pricing and quality of coal produced by our contractors. Any increase in the prices we pay for contractor-produced coal could increase our costs and therefore adversely affect our results of operations and cash available for distribution to our unitholders.
Defects in title in the properties that we own or loss of any leasehold interests could limit our ability to mine these properties or result in significant unanticipated costs.
We conduct a significant part of our mining operations on leased properties. A title defect or the loss of any lease could adversely affect our ability to mine the associated reserves. Title to most of our owned and leased properties and the associated mineral rights is not usually verified until we make a commitment to develop a property, which may not occur until after we have obtained necessary permits and completed exploration of the property. In some cases, we rely on title information or representations and warranties provided by our grantors or lessors, as the case may be. Our right to mine some reserves would be adversely affected by defects in title or boundaries or if a lease expires. Any challenge to our title or leasehold interest could delay the exploration and development of the property and could ultimately result in the loss of some or all of our interest in the property. Mining operations from time to time may rely on a lease that we are unable to renew on terms at least as favorable, if at all. In such event, we may have to close down or significantly alter the sequence of mining operations or incur additional costs to obtain or renew such leases, which could adversely affect our future coal production. If we mine on property that we do not control, we could incur liability for such mining. Wexford will not indemnify us for losses attributable to title defects in the properties that we own or lease.
Our work force could become unionized in the future, which could adversely affect our production and labor costs and increase the risk of work stoppages.
Currently, none of our employees are represented under collective bargaining agreements. However, we cannot assure you that all of our work force will remain union-free in the future. If some or all of our work force were to become unionized, it could adversely affect our productivity and labor costs and increase the risk of work stoppages.
We depend on key personnel for the success of our business.
We depend on the services of our senior management team and other key personnel. The loss of the services of any member of senior management or key employee could have an adverse effect on our business and reduce our ability to make distributions to our unitholders. We may not be able to locate or employ on acceptable terms qualified replacements for senior management or other key employees if their services were no longer available.
If the assumptions underlying our reclamation and mine closure obligations are materially inaccurate, we could be required to expend greater amounts than anticipated.
The Federal Surface Mining Control and Reclamation Act of 1977 and counterpart state laws and regulations establish operational, reclamation and closure standards for all aspects of surface mining as well as most aspects of underground mining. Estimates of our total reclamation and
mine closing liabilities are based upon permit requirements and our engineering expertise related to these requirements. The estimate of ultimate reclamation liability is reviewed both periodically by our management and annually by independent third-party engineers. The estimated liability can change significantly if actual costs vary from assumptions or if governmental regulations change significantly. Please read "Management's Discussion and Analysis of Financial Condition and Results of Operations—Critical Accounting Policies and Estimates—Asset Retirement Obligations." Wexford will not indemnify us against any reclamation or mine closing liabilities associated with our assets.
We may invest in non-coal natural resource assets, which could have a material adverse effect on our results of operations and cash available for distribution to our unitholders.
Part of our business strategy is to expand our operations through strategic acquisitions, which may include investing in non-coal natural resources assets. Our management team has no experience investing in or operating non-coal natural resources assets and we may be unable to hire additional management with relevant expertise in acquiring and operating such assets. Furthermore, the acquisition of non-coal natural resource assets could expose us to new and additional operating and regulatory risks. Investments in non-coal natural resource assets could have a material adverse effect on our results of operations and cash available for distribution to our unitholders.
Our debt levels may limit our flexibility in obtaining additional financing and in pursuing other business opportunities.
Our level of indebtedness could have important consequences to us, including the following:
Increases in our total indebtedness would increase our total interest expense, which would in turn reduce our forecasted cash available for distribution. As of December 31, 2009 our current portion of long-term debt that will be funded from cash flows from operating activities during 2010 was approximately $2.2 million. Our ability to service our indebtedness will depend upon, among other things, our future financial and operating performance, which will be affected by prevailing economic conditions and financial, business, regulatory and other factors, some of which are beyond our control. If our operating results are not sufficient to service our current or future indebtedness, we will be forced to take actions such as reducing distributions, reducing or delaying our business activities, acquisitions, investments and/or capital expenditures, selling assets, restructuring or refinancing our indebtedness, or seeking additional equity capital or bankruptcy protection. We may not be able to effect any of these remedies on satisfactory terms, or at all.
Our credit agreement contains operating and financial restrictions that may restrict our business and financing activities and limit our ability to pay distributions upon the occurrence of certain events.
The operating and financial restrictions and covenants in our credit agreement and any future financing agreements could restrict our ability to finance future operations or capital needs or to engage, expand or pursue our business activities. For example, our credit agreement restricts our ability to:
In addition, our payment of principal and interest on our debt will reduce cash available for distribution on our units. Our credit agreement limits our ability to pay distributions upon the occurrence of the following events, among others, which would apply to us and our subsidiaries:
Any subsequent refinancing of our current debt or any new debt could have similar restrictions. Our ability to comply with the covenants and restrictions contained in our credit agreement may be affected by events beyond our control, including prevailing economic, financial and industry conditions. If market or other economic conditions deteriorate, our ability to comply with these covenants may be impaired. If we violate any of the restrictions, covenants, ratios or tests in our credit agreement, a significant portion of our indebtedness may become immediately due and payable, and our lenders' commitment to make further loans to us may terminate. We might not have, or be able to obtain, sufficient funds to make these accelerated payments. In addition, our obligations under our credit agreement will be secured by substantially all of our assets, and if we are unable to repay our indebtedness under our credit agreement, the lenders could seek to foreclose on such assets.
For more information, please read "Management's Discussion and Analysis of Financial Condition and Results of Operations—Liquidity and Capital Resources—Credit Agreement."
Risks Inherent in an Investment in Us
Wexford owns and controls our general partner, which has sole responsibility for conducting our business and managing our operations. Our general partner and its affiliates, including Wexford, have conflicts of interest with us and limited fiduciary duties, and they may favor their own interests to the detriment of us and our unitholders.
Following the offering, Wexford will own and control our general partner and will appoint all of the directors of our general partner. Although our general partner has a fiduciary duty to manage us in a manner beneficial to us and our unitholders, the executive officers and directors of our general partner have a fiduciary duty to manage our general partner in a manner beneficial to Wexford. Therefore, conflicts of interest may arise between Wexford and its affiliates, including our general partner, on the one hand, and us and our unitholders, on the other hand. In resolving these conflicts of interest, our general partner may favor its own interests and the interests of its affiliates over the interests of our common unitholders.
In addition, Wexford currently holds substantial interests in other companies in the energy and natural resource sectors. We may compete directly with entities in which Wexford has an interest for acquisition opportunities and potentially will compete with these entities for new business or extensions of the existing services provided by us. Please read "—Our sponsor, Wexford Capital, and affiliates of our general partner may compete with us" and "Conflicts of Interest and Fiduciary Duties."
Common units held by unitholders who are not eligible citizens will be subject to redemption.
In order to comply with U.S. laws with respect to the ownership of interests in mineral leases on federal lands, we have adopted certain requirements regarding those investors who own our common units. As used in this prospectus, an eligible citizen means a person or entity qualified to hold an interest in mineral leases on federal lands. As of the date hereof, an eligible citizen must be: (1) a citizen of the United States; (2) a corporation organized under the laws of the United States or of any state thereof; or (3) an association of U.S. citizens, such as a partnership or limited liability company, organized under the laws of the United States or of any state thereof, but only if such association does not have any direct or indirect foreign ownership, other than foreign ownership of stock in a parent corporation organized under the laws of the United States or of any state thereof. For the avoidance of doubt, onshore mineral leases or any direct or indirect interest therein may be acquired and held by aliens only through stock ownership, holding or control in a corporation organized under the laws of the United States or of any state thereof. Unitholders who are not persons or entities who meet the requirements to be an eligible citizen run the risk of having their units redeemed by us at the lower of their purchase price cost or the then-current market price. The redemption price will be paid in cash or by delivery of a promissory note, as determined by our general partner. Please read "Description of the Common Units—Transfer of Common Units" and "The Partnership Agreement—Ineligible Citizens; Redemption."
Our general partner intends to limit its liability regarding our obligations.
Our general partner intends to limit its liability under contractual arrangements so that the counterparties to such arrangements have recourse only against our assets, and not against our general partner or its assets. Our general partner may therefore cause us to incur indebtedness or other obligations that are nonrecourse to our general partner. Our partnership agreement provides that any action taken by our general partner to limit its liability is not a breach of our general partner's fiduciary duties, even if we could have obtained more favorable terms without the limitation on liability. In addition, we are obligated to reimburse or indemnify our general partner to the extent that it incurs obligations on our behalf. Any such reimbursement or indemnification payments would reduce the amount of cash otherwise available for distribution to our unitholders.
Our partnership agreement requires that we distribute all of our available cash, which could limit our ability to grow and make acquisitions.
We expect that we will distribute all of our available cash to our unitholders and will rely primarily upon external financing sources, including commercial bank borrowings and the issuance of debt and equity securities, to fund our acquisitions and expansion capital expenditures. As a result, to the extent we are unable to finance growth externally, our cash distribution policy will significantly impair our ability to grow.
In addition, because we distribute all of our available cash, our growth may not be as fast as that of businesses that reinvest their available cash to expand ongoing operations. To the extent we issue additional units in connection with any acquisitions or expansion capital expenditures, the payment of distributions on those additional units may increase the risk that we will be unable to maintain or increase our per unit distribution level. There are no limitations in our partnership agreement or our credit agreement on our ability to issue additional units, including units ranking senior to the common units. The incurrence of additional commercial borrowings or other debt to finance our growth strategy would result in increased interest expense, which, in turn, may impact the available cash that we have to distribute to our unitholders.
Our partnership agreement limits our general partner's fiduciary duties to holders of our common and subordinated units.
Our partnership agreement contains provisions that modify and reduce the fiduciary standards to which our general partner would otherwise be held by state fiduciary duty law. For example, our partnership agreement permits our general partner to make a number of decisions in its individual capacity, as opposed to in its capacity as our general partner, or otherwise free of fiduciary duties to us and our unitholders. This entitles our general partner to consider only the interests and factors that it desires and relieves it of any duty or obligation to give any consideration to any interest of, or factors affecting, us, our affiliates or our limited partners. Examples of decisions that our general partner may make in its individual capacity include:
By purchasing a common unit, a unitholder is treated as having consented to the provisions in the partnership agreement, including the provisions discussed above. Please read "Conflicts of Interest and Fiduciary Duties—Fiduciary Duties."
Our partnership agreement restricts the remedies available to holders of our common and subordinated units for actions taken by our general partner that might otherwise constitute breaches of fiduciary duty.
Our partnership agreement contains provisions that restrict the remedies available to unitholders for actions taken by our general partner that might otherwise constitute breaches of fiduciary duty under state fiduciary duty law. For example, our partnership agreement:
In connection with a situation involving a transaction with an affiliate or a conflict of interest, any determination by our general partner must be made in good faith. If an affiliate transaction or the resolution of a conflict of interest is not approved by our common unitholders or the conflicts committee and the board of directors of our general partner determines that the resolution or course of action taken with respect to the affiliate transaction or conflict of interest satisfies either of the standards set forth in subclauses (3) and (4) above, then it will be presumed that, in making its decision, the board of directors acted in good faith, and in any proceeding brought by or on behalf of any limited partner or the partnership, the person bringing or prosecuting such proceeding will have the burden of overcoming such presumption. Please read "Conflicts of Interest and Fiduciary Duties."
Our sponsor, Wexford Capital, and affiliates of our general partner may compete with us.
Our partnership agreement provides that our general partner will be restricted from engaging in any business activities other than acting as our general partner and those activities incidental to its ownership interest in us. Affiliates of our general partner, including our sponsor, Wexford Capital, and its investment funds, are not prohibited from engaging in other businesses or activities, including those that might be in direct competition with us. Through its investment funds, Wexford Capital currently holds substantial interests in other companies in the energy and natural resources sectors. Wexford Capital, through its investment funds and managed accounts, makes investments and purchases entities in the coal and oil and natural gas sectors. These investments and acquisitions may include entities or assets that we would have been interested in acquiring. Therefore, Wexford Capital may compete with us for investment opportunities and Wexford may own an interest in entities that compete with us.
Pursuant to the terms of our partnership agreement, the doctrine of corporate opportunity, or any analogous doctrine, does not apply to our general partner or any of its affiliates, including its executive officers, directors and Wexford Capital. Any such person or entity that becomes aware of a potential transaction, agreement, arrangement or other matter that may be an opportunity for us will not have any duty to communicate or offer such opportunity to us. Any such person or entity will not be liable to us or to any limited partner for breach of any fiduciary duty or other duty by reason of the fact that such person or entity pursues or acquires such opportunity for itself, directs such opportunity to another person or entity or does not communicate such opportunity or information to us. This may create actual and potential conflicts of interest between us and affiliates of our general partner and result in less than favorable treatment of us and our unitholders. Please read "Conflicts of Interest and Fiduciary Duties."
Our general partner may elect to cause us to issue common units to it in connection with a resetting of the target distribution levels related to its incentive distribution rights, without the approval of the conflicts committee of its board of directors or the holders of our common units. This could result in lower distributions to holders of our common units.
Our general partner has the right, at any time when there are no subordinated units outstanding and it has received incentive distributions at the highest level to which it is entitled (48.0%) for each of the prior four consecutive fiscal quarters, to reset the initial target distribution levels at higher levels based on our distributions at the time of the exercise of the reset election. Following a reset election by our general partner, the minimum quarterly distribution will be adjusted to equal the reset minimum quarterly distribution and the target distribution levels will be reset to correspondingly higher levels based on percentage increases above the reset minimum quarterly distribution.
If our general partner elects to reset the target distribution levels, it will be entitled to receive a number of common units and will retain its then-current general partner interest. The number of common units to be issued to our general partner will equal the number of common units which would have entitled the holder to an average aggregate quarterly cash distribution in the prior two quarters equal to the average of the distributions to our general partner on the incentive distribution rights in the prior two quarters. We anticipate that our general partner would exercise this reset right in order to facilitate acquisitions or internal growth projects that would not be sufficiently accretive to cash distributions per common unit without such conversion. It is possible, however, that our general partner could exercise this reset election at a time when it is experiencing, or expects to experience, declines in the cash distributions it receives related to its incentive distribution rights and may, therefore, desire to be issued
common units rather than retain the right to receive incentive distributions based on the initial target distribution levels. As a result, a reset election may cause our common unitholders to experience a reduction in the amount of cash distributions that our common unitholders would have otherwise received had we not issued new common units to our general partner in connection with resetting the target distribution levels. Please read "Provisions of Our Partnership Agreement Relating to Cash Distributions—General Partner's Right to Reset Incentive Distribution Levels."
Holders of our common units have limited voting rights and are not entitled to elect our general partner or its directors, which could reduce the price at which the common units will trade.
Unlike the holders of common stock in a corporation, unitholders have only limited voting rights on matters affecting our business and, therefore, limited ability to influence management's decisions regarding our business. Unitholders will have no right on an annual or ongoing basis to elect our general partner or its board of directors. The board of directors of our general partner, including the independent directors, is chosen entirely by Wexford, as a result of it owning our general partner, and not by our unitholders. Please read "Management—Management of Rhino Resource Partners LP" and "Certain Relationships and Related Party Transactions—Ownership Interests of Certain Directors of Our General Partner." Unlike publicly traded corporations, we will not conduct annual meetings of our unitholders to elect directors or conduct other matters routinely conducted at annual meetings of stockholders of corporations. As a result of these limitations, the price at which the common units will trade could be diminished because of the absence or reduction of a takeover premium in the trading price.
Even if holders of our common units are dissatisfied, they cannot initially remove our general partner without its consent.
If our unitholders are dissatisfied with the performance of our general partner, they will have limited ability to remove our general partner. Unitholders initially will be unable to remove our general partner without its consent because our general partner and its affiliates will own sufficient units upon the completion of this offering to be able to prevent its removal. The vote of the holders of at least 662/3% of all outstanding common and subordinated units voting together as a single class is required to remove our general partner. Following the closing of this offering, Wexford will own an aggregate of 84.9%86.9% of our common and subordinated units (or 82.6%85.0% of our common and subordinated units, if the underwriters exercise their option to purchase additional common units in full). Also, if our general partner is removed without cause during the subordination period and no units held by the holders of the subordinated units or their affiliates are voted in favor of that removal, all remaining subordinated units will automatically be converted into common units and any existing arrearages on the common units will be extinguished. Cause is narrowly defined in our partnership agreement to mean that a
court of competent jurisdiction has entered a final, non-appealable judgment finding our general partner liable for actual fraud or willful or wanton misconduct in its capacity as our general partner. Cause does not include most cases of charges of poor management of the business.
Unitholders will experience immediate and substantial dilution of $11.75$11.43 per common unit.
The assumed initial public offering price of $20.00 per common unit exceeds pro forma net tangible book value of $8.25$8.57 per common unit. Based on the assumed initial public offering price of $20.00 per common unit, unitholders will incur immediate and substantial dilution of $11.75$11.43 per common unit. This dilution results primarily because the assets contributed to us by
affiliates of our general partner are recorded at their historical cost in accordance with GAAP, and not their fair value. Please read "Dilution."
Our general partner interest or the control of our general partner may be transferred to a third party without unitholder consent.
Our general partner may transfer its general partner interest to a third party in a merger or in a sale of all or substantially all of its assets without the consent of our unitholders. Furthermore, our partnership agreement does not restrict the ability of the members of our general partner to transfer their respective membership interests in our general partner to a third party. The new members of our general partner would then be in a position to replace the board of directors and executive officers of our general partner with their own designees and thereby exert significant control over the decisions taken by the board of directors and executive officers of our general partner. This effectively permits a "change of control" without the vote or consent of the unitholders.
Our general partner has a limited call right that may require unitholders to sell their common units at an undesirable time or price.
If at any time our general partner and its affiliates own more than 90% of the common units, our general partner will have the right, but not the obligation, which it may assign to any of its affiliates or to us, to acquire all, but not less than all, of the common units held by unaffiliated persons at a price equal to the greater of (1) the average of the daily closing price of the common units over the 20 trading days preceding the date three days before notice of exercise of the call right is first mailed and (2) the highest per-unit price paid by our general partner or any of its affiliates for common units during the 90-day period preceding the date such notice is first mailed. If our general partner and its affiliates reduce their ownership percentage to below 70% of the outstanding common units, the ownership threshold to exercise the limited call rights will be reduced to 80%. As a result, unitholders may be required to sell their common units at an undesirable time or price and may not receive any return or a negative return on their investment. Unitholders may also incur a tax liability upon a sale of their units. Our general partner is not obligated to obtain a fairness opinion regarding the value of the common units to be repurchased by it upon exercise of the limited call right. There is no restriction in our partnership agreement that prevents our general partner from issuing additional common units and exercising its call right. If our general partner exercised its limited call right, the effect would be to take us private and, if the units were subsequently deregistered, we would no longer be subject to the reporting requirements of the Securities Exchange Act of 1934, or the Exchange Act. Upon consummation of this offering, and assuming no exercise of the underwriters' option to purchase additional common units, Wexford will own an aggregate of 84.9%86.9% of our common and subordinated units. At the end of the subordination period, assuming no additional issuances of units (other than upon the conversion of the subordinated units), Wexford will own 84.9%86.9% of our common units. For additional information about the limited call right, please read "The Partnership Agreement—Limited Call Right."
We may issue additional units without unitholder approval, which would dilute existing unitholder ownership interests.
Our partnership agreement does not limit the number of additional limited partner interests we may issue at any time without the approval of our unitholders. The issuance of additional common units or other equity interests of equal or senior rank will have the following effects:
The market price of our common units could be adversely affected by sales of substantial amounts of our common units in the public or private markets, including sales by Wexford or other large holders.
After this offering, we will have 12,397,000 common units and 12,397,000 subordinated units outstanding, which includes the 3,750,0003,244,000 common units we are selling in this offering that may be resold in the public market immediately. All of the subordinated units will convert into common units on a one-for-one basis at the end of the subordination period. All of the 8,647,0009,153,000 common units (8,084,500(8,666,400 if the underwriters exercise in full their option to purchase additional common units)units in full) that are issued to Rhino Energy Holdings LLC will be subject to resale restrictions under a 180-day lock-up agreement with the underwriters. Each of the lock-up agreements with the underwriters may be waived in the discretion of certain of the underwriters. Sales by Wexford or other large holders of a substantial number of our common units in the public markets following this offering, or the perception that such sales might occur, could have a material adverse effect on the price of our common units or could impair our ability to obtain capital through an offering of equity securities. In addition, we have agreed to provide registration rights to Wexford. Under our agreement, our general partner and its affiliates have registration rights relating to the offer and sale of any units that they hold, subject to certain limitations. Please read "Units Eligible for Future Sale."
Our partnership agreement restricts the voting rights of unitholders owning 20% or more of our common units.
Our partnership agreement restricts unitholders' voting rights by providing that any units held by a person or group that owns 20% or more of any class of units then outstanding, other than our general partner and its affiliates, their transferees and persons who acquired such units with the prior approval of the board of directors of our general partner, cannot vote on any matter.
Cost reimbursements due to our general partner and its affiliates for services provided to us or on our behalf will reduce cash available for distribution to our unitholders. The amount and timing of such reimbursements will be determined by our general partner.
Prior to making any distribution on the common units, we will reimburse our general partner and its affiliates for all expenses they incur and payments they make on our behalf. Our partnership agreement does not set a limit on the amount of expenses for which our general partner and its affiliates may be reimbursed. These expenses include salary, bonus, incentive compensation and other amounts paid to persons who perform services for us or on our behalf and expenses allocated to our general partner by its affiliates. Our partnership agreement provides that our general partner will determine in good faith the expenses that are allocable to us. The reimbursement of expenses and payment of fees, if any, to our general partner and its affiliates will reduce the amount of available cash to pay cash distributions to our unitholders. Please read "Cash Distribution Policy and Restrictions on Distributions."
While our partnership agreement requires us to distribute all of our available cash, our partnership agreement, including provisions requiring us to make cash distributions contained therein, may be amended.
While our partnership agreement requires us to distribute all of our available cash, our partnership agreement, including provisions requiring us to make cash distributions contained therein, may be amended. Our partnership agreement generally may not be amended during the subordination period without the approval of our public common unitholders. However, our partnership agreement can be amended with the consent of our general partner and the approval of a majority of the outstanding common units (including common units held by Wexford) after the subordination period has ended. At the closing of this offering, Wexford will own approximately 69.8%73.8% of the outstanding common units and all of our outstanding subordinated units. Please read "The Partnership Agreement—Amendment of the Partnership Agreement."
There is no existing market for our common units, and a trading market that will provide you with adequate liquidity may not develop. The price of our common units may fluctuate significantly, and unitholders could lose all or part of their investment.
Prior to this offering, there has been no public market for the common units. After this offering, there will be only 3,750,0003,244,000 publicly traded common units. We do not know the extent to which investor interest will lead to the development of a trading market or how liquid that market might be. Unitholders may not be able to resell their common units at or above the initial public offering price. Additionally, the lack of liquidity may result in wide bid-ask spreads, contribute to significant fluctuations in the market price of the common units and limit the number of investors who are able to buy the common units.
The initial public offering price for our common units will be determined by negotiations between us and the representative of the underwriters and may not be indicative of the market price of the common units that will prevail in the trading market. The market price of our common units may decline below the initial public offering price. The market price of our common units may also be influenced by many factors, some of which are beyond our control, including:
Unitholders may have liability to repay distributions and in certain circumstances may be personally liable for the obligations of the Partnership.
Under certain circumstances, unitholders may have to repay amounts wrongfully returned or distributed to them. Under Section 17-607 of the Delaware Revised Uniform Limited Partnership Act, or the Delaware Act, we may not make a distribution to our unitholders if the distribution would cause our liabilities to exceed the fair value of our assets. Delaware law provides that for a period of three years from the date of the impermissible distribution, limited partners who received the distribution and who knew at the time of the distribution that it violated Delaware law will be liable to the limited partnership for the distribution amount. A purchaser of units who becomes a limited partner is liable for the obligations of the transferring limited partner to make contributions to the partnership that are known to the purchaser of units at the time it became a limited partner and for unknown obligations if the liabilities could be determined from the partnership agreement. Liabilities to partners on account of their partnership interests and liabilities that are non-recourse to the partnership are not counted for purposes of determining whether a distribution is permitted.
It may be determined that the right, or the exercise of the right by the limited partners as a group, to (i) remove or replace our general partner, (ii) approve some amendments to our partnership agreement or (iii) take other action under our partnership agreement constitutes "participation in the control" of our business. A limited partner that participates in the control of our business within the meaning of the Delaware Act may be held personally liable for our obligations under the laws of Delaware, to the same extent as our general partner. This liability would extend to persons who transact business with us under the reasonable belief that the limited partner is a general partner. Neither our partnership agreement nor the Delaware Act specifically provides for legal recourse against our general partner if a limited partner were to lose limited liability through any fault of our general partner. See "The Partnership Agreement—Limited Liability."
The New York Stock Exchange does not require a publicly traded limited partnership like us to comply with certain of its corporate governance requirements.
We have been approved to list our common units on the NYSE. Because we will be a publicly traded limited partnership, the NYSE does not require us to have a majority of independent directors on our general partner's board of directors or to establish a compensation committee or a nominating and corporate governance committee. Accordingly, unitholders will not have the same protections afforded to certain corporations that are subject to all of the NYSE corporate governance requirements. Please read "Management—Management of Rhino Resource Partners LP."
We cannot provide absolute assurance as to our ability to establish and maintain effective internal controls in accordance with applicable federal securities laws and regulations, and we may incur significant costs in our efforts.
Prior to this offering, we have not been required to file reports with the SEC. Upon the completion of this offering, we will become subject to the public reporting requirements of the Exchange Act. We prepare our consolidated financial statements in accordance with GAAP, but our internal accounting controls may not currently meet all standards applicable to companies with publicly traded securities. Effective internal controls are necessary for us to provide reliable financial reports, prevent fraud and operate successfully as a publicly traded partnership.
Subsequent to the audit of our consolidated financial statements for the year ended December 31, 2009, our independent registered public accounting firm identified a deficiency in
our internal control over financial reporting as a result of a restatement of our consolidated financial statements as of December 31, 2008 which constituted a material weakness. A material weakness is a deficiency, or a combination of deficiencies, in internal control over financial reporting, such that there is a reasonable possibility that a material misstatement of the annual or interim financial statements will not be prevented or detected on a timely basis. As a result of the identified material weakness, we restated our consolidated historical financial statements for the year ended December 31, 2008. Please read Note 18 to the Rhino Energy LLC historical audited consolidated financial statements included elsewhere in this prospectus. Although we have taken measures to improve our internal control over financial reporting, we cannot assure you that additional material weaknesses that may result in a material misstatement of our financial statements will not occur in the future.
We will incur increased costs as a result of being a publicly traded partnership.
We have no history operating as a publicly traded partnership. As a publicly traded partnership, we will incur significant legal, accounting and other expenses that we did not incur prior to this offering. In addition, the Sarbanes-Oxley Act of 2002, as well as rules implemented by the SEC and the NYSE, require publicly-traded entities to adopt various corporate governance practices that will further increase our costs. Before we are able to make distributions to our members, we must first pay or reserve cash for our expenses, including the costs of being a public company. As a result, the amount of cash we have available for distribution to our members will be affected by the costs associated with being a public company.
Prior to this offering, we have not filed reports with the SEC. Following this offering, we will become subject to the public reporting requirements of the Exchange Act. We expect these rules and regulations to increase certain of our legal and financial compliance costs and to make activities more time-consuming and costly. For example, as a result of becoming a publicly-traded company, we are required to have at least three independent directors, create an audit committee and adopt policies regarding internal controls and disclosure controls and procedures, including the preparation of reports on internal controls over financial reporting. In addition, we will incur additional costs associated with our SEC reporting requirements.
We also expect to incur significant expense in order to obtain director and officer liability insurance. Because of the limitations in coverage for directors, it may be more difficult for us to attract and retain qualified persons to serve on our board or as executive officers.
We estimate that we will incur approximately $3.0 million of incremental costs per year associated with being a publicly-traded company; however, it is possible that our actual incremental costs of being a publicly-traded company will be higher than we currently estimate.
Tax Risks
In addition to reading the following risk factors, please read "Material Tax Consequences" for a more complete discussion of the expected material federal income tax consequences of owning and disposing of common units.
Our tax treatment depends on our status as a partnership for federal income tax purposes. If the IRS were to treat us as a corporation for federal income tax purposes or we become subject to additional amounts of entity-level taxation, then our cash available for distribution to our unitholders would be substantially reduced.
The anticipated after-tax economic benefit of an investment in the common units depends largely on our being treated as a partnership for federal income tax purposes. We have not
requested, and do not plan to request, a ruling from the Internal Revenue Service, or IRS, on this or any other tax matter affecting us.
Despite the fact that we are a limited partnership under Delaware law, it is possible in certain circumstances for a partnership such as ours to be treated as a corporation for federal income tax purposes. Although we do not believe based upon our current operations that we are so treated, a change in our business or a change in current law could cause us to be treated as a corporation for federal income tax purposes or otherwise subject us to taxation as an entity.
If we were treated as a corporation for federal income tax purposes, we would pay federal income tax on our taxable income at the corporate tax rate, which is currently a maximum of 35%, and would likely pay state and local income tax at varying rates. Distributions to you would generally be taxed again as corporate distributions, and no income, gains, losses, deductions, or credits would flow through to you. Because a tax would be imposed upon us as a corporation, our cash available for distribution to you would be substantially reduced. Therefore, treatment of us as a corporation would result in a material reduction in the anticipated cash flow and after-tax return to the unitholders, likely causing a substantial reduction in the value of our common units.
The tax treatment of publicly traded partnerships or an investment in our common units could be subject to potential legislative, judicial or administrative changes and differing interpretations, possibly on a retroactive basis.
Current law may change so as to cause us to be treated as a corporation for federal income tax purposes or otherwise subjecting us to entity-level taxation. Specifically, the present federal income tax treatment of publicly traded partnerships, including us, or an investment in our common units may be modified by administrative, legislative or judicial interpretation at any time. For example, at the federal level, legislation has been proposed that would eliminate partnership tax treatment for certain publicly traded partnerships. Although such legislation would not apply to us as currently proposed, it could be amended prior to enactment in a manner that does apply to us. Any modification to the federal income tax laws and interpretations thereof may or may not be applied retroactively. We are unable to predict whether any of these changes, or other proposals, will ultimately be enacted. Any such changes could negatively impact the value of an investment in our common units.
If we were subjected to a material amount of additional entity-level taxation by individual states, it would reduce our cash available for distribution to our unitholders.
Changes in current state law may subject us to additional entity-level taxation by individual states. Because of widespread state budget deficits and other reasons, several states are evaluating ways to subject partnerships to entity-level taxation through the imposition of state income, franchise and other forms of taxation. Imposition of any such taxes may substantially reduce the cash available for distribution to you.
Our partnership agreement provides that if a law is enacted or existing law is modified or interpreted in a manner that subjects us to additional amounts of entity-level taxation, the minimum quarterly distribution amount and the target distribution amounts may be adjusted to reflect the impact of that law on us.
If the IRS contests the federal income tax positions we take, the market for our common units may be adversely impacted and the cost of any IRS contest will reduce our cash available for distribution to our unitholders.
We have not requested a ruling from the IRS with respect to our treatment as a partnership for federal income tax purposes or any other matter affecting us. The IRS may adopt positions that differ from the conclusions of our counsel expressed in this prospectus or from the positions we take, and the IRS's positions may ultimately be sustained. It may be necessary to resort to administrative or court proceedings to sustain some or all of our counsel's conclusions or the positions we take. A court may not agree with some or all of our counsel's conclusions or positions we take. Any contest with the IRS may materially and adversely impact the market for our common units and the price at which they trade. In addition, our costs of any contest with the IRS will be borne indirectly by our unitholders and our general partner because the costs will reduce our cash available for distribution.
Unitholders' share of our income will be taxable for U.S. federal income tax purposes even if they do not receive any cash distributions from us.
Because our unitholders will be treated as partners to whom we will allocate taxable income which could be different in amount than the cash we distribute, a unitholder's allocable share of our taxable income will be taxable to it, which may require the payment of federal income taxes and, in some cases, state and local income taxes on their share of our taxable income even if they receive no cash distributions from us. Unitholders may not receive cash distributions from us equal to their share of our taxable income or even equal to the actual tax liability that results from that income.
Tax gain or loss on the disposition of our common units could be more or less than expected.
If you sell your common units, you will recognize a gain or loss for federal income tax purposes equal to the difference between the amount realized and your tax basis in those common units. Because distributions in excess of your allocable share of our net taxable income decrease your tax basis in your common units, the amount, if any, of such prior excess distributions with respect to the units you sell will, in effect, become taxable income to you if you sell such units at a price greater than your tax basis in those units, even if the price you receive is less than your original cost. Furthermore, a substantial portion of the amount realized, whether or not representing gain, may be taxed as ordinary income due to potential recapture items, including depletion and depreciation recapture. In addition, because the amount realized includes a unitholder's share of our nonrecourse liabilities, if you sell your units, you may incur
a tax liability in excess of the amount of cash you receive from the sale. Please read "Material Tax Consequences—Disposition of Common Units—Recognition of Gain or Loss" for a further discussion of the foregoing.
Tax-exempt entities and non-U.S. persons face unique tax issues from owning our common units that may result in adverse tax consequences to them.
Investment in common units by tax-exempt entities, such as individual retirement accounts (known as IRAs), and non-U.S. persons raises issues unique to them. For example, virtually all of our income allocated to organizations that are exempt from federal income tax, including IRAs and other retirement plans, will be unrelated business taxable income and will be taxable to them. Distributions to non-U.S. persons will be reduced by withholding taxes at the highest applicable effective tax rate, and non-U.S. persons will be required to file U.S. federal tax returns and pay tax on their share of our taxable income. If you are a tax-exempt entity or a non-U.S. person, you should consult a tax advisor before investing in our common units.
We will treat each purchaser of common units as having the same tax benefits without regard to the actual common units purchased. The IRS may challenge this treatment, which could adversely affect the value of the common units.
Due to a number of factors, including our inability to match transferors and transferees of common units, we will adopt depreciation and amortization positions that may not conform to all aspects of existing Treasury Regulations. A successful IRS challenge to those positions could adversely affect the amount of tax benefits available to you. Our counsel is unable to opine as to the validity of such filing positions. It also could affect the timing of these tax benefits or the amount of gain from your sale of common units and could have a negative impact on the value of our common units or result in audit adjustments to your tax returns. Please read "Material Tax Consequences—Tax Consequences of Unit Ownership—Section 754 Election" for a further discussion of the effect of the depreciation and amortization positions we will adopt.
We prorate our items of income, gain, loss and deduction, for U.S. federal income tax purposes, between transferors and transferees of our units each month based upon the ownership of our units on the first day of each month, instead of on the basis of the date a particular unit is transferred. The IRS may challenge this treatment, which could change the allocation of items of income, gain, loss and deduction among our unitholders.
We generally prorate our items of income, gain, loss and deduction, for U.S. federal income tax purposes, between transferors and transferees of our units each month based upon the ownership of our units on the first day of each month, instead of on the basis of the date a particular unit is transferred. Nonetheless, we allocate certain deductions for depreciation of capital additions based upon the date the underlying property is placed in service. The use of this proration method may not be permitted under existing Treasury Regulations. Recently, however, the U.S. Treasury Department issued proposed Treasury Regulations that provide a safe harbor pursuant to which publicly traded partnerships may use a similar monthly simplifying convention to allocate tax items among transferor and transferee unitholders. Nonetheless, the proposed regulations do not specifically authorize the use of the proration method we have adopted. If the IRS were to challenge our proration method, we may be required to change our allocation of items of income, gain, loss and deduction among our unitholders. Please read "Material Tax Consequences—Disposition of Common Units—Allocations Between Transferors and Transferees."
A unitholder whose units are loaned to a "short seller" to cover a short sale of units may be considered as having disposed of those units. If so, he would no longer be treated for tax purposes as a partner with respect to those units during the period of the loan and may recognize gain or loss from the disposition.
Because a unitholder whose units are loaned to a "short seller" to cover a short sale of units may be considered as having disposed of the loaned units, he may no longer be treated for tax purposes as a partner with respect to those units during the period of the loan to the short seller and the unitholder may recognize gain or loss from such disposition. Moreover, during the period of the loan to the short seller, any of our income, gain, loss or deduction with respect to those units may not be reportable by the unitholder and any cash distributions received by the unitholder as to those units could be fully taxable as ordinary income. Our counsel has not rendered an opinion regarding the treatment of a unitholder where common units are loaned to a short seller to cover a short sale of common units; therefore, unitholders desiring to assure their status as partners and avoid the risk of gain recognition from a loan to a short seller are urged to consult a tax advisor to discuss whether it is advisable to modify any applicable brokerage account agreements to prohibit their brokers from loaning their units.
We will adopt certain valuation methodologies, for U.S. federal income tax purposes, that may result in a shift of income, gain, loss and deduction between our general partner and the unitholders. The IRS may challenge this treatment, which could adversely affect the value of the common units.
When we issue additional units or engage in certain other transactions, we will determine the fair market value of our assets and allocate any unrealized gain or loss attributable to our assets to the capital accounts of our unitholders and our general partner. Our methodology may be viewed as understating the value of our assets. In that case, there may be a shift of income, gain, loss and deduction between certain unitholders and our general partner, which may be unfavorable to such unitholders. Moreover, under our valuation methods, subsequent purchasers of common units may have a greater portion of their Internal Revenue Code Section 743(b) adjustment allocated to our tangible assets and a lesser portion allocated to our intangible assets. The IRS may challenge our valuation methods, or our allocation of the Section 743(b) adjustment attributable to our tangible and intangible assets, and allocations of taxable income, gain, loss and deduction between our general partner and certain of our unitholders.
A successful IRS challenge to these methods or allocations could adversely affect the amount of taxable income or loss being allocated to our unitholders. It also could affect the amount of taxable gain from our unitholders' sale of common units and could have a negative impact on the value of the common units or result in audit adjustments to our unitholders' tax returns without the benefit of additional deductions.
The sale or exchange of 50% or more of our capital and profits interests during any twelve-month period will result in the termination of our partnership for federal income tax purposes.
We will be considered to have technically terminated for federal income tax purposes if there is a sale or exchange of 50% or more of the total interests in our capital and profits within a twelve-month period. For purposes of determining whether a technical tax termination has occurred, a sale or exchange of 50% or more of the total interests in our capital and profits could occur if, for example, Rhino Energy Holdings LLC, which will own approximately 83.2%85.2% of the total interests in our capital and profits immediately after the consummation of this offering, sells or exchanges a majority of the interests it owns in us within a period of twelve
months. For purposes of determining whether the 50% threshold has been met, multiple sales of the same unit will be counted only once. While we would continue our existence as a Delaware limited partnership, our technical termination would, among other things, result in the closing of our taxable year for all unitholders, which would result in us filing two tax returns (and our unitholders could receive two Schedules K-1) for one fiscal year and could result in a deferral of depreciation deductions allowable in computing our taxable income. In the case of a unitholder reporting on a taxable year other than a fiscal year ending December 31, the closing of our taxable year may also result in more than twelve months of our taxable income or loss being includable in his taxable income for the year of termination. A technical termination would not affect our classification as a partnership for federal income tax purposes, but instead, we would be treated as a new partnership for tax purposes. If treated as a new partnership, we must make new tax elections and could be subject to penalties if we are unable to determine that a technical termination occurred. The IRS has recently announced a relief procedure whereby if a publicly traded partnership that has technically terminated requests and the IRS grants special relief, among other things, the partnership will be required to provide only a single Schedule K-1 to unitholders for the tax years in which the termination occurs.
Certain federal income tax preferences currently available with respect to coal exploration and development may be eliminated as a result of future legislation.
Among the changes contained in President Obama's Budget Proposal, or the Budget Proposal, for Fiscal Year 2011 is the elimination of certain key U.S. federal income tax preferences relating to coal exploration and development. The Budget Proposal would (1) eliminate current deductions and 60-month amortization for exploration and development costs relating to coal and other hard mineral fossil fuels, (2) repeal the percentage depletion allowance with respect to coal properties, (3) repeal capital gains treatment of coal and lignite royalties, and (4) exclude from the definition of domestic production gross receipts all gross receipts derived from the sale, exchange, or other disposition of coal, other hard mineral fossil fuels, or primary products thereof. The passage of any legislation as a result of the Budget Proposal or any other similar changes in U.S. federal income tax laws could eliminate certain tax deductions that are currently available with respect to coal exploration and development, and any such change could increase the taxable income allocable to our unitholders and negatively impact the value of an investment in our units.
Unitholders will likely be subject to state and local taxes and return filing requirements in states where they do not live as a result of investing in our common units.
In addition to federal income taxes, unitholders will likely be subject to other taxes, including state and local taxes, unincorporated business taxes and estate, inheritance or intangible taxes that are imposed by the various jurisdictions in which we do business or control property now or in the future, even if they do not live in any of those jurisdictions. Unitholders will likely be required to file state and local income tax returns and pay state and local income taxes in some or all of these various jurisdictions. Further, unitholders may be subject to penalties for failure to comply with those requirements. We initially expect to conduct business in a number of states, most of which also impose an income tax on corporations and other entities. In addition, many of these states also impose a personal income tax on individuals. As we make acquisitions or expand our business, we may control assets or conduct business in additional states that impose a personal income tax. It is your responsibility to file all U.S. federal, state and local tax returns. Our counsel has not rendered an opinion on the state or local tax consequences of an investment in our common units.
Based on an assumed initial offering price of $20.00 per common unit, we expect to receive net proceeds of approximately $67.0$57.5 million from the sale of 3,750,0003,244,000 common units offered by this prospectus, after deducting the estimated underwriting discount and offering expenses payable by us, and a related capital contribution by our general partner of approximately $10.1 million to maintain its 2.0% general partner interest in us.
We intend to use all of the net proceeds from this offering and the related capital contribution by our general partner to repay indebtedness outstanding under our credit agreement, which was incurred for working capital needs and the acquisitions of coal properties and mining equipment. We may reborrow any amounts repaid under our credit agreement. Upon application of the net proceeds from this offering as described herein,and the related capital contribution by our general partner, we will have $50.1$34.5 million of indebtedness outstanding under our credit agreement.
On June 30, 2010, we amended our credit agreement. References to our credit agreement refer to the credit agreement as amended. Our credit agreement bears interest at either (1) LIBOR plus 3.0% to 3.5% per annum, depending on our leverage ratio, or (2) a base rate that is the sum of (i) the higher of (a) the prime rate, (b) the federal funds rate plus 0.5% or (c) LIBOR plus 1.0% and (ii) 1.5% to 2.0% per annum, depending on our leverage ratio. We incur letter of credit fees equal to the then applicable spread above LIBOR on the undrawn face amount of standby letters of credit issued and a 15 basis point fronting fee payable to the administrative agent on the aggregate face amount of such letters of credit. In addition, we incur a commitment fee on the unused portion of the credit agreement at a rate of 0.5% per annum based on the unused portion of the facility. The credit agreement will mature in February 2013. Please read "Management's Discussion and Analysis of Financial Condition and Results of Operations—Liquidity and Capital Resources—Credit Agreement."
The net proceeds from any exercise of the underwriters' option to purchase additional common units (approximately $10.5$9.1 million based on an assumed initial offering price of $20.00 per common unit, if exercised in full) will be used to reimburse Wexford for capital expenditures incurred with respect to the assets contributed to us. If the underwriters do not exercise their option to purchase additional common units, we will issue 562,500486,600 common units to Rhino Energy Holdings LLC at the expiration of the option period. If and to the extent the underwriters exercise their option to purchase additional common units, the number of units purchased by the underwriters pursuant to such exercise will be issued to the public and the remainder, if any, will be issued to Rhino Energy Holdings LLC. Accordingly, the exercise of the underwriters' option will not affect the total number of units outstanding or the amount of cash needed to pay the minimum quarterly distribution on all units. Please read "Underwriting."
Affiliates of Raymond James & Associates, Inc. and RBC Capital Markets Corporation are lenders under our credit agreement and will receive their pro rata portion of the net proceeds from this offering and the related capital contribution by our general partner through the repayment of borrowings they have extended under the credit agreement.
A $1.00 increase or decrease in the assumed initial public offering price of $20.00 per common unit would cause the net proceeds from this offering, after deducting the estimated underwriting discount and offering expenses payable by us, and the related capital contribution by our general partner, to increase or decrease, respectively, by approximately $3.5 million. In addition, we may also increase or decrease the number of common units we are offering. Each increase of 1.0 million common units offered by us, together with a concomitant $1.00 increase in the assumed public offering price to $21.00 per common unit, would increase net proceeds to us from this offering and the related capital contribution by our general partner by approximately $23.1 million. Similarly, each decrease of 1.0 million common units offered by us, together with a concomitant $1.00 decrease in the assumed initial offering price to $19.00 per common unit, would decrease the net proceeds to us from this offering and the related capital contribution by our general partner by approximately $21.2 million.
The following table shows our capitalization as of March 31,June 30, 2010:
This table is derived from, and should be read together with, the unaudited pro forma condensed consolidated financial statements and the accompanying notes included elsewhere in this prospectus. You should also read this table in conjunction with "Summary—The Transactions," "Use of Proceeds" and "Management's Discussion and Analysis of Financial Condition and Results of Operations."
| | | As of March 31, 2010 | | As of June 30, 2010 | ||||||||||||||||
|---|---|---|---|---|---|---|---|---|---|---|---|---|---|---|---|---|---|---|---|---|
| | | Actual | Pro Forma | | Actual | Pro Forma | ||||||||||||||
| | | (in thousands) | | (in thousands) | ||||||||||||||||
Debt: | Debt: | Debt: | ||||||||||||||||||
Credit facility | $ | 117,020 | $ | 50,070 | Credit facility | $ | 102,140 | $ | 34,507 | |||||||||||
Other debt | 6,813 | 6,813 | Other debt | 6,314 | 6,314 | |||||||||||||||
Total debt | 123,833 | 56,883 | Total debt | 108,454 | 40,821 | |||||||||||||||
Members'/partners' equity: | Members'/partners' equity: | Members'/partners' equity: | ||||||||||||||||||
Rhino Energy LLC | 143,467 | — | Rhino Energy LLC | 150,609 | — | |||||||||||||||
Rhino Resource Partners LP: | Rhino Resource Partners LP: | |||||||||||||||||||
Held by public: | Held by public: | |||||||||||||||||||
Common units (1) | — | 31,188 | Common units (1) | — | 27,983 | |||||||||||||||
Held by Wexford: | Held by Wexford: | |||||||||||||||||||
Common units | — | 71,916 | Common units | — | 78,955 | |||||||||||||||
Subordinated units | — | 103,104 | Subordinated units | — | 106,939 | |||||||||||||||
General partner interest | — | 4,208 | General partner interest | — | 4,365 | |||||||||||||||
Accumulated other comprehensive income | 1,477 | 1,477 | Accumulated other comprehensive income | 1,477 | 1,477 | |||||||||||||||
Total members'/partners' equity | 144,944 | 211,894 | Total members'/partners' equity | 152,086 | 219,719 | |||||||||||||||
Total capitalization (1) | $ | 268,777 | $ | 268,777 | Total capitalization (1) | $ | 260,540 | $ | 260,540 | |||||||||||
Dilution is the amount by which the offering price will exceed the net tangible book value per common unit after the offering. Assuming an initial public offering price of $20.00 per common unit, on a pro forma basis as of March 31,June 30, 2010, after giving effect to the offering of common units and the related transactions, our net tangible book value was approximately $208.9$216.8 million, or $8.25$8.57 per common unit. The pro forma net tangible book value excludes $2.1$2.0 million of deferred financing costs and $1.0$0.9 million of intangible assets and goodwill. Purchasers of our common units in this offering will experience substantial and immediate dilution in net tangible book value per common unit for financial accounting purposes, as illustrated in the following table.
Assumed initial public offering price per common unit | $ | 20.00 | $ | 20.00 | ||||||||||
Net tangible book value per common unit before the offering (1) | $ | 6.58 | $ | 6.76 | ||||||||||
Increase in net tangible book value per common unit attributable to purchasers in the offering | 1.67 | 1.81 | ||||||||||||
Less: Pro forma net tangible book value per common unit after the offering (2) | 8.25 | 8.57 | ||||||||||||
Immediate dilution in net tangible book value per common unit to purchasers in the offering (3) | $ | 11.75 | $ | 11.43 | ||||||||||
The following table sets forth the number of units that we will issue and the total consideration contributed to us by our general partner and its affiliates and by the purchasers of our common units in this offering upon consummation of the transactions contemplated by this prospectus.prospectus:
| | Units | Total Consideration | Units | Total Consideration | ||||||||||||||||||||||
|---|---|---|---|---|---|---|---|---|---|---|---|---|---|---|---|---|---|---|---|---|---|---|---|---|---|---|
| | Number | Percent | Amount | Percent | Number | Percent | Amount | Percent | ||||||||||||||||||
General partner and its affiliates (1)(2) | 21,550,000 | 85.2 | % | $ | 143,467,246 | 65.7 | % | 22,056,000 | 87.2 | % | $ | 160,729,208 | 71.2 | % | ||||||||||||
New investors | 3,750,000 | 14.8 | % | 75,000,000 | 34.3 | % | 3,244,000 | 12.8 | % | 64,880,000 | 28.8 | % | ||||||||||||||
Total | 25,300,000 | 100 | % | $ | 218,467,246 | 100 | % | 25,300,000 | 100 | % | $ | 225,609,208 | 100 | % | ||||||||||||
CASH DISTRIBUTION POLICY AND RESTRICTIONS ON DISTRIBUTIONS
You should read the following discussion of our cash distribution policy in conjunction with specific assumptions included in this section. In addition, you should read "Forward-Looking Statements" and "Risk Factors" for information regarding statements that do not relate strictly to historical or current facts and certain risks inherent in our business.
For additional information regarding our historical and pro forma consolidated results of operations, you should refer to the audited historical consolidated financial statements as of December 31, 2008 and 2009 and for the years ended December 31, 2007, 2008 and 2009 and the unaudited historical condensed consolidated financial statements as of March 31,June 30, 2010 and for the threesix months ended March 31,June 30, 2009 and 2010 of Rhino Energy LLC and our unaudited pro forma condensed consolidated financial statements as of and for the year ended December 31, 2009 and as of and for the threesix months end March 31,June 30, 2010, included elsewhere in this prospectus.
General
Rationale for Our Cash Distribution Policy
Our partnership agreement requires us to distribute all of our available cash each quarter. Our cash distribution policy reflects a judgment that our unitholders will be better served by our distributing rather than retaining our available cash. Our partnership agreement generally defines available cash as, for each quarter, cash generated from our business in excess of the amount of cash reserves established by our general partner to provide for the conduct of our business, to comply with applicable law, any of our debt instruments or other agreements or to provide for future distributions to our unitholders for any one or more of the next four quarters. Our available cash may also include, if our general partner so determines, all or any portion of the cash on hand on the date of determination of available cash for the quarter resulting from working capital borrowings made subsequent to the end of such quarter. Since our revenue and cash available for distribution will likely fluctuate over time as a result of changes in coal prices as well as other factors, the board of directors of our general partner expects to reserve from time to time all or a portion of any cash generated in excess of the amount sufficient to pay the full minimum quarterly distribution on all units, as a whole, to allow us to maintain and to gradually increase our quarterly cash distributions. We may also borrow to fund distributions in quarters when we generate less available cash than necessary to sustain or grow our cash distributions per unit. Because we are not subject to an entity-level federal income tax, we have more cash to distribute to our unitholders than would be the case were we subject to federal income tax.
Limitations on Cash Distributions and Our Ability to Change Our Cash Distribution Policy
There is no guarantee that we will distribute quarterly cash distributions to our unitholders. Our distribution policy is subject to certain restrictions and may be changed at any time. The reasons for such uncertainties in our stated cash distribution policy include the following factors:
are otherwise in default under our credit agreement, we would be prohibited from making cash distributions notwithstanding our cash distribution policy.
policy. Our partnership agreement does not set a limit on the amount of cash reserves that our general partner may establish.
Distribution Levels." We do not anticipate that we will make any distributions from capital surplus.
Our Ability to Grow is Dependent on Our Ability to Access External Expansion Capital
Our partnership agreement requires us to distribute all of our available cash to our unitholders on a quarterly basis. As a result, we expect that we will rely primarily upon external financing sources, including commercial bank borrowings and the issuance of debt and equity securities, to fund any future expansion capital expenditures. To the extent we are unable to finance growth externally, our cash distribution policy will significantly impair our ability to grow. In addition, because we distribute all of our available cash, our growth may not be as fast as businesses that reinvest all of their available cash to expand ongoing operations. To the extent we issue additional units, the payment of distributions on those additional units may increase the risk that we will be unable to maintain or increase our per unit distribution level. There are no limitations in our partnership agreement or our credit agreement on our ability to issue additional units, including units ranking senior to the common units. The incurrence of additional commercial borrowings or other debt to finance our growth would result in increased interest expense, which in turn may impact the available cash that we have to distribute to our unitholders.
Minimum Quarterly Distribution
Upon the consummation of this offering, the board of directors of our general partner will establish a minimum quarterly distribution of $0.445 per unit for each complete quarter, or $1.78 per unit on an annualized basis, to be paid within 45 days after the end of each quarter. This equates to an aggregate cash distribution of $11.3 million per quarter, or $45.0 million per year, based on the number of common and subordinated units and 2.0% general partner interest to be outstanding immediately after completion of this offering. Our ability to make cash distributions equal to the minimum quarterly distribution pursuant to our cash distribution policy will be subject to the factors described above under "—General—Limitations on Cash Distributions and Our Ability to Change Our Cash Distribution Policy." The amount of available cash needed to pay the minimum quarterly distribution on all of the common units, subordinated units and 2.0% general partner interest to be outstanding immediately after this offering for one quarter and for four quarters is summarized in the table below:
| | | Distributions | |||||||||
|---|---|---|---|---|---|---|---|---|---|---|---|
| | Number of Units | ||||||||||
| | One Quarter | Annualized | |||||||||
Common units | 12,397,000 | $ | 5,516,665 | $ | 22,066,660 | ||||||
Subordinated units | 12,397,000 | 5,516,665 | 22,066,660 | ||||||||
General partner interest (1) | 506,000 | 225,170 | 900,680 | ||||||||
Total | 25,300,000 | $ | 11,258,500 | $ | 45,034,000 | ||||||
The preceding table assumes the underwriters have not exercised their option to purchase additional common units. If the underwriters do not exercise their option to purchase additional common units, we will issue 562,500486,600 common units to Rhino Energy Holdings LLC at the expiration of the option period. If and to the extent the underwriters exercise their option to purchase additional common units, the number of units purchased by the underwriters pursuant to such exercise will be sold to the public and the remainder, if any, will be issued to Rhino Energy Holdings LLC. Accordingly, the exercise of the underwriters' option will not affect the total number of units outstanding or the amount of cash needed to pay the minimum quarterly distribution on all units. Please read "Underwriting."
As of the date of this offering, our general partner will be entitled to 2.0% of all distributions that we make prior to our liquidation. Our general partner's initial 2.0% interest in these distributions may be reduced if we issue additional units in the future and our general partner does not contribute a proportionate amount of capital to us to maintain its initial 2.0% general partner interest.
During the subordination period, before we make any quarterly distributions to our subordinated unitholders, our common unitholders are entitled to receive payment of the minimum quarterly distribution plus any arrearages in distributions from prior quarters. Please read "Provisions of Our Partnership Agreement Relating to Cash Distributions—Subordination Period." We cannot guarantee, however, that we will pay the minimum quarterly distribution on the common units in any quarter.
We do not have a legal obligation to pay distributions at our minimum quarterly distribution rate or at any other rate except as provided in our partnership agreement. Our cash distribution policy is consistent with the terms of our partnership agreement, which requires that we distribute all of our available cash quarterly. Under our partnership agreement, available cash is generally defined to mean, for each quarter, cash generated from our business in excess of the amount of reserves established by our general partner to provide for the conduct of our business, to comply with applicable law, any of our debt instruments or other agreements or to provide for future distributions to our unitholders for any one or more of the next four quarters.
Although holders of our common units may pursue judicial action to enforce provisions of our partnership agreement, including those related to requirements to make cash distributions as described above, our partnership agreement provides that any determination made by our general partner in its capacity as our general partner must be made in good faith and that any such determination will not be subject to any other standard imposed by the Delaware Act or any other law, rule or regulation or at equity. Our partnership agreement provides that, in order for a determination by our general partner to be made in "good faith," our general partner must believe that the determination is in our best interest. Please read "Conflicts of Interest and Fiduciary Duties."
Our cash distribution policy, as expressed in our partnership agreement, may not be modified or repealed without amending our partnership agreement; however, the actual amount of our cash distributions for any quarter is subject to fluctuations based on the amount of cash we generate from our business and the amount of reserves our general partner establishes in accordance with our partnership agreement as described above.
We will pay our distributions on or about the 15th day of each of February, May, August and November to holders of record on or about the 1st day of each such month. If the distribution date does not fall on a business day, we will make the distribution on the business day immediately preceding the indicated distribution date. We will adjust the quarterly distribution
for the period from the closing of this offering through September 30, 2010 based on the actual length of the period.
Pro Forma and Forecasted Results of Operations and Cash Available for Distribution
In this section, we present in detail the basis for our belief that we will be able to pay the minimum quarterly distribution on all of our common units and subordinated units and make the corresponding distributions on our 2.0% general partner interest for the twelve months ending JuneSeptember 30, 2011. We present a table, consisting of pro forma and forecasted results of operations and cash available for distribution for the year ended December 31, 2009, the twelve
months ended March 31,June 30, 2010 and the twelve months ending JuneSeptember 30, 2011. In the table that follows, we show our pro forma results of operations and the amount of cash available for distribution we would have had for the year ended December 31, 2009 and the twelve months ended March 31,June 30, 2010 based on our unaudited pro forma condensed consolidated statements of operations included elsewhere in this prospectus and our forecasted results of operations and the forecasted amount of cash available for distribution for the twelve months ending JuneSeptember 30, 2011 and the significant assumptions upon which this forecast is based.
Our unaudited pro forma condensed consolidated financial statements are derived from the audited historical and the unaudited historical condensed consolidated financial statements of Rhino Energy LLC included elsewhere in this prospectus and our predecessor's accounting records, which are unaudited. Our unaudited pro forma condensed consolidated financial statements should be read together with "Selected Historical Consolidated and Pro Forma Condensed Consolidated Financial and Operating Data," "Management's Discussion and Analysis of Financial Condition and Results of Operations" and the audited historical consolidated financial statements of Rhino Energy LLC and the notes to those statements included elsewhere in this prospectus.
We must generate approximately $45.0 million (or approximately $11.3 million per quarter) of available cash to pay the minimum quarterly distribution for four quarters on all of our common units and subordinated units that will be outstanding immediately after this offering and the corresponding distribution on our general partner interest. We did not, however, generate $45.0 million of available cash from operating surplus during the year ended December 31, 2009 or the twelve months ended March 31,June 30, 2010. The amount of available cash from operating surplus we generated with respect to those periods was approximately $33.4 million and $39.3$43.6 million, respectively. Asrespectively, or approximately $11.6 million and $1.5 million, respectively, less than the amount needed to pay the full minimum quarterly distributions on all units as a result, forwhole, including subordinated units. For those periods, we would have generated available cash sufficient to pay 100% of the minimum quarterly distribution on our common units, but only approximately 48.3%48.4% and 74.8%93.5%, respectively, of the minimum quarterly distribution on our subordinated units during those periods. We have not usedcalculated available cash on a quarter-by-quarter estimatesbasis for each quarter in the year ended December 31, 2009 andor the twelve months ended March 31,June 30, 2010 to determine if we would have generated available cash sufficient to pay the minimum quarterly distribution for each quarter during those periods.
The following table also sets forth our calculation of forecasted cash available for distribution to our unitholders and general partner for the twelve months ending JuneSeptember 30, 2011. We forecast that our cash available for distribution generated during the twelve months ending JuneSeptember 30, 2011 will be approximately $74.8$77.9 million. This amount would be sufficient to pay the minimum quarterly distribution of $0.445 per unit on all of our common units and subordinated units and the corresponding distribution on our general partner's 2.0% general partner interest for each quarter in the four quarters ending JuneSeptember 30, 2011. Since
our revenue and cash available for distribution will likely fluctuate over time as a result of changes in coal prices as well as other factors, the board of directors of our general partner expects to reserve from time to time all or a portion of any cash generated in excess of the amount sufficient to pay the full minimum quarterly distribution on all units, as a whole, to allow us to maintain and to gradually increase our quarterly cash distributions.
We are providing the financial forecast to supplement our pro forma and historical consolidated financial statements in support of our belief that we will have sufficient cash available to allow us to pay cash distributions on all of our common units and subordinated units and the corresponding distributionsdistribution on our general partner's 2.0% general partner interest for each quarter in the twelve months ending JuneSeptember 30, 2011 at the minimum quarterly distribution rate. Please read "—Significant Forecast Assumptions" for further information as to the assumptions we have made for the financial forecast. Please read "Management's Discussion and Analysis of Financial Condition and Results of Operations—Critical Accounting Policies and Estimates" for information as to the accounting policies we have followed for the financial forecast.
Our forecast reflects our judgment as of the date of this prospectus of conditions we expect to exist and the course of action we expect to take during the twelve months ending JuneSeptember 30, 2011. We believe that our actual results of operations will approximate those reflected in our forecast, but we can give no assurance that our forecasted results will be achieved. If our estimates are not achieved, we may not be able to pay distributions on our common units and subordinated units at the minimum quarterly distribution rate of $0.445 per unit each quarter (or $1.78 per unit on an annualized basis) or any other rate. The assumptions and estimates underlying the forecast are inherently uncertain and, though we consider them reasonable as of the date of this prospectus, are subject to a wide variety of significant business, economic, and competitive risks and uncertainties that could cause actual results to differ materially from those contained in the forecast, including, among others, risks and uncertainties contained in "Risk Factors." Accordingly, there can be no assurance that the forecast is indicative of our future performance or that actual results will not differ materially from those presented in the forecast. Inclusion of the forecast in this prospectus should not be regarded as a representation by any person that the results contained in the forecast will be achieved.
We do not, as a matter of course, make public forecasts as to future sales, earnings or other results. However, we have prepared the following forecast to present the forecasted cash available for distribution to our unitholders and general partner during the forecasted period. The accompanying forecast was not prepared with a view toward complying with the guidelines established by the American Institute of Certified Public Accountants with respect to prospective financial information, but, in our view, was prepared on a reasonable basis, reflects the best currently available estimates and judgments, and presents, to the best of management's knowledge and belief, the expected course of action and our expected future financial performance. However, this information is not necessarily indicative of future results.
Neither our independent auditors, nor any other independent accountants, have compiled, examined or performed any procedures with respect to the forecast contained herein, nor have they expressed any opinion or any other form of assurance on such information or its achievability, and assume no responsibility for, and disclaim any association with, the forecast. We do not undertake to release publicly after this offering any revisions or updates to the financial forecast or the assumptions on which our forecasted results of operations are based.
Rhino Resource Partners LP
Cash Available for Distribution
| | | Pro Forma (1) | Forecasted (1)(2) | | Pro Forma (1) | Forecasted (1)(2) | ||||||||||||||||||
|---|---|---|---|---|---|---|---|---|---|---|---|---|---|---|---|---|---|---|---|---|---|---|---|---|
| | | Year Ended December 31, 2009 | Twelve Months Ended March 31, 2010 | Twelve Months Ending June 30, 2011 | | Year Ended December 31, 2009 | Twelve Months Ended June 30, 2010 | Twelve Months Ending September 30, 2011 | ||||||||||||||||
| | | (in thousands, except average coal price) | | (in thousands, except average coal price) | ||||||||||||||||||||
Operating Data: | Operating Data: | Operating Data: | ||||||||||||||||||||||
Coal produced in tons | Coal produced in tons | 4,705 | 4,218 | 4,400 | Coal produced in tons | 4,705 | 4,120 | 4,833 | ||||||||||||||||
(Increase) decrease to coal inventory in tons | (Increase) decrease to coal inventory in tons | (34 | ) | (77 | ) | 241 | (Increase) decrease to coal inventory in tons | (34 | ) | (122 | ) | 108 | ||||||||||||
Coal purchased in tons | Coal purchased in tons | 2,027 | 1,567 | 115 | Coal purchased in tons | 2,027 | 1,046 | 166 | ||||||||||||||||
Coal sales in tons | Coal sales in tons | 6,699 | 5,708 | 4,757 | Coal sales in tons | 6,699 | 5,045 | 5,106 | ||||||||||||||||
Steam coal sales in tons—committed (3) | Steam coal sales in tons—committed (3) | 6,277 | 5,270 | 3,239 | Steam coal sales in tons—committed (3) | 6,277 | 4,510 | 3,158 | ||||||||||||||||
Wgt. avg. steam coal sales price per ton—committed (3) | Wgt. avg. steam coal sales price per ton—committed (3) | $ | 54.39 | $ | 54.58 | $ | 56.86 | Wgt. avg. steam coal sales price per ton—committed (3) | $ | 54.39 | $ | 54.92 | $ | 60.40 | ||||||||||
Metallurgical coal sales in tons—committed (3) | Metallurgical coal sales in tons—committed (3) | 354 | 363 | 391 | Metallurgical coal sales in tons—committed (3) | 354 | 413 | 313 | ||||||||||||||||
Wgt. avg. metallurgical coal sales price per ton—committed (3) | Wgt. avg. metallurgical coal sales price per ton—committed (3) | $ | 162.57 | $ | 165.12 | $ | 127.09 | Wgt. avg. metallurgical coal sales price per ton—committed (3) | $ | 162.57 | $ | 151.86 | $ | 115.51 | ||||||||||
Steam coal sales in tons—uncommitted | Steam coal sales in tons—uncommitted | 68 | 65 | 808 | Steam coal sales in tons—uncommitted | 68 | 64 | 1,235 | ||||||||||||||||
Wgt. avg. steam coal sales price per ton—uncommitted | Wgt. avg. steam coal sales price per ton—uncommitted | $ | 46.62 | $ | 45.74 | $ | 52.68 | Wgt. avg. steam coal sales price per ton—uncommitted | $ | 46.62 | $ | 45.76 | $ | 52.37 | ||||||||||
Metallurgical coal sales in tons—uncommitted | Metallurgical coal sales in tons—uncommitted | n/a | 10 | 319 | Metallurgical coal sales in tons—uncommitted | n/a | 59 | 401 | ||||||||||||||||
Wgt. avg. metallurgical coal sales price per ton—uncommitted | Wgt. avg. metallurgical coal sales price per ton—uncommitted | n/a | $ | 85.00 | $ | 110.00 | Wgt. avg. metallurgical coal sales price per ton—uncommitted | n/a | $ | 121.97 | $ | 105.00 | ||||||||||||
Financial Data: | Financial Data: | Financial Data: | ||||||||||||||||||||||
Coal sales revenue—committed (3) | $ | 398,595 | $ | 347,212 | $ | 233,873 | ||||||||||||||||||
Coal sales revenue—uncommitted | 3,157 | 3,852 | 77,604 | |||||||||||||||||||||
Other coal sales revenue (4) | 5,050 | 4,997 | 1,305 | |||||||||||||||||||||
Coal revenue—committed (3) | Coal revenue—committed (3) | $ | 398,595 | $ | 310,005 | $ | 226,921 | |||||||||||||||||
Coal revenue—uncommitted | Coal revenue—uncommitted | 3,157 | 10,076 | 106,712 | ||||||||||||||||||||
Other coal revenue (4) | Other coal revenue (4) | 5,050 | 4,636 | 1,085 | ||||||||||||||||||||
Other revenues (5) | Other revenues (5) | 12,988 | 13,626 | 15,195 | Other revenues (5) | 12,988 | 14,009 | 13,219 | ||||||||||||||||
Total revenues | $ | 419,790 | $ | 369,686 | $ | 327,977 | Total revenues | $ | 419,790 | $ | 338,725 | $ | 347,937 | |||||||||||
Costs and expenses: | Costs and expenses: | Costs and expenses: | ||||||||||||||||||||||
Cost of operations (exclusive of depreciation, depletion and amortization shown separately below) | $ | 336,335 | $ | 284,370 | $ | 220,095 | Cost of operations (exclusive of depreciation, depletion and amortization shown separately below) | $ | 336,335 | $ | 257,009 | $ | 234,994 | |||||||||||
Freight and handling | 3,990 | 3,725 | 3,907 | Freight and handling | 3,990 | 3,458 | 4,497 | |||||||||||||||||
Depreciation, depletion and amortization (6) | 36,279 | 34,070 | 36,345 | Depreciation, depletion and amortization (6) | 36,279 | 32,210 | 36,620 | |||||||||||||||||
Selling, general and administrative (exclusive of depreciation, depletion and amortization shown separately above) | 16,754 | 16,056 | 15,482 | Selling, general and administrative (exclusive of depreciation, depletion and amortization shown separately above) | 16,754 | 15,369 | 15,614 | |||||||||||||||||
Incremental selling, general and administrative | — | — | 3,000 | Incremental selling, general and administrative | — | — | 3,000 | |||||||||||||||||
Loss on sale of assets | 1,710 | 1,709 | — | Loss on sale of assets | 1,710 | 375 | — | |||||||||||||||||
Total costs and expenses | $ | 395,069 | $ | 339,930 | $ | 278,829 | Total costs and expenses | $ | 395,069 | $ | 308,422 | $ | 294,725 | |||||||||||
Income from operations | Income from operations | $ | 24,721 | $ | 29,756 | $ | 49,148 | Income from operations | $ | 24,721 | $ | 30,304 | $ | 53,212 | ||||||||||
Interest and other income (expense): | Interest and other income (expense): | Interest and other income (expense): | ||||||||||||||||||||||
Interest expense | (4,291 | ) | (4,113 | ) | (3,803 | ) | Interest expense | (4,271 | ) | (3,255 | ) | (3,664 | ) | |||||||||||
Interest income | 154 | 75 | — | Interest income | 154 | 103 | — | |||||||||||||||||
Other income (expense) | (83 | ) | (83 | ) | — | Other income (expense) | (83 | ) | (83 | ) | — | |||||||||||||
Equity in net income of unconsolidated affiliate | 893 | 806 | 8,705 | Equity in net income of unconsolidated affiliate | 893 | 1,574 | 8,915 | |||||||||||||||||
Net income | Net income | $ | 21,394 | $ | 26,441 | $ | 54,049 | Net income | $ | 21,413 | $ | 28,643 | $ | 58,463 | ||||||||||
| | | Pro Forma (1) | Forecasted (1)(2) | | Pro Forma (1) | Forecasted (1)(2) | ||||||||||||||||||
|---|---|---|---|---|---|---|---|---|---|---|---|---|---|---|---|---|---|---|---|---|---|---|---|---|
| | | Year Ended December 31, 2009 | Twelve Months Ended March 31, 2010 | Twelve Months Ending June 30, 2011 | | Year Ended December 31, 2009 | Twelve Months Ended June 30, 2010 | Twelve Months Ending September 30, 2011 | ||||||||||||||||
| | | (in thousands, except distributions per unit) | | (in thousands, except distributions per unit) | ||||||||||||||||||||
Net income | Net income | $ | 21,394 | $ | 26,441 | $ | 54,049 | Net income | $ | 21,413 | $ | 28,643 | $ | 58,463 | ||||||||||
Plus: | Plus: | Plus: | ||||||||||||||||||||||
Depreciation, depletion and amortization | 36,279 | 34,070 | 36,345 | Depreciation, depletion and amortization | 36,279 | 32,210 | 36,620 | |||||||||||||||||
Interest expense | 4,291 | 4,113 | 3,803 | Interest expense | 4,271 | 3,255 | 3,664 | |||||||||||||||||
EBITDA (6) | EBITDA (6) | $ | 61,964 | $ | 64,623 | $ | 94,197 | EBITDA (6) | $ | 61,964 | $ | 64,108 | $ | 98,747 | ||||||||||
Less: | Less: | Less: | ||||||||||||||||||||||
Cash interest expense | (4,291 | ) | (4,113 | ) | (2,681 | ) | Cash interest expense | (4,271 | ) | (3,255 | ) | (2,254 | ) | |||||||||||
Equity in net income of unconsolidated affiliate (7) | (893 | ) | (806 | ) | — | Equity in net income of unconsolidated affiliate (7) | (893 | ) | (1,574 | ) | — | |||||||||||||
Maintenance capital expenditures (8) | (23,393 | ) | (20,356 | ) | (16,686 | ) | Maintenance capital expenditures (8) | (23,393 | ) | (15,699 | ) | (18,614 | ) | |||||||||||
Expansion capital expenditures (8) | (6,264 | ) | (4,973 | ) | (46,092 | ) | Expansion capital expenditures (8) | (6,264 | ) | (6,573 | ) | (29,611 | ) | |||||||||||
Plus: | Plus: | Plus: | ||||||||||||||||||||||
Borrowings or cash on hand for expansion capital expenditures (8) | 6,264 | 4,973 | 46,092 | Borrowings or cash on hand for expansion capital expenditures (8) | 6,264 | 6,573 | 29,611 | |||||||||||||||||
Cash available for distribution | Cash available for distribution | $ | 33,387 | $ | 39,349 | $ | 74,831 | Cash available for distribution | $ | 33,406 | $ | 43,579 | $ | 77,879 | ||||||||||
Implied cash distributions based on the minimum quarterly distribution per unit: | Implied cash distributions based on the minimum quarterly distribution per unit: | Implied cash distributions based on the minimum quarterly distribution per unit: | ||||||||||||||||||||||
Annualized minimum quarterly distribution per unit | $ | 1.78 | $ | 1.78 | $ | 1.78 | Annualized minimum quarterly distribution per unit | $ | 1.78 | $ | 1.78 | $ | 1.78 | |||||||||||
Distribution to common unitholders | $ | 22,067 | $ | 22,067 | $ | 22,067 | Distribution to common unitholders | $ | 22,067 | $ | 22,067 | $ | 22,067 | |||||||||||
Distribution to subordinated unitholder | 22,067 | 22,067 | 22,067 | Distribution to subordinated unitholder | 22,067 | 22,067 | 22,067 | |||||||||||||||||
Distribution to general partner | 901 | 901 | 901 | Distribution to general partner | 901 | 901 | 901 | |||||||||||||||||
Total distributions (9) | $ | 45,034 | $ | 45,034 | $ | 45,034 | Total distributions (9) | $ | 45,034 | $ | 45,034 | $ | 45,034 | |||||||||||
Excess (shortfall) | Excess (shortfall) | $ | (11,647 | ) | $ | (5,685 | ) | $ | 29,797 | Excess (shortfall) | $ | (11,628 | ) | $ | (1,455 | ) | $ | 32,845 | ||||||
venture for the forecast period, and we estimate that forecasted cash available for distribution resulting from the joint venture will approximate our forecasted equity interest in net income of the joint venture.
Significant Forecast Assumptions
The forecast has been prepared by and is the responsibility of our management. Our forecast reflects our judgment as of the date of this prospectus of conditions we expect to exist and the course of action we expect to take during the twelve months ending JuneSeptember 30, 2011. While the assumptions disclosed in this prospectus are not all-inclusive, the assumptions listed are those that we believe are significant to our forecasted results of operations. We believe we have a reasonable objective basis for these assumptions. We believe our actual results of operations will approximate those reflected in our forecast, but we can give no assurance that our forecasted results will be achieved. There will likely be differences between our forecast and the actual results, and those differences could be material. If the forecast is not achieved, we may not be able to pay cash distributions on our common units at the minimum distribution rate or at all.
Production and Revenues. We forecast that our total revenues for the twelve months ending JuneSeptember 30, 2011 will be approximately $328.0$347.9 million, as compared to approximately $419.8 million and $369.7$338.7 million, in each case on a pro forma basis, for the year ended December 31, 2009 and the twelve months ended March 31,June 30, 2010, respectively. Our forecast is based primarily on the following assumptions:
as compared to approximately 4.7 million tons and 4.24.1 million tons we produced for the year ended December 31, 2009 and the twelve months ended March 31,June 30, 2010, respectively, in each case on a pro forma basis. This volume decrease is primarily due to a decrease in production from our Central Appalachia operations. Production from alleach of our coal operations for the forecasted period is expected to decrease from or remain substantially consistent fromwith the year ended December 31, 2009 andbut increase from or remain substantially consistent with the twelve months ended March 31,June 30, 2010, to the forecasted period.in each case on a pro forma basis. Our Central Appalachia operations are expected to decrease production toproduce approximately 1.92.1 million tons in the forecasted period, a decrease from approximately 2.3 million
tons in the year ended December 31, 2009 and an increase from approximately 1.9 million tons in the twelve months ended March 31,June 30, 2010, in each case on a pro forma basis, as abasis. These changes are the result of idling several of our less profitable surface mines.mines in 2009, offset by increasing production of metallurgical coal from our Mine 28 in the forecasted period. Our Northern Appalachia operations are forecasted to remain substantially constant,consistent, with production of approximately 2.12.2 million tons in the forecasted period versus approximately 2.2 million tons in the year ended December 31, 2009 and approximately 2.12.0 million tons in the twelve months ended March 31,June 30, 2010, in each case on a pro forma basis. The operation in our Other segment currently producing coal, McClane Canyon mine, is expected to increasedecrease production slightly, from approximately 0.3 million tons in the year ended December 31, 2009 and approximately 0.2 million tons in the twelve months ended March 31,June 30, 2010, in each case on a pro forma basis, to approximately 0.4less than 0.1 million tons for the twelve months ending JuneSeptember 30, 2011, as we plan to temporarily idle this operation as we build and permit a rail loadout. However, we forecast that the operations in our Other segment are expected to increase production to approximately 0.5 million tons for the twelve months ending September 30, 2011, due to the expected acquisition of mining assets in Utah.Utah in August 2010, which we expect will begin production in late 2010. Our coal production could vary significantly from the foregoing assumption based on numerous factors, many of which are beyond our control.
Actual results per ton could vary significantly from the foregoing assumptions if we are unable to deliver coal pursuant to our contracts, if a number of our customers are unable to
satisfy their contractual obligations or if we are incorrect in our pricing or volume assumptions for uncommitted sales.
As of July 22, 2010, one of our coal supply contracts relating to sales commitments for our estimated coal production through 2014 contained provisions that allow for the purchase price to be renegotiated at periodic intervals. We are currently renegotiating the purchase price pursuant to this price re-opener provision. If we fail to agree on a new price on or prior to October 1, 2010, this coal supply contract will terminate. If this contract terminates, our estimates of coal sales tons and total coal sales revenue for the twelve months ending June 30, 2011 will remain the same in all material respects. Please read "Risk Factors—Risks Inherent in Our Business—The assumptions underlying our forecast of cash available for distribution included in "Cash Distribution Policy and Restrictions on Distributions" are inherently uncertain and subject to significant business, economic, financial, regulatory and competitive risks and uncertainties that could cause cash available for distribution to differ materially from those estimated." and "—Certain provisions in our long-term supply contracts may provide limited protection during adverse economic conditions, may result in economic penalties to us or permit the customer to terminate the contract."
Cost of Operations. We forecast our cost of operations, excluding the cost of purchased coal and results from the joint venture, will be approximately $214.0$226.0 million for the twelve months ending JuneSeptember 30, 2011, as compared to approximately $227.2 million for the year ended December 31, 2009 and approximately $201.7$202.7 million for the twelve months ended March 31,June 30, 2010, in each case on a pro forma basis. Cost of operations primarily includes the cost of labor and benefits, operating supplies, equipment maintenance, rental and lease cost of equipment, royalties, taxes and transportation costs. The decrease in cost of operations for the forecasted period as compared to the year ended December 31, 2009, on a pro forma basis, is attributable primarily to decreasedthe projected decrease in the cost of operating supplies and the rental and lease expense related to our mining equipment, partially offset by an increase in royalties related to the increase in coal revenues per ton sold. The increase in cost of operations for the forecasted period as compared to the twelve months ended June 30, 2010, on a pro forma basis, is attributable primarily to increased coal production for the forecasted period as compared to production in the twelve months ended June 30, 2010, on a pro forma basis.
We forecast our cost of purchased coal will be approximately $9.0 million for the forecasted period as compared to approximately $109.1 million for the year ended December 31, 2009 and approximately $54.3 million for the twelve months ended March 31,June 30, 2010, in each case on a pro forma basis. This decrease is attributable primarily to approximately 0.2 million tons of purchased coal in the forecast period as compared to approximately 2.0 million tons in the year ended December 31, 2009 and approximately 1.0 million tons in the twelve months ended June 30, 2010, in each case on a pro forma basis.
We forecast that our cost of operations, including the cost of purchased coal, per ton for the twelve months ending JuneSeptember 30, 2011 will be $46.27,$46.02, as compared to $50.21 for the year ended December 31, 2009 and $47.27$50.95 for the twelve months ended March 31,June 30, 2010, in each case on a pro forma basis. This decrease is attributable primarily to cost cutting measures put into effect in 2009 and continued in the first quarterhalf of 2010, and an increase in coal sold out of inventory, a decrease in the volume and cost of purchased coal and a decrease in rental and lease expense related to our mining equipment in the forecasted period as compared to the year ended December 31, 2009 and the twelve months ended March 31,June 30, 2010, in each case on a pro forma basis. Our forecasted cost of operations could vary significantly because of the large number of variables taken into consideration, many of which are beyond our control.
We forecast our cost of purchased coal will be approximately $6.1 million for the forecasted period as compared to approximately $109.1 million for the year ended December 31, 2009 and approximately $82.7 million for the twelve months ended March 31, 2010, in each case on a pro forma basis. This decrease is attributable primarily to approximately 0.1 million tons of purchased coal in the forecast period as compared to approximately 2.0 million tons in the year ended December 31, 2009 and approximately 1.6 million tons in the twelve months ended March 31, 2010, in each case on a pro forma basis.
Depreciation, Depletion and Amortization. We forecast depreciation, depletion and amortization expense to be approximately $36.3$36.6 million for the twelve months ending JuneSeptember 30, 2011, as compared to approximately $36.3 million for the year ended December 31, 2009 and approximately $34.1$32.2 million for the twelve months ended March 31,June 30, 2010, in each case on a pro forma basis. The increase in depreciation, depletion and amortization expense of approximately $2.2$0.3 million in the forecast period as compared to the year ended December 31, 2009, on a pro forma basis, is due to a decrease in depreciation expense of approximately $1.0 million, offset by an increase in depletion expense of approximately $0.4 million and an increase in amortization expense of approximately $0.9 million. The increase in depreciation, depletion and amortization expense of approximately $4.4 million in the forecast period as compared to the twelve months ended March 31,June 30, 2010, on a pro forma basis, is due to an increase in depreciation expense of approximately $0.3$1.1 million, an increase in depletion expense of
approximately $0.5$0.8 million and an increase in amortization expense of approximately $1.4$2.5 million.
Selling, General and Administrative. We forecast selling, general and administrative expenses to be approximately $18.5$18.6 million for the twelve months ending JuneSeptember 30, 2011, as compared to approximately $16.8 million for the year ended December 31, 2009, and approximately $16.1$15.4 million for the twelve months ended March 31,June 30, 2010, in each case on a pro forma basis. The forecasted selling, general and administrative expenses include wage increases, bonuses payable to certain executive officers upon the consummation of our initial public offering, inflationary increases in employee benefits and incremental expenses associated with being a publicly traded partnership of approximately $3.0 million.
Acquisition of Mining Assets in Utah. In August 2010, we completed the acquisition of certain mining assets in Emery and Carbon Counties, Utah, from which we expect to begin production in late 2010. During the twelve months ending September 30, 2011, we expect to produce and sell 0.5 million tons of steam coal from these assets, for which we do not currently have executed supply contracts. We forecast we will generate approximately $1.0 million of income from operations and $3.4 million of EBITDA from these assets during the forecasted period on $20.1 million of revenue.
Financing. We forecast interest expense of approximately $3.8$3.7 million for the twelve months ending JuneSeptember 30, 2011, as compared to approximately $4.3 million for the year ended December 31, 2009 and approximately $4.1$3.3 million for the twelve months ended March 31,June 30, 2010, in each case on a pro forma basis. Our total debt balance as of December 31, 2009, and March 31,June 30, 2010, in each case on a pro forma basis, was approximately $55.2$54.5 million and approximately $56.9
$40.8 million, respectively. Our interest expense for the twelve months ending JuneSeptember 30, 2011 is based on the following assumptions:following:
Equity in net income of unconsolidated affiliate. We forecast that our share of net income of our unconsolidated affiliate, a joint venture that owns the Rhino Eastern mining complex, will be approximately $8.7$8.9 million for the twelve months ending JuneSeptember 30, 2011, as compared to approximately $0.9 million and $0.8$1.6 million, in each case on a pro forma basis, for the year ended December 31, 2009 and the twelve months ended March 31,June 30, 2010, respectively. Our forecast is based on the following assumptions:
Capital Expenditures. We forecast capital expenditures for the twelve months ending JuneSeptember 30, 2011 based on the following assumptions:
ended December 31, 2009 were one time expenses. These include $4.1 million to finish ventilation development work at our Mine 28 in Central Appalachia, $1.4 million to buy out leases on certain of our mining equipment in Central Appalachia, $0.7 million to complete construction of our Ohio River dock in Northern Appalachia, and $0.5 million to comply with the MINER Act of 2006. We expect to fund maintenance capital expenditures from cash generated by our operations.
Regulatory, Industry and Economic Factors. We forecast our results of operations for the twelve months ending JuneSeptember 30, 2011 based on the following assumptions related to regulatory, industry and economic factors:
Quarterly Forecast Information
The following table presents our forecasted results of operations and cash available for distribution on a quarter-by-quarter basis for the forecast period. The following forecast reflects our judgment as of the date of this prospectus of conditions we expect to exist and the course of action we expect to take for the twelve months ending JuneSeptember 30, 2011. Please see "—Significant Forecast Assumptions." The assumptions and estimates underlying the forecast for the twelve months ending JuneSeptember 30, 2011 are inherently uncertain, and estimating the precise quarter in which each revenue and expense will be recognized increases the level of uncertainty of the quarterly forecast information. Accordingly, there can be no assurance that actual quarter-by-quarter results will not differ materially from the quarter-by-quarter forecast information presented below. However, to the extent that a shortfall were to occur during a quarter in the forecast period, we believe we would be able to make working capital borrowings to pay distributions in such quarter, and would likely be able to repay such borrowings in a subsequent quarter, because we believe the total cash available for distribution for the forecast period will be more than sufficient to pay the aggregate minimum quarterly distribution to all unitholders and the corresponding distribution to our general partner for the forecast period.
Rhino Resource Partners LP
Quarterly Forecast Information
| | Forecasted | |||||||||||||||||||||||||||||||||||
|---|---|---|---|---|---|---|---|---|---|---|---|---|---|---|---|---|---|---|---|---|---|---|---|---|---|---|---|---|---|---|---|---|---|---|---|---|
| | | Forecasted | | Three Months Ending | | |||||||||||||||||||||||||||||||
| | | Three Months Ending | | | Twelve Months Ending September 30, 2011 | |||||||||||||||||||||||||||||||
| | | September 30, 2010 | December 31, 2010 | March 31, 2011 | June 30, 2011, | Twelve Months Ending June 30, 2011 | | December 31, 2010 | March 31, 2011 | June 30, 2011, | September 30, 2011 | |||||||||||||||||||||||||
| | | (in thousands, except average coal price) | | (in thousands, except average coal price) | ||||||||||||||||||||||||||||||||
Operating Data: | Operating Data: | Operating Data: | ||||||||||||||||||||||||||||||||||
Coal produced in tons | Coal produced in tons | 937 | 1,006 | 1,220 | 1,237 | 4,400 | Coal produced in tons | 1,064 | 1,228 | 1,269 | 1,272 | 4,833 | ||||||||||||||||||||||||
(Increase) decrease to coal inventory in tons | (Increase) decrease to coal inventory in tons | 109 | 128 | 5 | (1 | ) | 241 | (Increase) decrease to coal inventory in tons | 64 | 24 | 1 | 20 | 108 | |||||||||||||||||||||||
Coal purchased in tons | Coal purchased in tons | 55 | 60 | — | — | 115 | Coal purchased in tons | 46 | 45 | 45 | 30 | 166 | ||||||||||||||||||||||||
Coal sales in tons | Coal sales in tons | 1,101 | 1,194 | 1,225 | 1,236 | 4,757 | Coal sales in tons | 1,173 | 1,297 | 1,314 | 1,322 | 5,106 | ||||||||||||||||||||||||
Steam coal sales in tons—committed | Steam coal sales in tons—committed | 970 | 968 | 650 | 650 | 3,239 | Steam coal sales in tons—committed | 986 | 749 | 749 | 674 | 3,158 | ||||||||||||||||||||||||
Wgt. avg. steam coal sales price per ton—committed | Wgt. avg. steam coal sales price per ton—committed | $ | 54.70 | $ | 54.65 | $ | 60.08 | $ | 60.15 | $ | 56.86 | Wgt. avg. steam coal sales price per ton—committed | $ | 56.28 | $ | 61.74 | $ | 61.81 | $ | 63.39 | $ | 60.40 | ||||||||||||||
Metallurgical coal sales in tons—committed | Metallurgical coal sales in tons—committed | 131 | 148 | 53 | 60 | 391 | Metallurgical coal sales in tons—committed | 148 | 53 | 60 | 53 | 313 | ||||||||||||||||||||||||
Wgt. avg. metallurgical coal sales price per ton—committed | Wgt. avg. metallurgical coal sales price per ton—committed | $ | 137.69 | $ | 138.64 | $ | 96.71 | $ | 102.13 | $ | 127.09 | Wgt. avg. metallurgical coal sales price per ton—committed | $ | 138.53 | $ | 93.71 | $ | 96.88 | $ | 93.71 | $ | 115.51 | ||||||||||||||
Steam coal sales in tons—uncommitted | Steam coal sales in tons—uncommitted | — | 51 | 377 | 380 | 808 | Steam coal sales in tons—uncommitted | 32 | 361 | 379 | 463 | 1,235 | ||||||||||||||||||||||||
Wgt. avg. steam coal sales price per ton—uncommitted | Wgt. avg. steam coal sales price per ton—uncommitted | n/a | $ | 44.50 | $ | 53.78 | $ | 52.70 | $ | 52.68 | Wgt. avg. steam coal sales price per ton—uncommitted | $ | 42.50 | $ | 53.43 | $ | 52.11 | $ | 52.42 | $ | 52.37 | |||||||||||||||
Metallurgical coal sales in tons—uncommitted | Metallurgical coal sales in tons—uncommitted | — | 27 | 146 | 146 | 319 | Metallurgical coal sales in tons—uncommitted | 8 | 134 | 126 | 134 | 401 | ||||||||||||||||||||||||
Wgt. avg. metallurgical coal sales price per ton—uncommitted | Wgt. avg. metallurgical coal sales price per ton—uncommitted | n/a | $ | 110.00 | $ | 110.00 | $ | 110.00 | $ | 110.00 | Wgt. avg. metallurgical coal sales price per ton—uncommitted | $ | 105.00 | $ | 105.00 | $ | 105.00 | $ | 105.00 | $ | 105.00 | |||||||||||||||
Financial Data: | Financial Data: | Financial Data: | ||||||||||||||||||||||||||||||||||
Coal sales revenue—committed | Coal sales revenue—committed | $ | 71,049 | $ | 73,412 | $ | 44,157 | $ | 45,256 | $ | 233,873 | Coal sales revenue—committed | $ | 75,988 | $ | 51,188 | $ | 52,130 | $ | 47,615 | $ | 226,921 | ||||||||||||||
Coal sales revenue—uncommitted | Coal sales revenue—uncommitted | — | 5,263 | 36,276 | 36,065 | 77,604 | Coal sales revenue—uncommitted | 2,137 | 33,330 | 32,978 | 38,267 | 106,712 | ||||||||||||||||||||||||
Other coal sales revenue | Other coal sales revenue | 303 | 322 | 330 | 350 | 1,305 | Other coal sales revenue | 266 | 325 | 329 | 164 | 1,085 | ||||||||||||||||||||||||
Other revenues | Other revenues | 4,415 | 4,432 | 3,373 | 2,974 | 15,195 | Other revenues | 4,301 | 3,238 | 2,839 | 2,841 | 13,219 | ||||||||||||||||||||||||
Total revenues (1) | $ | 75,767 | $ | 83,430 | $ | 84,135 | $ | 84,645 | $ | 327,977 | Total revenues (1) | $ | 82,692 | $ | 88,081 | $ | 88,276 | $ | 88,887 | $ | 347,937 | |||||||||||||||
Costs and expenses: | Costs and expenses: | Costs and expenses: | ||||||||||||||||||||||||||||||||||
Cost of operations (exclusive of depreciation, depletion and amortization shown separately below) | $ | 53,276 | $ | 56,720 | $ | 55,306 | $ | 54,792 | $ | 220,095 | Cost of operations (exclusive of depreciation, depletion and amortization shown separately below) | $ | 56,123 | $ | 60,106 | $ | 59,077 | $ | 59,688 | $ | 234,994 | |||||||||||||||
Freight and handling | 644 | 839 | 1,141 | 1,283 | 3,907 | Freight and handling | 708 | 1,138 | 1,283 | 1,368 | 4,497 | |||||||||||||||||||||||||
Depreciation, depletion and amortization | 9,006 | 8,898 | 9,264 | 9,177 | 36,345 | Depreciation, depletion and amortization | 8,932 | 9,300 | 9,130 | 9,259 | 36,620 | |||||||||||||||||||||||||
Selling, general and administrative (exclusive of depreciation, depletion and amortization shown separately above) | 3,784 | 3,778 | 4,027 | 3,894 | 15,482 | Selling, general and administrative (exclusive of depreciation, depletion and amortization shown separately above) | 3,779 | 4,026 | 3,893 | 3,915 | 15,614 | |||||||||||||||||||||||||
Incremental selling, general and administrative | 750 | 750 | 750 | 750 | 3,000 | Incremental selling, general and administrative | 750 | 750 | 750 | 750 | 3,000 | |||||||||||||||||||||||||
Loss on sale of assets | — | — | — | — | — | Loss on sale of assets | — | — | — | — | — | |||||||||||||||||||||||||
Total costs and expenses (1) | $ | 67,460 | $ | 70,985 | $ | 70,488 | $ | 69,896 | $ | 278,829 | Total costs and expenses (1) | $ | 70,292 | $ | 75,320 | $ | 74,133 | $ | 74,980 | $ | 294,725 | |||||||||||||||
Income from operations | Income from operations | $ | 8,307 | $ | 12,444 | $ | 13,647 | $ | 14,749 | $ | 49,148 | Income from operations | $ | 12,400 | $ | 12,761 | $ | 14,143 | $ | 13,907 | $ | 53,212 | ||||||||||||||
Interest and other income (expense): | Interest and other income (expense): | Interest and other income (expense): | ||||||||||||||||||||||||||||||||||
Interest expense | (909 | ) | (798 | ) | (951 | ) | (1,145 | ) | (3,803 | ) | Interest expense | (776 | ) | (867 | ) | (982 | ) | (1,039 | ) | (3,664 | ) | |||||||||||||||
Interest income | — | — | — | — | — | Interest income | — | — | — | — | — | |||||||||||||||||||||||||
Other income (expense) | — | — | — | — | — | Other income (expense) | — | — | — | — | — | |||||||||||||||||||||||||
Equity in net income of unconsolidated affiliate | 979 | 1,566 | 3,051 | 3,109 | 8,705 | Equity in net income of unconsolidated affiliate | 2,761 | 1,799 | 1,633 | 2,722 | 8,915 | |||||||||||||||||||||||||
Net income (1) | Net income (1) | $ | 8,376 | $ | 13,213 | $ | 15,747 | $ | 16,713 | $ | 54,049 | Net income (1) | $ | 14,386 | $ | 13,693 | $ | 14,794 | $ | 15,590 | $ | 58,463 | ||||||||||||||
| | Forecasted | |||||||||||||||||||||||||||||||||||
|---|---|---|---|---|---|---|---|---|---|---|---|---|---|---|---|---|---|---|---|---|---|---|---|---|---|---|---|---|---|---|---|---|---|---|---|---|
| | | Forecasted | | Three Months Ending | | |||||||||||||||||||||||||||||||
| | | Three Months Ending | | | Twelve Months Ending September 30, 2011 | |||||||||||||||||||||||||||||||
| | | September 30, 2010 | December 31, 2010 | March 31, 2011 | June 30, 2011, | Twelve Months Ending June 30, 2011 | | December 31, 2010 | March 31, 2011 | June 30, 2011, | September 30, 2011 | |||||||||||||||||||||||||
| | | (in thousands, except distributions per unit) | | (in thousands, except distributions per unit) | ||||||||||||||||||||||||||||||||
Net income (1) | Net income (1) | $ | 8,376 | $ | 13,213 | $ | 15,747 | $ | 16,713 | $ | 54,049 | Net income (1) | $ | 14,386 | $ | 13,693 | $ | 14,794 | $ | 15,590 | $ | 58,463 | ||||||||||||||
Plus: | Plus: | Plus: | ||||||||||||||||||||||||||||||||||
Depreciation, depletion and amortization | 9,006 | 8,898 | 9,264 | 9,177 | 36,345 | Depreciation, depletion and amortization | 8,932 | 9,300 | 9,130 | 9,259 | 36,620 | |||||||||||||||||||||||||
Interest expense | 909 | 798 | 951 | 1,145 | 3,803 | Interest expense | 776 | 867 | 982 | 1,039 | 3,664 | |||||||||||||||||||||||||
EBITDA (1) | EBITDA (1) | $ | 18,291 | $ | 22,909 | $ | 25,962 | $ | 27,035 | $ | 94,197 | EBITDA (1) | $ | 24,093 | $ | 23,860 | $ | 24,906 | $ | 25,888 | $ | 98,747 | ||||||||||||||
Less: | Less: | Less: | ||||||||||||||||||||||||||||||||||
Cash interest expense | (793 | ) | (581 | ) | (634 | ) | (673 | ) | (2,681 | ) | Cash interest expense | (565 | ) | (571 | ) | (561 | ) | (558 | ) | (2,254 | ) | |||||||||||||||
Maintenance capital expenditures | (3,540 | ) | (3,755 | ) | (4,675 | ) | (4,716 | ) | (16,686 | ) | Maintenance capital expenditures | (4,067 | ) | (4,751 | ) | (4,904 | ) | (4,893 | ) | (18,614 | ) | |||||||||||||||
Expansion capital expenditures | (9,554 | ) | (5,914 | ) | (10,789 | ) | (19,836 | ) | (46,092 | ) | Expansion capital expenditures | (4,950 | ) | (9,735 | ) | (11,883 | ) | (3,042 | ) | (29,611 | ) | |||||||||||||||
Plus: | Plus: | Plus: | ||||||||||||||||||||||||||||||||||
Borrowings or cash on hand for expansion capital expenditures | 9,554 | 5,914 | 10,789 | 19,836 | 46,092 | Borrowings or cash on hand for expansion capital expenditures | 4,950 | 9,735 | 11,883 | 3,042 | 29,611 | |||||||||||||||||||||||||
Cash available for distribution (1) | Cash available for distribution (1) | $ | 13,958 | $ | 18,573 | $ | 20,653 | $ | 21,646 | $ | 74,831 | Cash available for distribution (1) | $ | 19,462 | $ | 18,539 | $ | 19,441 | $ | 20,437 | $ | 77,879 | ||||||||||||||
Implied cash distributions based on the minimum quarterly distribution per unit: | Implied cash distributions based on the minimum quarterly distribution per unit: | Implied cash distributions based on the minimum quarterly distribution per unit: | ||||||||||||||||||||||||||||||||||
Annualized minimum quarterly distribution per unit | $ | 0.445 | $ | 0.445 | $ | 0.445 | $ | 0.445 | $ | 1.78 | Annualized minimum quarterly distribution per unit | $ | 0.445 | $ | 0.445 | $ | 0.445 | $ | 0.445 | $ | 1.780 | |||||||||||||||
Distribution to common unitholders | $ | 5,517 | $ | 5,517 | $ | 5,517 | $ | 5,517 | $ | 22,067 | Distribution to common unitholders | $ | 5,517 | $ | 5,517 | $ | 5,517 | $ | 5,517 | $ | 22,067 | |||||||||||||||
Distribution to subordinated unitholder | 5,517 | 5,517 | 5,517 | 5,517 | 22,067 | Distribution to subordinated unitholder | 5,517 | 5,517 | 5,517 | 5,517 | 22,067 | |||||||||||||||||||||||||
Distribution to general partner | 225 | 225 | 225 | 225 | 901 | Distribution to general partner | 225 | 225 | 225 | 225 | 901 | |||||||||||||||||||||||||
Total distributions (1) | $ | 11,259 | $ | 11,259 | $ | 11,259 | $ | 11,259 | $ | 45,034 | Total distributions (1) | $ | 11,259 | $ | 11,259 | $ | 11,259 | $ | 11,259 | $ | 45,034 | |||||||||||||||
Excess (shortfall) (1) | Excess (shortfall) (1) | $ | 2,700 | $ | 7,315 | $ | 9,395 | $ | 10,388 | $ | 29,797 | Excess (shortfall) (1) | $ | 8,204 | $ | 7,280 | $ | 8,183 | $ | 9,179 | $ | 32,845 | ||||||||||||||
PROVISIONS OF OUR PARTNERSHIP AGREEMENT RELATING TO CASH DISTRIBUTIONS
Set forth below is a summary of the significant provisions of our partnership agreement that relate to cash distributions.
Distributions of Available Cash
General
Our partnership agreement requires that, within 45 days after the end of each quarter, beginning with the quarter ending September 30, 2010, we distribute all of our available cash to unitholders of record on the applicable record date. We will adjust the minimum quarterly distribution for the period from the closing of the offering through September 30, 2010.
Definition of Available Cash
Available cash, for any quarter, consists of all cash and cash equivalents on hand at the end of that quarter:
The purpose and effect of the last bullet point above is to allow our general partner, if it so decides, to use cash from working capital borrowings made after the end of the quarter but on or before the date of determination of available cash for that quarter to pay distributions to unitholders. Under our partnership agreement, working capital borrowings are borrowings that are made under a credit agreement, commercial paper facility or similar financing arrangement, and in all cases are used solely for working capital purposes or to pay distributions to partners and with the intent of the borrower to repay such borrowings within twelve months from sources other than additional working capital borrowings. We may borrow funds to pay quarterly distributions to our unitholders.
Distributions of the Minimum Quarterly Distribution
We will distribute to the holders of common and subordinated units on a quarterly basis the minimum quarterly distribution of $0.445 per unit, or $1.78 on an annualized basis, to the extent we have sufficient cash from our operations after establishment of cash reserves and payment of fees and expenses, including payments to our general partner and its affiliates. However, there is no guarantee that we will pay the minimum quarterly distribution on the units in any quarter.
Even if our cash distribution policy is not modified or revoked, the amount of distributions paid
under our policy and the decision to make any distribution is determined by our general partner, taking into consideration the terms of our partnership agreement.
General Partner Interest and Incentive Distribution Rights
Initially, our general partner will be entitled to 2.0% of all distributions that we make prior to our liquidation. Our general partner has the right, but not the obligation, to contribute a proportionate amount of capital to us to maintain its current general partner interest. Our general partner's initial 2.0% interest in our distributions may be reduced if we issue additional limited partner units in the future and our general partner does not contribute a proportionate amount of capital to us to maintain its 2.0% general partner interest.
Our general partner also currently holds incentive distribution rights that entitle it to receive increasing percentages, up to a maximum of 50.0%, of the cash we distribute from operating surplus (as defined below) in excess of $0.445 per unit per quarter. We view these distributions as an incentive fee, providing our general partner with a direct financial incentive to expand the profitability of our business to enable us to increase distributions to our limited partners. The maximum distribution of 50.0% includes distributions paid to our general partner on its 2.0% general partner interest and assumes that our general partner maintains its general partner interest at 2.0%. The maximum distribution of 50.0% does not include any distributions that our general partner may receive on any limited partner units that it owns.
Operating Surplus and Capital Surplus
General
All cash distributed will be characterized as either "operating surplus" or "capital surplus." Our partnership agreement requires that we distribute available cash from operating surplus differently than available cash from capital surplus.
Operating Surplus
Operating surplus consists of:
provided that cash receipts from the termination of a commodity hedge or interest rate hedge prior to its specified termination date shall be included in operating surplus in
equal quarterly installments over the remaining scheduled life of such commodity hedge or interest rate hedge;plus
As described above, operating surplus does not reflect actual cash on hand that is available for distribution to our unitholders and is not limited to cash generated by our operations. For example, it includes $25.0 million that will enable us, if we choose, to distribute as operating surplus cash we receive in the future from non-operating sources such as asset sales, issuances of securities and long-term borrowings that would otherwise be distributed as capital surplus. In addition, the effect of including, as described above, certain cash distributions on equity interests in operating surplus will be to increase operating surplus by the amount of any such cash distributions. As a result, we may also distribute as operating surplus up to the amount of any such cash that we receive from non-operating sources.
The proceeds of working capital borrowings increase operating surplus and repayments of working capital borrowings are generally operating expenditures, as described below, and thus reduce operating surplus when made. However, if a working capital borrowing is not repaid during the twelve-month period following the borrowing, it will be deemed repaid at the end of such period, thus decreasing operating surplus at such time. When such working capital borrowing is in fact repaid, it will be excluded from operating expenditures because operating surplus will have been previously reduced by the deemed repayment.
We define operating expenditures in the partnership agreement, and it generally means all of our cash expenditures, including, but not limited to, taxes, reimbursement of expenses to our general partner or its affiliates, payments made under interest rate hedge agreements or commodity hedge agreements (provided that (1) with respect to amounts paid in connection with the initial purchase of an interest rate hedge contract or a commodity hedge contract, such amounts will be amortized over the life of the applicable interest rate hedge contract or
commodity hedge contract and (2) payments made in connection with the termination of any interest rate hedge contract or commodity hedge contract prior to the expiration of its stipulated settlement or termination date will be included in operating expenditures in equal quarterly installments over the remaining scheduled life of such interest rate hedge contract or commodity hedge contract), officer compensation, repayment of working capital borrowings, debt service
payments and estimated maintenance capital expenditures (as discussed in further detail below), provided that operating expenditures will not include:
Capital Surplus
Capital surplus is defined in our partnership agreement as any distribution of available cash in excess of our operating surplus. Accordingly, capital surplus would generally be generated by:
All available cash distributed by us on any date from any source will be treated as distributed from operating surplus until the sum of all available cash distributed since the closing of the initial public offering equals the operating surplus from the closing of the initial public offering through the end of the quarter immediately preceding that distribution. Any excess available cash distributed by us on that date will be deemed to be capital surplus.
Characterization of Cash Distributions
Our partnership agreement requires that we treat all available cash distributed as coming from operating surplus until the sum of all available cash distributed since the closing of this offering equals the operating surplus from the closing of this offering through the end of the
quarter immediately preceding that distribution. Our partnership agreement requires that we treat any amount distributed in excess of operating surplus, regardless of its source, as capital surplus. We do not anticipate that we will make any distributions from capital surplus.
Capital Expenditures
Estimated maintenance capital expenditures reduce operating surplus, but expansion capital expenditures, actual maintenance capital expenditures and investment capital expenditures do not. Maintenance capital expenditures are those capital expenditures required to maintain our long-term operating capacity. Examples of maintenance capital expenditures include expenditures associated with the replacement of equipment and coal reserves, whether through the expansion of an existing mine or the acquisition or development of new reserves, to the extent such expenditures are made to maintain our long-term operating capacity. Maintenance capital expenditures will also include interest (and related fees) on debt incurred and distributions on equity issued (including incremental distributions on incentive distribution rights) to finance all or any portion of the construction or development of a replacement asset that is paid in respect of the period that begins when we enter into a binding obligation to commence constructing or developing a replacement asset and ending on the earlier to occur of the date that any such replacement asset commences commercial service and the date that it is abandoned or disposed of. Capital expenditures made solely for investment purposes will not be considered maintenance capital expenditures.
Because our maintenance capital expenditures can be irregular, the amount of our actual maintenance capital expenditures may differ substantially from period to period, which could cause similar fluctuations in the amounts of operating surplus, adjusted operating surplus and cash available for distribution to our unitholders if we subtracted actual maintenance capital expenditures from operating surplus.
Our partnership agreement will require that an estimate of the average quarterly maintenance capital expenditures necessary to maintain our operating capacity over the long-term be subtracted from operating surplus each quarter as opposed to the actual amounts spent. The amount of estimated maintenance capital expenditures deducted from operating surplus for those periods will be subject to review and change by our general partner at least once a year, provided that any change is approved by our conflicts committee. The estimate will be made at least annually and whenever an event occurs that is likely to result in a material adjustment to the amount of our maintenance capital expenditures, such as a major acquisition or the introduction of new governmental regulations that will impact our business. Our partnership agreement does not cap the amount of maintenance capital expenditures that our general partner may estimate. For purposes of calculating operating surplus, any adjustment to this estimate will be prospective only. For a discussion of the amounts we have allocated toward estimated maintenance capital expenditures, please read "Cash Distribution Policy and Restrictions on Distributions."
The use of estimated maintenance capital expenditures in calculating operating surplus will have the following effects:
Expansion capital expenditures are those capital expenditures that we expect will increase our operating capacity over the long term. Examples of expansion capital expenditures include the acquisition of reserves, equipment or a new mine or the expansion of an existing mine, to the extent such capital expenditures are expected to expand our long-term operating capacity. Expansion capital expenditures will also include interest (and related fees) on debt incurred and distributions on equity issued (including incremental distributions on incentive distribution rights) to finance all or any portion of the construction of such capital improvement in respect of the period that commences when we enter into a binding obligation to commence construction of a capital improvement and ending on the earlier to occur of date any such capital improvement commences commercial service and the date that it is disposed of or abandoned. Capital expenditures made solely for investment purposes will not be considered expansion capital expenditures.
Investment capital expenditures are those capital expenditures that are neither maintenance capital expenditures nor expansion capital expenditures. Investment capital expenditures largely will consist of capital expenditures made for investment purposes. Examples of investment capital expenditures include traditional capital expenditures for investment purposes, such as purchases of securities, as well as other capital expenditures that might be made in lieu of such traditional investment capital expenditures, such as the acquisition of a capital asset for investment purposes or development of assets that are in excess of the maintenance of our existing operating capacity, but which are not expected to expand, for more than the short term, our operating capacity.
As described below, neither investment capital expenditures nor expansion capital expenditures are included in operating expenditures, and thus will not reduce operating surplus. Because expansion capital expenditures include interest payments (and related fees) on debt incurred to finance all or a portion of the construction, replacement or improvement of a capital asset during the period that begins when we enter into a binding obligation to commence construction of a capital improvement and ending on the earlier to occur of the date any such capital asset commences commercial service and the date that it is abandoned or disposed of, such interest payments also do not reduce operating surplus. Losses on disposition of an investment capital expenditure will reduce operating surplus when realized and cash receipts from an investment capital expenditure will be treated as a cash receipt for purposes of calculating operating surplus only to the extent the cash receipt is a return on principal.
Capital expenditures that are made in part for maintenance capital purposes, investment capital purposes and/or expansion capital purposes will be allocated as maintenance capital expenditures, investment capital expenditures or expansion capital expenditure by our general partner.
Subordination Period
General
Our partnership agreement provides that, during the subordination period (which we define below), the common units will have the right to receive distributions of available cash from operating surplus each quarter in an amount equal to $0.445 per common unit, which amount is defined in our partnership agreement as the minimum quarterly distribution, plus any arrearages
in the payment of the minimum quarterly distribution on the common units from prior quarters, before any distributions of available cash from operating surplus may be made on the subordinated units. These units are deemed "subordinated" because for a period of time, referred to as the subordination period, the subordinated units will not be entitled to receive any
distributions from operating surplus until the common units have received the minimum quarterly distribution plus any arrearages in the payment of the minimum quarterly distribution from prior quarters. Furthermore, no arrearages will be paid on the subordinated units. The practical effect of the subordinated units is to increase the likelihood that during the subordination period there will be sufficient available cash from operating surplus to pay the minimum quarterly distribution on the common units.
Subordination Period
Except as described below, the subordination period will begin on the closing date of this offering and expire on the first business day after the distribution to unitholders in respect of any quarter, beginning with the quarter ending JuneSeptember 30, 2013, if each of the following has occurred:
Early Termination of Subordination Period
Notwithstanding the foregoing, the subordination period will automatically terminate on the first business day after the distribution to unitholders in respect of any quarter, if each of the following has occurred:
We do not expect to satisfy the foregoing requirements for any four-quarter period ending on or before September 30, 2011.
Expiration Upon Removal of the General Partner
In addition, if the unitholders remove our general partner other than for cause:
Expiration of the Subordination Period
When the subordination period ends, each outstanding subordinated unit will convert into one common unit and will then participate pro-rata with the other common units in distributions of available cash.
Adjusted Operating Surplus
Adjusted operating surplus is intended to reflect the cash generated from operations during a particular period and therefore excludes net increases in working capital borrowings and net drawdowns of reserves of cash generated in prior periods. Adjusted operating surplus consists of:
Distributions of Available Cash From Operating Surplus During the Subordination Period
Our partnership agreement requires that we make distributions of available cash from operating surplus for any quarter during the subordination period in the following manner:
The preceding discussion is based on the assumptions that our general partner maintains its 2.0% general partner interest and that we do not issue additional classes of equity interests.
Distributions of Available Cash From Operating Surplus After the Subordination Period
Our partnership agreement requires that we make distributions of available cash from operating surplus for any quarter after the subordination period in the following manner:
The preceding discussion is based on the assumptions that our general partner maintains its 2.0% general partner interest and that we do not issue additional classes of equity interests.
General Partner Interest and Incentive Distribution Rights
Our partnership agreement provides that our general partner initially will be entitled to 2.0% of all distributions that we make prior to our liquidation. Our general partner has the right, but not the obligation, to contribute a proportionate amount of capital to us to maintain its 2.0% general partner interest if we issue additional units. Our general partner's 2.0% interest, and the percentage of our cash distributions to which it is entitled, will be proportionately reduced if we issue additional units in the future (other than the issuance of common units upon exercise by the underwriters of their option to purchase additional common units or the issuance of common units upon conversion of outstanding subordinated units) and our general partner does not contribute a proportionate amount of capital to us in order to maintain its 2.0% general partner interest. Our partnership agreement does not require that the general partner fund its capital contribution with cash and our general partner may fund its capital contribution by the contribution to us of common units or other property.
Incentive distribution rights represent the right to receive an increasing percentage (13.0%, 23.0% and 48.0%, in each case, not including distributions paid to the general partner on its 2.0% general partner interest) of quarterly distributions of available cash from operating surplus after the minimum quarterly distribution and the target distribution levels have been achieved. Our general partner currently holds the incentive distribution rights, but may transfer these rights separately from its general partner interest, subject to restrictions in the partnership agreement. We view distributions on the incentive distribution rights as an incentive fee, providing our general partner with a direct financial incentive to expand the profitability of our business to enable us to increase distributions to our limited partners.
The following discussion assumes that our general partner maintains its 2.0% general partner interest, that there are no arrearages on common units and that our general partner continues to own the incentive distribution rights.
If for any quarter:
then, our partnership agreement requires that we distribute any additional available cash from operating surplus for that quarter among the unitholders and the general partner in the following manner:
Percentage Allocations of Available Cash From Operating Surplus
The following table illustrates the percentage allocations of available cash from operating surplus between the unitholders and our general partner based on the specified target distribution levels. The amounts set forth under "Marginal Percentage Interest in Distributions" are the percentage interests of our general partner and the unitholders in any available cash from operating surplus we distribute up to and including the corresponding amount in the column "Total Quarterly Distribution Per Unit." The percentage interests shown for our unitholders and our general partner for the minimum quarterly distribution are also applicable to quarterly distribution amounts that are less than the minimum quarterly distribution. The percentage interests set forth below for our general partner include distributions paid on its 2.0% general partner interest, assume our general partner has contributed any additional capital to maintain
its 2.0% general partner interest and has not transferred its incentive distribution rights and there are no arrearages on common units.
| | | Marginal Percentage Interest in Distributions | | ||||||||
|---|---|---|---|---|---|---|---|---|---|---|---|
| | Total Quarterly Distribution Per Unit | Unitholders | General Partner | | |||||||
Minimum Quarterly Distribution | $0.445 | 98.0% | 2.0 | % | |||||||
First Target Distribution | up to $0.51175 | 98.0% | 2.0 | % | |||||||
Second Target Distribution | above $0.51175 up to $0.55625 | 85.0% | 15.0 | % | |||||||
Third Target Distribution | above $0.55625 up to $0.6675 | 75.0% | 25.0 | % | |||||||
Thereafter | above $0.6675 | 50.0% | 50.0 | % | |||||||
General Partner's Right to Reset Incentive Distribution Levels
Our general partner, as the initial holder of our incentive distribution rights, has the right under our partnership agreement to elect to relinquish the right to receive incentive distribution payments based on the initial cash target distribution levels and to reset, at higher levels, the minimum quarterly distribution amount and cash target distribution levels upon which the incentive distribution payments to our general partner would be set. If our general partner transfers all or a portion of our incentive distribution rights in the future, then the holder or holders of a majority of our incentive distribution rights will be entitled to exercise this right. The following discussion assumes that our general partner holds all of the incentive distribution rights at the time that a reset election is made. The right to reset the minimum quarterly distribution amount and the target distribution levels upon which the incentive distributions are based may be exercised, without approval of our unitholders or the conflicts committee of our general partner, at any time when there are no subordinated units outstanding and we have made cash distributions to the holders of the incentive distribution rights at the highest level of incentive distribution for each of the prior four consecutive fiscal quarters. The reset minimum quarterly distribution amount and target distribution levels will be higher than the minimum quarterly distribution amount and the target distribution levels prior to the reset such that there will be no incentive distributions paid under the reset target distribution levels until cash distributions per unit following this event increase as described below. We anticipate that our general partner would exercise this reset right in order to facilitate acquisitions or internal growth projects that would otherwise not be sufficiently accretive to cash distributions per common unit, taking into account the existing levels of incentive distribution payments being made to our general partner.
In connection with the resetting of the minimum quarterly distribution amount and the target distribution levels and the corresponding relinquishment by our general partner of incentive distribution payments based on the target cash distributions prior to the reset, our general partner will be entitled to receive a number of newly issued common units based on a predetermined formula described below that takes into account the "cash parity" value of the average cash distributions related to the incentive distribution rights received by our general partner for the two quarters prior to the reset event as compared to the average cash distributions per common unit during this period. In addition, our general partner will be issued a general partner interest necessary to maintain its general partner interest in us immediately prior to the reset election.
The number of common units that our general partner would be entitled to receive from us in connection with a resetting of the minimum quarterly distribution amount and the target distribution levels then in effect would be equal to the quotient determined by dividing (x) the
average amount of cash distributions received by our general partner in respect of its incentive distribution rights during the two consecutive fiscal quarters ended immediately prior to the date of such reset election by (y) the average of the amount of cash distributed per common unit during each of these two quarters.
Following a reset election, the minimum quarterly distribution amount will be reset to an amount equal to the average cash distribution amount per unit for the two fiscal quarters immediately preceding the reset election (which amount we refer to as the "reset minimum quarterly distribution") and the target distribution levels will be reset to be correspondingly higher such that we would distribute all of our available cash from operating surplus for each quarter thereafter as follows:
The following table illustrates the percentage allocation of available cash from operating surplus between the unitholders and our general partner at various cash distribution levels (1) pursuant to the cash distribution provisions of our partnership agreement in effect at the closing of this offering, as well as (2) following a hypothetical reset of the minimum quarterly distribution and target distribution levels based on the assumption that the average quarterly cash distribution amount per common unit during the two fiscal quarters immediately preceding the reset election was $0.712.
| | | | Marginal Percentage Interest in Distribution | | | |||||||||||
|---|---|---|---|---|---|---|---|---|---|---|---|---|---|---|---|---|
| | Quarterly Distribution Per Unit Prior to Reset | Unitholders | General Partner | Quarterly Distribution Per Unit Following Hypothetical Reset | ||||||||||||
Minimum Quarterly Distribution | $0.445 | 98.0 | % | 2.0 | % | $0.712 | ||||||||||
First Target Distribution | up to $0.51175 | 98.0 | % | 2.0 | % | up to $0.8188(1) | ||||||||||
Second Target Distribution | above $0.51175 up to $0.55625 | 85.0 | % | 15.0 | % | above $0.8188(1) up to $0.89(2) | ||||||||||
Third Target Distribution | above $0.55625 up to $0.6675 | 75.0 | % | 25.0 | % | above $0.89(2) up to $1.068(3) | ||||||||||
Thereafter | above $0.6675 | 50.0 | % | 50.0 | % | above $1.068(3) | ||||||||||
The following table illustrates the total amount of available cash from operating surplus that would be distributed to the unitholders and our general partner, including in respect of
incentive distribution rights, based on an average of the amounts distributed for a quarter for the
two quarters immediately prior to the reset. The table assumes that immediately prior to the reset there would be 24,794,000 common units outstanding, our general partner has maintained its 2.0% general partner interest, and the average distribution to each common unit would be $0.712 per quarter for the two quarters prior to the reset.
| | | | Cash Distributions to General Partner Prior to Reset | | |||||||||||||||||
|---|---|---|---|---|---|---|---|---|---|---|---|---|---|---|---|---|---|---|---|---|---|
| | | Cash Distributions to Common Unitholders Prior to Reset | | ||||||||||||||||||
| | Quarterly Distributions Per Unit Prior to Reset | | |||||||||||||||||||
| | Common Units | 2.0% General Partner Interest | Incentive Distribution Rights | Total | Total Distributions | ||||||||||||||||
Minimum Quarterly Distribution | $0.445 | $ | 11,033,330 | $ | — | $ | 225,170 | $ | — | $ | 225,170 | $ | 11,258,500 | ||||||||
First Target Distribution | up to $0.51175 | 1,655,000 | — | 33,776 | — | 33,776 | 1,688,775 | ||||||||||||||
Second Target Distribution | above $.51175 | ||||||||||||||||||||
| up to $0.55625 | 1,103,333 | — | 25,961 | 168,745 | 194,706 | 1,298,039 | |||||||||||||||
Third Target Distribution | above $0.55625 | ||||||||||||||||||||
| up to $0.6675 | 2,758,333 | — | 73,556 | 845,889 | 919,444 | 3,677,777 | |||||||||||||||
Thereafter | above $0.6675 | 1,103,333 | — | 44,133 | 1,059,200 | 1,103,333 | 2,206,666 | ||||||||||||||
| $ | 17,653,328 | $ | — | $ | 402,595 | $ | 2,073,833 | $ | 2,476,428 | $ | 20,129,756 | ||||||||||
The following table illustrates the total amount of available cash from operating surplus that would be distributed to the unitholders and our general partner, including in respect of incentive distribution rights, with respect to the quarter in which the reset occurs. The table reflects that as a result of the reset there would be 27,706,687 common units outstanding, our general partner's 2.0% interest has been maintained, and the average distribution to each common unit would be $0.712. The number of common units to be issued to our general partner upon the reset was calculated by dividing (1) the average of the amounts received by our general partner in respect of its incentive distribution rights for the two quarters prior to the reset as shown in the table above, or $2,073,833, by (2) the average available cash distributed on each common unit for the two quarters prior to the reset as shown in the table above, or $0.712.
| | | | Cash Distributions to General Partner After Reset | | ||||||||||||||||||
|---|---|---|---|---|---|---|---|---|---|---|---|---|---|---|---|---|---|---|---|---|---|---|
| | | Cash Distributions to Common Unitholders After Reset | | |||||||||||||||||||
| | Quarterly Distributions Per Unit After Reset | | ||||||||||||||||||||
| | Common Units | 2.0% General Partner Interest | Incentive Distribution Rights | Total | Total Distributions | |||||||||||||||||
Minimum Quarterly Distribution | $0.712 | $ | 17,653,328 | $ | 2,073,833 | $ | 402,595 | $ | — | $ | 2,476,428 | $ | 20,129,756 | |||||||||
First Target Distribution | up to $0.8188 | — | — | — | — | — | — | |||||||||||||||
Second Target Distribution | above $0.8188 | |||||||||||||||||||||
| up to $0.89 | — | — | — | — | — | — | ||||||||||||||||
Third Target Distribution | above $0.89 | |||||||||||||||||||||
| up to $1.068 | — | — | — | — | — | — | ||||||||||||||||
Thereafter | above $1.068 | — | — | — | — | — | — | |||||||||||||||
| $ | 17,653,328 | $ | 2,073,833 | $ | 402,595 | $ | — | $ | 2,476,428 | $ | 20,129,756 | |||||||||||
Our general partner will be entitled to cause the minimum quarterly distribution amount and the target distribution levels to be reset on more than one occasion, provided that it may not make a reset election except at a time when it has received incentive distributions for the prior four consecutive fiscal quarters based on the highest level of incentive distributions that it is entitled to receive under our partnership agreement.
Distributions From Capital Surplus
How Distributions From Capital Surplus Will Be Made
Our partnership agreement requires that we make distributions of available cash from capital surplus, if any, in the following manner:
The preceding paragraph assumes that our general partner maintains its 2.0% general partner interest and that we do not issue additional classes of equity interests.
Effect of a Distribution From Capital Surplus
Our partnership agreement treats a distribution of capital surplus as the repayment of the initial unit price from this initial public offering, which is a return of capital. The initial public offering price less any distributions of capital surplus per unit is referred to as the "unrecovered initial unit price." Each time a distribution of capital surplus is made, the minimum quarterly distribution and the target distribution levels will be reduced in the same proportion as the corresponding reduction in the unrecovered initial unit price. Because distributions of capital surplus will reduce the minimum quarterly distribution and target distribution levels after any of these distributions are made, it may be easier for our general partner to receive incentive distributions and for the subordinated units to convert into common units. However, any distribution of capital surplus before the unrecovered initial unit price is reduced to zero cannot be applied to the payment of the minimum quarterly distribution or any arrearages.
Once we distribute capital surplus on a unit issued in this offering in an amount equal to the initial unit price, our partnership agreement specifies that the minimum quarterly distribution and the target distribution levels will be reduced to zero. Our partnership agreement specifies that we then make all future distributions from operating surplus, with 50.0% being paid to the holders of units and 50.0% to our general partner. The percentage interests shown for our general partner include its 2.0% general partner interest and assume our general partner has not transferred the incentive distribution rights.
Adjustment to the Minimum Quarterly Distribution and Target Distribution Levels
In addition to adjusting the minimum quarterly distribution and target distribution levels to reflect a distribution of capital surplus, if we combine our units into fewer units or subdivide our units into a greater number of units, our partnership agreement specifies that the following items will be proportionately adjusted:
For example, if a two-for-one split of the common units should occur, the minimum quarterly distribution, the target distribution levels and the unrecovered initial unit price would each be reduced to 50.0% of its initial level. If we combine our common units into a lesser number of units or subdivide our common units into a greater number of units, we will combine or subdivide our subordinated units using the same ratio applied to the common units. Our partnership agreement provides that we do not make any adjustment by reason of the issuance of additional units for cash or property.
In addition, if legislation is enacted or if existing law is modified or interpreted by a governmental taxing authority, so that we become taxable as a corporation or otherwise subject to taxation as an entity for federal, state or local income tax purposes, our partnership agreement specifies that the minimum quarterly distribution and the target distribution levels for each quarter may, in the sole discretion of the general partner, be reduced by multiplying each distribution level by a fraction, the numerator of which is available cash for that quarter and the denominator of which is the sum of available cash for that quarter plus our general partner's estimate of our aggregate liability for the quarter for such income taxes payable by reason of such legislation or interpretation. To the extent that the actual tax liability differs from the estimated tax liability for any quarter, the difference will be accounted for in subsequent quarters.
Distributions of Cash Upon Liquidation
General
If we dissolve in accordance with the partnership agreement, we will sell or otherwise dispose of our assets in a process called liquidation. We will first apply the proceeds of liquidation to the payment of our creditors. We will distribute any remaining proceeds to the unitholders, the general partner and the holders of the incentive distribution rights, in accordance with their capital account balances, as adjusted to reflect any gain or loss upon the sale or other disposition of our assets in liquidation.
The allocations of gain and loss upon liquidation are intended, to the extent possible, to entitle the holders of common units to a preference over the holders of subordinated units upon our liquidation, to the extent required to permit common unitholders to receive their unrecovered initial unit price plus the minimum quarterly distribution for the quarter during which liquidation occurs plus any unpaid arrearages in payment of the minimum quarterly distribution on the common units. However, there may not be sufficient gain upon our
liquidation to enable the common unitholders to fully recover all of these amounts, even though
there may be cash available for distribution to the holders of subordinated units. Any further net gain recognized upon liquidation will be allocated in a manner that takes into account the incentive distribution rights of our general partner.
Manner of Adjustments for Gain
The manner of the adjustment for gain is set forth in the partnership agreement. If our liquidation occurs before the end of the subordination period, we will allocate any gain to the partners in the following manner:
The percentage interests set forth above for our general partner include its 2.0% general partner interest and assume our general partner has not transferred the incentive distribution rights.
If the liquidation occurs after the end of the subordination period, the distinction between common and subordinated units will disappear, so that clause (3) of the second bullet point above and all of the third bullet point above will no longer be applicable.
Manner of Adjustments for Losses
If our liquidation occurs before the end of the subordination period, after making allocations of loss to the general partner and the unitholders in a manner intended to offset in reverse order the allocations of gains that have previously been allocated, we will generally allocate any loss to our general partner and the unitholders in the following manner:
If the liquidation occurs after the end of the subordination period, the distinction between common and subordinated units will disappear, so that all of the first bullet point above will no longer be applicable.
Adjustments to Capital Accounts
Our partnership agreement requires that we make adjustments to capital accounts upon the issuance of additional units. In this regard, our partnership agreement specifies that we allocate any unrealized and, for U.S. federal income tax purposes, unrecognized gain resulting from the adjustments to the unitholders and the general partner in the same manner as we allocate gain upon liquidation. In the event that we make positive adjustments to the capital accounts upon the issuance of additional units, our partnership agreement requires that we generally allocate any later negative adjustments to the capital accounts resulting from the issuance of additional units or upon our liquidation in a manner which results, to the extent possible, in the partners' capital account balances equaling the amount which they would have been if no earlier positive adjustments to the capital accounts had been made. By contrast to the allocations of gain, and except as provided above, we generally will allocate any unrealized and unrecognized loss resulting from the adjustments to capital accounts upon the issuance of additional units to the unitholders and our general partner based on their respective percentage ownership of us. In this manner, prior to the end of the subordination period, we generally will allocate any such loss equally with respect to our common and subordinated units. In the event we make negative adjustments to the capital accounts as a result of such loss, future positive adjustments resulting from the issuance of additional units will be allocated in a manner designed to reverse the prior negative adjustments, and special allocations will be made upon liquidation in a manner that results, to the extent possible, in our unitholders' capital account balances equaling the amounts they would have been if no earlier adjustments for loss had been made.
SELECTED HISTORICAL CONSOLIDATED AND CONDENSED CONSOLIDATED AND PRO FORMA CONDENSED CONSOLIDATED FINANCIAL AND OPERATING DATA
The following table presents selected historical consolidated financial and operating data of our predecessor, Rhino Energy LLC, as of the dates and for the periods indicated. The selected historical consolidated financial data presented as of March 31, 2006 and December 31, 2006 and 2007 and for the years ended March 31, 2006 and nine months ended December 31, 2006 is derived from the audited historical consolidated financial statements of Rhino Energy LLC that are not included in this prospectus. The historical consolidated financial data as of and for the year ended December 31, 2008 was restated to reflect certain selling, general and administrative expenses within the statement of operations, rather than as a distribution to members in the statement of financial position. The selected historical consolidated financial data presented as of December 31, 2008 and 2009 and for the years ended December 31, 2007, 2008 and 2009 is derived from the audited historical consolidated financial statements of Rhino Energy LLC that are included elsewhere in this prospectus. The selected historical consolidated financial data presented as of March 31,June 30, 2010 and for the threesix months ended March 31,June 30, 2009 and 2010 is derived from the unaudited historical condensed consolidated financial statements of Rhino Energy LLC that are included elsewhere in this prospectus. The selected historical condensed consolidated financial data presented as of March 31,June 30, 2009 is derived from our predecessor's accounting records, which are unaudited. Effective April 1, 2006, Rhino Energy LLC changed its fiscal year end from March 31 to December 31.
The selected pro forma condensed consolidated financial data presented for the year ended December 31, 2009 and as of and for the threesix months ended March 31,June 30, 2010 is derived from our unaudited pro forma condensed consolidated financial statements included elsewhere in this prospectus. Our unaudited pro forma condensed consolidated financial statements give pro forma effect to:
The unaudited pro forma condensed consolidated statement of financial position assumes the items listed above occurred as of March 31,June 30, 2010. The unaudited pro forma condensed consolidated statements of operations data for the year ended December 31, 2009 and the threesix months ended March 31,June 30, 2010 assume the items listed above occurred as of January 1, 2009. We have not given pro forma effect to the incremental selling, general and administrative expenses of approximately $3.0 million that we expect to incur as a result of being a publicly traded partnership.
For a detailed discussion of the selected historical consolidated financial information contained in the following table, please read "Management's Discussion and Analysis of Financial Condition and Results of Operations." The following table should also be read in conjunction with "Use of Proceeds," "Business—Our History" and the audited historical
consolidated financial statements of Rhino Energy LLC and our unaudited pro forma condensed consolidated financial statements included elsewhere in this prospectus. Among other things,
the historical consolidated and unaudited pro forma condensed consolidated financial statements include more detailed information regarding the basis of presentation for the information in the following table.
The following table presents a non-GAAP financial measure, EBITDA, which we use in our business as it is an important supplemental measure of our performance and liquidity. EBITDA represents net income before interest expense, income taxes and depreciation, depletion and amortization. This measure is not calculated or presented in accordance with GAAP. We explain this measure under "—Non-GAAP Financial Measure" and reconcile it to its most directly comparable financial measures calculated and presented in accordance with GAAP.
| | | Rhino Energy LLC Historical | Rhino Resource Partners LP Pro Forma Condensed Consolidated | | Rhino Energy LLC Historical | Rhino Resource Partners LP Pro Forma Condensed Consolidated | ||||||||||||||||||||||||||||||||||||||||||||||||||||||
|---|---|---|---|---|---|---|---|---|---|---|---|---|---|---|---|---|---|---|---|---|---|---|---|---|---|---|---|---|---|---|---|---|---|---|---|---|---|---|---|---|---|---|---|---|---|---|---|---|---|---|---|---|---|---|---|---|---|---|---|---|
| | | Consolidated | Condensed Consolidated | | | | Consolidated | Condensed Consolidated | | | ||||||||||||||||||||||||||||||||||||||||||||||||||
| | | Year Ended March 31, | Nine Months Ended December 31, | Year Ended December 31, | Three Months Ended March 31, | Year Ended December 31, | Three Months Ended March 31, | | Year Ended March 31, | Nine Months Ended December 31, | Year Ended December 31, | Six Months Ended June 30, | Year Ended December 31, | Six Months Ended June 30, | ||||||||||||||||||||||||||||||||||||||||||||||
| | | | 2008 (as restated) | | | | 2008 (as restated) | | ||||||||||||||||||||||||||||||||||||||||||||||||||||
| | | 2006 | 2006 | 2007 | 2009 | 2009 | 2010 | 2009 | 2010 | | 2006 | 2006 | 2007 | 2009 | 2009 | 2010 | 2009 | 2010 | ||||||||||||||||||||||||||||||||||||||||||
| | | (in thousands, except per unit data) | | (in thousands, except per unit data) | ||||||||||||||||||||||||||||||||||||||||||||||||||||||||
Statement of Operations Data: | Statement of Operations Data: | Statement of Operations Data: | ||||||||||||||||||||||||||||||||||||||||||||||||||||||||||
Total revenues | Total revenues | $ | 363,960 | $ | 300,839 | $ | 403,452 | $ | 438,924 | $ | 419,790 | $ | 116,706 | $ | 66,603 | $ | 419,790 | $ | 66,603 | Total revenues | $ | 363,960 | $ | 300,839 | $ | 403,452 | $ | 438,924 | $ | 419,790 | $ | 226,095 | $ | 145,031 | $ | 419,790 | $ | 145,031 | ||||||||||||||||||||||
Costs and expenses: | Costs and expenses: | Costs and expenses: | ||||||||||||||||||||||||||||||||||||||||||||||||||||||||||
Cost of operations (exclusive of depreciation, depletion and amortization shown separately below) | 291,208 | 241,185 | 318,405 | 364,912 | 336,335 | 98,317 | 46,352 | 336,335 | 46,352 | Cost of operations (exclusive of depreciation, depletion and amortization shown separately below) | 291,208 | 241,185 | 318,405 | 364,912 | 336,335 | 183,518 | 104,192 | 336,335 | 104,192 | |||||||||||||||||||||||||||||||||||||||||
Freight and handling costs | 6,343 | 2,768 | 4,021 | 10,223 | 3,990 | 938 | 673 | 3,990 | 673 | Freight and handling costs | 6,343 | 2,768 | 4,021 | 10,223 | 3,990 | 1,976 | 1,444 | 3,990 | 1,444 | |||||||||||||||||||||||||||||||||||||||||
Depreciation, depletion and amortization | 13,744 | 28,471 | 30,750 | 36,428 | 36,279 | 9,974 | 7,765 | 36,279 | 7,765 | Depreciation, depletion and amortization | 13,744 | 28,471 | 30,750 | 36,428 | 36,279 | 19,872 | 15,803 | 36,279 | 15,803 | |||||||||||||||||||||||||||||||||||||||||
Selling, general and administrative (exclusive of depreciation, depletion and amortization shown separately above) | 17,129 | 18,573 | 15,370 | 19,042 | 16,754 | 4,376 | 3,678 | 16,754 | 3,678 | Selling, general and administrative (exclusive of depreciation, depletion and amortization shown separately above) | 17,129 | 18,573 | 15,370 | 19,042 | 16,754 | 8,989 | 7,604 | 16,754 | 7,604 | |||||||||||||||||||||||||||||||||||||||||
(Gain) loss on sale of assets | (377 | ) | 746 | (944 | ) | 451 | 1,710 | — | (1 | ) | 1,710 | (1 | ) | (Gain) loss on sale of assets | (377 | ) | 746 | (944 | ) | 451 | 1,710 | 1,288 | (47 | ) | 1,710 | (47 | ) | |||||||||||||||||||||||||||||||||
Total costs and expenses | 328,047 | 291,742 | 367,602 | 431,056 | 395,069 | 113,605 | 58,466 | 395,069 | 58,466 | Total costs and expenses | 328,047 | 291,742 | 367,602 | 431,056 | 395,069 | 215,643 | 128,996 | 395,069 | 128,996 | |||||||||||||||||||||||||||||||||||||||||
Income from operations | Income from operations | 35,913 | 9,096 | 35,849 | 7,868 | 24,721 | 3,101 | 8,136 | 24,721 | 8,136 | Income from operations | 35,913 | 9,096 | 35,849 | 7,868 | 24,721 | 10,452 | 16,035 | 24,721 | 16,035 | ||||||||||||||||||||||||||||||||||||||||
Interest and other income (expense): | Interest and other income (expense): | Interest and other income (expense): | ||||||||||||||||||||||||||||||||||||||||||||||||||||||||||
Interest expense | (4,976 | ) | (6,498 | ) | (5,579 | ) | (5,501 | ) | (6,222 | ) | (1,170 | ) | (1,471 | ) | (4,291 | ) | 992 | Interest expense | (4,976 | ) | (6,498 | ) | (5,579 | ) | (5,501 | ) | (6,222 | ) | (2,891 | ) | (2,781 | ) | (4,271 | ) | (1,875 | ) | ||||||||||||||||||||||||
Interest income | 412 | 312 | 317 | 149 | 71 | 87 | 8 | 71 | 8 | Interest income | 412 | 312 | 317 | 149 | 71 | 69 | 18 | 71 | 18 | |||||||||||||||||||||||||||||||||||||||||
Equity in net income (loss) of unconsolidated affiliate(1) | — | — | — | (1,587 | ) | 893 | (43 | ) | (130 | ) | 893 | (130 | ) | Equity in net income (loss) of unconsolidated affiliate(1) | — | — | — | (1,587 | ) | 893 | (268 | ) | 414 | 893 | 414 | |||||||||||||||||||||||||||||||||||
Other—net | 491 | 272 | — | — | — | — | — | — | — | Other—net | 491 | 272 | — | — | — | — | ||||||||||||||||||||||||||||||||||||||||||||
Total interest and other expense | Total interest and other expense | (4,073 | ) | (5,914 | ) | (5,263 | ) | (6,939 | ) | (5,259 | ) | (1,125 | ) | (1,592 | ) | (3,327 | ) | (1,114 | ) | Total interest and other expense | (4,073 | ) | (5,914 | ) | (5,263 | ) | (6,939 | ) | (5,259 | ) | (3,089 | ) | (2,349 | ) | (3,307 | ) | (1,443 | ) | ||||||||||||||||||||||
Income before income tax expense | Income before income tax expense | 31,840 | 3,182 | 30,588 | 929 | 19,462 | 1,976 | 6,544 | 21,394 | 7,023 | Income before income tax expense | 31,840 | 3,182 | 30,588 | 929 | 19,462 | 7,362 | 13,686 | 21,413 | 14,592 | ||||||||||||||||||||||||||||||||||||||||
Income tax expense (benefit) | Income tax expense (benefit) | 178 | 125 | (126 | ) | — | — | — | — | — | — | Income tax expense (benefit) | 178 | 125 | (126 | ) | — | — | — | — | — | — | ||||||||||||||||||||||||||||||||||||||
Net income | Net income | $ | 31,661 | $ | 3,057 | $ | 30,714 | $ | 929 | $ | 19,462 | $ | 1,976 | $ | 6,544 | $ | 21,394 | $ | 7,023 | Net income | $ | 31,661 | $ | 3,057 | $ | 30,714 | $ | 929 | $ | 19,462 | $ | 7,362 | $ | 13,686 | $ | 21,413 | $ | 14,592 | ||||||||||||||||||||||
Net income per limited partner unit, basic: | Net income per limited partner unit, basic: | Net income per limited partner unit, basic: | ||||||||||||||||||||||||||||||||||||||||||||||||||||||||||
Common units | $1.306 | $0.360 | Common units | $ | 1.306 | $ | 0.581 | |||||||||||||||||||||||||||||||||||||||||||||||||||||
Subordinated units | $0.385 | $0.196 | Subordinated units | $ | 0.387 | $ | 0.573 | |||||||||||||||||||||||||||||||||||||||||||||||||||||
Net income per limited partner unit, diluted: | Net income per limited partner unit, diluted: | Net income per limited partner unit, diluted: | ||||||||||||||||||||||||||||||||||||||||||||||||||||||||||
Common units | $1.304 | $0.358 | Common units | $ | 1.305 | $ | 0.578 | |||||||||||||||||||||||||||||||||||||||||||||||||||||
Subordinated units | $0.385 | $0.196 | Subordinated units | $ | 0.387 | $ | 0.573 | |||||||||||||||||||||||||||||||||||||||||||||||||||||
Weighted average number of limited partner units outstanding, basic: | Weighted average number of limited partner units outstanding, basic: | Weighted average number of limited partner units outstanding, basic: | ||||||||||||||||||||||||||||||||||||||||||||||||||||||||||
Common units | 12,411,479 | 12,447,417 | Common units | 12,397,000 | 12,397,000 | |||||||||||||||||||||||||||||||||||||||||||||||||||||||
Subordinated units | 12,397,000 | 12,397,000 | Subordinated units | 12,397,000 | 12,397,000 | |||||||||||||||||||||||||||||||||||||||||||||||||||||||
Weighted average number of limited partner units outstanding, diluted: | Weighted average number of limited partner units outstanding, diluted: | Weighted average number of limited partner units outstanding, diluted: | ||||||||||||||||||||||||||||||||||||||||||||||||||||||||||
Common units | 12,397,000 | 12,397,000 | Common units | 12,410,073 | 12,445,073 | |||||||||||||||||||||||||||||||||||||||||||||||||||||||
Subordinated units | 12,397,000 | 12,397,000 | Subordinated units | 12,397,000 | 12,397,000 | |||||||||||||||||||||||||||||||||||||||||||||||||||||||
| | | Rhino Energy LLC Historical | Rhino Resource Partners LP Pro Forma Condensed Consolidated | | Rhino Energy LLC Historical | Rhino Resource Partners LP Pro Forma Condensed Consolidated | ||||||||||||||||||||||||||||||||||||||||||||||||||||
|---|---|---|---|---|---|---|---|---|---|---|---|---|---|---|---|---|---|---|---|---|---|---|---|---|---|---|---|---|---|---|---|---|---|---|---|---|---|---|---|---|---|---|---|---|---|---|---|---|---|---|---|---|---|---|---|---|---|---|
| | | Consolidated | Condensed Consolidated | | | | Consolidated | Condensed Consolidated | | | ||||||||||||||||||||||||||||||||||||||||||||||||
| | | Year Ended March 31, | Nine Months Ended December 31, | Year Ended December 31, | Three Months Ended March 31, | Year Ended December 31, | Three Months Ended March 31, | | Year Ended March 31, | Nine Months Ended December 31, | Year Ended December 31, | Six Months Ended June 30, | Year Ended December 31, | Six Months Ended June 30, | ||||||||||||||||||||||||||||||||||||||||||||
| | | | 2008 (as restated) | | | | 2008 (as restated) | | ||||||||||||||||||||||||||||||||||||||||||||||||||
| | | 2006 | 2006 | 2007 | 2009 | 2009 | 2010 | 2009 | 2010 | | 2006 | 2006 | 2007 | 2009 | 2009 | 2010 | 2009 | 2010 | ||||||||||||||||||||||||||||||||||||||||
| | | (in thousands, except per ton data) | | (in thousands, except per ton data) | ||||||||||||||||||||||||||||||||||||||||||||||||||||||
Statement of Cash Flows Data: | Statement of Cash Flows Data: | Statement of Cash Flows Data: | ||||||||||||||||||||||||||||||||||||||||||||||||||||||||
Net cash provided by (used in): | Net cash provided by (used in): | Net cash provided by (used in): | ||||||||||||||||||||||||||||||||||||||||||||||||||||||||
Operating activities | $ | 32,892 | $ | 36,860 | $ | 52,493 | $ | 57,211 | $ | 41,495 | $ | 3,274 | $ | 4,555 | Operating activities | $ | 32,892 | $ | 36,860 | $ | 52,493 | $ | 57,211 | $ | 41,495 | $ | 20,222 | $ | 24,871 | |||||||||||||||||||||||||||||
Investing activities | $ | (34,613 | ) | $ | (28,828 | ) | $ | (28,098 | ) | $ | (106,638 | ) | $ | (27,345 | ) | $ | (11,732 | ) | $ | (6,541 | ) | Investing activities | $ | (34,613 | ) | $ | (28,828 | ) | $ | (28,098 | ) | $ | (106,638 | ) | $ | (27,345 | ) | $ | (19,424 | ) | $ | (11,588 | ) | |||||||||||||||
Financing activities | $ | (1,887 | ) | $ | (9,141 | ) | $ | (21,192 | ) | $ | 47,781 | $ | (15,401 | ) | $ | 7,028 | $ | 1,647 | Financing activities | $ | (1,887 | ) | $ | (9,141 | ) | $ | (21,192 | ) | $ | 47,781 | $ | (15,401 | ) | $ | (2,292 | ) | $ | (13,781 | ) | |||||||||||||||||||
Other Financial Data: | Other Financial Data: | Other Financial Data: | ||||||||||||||||||||||||||||||||||||||||||||||||||||||||
EBITDA | EBITDA | $ | 50,560 | $ | 38,151 | $ | 66,917 | $ | 42,858 | $ | 61,964 | $ | 13,119 | $ | 15.779 | $ | 61,964 | $ | 15,779 | EBITDA | $ | 50,560 | $ | 38,151 | $ | 66,917 | $ | 42,858 | $ | 61,964 | $ | 30,125 | $ | 32,270 | $ | 61,964 | $ | 32,270 | ||||||||||||||||||||
Capital expenditures (1) | Capital expenditures (1) | $ | 66,373 | $ | 42,393 | $ | 32,773 | $ | 92,741 | $ | 29,657 | $ | 10,965 | $ | 6,637 | $ | 29,657 | $ | 6,637 | Capital expenditures (1) | $ | 66,373 | $ | 42,393 | $ | 32,773 | $ | 92,741 | $ | 29,657 | $ | 18,825 | $ | 11,498 | $ | 29,657 | $ | 11,498 | ||||||||||||||||||||
Balance Sheet Data (at period end): | Balance Sheet Data (at period end): | Balance Sheet Data (at period end): | ||||||||||||||||||||||||||||||||||||||||||||||||||||||||
Cash and cash equivalents | Cash and cash equivalents | $ | 1,489 | $ | 380 | $ | 3,583 | $ | 1,937 | $ | 687 | $ | 508 | $ | 347 | $ | 687 | $ | 347 | Cash and cash equivalents | $ | 1,489 | $ | 380 | $ | 3,583 | $ | 1,937 | $ | 687 | $ | 443 | $ | 188 | $ | 188 | ||||||||||||||||||||||
Property and equipment, net | Property and equipment, net | $ | 180,267 | $ | 197,056 | $ | 211,657 | $ | 282,863 | $ | 270,680 | $ | 283,685 | $ | 269,603 | $ | 270,680 | $ | 269,603 | Property and equipment, net | $ | 180,267 | $ | 197,056 | $ | 211,657 | $ | 282,863 | $ | 270,680 | $ | 278,124 | $ | 266,357 | $ | 266,357 | ||||||||||||||||||||||
Total assets | Total assets | $ | 246,759 | $ | 248,195 | $ | 275,992 | $ | 352,536 | $ | 339,985 | $ | 369,112 | $ | 347,488 | $ | 339,985 | $ | 347,488 | Total assets | $ | 246,759 | $ | 248,195 | $ | 275,992 | $ | 352,536 | $ | 339,985 | $ | 350,652 | $ | 340,897 | $ | 340,897 | ||||||||||||||||||||||
Total liabilities | Total liabilities | $ | 154,028 | $ | 153,307 | $ | 158,152 | $ | 234,225 | $ | 201,584 | $ | 248,825 | $ | 202,543 | $ | 134,634 | $ | 135,593 | Total liabilities | $ | 154,028 | $ | 153,307 | $ | 158,152 | $ | 234,225 | $ | 201,584 | $ | 225,027 | $ | 188,811 | $ | 121,178 | ||||||||||||||||||||||
Total debt | Total debt | $ | 87,764 | $ | 88,571 | $ | 83,954 | $ | 138,027 | $ | 122,137 | $ | 145,107 | $ | 123,833 | $ | 55,187 | $ | 56,883 | Total debt | $ | 87,764 | $ | 88,571 | $ | 83,954 | $ | 138,027 | $ | 122,137 | $ | 137,146 | $ | 108,454 | $ | 40,821 | ||||||||||||||||||||||
Members'/partners' equity | Members'/partners' equity | $ | 92,731 | $ | 94,887 | $ | 117,841 | $ | 118,311 | $ | 138,401 | $ | 120,287 | $ | 144,944 | $ | 205,351 | $ | 211,894 | Members'/partners' equity | $ | 92,731 | $ | 94,887 | $ | 117,841 | $ | 118,311 | $ | 138,401 | $ | 125,625 | $ | 152,086 | $ | 219,719 | ||||||||||||||||||||||
Operating Data (2): | Operating Data (2): | Operating Data (2): | ||||||||||||||||||||||||||||||||||||||||||||||||||||||||
Tons of coal sold | Tons of coal sold | 7,900 | 6,223 | 8,159 | 7,977 | 6,699 | 1,939 | 949 | 6,699 | 949 | Tons of coal sold | 7,900 | 6,223 | 8,159 | 7,977 | 6,699 | 3,696 | 2,042 | 6,699 | 2,042 | ||||||||||||||||||||||||||||||||||||||
Tons of coal produced/purchased | Tons of coal produced/purchased | 7,950 | 6,182 | 8,024 | 8,017 | 6,732 | 1,991 | 1,044 | 6,732 | 1,044 | Tons of coal produced/purchased | 7,950 | 6,182 | 8,024 | 8,017 | 6,732 | 3,742 | 2,176 | 6,732 | 2,176 | ||||||||||||||||||||||||||||||||||||||
Coal revenues per ton (3) | Coal revenues per ton (3) | $ | 44.48 | $ | 47.31 | $ | 48.30 | $ | 51.25 | $ | 59.98 | $ | 58.33 | $ | 65.98 | $ | 59.98 | $ | 65.98 | Coal revenues per ton (3) | $ | 44.48 | $ | 47.31 | $ | 48.30 | $ | 51.25 | $ | 59.98 | $ | 59.06 | $ | 66.96 | $ | 59.98 | $ | 66.96 | ||||||||||||||||||||
Cost of operations per ton (4) | Cost of operations per ton (4) | $ | 36.89 | $ | 38.28 | $ | 39.02 | $ | 45.75 | $ | 50.21 | $ | 50.69 | $ | 48.82 | $ | 50.21 | $ | 48.82 | Cost of operations per ton (4) | $ | 36.89 | $ | 38.28 | $ | 39.02 | $ | 45.75 | $ | 50.21 | $ | 49.66 | $ | 51.02 | $ | 50.21 | $ | 51.02 | ||||||||||||||||||||
| | Rhino Energy LLC Historical | |||||||||||||||||||||||
|---|---|---|---|---|---|---|---|---|---|---|---|---|---|---|---|---|---|---|---|---|---|---|---|---|
| | Consolidated | Condensed Consolidated | ||||||||||||||||||||||
| | Year Ended March 31, | Nine Months Ended December 31, | Year Ended December 31, | Three Months Ended March 31, | ||||||||||||||||||||
| | 2006 | 2006 | 2007 | 2008 | 2009 | 2009 | 2010 | |||||||||||||||||
| | (in thousands) | |||||||||||||||||||||||
Reconciliation of total capital expenditures to net cash used for capital expenditures: | ||||||||||||||||||||||||
Additions to property, plant and equipment | $ | 31,485 | $ | 32,701 | $ | 14,599 | $ | 78,076 | $ | 27,836 | $ | 9,144 | $ | 6,637 | ||||||||||
Acquisitions of coal companies and coal properties | 5,000 | — | 18,174 | 14,665 | 1,821 | 1,821 | — | |||||||||||||||||
Net cash used for capital expenditures | 36,485 | 32,701 | 32,773 | 92,741 | 29,657 | 10,965 | 6,637 | |||||||||||||||||
Plus: | ||||||||||||||||||||||||
Additions to property, plant and equipment financed through long-term borrowings | 29,888 | 9,692 | — | — | — | — | — | |||||||||||||||||
Total capital expenditures | $ | 66,373 | $ | 42,393 | $ | 32,773 | $ | 92,741 | $ | 29,657 | $ | 10,965 | $ | 6,637 | ||||||||||
| | Rhino Energy LLC Historical | |||||||||||||||||||||||
|---|---|---|---|---|---|---|---|---|---|---|---|---|---|---|---|---|---|---|---|---|---|---|---|---|
| | Consolidated | Condensed Consolidated | ||||||||||||||||||||||
| | Year Ended March 31, | Nine Months Ended December 31, | Year Ended December 31, | Six Months Ended June 30, | ||||||||||||||||||||
| | 2006 | 2006 | 2007 | 2008 | 2009 | 2009 | 2010 | |||||||||||||||||
| | (in thousands) | |||||||||||||||||||||||
Reconciliation of total capital expenditures to net cash used for capital expenditures: | ||||||||||||||||||||||||
Additions to property, plant and equipment | $ | 31,485 | $ | 32,701 | $ | 14,599 | $ | 78,076 | $ | 27,836 | $ | 17,004 | $ | 11,440 | ||||||||||
Acquisitions of coal companies and coal properties | 5,000 | — | 18,174 | 14,665 | — | — | 58 | |||||||||||||||||
Acquisition of roof bolt manufacturing company | — | — | — | — | 1,821 | 1,821 | — | |||||||||||||||||
Net cash used for capital expenditures | 36,485 | 32,701 | 32,773 | 92,741 | 29,657 | 18,825 | 11,498 | |||||||||||||||||
Plus: | ||||||||||||||||||||||||
Additions to property, plant and equipment financed through long-term borrowings | 29,888 | 9,692 | — | — | — | — | — | |||||||||||||||||
Total capital expenditures | $ | 66,373 | $ | 42,393 | $ | 32,773 | $ | 92,741 | $ | 29,657 | $ | 18,825 | $ | 11,498 | ||||||||||
Non-GAAP Financial Measure
EBITDA is used as a supplemental financial measure by management and by external users of our financial statements, such as investors, to assess:
EBITDA should not be considered an alternative to net income, income from operations, cash flows from operating activities or any other measure of financial performance or liquidity presented in accordance with GAAP. EBITDA excludes some, but not all, items that affect net income, income from operations and cash flows from operating activities, and these measures may vary among other companies.
EBITDA as presented below may not be comparable to similarly titled measures of other companies. The following table presents a reconciliation of EBITDA to the most directly comparable GAAP financial measures, on a historical basis and pro forma basis, as applicable, for each of the periods indicated.indicated:
| | Rhino Energy LLC Historical | Rhino Resource Partners LP Pro Forma Condensed Consolidated | ||||||||||||||||||||||||||||||||||||||||||||||||||||||||
|---|---|---|---|---|---|---|---|---|---|---|---|---|---|---|---|---|---|---|---|---|---|---|---|---|---|---|---|---|---|---|---|---|---|---|---|---|---|---|---|---|---|---|---|---|---|---|---|---|---|---|---|---|---|---|---|---|---|---|
| | | Rhino Energy LLC Historical | Rhino Resource Partners LP Pro Forma Condensed Consolidated | | Consolidated | Condensed Consolidated | | | ||||||||||||||||||||||||||||||||||||||||||||||||||
| | | Consolidated | Condensed Consolidated | | | | Year Ended March 31, | Nine Months Ended December 31, | Year Ended December 31, | | | Year Ended December 31, | Six Months Ended June 30, | |||||||||||||||||||||||||||||||||||||||||||||
| | | Year Ended March 31, | Nine Months Ended December 31, | Year Ended December 31, | Three Months Ended March 31, | Year Ended December 31, | Three Months Ended March 31, | | Six Months Ended June 30, | |||||||||||||||||||||||||||||||||||||||||||||||||
| | | | 2008 (as restated) | | | | 2008 (as restated) | | Six Months Ended June 30, | |||||||||||||||||||||||||||||||||||||||||||||||||
| | | 2006 | 2006 | 2007 | 2009 | 2009 | 2010 | 2009 | 2010 | | 2006 | 2006 | 2007 | 2009 | 2009 | 2010 | 2009 | 2010 | ||||||||||||||||||||||||||||||||||||||||
| | | (in thousands) | | (in thousands) | ||||||||||||||||||||||||||||||||||||||||||||||||||||||
Reconciliation of EBITDA to net income: | Reconciliation of EBITDA to net income: | Reconciliation of EBITDA to net income: | ||||||||||||||||||||||||||||||||||||||||||||||||||||||||
Net income | Net income | $ | 31,661 | $ | 3,057 | $ | 30,714 | $ | 929 | $ | 19,462 | $ | 1,976 | $ | 6,544 | $ | 21,394 | $ | 7,023 | Net income | $ | 31,661 | $ | 3,057 | $ | 30,714 | $ | 929 | $ | 19,462 | $ | 7,362 | $ | 13,686 | $ | 21,413 | $ | 14,592 | ||||||||||||||||||||
Plus: | Plus: | Plus: | ||||||||||||||||||||||||||||||||||||||||||||||||||||||||
Depreciation, depletion and amortization | 13,744 | 28,471 | 30,750 | 36,428 | 36,279 | 9,974 | 7,765 | 36,279 | 7,765 | Depreciation, depletion and amortization | 13,744 | 28,471 | 30,750 | 36,428 | 36,279 | 19,872 | 15,803 | 36,279 | 15,803 | |||||||||||||||||||||||||||||||||||||||
Interest expense | 4,976 | 6,498 | 5,579 | 5,501 | 6,222 | 1,170 | 1,471 | 4,291 | 992 | Interest expense | 4,976 | 6,498 | 5,579 | 5,501 | 6,222 | 2,891 | 2,781 | 4,271 | 1,875 | |||||||||||||||||||||||||||||||||||||||
Income tax expense | 178 | 125 | — | — | — | — | Income tax expense | 178 | 125 | — | — | — | — | — | — | — | ||||||||||||||||||||||||||||||||||||||||||
Less: | Less: | Less: | ||||||||||||||||||||||||||||||||||||||||||||||||||||||||
Income tax benefit | — | — | 126 | — | — | — | — | — | — | Income tax benefit | — | — | 126 | — | — | — | — | — | — | |||||||||||||||||||||||||||||||||||||||
EBITDA | EBITDA | $ | 50,560 | $ | 38,151 | $ | 66,917 | $ | 42,858 | $ | 61,964 | $ | 13,119 | $ | 15,779 | $ | 61,964 | $ | 15,779 | EBITDA | $ | 50,560 | $ | 38,151 | $ | 66,917 | $ | 42,858 | $ | 61,964 | $ | 30,125 | $ | 32,270 | $ | 61,964 | $ | 32,270 | ||||||||||||||||||||
Reconciliation of EBITDA to net cash provided by (used in) operating activities: | Reconciliation of EBITDA to net cash provided by (used in) operating activities: | Reconciliation of EBITDA to net cash provided by (used in) operating activities: | ||||||||||||||||||||||||||||||||||||||||||||||||||||||||
Net cash provided by (used in) operating activities | Net cash provided by (used in) operating activities | $ | 32,892 | $ | 36,860 | $ | 52,493 | $ | 57,211 | $ | 41,495 | $ | 3,274 | $ | 4,555 | Net cash provided by (used in) operating activities | $ | 32,892 | $ | 36,860 | $ | 52,493 | $ | 57,211 | $ | 41,495 | $ | 20,222 | $ | 24,871 | ||||||||||||||||||||||||||||
Plus: | Plus: | Plus: | ||||||||||||||||||||||||||||||||||||||||||||||||||||||||
Increase in net operating assets | 16,447 | 893 | 10,553 | — | 17,190 | 9,601 | 10,828 | Increase in net operating assets | 16,447 | 893 | 10,553 | — | 17,190 | 10,290 | 5,827 | |||||||||||||||||||||||||||||||||||||||||||
Decrease in provision for doubtful accounts | — | 283 | 175 | — | — | — | — | Decrease in provision for doubtful accounts | — | 283 | 175 | — | — | — | — | |||||||||||||||||||||||||||||||||||||||||||
Gain on sale of assets | 377 | — | 944 | — | — | — | 1 | Gain on sale of assets | 377 | — | 944 | — | — | — | 47 | |||||||||||||||||||||||||||||||||||||||||||
Gain on retirement of advance royalties | 237 | — | 115 | — | — | — | — | Gain on retirement of advance royalties | 237 | — | 115 | — | — | 77 | — | |||||||||||||||||||||||||||||||||||||||||||
Interest expense | 4,976 | 6,498 | 5,579 | 5,501 | 6,222 | 1,170 | 1,471 | Interest expense | 4,976 | 6,498 | 5,579 | 5,501 | 6,222 | 2,891 | 2,781 | |||||||||||||||||||||||||||||||||||||||||||
Income tax expense | 178 | 125 | — | — | — | Income tax expense | 178 | 125 | — | — | — | — | — | |||||||||||||||||||||||||||||||||||||||||||||
Settlement of litigation | — | — | — | — | 1,773 | — | — | Settlement of litigation | — | — | — | — | 1,773 | — | — | |||||||||||||||||||||||||||||||||||||||||||
Equity in net income of unconsolidated affiliate | — | — | — | — | 893 | — | — | Equity in net income of unconsolidated affiliate | — | — | — | — | 893 | — | 414 | |||||||||||||||||||||||||||||||||||||||||||
Less: | Less: | Less: | ||||||||||||||||||||||||||||||||||||||||||||||||||||||||
Decrease in net operating assets | — | — | — | 10,440 | — | — | — | Decrease in net operating assets | — | — | — | 10,440 | — | — | — | |||||||||||||||||||||||||||||||||||||||||||
Accretion on interest-free debt | 321 | 255 | 360 | 569 | 200 | 44 | 49 | Accretion on interest-free debt | 321 | 255 | 360 | 569 | 200 | 193 | 98 | |||||||||||||||||||||||||||||||||||||||||||
Amortization of advance royalties | 2,187 | 1,099 | 700 | 471 | 215 | 83 | 276 | Amortization of advance royalties | 2,187 | 1,099 | 700 | 471 | 215 | 156 | 374 | |||||||||||||||||||||||||||||||||||||||||||
Increase in provision for doubtful accounts | 354 | — | — | — | 19 | — | — | Increase in provision for doubtful accounts | 354 | — | — | — | 19 | — | — | |||||||||||||||||||||||||||||||||||||||||||
Loss on sale of assets | — | 746 | — | 451 | 1,710 | — | — | Loss on sale of assets | — | 746 | — | 451 | 1,710 | 1,288 | — | |||||||||||||||||||||||||||||||||||||||||||
Loss on retirement of advance royalties | — | 2,995 | — | 45 | 712 | — | 78 | Loss on retirement of advance royalties | — | 2,995 | — | 45 | 712 | — | 113 | |||||||||||||||||||||||||||||||||||||||||||
Income tax benefit | — | — | 126 | — | — | — | — | Income tax benefit | — | — | 126 | — | — | — | — | |||||||||||||||||||||||||||||||||||||||||||
Accretion on asset retirement obligations | 1,686 | 1,412 | 1,757 | 2,709 | 2,753 | 756 | 542 | Accretion on asset retirement obligations | 1,686 | 1,412 | 1,757 | 2,709 | 2,753 | 1,450 | 1,085 | |||||||||||||||||||||||||||||||||||||||||||
Equity in net loss of unconsolidated affiliate | — | — | — | 1,587 | — | 43 | 130 | Equity in net loss of unconsolidated affiliate | — | — | — | 1,587 | — | 268 | — | |||||||||||||||||||||||||||||||||||||||||||
Payment of abandoned public offering expenses (a) | — | — | — | 3,582 | — | — | — | Payment of abandoned public offering expenses (a) | — | — | — | 3,582 | — | — | — | |||||||||||||||||||||||||||||||||||||||||||
EBITDA | EBITDA | $ | 50,560 | $ | 38,151 | $ | 66,917 | $ | 42,858 | $ | 61,964 | $ | 13,119 | $ | 15,779 | EBITDA | $ | 50,560 | $ | 38,151 | $ | 66,917 | $ | 42,858 | $ | 61,964 | $ | 30,125 | $ | 32,270 | ||||||||||||||||||||||||||||
MANAGEMENT'S DISCUSSION AND ANALYSIS
OF FINANCIAL CONDITION AND RESULTS OF OPERATIONS
You should read the following discussion of the financial condition and results of operations of our predecessor, Rhino Energy LLC and its subsidiaries, in conjunction with the historical consolidated financial statements of Rhino Energy LLC and the unaudited pro forma condensed consolidated financial statements of Rhino Resource Partners LP included elsewhere in this prospectus. Among other things, those historical consolidated and unaudited pro forma condensed consolidated financial statements include more detailed information regarding the basis of presentation for the following information.
Overview
We are a growth-oriented Delaware limited partnership formed to control and operate coal properties and related assets. We produce, process and sell high quality coal of various steam and metallurgical grades. We market our steam coal primarily to electric utility companies as fuel for their steam-powered generators. Customers for our metallurgical coal are primarily steel and coke producers who use our coal to produce coke, which is used as a raw material in the steel manufacturing process.
For the year ended December 31, 2009, we generated revenues of approximately $419.8 million and net income of approximately $19.5 million. For the threesix months ended March 31,June 30, 2010, we generated revenues of approximately $66.6$145.0 million and net income of approximately $6.5$13.7 million. As of July 13,August 23, 2010, we had sales commitments for approximately 99%97% and 80%69% of our estimated coal production (including purchased coal to supplement our production and excluding results from the joint venture) for the year ending December 31, 2010 and the twelve months ending JuneSeptember 30, 2011, respectively.
We have a geographically diverse asset base with coal reserves located in Central Appalachia, Northern Appalachia, the Illinois Basin and the Western Bituminous region. As of March 31, 2010, we controlled an estimated 285.4 million tons of proven and probable coal reserves, consisting of an estimated 272.9 million tons of steam coal and an estimated 12.5 million tons of metallurgical coal. In addition, as of March 31, 2010, we controlled an estimated 122.2 million tons of non-reserve coal deposits. As of March 31, 2010, Rhino Eastern LLC, a joint venture in which we have a 51% membership interest and for which we serve as manager, controlled an estimated 22.4 million tons of proven and probable coal reserves at the Rhino Eastern mining complex located in Central Appalachia, consisting entirely of premium mid-vol and low-vol metallurgical coal, and an estimated 34.3 million tons of non-reserve coal deposits. Our and the joint venture's proven and probable coal reserves and non-reserve coal deposits were the same in all material respects as of December 31, 2009. We currently operate twelveeleven mines, including sevensix underground and five surface mines, located in Kentucky, Ohio, Colorado and West Virginia. In addition, the joint venture currently operates one underground mine in West Virginia. The number of mines that we operate may vary from time to time depending on a number of factors, including the demand for and price of coal, depletion of economically recoverable reserves and availability of experienced labor. Excluding results from the joint venture, for the year ended December 31, 2009, we produced approximately 4.7 million tons of coal, purchased approximately 2.0 million tons of coal and sold approximately 6.7 million tons of coal, approximately 99% of which was pursuant to supply contracts. Excluding results from the joint venture, for the threesix months ended March 31,June 30, 2010, we produced approximately 1.02.1 million tons of coal and sold approximately 0.92.0 million tons of coal, approximately 99%97% of which were pursuant to supply contracts. Additionally, the joint venture produced and sold approximately 0.2 million tons and approximately 0.1 million
tons of premium mid-vol metallurgical coal for the year ended December 31, 2009 and the three
six months ended March 31,June 30, 2010, respectively. We expect to continue selling a significant portion of our coal under supply contracts.
Since our predecessor's formation in 2003, we have significantly grown our coal reserves. Since April 2003, we have completed numerous coal asset acquisitions with a total purchase price of approximately $208.3 million. Through these acquisitions and coal lease transactions, we have substantially increased$223.3 million, including our proven and probable coal reserves and non-reserve coal deposits. We expect to complete the acquisition in August 2010 of certain mining assets of C.W. Mining Company out of bankruptcy for approximately $15.0 million.bankruptcy. The assets to be acquired are located in Emery and Carbon Counties, Utah and include coal reserves and non-reserve coal deposits, underground mining equipment and infrastructure, an overland belt conveyor system, a loading facility and support facilities. We intend to fund the asset acquisition with borrowings underThrough these acquisitions and coal lease transactions, we have substantially increased our credit agreement.proven and probable coal reserves and non-reserve coal deposits. One of our business strategies is to expand our operations through strategic acquisitions, including coal and non-coal natural resource assets. Such non-coal natural resource assets may include assets that will serve as a natural hedge to help mitigate our exposure to certain operating costs, such as diesel fuel.
Our results of operations in the near term could be impacted by a number of factors, including (1) adverse weather conditions and natural disasters, (2) poor mining conditions resulting from geological conditions or the effects of prior mining, (3) equipment problems at mining locations, (4) the availability of transportation for coal shipments or (5) the availability and costs of key supplies and commodities such as steel, diesel fuel and explosives. On a long-term basis, our results of operations could be impacted by, among other factors, (1) changes in governmental regulation of the mining industry or the electric utility industry, (2) the availability and prices of competing electricity-generation fuels, (3) our ability to secure or acquire high-quality coal reserves and (4) our ability to find buyers for coal under favorable supply contracts. We have historically sold a majority of our coal through supply contracts and anticipate that we will continue to do so. During the year ended December 31, 2008, we entered into certain sales contracts at favorable prices. Sales under these contracts had a significant impact on revenues for the year ended December 31, 2009 and for threesix months ended March 31,June 30, 2010. We have remaining commitments under these contracts of approximately 0.9 million tons of coal at an average price of approximately $90 per ton for the remainder of the year ended December 31, 2010 and 0.4 million tons at an average price of $92 per ton for each of the years ended December 31, 2011, 2012 and 2013.
We conduct business through four reportable business segments: Central Appalachia, Northern Appalachia, Eastern Met and Other. Our Central Appalachia segment consists of three mining complexes: Tug River, Rob Fork and Deane, which, as of March 31,June 30, 2010, together included four underground mines, three surface mines and three preparation plants and loadout facilities in eastern Kentucky and southern West Virginia. Our Northern Appalachia segment consists of the Hopedale mining complex, the Sands Hill mining complex, the Leesville field and the Springdale field. The Hopedale mining complex, located in southern Ohio, included one underground mine and one preparation plant and loadout facility as of March 31,June 30, 2010. Our Sands Hill mining complex, located in northern Ohio, included two surface mines, a preparation plant and a river terminal as of March 31,June 30, 2010. The Eastern Met segment includes our 51% equity interest in the results of operations of the joint venture, which owns the Rhino Eastern mining complex, located in West Virginia, and for which we serve as manager. ThisAs of June 30, 2010, this complex iswas comprised of a singleone underground mine and a preparation plant and loadout facility (owned by our joint venture partner). For the year ended December 31, 2009 and the threesix months ended March 31,June 30, 2010, our Other segment included the results of our operations of our underground mine in the Western Bituminous region, our coal reserves in the Illinois Basin and our ancillary businesses. These ancillary businesses include a roof bolt manufacturing operation
businesses. These ancillaryand various businesses that provide support services such as reclamation, maintenance and transportation, the cost of which is reflected in our cost of operations.
Recent Trends and Economic Factors Affecting the Coal Industry
Our coal revenues depend on the price at which we are able to sell our coal. Any decrease in coal prices due to, among other reasons, the supply of domestic and foreign coal, the demand for electricity or the price and availability of alternative fuels for electricity generation could adversely affect our results of operations. Please read "The Coal Industry." In addition, our results of operations depend on the cost of coal production. We are experiencing increased operating costs for steel, health care and insurance. Recently, low interest rates have resulted in an increase in the present value of employee-benefit-related liabilities and therefore have increased our employee-benefit-related expenses. Increases in the costs of regulatory compliance could also adversely impact results of operations.
In recent years, certain trends and economic factors affecting the coal industry have emerged, garnering the attention of industry participants. Such factors include the following:
large part to demographic changes as existing miners retire at a faster rate than new miners are entering the workforce. If the shortage of experienced labor continues or worsens or coal producers are unable to train enough skilled laborers, there could be an adverse impact on labor productivity and an increase in our costs, our ability to expand production may be limited.
For additional information regarding some of the risks and uncertainties that affect our business and the industry in which we operate, please read "Risk Factors."
Results of Operations
Evaluating Our Results of Operations
Our management uses a variety of financial measurements to analyze our performance, including (1) EBITDA, (2) coal revenues per ton and (3) cost of operations per ton.
EBITDA. The discussion of our results of operations below includes references to, and analysis of, our segments' EBITDA results. EBITDA represents net income before deducting interest expense, income taxes and depreciation, depletion and amortization. EBITDA is used by management primarily as a measure of our segments' operating performance. Because not all companies calculate EBITDA identically, our calculation may not be comparable to similarly titled measures of other companies. Please read "—Reconciliation of EBITDA to Net Income by Segment" for reconciliations of EBITDA to net income for each of the periods indicated.
Coal Revenues Per Ton. Coal revenues per ton represents coal revenues divided by tons of coal sold. Coal revenues per ton is a key indicator of our effectiveness in obtaining favorable prices for our product.
Cost of Operations Per Ton. Cost of operations per ton sold represents the cost of operations (exclusive of depreciation, depletion and amortization) divided by tons of coal sold. Management uses this measurement as a key indicator of the efficiency of operations.
Public Company Expenses
We believe that our selling, general and administrative expenses will increase as a result of becoming a publicly traded partnership following this offering. This increase will be due to the increased accounting support services, filing annual and quarterly reports with the SEC, increased audit fees, investor relations, directors' fees, directors' and officers' insurance, legal fees, stock exchange listing fees and registrar and transfer agent fees. Our financial statements following this offering will reflect the impact of these increased expenses and will affect the comparability of our financial statements with periods prior to the completion of this offering.
The Joint Venture
We have historically accounted for the results of operations for the joint venture, Rhino Eastern LLC, using the equity method. Using the equity method, we recognize our proportionate share of the investees' net income as a single component of other income. For this reason, the historical and pro forma results of operations reported for the joint venture are only included in
our presentation and analyses of net income and EBITDA. We consider the operations at the Rhino Eastern mining complex as one of our reportable segments and, accordingly, present limited additional detail related to the results of operations of our Rhino Eastern mining complex in Note 15 to the Rhino Energy LLC unaudited historical condensed consolidated
financial statements and Note 17 to the Rhino Energy LLC audited historical consolidated financial statements included elsewhere in this prospectus.
Restatement of Audited Consolidated Financial Statements for the Year Ended December 31, 2008
Subsequent to the audit of our consolidated financial statements for the year ended December 31, 2009, our independent registered public accounting firm identified a deficiency in our internal control over financial reporting as a result of a restatement of our consolidated financial statements as of December 31, 2008 which constituted a material weakness. For information on the restatement of our audited consolidated financial statements as of and for the year ended December 31, 2008, please read Note 18 to the Rhino Energy LLC audited historical audited consolidated financial statements included elsewhere in this prospectus and "Risk Factors—Risks Inherent in an Investment in Us—We cannot provide absolute assurance as to our ability to establish and maintain effective internal controls in accordance with applicable federal securities laws and regulations, and we may incur significant costs in our efforts." We have taken measures to improve our internal controlcontrols over financial reporting to help ensure that material weaknesses resulting in a material misstatement of our financial statements do not occur in the future.
ThreeSix Months Ended March 31,June 30, 2010 Compared to ThreeSix Months Ended March 31,June 30, 2009
Summary. For the threesix months ended March 31,June 30, 2010, our total revenues decreased to $66.6$145.0 million from $116.7$226.1 million for the threesix months ended March 31,June 30, 2009. The decrease was primarily due to a decrease in demand for our production of both steam coal and metallurgical coal. We reduced our overall production of coal by 0.7 million tons to 2.1 million tons for the six months ended June 30, 2010 as various consumerscompared to 2.8 million tons for the six months ended June 30, 2009. We suspended or reduced production at specific mines in response to market conditions and businesses used less electricity and a decrease in demand for our metallurgical coalhave the ability to restart production at these operations quickly as a result of decreased steel production. As a result of this decreased demand,market conditions improve. In addition, we sold 1.0purchased 0.1 million tons of coal for the threesix months ended March 31,June 30, 2010 as compared to 1.1 million tons of purchased coal for the six months ended June 30, 2009 and increased our coal inventory by 0.1 million tons. This increase in inventory was the result of temporary delays in rail service.
As a result of these changes, we sold 2.0 million tons of coal for the six months ended June 30, 2010, which is 1.01.7 million fewer tons, or 51.1%44.7% less, than the 2.03.7 million tons of coal sold for the threesix months ended March 31, 2009. In response to the decrease in demand, we reduced our overall production of coal by 0.6 million tons to 1.0 million tons for the three months ended March 31, 2010 as compared to 1.6 million tons for the three months ended March 31, 2009. We reduced production by idling certain less profitable surface operations. In addition, we did not purchase any coal for the three months ended March 31, 2010 as compared to 0.4 million tons of purchased coal for the three months ended March 31,June 30, 2009. Despite the decrease in the number of tons that we produced and sold, both net income and EBITDA increased for the threesix months ended March 31,June 30, 2010 from the threesix months ended March 31,June 30, 2009. Net income increased to $6.6 million from $2.0$13.7 million for the threesix months ended March 31,June 30, 2010 from $7.4 million for the six months ended June 30, 2009, and EBITDA increased to $15.8$32.3 million for the threesix months ended March 31,June 30, 2010 from $13.1$30.1 million for the threesix months ended March 31,June 30, 2009. These increases in net income and EBITDA were due to the sale of higher quality coal and to our successful efforts to control cost of operations.
Tons Sold. The following table presents tons of coal sold by reportable segment for the threesix months ended March 31,June 30, 2009 and 2010:
| | | | Increase (Decrease) | | | Increase (Decrease) | ||||||||||||||||||||
|---|---|---|---|---|---|---|---|---|---|---|---|---|---|---|---|---|---|---|---|---|---|---|---|---|---|---|
| | Three Months Ended March 31, 2009 | Three Months Ended March 31, 2010 | Six Months Ended June 30, 2009 | Six Months Ended June 30, 2010 | ||||||||||||||||||||||
| Segment | Tons | % * | Tons | % * | ||||||||||||||||||||||
| | (in millions, except %) | (in millions, except %) | ||||||||||||||||||||||||
Central Appalachia | 1.3 | 0.4 | (0.9 | ) | (69.2 | )% | 2.4 | 1.0 | (1.4 | ) | (59.9 | )% | ||||||||||||||
Northern Appalachia | 0.6 | 0.5 | (0.1 | ) | (11.8 | )% | 1.1 | 1.0 | (0.1 | ) | (14.5 | )% | ||||||||||||||
Other | 0.1 | 0.1 | — | (28.4 | )% | 0.1 | 0.1 | — | (26.0 | )% | ||||||||||||||||
Total *† | 2.0 | 0.9 | (1.1 | ) | (51.1 | )% | 3.7 | 2.0 | (1.7 | ) | (44.7 | )% | ||||||||||||||
We sold 0.92.0 million tons of coal in the threesix months ended March 31,June 30, 2010 as compared to the 2.03.7 million tons sold in the threesix months ended March 31,June 30, 2009. This decrease in tons sold was primarily due to lower demand for coal in our Central Appalachia segment. Tons of coal sold in this segment decreased by 0.91.4 million, or 69.2%59.9%, to 0.41.0 million tons for the threesix months ended March 31,June 30, 2010 from 1.32.4 million tons for the threesix months ended March 31,June 30, 2009. For our Northern Appalachia segment, tons of coal sold decreased from 0.61.1 million tons for the threesix months ended March 31,June 30, 2009 to 0.51.0 million tons for the threesix months ended March 31,June 30, 2010. This decrease was also the result of a decrease in demand for coal in our Northern Appalachiathe segment. SalesCoal sales from our Other segment remained relatively steady at 0.1 milliondecreased from approximately 148,000 tons for the threesix months ended March 31,June 30, 2009 and 2010.to approximately 110,000 tons for the six months ended June 30, 2010, also due to decreased demand.
Revenues. The following table presents revenues and coal revenues per ton by reportable segment for the threesix months ended March 31,June 30, 2009 and 2010:
| | | | | Increase (Decrease) | | | | Increase (Decrease) | ||||||||||||||||||||
|---|---|---|---|---|---|---|---|---|---|---|---|---|---|---|---|---|---|---|---|---|---|---|---|---|---|---|---|---|
| | | Three Months Ended March 31, 2009 | Three Months Ended March 31, 2010 | | Six Months Ended June 30, 2009 | Six Months Ended June 30, 2010 | ||||||||||||||||||||||
| Segment | Segment | $ | % * | Segment | $ | % * | ||||||||||||||||||||||
| | | (in millions, except per ton data and %) | | (in millions, except per ton data and %) | ||||||||||||||||||||||||
Central Appalachia | Central Appalachia | Central Appalachia | ||||||||||||||||||||||||||
Coal revenues | $ | 85.0 | $ | 38.5 | $ | (46.5 | ) | (54.7 | )% | Coal revenues | $ | 162.3 | $ | 89.9 | $ | (72.4 | ) | (44.6 | )% | |||||||||
Freight and handling revenues | — | — | — | — | Freight and handling revenues | — | — | — | — | |||||||||||||||||||
Other revenues | 0.2 | 0.1 | (0.1 | ) | (61.4 | )% | Other revenues | 0.4 | 0.4 | — | (3.7 | )% | ||||||||||||||||
Total revenues | $ | 85.2 | $ | 38.6 | $ | (46.6 | ) | (54.7 | )% | Total revenues | $ | 162.7 | $ | 90.3 | $ | (72.4 | ) | (44.5 | )% | |||||||||
Coal revenues per ton * | 65.19 | 95.80 | 30.62 | 47.0 | % | Coal revenues per ton * | $ | 66.96 | $ | 92.44 | $ | 25.48 | 38.1 | % | ||||||||||||||
Northern Appalachia | Northern Appalachia | Northern Appalachia | ||||||||||||||||||||||||||
Coal revenues | $ | 24.8 | $ | 21.7 | $ | (3.1 | ) | (12.5 | )% | Coal revenues | $ | 49.6 | $ | 42.1 | $ | (7.5 | ) | (15.2 | )% | |||||||||
Freight and handling revenues | 1.2 | 0.9 | (0.3 | ) | (21.1 | )% | Freight and handling revenues | 2.5 | 1.9 | (0.6 | ) | (22.1 | )% | |||||||||||||||
Other revenues | 1.5 | 1.4 | (0.1 | ) | (7.1 | )% | Other revenues | 3.0 | 2.7 | (0.3 | ) | (10.7 | )% | |||||||||||||||
Total revenues | $ | 27.5 | $ | 24.0 | $ | (3.5 | ) | (12.6 | )% | Total revenues | $ | 55.1 | $ | 46.7 | $ | (8.4 | ) | (15.3 | )% | |||||||||
Coal revenues per ton * | 44.50 | 44.14 | (0.35 | ) | (0.8 | )% | Coal revenues per ton * | $ | 44.20 | $ | 43.83 | $ | (0.37 | ) | (0.8 | )% | ||||||||||||
| | | | | Increase (Decrease) | | | | Increase (Decrease) | ||||||||||||||||||||
|---|---|---|---|---|---|---|---|---|---|---|---|---|---|---|---|---|---|---|---|---|---|---|---|---|---|---|---|---|
| | | Three Months Ended March 31, 2009 | Three Months Ended March 31, 2010 | | Six Months Ended June 30, 2009 | Six Months Ended June 30, 2010 | ||||||||||||||||||||||
| Segment | Segment | $ | % * | Segment | $ | % * | ||||||||||||||||||||||
| | | (in millions, except per ton data and %) | | (in millions, except per ton data and %) | ||||||||||||||||||||||||
Other | Other | Other | ||||||||||||||||||||||||||
Coal revenues | $ | 3.3 | $ | 2.4 | $ | (0.9 | ) | (26.5 | )% | Coal revenues | $ | 6.3 | $ | 4.8 | $ | (1.5 | ) | (23.8 | )% | |||||||||
Freight and handling revenues | — | — | — | — | Freight and handling revenues | — | — | — | — | |||||||||||||||||||
Other revenues | 0.7 | 1.6 | 0.9 | 130.9 | % | Other revenues | 1.9 | 3.3 | 1.4 | 69.8 | % | |||||||||||||||||
Total revenues | $ | 4.0 | $ | 4.0 | $ | — | Total revenues | $ | 8.2 | $ | 8.1 | $ | (0.1 | ) | (1.8 | )% | ||||||||||||
Coal revenues per ton * | 42.54 | 43.68 | 1.14 | 2.7 | % | Coal revenues per ton * | $ | 42.43 | $ | 43.67 | $ | 1.23 | 2.9 | % | ||||||||||||||
Total | Total | Total | ||||||||||||||||||||||||||
Coal revenues | $ | 113.1 | $ | 62.6 | $ | (50.5 | ) | $ | (44.6 | )% | Coal revenues | $ | 218.3 | $ | 136.7 | $ | (81.4 | ) | (37.4 | )% | ||||||||
Freight and handling revenues | 1.2 | 0.9 | (0.3 | ) | (21.1 | )% | Freight and handling revenues | 2.5 | 1.9 | (0.6 | ) | (22.1 | )% | |||||||||||||||
Other revenues | 2.4 | 3.1 | 0.7 | 26.8 | % | Other revenues | 5.3 | 6.4 | 1.1 | 9.2 | % | |||||||||||||||||
Total revenues | $ | 116.7 | $ | 66.6 | $ | (50.1 | ) | (42.9 | )% | Total revenues | $ | 226.1 | $ | 145.0 | $ | (81.1 | ) | (35.9 | )% | |||||||||
Coal revenues per ton * | 58.33 | 65.98 | 7.66 | 13.1 | % | Coal revenues per ton * | $ | 59.06 | $ | 66.96 | $ | 7.90 | 13.4 | % | ||||||||||||||
Our total revenues for the threesix months ended March 31,June 30, 2010 decreased by $50.1$81.1 million, or 42.9%35.9%, to $66.6$145.0 million from $116.7$226.1 million for the threesix months ended March 31,June 30, 2009. The decline in total revenues was due to a decrease in demand for both steam and metallurgical coal. Coal revenues per ton were $65.98$66.96 for the quartersix months ended March 31,June 30, 2010, an increase of $7.66,$7.90, or 13.1%13.4%, from $58.33$59.06 per ton for the quartersix months ended March 31,June 30, 2009. This increase in coal revenues per ton was primarily the result of the sale of higher quality coal at a higher price per ton.
For our Central Appalachia segment, coal revenues decreased by $46.5$72.4 million, or 54.7%44.6%, to $38.5$89.9 million for the threesix months ended March 31,June 30, 2010 from $85.0$162.3 million for the threesix months ended March 31,June 30, 2009 due to fewer tons of coal sold in the first six months of 2010. Coal revenues per ton for our Central Appalachia segment increased by $30.62,$25.48, or 47.0%38.1%, to $95.80$92.44 per ton for the threesix months ended March 31,June 30, 2010 as compared to $65.19$66.96 for the threesix months ended March 31,June 30, 2009, due to increased sales of metallurgical coal at a higher price per ton.
For our Northern Appalachia segment, coal revenues were $21.7$42.1 million for the threesix months ended March 31,June 30, 2010, a decrease of $3.1$7.5 million, or 12.5%15.2%, from $24.8$49.6 million for the threesix months ended March 31,June 30, 2009, as a result of a decrease in demand. Coal revenues per ton for our Northern Appalachia segment decreased by $0.35,$0.37, or 0.8%, to $44.14$43.83 per ton for the threesix months ended March 31,June 30, 2010 as compared to $44.50$44.20 per ton for the threesix months ended March 31,June 30, 2009. This decrease was primarily due to variations in the amount of coal sold under existing coal supply contracts.
For our Other segment, coal revenues decreased by $0.9$1.5 million, or 26.5%23.8%, to $2.4$4.8 million for the threesix months ended March 31,June 30, 2010 from $3.3$6.3 million for the threesix months ended March 31,June 30, 2009. Coal revenues per ton for our Other segment were $43.68$43.67 for the threesix months ended March 31,June 30, 2010, an increase of $1.14,$1.23, or 2.7%2.9%, from $42.54$42.43 for the threesix months ended March 31,June 30, 2009 as a result of escalation provisions includeddue to an increase in the selling price to our contracts.primary customer for coal produced from our McClane Canyon mine. Other revenues for our Other segment increased by $0.9$1.4 million for the threesix months ended March 31,June 30, 2010 from the threesix months ended March 31,June 30, 2009. This increase was
primarily due to a $0.6$0.9 million increase in sales revenue from our roof supportbolt manufacturing company and a $0.2$0.3 million increase in revenue from the provision of oilfield services.
Costs and Expenses. The following table presents costs and expenses (including the cost of purchased coal) and cost of operations per ton by reportable segment for the threesix months ended March 31,June 30, 2009 and 2010:
| | | | Increase (Decrease) | | | Increase (Decrease) | ||||||||||||||||||||
|---|---|---|---|---|---|---|---|---|---|---|---|---|---|---|---|---|---|---|---|---|---|---|---|---|---|---|
| | Three Months Ended March 31, 2009 | Three Months Ended March 31, 2010 | Six Months Ended June 30, 2009 | Six Months Ended June 30, 2010 | ||||||||||||||||||||||
| Segment | $ | % * | $ | % * | ||||||||||||||||||||||
| | (in millions, except per ton data and %) | (in millions, except per ton data and %) | ||||||||||||||||||||||||
Central Appalachia | ||||||||||||||||||||||||||
Cost of operations (exclusive of depreciation, depletion and amortization shown separately below) | $ | 76.9 | $ | 24.6 | $ | (52.3 | ) | (68.1 | )% | $ | 139.6 | $ | 60.9 | $ | (78.7 | ) | (56.4 | )% | ||||||||
Freight and handling costs | — | — | — | — | — | — | — | — | ||||||||||||||||||
Depreciation, depletion and amortization | 6.8 | 4.7 | (2.1 | ) | (31.0 | )% | 13.6 | 9.5 | (4.1 | ) | (30.3 | )% | ||||||||||||||
Selling, general and administrative | 4.1 | 3.4 | (0.7 | ) | (17.1 | )% | 8.4 | 7.1 | (1.3 | ) | (16.1 | )% | ||||||||||||||
Cost of operations per ton * | $ | 58.96 | $ | 61.09 | $ | 2.13 | 3.6 | % | $ | 57.59 | $ | 62.64 | $ | 5.05 | 8.8 | % | ||||||||||
Northern Appalachia | ||||||||||||||||||||||||||
Cost of operations (exclusive of depreciation, depletion and amortization shown separately below) | $ | 17.8 | $ | 17.1 | $ | (0.7 | ) | (3.8 | )% | $ | 36.6 | $ | 33.1 | $ | (3.5 | ) | (9.4 | )% | ||||||||
Freight and handling costs | 0.9 | 0.6 | (0.2 | ) | (28.2 | )% | 2.0 | 1.4 | (0.6 | ) | (26.9 | )% | ||||||||||||||
Depreciation, depletion and amortization | 2.1 | 1.9 | (0.2 | ) | (8.0 | )% | 4.0 | 4.0 | — | (0.1 | )% | |||||||||||||||
Selling, general and administrative | 0.1 | 0.1 | — | (19.2 | )% | 0.2 | 0.2 | — | (8.4 | )% | ||||||||||||||||
Cost of operations per ton * | $ | 31.92 | $ | 34.82 | $ | 2.90 | 9.1 | % | $ | 32.59 | $ | 34.53 | $ | 1.94 | 6.0 | % | ||||||||||
Other | ||||||||||||||||||||||||||
Cost of operations (exclusive of depreciation, depletion and amortization shown separately below) | $ | 3.6 | $ | 4.7 | $ | 1.1 | 28.8 | % | $ | 7.3 | $ | 10.2 | $ | 2.9 | 39.0 | % | ||||||||||
Freight and handling costs | — | — | — | — | — | — | — | — | ||||||||||||||||||
Depreciation, depletion and amortization | 1.1 | 1.2 | 0.1 | 5.7 | % | 2.3 | 2.3 | — | 2.7 | % | ||||||||||||||||
Selling, general and administrative | 0.2 | 0.2 | — | 14.1 | % | 0.4 | 0.4 | — | (3.5 | )% | ||||||||||||||||
Cost of operations per ton ** | n/a | n/a | n/a | n/a | n/a | n/a | n/a | n/a | ||||||||||||||||||
Total | ||||||||||||||||||||||||||
Cost of operations (exclusive of depreciation, depletion and amortization shown separately below) | $ | 98.3 | $ | 46.4 | (51.9 | ) | (52.9 | )% | $ | 183.5 | $ | 104.2 | $ | (79.3 | ) | (43.2 | )% | |||||||||
Freight and handling costs | 0.9 | 0.6 | (0.3 | ) | (28.2 | )% | 2.0 | 1.4 | (0.6 | ) | (26.9 | )% | ||||||||||||||
Depreciation, depletion and amortization | 10.0 | 7.8 | (2.2 | ) | (22.2 | )% | 19.9 | 15.8 | (4.1 | ) | (20.5 | )% | ||||||||||||||
Selling, general and administrative | 4.4 | 3.7 | (0.7 | ) | (16.0 | )% | 9.0 | 7.6 | 1.4 | (15.4 | )% | |||||||||||||||
Cost of operations per ton * | $ | 50.69 | $ | 48.82 | (1.87 | ) | (3.7 | )% | $ | 49.66 | $ | 51.02 | $ | 1.37 | 2.8 | % | ||||||||||
Cost of Operations. Total cost of operations was $46.4$104.2 million for the threesix months ended March 31,June 30, 2010 as compared to $98.3$183.5 million for the threesix months ended March 31,June 30, 2009, primarily as a result of a 0.60.7 million ton decrease in the amount of coal produced for the quartersix months ended March 31,June 30, 2010 as compared to the same period in 2009. Our cost of operations per ton was $48.82$51.02 for the threesix months ended March 31,June 30, 2010, a decreasean increase of $1.87,$1.37, or 3.7%2.8%, from the threesix months ended March 31,June 30, 2009. This overall decreaseincrease in the cost of operations on a per ton basis was primarily due to the production of a higher percentage of our coalincreased "per ton" costs in our Central Appalachia and Northern Appalachia segmentsegments described below for the threesix months ended March 31,June 30, 2010 as compared to the threesix months ended March 31,June 30, 2009.
Our cost of operations for the Central Appalachia segment decreased by $52.3$78.7 million, or 68.1%56.4%, to $24.6$60.9 million for the threesix months ended March 31,June 30, 2010 from $76.9$139.6 million for the threesix months ended March 31,June 30, 2009, primarily resulting from decreases in coal production. Our cost of operations per ton however increased to $61.09$62.64 per ton for the threesix months ended March 31,June 30, 2010 from $58.96$57.59 per ton for threesix months ended March 31,June 30, 2009. This increase in cost of operations per ton was primarily due to higher cost of labor, employee benefits and outside services, allocated across fewer tons of coal sold,taxes and insurance and royalty costs, offset by reductions in the cost of diesel fuel and repairs and maintenance.
In our Northern Appalachia segment, our cost of operations decreased by $0.7$3.5 million, or 3.8%9.4%, to $17.1$33.1 million for the threesix months ended March 31,June 30, 2010 from $17.8$36.6 million for the threesix months ended March 31,June 30, 2009, primarily due to a decrease in the number of tons produced in the first quartersix months of 2010. Our cost of operations per ton increased to $34.82$34.53 for the threesix months ended March 31,June 30, 2010 from $31.92$32.59 for the threesix months ended March 31,June 30, 2009, an increase of $2.90$1.94 per ton, or 9.1%6.0%. This increase in cost of operations per ton was primarily due to higher costcosts of labor, employee benefitsoutside services and outside servicesmaintenance costs allocated across fewer tons of coal sold.
In addition, we experienced an increase in roof support costs per ton due to difficult mining conditions. Cost of operations in our Other segment increased by $1.1$2.9 million for the threesix months ended March 31,June 30, 2010 as compared to the threesix months ended March 31,June 30, 2009. This increase was primarily due to additional reclamationoperating costs incurred by our ancillary service companies and development costs relating to new roof support products at our roof supportbolt manufacturing company.
Freight and Handling. Total freight and handling cost for the threesix months ended March 31,June 30, 2010 decreased by $0.3$0.6 million, or 28.2%26.9%, to $0.6$1.4 million from $0.9$2.0 million for the threesix months ended March 31,June 30, 2009. This decrease was primarily due to a decrease of 1.01.7 million tons of coal sold for the threesix months ended March 31,June 30, 2010 as compared to the threesix months ended March 31,June 30, 2009.
Depreciation, Depletion and Amortization. Total depreciation, depletion and amortization, or DD&A, expense for the threesix months ended March 31,June 30, 2010 was $7.8$15.8 million as compared to $10.0$19.9 million for the threesix months ended March 31,June 30, 2009.
For the threesix months ended March 31,June 30, 2010, our depreciation cost was $6.6$13.4 million as compared to $7.4$15.5 million for the threesix months ended March 31,June 30, 2009. The decrease in depreciation cost in 2010 was primarily due to the disposal and idling of assets at certain less profitable surface mining operations.
For the threesix months ended March 31,June 30, 2010, our depletion cost was $0.5$1.0 million as compared to $0.8$1.4 million for the threesix months ended March 31,June 30, 2009. The decrease in depletion cost in 20092010 was primarily a result of the decrease in the number of tons of coal produced for the threesix months ended March 31,June 30, 2010. Depletion is applied on a per ton basis as coal is produced and decreases as production decreases.
For the three months ended March 31, 2010, our amortization cost was $0.7 million as compared to $1.7 million for the three months ended March 31, 2009. This decrease is primarily
For the six months ended June 30, 2010, our amortization cost was $1.4 million as compared to $3.0 million for the six months ended June 30, 2009. This decrease is primarily attributable to an overall decrease in production and a concurrent reduction in the allocationamortization of certain mine development and asset retirement costs based on the lower number of tons of coal produced.
Selling, General and Administrative. SG&A expense for the threesix months ended March 31,June 30, 2010 was $3.7$7.6 million as compared to $4.4$9.0 million for the threesix months ended March 31,June 30, 2009. This decrease in SG&A expense was primarily due to a $0.6 million reduction in uncollectible accounts for the six months ended June 30, 2010 as compared to the six months ended June 30, 2009 and to our successful efforts to reduce administrative costs. These efforts resulted in a decrease in administrative labor costs of $0.5$0.3 million, a decrease in legal fees of $0.1 million and a decrease in professional fees and servicesrent of $0.2$0.1 million.
Interest Expense. Interest expense for the threesix months ended March 31,June 30, 2010 was $1.5$2.8 million as compared to $1.2$2.9 million for the threesix months ended March 31,June 30, 2009, an increasea decrease of $0.3$0.1 million, or 25.7%.This increase3.8%. This decrease was primarily the result of an increasea reduction in the interest rate applicablebalance due under our credit facility, as amended on March 31, 2009.
Income Tax Expense (Benefit). For the three months ended March 31, 2009 and 2010, we operated as a partnership and, as such, were not subject to federal income tax. For the three months ended March 31, 2009 and 2010, we did not operate in any state or local jurisdictions that imposed an income tax on partnerships.facility.
Net Income (Loss). The following table presents net income (loss) by reportable segment for the threesix months ended March 31,June 30, 2009 and 2010:
| Segment | Three Months Ended March 31, 2009 | Three Months Ended March 31, 2010 | Increase (Decrease) | Six Months Ended June 30, 2009 | Six Months Ended June 30, 2010 | Increase (Decrease) | ||||||||||||||
|---|---|---|---|---|---|---|---|---|---|---|---|---|---|---|---|---|---|---|---|---|
| | (in millions) | (in millions) | ||||||||||||||||||
Central Appalachia | $ | (4.1 | ) | $ | 4.7 | $ | 8.8 | $ | (3.7 | ) | $ | 10.2 | $ | 13.9 | ||||||
Northern Appalachia | 5.4 | 2.6 | (2.8 | ) | 9.8 | 4.6 | (5.2 | ) | ||||||||||||
Eastern Met * | — | (0.1 | ) | (0.1 | ) | (0.3 | ) | 0.4 | 0.7 | |||||||||||
Other | 0.7 | (0.6 | ) | (1.3 | ) | 1.6 | (1.5 | ) | (3.1 | ) | ||||||||||
Total | $ | 2.0 | $ | 6.6 | $ | 4.6 | $ | 7.4 | $ | 13.7 | $ | 6.3 | ||||||||
For the threesix months ended March 31,June 30, 2010, total net income increased to $6.6$13.7 million from $2.0$7.4 million for the threesix months ended March 31,June 30, 2009. This increase was primarily due to the sale of higher quality coal and our successful cost containment efforts. For our Central Appalachia segment, net income increased to $4.7$10.2 million for the threesix months ended March 31,June 30, 2010, an improvement of $8.8$13.9 million as compared to the threesix months ended March 31,June 30, 2009, primarily due to the sale of higher quality coal and successful cost containment efforts. Net income in our Northern Appalachia segment decreased by $2.8$5.2 million to $2.6$4.6 million for the threesix months ended March 31,June 30, 2010, from $5.4$9.8 million for the threesix months ended March 31,June 30, 2009. This decrease was primarily the result of challenging geological conditions that limited production capacity and resulted in a decrease in tons of coal produced and an increase in operational costs such as roof support, labor and repairs on a per ton basis. Our Eastern Met segment recorded anet income of $0.4 million for the six months ended June 30, 2010, an increase of $0.7 million from the net loss of $0.1$0.3 million recorded for the threesix months ended March 31, 2010June 30, 2009. This increase occurred as a result of lower demand in January and February of 2010. This segment broke even for the three months ended March 31, 2009.joint venture became fully operational. For our Other segment, we had a net loss of $0.6$1.5 million for the threesix months ended March 31,June 30, 2010, a decrease of $3.1 million as compared to net income of $0.7$1.6 million recorded for the threesix months ended March 31, 2009June 30, 2009. This decrease was primarily due to a $1.1 million decrease in income from our McClane Canyon mine, a $0.2 million decrease in income from our roof bolt manufacturing company and a $1.8 million decrease in income from our ancillary service companies due to a decrease in trucking revenues as a result of the lower number of tons of coal sold.
EBITDA. The following table presents EBITDA by reportable segment for the threesix months ended March 31,June 30, 2009 and 2010:
| Segment | Three Months Ended March 31, 2009 | Three Months Ended March 31, 2010 | Increase (Decrease) | Six Months Ended June 30, 2009 | Six Months Ended June 30, 2010 | Increase (Decrease) | ||||||||||||||
|---|---|---|---|---|---|---|---|---|---|---|---|---|---|---|---|---|---|---|---|---|
| | (in millions) | (in millions) | ||||||||||||||||||
Central Appalachia | $ | 3.5 | $ | 10.1 | $ | 6.6 | $ | 11.6 | $ | 20.9 | $ | 9.3 | ||||||||
Northern Appalachia | 7.7 | 5.0 | (2.7 | ) | 14.6 | 9.7 | (4.9 | ) | ||||||||||||
Eastern Met * | — | (0.1 | ) | (0.1 | ) | (0.3 | ) | 0.4 | 0.7 | |||||||||||
Other | 1.9 | 0.8 | (1.1 | ) | 4.2 | 1.3 | (2.9 | ) | ||||||||||||
Total | $ | 13.1 | $ | 15.8 | $ | 2.6 | $ | 30.1 | $ | 32.3 | $ | 2.2 | ||||||||
Total EBITDA for the threesix months ended March 31,June 30, 2010 was $15.8$32.3 million, an increase of $2.6$2.2 million or 20.3%, from the threesix months ended March 31,June 30, 2009 primarily due to an increase in net income of $4.6$6.3 million offset by an increasea decrease in depreciation expense. Results of operations from our Eastern Met segment are recorded using the equity method and are reflected as a single line item in our financial statements. Therefore, depreciation, depletion and amortization and interest expense and income tax expense (benefit) are not presented separately for our Eastern Met segment. Please read "—Reconciliation of EBITDA to Net Income by Segment" for reconciliations of EBITDA to net income on a segment basis.
Year Ended December 31, 2009 Compared to Year Ended December 31, 2008
Summary. For the year ended December 31, 2009, our total revenues declined to $419.8 million from $438.9 million for the year ended December 31, 2008. The decrease was primarily due to the global economic recession and a concurrent decrease in the demand for both steam and metallurgical coal. As a result of this decreased demand, we sold 6.7 million tons of coal for the year ended December 31, 2009, which is 1.3 million fewer tons, or 16.0% less, than the 8.0 million tons of coal sold for the year ended December 31, 2008. Despite the decrease in the number of tons that we produced and sold, both net income and EBITDA increased for the year ended December 31, 2009 from the year ended December 31, 2008. Net income increased to $19.5 million for the year ended December 31, 2009 from $0.9 million for the year ended December 31, 2008, and EBITDA increased to $62.0 million for the year ended December 31, 2009 from $42.9 million for the year ended December 31, 2008. These increases in net income and EBITDA were the result of favorable pricing included in contracts executed in 2008 and effective for the year ended December 31, 2009 as well as our successful efforts to control the cost of operations.
Tons Sold. The following table presents tons of coal sold by reportable segment for the years ended December 31, 2008 and 2009:
| | | | Increase (Decrease) | ||||||||||
|---|---|---|---|---|---|---|---|---|---|---|---|---|---|
| | Year Ended December 31, 2008 | Year Ended December 31, 2009 | |||||||||||
| Segment | Tons | % * | |||||||||||
| | (in millions, except %) | ||||||||||||
Central Appalachia | 5.5 | 4.2 | (1.3 | ) | (22.0 | )% | |||||||
Northern Appalachia | 2.2 | 2.2 | — | (2.7 | )% | ||||||||
Other | 0.3 | 0.3 | — | (5.3 | )% | ||||||||
Total † | 8.0 | 6.7 | (1.3 | ) | (16.0 | )% | |||||||
Tons of coal sold for the year ended December 31, 2009 decreased by 1.3 million tons, primarily due to lower production in our Central Appalachia segment. Tons of coal sold in our Central Appalachia segment decreased by 1.3 million, or 22.0%, to 4.2 million tons for the year ended December 31, 2009 from 5.5 million tons for the year ended December 31, 2008. This decrease in production was a response to decreased demand for coal as well as the result of temporarily idling several of our less profitable surface mines. For our Northern Appalachia segment and Other segment, tons of coal sold were flat at 2.2 million tons and 0.3 million tons, respectively, for the year ended December 31, 2009. These operations maintained consistent sales due to the fact they serve a small customer base under supply contracts. We produced 4.7 million tons of coal and purchased 2.0 million tons of coal in 2009 as compared to producing 7.7 million tons of coal and purchasing 0.3 million tons of coal in 2008. We purchased additional amounts of coal in 2009 in order to satisfy certain existing contracts and to take advantage of favorable coal prices in the OTC market, which in some cases were lower than the actual costs of producing the same amount of coal.
Revenues. The following table presents revenue data by reportable segment for the years ended December 31, 2008 and 2009:
| | | | | Increase (Decrease) | | | | Increase (Decrease) | ||||||||||||||||||||
|---|---|---|---|---|---|---|---|---|---|---|---|---|---|---|---|---|---|---|---|---|---|---|---|---|---|---|---|---|
| | | Year Ended December 31, 2008 | Year Ended December 31, 2009 | | Year Ended December 31, 2008 | Year Ended December 31, 2009 | ||||||||||||||||||||||
| Segment | Segment | $ | % * | Segment | $ | % * | ||||||||||||||||||||||
| | | (in millions, except per ton data and %) | | (in millions, except per ton data and %) | ||||||||||||||||||||||||
Central Appalachia | Central Appalachia | Central Appalachia | ||||||||||||||||||||||||||
Coal revenues | $ | 310.6 | $ | 295.1 | $ | (15.5 | ) | (5.0 | )% | Coal revenues | $ | 310.6 | $ | 295.1 | $ | (15.5 | ) | (5.0 | )% | |||||||||
Freight and handling revenues | 0.8 | — | (0.8 | ) | (100.0 | )% | Freight and handling revenues | 0.8 | — | (0.8 | ) | (100.0 | )% | |||||||||||||||
Other revenues | 5.1 | 2.6 | (2.5 | ) | (49.1 | )% | Other revenues | 5.1 | 2.6 | (2.5 | ) | (49.1 | )% | |||||||||||||||
Total revenues | $ | 316.5 | $ | 297.7 | $ | (18.8 | ) | (5.9 | )% | Total revenues | $ | 316.5 | $ | 297.7 | $ | (18.8 | ) | (5.9 | )% | |||||||||
Coal revenues per ton * | $ | 56.74 | $ | 69.10 | $ | 12.36 | 21.8 | % | Coal revenues per ton * | $ | 56.74 | $ | 69.10 | $ | 12.36 | 21.8 | % | |||||||||||
Northern Appalachia | Northern Appalachia | Northern Appalachia | ||||||||||||||||||||||||||
Coal revenues | $ | 89.9 | $ | 95.5 | $ | 5.6 | 6.1 | % | Coal revenues | $ | 89.9 | $ | 95.5 | $ | 5.6 | 6.1 | % | |||||||||||
Freight and handling revenues | 7.1 | 5.0 | (2.1 | ) | (29.3 | )% | Freight and handling revenues | 7.1 | 5.0 | (2.1 | ) | (29.3 | )% | |||||||||||||||
Other revenues | 11.4 | 6.2 | (5.2 | ) | (45.0 | )% | Other revenues | 11.4 | 6.2 | (5.2 | ) | (45.0 | )% | |||||||||||||||
Total revenues | $ | 108.4 | $ | 106.7 | $ | (1.7 | ) | (1.6 | )% | Total revenues | $ | 108.4 | $ | 106.7 | $ | (1.7 | ) | (1.6 | )% | |||||||||
Coal revenues per ton * | $ | 40.44 | $ | 44.12 | $ | 3.68 | 9.1 | % | Coal revenues per ton * | $ | 40.44 | $ | 44.12 | $ | 3.68 | 9.1 | % | |||||||||||
Other | ||||||||||||||||||||||||||||
Coal revenues | $ | 8.3 | $ | 11.2 | $ | 2.9 | 34.9 | % | ||||||||||||||||||||
Freight and handling revenues | 2.3 | — | (2.3 | ) | (100.0 | )% | ||||||||||||||||||||||
Other revenues | 3.4 | 4.2 | 0.8 | 20.8 | % | |||||||||||||||||||||||
Total revenues | $ | 14.0 | $ | 15.4 | $ | 1.4 | 9.2 | % | ||||||||||||||||||||
Coal revenues per ton * | $ | 29.74 | $ | 42.35 | $ | 12.61 | 42.4 | % | ||||||||||||||||||||
Total | ||||||||||||||||||||||||||||
Coal revenues | $ | 408.8 | $ | 401.8 | $ | (7.0 | ) | (1.7 | )% | |||||||||||||||||||
Freight and handling revenues | 10.2 | 5.0 | (5.2 | ) | (50.5 | )% | ||||||||||||||||||||||
Other revenues | 19.9 | 13.0 | (6.9 | ) | (34.8 | )% | ||||||||||||||||||||||
Total revenues | $ | 438.9 | $ | 419.8 | $ | (19.1 | ) | (4.4 | )% | |||||||||||||||||||
Coal revenues per ton * | $ | 51.25 | $ | 59.98 | $ | 8.73 | 17.0 | % | ||||||||||||||||||||
| | | | Increase (Decrease) | |||||||||||
|---|---|---|---|---|---|---|---|---|---|---|---|---|---|---|
| | Year Ended December 31, 2008 | Year Ended December 31, 2009 | ||||||||||||
| Segment | $ | % * | ||||||||||||
| | (in millions, except per ton data and %) | |||||||||||||
Other | ||||||||||||||
Coal revenues | $ | 8.3 | $ | 11.2 | $ | 2.9 | 34.9 | % | ||||||
Freight and handling revenues | 2.3 | — | (2.3 | ) | (100.0 | )% | ||||||||
Other revenues | 3.4 | 4.2 | 0.8 | 20.8 | % | |||||||||
Total revenues | $ | 14.0 | $ | 15.4 | $ | 1.4 | 9.2 | % | ||||||
Coal revenues per ton * | $ | 29.74 | $ | 42.35 | $ | 12.61 | 42.4 | % | ||||||
Total | ||||||||||||||
Coal revenues | $ | 408.8 | $ | 401.8 | $ | (7.0 | ) | (1.7 | )% | |||||
Freight and handling revenues | 10.2 | 5.0 | (5.2 | ) | (50.5 | )% | ||||||||
Other revenues | 19.9 | 13.0 | (6.9 | ) | (34.8 | )% | ||||||||
Total revenues | $ | 438.9 | $ | 419.8 | $ | (19.1 | ) | (4.4 | )% | |||||
Coal revenues per ton * | $ | 51.25 | $ | 59.98 | $ | 8.73 | 17.0 | % | ||||||
Our total revenues for the year ended December 31, 2009 decreased by $19.1 million, or 4.4%, to $419.8 million from $438.9 million for the year ended December 31, 2008. The decline in total revenues was due to a decrease in coal demand as a result of the global recession. Please read "The Coal Industry." Coal revenues per ton were $59.98 for the year ended 2009, an increase of $8.73, or 17.0%, from $51.25 per ton for the year ended December 31, 2008. This increase in coal revenues per ton for the year ended December 31, 2009 was primarily the result of supply contracts executed in 2008 at favorable prices offset by the sale of a smaller percentage of metallurgical coal. The impact of the favorable prices included in these contracts was an increase in coal revenue per ton of approximately $11.49. This increase was offset by the impact of a less favorable sales mix as compared to the year ended December 31, 2008. This impact was a decrease of approximately $2.76 per ton.
For our Central Appalachia segment, coal revenues decreased by $15.5 million, or 5.0%, to $295.1 million for the year ended December 31, 2009 from $310.6 million for the year ended December 31, 2008 due to fewer tons of coal sold in 2009. Coal revenues per ton for our Central Appalachia segment increased by 21.8%, or $12.36, to $69.10 per ton for the year ended December 31, 2009 as compared to $56.74 per ton for the year ended December 31, 2008 due to favorable pricing included in contracts executed in 2008 offset by a less favorable sales mix of steam and metallurgical coal.
For our Northern Appalachia segment, coal revenues were $95.5 million for the year ended December 31, 2009, an increase of $5.6 million, or 6.1%, from $89.9 million for the year ended December 31, 2008 as a result of favorable prices included in our supply contracts. Coal revenues per ton for our Northern Appalachia segment increased by 9.1%, or $3.68, to $44.12 per ton for the year ended December 31, 2009 from $40.44 per ton for the year ended December 31, 2008. The increase in 2009 was primarily due to favorable pricing included in contracts executed in 2008 for coal produced at our Sands Hill operation.
For our Other segment, coal revenues increased by $2.9 million, or 34.9%, to $11.2 million for the year ended December 31, 2009 from $8.3 million for the year ended December 31, 2008. Coal revenues per ton for our Other segment were $42.35 for the year ended December 31, 2009,
an increase of $12.61, or 42.4%, from $29.74 for the year ended December 31, 2008 as a result of favorable prices included in supply contracts executed in 2008.
Costs and Expenses. The following table presents costs and expenses (including the cost of purchased coal) and cost of operations per ton by reportable segment for the years ended December 31, 2008 and 2009:
| | | | Increase (Decrease) | ||||||||||
|---|---|---|---|---|---|---|---|---|---|---|---|---|---|
| | Year Ended December 31, 2008 | Year Ended December 31, 2009 | |||||||||||
| Segment | $ | % * | |||||||||||
| | (in millions, except per ton data and %) | ||||||||||||
Central Appalachia | |||||||||||||
Cost of operations (exclusive of depreciation, depletion and amortization shown separately below) | $ | 272.8 | $ | 249.1 | $ | (23.7 | ) | (8.7 | )% | ||||
Freight and handling costs | 0.7 | — | (0.7 | ) | (100.0 | )% | |||||||
Depreciation, depletion and amortization | 24.9 | 23.9 | (1.0 | ) | (4.1 | )% | |||||||
Selling, general and administrative | 14.4 | 15.5 | 1.1 | 7.6 | % | ||||||||
Cost of operations per ton * | $ | 49.84 | $ | 58.32 | $ | 8.48 | 17.0 | % | |||||
Northern Appalachia | |||||||||||||
Cost of operations (exclusive of depreciation, depletion and amortization shown separately below) | $ | 76.6 | $ | 71.5 | $ | (5.1 | ) | (6.7 | )% | ||||
Freight and handling costs | 7.2 | 4.0 | (3.2 | ) | (44.7 | )% | |||||||
Depreciation, depletion and amortization | 8.1 | 7.8 | (0.3 | ) | (2.8 | )% | |||||||
Selling, general and administrative | 0.4 | 0.4 | — | 10.9 | % | ||||||||
Cost of operations per ton * | $ | 34.45 | $ | 33.04 | $ | (1.40 | ) | (4.1 | )% | ||||
| | | | Increase (Decrease) | | | Increase (Decrease) | ||||||||||||||||||||
|---|---|---|---|---|---|---|---|---|---|---|---|---|---|---|---|---|---|---|---|---|---|---|---|---|---|---|
| | Year Ended December 31, 2008 | Year Ended December 31, 2009 | Year Ended December 31, 2008 | Year Ended December 31, 2009 | ||||||||||||||||||||||
| Segment | $ | % * | $ | % * | ||||||||||||||||||||||
| | (in millions, except per ton data and %) | (in millions, except per ton data and %) | ||||||||||||||||||||||||
Central Appalachia | ||||||||||||||||||||||||||
Cost of operations (exclusive of depreciation, depletion and amortization shown separately below) | $ | 272.8 | $ | 249.1 | $ | (23.7 | ) | (8.7 | )% | |||||||||||||||||
Freight and handling costs | 0.7 | — | (0.7 | ) | (100.0 | )% | ||||||||||||||||||||
Depreciation, depletion and amortization | 24.9 | 23.9 | (1.0 | ) | (4.1 | )% | ||||||||||||||||||||
Selling, general and administrative | 14.4 | 15.5 | 1.1 | 7.6 | % | |||||||||||||||||||||
Cost of operations per ton * | $ | 49.84 | $ | 58.32 | $ | 8.48 | 17.0 | % | ||||||||||||||||||
Northern Appalachia | ||||||||||||||||||||||||||
Cost of operations (exclusive of depreciation, depletion and amortization shown separately below) | $ | 76.6 | $ | 71.5 | $ | (5.1 | ) | (6.7 | )% | |||||||||||||||||
Freight and handling costs | 7.2 | 4.0 | (3.2 | ) | (44.7 | )% | ||||||||||||||||||||
Depreciation, depletion and amortization | 8.1 | 7.8 | (0.3 | ) | (2.8 | )% | ||||||||||||||||||||
Selling, general and administrative | 0.4 | 0.4 | — | 10.9 | % | |||||||||||||||||||||
Cost of operations per ton * | $ | 34.45 | $ | 33.04 | $ | (1.40 | ) | (4.1 | )% | |||||||||||||||||
Other | ||||||||||||||||||||||||||
Cost of operations (exclusive of depreciation, depletion and amortization shown separately below) | $ | 15.5 | $ | 15.8 | $ | 0.3 | 1.9 | % | $ | 15.5 | $ | 15.8 | $ | 0.3 | 1.9 | % | ||||||||||
Freight and handling costs | 2.3 | — | (2.3 | ) | (100.0 | )% | 2.3 | — | (2.3 | ) | (100.0 | )% | ||||||||||||||
Depreciation, depletion and amortization | 3.4 | 4.5 | 1.1 | 32.1 | % | 3.4 | 4.5 | 1.1 | 32.1 | % | ||||||||||||||||
Selling, general and administrative | 4.3 | 0.9 | (3.4 | ) | (79.8 | )% | 4.3 | 0.9 | (3.4 | ) | (79.8 | )% | ||||||||||||||
Cost of operations per ton ** | n/a | n/a | n/a | n/a | n/a | n/a | n/a | n/a | ||||||||||||||||||
Total | ||||||||||||||||||||||||||
Cost of operations (exclusive of depreciation, depletion and amortization shown separately below) | $ | 364.9 | $ | 336.4 | $ | (28.5 | ) | (7.8 | )% | $ | 364.9 | $ | 336.4 | $ | (28.5 | ) | (7.8 | )% | ||||||||
Freight and handling costs | 10.2 | 4.0 | (6.2 | ) | (61.0 | )% | 10.2 | 4.0 | (6.2 | ) | (61.0 | )% | ||||||||||||||
Depreciation, depletion and amortization | 36.4 | 36.3 | (0.2 | ) | (0.4 | )% | 36.4 | 36.3 | (0.2 | ) | (0.4 | )% | ||||||||||||||
Selling, general and administrative | 19.1 | 16.8 | (2.3 | ) | (12.0 | )% | 19.1 | 16.8 | (2.3 | ) | (12.0 | )% | ||||||||||||||
Cost of operations per ton * | $ | 45.75 | $ | 50.21 | $ | 4.46 | 9.8 | % | $ | 45.75 | $ | 50.21 | $ | 4.46 | 9.8 | % | ||||||||||
Cost of Operations. Total cost of operations was $336.4 million for the year ended December 31, 2009 as compared to $364.9 million for the year ended December 31, 2008, primarily resulting from a decrease in the amount of coal produced of 2.8 million tons for the year ended December 31, 2009 as compared to the same period in 2008; however, we sold 2.0 million tons of purchased coal for the year ended December 31, 2009, an increase of 1.5 million tons from the year ended December 31, 2008. Our cost of operations per ton was $50.21 for the year ended December 31, 2009, an increase of $4.46, or 9.8%, from the year ended December 31, 2008. This increase was primarily due to the higher costs of labor, insurance and purchased coal, partially offset by reductions in the cost of operating supplies such as diesel fuel and explosives. We took steps to reduce our workforce as production slowed but necessarily retained a higher percentage of employees in critical ancillary and support positions. These labor costs, when applied to the smaller base of tons produced, resulted in higher costs on a per ton basis.
Our cost of operations for our Central Appalachia segment decreased by $23.7 million, or 8.7%, to $249.1 million for the year ended December 31, 2009 from $272.8 million for the year ended December 31, 2008, primarily resulting from a decrease in the amount of coal produced of 2.8 million tons. Our cost of operations per ton, however, increased to $58.32 per ton for the year ended December 31, 2009 from $49.84 per ton for the year ended December 31, 2008. This increase was primarily due to the higher costs of labor, insurance and purchased coal, offset by reductions in the cost of operating supplies such as diesel fuel and explosives. We bought 1.5 million more tons of coal for the year ended December 31, 2009 compared to the year ended December 31, 2008.
In our Northern Appalachia segment, our cost of operations decreased by $5.1 million, or 6.7%, to $71.5 million for the year ended December 31, 2009 from $76.6 million for the year ended December 31, 2008, primarily due to reductions in the costs of fuel, explosives and roof support. Our cost of operations per ton decreased to $33.04 for the year ended December 31, 2009 from $34.45 for the year ended December 31, 2008, a decrease of $1.40 per ton, or 4.1%, also due to reductions in amounts spent for operating supplies such as diesel fuel, explosives and roof support.
Cost of operations in our Other segment increased by $0.3 million for the year ended December 31, 2009 as compared to the year ended December 31, 2008.
Freight and Handling. Total freight and handling costs for the year ended December 31, 2009 decreased by $6.2 million, or 61.0%, to $4.0 million from $10.2 million for the year ended December 31, 2008. This decrease was primarily due to a decrease of 1.3 million tons of coal sold for the year ended December 31, 2009 as well as a decrease in the cost of fuel and favorable new contract terms that required customers to assume the transportation cost of purchased coal.
Depreciation, Depletion and Amortization. Total DD&A expense for the year ended December 31, 2009 was $36.3 million as compared to $36.4 million for the year ended December 31, 2008.
For the year ended December 31, 2009, our depreciation cost was $29.2 million as compared to $26.0 million for the year ended December 31, 2008. The higher depreciation cost in 2009 was primarily due to the acquisition of operating assets.
For the year ended December 31, 2009, our depletion cost was $2.3 million as compared to $4.0 million for the year ended December 31, 2008. The decrease in depletion cost in 2009 was primarily a result of the decrease in the number of tons of coal produced for the year ended December 31, 2009.
For the year ended December 31, 2009, our amortization cost was $4.7 million as compared to $6.4 million for the year ended December 31, 2008. Amortization cost for the year ended December 31, 2009 decreased as a result of producing fewer tons in 2009.
Selling, General and Administrative. Total SG&A expense for the year ended December 31, 2009 was $16.8 million as compared to $19.1 million for the year ended December 31, 2008. The decrease in SG&A expense for the year ended December 31, 2009 was primarily due to $3.6 million in costs related to an abandoned public offering recorded in August of 2008. This benefit was partially offset by decreases in the amounts of discounts and rebates available in 2009 and an increase in amounts spent for licenses, fines and penalties.
Interest Expense. Interest expense for the year ended December 31, 2009 was $6.2 million as compared to $5.5 million for the year ended December 31, 2008, an increase of $0.7 million, or 13.1%. For the year ended December 31, 2008, we increased our overall debt to fund the acquisition of the Deane mining complex, additional coal reserves at our Deane mining complex and the investment in the joint venture. The increase in interest expense for 2009 reflects a full year of interest expense resulting from debt incurred on 2008 acquisitions.
Income Tax Expense (Benefit). For the years ended December 31, 2008 and 2009, we operated as a partnership and, as such, were not subject to federal income tax. For the years ended December 31, 2008 and 2009, we did not operate in any state or local jurisdictions that imposed an income tax on partnerships.
Net Income (Loss). The following table presents net income (loss) by reportable segment for the years ended December 31, 2008 and 2009:
| Segment | Year Ended December 31, 2008 | Year Ended December 31, 2009 | Increase (Decrease) | |||||||
|---|---|---|---|---|---|---|---|---|---|---|
| | (in millions) | |||||||||
Central Appalachia | $ | (3.5 | ) | $ | 0.6 | $ | 4.1 | |||
Northern Appalachia | 10.9 | 17.6 | 6.7 | |||||||
Eastern Met * | (1.6 | ) | 0.9 | 2.5 | ||||||
Other | (4.9 | ) | 0.4 | 5.3 | ||||||
Total | $ | 0.9 | $ | 19.5 | $ | 18.6 | ||||
For the year ended December 31, 2009, total net income increased to $19.5 million from $0.9 million for the year ended December 31, 2008. This increase was due to favorable prices included in supply contracts executed in 2008 and successful cost containment efforts. For our Central Appalachia segment, net income increased to $0.6 million for the year ended December 31, 2009, an improvement of $4.1 million primarily due to higher coal revenues per ton as a result of favorable contract pricing, successful cost containment efforts. Net income in our Northern Appalachia segment increased by $6.7 million to $17.6 million for the year ended December 31, 2009, from $10.9 million for the year ended December 31, 2008 primarily due to higher coal revenues per ton resulting from favorable pricing included in contracts executed during 2008 for coal sold during 2009. Net income from our Eastern Met segment increased by $2.5 million for the year ended December 31, 2009, as compared to the year ended December 31, 2008, as a result of the Rhino Eastern mining complex reaching full production and beginning sales of metallurgical coal. For our Other segment, net income was $0.4 million for the year ended December 31, 2009 as compared to a net loss of $4.9 million for the year ended December 31, 2008, this increase was primarily due to abandoned public offering costs recorded in 2008, higher revenues from our Colorado operations and lower costs of operations from our ancillary businesses. These ancillary businesses provide services such as reclamation, maintenance and transportation.
EBITDA. The following table presents EBITDA by reportable segment for the years ended December 31, 2008 and 2009:
| Segment | Year Ended December 31, 2008 | Year Ended December 31, 2009 | Increase (Decrease) | |||||||
|---|---|---|---|---|---|---|---|---|---|---|
| | (in millions) | |||||||||
Central Appalachia | $ | 24.9 | $ | 28.0 | $ | 3.1 | ||||
Northern Appalachia | 20.4 | 27.3 | 6.9 | |||||||
Eastern Met * | (1.6 | ) | 0.9 | 2.5 | ||||||
Other | (0.8 | ) | 5.8 | 6.6 | ||||||
Total | $ | 42.9 | $ | 62.0 | $ | 19.1 | ||||
Total EBITDA for the year ended December 31, 2009 was $62.0 million, an increase of $19.1 million from the year ended December 31, 2008, primarily due to a $18.6 million increase in net income for the year ended December 31, 2009. Results of operations from our Eastern Met segment are recorded using the equity method and are reflected as a single line item in our financial statements. Therefore, depreciation, depletion and amortization, interest expense and income tax expense (benefit) are not presented separately for our Eastern Met segment. Please read "—Reconciliation of EBITDA to Net Income by Segment" for reconciliations of EBITDA to net income on a segment basis.
Year Ended December 31, 2008 Compared to Year Ended December 31, 2007
Summary. We sold 8.0 million tons of coal for the year ended December 31, 2008 as compared to 8.2 million tons of coal for the year ended December 31, 2007. Our coal revenues were $408.8 million for the year ended December 31, 2008 as compared to $394.1 million for the year ended December 31, 2007. The $14.7 million, or 3.7%, increase in coal revenues for the year ended December 31, 2008 was primarily due to a $2.95 per ton, or 6.1%, increase in coal revenue per ton. Net income for the year ended December 31, 2008 was $0.9 million as compared to $30.7 million for the year ended December 31, 2007. EBITDA was $42.9 million for the year ended December 31, 2008 as compared to $66.9 million for the year ended December 31, 2007. The decrease in net income and EBITDA for the year ended December 31, 2008 was primarily due to increases in labor costs and operating costs as a result of escalating fuel prices.
Tons Sold. The following table presents tons of coal sold by reportable segment for the years ended December 31, 2008 and 2007:
| | | | Increase (Decrease) | ||||||||||
|---|---|---|---|---|---|---|---|---|---|---|---|---|---|
| | Year Ended December 31, 2007 | Year Ended December 31, 2008 | |||||||||||
| Segment | Tons | % * | |||||||||||
| | (in millions, except %) | ||||||||||||
Central Appalachia | 6.6 | 5.5 | (1.1 | ) | (16.9 | )% | |||||||
Northern Appalachia | 1.3 | 2.2 | 0.9 | 67.8 | % | ||||||||
Other | 0.3 | 0.3 | — | 14.5 | % | ||||||||
Total † | 8.2 | 8.0 | (0.2 | ) | (2.4 | )% | |||||||
We sold 8.0 million tons of coal for the year ended December 31, 2008 as compared to 8.2 million tons of coal for the year ended December 31, 2007. We produced 7.7 million tons of coal and purchased 0.3 million tons of coal for the year ended December 31, 2008 as compared to producing 7.1 million tons of coal, purchasing 1.0 million tons of coal and selling 0.1 million tons of coal from inventory for the year ended December 31, 2007. Tons of coal sold in our Central Appalachia segment was 5.5 million tons for the year ended December 31, 2008, which included the sale of 0.3 million tons of purchased coal as compared to 6.6 million tons for the year ended December 31, 2007, which included the sale of 1.0 million tons of purchased coal and 0.1 million tons of coal sold from inventory. For our Northern Appalachia segment, we sold 2.2 million tons of coal for the year ended December 31, 2008 as compared to 1.3 million tons for the year ended December 31, 2007. This was primarily a result of the addition of production capacity through the acquisition of our Sands Hill mining complex in December 2007. This operation sold 0.7 million tons of coal for year ended December 31, 2008. Sales of coal for our Other segment were flat at 0.3 million tons for the year ended December 31, 2008. All sales of coal in our Other segment were to a small customer base under supply contracts.
Revenues. The following table presents revenue data by reportable segment for the year ended December 31, 2008 and 2007:
| | | | Increase (Decrease) | ||||||||||
|---|---|---|---|---|---|---|---|---|---|---|---|---|---|
| | Year Ended December 31, 2007 | Year Ended December 31, 2008 | |||||||||||
| Segment | Dollars | % * | |||||||||||
| | (in millions, except per ton data and %) | ||||||||||||
Central Appalachia | |||||||||||||
Coal revenues | $ | 337.4 | $ | 310.6 | $ | (26.8 | ) | (7.9 | )% | ||||
Freight and handling revenues | 1.1 | 0.8 | (0.3 | ) | (34.9 | )% | |||||||
Other revenues | 1.5 | 5.1 | 3.6 | 233.8 | % | ||||||||
Total revenues | $ | 340.0 | $ | 316.5 | $ | (23.5 | ) | (6.9 | )% | ||||
Coal revenues per ton * | $ | 51.19 | $ | 56.74 | $ | 5.54 | 10.8 | % | |||||
Northern Appalachia | |||||||||||||
Coal revenues | $ | 49.5 | $ | 89.9 | $ | 40.4 | 81.7 | % | |||||
Freight and handling revenues | 1.4 | 7.1 | 5.7 | 424.3 | % | ||||||||
Other revenues | 3.6 | 11.4 | 7.8 | 220.0 | % | ||||||||
Total revenues | $ | 54.5 | $ | 108.4 | $ | 53.9 | 99.3 | % | |||||
Coal revenues per ton * | $ | 37.35 | $ | 40.44 | $ | 3.09 | 8.3 | % | |||||
Other | |||||||||||||
Coal revenues | $ | 7.2 | $ | 8.3 | $ | 1.1 | 15.1 | % | |||||
Freight and handling revenues | 1.6 | 2.3 | 0.7 | 48.7 | % | ||||||||
Other revenues | 0.2 | 3.4 | 3.2 | 1382.0 | % | ||||||||
Total revenues | $ | 9.0 | $ | 14.0 | $ | 5.0 | 55.9 | % | |||||
Coal revenues per ton * | $ | 29.60 | $ | 29.74 | $ | 0.14 | 0.5 | % | |||||
Total | |||||||||||||
Coal revenues | $ | 394.1 | $ | 408.8 | $ | 14.7 | 3.7 | % | |||||
Freight and handling revenues | 4.1 | 10.2 | 6.1 | 151.5 | % | ||||||||
Other revenues | 5.3 | 19.9 | 14.6 | 274.3 | % | ||||||||
Total revenues | $ | 403.5 | $ | 438.9 | $ | 35.4 | 8.8 | % | |||||
Coal revenues per ton * | $ | 48.30 | $ | 51.25 | $ | 2.95 | 6.1 | % | |||||
Our total revenues for the year ended December 31, 2008 were $438.9 million as compared to $403.5 million for the year ended December 31, 2007. Our coal revenues were $408.8 million for the year ended December 31, 2008 as compared to $394.1 million for the year ended December 31, 2007, primarily due to a more favorable sales mix of steam and metallurgical coal, additional coal sales from our Sands Hill mining complex (acquired in December 2007). Coal revenues per ton increased by $2.95 per ton, or 6.1%, to $51.25 per ton for the year ended December 31, 2008 from $48.30 per ton for the year ended December 31, 2007. Increases in total coal revenue and coal revenue per ton were the result of a favorable sales mix of steam and metallurgical coal, growing demand for coal and a concurrent upward trend in prices.
For our Central Appalachia segment, coal revenues decreased by $26.8 million, or 7.9%, to $310.6 million for the year ended December 31, 2008 from $337.4 million for the year ended December 31, 2007 due to fewer tons of coal sold for that segment partially offset by an increase in coal revenue per ton for the year ended December 31, 2008. Coal revenues per ton for our Central Appalachia segment increased by $5.54 per ton, or 10.8%, to $56.74 per ton for the year ended December 31, 2008 as compared to $51.19 for the year ended December 31, 2007. The increase in coal revenue per ton in our Central Appalachia segment in 2008 as compared to 2007 was the result of a favorable sales mix of steam and metallurgical coal and an upward trend in prices.
For our Northern Appalachia segment, coal revenues were $89.9 million for the year ended December 31, 2008, an increase of $40.4 million, or 81.7%, from $49.5 million for the year ended December 31, 2007. The increase in coal revenues for the year ended December 31, 2008 in our Northern Appalachia segment was primarily due to an increase in tons of coal sold, as a result of the acquisition of the Sands Hill mining complex in December 2007 and an increase in coal revenue per ton. The Sands Hill mining complex sold 0.7 million tons of coal, generating $28.4 million in revenue for the year ended December 31, 2008 as compared to 0.02 million tons of coal sold generating $0.7 million in revenue for the year ended December 31, 2007. Coal revenues per ton for our Northern Appalachia segment increased by $3.09 per ton, or 8.3%, to $40.44 per ton for the year ended December 31, 2008 from $37.35 per ton for the year ended December 31, 2007. The increase in coal revenue per ton in 2008 as compared to 2007 was the result of growing demand for coal and a concurrent upward trend in prices.
For our Other segment, coal revenues increased by $1.1 million, or 15.1%, to $8.3 million for the year ended December 31, 2008 from $7.2 million for the year ended December 31, 2007 due to an increase in the number of tons of coal sold and an increase in coal revenue per ton. Coal revenues per ton for our Other segment were $29.74 for the year ended December 31, 2008, an increase of $0.14, or 0.5%, from $29.60 for the year ended December 31, 2007. The increase in 2008 as compared to 2007 was primarily due to contract provisions that allowed us to recover a portion of higher fuel costs through increases in the sales prices charged by our McClane Canyon mining complex.
Costs and Expenses. The following table presents costs and expenses (including the cost of purchased coal), cost of operations per ton and cost of operations per ton produced by reportable segment for the years ended December 31, 2008 and 2007:
| | | | Increase (Decrease) | ||||||||||
|---|---|---|---|---|---|---|---|---|---|---|---|---|---|
| | Year Ended December 31, 2007 | Year Ended December 31, 2008 | |||||||||||
| Segment | Dollars | % * | |||||||||||
| | (in millions, except per ton data and %) | ||||||||||||
Central Appalachia | |||||||||||||
Cost of operations (exclusive of depreciation, depletion and amortization shown separately below) | $ | 270.4 | $ | 272.8 | $ | 2.4 | 0.9 | % | |||||
Freight and handling costs | 1.1 | 0.7 | (0.4 | ) | (35.3 | )% | |||||||
Depreciation, depletion and amortization | 24.5 | 24.9 | 0.4 | (1.7 | )% | ||||||||
Selling, general and administrative | 13.2 | 14.4 | 1.2 | 9.0 | % | ||||||||
Cost of operations per ton * | $ | 41.03 | $ | 49.84 | $ | 8.81 | 21.5 | % | |||||
Northern Appalachia | |||||||||||||
Cost of operations (exclusive of depreciation, depletion and amortization shown separately below) | $ | 36.7 | $ | 76.6 | $ | 39.9 | 108.6 | % | |||||
Freight and handling costs | 1.3 | 7.2 | 5.9 | 463.8 | % | ||||||||
Depreciation, depletion and amortization | 4.3 | 8.1 | 3.8 | 88.5 | % | ||||||||
Selling, general and administrative | 1.2 | 0.4 | (0.8 | ) | (69.4 | )% | |||||||
Cost of operations per ton * | $ | 27.70 | $ | 34.45 | $ | 6.75 | 24.4 | % | |||||
Other | |||||||||||||
Cost of operations (exclusive of depreciation, depletion and amortization shown separately below) | $ | 11.3 | $ | 15.5 | $ | 4.2 | 36.9 | % | |||||
Freight and handling costs | 1.6 | 2.3 | 0.7 | 42.2 | % | ||||||||
Depreciation, depletion and amortization | 1.9 | 3.4 | 1.5 | 74.2 | % | ||||||||
Selling, general and administrative | 1.0 | 4.3 | 3.3 | 337.3 | % | ||||||||
Cost of operations per ton ** | n/a | n/a | n/a | n/a | |||||||||
Total | |||||||||||||
Cost of operations (exclusive of depreciation, depletion and amortization shown separately below) | $ | 318.4 | $ | 364.9 | $ | 46.5 | 14.6 | % | |||||
Freight and handling costs | 4.0 | 10.2 | 6.2 | 154.2 | % | ||||||||
Depreciation, depletion and amortization | 30.7 | 36.4 | 5.7 | 18.5 | % | ||||||||
Selling, general and administrative | 15.4 | 19.1 | 3.7 | 23.9 | % | ||||||||
Cost of operations per ton * | $ | 39.02 | $ | 45.75 | $ | 6.72 | 17.2 | % | |||||
Cost of Operations. Total cost of operations was $364.9 million for the year ended December 31, 2008 as compared to $318.4 million for the year ended December 31, 2007, with the increase resulting primarily from an increase in coal produced of 0.7 million tons for the year ended December 31, 2008. Our cost of operations per ton increased by $6.72 per ton, or 17.2%, to $45.75 per ton for the year ended December 31, 2008 compared to $39.02 per ton for the year ended December 31, 2007. The increase in 2008 over 2007 primarily reflected increasing costs for labor, the direct effect of increased costs of fuel and the indirect effect of those fuel cost increases as reflected in fuel surcharges and increased transportation costs affecting the price of raw materials and supplies.
Our cost of operations for our Central Appalachia segment increased by $2.4 million, or 0.9%, to $272.8 million for the year ended December 31, 2008 from $270.4 million for the year ended December 31, 2007. Our cost of operations per ton also increased by $8.81 per ton, or 21.5%, to $49.84 per ton for the year ended December 31, 2008 from $41.03 per ton for the year ended December 31, 2007. The increase in 2008 as compared to 2007 was due to increases in labor costs as a result of high demand for skilled workers, an overall increase in the cost of material and supplies as a result of escalating fuel costs and additional costs incurred as a result of poor geological conditions encountered in the coal production process.
In our Northern Appalachia segment, our cost of operations increased by $39.9 million, or 108.6%, to $76.6 million for the year ended December 31, 2008 from $36.7 million for the year ended December 31, 2007. The increase in 2008 over 2007 was primarily due to our acquisition of the Sands Hill mining complex in December 2007, which increased our total cost of operations by $33.0 million. For the year ended December 31, 2008, costs of operations in the Sands Hill mining complex was $33.8 million as compared to $0.8 million for the year ended December 31, 2007. Also contributing to this increase were increases in the cost of materials and supplies as a result of escalating fuel costs. Our cost of operations per ton also increased by $6.75 per ton, or 24.4%, to $34.45 per ton for the year ended December 31, 2008 from $27.70 per ton for the year ended December 31, 2007. The increase was primarily the direct result of increased costs of fuel and the indirect effect of those fuel cost increases as reflected in fuel surcharges and increased transportation costs affecting the price of raw materials and supplies.
Cost of operations in our Other segment increased by $4.2 million, or 36.9%, to $15.5 million for the year ended December 31, 2008 from $11.3 million for the year ended December 31, 2007. This increase was primarily due to increases in costs of operations in our ancillary businesses. These increases were primarily the result of the increasing price of fuel and the increased cost of labor.
Freight and Handling. Total freight and handling costs for the year ended December 31, 2008 increased by $6.2 million, or 154.2%, to $10.2 million from $4.0 million for the year ended December 31, 2007. This increase was primarily due to additional production as a result of the addition of our Sands Hill mining complex in our Northern Appalachia segment and escalating fuel costs.
Depreciation, Depletion and Amortization. Total DD&A expense for the year ended December 31, 2008 was $36.4 million as compared to $30.7 million for the year ended December 31, 2007. The increase in DD&A expense in 2008 as compared to 2007 was the result of a $5.0 million increase in depreciation as well as a $0.4 million increase in depletion and a $0.3 million increase in amortization.
For the year ended December 31, 2008, our depreciation cost was $26.0 million as compared to $21.0 million for the year ended December 31, 2007. The increase in depreciation cost for the
year ended December 31, 2008 was primarily due to the acquisition of the Sands Hill mining complex in December 2007, the Deane mining complex in February 2008 as well as significant additions of machinery and equipment at other existing operations.
For the year ended December 31, 2008, our depletion cost was $4.0 million as compared to $3.6 million for the year ended December 31, 2007. The higher depletion cost in 2008 was primarily due to an increase in production relating to our Sands Hill mining complex and Deane mining complex.
For the year ended December 31, 2008, our amortization cost was $6.4 million as compared to $6.1 million for the year ended December 31, 2007 resulting from an increase in both amortization of mine development and asset retirement costs for the year ended December 31, 2008.
Selling, General and Administrative. SG&A expenses increased by $3.7 million for the year ended December 31, 2008 primarily due to costs related to an abandoned public offering recorded in August of 2008.
Interest Expense. Interest expense for the year ended December 31, 2008 was $5.5 million as compared to $5.6 million for the year ended December 31, 2007. Our interest rates were lower in 2008 compared to the rates in 2007.
Income Tax Expense (Benefit). We are taxed as a partnership, and, as such, are not subject to federal income tax. For the year ended December 31, 2008, we did not operate in any state or local jurisdictions that imposed an income tax on partnerships. As a result, there was no income tax expense or benefit for the year ended December 31, 2008 as compared to an income tax benefit of $0.1 million for the year ended December 31, 2007. We incurred an income tax expense of $0.1 million in 2006 as a result of the state of Kentucky instituting a law effective January 1, 2005 that required partnerships to pay state income taxes. This law was repealed effective January 1, 2007, which resulted in a reversal of that income tax expense and generated an income tax benefit of $0.1 million for the year ended December 31, 2007.
Net Income (Loss). The following table presents net income (loss) by reportable segment for years ended December 31, 2007 and 2008:
| Segment | Year Ended December 31, 2007 | Year Ended December 31, 2008 | Increase (Decrease) | |||||||
|---|---|---|---|---|---|---|---|---|---|---|
| | (in millions) | |||||||||
Central Appalachia | $ | 23.8 | $ | (3.5 | ) | $ | (27.3 | ) | ||
Northern Appalachia | 8.9 | 10.9 | 2.0 | |||||||
Eastern Met * | n/a | (1.6 | ) | (1.6 | ) | |||||
Other | (2.0 | ) | (4.9 | ) | (2.9 | ) | ||||
Total | $ | 30.7 | $ | 0.9 | $ | (29.8 | ) | |||
For the year ended December 31, 2008, total net income decreased by $29.8 million to $0.9 million from $30.7 million for the year ended December 31, 2007. The decrease in 2008 as compared to 2007 was primarily due to increased labor costs, escalating fuel costs, abandoned public offering costs recorded in 2008 and increased operational costs related to poor geological
conditions at specific operations. For our Central Appalachia segment, net loss was $3.5 million for the year ended December 31, 2008, as compared to a net income of $23.8 million for the year ended December 31, 2007. This decline of $27.3 million in net income was due to increased labor costs and escalating fuel costs as well as increased costs as a result of poor geological conditions encountered in the course of coal production and partially offset by an increase in coal prices per ton. Net income in our Northern Appalachia segment increased by $2.0 million, or 23.2%, to $10.9 million for the year ended December 31, 2008, from $8.9 million for the year ended December 31, 2007 primarily due to additional production at our Sands Hill mining complex, acquired in August of 2007 and higher coal prices per ton of coal sold. We experienced a net loss of $1.6 million for our Eastern Met segment for the year ended December 31, 2008 as a result of the start-up costs associated with the Rhino Eastern mining complex, which began producing coal for sale in December 2008. For our Other segment, net loss increased by $2.9 million, or 147.6%, to $4.9 million for the year ended December 31, 2008 from a net loss of $2.0 million for the year ended December 31, 2007 primarily due to abandoned public offering costs recorded in 2008 offset by savings resulting from improvements in productivity at our McClane Canyon mining complex.
EBITDA. The following table presents EBITDA by reportable segment for the years ended December 31, 2007 and 2008:
| Segment | Year Ended December 31, 2007 | Year Ended December 31, 2008 | Increase (Decrease) | |||||||
|---|---|---|---|---|---|---|---|---|---|---|
| | (in millions) | |||||||||
Central Appalachia | $ | 52.3 | $ | 24.9 | $ | (27.4 | ) | |||
Northern Appalachia | 13.9 | 20.4 | 6.5 | |||||||
Eastern Met * | n/a | (1.6 | ) | (1.6 | ) | |||||
Other | 0.7 | (0.8 | ) | (1.5 | ) | |||||
Total | $ | 66.9 | $ | 42.9 | $ | (24.0 | ) | |||
Total EBITDA for the year ended December 31, 2008 was $42.9 million, a decrease of $24.0 million from $66.9 million for the year ended December 31, 2007. The decrease from 2007 to 2008 is primarily a result of a $29.8 million decrease in net income offset by a $5.7 million increase in DD&A. Results of operations from our Eastern Met segment are recorded using the equity method and are reflected as a single line item in our financial statements. Therefore, depreciation, depletion and amortization, interest expense and income tax expense (benefit) are not presented separately for our Eastern Met segment. Please read "—Reconciliation of EBITDA to Net Income by Segment" for reconciliations of EBITDA to net income on a segment basis.
Reconciliation of EBITDA to Net Income by Segment
EBITDA represents net income before interest expense, income taxes and depreciation, depletion and amortization. EBITDA is used by management primarily as a measure of each of our segments' operating performance. Because not all companies calculate EBITDA identically, our calculation may not be comparable to similarly titled measures of other companies. EBITDA should not be considered an alternative to net income, income from operations, cash flows from operating activities or any other measure of financial performance or liquidity presented in accordance with GAAP. The following tables present reconciliations of EBITDA to net income for each of the periods indicated.
| Year Ended December 31, 2007 | Central Appalachia | Northern Appalachia | Other | Total | ||||||||||
|---|---|---|---|---|---|---|---|---|---|---|---|---|---|---|
| | (in millions) | |||||||||||||
Net income (loss) | $ | 23.8 | $ | 8.9 | $ | (2.0 | ) | $ | 30.7 | |||||
Plus: | ||||||||||||||
Depreciation, depletion and amortization | 24.5 | 4.3 | 1.9 | 30.7 | ||||||||||
Interest expense | 4.1 | 0.7 | 0.8 | 5.6 | ||||||||||
Income tax (benefit) | (0.1 | ) | — | — | (0.1 | ) | ||||||||
EBITDA† | $ | 52.3 | $ | 13.9 | $ | 0.7 | $ | 66.9 | ||||||
| Year Ended December 31, 2008 | Central Appalachia | Northern Appalachia | Eastern Met * | Other | Total | ||||||||||||
|---|---|---|---|---|---|---|---|---|---|---|---|---|---|---|---|---|---|
| | (in millions) | ||||||||||||||||
Net income (loss) | $ | (3.5 | ) | $ | 10.9 | $ | (1.6 | ) | $ | (4.9 | ) | $ | 0.9 | ||||
Plus: | |||||||||||||||||
Depreciation, depletion and amortization | 24.9 | 8.1 | — | 3.4 | 36.4 | ||||||||||||
Interest expense | 3.6 | 1.4 | — | 0.6 | 5.5 | ||||||||||||
EBITDA† | $ | 24.9 | $ | 20.4 | $ | (1.6 | ) | $ | (0.9 | ) | $ | 42.9 | |||||
| Year Ended December 31, 2009 | Central Appalachia | Northern Appalachia | Eastern Met * | Other | Total | ||||||||||||
|---|---|---|---|---|---|---|---|---|---|---|---|---|---|---|---|---|---|
| | (in millions) | ||||||||||||||||
Net income (loss) | $ | 0.6 | $ | 17.6 | $ | 0.9 | $ | 0.4 | $ | 19.5 | |||||||
Plus: | |||||||||||||||||
Depreciation, depletion and amortization | 23.9 | 7.9 | — | 4.5 | 36.3 | ||||||||||||
Interest expense | 3.5 | 1.8 | — | 0.9 | 6.2 | ||||||||||||
EBITDA | $ | 28.0 | $ | 27.3 | $ | 0.9 | $ | 5.8 | $ | 62.0 | |||||||
| Three Months Ended March 31, 2009 | Central Appalachia | Northern Appalachia | Eastern Met * | Other | Total | |||||||||||||||||||||||||||||
|---|---|---|---|---|---|---|---|---|---|---|---|---|---|---|---|---|---|---|---|---|---|---|---|---|---|---|---|---|---|---|---|---|---|---|
| Six Months Ended June 30, 2009 | Six Months Ended June 30, 2009 | Central Appalachia | Northern Appalachia | Eastern Met * | Other | Total | ||||||||||||||||||||||||||||
| | | (in millions) | | (in millions) | ||||||||||||||||||||||||||||||
Net income (loss) | Net income (loss) | $ | (4.1 | ) | $ | 5.4 | $ | — | $ | 0.7 | $ | 2.0 | Net income (loss) | $ | (3.7 | ) | $ | 9.8 | $ | (0.3 | ) | $ | 1.6 | $ | 7.4 | |||||||||
Plus: | Plus: | Plus: | ||||||||||||||||||||||||||||||||
Depreciation, depletion and amortization | 6.8 | 2.0 | — | 1.1 | 9.9 | Depreciation, depletion and amortization | 13.6 | 4.0 | — | 2.3 | 19.9 | |||||||||||||||||||||||
Interest expense | 0.7 | 0.3 | — | 0.2 | 1.2 | Interest expense | 1.7 | 0.8 | — | 0.4 | 2.9 | |||||||||||||||||||||||
EBITDA† | EBITDA† | $ | 3.5 | $ | 7.7 | $ | — | $ | 1.9 | $ | 13.1 | EBITDA† | $ | 11.6 | $ | 14.6 | $ | (0.3 | ) | $ | 4.2 | $ | 30.1 | |||||||||||
| Three Months Ended March 31, 2010 | Central Appalachia | Northern Appalachia | Eastern Met * | Other | Total | |||||||||||||||||||||||||||||
|---|---|---|---|---|---|---|---|---|---|---|---|---|---|---|---|---|---|---|---|---|---|---|---|---|---|---|---|---|---|---|---|---|---|---|
| Six Months Ended June 30, 2010 | Six Months Ended June 30, 2010 | Central Appalachia | Northern Appalachia | Eastern Met * | Other | Total | ||||||||||||||||||||||||||||
| | | (in millions) | | (in millions) | ||||||||||||||||||||||||||||||
Net income (loss) | Net income (loss) | $ | 4.7 | $ | 2.6 | $ | (0.1 | ) | $ | (0.6 | ) | $ | 6.6 | Net income (loss) | $ | 10.2 | $ | 4.6 | $ | 0.4 | $ | (1.5 | ) | $ | 13.7 | |||||||||
Plus: | Plus: | Plus: | ||||||||||||||||||||||||||||||||
Depreciation, depletion and amortization | 4.7 | 1.9 | — | 1.1 | 7.7 | Depreciation, depletion and amortization | 9.5 | 4.0 | — | 2.3 | 15.8 | |||||||||||||||||||||||
Interest expense | 0.6 | 0.6 | — | 0.3 | 1.5 | Interest expense | 1.2 | 1.1 | — | 0.5 | 2.8 | |||||||||||||||||||||||
EBITDA† | EBITDA† | $ | 10.1 | $ | 5.0 | $ | (0.1 | ) | $ | 0.8 | $ | 15.8 | EBITDA† | $ | 20.9 | $ | 9.7 | $ | 0.4 | $ | 1.3 | $ | 32.3 | |||||||||||
Liquidity and Capital Resources
Liquidity
Our business is capital intensive and requires substantial capital expenditures for purchasing, upgrading and maintaining equipment used in developing and mining our reserves, as well as complying with applicable environmental and mine safety laws and regulations. Our principal liquidity requirements are to finance current operations, fund capital expenditures, including acquisitions from time to time, and service our debt. Following completion of this offering, we expect our sources of liquidity to include cash generated by our operations, borrowings under our credit agreement and issuances of equity and debt securities. Furthermore, following the completion of this offering, we will make a minimum quarterly distribution of $0.445 per unit per quarter, which equates to $11.3 million per quarter, or $45.0 million per year, based on the number of common and subordinated units and the general partner interest to be outstanding immediately after completion of this offering, to the extent we have sufficient cash from our operations after establishment of cash reserves and payment of fees and expenses, including payments to our general partner and its affiliates. We do not have a legal obligation to pay this distribution. Please read "Cash Distribution Policy and Restrictions on Distributions."
The principal indicators of our liquidity are our cash on hand and availability under our credit agreement. As of March 31,June 30, 2010, our available liquidity was $61.9$76.9 million, including cash on hand of $0.3$0.2 million and $61.6$76.7 million available under our credit agreement.
Please read "—Capital Expenditures" for a further discussion of the impact on liquidity.
Cash Flows
ThreeSix Months Ended March 31,June 30, 2010 Compared to ThreeSix Months Ended March 31,June 30, 2009. Net cash provided by operating activities was $4.6$24.9 million for the threesix months ended March 31,June 30, 2010 as compared to $3.3$20.2 million for the threesix months ended March 31,June 30, 2009. This increase in cash provided by operating activities was primarily the result of an increase in net earnings due to favorable sales prices and our successful efforts to reduce costs and a decrease in the use of net working capital related to accrued expenses and other payables.liabilities.
Net cash used in investing activities was $6.5$11.6 million for the threesix months ended March 31,June 30, 2010 as compared to $11.7$19.4 million for the threesix months ended March 31,June 30, 2009. The decrease in cash used forin investing activities was primarily due to a reduction in our expenditures for plant and equipment.equipment acquisitions and a decrease in amounts loaned to the joint venture.
Net cash provided byused for financing activities for the threesix months ended March 31,June 30, 2010 was $1.6$13.8 million, which primarily representsrepresented the net repayment of borrowings under our credit agreement. Net cash used for financing activities for the six months ended June 30, 2009 was $2.3 million, which primarily represented the repayment of a loan from Wexford offset by net borrowings under our revolving line of credit offset by repayments of other long-term debt. Net cash provided by financing activities for the three months ended March 31, 2009 was $7.0 million, which represents borrowing under our line of credit offset by repayments of other long-term debt.facility.
Year Ended December 31, 2009 Compared to Year Ended December 31, 2008. Net cash provided by operating activities was $41.5 million for the year ended December 31, 2009 as compared to $57.2 million for the year ended December 31, 2008. This decrease in 2009 as compared to 2008 was primarily the result of increases in accounts receivable, decreases in accounts payable and asset retirement obligations offset by higher net income.
For the year ended December 31, 2009, net cash used in investing activities was $27.3 million as compared to $106.6 million for the year ended December 31, 2008. The
decrease in cash used for investing activities in 2009 as compared to 2008 was primarily due to a reduction in our expenditures for mining equipment and coal properties.
Net cash used by financing activities was $15.4 million for the year ended December 31, 2009 as compared to net cash provided by financing activities of $47.8 million for the year ended December 31, 2008. In 2009 as compared to 2008, we had sufficient cash provided by operations to finance a larger portion of our growth and relied less on financing activities. In 2009, we borrowed $27.7 million less than the year in 2008 and paid back an additional $35.4 million of the debt as compared to the year ended December 31, 2008.
Year Ended December 31, 2008 Compared to the Year Ended December 31, 2007. Net cash provided by operating activities was $57.2 million for the year ended December 31, 2008 as compared to $52.5 million for the year ended December 31, 2007. The greater amount in 2008 was primarily due to an increase in cash provided from decreases in accounts receivable offset by a decrease in net income.
Net cash used in investing activities for the year ended December 31, 2008 was $106.6 million as compared to $28.1 million in the year ended December 31, 2007. This increase was the result of additional investments in equipment, asset acquisitions and coal reserves in 2008 as compared to 2007.
Net cash generated by financing activities was $47.8 million for the year ended December 31, 2008 as compared to net cash used in financing activities of $21.2 million for the year ended December 31, 2007. We made $25.0 million less in debt payments and borrowed $35.1 million more in cash in the year ended December 31, 2008 as compared to the year ended December 31, 2007 in order to finance acquisitions of additional operations and replacements of equipment.
Contractual Obligations
We have contractual obligations that are required to be settled in cash. The amount of our contractual obligations as of December 31, 2009 were as follows:
| | Payments Due by Period | ||||||||||||||||
|---|---|---|---|---|---|---|---|---|---|---|---|---|---|---|---|---|---|
| | Total | Less than 1 Year | 1-3 Years | 4-5 Years | More than 5 Years | ||||||||||||
| | (in thousands) | ||||||||||||||||
Long-term debt obligations (including interest) (1) | $ | 122,137 | $ | 2,242 | $ | 1,508 | $ | 114,822 | $ | 3,565 | |||||||
Asset retirement obligations | 45,101 | 5,428 | 10,000 | 10,000 | 19,673 | ||||||||||||
Operating lease obligations (2) | 8,204 | 4,883 | 2,332 | 989 | — | ||||||||||||
Diesel fuel obligations | 7,437 | 7,437 | — | — | — | ||||||||||||
Ammonia nitrate obligations | 2,392 | 2,392 | — | — | — | ||||||||||||
Advance royalties (3) | 38,444 | 4,207 | 7,764 | 7,563 | 18,910 | ||||||||||||
Retiree medical obligations | 5,210 | 95 | 473 | 888 | 3,754 | ||||||||||||
Total | $ | 228,925 | $ | 26,684 | $ | 22,077 | $ | 134,262 | $ | 45,902 | |||||||
Capital Expenditures
Our mining operations require investments to expand, upgrade or enhance existing operations and to meet environmental and safety regulations. Maintenance capital expenditures are those capital expenditures required to maintain our long-term operating capacity. Examples of maintenance capital expenditures include expenditures associated with the replacement of equipment and coal reserves, whether through the expansion of an existing mine or the acquisition or development of new reserves, to the extent such expenditures are made to maintain our long-term operating capacity. Expansion capital expenditures are those capital expenditures that we expect will increase our operating capacity over the long term. Examples of expansion capital expenditures include the acquisition of reserves, equipment or a new mine or the expansion of an existing mine, to the extent such expenditures are expected to expand our long-term operating capacity.
For the year ending December 31, 2010, we have budgeted $31.1$37.4 million in capital expenditures. We believe that we have sufficient liquid assets, cash flows from operations and borrowing capacity under our credit agreement to meet our financial commitments, debt service obligations, contingencies and anticipated capital expenditures. However, we are subject to business and operational risks that could adversely affect our cash flow. A material decrease in our cash flows would likely produce a corollary adverse effect on our borrowing capacity. From time to time, we may issue debt and equity securities.
Off-Balance Sheet Arrangements
In the normal course of business, we are a party to certain off-balance sheet arrangements. These arrangements include guarantees and financial instruments with off-balance sheet risk, such as bank letters of credit and surety bonds. No liabilities related to these arrangements are reflected in our consolidated balance sheet, and we do not expect any material adverse effects on our financial condition, results of operations or cash flows to result from these off-balance sheet arrangements.
Federal and state laws require us to secure certain long-term obligations related to mine closure and reclamation costs. We typically secure these obligations by using surety bonds, an off-balance sheet instrument. The use of surety bonds is less expensive for us than the alternative of posting a 100% cash bond or a bank letter of credit, either of which would require a greater use of our credit agreement. We then use bank letters of credit to secure our surety bonding obligations as a lower cost alternative than securing those bonds with a committed bonding facility pursuant to which we are required to provide bank letters of credit in an amount of up to 25% of the aggregate bond liability. To the extent that surety bonds become unavailable, we would seek to secure our reclamation obligations with letters of credit, cash deposits or other suitable forms of collateral.
As of March 31, 2009,June 30, 2010, we had $21.4$21.1 million in letters of credit outstanding, of which $18.5$18.2 million served as collateral for surety bonds.
Credit Agreement
Rhino Energy LLC, our wholly owned subsidiary, as borrower, and our operating subsidiaries, as guarantors, are parties to our $200.0 million credit agreement, which is available for general partnership purposes, including working capital and capital expenditures, and may be increased by up to $75.0 million with the consent of the lenders, so long as there is no event of default. Of the $200.0 million, $50.0 million is available for letters of credit. As of March 31,June 30, 2010, we had borrowings outstanding under our credit agreement of approximately
$117.0102.1 million and $21.4$21.1 million of letters of credit in place, leaving approximately $61.6$76.7 million of availability under our credit agreement. Upon application of the net proceeds from this offering and the related capital contribution from our general partner as described under "Use of Proceeds," we will have $50.1$34.5 million of indebtedness outstanding under our credit agreement. On June 30, 2010, in connection with this offering, we amended our credit agreement. References to our credit agreement refer to our credit agreement as amended.
Our obligations under the credit agreement are secured by substantially all of our assets, including the equity interests in our subsidiaries. Indebtedness under the credit agreement is guaranteed by us and all of our wholly owned subsidiaries.
Our credit agreement bears interest at either (1) LIBOR plus 3.0% to 3.5% per annum, depending on our leverage ratio, or (2) a base rate that is the sum of (i) the higher of (a) the prime rate, (b) the federal funds rate plus 0.5% or (c) LIBOR plus 1.0% and (ii) 1.5% to 2.0% per annum, depending on our leverage ratio. We incur letter of credit fees equal to the then applicable spread above LIBOR on the undrawn face amount of standby letters of credit and a 15 basis point fronting fee payable to the administrative agent on the aggregate face amount of such letters of credit. In addition, we incur a commitment fee on the unused portion of the credit agreement at a rate of 0.5% per annum. The credit agreement will mature in February 2013. At that time, the credit agreement will terminate and all outstanding amounts thereunder will be due and payable, unless the credit agreement is amended.
The credit agreement contains various covenants that may limit, among other things, our ability to:
The credit agreement also contains financial covenants requiring us to maintain:
If an event of default exists under the credit agreement, the lenders are able to accelerate the maturity of the credit agreement and exercise other rights and remedies. The credit agreement prohibits us from making distributions if any potential default or event of default, as defined in
the credit agreement, occurs or would result from such distribution. Each of the following could be an event of default:
Critical Accounting Policies and Estimates
Our financial statements are prepared in accordance with accounting principles that are generally accepted in the United States. The preparation of these financial statements requires management to make estimates and judgments that affect the reported amount of assets, liabilities, revenues and expenses as well as the disclosure of contingent assets and liabilities. Management evaluates its estimates on an on-going basis. Management bases its estimates and judgments on historical experience and other factors that are believed to be reasonable under the circumstances. Actual results may differ from the estimates used. Note 2 to the Rhino Energy LLC audited historical consolidated financial statements and Note 2 to the Rhino Energy LLC unaudited historical condensed consolidated financial statements included elsewhere in this prospectus provides a summary of all significant accounting policies. We believe that of these significant accounting policies, the following may involve a higher degree of judgment or complexity.
Company Environment and Risk Factors
We, in the course of our business activities, are exposed to a number of risks, including: fluctuating market conditions of coal, truck and rail transportation, fuel costs, changing government regulations, unexpected maintenance and equipment failure, employee benefits cost control, changes in estimates of proven and probable coal reserves, as well as the ability of us to maintain adequate financing, necessary mining permits and control of sufficient recoverable coal properties. In addition, adverse weather and geological conditions may increase mining costs, sometimes substantially.
Investment in Joint Venture
Investments in other entities are accounted for using the consolidation, equity method or cost basis depending upon the level of ownership, our ability to exercise significant influence over the operating and financial policies of the investee and whether we are determined to be the primary beneficiary. Equity investments are recorded at original cost and adjusted periodically to recognize our proportionate share of the investees' net income or losses after the date of investment. When net losses from an equity method investment exceed its carrying amount, the investment balance is reduced to zero and additional losses are not provided for. We
resume accounting for the investment under the equity method when the entity subsequently reports net income and our share of that net income exceeds the share of net losses not recognized during the period the equity method was suspended. Investments are written down only when there is clear evidence that a decline in value that is other than temporary has occurred.
In May 2008, we entered into a joint venture, Rhino Eastern, with an affiliate of Patriot to acquire the Rhino Eastern mining complex. To initially capitalize the joint venture, we contributed approximately $16.1 million for a 51% ownership interest in the joint venture, and we account for the investment in the joint venture and its results of operations under the equity method. We consider the operations of this entity to comprise a reporting segment and have provided supplemental detail related to this operation in Note 15 to the Rhino Energy LLC unaudited historical condensed consolidated financial statements and Note 17 to the Rhino Energy LLC audited historical consolidated financial statements that are included elsewhere in this prospectus.
In determining that we were not the primary beneficiary of the variable interest entity for the years ended December 31, 2009 and 2008, we performed a qualitative and quantitative analysis of the variable interests in the joint venture. This included an analysis of the expected losses and residual returns of the joint venture. We concluded that we are not the primary beneficiary of the joint venture primarily because of certain contractual arrangements by the joint venture with Patriot. Mandatory pro rata additional contributions not to exceed $10 million in the aggregate could be required of the joint venture partners which we would be obligated to fund based upon our 51% ownership interest.
As of March 31,June 30, 2010, December 31, 2009 and December 31, 2008, we have recorded our equity method investment of $17,056,473,$17,600,307, $17,186,362 and $16,293,489, respectively, as a long-term asset. Our maximum exposure to losses associated with our involvement in this variable interest entity would be limited to our equity investment of $17,056,473$17,600,307 as of March 31,June 30, 2010, plus any additional capital contributions, if required. We had not provided any additional contractually required support as of December 31, 2009; however, as disclosed in Note 12 to the Rhino Energy LLC audited historical consolidated financial statements that are included elsewhere in this prospectus, we had provided a loan in the amount of $377,183 to the joint venture.
Concentrations of Credit Risk
We do not require collateral or other security on accounts receivable. Credit risk is controlled through credit approvals and monitoring procedures. Please read Note 13 to the Rhino Energy LLC audited historical consolidated financial statements and Note 12 to the Rhino Energy LLC unaudited historical condensed consolidated financial statements included elsewhere in this prospectus for discussion of major customers.
Property, Plant and Equipment
Property, plant, and equipment, including coal properties, mine development costs and construction costs, are recorded at cost, which includes construction overhead and interest, where applicable. Expenditures for major renewals and betterments are capitalized, while expenditures for maintenance and repairs are expensed as incurred. Mining and other equipment and related facilities are depreciated using the straight-line method based upon the shorter of estimated useful lives of the assets or the estimated life of each mine. Coal properties are depleted using the units-of-production method, based on estimated proven and probable reserves. Mine development costs are amortized using the units-of-production method, based on
estimated proven and probable reserves. Gains or losses arising from sales or retirements are included in current operations.
On March 30, 2005, the Financial Accounting Standards Board (FASB) ratified the consensus reached by the Emerging Issues Task Force, or EITF, on ASC Topic 930 (previously "EITF 04-06", "Accounting for Stripping Costs in the Mining Industry"). ASC Topic 930 applies to stripping costs incurred in the production phase of a mine for the removal of overburden or waste materials for the purpose of obtaining access to coal that will be extracted. Under the rule, stripping costs incurred during the production phase of the mine are variable production costs that are included in the cost of inventory produced and extracted during the period the stripping costs are incurred. The guidance in ASC Topic 930 consensus is effective for fiscal years beginning after December 15, 2005, with early adoption permitted. We have recorded stripping costs for all its surface mines incurred during the production phase as variable production costs that are included in the cost of inventory produced. We define a surface mine as a location where we utilize operating assets necessary to extract coal, with the geographic boundary determined by property control, permit boundaries, and/or economic threshold limits. Multiple pits that share common infrastructure and processing equipment may be located within a single surface mine boundary, which can cover separate coal seams that typically are recovered incrementally as the overburden depth increases. In accordance with ASC Topic 930, we define a mine in production as one from which saleable minerals have begun to be extracted (produced) from an ore body, regardless of the level of production; however, the production phase does not commence with the removal of de minimis saleable mineral material that occurs in conjunction with the removal of overburden or waste material for the purpose of obtaining access to an ore body. We capitalize only the development cost of the first pit at a mine site that may include multiple pits.
Asset Impairments
We follow ASC Topic 360 (previously Statement of Financial Accounting Standards, or SFAS, No. 144, "Accounting for the Impairment or Disposal of Long-Lived Assets"), which requires that projected future cash flows from use and disposition of assets be compared with the carrying amounts of those assets, when potential impairment is indicated. When the sum of projected undiscounted cash flows is less than the carrying amount, impairment losses are recognized. In determining such impairment losses, discounted cash flows are utilized to determine the fair value of the assets being evaluated. Also, in certain situations, expected mine lives are shortened because of changes to planned operations. When that occurs and it is determined that the mine's underlying costs are not recoverable in the future, reclamation and mine closing obligations are accelerated and the mine closing accrual is increased accordingly. To the extent it is determined that asset carrying values will not be recoverable during a shorter mine life, a provision for such impairment is recognized. There were no impairment losses recorded during the years ended December 31, 2009 and 2008.
Asset Retirement Obligations
ASC Topic 410 (previously SFAS No. 143, "Accounting for Asset Retirement Obligations") addresses asset retirement obligations that result from the acquisition, construction, or normal operation of long-lived assets. It requires companies to recognize asset retirement obligations at fair value when the liability is incurred or acquired. Upon initial recognition of a liability, an amount equal to the liability is capitalized as part of the related long-lived asset and allocated to expense over the useful life of the asset. We have recorded the asset retirement costs in coal properties.
We estimate our future cost requirements for reclamation of land where we have conducted surface and underground mining operations, based on our interpretation of the technical standards of regulations enacted by the U.S. Office of Surface Mining, as well as state regulations. These costs relate to reclaiming the pit and support acreage at surface mines and sealing portals at underground mines. Other reclamation costs are related to refuse and slurry ponds, as well as holding and related termination or exit costs.
We expense contemporaneous reclamation which is performed prior to final mine closure. The establishment of the end of mine reclamation and closure liability is based upon permit requirements and requires significant estimates and assumptions, principally associated with regulatory requirements, costs and recoverable coal reserves. Annually, we review our end of mine reclamation and closure liability and make necessary adjustments, including mine plan and permit changes and revisions to cost and production levels to optimize mining and reclamation efficiency. When a mine life is shortened due to a change in the mine plan, mine closing obligations are accelerated, the related accrual is increased and the related asset is reviewed for impairment, accordingly.
The adjustments to the liability from annual recosting reflect changes in expected timing, cash flow, and the discount rate used in the present value calculation of the liability. Changes in the asset retirement obligations for the year ended December 31, 2009 and the threesix months ended March 31,June 30, 2010 were calculated with the same discount rate (10%) used for the year ended December 31, 2008. Other recosting adjustments to the liability are made annually based on inflationary cost increases and changes in the expected operating periods of the mines.
Workers' Compensation Benefits
Certain of our subsidiaries are liable under federal and state laws to pay workers' compensation and coal workers' pneumoconiosis ("black lung") benefits to eligible employees, former employees and their dependents. We currently utilize an insurance program and state workers' compensation fund participation to secure our on-going obligations depending on the location of the operation. Premium expense for workers' compensation benefits is recognized in the period in which the related insurance coverage is provided.
Revenue Recognition
Most of our revenues are generated under supply contracts with electric utilities, industrial companies or other coal-related organizations, primarily in the eastern United States. Revenue is recognized and recorded when shipment or delivery to the customer has occurred, prices are fixed or determinable and the title or risk of loss has passed in accordance with the terms of the supply contract. Under the typical terms of these contracts, risk of loss transfers to the customers at the mine or port, when the coal is loaded on the rail, barge, truck or other transportation source that delivers coal to its destination. Advance payments are deferred and recognized in revenue as coal is shipped and title has passed.
Coal sales revenues also result from the sale of brokered coal produced by others. The revenues related to brokered coal sales are included in coal sales revenues on a gross basis and the corresponding cost of the coal from the supplier is recorded in cost of coal sales in accordance with ASC Topic 605-45, "Principal Agent Considerations."
Freight and handling costs paid directly to third-party carriers and invoiced to coal customers are recorded as freight and handling costs and freight and handling revenues, respectively.
Other revenues generally consist of limestone sales, coal handling and processing, rebates and rental income. With respect to other revenues recognized in situations unrelated to the shipment of coal, we carefully review the facts and circumstances of each transaction and do not recognize revenue until the following criteria are met: persuasive evidence of an arrangement exists, delivery has occurred or services have been rendered, the seller's price to the buyer is fixed or determinable and collectibility is reasonably assured. Advance payments received are deferred and recognized in revenue when earned.
Derivative Financial Instruments
During the year ended December 31, 2008, we used futures contracts to manage the risk of fluctuations in the sales price of coal. We did not use derivative financial instruments for trading or speculative purposes. We recorded the derivative financial instruments as either assets or liabilities, at fair value, in accordance with ASC Topic 815, "Derivatives and Hedging." All futures contracts were settled as of December 31, 2008. We also use diesel fuel forward contracts to manage the risk of fluctuations in the cost of diesel fuel. Our diesel fuel forward contracts qualify for the normal purchase normal sale, or NPNS, exception prescribed by ASC Topic 815, based on management's intent and ability to take physical delivery of the diesel fuel.
Income Taxes
We are considered a partnership for income tax purposes. Accordingly, the members report our taxable income or loss on their individual tax returns.
Recent Accounting Pronouncements
Effective January 1, 2008, we adopted the new guidance codified in ASC Topic 820 (previously SFAS No. 157, "Fair Value Measures"), which clarifies the definition of fair value, establishes a framework for measuring fair value and expands the disclosures on fair value measurements. ASC Topic 820 applies whenever other statements require or permit assets or liabilities to be measured at fair value. ASC Topic 820 requirements for certain non-financial assets and liabilities were permitted to be deferred until the first quarter of 2009 in accordance with Financial Accounting Standards Board, or FASB, Staff Position 157-2,Effective Date of ASC Topic 820. We adopted this new guidance effective January 1, 2009, at the time of the adoption, there were no nonfinancial assets or nonfinancial liabilities that were measured at fair value on a nonrecurring basis. ASC Topic 820 establishes the following fair value hierarchy that prioritizes the inputs used to measure fair value:
ASC Topic 805 (previously SFAS No. 141, "Business Combinations"), among other things, provides guidance for the way companies account for business combinations. This guidance requires transaction-related costs to be expensed as incurred, which were previously accounted for as a cost of acquisition. ASC Topic 805 also requires acquirers to estimate the acquisition-date fair value of any contingent consideration and recognize any subsequent
changes in the fair value of contingent consideration in earnings. In addition, restructuring costs the acquirer was not obligated to incur shall be recognized separately from the business acquisition. We adopted this guidance on a prospective basis as of January 1, 2009. The adoption of this guidance did not require remeasurement of any prior balances but will impact accounting for business combinations after date of adoption. This guidance was applied to the purchase accounting of Triad Roof Support Systems LLC.
ASC Topic 810 (previously SFAS No. 160, "Noncontrolling Interests in Consolidated Financial Statements, An Amendment of ARB No. 51") requires all entities to report noncontrolling interests in subsidiaries as a separate component of equity in the consolidated financial statements. A single method of accounting has been established for changes in a parent's ownership interest in a subsidiary that do not result in deconsolidation. Companies no longer recognize a gain or loss on partial disposals of a subsidiary where control is retained. In addition, in partial acquisitions where control is obtained, the acquiring company will recognize and measure at fair value 100% of the assets and liabilities, including goodwill, as if the entire target company had been acquired. We adopted this guidance as of January 1, 2009.
In May 2009, the FASB issued guidance under ASC Topic 855 (previously SFAS No. 165, "Subsequent Events"), which provided general accounting standards for the disclosure of events that occur after the balance sheet date but before the financial statements are issued or available for issue. This guidance does not apply to subsequent events or transactions that are within the scope of other generally accepted accounting principles that provide different guidance on the accounting treatment of subsequent events. ASC Topic 855 includes a new required disclosure of the date through which an entity, other than a public filer, has evaluated subsequent events and the basis for that date. Such disclosures are required for financial statements issued after June 15, 2009 and are included in these consolidated financial statements.
In June 2009, the FASB issued guidance under ASC Topic 810 (previously SFAS No. 167, "Amendments to FASB Interpretation No. 46(R)"), which amended the consolidation guidance for variable interest entities, or VIEs. The new guidance requires a company to perform an analysis to determine whether its variable interest gives it a controlling financial interest in a VIE. The amendment, which requires ongoing reassessments, redefines the primary beneficiary as the party that (1) has the power to direct the activities of a VIE that most significantly impact the entity's economic performance and (2) has the obligation to absorb losses of the entity that could potentially be significant to the VIE or the right to receive benefits from the entity that could potentially be significant to the VIE. The guidance includes enhanced disclosures about a company's involvement in a VIE and also eliminates the exemption for qualifying special purpose entities. We evaluated this guidance and determined that certain criteria is not met for consolidation of the VIE and will continue to report the results of the VIE using the equity method of accounting.
In June 2009, the FASB adopted ASC Topic 105 (previously SFAS No. 168, "The FASB Accounting Standards Codification and the Hierarchy of Generally Accepted Accounting Principles, a replacement of FASB Statement No. 162"), which is effective for periods after September 15, 2009. The ASC became the source of authoritative GAAP applied to nongovernmental entities. Rules and interpretive releases of the SEC under authority of federal securities laws are also sources of authoritative GAAP for SEC registrants. All other non-grandfathered non-SEC accounting literature not included in the ASC is considered non-authoritative. We adopted the ASC as the single source of authoritative nongovernmental generally accepted accounting principles.
ASC 260 affects how a master limited partnership, or MLP, allocates income between its general partner, which typically holds incentive distribution rights, along with the general partner interest, and the limited partners. It is not uncommon for MLPs to experience timing differences between the recognition of income and partnership distributions. The amount of incentive distributions is typically calculated based on the amount of distributions paid to the MLP's partners. The issue is whether current period earnings of an MLP should be allocated to the holders of incentive distribution rights as well as the holders of the general and limited partner interests when applying the two-class method. The conclusion was that when current period earnings are in excess of cash distributions, the undistributed earnings should be allocated to the holders of the general partner interest, the holders of the limited partner interest and incentive distribution rights holders based upon the terms of the partnership agreement. Under this model, contractual limitations on distributions to holders of incentive distribution rights would be considered when determining the amount of earnings to allocate to them. That is, undistributed earnings would not be considered available cash for purposes of allocating earnings to incentive distribution rights holders. Conversely, when cash distributions are in excess of earnings, net income (or loss) should be reduced (increased) by the distributions made to the holders of the general partner interest, the holders of the limited partner interest and incentive distribution rights holders. The resulting net loss would then be allocated to the holders of the general partner interest and the holders of the limited partner interest based on their respective sharing of the losses based upon the terms of the partnership agreement. This guidance is effective for fiscal years beginning after December 15, 2008 and interim periods within those fiscal years. The accounting treatment is effective for all financial statements presented. We do not expect the impact of the adoption of this item on our presentation of earnings per unit to be significant.
Quantitative and Qualitative Disclosures About Market Risk
Market risk is the risk of loss arising from adverse changes in market rates and prices. The principal market risks to which we are exposed are commodity risk and interest rate risk.
Commodity Price Risk
We manage our commodity price risk for coal sales through the use of supply contracts and the use of forward contracts.
Some of the products used in our mining activities, such as diesel fuel, explosives and steel products for roof support used in our underground mining, are subject to price volatility. Through our suppliers, we utilize forward purchases to manage the exposure related to this volatility. A hypothetical increase of $0.10 per gallon for diesel fuel would have reduced net income by $0.8 million for the year ended December 31, 2009 and $0.1$0.3 million for the threesix months ended March 31,June 30, 2010. A hypothetical increase of 10% in steel prices would have reduced net income by $1.2 million for the year ended December 31, 2009 and $0.3$0.4 million for the threesix months ended March 31,June 30, 2010. A hypothetical increase of 10% in explosives prices would have reduced net income by $0.8 million for the year ended December 31, 2009 and $0.1 million for the threesix months ended March 31,June 30, 2010.
Interest Rate Risk
We have exposure to changes in interest rates on our indebtedness associated with our credit agreement. During the past year, we have been operating in a period of declining interest rates, and we have managed to take advantage of the trend to reduce our interest expense. A hypothetical increase or decrease in interest rates by 1% would have changed our interest expense by $1.4$1.3 million for the year ended December 31, 2009 and $0.3$0.6 million for the threesix months ended March 31,June 30, 2010.
Market and industry data and certain other statistical data used in this section are based on independent industry publications, government publications and other published independent sources. In this section, we refer to information regarding the coal industry in the United States and internationally from various third party organizations that are not affiliated with us, including the U.S. Department of Energy's Energy Information Administration, or EIA. The EIA's forecasts are based on a number of variables, and certain unexpected events such as a smaller number of power plants than projected being built, existing plants not significantly increasing capacity or utilization rates, or a change in the number of planned plant retirements among other events, could materially alter coal consumption. In addition, if greenhouse gas emissions from coal-fired power plants are subject to extensive new regulation in the United States pursuant to future U.S. treaty obligations, statutory or regulatory changes under the Clean Air Act, or federal or additional state adoption of a greenhouse gas regulatory scheme, or if reductions in greenhouse gas emissions are mandated by courts or through other legally enforceable mechanisms, absent other factors, the EIA's projections with respect to the demand for coal may not be realized.
Coal is a combustible mineral that serves as the primary fuel source for the generation of electric power and as a vital ingredient in the production of steel. According to the World Coal Institute, or WCI, coal fuels approximately 41% of global electricity generation, and approximately 68% of global steel production utilizes coal in the manufacturing process. In general, coal of all geological composition is characterized by end use as either steam coal, also known as thermal coal, or metallurgical coal. Nearly half of the United States' electricity is produced by burning steam coal. Metallurgical coal is heated to produce coke, which is used in smelting iron ore to make steel.
According to theBP Statistical Review of World Energy June 2010, or the BP Review, coal remains the world's most abundant fossil fuel, with a global reserve to production ratio of approximately 119 years. Coal is the least expensive fossil fuel when measured based on the cost per Btu. Due to low cost and available supply, coal represented approximately 29% of the world energy consumption in 2009, the highest since 1970, according to the BP Review.
Coal is the most abundant fossil fuel in the United States, representing the vast majority of the nation's total fossil fuel reserves. The United States has the largest proved reserves of coal in the world, with approximately 263 billion tons. The United States is the second largest producer of coal after China. According to the EIA, in 2009 the United States produced approximately 1,072.8 million tons of coal and exported approximately 59.1 million tons of coal. At this production rate, the United States has approximately 245 years of coal supply remaining.
Key attributes in grading metallurgical coal are its sulfur, ash and moisture content and coking characteristics, as compared to the key attributes in grading steam coal, which are heat value, ash and sulfur content. Metallurgical coal used to make coke must be low in sulfur and requires more thorough cleaning than coal used in power plants, and therefore it commands a higher price per ton than steam coal.
According to Energy Ventures Analysis, Inc., or EVA, the Central Appalachian region supplies the majority of U.S. metallurgical coal for both domestic consumption and for the export market. EVA estimates that the Central Appalachian region supplied approximately 88% of domestic metallurgical coal and 70% of U.S. exported metallurgical coal during 2008. According to the World Steel Association, or WSA, global steel production is expected to increase approximately 9% in 2010, with continued growth in China and India and increased
output from traditional steel-producing nations as steel mill utilization rates recover. The Asian market accounted for almost 15% of U.S. metallurgical coal exports in 2009, increasing approximately 32% in 2009 compared to 2008. In addition, the U.S. exported approximately one million tons of metallurgical coal to China, which had not received U.S. metallurgical coal since 2004.
Steam coal is used by electric utilities throughout the United States to generate power for industrial, commercial and residential consumption. The United States relies on coal for approximately 45% of its power generation, compared to approximately 23% for natural gas. Demand for electricity has historically been driven by U.S. economic growth, but it can fluctuate from year to year depending on weather patterns. In 2009, electricity consumption in the United States decreased approximately 4.0% from 2008, but the average growth rate in the decade prior to 2009 was approximately 0.7% per year according to EIA estimates. Because coal-fired generation is used in most cases to meet base load requirements, coal consumption has generally grown at the pace of electricity demand growth.
Recent Coal Market Conditions and Trends
The unprecedented reduction in U.S. electricity consumption in 2009 led to a decline in coal demand and record inventories. However, as the U.S. and global economies recover, we believe that steam coal consumption and the demand for metallurgical coal will increase and lead to higher prices. This is supported by the following trends:
65% compared to MayJune 2009. The following chart illustrates the rebound in monthly global steel production:
Total Monthly Global Steel Production
(million metric tons)
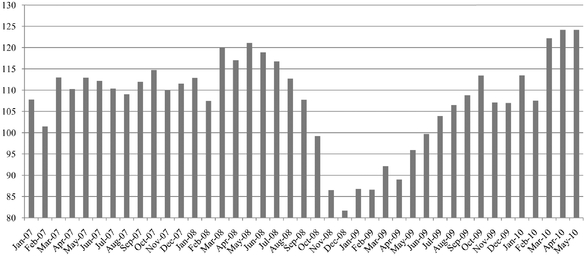
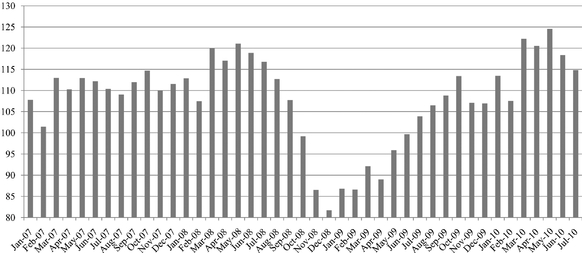
Source: World Steel Association
Coal Pricing
During the past ten years, the global marketplace for coal has experienced swings in the demand/supply balance. In periods of supply shortfall, as occurred from 2003 to early 2006 and again in late 2007 through late 2008, the prices for coal reached record highs in the United States. The increased worldwide demand for coal was primarily driven by higher prices for oil and natural gas and economic expansion, particularly in China, India and elsewhere in Asia. At the same time, infrastructure and demands and restrictions on exports in China contributed to a tightening of worldwide coal supply, affecting global prices of coal. The growth in China and India caused an increase in worldwide demand for raw materials and a disruption of expected coal exports from China to Japan, Korea and other countries. The recent global economic recession reduced the demand for coal.
Domestic spot coal prices by producing region can trade at vastly different prices due to coal characteristics and deliverability. Northern Appalachia and Central Appalachia spot coal prices typically trade at a premium to other regions due to its higher quality and closer proximity to transportation. At July 9,August 13, 2010, spot prices for Northern Appalachia and Central Appalachia are trading at prices above the average 2009 delivered prices for electric utilities. The following graph shows the historical spot coal prices for the following areas: Central Appalachia, Northern Appalachia, Illinois Basin, Uinta Basin and Powder River Basin.
Historical Average Weekly Coal Commodity Spot Prices
(Dollars per Short Ton)

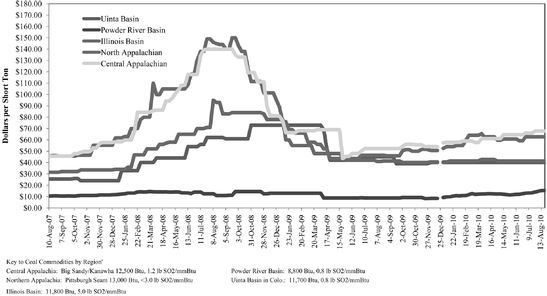
Source: EIA
Although coal production and consumption decreased in 2009, the average delivered price for coal continued to increase, rising for the sixth consecutive year. This was primarily caused by the number of coal contracts that were signed in 2008 during the dramatic rise of spot coal prices. The majority of coal sold in the electric power sector is through long-term supply contracts (generally defined as those having terms of one year or more), in conjunction with spot purchases to supplement the demand. As contracts expire and are renegotiated, the prevailing spot price influences the contract price. Metallurgical coal used in steel production continues to be priced at a large premium to steam coal.
The following table details the average delivered prices for coal by end use in the United States over the last five years:
| Average Delivered Price | 2005 | 2006 | 2007 | 2008 | 2009 | |||||||||||
|---|---|---|---|---|---|---|---|---|---|---|---|---|---|---|---|---|
| | ($ per ton) | |||||||||||||||
Electric Utilities | $ | 31.22 | $ | 34.26 | $ | 36.06 | $ | 41.32 | $ | 44.72 | ||||||
Independent Power Producers | $ | 30.39 | $ | 33.04 | $ | 33.11 | $ | 38.98 | $ | 39.72 | ||||||
Coke Plants/Metallurgical Coal | $ | 83.79 | $ | 92.87 | $ | 94.97 | $ | 118.09 | $ | 143.04 | ||||||
Other Industrial Plants | $ | 47.63 | $ | 51.67 | $ | 54.42 | $ | 63.44 | $ | 64.87 | ||||||
Commercial/Institutional | — | — | — | $ | 86.50 | $ | 97.28 | |||||||||
Source: EIA
Metallurgical coal prices in both the domestic and seaborne export markets increased significantly from 2006 to the third quarter of 2008. However, metallurgical coal prices began weakening in the fourth quarter of 2008 with the global economic downturn. Driven by increased demand for steel used in oil and natural gas production, global infrastructure projects, and the manufacturing of automobiles and consumer durables, metallurgical coal prices have begun to rebound as the global steel market begins to strengthen and U.S. steel plant utilization increases. Prices for seaborne metallurgical and steam coal are moving higher as China and India are increasing imports and traditional Asian-based customers are returning to pre-recession levels of coal consumption. Current spotSpot metallurgical coal prices have increased to the $200 per ton range.range, based on certain contracts entered into by third parties in the first quarter of 2010. The following table, derived from data prepared by the EIA, shows the historical average cost of steam coal and metallurgical coal in the export market.
| | International Export Prices | |||||||||||||||
|---|---|---|---|---|---|---|---|---|---|---|---|---|---|---|---|---|
| Average Free Alongside Ship Price | 2005 | 2006 | 2007 | 2008 | 2009 | |||||||||||
| | ($ per ton) | |||||||||||||||
Steam Coal | $ | 47.64 | $ | 46.25 | $ | 47.90 | $ | 57.35 | $ | 73.63 | ||||||
Metallurgical Coal | $ | 81.56 | $ | 90.81 | $ | 88.99 | $ | 134.62 | $ | 117.73 | ||||||
Source: EIA
U.S. Coal Producing Regions
Coal is mined from coal basins throughout the United States, with the major production centers located in the Appalachian, Interior and Western United States regions. The quality of coal varies by region. Heat value, sulfur content, ash content, moisture and suitability for production of metallurgical coal coke are important quality characteristics and are used to determine the best end use for the particular coal types.
U.S. coal production decreased considerably in 2009, dropping approximately 8.5% to approximately 1,073 million tons. The decline in coal production in 2009 was the largest percent decline since 1958 and the largest tonnage decline recorded by the EIA, based on records beginning in 1949. Furthermore, coal production in the United States in 2010 is expected to total approximately 1,0531,071 million tons, a decrease of approximately 1.9%0.2% compared to 2009. The following depictions, derived from data prepared by the EIA, sets forth production statistics in the three coal producing regions in the United States for the periods indicated.
U.S Coal Resources Regions 2008
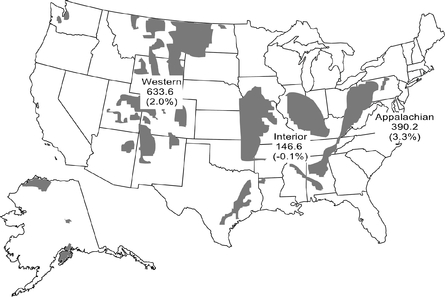
Annual U.S. Coal Production by Region

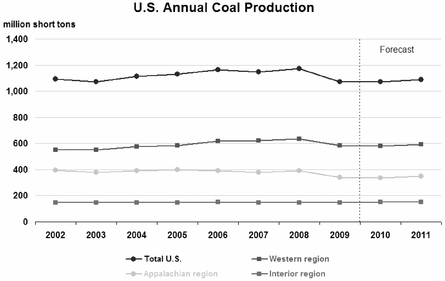
Source: EIA
Appalachian Region
The Appalachian region is divided into the Northern, Central and Southern regions. According to the EIA, coal produced in the Appalachian region decreased from approximately 445 million tons in 1994 to 341339 million tons in 2009 primarily as a result of the depletion of economically attractive reserves, permitting issues and increasing costs of production.
Northern Appalachia includes Maryland, Ohio, Pennsylvania and northern West Virginia. Coal from this region generally has a heat value of between 10,500 and 13,500 Btu/lb with
typical sulfur content ranging from 1.0% to 4.5%. Central Appalachia includes eastern Kentucky, Virginia and southern West Virginia. Coal from this region generally has a sulfur content of 0.7% to 1.5% and a heat value of between 10,000 and 13,500 Btu/lb. Southern Appalachia includes Alabama and Tennessee. Coal from this region typically has a sulfur content of 0.7% to 1.5% and a heat value of between 11,500 and 12,500 Btu/lb.
Interior Region
The major coal producing center of the Interior region is the Illinois Basin which includes Illinois, Indiana, and western Kentucky. According to the EIA, coal produced in the Interior region decreased from approximately 180 million tons in 1994 to approximately 148 million tons in 2009. Coal from the Illinois Basin generally has a heat value ranging from 10,000 to 12,500 Btu/lb and has a high sulfur content ranging from 2.0% to 4.0%. Despite its high sulfur content, coal from the Illinois Basin can generally be used by some electric power generation facilities that have installed pollution control devices, such as scrubbers, to reduce emissions.
Other coal-producing states in the Interior region include Arkansas, Kansas, Louisiana, Mississippi, Missouri, North Dakota, Oklahoma and Texas. The majority of production in the Interior region outside of the Illinois Basin consists of lignite production from Texas and North Dakota. This lignite typically has a heat value of between 5,000 and 12,5008,000 Btu/lb and a sulfur content of between 1.0% and 2.0%.
Western United States Region
The Western United States region includes, among other areas, the Powder River Basin, the Western Bituminous region (including the Uinta Basin) and the Four Corners area. According to the EIA, coal produced in the Western United States region increased from approximately 408 million tons in 1994 to approximately 585 million tons in 2009, as competitive mining costs and regulations limiting sulfur dioxide emissions have continued the increased demand for low-sulfur coal over this period and the Bureau of Land Management, or BLM, has been actively leasing reserves through the federal coal leasing process.
The Powder River Basin is located in northeastern Wyoming and southeastern Montana. The coal from this region has a sulfur content of between 0.15% to 0.55% and a heat value of between 8,000 and 10,500 Btu/lb.
The Western Bituminous region includes western Colorado and eastern Utah. The coal from this region typically has a sulfur content of 0.5% to 1.0% and a heat value of between 10,000 and 12,000 Btu/lb.
The Four Corners area includes northwestern New Mexico, northeastern Arizona, southeastern Utah and southwestern Colorado. The coal from this region typically has a sulfur content of 0.75% to 1.0% and a heat value of between 9,000 and 12,500 Btu/lb.
U.S. Coal Consumption
Preliminary data shows that total coal consumption declined significantly in 2009, dropping by 10.7% from the 2008 level. Total U.S. coal consumption was 1,000 million tons, a decrease of 120 million tons, with all coal-consuming sectors having lower consumption for the year.
Although all sectors had declines, the electric generation sector, which consumes approximately 94% of all the coal in the United States, generally determines total domestic coal consumption.
The following table sets forth historical and forecasted coal consumption for U.S. coal as aggregated by the EIA for the periods indicated.indicated:
| | | Actual | Forecasted | | Actual | Forecasted | ||||||||||||||||||||||||||||||||||||||||||||||||||||
|---|---|---|---|---|---|---|---|---|---|---|---|---|---|---|---|---|---|---|---|---|---|---|---|---|---|---|---|---|---|---|---|---|---|---|---|---|---|---|---|---|---|---|---|---|---|---|---|---|---|---|---|---|---|---|---|---|---|---|
| | | 2003 | 2004 | 2005 | 2006 | 2007 | 2008 | 2009 | 2010 | 2011 | | 2003 | 2004 | 2005 | 2006 | 2007 | 2008 | 2009 | 2010 | 2011 | ||||||||||||||||||||||||||||||||||||||
| | | (in million of tons) | | (in million of tons) | ||||||||||||||||||||||||||||||||||||||||||||||||||||||
Electrical Generation | Electrical Generation | 1,005 | 1,016 | 1,038 | 1,027 | 1,045 | 1,041 | 937 | 979 | 1,003 | Electrical Generation | 1,005 | 1,016 | 1,038 | 1,027 | 1,045 | 1,041 | 937 | 986 | 987 | ||||||||||||||||||||||||||||||||||||||
Industrial | Industrial | 61 | 62 | 60 | 60 | 57 | 54 | 45 | 40 | 43 | Industrial | 61 | 62 | 60 | 60 | 57 | 54 | 45 | 43 | 43 | ||||||||||||||||||||||||||||||||||||||
Steel Production | Steel Production | 24 | 24 | 23 | 23 | 23 | 22 | 16 | 21 | 24 | Steel Production | 24 | 24 | 23 | 23 | 23 | 22 | 16 | 21 | 23 | ||||||||||||||||||||||||||||||||||||||
Residential/Commercial | Residential/Commercial | 4 | 5 | 5 | 4 | 4 | 4 | 3 | 3 | 3 | Residential/Commercial | 4 | 5 | 5 | 4 | 4 | 4 | 3 | 3 | 3 | ||||||||||||||||||||||||||||||||||||||
Coal to Liquids | Coal to Liquids | — | — | — | — | — | — | — | — | — | Coal to Liquids | — | — | — | — | — | — | — | — | — | ||||||||||||||||||||||||||||||||||||||
Exports | Exports | 43 | 48 | 50 | 50 | 59 | 82 | 59 | 74 | 74 | Exports | 43 | 48 | 50 | 50 | 59 | 82 | 59 | 74 | 74 | ||||||||||||||||||||||||||||||||||||||
Total | 1,137 | 1,153 | 1,176 | 1,163 | 1,188 | 1,202 | 1,059 | 1,117 | 1,147 | Total | 1,137 | 1,153 | 1,176 | 1,163 | 1,188 | 1,202 | 1,059 | 1,127 | 1,130 | |||||||||||||||||||||||||||||||||||||||
Source: EIA
Coal consumption patterns are also influenced by the demand for electricity, governmental regulation impacting power generation, technological developments and the location, availability and cost of other fuels such as natural gas, nuclear and hydroelectric power.
The following table sets forth the different source fuels used for net electricity generation for 2009, according to the EIA.EIA:
| Electricity Generation Source | % of Total Electricity Generation | |||
|---|---|---|---|---|
Coal | 44.6 | % | ||
Natural Gas | 23.3 | % | ||
Nuclear | 20.2 | % | ||
Hydro | 6.8 | % | ||
Renewables Other Than Hydro | 3.6 | % | ||
Petroleum and Other | 1.5 | % | ||
Total | 100.0 | % | ||
Source: EIA
The nation's power generation infrastructure was approximately 44.6% coal-fired, according to the EIA for 2009. As a result, coal has consistently maintained approximately a 45% to 52% market share during the past 10 years, principally because of its relatively low cost, reliability and abundance.
The production of electricity from existing hydroelectric facilities is inexpensive, but its application is limited both by geography and susceptibility to seasonal and climatic conditions. In 2009, non-hydropower renewable power generation accounted for only 3.6% of all the electricity generated in the United States.
The largest cost component in electricity generation is fuel. Coal's primary advantage is its relatively low cost compared to other fuels used to generate electricity. The EIA has estimated
the average fuel prices per million of Btu to electricity generators, using coal and competing fossil fuel generation alternatives, as follows:
| | Actual | Projected | Actual | Projected | ||||||||||||||||||||||||||||||||||||||||
|---|---|---|---|---|---|---|---|---|---|---|---|---|---|---|---|---|---|---|---|---|---|---|---|---|---|---|---|---|---|---|---|---|---|---|---|---|---|---|---|---|---|---|---|---|
| | 2005 | 2006 | 2007 | 2008 | 2009 | 2010 | 2011 | 2005 | 2006 | 2007 | 2008 | 2009 | 2010 | 2011 | ||||||||||||||||||||||||||||||
| | ($ per million Btu) | ($ per million Btu) | ||||||||||||||||||||||||||||||||||||||||||
Distillate Fuel Oil | $ | 11.50 | $ | 13.39 | $ | 14.66 | $ | 21.46 | $ | 13.10 | $ | 16.53 | $ | 17.69 | $ | 11.50 | $ | 13.39 | $ | 14.66 | $ | 21.46 | $ | 13.10 | $ | 16.48 | $ | 17.81 | ||||||||||||||||
Residual Fuel Oil | $ | 7.00 | $ | 7.80 | $ | 8.59 | $ | 13.68 | $ | 8.85 | $ | 11.95 | $ | 12.47 | $ | 7.00 | $ | 7.80 | $ | 8.59 | $ | 13.68 | $ | 8.85 | $ | 11.92 | $ | 12.62 | ||||||||||||||||
Natural Gas | $ | 8.23 | $ | 6.92 | $ | 7.09 | $ | 9.13 | $ | 4.69 | $ | 5.45 | $ | 5.96 | $ | 8.23 | $ | 6.92 | $ | 7.09 | $ | 9.13 | $ | 4.69 | $ | 5.42 | $ | 5.71 | ||||||||||||||||
Coal | $ | 1.54 | $ | 1.69 | $ | 1.77 | $ | 2.07 | $ | 2.21 | $ | 2.24 | $ | 2.19 | $ | 1.54 | $ | 1.69 | $ | 1.77 | $ | 2.07 | $ | 2.21 | $ | 2.25 | $ | 2.20 | ||||||||||||||||
Source: EIA
Coal is the lowest cost fossil fuel used for base-load electric power generation, being considerably less expensive than natural gas or fuel oil. Coal-fueled generation is also competitive with nuclear power generation on a total cost per megawatt-hour basis.
Mining Methods
Coal is mined using one of two methods, underground or surface mining.
Underground Mining
Underground mines in the United States are typically operated using one of two different methods: room and pillar mining or longwall mining. In room and pillar mining, rooms are cut into the coal bed leaving a series of pillars, or columns of coal, to help support the mine roof and control the flow of air. Continuous mining equipment is used to cut the coal from the mining face. Generally, openings are driven 20 feet wide and the pillars are generally rectangular in shape. As mining advances, a grid-like pattern of entries and pillars is formed. Shuttle cars are used to transport coal to the conveyor belt for transport to the surface. When mining advances to the end of a panel, retreat mining may begin. In retreat mining, as much coal as is feasible is mined from the pillars that were created in advancing the panel, allowing the roof to cave. When retreat mining is completed to the mouth of the panel, the mined panel is abandoned. The room and pillar method is often used to mine smaller coal blocks or thin seams, and seam recovery ranges from 35% to 70%, with higher seam recovery rates applicable where retreat mining is combined with room and pillar mining.
The other underground mining method commonly used in the United States is the longwall mining method. In longwall mining, a rotating drum is trammed mechanically across the face of coal, and a hydraulic system supports the roof of the mine while it advances through the coal. Chain conveyors then move the loosened coal to an underground mine conveyor system for delivery to the surface.
Productivity for underground mining in the United States averages 3.2 tons per employee per hour, according to the EIA.
Surface Mining
Surface mining is generally used when coal is found relatively close to the surface, when multiple seams in close vertical proximity are being mined or when conditions otherwise
warrant. Surface mining involves the removal of overburden (earth and rock covering the coal) with heavy earth moving equipment and explosives, loading out the coal, replacing the
overburden and topsoil after the coal has been excavated and reestablishing vegetation and plant life and making other improvements that have local community and environmental benefit. Overburden is typically removed at mines using explosives in combination with large, rubber-tired diesel loaders. Seam recovery for surface mining is typically 90% or more. Productivity depends on equipment, geological composition and mining ratios and averages 3.6 tons per employee per hour in eastern regions of the United States, according to the EIA.
Surface-mining methods include area, contour, highwall and mountaintop removal. Area mines are surface mines that remove shallow coal over a broad area where the land is fairly flat. After the coal has been removed, the overburden is placed back into the pit. Contour mines are surface mines that mine coal in steep, hilly or mountainous terrain. A wedge of overburden is removed along the coal outcrop on the side of a hill, forming a bench at the level of the coal. After the coal is removed, the overburden is placed back on the bench to return the hill to its natural slope. Highwall mining is a form of mining in which a remotely controlled continuous miner extracts coal and conveys it via augers, belt or chain conveyors to the outside. The cut is typically a rectangular, horizontal cut from a highwall bench, reaching depths of several hundred feet or deeper. A highwall is the unexcavated face of exposed overburden and coal in a surface mine. Mountaintop removal mines are special area mines used where several thick coal seams occur near the top of a mountain. Large quantities of overburden are removed from the top of the mountains, and this material is used to fill in valleys next to the mine.
Transportation
Coal used for domestic consumption is generally sold free-on-board at the mine, and the purchaser normally bears the transportation costs. Export coal, however, is usually sold at the loading port, and coal producers are responsible for shipment to the export coal-loading facility, with the buyer paying the ocean freight.
Most electric generators arrange long-term shipping contracts with rail or barge companies to assure stable delivered costs. Transportation can be a large component of a purchaser's total cost. Although the purchaser pays the freight, transportation costs still are important to coal mining companies because the purchaser may choose a supplier largely based on cost of transportation. According to the National Mining Association, in 2008, railroads accounted for approximately 70% of total U.S. coal shipments, while truck movements accounted for approximately 16%. Trucks and overland conveyors haul coal over shorter distances, while barges, Great Lake carriers and ocean vessels move coal to export markets and domestic markets requiring shipment over the Great Lakes. Most coal mines are served by a single rail company, but much of the Powder River Basin is served by two competing rail carriers, the Burlington Northern Santa Fe Railway and the Union Pacific Railroad. Rail competition in this major coal-producing region is important because rail costs constitute a significant portion of the delivered cost of Powder River Basin coal in eastern markets.
Overview
We are a growth-oriented Delaware limited partnership formed to control and operate coal properties and related assets. We produce, process and sell high quality coal of various steam and metallurgical grades. We market our steam coal primarily to electric utility companies as fuel for their steam-powered generators. Customers for our metallurgical coal are primarily steel and coke producers who use our coal to produce coke, which is used as a raw material in the steel manufacturing process.
Our Properties
We have a geographically diverse asset base with coal reserves located in Central Appalachia, Northern Appalachia, the Illinois Basin and the Western Bituminous region. As of March 31, 2010, we controlled an estimated 285.4 million tons of proven and probable coal reserves, consisting of an estimated 272.9 million tons of steam coal and an estimated 12.5 million tons of metallurgical coal. In addition, as of March 31, 2010, we controlled an estimated 122.2 million tons of non-reserve coal deposits. As of March 31, 2010, Rhino Eastern LLC, a joint venture in which we own a 51% membership interest and for which we serve as manager, controlled an estimated 22.4 million tons of proven and probable coal reserves at the Rhino Eastern mining complex located in Central Appalachia, consisting entirely of premium mid-vol and low-vol metallurgical coal, and an estimated 34.3 million tons of non-reserve coal deposits. Our and the joint venture's proven and probable coal reserves and non-reserve coal deposits were the same in all material respects as of December 31, 2009. We currently operate twelveeleven mines, including sevensix underground and five surface mines, located in Kentucky, Ohio, Colorado and West Virginia. In addition, our joint venture currently operates one underground mine in West Virginia. The number of mines that we operate may vary from time to time depending on a number of factors, including the existing demand for and price of coal, depletion of economically recoverable reserves and availability of experienced labor. Excluding results from the joint venture, for the three monthsyear ended MarchDecember 31, 2010,2009, we produced approximately 1.04.7 million tons of coal, purchased approximately 2.0 million tons of coal and sold approximately 0.96.7 million tons of coal, approximately 99% of which were pursuant to supply contracts. Excluding results from the joint venture, for the six months ended June 30, 2010, we produced approximately 2.1 million tons of coal and sold approximately 2.0 million tons of coal, approximately 97% of which were pursuant to supply contracts. Additionally, the joint venture produced and sold approximately 0.2 million tons and approximately 0.1 million tons of premium mid-vol metallurgical coal for the year ended December 31, 2009 and the threesix months ended March 31,June 30, 2010, respectively.
Since our predecessor's formation in 2003, we have significantly grown our coal reserves. Since April 2003, we have completed numerous coal asset acquisitions with a total purchase price of approximately $208.3 million. Through these acquisitions and coal lease transactions, we have substantially increased$223.3 million, including our proven and probable coal reserves and non-reserve coal deposits. We expect to complete the acquisition in August 2010 of certain mining assets of C.W. Mining Company out of bankruptcy for approximately $15.0 million.bankruptcy. The assets to be acquired are located in Emery and Carbon Counties, Utah and include coal reserves and non-reserve coal deposits, underground mining equipment and infrastructure, an overland belt conveyor system, a loading facility and support facilities. We intend to fund the asset acquisition with borrowings underThrough these acquisitions and coal lease transactions, we have substantially increased our credit agreement.proven and probable coal reserves and non-reserve coal deposits.
In addition, we have successfully grown our production through internal development projects. Between 2004 and 2006, we invested approximately $19.0 million in the Hopedale mine located in Northern Appalachia to develop the estimated 18.5 million tons of proven and
probable coal reserves at the mine. The Hopedale mine produced approximately 1.5 million tons of coal for the year ended December 31, 2009 and approximately 0.30.7 million tons of coal for the
three six months ended March 31,June 30, 2010. In 2007, we completed initial development of Mine 28, a new underground high-vol metallurgical coal mine at the Rob Fork mining complex located in Central Appalachia. We finished additional development work on Mine 28 in 2009, which completes all major foreseen development projects for the life of these reserves. Mine 28 produced approximately 0.4 million tons of metallurgical coal for the year ended December 31, 2009 and approximately 0.10.2 million tons of metallurgical coal for the threesix months ended March 31,June 30, 2010. As of March 31, 2010, we also controlled or managed a significant amount of undeveloped proven and probable coal reserves. These reserves can be developed and produced over time as industry and regional conditions permit. We believe our existing asset base will continue to provide attractive internal growth projects.
The following table summarizes our and the joint venture's mining complexes, production and reserves by region:
| | | | | Production for the (3) | | | | | | | | | | Production for the (3) | | | | | | | ||||||||||||||||||||||||||||||||||||||||
|---|---|---|---|---|---|---|---|---|---|---|---|---|---|---|---|---|---|---|---|---|---|---|---|---|---|---|---|---|---|---|---|---|---|---|---|---|---|---|---|---|---|---|---|---|---|---|---|---|---|---|---|---|---|---|---|---|---|---|---|---|
| | | | | As of March 31, 2010 (4) | | | | As of March 31, 2010 (4) | ||||||||||||||||||||||||||||||||||||||||||||||||||||
| | | | | | Three Months Ended March 31, 2010 | | | | | Six Months Ended June 30, 2010 | ||||||||||||||||||||||||||||||||||||||||||||||||||
| | | | | | Reserves | | | | | | | | Reserves | | | | ||||||||||||||||||||||||||||||||||||||||||||
| | | Type of Production (1) | | Year Ended December 31, 2009 | Average Heat Value | Average Sulfur Content | Steam/ Metallurgical Reserves | | Type of Production (1) | | Year Ended December 31, 2009 | Average Heat Value | Average Sulfur Content | Steam/ Metallurgical Reserves | ||||||||||||||||||||||||||||||||||||||||||||||
| Region | Region | Transportation (2) | Proven | Three Months Ended March 31, 2010 | Proven | Probable | Region | Transportation (2) | Proven | Six Months Ended June 30, 2010 | Proven | Probable | ||||||||||||||||||||||||||||||||||||||||||||||||
| | | | | (in million tons) | (in million tons) | (Btu/lb) | (%) | (in million tons) | | | | (in million tons) | (in million tons) | (Btu/lb) | (%) | (in million tons) | ||||||||||||||||||||||||||||||||||||||||||||
Central Appalachia | Central Appalachia | Central Appalachia | ||||||||||||||||||||||||||||||||||||||||||||||||||||||||||
Tug River Complex (KY, WV) | Tug River Complex (KY, WV) | U, S | Truck, Barge, Rail (NS) | 0.5 | 0.1 | 28.1 | 6.7 | 12,946 | 1.21 | 28.8/6.0 | Tug River Complex (KY, WV) | U, S | Truck, Barge, Rail (NS) | 0.5 | 0.2 | 28.1 | 6.7 | 12,946 | 1.21 | 28.8/6.0 | ||||||||||||||||||||||||||||||||||||||||
Rob Fork Complex (KY) | Rob Fork Complex (KY) | U, S | Truck, Barge, Rail (CSX) | 1.2 | 0.3 | 26.2 | 22.6 | 3.6 | 13,374 | 1.14 | 19.7/6.5 | Rob Fork Complex (KY) | U, S | Truck, Barge, Rail (CSX) | 1.2 | 0.5 | 26.2 | 22.6 | 3.6 | 13,374 | 1.14 | 19.7/6.5 | ||||||||||||||||||||||||||||||||||||||
Deane Complex (KY) | Deane Complex (KY) | U | Rail (CSX) | 0.6 | 0.1 | 40.8 | 24.2 | 16.6 | 13,448 | 0.91 | 40.8/— | Deane Complex (KY) | U | Rail (CSX) | 0.6 | 0.2 | 40.8 | 24.2 | 16.6 | 13,448 | 0.91 | 40.8/— | ||||||||||||||||||||||||||||||||||||||
Northern Appalachia | Northern Appalachia | Northern Appalachia | �� | |||||||||||||||||||||||||||||||||||||||||||||||||||||||||
Hopedale Complex (OH) | Hopedale Complex (OH) | U | Truck, Rail (OHC, WLE) | 1.5 | 0.3 | 18.5 | 12.7 | 5.8 | 12,994 | 2.32 | 18.5/— | Hopedale Complex (OH) | U | Truck, Rail (OHC, WLE) | 1.5 | 0.7 | 18.5 | 12.7 | 5.8 | 12,994 | 2.32 | 18.5/— | ||||||||||||||||||||||||||||||||||||||
Sands Hill Complex (OH) | Sands Hill Complex (OH) | S | Truck, Barge | 0.7 | 0.2 | 8.6 | 8.3 | 0.3 | 10,611 | 2.51 | 8.6/— | Sands Hill Complex (OH) | S | Truck, Barge | 0.7 | 0.3 | 8.6 | 8.3 | 0.3 | 10,611 | 2.51 | 8.6/— | ||||||||||||||||||||||||||||||||||||||
Leesville Field (OH) | Leesville Field (OH) | U | Rail (OHC, WLE) | — | — | 26.8 | 7.8 | 19.0 | 13,152 | 2.21 | 26.8/— | Leesville Field (OH) | U | Rail (OHC, WLE) | — | — | 26.8 | 7.8 | 19.0 | 13,152 | 2.21 | 26.8/— | ||||||||||||||||||||||||||||||||||||||
Springdale Field (PA) | Springdale Field (PA) | U | Barge | — | — | 13.8 | 8.8 | 5.0 | 13,443 | 1.72 | 13.8/— | Springdale Field (PA) | U | Barge | — | — | 13.8 | 8.8 | 5.0 | 13,443 | 1.72 | 13.8/— | ||||||||||||||||||||||||||||||||||||||
Illinois Basin | Illinois Basin | Illinois Basin | ||||||||||||||||||||||||||||||||||||||||||||||||||||||||||
Taylorville Field (IL) | Taylorville Field (IL) | U | Rail (NS) | — | — | 109.5 | 38.8 | 70.7 | 12,085 | 3.85 | 109.5/— | Taylorville Field (IL) | U | Rail (NS) | — | — | 109.5 | 38.8 | 70.7 | 12,085 | 3.85 | 109.5/— | ||||||||||||||||||||||||||||||||||||||
Western Bituminous | Western Bituminous | Western Bituminous | ||||||||||||||||||||||||||||||||||||||||||||||||||||||||||
McClane Canyon Mine (CO) | McClane Canyon Mine (CO) | U | Truck | 0.3 | 0.1 | 6.4 | 4.4 | 2.0 | 11,675 | 0.59 | 6.4/— | McClane Canyon Mine (CO) | U | Truck | 0.3 | 0.1 | 6.4 | 4.4 | 2.0 | 11,675 | 0.59 | 6.4/— | ||||||||||||||||||||||||||||||||||||||
Total | 4.7 | 1.0 | 285.4 | 155.7 | 129.7 | 272.9/12.5 | Total | 4.7 | 2.1 | 285.4 | 155.7 | 129.7 | 272.9/12.5 | |||||||||||||||||||||||||||||||||||||||||||||||
Central Appalachia | Central Appalachia | Central Appalachia | ||||||||||||||||||||||||||||||||||||||||||||||||||||||||||
Rhino Eastern Complex (WV) (5) | Rhino Eastern Complex (WV) (5) | U | Truck, Rail (NS, CSX) | 0.2 | 0.1 | 22.4 | 13.7 | 8.7 | 13,999 | 0.64 | —/22.4 | Rhino Eastern Complex (WV) (5) | U | Truck, Rail (NS, CSX) | 0.2 | 0.1 | 22.4 | 13.7 | 8.7 | 13,999 | 0.64 | —/22.4 | ||||||||||||||||||||||||||||||||||||||
Our Business Strategy
Our principal business strategy is to safely, efficiently and profitably produce and sell both steam and metallurgical coal from our diverse asset base in order to maintain and, over time,
increase our quarterly cash distributions. Our plan for executing this strategy includes the following key components:
safety and environmental regulations required by state and federal laws. For the year ended December 31, 2009, our non-fatal days lost incidence rate for our operations was 14.9% below the industry average. For the year ended December 31, 2009, our operations received 17.6% fewer violations per inspection day than the national average according to MSHA. In March 2010, MSHA awarded our Hopedale and Sands Hill mines in Northern Appalachia with Pacesetter for Mine Safety awards for having the lowest injury (non-fatal days lost) incident rate for 2009 in their district. Additionally, in February 2010, the Colorado Division of Reclamation, Mining and Safety and The Colorado Mining Association presented the Medium Underground Coal Mine Award to our McClane Canyon operation in Colorado for achieving zero non-fatal days lost in 2009. We believe our ability to minimize lost-time injuries and environmental and mine health and safety violations will increase our operating efficiency and maintain strong employee morale.
period. We expect that our financial flexibility will allow us to make opportunistic acquisitions, as well as capital expenditures to execute our planned development of existing assets, and maintain and grow our cash available for distribution. Please read "Cash Distribution Policy and Restrictions on Distributions."
Our Competitive Strengths
We believe the following competitive strengths will enable us to successfully execute our business strategy:
coal production, along with associated supply contracts and long-lived reserves, provide us with a base cash flow to support our minimum quarterly distribution, and that our and the joint venture's metallurgical coal production provides additional coverage. Over time we have increased our production and expanded our reserves of metallurgical coal, which commands premium pricing to steam coal. We believe that the long-term global demand outlook for both steel and metallurgical coal is favorable. During the past three
years, the world-wide metallurgical coal market has experienced periods of increasing demand with limited additional sources of supply resulting in periods of high prices. We expect these conditions to persist for the foreseeable future.
approximately $208.3$223.3 million. Through these acquisitions and coal lease transactions we have significantly increased our proven and probable coal reserves and non-reserve coal deposits. These acquisitions have consisted of high quality coal reserves and union-free operations with limited reclamation and legacy liabilities. We believe that we have a disciplined acquisition strategy focused on selected assets at attractive valuations, while limiting to the extent possible the assumption of debt and reclamation and employee-related liabilities.
Our History
Rhino Energy LLC, our predecessor, was formed in April 2003 by Wexford. Please read "—Our Management." Since our inception, our strategy has been to acquire economically recoverable coal reserves and properties with long lives. We have accomplished this through a series of property purchases and leases.
In May 2003, we made our first acquisition, in Central Appalachia, which we refer to as Tug River from Lodestar Energy Inc. and certain of its affiliates. The acquisition included an estimated 20.6 million tons of surface and underground proven and probable coal reserves and an estimated 0.7 million tons of non-reserve coal deposits and equipment in Pike County, Kentucky that are serviced by the Norfolk Southern Railroad. These assets were purchased free of legacy liabilities associated with inactive properties. In May 2003, we purchased additional assets in Pike County from Lodestar Energy Inc., including an estimated 5.0 million tons of underground proven and probable coal reserves and an estimated 0.5 million tons of non-reserve coal deposits and equipment.
In May 2003, we acquired three coal leases from BLM and an operating underground mine, the McClane Canyon mine, located in the Western Bituminous region of Colorado, near Grand Junction. This acquisition also included a long-term contract with Xcel Energy Inc.'s, or Xcel, Cameo power plant, located east of Grand Junction. During 2009, we produced approximately 0.3 million tons of coal from the McClane Canyon mine, which was sold to the Xcel Cameo power plant under a contract that expires December 31, 2010.
In February 2004, we acquired leases covering an estimated 5.9 million tons of surface proven and probable coal reserves and an estimated 7.6 million tons of non-reserve coal deposits in Pike County, Kentucky, adjacent to the Tug River properties, from Pompey Coal Corporation and Berkeley Energy Corporation. This acquisition also included a long-term lease from
Appalachian Land Company and a unit train loading facility on the Norfolk Southern Railroad, which we refer to as the Jamboree loadout. The acquisition of the Jamboree loadout, consistent with our business strategy, allowed us to build a large block of contiguous surface reserves that could be serviced from a single shipping location.
In April 2004, we acquired control of an estimated 18.8 million tons of surface and underground proven and probable coal reserves and an estimated 6.6 million tons of non-reserve coal deposits in Mingo County, West Virginia, from H&L Construction Co., Inc. and Little Boyd
Coal Co., Inc. These properties, which are located across the Tug River from our existing properties, brought our total proven and probable coal reserves in the Tug River area to an estimated 45.3 million tons. Coal from these properties is also shipped through the Jamboree loadout.
In April 2004, we also acquired coal assets from subsidiaries of American Electric Power Company, Inc., AEP Coal, Inc. and certain of their affiliates, or AEP, in eastern Kentucky, Ohio and Pennsylvania. In this transaction, we acquired only active mining areas and did not assume any legacy liabilities related to AEP's inactive mining areas. The acquisition included an estimated 18.4 million tons of surface and underground proven and probable coal reserves and an estimated 11.5 million tons of non-reserve coal deposits in Kentucky and an estimated 50.0 million tons of underground proven and probable coal reserves and an estimated 43.737.2 million tons of non-reserve coal deposits in Ohio and Pennsylvania, together with a substantial amount of infrastructure. In Kentucky, this infrastructure included the Rob Fork preparation plant and unit loadout facility on the CSX Rail and six underground mines and two surface mines, collectively referred to as the Rob Fork mining complex. The Ohio assets included an underground mine that was mined out in 2007, and the Nelms preparation plant near Cadiz, Ohio. The Ohio assets also included the Hopedale mine which was shut in the 1980s. We reopened the Hopedale mine in September 2005. As of March 31, 2010, the Hopedale mine has an estimated 18.5 million tons of underground proven and probable coal reserves and an estimated 19.5 million tons of non-reserve coal deposits and an expected reserve life of at least 12 years at its planned production rate. The Hopedale mine and Rob Fork mining complex together accounted for more than 50% of our total coal production for the year ended December 31, 2009.
In December 2004, we acquired leases for an estimated 7.5 million tons of surface proven and probable coal reserves and an estimated 9.6 million tons of non-reserve coal deposits near our Bevins Branch mine from Millers Creek Resources, Inc., Prater Creek Coal Corporation and Alma Land Company. We also leased an estimated 1.0 million tons of surface proven and probable coal reserves and an estimated 3.0 million tons of non-reserve coal deposits from Elk Horn Properties at Bevins Branch mine. Subsequent to the AEP acquisition, we also leased an estimated 2.2 million tons of surface proven and probable coal reserves from various lessors which extended the life of our Three Mile mine.
In March 2005, we leased an estimated 9.2 million tons of underground proven and probable coal reserves of high-vol metallurgical coal from Big Sandy Company L.P. The acquisition of these reserves allowed us to increase our participation in the metallurgical coal market. These reserves are accessed from a mine portal adjacent to the Rob Fork mining complex and therefore require no trucking costs from mine to the plant.
In June 2005, we acquired the assets of Christian County Coal Company which consisted primarily of 237.5 acres of surface property rights (165 owned acres) and two mineral leases covering 21,00021,500 acres. Subsequent to the initial acquisition, we have acquired additional surface properties and continue to develop permitting and construction plans. The assets contain an
estimated 109.5 million tons of underground proven and probable coal reserves and an estimated 28.6 million tons of non-reserve coal deposits as of March 31, 2010. These undeveloped reserves are located near Taylorville in Christian County, Illinois.
In November 2005, we acquired an estimated 1.8 million tons of surface proven and probable coal reserves and an estimated 0.7 million tons of non-reserve coal deposits and assumed control of a surface mining operation near Pikeville, Kentucky from M&D Pipeline Inc.
In December 2007, we acquired the assets of Sands Hill Coal Company, which included control of approximately 6,000 acres containing, as of March 31, 2010, an estimated 8.6 million tons of proven and probable coal reserves and an estimated 1.9 million tons of non-reserve coal deposits located in Jackson, Vinton and Gallia Counties in Ohio. This acquisition also included limestone reserves that are mined in conjunction with the coal seams.
In February 2008, we acquired approximately 30,000 acres containing, as of March 31, 2010,the acquisition date, an estimated 7.218.9 million tons of proven and probable coal reserves and an estimated 0.21.6 million tons of non-reserve coal deposits at our Deane mining complex located in Letcher, Pike and Knott Counties in Kentucky from CONSOL of Kentucky, Inc. In addition, the acquisition included approximately 14,627 acres of surface property, as well as a 950 tons-per-hour preparation plant and unit train loadout facility on the CSX Rail.
In February 2008, we entered into a lease with West Virginia Mid-Vol, Inc. covering an estimated 15.3 million tons of proven and probable coal reserves and an estimated 33.1 million tons of non-reserve coal deposits at our Rhino Eastern mining complex located in Raleigh County in West Virginia.
In May 2008, we entered into a joint venture with an affiliate of Patriot that acquired a then inactive metallurgical coal operation covering, as of March 31, 2010, an estimated 5.8 million tons of proven and probable metallurgical coal reserves located in Raleigh and Wyoming Counties in West Virginia from Peachtree Ridge Mining Company, Inc. In connection with its formation, the joint venture acquired the February 2008 Raleigh County lease. As of March 31, 2010, the joint venture controlled an estimated 22.4 million tons of proven and probable reserves and an estimated 34.3 million tons of non-reserve coal deposits at the Rhino Eastern mining complex. We hold a 51% membership interest in, and serve as manager for, the joint venture.
In September 2008, we acquired approximately 20,000 acres containing an estimated 17.8 million tons of proven and probable coal reserves and an estimated 1.9 million tons of non-reserve coal deposits located in Floyd, Knott, Letcher and Pike Counties in Kentucky from a subsidiary of Alpha Natural Resources, Inc. The acquisition included approximately 2,369 acres of surface property, the assignment of four surface leases and one coal lease, and the transfer of 15 mining permits. This property is adjacent and immediately contiguous to our Deane mining complex.
In January 2009, we acquired the manufacturing operations of Triad Roof Support Systems, LLC located in Kentucky as part of a vertical integration effort. This operation produces roof control products used in underground coal mining. This acquisition included a manufacturing facility as well as a small product development shop.
In May 2009, we completed the sale of our Hunts Branch surface mine in Pike County, Kentucky to Revelation Coal Company. This sale reduced our end of mine reclamation liability from our Tug River complex.
We expect to completeIn August 2010, we completed the acquisition in August 2010 of certain mining assets of C.W. Mining Company out of bankruptcy for approximately $15.0 million.bankruptcy. The assets to be acquired are located in Emery and Carbon Counties, Utah and include coal reserves and non-reserve coal deposits, underground mining equipment and infrastructure, an overland belt conveyor system, a loading facility and support facilities. We intend to fund the asset acquisition with borrowings under our credit agreement.
Our Management
We are managed and operated by the board of directors and executive officers of our general partner, Rhino GP LLC. Following this offering, approximately 69.8%73.8% of our outstanding common units and all of our outstanding subordinated units and incentive distribution rights will be owned by Wexford. As a result of owning our general partner, Wexford will have the right to appoint all members of the board of directors of our general partner, including the independent directors. Our unitholders will not be entitled to elect our general partner or its directors or otherwise directly participate in our management or operation. For more information about the executive officers and directors of our general partner, please read "Management."
Following the consummation of this offering, neither our general partner nor Wexford will receive any management fee or other compensation in connection with our general partner's management of our business, but webusiness. Our general partner, however, may receive incentive fees resulting from holding the incentive distribution rights. Please see "Provisions of our Partnership Agreement Relating to Cash Distributions—Distributions of Available Cash—General Partner Interest and Incentive Distribution Rights." We will reimburse our general partner and its affiliates, including Wexford, for all expenses they incur and payments they make on our behalf. Our partnership agreement does not set a limit on the amount of expenses for which our general partner and its affiliates may be reimbursed. These expenses include salary, bonus, incentive compensation and other amounts paid to persons who perform services for us or on our behalf and expenses allocated to our general partner by its affiliates. Our partnership agreement provides that our general partner will determine in good faith the expenses that are allocable to us.
In order to maximize operational flexibility, our operations will be conducted through, and our operating assets will be owned by, our wholly owned subsidiary, Rhino Energy LLC, and its subsidiaries. Rhino Resource Partners LP does not have any employees. All of the employees that conduct our business are employed by our general partner or our subsidiaries.
Wexford Capital is an SEC registered investment advisor. Wexford Capital, which was formed in 1994, manages a series of investment funds and has over $6.0 billion of assets under management.
Since its inception in 1994, Wexford has been an active and successful investor in a variety of sectors, including energy and natural resource businesses. Wexford has made numerous investments in various aspects of the energy sector, and at present holds substantial interests in companies with oil, gas and coalbed methane assets in major producing areas of the United States and abroad. Through these and other investments, Wexford has demonstrated a proven and profitable track record in identifying, acquiring and developing energy and natural resource assets in a broad number of operating basins in North America and abroad.
Many of Wexford's investments involve controlling interests in private companies, both in the energy sector and in other areas, and Wexford has a track record of successfully growing such private companies. Wexford's strategy for such companies, including Rhino Energy LLC, involves recruiting strong management teams to focus on, among other things, internal growth and acquisitions of assets. Wexford also provides substantial ongoing assistance to the companies it controls. Such assistance includes market analysis and analysis of industry trends, sales and
hedging assistance, assistance in acquisitions, financings and other transactions, legal and corporate secretary support, accounting support and investor relations. In addition, Wexford often assists management teams in adding capabilities to expand into complementary business lines. This approach has been successfully employed by Wexford in its energy companies.
In addition, Wexford has significant involvement in the natural resource transportation sector, including existing or previous investments in oil tankers and coal and iron ore bulk carriers. Wexford also has significant expertise and experience in distressed investments. Its first
involvement with the coal industry was through the purchase of distressed securities of certain coal companies.
With its diverse background in the energy and related sectors, in managing private companies and in financing and acquisition transactions, Wexford has provided us with substantial assistance. In the future, we would expect that Wexford will continue to be involved in providing such assistance as well as strategic guidance concerning the growth of us and our mining operations and making other major decisions concerning our business.
Coal Operations
Mining Operations
As of March 31,June 30, 2010, we operated four mining complexes located in Central Appalachia (Tug River, Rob Fork, Deane and Rhino Eastern (owned by the joint venture with an affiliate of Patriot)), two mining complexes located in Northern Appalachia (Hopedale and Sands Hill) and one mine located in the Western Bituminous region in Colorado (McClane Canyon). We define a mining complex as a central location for processing raw coal and loading coal into railroad cars or trucks for shipment to customers. These mining complexes include six active preparation plants and/or loadouts (including one owned by our joint venture partner), each of which receive, blend, process and ship coal that is produced from one or more of our active surface and underground mines. All of the preparation plants are modern plants that have both coarse and fine coal cleaning circuits.
Our surface mines include area mining, mountaintop removal and contour mining. These operations use truck and wheel loader equipment fleets along with large production tractors. Our underground mines utilize the room and pillar mining method. These operations generally consist of one or more single or dual continuous miner sections which are made up of the continuous miner, shuttle cars, roof bolters, feeder and other support equipment. We currently own most of the equipment utilized in our mining operations. We employ preventive maintenance and rebuild programs to ensure that our equipment is modern and well-maintained. The rebuild programs are performed either by an on-site shop or by third-party manufacturers. The mobile equipment utilized at our mining operations is scheduled for replacement on an on-going basis with new, more efficient units according to a predetermined schedule.
We have the ability to increase production from mines currently in operation and we have substantial additional idle surface and underground capacity that can be restarted on short notice and at low cost. As market conditions permit we expect to bring these mines back into operation and to increase our revenues and operating cash flow. In addition, we have a significant portfolio of low cost growth projects that we intend to bring into production and that we expect will increase our revenues and operating cash flow. We also intend to continue to build our existing asset base through acquisitions that will be accretive to our cash available for distribution per unit and through us and our sponsor, to evaluate and potentially acquire non-coal assets.
Central Appalachia. As of March 31,June 30, 2010, we operated four mining complexes located in Central Appalachia consisting of sixfive active underground mines, fivefour of which are company-operated and one that is contractor-operated. In addition, we operated three company-operated surface mines. For the year ended December 31, 2009, the mines at our Tug River, Rob Fork and Deane mining complexes produced an aggregate of approximately 1.9 million tons of steam coal and an estimated 0.4 million tons of metallurgical coal and the underground mine at the Rhino Eastern mining complex, owned by the joint venture in which we have a 51% membership
interest and for which we serve as manager, produced approximately 0.2 million tons of metallurgical coal. As of March 31, 2010, we controlled an estimated 101.7 million tons of proven and probable coal reserves and an estimated 29.2 million tons of non-reserve coal deposits in Central Appalachia, excluding reserves held by the joint venture. As of March 31, 2010, the Rhino Eastern mining complex, owned by the joint venture, contained an estimated 22.4 million tons of proven and probable coal reserves and an estimated 34.3 million tons of non-reserve coal deposits, consisting of premium mid-vol and low-vol metallurgical coal.
The following table provides summary information regarding our and the joint venture's mining complexes in Central Appalachia as of March 31, 2010.June 30, 2010:
| | | | | Number and Type of Active Mines (2) | Tons Produced for the | | | | Number and Type of Active Mines (2) | Tons Produced for the (3) | ||||||||||||||||||||||||||||||||
|---|---|---|---|---|---|---|---|---|---|---|---|---|---|---|---|---|---|---|---|---|---|---|---|---|---|---|---|---|---|---|---|---|---|---|---|---|---|---|---|---|---|---|
| Mining Complex (Location) | Mining Complex (Location) | Preparation Plants and Loadouts | Transportation to Customers (1) | Company Operated Mines | Contractor Operated Mines | Total Mines | Year Ended December 31, 2009 | Three Months Ended March 31, 2010 | Mining Complex (Location) | Preparation Plants and Loadouts | Transportation to Customers (1) | Company Operated Mines | Contractor Operated Mines | Total Mines | Year Ended December 31, 2009 | Six Months Ended June 30, 2010 | ||||||||||||||||||||||||||
| | | | | | | | (in millions) | | | | | | | (in millions) | ||||||||||||||||||||||||||||
Tug River (KY, WV) | Tug River (KY, WV) | Jamboree (3) | Truck, Barge, Rail (NS) | 1S | — | 1S | 0.5 | 0.1 | Tug River (KY, WV) | Jamboree (4) | Truck, Barge, Rail (NS) | 1S | — | 1S | 0.5 | 0.2 | ||||||||||||||||||||||||||
Rob Fork (KY) | Rob Fork (KY) | Rob Fork | Truck, Barge, Rail (CSX) | 2U, 2S | — | 2U, 2S | 1.2 | 0.3 | Rob Fork (KY) | Rob Fork | Truck, Barge, Rail (CSX) | 2U, 2S | — | 2U, 2S | 1.2 | 0.5 | ||||||||||||||||||||||||||
Deane (KY) | Deane (KY) | Rapid Loader | Truck, Rail (CSX) | 2U | 1U | 3U | 0.6 | 0.1 | Deane (KY) | Rapid Loader | Truck, Rail (CSX) | 1U | 1U | 2U | 0.6 | 0.2 | ||||||||||||||||||||||||||
Total | 4U, 3S | 1U | 5U, 3S | 2.2 | 0.5 | Total | 3U, 3S | 1U | 4U, 3S | 2.2 | 1.0 | |||||||||||||||||||||||||||||||
Rhino Eastern (WV) | Rhino Eastern (WV) | Rocklick | Truck, Rail (NS, CSX) | 1U | — | 1U | 0.2 | 0.1 | Rhino Eastern (WV) | Rocklick | Truck, Rail (NS, CSX) | 1U | — | 1U | 0.2 | 0.1 | ||||||||||||||||||||||||||
Tug River Mining Complex. The following map outlines the mines and loadout facility that comprise our Tug River mining complex.complex as of June 30, 2010:
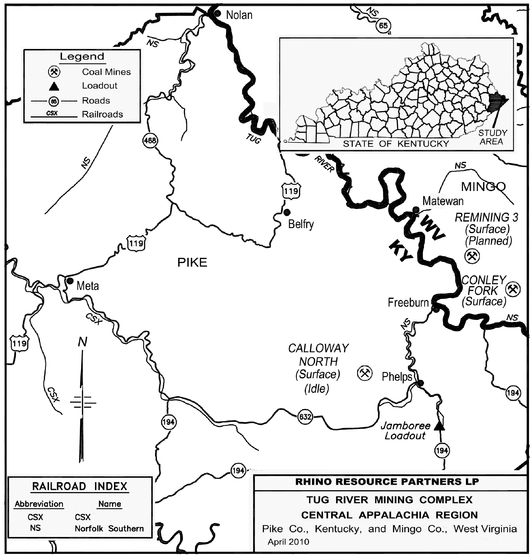
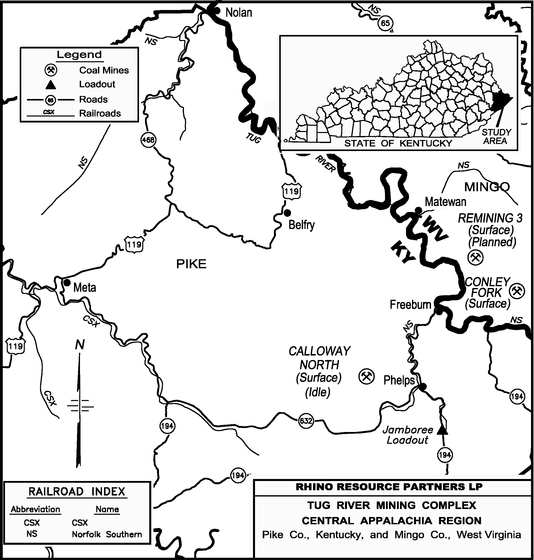
Our Tug River mining complex consists of property in Kentucky and West Virginia that borders the Tug River. As of March 31, 2010, the Tug River mining complex included an estimated 34.8 million tons of proven and probable coal reserves and an estimated 9.1 million tons of non-reserve coal deposits.
Our Tug River mining complex produces coal from one company-operated surface mine. Coal production from this mine is delivered by truck to the Jamboree loadout for blending and loading or to the Rob Fork facilities for processing, blending and loading. The Jamboree loadout is located on the Norfolk Southern Railroad and is a modern unit train loadout with batch weighing equipment capable of loading in excess of 10,000 tons into railcars in less thanapproximately four hours. The Jamboree loadout is used primarily to process surface mined coal which is sold as steam coal to electric utilities. This mining complex produced approximately 0.5 million tons of steam coal for the year ended December 31, 2009 and approximately 0.2 million tons of coal for the six months ended June 30, 2010, 0.1 million tons of which was steam coal forsold through the three months ended March 31, 2010.Jamboree loadout and 0.1 million tons of which was metallurgical coal processed and sold through the Rob Fork facilities.
Rob Fork Mining Complex. The following map outlines the mines, preparation plant and loadout facility that comprise our Rob Fork mining complex.complex as of June 30, 2010:
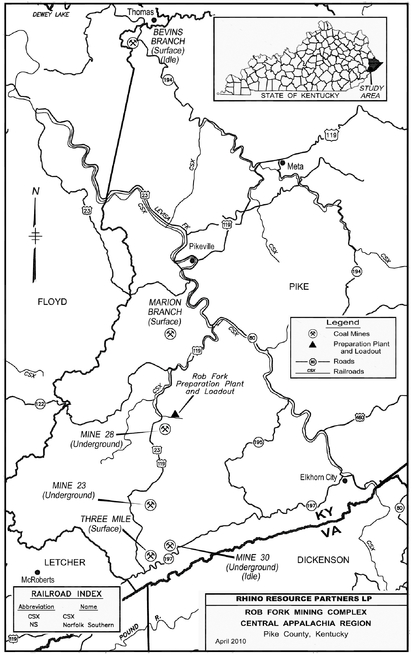

Our Rob Fork mining complex is located in eastern Kentucky and, as of March 31, 2010, included an estimated 26.2 million tons of proven and probable coal reserves and an estimated 14.6 million tons of non-reserve coal deposits.
Our Rob Fork mining complex currently produces coal from two company-operated surface mines and two company-operated underground mines. The Rob Fork mining complex is located on the CSX Railroad and consists of a modern 700 tons-per-hour preparation plant utilizing heavy media circuitry that is capable of cleaning coarse and fine coal size fractions and a unit train loadout with batch weighing equipment capable of loading in excess of 10,000 tons into railcars in less thanapproximately four hours. The mining complex has significant blending capabilities allowing the blending of raw coals with washed coals to meet a wide variety of customers' needs. The Rob Fork mining complex produced approximately 0.8 million tons of steam coal
complex produced approximately 0.8 million tons of steam coal and 0.4 million tons of metallurgical coal for the year ended December 31, 2009, accounting for approximately 25%26% of our total coal production for that year. The Rob Fork mining complex produced approximately 0.20.3 million tons of steam coal and approximately 0.10.2 million tons of metallurgical coal for the threesix months ended March 31,June 30, 2010, accounting for approximately 26% of our total coal production for that period.
Between 2006 and 2007, in an effort to enhance production at our Rob Fork mining complex, we completed initial development of Mine 28, a new underground metallurgical coal mine. Our investment of approximately $30.0 million included a conveyor belt to transfer coal from the mine portal directly to the preparation plant as well as an extensive entry system to access the main reserve body. In 2008 and 2009, we spent an additional $4.1 million at Mine 28 to complete development work on additional ventilation entries which connect to two new slopes to provide ventilation for the mine throughout the life of the reserve. AsRecently, we transitioned employees and some equipment from certain of March 31, 2010,our underground operations in Central Appalachia to Mine 28 had an expected reserve lifeto take advantage of approximately 16 years at current production levels.favorable pricing for metallurgical coal.
Deane Mining Complex. The following map outlines the mines, preparation plant and loadout facility that comprise our Deane mining complex:complex as of June 30, 2010:
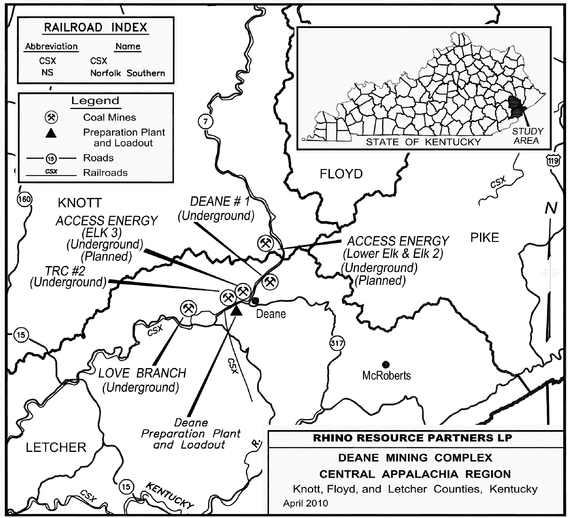
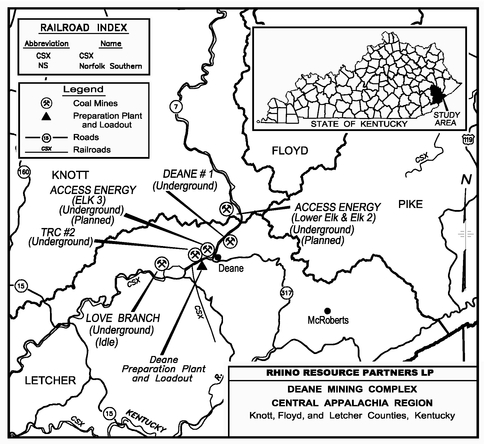
Our Deane mining complex is located in eastern Kentucky and, as of March 31, 2010, included an estimated 40.8 million tons of proven and probable coal reserves and an estimated 5.6 million tons of non-reserve coal deposits. This includes the original acquisition in February
2008 of reserves and infrastructure as well as additional reserves purchased in September 2008, which significantly extended the reserve life of the complex.
Our Deane mining complex produces steam coal from twoone company-operated underground minesmine and one contractor-operated underground mine. The infrastructure consists of a 950 tons-per-hour preparation plant utilizing heavy media circuitry capable of cleaning coarse and fine coal size fractions, as well as a unit train loadout facility with batch weighing equipment capable of loading in excess of 10,000 tons into railcars in less thanapproximately four hours. The facility has significant blending capabilities allowing the blending of raw coals with washed coals to meet a wide variety of customers' needs. The Deane complex produced approximately 0.6 million tons of steam coal for the year ended December 31, 2009 and approximately 0.10.2 million tons of steam coal for the threesix months ended March 31,June 30, 2010.
Rhino Eastern Mining Complex. The following map outlines the mines, preparation plant and loadout facility that comprise the joint venture's Rhino Eastern mining complex:complex as of June 30, 2010:
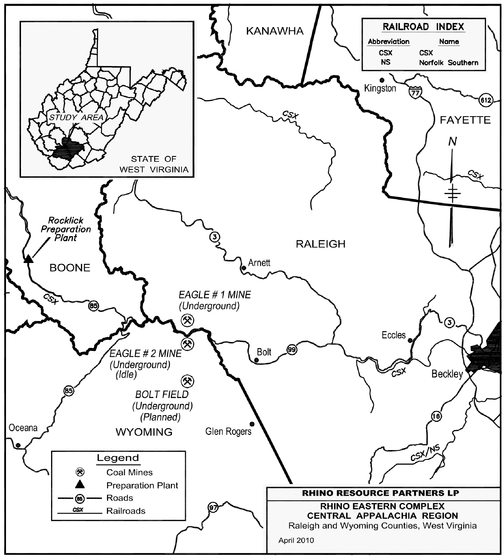
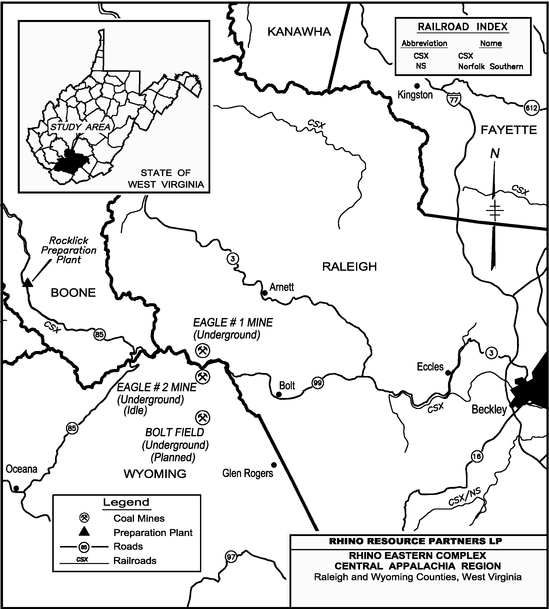
The Rhino Eastern mining complex is located in Raleigh and Wyoming Counties, West Virginia and, as of March 31, 2010, included an estimated 22.4 million tons of proven and probable premium mid-vol and low-vol metallurgical coal reserves and an estimated 34.3 million
tons of non-reserve coal deposits. We have a 51% membership interest in, and serve as manager
for, the joint venture that owns the Rhino Eastern mining complex. Pursuant to the terms of a coal purchase agreement entered into under the joint venture agreement, an affiliate of our joint venture partner, Patriot, controls the amount and terms of sales of the coal produced from the Rhino Eastern mining complex.
The Rhino Eastern mining complex produces premium metallurgical coal from one company-operated underground mine. The joint venture acquired the Rhino Eastern complex in May 2008 and commenced production in August 2008. Raw coal is trucked from the mine to a facility owned by our joint venture partner to be sized, washed and shipped by truck or via one of two rail loadouts, located on the CSX Railroad and the Norfolk Southern Railroad. The Rhino Eastern mining complex produced approximately 0.2 million tons of premium mid-vol metallurgical coal for the year ended December 31, 2009 and approximately 0.1 million tons of premium mid-vol metallurgical coal for the threesix months ended March 31,June 30, 2010.
Northern Appalachia. We operate two mining complexes located in Northern Appalachia consisting of one company-operated underground mine and two company-operated surface mines. For the year ended December 31, 2009, these mines produced an aggregate of approximately 2.2 million tons of steam coal. As of March 31, 2010, we controlled an estimated 67.8 million tons of proven and probable coal reserves and an estimated 39.2 million tons of non-reserve coal deposits in Northern Appalachia. As of March 31, 2010, these reserves included: (1) an estimated 26.8 million tons of proven and probable coal reserves and an estimated 1.2 million tons of non-reserve coal deposits at our Leesville field in Ohio, (2) an estimated 13.8 million tons of proven and probable coal reserves and an estimated 7.6 million tons of non-reserve coal deposits at our Springdale field in Pennsylvania, and (3) an estimated 8.9 million tons of non-reserve coal deposits at our Belmont field in Ohio.
The following table provides summary information regarding our active mining complexes in Northern Appalachia as of March 31,June 30, 2010:
| | | | | Number and Type of Active Mines (2) | Tons Produced for the | | | | Number and Type of Active Mines (2) | Tons Produced for the | ||||||||||||||||||||||||||||||||
|---|---|---|---|---|---|---|---|---|---|---|---|---|---|---|---|---|---|---|---|---|---|---|---|---|---|---|---|---|---|---|---|---|---|---|---|---|---|---|---|---|---|---|
| Mining Complex (Location) | Mining Complex (Location) | Preparation Plants and Loadouts | Transportation to Customers (1) | Company Operated Mines | Contractor Operated Mines | Total Mines | Year Ended December 31, 2009 | Three Months Ended March 31, 2010 | Mining Complex (Location) | Preparation Plants and Loadouts | Transportation to Customers (1) | Company Operated Mines | Contractor Operated Mines | Total Mines | Year Ended December 31, 2009 | Six Months Ended June 30, 2010 | ||||||||||||||||||||||||||
| | | | | | | | (in millions) | | | | | | | (in millions) | ||||||||||||||||||||||||||||
Hopedale (OH) | Hopedale (OH) | Nelms | Truck, Rail (OHC, WLE) | 1U | — | 1U | 1.5 | 0.3 | Hopedale (OH) | Nelms | Truck, Rail (OHC, WLE) | 1U | — | 1U | 1.5 | 0.7 | ||||||||||||||||||||||||||
Sands Hill (OH) | Sands Hill (OH) | Sands Hill(3) | Truck, Barge | 2S | — | 2S | 0.7 | 0.2 | Sands Hill (OH) | Sands Hill(3) | Truck, Barge | 2S | — | 2S | 0.7 | 0.3 | ||||||||||||||||||||||||||
Total | 1U, 2S | — | 1U, 2S | 2.2 | 0.5 | Total | 1U, 2S | — | 1U, 2S | 2.2 | 1.0 | |||||||||||||||||||||||||||||||
Hopedale Mining Complex. The following map outlines the mine and the preparation plant and loadout facility that comprise our Hopedale mining complex:complex as of June 30, 2010:
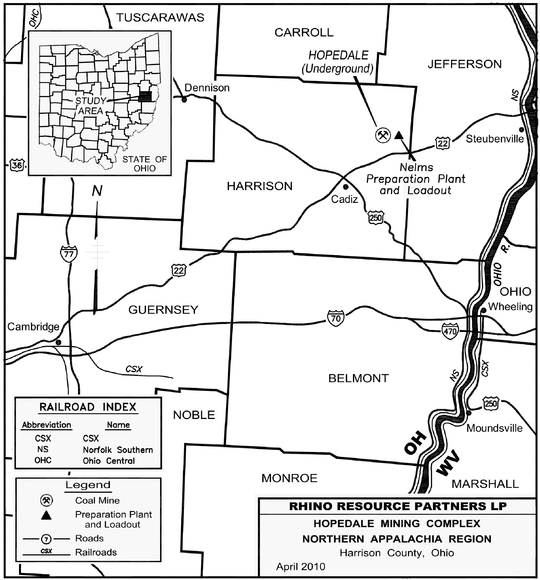
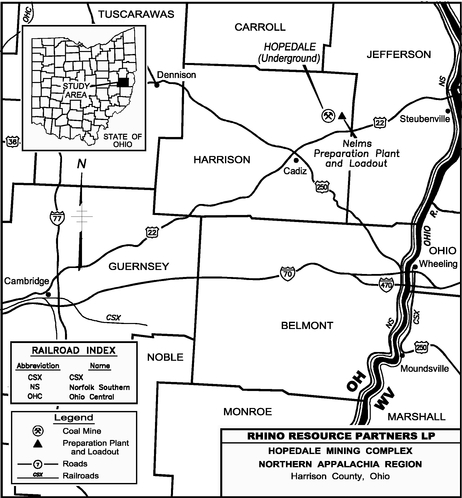
The Hopedale mining complex includes an underground mine located in Hopedale, Ohio approximately five miles northeast of Cadiz, Ohio. As of March 31, 2010, the Hopedale mining complex included an estimated 18.5 million tons of proven and probable coal reserves and an estimated 19.5 million tons of non-reserve coal deposits. Coal produced from the Hopedale mine is first cleaned at our Nelms preparation plant located on the Ohio Central Railroad and the Wheeling & Lake Erie Railroad in Cadiz, Ohio and then shipped by train or truck to the customer. The infrastructure includes a full-service loadout facility. This underground mining operation produced approximately 1.5 million tons of steam coal for the year ended December 31, 2009, accounting for approximately 31% of our total coal production for that year. The operation produced approximately 0.30.7 million tons of steam coal for the threesix months ended March 31,June 30, 2010, accounting for approximately 27%34% of our total coal production for that period.
Sands Hill Mining Complex. The following map outlines the mines and preparation plant that comprise our Sands Hill mining complex.complex as of June 30, 2010:

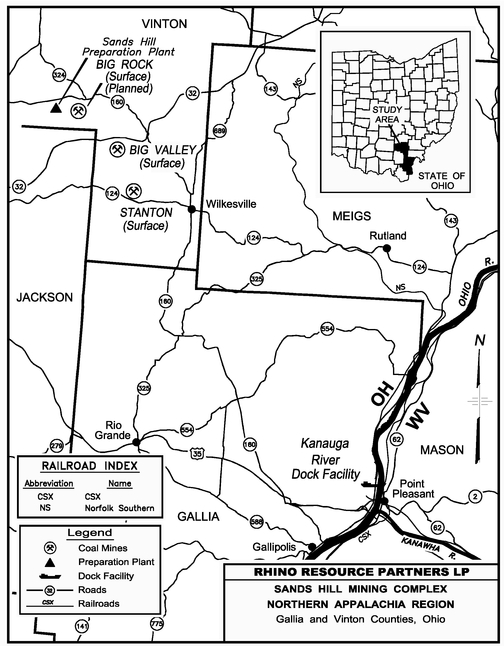
We operate two surface mines at our Sands Hill mining complex, located near Hamden, Ohio. As of March 31, 2010, the Sands Hill mining complex included an estimated 8.6 million tons of proven and probable coal reserves and an estimated 1.9 million tons of non-reserve coal deposits and limestone reserves. In 2009, we completed construction of a river-front barge and dock facility on the Ohio River with a capacity of approximately 1,200 tons-per-hour.River. The infrastructure also includes a 260 tons-per-hour preparation plant. The Sands Hill mining complex produced approximately 0.7 million tons of steam coal and approximately 0.5 million tons of limestone aggregate for the year ended December 31, 2009. The Sands Hill mining complex produced approximately 0.20.3 million tons of steam coal and approximately 0.10.2 million tons of limestone aggregate for the threesix months ended March 31,June 30, 2010.
Western Bituminous Region. We operate an underground mine in the Western Bituminous region of Colorado. The McClane Canyon mine is located near Loma, Colorado and is on
property leased from BLM. As of March 31, 2010, the McClane Canyon complex included an estimated 6.4 million tons of proven and probable coal reserves and an estimated 25.2 million tons of non-reserve coal deposits. We currently produce approximately 0.3 million tons of coal per year from the McClane Canyon mine, all of which is sold to Xcel's Cameo power plant, located east of Grand Junction, Colorado. The current contract with Xcel will expire on December 31, 2010. At the expiration of this contract, we plan to temporarily idle production at the McClane Canyon mine as we build and permit a rail loadout. We believe access to a rail loadout will enable us to expand our customer base. We are currently planning to restart production at the McClane Canyon mine in late 2011.
The following map outlines the McClane Canyon mine as of June 30, 2010:
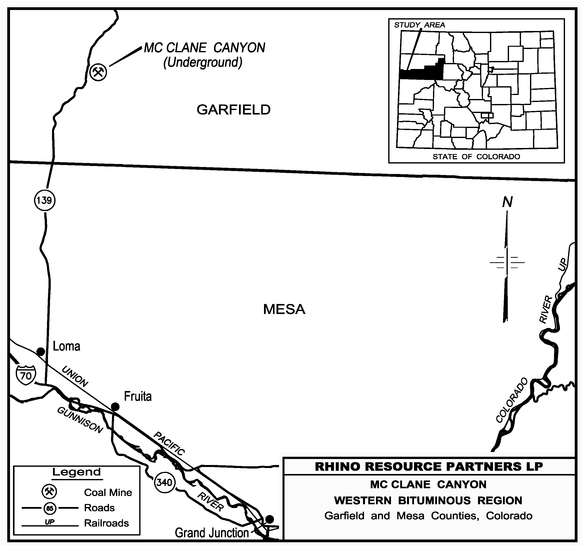
In addition to the McClane Canyon mine, we currently control three nearby federal leases consisting of approximately 8,7807,566 acres, two of which have the potential to support a future underground coal mining operation with procurement of an adjacent federal leasehold. We began the permitting process and leasehold procurement in 2005 and expect the process to last approximately one to three more years. We are currently in an exploration process to define the volume, quality, and mineability of the coal reserves.
In August 2010, we completed the acquisition of certain mining assets of C.W. Mining Company out of bankruptcy. The following map outlines the McClane Canyon mine:
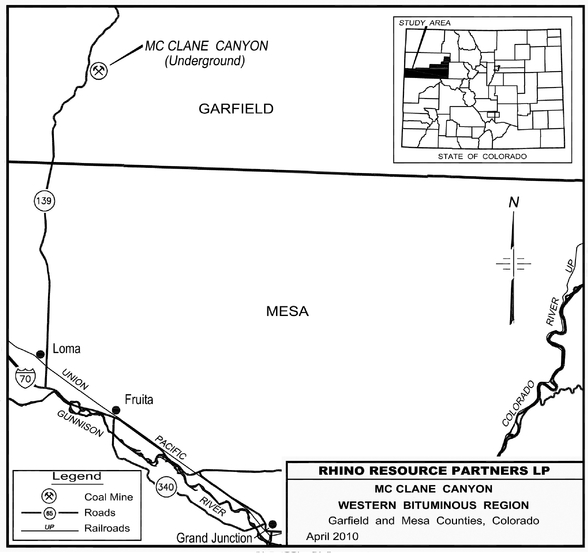
Utah and include coal reserves and non-reserve coal deposits, underground mining equipment and infrastructure, an overland belt conveyor system, a loading facility and support facilities. We expect to begin production from these assets at one underground mine in late 2010. The coal we expect to produce and sell from these mining assets will be sold as steam coal in the Western Bituminous region.
Other Non-Mining Operations
In addition to our mining operations, we operate several subsidiaries which provide auxiliary services for our coal mining operations. Rhino Trucking provides our Kentucky coal operations with dependable, safe coal hauling to our preparation plants and loadout facilities and our southeastern Ohio coal operations with reliable transportation to our customers where rail is not available. As of March 31,June 30, 2010, our fleet included 44 trucks in Kentucky and 18 trucks in Ohio. Rhino Services is responsible for mine-related construction, site and roadway maintenance and post-mining reclamation. We have been able to efficiently supply internally the majority of these services, which were previously outsourced. Through Rhino Services, we plan and monitor each phase of our mining projects as well as the post-mining reclamation efforts. We also perform the majority of our drilling and blasting activities at our company-operated surface mines in-house rather than contracting to a third party. Triad Roof Support Systems manufactures roof control products used in underground coal mining.
Coal Reserves and Non-Reserve Coal Deposits
We base our coal reserve and non-reserve coal deposit estimates on engineering, economic and geological data assembled and analyzed by our staff. These estimates are also based on the expected cost of production and projected sale prices and assumptions concerning the permitability and advances in mining technology. The estimates of coal reserves and non-reserve coal deposits as to both quantity and quality are periodically updated to reflect the production of coal from the reserves, updated geologic models and mining recovery data, coal reserves recently acquired and estimated costs of production and sales prices. Changes in mining methods may increase or decrease the recovery basis for a coal seam as will plant processing efficiency tests. We maintain reserve and non-reserve coal deposit information in secure computerized databases, as well as in hard copy. The ability to update and/or modify the estimates of our coal reserves and non-reserve coal deposits is restricted to a few individuals and the modifications are documented.
Periodically, we retain outside experts to independently verify our coal reserve and our non-reserve coal deposit estimates. The most recent audit by an independent engineering firm of our and the joint venture's coal reserve and non-reserve coal deposit estimates was completed by Marshall Miller & Associates, Inc., as of March 31, 2010, and covered all of the coal reserves and non-reserve coal deposits that we and the joint venture controlled as of such date. As of March 31, 2010, we controlled an estimated 285.4 million tons of proven and probable reserves and an estimated 122.2 million tons of non-reserve coal deposits. As of March 31, 2010, the joint venture controlled an estimated 22.4 million tons of proven and probable coal reserves and an estimated 34.3 million tons of non-reserve coal deposits. Our and the joint venture's proven and probable coal reserves and non-reserve coal deposits were the same in all material respects as of December 31, 2009.
Coal Reserves
"Reserves" are defined by the SEC Industry Guide 7 as that part of a mineral deposit that could be economically and legally extracted or produced at the time of the reserve
determination. Industry Guide 7 divides reserves between "proven (measured) reserves" and "probable (indicated) reserves" which are defined as follows:
sampling and measurement are spaced so closely and the geologic character is so well defined that size, shape, depth and mineral content of reserves are well-established.
As of March 31, 2010, an estimated 93.4 million tons of our estimated 285.4 million tons of proven and probable coal reserves were assigned reserves, which are coal reserves that can be mined without a significant capital expenditure for mine development, and an estimated 192.0 million tons were unassigned reserves, which are coal reserves that we are holding for future development and, in most instances, would require new mining equipment, development work and possibly preparation facilities before we could commence coal mining. As of March 31, 2010, all of the joint venture's 22.4 million tons of proven and probable coal reserves were assigned reserves.
As of March 31, 2010, we owned approximately 36.8% of our proven and probable coal reserves and leased approximately 63.2% of our proven and probable reserves from various third-party landowners. As of March 31, 2010, the joint venture leased all of its proven and probable coal reserves. The majority of our leases have an initial term denominated in years but also provide for the term of the lease to continue until exhaustion of the "mineable and merchantable" coal in the lease area so long as the terms of the lease are complied with. Some of our leases have terms denominated in years rather than mine-to-exhaustion provisions, but in all such cases, we believe that the term of years will allow the recoverable reserve to be fully extracted in accordance with our projected mine plan. Consistent with industry practice, we conduct only limited investigations of title to our and the joint venture's coal properties prior to leasing. Title to lands and reserves of the lessors or grantors and the boundaries of our and the joint venture's leased priorities are not completely verified until we prepare to mine those reserves.
The following table provides information as of March 31, 2010 on the location of our and the joint venture's operations and the type, amount and ownership of the coal reserves:
| | Proven and Probable Reserves (1) | |||||||||||||||||||||||||||||
|---|---|---|---|---|---|---|---|---|---|---|---|---|---|---|---|---|---|---|---|---|---|---|---|---|---|---|---|---|---|---|
| Region | Total | Proven | Probable | Assigned (2) | Unassigned (2) | Owned | Leased | Steam (3) | Metallurgical (3) | |||||||||||||||||||||
| | (in million tons) | |||||||||||||||||||||||||||||
Central Appalachia | ||||||||||||||||||||||||||||||
Tug River Complex (KY, WV) | 34.8 | 28.1 | 6.7 | 30.8 | 4.0 | 4.9 | 29.9 | 28.8 | 6.0 | |||||||||||||||||||||
Rob Fork Complex (KY) | 26.2 | 22.6 | 3.6 | 26.2 | — | 8.5 | 17.7 | 19.7 | 6.5 | |||||||||||||||||||||
Deane Complex (KY) | 40.8 | 24.2 | 16.6 | 8.3 | 32.5 | 40.3 | 0.5 | 40.8 | — | |||||||||||||||||||||
Total Central Appalachia | 101.8 | 74.9 | 26.9 | 65.3 | 36.5 | 53.7 | 48.1 | 89.3 | 12.5 | |||||||||||||||||||||
Northern Appalachia | ||||||||||||||||||||||||||||||
Hopedale Complex (OH) | 18.5 | 12.7 | 5.8 | 13.1 | 5.4 | 10.5 | 8.0 | 18.5 | — | |||||||||||||||||||||
Sands Hill Complex (OH) | 8.6 | 8.3 | 0.3 | 8.6 | — | — | 8.6 | 8.6 | — | |||||||||||||||||||||
Leesville Field (OH) | 26.8 | 7.8 | 19.0 | — | 26.8 | 26.8 | — | 26.8 | — | |||||||||||||||||||||
Springdale Field (PA) | 13.8 | 8.8 | 5.0 | — | 13.8 | 13.8 | — | 13.8 | — | |||||||||||||||||||||
Total Northern Appalachia | 67.7 | 37.6 | 30.1 | 21.7 | 46.0 | 51.1 | 16.6 | 67.7 | — | |||||||||||||||||||||
Illinois Basin | ||||||||||||||||||||||||||||||
Taylorville Field (IL) | 109.5 | 38.8 | 70.7 | — | 109.5 | — | 109.5 | 109.5 | — | |||||||||||||||||||||
Western Bituminous | ||||||||||||||||||||||||||||||
McClane Canyon Mine (CO) | 6.4 | 4.4 | 2.0 | 6.4 | — | 0.2 | 6.2 | 6.4 | — | |||||||||||||||||||||
Total | 285.4 | 155.7 | 129.7 | 93.4 | 192.0 | 105.0 | 180.4 | 272.9 | 12.5 | |||||||||||||||||||||
Percentage of total | 54.6 | % | 45.4 | % | 32.7 | % | 67.3 | % | 36.8 | % | 63.2 | % | 95.6 | % | 4.4 | % | ||||||||||||||
Central Appalachia | ||||||||||||||||||||||||||||||
Rhino Eastern Complex | 22.4 | 13.7 | 8.7 | 22.4 | — | — | 22.4 | — | 22.4 | |||||||||||||||||||||
Percentage of total | 61.2 | % | 38.8 | % | 100 | % | — | — | 100 | % | — | 100 | % | |||||||||||||||||
The following table provides information on particular characteristics of our and the joint venture's coal reserves as of March 31, 2010:
| | | As Received Basis (1) | Proven and Probable Coal Reserves (2) | | As Received Basis (1) | Proven and Probable Coal Reserves (2) | ||||||||||||||||||||||||||||||||||||||||||||||||||||||
|---|---|---|---|---|---|---|---|---|---|---|---|---|---|---|---|---|---|---|---|---|---|---|---|---|---|---|---|---|---|---|---|---|---|---|---|---|---|---|---|---|---|---|---|---|---|---|---|---|---|---|---|---|---|---|---|---|---|---|---|---|
| | | | | | | | Sulfur Content | | | | | | | Sulfur Content | ||||||||||||||||||||||||||||||||||||||||||||||
| | | | | | S02/mm Btu | | | | | | S02/mm Btu | | ||||||||||||||||||||||||||||||||||||||||||||||||
| Region | Region | % Ash | % Sulfur | Btu/lb. | Total | <1% | 1-1.5% | >1.5% | Unknown | Region | % Ash | % Sulfur | Btu/lb. | Total | <1% | 1-1.5% | >1.5% | Unknown | ||||||||||||||||||||||||||||||||||||||||||
| | | | | | | (in million tons) | | | | | | (in million tons) | ||||||||||||||||||||||||||||||||||||||||||||||||
Central Appalachia | Central Appalachia | Central Appalachia | ||||||||||||||||||||||||||||||||||||||||||||||||||||||||||
Tug River Complex (KY, WV) | 10.42 | % | 1.21 | % | 12,946 | 1.86 | 34.8 | 22.1 | 6.4 | 5.0 | 1.3 | Tug River Complex (KY, WV) | 10.40 | % | 1.21 | % | 12,946 | 1.86 | 34.8 | 22.1 | 6.4 | 5.0 | 1.3 | |||||||||||||||||||||||||||||||||||||
Rob Fork Complex (KY) | 6.17 | % | 1.14 | % | 13,374 | 1.71 | 26.2 | 16.2 | 6.0 | 2.4 | 1.6 | Rob Fork Complex (KY) | 6.17 | % | 1.14 | % | 13,374 | 1.71 | 26.2 | 16.2 | 6.0 | 2.4 | 1.6 | |||||||||||||||||||||||||||||||||||||
Deane Complex (KY) | 5.36 | % | 0.91 | % | 13,448 | 1.36 | 40.8 | 21.0 | 11.8 | 1.0 | 7.0 | Deane Complex (KY) | 5.36 | % | 0.91 | % | 13,448 | 1.36 | 40.8 | 21.0 | 11.8 | 1.0 | 7.0 | |||||||||||||||||||||||||||||||||||||
Total Central Appalachia | 7.30 | % | 1.07 | % | 13,257 | 1.62 | 101.8 | 59.3 | 24.2 | 8.4 | 9.9 | Total Central Appalachia | 7.30 | % | 1.07 | % | 13,257 | 1.62 | 101.8 | 59.3 | 24.2 | 8.4 | 9.9 | |||||||||||||||||||||||||||||||||||||
Northern Appalachia | Northern Appalachia | Northern Appalachia | ||||||||||||||||||||||||||||||||||||||||||||||||||||||||||
Hopedale Complex (OH) | 6.71 | % | 2.32 | % | 12,994 | 3.57 | 18.5 | — | — | 18.5 | — | Hopedale Complex (OH) | 6.71 | % | 2.32 | % | 12,994 | 3.57 | 18.5 | — | — | 18.5 | — | |||||||||||||||||||||||||||||||||||||
Sands Hill Complex (OH) | 9.14 | % | 2.51 | % | 10,611 | 4.73 | 8.6 | — | — | 8.6 | — | Sands Hill Complex (OH) | 9.14 | % | 2.51 | % | 10,611 | 4.73 | 8.6 | — | — | 8.6 | — | |||||||||||||||||||||||||||||||||||||
Leesville Field (OH) | 6.21 | % | 2.21 | % | 13,152 | 3.36 | 26.8 | — | — | 26.8 | — | Leesville Field (OH) | 6.21 | % | 2.21 | % | 13,152 | 3.36 | 26.8 | — | — | 26.8 | — | |||||||||||||||||||||||||||||||||||||
Springdale Field (PA) | 6.63 | % | 1.72 | % | 13,443 | 2.55 | 13.8 | — | — | 13.8 | — | Springdale Field (PA) | 6.63 | % | 1.72 | % | 13,443 | 2.55 | 13.8 | — | — | 13.8 | — | |||||||||||||||||||||||||||||||||||||
Total Northern Appalachia | 6.81 | % | 2.18 | % | 12,844 | 3.39 | 67.7 | — | — | 67.7 | — | Total Northern Appalachia | 6.81 | % | 2.18 | % | 12,844 | 3.39 | 67.7 | — | — | 67.7 | — | |||||||||||||||||||||||||||||||||||||
Illinois Basin | Illinois Basin | Illinois Basin | ||||||||||||||||||||||||||||||||||||||||||||||||||||||||||
Taylorville Field (IL) | 8.47 | % | 3.85 | % | 12,085 | 6.38 | 109.5 | — | — | 109.5 | — | Taylorville Field (IL) | 8.47 | % | 3.85 | % | 12,085 | 6.38 | 109.5 | — | — | 109.5 | — | |||||||||||||||||||||||||||||||||||||
Western Bituminous | Western Bituminous | Western Bituminous | ||||||||||||||||||||||||||||||||||||||||||||||||||||||||||
McClane Canyon Mine (CO) | 11.62 | % | 0.59 | % | 11,675 | 1.01 | 6.4 | 6.4 | — | — | — | McClane Canyon Mine (CO) | 11.62 | % | 0.59 | % | 11,675 | 1.01 | 6.4 | 6.4 | — | — | — | |||||||||||||||||||||||||||||||||||||
Total | 7.73 | % | 2.39 | % | 12,674 | 3.86 | 285.4 | 65.7 | 24.2 | 185.6 | 9.9 | Total | 7.73 | % | 2.39 | % | 12,674 | 3.86 | 285.4 | 65.7 | 24.2 | 185.6 | 9.9 | |||||||||||||||||||||||||||||||||||||
Percentage of total | 23.0 | % | 8.5 | % | 65.0 | % | 3.5 | % | Percentage of total | 23.0 | % | 8.5 | % | 65.0 | % | 3.5 | % | |||||||||||||||||||||||||||||||||||||||||||
Central Appalachia | Central Appalachia | Central Appalachia | ||||||||||||||||||||||||||||||||||||||||||||||||||||||||||
Rhino Eastern Complex (WV) (3) | 4.55 | % | 0.64 | % | 13,999 | 0.92 | 22.4 | 22.4 | — | — | — | Rhino Eastern Complex (WV) (3) | 4.55 | % | 0.64 | % | 13,999 | 0.92 | 22.4 | 22.4 | — | — | — | |||||||||||||||||||||||||||||||||||||
Non-Reserve Coal Deposits
Non-reserve coal deposits are coal-bearing bodies that have been sufficiently sampled and analyzed in trenches, outcrops, drilling, and underground workings to assume continuity between sample points, and therefore warrant further exploration stage work. However, this coal does not qualify as a commercially viable coal reserve as prescribed by standards of the SEC until a final comprehensive evaluation based on unit cost per ton, recoverability and other material factors concludes legal and economic feasibility. Non-reserve coal deposits may be classified as such by either limited property control or geologic limitations, or both.
As of March 31, 2010, we owned approximately 32.7% of our non-reserve coal deposits and leased approximately 67.3% of our non-reserve coal deposits from various third-party landowners. The joint venture leased all of its non-reserve coal deposits from third-party landowners. Consistent with industry practice, we conduct only limited investigations of title to our coal properties prior to leasing. Title to lands and non-reserve coal deposits of the lessors or grantors and the boundaries of our leased priorities are not completely verified until we prepare to mine the coal.
The following table provides information as of March 31, 2010 on our and the joint venture's non-reserve coal deposits:
| | Non-Reserve Coal Deposits | ||||||||||
|---|---|---|---|---|---|---|---|---|---|---|---|
| | | Total Tons | |||||||||
| | Total Tons | ||||||||||
| Region | Owned | Leased | |||||||||
| | (in million tons) | ||||||||||
Central Appalachia | 29.2 | 11.7 | 17.5 | ||||||||
Northern Appalachia | 39.2 | 28.2 | 11.0 | ||||||||
Illinois Basin | 28.6 | — | 28.6 | ||||||||
Western Bituminous | 25.2 | — | 25.2 | ||||||||
Total | 122.2 | 39.9 | 82.3 | ||||||||
Percentage of total | 32.7 | % | 67.3 | % | |||||||
Rhino Eastern (Central Appalachia) (1) | 34.3 | — | 34.3 | ||||||||
Other Natural Resource Assets
Incidental to our coal mining process, we mine limestone from reserves located at our Sands Hill mining complex and sell it as aggregate to various construction companies and road builders that are located in close proximity to the mining complex when market conditions are favorable. We believe that our production of limestone provides us with an additional source of revenues at low incremental capital cost.
Part of our business strategy is to expand our operations through strategic acquisitions, including the acquisition of stable, cash generating, coal and non-coal natural resource assets. We believe that such assets would allow us to grow our cash available for distribution and enhance the stability of our cash flow by, for example, serving as a natural hedge to help mitigate our exposure to certain operating costs, such as diesel fuel. Wexford Capital has substantial experience in acquiring and operating natural resource assets and will assist us in identifying growth opportunities and additional management with the relevant expertise in acquiring such assets.
Customers
General
Our primary customers for our steam coal are electric utilities, and the metallurgical coal we produce is sold primarily to domestic and international steel producers. Excluding results from the joint venture, for the year ended December 31, 2009 and the threesix months ended March 31,June 30, 2010, approximately 95% and 86%85%, respectively, of our coal sales tons consisted of steam coal and approximately 5% and 14%15%, respectively, consisted of metallurgical coal. For both the year ended December 31, 2009 and the threesix months ended March 31,June 30, 2010, 100% of the joint venture's coal sales tons consisted of metallurgical coal. For the year ended December 31, 2009 and the threesix months ended March 31,June 30, 2010, excluding results from the joint venture, approximately 86% and 73%74%, respectively, of our coal sales tons that we produced were sold to electric utilities. In addition, for the year ended December 31, 2009, excluding results from the joint venture, approximately 26% of our total coal sales tons were sold through the OTC market, a portion of which were ultimately supplied to electric utilities. The majority of our electric utility customers
utility customers purchase coal for terms of one to three years, but we also supply coal on a spot basis for some of our customers. Excluding the results from the joint venture, for the year ended December 31, 2009, we derived approximately 85.0% of our total coal sales revenues from sales to our ten largest customers, for the year ended December 31, 2009, with affiliates of our top three customers accounting for approximately 52.2% of our coal sales revenues for that period: American Electric Power Company, Inc. (23.8%); Constellation Energy Group, Inc. (16.5%); and Indiana Harbor Coke Company, L.P., a subsidiary of Sunoco, Inc. (11.9%). Excluding the results from the joint venture, for the threesix months ended March 31, 2010.June 30, 2010, we derived approximately 85.6%81.1% of our total coal revenues from coal sales to our ten largest customers, with affiliates of our top three customers accounting for approximately 48.6%44.1% of our total coal revenues for that period: Indiana Harbor Coke Company, L.P. (21.9%, a subsidiary of Sunoco, Inc. (18.6%); American Electric Power Company, Inc. (14.0%(12.7%); and Mirant Corporation (12.6%Energy Trading, LLC (12.7%). Additionally, pursuant to the terms of a coal purchase agreement entered into under the joint venture agreement, we sell 100% of the joint venture's production to an affiliate of our joint venture partner, Patriot, which controls the amount and terms of sales of the coal produced from the joint venture. Incidental to our coal mining process, we mine limestone and sell it as aggregate to various construction companies and road builders that are located in close proximity to our Sands Hill mining complex.
Coal Supply Contracts
As of July 13,August 23, 2010, our sales commitments represented approximately 99%97% and 80%69%, respectively, of our estimated coal production (including purchased coal to supplement our production and excluding results from the joint venture) for the year ending December 31, 2010 and the twelve months ending JuneSeptember 30, 2011. For both the year ended December 31, 2009 and the threesix months ended March 31,June 30, 2010, approximately 99% and 97%, respectively, of our aggregate coal tons sold were sold through supply contracts. We expect to continue selling a significant portion of our coal under supply contracts.
As of July 22, 2010, one of our coal supply contracts relating to sales commitments for our estimated coal production through 2014 contained provisions that allow for the purchase price to be renegotiated at periodic intervals. This price re-opener provision requires the parties to agree on a new price. Failure of the parties to agree on a price under a price re-opener provision can lead to termination of the contract. Any adjustment or renegotiations leading to a significantly lower contract price could adversely affect our results of operations and cash available for distribution to our unitholders. We are currently renegotiating the purchase price pursuant to this price re-opener provision. If we fail to agree on a new price prior to October 1, 2010, this coal supply contract will terminate.
Quality and volumes for the coal are stipulated in coal supply contracts, and in some instances buyers have the option to vary annual or monthly volumes. Most of our coal supply contracts contain provisions requiring us to deliver coal within certain ranges for specific coal characteristics such as heat content, sulfur, ash, hardness and ash fusion temperature. Failure to meet these specifications can result in economic penalties, suspension or cancellation of shipments or termination of the contracts. Some of our contracts specify approved locations from which coal may be sourced. Some of our contracts set out mechanisms for temporary reductions or delays in coal volumes in the event of a force majeure, including events such as strikes, adverse mining conditions, mine closures, or serious transportation problems that affect us or unanticipated plant outages that may affect the buyers.
The terms of our coal supply contracts result from competitive bidding procedures and extensive negotiations with customers. As a result, the terms of these contracts, including price adjustment features, price re-opener terms, coal quality requirements, quantity parameters,
permitted sources of supply, future regulatory changes, extension options, force majeure, termination and assignment provisions, vary significantly by customer.
Transportation
We ship coal to our customers by rail, truck or barge. For the year ended December 31, 2009, the majority of our coal sales tonnage was shipped by rail. The majority of our coal is transported to customers by either the CSX Railroad or the Norfolk Southern Railroad in eastern Kentucky and by the Ohio Central Railroad or the Wheeling & Lake Erie Railroad in Ohio. In addition, in southeastern Ohio, we use our own trucking operations to transport coal to our
customers where rail is not available. We use third-party trucking to transport coal to our customer in Colorado. In addition, coal from certain of our mines is located within economical trucking distance to the Big Sandy River and/or the Ohio River and can be transported by barge. It is customary for customers to pay the transportation costs to their location.
We believe that we have good relationships with rail carriers and truck companies due, in part, to our modern coal-loading facilities at our loadouts and the working relationships and experience of our transportation and distribution employees.
Suppliers
For the year ended December 31, 2009 and the threesix months ending March 31,June 30, 2010, we spent $93.1 million and $20.5$41.3 million, respectively, to obtain goods and services in support of our mining operations, excluding capital expenditures and the joint venture. Principal supplies used in our business include diesel fuel, explosives, maintenance and repair parts and services, roof control and support items, tires, conveyance structures, ventilation supplies and lubricants. We use third-party suppliers for a significant portion of our equipment rebuilds and repairs, drilling services and construction.
We have a centralized sourcing group for major supplier contract negotiation and administration, for the negotiation and purchase of major capital goods and to support the mining and coal preparation plants. We are not dependent on any one supplier in any region. We promote competition between suppliers and seek to develop relationships with those suppliers whose focus is on lowering our costs. We seek suppliers who identify and concentrate on implementing continuous improvement opportunities within their area of expertise.
Competition
The coal industry is highly competitive. There are numerous large and small producers in all coal producing regions of the United States and we compete with many of these producers. Our main competitors include Alliance Resource Partners LP, Alpha Natural Resources, Inc., Booth Energy Group, CONSOL Energy Inc., International Coal Group, Inc., James River Coal Company, Massey Energy Company, Murray Energy Corporation, Oxford Resource Partners, LP, Patriot and TECO Energy, Inc.
The most important factors on which we compete are coal price, coal quality and characteristics, transportation costs and the reliability of supply. Demand for coal and the prices that we will be able to obtain for our coal are closely linked to coal consumption patterns of the domestic electric generation industry and international consumers. These coal consumption patterns are influenced by factors beyond our control, including demand for electricity, which is significantly dependent upon economic activity and summer and winter temperatures in the United States, government regulation, technological developments and the location, availability,
quality and price of competing sources of fuel such as natural gas, oil and nuclear, and alternative energy sources such as hydroelectric power.
Regulation and Laws
The coal mining industry is subject to regulation by federal, state and local authorities on matters such as:
In addition, many of our customers are subject to extensive regulation regarding the environmental impacts associated with the combustion or other use of coal, which could affect demand for our coal. The possibility exists that new laws or regulations, or new interpretations of existing laws or regulations, may be adopted that may have a significant impact on our mining operations or our customers' ability to use coal.
We are committed to conducting mining operations in compliance with applicable federal, state and local laws and regulations. However, because of extensive and comprehensive regulatory requirements, violations during mining operations occur from time to time. Violations, including violations of any permit or approval, can result in substantial civil and criminal fines and penalties, including revocation or suspension of mining permits. None of the violations to date have had a material impact on our operations or financial condition.
While it is not possible to quantify the costs of compliance with applicable federal and state laws and regulations, those costs have been and are expected to continue to be significant. Nonetheless, capital expenditures for environmental matters have not been material in recent years. We have accrued for the present value of estimated cost of reclamation and mine closings, including the cost of treating mine water discharge when necessary. The accruals for reclamation and mine closing costs are based upon permit requirements and the costs and timing of reclamation and mine closing procedures. Although management believes it has made adequate provisions for all expected reclamation and other costs associated with mine closures, future operating results would be adversely affected if we later determined these accruals to be
insufficient. Compliance with these laws and regulations has substantially increased the cost of coal mining for all domestic coal producers.
Mining Permits and Approvals
Numerous governmental permits or approvals are required for coal mining operations. When we apply for these permits and approvals, we are often required to assess the effect or impact that any proposed production of coal may have upon the environment. The permit application
requirements may be costly and time consuming, and may delay or prevent commencement or continuation of mining operations in certain locations. Future laws and regulations may emphasize more heavily the protection of the environment and, as a consequence, our activities may be more closely regulated. Laws and regulations, as well as future interpretations or enforcement of existing laws and regulations, may require substantial increases in equipment and operating costs, or delays, interruptions or terminations of operations, the extent of any of which cannot be predicted. The permitting process for certain mining operations can extend over several years, and can be subject to judicial challenge, including by the public. Some required mining permits are becoming increasingly difficult to obtain in a timely manner, or at all. We cannot assure you that we will not experience difficulty and/or delay in obtaining mining permits in the future.
Regulations provide that a mining permit can be refused or revoked if the permit applicant or permittee owns or controls, directly or indirectly through other entities, mining operations which have outstanding environmental violations. Although, like other coal companies, we have been cited for violations in the ordinary course of business, we have never had a permit suspended or revoked because of any violation, and the penalties assessed for these violations have not been material.
Before commencing mining on a particular property, we must obtain mining permits and approvals by state regulatory authorities of a reclamation plan for restoring, upon the completion of mining, the mined property to its approximate prior condition, productive use or other permitted condition.
Mine Health and Safety Laws
Stringent safety and health standards have been in effect since the adoption of the Coal Mine Health and Safety Act of 1969. The Mine Act, and regulations adopted pursuant thereto, significantly expanded the enforcement of health and safety standards and imposed comprehensive safety and health standards on numerous aspects of mining operations, including training of mine personnel, mining procedures, blasting, the equipment used in mining operations and other matters. MSHA monitors compliance with these laws and regulations. In addition, the states where we operate also have state programs for mine safety and health regulation and enforcement. Federal and state safety and health regulations affecting the coal industry are complex, rigorous and comprehensive, and have a significant effect on our operating costs.
The Mine Act is a strict liability statute that requires mandatory inspections of surface and underground coal mines and requires the issuance of enforcement action when it is believed that a standard has been violated. A penalty is required to be imposed for each cited violation. Negligence and gravity assessments result in a cumulative enforcement scheme that may result in the issuance of withdrawal orders. The Mine Act contains criminal liability provisions. For example, criminal liability may be imposed for corporate operators who knowingly or willfully authorize, order or carry out violations. The Mine Act also provides that civil and criminal penalties may be assessed against individual agents, officers and directors who knowingly authorize, order or carry out violations. Violations of mandatory health and safety standards that
are labeled as "serious" may result in the issuance of an order requiring the immediate withdrawal of miners from the mine or shutting down a mine or any section of a mine or any piece of mine equipment.
We have developed a health and safety management system that, among other things, educates our employees about health and safety requirements including those arising under
federal and state laws that apply to our mines. In addition, our health and safety management system tracks the performance of each operational facility in meeting the requirements of safety laws and company safety policies. As an example of the resources we allocate to health and safety matters, our safety management system includes a company-wide safety director and local safety directors who oversee safety and compliance at operations on a day-to-day basis. We continually monitor the performance of our safety management system and from time-to-time modify that system to address findings or reflect new requirements or for other reasons. We have even integrated safety matters into our compensation and retention decisions. For instance, our bonus program includes a meaningful evaluation of each eligible employee's role in complying with, fostering and furthering our safety policies.
We evaluate a variety of safety-related metrics to assess the adequacy and performance of our safety management system. For example, we monitor and track performance in areas such as "accidents, reportable accidents, lost time accidents and the lost-time accident frequency rate" and a number of others. Each of these metrics provides insights and perspectives into various aspects of our safety systems and performance at particular locations or mines generally and, among other things, can indicate where improvements are needed or further evaluation is warranted with regard to the system or its implementation. An important part of this evaluation is to assess our performance relative to certain national benchmarks.
Our non-fatal days lost incidence rate was 14.9% below the industry average for the year ended December 31, 2009. Non-fatal days lost incidence rate is an industry standard used to describe occupational injuries that result in loss of one or more days from an employee's scheduled work. Our non-fatal days lost time incidence rate for all operations for the year ended December 31, 2009 was 2.17 as compared to the national average of 2.55 for the same period, as reported by the MSHA.
In addition, for the year ended December 31, 2009 our average MSHA violations per inspection day was 0.70, as compared to the national average of 0.85 violations per inspection day, 17.6% below the national average.
These statistics demonstrate our commitment to providing a safe work environment and we have received industry-wide recognition for our safety record. For example, in February 2008, the Colorado Division of Reclamation, Mining and Safety and The Colorado Mining Association presented the Medium Underground Coal Mine Award to our McClane Canyon operation in Colorado for achieving an impressive reduction in their non-fatal days lost from 21.42 in 2004 to zero in 2007. The McClane Canyon operation received this award again in February 2010 for zero non-fatal days lost in 2009. In March 2010, MSHA awarded our Hopedale and Sands Hill mines in Northern Appalachia with Pacesetter for Mine Safety awards for having the lowest injury (non-fatal days lost) incident rate for 2009 in their district. Hopedale won in the category of "Underground mines with 101 or more employees," and Sands Hill won in the category of "Surface/Auger operations with 26 or more employees." Additionally, in February 2010, the Colorado Division of Reclamation, Mining and Safety and The Colorado Mining Association presented the Medium Underground Coal Mine Award to our McClane Canyon operation in Colorado for achieving zero non-fatal days lost in 2009.
In 2006, MSHA promulgated emergency rules on mine safety that address mine safety equipment, training, and emergency reporting requirements, including, among other matters,
(1) obligations related to (a) the development of new emergency response plans that address post-accident communications, tracking of miners, breathable air, lifelines, training and communication with local emergency response personnel, (b) establishing additional requirements for mine rescue teams, and (c) promptly notifying federal authorities of incidents
that pose a reasonable risk of death and (2) increased penalties for violations of the applicable federal laws and regulations. The Mine Improvement and New Emergency Response Act of 2006, or MINER Act, significantly amended the Mine Act, requiring improvements in mine safety practices, increasing criminal penalties and establishing a maximum civil penalty for non-compliance, and expanding the scope of federal oversight, inspection and enforcement activities. MSHA published final rules implementing the MINER Act to revise both the emergency rules and MSHA's existing civil penalty assessment regulations. Since passage of the MINER Act, enforcement scrutiny has also increased, including more inspection hours at mine sites, increased numbers of inspections and increased issuance of the number and the severity of enforcement actions and related penalties. Various states also have enacted their own new laws and regulations addressing many of these same subjects.
Mining accidents in the last several years in West Virginia, Kentucky and Utah have received national attention and instigated responses at the state and national levels that have resulted in increased scrutiny of current safety practices and procedures at all mining operations, particularly underground mining operations. More stringent mine safety laws and regulations promulgated by these states and the federal government have included increased sanctions for non-compliance. Other states have proposed or passed similar bills, resolutions or regulations addressing mine safety practices. Moreover, workplace accidents, such as the April 5, 2010, Upper Big Branch Mine incident, are likely to result in more stringent enforcement and possibly the passage of new laws and regulations.
Following the April 5, 2010 Upper Big Branch mine incident, public scrutiny of large mining operations has increased among government officials as well as regulatory agencies. On April 14, 2010, U.S. Representative George Miller publicly released a list of mining operations which would have faced "pattern of violation" sanctions were it not for contested notices of violation. This list included our Mine 28 in Pike County, Kentucky. After additional inspections on April 20, 2010, MSHA issued various citations related to Mine 28. Although we took steps to immediately abate certain of these citations, we may incur various penalties or sanctions.
From time to time, certain portions of individual mines have been required to suspend or shut down operations temporarily in order to address a compliance requirement or because of an accident. For instance, MSHA issues orders pursuant to Section 103(k) that, among other things, call for operations in the area of the mine at issue to suspend operations until compliance is restored. Likewise, if an accident occurs within a mine, the MSHA requirements call for all operations in that area to be suspended until the circumstance leading to the accident has been resolved. During the fiscal year ended December 31, 2009 (as in earlier years), we received such orders from government agencies and have experienced accidents within our mines requiring the suspension or shutdown of operations in those particular areas until the circumstances leading to the accident have been resolved. While the violations or other circumstances that caused such an accident were being addressed, other areas of the mine could and did remain operational. These circumstances did not require us to suspend operations on a mine-wide level or otherwise entail material financial or operational consequences for us. We cannot assure you that any suspension of operations at any one of our locations that may occur in the future will not have material financial or operational consequences for us.
It is our practice to contest notices of violations in cases in which we believe we have a good faith defense to the alleged violation or the proposed penalty and/or other legitimate grounds to challenge the alleged violation or the proposed penalty. In December 2008 and March 2009, MSHA assessed proposed penalties in excess of $100,000 with regard to three separate
notices of violation, all of which relate to our operations at Mine 28. Each of these notices of violation alleged an "unwarrantable failure" under the Mine Act with specific regard to the accumulation of combustible materials. The combustible materials typically underlying such citations are coal, loose coal, and float coal dust. We have contested these violations on grounds that the underlying circumstances did not support the issuance of a notice of violation and/or the gravity of the proposed penalty. These contests are pending. These alleged violations were abated at the time or immediately after the notices of violation were issued, and we have not been issued any notices of violation from MSHA proposing a penalty in excess of $100,000 since March 2009. We cannot predict the outcome of our challenges or assure you that we will not be assessed significant fines, penalties, or sanctions in the future with respect to alleged instances of non-compliance.
We exercise substantial efforts toward achieving compliance at our mines. In light of the recent citations issued with respect to Mine 28, we have further increased our focus with regard to health and safety at all of our mines and at Mine 28 in particular. These efforts include hiring additional skilled personnel, providing training programs, hosting quarterly safety meetings with MSHA personnel and making capital expenditures in consultation with MSHA aimed at increasing mine safety. We believe that these efforts have contributed, and continue to contribute, positively to safety and compliance at Mine 28.
Implementing and complying with these state and federal safety laws and regulations could adversely affect our results of operations and financial position. Some safety measures may decrease our production rates or cause us not to pursue certain reserves due to safety concerns, adversely affecting our revenues. For instance, we incurred approximately $2.2$3.1 million for the fifteeneighteen months ended March 31,June 30, 2010 in capital expenditures to comply with the requirements of the MINER Act. We project capital expenditures of approximately $2.8 million on compliance with mine safety laws over the next five years. These figures are subject to change, however, as new requirements come into effect.
Black Lung Laws
Under federal black lung benefits laws, businesses that conduct current mining operations must make payments of black lung benefits to coal miners with black lung disease and to some survivors of a miner who dies from this disease. To help fund these benefits, a tax is levied on production of $1.10 per ton for underground-mined coal and $0.55 per ton for surface-mined coal, but not to exceed 4.4% of the applicable sales price, in order to compensate miners who are totally disabled due to black lung disease and some survivors of miners who died from this disease, and who were last employed as miners prior to 1970 or subsequently where no responsible coal mine operator has been identified for claims. In addition, some claims for which coal operators had previously been responsible will be obligations of the government trust funded by the tax. The Revenue Act of 1987 extended the termination date of this tax from January 1, 1996, to the earlier of January 1, 2014, or the date on which the government trust becomes solvent. In 2009, we recorded approximately $4.0 million of expense related to this excise tax.
On March 23, 2010, President Obama signed into law health care reform legislation, known as the Affordable Health Choices Act, which includes significant changes to the federal black lung program. Among other things, these changes include provisions, retroactive to 2005, which
would (1) provide an automatic survivor benefit paid upon the death of a miner with an awarded black lung claim, without requiring proof that the death was due to pneumoconiosis and (2) establish a rebuttable presumption with regard to pneumoconiosis among miners with 15 or more years of coal mine employment that are totally disabled by a respiratory condition. These changes could have a material impact on our costs expended in association with the federal black lung program.
For miners last employed as miners after 1969 and who are determined to have contracted black lung, we maintain insurance coverage sufficient to cover the cost of present and future claims or we participate in state programs that provide this coverage. We may also be liable under state laws for black lung claims and are covered through either insurance policies or state programs. Congress and state legislatures regularly consider various items of black lung legislation, which, if enacted, could adversely affect our business, results of operations and financial position.
Workers' Compensation
We are required to compensate employees for work-related injuries under various state workers compensation laws. The states in which we operate consider changes in workers' compensation laws from time to time. Our costs will vary based on the number of accidents that occur at our mines and other facilities, and our costs of addressing these claims. We are insured under the Ohio State Workers Compensation Program for our operations in Ohio. Our remaining operations, including Central Appalachia and the Western Bituminous region, are insured through Rockwood Casualty Insurance Company.
Surface Mining Control and Reclamation Act
SMCRA establishes operational, reclamation and closure standards for all aspects of surface mining, including the surface effects of underground coal mining. SMCRA requires that comprehensive environmental protection and reclamation standards be met during the course of and upon completion of mining activities. In conjunction with mining the property, we reclaim and restore the mined areas by grading, shaping and preparing the soil for seeding. Upon completion of mining, reclamation generally is completed by seeding with grasses or planting trees for a variety of uses, as specified in the approved reclamation plan. We believe we are in compliance in all material respects with applicable regulations relating to reclamation.
SMCRA and similar state statutes require, among other things, that mined property be restored in accordance with specified standards and approved reclamation plans. The act requires that we restore the surface to approximate the original contours as soon as practicable upon the completion of surface mining operations. The mine operator must submit a bond or otherwise secure the performance of these reclamation obligations. Mine operators can also be responsible for replacing certain water supplies damaged by mining operations and repairing or compensating for damage to certain structures occurring on the surface as a result of mine subsidence, a consequence of long-wall mining and possibly other mining operations. In addition, the Abandoned Mine Lands Program, which is part of SMCRA, imposes a tax on all current mining operations, the proceeds of which are used to restore mines closed before prior to SMCRA's adoption in 1977. The maximum tax is 31.5 cents per ton on surface-mined coal and 13.5 cents per ton on underground-mined coal. As of December 31, 2009, we had accrued approximately $45.1 million for the estimated costs of reclamation and mine closing, including the cost of treating mine water discharge when necessary. In addition, states from time to time have increased and may continue to increase their fees and taxes to fund reclamation of orphaned mine sites and abandoned mine drainage control on a statewide basis.
After the application is submitted, public notice or advertisement of the proposed permit action is required, which is followed by a public comment period. It is not uncommon for a SMCRA mine permit application to take over two years to prepare and review, depending on the size and complexity of the mine, and another two years or even longer for the permit to be issued. The variability in time frame required to prepare the application and issue the permit can be attributed primarily to the various regulatory authorities' discretion in the handling of
comments and objections relating to the project received from the general public and other agencies. Also, it is not uncommon for a permit to be delayed as a result of judicial challenges related to the specific permit or another related company's permit.
Federal laws and regulations also provide that a mining permit or modification can be delayed, refused or revoked if owners of specific percentages of ownership interests or controllers (i.e., officers and directors or other entities) of the applicant have, or are affiliated with another entity that has outstanding violations of SMCRA or state or tribal programs authorized by SMCRA. This condition is often referred to as being "permit blocked" under the federal Applicant Violator Systems, or AVS. Thus, non-compliance with SMCRA can provide the bases to deny the issuance of new mining permits or modifications of existing mining permits, although we know of no basis by which we would be (and we are not now) permit-blocked.
The "stream buffer zone rule," or SBZ Rule, prohibits mining disturbances within 100 feet of streams if there would be a negative effect on water quality. In December 2008, the U.S. Department of the Interior's Office of Surface Mining Reclamation and Enforcement, or OSM, revised the original SBZ Rule, which had been issued under SMCRA in 1983. The 2008 SBZ Rule was challenged in the U.S. District Court for the District of Columbia. In June 2009, the OSM and the Corps entered into a memorandum of understanding on how to protect waterways from degradation if the revised SBZ Rule were vacated. In August 2009, the Court concluded that the 2008 SBZ Rule could not be vacated at that time. On November 30, 2009, the OSM published an advanced notice of proposed rulemaking to further revise the SBZ Rule. In a March 2010 settlement with litigation parties, the OSM agreed to use best efforts to sign a proposed rule by February 28, 2011 and a final rule by June 29, 2012. In addition, Congress has proposed, and may in the future propose, legislation to restrict the placement of mining material in streams. The requirements of the revised SBZ Rule or future legislation, when adopted, will likely be stricter than the prior SBZ Rule to further protect streams from the impact of surface mining, and may adversely affect our business and operations.
Surety Bonds
A mine operator must secure the performance of its reclamation obligations required under SMCRA through the use of surety bonds or other approved forms of performance security to cover the costs the state would incur if the mine operator were unable to fulfill its obligations. It has become increasingly difficult for mining companies to secure new surety bonds without the posting of partial collateral. In addition, surety bond costs have increased while the market terms of surety bonds have generally become less favorable. It is possible that surety bonds issuers may refuse to renew bonds or may demand additional collateral upon those renewals. Our failure to maintain, or inability to acquire, surety bonds that are required by state and federal laws would have a material adverse effect on our ability to produce coal, which could affect our profitability and cash flow. As of March 31,June 30, 2010, we had approximately $65.8$65.9 million in surety bonds outstanding to secure the performance of our reclamation obligations.
Air Emissions
The Federal Clean Air Act, or the CAA, and similar state and local laws and regulations, which regulate emissions into the air, affect coal mining operations both directly and indirectly. The CAA directly impacts our coal mining and processing operations by imposing permitting requirements and, in some cases, requirements to install certain emissions control equipment, on sources that emit various hazardous and non-hazardous air pollutants. The CAA also indirectly affects coal mining operations by extensively regulating the air emissions of coal-fired electric power generating plants and other industrial consumers of coal, including air emissions of sulfur
dioxide, nitrogen oxides, particulates, mercury and other compounds. There have been a series of recent federal rulemakings that are focused on emissions from coal-fired electric generating facilities. Installation of additional emissions control technology and additional measures required under laws and regulations related to air emissions will make it more costly to operate coal-fired power plants and possibly other facilities that consume coal and, depending on the requirements of individual state implementation plans, or SIPs, could make coal a less attractive fuel alternative in the planning and building of power plants in the future. Stricter air emission regulation would impact the operation of existing power plants and the construction of new power plants and may lead to changes in our customers' cost structure and purchasing patterns. Coal-fired power plants without up-to-date pollution controls may have to continue to install pollution control technology and upgrades, and might not be able to recover costs for these upgrades in the prices they charge for power due, in part, to the control exercised by state public utility commissions over such rate matters. As a result, the regulation of emissions under the CAA may impact our operations due to any resulting change in the use and demand for coal by our steam coal customers, which could have a material adverse effect on our business, financial condition and results of operations.
The EPA's Acid Rain Program, provided in Title IV of the CAA, regulates emissions of sulfur dioxide from electric generating facilities. Sulfur dioxide is a by-product of coal combustion. Affected facilities purchase or are otherwise allocated sulfur dioxide emissions allowances, which must be surrendered annually in an amount equal to a facility's sulfur dioxide emissions in that year. Affected facilities may sell or trade excess allowances to other facilities that require additional allowances to offset their sulfur dioxide emissions. In addition to purchasing or trading for additional sulfur dioxide allowances, affected power facilities can satisfy the requirements of the EPA's Acid Rain Program by switching to lower sulfur fuels, installing pollution control devices such as flue gas desulfurization systems, or "scrubbers," by reducing electricity generating levels, or by switching to fuels other than coal.
EPA has promulgated rules, referred to as the "NOx SIP Call," that require coal-fired power plants in 21 eastern states and Washington D.C. to make substantial reductions in nitrogen oxide emissions in an effort to reduce the impacts of ozone transport between states. As a result of the program, many power plants have been or will be required to install additional emission control measures, such as selective catalytic reduction devices. Installation of additional emission control measures will make it more costly to operate coal-fired power plants, potentially making coal a less attractive fuel.
Additionally, in March 2005, EPA issued the final Clean Air Interstate Rule, or CAIR, which would have permanently capped nitrogen oxide and sulfur dioxide emissions in 28 eastern states and Washington, D.C. CAIR required those states to achieve the required emission reductions by requiring power plants to either participate in an EPA-administered "cap-and-trade" program that caps emission in two phases, or by meeting an individual state emissions budget through measures established by the state. The stringency of the caps under CAIR may have required many coal-fired sources to install additional pollution control equipment, such as wet scrubbers,
to comply. This increased sulfur emission removal capability required by the rule could have resulted in decreased demand for lower sulfur coal, which may have potentially driven down prices for lower sulfur coal. On July 11, 2008, the United States Court of Appeals for the D.C. Circuit vacated CAIR. The EPA subsequently filed a petition for rehearing or, in the alternative, for a remand of the case without vacatur. On December 23, 2008, the Court issued an opinion to remand without vacating CAIR. Therefore, CAIR will remain in effect while the EPA conducts rulemaking to modify CAIR to comply with the Court's July 2008 opinion. The Court declined to impose a schedule by which the EPA must complete the rulemaking, but reminded the EPA that
the Court does "...not intend to grant an indefinite stay of the effectiveness of this Court's decision." The EPA is considering its options on how to proceed.
In March 2005, EPA finalized the Clean Air Mercury Rule, or CAMR, which establishes a two-part nationwide cap on mercury emissions from coal-fired power plants beginning in 2010. The CAMR has been the subject of ongoing litigation, and on February 8, 2008, the United States Court of Appeals for the D.C. Circuit vacated the rule for further consideration by the EPA. As a result of the decision to vacate the CAMR, in February 2009 the EPA announced that it would regulate mercury emissions by issuing Maximum Achievable Control Technology standards, or MACT, which are likely to impose stricter limitations on mercury emissions from power plants than the vacated CAMR. The EPA is under a court deadline to issue a final rule requiring MACT for power plants by November 2011. In conjunction with these efforts, on December 24, 2009, EPA approved an Information Collection Request (ICR) requiring all US power plants with coal-or oil-fired electric generating units to submit emissions information for use in developing air toxics emissions standards. The EPA has stated that it intends to propose air toxics standards for coal- and oil-fired electric generating units by March 10, 2011. In addition, on April 30, 2010, EPA proposed new MACT for several classes of boilers and process heaters, including large coal-fired boilers and process heaters, which would require significant reductions in the emission of particulate matter, carbon monoxide, hydrogen chloride, dioxins and mercury. While the future of mercury emission regulation is uncertain, certain states have adopted or proposed mercury control regulations that are more stringent than the federal requirements, which could reduce the demand for coal in those states.
The EPA has adopted new, more stringent national air quality standards, or NAAQS, for ozone and fine particulate matter. As a result, some states will be required to amend their existing SIPs to attain and maintain compliance with the new air quality standards. For example, in December 2004, the EPA designated specific areas in the United States as in "non-attainment" with the new NAAQS for fine particulate matter. In March 2007, the EPA published final rules addressing how states would implement plans to bring applicable non-attainment regions into compliance with the new air quality standard. Because coal mining operations and coal-fired electric generating facilities emit particulate matter, our mining operations and customers could be affected when the standards are implemented by the applicable states.
In June 2005, the EPA amended its regional haze program to improve visibility in national parks and wilderness areas. Affected states were required to develop SIPs by December 2007 that, among other things, identify facilities that will have to reduce emissions and comply with stricter emission limitations. This program may restrict construction of new coal-fired power plants where emissions are projected to reduce visibility in protected areas. In addition, this program may require certain existing coal-fired power plants to install emissions control equipment to reduce haze-causing emissions such as sulfur dioxide, nitrogen oxide, and particulate matter. Demand for our steam coal could be affected when these standards are implemented by the applicable states.
On June 3, 2010, EPA issued a final rule setting forth a more stringent primary NAAQS applicable to sulfur dioxide. The rule also modifies the monitoring increment for the sulfur dioxide standard, establishing a 1-hour standard, and expands the sulfur dioxide monitoring network. Attainment designations will be made pursuant to the modified standards by June 2012. States with non-attainment areas will have until 2014 to submit SIP revisions which must meet the modified standard by August 1, 2017; for all other areas, states will be required to submit "maintenance" SIPs by 2013. EPA also plans to address the secondary sulfur dioxide standard, which is currently under review. As a result, coal-fired power plants, which are the
largest end users of our coal, may be required to install additional emissions control equipment or take other steps to lower sulfur emissions.
The Department of Justice, on behalf of the EPA, has filed lawsuits against a number of coal-fired electric generating facilities alleging violations of the new source review provisions of the CAA. The EPA has alleged that certain modifications have been made to these facilities without first obtaining certain permits issued under the new source review program. Several of these lawsuits have settled, but others remain pending. Depending on the ultimate resolution of these cases, demand for our coal could be affected.
On June 16, 2010, several environmental groups petitioned the EPA to list coal mines as a source of air pollution and establish emissions standards under the CAA for several pollutants, including particulate matter, nitrogen oxide gases, volatile organic compounds, and methane. Petitioners further requested that the EPA regulate other emissions from mining operations, including dust and clouds of nitrogen oxides associated with blasting operations. If the petitioners are successful, emissions of these or other materials associated with our mining operations could become subject to further regulation pursuant to existing laws such as the CAA. In that event, we may be required to install additional emissions control equipment or take other steps to lower emissions associated with our operations, thereby reducing our revenues and adversely affecting our operations.
Carbon Dioxide Emissions
One by-product of burning coal is carbon dioxide, which is considered a greenhouse gas and is a major source of concern with respect to climate change and global warming. In 2005, the Kyoto Protocol to the 1992 United Nations Framework Convention on Climate Change, which establishes a binding set of emission targets for greenhouse gases, became binding on all countries that had ratified it. The United States has not ratified the Kyoto Protocol, which expires in 2012. However, the United States is actively participating in international discussions that are currently underway to develop a treaty to replace the Kyoto Protocol after its expiration, with a goal of reaching a consensus on a replacement treaty. Any replacement treaty or other international arrangement requiring additional reductions in greenhouse gas emissions could have a global impact on the demand for coal.
Future regulation of greenhouse gases in the United States could occur pursuant to future U.S. treaty commitments, new domestic legislation that may impose a carbon emissions tax or establish a cap-and-trade program or regulation by the EPA. The Obama Administration has indicated its support for a mandatory cap and trade program to reduce greenhouse gas emissions and the U.S. Congress is considering various proposals to reduce greenhouse gas emissions, mandate electricity suppliers to use renewable energy sources to generate a certain percentage of power, and require energy efficiency measures. In June 2009, the U.S. House of Representatives passed a comprehensive climate change and energy bill, the American Clean Energy and Security Act, and the U.S. Senate has considered similar legislation that would, among other things, impose a nationwide cap on greenhouse gas emissions and require major sources,
including coal-fired power plants, to obtain "allowances" to meet that cap. In May 2010, Senators Kerry and Lieberman introduced a draft bill, the American Power Act, which is similar to the House bill, and would seek to reduce greenhouse gas emissions to 17% below 2005 levels by 2020, and more than 80% below those levels by 2050. Passage of such comprehensive climate change and energy legislation could impact the demand for coal. Any reduction in the amount of coal consumed by North American electric power generators could reduce the price of coal that we mine and sell, thereby reducing our revenues and materially and adversely affecting our business and results of operations.
Even in the absence of new federal legislation, greenhouse gas emissions may be regulated in the future by the EPA pursuant to the CAA. In response to the April 2007 United States Supreme Court ruling inMassachusetts, et al. v. EPA that the EPA has authority to regulate carbon dioxide emissions under the CAA, the EPA has taken several steps towards implementing regulations regarding the emission of greenhouse gases. In April 2009, the EPA issued a proposed finding that carbon dioxide and certain other greenhouse gases emitted by motor vehicles endanger public health and the environment. This finding was finalized in December 2009, allowing the EPA to begin regulating greenhouse gas emissions under existing provisions of CAA. In May 2010, the EPA issued a final "tailoring rule" that phases in various greenhouse-gas-related permitting requirements beginning in January 2011. Until June 30, 2011, only sources currently subject to CAA prevention of significant deterioration or operating permit programs will be subject to greenhouse gas permitting requirements. Beginning July 1, 2011, these permitting programs will extend to newly built sources emitting more than 100,000 tons of greenhouse gases per year and modified facilities increasing their emissions by at least 75,000 tons of greenhouse gases per year. EPA's rule clarifies that "smaller sources," those with emissions of less than 50,000 tons of greenhouse gases per year, will not be regulated until at least April 30, 2016, and may in fact be permanently excluded from the permitting requirements. As a result of these and other emissions limitations EPA may set for carbon dioxide from electric utilities, the amount of coal our customers purchase from us could decrease. Lawsuits challenging the tailoring rule have already been brought, and as a result of such challenges, the rule may be modified or vacated in whole or in part. Moreover, the final outcome of federal legislative action on greenhouse gas emissions may change one or more of the foregoing final or proposed EPA findings and regulations. Additionally, in October 2009, the EPA published a final rule requiring certain emitters of greenhouse gases, including coal-fired power plants, to monitor and report their greenhouse gas emissions to the EPA beginning in 2011 for emissions occurring in 2010. As a result of these or other emissions limitations EPA may set for carbon dioxide from electric utilities, the amount of coal our customers purchase from us could decrease.
On June 28, 2010, the EPA issued final regulations that will require certain underground coal mines with annual greenhouse gas emissions in excess of 25,000 tons of carbon dioxide per year to monitor and report greenhouse gas emissions. Subject coal mines will be required to begin monitoring as of January 1, 2011, and report emissions of greenhouse gases by March of the following year. We are in the process of reviewing the regulations and the methods of compliance. The costs of complying with these regulations may be material. However, the regulations do not require that underground coal mines install and implement controls to restrict greenhouse gas emissions.
Many states and regions have adopted greenhouse gas initiatives and certain governmental bodies, including the State of California, have or are considering the imposition of fees or taxes based on the emission of greenhouse gases by certain facilities. In December 2005, seven northeastern states (Connecticut, Delaware, Maine, New Hampshire, New Jersey, New York, and Vermont) signed the Regional Greenhouse Gas Initiative agreement, or RGGI, calling for implementation of a cap and trade program aimed at reducing carbon dioxide emissions from
power plants in the participating states. The members of RGGI agreed to seek to establish in statute and/or regulation a carbon dioxide trading program and have each state's component of the regional program effective no later than December 31, 2009. Auctions for carbon dioxide allowances under the program began in September 2008. The RGGI program calls for signatory states to stabilize carbon dioxide emissions to current levels from 2009 to 2015, followed by a 2.5% reduction each year from 2015 through 2018. Since its inception, several additional northeastern states and Canadian provinces have joined as participants or observers. RGGI has begun holding quarterly carbon dioxide allowance auctions for its initial three-year compliance
period from January 1, 2009 to December 31, 2011 to allow utilities to buy allowances to cover their carbon dioxide emissions.
Climate change initiatives are also being considered or enacted in some western states. In September 2006, California enacted the Global Warming Solutions Act of 2006, which establishes a statewide greenhouse gas emissions cap of 1990 levels by 2020 and sets a framework for further reductions after 2020. In September 2006, California also adopted greenhouse gas legislation that prohibits long-term baseload generators from having a greenhouse gas emissions rate greater than that of combined cycle natural gas generator. In February 2007, the governors of Arizona, California, New Mexico, Oregon and Washington launched the Western Climate Initiative in an effort to develop a regional strategy for addressing climate change. The goal of the Western Climate Initiative is to identify, evaluate and implement collective and cooperative methods of reducing greenhouse gases in the region to 15% below 2005 levels by 2020. Since its initial launching, a number of additional western states and provinces have joined the initiative, or have agreed to participate as observers, including Montana, which has joined the initiative and Wyoming, which has signed on as an observer. However, Arizona has stated more recently that it does not intend to endorse or participate in any regional cap-and-trade program instituted by the Western Climate Initiative, though it will remain a member of the multistate coalition.
Midwestern states have also adopted initiatives to reduce and monitor greenhouse gas emissions. In November 2007, Illinois, Indiana, Iowa, Kansas, Michigan, Minnesota, Ohio, South Dakota and Wisconsin and Manitoba signed the Midwestern Greenhouse Gas Reduction Accord to develop and implement steps to reduce greenhouse gas emissions. The draft recommendations, released in June 2009, call for a 20% reduction below 2005 emissions levels by 2020 and additional reductions to 80% below 2005 emissions levels by 2080.
The permitting of new coal-fired power plants has also recently been contested by some state regulators and environmental organizations based on concerns relating to greenhouse gas emissions. In October 2007, state regulators in Kansas denied an air emissions construction permit for a new coal-fueled power plant based on the plant's projected emissions of carbon dioxide. Other state regulatory authorities have also rejected the construction of new coal-fueled power plants based on the uncertainty surrounding the potential costs associated with greenhouse gas emissions from these plants under future laws limiting the emissions of carbon dioxide. In addition, several permits issued to new coal-fueled power plants without limits on greenhouse gas emissions have been appealed to the EPA's Environmental Appeals Board.
Also, a federal appeals court has allowed a lawsuit pursuing federal common law claims to proceed against certain utilities on the basis that they may have created a public nuisance due to their emissions of carbon dioxide, while a second federal appeals court dismissed a similar case on procedural grounds.
In addition to direct regulation of greenhouse gases, over 30 states have adopted mandatory "renewable portfolio standards," which require electric utilities to obtain a certain percentage of their electric generation portfolio from renewable resources by a certain date. These standards
range generally from 10% to 30%, over time periods that generally extend from the present until between 2020 and 2030. At least five states have renewable portfolio standard goals that are not yet legal requirements. Other states may adopt similar requirements, and federal legislation is a possibility in this area. To the extent these requirements affect our current and prospective customers, they may reduce the demand for coal-fired power, and may affect long-term demand for our coal.
Increased efforts to control greenhouse gas emissions could result in reduced demand for coal. Current or future climate change rules have required, and rules, court orders or other legally enforceable mechanisms may in the future require, additional controls on coal-fired power plants and industrial boilers and may even cause some users of coal to switch from coal to a lower carbon fuel. There can be no assurance at this time that a carbon dioxide cap and trade program, a carbon tax or other regulatory regime, if implemented by the states in which our customers operate or at the federal level, or future court orders or other legally enforceable mechanisms, will not affect the future market for coal in those regions. If mandatory restrictions on carbon dioxide emissions are imposed, the ability to capture and store large volumes of carbon dioxide emissions from coal-fired power plants may be a key mitigation technology to achieve emissions reductions while meeting projected energy demands. A number of recent legislative and regulatory initiatives to encourage the development and use of carbon capture and storage technology have been proposed or enacted. For example, the U.S. Department of Energy announced in May 2009 that it would provide $2.4 billion of federal stimulus funds under the ARRA to expand and accelerate the commercial deployment of large-scaled carbon capture and storage technology. However, there can be no assurances that cost-effective carbon capture and storage technology will become commercially feasible in the near future.
Clean Water Act
The Federal Clean Water Act, or the CWA, and similar state and local laws and regulations affect coal mining operations by imposing restrictions on the discharge of pollutants, including dredged or fill material, into waters of the United States. The CWA establishes in-stream water quality and treatment standards for wastewater discharges through Section 402 National Pollutant Discharge Elimination System, or NPDES, permits. Regular monitoring, as well as compliance with reporting requirements and performance standards, are preconditions for the issuance and renewal of Section 402 NPDES permits. Individual permits or general permits under Section 404 of the CWA are required to discharge dredged or fill materials into waters of the United States. Individual permits are more difficult and time-consuming to obtain, and are more likely to be subject to public challenge, unlike general permits, which can be available when minimal adverse environmental effect is expected and, as a result, are subject to a less comprehensive application process. Our surface coal mining operations typically require such permits to authorize activities such as the creation of slurry ponds, stream impoundments, and valley fills.
Recent federal district court decisions in West Virginia, and related litigation filed in federal district court in Kentucky, have created uncertainty regarding the future ability to obtain certain general Section 404 permits authorizing the construction of valley fills for the disposal of overburden from mining operations. The Corps is authorized to issue general "nationwide" permits for specific categories of activities that are similar in nature and that are determined to have minimal adverse environmental effects. Nationwide Permit 21, or NWP 21, authorizes the disposal of dredged or fill material from surface coal mining activities into the waters of the United States. A July 2004 decision by the United States District Court for the Southern District of West Virginia inOhio Valley Environmental Coalition v. Bulen enjoined the Huntington District of the Corps from issuing further permits pursuant to NWP 21 (Surface Coal Mining
Activities). While this decision was vacated by the United States Court of Appeals for the Fourth Circuit in November 2005, it has been remanded to the United States District Court for the Southern District of West Virginia for further proceedings. Moreover, a similar lawsuit has been filed in the United States District Court for the Eastern District of Kentucky that seeks to enjoin the issuance of permits pursuant to NWP 21 by the Louisville District of the Corps. The plaintiffs have sought to amend their claims also to enjoin permits issued under Nationwide Permit 49 (Coal Remining Activities) and Nationwide Permit 50 (Underground Coal Mining
Activities). We currently utilize certain of these Nationwide Permit authorizations, and these court cases have created uncertainty regarding our ability to utilize these types of permits in the future for the disposal of dredged or fill material.
Plaintiff environmental groups have also recently challenged the Corps' decision to issue individual Section 404 permits for certain surface coal mining activities. On March 23, 2007, in the caseOhio Valley Environmental Coalition v. U.S. Army Corps of Engineers, the United States District Court for the Southern District of West Virginia rescinded permits authorizing the construction of valley fills at a number of separate surface coal mining operations, finding that the Corps had issued the permits arbitrarily and capriciously in violation of NEPA and the CWA. On June 13, 2007, the Court issued a declaratory judgment indicating that the mining companies in the case were also required to obtain separate NPDES authorizations for discharges into the stream segments located between the toes of their valley fills and their respective sediment pond embankments. On February 13, 2009, the United States Court of Appeals for the Fourth Circuit, inOhio Valley Environmental Council v. Aracoma Coal Company, rejected the substantive challenges to the Section 404 permits involved in the case primarily by deferring to the expertise of the Corps in review of the permit applications. On August 26, 2009,The Ohio Valley Environmental Council petitioned for certiorari, thoughbut the Supreme Court has not yet decided if it will heardismissed the case.petition on August 19, 2010.
In addition, the EPA has taken several initiatives to address the issuance of Section 404 permits for coal mining activities in the Eastern United States. In particular, the EPA began to comment on Section 404 permit applications pending before the Corps raising many of the same issues decided in favor of the coal industry inAracoma. Many of the EPA's comment letters were submitted long after the end of the EPA's comment period based on what the EPA contended was "new" information on the impacts of valley fills on stream water quality immediately downstream of valley fills. These letters have created regulatory uncertainty regarding the issuance of Section 404 permits for coal mining operations and have substantially expanded the time required for issuance of these permits.
We currently have a number of Section 404 permit applications pending with the Corps. Not all of these permit applications seek approval for actual fills; some relate to other activities, such as mining through streams and the associated post-mining reconstruction efforts. We sought to prepare all pending permit applications consistent with the requirements of the Section 404 program. Our five year plan of mining operations does not rely on the issuance of these pending permit applications. However, the Section 404 permitting requirements are complex, and regulatory scrutiny of these applications, particularly in Appalachia, has increased such that we cannot assure you that our applications will be granted or, alternatively, require material changes to their terms before being granted by the Corps. While we will continue to pursue the issuance of these permits in the ordinary course of our operations, to the extent that the permitting process creates significant delay or limits our ability to pursue certain reserves beyond our current five year plan, our revenues may be negatively affected.
The Corps, the EPA and the Department of the Interior announced an interagency action plan in June 2009 for an "enhanced review" of any project that requires both a SMCRA and a CWA permit designed to reduce the harmful environmental consequences of mountaintop
mining in the Appalachian region. As part of this interagency action plan, in July 2009 the Corps proposed to suspend and modify NWP 21 in six Appalachian region states to prohibit its use to authorize discharges of fill material into waters of the United States for mountaintop mining. On June 17, 2010, the Corps announced the suspension of all NWP 21 permits in these six Appalachian region states until the Corps takes further action on NWP 21, or until NWP 21 expires on March 18, 2012. While the suspension is in effect, proposed surface coal mining
projects these states that involve discharges of dredged or fill material into waters of the United States will have to obtain individual permits from the Corps. Projects currently permitted under NWP 21 are not affected by the suspension, and NWP 21 remains available for proposed surface coal mining projects outside the Appalachia region. The EPA is also taking a more active role in its review of NPDES permit applications for coal mining operations in Appalachia especially in West Virginia where the EPA plans to review all applications for NPDES permits even though the State of West Virginia is authorized to issue NPDES permits in West Virginia. Indeed, interim final guidance issued by the EPA on April 1, 2010, encourages EPA Regions 3, 4 and 5 to (1) object to the issuance of state program NPDES permits where the Region does not believe that the proposed permit satisfies the requirements of the CWA, and (2) exercise a greater degree of oversight with regard to state issued general Section 404 permits.
The April 1, 2010, interim final guidance also addresses the Regions' involvement in Section 404 permitting decisions. The document urges the Regions to undertake a meaningful review of Section 404 permitting decisions in Appalachia, with a focus on verifying that:
Should a Region's review conclude that these factors are insufficient with regard to the proposed permit, the guidance encourages the Region to inform the Corps, the permit applicant, and the state of the results of its review, and if appropriate changes to the permit are not made, "proceed" under either (1) the dispute resolution provisions of the Section 404(q) Memorandum of Agreement or (2) Section 404(c)'s "veto" power.
On March 26, 2010, the EPA announced a proposal to exercise its Section 404(c) "veto" power to withdraw or restrict the use of previously issued permits in connection with the Spruce No. 1 Surface Mine in West Virginia. The Spruce No. 1 Mine is one of the largest surface mining operations ever authorized in Appalachia. Though the project was permitted in 2007, it has been subsequently delayed by litigation. The proposed action would be just the thirteenth instance that the EPA has exercised its Section 404(c) "veto" power, and the first time that such power was exercised with regard to a previously permitted project. Consistent with the focus of the EPA's April 1, 2010, interim final guidance regarding Section 404 permits, the EPA's proposed action focuses on water quality impacts, fish and wildlife impacts, mitigation impacts,
and cumulative mining impacts of the Spruce No. 1 Mine. More frequent use of the EPA's Section 404 "veto" power as well as the increased risk of application of this power to previously permitted projects could create uncertainly with regard to our continued use of our current permits, as well as impose additional time and cost burdens on future operations, potentially adversely affecting our ability to obtain permits and produce coal.
These initiatives have extended the time required to obtain permits for coal mining and we anticipate further delays in obtaining permits and that the costs associated with obtaining and complying with those permits will increase substantially. It is possible that some projects may not be able to obtain these permits because of the manner in which these rules are being interpreted and applied. It is also possible that we may be unable to obtain or may experience delays in securing, utilizing or renewing additional Section 404 individual permits for surface mining operations due to agency or court decisions stemming from the above developments.
The EPA recently published a guidance regarding the issuance of permits under the Clean Water Act for Appalachian Surface Coal Mining Operations that sets forth new interpretations of criteria to be considered by state and agencies and EPA regional offices in connection with the issuance of permits for coal mining projects in Appalachia. This guidance applies to the issuance of permits under Sections 402 and 404 of the Clean Water Act and has the effect of setting new standards for discharges from coal mining operations. The requirements of this guidance will certainly increase the time and cost of obtaining new permits, may increase the costs of operating under those permits, and could lead to the rejection of new or renewed permits for certain projects that cannot demonstrate that they will not have any adverse impacts under the new tests set forth in this guidance. As an example of the significance of this guidance, the EPA also published on April 1, 2010 a proposed determination to prohibit, restrict or deny a permit issued under Section 404 to Mingo Logan Coal Company for the discharge of dredged fill in connection with the construction of carious fills and sedimentation ponds.
Total Maximum Daily Load, or TMDL, regulations under the CWA establish a process to calculate the maximum amount of a pollutant that a water body can receive and still meet state water quality standards, and to allocate pollutant loads among the point- and non-point pollutant sources discharging into that water body. This process applies to those waters that states have designated as impaired (i.e., as not meeting present water quality standards). Industrial dischargers, including coal mines, will be required to meet new TMDL load allocations for these stream segments. The adoption of new TMDL-related allocations for our coal mines could require more costly water treatment and could adversely affect our coal production.
Under the CWA, states also must conduct an antidegradation review before approving permits for the discharge of pollutants to waters that have been designated as high quality. A state's antidegradation regulations must prohibit the diminution of water quality in these streams absent an analysis of alternatives to the discharge and a demonstration of the socio-economic necessity for the discharge. Several environmental groups and individuals have challenged West Virginia's antidegradation policy. In general, waters discharged from coal mines to high quality streams in West Virginia will be required to meet or exceed new "high quality" standards. This could cause increases in the costs, time and difficulty associated with obtaining and complying with NPDES permits in West Virginia, and could adversely affect our coal production. Several other environmental groups have also challenged the EPA's approval of Kentucky's antidegradation policy, including its alternative antidegradation implementation methodology for permits associated with coal mining discharges, which recognizes that those discharges are subject to comparable regulation under SMCRA and Section 404 of the CWA. On March 31, 2006, the United States District Court for the Western District of Kentucky granted summary
judgment in favor of the EPA and various intervening defendants, upholding the EPA's approval of Kentucky's antidegradation policy. The plaintiffs subsequently appealed the district court's decision to the United States Court of Appeals for the Sixth Circuit. An unfavorable decision on the merits by the Sixth Circuit could result in the elimination of the alternative implementation methodology for coal mining discharges or other provisions of Kentucky's antidegradation rules. Such an outcome could mean that our operations in Kentucky would be required to comply with
more complex and costly antidegradation procedures and cause increases in the costs, time and difficulty associated with obtaining and complying with NPDES permits in Kentucky, and thereby adversely affect our coal production.
Hazardous Substances and Wastes
The federal Comprehensive Environmental Response, Compensation and Liability Act, or CERCLA, also known as "Superfund", and analogous state laws, impose liability, without regard to fault or the legality of the original conduct, on certain classes of persons that are considered to have contributed to the release of a "hazardous substance" into the environment. These persons include the owner or operator of the site where the release occurred and companies that disposed or arranged for the disposal of the hazardous substances found at the site. Persons who are or were responsible for releases of hazardous substances under CERCLA may be subject to joint and several liability for the costs of cleaning up the hazardous substances that have been released into the environment and for damages to natural resources. Some products used by coal companies in operations generate waste containing hazardous substances. We are not aware of any material liability associated with the release or disposal of hazardous substances from our past or present mine sites.
The federal Resource Conservation and Recovery Act, or RCRA, and corresponding state laws regulating hazardous waste affect coal mining operations by imposing requirements for the generation, transportation, treatment, storage, disposal and cleanup of hazardous wastes. Many mining wastes are excluded from the regulatory definition of hazardous wastes, and coal mining operations covered by SMCRA permits are by statute exempted from RCRA permitting. RCRA also allows the EPA to require corrective action at sites where there is a release of hazardous substances. In addition, each state has its own laws regarding the proper management and disposal of waste material. While these laws impose ongoing compliance obligations, such costs are not believed to have a material impact on our operations.
In 1993 and 2000, the EPA declined to impose hazardous waste regulatory controls under subtitle C of RCRA on the disposal of certain coal combustion by-products, or CCB, including the practice of using CCB as mine fill. In its 2000 regulatory determination, the EPA said that the disposal of CCB should be regulated under subtitle D as non-hazardous solid waste, by modifying SMCRA regulations or by a combination of both. The OSM issued an advanced notice of proposed rulemaking on March 14, 2007 seeking comment on the development of rules for the disposal of CCB in active and abandoned mines. On August 29, 2007, the EPA published in the Federal Register a Notice of Data Availability, or NODA, of analyses of the disposal of CCB in landfills and surface impoundments that have become available since the EPA's RCRA regulatory determination in 2000. Meanwhile, residents in Maryland have filed a class action lawsuit against an energy company for alleged harms caused by their exposure to CCB disposed of in a landfill by the company. The plaintiffs allege common law tort claims against the company for disposing of the CCB without adequate controls and seek compensatory, punitive and equitable relief.
In the wake of a large fly ash spill in December 2008, there have been several legislative proposals that would require the EPA to further regulate the storage of coal combustion waste.
On June 21, 2010, EPA released a proposed rule to regulate the disposal of CCB. The proposed rule sets forth two proposed avenues for the regulation of CCB under RCRA. The first option calls for regulation of CCB under Subtitle C, which creates a comprehensive program of federally enforceable requirements for waste management and disposal. The second option utilizes Subtitle D, which gives EPA authority to set performance standards for waste
management facilities and would be enforced primarily through citizen suits. The proposal leaves intact the Bevill exemption for beneficial uses of CCB. If CCB is not classified as hazardous waste, it is not anticipated that regulation of CCB will have any material effect on the amount of coal used by electricity generators. However, if CCB were re-classified as hazardous waste, regulations may impose restrictions on ash disposal, provide specifications for storage facilities, require groundwater testing and impose restrictions on storage locations, which could increase our customers' operating costs and potentially reduce their ability to purchase coal. In addition, contamination caused by the past disposal of CCB, including coal ash, can lead to material liability to our customers under RCRA or other federal or state laws and potentially reduce the demand for coal.
It is not possible to determine with certainty the potential permitting requirements or performance standards that may be imposed on the disposal of CCB by future regulations or lawsuits. Any costs associated with new requirements applicable to CCB handling or disposal could increase our customers' operating costs and potentially reduce their ability to purchase coal.
National Environmental Policy Act
Certain of our planned activities and operations include acreage located on federal land and, thus, require governmental approvals that are subject to the requirements of NEPA. NEPA requires federal agencies, including the Department of Interior, to evaluate major agency actions such as issuing an approval that have the potential to significantly impact the environment. In the course of such evaluations, an agency will typically prepare an environmental assessment, or EA, to assess the potential direct, indirect and cumulative impacts of a proposed project. Where the activities in question have significant impacts to the environment, the agency, in this instance, must prepare an environmental impact statement, or EIS. The preparation of an EIS can be time consuming and may result in the imposition of mitigation measures that could affect the amount of coal that we are able to produce from mines on federal lands. Moreover, an EIS is subject to protest, appeal or litigation, which can delay or halt projects. Our proposed Red Cliffs project, which includes acreage on federal land in Colorado, is subject to NEPA. The Bureau of Land Management has published a draft EIS for the Red Cliffs project. Although we do not expect any delays in our development of the Red Cliffs project because of the NEPA review process, we cannot assure you that the NEPA review will not extend the time and/or increase the costs for obtaining the necessary governmental approvals.
Endangered Species Act
The federal Endangered Species Act and counterpart state legislation protect species threatened with possible extinction. Protection of threatened and endangered species may have the effect of prohibiting or delaying us from obtaining mining permits and may include restrictions on timber harvesting, road building and other mining or agricultural activities in areas containing the affected species or their habitats. A number of species indigenous to our properties are protected under the Endangered Species Act. Based on the species that have been identified to date and the current application of applicable laws and regulations, however, we do not believe there are any species protected under the Endangered Species Act that would
materially and adversely affect our ability to mine coal from our properties in accordance with current mining plans.
Use of Explosives
We use explosives in connection with our surface mining activities. The Federal Safe Explosives Act, or SEA, applies to all users of explosives. Knowing or willful violations of the
SEA may result in fines, imprisonment, or both. In addition, violations of SEA may result in revocation of user permits and seizure or forfeiture of explosive materials.
The storage of explosives is also subject to regulatory requirements. For example, pursuant to a rule issued by the Department of Homeland Security in 2007, facilities in possession of chemicals of interest (including ammonium nitrate at certain threshold levels) are required to complete a screening review in order to help determine whether there is a high level of security risk, such that a security vulnerability assessment and a site security plan will be required. It is possible that our use of explosives in connection with blasting operations may subject us to the Department of Homeland Security's new chemical facility security regulatory program.
The costs of compliance with these requirements should not have a material adverse effect on our business, financial condition or results of operations.
Other Environmental and Mine Safety Laws
We are required to comply with numerous other federal, state and local environmental and mine safety laws and regulations in addition to those previously discussed. These additional laws include, for example, the Safe Drinking Water Act, the Toxic Substance Control Act and the Emergency Planning and Community Right-to-Know Act.
The costs of compliance with these requirements should not have a material adverse effect on our business, financial condition or results of operations.
Office Facilities
We lease office space in Lexington, Kentucky for our executives and administrative support staff. We lease our executive office space at 424 Lewis Hargett Circle, Lexington, Kentucky, which lease expires August 2013, subject to us having two consecutive three-year renewal options. In addition, we lease a building primarily for our administrative support staff at 265 Hambley Boulevard, Pikeville, Kentucky, which lease expires June 30, 2010,2015, subject to us having two consecutivea five-year renewal options.option.
Employees
To carry out our operations, our subsidiaries employed 869 full-time employees as of December 31, 2009. None of the employees are subject to collective bargaining agreements. We believe that we have good relations with these employees and since our inception we have had no history of work stoppages or union organizing campaigns.
Legal Proceedings
Although we may, from time to time, be involved in litigation and claims arising out of our operations in the normal course of business, we do not believe that we are a party to any litigation that will have a material adverse impact on our financial condition or results of operations. We are not aware of any significant legal or governmental proceedings against us, or contemplated to be brought against us. We maintain insurance policies with insurers in amounts and with coverage and deductibles as we believe are reasonable and prudent. However, we cannot assure you that this insurance will be adequate to protect us from all material expenses related to potential future claims for personal and property damage or that these levels of insurance will be available in the future at economical prices. Please read "—Regulation and Laws—Mine Health and Safety Laws."
Management of Rhino Resource Partners LP
We are managed and operated by the board of directors and executive officers of our general partner, Rhino GP LLC. It is anticipated that the employees of our general partner will devote substantially all of their time and effort to our business. As a result of owning our general partner, Wexford will have the right to appoint all members of the board of directors of our general partner, including the independent directors. Our unitholders will not be entitled to elect our general partner or its directors or otherwise directly participate in our management or operation. Our general partner owes certain fiduciary duties to our unitholders as well as a fiduciary duty to its owners. Our general partner will be liable, as general partner, for all of our debts (to the extent not paid from our assets), except for indebtedness or other obligations that are made specifically nonrecourse to it. Our general partner, therefore, may cause us to incur indebtedness or other obligations that are nonrecourse.
We expect that our general partner will have sevennine directors, three of whom will be independent as defined under the independence standards established by the NYSE and the Exchange Act. The NYSE does not require a publicly traded limited partnership, like us, to have a majority of independent directors on the board of directors of our general partner or to establish a compensation committee or a nominating/corporate governance committee. We are, however, required to have an audit committee of at least three members, and all its members are required to be independent as defined by the NYSE. Wexford will have appointed all three independent directors to the board of our general partner on the date our common units first trade on the NYSE.
In evaluating director candidates, Wexford will assess whether a candidate possesses the integrity, judgment, knowledge, experience, skill and expertise that are likely to enhance the board's ability to manage and direct our affairs and business, including, when applicable, to enhance the ability of committees of the board to fulfill their duties.
Executive Officers and Directors
The following table shows information for the executive officers and directors of our general partner upon the consummation of this offering:
| Name | Age (as of 12/31/2009) | Position With Our General Partner | ||
|---|---|---|---|---|
Mark D. Zand* | 56 | Chairman of the Board of Directors | ||
David G. Zatezalo | 54 | President, | ||
Richard A. Boone | 55 | Senior Vice President and Chief Financial Officer | ||
Christopher N. Moravec | 53 | Executive Vice President | ||
Andrew W. Cox | 53 | Vice President of Sales | ||
Reford C. Hunt | 36 | Vice President of Technical Services | ||
Joseph R. Miller | 34 | Vice President, Secretary and General Counsel | ||
Bruce Hann | 55 | Vice President—Ohio | ||
Jay L. Maymudes* | 48 | Director | ||
Arthur H. Amron* | 53 | Director | ||
Kenneth A. Rubin* | 55 | Director | ||
Joseph M. Jacobs* | 56 | Director | ||
Mark L. Plaumann | 54 | Director nominee | ||
Douglas Lambert | 52 | Director nominee | ||
James F. Tompkins | 61 | Director nominee |
Mark D. Zand. Mr. Zand has served as the Chairman of our general partner's board of directors since January 2010 and will serve as a member of our general partner's compensation committee. He is a partner of Wexford. Mr. Zand joined Wexford in 1996 and became a partner in 2001. He is involved in fixed income and distressed securities research and trading, and in public and private equity investing. Mr. Zand has been actively involved with Wexford's coal investments since their inception. Mr. Zand was selected to serve as a director due to his in-depth knowledge of our business, including our strategies, operations, finances and markets, as well as his significant knowledge of the coal industry. Since our inception, Mr. Zand has been an integral part of our growth and expansion and we believe he will continue to provide valuable guidance to the board of directors of our general partner. In addition, he has served on the boards and creditors' committees of a number of private companies.
David G. Zatezalo. Mr. Zatezalo has been employed with Rhino Energy LLC since May 2004 and has served as President and Chief Executive Officer since September 2009. He has served as a director of our general partner since July 2010. From March 2007 to September 2009, Mr Zatezalo served as Chief Operating Officer of Rhino Energy LLC. Prior to March 2007, Mr. Zatezalo served as President of our subsidiary Hopedale Mining LLC. Prior to joining Rhino Energy LLC, Mr. Zatezalo served as President of AEP's various Appalachian Mining Operations and as General Manager of Windsor Coal Company from 1998 to May 2004. He previously served as General Manager of the Cliff Collieries and Manager of Underground Development in the Bowen Basin of Queensland for BHP Australia Coal. Additionally, Mr. Zatezalo has served as Chairman of the Ohio Coal Association and is currently a member of the executive committee of the Kentucky Coal Association. In total, Mr. Zatezalo has approximately 36 years of experience in the coal industry. Mr. Zatezalo was selected to be a director of our general partner due to his extensive background and familiarity with the coal industry and his leadership position as our President and Chief Executive Officer.
Richard A. Boone. Mr. Boone has been employed as Senior Vice President and Chief Financial Officer of Rhino Energy LLC since February 2005. Prior to joining Rhino Energy LLC, he served as Vice President and Corporate Controller of PinnOak Resources, LLC, a coal producer serving the steel making industry, since 2003. Prior to joining PinnOak Resources, LLC, he served as Vice President, Treasurer and Corporate Controller of Horizon Natural Resources Company, a producer of steam and metallurgical coal, since 1998. In total, Mr. Boone has approximately 29 years of experience in the coal industry.
Christopher N. Moravec. Mr. Moravec has been employed as Executive Vice President of Rhino Energy LLC since April 2010, prior to which he served as Senior Vice President of Business Development of Rhino Energy LLC beginning in March 2007 and President of Kentucky Operations beginning in September 2009. Mr. Moravec also oversees our sales efforts and is a board member of our Rhino Eastern joint venture. Prior to joining Rhino Energy LLC, he was employed by PNC Bank for more than 22 years, most recently serving as Senior Vice President and Managing Director, where he was responsible for providing investment and commercial banking services primarily to the domestic coal industry. In total, Mr. Moravec has approximately 34 years of experience in the coal industry.
Andrew W. Cox. Mr. Cox has been employed with Rhino Energy LLC since January 2007 as its Vice President of Sales. Prior to joining Rhino Energy LLC, he was Sales Director for Coal Marketing Company (USA) Inc., a wholly owned subsidiary of CMC Ltd., a Dublin, Ireland based coal sales company which sells and markets coal from Colombia, South America. Prior to joining CMC in September 2004, he was a Vice President with AMVEST Coal Sales Company and also held various sales and marketing positions with Cumberland River Energies, Mingo Logan Coal
Company, Old Ben Coal Sales and NERCO Coal Sales. In total, Mr. Cox has approximately 28 years of experience in the coal industry.
Reford C. Hunt. Mr. Hunt has been employed with Rhino Energy LLC or its subsidiaries since April 2005 and has served in various capacities, including as Chief Engineer and Director of Operations. Mr. Hunt currently serves as Vice President of Technical Services of Rhino
Energy LLC, a position he has held since August 2008, as well as President of Rhino Energy WV LLC and McClane Canyon Mining LLC since September, 2009. Prior to joining Rhino Energy LLC, Mr. Hunt was employed by Sidney Coal Company a subsidiary of Massey Energy from 1997 to 2005. During his time at Sidney Coal Company as a Mining Engineer, he oversaw planning, engineering, and construction for various mining and preparation operations. In total, Mr. Hunt has approximately 13 years of experience in the coal industry.
Joseph R. Miller. Mr. Miller has been employed with Rhino Energy LLC since January 2007. From January 2007 until March 2009 he served as its Vice President and was also named Secretary and General Counsel in March 2009. Prior to joining Rhino Energy LLC, Mr. Miller practiced law with Frost Brown Todd in Lexington, Kentucky, from 2002 to 2007, with a substantial portion of his practice devoted to coal industry matters. Mr. Miller is a member of the Kentucky Bar Association.
Bruce Hann. Mr. Hann has been employed by Hopedale Mining LLC as its General Manager since 2004. He currently serves as Vice President—Ohio, a position he was named to in November 2009. Prior to joining Hopedale Mining LLC he was employed as the General Manager of AEP Ohio Coal LLC. Mr. Hann has over 30 years of experience in the mining industry where he has worked in various rolls including engineering, operations and human resources. From 2002 to 2006 he served on the board of the Ohio Coal Association.
Joseph M. Jacobs. Mr. Jacobs has served as a director of our general partner since July 2010. Mr. Jacobs is the President of Wexford Capital, which he co-founded in 1994. From 1982 to 1994, Mr. Jacobs was employed by Bear Stearns & Co., Inc., where he attained the position of Senior Managing Director. From 1979 to 1982, he was employed as a commercial lending officer at Citibank, N.A. Mr. Jacobs currently serves as a director for ICx Technologies, Inc., and has served on the boards and creditors' committees of a number of public and private companies in which Wexford has held investments. Mr. Jacobs holds an M.B.A. from Harvard Business School and a B.S. in Economics from the Wharton School of the University of Pennsylvania. Mr. Jacobs was selected to serve as a director due to his significant service on the boards of other public and private companies, which provides a thorough understanding of board roles and responsibilities and widespread knowledge of various industries, businesses, operations, opportunities and risks. Mr. Jacobs' current position as President of Wexford Capital also provides a comprehensive knowledge of management strategy and policy.
Jay L. Maymudes. Mr. Maymudes has served as a director of our general partner since January 2010 and will serve as a member of our general partner's compensation committee. He is a partner of Wexford. He joined Wexford in 1994 and became a partner in 1997 and serves as Wexford's Chief Financial Officer. Mr. Maymudes is responsible for the financial, tax and reporting requirements of Wexford and all of its private investment partnerships and its trading activities. Mr. Maymudes is a Certified Public Accountant. Mr. Maymudes was selected to serve as a director due to his credentials and qualifications in the area of public and financial accounting. Mr. Maymudes has particular skills in corporate finance, corporate governance, compliance, disclosure and compensation matters and has extensive experience in capital market transactions, which we believe will provide valuable expertise and insight to the board of
directors of our general partner. In addition, Mr. Maymudes has sat on the boards of a number of public and private companies.
Arthur H. Amron. Mr. Amron has served as a director of our general partner since January 2010. He is the General Counsel and a partner of Wexford. He joined Wexford as General Counsel in 1994 and became a partner in 1999. Mr. Amron is responsible for legal and securities compliance and actively participates in various private equity transactions, particularly in the bankruptcy and restructuring areas. Mr. Amron was selected to serve as a director due to his experience with us, his background as a corporate and transactional lawyer and his familiarity with mergers and acquisitions transactions, public offerings, financings, and other capital markets and financial transactions, which we believe will provide valuable expertise and insight to the board of directors of our general partner. Mr. Amron has served as Wexford's general counsel since 1994 and, in that capacity, has been involved with us since our formation and is familiar with many of the transactions we have undertaken prior to this offering. In addition, Mr. Amron has served on the boards of other public and private companies in which Wexford has invested.
Kenneth A. Rubin. Mr. Rubin has served as a director of our general partner since January 2010. He is a partner of Wexford. He joined Wexford in 1996 and became a partner in 2001 and serves as the portfolio manager of the Wexford Global Strategies Fund. Mr. Rubin focuses on investment grade and government fixed income investments. Mr. Rubin was selected to serve as a director due to his long-term experience in the capital and investment markets. Mr. Rubin brings to the board of directors of our general partner an understanding of our
business, history and organization. Mr. Rubin has been on the boards of public and private companies.
Mark L. Plaumann. Mr. Plaumann will be elected director of our general partner and will serve as the chair of our general partner's audit committee and as a member of our general partner's conflicts committee. He is currently a Managing Member of Greyhawke Capital Advisors LLC, or Greyhawke, which he co-founded in 1998. Prior to founding Greyhawke, Mr. Plaumann was a Senior Vice President of Wexford Capital. Mr. Plaumann was formerly a Managing Director of Alvarez & Marsal, Inc. and the President of American Healthcare Management, Inc. He also earned the position of Senior Manager at Ernst & Young LLP. Mr. Plaumann holds an M.B.A. and a B.A. in Business from University of Central Florida. Mr. Plaumann currently serves as a director and audit committee chairman for ICx Technologies, Inc. and Republic Airways Holdings, Inc., and a director of one private company. Mr. Plaumann was selected to serve as a director of our general partner due to his significant financial and audit expertise. Mr. Plaumann's service on the boards of other public companies, including previous experience as chairman of audit committees, gives him a clear understanding of his role and responsibilities on our general partner's board of directors.
Douglas Lambert. Mr. Lambert will be elected director of our general partner and will serve as a member of our general partner's audit committee and conflicts committee. He is presently a Managing Director in the North American Restructuring Practice Group of Alvarez & Marsal Inc., a position he has held since November 2006, and currently serveshas served as Chief Executive Officer of Legacy Asset Management Company, a wholly-owned subsidiary of Lehman Brothers Holdings, Inc. since May 2010. Mr. Lambert has been a director of Republic Airways Holdings, Inc., an airline holding company, since 2001. From 1994 to 2003, Mr. Lambert was a Senior Vice President of Wexford Capital. From 1983 to 1994, Mr. Lambert held various financial positions with Integrated Resources, Inc.'s Equipment Leasing Group, including Treasurer and Chief Financial Officer. Mr. Lambert is a member of the American Institute of Certified Public Accountants and
the New York State Society of Certified Public Accountants. Mr. Lambert was chosen to serve as a director due to his strong and diverse financial and operational background in a variety of different businesses and industries.
James F. Tompkins. Mr. Tompkins will be elected director of our general partner and will serve as a member of our general partner's audit committee and conflicts committee. He is currently the President of JFT Consultants, LLC, a firm that provides consulting services to the coal and associated industries and which Mr. Tompkins founded in 1997. Prior to founding JFT Consultants, Mr. Tompkins served as a Vice President of the Southern Ohio Coal Company. Mr Tompkins also worked in the mining industry in West Virginia, Nova Scotia, and Manitoba. Mr. Tompkins earned a Bachelor of Mining Engineering degree from Dalhousie University (DalTech) in 1971 and an M.A. in Interpersonal Communication from Ohio University in 1997. He is a member of the Ohio Chapter of the Society of Mining Engineers and a member of the Mining Society of Nova Scotia. Mr. Tompkins has served on several non-profit boards in southern Ohio. Mr. Tompkins was selected to serve as a director of our general partner due to his extensive operational and engineering expertise in the coal industry, as well as his financial experience.
Director Independence
The board of directors of our general partners has determined that each of Messrs. Plaumann, Lambert and TomkinsTompkins are independent as defined under the independence standards established by the NYSE and the Exchange Act. In evaluating director independence with respect to Mr. Plaumann and Mr. Lambert, the board of directors of our general partner considered the various relationships each of them has with Wexford and certain affiliates of Wexford. Certain affiliated investment funds of Wexford are the majority owners of ICx Technologies, Inc. As described below, Mr. Plaumann serves as an independent director and
audit committee chairman of ICx Technologies, Inc. In addition, as described below, both Mr. Plaumann and Mr. Lambert were former employees of Wexford and continue to hold small interests in Wexford private equity funds in connection with investments that were made at the time each of them was employed by Wexford Capital. Certain of these funds will hold an interest in Rhino Energy Holdings LLC upon the closing of this offering. Mr. Plaumann's and Mr. Lambert's indirect beneficial interest in Rhino Energy Holdings LLC through these funds will be immaterial. The board of directors of our general partner considered these relationships in light of the attributes it believes need to be possessed by independent-minded directors, including personal financial substance and a lack of economic dependence on us. The board of directors of our general partner concluded that each of Mr. Plaumann's and Mr. Lambert's relationships, rather than interfering with their ability to be independent from management, are consistent with the business and financial substance that make them qualified, independent directors.
Committees of the Board of Directors
The board of directors of our general partner will have an audit committee, a conflicts committee and, although not required by the NYSE, a compensation committee.
Audit Committee
The audit committee of our general partner will initially consist of Messrs. Plaumann, Lambert and Tompkins, who are all independent. We expect the board of directors of our general
partner will determine Mr. Plaumann is an "audit committee financial expert" within the meaning of the SEC rules. Upon completion of this offering, our audit committee will operate pursuant to a written charter. This committee will oversee, review, act on and report to our board of directors of our general partner on various auditing and accounting matters, including: the selection of our independent accountants, the scope of our annual audits, fees to be paid to the independent accountants, the performance of our independent accountants and our accounting practices. In addition, the audit committee will oversee our compliance programs relating to legal and regulatory requirements.
Compensation Committee
The compensation committee of our general partner will initially consist of Messrs. Zand and Maymudes. Upon completion of this offering, the compensation committee will operate pursuant to a written charter. This committee will establish salaries, incentives and other forms of compensation for officers and other employees. The compensation committee will also administer our incentive compensation and benefit plans.
Conflicts Committee
At least two independent members of the board directors of our general partner will serve on a conflicts committee to review specific matters that the board believes may involve conflicts of interest and determine to submit to the conflicts committee for review. Messrs. Plaumann, Lambert and Tompkins will serve as the initial members of the conflicts committee. The conflicts committee will determine if the resolution of the conflict of interest is fair and reasonable to us. The members of the conflicts committee may not be directors, officers or employees of our general partner or any person controlling our general partner, including Wexford, and must meet the independence standards established by the NYSE and the Exchange Act to serve on an audit committee of a board of directors, along with other requirements in our partnership agreement. Any matters approved by the conflicts committee will be conclusive deemed to be fair and reasonable to us, approved by all of our partners and not a breach by our general partner of any duties it may owe us or our unitholders.
EXECUTIVE OFFICER COMPENSATION
Compensation Discussion and Analysis
Introduction
Our general partner has the sole responsibility for conducting our business and for managing our operations and its board of directors and officers make decisions on our behalf. For this reason, we have not formed, and will not form, a compensation committee, but, in connection with the completion of this offering, the board of directors of our general partner will form a compensation committee that will determine the future compensation of the directors and officers of our general partner, including its named executive officers. The compensation payable to the officers of our general partner will be paid by our general partner and such payments will be reimbursed on a dollar-for-dollar basis. See "The Partnership Agreement—Reimbursement of Expenses."
Historically, including for the year ended December 31, 2009, the President and Chief Executive Officer of Rhino Energy LLC made all decisions regarding the compensation of the executive officers of Rhino Energy LLC pursuant to the terms of the employment agreements entered into with those executives. In 2009, the named executive officers of Rhino Energy LLC, our predecessor, were:
With respect to historical compensation disclosures in the Compensation Discussion and Analysis and the tables that follow, these individuals are referred to as the "named executive officers." The named executive officers in 2010 have not yet been determined; however, Mr. Hanley and Mr. Glancy will not be executive officers of our general partner upon completion of this offering. The historical compensation discussion that follows reflects the total compensation the named executive officers received for services provided to Rhino Energy LLC, and the philosophy and policies of Rhino Energy LLC that drove the compensation decisions for these named executive officers, as implemented by the President and Chief Executive Officer of Rhino Energy LLC. Current and forward-looking statements refer to the compensation philosophy, policy and practices of our general partner and the procedures our general partner either has adopted or intends to adopt, though these practices are largely a continuation of the compensation practices employed by Rhino Energy LLC. Specific changes to our compensatory policies that will be implemented in connection with and following the completion of this offering are noted below. Unless otherwise noted, within the remainder of this Compensation
Discussion and Analysis, references to "we" and "our" refer to both the philosophy and policies implemented by our predecessor, Rhino Energy LLC, as well as the philosophy and policies to be implemented by our general partner upon completion of this offering. The philosophy and policies may change in the future.
Compensation Philosophy and Objectives
We employ a compensation philosophy that emphasizes pay for performance and reflects what the current market dictates. The executive compensation program applicable to the named executive officers is designed to provide a total compensation package that allows us to attract, retain and motivate the executives necessary to manage our business. Our general philosophy and program is guided by several key principles:
In the future we also intend to ensure that a portion of the total compensation made available to the named executive officers is determined by increases in equity value, thus assuring an alignment of interests between our senior management level employees and our unitholders.
By accomplishing these objectives, we hope to optimize long-term unitholder value.
Compensation Setting Process
Historically, the President and Chief Executive Officer of Rhino Energy LLC determined the overall compensation philosophy and set the final compensation of the named executive officers without the assistance of a compensation consultant. Following the formation of the compensation committee by the board of our general partner, all compensation decisions for the named executive officers will be determined by the compensation committee (consistent with the employment agreements that we have entered into with the named executive officers described below in the section titled "—Elements of Compensation—Employment Agreements").
The compensation committee will seek to provide a total compensation package designed to drive performance and reward contributions in support of our business strategies and to attract, motivate and retain high quality talent with the skills and competencies required by us. It is possible that the compensation committee will examine the compensation practices of our peer companies and may also review compensation data from the coal industry generally to the extent the competition for executive talent is broader than a group of selected peer companies, but any decisions regarding possible benchmarking will be made following the completion of this offering. In addition, the compensation committee may review and, in certain cases, participate in, various relevant compensation surveys and consult with compensation consultants with respect to determining compensation for the named executive officers. We expect that our President and Chief Executive Officer, Mr. Zatezalo, will provide periodic recommendations to the compensation committee regarding the compensation of the other named executive officers.
Elements of Compensation
The following discussion regarding the elements of compensation provided to the named executive officers reflects our historical philosophy concerning the division of the elements of senior management level employees' compensation packages, which our general partner, at this time, continues to employ with the modifications noted below.
Historically the principal elements of compensation for the named executive officers have been:
We believe a material amount of executive compensation should be tied to our performance, and a significant portion of the total prospective compensation of each named executive officer should be tied to measurable financial and operational objectives. These objectives may include absolute performance or performance relative to a peer group. During periods when performance meets or exceeds established objectives, the named executive officers should be paid at or above targeted levels, respectively. When our performance does not meet key objectives, incentive award payments, if any, should be less than such targeted levels.
Historically, our compensation program has predominately been focused on retention and the achievement of strong short-term annual results. The preponderance of these short-term incentives have been in the form of discretionary cash bonuses that are based on both objective performance criteria and subjective criteria. In the future, we anticipate that the compensation committee will seek to balance awards based on short-term annual results with awards intended to compensate our executives based on our long-term viability and success. Consequently, in addition to annual bonuses, in the future we anticipate that we will provide long-term incentives to our executives in the form of equity based awards to align the interests of the named executive officers with those of our equity holders. In connection with this offering, the board of directors of our general partner will adopt a long-term incentive plan, which our general partner believes will further incentivize the executive officers to perform their duties in a way that will enhance our long-term success.
Our compensation committee will determine the mix of compensation, both among short-term and long-term compensation and cash and non-cash compensation, to establish structures that it believes are appropriate for each of the named executive officers. We believe that the mix of base salary, bonus awards, awards under the long-term incentive plan and the other benefits that will be available to the named executive officers will accomplish our overall compensation objectives. We believe the elements of compensation provided create competitive compensation opportunities to align and drive employee performance in support of our business strategies and to attract, motivate and retain high quality talent with the skills and competencies required by us.
Employment Agreements
We previously entered into employment agreements with Messrs. Zatezalo, Boone, Moravec, Cox and Hunt. Our employment agreements typically provide for a three year term, which may be earlier terminated in accordance with the terms of the applicable agreement or extended by
mutual agreement of the parties. The terms of these employment agreements, and the employment agreements with Messrs. Glancy and Hanley that were in effect during 2009, are described in greater detail below in the section entitled "—Discussion of Summary Compensation Table—Employment Agreements."
We recently entered into amended and restated employment agreements with Messrs. Zatezalo and Moravec. The amended and restated employment agreements are substantially similar to the prior agreements in effect with Messrs. Zatezalo and Moravec. The amended and restated employment agreement with Mr. Zatezalo will expire on December 31, 2012, and the amended and restated employment agreement with Mr. Moravec will expire on March 31, 2013. The amended and restated employment agreements will specify the annual base salaries and annual bonus opportunities for Messrs. Zatezalo and Moravec, and Mr. Zatezalo's agreement provides for automatic salary increases in calendar years 2011 and 2012. The amended and restated employment agreements also provide Messrs. Zatezalo and Moravec with the opportunity to participate in the employee benefit arrangements offered to similarly situated employees and provide that they may periodically receive grants pursuant to our long-term incentive plan as determined in our discretion.
The severance benefits provided by the employment agreements with the named executive officers are described below in the section titled "—Potential Payments Upon Termination or Change in Control—Employment Agreements." The employment agreements also contain certain confidentiality, noncompetition, and other restrictive covenants, which are also described in the section titled "—Potential Payments Upon Termination or Change in Control—Employment Agreements."
Base Salary. The base salaries set forth in the employment agreements were established based on various factors, including the amounts we considered necessary to attract and retain the highest quality executives, the responsibilities of the named executive officers and the historic compensation of our executives. Our compensation committee will review the base salaries on an annual basis and may adjust base salaries consistent with the employment agreements. As part of its review, the compensation committee may review the compensation of executives in similar positions with similar responsibility in any peer companies identified by the compensation committee or in companies in the coal industry with which we generally compete for executives. While our compensation committee will consider all of the foregoing factors in determining the appropriate amount of base salary for each named executive officer, ultimately the minimum base salary established for each individual officer was determined through negotiations with the individual and is set at the level necessary to retain the executive's services.
Bonus Awards. Historically, annual bonuses have been discretionary. We review annual cash bonus awards for the named executive officers and other executives annually to determine award payments for the last completed fiscal year, as well as to establish award opportunities for the current fiscal year. At the beginning of each year, we meet with executives to discuss company goals for the year and what each executive is expected to contribute in order to help us achieve those goals. Our bonuses for 2009 were determined by the President and Chief Executive Officer of Rhino Energy LLC at year-end following a review of the individual performance of the executive officer in question, the past compensation paid to the executive officer, and our overall performance, including our performance with respect to various safety measures and our profitability for the year; however, no specific pre-established performance objectives are set and, ultimately, the amount of the annual bonuses is determined in the discretion of the President and Chief Executive Officer. In addition, Mr. Moravec has been entitled to receive additional
annual term bonuses pursuant to his employment agreement beginning in 2008 and ending in March 2010.
In connection with the consummation of this offering, the named executive officers (other than Messrs. Hunt and Cox) will also receive certain one-time cash bonuses. The amount of these bonuses is approximately 50% of base salary for Mr. Zatezalo and approximately 40% of base salary for Messrs. Boone and Moravec, which amounts were ultimately determined on a discretionary basis to be appropriate to reward the contributions these individuals are making to us in contemplation of this offering. Please read "—Potential Payments Upon Termination or Change in Control—Bonuses in Connection with This Offering." In the near future we expect our compensation committee will continue to rely on discretionary annual bonus awards to the named executive officers, except that Mr. Moravec's employment agreement also provides that he is entitled to a guaranteed annual bonus of $200,000 each year, payable in 26 installments in accordance with our general payroll practices. Because we agreed to provide Mr. Moravec with a guaranteed annual bonus in his amended and restated employment agreement, we significantly reduced the size of the phantom unit grant awarded to him in connection with this offering. See "—Compensation Discussion and Analysis—Elements of Compensation—Long-term Incentive Compensation." While we intend to continue to use discretionary bonus awards for achieving financial and operational goals and for achieving individual performance objectives for 2010, we anticipate that one-half of the annual discretionary bonus amount payable to each named executive officer will be determined based on the bonus amounts actually received by the employees supervised by the named executive officer and the other one-half of the annual bonus amount will be purely discretionary. Pursuant to the employment agreements of the named executive officers, such discretionary bonuses will be up to 40% of the annual salary for each respective named executive officer (up to 150% of annual salary in the case of Mr. Zatezalo). Consistent with our historical practice, we have retained a maximum bonus threshold of 40% for most of our named executive officers. Historically, our chief executive officer has been entitled to receive significant guaranteed payments, including guaranteed bonus payments; however, in order to incentivize Mr. Zatezalo to improve our performance, we have structured a large portion of his cash compensation to be a discretionary, performance-based bonus of up to 150% of his base salary.
The following table sets forth the annual rate of salary payable for the remainder of 2010 and potential bonus amounts for the named executive officers pursuant to the employment agreements that will be in effect following the completion of this offering:
| Name and Principal Position | Salary | Bonus | |||
|---|---|---|---|---|---|
David G. Zatezalo | $ | 480,000 | 0% to 150% of salary | ||
Richard A. Boone | $ | 250,000 | 0% to 40% of salary | ||
Christopher N. Moravec | $ | 400,000 | 0% to 40% of salary | ||
Andrew W. Cox | $ | 210,000 | 0% to 40% of salary | ||
Reford C. Hunt | $ | 175,000 | 0% to 40% of salary | ||
Severance and Change in Control Benefits. The employment agreements with the named executive officers (other than Mr. Hunt) provide such individuals with certain severance benefits upon an involuntary termination, including, in some cases, upon a termination due to death. We
believe it is appropriate to continue to provide these severance benefits in recognition of the fact that it may be difficult for the named executive officers to find comparable employment within a short period of time if they are involuntarily terminated. The severance and benefits provided under the employment agreements are described in greater detail below. Please read "—Potential Payments Upon Termination or Change in Control—Employment Agreements."
Bonuses in Connection with this Offering
In connection with the consummation of this offering, the following named executive officers will receive the following one-time cash bonuses: Mr. Zatezalo ($250,000); Mr. Boone ($100,000); and Mr. Moravec ($150,000).
Long-Term Incentive Compensation
Historically, equity based compensation has not been an element of the compensation provided to our employees. However, in connection with this offering the board of directors of our general partner will adopt a long-term incentive plan for our employees, consultants and directors and those of our affiliates who perform services for us. Each of the named executive officers will be eligible to participate in this plan. The long-term incentive plan provides for the grant of restricted units, unit options, unit appreciation rights, phantom units, unit payments, other equity-based awards and performance awards. Please read "—Long-Term Incentive Plan."
In connection with this offering, the named executive officers will each receive a grant of phantom units under the long-term incentive plan in the number of units equal to the following values divided by the per unit offering price of our common units in this offering: Mr. Zatezalo ($1,500,000), Mr. Boone ($500,000), Mr. Moravec ($150,000), Mr. Cox ($25,000) and Mr. Hunt ($25,000). The dollar values of these phantom unit awards were determined as follows: (1) Mr. Zatezalo's award is equal to approximately three times his base salary; (ii) awards to Messrs. Boone and Moravec were targeted at approximately two times their respective base salaries (except the value of Mr. Moravec's award was reduced by the $600,000 of guaranteed bonuses provided under his amended and restated employment agreement); and (iii) awards to Messrs. Cox and Hunt were not tied to their salary levels, but are consistent with the awards granted to other officers in connection with this offering. These multiples of base salary were established pursuant to the discretion of our President and Chief Executive Officer and Wexford and negotiations with our executive officers. We intend to primarily utilize phantom units with associated distribution equivalent rights, or DERs, to provide long-term incentives to our named executive officers. DERs enable the recipients of phantom unit awards to receive cash distributions on our phantom units to the same extent generally as unitholders receive cash distributions on our common units. These awards are intended to align the interests of key employees (including the named executive officers) with those of our unitholders. The phantom units will vest in equal one-sixth increments over a thirty-six month period, subject to earlier vesting upon a change of control or the executive's termination due to death or disability. In addition, upon a termination of the executive by us without cause or by the executive for good reason, the vesting of those phantom units scheduled to vest in the 12-month period following such termination will be accelerated to such termination date. DER distributions with respect to unvested phantom units will be paid upon vesting of the associated phantom units (and will be forfeited at the same time the associated phantom units are forfeited).
Long-Term Incentive Plan
In connection with this offering, the board of directors of our general partner will adopt the long-term incentive plan for employees, consultants and directors who perform services for us.
The long-term incentive plan will consist of the following components: restricted units, unit options, phantom units, unit payments, unit appreciation rights, other equity-based awards and performance awards. The long-term incentive plan will limit the number of units that may be delivered pursuant to awards to 10% of the outstanding common units and subordinated units on the effective date of the initial public offering of our common units. Common units withheld to satisfy exercise prices or tax withholding obligations are available for delivery pursuant to
other awards. The plan will be administered by our board of directors or a committee thereof, which we refer to as the plan administrator.
The plan administrator may terminate or amend the long-term incentive plan at any time with respect to any of our common units for which a grant has not yet been made. The plan administrator also has the right to alter or amend the long-term incentive plan or any part of the plan from time to time, including increasing the number of common units that may be granted, subject to unitholder approval as required by the exchange upon which our common units are listed at that time. However, no change in any outstanding grant may be made that would materially reduce the benefits of the participant without the consent of the participant. The plan will expire on the tenth anniversary of its approval, when common units are no longer available under the plan for grants or upon its termination by the plan administrator, whichever occurs first.
Restricted Units. A restricted unit grant is an award of common units that vests over a period of time and that during such time is subject to forfeiture. The plan administrator may determine to make grants of restricted units under the plan to participants containing such terms as the plan administrator shall determine. The plan administrator will determine the period over which restricted units granted to participants will vest. The plan administrator, in its discretion, may base its determination upon the achievement of specified financial objectives. In addition, the restricted units will vest upon a change of control, as defined in the plan, unless provided otherwise by the plan administrator. Distributions made on restricted units may or may not be subjected to the same vesting provisions as the restricted units. If a grantee's employment, consulting relationship or membership on the board of directors of our general partner terminates for any reason, the grantee's restricted units will be automatically forfeited unless, and except to the extent that, the plan administrator or the terms of the award agreement or an employment agreement provide otherwise.
We intend the restricted units under the plan to serve as a means of incentive compensation for performance and not primarily as an opportunity to participate in the equity appreciation of our common units. Therefore, plan participants will not pay any consideration for restricted units they receive, and we will receive no remuneration for the restricted units.
Unit Options. The plan will permit the grant of options covering our common units. The plan administrator may make grants under the plan to participants containing such terms as the plan administrator shall determine. Unit options will have an exercise price that may not be less than the fair market value of our common units on the date of grant. In general, unit options granted will become exercisable over a period determined by the plan administrator. In addition, the unit options will become exercisable upon a change of control, as defined in the plan, unless provided otherwise by the plan administrator. If a grantee's employment, consulting relationship or membership on the board of directors of our general partner terminates for any reason, the grantee's unvested unit options will be automatically forfeited unless, and except to the extent, the option agreement, an employment agreement or the plan administrator provides otherwise.
Upon exercise of a unit option, we will acquire common units on the open market or from any other person or we will directly issue common units or use any combination of the
foregoing, in the plan administrator's discretion. If we issue new common units upon exercise of the unit options, the total number of common units outstanding will increase. The availability of unit options is intended to furnish additional compensation to plan participants and to align their economic interests with those of common unitholders.
Performance Award. A performance award is denominated as a cash amount at the time of grant and gives the grantee the right to receive all or part of such award upon the achievement of specified financial objectives, length of service or other specified criteria. The plan administrator will determine the period over which certain specified financial objectives or other specified criteria must be met. The performance award may be paid in cash, common units or a combination of cash and common units. If a grantee's employment, consulting relationship or membership on the board of directors of our general partner terminates for any reason prior to payment, the grantee's performance award will be automatically forfeited unless, and except to the extent that, the plan administrator or the terms of the award agreement or an employment agreement provide otherwise.
Phantom Units. A phantom unit is a notional common unit that entitles the grantee to receive a common unit upon the vesting of the phantom unit or, in the discretion of the plan administrator, cash equal to the value of a common unit. The plan administrator may determine to make grants of phantom units under the plan to participants containing such terms as the plan administrator shall determine, which may include DERs, which entitle the grantee to receive an amount of cash equal to the cash distributions made on a common unit during the period the phantom unit remains "outstanding." Such DERs generally will become vested or forfeited at the same time as the tandem phantom unit becomes vested or is forfeited. The plan administrator will determine the period over which phantom units granted to participants will vest. The plan administrator, in its discretion, may base its determination upon the achievement of specified financial objectives. In addition, the phantom units will vest upon a change of control, as defined in the plan, unless provided otherwise by the plan administrator. If a grantee's employment, consulting relationship or membership on the board of directors of our general partner terminates for any reason, the grantee's phantom units will be automatically forfeited unless, and except to the extent that, the plan administrator or the terms of the award agreement or an employment agreement provide otherwise.
Upon the vesting of phantom units, to the extent such phantom unit will be satisfied or paid with common units, we will acquire common units on the open market or from any other person or we will directly issue common units or use any combination of the foregoing, in the plan administrator's discretion. If we issue new common units upon vesting of the phantom units, the total common units outstanding will increase.
We intend the issuance of any common units upon vesting of the phantom units under the plan to serve as a means of incentive compensation for performance and not primarily as an opportunity to participate in the equity appreciation of our common units. Therefore, plan participants will not pay any consideration for the common units they receive, and we will receive no remuneration for the common units.
Unit Payment. The plan administrator, in its discretion, may also grant to participants common units that are not subject to forfeiture.
Unit Appreciation Rights. The long-term incentive plan will permit the grant of unit appreciation rights. A unit appreciation right is an award that, upon exercise, entitles participants to receive the excess of the fair market value of our common units on the exercise date over the exercise price established for the unit appreciation right. Such excess will be paid
in cash or our common units. The plan administrator may determine to make grants of unit appreciation rights under the plan to participants containing such terms as the plan administrator shall determine. Unit appreciation rights will have an exercise price that may not be less than the fair market value of our common units on the date of grant. In general, unit appreciation rights granted will become exercisable over a period determined by the plan
administrator. In addition, the unit appreciation rights will become exercisable upon a change in control, as defined in the plan, unless provided otherwise by the plan administrator. If a grantee's employment, consulting relationship or membership on the board of directors of our general partner terminates for any reason, the grantee's unvested unit appreciation rights will be automatically forfeited unless, and except to the extent that, the grant agreement, an employment agreement or the plan administrator provides otherwise.
Upon exercise of a unit appreciation right, to the extent it will be paid in common units, we will acquire common units on the open market or from any other person or we will directly issue common units or use any combination of the foregoing, in the plan administrator's discretion. If we issue new common units upon exercise of the unit appreciation rights, the total number of common units outstanding will increase. The availability of unit appreciation rights is intended to furnish additional compensation to plan participants and to align their economic interests with those of common unitholders.
Other Unit-Based Awards. The plan administrator, in its discretion, may also grant to participants an award denominated or payable in, referenced to, or otherwise based on or related to the value of our common units. Such awards shall contain such terms as the plan administrator shall determine, including the vesting provisions and whether such award shall be paid in cash, units or a combination thereof.
401(k) Plan
Rhino Energy LLC and two of its subsidiaries, CAM Mining LLC and McClane Canyon Mining LLC, are participating employers in the CAM Mining LLC 401(k) Plan, and Rhino Energy LLC's subsidiaries Hopedale Mining LLC, Rhino Coalfield Services LLC and Sands Hill Mining LLC each sponsor their own plans (collectively, the "401(k) Plans"). The companies use the 401(k) Plans to assist their eligible employees in saving for retirement on a tax-deferred basis. The 401(k) Plans permit all eligible employees, including the named executive officers, to make voluntary pre-tax contributions to the applicable plan, subject to applicable tax limitations. A discretionary employer matching contribution may also be made to the plan for those eligible employees who meet certain conditions and subject to certain limitations under federal law. The employer matching contribution percentage, if any, will be determined each year. Employee contributions are subject to annual dollar limitations, which are periodically adjusted by the cost of living index. Each 401(k) Plan is intended to be tax-qualified under Section 401(a) of the Internal Revenue Code so that contributions to the plan, and income earned on plan contributions, are not taxable to employees until withdrawn from the plan, and so that contributions, if any, will be deductible when made.
Other Benefits
The employment agreements for each of the named executive officers provide, in general, that the named executive officer is eligible to participate in our employee benefit plans. Additional benefits and perquisites for the named executive officers may include payment of premiums for supplemental life insurance, long-term disability insurance and automobile fringe benefits. In 2009, the only perquisite provided to the named executive officers was the use of a company owned automobile.
Tax Deductibility of Compensation
With respect to the deduction limitations under Section 162(m) of the Internal Revenue Code, we are a limited partnership and do not meet the definition of a "corporation" under
Section 162(m). Nonetheless, the taxable compensation paid to each of the named executive officers in 2009 was substantially less than the Section 162(m) threshold of $1,000,000.
Summary Compensation Table
The following table sets forth the cash and other compensation earned for the year ended December 31, 2009 by the named executive officers.officers:
| Name and Principal Position with Rhino Energy LLC | Year | Salary ($) | Bonus ($) | All Other Compensation ($) (1) | Total ($) | Year | Salary ($) | Bonus ($) | All Other Compensation ($) (1) | Total ($) | ||||||||||||||||||||||
|---|---|---|---|---|---|---|---|---|---|---|---|---|---|---|---|---|---|---|---|---|---|---|---|---|---|---|---|---|---|---|---|---|
David G. Zatezalo | 2009 | $ | 325,000 | $ | 195,000 | $ | 22,280 | $ | 542,280 | 2009 | $ | 325,000 | $ | 195,000 | $ | 22,280 | $ | 542,280 | ||||||||||||||
Nicholas R. Glancy | 2009 | $ | 116,000 | $ | — | $ | 1,154 | $ | 117,154 | 2009 | $ | 116,000 | $ | — | $ | 1,154 | $ | 117,154 | ||||||||||||||
Thomas Hanley | 2009 | $ | 211,200 | $ | —- | $ | 258,226 | $ | 469,426 | 2009 | $ | 171,261 | $ | — | $ | 258,226 | $ | 469,426 | ||||||||||||||
Richard A. Boone | 2009 | $ | 228,318 | $ | 66,000 | $ | 11,944 | $ | 306,262 | 2009 | $ | 228,318 | $ | 66,000 | $ | 11,944 | $ | 306,262 | ||||||||||||||
Christopher N. Moravec | 2009 | $ | 240,000 | $ | 325,000 | (5) | $ | 16,035 | $ | 581,035 | 2009 | $ | 240,000 | $ | 407,000 | (5) | $ | 16,035 | $ | 581,035 | ||||||||||||
Andrew W. Cox | 2009 | $ | 210,000 | $ | 65,000 | $ | 11,169 | $ | 286,169 | 2009 | $ | 210,000 | $ | 65,000 | $ | 11,169 | $ | 286,169 | ||||||||||||||
Reford C. Hunt | 2009 | $ | 181,732 | $ | 57,000 | $ | 10,054 | $ | 248,785 | 2009 | $ | 181,732 | $ | 57,000 | $ | 10,054 | $ | 248,785 | ||||||||||||||
calculated as the monthly lease payment paid by us on behalf of the executive multiplied by the monthly percentage of personal use of the automobile by the executive.
| Name | Automobile Use | Employer Contribution to Our 401(k) Plan | Employer Contribution to the Hopedale 401(k) Plan | |||||||
|---|---|---|---|---|---|---|---|---|---|---|
David G. Zatezalo | $ | 230 | $ | 14,700 | $ | 7,350 | ||||
Nick Glancy | — | $ | 1,154 | — | ||||||
Tom Hanley | — | $ | 8,250 | — | ||||||
Richard A. Boone | $ | 1,267 | $ | 10,677 | — | |||||
Christopher N. Moravec | — | $ | 16,035 | — | ||||||
Andrew W. Cox | $ | 1,003 | $ | 10,166 | — | |||||
Reford C. Hunt | $ | 1,368 | $ | 8,686 | — | |||||
Discussion of Summary Compensation Table
Employment AgreementsBonuses in Connection with this Offering
During 2009, we had employment agreementsIn connection with the consummation of this offering, the following named executive officers will receive the following one-time cash bonuses: Mr. Zatezalo ($250,000); Mr. Boone ($100,000); and Mr. Moravec ($150,000).
Long-Term Incentive Compensation
Historically, equity based compensation has not been an element of the compensation provided to our employees. However, in effectconnection with eachthis offering the board of directors of our general partner will adopt a long-term incentive plan for our employees, consultants and directors and those of our affiliates who perform services for us. Each of the named executive officers includedwill be eligible to participate in this plan. The long-term incentive plan provides for the grant of restricted units, unit options, unit appreciation rights, phantom units, unit payments, other equity-based awards and performance awards. Please read "—Long-Term Incentive Plan."
In connection with this offering, the named executive officers will each receive a grant of phantom units under the long-term incentive plan in the number of units equal to the following values divided by the per unit offering price of our Summary Compensation Table.common units in this offering: Mr. Zatezalo ($1,500,000), Mr. Boone ($500,000), Mr. Moravec ($150,000), Mr. Cox ($25,000) and Mr. Hunt ($25,000). The dollar values of these phantom unit awards were determined as follows: (1) Mr. Zatezalo's award is equal to approximately three times his base salary; (ii) awards to Messrs. Boone and Moravec were targeted at approximately two times their respective base salaries (except the value of Mr. Moravec's award was reduced by the $600,000 of guaranteed bonuses provided under his amended and restated employment agreements withagreement); and (iii) awards to Messrs. Zatezalo, Boone, Moravec, Cox and Hunt set forth the annual base salary payable to each named executive officer, which may be reviewed each year for possible increase. The foregoing named executive officers were each entitled in 2009 under their respective employment agreements to receive an annual discretionary bonus of up to 40% of annual base salary. Pursuant to an amendment to Mr. Zatezalo's employment agreement, he received a special one-time bonus of $65,000 on April 28, 2009. In addition to a discretionary annual bonus, Mr. Moravec has received additional annual term bonuses, paid in monthly installments for having remained employed by us through March 31, 2008 (at an annual rate of $150,000), through March 31, 2009 (at an annual rate of $250,000) and through March 31, 2010 (at an annual rate of $350,000). The named executive officers are also entitled to participate in our employee benefit programs, to the extent eligible. Pursuantnot tied to their respective employment agreements, we provide Messrs. Zatezalo, Moravec, Boone, Cox and Huntsalary levels, but are consistent with automobiles suitable for their duties and responsibilitiesthe awards granted to us.
During 2009, we had an employment agreementother officers in connection with Mr. Glancy that provided him with a base salary of $385,000, a discretionary annual bonus of 40%this offering. These multiples of base salary andwere established pursuant to the opportunity to participate in incentive and other benefit plans. In connection with Mr. Glancy's resignation asdiscretion of our President and Chief Executive Officer in March 2009, we entered into an amended and restated employment agreementWexford and negotiations with Mr. Glancy in his capacity as a senior advisor, which provides for a monthly salary of $7,500 and the opportunityour executive officers. We intend to participate in the benefits offeredprimarily utilize phantom units with associated distribution equivalent rights, or DERs, to provide long-term incentives to our other salaried employees. We also had an employment agreement in effect with Mr. Hanley duringnamed executive officers. DERs enable the period he served asrecipients of phantom unit awards to receive cash distributions on our interim President and Chief Executive Officer during 2009. Mr. Hanley's employment agreement provided him with a base salary of $220,000 each year, which could be increased or decreased depending on the amount of time Mr. Hanley was required to devote to our predecessor during the year.
We recently entered into amended and restated employment agreements with Messrs. Zatezalo and Moravec. The amended and restated employment agreements are substantially similarphantom units to the agreements previously in effect, exceptsame extent generally as previously described inunitholders receive cash distributions on our common units. These awards are intended to align the section titled "—Compensation Discussion and Analysis—Elementsinterests of Compensation—Employment Agreements." The severance and change in control benefits provided by the employment agreements withkey employees (including the named executive officers are described belowofficers) with those of our unitholders. The phantom units will vest in equal one-sixth increments over a thirty-six month period, subject to earlier vesting upon a change of control or the executive's termination due to death or disability. In addition, upon a termination of the executive by us without cause or by the executive for good reason, the vesting of those phantom units scheduled to vest in the section titled "—Potential Payments Upon Termination or Change in Control—Employment Agreements."12-month period following such termination will be accelerated to such termination date. DER distributions with respect to unvested phantom units will be paid upon vesting of the associated phantom units (and will be forfeited at the same time the associated phantom units are forfeited).
Long-Term Incentive Plan
In connection with this offering, the board of directors of our general partner will adopt the long-term incentive plan for employees, consultants and directors who perform services for us.
The long-term incentive plan will consist of the following components: restricted units, unit options, phantom units, unit payments, unit appreciation rights, other equity-based awards and performance awards. The long-term incentive plan will limit the number of units that may be delivered pursuant to awards to 10% of the outstanding common units and subordinated units on the effective date of the initial public offering of our common units. Common units withheld to satisfy exercise prices or tax withholding obligations are available for delivery pursuant to other awards. The plan will be administered by our board of directors or a committee thereof, which we refer to as the plan administrator.
The plan administrator may terminate or amend the long-term incentive plan at any time with respect to any of our common units for which a grant has not yet been made. The plan administrator also has the right to alter or amend the long-term incentive plan or any part of the plan from time to time, including increasing the number of common units that may be granted, subject to unitholder approval as required by the exchange upon which our common units are listed at that time. However, no change in any outstanding grant may be made that would materially reduce the benefits of the participant without the consent of the participant. The plan will expire on the tenth anniversary of its approval, when common units are no longer available under the plan for grants or upon its termination by the plan administrator, whichever occurs first.
Grants Restricted Units. A restricted unit grant is an award of Plan-Based Awardscommon units that vests over a period of time and that during such time is subject to forfeiture. The plan administrator may determine to make grants of restricted units under the plan to participants containing such terms as the plan administrator shall determine. The plan administrator will determine the period over which restricted units granted to participants will vest. The plan administrator, in its discretion, may base its determination upon the achievement of specified financial objectives. In addition, the restricted units will vest upon a change of control, as defined in the plan, unless provided otherwise by the plan administrator. Distributions made on restricted units may or may not be subjected to the same vesting provisions as the restricted units. If a grantee's employment, consulting relationship or membership on the board of directors of our general partner terminates for any reason, the grantee's restricted units will be automatically forfeited unless, and except to the extent that, the plan administrator or the terms of the award agreement or an employment agreement provide otherwise.
We didintend the restricted units under the plan to serve as a means of incentive compensation for performance and not primarily as an opportunity to participate in the equity appreciation of our common units. Therefore, plan participants will not pay any consideration for restricted units they receive, and we will receive no remuneration for the restricted units.
Unit Options. The plan will permit the grant of options covering our common units. The plan administrator may make grants under the plan to participants containing such terms as the plan administrator shall determine. Unit options will have an exercise price that may not be less than the fair market value of our common units on the date of grant. In general, unit options granted will become exercisable over a period determined by the plan administrator. In addition, the unit options will become exercisable upon a change of control, as defined in the plan, unless provided otherwise by the plan administrator. If a grantee's employment, consulting relationship or membership on the board of directors of our general partner terminates for any equity awards or non-equity incentive plan awardsreason, the grantee's unvested unit options will be automatically forfeited unless, and except to the named executive officers in 2009.
Outstanding Equity Awards at Fiscal Year End and Option Exercise and Stock Vested in 2009extent, the option agreement, an employment agreement or the plan administrator provides otherwise.
None of the named executive officers held outstanding equity awards during 2009 or as of December 31, 2009.
Pension Benefits
Currently, we do not, and we do not intend to, provide pension benefits to our employees including the named executive officers. Our general partner may change this policy in the future.
Nonqualified Deferred Compensation Table
Currently, we do not, and we do not intend to, sponsor or adopt a nonqualified deferred compensation plan. Our general partner may change this policy in the future.
Potential Payments Upon Termination or Change in Control
We have employment agreements with each of the named executive officers that contain provisions regarding payments to be made to such individuals upon an involuntary termination of their employment by us, other than for cause. The employment agreements are described in greater detail below and in the section above titled "—Compensation Discussion and Analysis—Elements of Compensation—Employment Agreements." In order to provide our unitholders with an understanding of the severance benefits that will be in effect following this offering, we discuss below the benefits payable under the amended and restated employment agreements with Messrs. Zatezalo and Moravec, assuming such arrangements were in place as of December 31, 2009.
Employment Agreements
Under the employment agreements with Messrs. Zatezalo, Boone and Moravec, if the employment of the executive is terminated by us for "cause," by the executive voluntarily without "good reason," or due to the executive's "disability," then the executive, as applicable, will be entitled to receive his earned but unpaid base salary, payment with respect to accrued but unpaid vacation days, all benefits accrued and vested under any of our benefit plans, and reimbursement for any properly incurred business expenses (collectively, the "accrued obligations"). In addition to the foregoing, in the event the employment of Mr. Zatezalo, Mr. Boone or Mr. Moravec is terminated by us without "cause" or by the executive for "good reason," the executive shall receive a lump sum cash payment equal to twelve months' worth of his base salary (six months in the case of Mr. Moravec), subject to his timely execution and delivery (and nonrevocation)exercise of a release agreement for our benefit. Inunit option, we will acquire common units on the eventopen market or from any other person or we will directly issue common units or use any combination of the death of Mr. Zatezalo, Mr. Boone or Mr. Moravec, his estate will be entitled to receive the accrued obligations and a pro-rated annual discretionary bonus. Messrs. Zatezalo, Boone and Moravec are subject to certain confidentiality, noncompete and nonsolicitation provisions contained in their respective employment agreements. The confidentiality covenants are perpetual, while the
noncompete and nonsolicitation covenants apply duringforegoing, in the termplan administrator's discretion. If we issue new common units upon exercise of the unit options, the total number of common units outstanding will increase. The availability of unit options is intended to furnish additional compensation to plan participants and to align their economic interests with those of common unitholders.
Performance Award. A performance award is denominated as a cash amount at the time of grant and gives the grantee the right to receive all or part of such award upon the achievement of specified financial objectives, length of service or other specified criteria. The plan administrator will determine the period over which certain specified financial objectives or other specified criteria must be met. The performance award may be paid in cash, common units or a combination of cash and common units. If a grantee's employment, agreement and for one year (six months inconsulting relationship or membership on the caseboard of Mr. Moravec) following the executive's terminationdirectors of our general partner terminates for any reason (two years followingprior to payment, the executive's terminationgrantee's performance award will be automatically forfeited unless, and except to the extent that, the plan administrator or the terms of the award agreement or an employment agreement provide otherwise.
Phantom Units. A phantom unit is a notional common unit that entitles the grantee to receive a common unit upon the vesting of the phantom unit or, in the discretion of the plan administrator, cash equal to the value of a common unit. The plan administrator may determine to make grants of phantom units under the plan to participants containing such terms as the plan administrator shall determine, which may include DERs, which entitle the grantee to receive an amount of cash equal to the cash distributions made on a common unit during the period the phantom unit remains "outstanding." Such DERs generally will become vested or forfeited at the same time as the tandem phantom unit becomes vested or is forfeited. The plan administrator will determine the period over which phantom units granted to participants will vest. The plan administrator, in its discretion, may base its determination upon the achievement of specified financial objectives. In addition, the phantom units will vest upon a change of control, as defined in the plan, unless provided otherwise by the plan administrator. If a grantee's employment, consulting relationship or membership on the board of directors of our general partner terminates for any reason, the grantee's phantom units will be automatically forfeited unless, and except to the extent that, the plan administrator or the terms of the award agreement or an employment agreement provide otherwise.
Upon the vesting of phantom units, to the extent such phantom unit will be satisfied or paid with common units, we will acquire common units on the open market or from any other person or we will directly issue common units or use any combination of the foregoing, in the caseplan administrator's discretion. If we issue new common units upon vesting of the nonsolicitation covenant).phantom units, the total common units outstanding will increase.
For purposesWe intend the issuance of any common units upon vesting of the agreements with Messrs. Zatezalo, Boonephantom units under the plan to serve as a means of incentive compensation for performance and Moravec,not primarily as an opportunity to participate in the terms listed below have been defined as follows:equity appreciation of our common units. Therefore, plan participants will not pay any consideration for the common units they receive, and we will receive no remuneration for the common units.
"cause" means (a) failure Unit Payment. The plan administrator, in its discretion, may also grant to participants common units that are not subject to forfeiture.
Unit Appreciation Rights. The long-term incentive plan will permit the grant of unit appreciation rights. A unit appreciation right is an award that, upon exercise, entitles participants to receive the excess of the executivefair market value of our common units on the exercise date over the exercise price established for the unit appreciation right. Such excess will be paid
in cash or our common units. The plan administrator may determine to perform substantially his duties (othermake grants of unit appreciation rights under the plan to participants containing such terms as the plan administrator shall determine. Unit appreciation rights will have an exercise price that may not be less than the fair market value of our common units on the date of grant. In general, unit appreciation rights granted will become exercisable over a failure dueperiod determined by the plan administrator. In addition, the unit appreciation rights will become exercisable upon a change in control, as defined in the plan, unless provided otherwise by the plan administrator. If a grantee's employment, consulting relationship or membership on the board of directors of our general partner terminates for any reason, the grantee's unvested unit appreciation rights will be automatically forfeited unless, and except to the extent that, the grant agreement, an employment agreement or the plan administrator provides otherwise.
Upon exercise of a "disability") within ten days after written noticeunit appreciation right, to the extent it will be paid in common units, we will acquire common units on the open market or from us, (b) executive's conviction of,any other person or plea of guiltywe will directly issue common units or no contest to a misdemeanor involving dishonesty oruse any felony, (c) executive engaging in any illegal conduct, gross misconduct, or other material breachcombination of the employment agreement thatforegoing, in the plan administrator's discretion. If we issue new common units upon exercise of the unit appreciation rights, the total number of common units outstanding will increase. The availability of unit appreciation rights is materiallyintended to furnish additional compensation to plan participants and demonstratively injurious to us or (d) executive engaging in any act of dishonesty or fraud involving us or any of our affiliates.
Other Unit-Based Awards. The plan administrator, in its discretion, may also grant to participants an award denominated or payable in, referenced to, or otherwise based on or related to the executive's position (including status, office, title,value of our common units. Such awards shall contain such terms as the plan administrator shall determine, including the vesting provisions and reporting requirements),whether such award shall be paid in cash, units or any other diminution in any material respect in such position, authority, duties or responsibilities, (b) a reduction in base salary, (c) a reductioncombination thereof.
401(k) Plan
Rhino Energy LLC and two of its subsidiaries, CAM Mining LLC and McClane Canyon Mining LLC, are participating employers in the executive's welfare, qualifiedCAM Mining LLC 401(k) Plan, and Rhino Energy LLC's subsidiaries Hopedale Mining LLC, Rhino Coalfield Services LLC and Sands Hill Mining LLC each sponsor their own plans (collectively, the "401(k) Plans"). The companies use the 401(k) Plans to assist their eligible employees in saving for retirement on a tax-deferred basis. The 401(k) Plans permit all eligible employees, including the named executive officers, to make voluntary pre-tax contributions to the applicable plan, or paid time off benefits, other than a reduction as a result of a general change in any suchsubject to applicable tax limitations. A discretionary employer matching contribution may also be made to the plan (d) any purported termination of the executive's employment under the employment agreement other than for "cause," death or "disability" or (e) in the case of Messrs. Zatezalothose eligible employees who meet certain conditions and Moravec (but not Mr. Boone), a sale of our assets or ownership interests to an entity other than any of our subsidiaries or affiliates, Wexford Capital or any investment fund managed thereby. The executive must give notice of the event alleged to constitute "good reason" within six months of its occurrence and we have 30 days upon receipt of the notice to cure the alleged "good reason" event.
Under the employment agreement with Mr. Cox, if Mr. Cox's employment is terminated by us without "cause," he is entitled to receive a lump sum payment equal to six months' worth of his base salary and continued family health insurance, at no premium cost, until the earlier of six months or he becomes covered under a new employer's plan. Mr. Cox is subject to certain confidentiality, noncompete and nonsolicitation provisions contained in his employment agreement.limitations under federal law. The confidentiality covenantsemployer matching contribution percentage, if any, will be determined each year. Employee contributions are perpetual, whilesubject to annual dollar limitations, which are periodically adjusted by the noncompete covenants apply during the termcost of living index. Each 401(k) Plan is intended to be tax-qualified under Section 401(a) of the Internal Revenue Code so that contributions to the plan, and income earned on plan contributions, are not taxable to employees until withdrawn from the plan, and so that contributions, if any, will be deductible when made.
Other Benefits
The employment agreement andagreements for one year following terminationeach of Mr. Cox's employment (exceptthe named executive officers provide, in general, that the noncompete covenant appliesnamed executive officer is eligible to participate in our employee benefit plans. Additional benefits and perquisites for the named executive officers may include payment of premiums for supplemental life insurance, long-term disability insurance and automobile fringe benefits. In 2009, the only 90 days following Mr. Cox's termination by us without "cause"). The nonsolicitation period runs untilperquisite provided to the end ofnamed executive officers was the six month period following the end of the applicable noncompete period.
For purposes of the agreement with Mr. Cox, "cause" means (1) the commission by executive of an act of dishonesty or fraud against us, (2) a breach of the executive's obligations under the employment agreement and failure to cure such breach within five days after written notice from us, (3) executive is indicted for or convicteduse of a crime involving moral turpitude or (4) executive materially fails or neglects to diligently perform his duties.company owned automobile.
Mr. Hunt's employment agreement previously providedTax Deductibility of Compensation
With respect to the deduction limitations under Section 162(m) of the Internal Revenue Code, we are a limited partnership and do not meet the definition of a "corporation" under Section 162(m). Nonetheless, the taxable compensation paid to each of the named executive officers in 2009 was substantially less than the Section 162(m) threshold of $1,000,000.
Summary Compensation Table
The following table sets forth the cash and other compensation earned for the paymentyear ended December 31, 2009 by the named executive officers:
| Name and Principal Position with Rhino Energy LLC | Year | Salary ($) | Bonus ($) | All Other Compensation ($) (1) | Total ($) | |||||||||||
|---|---|---|---|---|---|---|---|---|---|---|---|---|---|---|---|---|
David G. Zatezalo | 2009 | $ | 325,000 | $ | 195,000 | $ | 22,280 | $ | 542,280 | |||||||
Nicholas R. Glancy | 2009 | $ | 116,000 | $ | — | $ | 1,154 | $ | 117,154 | |||||||
Thomas Hanley | 2009 | $ | 171,261 | $ | — | $ | 258,226 | $ | 469,426 | |||||||
Richard A. Boone | 2009 | $ | 228,318 | $ | 66,000 | $ | 11,944 | $ | 306,262 | |||||||
Christopher N. Moravec | 2009 | $ | 240,000 | $ | 407,000 | (5) | $ | 16,035 | $ | 581,035 | ||||||
Andrew W. Cox | 2009 | $ | 210,000 | $ | 65,000 | $ | 11,169 | $ | 286,169 | |||||||
Reford C. Hunt | 2009 | $ | 181,732 | $ | 57,000 | $ | 10,054 | $ | 248,785 | |||||||
calculated as the monthly lease payment paid by us on behalf of the executive multiplied by the monthly percentage of personal use of the automobile by the executive.
| Name | Automobile Use | Employer Contribution to Our 401(k) Plan | Employer Contribution to the Hopedale 401(k) Plan | |||||||
|---|---|---|---|---|---|---|---|---|---|---|
David G. Zatezalo | $ | 230 | $ | 14,700 | $ | 7,350 | ||||
Nick Glancy | — | $ | 1,154 | — | ||||||
Tom Hanley | — | $ | 8,250 | — | ||||||
Richard A. Boone | $ | 1,267 | $ | 10,677 | — | |||||
Christopher N. Moravec | — | $ | 16,035 | — | ||||||
Andrew W. Cox | $ | 1,003 | $ | 10,166 | — | |||||
Reford C. Hunt | $ | 1,368 | $ | 8,686 | — | |||||
respect to services provided to us in 2009 (at an annual rate of $250,000 through March 31, 2009 and an annual rate of $350,000 beginning April 1, 2009). He also received a lump sum payment of $82,000 as his discretionary bonus for the year ended December 31, 2009.
In connection with the consummation of this offering, the following named executive officers will receive the following one-time cash bonuses: Mr. Zatezalo ($250,000); Mr. Boone ($100,000); and Mr. Moravec ($150,000).
Long-Term Incentive Compensation
Historically, equity based compensation has not been an element of the compensation provided to our employees. However, in connection with this offering the board of directors of our general partner will adopt a long-term incentive plan for our employees, consultants and directors and those of our affiliates who perform services for us. Each of the named executive officers will be eligible to participate in this plan. The long-term incentive plan provides for the grant of restricted units, unit options, unit appreciation rights, phantom units, unit payments, other equity-based awards and performance awards. Please read "—Long-Term Incentive Plan."
In connection with this offering, the named executive officers will each receive a grant of phantom units under the long-term incentive plan in the number of units equal to the following values divided by the per unit offering price of our common units in this offering: Mr. Zatezalo ($1,500,000), Mr. Boone ($500,000), Mr. Moravec ($150,000), Mr. Cox ($25,000) and Mr. Hunt ($25,000). The dollar values of these phantom unit awards were determined as follows: (1) Mr. Zatezalo's award is equal to approximately three times his base salary; (ii) awards to Messrs. Boone and Moravec were targeted at approximately two times their respective base salaries (except the value of Mr. Moravec's award was reduced by the $600,000 of guaranteed bonuses provided under his amended and restated employment agreement); and (iii) awards to Messrs. Cox and Hunt were not tied to their salary levels, but are consistent with the awards granted to other officers in connection with this offering. These multiples of base salary were established pursuant to the discretion of our President and Chief Executive Officer and Wexford and negotiations with our executive officers. We intend to primarily utilize phantom units with associated distribution equivalent rights, or DERs, to provide long-term incentives to our named executive officers. DERs enable the recipients of phantom unit awards to receive cash distributions on our phantom units to the same extent generally as unitholders receive cash distributions on our common units. These awards are intended to align the interests of key employees (including the named executive officers) with those of our unitholders. The phantom units will vest in equal one-sixth increments over a thirty-six month period, subject to earlier vesting upon a change of control or the executive's termination due to death or disability. In addition, upon a termination of the executive by us without cause or by the executive for good reason, the vesting of those phantom units scheduled to vest in the 12-month period following such termination will be accelerated to such termination date. DER distributions with respect to unvested phantom units will be paid upon vesting of the associated phantom units (and will be forfeited at the same time the associated phantom units are forfeited).
Long-Term Incentive Plan
In connection with this offering, the board of directors of our general partner will adopt the long-term incentive plan for employees, consultants and directors who perform services for us.
The long-term incentive plan will consist of the following components: restricted units, unit options, phantom units, unit payments, unit appreciation rights, other equity-based awards and performance awards. The long-term incentive plan will limit the number of units that may be delivered pursuant to awards to 10% of the outstanding common units and subordinated units on the effective date of the initial public offering of our common units. Common units withheld to satisfy exercise prices or tax withholding obligations are available for delivery pursuant to other awards. The plan will be administered by our board of directors or a committee thereof, which we refer to as the plan administrator.
The plan administrator may terminate or amend the long-term incentive plan at any time with respect to any of our common units for which a grant has not yet been made. The plan administrator also has the right to alter or amend the long-term incentive plan or any part of the plan from time to time, including increasing the number of common units that may be granted, subject to unitholder approval as required by the exchange upon which our common units are listed at that time. However, no change in any outstanding grant may be made that would materially reduce the benefits of the participant without the consent of the participant. The plan will expire on the tenth anniversary of its approval, when common units are no longer available under the plan for grants or upon its termination by the plan administrator, whichever occurs first.
Restricted Units. A restricted unit grant is an award of common units that vests over a period of time and that during such time is subject to forfeiture. The plan administrator may determine to make grants of restricted units under the plan to participants containing such terms as the plan administrator shall determine. The plan administrator will determine the period over which restricted units granted to participants will vest. The plan administrator, in its discretion, may base its determination upon the achievement of specified financial objectives. In addition, the restricted units will vest upon a change of control, as defined in the plan, unless provided otherwise by the plan administrator. Distributions made on restricted units may or may not be subjected to the same vesting provisions as the restricted units. If a grantee's employment, consulting relationship or membership on the board of directors of our general partner terminates for any reason, the grantee's restricted units will be automatically forfeited unless, and except to the extent that, the plan administrator or the terms of the award agreement or an employment agreement provide otherwise.
We intend the restricted units under the plan to serve as a means of incentive compensation for performance and not primarily as an opportunity to participate in the equity appreciation of our common units. Therefore, plan participants will not pay any consideration for restricted units they receive, and we will receive no remuneration for the restricted units.
Unit Options. The plan will permit the grant of options covering our common units. The plan administrator may make grants under the plan to participants containing such terms as the plan administrator shall determine. Unit options will have an exercise price that may not be less than the fair market value of our common units on the date of grant. In general, unit options granted will become exercisable over a period determined by the plan administrator. In addition, the unit options will become exercisable upon a change of control, as defined in the plan, unless provided otherwise by the plan administrator. If a grantee's employment, consulting relationship or membership on the board of directors of our general partner terminates for any reason, the grantee's unvested unit options will be automatically forfeited unless, and except to the extent, the option agreement, an employment agreement or the plan administrator provides otherwise.
Upon exercise of a unit option, we will acquire common units on the open market or from any other person or we will directly issue common units or use any combination of the
foregoing, in the plan administrator's discretion. If we issue new common units upon exercise of the unit options, the total number of common units outstanding will increase. The availability of unit options is intended to furnish additional compensation to plan participants and to align their economic interests with those of common unitholders.
Performance Award. A performance award is denominated as a cash amount at the time of grant and gives the grantee the right to receive all or part of such award upon the achievement of specified financial objectives, length of service or other specified criteria. The plan administrator will determine the period over which certain specified financial objectives or other specified criteria must be met. The performance award may be paid in cash, common units or a combination of cash and common units. If a grantee's employment, consulting relationship or membership on the board of directors of our general partner terminates for any reason prior to payment, the grantee's performance award will be automatically forfeited unless, and except to the extent that, the plan administrator or the terms of the award agreement or an employment agreement provide otherwise.
Phantom Units. A phantom unit is a notional common unit that entitles the grantee to receive a common unit upon the vesting of the phantom unit or, in the discretion of the plan administrator, cash equal to the value of a common unit. The plan administrator may determine to make grants of phantom units under the plan to participants containing such terms as the plan administrator shall determine, which may include DERs, which entitle the grantee to receive an amount of cash equal to the cash distributions made on a common unit during the period the phantom unit remains "outstanding." Such DERs generally will become vested or forfeited at the same time as the tandem phantom unit becomes vested or is forfeited. The plan administrator will determine the period over which phantom units granted to participants will vest. The plan administrator, in its discretion, may base its determination upon the achievement of specified financial objectives. In addition, the phantom units will vest upon a change of control, as defined in the plan, unless provided otherwise by the plan administrator. If a grantee's employment, consulting relationship or membership on the board of directors of our general partner terminates for any reason, the grantee's phantom units will be automatically forfeited unless, and except to the extent that, the plan administrator or the terms of the award agreement or an employment agreement provide otherwise.
Upon the vesting of phantom units, to the extent such phantom unit will be satisfied or paid with common units, we will acquire common units on the open market or from any other person or we will directly issue common units or use any combination of the foregoing, in the plan administrator's discretion. If we issue new common units upon vesting of the phantom units, the total common units outstanding will increase.
We intend the issuance of any common units upon vesting of the phantom units under the plan to serve as a means of incentive compensation for performance and not primarily as an opportunity to participate in the equity appreciation of our common units. Therefore, plan participants will not pay any consideration for the common units they receive, and we will receive no remuneration for the common units.
Unit Payment. The plan administrator, in its discretion, may also grant to participants common units that are not subject to forfeiture.
Unit Appreciation Rights. The long-term incentive plan will permit the grant of unit appreciation rights. A unit appreciation right is an award that, upon exercise, entitles participants to receive the excess of the fair market value of our common units on the exercise date over the exercise price established for the unit appreciation right. Such excess will be paid
in cash or our common units. The plan administrator may determine to make grants of unit appreciation rights under the plan to participants containing such terms as the plan administrator shall determine. Unit appreciation rights will have an exercise price that may not be less than the fair market value of our common units on the date of grant. In general, unit appreciation rights granted will become exercisable over a period determined by the plan administrator. In addition, the unit appreciation rights will become exercisable upon a change in control, as defined in the plan, unless provided otherwise by the plan administrator. If a grantee's employment, consulting relationship or membership on the board of directors of our general partner terminates for any reason, the grantee's unvested unit appreciation rights will be automatically forfeited unless, and except to the extent that, the grant agreement, an employment agreement or the plan administrator provides otherwise.
Upon exercise of a unit appreciation right, to the extent it will be paid in common units, we will acquire common units on the open market or from any other person or we will directly issue common units or use any combination of the foregoing, in the plan administrator's discretion. If we issue new common units upon exercise of the unit appreciation rights, the total number of common units outstanding will increase. The availability of unit appreciation rights is intended to furnish additional compensation to plan participants and to align their economic interests with those of common unitholders.
Other Unit-Based Awards. The plan administrator, in its discretion, may also grant to participants an award denominated or payable in, referenced to, or otherwise based on or related to the value of our common units. Such awards shall contain such terms as the plan administrator shall determine, including the vesting provisions and whether such award shall be paid in cash, units or a combination thereof.
401(k) Plan
Rhino Energy LLC and two of its subsidiaries, CAM Mining LLC and McClane Canyon Mining LLC, are participating employers in the CAM Mining LLC 401(k) Plan, and Rhino Energy LLC's subsidiaries Hopedale Mining LLC, Rhino Coalfield Services LLC and Sands Hill Mining LLC each sponsor their own plans (collectively, the "401(k) Plans"). The companies use the 401(k) Plans to assist their eligible employees in saving for retirement on a tax-deferred basis. The 401(k) Plans permit all eligible employees, including the named executive officers, to make voluntary pre-tax contributions to the applicable plan, subject to applicable tax limitations. A discretionary employer matching contribution may also be made to the plan for those eligible employees who meet certain conditions and subject to certain limitations under federal law. The employer matching contribution percentage, if any, will be determined each year. Employee contributions are subject to annual dollar limitations, which are periodically adjusted by the cost of living index. Each 401(k) Plan is intended to be tax-qualified under Section 401(a) of the Internal Revenue Code so that contributions to the plan, and income earned on plan contributions, are not taxable to employees until withdrawn from the plan, and so that contributions, if any, will be deductible when made.
Other Benefits
The employment agreements for each of the named executive officers provide, in general, that the named executive officer is eligible to participate in our employee benefit plans. Additional benefits and perquisites for the named executive officers may include payment of premiums for supplemental life insurance, long-term disability insurance and automobile fringe benefits. In 2009, the only perquisite provided to the named executive officers was the use of a company owned automobile.
Tax Deductibility of Compensation
With respect to the deduction limitations under Section 162(m) of the Internal Revenue Code, we are a limited partnership and do not meet the definition of a "corporation" under Section 162(m). Nonetheless, the taxable compensation paid to each of the named executive officers in 2009 was substantially less than the Section 162(m) threshold of $1,000,000.
Summary Compensation Table
The following table sets forth the cash and other compensation earned for the year ended December 31, 2009 by the named executive officers:
| Name and Principal Position with Rhino Energy LLC | Year | Salary ($) | Bonus ($) | All Other Compensation ($) (1) | Total ($) | |||||||||||
|---|---|---|---|---|---|---|---|---|---|---|---|---|---|---|---|---|
David G. Zatezalo | 2009 | $ | 325,000 | $ | 195,000 | $ | 22,280 | $ | 542,280 | |||||||
Nicholas R. Glancy | 2009 | $ | 116,000 | $ | — | $ | 1,154 | $ | 117,154 | |||||||
Thomas Hanley | 2009 | $ | 171,261 | $ | — | $ | 258,226 | $ | 469,426 | |||||||
Richard A. Boone | 2009 | $ | 228,318 | $ | 66,000 | $ | 11,944 | $ | 306,262 | |||||||
Christopher N. Moravec | 2009 | $ | 240,000 | $ | 407,000 | (5) | $ | 16,035 | $ | 581,035 | ||||||
Andrew W. Cox | 2009 | $ | 210,000 | $ | 65,000 | $ | 11,169 | $ | 286,169 | |||||||
Reford C. Hunt | 2009 | $ | 181,732 | $ | 57,000 | $ | 10,054 | $ | 248,785 | |||||||
calculated as the monthly lease payment paid by us on behalf of the executive multiplied by the monthly percentage of personal use of the automobile by the executive.
| Name | Automobile Use | Employer Contribution to Our 401(k) Plan | Employer Contribution to the Hopedale 401(k) Plan | |||||||
|---|---|---|---|---|---|---|---|---|---|---|
David G. Zatezalo | $ | 230 | $ | 14,700 | $ | 7,350 | ||||
Nick Glancy | — | $ | 1,154 | — | ||||||
Tom Hanley | — | $ | 8,250 | — | ||||||
Richard A. Boone | $ | 1,267 | $ | 10,677 | — | |||||
Christopher N. Moravec | — | $ | 16,035 | — | ||||||
Andrew W. Cox | $ | 1,003 | $ | 10,166 | — | |||||
Reford C. Hunt | $ | 1,368 | $ | 8,686 | — | |||||
Discussion of Summary Compensation Table
Employment Agreements
During 2009, we had employment agreements in effect with each of the named executive officers included in our Summary Compensation Table. The employment agreements with Messrs. Zatezalo, Boone, Moravec, Cox and Hunt set forth the annual base salary payable to each named executive officer, which may be reviewed each year for possible increase. The foregoing named executive officers were each entitled in 2009 under their respective employment agreements to receive an annual discretionary bonus of up to 40% of annual base salary. Pursuant to an amendment to Mr. Zatezalo's employment agreement, he received a special one-time bonus of $65,000 on April 28, 2009. In addition to a discretionary annual bonus, Mr. Moravec has received additional annual term bonuses, paid in monthly installments for having remained employed by us through March 31, 2008 (at an annual rate of $150,000), through March 31, 2009 (at an annual rate of $250,000) and through March 31, 2010 (at an annual rate of $350,000). The named executive officers are also entitled to participate in our employee benefit programs, to the extent eligible. Pursuant to their respective employment agreements, we provide Messrs. Zatezalo, Moravec, Boone, Cox and Hunt with automobiles suitable for their duties and responsibilities to us.
During 2009, we had an employment agreement with Mr. Glancy that provided him with a base salary of $385,000, a discretionary annual bonus of 40% of base salary, and the opportunity to participate in incentive and other benefit plans. In connection with Mr. Glancy's resignation as our President and Chief Executive Officer in March 2009, we entered into an amended and restated employment agreement with Mr. Glancy in his capacity as a senior advisor, which
provides for a monthly salary of $7,500 and the opportunity to participate in the benefits offered to our other salaried employees. We also had an employment agreement in effect with Mr. Hanley during the period he served as our interim President and Chief Executive Officer during 2009. Mr. Hanley's employment agreement provided him with a base salary of $220,000 each year, which could be increased or decreased depending on the amount of time Mr. Hanley was required to devote to our predecessor during the year.
We recently entered into amended and restated employment agreements with Messrs. Zatezalo and Moravec. The amended and restated employment agreements are substantially similar to the agreements previously in effect, except as previously described in the section titled "—Compensation Discussion and Analysis—Elements of Compensation—Employment Agreements." The severance and change in control benefits provided by the employment agreements with the named executive officers are described below in the section titled "—Potential Payments Upon Termination or Change in Control—Employment Agreements."
Grants of Plan-Based Awards
We did not grant any equity awards or non-equity incentive plan awards to the named executive officers in 2009.
Outstanding Equity Awards at Fiscal Year End and Option Exercise and Stock Vested in 2009
None of the named executive officers held outstanding equity awards during 2009 or as of December 31, 2009.
Pension Benefits
Currently, we do not, and we do not intend to, provide pension benefits to our employees including the named executive officers. Our general partner may change this policy in the future.
Nonqualified Deferred Compensation Table
Currently, we do not, and we do not intend to, sponsor or adopt a nonqualified deferred compensation plan. Our general partner may change this policy in the future.
Potential Payments Upon Termination or Change in Control
We have employment agreements with each of the named executive officers that contain provisions regarding payments to be made to such individuals upon an involuntary termination of their employment by us, other than for cause. The employment agreements are described in greater detail below and in the section above titled "—Compensation Discussion and Analysis—Elements of Compensation—Employment Agreements." In order to provide our unitholders with an understanding of the severance benefits that will be in effect following this offering, we discuss below the benefits payable under the amended and restated employment agreements with Messrs. Zatezalo and Moravec, assuming such arrangements were in place as of December 31, 2009.
Employment Agreements
Under the employment agreements with Messrs. Zatezalo, Boone and Moravec, if the employment of the executive is terminated by us for "cause," by the executive voluntarily without "good reason," or due to the executive's "disability," then the executive, as applicable, will be entitled to receive his earned but unpaid base salary, payment with respect to accrued but unpaid vacation days, all benefits accrued and vested under any of our benefit plans, and reimbursement for any properly incurred business expenses (collectively, the "accrued obligations"). In addition to the foregoing, in the event the employment of Mr. Zatezalo, Mr. Boone or Mr. Moravec is terminated by us without "cause" or by the executive for "good reason," the executive shall receive a lump sum cash payment equal to twelve months' worth of his base salary (six months in the case of Mr. Moravec), subject to his timely execution and delivery (and nonrevocation) of a release agreement for our benefit. In the event of the death of Mr. Zatezalo, Mr. Boone or Mr. Moravec, his estate will be entitled to receive the accrued obligations and a pro-rated annual discretionary bonus. Messrs. Zatezalo, Boone and Moravec are subject to certain confidentiality, noncompete and nonsolicitation provisions contained in their respective employment agreements. The confidentiality covenants are perpetual, while the noncompete and nonsolicitation covenants apply during the term of the employment agreement and for one year (six months in the case of Mr. Moravec) following the executive's termination for any reason (two years following the executive's termination for any reason in the case of the nonsolicitation covenant).
For purposes of the agreements with Messrs. Zatezalo, Boone and Moravec, the terms listed below have been defined as follows:
Under the employment agreement with Mr. Cox, if Mr. Cox's employment is terminated by us without "cause," he is entitled to receive a lump sum payment equal to six months' worth of his base salary and continued family health insurance, at no premium cost, until the earlier of six months or he becomes covered under a new employer's plan. Mr. Cox is subject to certain confidentiality, noncompete and nonsolicitation provisions contained in his employment agreement. The confidentiality covenants are perpetual, while the noncompete covenants apply during the term of the employment agreement and for one year following termination of Mr. Cox's employment (except that the noncompete covenant applies for only 90 days following Mr. Cox's termination by us without "cause"). The nonsolicitation period runs until the end of the six month period following the end of the applicable noncompete period.
For purposes of the agreement with Mr. Cox, "cause" means (1) the commission by executive of an act of dishonesty or fraud against us, (2) a breach of the executive's obligations under the employment agreement and failure to cure such breach within five days after written notice from us, (3) executive is indicted for or convicted of a crime involving moral turpitude or (4) executive materially fails or neglects to diligently perform his duties.
Mr. Hunt's employment agreement previously provided for the payment of a one-time cash bonus of $100,000 in connection with the occurrence of certain change in control transactions or a public offering of common units of CAM Mining LLC or Rhino Energy LLC. Although this employment agreement was in effect on December 31, 2009, in 2010 Mr. Hunt received a one-time bonus of $100,000 and his employment agreement was amended to eliminate the change in control bonus contemplated thereunder. Mr. Hunt has agreed not to compete with us during his employment term and, in the case of his voluntary resignation or termination by us for "cause," for a period of three months following such termination. Mr. Hunt has also agreed not to solicit our employees for a period of six months following his noncompete period. For purposes of Mr. Hunt's employment agreement, "cause" has the same meaning set forth above with respect to the agreement with Mr. Cox.
Nick Glancy Resignation
The employment agreement between us and Mr. Glancy in effect prior to March 5, 2009 provided severance benefits substantially identical to the severance benefits described above with respect to Messrs. Zatezalo, Boone and Moravec. In connection with Mr. Glancy's resignation as our President and Chief Executive Officer, that employment agreement was terminated and Mr. Glancy entered into a new employment agreement in the capacity as a senior advisor. Mr. Glancy received only his accrued and unpaid regular salary and accrued vacation time in connection with his resignation as our President and Chief Executive Officer. The employment agreement with Mr. Glancy that became effective March 5, 2009 does not provide for severance benefits.
Tom Hanley Resignation
Mr. Hanley's employment with us terminated effective as of September 30, 2009. In connection with his termination, Mr. Hanley entered into an Agreement and General Release with us pursuant to which we paid Mr. Hanley a lump sum payment equal to $250,000 and a portion of the cost of his continued medical coverage through the end of his termination month. These benefits were contingent upon Mr. Hanley executing and not revoking a release of claims in favor of us and our affiliates. Mr. Hanley remains subject to confidentiality and noncompete covenants contained in his prior employment agreement and in his consulting agreement with Wexford.
Phantom Units
In connection with this offering, Messrs. Zatezalo, Boone, Moravec, Cox and Hunt will receive grants of phantom units under our long-term incentive plan as previously described in the section above titled "—Compensation Discussion and Analysis—Long-Term Incentive Compensation." The phantom units will vest in equal one-sixth increments over a thirty-six month period, subject to earlier vesting upon a "change of control" or the named executive officer's termination due to death or "disability." In addition, upon a termination of the executive by us without cause or by the executive for a good reason, the vesting of those phantom units scheduled to vest in the 12-month period following such termination will be
accelerated to such termination date. "Good reason" will generally have the meaning set forth above and "cause" will have the meaning set forth in the respective employment agreement of the named executive officer as described above. "Cause" with respect to Mr. Hunt will have the meaning set forth in the employment agreements of Messrs. Zatezalo, Boone and Moravec. A "change of control" will be deemed to have occurred if: (i) any person or group, other than Wexford Capital, our general partner or an affiliate of either, becomes the owner of more than 50% of the voting power of the voting securities of either us or our general partner; or (ii) upon the sale or other disposition by either us or our general partner of all or substantially all of its assets, whether in a single or series of related transactions, to one or more parties (other than Wexford Capital, our general partner or an affiliate of either). This offering will not constitute a "change of control." A "disability" is any illness or injury for which the named executive officer will be entitled to benefits under the long-term disability plan of our general partner.
Quantification of Payments
The table below discloses the amount of compensation and/or benefits due to Messrs. Zatezalo, Boone, Moravec and Cox in the event of their termination of employment under certain specified circumstances. The amounts disclosed assume such termination was effective on December 31, 2009, taking into account the arrangements described above and the salary and bonus rates in effect for the named executive officers for 2010 (except that any accelerated vesting associated with the phantom units is not included in the table since our units were not publicly traded as of December 31, 2009). Amounts paid in connection with the resignation of Mr. Hanley are disclosed above. Neither Mr. Glancy nor Mr. Hunt was entitled to severance benefits as of December 31, 2009. The amounts below constitute estimates of the amounts that would be paid to the named executive officers upon their respective terminations under such arrangements. The actual amounts to be paid out are dependent on various factors, which may or may not exist at the time a named executive officer is actually terminated. Therefore, such amounts should be considered "forward-looking statements."
| Name | Termination without Cause | Death | Resignation with Good Reason | |||||||
|---|---|---|---|---|---|---|---|---|---|---|
David G. Zatezalo | $ | 480,000 | $ | 720,000 | $ | 480,000 | ||||
Richard A. Boone | $ | 250,000 | $ | 100,000 | $ | 250,000 | ||||
Christopher N. Moravec | $ | 200,000 | $ | 80,000 | $ | 200,000 | ||||
Andrew W. Cox | $ | 113,683 | (1) | — | — | |||||
Director Compensation
Our predecessor is managed by Wexford and does not have a board of managers. Wexford does not receive compensation from us for conducting our business or managing our operations.
Following the consummation of this offering, we will provide compensation to the non-employee directors (including the directors who are principals of Wexford) of the board of our general partner, including a $20,000 base director fee and a grant of that number of common units having a grant date value of $25,000 (based on the preceding 10-day average price per unit), 25% of which will be vested on the grant date and 75% of which will be restricted units that will vest one-third on the first day of each of the first three calendar quarters that begin following the grant date (with vesting to be accelerated upon the director's death or disability, if
a non-Wexford director, and for all of the directors, on a change of control (as defined in the long-term incentive plan)). Distributions made by the Partnershipus on a restricted unit will vest or be forfeited when the restricted unit vests or is forfeited, as applicable. In addition, the chairs of the audit committee and conflicts committee will receive a $15,000 fee, the chair of any other committee will receive a $10,000 fee, audit committee and conflicts committee members will receive a $10,000 fee and the other committee members will receive a $5,000 fee, for their service in such roles. Our employees who also serve as directors will not receive additional compensation. It is anticipated that each non-employee director will be reimbursed for out-of-pocket expenses in connection with attending meetings of the board of directors or committees, and that each director will be fully indemnified by us for actions associated with being a director to the extent permitted under Delaware law.
Compensation Practices as They Related to Risk Management
We believe our compensation programs do not encourage excessive and unnecessary risk taking by executive officers (or other employees). Short-term annual incentives are generally paid pursuant to discretionary bonuses enabling, historically, the manager of our predecessor, and, in the future, the compensation committee of our general partner, to assess the actual behavior of our employees as it relates to risk taking in awarding a bonus. In the future, our use of equity based long-term compensation will serve our compensation program's goal of aligning the interests of executives and unitholders, thereby reducing the incentives to unnecessary risk taking.
SECURITY OWNERSHIP OF CERTAIN BENEFICIAL OWNERS AND MANAGEMENT
The following table sets forth the beneficial ownership of common units and subordinated units of Rhino Resource Partners LP that will be issued and outstanding upon the consummation of this offering and the related transactions and held by:
The following table does not include any awards granted under the long-term incentive plan in connection with this offering. Please see "Executive Officer Compensation—Elements of Compensation—Long-Term Incentive Compensation" and "—Director Compensation."
| Name of Beneficial Owner | Common Units Beneficially Owned | Percentage of Common Units Beneficially Owned | Subordinated Units Beneficially Owned | Percentage of Subordinated Units Beneficially Owned | Percentage of Common and Subordinated Units Beneficially Owned | Common Units Beneficially Owned | Percentage of Common Units Beneficially Owned | Subordinated Units Beneficially Owned | Percentage of Subordinated Units Beneficially Owned | Percentage of Common and Subordinated Units Beneficially Owned | ||||||||||||||||||||||
|---|---|---|---|---|---|---|---|---|---|---|---|---|---|---|---|---|---|---|---|---|---|---|---|---|---|---|---|---|---|---|---|---|
Rhino Energy Holdings LLC (1)(2) | 8,647,000 | 69.8 | % | 12,397,000 | 100 | % | 84.9 | % | 9,153,000 | 73.8 | % | 12,397,000 | 100 | % | 86.9 | % | ||||||||||||||||
Charles E. Davidson (1)(2) | 8,647,000 | 69.8 | % | 12,397,000 | 100 | % | 84.9 | % | 9,153,000 | 73.8 | % | 12,397,000 | 100 | % | 86.9 | % | ||||||||||||||||
Joseph M. Jacobs (1)(2) | 8,647,000 | 69.8 | % | 12,397,000 | 100 | % | 84.9 | % | 9,153,000 | 73.8 | % | 12,397,000 | 100 | % | 86.9 | % | ||||||||||||||||
Wexford GP LLC (1)(2) | 8,647,000 | 69.8 | % | 12,397,000 | 100 | % | 84.9 | % | 9,153,000 | 73.8 | % | 12,397,000 | 100 | % | 86.9 | % | ||||||||||||||||
Mark D. Zand (2) | — | — | % | — | — | % | — | % | — | — | % | — | — | % | — | % | ||||||||||||||||
David G. Zatezalo (3) | — | — | % | — | — | % | — | % | — | — | % | — | — | % | — | % | ||||||||||||||||
Richard A. Boone (3) | — | — | % | — | — | % | — | % | — | — | % | — | — | % | — | % | ||||||||||||||||
Christopher N. Moravec (3) | — | — | % | — | — | % | — | % | — | — | % | — | — | % | — | % | ||||||||||||||||
Andrew W. Cox (3) | — | — | % | — | — | % | — | % | — | — | % | — | — | % | — | % | ||||||||||||||||
Reford C. Hunt (3) | — | — | % | — | — | % | — | % | — | — | % | — | — | % | — | % | ||||||||||||||||
Jay L. Maymudes (2) | — | — | % | — | — | % | — | % | — | — | % | — | — | % | — | % | ||||||||||||||||
Arthur H. Amron (2) | — | — | % | — | — | % | — | % | — | — | % | — | — | % | — | % | ||||||||||||||||
Kenneth A. Rubin (2) | — | — | % | — | — | % | — | % | — | — | % | — | — | % | — | % | ||||||||||||||||
Mark L. Plaumann (4) | — | — | % | — | — | % | — | % | — | — | % | — | — | % | — | % | ||||||||||||||||
Douglas Lambert (5) | — | — | % | — | — | % | — | % | — | — | % | — | — | % | — | % | ||||||||||||||||
James F. Tompkins (6) | — | — | % | — | — | % | — | % | — | — | % | — | — | % | — | % | ||||||||||||||||
All executive officers and directors as a group (12 persons) | — | — | % | — | — | % | — | % | ||||||||||||||||||||||||
All executive officers and directors as a group (13 persons) | — | — | % | — | — | % | — | % | ||||||||||||||||||||||||
CERTAIN RELATIONSHIPS AND RELATED PARTY TRANSACTIONS
After this offering, Wexford will own 8,647,0009,153,000 common units and 12,397,000 subordinated units representing approximately 84.9%86.9% of our units and will own and control our general partner, and will appoint all of the directors of our general partner, which will maintain its 2.0% general partner interest in us and will be issued the incentive distribution rights.
The terms of the transactions and agreements disclosed in this section were determined by and among affiliated entities and, consequently, are not the result of arm's length negotiations. Such terms are not necessarily at least as favorable to the parties to these transactions and agreements as the terms which could have been obtained from unaffiliated third parties.
Distributions and Payments to Our General Partner and Its Affiliates
The following table summarizes the distributions and payments to be made by us to our general partner and its affiliates in connection with the formation, ongoing operation and liquidation of Rhino Resource Partners LP.
| Formation Stage | ||
The consideration received by our general partner and its affiliates for the contribution of their interests | • | |
• 12,397,000 subordinated units; | ||
• 2.0% general partner interest; and | ||
• the incentive distribution rights. | ||
Operational Stage | ||
Distributions of available cash to our general partner and its affiliates | We will generally make cash distributions 98% to the unitholders, including affiliates of our general partner, as the holders of an aggregate of | |
Assuming we have sufficient available cash to pay the minimum quarterly distribution on all of our outstanding units for four quarters, our general partner and its affiliates would receive an annual distribution of approximately $0.9 million on the 2.0% general partner interest and approximately |
| Payments to our general partner and its affiliates | Our general partner will not receive a management fee | |
Withdrawal or removal of our general partner | If our general partner withdraws or is removed, its general partner interest and its incentive distribution rights will either be sold to the new general partner for cash or converted into common units, in each case for an amount equal to the fair market value of those interests. Please read "The Partnership Agreement—Withdrawal or Removal of Our General Partner." | |
Liquidation Stage | ||
Liquidation | Upon our liquidation, the partners, including our general partner, will be entitled to receive liquidating distributions according to their particular capital account balances. |
Ownership Interests of Certain Directors of Our General Partner
Upon the closing of this offering, principals of Wexford Capital, including Mark D. Zand, Joseph M. Jacobs, Jay L. Maymudes, Arthur H. Amron and Kenneth A. Rubin, will own membership interests in our general partner. In addition to the 2.0% general partner interest in us, our general partner will own the incentive distribution rights.
Agreements with Affiliates
In connection with this offering, we will enter into certain agreements with Wexford, as described in more detail below.
Contribution Agreement
In connection with the closing of this offering, we will enter into a contribution agreement that will effect the transactions, including the transfer of the ownership interests in Rhino Energy LLC, and the use of the net proceeds of this offering. This agreement will not be the
result of arm's-length negotiations, and it, or any of the transactions that it provides for, may not be effected on terms at least as favorable to the parties to this agreement as could have been obtained from unaffiliated third parties. All of the transaction expenses incurred in connection with these transactions will be paid from the proceeds of this offering.
Registration Rights Agreement
Under our partnership agreement, we have agreed to register for resale under the Securities Act and applicable state securities laws any common units, subordinated units or other limited partner interests proposed to be sold by our general partner or any of its affiliates or their assignees if an exemption from the registration requirements is not otherwise available. These registration rights continue for two years following any withdrawal or removal of our general partner. We are obligated to pay all expenses incidental to the registration, excluding underwriting discounts.
In addition, in connection with this offering, we expect to enter into a registration rights agreement with Rhino Energy Holdings LLC. Pursuant to the registration rights agreement, we will be required to file a registration statement to register the common units and subordinated units issued to Rhino Energy Holdings LLC and the common units issuable upon the conversion of the subordinated units upon request of Rhino Energy Holdings LLC. In addition, the registration rights agreement gives Rhino Energy Holdings LLC piggyback registration rights under certain circumstances. The registration rights agreement also includes provisions dealing with holdback agreements, indemnification and contribution and allocation of expenses. These registration rights are transferable to affiliates of Rhino Energy Holdings LLC and, in certain circumstances, to third parties. See "Units Eligible for Future Sale."
CONFLICTS OF INTEREST AND FIDUCIARY DUTIES
Conflicts of Interest
Conflicts of interest exist and may arise in the future as a result of the relationships between our general partner and its affiliates, including Wexford, on the one hand, and our partnership and our limited partners, on the other hand. The directors and officers of our general partner have fiduciary duties to manage our general partner in a manner beneficial to its owners. At the same time, our general partner has a fiduciary duty to manage our partnership in a manner beneficial to us and our unitholders.
Whenever a conflict arises between our general partner or its affiliates, on the one hand, and us and our limited partners, on the other hand, our general partner will resolve that conflict. Our partnership agreement contains provisions that modify and limit our general partner's fiduciary duties to our unitholders. Our partnership agreement also restricts the remedies available to our unitholders for actions taken by our general partner that, without those limitations, might constitute breaches of its fiduciary duty.
Our general partner will not be in breach of its obligations under our partnership agreement or its fiduciary duties to us or our unitholders if the resolution of the conflict is:
Our general partner may, but is not required to, seek the approval of such resolution from the conflicts committee of its board of directors. In connection with a situation involving a conflict of interest, any determination by our general partner involving the resolution of the conflict of interest must be made in good faith, provided that, if our general partner does not seek approval from the conflicts committee and its board of directors determines that the resolution or course of action taken with respect to the conflict of interest satisfies either of the standards set forth in the third and fourth bullet points above, then it will be presumed that, in making its decision, the board of directors acted in good faith, and in any proceeding brought by or on behalf of any limited partner or the partnership, the person bringing or prosecuting such proceeding will have the burden of overcoming such presumption. Unless the resolution of a conflict is specifically provided for in our partnership agreement, our general partner or the conflicts committee may consider any factors that it determines in good faith to be appropriate when resolving a conflict. When our partnership agreement provides that someone act in good faith, it requires that person to reasonably believe he is acting in the best interests of the partnership.
Conflicts of interest could arise in the situations described below, among others.
Our general partner's affiliates may compete with us.
Our partnership agreement provides that our general partner will be restricted from engaging in any business activities other than acting as our general partner or those activities incidental to its ownership of interests in us. Except as provided in our partnership agreement, affiliates of our general partner, including Wexford, are not prohibited from engaging in other businesses or activities, including those that might be in direct competition with us. Wexford makes investments and purchases entities in the coal and oil and natural gas sectors. These investments and acquisitions may include entities or assets that we would have been interested in acquiring. Pursuant to the terms of our partnership agreement, the doctrine of corporate opportunity, or any analogous doctrine, shall not apply to our general partner or any of its affiliates, including its executive officers, directors and Wexford. Any such person or entity that becomes aware of a potential transaction, agreement, arrangement or other matter that may be an opportunity for us will not have any duty to communicate or offer such opportunity to us. Any such person or entity will not be liable to us or to any limited partner for breach of any fiduciary duty or other duty by reason of the fact that such person or entity pursues or acquires such opportunity for itself, directs such opportunity to another person or entity or does not communicate such opportunity or information to us. The above provisions will not apply to the members of management at Rhino Energy LLC who are responsible for our coal operations. Such persons will be obligated to present corporate opportunities to us. Therefore, Wexford may compete with us for investment opportunities and Wexford may own an interest in entities that compete with us on an operations basis.
Our general partner and its affiliates are allowed to take into account the interests of parties other than us in resolving conflicts of interest.
Our partnership agreement contains provisions that reduce the fiduciary standards to which our general partner would otherwise be held by state fiduciary duty law. For example, our partnership agreement permits our general partner to make a number of decisions in its individual capacity, as opposed to in its capacity as our general partner. This entitles our general partner to consider only the interests and factors that it desires, and it has no duty or obligation to give any consideration to any interest of, or factors affecting, us, our affiliates or our limited partners. Examples include our general partner's limited call right, its voting rights with respect to the units it owns, its registration rights and its determination whether or not to consent to any merger or consolidation of the partnership.
Our partnership agreement limits the liability of and reduces the fiduciary duties owed by our general partner, and also restricts the remedies available to our unitholders for actions that, without the limitations, might constitute breaches of its fiduciary duty.
In addition to the provisions described above, our partnership agreement contains provisions that restrict the remedies available to our unitholders for actions that might otherwise constitute breaches of our general partner's fiduciary duty. For example, our partnership agreement:
favorable to us than those generally provided to or available from unrelated third parties or (2) "fair and reasonable" to us, as determined by our general partner in good faith, provided that, in determining whether a transaction or resolution is "fair and reasonable," our general partner may consider the totality of the relationships between the parties involved, including other transactions that may be particularly advantageous or beneficial to us; and
Except in limited circumstances, our general partner has the power and authority to conduct our business without unitholder approval.
Under our partnership agreement, our general partner has full power and authority to do all things, other than those items that require unitholder approval or with respect to which our general partner has sought conflicts committee approval, on such terms as it determines to be necessary or appropriate to conduct our business including, but not limited to, the following:
Our partnership agreement provides that our general partner must act in "good faith" when making decisions on our behalf, and our partnership agreement further provides that in order for a determination to be made in "good faith," our general partner must believe that the determination is in our best interests. Please read "The Partnership Agreement—Voting Rights" for information regarding matters that require unitholder approval.
Our general partner determines the amount and timing of asset purchases and sales, capital expenditures, borrowings, issuances of additional partnership securities and the creation, reduction or increase of reserves, each of which can affect the amount of cash that is distributed to our unitholders.
The amount of cash that is available for distribution to our unitholders is affected by decisions of our general partner regarding such matters as:
Our general partner determines the amount and timing of any capital expenditures and whether a capital expenditure is classified as a maintenance capital expenditure, which reduces operating surplus, or an expansion capital expenditure, which does not reduce operating surplus. This determination can affect the amount of cash that is distributed to our unitholders and to our general partner and the ability of the subordinated units to convert into common units.
In addition, our general partner may use an amount, initially equal to $25.0 million, which would not otherwise constitute available cash from operating surplus, in order to permit the payment of cash distributions on its units and incentive distribution rights. All of these actions may affect the amount of cash distributed to our unitholders and our general partner and may facilitate the conversion of subordinated units into common units. Please read "Provisions of Our Partnership Agreement Relating to Cash Distributions."
In addition, borrowings by us and our affiliates do not constitute a breach of any duty owed by our general partner to our unitholders, including borrowings that have the purpose or effect of:
For example, in the event we have not generated sufficient cash from our operations to pay the minimum quarterly distribution on our common and subordinated units, our partnership agreement permits us to borrow funds, which would enable us to make this distribution on all of our outstanding units. Please read "Provisions of Our Partnership Agreement Relating to Cash Distributions—Subordination Period."
Our partnership agreement provides that we and our subsidiaries may borrow funds from our general partner and its affiliates. Our general partner and its affiliates may borrow funds from us, or our operating company and its operating subsidiaries.
Our general partner determines which of the costs it incurs on our behalf are reimbursable by us.
We will reimburse our general partner and its affiliates for the costs incurred in managing and operating us, including costs incurred in rendering corporate staff and support services to us. Our partnership agreement provides that our general partner will determine in good faith the expenses that are allocable to us, and it will charge on a fully allocated cost basis for services provided to us. The fully allocated basis charged by our general partner does not include a profit component. Please read "Certain Relationships and Related Party Transactions."
Our partnership agreement does not restrict our general partner from causing us to pay it or its affiliates for any services rendered to us or from entering into additional contractual arrangements with any of these entities on our behalf.
Our partnership agreement allows our general partner to determine, in good faith, any amounts to pay itself or its affiliates for any services rendered to us. Our general partner may also enter into additional contractual arrangements with any of its affiliates on our behalf. Neither our partnership agreement nor any of the other agreements, contracts or arrangements between us, on the one hand, and our general partner and its affiliates, on the other hand, that will be in effect as of the closing of this offering, will be the result of arm's-length negotiations. Similarly, agreements, contracts or arrangements between us and our general partner and its affiliates that are entered into following the closing of this offering may not be negotiated on an arm's-length basis, although, in some circumstances, our general partner may determine that the conflicts committee of our general partner may make a determination on our behalf with respect to such arrangements.
Our general partner will determine, in good faith, the terms of any such transactions entered into after the closing of this offering.
Our general partner and its affiliates will have no obligation to permit us to use any of its or its affiliates' facilities or assets, except as may be provided in contracts entered into specifically for such use. There is no obligation of our general partner or its affiliates to enter into any contracts of this kind.
Our general partner intends to limit its liability regarding our obligations.
Our general partner intends to limit its liability under contractual arrangements so that counterparties to such arrangements have recourse only against our assets, and not against our general partner or its assets. Our partnership agreement provides that any action taken by our general partner to limit its liability is not a breach of our general partner's fiduciary duties, even if we could have obtained more favorable terms without the limitation on liability.
Our general partner may exercise its right to call and purchase all of the common units not owned by it and its affiliates if they own more than 90% of the outstanding common units.
Our general partner may exercise its right to call and purchase common units, as provided in our partnership agreement, or may assign this right to one of its affiliates or to us. Our general partner is not bound by fiduciary duty restrictions in determining whether to exercise this right. As a result, a common unitholder may be required to sell his common units at an undesirable time or price. Please read "The Partnership Agreement—Limited Call Right."
Our general partner controls the enforcement of its and its affiliates' obligations to us.
Any agreements between us, on the one hand, and our general partner and its affiliates, on the other, will not grant to the unitholders, separate and apart from us, the right to enforce the obligations of our general partner and its affiliates in our favor.
Our general partner decides whether to retain separate counsel, accountants or others to perform services for us.
The attorneys, independent accountants and others who have performed services for us regarding this offering have been retained by our general partner. Attorneys, independent accountants and others who perform services for us are selected by our general partner or the conflicts committee and may perform services for our general partner and its affiliates. We may retain separate counsel for ourselves or the common unitholders in the event of a conflict of interest between our general partner and its affiliates, on the one hand, and us or the common unitholders, on the other, depending on the nature of the conflict. We do not intend to do so in most cases.
Our general partner may elect to cause us to issue common units to it in connection with a resetting of the target distribution levels related to our general partner's incentive distribution rights without the approval of the conflicts committee of the board of directors of our general partner or our unitholders. This election may result in lower distributions to our common unitholders in certain situations.
Our general partner has the right, at any time when there are no subordinated units outstanding and it has received incentive distributions at the highest level to which it is entitled (48.0%) for each of the prior four consecutive fiscal quarters, to reset the initial target distribution levels at higher levels based on our cash distribution at the time of the exercise of the reset election. Following a reset election by our general partner, the minimum quarterly distribution will be reset to an amount equal to the average cash distribution per common unit for the two fiscal quarters immediately preceding the reset election (such amount is referred to as the "reset minimum quarterly distribution"), and the target distribution levels will be reset to correspondingly higher levels based on percentage increases above the reset minimum quarterly distribution.
We anticipate that our general partner would exercise this reset right in order to facilitate acquisitions or internal growth projects that would not be sufficiently accretive to cash distributions per common unit without such conversion; however, it is possible that our general partner could exercise this reset election at a time when we are experiencing declines in our aggregate cash distributions or at a time when our general partner expects that we will experience declines in our aggregate cash distributions in the foreseeable future. In such situations, our general partner may be experiencing, or may expect to experience, declines in the cash distributions it receives related to its incentive distribution rights and may therefore desire to be issued our common units, which are entitled to specified priorities with respect to our distributions and which therefore may be more advantageous for the general partner to own in lieu of the right to receive incentive distribution payments based on target distribution levels that are less certain to be achieved in the then current business environment. As a result, a reset election may cause our common unitholders to experience dilution in the amount of cash distributions that they would have otherwise received had we not issued new common units to our general partner in connection with resetting the target distribution levels related to our general partner's incentive distribution rights. Please read "Provisions of Our Partnership Agreement Relating to Cash Distributions—Distributions of Available Cash—General Partner Interest and Incentive Distribution Rights."
Fiduciary Duties
Our general partner is accountable to us and our unitholders as a fiduciary. Fiduciary duties owed to unitholders by our general partner are prescribed by law and our partnership agreement. The Delaware Act provides that Delaware limited partnerships may, in their partnership agreements, modify, restrict or expand the fiduciary duties otherwise owed by a general partner to limited partners and the partnership.
Our partnership agreement contains various provisions modifying and restricting the fiduciary duties that might otherwise be owed by our general partner. We have adopted these restrictions to allow our general partner or its affiliates to engage in transactions with us that would otherwise be prohibited by state-law fiduciary duty standards and to take into account the interests of other parties in addition to our interests when resolving conflicts of interest. We believe this is appropriate and necessary because our general partner's board of directors will have fiduciary duties to manage our general partner in a manner that is beneficial to its owners, as well as to our unitholders. Without these modifications, our general partner's ability to make decisions involving conflicts of interest would be restricted. The modifications to the fiduciary standards enable our general partner to take into consideration all parties involved in the proposed action, so long as the resolution is fair and reasonable to us. These modifications also enable our general partner to attract and retain experienced and capable directors. These modifications are detrimental to our unitholders because they restrict the remedies available to unitholders for actions that, without those limitations, might constitute breaches of fiduciary duty, as described below, and permit our general partner to take into account the interests of third parties in addition to our interests when resolving conflicts of interest. The following is a
summary of the material restrictions of the fiduciary duties owed by our general partner to the limited partners:
| State law fiduciary duty standards | Fiduciary duties are generally considered to include an obligation to act in good faith and with due care and loyalty. The duty of care, in the absence of a provision in a partnership agreement providing otherwise, would generally require a general partner to act for the partnership in the same manner as a prudent person would act on his own behalf. The duty of loyalty, in the absence of a provision in a partnership agreement providing otherwise, would generally prohibit a general partner of a Delaware limited partnership from taking any action or engaging in any transaction where a conflict of interest is present. | |
Partnership agreement modified standards | Our partnership agreement contains provisions that waive or consent to conduct by our general partner and its affiliates that might otherwise raise issues about compliance with fiduciary duties or applicable law. For example, our partnership agreement provides that when our general partner is acting in its capacity as our general partner, as opposed to in its individual capacity, it must act in "good faith" and will not be subject to any other standard under applicable law. In addition, when our general partner is acting in its individual capacity, as opposed to in its capacity as our general partner, it may act without any fiduciary obligation to us or the unitholders whatsoever. These standards reduce the obligations to which our general partner would otherwise be held. | |
Our partnership agreement generally provides that affiliated transactions and resolutions of conflicts of interest that are not approved by a vote of common unitholders and that are not approved by the conflicts committee of the board of directors of our general partner must be: | ||
• on terms no less favorable to us than those generally being provided to, or available from, unrelated third parties; or |
• "fair and reasonable" to us, taking into account the totality of the relationships between the parties involved (including other transactions that may be particularly favorable or advantageous to us). | ||
If our general partner does not seek approval from the conflicts committee and the board of directors determines that the resolution or course of action taken with respect to the conflict of interest satisfies either of the standards set forth in the bullet points above, then it will be presumed that, in making its decision, the board of directors, which may include board members affected by the conflict of interest, acted in good faith. In any proceeding brought by or on behalf of any limited partner or the partnership, the person bringing or prosecuting such proceeding will have the burden of overcoming such presumption. These standards reduce the obligations to which our general partner would otherwise be held. | ||
In addition to the other more specific provisions limiting the obligations of our general partner, our partnership agreement further provides that our general partner and its officers and directors will not be liable for monetary damages to us or our limited partners for errors of judgment or for any acts or omissions unless there has been a final and non-appealable judgment by a court of competent jurisdiction determining that our general partner or its officers and directors acted in bad faith or engaged in fraud or willful misconduct. | ||
Rights and remedies of unitholders | The Delaware Act generally provides that a limited partner may institute legal action on behalf of the partnership to recover damages from a third party where a general partner has refused to institute the action or where an effort to cause a general partner to do so is not likely to succeed. In addition, the statutory or case law of some jurisdictions may permit a limited partner to institute legal action on behalf of himself and all other similarly situated limited partners to recover damages from a general partner for violations of its fiduciary duties to the limited partners. The |
| Delaware Act provides that, unless otherwise provided in a partnership agreement, a partner or other person shall not be liable to a limited partnership or to another partner or to another person that is a party to or is otherwise bound by a partnership agreement for breach of fiduciary duty for the partner's or other person's good faith reliance on the provisions of the partnership agreement Under our partnership agreement, to the extent that, at law or in equity an indemnitee has duties (including fiduciary duties) and liabilities relating thereto to us or to our partners, our general partner and any other indemnitee acting in connection with our business or affairs shall not be liable to us or to any partner for its good faith reliance on the provisions of our partnership agreement. |
By purchasing our common units, each common unitholder automatically agrees to be bound by the provisions in our partnership agreement, including the provisions discussed above. This is in accordance with the policy of the Delaware Act favoring the principle of freedom of contract and the enforceability of partnership agreements. The failure of a limited partner to sign a partnership agreement does not render the partnership agreement unenforceable against that person.
Under our partnership agreement, we must indemnify our general partner and its officers, directors, managers and certain other specified persons, to the fullest extent permitted by law, against liabilities, costs and expenses incurred by our general partner or these other persons. We must provide this indemnification unless there has been a final and non-appealable judgment by a court of competent jurisdiction determining that these persons acted in bad faith or engaged in fraud or willful misconduct. We must also provide this indemnification for criminal proceedings unless our general partner or these other persons acted with knowledge that their conduct was unlawful. Thus, our general partner could be indemnified for its negligent acts if it meets the requirements set forth above. To the extent these provisions purport to include indemnification for liabilities arising under the Securities Act in the opinion of the SEC, such indemnification is contrary to public policy and, therefore, unenforceable. Please read "The Partnership Agreement—Indemnification."
DESCRIPTION OF THE COMMON UNITS
The Units
The common units and the subordinated units are separate classes of limited partner interests in us. The holders of units are entitled to participate in partnership distributions and exercise the rights or privileges available to limited partners under our partnership agreement. For a description of the relative rights and preferences of holders of common and subordinated units in and to partnership distributions, please read this section and "Cash Distribution Policy and Restrictions on Distributions." For a description of other rights and privileges of limited partners under our partnership agreement, including voting rights, please read "The Partnership Agreement."
Transfer Agent and Registrar
Duties
Computershare Trust Company, N.A. will serve as the registrar and transfer agent for the common units. We will pay all fees charged by the transfer agent for transfers of common units except the following, which must be paid by unitholders:
There will be no charge to unitholders for disbursements of our cash distributions. We will indemnify the transfer agent, its agents and each of their stockholders, directors, officers and employees against all claims and losses that may arise out of acts performed or omitted for its activities in that capacity, except for any liability due to any gross negligence or intentional misconduct of the indemnified person or entity.
Resignation or Removal
The transfer agent may resign, by notice to us, or be removed by us. The resignation or removal of the transfer agent will become effective upon our appointment of a successor transfer agent and registrar and its acceptance of the appointment. If no successor is appointed, our general partner may act as the transfer agent and registrar until a successor is appointed.
Transfer of Common Units
The transfer of the common units to persons that purchase directly from the underwriters will be accomplished through the proper completion, execution and delivery of a transfer application by the investor. Any later transfers of a common unit will not be recorded by the transfer agent or recognized by us unless the transferee executes and delivers a properly completed transfer application. By executing and delivering a transfer application, the transferee of common units:
As used in this prospectus, an eligible citizen means a person or entity qualified to hold an interest in mineral leases on federal lands. As of the date hereof, an eligible citizen must be: (1) a citizen of the United States; (2) a corporation organized under the laws of the United States or of any state thereof; or (3) an association of U.S. citizens, such as a partnership or limited liability company, organized under the laws of the United States or of any state thereof, but only if such association does not have any direct or indirect foreign ownership, other than foreign ownership of stock in a parent corporation organized under the laws of the United States or of any state thereof.
A transferee that executes and delivers a properly completed transfer application will become a substituted limited partner of our partnership for the transferred common units automatically upon the recording of the transfer on our books and records. Our general partner will cause any transfers to be recorded on our books and records no less frequently than quarterly.
A transferee's broker, agent or nominee may, but is not obligated to, complete, execute and deliver a transfer application. We may, at our discretion, treat the nominee holder of a common unit as the absolute owner. In that case, the beneficial holder's rights are limited solely to those that it has against the nominee holder as a result of any agreement between the beneficial owner and the nominee holder.
Common units are securities and any transfers are subject to the laws governing the transfer of securities. In addition to other rights acquired upon transfer, the transferor gives the transferee the right to become a substituted limited partner in our partnership for the transferred common units. A purchaser or transferee of common units who does not execute and deliver a properly completed transfer application obtains only:
Thus, a purchaser or transferee of common units who does not execute and deliver a properly completed transfer application:
unless the common units are held in a nominee or "street name" account and the nominee or broker has executed and delivered a transfer application and certification as to itself and any beneficial holders.
The transferor does not have a duty to ensure the execution of the transfer application by the transferee and has no liability or responsibility if the transferee neglects or chooses not to execute and deliver a properly completed transfer application to the transfer agent. Please read "The Partnership Agreement—Status as Limited Partner."
Until a common unit has been transferred on our books, we and the transfer agent may treat the record holder of the unit as the absolute owner for all purposes, except as otherwise required by law or stock exchange regulations.
The following is a summary of the material provisions of our partnership agreement. The form of our partnership agreement is included in this prospectus as Appendix A. We will provide prospective investors with a copy of our partnership agreement upon request at no charge.
We summarize the following provisions of our partnership agreement elsewhere in this prospectus:
Organization and Duration
Our partnership was organized in April 2010 and will have a perpetual existence unless terminated pursuant to the terms of our partnership agreement.
Purpose
Our purpose, as set forth in our partnership agreement, is limited to any business activity that is approved by our general partner and that lawfully may be conducted by a limited partnership organized under Delaware law; provided that without the approval of unitholders holding at least 90% of the outstanding units (including units held by our general partner and its affiliates) voting as a single class, our general partner shall not cause us to take any action that the general partner determines would be reasonably likely to cause us to be treated as an association taxable as a corporation or otherwise taxable as an entity for federal income tax purposes.
Although our general partner has the ability to cause us and our subsidiaries to engage in activities other than the business of coal mining and marketing, our general partner may decline to do so free of any fiduciary duty or obligation whatsoever to us or the limited partners, including any duty to act in good faith or in the best interests of us or the limited partners. Our general partner is generally authorized to perform all acts it determines to be necessary or appropriate to carry out our purposes and to conduct our business.
Cash Distributions
Our partnership agreement specifies the manner in which we will make cash distributions to holders of our common units and other partnership securities as well as to our general partner in respect of its general partner interest and its incentive distribution rights. For a description of these cash distribution provisions, please read "Provisions of Our Partnership Agreement Relating to Cash Distributions."
Capital Contributions
Unitholders are not obligated to make additional capital contributions, except as described below under "—Limited Liability."
For a discussion of our general partner's right to contribute capital to maintain its 2.0% general partner interest if we issue additional units, please read "—Issuance of Additional Interests."
Voting Rights
The following is a summary of the unitholder vote required for approval of the matters specified below. Matters that require the approval of a "unit majority" require:
In voting their common and subordinated units, our general partner and its affiliates will have no fiduciary duty or obligation whatsoever to us or the limited partners, including any duty to act in good faith or in the best interests of us or the limited partners.
The incentive distribution rights may be entitled to vote in certain circumstances.
Issuance of additional units | No approval right. | |
Amendment of the partnership agreement | Certain amendments may be made by our general partner without the approval of the unitholders. Other amendments generally require the approval of a unit majority. Please read "—Amendment of the Partnership Agreement." | |
Merger of our partnership or the sale of all or substantially all of our assets | Unit majority in certain circumstances. Please read "—Merger, Consolidation, Conversion, Sale or Other Disposition of Assets." | |
Dissolution of our partnership | Unit majority. Please read "—Dissolution." | |
Continuation of our business upon dissolution | Unit majority. Please read "—Dissolution." |
Withdrawal of our general partner | Under most circumstances, the approval of a majority of the common units, excluding common units held by our general partner and its affiliates, is required for the withdrawal of our general partner prior to | |
Removal of our general partner | Not less than 662/3% of the outstanding units, voting as a single class, including units held by our general partner and its affiliates. Please read "—Withdrawal or Removal of Our General Partner." | |
Transfer of our general partner interest | Our general partner may transfer all, but not less than all, of its general partner interest in us without a vote of our unitholders to an affiliate or another person in connection with its merger or consolidation with or into, or sale of all or substantially all of its assets to, such person. The approval of a majority of the common units, excluding common units held by our general partner and its affiliates, is required in other circumstances for a transfer of the general partner interest to a third party prior to | |
Transfer of incentive distribution rights | No approval right. Please read "—Transfer of Incentive Distribution Rights." | |
Transfer of ownership interests in our general partner | No approval right. Please read "—Transfer of Ownership Interests in the General Partner." |
If any person or group other than our general partner and its affiliates acquires beneficial ownership of 20% or more of any class of units, that person or group loses voting rights on all of its units. This loss of voting rights does not apply to any person or group that acquires the units from our general partner or its affiliates and any transferees of that person or group approved by our general partner or to any person or group who acquires the units with the specific prior approval of our general partner.
Applicable Law; Forum, Venue and Jurisdiction
Our partnership agreement is governed by Delaware law. Our partnership agreement requires that any claims, suits, actions or proceedings:
shall be exclusively brought in the Court of Chancery of the State of Delaware, regardless of whether such claims, suits, actions or proceedings sound in contract, tort, fraud or otherwise, are based on common law, statutory, equitable, legal or other grounds, or are derivative or direct claims. By purchasing a common unit, a limited partner is irrevocably consenting to these limitations and provisions regarding claims, suits, actions or proceedings and submitting to the exclusive jurisdiction of the Court of Chancery of the State of Delaware in connection with any such claims, suits, actions or proceedings.
Limited Liability
Assuming that a limited partner does not participate in the control of our business within the meaning of the Delaware Act and that he otherwise acts in conformity with the provisions of the partnership agreement, his liability under the Delaware Act will be limited, subject to possible exceptions, to the amount of capital he is obligated to contribute to us for his common units plus his share of any undistributed profits and assets. However, if it were determined that the right, or exercise of the right, by the limited partners as a group:
constituted "participation in the control" of our business for the purposes of the Delaware Act, then the limited partners could be held personally liable for our obligations under the laws of Delaware, to the same extent as our general partner. This liability would extend to persons who transact business with us under the reasonable belief that the limited partner is a general partner. Neither our partnership agreement nor the Delaware Act specifically provides for legal recourse against our general partner if a limited partner were to lose limited liability through any fault of our general partner. While this does not mean that a limited partner could not seek legal recourse, we know of no precedent for this type of a claim in Delaware case law.
Under the Delaware Act, a limited partnership may not make a distribution to a partner if, after the distribution, all liabilities of the limited partnership, other than liabilities to partners on account of their partnership interests and liabilities for which the recourse of creditors is limited to specific property of the partnership, would exceed the fair value of the assets of the limited partnership. For the purpose of determining the fair value of the assets of a limited partnership, the Delaware Act provides that the fair value of property subject to liability for which recourse of creditors is limited shall be included in the assets of the limited partnership only to the extent that the fair value of that property exceeds the nonrecourse liability. The Delaware Act provides that a limited partner who receives a distribution and knew at the time of the distribution that the distribution was in violation of the Delaware Act shall be liable to the limited partnership for the amount of the distribution for three years.
Our subsidiaries conduct business in seven states and we may have subsidiaries that conduct business in other states or countries in the future. Maintenance of our limited liability as owner of our operating subsidiaries may require compliance with legal requirements in the jurisdictions in which the operating subsidiaries conduct business, including qualifying our subsidiaries to do business there.
Limitations on the liability of members or limited partners for the obligations of a limited liability company or limited partnership have not been clearly established in many jurisdictions. If, by virtue of our ownership interest in our subsidiaries or otherwise, it were determined that we were conducting business in any jurisdiction without compliance with the applicable limited partnership or limited liability company statute, or that the right or exercise of the right by the limited partners as a group to remove or replace our general partner, to approve some amendments to our partnership agreement, or to take other action under our partnership agreement constituted "participation in the control" of our business for purposes of the statutes of any relevant jurisdiction, then the limited partners could be held personally liable for our obligations under the law of that jurisdiction to the same extent as our general partner under the circumstances. We will operate in a manner that our general partner considers reasonable and necessary or appropriate to preserve the limited liability of the limited partners.
Issuance of Additional Interests
Our partnership agreement authorizes us to issue an unlimited number of additional partnership interests for the consideration and on the terms and conditions determined by our general partner without the approval of the unitholders.
It is possible that we will fund acquisitions through the issuance of additional common units, subordinated units or other partnership interests. Holders of any additional common units we issue will be entitled to share equally with the then-existing common unitholders in our distributions of available cash. In addition, the issuance of additional common units or other partnership interests may dilute the value of the interests of the then-existing common unitholders in our net assets.
In accordance with Delaware law and the provisions of our partnership agreement, we may also issue additional partnership interests that, as determined by our general partner, may have special voting rights to which the common units are not entitled. In addition, our partnership agreement does not prohibit our subsidiaries from issuing equity interests, which may effectively rank senior to the common units.
Upon issuance of additional partnership interests (other than the issuance of common units upon exercise by the underwriters of their option to purchase additional common units, the issuance of common units to Rhino Energy Holdings LLC upon expiration of the option to purchase additional common units, the issuance of partnership interests issued in connection with a reset of the incentive distribution target levels relating to our general partner's incentive distribution rights or the issuance of partnership interests upon conversion of outstanding partnership securities), our general partner will be entitled, but not required, to make additional capital contributions to the extent necessary to maintain its 2.0% general partner interest in us. Our general partner's 2.0% interest in us will be reduced if we issue additional units in the future and our general partner does not contribute a proportionate amount of capital to us to maintain its 2.0% general partner interest. Moreover, our general partner will have the right, which it may from time to time assign in whole or in part to any of its affiliates, to purchase common units, subordinated units or other partnership interests whenever, and on the same terms that, we issue partnership interests to persons other than our general partner and its affiliates, to the extent necessary to maintain the percentage interest of the general partner and
its affiliates, including such interest represented by common and subordinated units, that existed immediately prior to each issuance. The common unitholders will not have preemptive rights under our partnership agreement to acquire additional common units or other partnership interests.
Amendment of the Partnership Agreement
General
Amendments to our partnership agreement may be proposed only by our general partner. However, our general partner will have no duty or obligation to propose any amendment and may decline to do so free of any fiduciary duty or obligation whatsoever to us or the limited partners, including any duty to act in good faith or in the best interests of us or the limited partners. In order to adopt a proposed amendment, other than the amendments discussed below, our general partner is required to seek written approval of the holders of the number of units required to approve the amendment or to call a meeting of the limited partners to consider and vote upon the proposed amendment. Except as described below, an amendment must be approved by a unit majority.
Prohibited Amendments
No amendment may be made that would:
The provision of our partnership agreement preventing the amendments having the effects described in the clauses above can be amended upon the approval of the holders of at least 90.0% of the outstanding units, voting as a single class (including units owned by our general partner and its affiliates). Upon completion of the offering, an affiliate of our general partner will own approximately 84.9%86.9% of our outstanding common and subordinated units.
No Unitholder Approval
Our general partner may generally make amendments to our partnership agreement without the approval of any limited partner to reflect:
In addition, our general partner may make amendments to our partnership agreement, without the approval of any limited partner, if our general partner determines that those amendments:
Opinion of Counsel and Unitholder Approval
Any amendment that our general partner determines adversely affects in any material respect one or more particular classes of limited partners will require the approval of at least a majority of the class or classes so affected, but no vote will be required by any class or classes of limited partners that our general partner determines are not adversely affected in any material respect. Any amendment that would have a material adverse effect on the rights or preferences of any type or class of outstanding units in relation to other classes of units will require the approval of at least a majority of the type or class of units so affected. Any amendment that would reduce the voting percentage required to take any action other than to remove the general partner or call a meeting of unitholders is required to be approved by the affirmative vote of limited partners whose aggregate outstanding units constitute not less than the voting requirement sought to be reduced. Any amendment that would increase the percentage of units required to remove the general partner or call a meeting of unitholders must be approved by the affirmative vote of limited partners whose aggregate outstanding units constitute not less than the percentage sought to be increased. For amendments of the type not requiring unitholder approval, our general partner will not be required to obtain an opinion of counsel that an amendment will neither result in a loss of limited liability to the limited partners nor result in our being treated as a taxable entity for federal income tax purposes in connection with any of the amendments. No other amendments to our partnership agreement will become effective without the approval of holders of at least 90% of the outstanding units, voting as a single class, unless we first obtain an opinion of counsel to the effect that the amendment will not affect the limited liability under applicable law of any of our limited partners.
Merger, Consolidation, Conversion, Sale or Other Disposition of Assets
A merger, consolidation or conversion of us requires the prior consent of our general partner. However, our general partner will have no duty or obligation to consent to any merger, consolidation or conversion and may decline to do so free of any fiduciary duty or obligation whatsoever to us or the limited partners, including any duty to act in good faith or in the best interest of us or the limited partners.
In addition, our partnership agreement generally prohibits our general partner, without the prior approval of the holders of a unit majority, from causing us to sell, exchange or otherwise dispose of all or substantially all of our assets in a single transaction or a series of related transactions, including by way of merger, consolidation or other combination. Our general partner may, however, mortgage, pledge, hypothecate or grant a security interest in all or substantially all of our assets without such approval. Our general partner may also sell all or substantially all of our assets under a foreclosure or other realization upon those encumbrances without such approval. Finally, our general partner may consummate any merger without the prior approval of our unitholders if we are the surviving entity in the transaction, our general partner has received an opinion of counsel regarding limited liability and tax matters, the transaction would not result in a material amendment to the partnership agreement (other than an amendment that the general partner could adopt without the consent of other partners), each of our units will be an identical unit of our partnership following the transaction and the partnership securities to be issued do not exceed 20% of our outstanding partnership interests (other than incentive distribution rights) immediately prior to the transaction.
If the conditions specified in our partnership agreement are satisfied, our general partner may convert us or any of our subsidiaries into a new limited liability entity or merge us or any of our subsidiaries into, or convey all of our assets to, a newly formed entity, if the sole purpose of that conversion, merger or conveyance is to effect a mere change in our legal form into another limited liability entity, we have received an opinion of counsel regarding limited liability and tax matters and the governing instruments of the new entity provide the limited partners and our general partner with the same rights and obligations as contained in our partnership agreement. Our unitholders are not entitled to dissenters' rights of appraisal under our partnership agreement or applicable Delaware law in the event of a conversion, merger or consolidation, a sale of substantially all of our assets or any other similar transaction or event.
Dissolution
We will continue as a limited partnership until dissolved under our partnership agreement. We will dissolve upon:
Upon a dissolution under the last clause above, the holders of a unit majority may also elect, within specific time limitations, to continue our business on the same terms and conditions described in our partnership agreement by appointing as a successor general partner an entity approved by the holders of units representing a unit majority, subject to our receipt of an opinion of counsel to the effect that:
Liquidation and Distribution of Proceeds
Upon our dissolution, unless our business is continued, the liquidator authorized to wind up our affairs will, acting with all of the powers of our general partner that are necessary or appropriate, liquidate our assets and apply the proceeds of the liquidation as described in "Provisions of Our Partnership Agreement Relating to Cash Distributions—Distributions of Cash Upon Liquidation." The liquidator may defer liquidation or distribution of our assets for a reasonable period of time or distribute assets to partners in kind if it determines that a sale would be impractical or would cause undue loss to our partners.
Withdrawal or Removal of Our General Partner
Except as described below, our general partner has agreed not to withdraw voluntarily as our general partner prior to JuneSeptember 30, 2020 without obtaining the approval of the holders of at least a majority of the outstanding common units, excluding common units held by our general partner and its affiliates, and furnishing an opinion of counsel regarding limited liability and tax matters. On or after JuneSeptember 30, 2020, our general partner may withdraw as general partner without first obtaining approval of any unitholder by giving 90 days' written notice, and that withdrawal will not constitute a violation of our partnership agreement. Notwithstanding the information above, our general partner may withdraw without unitholder approval upon 90 days' notice to the limited partners if at least 50% of the outstanding common units are held or controlled by one person and its affiliates, other than our general partner and its affiliates. In addition, our partnership agreement permits our general partner, in some instances, to sell or otherwise transfer all of its general partner interest in us without the approval of the unitholders. Please read "—Transfer of General Partner Interest."
Upon withdrawal of our general partner under any circumstances, other than as a result of a transfer by our general partner of all or a part of its general partner interest in us, the holders of a unit majority may select a successor to that withdrawing general partner. If a successor is not elected, or is elected but an opinion of counsel regarding limited liability and tax matters cannot be obtained, we will be dissolved, wound up and liquidated, unless within a specified period after that withdrawal, the holders of a unit majority agree in writing to continue our business and to appoint a successor general partner. Please read "—Dissolution."
Our general partner may not be removed unless that removal is approved by the vote of the holders of not less than 662/3% of the outstanding units, voting together as a single class, including units held by our general partner and its affiliates, and we receive an opinion of counsel regarding limited liability and tax matters. Any removal of our general partner is also subject to the approval of a successor general partner by the vote of the holders of a majority of the outstanding common units, voting as a class, and the outstanding subordinated units, voting as a class. The ownership of more than 331/3% of the outstanding units by our general partner and its affiliates gives them the ability to prevent our general partner's removal. At the closing of this offering, an affiliate of our general partner will own 84.9%86.9% of our outstanding common and subordinated units.
Our partnership agreement also provides that if our general partner is removed as our general partner under circumstances where cause does not exist:
In the event of the removal of our general partner under circumstances where cause exists or withdrawal of our general partner where that withdrawal violates our partnership agreement, a successor general partner will have the option to purchase the general partner interest and incentive distribution rights of the departing general partner and its affiliates for a cash payment equal to the fair market value of those interests. Under all other circumstances where our general partner withdraws or is removed by the limited partners, the departing general partner will have the option to require the successor general partner to purchase the general partner interest and
the incentive distribution rights of the departing general partner and its affiliates for fair market value. In each case, this fair market value will be determined by agreement between the departing general partner and the successor general partner. If no agreement is reached, an independent investment banking firm or other independent expert selected by the departing general partner and the successor general partner will determine the fair market value. Or, if the departing general partner and the successor general partner cannot agree upon an expert, then an expert chosen by agreement of the experts selected by each of them will determine the fair market value.
If the option described above is not exercised by either the departing general partner or the successor general partner, the departing general partner's general partner interest and all its and its affiliates' incentive distribution rights will automatically convert into common units equal to the fair market value of those interests as determined by an investment banking firm or other independent expert selected in the manner described in the preceding paragraph.
In addition, we will be required to reimburse the departing general partner for all amounts due the departing general partner, including, without limitation, all employee-related liabilities, including severance liabilities, incurred as a result of the termination of any employees employed for our benefit by the departing general partner or its affiliates.
Transfer of General Partner Interest
Except for transfer by our general partner of all, but not less than all, of its general partner interest to:
our general partner may not transfer all or any of its general partner interest to another person prior to JuneSeptember 30, 2020 without the approval of the holders of at least a majority of the outstanding common units, excluding common units held by our general partner and its affiliates. As a condition of this transfer, the transferee must, among other things, assume the rights and duties of our general partner, agree to be bound by the provisions of our partnership agreement and furnish an opinion of counsel regarding limited liability and tax matters.
Our general partner and its affiliates may, at any time, transfer common units or subordinated units to one or more persons, without unitholder approval, except that they may not transfer subordinated units to us.
Transfer of Ownership Interests in the General Partner
At any time, the owners of our general partner may sell or transfer all or part of its ownership interests in our general partner to an affiliate or third party without the approval of our unitholders.
Transfer of Subordinated Units and Incentive Distribution Rights
By transfer of subordinated units or incentive distribution rights in accordance with our partnership agreement, each transferee of subordinated units or incentive distribution rights will be admitted as a limited partner with respect to the subordinated units or incentive distribution
rights transferred when such transfer and admission is reflected in our books and records. Each transferee:
Our general partner will cause any transfers to be recorded on our books and records no less frequently than quarterly.
We may, at our discretion, treat the nominee holder of subordinated units or incentive distribution rights as the absolute owner. In that case, the beneficial holder's rights are limited solely to those that it has against the nominee holder as a result of any agreement between the beneficial owner and the nominee holder.
Subordinated units or incentive distribution rights are securities and any transfers are subject to the laws governing transfer of securities. In addition to other rights acquired upon transfer, the transferor gives the transferee the right to become a limited partner for the transferred subordinated units or incentive distribution rights.
Until a subordinated unit or incentive distribution right has been transferred on our books, we and the transfer agent may treat the record holder of the unit or right as the absolute owner for all purposes, except as otherwise required by law or stock exchange regulations.
Change of Management Provisions
Our partnership agreement contains specific provisions that are intended to discourage a person or group from attempting to remove Rhino GP LLC as our general partner or from otherwise changing our management. Please read "—Withdrawal or Removal of Our General Partner" for a discussion of certain consequences of the removal of our general partner. If any person or group, other than our general partner and its affiliates, acquires beneficial ownership of 20% or more of any class of units, that person or group loses voting rights on all of its units. This loss of voting rights does not apply in certain circumstances. Please read "—Meetings; Voting."
Limited Call Right
If at any time our general partner and its affiliates own more than 90% of the then-issued and outstanding limited partner interests of any class, our general partner will have the right, which it may assign in whole or in part to any of its affiliates or beneficial owners or to us, to acquire all, but not less than all, of the limited partner interests of the class held by unaffiliated persons, as of a record date to be selected by our general partner, on at least 10, but not more than 60, days notice. If our general partner and its affiliates reduce their ownership percentage to below 70% of the outstanding common units, the ownership threshold to exercise the limited
call right will be reduced to 80%. The purchase price in the event of this purchase is the greater of:
As a result of our general partner's right to purchase outstanding limited partner interests, a holder of limited partner interests may have his limited partner interests purchased at an undesirable time or at a price that may be lower than market prices at various times prior to such purchase or lower than a unitholder may anticipate the market price to be in the future. The tax consequences to a unitholder of the exercise of this call right are the same as a sale by that unitholder of his common units in the market. Please read "Material Tax Consequences—Disposition of Common Units."
Non-Taxpaying Holders; Redemption
To avoid any adverse effect on the maximum applicable rates chargeable to customers by our subsidiaries, or in order to reverse an adverse determination that has occurred regarding such maximum rate, our partnership agreement provides our general partner the power to amend the agreement. If our general partner, with the advice of counsel, determines that our not being treated as an association taxable as a corporation or otherwise taxable as an entity for U.S. federal income tax purposes, coupled with the tax status (or lack of proof thereof) of one or more of our limited partners, has, or is reasonably likely to have, a material adverse effect on the maximum applicable rates chargeable to customers by our subsidiaries, then our general partner may adopt such amendments to our partnership agreement as it determines necessary or advisable to:
Ineligible Citizens; Redemption
To comply with certain U.S. laws relating to the ownership of interests in mineral leases on federal lands, investors (including purchasers from the underwriters in this offering) are required to fill out a properly completed transfer application certifying, and our general partner, acting on our behalf, may at any time require each unitholder to re-certify that the unitholder is an eligible citizen (meaning a person or entity qualified to hold an interest in mineral leases on federal lands). As of the date of this prospectus, an eligible citizen must be: (1) a citizen of the United States; (2) a corporation organized under the laws of the United States or of any state thereof; or (3) an association of U.S. citizens, such as a partnership or limited liability company, organized under the laws of the United States or of any state thereof, but only if such association does not
have any direct or indirect foreign ownership, other than foreign ownership of stock in a parent corporation organized under the laws of the United States or of any state thereof. For the avoidance of doubt, onshore mineral leases or any direct or indirect interest therein may be acquired and held by aliens only through stock ownership, holding, or control in a corporation organized under the laws of the United States or of any state thereof and only for so long as the alien is not from a country that the U.S. federal government regards as denying similar privileges to citizens or corporations of the United States. This certification can be changed in any manner our general partner determines is necessary or appropriate to implement its original purpose.
If a transferee or unitholder, as the case may be:
then, as the case may be, such transfer will, to the fullest extent permitted by law, be void or we will have the right to acquire all but not less than all of the units held by such unitholder. Further, the units will not be entitled to any voting rights while held by such unitholder.
The purchase price will be paid in cash or by delivery of a promissory note, as determined by our general partner. Any such promissory note will bear interest at the rate of 5% annually and be payable in three equal annual installments of principal and accrued interest, commencing one year after the redemption date.
Meetings; Voting
Except as described below regarding a person or group owning 20% or more of any class of units then outstanding, record holders of units on the record date will be entitled to notice of, and to vote at, meetings of our limited partners and to act upon matters for which approvals may be solicited.
Our general partner does not anticipate that any meeting of our unitholders will be called in the foreseeable future. Any action that is required or permitted to be taken by the unitholders may be taken either at a meeting of the unitholders or without a meeting if consents in writing describing the action so taken are signed by holders of the number of units necessary to authorize or take that action at a meeting. Meetings of the unitholders may be called by our general partner or by unitholders owning at least 20% of the outstanding units of the class for which a meeting is proposed. Unitholders may vote either in person or by proxy at meetings. The holders of a majority of the outstanding units of the class or classes for which a meeting has been called, represented in person or by proxy, will constitute a quorum, unless any action by the unitholders requires approval by holders of a greater percentage of the units, in which case the quorum will be the greater percentage.
Each record holder of a unit has a vote according to his percentage interest in us, although additional limited partner interests having special voting rights could be issued. Please read "—Issuance of Additional Interests." However, if at any time any person or group, other than our general partner and its affiliates, or a direct or subsequently approved transferee of our general partner or its affiliates and purchasers specifically approved by our general partner, acquires, in the aggregate, beneficial ownership of 20% or more of any class of units then outstanding, that person or group will lose voting rights on all of its units and the units may not be voted on any
matter and will not be considered to be outstanding when sending notices of a meeting of unitholders, calculating required votes, determining the presence of a quorum or for other similar purposes. Common units held in nominee or street name account will be voted by the broker or other nominee in accordance with the instruction of the beneficial owner unless the arrangement between the beneficial owner and his nominee provides otherwise. Except as our partnership agreement otherwise provides, subordinated units will vote together with common units, as a single class.
Any notice, demand, request, report or proxy material required or permitted to be given or made to record common unitholders under our partnership agreement will be delivered to the record holder by us or by the transfer agent.
Voting Rights of Incentive Distribution Rights
If a majority of the incentive distribution rights are held by our general partner and its affiliates, the holders of the incentive distribution rights will have no right to vote in respect of such rights on any matter, unless otherwise required by law, and the holders of the incentive distribution rights shall be deemed to have approved any matter approved by our general partner.
If less than a majority of the incentive distribution rights are held by our general partner and its affiliates, the incentive distribution rights will be entitled to vote on all matters submitted to a vote of unitholders, other than amendments and other matters that our general partner determines do not adversely affect the holders of the incentive distribution rights in any material respect. On any matter in which the holders of incentive distribution rights are entitled to vote, such holders will vote together with the subordinated units, prior to the end of the subordination period, or together with the common units, thereafter, in either case as a single class. The relative voting power of the holders of the incentive distribution rights and the subordinated units or common units, depending on which class the holders of incentive distribution rights are voting with, will be set in the same proportion as cumulative cash distributions, if any, in respect of the incentive distribution rights for the four consecutive quarters prior to the record date for the vote bears to the cumulative cash distributions in respect of such class of units for such four quarters.
Status as Limited Partner
By transfer of common units in accordance with our partnership agreement, each transferee of common units shall be admitted as a limited partner with respect to the common units transferred when such transfer and admission are reflected in our books and records. Except as described under "—Limited Liability," the common units will be fully paid, and unitholders will not be required to make additional contributions.
Indemnification
Under our partnership agreement, in most circumstances, we will indemnify the following persons, to the fullest extent permitted by law, from and against all losses, claims, damages or similar events:
Any indemnification under these provisions will only be out of our assets. Unless our general partner otherwise agrees, it will not be personally liable for, or have any obligation to contribute or lend funds or assets to us to enable us to effectuate, indemnification. We may purchase insurance against liabilities asserted against and expenses incurred by persons for our activities, regardless of whether we would have the power to indemnify the person against liabilities under our partnership agreement.
Reimbursement of Expenses
Our partnership agreement requires us to reimburse our general partner for all direct and indirect expenses it incurs or payments they make on our behalf and all other expenses allocable to us or otherwise incurred by our general partner in connection with operating our business. Our partnership agreement does not set a limit on the amount of expenses for which our general partner and its affiliates may be reimbursed. These expenses include salary, bonus, incentive compensation and other amounts paid to persons who perform services for us or on our behalf and expenses allocated to our general partner by its affiliates. Our general partner is entitled to determine the expenses that are allocable to us.
Books and Reports
Our general partner is required to keep appropriate books of our business at our principal offices. These books will be maintained for both tax and financial reporting purposes on an accrual basis. For tax and fiscal reporting purposes, our fiscal year is the calendar year.
We will furnish or make available to record holders of our common units, within 90 days after the close of each fiscal year, an annual report containing audited consolidated financial statements and a report on those consolidated financial statements by our independent public accountants. Except for our fourth quarter, we will also furnish or make available summary financial information within 45 days after the close of each quarter. We will be deemed to have made any such report available if we file such report with the SEC on EDGAR or make the report available on a publicly available website which we maintain.
We will furnish each record holder with information reasonably required for U.S. federal and state tax reporting purposes within 90 days after the close of each calendar year. This information is expected to be furnished in summary form so that some complex calculations normally required of partners can be avoided. Our ability to furnish this summary information to our unitholders will depend on their cooperation in supplying us with specific information. Every unitholder will receive information to assist him in determining his U.S. federal and state
tax liability and in filing his U.S. federal and state income tax returns, regardless of whether he supplies us with the necessary information.
Right to Inspect Our Books and Records
Our partnership agreement provides that a limited partner can, for a purpose reasonably related to his interest as a limited partner, upon reasonable written demand stating the purpose of such demand and at his own expense, have furnished to him:
Our general partner may, and intends to, keep confidential from the limited partners trade secrets or other information the disclosure of which our general partner believes in good faith is not in our best interests or that we are required by law or by agreements with third parties to keep confidential.
Registration Rights
Under our partnership agreement, we have agreed to register for resale under the Securities Act and applicable state securities laws any common units, subordinated units or other limited partner interests proposed to be sold by our general partner or any of its affiliates or their assignees if an exemption from the registration requirements is not otherwise available. These registration rights continue for two years following any withdrawal or removal of our general partner. We are obligated to pay all expenses incidental to the registration, excluding underwriting discounts.
In addition, in connection with this offering, we expect to enter into a registration rights agreement with Rhino Energy Holdings LLC. Pursuant to the registration rights agreement, we will be required to file a registration statement to register the common units and subordinated units issued to Rhino Energy Holdings LLC and the common units issuable upon the conversion of the subordinated units upon request of Rhino Energy Holdings LLC. In addition, the registration rights agreement gives Rhino Energy Holdings LLC piggyback registration rights under certain circumstances. The registration rights agreement also includes provisions dealing with holdback agreements, indemnification and contribution and allocation of expenses. These registration rights are transferable to affiliates of Rhino Energy Holdings LLC and, in certain circumstances, to third parties. See "Units Eligible for Future Sale."
UNITS ELIGIBLE FOR FUTURE SALE
After the sale of the common units offered by this prospectus, Wexford will hold an aggregate of 8,647,0009,153,000 common units and 12,397,000 subordinated units. All of the subordinated units will convert into common units at the end of the subordination period. The sale of these common and subordinated units could have an adverse impact on the price of the common units or on any trading market that may develop.
Our common units sold in this offering will generally be freely transferable without restriction or further registration under the Securities Act, except that any common units held by an "affiliate" of ours may not be resold publicly except in compliance with the registration requirements of the Securities Act or under an exemption under Rule 144 or otherwise. Rule 144 permits securities acquired by an affiliate of the issuer to be sold into the market in an amount that does not exceed, during any three-month period, the greater of:
Sales under Rule 144 are also subject to specific manner of sale provisions, holding period requirements, notice requirements and the availability of current public information about us. A person who is not deemed to have been an affiliate of ours at any time during the three months preceding a sale, and who has beneficially owned our common units for at least six months (provided we are in compliance with the current public information requirement), or one year (regardless of whether we are in compliance with the current public information requirement), would be entitled to sell those common units under Rule 144, subject only to the current public information requirement. After beneficially owning Rule 144 restricted units for at least one year, a person who is not deemed to have been an affiliate of ours at any time during the 90 days preceding a sale would be entitled to freely sell those common units without regard to the public information requirements, volume limitations, manner of sale provisions and notice requirements of Rule 144.
Our partnership agreement provides that we may issue an unlimited number of limited partner interests of any type without a vote of the unitholders at any time. Any issuance of additional common units or other equity securities would result in a corresponding decrease in the proportionate ownership interest in us represented by, and could adversely affect the cash distributions to and market price of, common units then outstanding. Please read "The Partnership Agreement—Issuance of Additional Interests."
Under our partnership agreement and the registration rights agreement that we expect to enter into, our general partner and its affiliates will have the right to cause us to register under the Securities Act and applicable state securities laws the offer and sale of any units that they hold. Subject to the terms and conditions of the partnership agreement and the registration rights agreement, these registration rights allow our general partner and its affiliates or their assignees holding any units to require registration of any of these units and to include any of these units in a registration by us of other units, including units offered by us or by any unitholder. Our general partner and its affiliates will continue to have these registration rights for two years following its withdrawal or removal as our general partner. In connection with any registration of this kind, we will indemnify each unitholder participating in the registration and its officers, directors, and controlling persons from and against any liabilities under the Securities Act or any applicable state securities laws arising from the registration statement or prospectus. We will
bear all costs and expenses incidental to any registration, excluding any underwriting discount. Except as described below, our general partner and its affiliates may sell their units in private transactions at any time, subject to compliance with applicable laws.
The executive officers and directors of our general partner and Rhino Energy Holdings LLC have agreed not to sell any common units they beneficially own for a period of 180 days from the date of this prospectus. Please read "Underwriting" for a description of these lock-up provisions.
This section is a summary of the material federal income tax considerations that may be relevant to prospective unitholders who are individual citizens or residents of the United States and, unless otherwise noted in the following discussion, is the opinion of Vinson & Elkins L.L.P., counsel to our general partner and us, insofar as it relates to legal conclusions with respect to matters of U.S. federal income tax law. This section is based upon current provisions of the Internal Revenue Code of 1986, as amended, or the Internal Revenue Code, existing and proposed Treasury Regulations promulgated under the Internal Revenue Code (the "Treasury Regulations") and current administrative rulings and court decisions, all of which are subject to change. Later changes in these authorities may cause the tax consequences to vary substantially from the consequences described below. Unless the context otherwise requires, references in this section to "us" or "we" are references to Rhino Resource Partners LP and our operating company.
The following discussion does not comment on all federal income tax matters affecting us or the unitholders. Moreover, the discussion focuses on unitholders who are individual citizens or residents of the United States and has only limited application to corporations, estates, trusts, nonresident aliens or other unitholders subject to specialized tax treatment, such as tax-exempt institutions, foreign persons, individual retirement accounts (IRAs), real estate investment trusts (REITs) or mutual funds. Accordingly, we urge each prospective unitholder to consult, and depend on, his own tax advisor in analyzing the federal, state, local and foreign tax consequences particular to him of the ownership or disposition of common units.
No ruling has been or will be requested from the IRS regarding any matter affecting us or prospective unitholders. Instead, we will rely on opinions of Vinson & Elkins L.L.P. Unlike a ruling, an opinion of counsel represents only that counsel's best legal judgment and does not bind the IRS or the courts. Accordingly, the opinions and statements made here may not be sustained by a court if contested by the IRS. Any contest of this sort with the IRS may materially and adversely impact the market for the common units and the prices at which common units trade. In addition, the costs of any contest with the IRS, principally legal, accounting and related fees, will result in a reduction in cash available for distribution to our unitholders and our general partner and thus will be borne indirectly by our unitholders and our general partner. Furthermore, the tax treatment of us, or of an investment in us, may be significantly modified by future legislative or administrative changes or court decisions. Any modifications may or may not be retroactively applied.
All statements as to matters of law and legal conclusions, but not as to factual matters, contained in this section, unless otherwise noted, are the opinion of Vinson & Elkins L.L.P. and are based on the accuracy of the representations made by us.
For the reasons described below, Vinson & Elkins L.L.P. has not rendered an opinion with respect to the following specific federal income tax issues: (1) the treatment of a unitholder whose common units are loaned to a short seller to cover a short sale of common units (please read "—Tax Consequences of Unit Ownership—Treatment of Short Sales"); (2) whether our monthly convention for allocating taxable income and losses is permitted by existing Treasury Regulations (please read "—Disposition of Common Units—Allocations Between Transferors and Transferees"); (3) whether our method for depreciating Section 743 adjustments is sustainable in certain cases (please read "—Tax Consequences of Unit Ownership—Section 754 Election") and (4) the treatment of assignees of common units who are entitled, but fail, to execute and deliver transfer applications (please read "—Limited Partner Status").
Partnership Status
A partnership is not a taxable entity and incurs no federal income tax liability. Instead, each partner of a partnership is required to take into account his share of items of income, gain, loss and deduction of the partnership in computing his federal income tax liability, regardless of whether cash distributions are made to him by the partnership. Distributions by a partnership to a partner are generally not taxable to the partnership or the partner unless the amount of cash distributed to him is in excess of the partner's adjusted basis in his partnership interest.
Section 7704 of the Internal Revenue Code provides that publicly traded partnerships will, as a general rule, be taxed as corporations. However, an exception, referred to as the "Qualifying Income Exception," exists with respect to publicly traded partnerships of which 90% or more of the gross income for every taxable year consists of "qualifying income." Qualifying income includes income and gains derived from the mining, transportation and marketing of minerals and natural resources, such as coal and limestone. Other types of qualifying income include interest (other than from a financial business), dividends, gains from the sale of real property and gains from the sale or other disposition of capital assets held for the production of income that otherwise constitutes qualifying income. We estimate that less than 4.0% of our current gross income is not qualifying income; however, this estimate could change from time to time. Based upon and subject to this estimate, the factual representations made by us and our general partner and a review of the applicable legal authorities, Vinson & Elkins L.L.P. is of the opinion that at least 90% of our current gross income constitutes qualifying income. The portion of our income that is qualifying income may change from time to time.
No ruling has been or will be sought from the IRS and the IRS has made no determination as to our status for federal income tax purposes or whether our operations generate "qualifying income" under Section 7704 of the Internal Revenue Code. Instead, we will rely on the opinion of Vinson & Elkins L.L.P. on such matters. It is the opinion of Vinson & Elkins that, based upon the Internal Revenue Code, its regulations, published revenue rulings and court decisions and the representations described below, we will be classified as a partnership and our non-corporate operating companies will be treated as partnerships or will be disregarded as entities separate from us for federal income tax purposes.
In rendering its opinion, Vinson & Elkins L.L.P. has relied on factual representations made by us and our general partner. The representations made by us and our general partner upon which Vinson & Elkins L.L.P. has relied include:
We believe that these representations have been true in the past and expect that these representations will continue to be true in the future.
If we fail to meet the Qualifying Income Exception, other than a failure that is determined by the IRS to be inadvertent and that is cured within a reasonable time after discovery (in which case the IRS may also require us to make adjustments with respect to our unitholders or pay other amounts), we will be treated as if we had transferred all of our assets, subject to liabilities, to a newly formed corporation, on the first day of the year in which we fail to meet the
Qualifying Income Exception, in return for stock in that corporation, and then distributed that
stock to the unitholders in liquidation of their interests in us. This deemed contribution and liquidation should be tax-free to unitholders and us so long as we, at that time, do not have liabilities in excess of the tax basis of our assets. Thereafter, we would be treated as a corporation for federal income tax purposes.
If we were treated as an association taxable as a corporation in any taxable year, either as a result of a failure to meet the Qualifying Income Exception or otherwise, our items of income, gain, loss and deduction would be reflected only on our tax return rather than being passed through to the unitholders, and our net income would be taxed to us at corporate rates. In addition, any distribution made to a unitholder would be treated as taxable dividend income, to the extent of our current or accumulated earnings and profits, and, in the absence of earnings and profits, a nontaxable return of capital, to the extent of the unitholder's tax basis in his common units, or taxable capital gain, after the unitholder's tax basis in his common units is reduced to zero. Accordingly, taxation as a corporation would result in a material reduction in a unitholder's cash flow and after-tax return and thus would likely result in a substantial reduction of the value of the units.
The discussion below is based on Vinson & Elkins L.L.P.'s opinion that we will be classified as a partnership for federal income tax purposes.
Limited Partner Status
Unitholders who have become limited partners of Rhino Resource Partners LP will be treated as partners of Rhino Resource Partners LP for federal income tax purposes. Also:
As there is no direct or indirect controlling authority addressing assignees of common units who are entitled to execute and deliver transfer applications and thereby become entitled to direct the exercise of attendant rights, but who fail to execute and deliver transfer applications, Vinson & Elkins L.L.P.'s opinion does not extend to these persons. Furthermore, a purchaser or other transferee of common units who does not execute and deliver a transfer application may not receive some federal income tax information or reports furnished to record common unitholders unless the common units are held in a nominee or street name account and the nominee or broker has executed and delivered a transfer application for those common units.
A beneficial owner of common units whose units have been transferred to a short seller to complete a short sale would appear to lose his status as a partner with respect to those units for federal income tax purposes. Please read "—Tax Consequences of Unit Ownership—Treatment of Short Sales."
Income, gain, deductions or losses would not appear to be reportable by a unitholder who is not a partner for federal income tax purposes, and any cash distributions received by a unitholder who is not a partner for federal income tax purposes would therefore appear to be
fully taxable as ordinary income. These holders are urged to consult their own tax advisors with respect to their tax consequences of holding common units in Rhino Resource Partners LP.
Tax Consequences of Unit Ownership
Flow-Through of Taxable Income
Subject to the discussion below under "—Entity-Level Collections," we will not pay any federal income tax. Instead, each unitholder will be required to report on his income tax return his share of our income, gains, losses and deductions without regard to whether we make cash distributions to him. Consequently, we may allocate income to a unitholder even if he has not received a cash distribution. Each unitholder will be required to include in income his allocable share of our income, gains, losses and deductions for our taxable year ending with or within his taxable year. Our taxable year ends on December 31.
Treatment of Distributions
Distributions by us to a unitholder generally will not be taxable to the unitholder for federal income tax purposes, except to the extent the amount of any cash distribution exceeds his tax basis in his common units immediately before the distribution. Our cash distributions in excess of a unitholder's tax basis generally will be considered to be gain from the sale or exchange of the common units, taxable in accordance with the rules described under "—Disposition of Common Units" below. Any reduction in a unitholder's share of our liabilities for which no partner, including our general partner, bears the economic risk of loss, known as "nonrecourse liabilities," will be treated as a distribution of cash to that unitholder. To the extent our distributions cause a unitholder's "at risk" amount to be less than zero at the end of any taxable year, he must recapture any losses deducted in previous years. Please read "—Limitations on Deductibility of Losses."
A decrease in a unitholder's percentage interest in us because of our issuance of additional common units will decrease his share of our nonrecourse liabilities, and thus will result in a corresponding deemed distribution of cash. This deemed distribution may constitute a non-pro rata distribution. A non-pro rata distribution of money or property may result in ordinary income to a unitholder, regardless of his tax basis in his common units, if the distribution reduces the unitholder's share of our "unrealized receivables," which includes depreciation and depletion recapture, and/or substantially appreciated "inventory items," both as defined in the Internal Revenue Code, and collectively, "Section 751 Assets." To that extent, he will be treated as having been distributed his proportionate share of the Section 751 Assets and having exchanged those assets with us in return for the non-pro rata portion of the actual distribution made to him. This latter deemed exchange will generally result in the unitholder's realization of ordinary income, which will equal the excess of (1) the non-pro rata portion of that distribution over (2) the unitholder's tax basis (generally zero) for the share of Section 751 Assets deemed relinquished in the exchange.
Ratio of Taxable Income to Distributions
We estimate that a purchaser of common units in this offering who owns those common units from the date of closing of this offering through the record date for distributions for the period ending December 31, 2012, will be allocated, on a cumulative basis, an amount of federal taxable income for that period that will be approximately 40.0% of the cash distributed with respect to that period. Thereafter, the ratio of allocable taxable income to cash distributions to the unitholders could substantially increase. These estimates are based upon the assumption that
gross income from operations will approximate the amount required to make the minimum quarterly distribution on all units and other assumptions with respect to capital expenditures, cash flow, net working capital, distribution coverage ratio and anticipated cash distributions. These estimates and assumptions are subject to, among other things, numerous business,
economic, regulatory, legislative, competitive and political uncertainties beyond our control. Further, the estimates are based on current tax law and tax reporting positions that we will adopt and with which the IRS could disagree. Accordingly, we cannot assure you that these estimates will prove to be correct. The actual percentage of distributions relative to taxable income could be higher or lower than expected, and any differences could be material and could materially affect the value of the common units. For example, the ratio of allocable taxable income to cash distributions to a purchaser of common units in this offering will be greater, and perhaps substantially greater, than our estimate with respect to the period described above if:
Basis of Common Units
A unitholder's initial tax basis for his common units will be the amount he paid for the common units plus his share of our nonrecourse liabilities. That basis will be increased by his share of our income and by any increases in his share of our nonrecourse liabilities. That basis will be decreased, but not below zero, by distributions from us, by the unitholder's share of our losses, by any decreases in his share of our nonrecourse liabilities and by his share of our expenditures that are not deductible in computing taxable income and are not required to be capitalized. A unitholder will have no share of our debt that is recourse to our general partner, but will have a share, generally based on his share of profits, of our nonrecourse liabilities. Please read "—Disposition of Common Units—Recognition of Gain or Loss."
Limitations on Deductibility of Losses
The deduction by a unitholder of his share of our losses will be limited to the tax basis in his units and, in the case of an individual unitholder or a corporate unitholder, if more than 50% of the value of the corporate unitholder's stock is owned directly or indirectly by five or fewer individuals or some tax-exempt organizations, to the amount for which the unitholder is considered to be "at risk" with respect to our activities, if that is less than his tax basis. A unitholder subject to these limitations must recapture losses deducted in previous years to the extent that distributions cause his at risk amount to be less than zero at the end of any taxable year. Losses disallowed to a unitholder or recaptured as a result of these limitations will carry forward and will be allowable as a deduction to the extent that his at-risk amount is subsequently increased, so long as such losses do not exceed such common unitholders' tax
basis in his common units. Upon the taxable disposition of a unit, any gain recognized by a unitholder can be offset by losses that were previously suspended by the at risk limitation but may not be offset by losses suspended by the basis limitation. Any excess loss above that gain previously suspended by the at risk or basis limitations is no longer utilizable.
In general, a unitholder will be at risk to the extent of the tax basis of his units, excluding any portion of that basis attributable to his share of our nonrecourse liabilities, reduced by (1) any portion of that basis representing amounts otherwise protected against loss because of a guarantee, stop loss agreement or other similar arrangement and (2) any amount of money he borrows to acquire or hold his units, if the lender of those borrowed funds owns an interest in us, is related to another unitholder who has an interest in us or can look only to the units for repayment. A unitholder's at-risk amount will increase or decrease as the tax basis of the unitholder's units increases or decreases, other than tax basis increases or decreases attributable to increases or decreases in his share of our nonrecourse liabilities.
In addition to the basis and at-risk limitations on the deductibility of losses, the passive loss limitations generally provide that individuals, estates, trusts and some closely-held corporations and personal service corporations can deduct losses from passive activities, which are generally trade or business activities in which the taxpayer does not materially participate, only to the extent of the taxpayer's income from those passive activities. The passive loss limitations are applied separately with respect to each publicly traded partnership. Consequently, any passive losses we generate will only be available to offset our passive income generated in the future and will not be available to offset income from other passive activities or investments, including our investments or investments in other publicly traded partnerships, or salary or active business income. Passive losses that are not deductible because they exceed a unitholder's share of income we generate may be deducted in full when he disposes of his entire investment in us in a fully taxable transaction with an unrelated party. The passive activity loss rules are applied after other applicable limitations on deductions, including the at risk rules and the basis limitation.
A unitholder's share of our net income may be offset by any of our suspended passive losses, but it may not be offset by any other current or carryover losses from other passive activities, including those attributable to other publicly traded partnerships.
Limitations on Interest Deductions
The deductibility of a non-corporate taxpayer's "investment interest expense" is generally limited to the amount of that taxpayer's "net investment income." Investment interest expense includes:
The computation of a unitholder's investment interest expense will take into account interest on any margin account borrowing or other loan incurred to purchase or carry a unit. Net investment income includes gross income from property held for investment and amounts treated as portfolio income under the passive loss rules, less deductible expenses, other than interest, directly connected with the production of investment income, but generally does not
include gains attributable to the disposition of property held for investment or qualified dividend income. The IRS has indicated that net passive income earned by a publicly traded partnership will be treated as investment income to its unitholders. In addition, the unitholder's share of our portfolio income will be treated as investment income.
Entity-Level Collections
If we are required or elect under applicable law to pay any federal, state, local or foreign income tax on behalf of any unitholder or our general partner or any former unitholder, we are authorized to pay those taxes from our funds. That payment, if made, will be treated as a distribution of cash to the unitholder on whose behalf the payment was made. If the payment is made on behalf of a person whose identity cannot be determined, we are authorized to treat the payment as a distribution to all current unitholders. We are authorized to amend our partnership agreement in the manner necessary to maintain uniformity of intrinsic tax characteristics of units and to adjust later distributions, so that after giving effect to these distributions, the priority and characterization of distributions otherwise applicable under our partnership agreement is maintained as nearly as is practicable. Payments by us as described above could give rise to an overpayment of tax on behalf of an individual unitholder in which event the unitholder would be required to file a claim in order to obtain a credit or refund.
Allocation of Income, Gain, Loss and Deduction
In general, if we have a net profit, our items of income, gain, loss and deduction will be allocated among our general partner and the unitholders in accordance with their percentage interests in us. At any time that distributions are made to the common units in excess of distributions to the subordinated units, or incentive distributions are made to our general partner, gross income will be allocated to the recipients to the extent of these distributions. Gross income may also be allocated to holders of subordinated units after the close of the subordination period to the extent necessary to give them economic rights at liquidation identical to the rights of common units. If we have a net loss for the entire year, that loss will be allocated first to our general partner and the unitholders in accordance with their percentage interests in us to the extent of their positive capital accounts and, second, to our general partner.
Specified items of our income, gain, loss and deduction will be allocated to account for (1) any difference between the tax basis and fair market value of our assets at the time of an offering and (2) any difference between the tax basis and fair market value of any property contributed to us by the general partner and its affiliates that exists at the time of such contribution, together, referred to in this discussion as the "Contributed Property." The effect of these allocations, referred to as Section 704(c) Allocations, to a unitholder purchasing common units from us in this offering will be essentially the same as if the tax bases of our assets were equal to their fair market value at the time of this offering. In the event we issue additional common units or engage in certain other transactions in the future, "reverse Section 704(c) Allocations," similar to the Section 704(c) Allocations described above, will be made to the general partner and our other unitholders immediately prior to such issuance or other transactions to account for the difference between the "book" basis for purposes of maintaining capital accounts and the fair market value of all property held by us at the time of such issuance or future transaction. In addition, items of recapture income will be allocated to the extent possible to the unitholder who was allocated the deduction giving rise to the treatment of that gain as recapture income in order to minimize the recognition of ordinary income by some unitholders. Finally, although we do not expect that our operations will result in the creation of negative capital accounts, if negative capital accounts nevertheless result, items of our income
and gain will be allocated in an amount and manner sufficient to eliminate the negative balance as quickly as possible.
An allocation of items of our income, gain, loss or deduction, other than an allocation required by the Internal Revenue Code to eliminate the difference between a partner's "book" capital account, credited with the fair market value of Contributed Property, and "tax" capital
account, credited with the tax basis of Contributed Property, referred to in this discussion as the "Book-Tax Disparity," will generally be given effect for federal income tax purposes in determining a partner's share of an item of income, gain, loss or deduction only if the allocation has "substantial economic effect." In any other case, a partner's share of an item will be determined on the basis of his interest in us, which will be determined by taking into account all the facts and circumstances, including:
Vinson & Elkins L.L.P. is of the opinion that, with the exception of the issues described in "—Tax Consequences of Unit Ownership—Section 754 Election" and "—Disposition of Common Units—Allocations Between Transferors and Transferees," allocations under our partnership agreement will be given effect for federal income tax purposes in determining a partner's share of an item of income, gain, loss or deduction.
Treatment of Short Sales
A unitholder whose units are loaned to a "short seller" to cover a short sale of units may be considered as having disposed of those units. If so, he would no longer be treated for tax purposes as a partner with respect to those units during the period of the loan and may recognize gain or loss from the disposition. As a result, during this period:
Vinson & Elkins L.L.P. has not rendered an opinion regarding the treatment of a unitholder where common units are loaned to a short seller to cover a short sale of common units; therefore, unitholders desiring to assure their status as partners and avoid the risk of gain recognition from a loan to a short seller are urged to modify any applicable brokerage account agreements to prohibit their brokers from loaning their units. The IRS has announced that it is actively studying issues relating to the tax treatment of short sales of partnership interests. Please also read "—Disposition of Common Units—Recognition of Gain or Loss."
Alternative Minimum Tax
Each unitholder will be required to take into account his distributive share of any items of our income, gain, loss or deduction for purposes of the alternative minimum tax. The current minimum tax rate for noncorporate taxpayers is 26% on the first $175,000 of alternative minimum taxable income in excess of the exemption amount and 28% on any additional alternative minimum taxable income. Prospective unitholders are urged to consult with their tax advisors as to the impact of an investment in units on their liability for the alternative minimum tax.
Tax Rates
Under current law, the highest marginal U.S. federal income tax rate applicable to ordinary income of individuals is 35% and the highest marginal U.S. federal income tax rate applicable to long-term capital gains (generally, capital gains on certain assets held for more than 12 months) of individuals is 15%. However, absent new legislation extending the current rates, beginning January 1, 2011, the highest marginal U.S. federal income tax rate applicable to ordinary income and long-term capital gains of individuals will increase to 39.6% and 20%, respectively. Moreover, these rates are subject to change by new legislation at any time.
The recently enacted Patient Protection and Affordable Care Act of 2010, as amended by the Health Care and Education Affordability Reconciliation Act of 2010, is scheduled to impose a 3.8% Medicare tax on net investment income earned by certain individuals, estates and trusts for taxable years beginning after December 31, 2012. For these purposes, net investment income generally includes a unitholder's allocable share of our income and gain realized by a unitholder from a sale of units. In the case of an individual, the tax will be imposed on the lesser of (1) the unitholder's net investment income or (2) the amount by which the unitholder's modified adjusted gross income exceeds $250,000 (if the unitholder is married and filing jointly or a surviving spouse), $125,000 (if the unitholder is married and filing separately) or $200,000 (in any other case). In the case of an estate or trust, the tax will be imposed on the lesser of (1) undistributed net investment income, or (2) the excess adjusted gross income over the dollar amount at which the highest income tax bracket applicable to an estate or trust begins.
Section 754 Election
We will make the election permitted by Section 754 of the Internal Revenue Code. That election is irrevocable without the consent of the IRS, unless there is a constructive termination of the partnership. Please read "—Disposition of Common Units—Constructive Termination." The election will generally permit us to adjust a common unit purchaser's tax basis in our assets ("inside basis") under Section 743(b) of the Internal Revenue Code to reflect his purchase price. This election does not apply to a person who purchases common units directly from us. The Section 743(b) adjustment belongs to the purchaser and not to other unitholders. For purposes of this discussion, a unitholder's inside basis in our assets will be considered to have two components: (1) his share of our tax basis in our assets ("common basis") and (2) his Section 743(b) adjustment to that basis.
Where the remedial allocation method is adopted (which we will adopt as to our properties), the Treasury Regulations under Section 743 of the Internal Revenue Code require a portion of the Section 743(b) adjustment that is attributable to recovery property subject to depreciation under Section 168 of the Internal Revenue Code whose book basis is in excess of its tax basis to be depreciated over the remaining cost recovery period for the property's unamortized Book-Tax Disparity. Under Treasury Regulation Section 1.167(c)-1(a)(6), a
Section 743(b) adjustment attributable to property subject to depreciation under Section 167 of the Internal Revenue Code, rather than cost recovery deductions under Section 168, is generally required to be depreciated using either the straight-line method or the 150% declining balance method. Under our partnership agreement, our general partner is authorized to take a position to preserve the uniformity of units even if that position is not consistent with these and any other Treasury Regulations. Please read "—Disposition of Common Units—Uniformity of Units."
Although Vinson & Elkins L.L.P. is unable to opine as to the validity of this approach because there is no direct or indirect controlling authority on this issue, we intend to depreciate the portion of a Section 743(b) adjustment attributable to unrealized appreciation in the value of
Contributed Property, to the extent of any unamortized Book-Tax Disparity, using a rate of depreciation or amortization derived from the depreciation or amortization method and useful life applied to the property's unamortized Book-Tax Disparity, or treat that portion as non-amortizable to the extent attributable to property which is not amortizable. This method is consistent with the methods employed by other publicly traded partnerships but is arguably inconsistent with Treasury Regulation Section 1.167(c)-1(a)(6), which is not expected to directly apply to a material portion of our assets, and Treasury Regulation Section 1.197-2(g)(3). To the extent this Section 743(b) adjustment is attributable to appreciation in value in excess of the unamortized Book-Tax Disparity, we will apply the rules described in the Treasury Regulations and legislative history. If we determine that this position cannot reasonably be taken, we may take a depreciation or amortization position under which all purchasers acquiring units in the same month would receive depreciation or amortization, whether attributable to common basis or a Section 743(b) adjustment, based upon the same applicable rate as if they had purchased a direct interest in our assets. This kind of aggregate approach may result in lower annual depreciation or amortization deductions than would otherwise be allowable to some unitholders. Please read "—Disposition of Common Units—Uniformity of Units." A unitholder's tax basis for his common units is reduced by his share of our deductions (whether or not such deductions were claimed on an individual's income tax return) so that any position we take that understates deductions will overstate the common unitholder's basis in his common units, which may cause the unitholder to understate gain or overstate loss on any sale of such units. Please read "—Disposition of Common Units—Recognition of Gain or Loss." The IRS may challenge our position with respect to depreciating or amortizing the Section 743(b) adjustment we take to preserve the uniformity of the units. If such a challenge were sustained, the gain from the sale of units might be increased without the benefit of additional deductions.
A Section 754 election is advantageous if the transferee's tax basis in his units is higher than the units' share of the aggregate tax basis of our assets immediately prior to the transfer. In that case, as a result of the election, the transferee would have, among other items, a greater amount of depreciation and depletion deductions and his share of any gain or loss on a sale of our assets would be less. Conversely, a Section 754 election is disadvantageous if the transferee's tax basis in his units is lower than those units' share of the aggregate tax basis of our assets immediately prior to the transfer. Thus, the fair market value of the units may be affected either favorably or unfavorably by the election. A basis adjustment is required regardless of whether a Section 754 election is made in the case of a transfer of an interest in us if we have a substantial built-in loss immediately after the transfer, or if we distribute property and have a substantial basis reduction. Generally, a built-in loss or a basis reduction is substantial if it exceeds $250,000.
The calculations involved in the Section 754 election are complex and will be made on the basis of assumptions as to the value of our assets and other matters. For example, the allocation of the Section 743(b) adjustment among our assets must be made in accordance with the Internal Revenue Code. The IRS could seek to reallocate some or all of any Section 743(b) adjustment allocated by us to our tangible assets to goodwill instead. Goodwill, as an intangible asset, is
generally non-amortizable or amortizable over a longer period of time or under a less accelerated method than our tangible assets. We cannot assure you that the determinations we make will not be successfully challenged by the IRS and that the deductions resulting from them will not be reduced or disallowed altogether. Should the IRS require a different basis adjustment to be made, and should, in our opinion, the expense of compliance exceed the benefit of the election, we may seek permission from the IRS to revoke our Section 754 election. If permission is granted, a subsequent purchaser of units may be allocated more income than he would have been allocated had the election not been revoked.
Tax Treatment of Operations
Accounting Method and Taxable Year
We use the year ending December 31 as our taxable year and the accrual method of accounting for federal income tax purposes. Each unitholder will be required to include in income his share of our income, gain, loss and deduction for our taxable year ending within or with his taxable year. In addition, a unitholder who has a taxable year ending on a date other than December 31 and who disposes of all of his units following the close of our taxable year but before the close of his taxable year must include his share of our income, gain, loss and deduction in income for his taxable year, with the result that he will be required to include in income for his taxable year his share of more than one year of our income, gain, loss and deduction. Please read "—Disposition of Common Units—Allocations Between Transferors and Transferees."
Initial Tax Basis, Depreciation and Amortization
The tax basis of our assets will be used for purposes of computing depreciation and cost recovery deductions and, ultimately, gain or loss on the disposition of these assets. The federal income tax burden associated with the difference between the fair market value of our assets and their tax basis immediately prior to (1) this offering will be borne by our general partner and its affiliates, and (2) any other offering will be borne by our general partner and all of our unitholders as of that time. Please read "—Tax Consequences of Unit Ownership—Allocation of Income, Gain, Loss and Deduction."
To the extent allowable, we may elect to use the depreciation and cost recovery methods that will result in the largest deductions being taken in the early years after assets are placed in service. Property we subsequently acquire or construct may be depreciated using accelerated methods permitted by the Internal Revenue Code.
If we dispose of depreciable property by sale, foreclosure or otherwise, all or a portion of any gain, determined by reference to the amount of depreciation previously deducted and the nature of the property, may be subject to the recapture rules and taxed as ordinary income rather than capital gain. Similarly, a unitholder who has taken cost recovery or depreciation deductions with respect to property we own will likely be required to recapture some or all of those deductions as ordinary income upon a sale of his interest in us. Please read "—Tax Consequences of Unit Ownership—Allocation of Income, Gain, Loss and Deduction" and "—Disposition of Common Units—Recognition of Gain or Loss."
The costs incurred in selling our units (called "syndication expenses") must be capitalized and cannot be deducted currently, ratably or upon our termination. There are uncertainties regarding the classification of costs as organization expenses, which may be amortized by us,
and as syndication expenses, which may not be amortized by us. The underwriting discount will be treated as syndication expenses.
Valuation and Tax Basis of Our Properties
The federal income tax consequences of the ownership and disposition of units will depend in part on our estimates of the relative fair market values, and the initial tax bases, of our assets. Although we may from time to time consult with professional appraisers regarding valuation matters, we will make many of the relative fair market value estimates ourselves. These estimates and determinations of basis are subject to challenge and will not be binding on the IRS or the courts. If the estimates of fair market value or basis are later found to be incorrect, the
character and amount of items of income, gain, loss or deductions previously reported by unitholders might change, and unitholders might be required to adjust their tax liability for prior years and incur interest and penalties with respect to those adjustments.
Coal Depletion
In general, we are entitled to depletion deductions with respect to coal mined from the underlying mineral property. We generally are entitled to the greater of cost depletion limited to the basis of the property or percentage depletion. The percentage depletion rate for coal is 10%.
Depletion deductions we claim generally will reduce the tax basis of the underlying mineral property. Depletion deductions can, however, exceed the total tax basis of the mineral property. The excess of our percentage depletion deductions over the adjusted tax basis of the property at the end of the taxable year is subject to tax preference treatment in computing the alternative minimum tax. Please read "—Tax Consequences of Unit Ownership—Alternative Minimum Tax." Upon the disposition of the mineral property, a portion of the gain, if any, equal to the lesser of the deductions for depletion which reduce the adjusted tax basis of the mineral property plus deductible development and mining exploration expenses, or the amount of gain recognized upon the disposition, will be treated as ordinary income to us. In addition, a corporate unitholder's allocable share of the amount allowable as a percentage depletion deduction for any property will be reduced by 20% of the excess, if any, of that partner's allocable share of the amount of the percentage depletion deductions for the taxable year over the adjusted tax basis of the mineral property as of the close of the taxable year.
Mining Exploration and Development Expenditures
We will elect to currently deduct mining exploration expenditures that we pay or incur to determine the existence, location, extent or quality of coal deposits prior to the time the existence of coal in commercially marketable quantities has been disclosed.
Amounts we deduct for mine exploration expenditures must be recaptured and included in our taxable income at the time a mine reaches the production stage, unless we elect to reduce future depletion deductions by the amount of the recapture. A mine reaches the producing stage when the major part of the coal production is obtained from working mines other than those opened for the purpose of development or the principal activity of the mine is the production of developed coal rather than the development of additional coal for mining. This recapture is accomplished through the disallowance of both cost and percentage depletion deductions on the particular mine reaching the producing stage. This disallowance of depletion deductions continues until the amount of adjusted exploration expenditures with respect to the mine have been fully recaptured. This recapture is not applied to the full amount of the previously deducted exploration expenditures. Instead, these expenditures are reduced by the amount of
percentage depletion, if any, that was lost as a result of deducting these exploration expenditures.
We generally elect to defer mine development expenses, consisting of expenditures incurred in making coal accessible for extraction, after the exploration process has disclosed the existence of coal in commercially marketable quantities, and deduct them on a ratable basis as the coal benefited by the expenses is sold.
Mine exploration and development expenditures are subject to recapture as ordinary income to the extent of any gain upon a sale or other disposition of our property or of your common units. Please read "—Disposition of Common Units." Corporate unitholders are subject to an additional rule that requires them to capitalize a portion of their otherwise deductible mine exploration and development expenditures. Corporate unitholders, other than some S corporations, are required to reduce their otherwise deductible exploration expenditures by 30%. These capitalized mine exploration and development expenditures must be amortized over a 60-month period, beginning in the month paid or incurred, using a straight-line method and may not be treated as part of the basis of the property for purposes of computing depletion.
When computing the alternative minimum tax, mine exploration and development expenditures are capitalized and deducted over a ten year period. Unitholders may avoid this alternative minimum tax adjustment of their mine exploration and development expenditures by electing to capitalize all or part of the expenditures and deducting them over ten years for regular income tax purposes. You may select the specific amount of these expenditures for which you wish to make this election.
Sales of Coal Reserves
If any coal reserves are sold or otherwise disposed of in a taxable transaction, we will recognize gain or loss measured by the difference between the amount realized (including the amount of any indebtedness assumed by the purchaser upon such disposition or to which such property is subject) and the adjusted tax basis of the property sold. Generally, the character of any gain or loss recognized upon that disposition will depend upon whether our coal reserves or the mined coal sold are held by us:
In determining dealer status with respect to coal reserves and other types of real estate, the courts have identified a number of factors for distinguishing between a particular property held for sale in the ordinary course of business and one held for investment. Any determination must be based on all the facts and circumstances surrounding the particular property and sale in question.
We intend to hold our coal reserves for use in a trade or business and achieving long-term capital appreciation. Although our general partner may consider strategic sales of coal reserves consistent with achieving long-term capital appreciation, our general partner does not anticipate frequent sales of coal reserves. Thus, the general partner does not believe we will be viewed as a
dealer. In light of the factual nature of this question, however, there is no assurance that our purposes for holding our properties will not change and that our future activities will not cause us to be a "dealer" in coal reserves.
If we are not a dealer with respect to our coal reserves and we have held the disposed property for more than a one-year period primarily for use in our trade or business, the character of any gain or loss realized from a disposition of the property will be determined under
Section 1231 of the Internal Revenue Code. If we have not held the property for more than one year at the time of the sale, gain or loss from the sale will be taxable as ordinary income.
A unitholder's distributive share of any Section 1231 gain or loss generated by us will be aggregated with any other gains and losses realized by that unitholder from the disposition of property used in the trade or business, as defined in Section 1231(b) of the Internal Revenue Code, and from the involuntary conversion of such properties and of capital assets held in connection with a trade or business or a transaction entered into for profit for the requisite holding period. If a net gain results, all such gains and losses will be long-term capital gains and losses; if a net loss results, all such gains and losses will be ordinary income and losses. Net Section 1231 gains will be treated as ordinary income to the extent of prior net Section 1231 losses of the taxpayer or predecessor taxpayer for the five most recent prior taxable years to the extent such losses have not previously been offset against Section 1231 gains. Losses are deemed recaptured in the chronological order in which they arose.
If we are not a dealer with respect to our coal reserves and that property is not used in a trade or business, the property will be a "capital asset" within the meaning of Section 1221 of the Internal Revenue Code. Gain or loss recognized from the disposition of that property will be taxable as capital gain or loss, and the character of such capital gain or loss as long-term or short-term will be based upon our holding period of such property at the time of its sale. The requisite holding period for long-term capital gain is more than one year.
Upon a disposition of coal reserves, a portion of the gain, if any, equal to the lesser of (1) the depletion deductions that reduced the tax basis of the disposed mineral property plus deductible development and mining exploration expenses or (2) the amount of gain recognized on the disposition, will be treated as ordinary income to us.
Deduction for U.S. Production Activities
Subject to the limitations on the deductibility of losses discussed above and the limitation discussed below, unitholders will be entitled to a deduction, herein referred to as the Section 199 deduction, equal to a specified percentage of our qualified production activities income that is allocated to such unitholder. The percentage is currently 9% for qualified production activities income.
Qualified production activities income is generally equal to gross receipts from domestic production activities reduced by cost of goods sold allocable to those receipts, other expenses directly associated with those receipts, and a share of other deductions, expenses and losses that are not directly allocable to those receipts or another class of income. The products produced must be manufactured, produced, grown or extracted in whole or in significant part by the taxpayer in the United States.
For a partnership, the Section 199 deduction is determined at the partner level. To determine his Section 199 deduction, each unitholder will aggregate his share of the qualified production activities income allocated to him from us with the unitholder's qualified production
activities income from other sources. Each unitholder must take into account his distributive share of the expenses allocated to him from our qualified production activities regardless of whether we otherwise have taxable income. However, our expenses that otherwise would be taken into account for purposes of computing the Section 199 deduction are only taken into account if and to the extent the unitholder's share of losses and deductions from all of our activities is not disallowed by the basis rules, the at—risk rules or the passive activity loss rules. Please read "—Tax Consequences of Unit Ownership—Limitations on Deductibility of Losses."
The amount of a unitholder's Section 199 deduction for each year is limited to 50% of the IRS Form W-2 wages actually or deemed paid by the unitholder during the calendar year that are deducted in arriving at qualified production activities income. Each unitholder is treated as having been allocated IRS Form W-2 wages from us equal to the unitholder's allocable share of our wages that are deducted in arriving at qualified production activities income for that taxable year. It is not anticipated that we or our subsidiaries will pay material wages that will be allocated to our unitholders, and thus a unitholder's ability to claim the Section 199 deduction may be limited.
Recent Legislative Developments
The White House recently released the Budget Proposal. Among the changes recommended in the Budget Proposal is the elimination of certain key U.S. federal income tax preferences relating to coal exploration and development. The Budget Proposal would (1) eliminate current deductions and 60-month amortization for exploration and development costs relating to coal and other hard mineral fossil fuels, (2) repeal the percentage depletion allowance with respect to coal properties, (3) repeal capital gains treatment of coal and lignite royalties, and (4) exclude from the definition of domestic production gross receipts all gross receipts derived from the sale, exchange, or other disposition of coal, other hard mineral fossil fuels, or primary products thereof. The passage of any legislation as a result of the Budget Proposal or any other similar changes in U.S. federal income tax laws could eliminate certain tax deductions that are currently available with respect to coal exploration and development, and any such change could increase the taxable income allocable to our unitholders and negatively impact the value of an investment in our units.
Disposition of Common Units
Recognition of Gain or Loss
Gain or loss will be recognized on a sale of units equal to the difference between the amount realized and the unitholder's tax basis for the units sold. A unitholder's amount realized will be measured by the sum of the cash or the fair market value of other property received by him plus his share of our nonrecourse liabilities. Because the amount realized includes a unitholder's share of our nonrecourse liabilities, the gain recognized on the sale of units could result in a tax liability in excess of any cash received from the sale.
Prior distributions from us in excess of cumulative net taxable income for a common unit that decreased a unitholder's tax basis in that common unit will, in effect, become taxable income if the common unit is sold at a price greater than the unitholder's tax basis in that common unit, even if the price received is less than his original cost.
Except as noted below, gain or loss recognized by a unitholder, other than a "dealer" in units, on the sale or exchange of a unit held for more than one year will generally be taxable as long-term capital gain or loss. Capital gain recognized by an individual on the sale of units held
more than twelve months will generally be taxed at a maximum U.S. federal income tax rate of 15% through December 31, 2010 and 20% thereafter (absent new legislation extending or adjusting the current rate). However, a portion of this gain or loss, which will likely be substantial, will be separately computed and taxed as ordinary income or loss under Section 751 of the Internal Revenue Code to the extent attributable to assets giving rise to depreciation recapture or other "unrealized receivables" or to "inventory items" we own. The term "unrealized receivables" includes potential recapture items, including depreciation and depletion recapture. Ordinary income attributable to unrealized receivables, inventory items and
depreciation recapture may exceed net taxable gain realized upon the sale of a unit and may be recognized even if there is a net taxable loss realized on the sale of a unit. Thus, a unitholder may recognize both ordinary income and a capital loss upon a sale of units. Net capital losses may offset capital gains and no more than $3,000 of ordinary income each year, in the case of individuals, and may only be used to offset capital gains in the case of corporations.
The IRS has ruled that a partner who acquires interests in a partnership in separate transactions must combine those interests and maintain a single adjusted tax basis for all those interests. Upon a sale or other disposition of less than all of those interests, a portion of that tax basis must be allocated to the interests sold using an "equitable apportionment" method, which generally means that the tax basis allocated to the interest sold equals an amount that bears the same relation to the partner's tax basis in his entire interest in the partnership as the value of the interest sold bears to the value of the partner's entire interest in the partnership. Treasury Regulations under Section 1223 of the Internal Revenue Code allow a selling unitholder who can identify common units transferred with an ascertainable holding period to elect to use the actual holding period of the common units transferred. Thus, according to the ruling, a common unitholder will be unable to select high or low basis common units to sell as would be the case with corporate stock, but, according to the Treasury Regulations, may designate specific common units sold for purposes of determining the holding period of units transferred. A unitholder electing to use the actual holding period of common units transferred must consistently use that identification method for all subsequent sales or exchanges of common units. A unitholder considering the purchase of additional units or a sale of common units purchased in separate transactions is urged to consult his tax advisor as to the possible consequences of this ruling and application of the Treasury Regulations.
Specific provisions of the Internal Revenue Code affect the taxation of some financial products and securities, including partnership interests, by treating a taxpayer as having sold an "appreciated" partnership interest, one in which gain would be recognized if it were sold, assigned or terminated at its fair market value, if the taxpayer or related persons enter(s) into:
Moreover, if a taxpayer has previously entered into a short sale, an offsetting notional principal contract or a futures or forward contract with respect to the partnership interest, the taxpayer will be treated as having sold that position if the taxpayer or a related person then acquires the partnership interest or substantially identical property. The Secretary of the Treasury is also authorized to issue regulations that treat a taxpayer that enters into transactions or positions that have substantially the same effect as the preceding transactions as having constructively sold the financial position.
Allocations Between Transferors and Transferees
In general, our taxable income or loss will be determined annually, will be prorated on a monthly basis and will be subsequently apportioned among the unitholders in proportion to the number of units owned by each of them as of the opening of the applicable exchange on the first business day of the month, which we refer to in this prospectus as the "Allocation Date." However, gain or loss realized on a sale or other disposition of our assets other than in the
ordinary course of business will be allocated among the unitholders on the Allocation Date in the month in which that gain or loss is recognized. As a result, a unitholder transferring units may be allocated income, gain, loss and deduction realized after the date of transfer.
Although simplifying conventions are contemplated by the Internal Revenue Code and most publicly traded partnerships use a similar simplifying convention, the use of this method may not be permitted under existing Treasury Regulations. Recently, however, the Department of the Treasury and the IRS issued proposed Treasury Regulations that provide a safe harbor pursuant to which a publicly traded partnership may use a similar monthly simplifying convention to allocate tax items among transferor and transferee unitholders, although such tax items must be prorated on a daily basis. Nonetheless, the proposed regulations do not specifically authorize the use of the proration method we have adopted. Existing publicly traded partnerships are entitled to rely on these proposed Treasury Regulations; however, they are not binding on the IRS and are subject to change until final Treasury Regulations are issued. Accordingly, Vinson & Elkins L.L.P. is unable to opine on the validity of this method of allocating income and deductions between transferor and transferee unitholders. If this method is not allowed under the Treasury Regulations, or only applies to transfers of less than all of the unitholder's interest, our taxable income or losses might be reallocated among the unitholders. We are authorized to revise our method of allocation between transferor and transferee unitholders, as well as unitholders whose interests vary during a taxable year, to conform to a method permitted under future Treasury Regulations.
A unitholder who owns units at any time during a quarter and who disposes of them prior to the record date set for a cash distribution for that quarter will be allocated items of our income, gain, loss and deductions attributable to that quarter but will not be entitled to receive that cash distribution.
Notification Requirements
A unitholder who sells any of his units generally is required to notify us in writing of that sale within 30 days after the sale (or, if earlier, January 15 of the year following the sale). A purchaser of units who purchases units from another unitholder also generally is required to notify us in writing of that purchase within 30 days after the purchase. Upon receiving such notifications, we are required to notify the IRS of that transaction and to furnish specified information to the transferor and transferee. Failure to notify us of a purchase may, in some cases, lead to the imposition of penalties. However, these reporting requirements do not apply to a sale by an individual who is a citizen of the United States and who effects the sale or exchange through a broker who will satisfy such requirements.
Constructive Termination
We will be considered to have been terminated for tax purposes if there are sales or exchanges which, in the aggregate, constitute 50% or more of the total interests in our capital and profits within a twelve-month period. For purposes of measuring whether the 50% threshold is reached, multiple sales of the same interest within a twelve-month period are counted only
once. A constructive termination results in the closing of our taxable year for all unitholders. In the case of a unitholder reporting on a taxable year other than a fiscal year ending December 31, the closing of our taxable year may result in more than twelve months of our taxable income or loss being includable in his taxable income for the year of termination. A constructive termination occurring on a date other than December 31 will result in us filing two tax returns (and unitholders receiving two Schedules K-1) for one fiscal year and the cost of the preparation of these returns will be borne by all common unitholders. We would be required to make new
tax elections after a termination, including a new election under Section 754 of the Internal Revenue Code, and a termination would result in a deferral of our deductions for depreciation. A termination could also result in penalties if we were unable to determine that the termination had occurred. Moreover, a termination might either accelerate the application of, or subject us to, any tax legislation enacted before the termination. The IRS has recently announced a relief procedure whereby if a publicly traded partnership that has technically terminated requests and the IRS grants special relief, among other things, the partnership will be required to provide only a single Schedule K-1 to unitholder for the tax years in which the termination occurs.
Uniformity of Units
Because we cannot match transferors and transferees of units, we must maintain uniformity of the economic and tax characteristics of the units to a purchaser of these units. In the absence of uniformity, we may be unable to completely comply with a number of federal income tax requirements, both statutory and regulatory. A lack of uniformity can result from a literal application of Treasury Regulation Section 1.167(c)-1(a)(6). Any non-uniformity could have a negative impact on the value of the units. Please read "—Tax Consequences of Unit Ownership—Section 754 Election."
We intend to depreciate the portion of a Section 743(b) adjustment attributable to unrealized appreciation in the value of Contributed Property, to the extent of any unamortized Book-Tax Disparity, using a rate of depreciation or amortization derived from the depreciation or amortization method and useful life applied to the property's unamortized Book-Tax Disparity, or treat that portion as nonamortizable, to the extent attributable to property the common basis of which is not amortizable, consistent with the regulations under Section 743 of the Internal Revenue Code, even though that position may be inconsistent with Treasury Regulation Section 1.167(c)-1(a)(6), which is not expected to directly apply to a material portion of our assets and Treasury Regulation Section 1.197-2(g)(3). Please read "—Tax Consequences of Unit Ownership—Section 754 Election." To the extent that the Section 743(b) adjustment is attributable to appreciation in value in excess of the unamortized Book-Tax Disparity, we will apply the rules described in the Treasury Regulations and legislative history. If we determine that this position cannot reasonably be taken, we may adopt a depreciation and amortization position under which all purchasers acquiring units in the same month would receive depreciation and amortization deductions, whether attributable to a common basis or Section 743(b) adjustment, based upon the same applicable methods and lives as if they had purchased a direct interest in our property. If this position is adopted, it may result in lower annual depreciation and amortization deductions than would otherwise be allowable to some unitholders and risk the loss of depreciation and amortization deductions not taken in the year that these deductions are otherwise allowable. This position will not be adopted if we determine that the loss of depreciation and amortization deductions will have a material adverse effect on the unitholders. If we choose not to utilize this aggregate method, we may use any other reasonable depreciation and amortization method to preserve the uniformity of the intrinsic tax characteristics of any units that would not have a material adverse effect on the unitholders. The IRS may challenge any method of depreciating the Section 743(b) adjustment described in this paragraph. If this challenge were sustained, the uniformity of units might be affected, and the
gain from the sale of units might be increased without the benefit of additional deductions. Please read "—Disposition of Common Units—Recognition of Gain or Loss."
Tax-Exempt Organizations and Other Investors
Ownership of units by employee benefit plans, other tax-exempt organizations, non-resident aliens, foreign corporations and other foreign persons raises issues unique to those investors and,
as described below, may have substantially adverse tax consequences to them. If you are a tax-exempt entity or a non-U.S. person, you should consult your tax advisor before investing in our common units.
Employee benefit plans and most other organizations exempt from federal income tax, including individual retirement accounts (IRAs) and other retirement plans, are subject to federal income tax on unrelated business taxable income. Virtually all of our income allocated to a unitholder that is a tax-exempt organization will be unrelated business taxable income and will be taxable to them.
Non-resident aliens and foreign corporations, trusts or estates that own units will be considered to be engaged in business in the United States because of the ownership of units. As a consequence, they will be required to file federal tax returns to report their share of our income, gain, loss or deduction and pay federal income tax at regular rates on their share of our net income or gain. Moreover, under rules applicable to publicly traded partnerships, we will withhold at the highest applicable effective tax rate from cash distributions made quarterly to foreign unitholders. Each foreign unitholder must obtain a taxpayer identification number from the IRS and submit that number to our transfer agent on a Form W-8BEN or applicable substitute form in order to obtain credit for these withholding taxes. A change in applicable law may require us to change these procedures.
In addition, because a foreign corporation that owns units will be treated as engaged in a U.S. trade or business, that corporation may be subject to the U.S. branch profits tax at a rate of 30%, in addition to regular federal income tax, on its share of our income and gain, as adjusted for changes in the foreign corporation's "U.S. net equity," which is effectively connected with the conduct of a U.S. trade or business. That tax may be reduced or eliminated by an income tax treaty between the United States and the country in which the foreign corporate unitholder is a "qualified resident." In addition, this type of unitholder is subject to special information reporting requirements under Section 6038C of the Internal Revenue Code.
A foreign unitholder who sells or otherwise disposes of a unit will be subject to U.S. federal income tax on gain realized from the sale or disposition of that unit to the extent the gain is effectively connected with a U.S. trade or business of the foreign unitholder. Under a ruling published by the IRS, interpreting the scope of "effectively connected income," a foreign unitholder would be considered to be engaged in a trade or business in the U.S. by virtue of the U.S. activities of the partnership, and part or all of that unitholder's gain would be effectively connected with that unitholder's indirect U.S. trade or business. Moreover, under the Foreign Investment in Real Property Tax Act, a foreign unitholder generally will be subject to U.S. federal income tax upon the sale or disposition of a common unit if (1) he owned (directly or constructively applying certain attribution rules) more than 5% of our units at any time during the five-year period ending on the date of such disposition and (2) 50% or more of the fair market value of all of our assets consisted of U.S. real property interests at any time during the shorter of the period during which such unitholder held the units or the 5-year period ending on the date of disposition. Currently, more than 50% of our assets consist of U.S. real property interests and we do not expect that to change in the foreseeable future. Therefore, foreign
unitholders may be subject to federal income tax on gain from the sale or disposition of their units.
Administrative Matters
Information Returns and Audit Procedures
We intend to furnish to each unitholder, within 90 days after the close of each calendar year, specific tax information, including a Schedule K-1, which describes his share of our income, gain, loss and deduction for our preceding taxable year. In preparing this information, which will not be reviewed by counsel, we will take various accounting and reporting positions, some of which have been mentioned earlier, to determine each unitholder's share of income, gain, loss and deduction. We cannot assure you that those positions will yield a result that conforms to the requirements of the Internal Revenue Code, Treasury Regulations or administrative interpretations of the IRS. Neither we nor Vinson & Elkins L.L.P. can assure prospective unitholders that the IRS will not successfully contend in court that those positions are impermissible. Any challenge by the IRS could negatively affect the value of the units.
The IRS may audit our federal income tax information returns. Adjustments resulting from an IRS audit may require each unitholder to adjust a prior year's tax liability, and possibly may result in an audit of his return. Any audit of a unitholder's return could result in adjustments not related to our returns as well as those related to our returns.
Partnerships generally are treated as separate entities for purposes of federal tax audits, judicial review of administrative adjustments by the IRS and tax settlement proceedings. The tax treatment of partnership items of income, gain, loss and deduction are determined in a partnership proceeding rather than in separate proceedings with the partners. The Internal Revenue Code requires that one partner be designated as the "Tax Matters Partner" for these purposes. Our partnership agreement names Rhino GP LLC, our general partner, as our Tax Matters Partner.
The Tax Matters Partner will make some elections on our behalf and on behalf of unitholders. In addition, the Tax Matters Partner can extend the statute of limitations for assessment of tax deficiencies against unitholders for items in our returns. The Tax Matters Partner may bind a unitholder with less than a 1% profits interest in us to a settlement with the IRS unless that unitholder elects, by filing a statement with the IRS, not to give that authority to the Tax Matters Partner. The Tax Matters Partner may seek judicial review, by which all the unitholders are bound, of a final partnership administrative adjustment and, if the Tax Matters Partner fails to seek judicial review, judicial review may be sought by any unitholder having at least a 1% interest in profits or by any group of unitholders having in the aggregate at least a 5% interest in profits. However, only one action for judicial review will go forward, and each unitholder with an interest in the outcome may participate.
A unitholder must file a statement with the IRS identifying the treatment of any item on his federal income tax return that is not consistent with the treatment of the item on our return. Intentional or negligent disregard of this consistency requirement may subject a unitholder to substantial penalties.
Nominee Reporting
Persons who hold an interest in us as a nominee for another person are required to furnish to us:
Brokers and financial institutions are required to furnish additional information, including whether they are U.S. persons and specific information on units they acquire, hold or transfer for their own account. A penalty of $50 per failure, up to a maximum of $100,000 per calendar year, is imposed by the Internal Revenue Code for failure to report that information to us. The nominee is required to supply the beneficial owner of the units with the information furnished to us.
Accuracy-Related Penalties
An additional tax equal to 20% of the amount of any portion of an underpayment of tax that is attributable to one or more specified causes, including negligence or disregard of rules or regulations, substantial understatements of income tax and substantial valuation misstatements, is imposed by the Internal Revenue Code. No penalty will be imposed, however, for any portion of an underpayment if it is shown that there was a reasonable cause for that portion and that the taxpayer acted in good faith regarding that portion.
For individuals, a substantial understatement of income tax in any taxable year exists if the amount of the understatement exceeds the greater of 10% of the tax required to be shown on the return for the taxable year or $5,000. The amount of any understatement subject to penalty generally is reduced if any portion is attributable to a position adopted on the return:
If any item of income, gain, loss or deduction included in the distributive shares of unitholders might result in that kind of an "understatement" of income for which no "substantial
"substantial authority" exists, we must disclose the pertinent facts on our return. In addition, we will make a reasonable effort to furnish sufficient information for unitholders to make adequate disclosure on their returns and to take other actions as may be appropriate to permit unitholders to avoid liability for this penalty. More stringent rules apply to "tax shelters," which we do not believe includes us or any of our investments, plans or arrangements.
A substantial valuation misstatement exists if (a) the value of any property, or the tax basis of any property, claimed on a tax return is 150% or more of the amount determined to be the
correct amount of the valuation or tax basis, (b) the price for any property or services (or for the use of property) claimed on any such return with respect to any transaction between persons described in Internal Revenue Code Section 482 is 200% or more (or 50% or less) of the amount determined under Section 482 to be the correct amount of such price, or (c) the net Internal Revenue Code Section 482 transfer price adjustment for the taxable year exceeds the lesser of $5 million or 10% of the taxpayer's gross receipts. No penalty is imposed unless the portion of the underpayment attributable to a substantial valuation misstatement exceeds $5,000 ($10,000 for most corporations). The penalty is increased to 40% in the event of a gross valuation misstatement. We do not anticipate making any valuation misstatements.
Reportable Transactions
If we were to engage in a "reportable transaction," we (and possibly you and others) would be required to make a detailed disclosure of the transaction to the IRS. A transaction may be a reportable transaction based upon any of several factors, including the fact that it is a type of tax avoidance transaction publicly identified by the IRS as a "listed transaction" or that it produces certain kinds of losses for partnerships, individuals, S corporations, and trusts in excess of $2 million in any single year, or $4 million in any combination of six successive tax years. Our participation in a reportable transaction could increase the likelihood that our federal income tax information return (and possibly your tax return) would be audited by the IRS. Please read "—Information Returns and Audit Procedures."
Moreover, if we were to participate in a reportable transaction with a significant purpose to avoid or evade tax, or in any listed transaction, you may be subject to the following provisions of the American Jobs Creation Act of 2004:
We do not expect to engage in any "reportable transactions."
State, Local, Foreign and Other Tax Considerations
In addition to federal income taxes, you likely will be subject to other taxes, such as state, local and foreign income taxes, unincorporated business taxes, and estate, inheritance or intangible taxes that may be imposed by the various jurisdictions in which we do business or own property or in which you are a resident. Although an analysis of those various taxes is not presented here, each prospective unitholder should consider their potential impact on his investment in us. We will initially control property or do business in Colorado, Illinois,
Kentucky, Ohio, Pennsylvania and West Virginia. We may also control property or do business in other jurisdictions in the future. Although you may not be required to file a return and pay taxes in some jurisdictions because your income from that jurisdiction falls below the filing and payment requirement, you will be required to file income tax returns and to pay income taxes in many of these jurisdictions in which we do business or control property and may be subject to penalties for failure to comply with those requirements. In some jurisdictions, tax losses may not produce a tax benefit in the year incurred and may not be available to offset income in subsequent taxable years. Some of the jurisdictions may require us, or we may elect, to withhold
a percentage of income from amounts to be distributed to a unitholder who is not a resident of the jurisdiction. Withholding, the amount of which may be greater or less than a particular unitholder's income tax liability to the jurisdiction, generally does not relieve a nonresident unitholder from the obligation to file an income tax return. Amounts withheld will be treated as if distributed to unitholders for purposes of determining the amounts distributed by us. Please read "—Tax Consequences of Unit Ownership—Entity-Level Collections." Based on current law and our estimate of our future operations, our general partner anticipates that any amounts required to be withheld will not be material.
It is the responsibility of each unitholder to investigate the legal and tax consequences, under the laws of pertinent jurisdictions, of his investment in us. Accordingly, each prospective unitholder is urged to consult, and depend upon, his tax counsel or other advisor with regard to those matters. Further, it is the responsibility of each unitholder to file all state, local and foreign, as well as U.S. federal tax returns, which may be required of him. Vinson & Elkins L.L.P. has not rendered an opinion on the state, local or foreign tax consequences of an investment in us.
INVESTMENT IN RHINO RESOURCE PARTNERS LP BY
EMPLOYEE BENEFIT PLANS
An investment in us by an employee benefit plan is subject to additional considerations because the investments of these plans are subject to the fiduciary responsibility and prohibited transaction provisions of ERISA and restrictions imposed by Section 4975 of the Internal Revenue Code. For these purposes the term "employee benefit plan" includes, but is not limited to, qualified pension, profit-sharing and stock bonus plans, Keogh plans, simplified employee pension plans and tax deferred annuities or IRAs established or maintained by an employer or employee organization. Among other things, consideration should be given to:
The person with investment discretion with respect to the assets of an employee benefit plan, often called a fiduciary, should determine whether an investment in us is authorized by the appropriate governing instrument and is a proper investment for the plan or IRA.
Section 406 of ERISA and Section 4975 of the Internal Revenue Code prohibit employee benefit plans, and also IRAs that are not considered part of an employee benefit plan, from engaging in specified transactions involving "plan assets" with parties that are "parties in interest" under ERISA or "disqualified persons" under the Internal Revenue Code with respect to the plan.
In addition to considering whether the purchase of common units is a prohibited transaction, a fiduciary of an employee benefit plan should consider whether the plan will, by investing in us, be deemed to own an undivided interest in our assets, with the result that our operations would be subject to the regulatory restrictions of ERISA, including its prohibited transaction rules, as well as the prohibited transaction rules of the Internal Revenue Code.
The Department of Labor regulations provide guidance with respect to whether the assets of an entity in which employee benefit plans acquire equity interests would be deemed "plan assets" under some circumstances. Under these regulations, an entity's assets would not be considered to be "plan assets" if, among other things:
benefit plans referred to above, and IRAs that are subject to ERISA or Section 4975 of the Internal Revenue Code.
Our assets should not be considered "plan assets" under these regulations because it is expected that the investment will satisfy the requirements in (a) and (b) above.
Plan fiduciaries contemplating a purchase of common units should consult with their own counsel regarding the consequences under ERISA and the Internal Revenue Code in light of the serious penalties imposed on persons who engage in prohibited transactions or other violations.
Subject to the terms and conditions in an underwriting agreement dated , 2010, the underwriters named below, for whom Raymond James & Associates, Inc. is acting as representative, have severally agreed to purchase from us, and we have agreed to sell to them, the number of common units set forth opposite their names below:
| Name of Underwriter | Number of Common Units | ||||
|---|---|---|---|---|---|
Raymond James & Associates, Inc. | |||||
RBC Capital Markets Corporation | |||||
Stifel, Nicolaus & Company, Incorporated | |||||
Total | |||||
The underwriting agreement provides that the obligations of the underwriters to purchase and accept delivery of the common units offered by this prospectus are subject to the satisfaction of the conditions contained in the underwriting agreement, including:
The underwriters are obligated to purchase and accept delivery of all of the common units offered by this prospectus, if any are purchased, other than those covered by the option to purchase additional common units described below.
The underwriters propose to offer the common units directly to the public at the public offering price indicated on the cover page of this prospectus and to various dealers at that price less a concession not in excess of $ per unit. If all of the common units are not sold at the public offering price, the underwriters may change the public offering price and other selling terms. The common units are offered by the underwriters as stated in this prospectus, subject to receipt and acceptance by them. The underwriters reserve the right to reject an order for the purchase of the common units in whole or in part.
Option to Purchase Additional Common Units
We have granted the underwriters an option, exercisable for 30 days after the date of this prospectus, to purchase from time to time up to an aggregate of 562,500486,600 additional common units to cover over-allotments, if any, at the public offering price less the underwriting discount set forth on the cover page of this prospectus. If the underwriters exercise this option, each underwriter, subject to certain conditions, will become obligated to purchase its pro rata portion of these additional units based on the underwriters' percentage purchase commitment in this offering as indicated in the table above. The underwriters may exercise the option to purchase additional common units only to cover over-allotments made in connection with the sale of the common units offered in this offering.
If the underwriters do not exercise their option, the 562,500486,600 common units will be issued to Rhino Energy Holdings LLC. If and to the extent the underwriters exercise their option, the number of units purchased by the underwriters pursuant to such exercise will be issued to the
public and the remainder, if any, will be issued to Rhino Energy Holdings LLC. The net proceeds from any exercise of the underwriters' option to purchase additional common units (approximately $10.5$9.1 million based on an assumed initial offering price of $20.00 per common unit, if exercised in full, after deducting the estimated underwriting discount) will be used to reimburse Wexford for capital expenditures it incurred with respect to the assets contributed to us.
Discounts and Expenses
The following table shows the amount per common unit and total underwriting discounts we will pay to the underwriters (dollars in thousands, except per unit amounts). The amounts are shown assuming both no exercise and full exercise of the underwriters' option to purchase additional common units.
| | Per Unit | Total Without Over-Allotment Exercise | Total With Over- Allotment Exercise | |||||||
|---|---|---|---|---|---|---|---|---|---|---|
Price to the public | ||||||||||
Underwriting discount and commissions | ||||||||||
Proceeds to us (before offering expenses) | ||||||||||
The expenses of this offering that are payable by us are estimated to be $3.0 million (excluding the underwriting discount, but including an aggregate of $1.0 million of bonuses payable to certain executive officers upon consummation of this offering).
Indemnification
We have agreed to indemnify the underwriters against certain liabilities that may arise in connection with this offering, including liabilities under the Securities Act, and to contribute to payments that the underwriters may be required to make for those liabilities.
Lock-Up Agreements
Subject to specified exceptions, we, our general partner's officers and directors and Rhino Energy Holdings LLC have agreed with the underwriters, for a period of 180 days after the date of this prospectus, without the prior written consent of Raymond James & Associates, Inc.:
These agreements also prohibit us from entering into any of the foregoing transactions with respect to any securities that are convertible into or exchangeable for the common units.
Raymond James & Associates, Inc. may, in its discretion and at any time without notice, release all or any portion of the securities subject to these agreements. Raymond James & Associates, Inc. does not have any present intent or any understanding to release all or any portion of the securities subject to these agreements.
The 180-day period described in the preceding paragraphs will be extended if:
Stabilization
Until this offering is completed, rules of the SEC may limit the ability of the underwriters to bid for and purchase the common units. As an exception to these rules, the underwriters may engage in activities that stabilize, maintain or otherwise affect the price of the common units, including:
Stabilizing transactions consist of bids or purchases made for the purpose of preventing or retarding a decline in the market price of the common units while this offering is in progress. Stabilizing transactions may include making short sales of common units, which involve the sale by the underwriters of a greater number of common units than it is required to purchase in this offering and purchasing common units from us or in the open market to cover positions created by short sales. Short sales may be "covered" shorts, which are short positions in an amount not greater than the underwriters' option to purchase additional common units referred to above, or may be "naked" shorts, which are short positions in excess of that amount.
Each underwriter may close out any covered short position either by exercising its option to purchase additional common units, in whole or in part, or by purchasing common units in the open market. In making this determination, each underwriter will consider, among other things, the price of common units available for purchase in the open market compared to the price at which the underwriter may purchase common units pursuant to the option to purchase additional common units.
A naked short position is more likely to be created if the underwriters are concerned that there may be downward pressure on the price of the common units in the open market that could adversely affect investors who purchased in this offering. To the extent that the underwriters create a naked short position, they will purchase common units in the open market to cover the position.
As a result of these activities, the price of the common units may be higher than the price that otherwise might exist in the open market. If the underwriters commence these activities, they may discontinue them without notice at any time. The underwriters may carry out these transactions on the NYSE or otherwise.
Relationships
Certain of the underwriters and their affiliates may provide in the future investment banking, financial advisory or other financial services for us and our affiliates, for which they may receive advisory or transaction fees, as applicable, plus out-of-pocket expenses, of the nature and in amounts customary in the industry for these financial services. Additionally, affiliates of Raymond James & Associates, Inc. and RBC Capital Markets Corporation are lenders under our credit agreement and will receive their pro rata portion of the net proceeds from this offering and the related capital contribution by our general partner through the repayment of borrowings they have extended under the credit agreement.
Discretionary Accounts
The underwriters may confirm sales of the common units offered by this prospectus to accounts over which they exercise discretionary authority but do not expect those sales to exceed 5% of the total common units offered by this prospectus.
Listing
We have been approved to list our common units on the NYSE under the symbol "RNO." In connection with the listing of the common units on the NYSE, the underwriters will undertake to sell round lots of 100 units or more to a minimum of 400 beneficial owners.
Determination of Initial Offering Price
Prior to this offering, there has been no public market for the common units. Consequently, the initial public offering price for the common units will be determined by negotiations among us and the underwriters. The primary factors to be considered in determining the initial public offering price will be:
The initial offering price may not correspond to the price at which the common units will trade in the public market subsequent to this offering, and an active trading market may develop and continue after this offering.
Electronic Prospectus
A prospectus in electronic format may be available on the Internet sites or through other online services maintained by one or more of the underwriters participating in this offering, or by their affiliates. In those cases, prospective investors may view offering terms online and, depending upon the underwriter, prospective investors may be allowed to place orders online. The underwriters may agree with us to allocate a specific number of common units for sale to online brokerage account holders. Any such allocation for online distributions will be made by the underwriters on the same basis as other allocations.
Other than the prospectus in electronic format, the information on any underwriter's website and any information contained in any other website maintained by the underwriters is not part of this prospectus or the registration statement of which this prospectus forms a part, has not been approved or endorsed by us or any underwriters in its capacity as underwriter and should not be relied upon by investors.
FINRA Rules
Because FINRA is expected to view the common units offered hereby as interests in a direct participation program, this offering is being made in compliance with Rule 2310 of the FINRA rules. Investor suitability with respect to the common units should be judged similarly to the suitability with respect to other securities that are listed for trading on a national securities exchange. In addition, investor suitability will take into account the eligible citizen requirements set forth in our partnership agreement. Please read "Description of the Common Units—Transfer of Common Units" and "The Partnership Agreement—Ineligible Citizens; Redemption."
The validity of our common units will be passed upon for us by Vinson & Elkins L.L.P., New York, New York. Certain legal matters in connection with our common units offered hereby will be passed upon for the underwriters by Latham & Watkins LLP, New York, New York.
The consolidated financial statements of Rhino Energy LLC as of December 31, 2009 and 2008 and for the years ended December 31, 2007, 2008 and 2009 included in this prospectus and the related consolidated financial statement schedule included elsewhere in this registration statement have been audited by Deloitte & Touche LLP, an independent registered public accounting firm, as stated in their reports appearing herein and elsewhere in this registration statement. Such consolidated financial statements and consolidated financial statement schedule have been so included in reliance upon the reports of such firm given upon their authority as experts in accounting and auditing.
The statement of financial position of Rhino Resource Partners LP as of April 19, 2010 (date of inception), included in this prospectus, has been audited by Deloitte & Touche LLP, an independent registered public accounting firm, as stated in their report appearing herein and elsewhere in this prospectus. Such statement of financial position has been so included in reliance upon the report of such firm given upon their authority as experts in accounting and auditing.
The information included in this prospectus relating to the estimates of our and the joint venture's proven and probable coal reserves and non-reserve coal deposits is derived from internal estimates, which estimates were audited by Marshall Miller & Associates, Inc., an independent engineering firm, and has been included herein upon the authority of this firm as an expert.
WHERE YOU CAN FIND MORE INFORMATION
We have filed with the SEC a registration statement on Form S-1 regarding our common units. This prospectus, which constitutes part of the registration statement, does not contain all of the information set forth in the registration statement. For further information regarding us and our common units offered in this prospectus, we refer you to the registration statement and the exhibits and schedule filed as part of the registration statement. The registration statement, including the exhibits, may be inspected and copied at the public reference facilities maintained by the SEC at 100 F Street, N.E., Room 1580, Washington, D.C. 20549. Copies of this material can also be obtained upon written request from the Public Reference Section of the SEC at 100 F Street, N.E., Room 1580, Washington, D.C. 20549, at prescribed rates or from the SEC's web site on the Internet athttp://www.sec.gov. Please call the SEC at 1-800-SEC-0330 for further information on public reference rooms.
As a result of the offering, we will file with or furnish to the SEC periodic reports and other information. These reports and other information may be inspected and copied at the public reference facilities maintained by the SEC or obtained from the SEC's website as provided above. Our website address on the Internet will behttp://rhinolp.com, and we intend to make our periodic reports and other information filed with or furnished to the SEC available, free of charge, through our website, as soon as reasonably practicable after those reports and other information are electronically filed with or furnished to the SEC. Information on our website or any other website is not incorporated by reference into this prospectus and does not constitute a part of this prospectus.
We intend to furnish or make available to our unitholders annual reports containing our audited financial statements prepared in accordance with GAAP. We also intend to furnish or make available to our unitholders quarterly reports containing our unaudited interim financial information, including the information required by Form 10-Q, for the first three fiscal quarters of each fiscal year.
Some of the information in this prospectus may contain forward-looking statements. These statements can be identified by the use of forward-looking terminology including "will," "may," "believe," "expect," "anticipate," "estimate," "continue," or other similar words. These statements discuss future expectations, contain projections of results of operations or of financial condition, or state other "forward-looking" information. These forward-looking statements involve risks and uncertainties. When considering these forward-looking statements, you should keep in mind the risk factors and other cautionary statements in this prospectus. The risk factors and other factors noted throughout this prospectus could cause our actual results to differ materially from those contained in any forward-looking statement.
RHINO RESOURCE PARTNERS LP | |||
UNAUDITED PRO FORMA CONDENSED CONSOLIDATED FINANCIAL STATEMENTS | |||
Introduction | F-2 | ||
Unaudited Pro Forma Condensed Consolidated Statement of Financial Position as of | F-3 | ||
Unaudited Pro Forma Condensed Consolidated Statement of Operations for the | F-4 | ||
Unaudited Pro Forma Condensed Consolidated Statement of Operations for the Year ended December 31, 2009 | F-5 | ||
Notes to Unaudited Pro Forma Condensed Consolidated Financial Statements | F-6 | ||
RHINO ENERGY LLC | |||
UNAUDITED CONDENSED CONSOLIDATED FINANCIAL STATEMENTS | |||
Unaudited Condensed Consolidated Statement of Financial Position as of | F-10 | ||
Unaudited Condensed Consolidated Statements of Operations | F-11 | ||
Unaudited Condensed Consolidated Statements of Cash Flows for the | F-12 | ||
Notes to Unaudited Condensed Consolidated Financial Statements | F-13 | ||
AUDITED CONSOLIDATED FINANCIAL STATEMENTS | |||
Report of Independent Registered Public Accounting Firm | F-23 | ||
Consolidated Statements of Financial Position as of December 31, 2009 and 2008 | F-24 | ||
Consolidated Statements of Operations and Comprehensive Income for the Years Ended December 31, 2009, 2008 and 2007 | F-25 | ||
Consolidated Statements of Members' Equity for the Years Ended December 31, 2009, 2008 and 2007 | F-26 | ||
Consolidated Statements of Cash Flows for the Years Ended December 31, 2009, 2008 and 2007 | F-27 | ||
Notes to Consolidated Financial Statements | F-28 | ||
RHINO RESOURCE PARTNERS LP | |||
AUDITED STATEMENT OF FINANCIAL POSITION | |||
Report of Independent Registered Public Accounting Firm | F-50 | ||
Statement of Financial Position as of April 19, 2010 (Date of Inception) | F-51 | ||
Notes to the Statements of Financial Position | F-52 | ||
RHINO RESOURCE PARTNERS LP
UNAUDITED PRO FORMA CONDENSED CONSOLIDATED FINANCIAL STATEMENTS
The unaudited pro forma condensed consolidated financial statements for Rhino Resource Partners LP (the "Partnership") have been derived from the audited historical and unaudited historical condensed consolidated financial statements of Rhino Energy LLC and its subsidiaries (the "Predecessor") set forth elsewhere in this prospectus and are qualified in their entirety by reference to such financial statements and related notes contained therein. The unaudited pro forma condensed consolidated financial statements should be read in conjunction with the notes accompanying such financial statements and with the audited historical and unaudited historical condensed consolidated financial statements and related notes of the Predecessor set forth elsewhere in this prospectus.
The unaudited pro forma condensed consolidated financial statements were derived by adjusting the audited historical and unaudited historical condensed consolidated financial statements of the Predecessor. The adjustments are based upon currently available information and certain estimates and assumptions; therefore, actual adjustments will differ from the pro forma adjustments. However, management believes that the estimates and assumptions provide a reasonable basis for presenting the significant effects of the transactions as contemplated and that the pro forma adjustments give appropriate effect to those estimates and assumptions and are properly applied in the unaudited pro forma condensed consolidated financial information.
The unaudited pro forma condensed consolidated financial data are not necessarily indicative of the results that actually would have occurred if the Partnership had assumed the operations of the Predecessor on the dates indicated nor are they indicative of future results.
RHINO RESOURCE PARTNERS LP
UNAUDITED PRO FORMA CONDENSED CONSOLIDATED
STATEMENT OF FINANCIAL POSITION
AS OF MARCH 31,JUNE 30, 2010
| | | Rhino Energy LLC Historical | Pro Forma Adjustments | Rhino Resource Partners LP Pro Forma | | Rhino Energy LLC Historical | Pro Forma Adjustments | Rhino Resource Partners LP Pro Forma | ||||||||||||||||||
|---|---|---|---|---|---|---|---|---|---|---|---|---|---|---|---|---|---|---|---|---|---|---|---|---|---|---|
ASSETS | ASSETS | ASSETS | ||||||||||||||||||||||||
CURRENT ASSETS: | ||||||||||||||||||||||||||
CURRENT ASSETS: | ||||||||||||||||||||||||||
Cash and cash equivalents | $ | 187,671 | $ | 64,880,000 | (a) | $ | 187,671 | |||||||||||||||||||
Cash and cash equivalents | $ | 347,428 | $ | 75,000,000 | (a) | $ | 347,428 | 10,120,000 | (b) | |||||||||||||||||
| (8,050,000 | ) (b) | (7,366,900 | ) (c) | |||||||||||||||||||||||
| (66,950,000 | ) (c) | (67,633,100 | ) (d) | |||||||||||||||||||||||
Accounts receivable, net of allowance for doubtful accounts of $0 | 27,753,929 | — | 27,753,929 | Accounts receivable, net of allowance for doubtful accounts of $0 | 22,382,910 | — | 22,382,910 | |||||||||||||||||||
Inventories | 20,323,102 | — | 20,323,102 | Inventories | 20,231,237 | — | 20,231,237 | |||||||||||||||||||
Advance royalties, current portion | 1,014,588 | — | 1,014,588 | Advance royalties, current portion | 1,014,588 | — | 1,014,588 | |||||||||||||||||||
Prepaid expenses and other | 3,721,005 | — | 3,721,005 | Prepaid expenses and other | 5,888,016 | — | 5,888,016 | |||||||||||||||||||
Total current assets | 53,160,052 | — | 53,160,052 | Total current assets | 49,704,422 | — | 49,704,422 | |||||||||||||||||||
PROPERTY, PLANT AND EQUIPMENT: | PROPERTY, PLANT AND EQUIPMENT: | |||||||||||||||||||||||||
At cost, including coal properties, mine development and contract costs | 405,540,339 | — | 405,540,339 | At cost, including coal properties, mine development and contract costs | 410,111,777 | — | 410,111,777 | |||||||||||||||||||
Less accumulated depreciation, depletion and amortization | (135,937,094 | ) | — | (135,937,094 | ) | Less accumulated depreciation, depletion and amortization | (143,755,048 | ) | — | (143,755,048 | ) | |||||||||||||||
Net property, plant and equipment | 269,603,245 | — | 269,603,245 | Net property, plant and equipment | 266,356,729 | — | 266,356,729 | |||||||||||||||||||
Advance royalties, net of current portion | 3,837,513 | — | 3,837,513 | Advance royalties, net of current portion | 3,967,819 | — | 3,967,819 | |||||||||||||||||||
Investment in unconsolidated affiliate | 17,056,473 | — | 17,056,473 | Investment in unconsolidated affiliate | 17,600,308 | — | 17,600,308 | |||||||||||||||||||
Goodwill | 201,500 | — | 201,500 | Goodwill | 201,500 | — | 201,500 | |||||||||||||||||||
Intangible assets | 754,637 | — | 754,637 | Intangible assets | 742,784 | — | 742,784 | |||||||||||||||||||
Other non-current assets | 2,874,144 | — | 2,874,144 | Other non-current assets | 2,323,781 | — | 2,323,781 | |||||||||||||||||||
TOTAL | $ | 347,487,564 | $ | — | $ | 347,487,564 | TOTAL | $ | 340,897,343 | $ | — | $ | 340,897,343 | |||||||||||||
LIABILITIES | LIABILITIES | LIABILITIES | ||||||||||||||||||||||||
CURRENT LIABILITIES: | CURRENT LIABILITIES: | |||||||||||||||||||||||||
Accounts payable | $ | 10,877,001 | $ | — | $ | 10,877,001 | Accounts payable | $ | 12,148,075 | $ | — | $ | 12,148,075 | |||||||||||||
Accrued expenses and other | 16,914,937 | — | 16,914,937 | Accrued expenses and other | 17,335,880 | — | 17,335,880 | |||||||||||||||||||
Current portion of long-term debt | 1,098,521 | — | 1,098,521 | Current portion of long-term debt | 721,514 | — | 721,514 | |||||||||||||||||||
Current portion of asset retirement obligations | 5,427,614 | — | 5,427,614 | Current portion of asset retirement obligations | 5,427,614 | — | 5,427,614 | |||||||||||||||||||
Current portion of postretirement benefits | 95,139 | — | 95,139 | Current portion of postretirement benefits | 95,139 | — | 95,139 | |||||||||||||||||||
Total current liabilities | 34,413,212 | — | 34,413,212 | Total current liabilities | 35,728,222 | — | 35,728,222 | |||||||||||||||||||
NON-CURRENT LIABILITIES | NON-CURRENT LIABILITIES | |||||||||||||||||||||||||
Long-term debt | 122,734,331 | (66,950,000 | ) (c) | 55,784,331 | Long-term debt | 107,732,727 | (67,633,100 | ) (d) | 40,099,627 | |||||||||||||||||
Asset retirement obligations | 40,024,123 | — | 40,024,123 | Asset retirement obligations | 39,892,824 | — | 39,892,824 | |||||||||||||||||||
Other non-current liabilities | 83,314 | — | 83,314 | Postretirement benefits | 5,457,163 | — | 5,457,163 | |||||||||||||||||||
Postretirement benefits | 5,288,147 | — | 5,288,147 | |||||||||||||||||||||||
Total non-current liabilities | 153,082,714 | (67,633,100 | ) | 85,449,614 | ||||||||||||||||||||||
Total non-current liabilities | 168,129,915 | (66,950,000 | ) | 101,179,915 | ||||||||||||||||||||||
Total liabilities | 188,810,936 | (67,633,100 | ) | 121,177,836 | ||||||||||||||||||||||
Total liabilities | 202,543,127 | (66,950,000 | ) | 135,593,127 | ||||||||||||||||||||||
EQUITY | EQUITY | EQUITY | ||||||||||||||||||||||||
MEMBERS' EQUITY: | MEMBERS' EQUITY: | |||||||||||||||||||||||||
Members' investment | $ | 22,907,364 | $ | (22,907,364 | ) (d) | $ | — | Members' investment | $ | 22,907,427 | $ | (22,907,427 | ) (e) | $ | — | |||||||||||
| 75,000,000 | (a) | 64,880,000 | (a) | |||||||||||||||||||||||
| (8,050,000 | ) (b) | 10,120,000 | (b) | |||||||||||||||||||||||
| (66,950,000 | ) (c) | (7,366,900 | ) (c) | |||||||||||||||||||||||
Retained earnings | 120,559,882 | (120,559,882 | ) (d) | — | (67,633,100 | ) (d) | ||||||||||||||||||||
Accumulated other comprehensive income (loss) | 1,477,191 | (1,477,191 | ) (e) | — | Retained earnings | 127,701,789 | (127,701,789 | ) (e) | — | |||||||||||||||||
Accumulated other comprehensive income (loss) | 1,477,191 | (1,477,191 | ) (f) | — | ||||||||||||||||||||||
Total members' equity | 144,944,437 | (144,944,437 | ) | — | ||||||||||||||||||||||
Total members' equity | 152,086,407 | (152,086,407 | ) | — | ||||||||||||||||||||||
PARTNERS' EQUITY: | ||||||||||||||||||||||||||
Limited partner interests | PARTNERS' EQUITY: | |||||||||||||||||||||||||
Common Units (12,397,000 units) | — | 103,104,451 | (d) | 103,104,451 | Limited partner interests | |||||||||||||||||||||
Subordinated Units (12,397,000 units) | — | 103,104,451 | (d) | 103,104,451 | Common Units (12,397,000 units) | — | 106,938,735 | (e) | 106,938,735 | |||||||||||||||||
General partner interest (506,000 notional units) | — | 4,208,345 | (d) | 4,208,345 | Subordinated Units (12,397,000 units) | — | 106,938,735 | (e) | 106,938,735 | |||||||||||||||||
Accumulated other comprehensive income (loss) | — | 1,477,191 | (e) | 1,477,191 | General partner interest (506,000 notional units) | — | 4,364,846 | (e) | 4,364,846 | |||||||||||||||||
Accumulated other comprehensive income (loss) | — | 1,477,191 | (f) | 1,477,191 | ||||||||||||||||||||||
Total partners' equity | — | 211,894,437 | 211,894,437 | |||||||||||||||||||||||
Total partners' equity | — | 219,719,507 | 219,719,507 | |||||||||||||||||||||||
TOTAL | $ | 347,487,564 | $ | — | $ | 347,487,564 | ||||||||||||||||||||
TOTAL | $ | 340,897,343 | $ | — | $ | 340,897,343 | ||||||||||||||||||||
See notes to unaudited pro forma condensed consolidated financial statements.
RHINO RESOURCE PARTNERS LP
UNAUDITED PRO FORMA CONSOLIDATED STATEMENT OF OPERATIONS
FOR THE THREESIX MONTHS ENDED MARCH 31,JUNE 30, 2010
| | | Rhino Energy LLC Historical | Pro Forma Adjustments | Rhino Resource Partners LP Pro Forma | | Rhino Energy LLC Historical | Pro Forma Adjustments | Rhino Resource Partners LP Pro Forma | ||||||||||||||||
|---|---|---|---|---|---|---|---|---|---|---|---|---|---|---|---|---|---|---|---|---|---|---|---|---|
REVENUES: | REVENUES: | REVENUES: | ||||||||||||||||||||||
Coal revenues | $ | 62,642,227 | $ | — | $ | 62,642,227 | Coal revenues | $ | 136,735,856 | $ | — | $ | 136,735,856 | |||||||||||
Freight and handling revenues | 942,239 | — | 942,239 | Freight and handling revenues | 1,947,208 | — | 1,947,208 | |||||||||||||||||
Other revenues | 3,018,165 | — | 3,018,165 | Other revenues | 6,347,715 | — | 6,347,715 | |||||||||||||||||
Total revenues | 66,602,631 | — | 66,602,631 | Total revenues | 145,030,779 | — | 145,030,779 | |||||||||||||||||
COSTS AND EXPENSES: | COSTS AND EXPENSES: | COSTS AND EXPENSES: | ||||||||||||||||||||||
Cost of operations (exclusive of depreciation, depletion and amortization shown separately below) | 104,191,981 | — | 104,191,981 | |||||||||||||||||||||
Cost of operations (exclusive of depreciation, depletion and amortization shown separately below) | 46,351,743 | — | 46,351,743 | Freight and handling costs | 1,444,242 | — | 1,444,242 | |||||||||||||||||
Freight and handling costs | 673,164 | — | 673,164 | Depreciation, depletion and amortization | 15,802,886 | — | 15,802,886 | |||||||||||||||||
Depreciation, depletion and amortization | 7,764,542 | — | 7,764,542 | Selling, general and administrative (exclusive of depreciation, depletion and amortization shown separately above) | 7,603,988 | — | 7,603,988 | |||||||||||||||||
Selling, general and administrative (exclusive of depreciation, depletion and amortization shown separately above) | 3,677,680 | — | 3,677,680 | (Gain) loss on sale of assets | (46,771 | ) | — | (46,771 | ) | |||||||||||||||
(Gain) loss on sale of assets | (750 | ) | — | (750 | ) | |||||||||||||||||||
Total costs and expenses | 128,996,326 | — | 128,996,326 | |||||||||||||||||||||
Total costs and expenses | 58,466,379 | — | 58,466,379 | |||||||||||||||||||||
INCOME FROM OPERATIONS | INCOME FROM OPERATIONS | 8,136,252 | — | 8,136,252 | INCOME FROM OPERATIONS | 16,034,453 | — | 16,034,453 | ||||||||||||||||
INTEREST AND OTHER INCOME (EXPENSE) | INTEREST AND OTHER INCOME (EXPENSE) | INTEREST AND OTHER INCOME (EXPENSE) | ||||||||||||||||||||||
Interest expense | (1,470,632 | ) | 478,916 | (d) | (991,716 | ) | Interest expense | (2,781,007 | ) | 905,748 | (e) | (1,875,259 | ) | |||||||||||
Interest income and other | 8,076 | — | 8,076 | Interest income and other | 18,382 | — | 18,382 | |||||||||||||||||
Equity in net income (loss) of unconsolidated affiliate | (129,889 | ) | — | (129,889 | ) | Equity in net income (loss) of unconsolidated affiliate | 413,946 | — | 413,946 | |||||||||||||||
Total interest and other expenses | (1,592,445 | ) | 478,916 | (1,113,529 | ) | Total interest and other expenses | (2,348,679 | ) | 905,748 | (1,442,931 | ) | |||||||||||||
INCOME BEFORE INCOME TAXES | INCOME BEFORE INCOME TAXES | 6,543,807 | 478,916 | 7,022,723 | INCOME BEFORE INCOME TAXES | 13,685,774 | 905,748 | 14,591,522 | ||||||||||||||||
INCOME TAX EXPENSE | INCOME TAX EXPENSE | — | — | — | INCOME TAX EXPENSE | — | — | — | ||||||||||||||||
NET INCOME | NET INCOME | $ | 6,543,807 | $ | 478,916 | $ | 7,022,723 | NET INCOME | $ | 13,685,774 | $ | 905,748 | $ | 14,591,522 | ||||||||||
General partner's interest in net income | General partner's interest in net income | $ | 140,454 | General partner's interest in net income | $ | 291,830 | ||||||||||||||||||
Common unitholders' interest in net income | Common unitholders' interest in net income | $ | 4,457,569 | Common unitholders' interest in net income | $ | 7,198,893 | ||||||||||||||||||
Subordinated unitholders' interest in net income | Subordinated unitholders' interest in net income | $ | 2,424,700 | Subordinated unitholders' interest in net income | $ | 7,100,799 | ||||||||||||||||||
Net income per limited partner unit, basic: | Net income per limited partner unit, basic: | Net income per limited partner unit, basic: | ||||||||||||||||||||||
Common units | $ | 0.360 | Common units | $ | 0.581 | |||||||||||||||||||
Subordinated units | $ | 0.196 | Subordinated units | $ | 0.573 | |||||||||||||||||||
Net income per limited partner unit, diluted: | Net income per limited partner unit, diluted: | Net income per limited partner unit, diluted: | ||||||||||||||||||||||
Common Units | $ | 0.358 | Common units | $ | 0.578 | |||||||||||||||||||
Subordinated Units | $ | 0.196 | Subordinated units | $ | 0.573 | |||||||||||||||||||
Weighted average number of limited partner units outstanding, basic: | Weighted average number of limited partner units outstanding, basic: | Weighted average number of limited partner units outstanding, basic: | ||||||||||||||||||||||
Common units | 12,397,000 | Common units | 12,397,000 | |||||||||||||||||||||
Subordinated units | 12,397,000 | Subordinated units | 12,397,000 | |||||||||||||||||||||
Weighted average number of limited partner units outstanding, diluted: | Weighted average number of limited partner units outstanding, diluted: | Weighted average number of limited partner units outstanding, diluted: | ||||||||||||||||||||||
Common Units | 12,447,417 | Common units | 12,445,073 | |||||||||||||||||||||
Subordinated Units | 12,397,000 | Subordinated units | 12,397,000 | |||||||||||||||||||||
See notes to unaudited pro forma condensed consolidated financial statements.
RHINO RESOURCE PARTNERS LP
UNAUDITED PRO FORMA CONDENSED CONSOLIDATED STATEMENT OF OPERATIONS
FOR THE YEAR ENDED DECEMBER 31, 2009
| | | Rhino Energy LLC Historical | Pro Forma Adjustments | Rhino Resource Partners LP Pro Forma | | Rhino Energy LLC Historical | Pro Forma Adjustments | Rhino Resource Partners LP Pro Forma | ||||||||||||||||
|---|---|---|---|---|---|---|---|---|---|---|---|---|---|---|---|---|---|---|---|---|---|---|---|---|
REVENUES: | REVENUES: | REVENUES: | ||||||||||||||||||||||
Coal revenues | $ | 401,751,460 | $ | — | $ | 401,751,460 | Coal revenues | $ | 401,751,460 | $ | — | $ | 401,751,460 | |||||||||||
Freight and handling revenues | 5,049,973 | — | 5,049,973 | Freight and handling revenues | 5,049,973 | — | 5,049,973 | |||||||||||||||||
Other revenues | 12,988,181 | — | 12,988,181 | Other revenues | 12,988,181 | — | 12,988,181 | |||||||||||||||||
Total revenues | 419,789,614 | — | 419,789,614 | Total revenues | 419,789,614 | — | 419,789,614 | |||||||||||||||||
COSTS AND EXPENSES: | COSTS AND EXPENSES: | COSTS AND EXPENSES: | ||||||||||||||||||||||
Cost of operations (exclusive of depreciation, depletion and amortization shown separately below) | 336,335,159 | — | 336,335,159 | Cost of operations (exclusive of depreciation, depletion and amortization shown separately below) | 336,335,159 | — | 336,335,159 | |||||||||||||||||
Freight and handling costs | 3,990,304 | — | 3,990,304 | Freight and handling costs | 3,990,304 | — | 3,990,304 | |||||||||||||||||
Depreciation, depletion and amortization | 36,279,249 | — | 36,279,249 | Depreciation, depletion and amortization | 36,279,249 | — | 36,279,249 | |||||||||||||||||
Selling, general and administrative (exclusive of depreciation, depletion and amortization) | 16,754,235 | — | 16,754,235 | Selling, general and administrative (exclusive of depreciation, depletion and amortization) | 16,754,235 | — | 16,754,235 | |||||||||||||||||
(Gain) loss on sale of assets | 1,709,904 | — | 1,709,904 | (Gain) loss on sale of assets | 1,709,904 | — | 1,709,904 | |||||||||||||||||
Total costs and expenses | 395,068,851 | — | 395,068,851 | Total costs and expenses | 395,068,851 | — | 395,068,851 | |||||||||||||||||
INCOME (LOSS) FROM OPERATIONS | INCOME (LOSS) FROM OPERATIONS | 24,720,763 | — | 24,720,763 | INCOME (LOSS) FROM OPERATIONS | 24,720,763 | — | 24,720,763 | ||||||||||||||||
INTEREST AND OTHER INCOME (EXPENSE) | INTEREST AND OTHER INCOME (EXPENSE) | INTEREST AND OTHER INCOME (EXPENSE) | ||||||||||||||||||||||
Interest expense | (6,222,208 | ) | 1,931,508 | (d) | (4,290,701 | ) | Interest expense | (6,222,208 | ) | 1,951,215 | (e) | (4,270,993 | ) | |||||||||||
Interest income | 70,737 | — | 70,737 | Interest income and other | 70,737 | — | 70,737 | |||||||||||||||||
Equity in net income (loss) of unconsolidated affiliate | 892,873 | — | 892,873 | Equity in net income (loss) of unconsolidated affiliate | 892,873 | — | 892,873 | |||||||||||||||||
Total interest and other expenses | (5,258,598 | ) | 1,931,508 | (3,327,091 | ) | Total interest and other expenses | (5,258,598 | ) | 1,951,215 | (3,307,383 | ) | |||||||||||||
INCOME BEFORE INCOME TAXES | INCOME BEFORE INCOME TAXES | 19,462,165 | 1,931,508 | 21,393,673 | INCOME BEFORE INCOME TAXES | 19,462,165 | 1,951,215 | 21,413,380 | ||||||||||||||||
INCOME TAX EXPENSE | INCOME TAX EXPENSE | — | — | — | INCOME TAX EXPENSE | — | — | — | ||||||||||||||||
NET INCOME | NET INCOME | $ | 19,462,165 | $ | 1,931,508 | $ | 21,393,673 | NET INCOME | $ | 19,462,165 | $ | 1,951,215 | $ | 21,413,380 | ||||||||||
General partner's interest in net income | General partner's interest in net income | $ | 427,873 | General partner's interest in net income | $ | 428,268 | ||||||||||||||||||
Common unitholders' interest in net income | Common unitholders' interest in net income | $ | 16,190,110 | Common unitholders' interest in net income | $ | 16,190,108 | ||||||||||||||||||
Subordinated unitholders' interest in net income | Subordinated unitholders' interest in net income | $ | 4,775,690 | Subordinated unitholders' interest in net income | $ | 4,795,004 | ||||||||||||||||||
Net income per limited partner unit, basic: | Net income per limited partner unit, basic: | Net income per limited partner unit, basic: | ||||||||||||||||||||||
Common units | $ | 1.306 | Common units | $ | 1.306 | |||||||||||||||||||
Subordinated units | $ | 0.385 | Subordinated units | $ | 0.387 | |||||||||||||||||||
Net income per limited partner unit, diluted: | Net income per limited partner unit, diluted: | Net income per limited partner unit, diluted: | ||||||||||||||||||||||
Common Units | $ | 1.304 | Common units | $ | 1.305 | |||||||||||||||||||
Subordinated Units | $ | 0.385 | Subordinated units | $ | 0.387 | |||||||||||||||||||
Weighted average number of limited partner units outstanding, basic: | Weighted average number of limited partner units outstanding, basic: | Weighted average number of limited partner units outstanding, basic: | ||||||||||||||||||||||
Common units | 12,397,000 | Common units | 12,397,000 | |||||||||||||||||||||
Subordinated units | 12,397,000 | Subordinated units | 12,397,000 | |||||||||||||||||||||
Weighted average number of limited partner units outstanding, diluted: | Weighted average number of limited partner units outstanding, diluted: | Weighted average number of limited partner units outstanding, diluted: | ||||||||||||||||||||||
Common Units | 12,411,479 | Common units | 12,410,073 | |||||||||||||||||||||
Subordinated Units | 12,397,000 | Subordinated units | 12,397,000 | |||||||||||||||||||||
See notes to unaudited pro forma condensed consolidated financial statements.
RHINO RESOURCE PARTNERS LP
NOTES TO UNAUDITED PRO FORMA CONDENSED CONSOLIDATED FINANCIAL STATEMENTS
AS OF AND FOR THE THREESIX MONTHS ENDED MARCH 31,JUNE 30, 2010 AND FOR THE YEAR
ENDED DECEMBER 31, 2009
1. ORGANIZATION AND BASIS OF PRESENTATION
Upon the consummation of the initial public offering of common units, representing limited partner interests, of Rhino Resource Partners LP (the "Partnership"), the Partnership will own and operate the business of Rhino Energy LLC (the "Predecessor"). The contribution of the business of the Predecessor to the Partnership will be recorded at historical cost as it is considered to be a reorganization of entities under common control.
The unaudited pro forma condensed consolidated financial statements as of and for the threesix months ended March 31,June 30, 2010 are derived from the unaudited historical condensed consolidated financial statements of the Predecessor. The unaudited pro forma condensed consolidated financial statements for the year ended December 31, 2009 are derived from the audited historical consolidated financial statements of the Predecessor. The unaudited pro forma condensed consolidated financial statements reflect the following transactions:
The unaudited pro forma condensed consolidated statement of financial position as of March 31,June 30, 2010 assumes the above transactions occurred as of March 31,June 30, 2010. The unaudited pro forma condensed consolidated statements of operations for the year ended December 31, 2009 and the threesix months ended March 31,June 30, 2010 assume that the above transactions occurred on January 1, 2009.
Upon the consummation of this offering, the Partnership expects to incur incremental selling, general and administrative expenses related to becoming a publicly traded partnership (e.g., cost of tax return preparation, annual and quarterly reports to unitholders, stock exchange listing fees and registrar and transfer agent fees) in an annual amount of approximately
RHINO RESOURCE PARTNERS LP
NOTES TO UNAUDITED PRO FORMA CONDENSED CONSOLIDATED FINANCIAL STATEMENTS
AS OF AND FOR THE THREESIX MONTHS ENDED MARCH 31,JUNE 30, 2010 AND FOR THE YEAR
ENDED DECEMBER 31, 2009 (Continued)
1. ORGANIZATION AND BASIS OF PRESENTATION (Continued)
$3.0 million. The unaudited pro forma condensed consolidated financial statements do not reflect this $3.0 million in incremental selling, general and administrative expenses.
The unaudited pro forma condensed consolidated financial statements have been prepared on the basis that the Partnership will be treated as a partnership for federal income tax purposes. The unaudited pro forma condensed consolidated financial statements assume that the underwriters' option to purchase additional common units is not exercised.
2. PRO FORMA ADJUSTMENTS AND ASSUMPTIONS
The adjustments are based upon currently available information and certain estimates and assumptions; therefore, actual adjustments will differ from the pro forma adjustments. A general description of these adjustments is provided as follows:
RHINO RESOURCE PARTNERS LP
NOTES TO UNAUDITED PRO FORMA CONDENSED CONSOLIDATED FINANCIAL STATEMENTS
AS OF AND FOR THE THREESIX MONTHS ENDED MARCH 31,JUNE 30, 2010 AND FOR THE YEAR
ENDED DECEMBER 31, 2009 (Continued)
2. PRO FORMA ADJUSTMENTS AND ASSUMPTIONS (Continued)
The net change in interest expense reflects the repayment of indebtedness outstanding under the credit agreement of $67.0$67.6 million at January 1, 2009. The individual components of the net change in interest expense are as follows:
| | Year Ended December 31, 2009 | Three Months Ended March 31, 2010 | |||||||
|---|---|---|---|---|---|---|---|---|---|
Revolving credit facility (1) | $ | 2,292,791 | $ | 415,052 | |||||
Commitment fee on the unused portion of the credit facility (2) | 382,587 | 121,713 | |||||||
Letters of credit (3) | 719,880 | 169,227 | |||||||
Note payable to Applied Financials (4) | 68,738 | 12,824 | |||||||
Note payable to H&L Construction Co., Inc. (5) | 139,177 | 44,874 | |||||||
Note payable to TJ Core Drilling, Inc. (6) | 2,172 | 2,172 | |||||||
Note payable to Sands Hill Coal Co., Inc. (7) | 46,404 | 46,404 | |||||||
Note payable to others (8) | 26,028 | — | |||||||
Deferred financing costs (9) | 612,924 | 179,450 | |||||||
Total pro forma interest expense | 4,290,701 | 991,716 | |||||||
Less: Historical interest expense | (6,222,208 | ) | (1,470,632 | ) | |||||
Pro forma interest expense adjustment | $ | (1,931,508 | ) | $ | (478,916 | ) | |||
| | Year Ended December 31, 2009 | Six Months Ended June 30, 2010 | |||||||
|---|---|---|---|---|---|---|---|---|---|
Revolving credit facility (1) | $ | 2,270,522 | $ | 737,932 | |||||
Commitment fee on the unused portion of the credit facility (2) | 385,149 | 250,672 | |||||||
Letters of credit (3) | 719,880 | 326,189 | |||||||
Note payable to Applied Financials (4) | 68,738 | 15,443 | |||||||
Note payable to H&L Construction Co., Inc. (5) | 139,177 | 87,754 | |||||||
Note payable to TJ Core Drilling, Inc. (6) | 2,172 | 4,164 | |||||||
Note payable to Sands Hill Coal Co., Inc. (7) | 46,404 | 94,124 | |||||||
Note payable to others (8) | 26,027 | — | |||||||
Deferred financing costs (9) | 612,924 | 358,981 | |||||||
Total pro forma interest expense | 4,270,993 | 1,875,259 | |||||||
Less: Historical interest expense | (6,222,208 | ) | (2,781,007 | ) | |||||
Pro forma interest expense adjustment | $ | (1,951,215 | ) | $ | (905,748 | ) | |||
RHINO RESOURCE PARTNERS LP
NOTES TO UNAUDITED PRO FORMA CONDENSED CONSOLIDATED FINANCIAL STATEMENTS
AS OF AND FOR THE THREESIX MONTHS ENDED MARCH 31,JUNE 30, 2010 AND FOR THE YEAR
ENDED DECEMBER 31, 2009 (Continued)
2. PRO FORMA ADJUSTMENTS AND ASSUMPTIONS (Continued)
3. PRO FORMA NET INCOME PER UNIT
Pro forma net income per limited partner unit is determined by dividing the pro forma net income that would have been allocated in accordance with the net income and loss allocation provisions of the limited partnership agreement to the common and subordinated unitholders under the two-class method, after deducting the general partner's 2.0% interest in pro forma net income, by the number of common and subordinated units expected to be outstanding at the closing of this offering. For purposes of this calculation, we assumed the number of common and subordinated units outstanding were 12,397,000 and 12,397,000, respectively. All units were assumed to have been outstanding since January 1, 2009. Pursuant to the partnership agreement, to the extent that the quarterly distributions exceed certain targets, the general partner is entitled to receive certain incentive distributions that will result in more net income proportionately being allocated to the general partner than to the holders of common and subordinated units. The pro forma net income per unit calculations assume that no incentive distributions were made to the general partner because no such distribution would have been paid based upon the pro forma available cash from operating surplus for the threesix months ended March 31,June 30, 2010, or the year ended December 31, 2009. Our pro forma calculations did not give effect to the option to purchase additional common units that may be exercised by the underwriters.
Accounting Standards Codification (or ASC) 260 (formerly Emerging Issues Task Force Issue No. 03-06,Participating Securities and the Two-Class Method under FASB Statement No. 128), addresses the computation of earnings per share by entities that have issued securities other than common stock that contractually entitle the holder to participate in dividends and earnings of the entity. ASC 260 provides that the general partner's interest in net income is to be calculated based on the amount that would be allocated to the general partner if all the net income for the period were distributed, and not on the basis of actual cash distributions for the period. The application of ASC 260 may have an impact on earnings per limited partner unit in future periods if there are material differences between net income and actual cash distributions or if other participating securities are issued.
RHINO ENERGY LLC
UNAUDITED CONDENSED CONSOLIDATED STATEMENTS OF FINANCIAL POSITION
AS OF MARCH 31,JUNE 30, 2010 AND DECEMBER 31, 2009
| | | March 31, 2010 | December 31, 2009 | | June 30, 2010 | December 31, 2009 | ||||||||||||
|---|---|---|---|---|---|---|---|---|---|---|---|---|---|---|---|---|---|---|
ASSETS | ASSETS | ASSETS | ||||||||||||||||
CURRENT ASSETS: | CURRENT ASSETS: | CURRENT ASSETS: | ||||||||||||||||
Cash and cash equivalents | $ | 347,428 | $ | 686,537 | Cash and cash equivalents | $ | 187,671 | $ | 686,537 | |||||||||
Accounts receivable, net of allowance for doubtful accounts ($0 as of March 31, 2010 and $18,992 as of December 31, 2009, respectively) | 27,753,929 | 24,383,376 | Accounts receivable, net of allowance for doubtful accounts ($0 as of June 30, 2010 and $18,992 as of December 31, 2009, respectively) | 22,382,910 | 24,383,376 | |||||||||||||
Inventories | 20,323,102 | 14,171,907 | Inventories | 20,231,237 | 14,171,907 | |||||||||||||
Advance royalties, current portion | 1,014,588 | 1,014,588 | Advance royalties, current portion | 1,014,588 | 1,014,588 | |||||||||||||
Prepaid expenses and other | 3,721,005 | 4,569,464 | Prepaid expenses and other | 5,888,016 | 4,569,464 | |||||||||||||
Total current assets | 53,160,052 | 44,825,872 | Total current assets | 49,704,422 | 44,825,872 | |||||||||||||
PROPERTY, PLANT AND EQUIPMENT: | PROPERTY, PLANT AND EQUIPMENT: | PROPERTY, PLANT AND EQUIPMENT: | ||||||||||||||||
At cost, including coal properties, mine development and construction costs | 405,540,339 | 398,903,511 | At cost, including coal properties, mine development and construction costs | 410,111,777 | 398,903,511 | |||||||||||||
Less accumulated depreciation, depletion and amortization | (135,937,094 | ) | (128,223,914 | ) | Less accumulated depreciation, depletion and amortization | (143,755,048 | ) | (128,223,914 | ) | |||||||||
Net property, plant and equipment | 269,603,245 | 270,679,597 | Net property, plant and equipment | 266,356,729 | 270,679,597 | |||||||||||||
Advance royalties, net of current portion | Advance royalties, net of current portion | 3,837,513 | 3,558,332 | Advance royalties, net of current portion | 3,967,819 | 3,558,332 | ||||||||||||
Investment in unconsolidated affiliate | Investment in unconsolidated affiliate | 17,056,473 | 17,186,362 | Investment in unconsolidated affiliate | 17,600,308 | 17,186,362 | ||||||||||||
Goodwill | Goodwill | 201,500 | 201,500 | Goodwill | 201,500 | 201,500 | ||||||||||||
Intangible assets | Intangible assets | 754,637 | 806,000 | Intangible assets | 742,784 | 806,000 | ||||||||||||
Other non-current assets | Other non-current assets | 2,874,144 | 2,726,800 | Other non-current assets | 2,323,781 | 2,726,800 | ||||||||||||
TOTAL | $ | 347,487,564 | $ | 339,984,463 | TOTAL | $ | 340,897,343 | $ | 339,984,463 | |||||||||
LIABILITIES AND EQUITY | LIABILITIES AND EQUITY | LIABILITIES AND EQUITY | ||||||||||||||||
CURRENT LIABILITIES: | CURRENT LIABILITIES: | CURRENT LIABILITIES: | ||||||||||||||||
Accounts payable | $ | 10,877,001 | $ | 13,851,368 | Accounts payable | $ | 12,148,075 | $ | 13,851,368 | |||||||||
Accrued expenses and other | 16,914,937 | 15,075,419 | Accrued expenses and other | 17,335,880 | 15,075,419 | |||||||||||||
Current portion of long-term debt | 1,098,521 | 2,241,634 | Current portion of long-term debt | 721,514 | 2,241,634 | |||||||||||||
Current portion of asset retirement obligations | 5,427,614 | 5,427,614 | Current portion of asset retirement obligations | 5,427,614 | 5,427,614 | |||||||||||||
Current portion of postretirement benefits | 95,139 | 95,139 | Current portion of postretirement benefits | 95,139 | 95,139 | |||||||||||||
Total current liabilities | 34,413,212 | 36,691,174 | Total current liabilities | 35,728,222 | 36,691,174 | |||||||||||||
NON-CURRENT LIABILITIES | NON-CURRENT LIABILITIES | NON-CURRENT LIABILITIES | ||||||||||||||||
Long-term debt | 122,734,331 | 119,895,791 | Long-term debt | 107,732,727 | 119,895,791 | |||||||||||||
Asset retirement obligations | 40,024,123 | 39,673,696 | Asset retirement obligations | 39,892,824 | 39,673,696 | |||||||||||||
Other non-current liabilities | 83,314 | 208,315 | Other non-current liabilities | — | 208,315 | |||||||||||||
Postretirement benefits | 5,288,147 | 5,114,854 | Postretirement benefits | 5,457,163 | 5,114,854 | |||||||||||||
Total non-current liabilities | 168,129,915 | 164,892,656 | Total non-current liabilities | 153,082,714 | 164,892,656 | |||||||||||||
Total liabilities | 202,543,127 | 201,583,830 | Total liabilities | 188,810,936 | 201,583,830 | |||||||||||||
COMMITMENTS AND CONTINGENCIES (NOTE 11) | COMMITMENTS AND CONTINGENCIES (NOTE 11) | COMMITMENTS AND CONTINGENCIES (NOTE 11) | ||||||||||||||||
MEMBERS' EQUITY: | MEMBERS' EQUITY: | MEMBERS' EQUITY: | ||||||||||||||||
Members' investment | $ | 22,907,364 | $ | 22,907,427 | Members' investment | $ | 22,907,427 | $ | 22,907,427 | |||||||||
Retained earnings | 120,559,882 | 114,016,015 | Retained earnings | 127,701,789 | 114,016,015 | |||||||||||||
Accumulated other comprehensive income | 1,477,191 | 1,477,191 | Accumulated other comprehensive income | 1,477,191 | 1,477,191 | |||||||||||||
Total members' equity | 144,944,437 | 138,400,633 | Total members' equity | 152,086,407 | 138,400,633 | |||||||||||||
TOTAL | TOTAL | $ | 347,487,564 | $ | 339,984,463 | TOTAL | $ | 340,897,343 | $ | 339,984,463 | ||||||||
See notes to unaudited condensed consolidated financial statements.
RHINO ENERGY LLC
UNAUDITED CONDENSED CONSOLIDATED STATEMENTS OF OPERATIONS AND
COMPREHENSIVE INCOME
FOR THE THREESIX MONTHS ENDED MARCH 31,JUNE 30, 2010 AND 2009
| | | Three Months Ended March 31, 2010 | Three Months Ended March 31, 2009 | | Six Months Ended June 30, 2010 | Six Months Ended June 30, 2009 | ||||||||||||
|---|---|---|---|---|---|---|---|---|---|---|---|---|---|---|---|---|---|---|
REVENUES: | REVENUES: | REVENUES: | ||||||||||||||||
Coal sales | $ | 62,642,227 | $ | 113,130,413 | Coal sales | $ | 136,735,856 | $ | 218,269,909 | |||||||||
Freight and handling revenues | 942,239 | 1,194,726 | Freight and handling revenues | 1,947,208 | 2,498,668 | |||||||||||||
Other revenues | 3,018,165 | 2,380,646 | Other revenues | 6,347,715 | 5,326,477 | |||||||||||||
Total revenues | 66,602,631 | 116,705,785 | Total revenues | 145,030,779 | 226,095,054 | |||||||||||||
COSTS AND EXPENSES: | COSTS AND EXPENSES: | COSTS AND EXPENSES: | ||||||||||||||||
Cost of operations (exclusive of depreciation, depletion and amortization shown separately below) | 46,351,743 | 98,317,233 | Cost of operations (exclusive of depreciation, depletion and amortization shown separately below) | 104,191,981 | 183,518,396 | |||||||||||||
Freight and handling costs | 673,164 | 938,064 | Freight and handling costs | 1,444,242 | 1,976,156 | |||||||||||||
Depreciation, depletion and amortization | 7,764,542 | 9,973,920 | Depreciation, depletion and amortization | 15,802,886 | 19,871,805 | |||||||||||||
Selling, general and administrative (exclusive of depreciation, depletion and amortization shown separately above) | 3,677,680 | 4,375,642 | Selling, general and administrative (exclusive of depreciation, depletion and amortization shown separately above) | 7,603,988 | 8,989,033 | |||||||||||||
(Gain) loss on sale of assets—net | (750 | ) | 270 | (Gain) loss on sale of assets—net | (46,771 | ) | 1,288,076 | |||||||||||
Total costs and expenses | 58,466,379 | 113,605,129 | Total costs and expenses | 128,996,326 | 215,643,466 | |||||||||||||
INCOME FROM OPERATIONS | INCOME FROM OPERATIONS | 8,136,252 | 3,100,656 | INCOME FROM OPERATIONS | 16,034,453 | 10,451,588 | ||||||||||||
INTEREST AND OTHER INCOME (EXPENSE): | INTEREST AND OTHER INCOME (EXPENSE): | INTEREST AND OTHER INCOME (EXPENSE): | ||||||||||||||||
Interest expense | (1,470,632 | ) | (1,169,812 | ) | Interest expense | (2,781,007 | ) | (2,890,835 | ) | |||||||||
Interest income and other | 8,076 | 87,309 | Interest income and other | 18,382 | 69,303 | |||||||||||||
Equity in net income (loss) of unconsolidated affiliate | (129,889 | ) | (42,522 | ) | Equity in net income (loss) of unconsolidated affiliate | 413,946 | (267,667 | ) | ||||||||||
Total interest and other income (expense) | (1,592,445 | ) | (1,125,025 | ) | Total interest and other income (expense) | (2,348,679 | ) | (3,089,199 | ) | |||||||||
INCOME BEFORE INCOME TAXES | INCOME BEFORE INCOME TAXES | 6,543,807 | 1,975,631 | INCOME BEFORE INCOME TAXES | 13,685,774 | 7,362,389 | ||||||||||||
INCOME TAX BENEFIT | — | — | ||||||||||||||||
INCOME TAXES | INCOME TAXES | — | — | |||||||||||||||
NET INCOME | NET INCOME | $ | 6,543,807 | $ | 1,975,631 | NET INCOME | $ | 13,685,774 | $ | 7,362,389 | ||||||||
Other comprehensive income: | Other comprehensive income: | |||||||||||||||||
Change in actuarial gain under ASC Topic 815 | — | — | Change in actuarial gain under ASC Topic 815 | — | — | |||||||||||||
COMPREHENSIVE INCOME | COMPREHENSIVE INCOME | $ | 6,543,807 | $ | 1,975,631 | COMPREHENSIVE INCOME | $ | 13,685,774 | $ | 7,362,389 | ||||||||
See notes to unaudited condensed consolidated financial statements.
RHINO ENERGY LLC
UNAUDITED CONDENSED CONSOLIDATED STATEMENTS OF CASH FLOWS
FOR THE THREESIX MONTHS ENDED MARCH 31,JUNE 30, 2010 AND 2009
| | | Three Months Ended March 31, 2010 | Three Months Ended March 31, 2009 | | Six Months Ended June 30, 2010 | Six Months Ended June 30, 2009 | ||||||||||||||
|---|---|---|---|---|---|---|---|---|---|---|---|---|---|---|---|---|---|---|---|---|
CASH FLOWS FROM OPERATING ACTIVITIES: | CASH FLOWS FROM OPERATING ACTIVITIES: | CASH FLOWS FROM OPERATING ACTIVITIES: | ||||||||||||||||||
Net income | $ | 6,543,807 | $ | 1,975,631 | Net income | $ | 13,685,774 | $ | 7,362,389 | |||||||||||
Adjustments to reconcile net income to net cash provided by operating activities: | Adjustments to reconcile net income to net cash provided by operating activities: | |||||||||||||||||||
Depreciation, depletion and amortization | 7,764,542 | 9,973,920 | Depreciation, depletion and amortization | 15,802,886 | 19,871,805 | |||||||||||||||
Accretion on asset retirement obligations | 542,499 | 755,502 | Accretion on asset retirement obligations | 1,084,998 | 1,450,490 | |||||||||||||||
Accretion on interest-free debt | 48,837 | 43,624 | Accretion on interest-free debt | 98,288 | 193,470 | |||||||||||||||
Amortization of advance royalties | 276,009 | 83,425 | Amortization of advance royalties | 374,481 | 155,788 | |||||||||||||||
Equity in net loss of unconsolidated affiliate | 129,889 | 42,522 | Equity in net loss (income) of unconsolidated affiliate | (413,946 | ) | 267,667 | ||||||||||||||
(Gain) loss on retirement of advance royalties | 77,666 | — | (Gain) loss on retirement of advance royalties | 112,560 | (77,269 | ) | ||||||||||||||
(Gain) loss on sale of assets—net | (750 | ) | 270 | (Gain) loss on sale of assets—net | (46,771 | ) | 1,288,076 | |||||||||||||
Changes in assets and liabilities: | Changes in assets and liabilities: | |||||||||||||||||||
Accounts receivable | (3,370,552 | ) | (13,680,504 | ) | Accounts receivable | 2,000,466 | (498,256 | ) | ||||||||||||
Inventories | (6,151,196 | ) | (3,127,790 | ) | Inventories | (6,059,334 | ) | (3,677,794 | ) | |||||||||||
Advance royalties | (632,856 | ) | (345,572 | ) | Advance royalties | (896,528 | ) | (667,553 | ) | |||||||||||
Prepaid expenses and other assets | 605,733 | 787,524 | Prepaid expenses and other assets | (697,219 | ) | 2,281,138 | ||||||||||||||
Accounts payable | (2,974,368 | ) | 6,726,713 | Accounts payable | (1,703,290 | ) | (2,390,489 | ) | ||||||||||||
Accrued expenses and other liabilities | 1,714,516 | 377,427 | Accrued expenses and other liabilities | 2,052,146 | (8,159 | ) | ||||||||||||||
Asset retirement obligations | (192,072 | ) | (514,038 | ) | Asset retirement obligations | (865,869 | ) | (5,680,259 | ) | |||||||||||
Postretirement benefits | 173,293 | 175,229 | Postretirement benefits | 342,309 | 350,459 | |||||||||||||||
Net cash provided by operating activities | 4,554,997 | 3,273,883 | Net cash provided by operating activities | 24,870,951 | 20,221,503 | |||||||||||||||
CASH FLOWS FROM INVESTING ACTIVITIES: | CASH FLOWS FROM INVESTING ACTIVITIES: | CASH FLOWS FROM INVESTING ACTIVITIES: | ||||||||||||||||||
Additions to property, plant, and equipment | (6,636,828 | ) | (9,143,502 | ) | Additions to property, plant, and equipment | (11,439,750 | ) | (17,004,303 | ) | |||||||||||
Proceeds from sales of property, plant, and equipment | 750 | — | Proceeds from sales of property, plant, and equipment | 69,718 | 221,275 | |||||||||||||||
Principal payments received on notes receivable | 98,383 | 1,273,129 | Principal payments received on notes receivable | 98,383 | 1,220,456 | |||||||||||||||
Cash advances from issuance of notes receivable | — | (2,040,000 | ) | Cash advances from issuance of notes receivable | (255,000 | ) | (2,040,000 | ) | ||||||||||||
Changes in restricted cash | (3,000 | ) | — | Changes in restricted cash | (3,000 | ) | — | |||||||||||||
Acquisition of coal companies and other properties | — | (1,821,342 | ) | Acquisition of coal companies and other properties | (58,696 | ) | — | |||||||||||||
Acquisition of roof bolt manufacturing company | — | (1,821,342 | ) | |||||||||||||||||
Net cash used in investing activities | (6,540,695 | ) | (11,731,715 | ) | ||||||||||||||||
Net cash used in investing activities | (11,588,345 | ) | (19,423,914 | ) | ||||||||||||||||
CASH FLOWS FROM FINANCING ACTIVITIES: | CASH FLOWS FROM FINANCING ACTIVITIES: | CASH FLOWS FROM FINANCING ACTIVITIES: | ||||||||||||||||||
Borrowings on line of credit | 30,000,000 | 48,700,000 | Borrowings on line of credit | 45,950,000 | 97,145,202 | |||||||||||||||
Repayments on line of credit | (26,980,000 | ) | (36,500,000 | ) | Repayments on line of credit | (59,731,472 | ) | (93,269,818 | ) | |||||||||||
Repayments on long-term debt | (1,373,411 | ) | (213,957 | ) | Payments on debt issuance costs | — | (1,168,674 | ) | ||||||||||||
Payments on debt issuance costs | — | (7,522 | ) | Proceeds from issuance of debt from related party | — | 50,000 | ||||||||||||||
Proceeds from issuance of debt from related party | — | 50,000 | Repayments on loan payable to related party | — | (5,000,000 | ) | ||||||||||||||
Repayments on loan payable to related party | — | (5,000,000 | ) | Distributions to members | — | (48,766 | ) | |||||||||||||
Net cash provided by financing activities | 1,646,589 | 7,028,521 | Net cash used in financing activities | (13,781,472 | ) | (2,292,056 | ) | |||||||||||||
NET INCREASE (DECREASE) IN CASH AND CASH EQUIVALENTS | NET INCREASE (DECREASE) IN CASH AND CASH EQUIVALENTS | (339,109 | ) | (1,429,311 | ) | NET INCREASE (DECREASE) IN CASH AND CASH EQUIVALENTS | (498,866 | ) | (1,494,467 | ) | ||||||||||
CASH AND CASH EQUIVALENTS—Beginning of period | CASH AND CASH EQUIVALENTS—Beginning of period | 686,537 | 1,937,265 | CASH AND CASH EQUIVALENTS—Beginning of period | 686,537 | 1,937,265 | ||||||||||||||
CASH AND CASH EQUIVALENTS—End of period | CASH AND CASH EQUIVALENTS—End of period | $ | 347,428 | $ | 507,954 | CASH AND CASH EQUIVALENTS—End of period | $ | 187,671 | $ | 442,798 | ||||||||||
See notes to unaudited condensed consolidated financial statements.
RHINO ENERGY LLC
NOTES TO UNAUDITED CONDENSED CONSOLIDATED FINANCIAL STATEMENTS
AS OF MARCH 31,JUNE 30, 2010 AND DECEMBER 31, 2009 AND FOR THE THREESIX MONTHS
ENDED MARCH 31,JUNE 30, 2010 AND 2009
1. BASIS OF PRESENTATION AND ORGANIZATION
Basis of Presentation and Principles of Consolidation—The accompanying consolidated financial statements include the accounts of Rhino Energy LLC (the "Company") and its subsidiaries. Significant intercompany transactions and balances have been eliminated in consolidation.
Unaudited Interim Financial Information—The accompanying unaudited interim financial statements have been prepared in accordance with generally accepted accounting principles for interim financial information. The condensed consolidated statement of financial position as of March 31,June 30, 2010, condensed statements of operations for the threesix months ended March 31,June 30, 2010 and 2009 and the consolidated statements of cash flows for the threesix months ended March 31,June 30, 2010 and 2009 include all adjustments (consisting of normal recurring adjustments) which the Company considers necessary for a fair presentation of the financial position, operating results and cash flows for the periods presented. The results of operations for the interim periods are not necessarily indicative of the results to be expected for the year or any future period. These unaudited interim financial statements should be read in conjunction with the audited financial statements included in this registration statement.
Organization—In January 2009, the Company acquired the manufacturing operations of Triad Roof Support Systems, LLC located in Kentucky as part of a vertical integration effort. This operation produces roof control products used in underground coal mining. This acquisition included a manufacturing facility as well as a small product development shop. The Company allocated the purchase price to assets and liabilities acquired based upon their respective fair values in accordance with Accounting Standards Codification ("ASC") Topic 805 (previously Statement of Financial Accounting Standards ("SFAS") No. 141,141R,"Business Combinations"). To the extent that the purchase price of the assets was greater than the fair value of the net assets acquired, the Company recorded goodwill. The recorded value of the assets and (liabilities) were:
Inventory | $ | 21,342 | ||
Property, plant and equipment | 792,500 | |||
Intangible assets | 806,000 | |||
Goodwill | 201,500 | |||
Net assets acquired | $ | 1,821,342 | ||
Total consideration | $ | 1,821,342 | ||
2. SUMMARY OF SIGNIFICANT ACCOUNTING POLICIES AND GENERAL
Investment in Joint Venture. Investments in other entities are accounted for using the consolidation, equity method or cost basis depending upon the level of ownership, the Company's ability to exercise significant influence over the operating and financial policies of the investee and whether the Company is determined to be the primary beneficiary. Equity investments are recorded at original cost and adjusted periodically to recognize the Company's
RHINO ENERGY LLC
NOTES TO UNAUDITED CONDENSED CONSOLIDATED FINANCIAL STATEMENTS
AS OF MARCH 31,JUNE 30, 2010 AND DECEMBER 31, 2009 AND FOR THE THREESIX MONTHS
ENDED MARCH 31,JUNE 30, 2010 AND 2009 (Continued)
2. SUMMARY OF SIGNIFICANT ACCOUNTING POLICIES AND GENERAL (Continued)
proportionate share of the investees' net income or losses after the date of investment. When net losses from an equity method investment exceed its carrying amount, the investment balance is reduced to zero and additional losses are not provided for. The Company resumes accounting for the investment under the equity method when the entity subsequently reports net income and the Company's share of that net income exceeds the share of net losses not recognized during the period the equity method was suspended. Investments are written down when there is clear evidence that a decline in value that is other than temporary has occurred.
In May 2008, the Company entered into a joint venture, Rhino Eastern LLC ("Rhino Eastern"), with Patriot Coal Corporation ("Patriot") to acquire the Eagle mining complex. To initially capitalize the joint venture, the Company contributed approximately $16.1 million for a 51% ownership interest in the joint venture, and accounts for the investment in the joint venture and its results of operations under the equity method. The Company considers the operations of this entity to comprise a separate reporting segment and has provided supplemental detail related to this operation in the "Segment Information" footnote.
3. PREPAID EXPENSES AND OTHER CURRENT ASSETS
Prepaid expenses and other current assets as of March 31,June 30, 2010 and December 31, 2009 consisted of the following:
| | March 31, 2010 | December 31, 2009 | June 30, 2010 | December 31, 2009 | ||||||||||
|---|---|---|---|---|---|---|---|---|---|---|---|---|---|---|
Notes receivable | $ | 278,800 | $ | 377,183 | $ | 533,800 | $ | 377,183 | ||||||
Deferred offering costs | 55,701 | — | 1,142,281 | — | ||||||||||
Other prepaid expenses | 726,904 | 571,934 | 910,480 | 571,934 | ||||||||||
Prepaid insurance | 1,969,949 | 2,918,607 | 2,710,619 | 2,918,607 | ||||||||||
Prepaid leases | 100,694 | 53,646 | 119,477 | 53,646 | ||||||||||
Supply inventory | 418,145 | 480,458 | 300,546 | 480,458 | ||||||||||
Deposits | 170,812 | 167,736 | 170,813 | 167,736 | ||||||||||
Total | $ | 3,721,005 | $ | 4,569,464 | $ | 5,888,016 | $ | 4,569,464 | ||||||
RHINO ENERGY LLC
NOTES TO UNAUDITED CONDENSED CONSOLIDATED FINANCIAL STATEMENTS
AS OF MARCH 31,JUNE 30, 2010 AND DECEMBER 31, 2009 AND FOR THE THREESIX MONTHS
ENDED MARCH 31,JUNE 30, 2010 AND 2009 (Continued)
4. PROPERTY, PLANT AND EQUIPMENT
Property, plant and equipment, including coal properties and mine development and construction costs, as of March 31,June 30, 2010 and December 31, 2009 are summarized by major classification as follows:
| | Useful Lives | March 31, 2010 | December 31, 2009 | Useful Lives | June 30, 2010 | December 31, 2009 | ||||||||||||
|---|---|---|---|---|---|---|---|---|---|---|---|---|---|---|---|---|---|---|
Land and land improvements | $ | 21,413,002 | $ | 21,413,003 | $ | 21,513,003 | $ | 21,413,003 | ||||||||||
Mining and other equipment and related facilities | 2 - 20 Years | 204,312,254 | 203,725,387 | 2 - 20 Years | 207,671,062 | 203,725,387 | ||||||||||||
Mine development costs | 1 - 15 Years | 48,358,988 | 47,135,311 | 1 - 15 Years | 49,186,188 | 47,135,311 | ||||||||||||
Coal properties | 1 - 15 Years | 119,764,966 | 119,764,966 | 1 - 15 Years | 120,005,206 | 119,764,966 | ||||||||||||
Construction work in process | 11,691,129 | 6,864,844 | 11,736,318 | 6,864,844 | ||||||||||||||
Total | 405,540,339 | 398,903,511 | 410,111,777 | 398,903,511 | ||||||||||||||
Less accumulated depreciation, depletion and amortization | (135,937,094 | ) | (128,223,914 | ) | (143,755,048 | ) | (128,223,914 | ) | ||||||||||
Net | $ | 269,603,245 | $ | 270,679,597 | $ | 266,356,729 | $ | 270,679,597 | ||||||||||
Depreciation expense for mining and other equipment and related facilities for the threesix months ended March 31,June 30, 2010 and 2009 was $6,601,735$13,434,514 and $7,443,988,$15,462,641, respectively. Depletion expense for coal properties for the threesix months ended March 31,June 30, 2010 and 2009 was $454,312$971,351 and $794,518,$1,377,431, respectively. Amortization expense for mine development costs for the threesix months ended March 31,June 30, 2010 and 2009 was $411,157$834,012 and $992,165,$1,796,418, respectively. Amortization expense for asset retirement costs for the threesix months ended March 31,June 30, 2010 and 2009 was $245,976$499,793 and $743,249,$1,235,315, respectively. Amortization expense for intangible assets for the threesix months ended March 31,June 30, 2010 and 2009 was $51,363$63,216 and $0, respectively.
5. GOODWILL AND INTANGIBLE ASSETS
ASC Topic 350 (previously SFAS No. 142, "Goodwill and Other Intangible Assets") addresses financial accounting and reporting for goodwill and other intangible assets subsequent to their acquisition. Under the provisions of ASC Topic 350, goodwill and other intangible assets with indefinite useful lives are no longer amortized but instead tested for impairment at least annually.
Goodwill as included in our Other reporting segment as of March 31,June 30, 2010 and December 31, 2009 consisted of the following:
| | March 31, 2010 | December 31, 2009 | ||||||
|---|---|---|---|---|---|---|---|---|
Goodwill from the acquisition of Triad | $ | 201,500 | $ | 201,500 | ||||
Total | $ | 201,500 | $ | 201,500 | ||||
| | June 30, 2010 | December 31, 2009 | ||||||
|---|---|---|---|---|---|---|---|---|
Goodwill from the acquisition of Triad | $ | 201,500 | $ | 201,500 | ||||
Total | $ | 201,500 | $ | 201,500 | ||||
RHINO ENERGY LLC
NOTES TO UNAUDITED CONDENSED CONSOLIDATED FINANCIAL STATEMENTS
AS OF MARCH 31,JUNE 30, 2010 AND DECEMBER 31, 2009 AND FOR THE THREESIX MONTHS
ENDED MARCH 31,JUNE 30, 2010 AND 2009 (Continued)
5. GOODWILL AND INTANGIBLE ASSETS (Continued)
Intangible assets as of March 31,June 30, 2010 consisted of the following:
Intangible Asset | Gross Carrying Amount | Accumulated Amortization | Net Carrying Amount | Gross Carrying Amount | Accumulated Amortization | Net Carrying Amount | ||||||||||||||
|---|---|---|---|---|---|---|---|---|---|---|---|---|---|---|---|---|---|---|---|---|
Patent | $ | 728,000 | $ | 46,392 | $ | 681,608 | $ | 728,000 | $ | 57,098 | $ | 670,902 | ||||||||
Developed Technology | 78,000 | 4,971 | 73,029 | 78,000 | 6,118 | 71,882 | ||||||||||||||
Total | $ | 806,000 | $ | 51,363 | $ | 754,637 | $ | 806,000 | $ | 63,216 | $ | 742,784 | ||||||||
Intangible assets as of December 31, 2009 consisted of the following:
Intangible Asset | Gross Carrying Amount | Accumulated Amortization | Net Carrying Amount | |||||||
|---|---|---|---|---|---|---|---|---|---|---|
Patent | $ | 728,000 | — | $ | 728,000 | |||||
Developed Technology | 78,000 | — | 78,000 | |||||||
Total | $ | 806,000 | — | $ | 806,000 | |||||
The Company considers these intangible assets to have a useful life of seventeen years. The intangible assets are amortized over their useful life on a straight line basis. Amortization for the threesix months ended March 31,June 30, 2009 was not significant.material.
The future total amortization expense for each of the five succeeding years related to all intangible assets that are currently recorded in the Unaudited Condensed Consolidated Statement of Financial Position is estimated to be as follows at March 31,June 30, 2010:
| | Patent | Developed Technology | Total | Patent | Developed Technology | Total | ||||||||||||||
|---|---|---|---|---|---|---|---|---|---|---|---|---|---|---|---|---|---|---|---|---|
2010 | $ | 32,118 | $ | 3,441 | $ | 35,559 | $ | 21,412 | $ | 2,294 | $ | 23,706 | ||||||||
2011 | $ | 42,824 | $ | 4,588 | $ | 47,412 | $ | 42,824 | $ | 4,588 | $ | 47,412 | ||||||||
2012 | $ | 42,824 | $ | 4,588 | $ | 47,412 | $ | 42,824 | $ | 4,588 | $ | 47,412 | ||||||||
2013 | $ | 42,824 | $ | 4,588 | $ | 47,412 | $ | 42,824 | $ | 4,588 | $ | 47,412 | ||||||||
2014 | $ | 42,824 | $ | 4,588 | $ | 47,412 | $ | 42,824 | $ | 4,588 | $ | 47,412 | ||||||||
RHINO ENERGY LLC
NOTES TO UNAUDITED CONDENSED CONSOLIDATED FINANCIAL STATEMENTS
AS OF MARCH 31,JUNE 30, 2010 AND DECEMBER 31, 2009 AND FOR THE THREESIX MONTHS
ENDED MARCH 31,JUNE 30, 2010 AND 2009 (Continued)
6. OTHER NON-CURRENT ASSETS
Other non-current assets as of March 31,June 30, 2010 and December 31, 2009 consisted of the following:
| | | March 31, 2010 | December 31, 2009 | | June 30, 2010 | December 31, 2009 | ||||||||||
|---|---|---|---|---|---|---|---|---|---|---|---|---|---|---|---|---|
Deposits and other | Deposits and other | $ | 666,427 | $ | 321,531 | Deposits and other | $ | 340,795 | $ | 321,531 | ||||||
Debt issuance costs—net | Debt issuance costs—net | 2,092,382 | 2,271,728 | Debt issuance costs—net | 1,913,036 | 2,271,728 | ||||||||||
Deferred expenses | Deferred expenses | 115,335 | 133,541 | Deferred expenses | 69,950 | 133,541 | ||||||||||
Total | $ | 2,874,144 | $ | 2,726,800 | Total | $ | 2,323,781 | $ | 2,726,800 | |||||||
Debt issuance costs were $4,309,502 and $4,309,502 as of March 31,June 30, 2010 and December 31, 2009, respectively. Accumulated amortization of debt issuance costs were $2,217,120$2,396,466 and $2,037,774 as of March 31,June 30, 2010 and December 31, 2009, respectively.
7. ACCRUED EXPENSES AND OTHER CURRENT LIABILITIES
Accrued expenses and other current liabilities as of March 31,June 30, 2010 and December 31, 2009 consisted of the following:
| | | March 31, 2010 | December 31, 2009 | | June 30, 2010 | December 31, 2009 | ||||||||||
|---|---|---|---|---|---|---|---|---|---|---|---|---|---|---|---|---|
Payroll, bonus and vacation expense | Payroll, bonus and vacation expense | $ | 3,538,252 | $ | 3,667,804 | Payroll, bonus and vacation expense | $ | 3,939,148 | $ | 3,667,804 | ||||||
Non income taxes | Non income taxes | 4,362,847 | 3,641,636 | Non income taxes | 4,556,498 | 3,641,636 | ||||||||||
Royalty expenses | Royalty expenses | 2,920,588 | 2,549,714 | Royalty expenses | 3,093,246 | 2,549,714 | ||||||||||
Accrued interest | Accrued interest | 301,721 | 325,508 | Accrued interest | 269,082 | 325,508 | ||||||||||
Health claims | Health claims | 2,137,837 | 1,618,611 | Health claims | 1,699,836 | 1,618,611 | ||||||||||
Workers' compensation and pneumoconiosis | Workers' compensation and pneumoconiosis | 3,355,221 | 3,090,227 | Workers' compensation and pneumoconiosis | 3,489,095 | 3,090,227 | ||||||||||
Other | Other | 298,471 | 181,919 | Other | 288,975 | 181,919 | ||||||||||
Total | $ | 16,914,937 | $ | 15,075,419 | Total | $ | 17,335,880 | $ | 15,075,419 | |||||||
RHINO ENERGY LLC
NOTES TO UNAUDITED CONDENSED CONSOLIDATED FINANCIAL STATEMENTS
AS OF MARCH 31,JUNE 30, 2010 AND DECEMBER 31, 2009 AND FOR THE THREESIX MONTHS
ENDED MARCH 31,JUNE 30, 2010 AND 2009 (Continued)
8. DEBT
Debt as of March 31,June 30, 2010 and December 31, 2009 consisted of the following:
| | | March 31, 2010 | December 31, 2009 | | June 30, 2010 | December 31, 2009 | ||||||||||
|---|---|---|---|---|---|---|---|---|---|---|---|---|---|---|---|---|
Line of credit with PNC Bank, N.A. | Line of credit with PNC Bank, N.A. | $ | 117,020,000 | $ | 114,000,000 | Line of credit with PNC Bank, N.A. | $ | 102,140,000 | $ | 114,000,000 | ||||||
Note payable to H&L Construction Co., Inc. | Note payable to H&L Construction Co., Inc. | 2,919,434 | 3,627,709 | Note payable to H&L Construction Co., Inc. | 2,756,705 | 3,627,709 | ||||||||||
Other notes payable | Other notes payable | 3,893,418 | 4,509,716 | Other notes payable | 3,557,536 | 4,509,716 | ||||||||||
Total | Total | 123,832,852 | 122,137,425 | Total | 108,454,241 | 122,137,425 | ||||||||||
Less current portion | Less current portion | (1,098,521 | ) | (2,241,634 | ) | Less current portion | (721,514 | ) | (2,241,634 | ) | ||||||
Long-term debt | $ | 122,734,331 | $ | 119,895,791 | Long-term debt | $ | 107,732,727 | $ | 119,895,791 | |||||||
Line of credit with PNC Bank, N.A.—Borrowings under the line of credit bear interest which varies depending upon the grouping of the borrowings within the line of credit. At March 31,June 30, 2010, the Company had borrowed $110,000,000$102,000,000 at a variable interest rate of LIBOR plus 3.00% (3.23%2.50% (2.86% at March 31,June 30, 2010) and an additional $7,020,000$140,000 under a revolving credit arrangement at a variable interest rate of PRIME plus 1.50% (4.75%1.00% (4.25% at March 31,June 30, 2010). The Company also had outstanding letters of credit of $21,382,580$21,144,050 at a fixed interest rate of 3.00% at March 31,June 30, 2010. The credit agreement is to expire in February 2013. At March 31,June 30, 2010, the Company had not used $61,597,420$76,715,950 of the borrowing availability. As part of the agreement, the Company is required to pay a commitment fee of 0.375% on the unused portion of the borrowing availability. Borrowings on the line of credit are collateralized by all the unsecured assets of the Company.
The revolving credit commitment requires the Company to maintain certain minimum financial ratios and contains certain restrictive provisions, including among others, restrictions on making loans, investments and advances, incurring additional indebtedness, guaranteeing indebtedness, creating liens, selling or assigning stock.
In April 2009, the Company amended its credit agreement with PNC Bank to revise certain restrictive provisions and extended the agreement expiration date to February 2013. The restrictive provisions of the amended credit agreement were effective as of March 31, 2009 and the Company was in compliance with all the restrictive provisions of the amended credit agreement as of March 31,June 30, 2010 and December 31, 2009.
In June 2010, the Company amended its credit agreement with PNC Bank to revise certain restrictive provisions and consent for equity transfer of the Company to Rhino Resource Partners LP (the "Partnership") in the event of a successful public offering and providing for quarterly cash distributions of available cash as defined in the Partnership's limited partnership agreement.
Note payable to H&L Construction Co., Inc.—In September 2009, the Company amended and restated the note payable to H&L Construction Co., Inc. This note payable is a non-interest
RHINO ENERGY LLC
NOTES TO UNAUDITED CONDENSED CONSOLIDATED FINANCIAL STATEMENTS
AS OF JUNE 30, 2010 AND DECEMBER 31, 2009 AND FOR THE SIX MONTHS
ENDED JUNE 30, 2010 AND 2009 (Continued)
8. DEBT (Continued)
bearing note. The Company has recorded a discount for imputed interest at a rate of 5.0% on this note. The Company is amortizing this discount over the life of the note using the effective interest method. The note payable matures in January 2015. The note is secured by mineral rights purchased by the Company from H&L Construction Co., Inc. with a carrying amount of $12,082,160 at March 31,June 30, 2010 and $12,388,127 at December 31, 2009.
RHINO ENERGY LLC
NOTES TO UNAUDITED CONDENSED CONSOLIDATED FINANCIAL STATEMENTS
AS OF MARCH 31, 2010 AND DECEMBER 31, 2009 AND FOR THE THREE MONTHSENDED MARCH 31, 2010 AND 2009 (Continued)
9. ASSET RETIREMENT OBLIGATIONS
The changes in the Company's asset retirement obligations for the threesix months ended March 31,June 30, 2010 and the year ended December 31, 2009 are:
| | Three Months Ended March 31, 2010 | Year Ended December 31, 2009 | Six Months Ended June 30, 2010 | Year Ended December 31, 2009 | ||||||||||
|---|---|---|---|---|---|---|---|---|---|---|---|---|---|---|
Balance at beginning of period (including current portion) | $ | 45,101,310 | $ | 55,760,291 | $ | 45,101,310 | $ | 55,760,291 | ||||||
Accretion expense | 542,499 | 2,752,665 | 1,084,998 | 2,752,665 | ||||||||||
Adjustment resulting from disposal of property | — | (2,038,433 | ) | — | (2,038,433 | ) | ||||||||
Adjustments to the liability from annual recosting and other | — | (6,595,947 | ) | — | (6,595,947 | ) | ||||||||
Liabilities settled | 192,072 | (4,777,266 | ) | (865,870 | ) | (4,777,266 | ) | |||||||
Balance at end of period | 45,451,737 | 45,101,310 | 45,320,438 | 45,101,310 | ||||||||||
Current portion of asset retirement obligation | 5,427,614 | 5,427,614 | (5,427,614 | ) | (5,427,614 | ) | ||||||||
Long-term portion of asset retirement obligation | $ | 40,024,123 | $ | 39,673,696 | $ | 39,892,824 | $ | 39,673,696 | ||||||
10. EMPLOYEE BENEFITS
Summaries ofNet periodic benefit cost for the changes in benefit obligations and funded status of the plan as of the measurement dates of March 31,six months ended June 30, 2010 and December 31, 2009 are as follows:
| | Three Months Ended March 31, 2010 | Year Ended December 31, 2009 | ||||||
|---|---|---|---|---|---|---|---|---|
Benefit obligation at beginning of period | $ | 5,209,993 | $ | 5,066,599 | ||||
Changes in benefit obligations: | ||||||||
Service costs | 107,156 | 441,553 | ||||||
Interest cost | 68,073 | 325,512 | ||||||
Benefits paid | (1,936 | ) | (14,963 | ) | ||||
Actuarial gain | — | (608,708 | ) | |||||
Benefit obligation at end of period | $ | 5,383,286 | $ | 5,209,993 | ||||
Fair value of plan assets at end of period | $ | — | $ | — | ||||
Funded status | $ | (5,383,286 | ) | $ | (5,209,993 | ) | ||
RHINO ENERGY LLC
NOTES TO UNAUDITED CONDENSED CONSOLIDATED FINANCIAL STATEMENTS
AS OF MARCH 31, 2010 AND DECEMBER 31, 2009 AND FOR THE THREE MONTHSENDED MARCH 31, 2010 AND 2009 (Continued)
10. EMPLOYEE BENEFITS (Continued)
| | Three Months Ended March 31, 2010 | Year Ended December 31, 2009 | Six Months Ended June 30, 2010 | Six Months Ended June 30, 2009 | ||||||||||
|---|---|---|---|---|---|---|---|---|---|---|---|---|---|---|
Net periodic benefit cost: | ||||||||||||||
Service costs | $ | 107,156 | $ | 441,553 | $ | 214,305 | $ | 214,305 | ||||||
Interest cost | 68,073 | 325,512 | 136,154 | 136,154 | ||||||||||
Amortization of (gain) | (37,764 | ) | (66,147 | ) | — | — | ||||||||
Benefit cost | $ | 137,465 | $ | 700,918 | $ | 350,459 | $ | 350,459 | ||||||
401(k) Plans—The Company and certain subsidiaries sponsor defined contribution savings plans for all employees. Under one defined contribution savings plan, the Company matches voluntary contributions of participants up to a maximum contribution based upon a percentage of a participant's salary with an additional matching contribution possible at the Company's
RHINO ENERGY LLC
NOTES TO UNAUDITED CONDENSED CONSOLIDATED FINANCIAL STATEMENTS
AS OF JUNE 30, 2010 AND DECEMBER 31, 2009 AND FOR THE SIX MONTHS
ENDED JUNE 30, 2010 AND 2009 (Continued)
10. EMPLOYEE BENEFITS (Continued)
discretion. The expense under these plans for the threesix month periods ended March 31,June 30, 2010 and 2009 was approximately $492,000$976,000 and $691,000,$1,254,000, respectively.
11. COMMITMENTS AND CONTINGENCIES
Coal Sales Contracts and Contingencies—As of March 31,June 30, 2010, the Company had commitments under sales contracts to deliver annually scheduled base quantities of 4.41.9 million, 2.43.1 million, 2.2 million, 1.8 million and 1.01.4 million tons of coal to 1923 customers in 2010, 512 customers in 2011, 46 customers in 2012, and 3 customers in 2013 and 1 customer in 2014 respectively. Some of the contracts have sales price adjustment provisions, subject to certain limitations and adjustments, based on a variety of factors and indices.
As of December 31, 2009, the Company had commitments under sales contracts to deliver annually scheduled base quantities of 4.2 million, 2.4 million, 2.2 million, 1.8 million and 1.0 million tons of coal to 19 customers in 2010, 5 customers in 2011, 4 customers in 2012, 3 customers in 2013 and 1 customer in 2014, respectively. Some of the contracts have sales price adjustment provisions, subject to certain limitations and adjustments, based on a variety of factors and indices.
Purchase Commitments—As of March 31,June 30, 2010, the Company had 2.31.5 million gallons remaining on a commitment to purchase diesel fuel at fixed prices through December 2010 for $5.5$3.7 million. As of December 31, 2009, the Company had 3.1 million gallons remaining on a commitment to purchase diesel fuel at fixed prices through December 2010 for $7.3 million.
Purchased Coal Expenses—The Company incurred purchased coal expense of approximately $0.3$1.8 million and $5.5$7.1 million for the threesix months ended March 31,June 30, 2010 and 2009, respectively, related to coal purchase contracts. In addition, the Company incurred purchased coal expense of approximately $0$2.1 and $21.2$51.6 million for coal purchased on the over-the-counter
RHINO ENERGY LLC
NOTES TO UNAUDITED CONDENSED CONSOLIDATED FINANCIAL STATEMENTS
AS OF MARCH 31, 2010 AND DECEMBER 31, 2009 AND FOR THE THREE MONTHSENDED MARCH 31, 2010 AND 2009 (Continued)
11. COMMITMENTS AND CONTINGENCIES (Continued)
market (OTC) for the threesix months ended March 31,June 30, 2010 and 2009, respectively. There were no outstanding coal purchase commitments as of March 31,June 30, 2010.
Leases—The Company leases various mining, transportation and other equipment under operating leases. Lease expense for the threesix months ended March 31,June 30, 2010 and 2009 was approximately $1.6$3.1 million and $2.2$4.3 million, respectively.
The Company also leases coal reserves under agreements that call for royalties to be paid as the coal is mined. Total royalty expense for the threesix months ended March 31,June 30, 2010 and 2009 was approximately $2.8$6.2 million and $4.3$7.5 million, respectively.
Joint Venture—Pursuant to the joint venture agreement with Patriot, the Company is required to contribute additional capital to assist in funding the development and operations of the joint venture. During the threesix months ended March 31,June 30, 2010 and 2009, the Company did not
RHINO ENERGY LLC
NOTES TO UNAUDITED CONDENSED CONSOLIDATED FINANCIAL STATEMENTS
AS OF JUNE 30, 2010 AND DECEMBER 31, 2009 AND FOR THE SIX MONTHS
ENDED JUNE 30, 2010 AND 2009 (Continued)
11. COMMITMENTS AND CONTINGENCIES (Continued)
make any capital contributions. The Company may be required to contribute additional capital to the joint venture in subsequent periods.
12. MAJOR CUSTOMERS
The Company had revenues or receivables from the following major customers that in each period equaled or exceeded 10% of revenues:
| | March 31, 2010 Receivable Balance | Three Months Ended March 31, 2010 Sales | Three Months Ended March 31, 2009 Sales | June 30, 2010 Receivable Balance | Six Months Ended June 30, 2010 Sales | Six Months Ended June 30, 2009 Sales | ||||||||||||||
|---|---|---|---|---|---|---|---|---|---|---|---|---|---|---|---|---|---|---|---|---|
Indiana Harbor Coke Company, L.P | $ | 5,858,848 | $ | 13,725,006 | $ | n/a | $ | 3,889,401 | $ | 25,461,377 | $ | n/a | ||||||||
Mirant Americas Energy Mkt | 2,365,757 | 7,909,724 | n/a | |||||||||||||||||
Resource Fuels, LLC | 5,100,499 | 8,801,085 | n/a | |||||||||||||||||
Mirant Energy Trading, LLC | n/a | 17,352,030 | n/a | |||||||||||||||||
American Electric Power Company, Inc. | n/a | n/a | 16,327,546 | 1,855,799 | 17,429,070 | 52,210,476 | ||||||||||||||
Constellation Energy Group, Inc. | n/a | n/a | 35,245,936 | |||||||||||||||||
13. FAIR VALUE OF FINANCIAL INSTRUMENTS
The book values of cash and cash equivalents, accounts receivable and accounts payable are considered to be representative of their respective fair values because of the immediate short-term maturity of these financial instruments. The carrying value of the Company's debt instruments and notes receivable approximate fair value since effective rates for these instruments are comparable to market at March 31,June 30, 2010.
14. SUPPLEMENTAL DISCLOSURES OF CASH FLOW INFORMATION
Cash payments for interest were $1,276,075$2.4 million and $895,943$2.4 million for the threesix months ended March 31,June 30, 2010 and 2009, respectively.
RHINO ENERGY LLC
NOTES TO UNAUDITED CONDENSED CONSOLIDATED FINANCIAL STATEMENTS
AS OF MARCH 31, 2010 AND DECEMBER 31, 2009 AND FOR THE THREE MONTHSENDED MARCH 31, 2010 AND 2009 (Continued)
15. SEGMENT INFORMATION
The Company produces and markets coal from surface and underground mines in Kentucky, West Virginia, Ohio and Colorado. The Company sells primarily to electric utilities in the United States. The Company has four reportable business segments: Central Appalachia (comprised of both surface and underground mines in located in Eastern Kentucky and Southern West Virginia), Northern Appalachia (comprised of both surface underground mines located in Ohio) and Eastern Met (comprised solely of the joint venture with Patriot Coal). The Other segment includes the Company's Colorado operations and its ancillary businesses that do not meet the aggregation criteria and that do not exceed the quantitative thresholds requiring separate disclosure as a reportable segment. The Company has not provided disclosure of total expenditures by segment for long-lived assets, as the Company does not maintain discrete financial information concerning segment expenditures for long-lived assets, and accordingly such information is not provided to the Company's chief operating decision maker.
RHINO ENERGY LLC
NOTES TO UNAUDITED CONDENSED CONSOLIDATED FINANCIAL STATEMENTS
AS OF JUNE 30, 2010 AND DECEMBER 31, 2009 AND FOR THE SIX MONTHS
ENDED JUNE 30, 2010 AND 2009 (Continued)
15. SEGMENT INFORMATION (Continued)
Reportable segment results of operations for the threesix months ended March 31,June 30, 2010 are as follows:
| | | | Eastern Met | | | | | Eastern Met | | | ||||||||||||||||||||||||||||||||||
|---|---|---|---|---|---|---|---|---|---|---|---|---|---|---|---|---|---|---|---|---|---|---|---|---|---|---|---|---|---|---|---|---|---|---|---|---|---|---|---|---|---|---|---|---|
| | Central Appalachia | Northern Appalachia | Complete Basis | Equity Method Eliminations | Equity Method Presentation | Other | Total Segments | Central Appalachia | Northern Appalachia | Complete Basis | Equity Method Eliminations | Equity Method Presentation | Other | Total Segments | ||||||||||||||||||||||||||||||
Total revenues | 38,590,574 | 24,000,283 | 5,442,839 | (5,442,839 | ) | — | 4,011,764 | 66,602,031 | $ | 90,258,037 | $ | 46,680,773 | $ | 13,676,345 | $ | (13,676,345 | ) | — | $ | 8,091,969 | $ | 145,030,779 | ||||||||||||||||||||||
Depreciation, depletion and amortization | 4,693,033 | 1,876,455 | 751,408 | (751,408 | ) | — | 1,195,054 | 7,764,542 | 9,513,646 | 3,974,480 | 1,541,437 | (1,541,437 | ) | — | 2,314,760 | 15,802,886 | ||||||||||||||||||||||||||||
Interest expense | 626,801 | 580,759 | 17,016 | (17,016 | ) | — | 263,072 | 1,470,632 | 1,221,851 | 1,065,273 | 38,785 | (38,785 | ) | — | 493,883 | 2,781,007 | ||||||||||||||||||||||||||||
Net Income (loss) | 4,734,187 | 2,581,417 | (254 ,684 | ) | 124,795 | (129,889 | ) | (641,908 | ) | 6,543,807 | $ | 10,203,083 | $ | 4,625,921 | $ | 811,659 | $ | (397,713 | ) | $ | 413,946 | $ | (1,557,176 | ) | $ | 13,685,774 | ||||||||||||||||||
We account for the Eastern Met segment under the equity method. Under the equity method of accounting, only limited information (Net Income) is presented. We consider this operation to comprise a separate reporting segment and as result have presented supplemental operating detail is presented for comparability.
Reportable segment results of operations for the threesix months ended March 31,June 30, 2009 are as follows:
| | | | Eastern Met | | | | | Eastern Met | | | ||||||||||||||||||||||||||||||||||
|---|---|---|---|---|---|---|---|---|---|---|---|---|---|---|---|---|---|---|---|---|---|---|---|---|---|---|---|---|---|---|---|---|---|---|---|---|---|---|---|---|---|---|---|---|
| | Central Appalachia | Northern Appalachia | Complete Basis | Equity Method Eliminations | Equity Method Presentation | Other | Total Segments | Central Appalachia | Northern Appalachia | Complete Basis | Equity Method Eliminations | Equity Method Presentation | Other | Total Segments | ||||||||||||||||||||||||||||||
Total revenues | 85,238,892 | 27,461,509 | 8,631,408 | (8,631,408 | ) | — | 4,005,384 | 116,705,785 | $ | 162,756,441 | $ | 55,098,831 | $ | 2,027,945 | $ | (2,027,945 | ) | — | $ | 8,239,782 | $ | 226,095,054 | ||||||||||||||||||||||
Depreciation, depletion and amortization | 6,803,637 | 2,039,377 | 581,641 | (581,641 | ) | — | 1,130,906 | 9,973,920 | 13,640,839 | 3,977,085 | 232,488 | (232,488 | ) | — | 2,253,881 | 19,871,805 | ||||||||||||||||||||||||||||
Interest expense | 730,601 | 287,079 | 138,039 | (138,039 | ) | — | 152,132 | 1,169,812 | 1,738,466 | 755,046 | 42,552 | (42,552 | ) | — | 397,323 | 2,890,835 | ||||||||||||||||||||||||||||
Net Income (loss) | (4,062,922 | ) | 5,383,503 | (83,376 | ) | 40,854 | (42,522 | ) | 697,572 | 1,975,631 | $ | (3,747,786 | ) | $ | 9,831,272 | $ | (524,837 | ) | $ | 257,170 | $ | (267,667 | ) | $ | 1,546,570 | $ | 7,362,389 | |||||||||||||||||
16. SUBSEQUENT EVENTS
Management has evaluated the accompanying consolidated financial statements and notes for subsequent events up through June 18,August 27, 2010 which is the date the financial statements were available for issue. Management is not aware of any changes that would have a material effect on the financial statements.statements except for on August 25, 2010, we completed the acquisition of certain idled mining assets of C.W. Mining Company for $15.0 million. The assets acquired are located in Emery and Carbon Counties, Utah and include coal reserves and non-reserve coal deposits, underground mining equipment and infrastructure, an overland belt conveyor system, a loading facility and support facilities. We expect to begin production from these assets at one underground mine in late 2010. The coal we expect to produce and sell from these mining assets will be sold as steam coal in the Western Bituminous region. Because this transaction just recently closed, we have not yet prepared a purchase price allocation to the assets acquired and the liabilities assumed, if any.
REPORT OF INDEPENDENT REGISTERED PUBLIC ACCOUNTING FIRM
To the Members of
Rhino Energy LLC
Lexington, Kentucky
We have audited the accompanying consolidated statements of financial position of Rhino Energy LLC (the "Company") as of December 31, 2009 and 2008, and the related consolidated statements of operations and comprehensive income, members' equity, and cash flows for each of the three years in the period ended December 31, 2009. These financial statements are the responsibility of the Company's management. Our responsibility is to express an opinion on these financial statements based on our audits.
We conducted our audits in accordance with the standards of the Public Company Accounting Oversight Board (United States). Those standards require that we plan and perform the audit to obtain reasonable assurance about whether the financial statements are free of material misstatement. The Company is not required to have, nor were we engaged to perform, an audit of its internal control over financial reporting. Our audits included consideration of internal control over financial reporting as a basis for designing audit procedures that are appropriate in the circumstances, but not for the purpose of expressing an opinion on the effectiveness of the Company's internal control over financial reporting. Accordingly, we express no such opinion. An audit also includes examining, on a test basis, evidence supporting the amounts and disclosures in the financial statements, assessing the accounting principles used and significant estimates made by management, as well as evaluating the overall financial statement presentation. We believe that our audits provide a reasonable basis for our opinion.
As discussed in Note 18, the accompanying financial statements have been restated for the year ended December 31, 2008.
In our opinion, such consolidated financial statements present fairly, in all material respects, the financial position of the Company as of December 31, 2009 and 2008, and the results of its operations and its cash flows for the years ended December 31, 2009, 2008 and 2007 in conformity with accounting principles generally accepted in the United States of America.
/s/ Deloitte & Touche LLP
Cincinnati, OH
May 5, 2010
RHINO ENERGY LLC
CONSOLIDATED STATEMENTS OF FINANCIAL POSITION
AS OF DECEMBER 31, 2009 AND 2008
| | December 31, 2009 | December 31, 2008 | |||||||
|---|---|---|---|---|---|---|---|---|---|
| | | (as restated) | |||||||
ASSETS | |||||||||
CURRENT ASSETS: | |||||||||
Cash and cash equivalents | $ | 686,537 | $ | 1,937,265 | |||||
Accounts receivable, net of allowance for doubtful accounts ($18,992 and $0 as of December 31, 2009 and 2008, respectively) | 24,383,376 | 27,697,844 | |||||||
Inventories | 14,171,907 | 10,691,405 | |||||||
Advance royalties, current portion | 1,014,588 | 1,313,374 | |||||||
Prepaid expenses and other | 4,569,464 | 5,869,065 | |||||||
Total current assets | 44,825,872 | 47,508,953 | |||||||
PROPERTY, PLANT AND EQUIPMENT: | |||||||||
At cost, including coal properties, mine development and construction costs | 398,903,511 | 384,646,158 | |||||||
Less accumulated depreciation, depletion and amortization | (128,223,914 | ) | (101,783,057 | ) | |||||
Net property, plant and equipment | 270,679,597 | 282,863,101 | |||||||
Advance royalties, net of current portion | 3,558,332 | 3,280,010 | |||||||
Investment in unconsolidated affiliate | 17,186,362 | 16,293,489 | |||||||
Goodwill | 201,500 | — | |||||||
Intangible assets | 806,000 | — | |||||||
Other non-current assets | 2,726,800 | 2,590,228 | |||||||
TOTAL | $ | 339,984,463 | $ | 352,535,781 | |||||
LIABILITIES AND EQUITY | |||||||||
CURRENT LIABILITIES: | |||||||||
Accounts payable | $ | 13,851,368 | $ | 19,123,808 | |||||
Accrued expenses and other | 15,075,419 | 15,538,640 | |||||||
Current portion of long-term debt | 2,241,634 | 7,540,286 | |||||||
Loan payable to related party | — | 4,950,000 | |||||||
Current portion of asset retirement obligations | 5,427,614 | 7,720,782 | |||||||
Current portion of postretirement benefits | 95,139 | 108,407 | |||||||
Total current liabilities | 36,691,174 | 54,981,923 | |||||||
NON-CURRENT LIABILITIES | |||||||||
Long-term debt | 119,895,791 | 125,536,730 | |||||||
Asset retirement obligations | 39,673,696 | 48,039,509 | |||||||
Other non-current liabilities | 208,315 | 708,318 | |||||||
Postretirement benefits | 5,114,854 | 4,958,192 | |||||||
Total non-current liabilities | 164,892,656 | 179,242,749 | |||||||
Total liabilities | 201,583,830 | 234,224,672 | |||||||
COMMITMENTS AND CONTINGENCIES (NOTE 12) | |||||||||
MEMBERS' EQUITY: | |||||||||
Members' investment | 22,907,427 | 22,822,629 | |||||||
Accumulated other comprehensive income | 1,477,191 | 934,630 | |||||||
Retained earnings | 114,016,015 | 94,553,850 | |||||||
Total members' equity | 138,400,633 | 118,311,109 | |||||||
TOTAL | $ | 339,984,463 | $ | 352,535,781 | |||||
See notes to consolidated financial statements.
RHINO ENERGY LLC
CONSOLIDATED STATEMENTS OF OPERATIONS AND COMPREHENSIVE INCOME
FOR THE YEARS ENDED DECEMBER 31, 2009, 2008 AND 2007
| | Year Ended December 31, 2009 | Year Ended December 31, 2008 | Year Ended December 31, 2007 | |||||||||
|---|---|---|---|---|---|---|---|---|---|---|---|---|
| | (as restated) | |||||||||||
REVENUES: | ||||||||||||
Coal sales | $ | 401,751,460 | $ | 408,816,716 | $ | 394,078,915 | ||||||
Freight and handling revenues | 5,049,973 | 10,192,073 | 4,052,430 | |||||||||
Other revenues | 12,988,181 | 19,915,131 | 5,320,452 | |||||||||
Total revenues | 419,789,614 | 438,923,920 | 403,451,797 | |||||||||
COSTS AND EXPENSES: | ||||||||||||
Cost of operations (exclusive of depreciation, depletion and amortization shown separately below) | 336,335,159 | 364,912,033 | 318,405,277 | |||||||||
Freight and handling costs | 3,990,304 | 10,222,721 | 4,020,747 | |||||||||
Depreciation, depletion and amortization | 36,279,249 | 36,428,281 | 30,749,773 | |||||||||
Selling, general and administrative (exclusive of depreciation, depletion and amortization shown separately above) | 16,754,235 | 19,042,004 | 15,370,333 | |||||||||
(Gain) loss on sale of assets—net | 1,709,904 | 450,513 | (944,303 | ) | ||||||||
Total costs and expenses | 395,068,851 | 431,055,552 | 367,601,827 | |||||||||
INCOME FROM OPERATIONS | 24,720,763 | 7,868,368 | 35,849,970 | |||||||||
INTEREST AND OTHER INCOME (EXPENSE): | ||||||||||||
Interest expense | (6,222,208 | ) | (5,500,512 | ) | (5,579,224 | ) | ||||||
Interest income and other | 70,737 | 147,759 | 316,710 | |||||||||
Equity in net income (loss) of unconsolidated affiliate | 892,873 | (1,586,733 | ) | — | ||||||||
Total interest and other income (expense) | (5,258,598 | ) | (6,939,486 | ) | (5,262,514 | ) | ||||||
INCOME BEFORE INCOME TAXES | 19,462,165 | 928,882 | 30,587,456 | |||||||||
INCOME TAX BENEFIT | — | — | (126,308 | ) | ||||||||
NET INCOME | 19,462,165 | 928,882 | 30,713,764 | |||||||||
Other comprehensive income: | ||||||||||||
Change in actuarial gain under ASC Topic 815 | 542,561 | 346,254 | 1,489,416 | |||||||||
COMPREHENSIVE INCOME | $ | 20,004,726 | $ | 1,275,136 | $ | 32,203,180 | ||||||
See notes to consolidated financial statements.
RHINO ENERGY LLC
CONSOLIDATED STATEMENTS OF MEMBERS' EQUITY
FOR THE YEARS ENDED DECEMBER 31, 2009, 2008 AND 2007
| | Member's Investment | Accumulated Other Comprehensive Income | Retained Earnings | Total | ||||||||||
|---|---|---|---|---|---|---|---|---|---|---|---|---|---|---|
BALANCE—January 1, 2007 | $ | 32,877,194 | $ | (901,040 | ) | $ | 62,911,204 | $ | 94,887,358 | |||||
Distributions to members | (9,250,000 | ) | — | — | (9,250,000 | ) | ||||||||
Change in actuarial gain under ASC Topic 815 | — | 1,489,416 | — | 1,489,416 | ||||||||||
Net income | — | — | 30,713,764 | 30,713,764 | ||||||||||
BALANCE—December 31, 2007 | $ | 23,627,194 | $ | 588,376 | $ | 93,624,968 | $ | 117,840,538 | ||||||
Distributions to members (as restated) | (804,565 | ) | — | — | (804,565 | ) | ||||||||
Change in actuarial gain under ASC Topic 815 | — | 346,254 | — | 346,254 | ||||||||||
Net income | — | — | 928,882 | 928,882 | ||||||||||
BALANCE—December 31, 2008 | $ | 22,822,629 | $ | 934,630 | $ | 94,553,850 | $ | 118,311,109 | ||||||
Members contribution | 84,798 | — | — | 84,798 | ||||||||||
Change in actuarial gain under ASC Topic 815 | — | 542,561 | — | 542,561 | ||||||||||
Net income | 19,462,165 | 19,462,165 | ||||||||||||
BALANCE—December 31, 2009 | $ | 22,907,427 | $ | 1,477,191 | $ | 114,016,015 | $ | 138,400,633 | ||||||
See notes to consolidated financial statements.
RHINO ENERGY LLC
CONSOLIDATED STATEMENTS OF CASH FLOWS
FOR THE YEARS ENDED DECEMBER 31, 2009, 2008 AND 2007
| | Year Ended December 31, 2009 | Year Ended December 31, 2008 | Year Ended December 31, 2007 | ||||||||||
|---|---|---|---|---|---|---|---|---|---|---|---|---|---|
| | | (as restated) | | ||||||||||
CASH FLOWS FROM OPERATING ACTIVITIES: | |||||||||||||
Net income | $ | 19,462,165 | $ | 928,882 | $ | 30,713,764 | |||||||
Adjustments to reconcile net income to net cash provided by operating activities: | |||||||||||||
Depreciation, depletion and amortization | 36,279,249 | 36,428,281 | 30,749,773 | ||||||||||
Accretion on asset retirement obligations | 2,752,665 | 2,709,013 | 1,756,965 | ||||||||||
Accretion on interest-free debt | 200,093 | 568,955 | 359,817 | ||||||||||
Amortization of advance royalties | 215,433 | 470,752 | 699,705 | ||||||||||
Provision for doubtful accounts | 18,992 | — | (175,242 | ) | |||||||||
Equity in net (income) loss of unconsolidated affiliate | (892,873 | ) | 1,586,733 | — | |||||||||
Gain (loss) on retirement of advance royalties | 711,892 | 44,750 | (115,277 | ) | |||||||||
Gain (loss) on sale of assets—net | 1,709,905 | 450,513 | (944,303 | ) | |||||||||
Settlement of litigation | (1,772,535 | ) | — | — | |||||||||
Changes in assets and liabilities: | |||||||||||||
Accounts receivable | 3,295,476 | 13,719,986 | (10,639,666 | ) | |||||||||
Inventories | (3,459,160 | ) | (3,103,820 | ) | 2,933,193 | ||||||||
Advance royalties | (1,027,268 | ) | (1,510,485 | ) | (1,857,955 | ) | |||||||
Prepaid expenses and other assets | 923,886 | (1,400,963 | ) | (1,031,645 | ) | ||||||||
Accounts payable | (5,272,440 | ) | 4,658,282 | 1,471,100 | |||||||||
Accrued expenses and other liabilities | (963,225 | ) | 1,812,150 | 3,117,347 | |||||||||
Asset retirement obligations | (11,373,213 | ) | (816,764 | ) | (5,379,905 | ) | |||||||
Postretirement benefits | 685,955 | 664,561 | 834,851 | ||||||||||
Net cash provided by operating activities | 41,494,997 | 57,210,826 | 52,492,522 | ||||||||||
CASH FLOWS FROM INVESTING ACTIVITIES: | |||||||||||||
Additions to property, plant, and equipment | (27,835,697 | ) | (78,076,078 | ) | (14,598,735 | ) | |||||||
Proceeds from sales of property, plant, and equipment | 904,522 | 3,043,861 | 4,482,154 | ||||||||||
Principal payments received on notes receivable | 3,447,817 | 2,059,968 | 293,498 | ||||||||||
Cash advances from issuance of notes receivable | (2,040,000 | ) | (1,785,000 | ) | — | ||||||||
Changes in restricted cash | — | 663,960 | (100,006 | ) | |||||||||
Investment in unconsolidated affiliate | — | (17,880,222 | ) | — | |||||||||
Acquisitions of coal companies and other properties | — | (14,664,659 | ) | (18,174,465 | ) | ||||||||
Acquisition of roof support company | (1,821,342 | ) | — | — | |||||||||
Net cash used in investing activities | (27,344,700 | ) | (106,638,170 | ) | (28,097,554 | ) | |||||||
CASH FLOWS FROM FINANCING ACTIVITIES: | |||||||||||||
Borrowings on line of credit | 166,450,000 | 194,100,000 | 159,042,000 | ||||||||||
Repayments on line of credit | (175,450,000 | ) | (140,100,000 | ) | (165,042,000 | ) | |||||||
Proceeds from issuance of long-term debt | 4,576,292 | — | — | ||||||||||
Payment of abandoned public offering expenses | — | (3,581,888 | ) | — | |||||||||
Repayments on long-term debt | (4,943,441 | ) | (5,697,090 | ) | (7,708,871 | ) | |||||||
Payments on debt issuance costs | (1,168,674 | ) | (1,085,243 | ) | — | ||||||||
Proceeds from issuance of debt from related party | 50,000 | 4,950,000 | 1,767,342 | ||||||||||
Repayments on loan payable to related party | (5,000,000 | ) | — | — | |||||||||
Distributions to members | — | (804,565 | ) | (9,250,000 | ) | ||||||||
Contributions from members | 84,798 | — | — | ||||||||||
Net cash (used in) provided by financing activities | (15,401,025 | ) | 47,781,214 | (21,191,529 | ) | ||||||||
NET INCREASE (DECREASE) IN CASH AND CASH EQUIVALENTS | (1,250,728 | ) | (1,646,130 | ) | 3,203,439 | ||||||||
CASH AND CASH EQUIVALENTS—Beginning of period | 1,937,265 | 3,583,395 | 379,956 | ||||||||||
CASH AND CASH EQUIVALENTS—End of period | $ | 686,537 | $ | 1,937,265 | $ | 3,583,395 | |||||||
See notes to consolidated financial statements.
RHINO ENERGY LLC
NOTES TO CONSOLIDATED FINANCIAL STATEMENTS
FOR THE YEARS ENDED DECEMBER 31, 2009, 2008 AND 2007
1. ORGANIZATION AND BASIS OF PRESENTATION
Organization—Rhino Energy LLC and its wholly owned subsidiaries (the "Company") produce and market coal from surface and underground mines in Kentucky, Ohio, West Virginia, and Colorado, with the majority of the Company's sales going to domestic utilities and other coal-related organizations in the United States. The Company was formed in April 2003 and has been built via acquisitions.
In January 2009, the Company acquired the manufacturing operations of Triad Roof Support Systems, LLC located in Kentucky as part of a vertical integration effort. This operation produces roof control products used in underground coal mining. This acquisition included a manufacturing facility as well as a small product development shop. The Company allocated the purchase price to assets and liabilities acquired based upon their respective fair values in accordance with Accounting Standards Codification ("ASC") Topic 805 (previously Statement of Financial Accounting Standards ("SFAS") No. 141R, "Business Combinations"). To the extent that the purchase price of the assets was greater than the fair value of the net assets acquired, the Company recorded goodwill. The recorded values of the assets were:
Inventory | $ | 21,342 | ||
Property, plant and equipment | 792,500 | |||
Intangible assets | 806,000 | |||
Goodwill | 201,500 | |||
Assets acquired | $ | 1,821,342 | ||
Total consideration | $ | 1,821,342 | ||
Basis of Presentation and Principles of Consolidation—The accompanying consolidated financial statements include the accounts of Rhino Energy LLC and its subsidiaries. Significant intercompany transactions and balances have been eliminated in consolidation.
2. SUMMARY OF SIGNIFICANT ACCOUNTING POLICIES AND GENERAL
Company Environment and Risk Factors. The Company, in the course of its business activities, is exposed to a number of risks including: fluctuating market conditions of coal, truck and rail transportation, fuel costs, changing government regulations, unexpected maintenance and equipment failure, employee benefits cost control, changes in estimates of proven and probable coal reserves, as well as the ability of the Company to maintain adequate financing, necessary mining permits and control of sufficient recoverable coal properties. In addition, adverse weather and geological conditions may increase mining costs, sometimes substantially.
Concentrations of Credit Risk. See Note 13 for discussion of major customers. The Company does not require collateral or other security on accounts receivable. The credit risk is controlled through credit approvals and monitoring procedures.
Cash and Cash Equivalents. The Company considers all highly liquid investments purchased with maturities of three months or less to be cash equivalents.
RHINO ENERGY LLC
NOTES TO CONSOLIDATED FINANCIAL STATEMENTS (Continued)
FOR THE YEARS ENDED DECEMBER 31, 2009, 2008 AND 2007
2. SUMMARY OF SIGNIFICANT ACCOUNTING POLICIES AND GENERAL (Continued)
Inventories. Inventories are stated at the lower of cost, based on a three month rolling average, or market. Inventories primarily consist of coal contained in stockpiles.
Advance Royalties. The Company is required, under certain royalty lease agreements, to make minimum royalty payments whether or not mining activity is being performed on the leased property. These minimum payments may be recoupable once mining begins on the leased property. The Company capitalizes the recoupable minimum royalty payments and amortizes the deferred costs once mining activities begin on the units of production method or expenses the deferred costs when the Company has ceased mining or has made a decision not to mine on such property.
Note Receivable. Included in prepaid expenses and other current assets as of December 31, 2009 and 2008 are notes receivable the Company advanced to Rhino Eastern LLC ("Rhino Eastern"), a joint venture with Patriot Coal Corporation ("Patriot"), in the amount of $377,183 and $1,785,000, which bear interest at a fixed rate of 10%. The notes have no stated due dates.
Property, Plant and Equipment. Property, plant, and equipment, including coal properties, mine development costs and construction costs, are recorded at cost, which includes construction overhead and interest, where applicable. Expenditures for major renewals and betterments are capitalized, while expenditures for maintenance and repairs are expensed as incurred. Mining and other equipment and related facilities are depreciated using the straight-line method based upon the shorter of estimated useful lives of the assets or the estimated life of each mine. Coal properties are depleted using the units-of-production method, based on estimated proven and probable reserves. Mine development costs are amortized using the units-of-production method, based on estimated proven and probable reserves. Gains or losses arising from sales or retirements are included in current operations.
The Company applies the accounting guidance under ASC Topic 980 to stripping costs incurred in the production phase of a mine for the removal of overburden or waste materials for the purpose of obtaining access to coal that will be extracted. Under the rule, stripping costs incurred during the production phase of the mine are variable production costs that are included in the cost of inventory produced and extracted during the period the stripping costs are incurred. The Company has recorded stripping costs for all its surface mines incurred during the production phase as variable production costs that are included in the cost of inventory produced. The Company defines a surface mine as a location where the Company utilizes operating assets necessary to extract coal, with the geographic boundary determined by property control, permit boundaries, and/or economic threshold limits. Multiple pits that share common infrastructure and processing equipment may be located within a single surface mine boundary, which can cover separate coal seams that typically are recovered incrementally as the overburden depth increases. In accordance with ASC Topic 930, the Company defines a mine in production as one from which saleable minerals have begun to be extracted (produced) from an ore body, regardless of the level of production; however, the production phase does not commence with the removal of de minimis saleable mineral material that occurs in conjunction with the removal of overburden or waste material for the purpose of obtaining access to an ore
RHINO ENERGY LLC
NOTES TO CONSOLIDATED FINANCIAL STATEMENTS (Continued)
FOR THE YEARS ENDED DECEMBER 31, 2009, 2008 AND 2007
2. SUMMARY OF SIGNIFICANT ACCOUNTING POLICIES AND GENERAL (Continued)
body. The Company capitalizes only the development cost of the first pit at a mine site that may include multiple pits.
Asset Impairments. The Company follows ASC Topic 360 (previously SFAS No. 144, "Accounting for the Impairment or Disposal of Long-Lived Assets"), which requires that projected future cash flows from use and disposition of assets be compared with the carrying amounts of those assets, when potential impairment is indicated. When the sum of projected undiscounted cash flows is less than the carrying amount, impairment losses are recognized. In determining such impairment losses, discounted cash flows are utilized to determine the fair value of the assets being evaluated. Also, in certain situations, expected mine lives are shortened because of changes to planned operations. When that occurs and it is determined that the mine's underlying costs are not recoverable in the future, reclamation and mine closing obligations are accelerated and the mine closing accrual is increased accordingly. To the extent it is determined that asset carrying values will not be recoverable during a shorter mine life, a provision for such impairment is recognized. There were no impairment losses recorded during the years ended December 31, 2009, 2008 or 2007.
Debt Issuance Costs. Debt issuance costs reflect fees incurred to obtain financing and are amortized (included in interest expense) using the effective interest method, over the life of the related debt. Debt issuance costs are included in other non-current assets.
Asset Retirement Obligations. ASC Topic 410 (previously SFAS No. 143, "Accounting for Asset Retirement Obligations"), addresses asset retirement obligations that result from the acquisition, construction, or normal operation of long-lived assets. It requires companies to recognize asset retirement obligations at fair value when the liability is incurred or acquired. Upon initial recognition of a liability, an amount equal to the liability is capitalized as part of the related long-lived asset and allocated to expense over the useful life of the asset. The Company has recorded the asset retirement costs in coal properties.
The Company estimates its future cost requirements for reclamation of land where it has conducted surface and underground mining operations, based on its interpretation of the technical standards of regulations enacted by the U.S. Office of Surface Mining, as well as state regulations. These costs relate to reclaiming the pit and support acreage at surface mines and sealing portals at underground mines. Other reclamation costs are related to refuse and slurry ponds, as well as holding and related termination/exit costs.
The Company expenses contemporaneous reclamation which is performed prior to final mine closure. The establishment of the end of mine reclamation and closure liability is based upon permit requirements and requires significant estimates and assumptions, principally associated with regulatory requirements, costs and recoverable coal reserves. Annually, the Company reviews its end of mine reclamation and closure liability and makes necessary adjustments, including mine plan and permit changes and revisions to cost and production levels to optimize mining and reclamation efficiency. When a mine life is shortened due to a change in the mine plan, mine closing obligations are accelerated, the related accrual is increased and the related asset is reviewed for impairment, accordingly.
RHINO ENERGY LLC
NOTES TO CONSOLIDATED FINANCIAL STATEMENTS (Continued)
FOR THE YEARS ENDED DECEMBER 31, 2009, 2008 AND 2007
2. SUMMARY OF SIGNIFICANT ACCOUNTING POLICIES AND GENERAL (Continued)
The adjustments to the liability from annual recosting reflect changes in expected timing, cash flow, and the discount rate used in the present value calculation of the liability. Changes in the asset retirement obligations for the year ended December 31, 2009 were calculated with the same discount rate (10%) used for the year ended December 31, 2008. An 8% discount rate was used for 2007. Other recosting adjustments to the liability are made annually based on inflationary cost increases and changes in the expected operating periods of the mines.
Sales Contract Liability. In connection with certain acquisitions during 2004, the Company acquired certain contracts with sales prices that were below its production cost. The Company recognized a liability for these contracts equal to the present value of the difference between the Company's cost and the contract amount in accordance with ASC Topic 805. The Company amortized this liability as sales were made under these sales contracts. Such amortization is included within depreciation, depletion and amortization. The sales contract liability has been fully amortized as of December 31, 2008.
Workers' Compensation Benefits. Certain of the Company's subsidiaries are liable under federal and state laws to pay workers' compensation and coal workers' pneumoconiosis ("black lung") benefits to eligible employees, former employees and their dependents. The Company currently utilizes an insurance program and state workers' compensation fund participation to secure its on-going obligations depending on the location of the operation. Premium expense for workers' compensation benefits is recognized in the period in which the related insurance coverage is provided.
Revenue Recognition. Most of the Company's revenues are generated under long-term coal sales contracts with electric utilities, industrial companies or other coal-related organizations, primarily in the eastern United States. Revenue is recognized and recorded when shipment or delivery to the customer has occurred, prices are fixed or determinable and the title or risk of loss has passed in accordance with the terms of the sales agreement. Under the typical terms of these agreements, risk of loss transfers to the customers at the mine or port, when the coal is loaded on the rail, barge, truck or other transportation source that delivers coal to its destination. Advance payments received are deferred and recognized in revenue as coal is shipped and title has passed.
Coal sales revenues also result from the sale of brokered coal produced by others. The revenues related to brokered coal sales are included in coal sales revenues on a gross basis and the corresponding cost of the coal from the supplier is recorded in cost of coal sales in accordance with ASC Topic 605-45, "Principal Agent Considerations".
Freight and handling costs paid directly to third-party carriers and invoiced to coal customers are recorded as freight and handling costs and freight and handling revenues, respectively.
Other revenues generally consist of limestone sales, coal handling and processing, rebates and rental income. With respect to other revenues recognized in situations unrelated to the shipment of coal, we carefully review the facts and circumstances of each transaction and do not
RHINO ENERGY LLC
NOTES TO CONSOLIDATED FINANCIAL STATEMENTS (Continued)
FOR THE YEARS ENDED DECEMBER 31, 2009, 2008 AND 2007
2. SUMMARY OF SIGNIFICANT ACCOUNTING POLICIES AND GENERAL (Continued)
recognize revenue until the following criteria are met: persuasive evidence of an arrangement exists, delivery has occurred or services have been rendered, the seller's price to the buyer is fixed or determinable and collectibility is reasonably assured. Advance payments received are deferred and recognized in revenue when earned.
Selling General and Administrative ("SG&A") Expenses. SG&A expense recorded for the year ended December 31, 2008 includes the recognition of $3.6 million in deferred costs related to our previous initial public offering, which was abandoned in August of that year.
Derivative Financial Instruments.��During the year ended December 31, 2008, the Company used futures contracts to manage the risk of fluctuations in the sales price of coal. The Company did not use derivative financial instruments for trading or speculative purposes. The Company recorded the derivative financial instruments as either assets or liabilities, at fair value, in accordance with ASC Topic 815, Derivatives and Hedging. All futures contracts were settled as of December 31, 2008. The Company also uses diesel fuel forward contracts to manage the risk of fluctuations in the cost of diesel fuel. The Company's diesel fuel forward contracts qualify for the normal purchase normal sale ("NPNS") exception prescribed by ASC Topic 815, based on management's intent and ability to take physical delivery of the diesel fuel.
Investment in Joint Venture. Investments in other entities are accounted for using the consolidation, equity method or cost basis depending upon the level of ownership, the Company's ability to exercise significant influence over the operating and financial policies of the investee and whether the Company is determined to be the primary beneficiary. Equity investments are recorded at original cost and adjusted periodically to recognize the Company's proportionate share of the investees' net income or losses after the date of investment. When net losses from an equity method investment exceed its carrying amount, the investment balance is reduced to zero and additional losses are not provided for. The Company resumes accounting for the investment under the equity method when the entity subsequently reports net income and the Company's share of that net income exceeds the share of net losses not recognized during the period the equity method was suspended. Investments are written down only when there is clear evidence that a decline in value that is other than temporary has occurred.
In May 2008, the Company entered into a joint venture, Rhino Eastern, with Patriot to acquire the Eagle mining complex. To initially capitalize the joint venture, the Company contributed approximately $16.1 million for a 51% ownership interest in the joint venture and accounts for the investment in the joint venture and its results of operations under the equity method. The Company considers the operations of this entity to comprise a reporting segment and has provided additional detail related to this operation in Note 17, "Segment Information."
In determining that the Company was not the primary beneficiary of the variable interest entity for the years ended December 31, 2009 and 2008, the Company performed a qualitative and quantitative analysis of the variable interests in the joint venture. This included an analysis of the expected losses and residual returns of the joint venture. The Company concluded that it is not the primary beneficiary of the joint venture primarily because of certain contractual arrangements by the joint venture with Patriot. Mandatory pro rata additional contributions not
RHINO ENERGY LLC
NOTES TO CONSOLIDATED FINANCIAL STATEMENTS (Continued)
FOR THE YEARS ENDED DECEMBER 31, 2009, 2008 AND 2007
2. SUMMARY OF SIGNIFICANT ACCOUNTING POLICIES AND GENERAL (Continued)
to exceed $10 million in the aggregate could be required of the joint venture partners which the Company would be obligated to fund based upon its 51% ownership interest.
As of December 31, 2009 and 2008, the Company has recorded its equity method investment of $17,186,362 and $16,293,489, respectively as a long-term asset. The Company's maximum exposure to losses associated with its involvement in this variable interest entity would be limited to its equity investment of $17,186,362 as of December 31, 2009 plus any additional capital contributions, if required. The Company has not provided any additional contractually required support as of December 31, 2009; however, as disclosed in Note 12 "Commitments and Contingencies" the Company has provided a loan in the amount of $377,183 to the joint venture.
Income Taxes. The Company is considered a partnership for income tax purposes. Accordingly, the members report the Company's taxable income or loss on their individual tax returns.
Loss Contingencies. In accordance with ASC Topic 415 (previously SFAS No. 5 "Accounting for Contingencies"), the Company records loss contingencies at such time that an unfavorable outcome becomes probable and the amount can be reasonably estimated. When the reasonable estimate is a range, the recorded loss is the best estimate within the range. If no amount in the range is a better estimate than any other amount, the minimum amount of the range is recorded. The Company discloses information concerning loss contingencies for which an unfavorable outcome is more than remote. See Note 12, "Commitments and Contingencies," for a discussion of legal matters.
Management's Use of Estimates. The preparation of consolidated financial statements in conformity with accounting principles generally accepted in the United States of America requires management to make estimates and assumptions that affect the reported amounts of assets, liabilities and disclosure of contingent assets and liabilities at the date of the consolidated financial statements as well as the reported amounts of revenues and expenses during the reporting period. Actual results could differ from those estimates.
Recently Issued Accounting Standards . Effective January 1, 2008, the Company adopted ASC Topic 820 (previously SFAS No. 157, "Fair Value Measurements") which clarifies the definition of fair value, establishes a framework for measuring fair value and expands the disclosures on fair value measurements. ASC Topic 820 applies whenever other statements require or permit assets or liabilities to be measured at fair value. ASC Topic 820 requirements for certain non-financial assets and liabilities were permitted to be deferred until the first quarter of 2009 in accordance with FSP 157-2,Effective Date of ASC Topic 820. The Company adopted the new guidance under ASC Topic 820 January 1, 2009, at the time of the adoption there were no nonfinancial assets or nonfinancial liabilities that were measured at fair value on a nonrecurring basis. ASC Topic 820 establishes the following fair value hierarchy that prioritizes the inputs used to measure fair value:
RHINO ENERGY LLC
NOTES TO CONSOLIDATED FINANCIAL STATEMENTS (Continued)
FOR THE YEARS ENDED DECEMBER 31, 2009, 2008 AND 2007
2. SUMMARY OF SIGNIFICANT ACCOUNTING POLICIES AND GENERAL (Continued)
The Company also adopted ASC Topic 825 (previously SFAS No. 159, "The Fair Value Option for Financial Assets and Financial Liabilities"—Including an amendment of FASB Statement No. 115) as of January 1, 2008, which permits entities to choose to measure many financial instruments and certain other items at fair value that are not currently required to be measured at fair value. In addition, it also establishes recognition, presentation, and disclosure requirements designed to facilitate comparisons between entities that choose different measurement attributes for similar types of assets and liabilities. The Company has not made any fair value elections with respect to any of its eligible assets or liabilities as of December 31, 2009 or 2008.
ASC Topic 740 (previously FASB Interpretation No. 48, "Accounting for Uncertainty in Income Taxes") among other things prescribes a recognition threshold and measurement attribute for the recognition, measurement, presentation, and disclosure of uncertain tax positions that the Company has taken or expects to take on a tax return. ASC Topic 740 provides that a tax benefit from an uncertain tax position may be recognized when it is more likely than not that the position will be sustained upon examination, including resolutions of any related appeals or litigation processes, based on the technical merits of the income tax position. Income tax positions must meet a more-likely-than-not recognition threshold to be recognized. The Company adopted this guidance as of January 1, 2007 and the adoption of this guidance did not have a material impact on the Company's financial position, results of operations, or cash flows as of and for the year ended December 31, 2009.
ASC Topic 805 among other things provides guidance for the way companies account for business combinations. This guidance requires transaction-related costs to be expensed as incurred, which were previously accounted for as a cost of acquisition. ASC Topic 805 also requires acquirers to estimate the acquisition-date fair value of any contingent consideration and recognize any subsequent changes in the fair value of contingent consideration in earnings. In addition, restructuring costs the acquirer was not obligated to incur shall be recognized separately from the business acquisition. The Company adopted this guidance on a prospective basis as of January 1, 2009. The adoption of this guidance did not require remeasurement of any prior balances but will impact accounting for business combinations after date of adoption. The adoption of this guidance was applied to the purchase accounting of Triad Roof Support Systems LLC.
ASC Topic 810 (previously SFAS No. 160, "Noncontrolling Interests in Consolidated Financial Statements, An Amendment of ARB No. 51") requires all entities to report noncontrolling interests in subsidiaries as a separate component of equity in the consolidated
RHINO ENERGY LLC
NOTES TO CONSOLIDATED FINANCIAL STATEMENTS (Continued)
FOR THE YEARS ENDED DECEMBER 31, 2009, 2008 AND 2007
2. SUMMARY OF SIGNIFICANT ACCOUNTING POLICIES AND GENERAL (Continued)
financial statements. A single method of accounting has been established for changes in a parent's ownership interest in a subsidiary that do not result in deconsolidation. Companies no longer recognize a gain or loss on partial disposals of a subsidiary where control is retained. In addition, in partial acquisitions where control is obtained, the acquiring company will recognize and measure at fair value 100 percent of the assets and liabilities, including goodwill, as if the entire target company had been acquired. The Company adopted this guidance as of January 1, 2009.
In May 2009, the FASB issued guidance under ASC Topic 855 (previously SFAS No. 165, "Subsequent Events"), which provided general accounting standards for the disclosure of events that occur after the balance sheet date but before the financial statements are issued or available for issue. This guidance does not apply to subsequent events or transactions that are within the scope of other generally accepted accounting principles that provide different guidance on the accounting treatment of subsequent events. ASC Topic 855 includes a new required disclosure of the date through which an entity, other than a public filer, has evaluated subsequent events and the basis for that date. Such disclosures are required for financial statements issued after June 15, 2009 and are included in these consolidated financial statements.
In June 2009, the FASB issued guidance under ASC Topic 810 (previously SFAS No. 167, "Amendments to FASB Interpretation No. 46(R)"), which amended the consolidation guidance for variable interest entities ("VIEs"). The new guidance requires a company to perform an analysis to determine whether its variable interest gives it a controlling financial interest in a VIE. The amendment, which requires ongoing reassessments, redefines the primary beneficiary as the party that (1) has the power to direct the activities of a VIE that most significantly impact the entity's economic performance and (2) has the obligation to absorb losses of the entity that could potentially be significant to the VIE or the right to receive benefits from the entity that could potentially be significant to the VIE. The guidance includes enhanced disclosures about a company's involvement in a VIE and also eliminates the exemption for qualifying special purpose entities. The guidance was effective for the Company on January 1, 2010.
In June 2009, the FASB adopted ASC Topic 105 (previously SFAS No. 168, "The FASB Accounting Standards Codification and the Hierarchy of Generally Accepted Accounting Principles, a replacement of FASB Statement No. 162"), which is effective for periods after September 15, 2009. The ASC became the source of authoritative US Generally Accepted Accounting Principals ("GAAP") applied to nongovernmental entities. Rules and interpretive releases of the Securities and Exchange Commission ("SEC") under authority of federal securities laws are also sources of authoritative GAAP for SEC registrants. All other non-grandfathered non-SEC accounting literature not included in the ASC is considered non-authoritative. The Company adopted the ASC as the single source of authoritative nongovernmental generally accepted accounting principles.
3. SUBSEQUENT EVENTS
Management has evaluated the accompanying consolidated financial statements and notes for subsequent events up through May 5, 2010 which is the date the financial statements were
RHINO ENERGY LLC
NOTES TO CONSOLIDATED FINANCIAL STATEMENTS (Continued)
FOR THE YEARS ENDED DECEMBER 31, 2009, 2008 AND 2007
3. SUBSEQUENT EVENTS (Continued)
available for issue. Management is not aware of any changes that would have a material effect on the financial statements.
4. PREPAID EXPENSES AND OTHER CURRENT ASSETS
Prepaid expenses and other current assets as of December 31, 2009 and 2008 consisted of the following:
| | December 31, 2009 | December 31, 2008 | |||||
|---|---|---|---|---|---|---|---|
Notes receivable from affiliate | $ | 377,183 | $ | 1,785,000 | |||
Other prepaid expenses | 571,834 | 730,263 | |||||
Prepaid insurance | 2,918,607 | 1,956,223 | |||||
Prepaid leases | 53,646 | 196,952 | |||||
Supply inventory | 480,458 | 418,196 | |||||
Deposits | 167,736 | 210,169 | |||||
Rebates receivable | — | 572,262 | |||||
Total | $ | 4,569,464 | $ | 5,869,065 | |||
5. PROPERTY, PLANT AND EQUIPMENT
Property, plant and equipment, including coal properties and mine development and construction costs, as of December 31, 2009 and 2008 are summarized by major classification as follows:
| | Useful Lives | December 31, 2009 | December 31, 2008 | ||||||
|---|---|---|---|---|---|---|---|---|---|
Land and land improvements | $ | 21,413,003 | $ | 19,573,733 | |||||
Mining and other equipment and related facilities | 2 - 20 Years | 203,725,387 | 185,490,370 | ||||||
Mine development costs | 1 - 15 Years | 47,135,311 | 43,837,630 | ||||||
Coal properties | 1 - 15 Years | 119,764,966 | 129,203,964 | ||||||
Construction work in process | 6,864,844 | 6,540,461 | |||||||
Total | 398,903,511 | 384,646,158 | |||||||
Less accumulated depreciation, depletion and amortization | (128,223,914 | ) | (101,783,057 | ) | |||||
Net | $ | 270,679,597 | $ | 282,863,101 | |||||
Depreciation expense for mining and other equipment and related facilities for the years ended December 31, 2009, 2008 and 2007 was $29,246,929, $25,989,778 and $20,960,235, respectively. Depletion expense for coal properties for the years ended December 31, 2009, 2008 and 2007 was $2,315,312, $3,953,669 and $3,611,530, respectively. Amortization expense for mine development costs for the years ended December 31, 2009, 2008 and 2007 was $2,874,558, $4,315,028 and $4,211,449, respectively. Amortization expense for asset retirement costs for the
RHINO ENERGY LLC
NOTES TO CONSOLIDATED FINANCIAL STATEMENTS (Continued)
FOR THE YEARS ENDED DECEMBER 31, 2009, 2008 AND 2007
5. PROPERTY, PLANT AND EQUIPMENT (Continued)
years ended December 31, 2009, 2008 and 2007 was $1,842,450, $2,740,342 and $2,639,083, respectively.
6. GOODWILL AND INTANGIBLE ASSETS
ASC Topic 350 (previously SFAS No. 142, "Goodwill and Other Intangible Assets") addresses financial accounting and reporting for goodwill and other intangible assets subsequent to their acquisition. Under the provisions of ASC Topic 350, goodwill and other intangible assets with indefinite useful lives are no longer amortized but instead tested for impairment at least annually.
Goodwill as of December 31, 2009 and 2008 consisted of the following:
| | December 31, 2009 | December 31, 2008 | ||||||
|---|---|---|---|---|---|---|---|---|
Goodwill from the acquisition of Triad | $ | 201,500 | $ | — | ||||
Total | $ | 201,500 | $ | — | ||||
Intangible Assets as of December 31, 2009 and 2008 consisted of the following:
| | December 31, 2009 | December 31, 2008 | |||||
|---|---|---|---|---|---|---|---|
Patent | $ | 728,000 | $ | 1 | |||
Developed Technology | 78,000 | — | |||||
Total | $ | 806,000 | $ | — | |||
The Company considers these intangible assets to have a useful life of seventeen years. The intangible assets are amortized over their useful life on a straight line basis. Amortization for the year ended December 31, 2009 was not material.
7. OTHER NON-CURRENT ASSETS
Other non-current assets as of December 31, 2009 and 2008 consisted of the following:
| | December 31, 2009 | December 31, 2008 | ||||||
|---|---|---|---|---|---|---|---|---|
Deposits and other | $ | 321,531 | $ | 620,795 | ||||
Debt issuance costs—net | 2,271,728 | 1,720,596 | ||||||
Deferred expenses | 133,541 | 248,837 | ||||||
Total | $ | 2,726,800 | $ | 2,590,228 | ||||
Debt issuance costs were $4,309,502 and $3,151,875 as of December 31, 2009 and 2008, respectively. Accumulated amortization of debt issuance costs were $2,037,774 and $1,431,279 as of December 31, 2009 and 2008, respectively.
RHINO ENERGY LLC
NOTES TO CONSOLIDATED FINANCIAL STATEMENTS (Continued)
FOR THE YEARS ENDED DECEMBER 31, 2009 AND 2008
8. ACCRUED EXPENSES AND OTHER CURRENT LIABILITIES
Accrued expenses and other current liabilities as of December 31, 2009 and 2008 consisted of the following:
| | December 31, 2009 | December 31, 2008 | ||||||
|---|---|---|---|---|---|---|---|---|
Payroll, bonus and vacation expense | $ | 3,667,804 | $ | 5,463,113 | ||||
Non income taxes | 3,641,636 | 3,190,582 | ||||||
Royalty expenses | 2,549,714 | 2,249,761 | ||||||
Accrued interest | 325,508 | 363,253 | ||||||
Health claims | 1,618,611 | 2,116,729 | ||||||
Workers' compensation and pneumoconiosis | 3,090,227 | 1,799,196 | ||||||
Other | 181,919 | 356,006 | ||||||
Total | $ | 15,075,419 | $ | 15,538,640 | ||||
9. DEBT
Debt as of December 31, 2009 and 2008 consisted of the following:
| | December 31, 2009 | December 31, 2008 | ||||||
|---|---|---|---|---|---|---|---|---|
Line of credit with PNC Bank, N.A. | $ | 114,000,000 | $ | 123,000,000 | ||||
Note payable to H&L Construction Co., Inc. | 3,627,709 | 6,840,764 | ||||||
Note payable to related party | — | 4,950,000 | ||||||
Capital lease obligation with Applied Financial | — | 406,225 | ||||||
Other notes payable | 4,509,716 | 2,830,027 | ||||||
Total | 122,137,425 | 138,027,016 | ||||||
Less current portion | (2,241,634 | ) | (12,490,286 | ) | ||||
Long-term debt | $ | 119,895,791 | $ | 125,536,730 | ||||
Line of credit with PNC Bank, N.A.—Borrowings under the line of credit bear interest which varies depending upon the grouping of the borrowings within the line of credit. At December 31, 2009, the Company had borrowed $114,000,000 at a variable interest rate of LIBOR plus 3.00% (3.26% at December 31, 2009). In addition, the Company had outstanding letters of credit of $21,482,580 at a fixed interest rate of 3.00% at December 31, 2009. The credit agreement is to expire in February 2013. At December 31, 2009, the Company had not used $64,517,420 of the borrowing availability. As part of the agreement, the Company is required to pay a commitment fee of 0.375% on the unused portion of the borrowing availability. Borrowings on the line of credit are collateralized by all the unsecured assets of the Company.
The revolving credit commitment requires the Company to maintain certain minimum financial ratios and contains certain restrictive provisions, including among others, restrictions on making loans, investments and advances, incurring additional indebtedness, guaranteeing indebtedness, creating liens, selling or assigning stock. The Company was in compliance with all restrictive provisions as of December 31, 2009.
RHINO ENERGY LLC
NOTES TO CONSOLIDATED FINANCIAL STATEMENTS (Continued)
FOR THE YEARS ENDED DECEMBER 31, 2009 AND 2008
9. DEBT (Continued)
In May 2008, the Company amended the credit agreement with PNC to exclude CAM-Colorado from certain restrictions generally applicable to subsidiaries under the credit facility. The maximum availability under the credit facility remained at $200,000,000. The expiration of the credit agreement was unchanged.
In November 2008, the Company amended the credit agreement with PNC to remove the restriction of the Company's investments in oil and gas and related business activities. The maximum availability under the credit facility and the expiration of the credit agreement were unchanged.
In April 2009, the Company amended its credit agreement with PNC to revise certain restrictive provisions and extended the agreement expiration date to February 2013. The restrictive provisions of the amended credit agreement were effective as of March 31, 2009 and the Company was in compliance with all the financial restrictive provisions of the amended credit agreement as of December 31, 2009.
Note payable to H&L Construction Co., Inc.—In September 2009, the Company amended and restated the note payable to H&L Construction Co., Inc. This note payable is a non-interest bearing note. The Company has recorded a discount for imputed interest at a rate of 5.0% on this note. The Company is amortizing this discount over the life of the note using the effective interest method. The note payable matures in January 2015. The note is secured by mineral rights purchased by the Company from H&L Construction Co., Inc. with a carrying amount of $12,388,127 at December 31, 2009.
Note payable to Related Party—The note payable to an investment fund of Wexford was classified as short-term and had an interest rate of 10%. The Company repaid the full amount plus accrued interest in January 2009.
Capital Lease Obligation with Applied Financial—Borrowings under the capital lease with Applied Financial are to be paid back in 48 equal installments of $30,104. This obligation was retired in October 2009.
Principal payments on long-term debt due subsequent to December 31, 2009, are as follows:
2010 | $ | 2,241,634 | ||
2011 | 746,448 | |||
2012 | 784,571 | |||
2013 | 115,008,269 | |||
2014 | 996,181 | |||
Thereafter | 3,050,324 | |||
Total principal payments | 122,827,427 | |||
Less imputed interest on interest free notes payable | (690,002 | ) | ||
Total debt | $ | 122,137,425 | ||
RHINO ENERGY LLC
NOTES TO CONSOLIDATED FINANCIAL STATEMENTS (Continued)
FOR THE YEARS ENDED DECEMBER 31, 2009 AND 2008
10. ASSET RETIREMENT OBLIGATIONS
The changes in the Company's asset retirement obligations for the years ended December 31, 2009, 2008 and 2007 are:
| | Year Ended December 31, 2009 | Year Ended December 31, 2008 | Year Ended December 31, 2007 | |||||||
|---|---|---|---|---|---|---|---|---|---|---|
Balance at beginning of period (including current portion) | $ | 55,760,291 | $ | 36,387,399 | $ | 30,168,469 | ||||
Accretion expense | 2,752,665 | 2,709,013 | 1,756,965 | |||||||
Additions resulting from property additions | — | 17,480,643 | 9,841,870 | |||||||
Adjustment resulting from disposal of property | (2,038,433 | ) | — | — | ||||||
Adjustments to the liability from annual recosting and other | (6,595,947 | ) | 1,409,949 | (2,578,714 | ) | |||||
Liabilities settled | (4,777,266 | ) | (2,226,713 | ) | (2,801,191 | ) | ||||
Balance at end of period | 45,101,310 | 55,760,291 | 36,387,399 | |||||||
Current portion of asset retirement obligation | 5,427,614 | 7,720,782 | 2,582,646 | |||||||
Long-term portion of asset retirement obligation | $ | 39,673,696 | $ | 48,039,509 | $ | 33,804,753 | ||||
11. EMPLOYEE BENEFITS
Postretirement Plan—In conjunction with the acquisition of the coal operations of American Electric Power on April 16, 2004, the Company acquired a postretirement benefit plan providing healthcare to eligible employees. The Company has no other postretirement plans.
Summaries of the changes in benefit obligations and funded status of the plan as of the measurement dates of December 31, 2009, 2008 and 2007 are as follows:
| | Year Ended December 31, 2009 | Year Ended December 31, 2008 | Year Ended December 31, 2007 | ||||||||
|---|---|---|---|---|---|---|---|---|---|---|---|
Benefit obligation at beginning of period | $ | 5,066,599 | $ | 4,748,292 | $ | 5,402,857 | |||||
Changes in benefit obligations: | |||||||||||
Service costs | 441,553 | 454,115 | 535,428 | ||||||||
Interest cost | 325,512 | 293,661 | 293,199 | ||||||||
Benefits paid | (14,963 | ) | (67,829 | ) | (15,693 | ) | |||||
Actuarial gain | (608,708 | ) | (361,640 | ) | (1,467,499 | ) | |||||
Benefit obligation at end of period | $ | 5,209,993 | $ | 5,066,599 | $ | 4,748,292 | |||||
Fair value of plan assets at end of period | $ | — | $ | — | $ | — | |||||
Funded status | $ | (5,209,993 | ) | $ | (5,066,599 | ) | $ | (4,748,292 | ) | ||
RHINO ENERGY LLC
NOTES TO CONSOLIDATED FINANCIAL STATEMENTS (Continued)
FOR THE YEARS ENDED DECEMBER 31, 2009 AND 2008
11. EMPLOYEE BENEFITS (Continued)
| | December 31, 2009 | December 31, 2008 | ||||||
|---|---|---|---|---|---|---|---|---|
Classification of net amount recognized: | ||||||||
Current liability—postretirement benefits | $ | (95,139 | ) | $ | (108,407 | ) | ||
Non-current liability—postretirement benefits | (5,114,854 | ) | (4,958,192 | ) | ||||
Net amount recognized | $ | (5,209,993 | ) | $ | (5,066,599 | ) | ||
| | Year Ended December 31, 2009 | Year Ended December 31, 2008 | Year Ended December 31, 2007 | ||||||||
|---|---|---|---|---|---|---|---|---|---|---|---|
Amount recognized in accumulated other comprehensive income— | |||||||||||
Balance at the beginning of the year | $ | 934,630 | $ | 588,376 | $ | (901,040 | ) | ||||
Actuarial gain | 608,708 | 361,640 | 1,489,416 | ||||||||
Amortization of actuarial gain | (66,147 | ) | (15,386 | ) | — | ||||||
Net actuarial gain | $ | 1,477,191 | $ | 934,630 | $ | 588,376 | |||||
| | December 31, 2009 | December 31, 2008 | |||||
|---|---|---|---|---|---|---|---|
Weighted Average assumptions used to determine benefit obligations | |||||||
Discount rate | 5.60 | % | 6.50 | % | |||
Expected return on plan assets | n/a | n/a | |||||
| | Year Ended December 31, 2009 | Year Ended December 31, 2008 | Year Ended December 31, 2007 | |||
|---|---|---|---|---|---|---|
Weighted Average assumptions used to determine periodic benefit cost | ||||||
Discount rate | 6.50% | 6.25% | 5.60% | |||
Expected return on plan assets | n/a | n/a | n/a | |||
Rate of compensation increase | n/a | n/a | n/a |
| | Year Ended December 31, 2009 | Year Ended December 31, 2008 | Year Ended December 31, 2007 | |||||||
|---|---|---|---|---|---|---|---|---|---|---|
Net periodic benefit cost: | ||||||||||
Service costs | $ | 441,553 | $ | 454,115 | $ | 535,428 | ||||
Interest cost | 325,512 | 293,661 | 293,199 | |||||||
Amortization of (gain) | (66,147 | ) | (15,386 | ) | — | |||||
Benefit cost | $ | 700,918 | $ | 732,390 | $ | 828,627 | ||||
Amounts expected to be amortized from accumulated other comprehensive income into net periodic benefit cost during the year ending December 31, 2010, are as follows:
Net actuarial gain | $ | 157,057 |
RHINO ENERGY LLC
NOTES TO CONSOLIDATED FINANCIAL STATEMENTS (Continued)
FOR THE YEARS ENDED DECEMBER 31, 2009 AND 2008
11. EMPLOYEE BENEFITS (Continued)
Expected benefit payments:
Period | | |||
|---|---|---|---|---|
2010 | $ | 95,139 | ||
2011 | 178,461 | |||
2012 | 294,332 | |||
2013 | 384,130 | |||
2014 | 503,855 | |||
2015-2019 | 4,314,307 | |||
For measurement purposes, an 8.25% annual rate of increase in the per capita cost of covered health care benefits was assumed, gradually decreasing to 4.5% in 2025 and remaining level thereafter.
Net periodic benefit cost is determined using the assumptions as of the beginning of the year, and the funded status is determined using the assumptions as of the end of the year. Effective June 1, 2007, employees hired by the Company are not eligible for benefits under the plan.
The expense and liability estimates can fluctuate by significant amounts based upon the assumptions used by the Company. As of December 31, 2009, a one-percentage-point change in assumed health care cost trend rates would have the following effects:
| | One-Percentage Point Increase | One-Percentage Point Decrease | |||||
|---|---|---|---|---|---|---|---|
Effect on total service and interest cost components | $ | 68,280 | $ | (61,965 | ) | ||
Effect on postretirement benefit obligation | $ | 432,110 | $ | (393,441 | ) | ||
401(k) Plans—The Company and certain subsidiaries sponsor defined contribution savings plans for all employees. Under one defined contribution savings plan, the Company matches voluntary contributions of participants up to a maximum contribution based upon a percentage of a participant's salary with an additional matching contribution possible at the Company's discretion. The expense under these plans for the years ended December 31, 2009, 2008 and 2007 was approximately $2,326,000, $1,998,000 and $1,262,000, respectively.
12. COMMITMENTS AND CONTINGENCIES
Coal Sales Contracts and Contingencies—As of December 31, 2009, the Company had commitments under sales contracts to deliver annually scheduled base quantities of 4.2 million, 2.4 million, 2.2 million, 1.8 million and 1.0 million tons of coal to 19 customers in 2010, 5 customers in 2011, 4 customers in 2012, 3 customers in 2013 and 1 customer in 2014 respectively. Some of the contracts have sales price adjustment provisions, subject to certain limitations and adjustments, based on a variety of factors and indices.
RHINO ENERGY LLC
NOTES TO CONSOLIDATED FINANCIAL STATEMENTS (Continued)
FOR THE YEARS ENDED DECEMBER 31, 2009 AND 2008
12. COMMITMENTS AND CONTINGENCIES (Continued)
Purchase Commitments—As of December 31, 2009, the Company had 3.1 million gallons remaining on a commitment to purchase diesel fuel at fixed prices through December 2010 for $7.3 million.
Purchased Coal Expenses—The Company incurred purchased coal expense of approximately $10.5 million, $27.0 million and $7.1 million for the years ended December 31, 2009, 2008 and 2007 related to coal purchase contracts. In addition, the Company incurred purchased coal expense of approximately $98.6 million, $12.8 million and $37.6 million for coal purchased on the over-the-counter market (OTC) for the years ended December 31, 2009, 2008 and 2007. There were no outstanding coal purchase commitments as of December 31, 2009.
Leases—The Company leases various mining, transportation and other equipment under operating leases. Lease expense for the years ended December 31, 2009, 2008 and 2007 was approximately $8,151,000, $8,319,000 and $10,423,000, respectively.
The Company also leases coal reserves under agreements that call for royalties to be paid as the coal is mined. Total royalty expense for the years ended December 31, 2009, 2008 and 2007 was approximately $12,866,000, $20,899,000 and $20,518,000, respectively.
Approximate future minimum lease and royalty payments (not including advance royalties already paid and recorded as assets in the accompanying statements of financial position) are as follows:
| Years Ended December 31, | Royalties | Leases | |||||
|---|---|---|---|---|---|---|---|
2010 | $ | 4,206,942 | $ | 4,883,063 | |||
2011 | 3,981,940 | 1,162,435 | |||||
2012 | 3,781,938 | 1,168,939 | |||||
2013 | 3,781,938 | 897,306 | |||||
2014 | 3,781,938 | 91,800 | |||||
Thereafter | 18,909,691 | — | |||||
Total minimum royalty and lease payments | $ | 38,444,387 | $ | 8,203,543 | |||
Environmental Matters—Based upon current knowledge, the Company believes that it is in compliance with environmental laws and regulations as currently promulgated. However, the exact nature of environmental control problems, if any, which the Company may encounter in the future cannot be predicted, primarily because of the increasing number, complexity and changing character of environmental requirements that may be enacted by federal and state authorities.
Legal Matters—The Company is involved in various legal proceedings arising in the ordinary course of business. The Company is not party to any pending litigation that is likely to have a material adverse effect on the financial condition, results of operations or cash flows of
RHINO ENERGY LLC
NOTES TO CONSOLIDATED FINANCIAL STATEMENTS (Continued)
FOR THE YEARS ENDED DECEMBER 31, 2009 AND 2008
12. COMMITMENTS AND CONTINGENCIES (Continued)
the Company. Management of the Company is not aware of any significant legal or governmental proceedings against or contemplated to be brought against the Company.
Guarantees/Indemnifications and Financial Instruments with Off-balance Sheet Risk—In the normal course of business, the Company is a party to certain guarantees and financial instruments with off-balance sheet risk, such as bank letters of credit and performance or surety bonds. No liabilities related to these arrangements are reflected in the Company's consolidated statements of financial position. The amount of bank letters of credit outstanding with PNC as of December 31, 2009 was $21,482,580. The bank letters of credit outstanding with PNC reduce the Company's borrowing capacity on its line of credit with PNC. In addition, the Company has outstanding surety bonds with third parties of $64,489,882 as of December 31, 2009, to secure reclamation and other performance commitments.
The line of credit with PNC is fully and unconditionally, jointly and severally guaranteed by the Company and substantially all of its wholly owned subsidiaries. Borrowings on the line of credit with PNC are collateralized by the unsecured assets of the Company and substantially all of its wholly owned subsidiaries. See Note 9 for a more complete discussion of the Company's debt obligations.
The Company is owned by a collection of investment funds managed by Wexford. Wexford fully and unconditionally guarantees 91% of the Company's obligations under its outstanding surety bonds with third parties to secure reclamation and other performance commitments.
Employment Agreements—The Company has employment agreements with key executive officers which expire between March 2010 and May 2011. In addition to a base salary, the agreements provide for bonuses based on a percentage of base salary up to 40%. Total salary and bonus expenses of $2,840,941, $3,138,267 and $4,385,735 were recognized under the employment agreements for the years ended December 31, 2009, 2008 and 2007, respectively.
Joint Venture—Pursuant to the joint venture agreement with Patriot, the Company is required to contribute additional capital to assist in funding the development and operations of the joint venture. During the year ended December 31, 2009, the Company did not make any capital contributions but did have outstanding notes receivable of $377,183. The Company may be required to contribute additional capital or make loans to the joint venture in subsequent periods.
RHINO ENERGY LLC
NOTES TO CONSOLIDATED FINANCIAL STATEMENTS (Continued)
FOR THE YEARS ENDED DECEMBER 31, 2009 AND 2008
13. MAJOR CUSTOMERS
The Company had revenues or receivables from the following major customers that in each period equaled or exceeded 10% of revenues:
| | December 31, 2009 Receivable Balance | Year Ended December 31, 2009 Sales | December 31, 2008 Receivable Balance | Year Ended December 31, 2008 Sales | December 31, 2007 Receivable Balance | Year Ended December 31, 2007 Sales | |||||||||||||
|---|---|---|---|---|---|---|---|---|---|---|---|---|---|---|---|---|---|---|---|
Constellation Energy Group, Inc. | $ | 1,702,151 | $ | 67,166,927 | $ | 3,804,046 | $ | 56,589,113 | $ | 6,112,034 | $ | 97,930,807 | |||||||
American Electric Power Company, Inc. | 6,563,401 | 97,005,552 | 6,172,968 | 97,646,669 | 1,805,892 | 57,110,321 | |||||||||||||
Progress Energy, Inc. | n/a | n/a | n/a | n/a | 5,662,044 | 68,011,968 | |||||||||||||
Duke Energy Corp. | n/a | n/a | n/a | n/a | 3,597,077 | 52,746,859 | |||||||||||||
Indiana Harbor Coke Company, L.P. | 2,260,425 | 48,478,403 | n/a | n/a | n/a | n/a | |||||||||||||
14. FAIR VALUE OF FINANCIAL INSTRUMENTS
The book values of cash and cash equivalents, accounts receivable and accounts payable are considered to be representative of their respective fair values because of the immediate short-term maturity of these financial instruments. The carrying value of the Company's debt instruments and notes receivable approximate fair value since effective rates for these instruments are comparable to market at year-end.
Effective January 1, 2008, the Company adopted ASC Topic 820 (previously SFAS No. 157, "Fair Value Measures") which clarifies the definition of fair value, establishes a framework for measuring fair value and expands the disclosures on fair value measurements. ASC Topic 820 applies whenever other statements require or permit assets or liabilities to be measured at fair value. ASC Topic 820 requirements for certain non-financial assets and liabilities were permitted to be deferred until the first quarter of 2009 in accordance with FSP 157-2, "Effective Date of ASC Topic 820." The Company adopted ASC Topic 820 January 1, 2009, at the time of the adoption there were no nonfinancial assets or nonfinancial liabilities that were measured at fair value on a nonrecurring basis.
The Company does not have any assets or liabilities measured at fair value.
RHINO ENERGY LLC
NOTES TO CONSOLIDATED FINANCIAL STATEMENTS (Continued)
FOR THE YEARS ENDED DECEMBER 31, 2009 AND 2008
15. RELATED PARTY AND AFFILIATE TRANSACTIONS
| Related Party | Description | 2009 | 2008 | 2007 | ||||||||
|---|---|---|---|---|---|---|---|---|---|---|---|---|
Wexford Capital LP | Expenses for legal, consulting, and advisory services | $ | 61,639 | $ | 138,521 | $ | 165,719 | |||||
Wexford Capital LP | Distributions | — | 804,565 | 9,250,000 | ||||||||
Wexford Capital LP | Members contribution | 84,798 | — | — | ||||||||
Taurus Investors LLC | Note payable | — | 4,950,000 | — | ||||||||
Rhino Eastern LLC | Equity in net income (loss) of unconsolidated affiliate | 892,873 | (1,586,733 | ) | — | |||||||
Rhino Eastern LLC | Notes receivable | 377,183 | 1,785,000 | — | ||||||||
Rhino Eastern LLC | Receivables for legal, health claims and workers' compensation | 161,088 | 127,647 | — | ||||||||
Rhino Eastern LLC | Interest receivable | 930 | 15,646 | — | ||||||||
Rhino Eastern LLC | Investment in unconsolidated affiliate | 17,186,362 | 16,293,489 | — | ||||||||
From time to time, employees from Wexford perform legal, consulting, and advisory services to the Company. The Company incurred expenses of $61,639, $138,521 and $165,719 for the years ended December 31, 2009, 2008 and 2007, respectively, for legal, consulting, and advisory services performed by Wexford.
As of December 31, 2009 and 2008, the Company had a note receivable outstanding of $377,183 and $1,785,000 to Rhino Eastern, a joint venture ("joint venture") between the Company and Patriot. The note bears a fixed interest rate of 10%.
From time to time, the Company allocated and paid expenses on behalf of the joint venture. During the year ended December 31, 2009 and 2008, the Company paid expenses for legal, health claims and workers' compensation of $161,088 and $127,647 on behalf of the joint venture.
16. SUPPLEMENTAL DISCLOSURES OF CASH FLOW INFORMATION
Cash payments for interest were $5,371,804, $4,826,290 and $5,416,373 for the years ended December 31, 2009, 2008 and 2007, respectively. In September 2009 the Company reached a settlement on the outstanding debt balance with H&L Construction Co., Inc. resulting in a non-cash debt reduction of $1,772,535.
17. SEGMENT INFORMATION
The Company produces and markets coal from surface and underground mines in Kentucky, West Virginia, Ohio and Colorado. The Company sells primarily to electric utilities in the United States. The Company has four reportable business segments: Central Appalachia (comprised of
RHINO ENERGY LLC
NOTES TO CONSOLIDATED FINANCIAL STATEMENTS (Continued)
FOR THE YEARS ENDED DECEMBER 31, 2009 AND 2008
17. SEGMENT INFORMATION (Continued)
both surface and underground mines in located in Eastern Kentucky and Southern West Virginia) and Northern Appalachia (comprised of both surface and underground mines located in Ohio), Eastern Met (comprised solely of the joint venture with Patriot Coal) and Other. Within the Northern Appalachia reporting segment, the Company has aggregated two operating segments (representing its Sands Hill and Hopedale mining complexes) that have similar geography and similar economic characteristics in terms of product sold, product quality and end customers. The Other segment includes the Company's Colorado operations that do not exceed the quantitative thresholds requiring separate disclosure as a reportable segment and the Company's ancillary businesses. The Company has not provided disclosure of total expenditures by segment for long-lived assets, as the Company does not maintain discrete financial information concerning segment expenditures for long lived assets, and accordingly such information is not provided to the Company's chief operating decision maker.
The Company has historically accounted for the joint venture (formed in the year ended December 31, 2008) under the equity method. Under the equity method of accounting, only limited information (net income) is presented. The Company considers this operation to comprise a separate operating segment and has presented additional operating detail (with corresponding eliminations and adjustments to reflect its percentage of ownership) below.
Reportable segment results of operations for the year ended December 31, 2009 are as follows:
| | | | Eastern Met | | | |||||||||||||||||
|---|---|---|---|---|---|---|---|---|---|---|---|---|---|---|---|---|---|---|---|---|---|---|
| | Central Appalachia | Northern Appalachia | Complete Basis | Equity Method Eliminations | Equity Method Presentation | Other | Consolidated | |||||||||||||||
Total assets | $ | 207,870,225 | $ | 55,564,667 | $ | 42,428,237 | $ | (42,428,237 | ) | $ | — | $ | 76,549,571 | $ | 339,984,463 | |||||||
Total revenues | $ | 297,723,766 | $ | 106,741,261 | $ | 28,819,799 | $ | (28,819,799 | ) | $ | — | $ | 15,324,587 | $ | 419,789,614 | |||||||
Depreciation, depletion and amortization | 23,877,068 | 7,862,244 | 2,863,425 | (2,863,425 | ) | — | 4,539,936 | 36,279,249 | ||||||||||||||
Interest expense | 3,530,639 | 1,776,161 | 429,175 | (429,175 | ) | — | 915,408 | 6,222,208 | ||||||||||||||
Net income | 560,552 | 17,638,192 | 1,750,731 | (857,858 | ) | 892,873 | 370,548 | 19,462,165 | ||||||||||||||
Reportable segment results of operations for the year ended December 31, 2008 are as follows:
| | | | Eastern Met | | | |||||||||||||||||
|---|---|---|---|---|---|---|---|---|---|---|---|---|---|---|---|---|---|---|---|---|---|---|
| | Central Appalachia | Northern Appalachia | Complete Basis | Equity Method Eliminations | Equity Method Presentation | Other | Consolidated | |||||||||||||||
Total assets | $ | 218,924,254 | $ | 59,462,622 | $ | 43,454,228 | $ | (43,454,228 | ) | $ | — | $ | 74,148,905 | $ | 352,535,781 | |||||||
Total revenues | $ | 316,463,079 | $ | 108,431,937 | $ | 3,913 | $ | (3,913 | ) | $ | — | $ | 14,028,904 | $ | 438,923,920 | |||||||
Depreciation, depletion and amortization | 24,906,246 | 8,084,730 | 509,182 | (509,182 | ) | — | 3,437,305 | 36,428,281 | ||||||||||||||
Interest expense | 3,519,543 | 1,431,174 | 31,078 | (31,078 | ) | — | 549,795 | 5,500,512 | ||||||||||||||
Net income (loss) | (3,487,630 | ) | 10,933,188 | (3,111,241 | ) | 1,524,508 | (1,586,733 | ) | (4,929,943 | ) | 928,882 | |||||||||||
RHINO ENERGY LLC
NOTES TO CONSOLIDATED FINANCIAL STATEMENTS (Continued)
FOR THE YEARS ENDED DECEMBER 31, 2009 AND 2008
17. SEGMENT INFORMATION (Continued)
Reportable segment results of operations for the year ended December 31, 2007 are as follows:
| | | | Eastern Met | | | |||||||||||||||||
|---|---|---|---|---|---|---|---|---|---|---|---|---|---|---|---|---|---|---|---|---|---|---|
| | Central Appalachia | Northern Appalachia | Complete Basis | Equity Method Eliminations | Equity Method Presentation | Other | Consolidated | |||||||||||||||
Total assets | $ | 170,170,717 | $ | 61,052,458 | $ | — | $ | — | $ | — | $ | 44,769,058 | $ | 275,992,233 | ||||||||
Total revenues | $ | 340,033,175 | $ | 54,418,109 | $ | — | $ | — | $ | — | $ | 9,000,512 | $ | 403,451,797 | ||||||||
Depreciation, depletion and amortization | 24,488,240 | 4,287,885 | — | — | — | 1,973,648 | 30,749,773 | |||||||||||||||
Interest expense | 4,165,825 | 722,513 | — | — | — | 690,887 | 5,579,224 | |||||||||||||||
Net income (loss) | 23,832,098 | 8,872,633 | — | — | — | (1,990,970 | ) | 30,713,764 | ||||||||||||||
During the year ended December 31, 2008, the Company retained a new chief operating officer, representing the chief operating decision maker as defined under ASC Topic 280, and revised the financial information reviewed by the chief operating officer to evaluate the Company's performance and make decisions regarding resource allocation. As a result, the 2007 segment presentation herein has been recast to conform to our current presentation of reportable segments.
18. RESTATEMENT OF FINANCIAL STATEMENTS
Subsequent to the issuance of the Company's 2009 financial statements, a determination was made that $3.6 million in costs related to an abandoned initial public offering, previously accounted for as a distribution by the Company to its members in the Company's consolidated statement of financial position as of December 31, 2008, should have been included in the Company's consolidated statement of operations for the year ended December 31, 2008. As a result, the Company's financial statements as of and for the year ended December 31, 2008 have been restated from the amounts previously reported to reclassify the $3.6 million as selling, general and administrative expenses of the Company, as follows:
Consolidated Statements of Financial Position
| | As Previously Reported | As Restated | ||||||
|---|---|---|---|---|---|---|---|---|
Members' investment | $ | 19,240,741 | $ | 22,822,629 | ||||
Retained earnings | 98,135,738 | 94,553,850 | ||||||
RHINO ENERGY LLC
NOTES TO CONSOLIDATED FINANCIAL STATEMENTS (Continued)
FOR THE YEARS ENDED DECEMBER 31, 2009 AND 2008
18. RESTATEMENT OF FINANCIAL STATEMENTS (Continued)
Consolidated Statement of Operations and Comprehensive Income
| | As Previously Reported | As Restated | |||||||
|---|---|---|---|---|---|---|---|---|---|
COSTS AND EXPENSES: | |||||||||
Selling, general and administrative | $ | 15,460,116 | $ | 19,042,004 | |||||
Total Costs and Expenses | 427,473,664 | 431,055,552 | |||||||
INCOME FROM OPERATIONS | 11,450,256 | 7,868,368 | |||||||
INCOME BEFORE INCOME TAXES | 4,510,770 | 928,882 | |||||||
NET INCOME | 4,510,770 | 928,882 | |||||||
Consolidated Statements of Members' Equity
| | Members' Investment | Accumulated Other Comprehensive Income | Retained Earnings | Total | |||||||||
|---|---|---|---|---|---|---|---|---|---|---|---|---|---|
Distributions to members—year ended December 31, 2008—as previously reported | $ | (4,386,453 | ) | $ | — | $ | — | $ | (4,386,453 | ) | |||
Distributions to members—year ended December 31, 2008—as restated | (804,565 | ) | — | — | (804,565 | ) | |||||||
Net income—year ended December 31, 2008—as previously reported | — | — | 4,510,770 | 4,510,770 | |||||||||
Net income—year ended December 31, 2008—as restated | — | — | 928,882 | 928,882 | |||||||||
Balance—December 31, 2008—as previously reported | 19,240,741 | 934,630 | 98,135,738 | 118,311,109 | |||||||||
Balance—December 31, 2008—as restated | 22,822,629 | 934,630 | 94,553,850 | 118,311,109 | |||||||||
Balance—December 31, 2009—as previously reported | 19,325,539 | 1,477,191 | 117,597,903 | 138,400,633 | |||||||||
Balance—December 31, 2009—as restated | 22,907,427 | 1,477,191 | 114,016,015 | 138,400,633 | |||||||||
Consolidated Statements of Cash Flows
| | As Previously Reported | As Restated | ||||||
|---|---|---|---|---|---|---|---|---|
CASH FLOWS FROM OPERATING ACTIVITIES: | ||||||||
Net income | $ | 4,510,770 | $ | 928,882 | ||||
Accrued expenses and other liabilities | (1,769,738 | ) | 1,812,150 | |||||
CASH FLOW FROM FINANCING ACTIVITIES: | ||||||||
Payment of abandoned public offering expenses | — | (3,581,888 | ) | |||||
Distributions to members | (4,386,453 | ) | (804,565 | ) | ||||
REPORT OF INDEPENDENT REGISTERED PUBLIC ACCOUNTING FIRM
To the Partners of
Rhino Resource Partners LP
Lexington, Kentucky
We have audited the accompanying statement of financial position of Rhino Resource Partners LP (the "Partnership") as of April 19, 2010 (date of inception). This financial statement is the responsibility of the Partnership's management. Our responsibility is to express an opinion on this financial statement based on our audit.
We conducted our audit in accordance with the standards of the Public Company Accounting Oversight Board (United States). Those standards require that we plan and perform the audit to obtain reasonable assurance about whether the statement of financial position is free of material misstatement. The Partnership is not required to have, nor were we engaged to perform, an audit of its internal control over financial reporting. Our audit included consideration of internal control over financial reporting as a basis for designing audit procedures that are appropriate in the circumstances, but not for the purpose of expressing an opinion on the effectiveness of the Partnership's internal control over financial reporting. Accordingly, we express no such opinion. An audit also includes examining, on a test basis, evidence supporting the amounts and disclosures in the statement of financial position, assessing the accounting principles used and significant estimates made by management, as well as evaluating the overall statement of financial position presentation. We believe that our audit provides a reasonable basis for our opinion.
In our opinion, such statement of financial position presents fairly, in all material respects, the financial position of the Partnership as of April 19, 2010 (date of inception) in conformity with accounting principles generally accepted in the United States of America.
/s/ Deloitte & Touche LLP
Cincinnati, OH
May 5, 2010
RHINO RESOURCE PARTNERS LP
STATEMENT OF FINANCIAL POSITION
AS OF APRIL 19, 2010 (DATE OF INCEPTION)
| | April 19, 2010 | ||||
|---|---|---|---|---|---|
Assets | $ | — | |||
Liabilities | $ | — | |||
Partners' equity: | |||||
Limited partner's equity | $ | 980 | |||
General partner's equity | 20 | ||||
Receivable from partners | (1,000 | ) | |||
Total partners' equity | $ | — | |||
Total liabilities and partners' equity | $ | — | |||
See notes to statement of financial position.
RHINO RESOURCE PARTNERS LP
NOTES TO THE STATEMENT OF FINANCIAL POSITION AS OF APRIL 19, 2010
(DATE OF INCEPTION)
1. ORGANIZATION AND OPERATIONS
Rhino Resource Partners LP (the "Partnership") is a Delaware limited partnership formed on April 19, 2010 to acquire Rhino Energy LLC, an entity engaged primarily in the mining and sale of coal.
The Partnership intends to offer common units, representing limited partner interests, pursuant to a public offering. In addition, the Partnership will issue common units and subordinated units, representing additional limited partner interests, to Rhino Energy Holdings LLC, an entity owned by affiliates of Wexford Capital LP. Rhino GP LLC, the general partner of the Partnership, will maintain its 2.0% general partner interest in the Partnership. The Partnership will issue to the general partner the incentive distribution rights, which entitle the holder to increasing percentages, up to a maximum of 48.0% (in addition to distributions paid on the 2.0% general partner interest), of the distributions the Partnership makes above the highest target level.
Rhino GP LLC, as the general partner, has committed to contribute $20 to the Partnership. Rhino Energy Holdings LLC has committed to contribute $980 to the Partnership. These contributions receivable are reflected as a reduction to partners' equity.
2. SUBSEQUENT EVENTS
Management has evaluated the accompanying statement of financial position and notes for subsequent events up through May 5, 2010, which is the date the financial statement was available for issue. Management is not aware of any changes that would have a material effect on the financial statement.
APPENDIX A
FIRST AMENDED AND RESTATED
AGREEMENT OF LIMITED PARTNERSHIP
OF
RHINO RESOURCE PARTNERS LP
ARTICLE I | ||||
DEFINITIONS | ||||
Section 1.1 | Definitions | A-1 | ||
Section 1.2 | Construction | A-23 | ||
ARTICLE II | ||||
ORGANIZATION | ||||
Section 2.1 | Formation | A-23 | ||
Section 2.2 | Name | A-23 | ||
Section 2.3 | Registered Office; Registered Agent; Principal Office; Other Offices | A-23 | ||
Section 2.4 | Purpose and Business | A-24 | ||
Section 2.5 | Powers | A-24 | ||
Section 2.6 | Term | A-24 | ||
Section 2.7 | Title to Partnership Assets | A-24 | ||
ARTICLE III | ||||
RIGHTS OF LIMITED PARTNERS | ||||
Section 3.1 | Limitation of Liability | A-25 | ||
Section 3.2 | Management of Business | A-25 | ||
Section 3.3 | Outside Activities of the Limited Partners | A-25 | ||
Section 3.4 | Rights of Limited Partners | A-25 | ||
ARTICLE IV | ||||
CERTIFICATES; RECORD HOLDERS; TRANSFER OF PARTNERSHIP INTERESTS; | ||||
Section 4.1 | Certificates | A-26 | ||
Section 4.2 | Mutilated, Destroyed, Lost or Stolen Certificates | A-26 | ||
Section 4.3 | Record Holders | A-27 | ||
Section 4.4 | Transfer Generally | A-27 | ||
Section 4.5 | Registration and Transfer of Limited Partner Interests | A-28 | ||
Section 4.6 | Transfer of the General Partner's General Partner Interest | A-29 | ||
Section 4.7 | Restrictions on Transfers | A-29 | ||
Section 4.8 | Eligibility Certificates; Ineligible Holders | A-31 | ||
Section 4.9 | Redemption of Partnership Interests of Ineligible Holders | A-32 | ||
A-i
ARTICLE V | ||||
CAPITAL CONTRIBUTIONS AND ISSUANCE OF PARTNERSHIP INTERESTS | ||||
Section 5.1 | Organizational Contributions | A-33 | ||
Section 5.2 | Contributions by the General Partner and its Affiliates | A-34 | ||
Section 5.3 | Contributions by Initial Limited Partners | A-34 | ||
Section 5.4 | Interest and Withdrawal | A-34 | ||
Section 5.5 | Capital Accounts | A-35 | ||
Section 5.6 | Issuances of Additional Partnership Interests | A-37 | ||
Section 5.7 | Conversion of Subordinated Units | A-38 | ||
Section 5.8 | Limited Preemptive Right | A-38 | ||
Section 5.9 | Splits and Combinations | A-39 | ||
Section 5.10 | Fully Paid and Non-Assessable Nature of Limited Partner Interests | A-39 | ||
Section 5.11 | Issuance of Common Units in Connection with Reset of Incentive Distribution Rights | A-39 | ||
ARTICLE VI | ||||
ALLOCATIONS AND DISTRIBUTIONS | ||||
Section 6.1 | Allocations for Capital Account Purposes | A-41 | ||
Section 6.2 | Allocations for Tax Purposes | A-49 | ||
Section 6.3 | Requirement and Characterization of Distributions; Distributions to Record Holders | A-51 | ||
Section 6.4 | Distributions of Available Cash from Operating Surplus | A-51 | ||
Section 6.5 | Distributions of Available Cash from Capital Surplus | A-53 | ||
Section 6.6 | Adjustment of Minimum Quarterly Distribution and Target Distribution Levels | A-53 | ||
Section 6.7 | Special Provisions Relating to the Holders of Subordinated Units | A-54 | ||
Section 6.8 | Special Provisions Relating to the Holders of Incentive Distribution Rights | A-54 | ||
Section 6.9 | Entity-Level Taxation | A-54 | ||
ARTICLE VII | ||||
MANAGEMENT AND OPERATION OF BUSINESS | ||||
Section 7.1 | Management | A-55 | ||
Section 7.2 | Certificate of Limited Partnership | A-57 | ||
Section 7.3 | Restrictions on the General Partner's Authority | A-57 | ||
Section 7.4 | Reimbursement of the General Partner | A-58 | ||
Section 7.5 | Outside Activities | A-58 | ||
Section 7.6 | Loans from the General Partner; Loans or Contributions from the Partnership or Group Members | A-60 | ||
Section 7.7 | Indemnification | A-60 | ||
Section 7.8 | Liability of Indemnitees | A-62 | ||
Section 7.9 | Resolution of Conflicts of Interest; Standards of Conduct and Modification of Duties | A-63 | ||
Section 7.10 | Other Matters Concerning the General Partner | A-64 | ||
Section 7.11 | Purchase or Sale of Partnership Interests | A-65 | ||
Section 7.12 | Registration Rights of the General Partner and its Affiliates | A-65 | ||
Section 7.13 | Reliance by Third Parties | A-67 | ||
A-ii
ARTICLE VIII | ||||
BOOKS, RECORDS, ACCOUNTING AND REPORTS | ||||
Section 8.1 | Records and Accounting | A-68 | ||
Section 8.2 | Fiscal Year | A-68 | ||
Section 8.3 | Reports | A-68 | ||
ARTICLE IX | ||||
TAX MATTERS | ||||
Section 9.1 | Tax Returns and Information | A-69 | ||
Section 9.2 | Tax Elections | A-69 | ||
Section 9.3 | Tax Controversies | A-69 | ||
Section 9.4 | Withholding; Tax Payments | A-69 | ||
ARTICLE X | ||||
ADMISSION OF PARTNERS | ||||
Section 10.1 | Admission of Limited Partners | A-70 | ||
Section 10.2 | Admission of Substituted Limited Partners | A-71 | ||
Section 10.3 | Admission of Successor General Partner | A-71 | ||
Section 10.4 | Amendment of Agreement and Certificate of Limited Partnership | A-71 | ||
ARTICLE XI | ||||
WITHDRAWAL OR REMOVAL OF PARTNERS | ||||
Section 11.1 | Withdrawal of the General Partner | A-72 | ||
Section 11.2 | Removal of the General Partner | A-73 | ||
Section 11.3 | Interest of Departing General Partner and Successor General Partner | A-74 | ||
Section 11.4 | Termination of Subordination Period, Conversion of Subordinated Units and Extinguishment of Cumulative Common Unit Arrearages | A-75 | ||
Section 11.5 | Withdrawal of Limited Partners | A-75 | ||
ARTICLE XII | ||||
DISSOLUTION AND LIQUIDATION | ||||
Section 12.1 | Dissolution | A-76 | ||
Section 12.2 | Continuation of the Business of the Partnership After Dissolution | A-76 | ||
Section 12.3 | Liquidator | A-77 | ||
Section 12.4 | Liquidation | A-77 | ||
Section 12.5 | Cancellation of Certificate of Limited Partnership | A-78 | ||
Section 12.6 | Return of Contributions | A-78 | ||
Section 12.7 | Waiver of Partition | A-78 | ||
Section 12.8 | Capital Account Restoration | A-78 | ||
A-iii
ARTICLE XIII | ||||
AMENDMENT OF PARTNERSHIP AGREEMENT; MEETINGS; RECORD DATE | ||||
Section 13.1 | Amendments to be Adopted Solely by the General Partner | A-78 | ||
Section 13.2 | Amendment Procedures | A-79 | ||
Section 13.3 | Amendment Requirements | A-80 | ||
Section 13.4 | Special Meetings | A-81 | ||
Section 13.5 | Notice of a Meeting | A-81 | ||
Section 13.6 | Record Date | A-81 | ||
Section 13.7 | Adjournment | A-81 | ||
Section 13.8 | Waiver of Notice; Approval of Meeting; Approval of Minutes | A-82 | ||
Section 13.9 | Quorum and Voting | A-82 | ||
Section 13.10 | Conduct of a Meeting | A-82 | ||
Section 13.11 | Action Without a Meeting | A-83 | ||
Section 13.12 | Right to Vote and Related Matters | A-83 | ||
Section 13.13 | Voting of Incentive Distribution Rights. | A-83 | ||
ARTICLE XIV | ||||
MERGER, CONSOLIDATION OR CONVERSION | ||||
Section 14.1 | Authority | A-84 | ||
Section 14.2 | Procedure for Merger, Consolidation or Conversion | A-84 | ||
Section 14.3 | Approval by Limited Partners | A-86 | ||
Section 14.4 | Certificate of Merger | A-87 | ||
Section 14.5 | Effect of Merger, Consolidation or Conversion | A-87 | ||
ARTICLE XV | ||||
RIGHT TO ACQUIRE LIMITED PARTNER INTERESTS | ||||
Section 15.1 | Right to Acquire Limited Partner Interests | A-88 | ||
ARTICLE XVI | ||||
GENERAL PROVISIONS | ||||
Section 16.1 | Addresses and Notices; Written Communications | A-90 | ||
Section 16.2 | Further Action | A-90 | ||
Section 16.3 | Binding Effect | A-90 | ||
Section 16.4 | Integration | A-91 | ||
Section 16.5 | Creditors | A-91 | ||
Section 16.6 | Waiver | A-91 | ||
Section 16.7 | Third-Party Beneficiaries | A-91 | ||
Section 16.8 | Counterparts | A-91 | ||
Section 16.9 | Applicable Law; Forum, Venue and Jurisdiction | A-91 | ||
Section 16.10 | Invalidity of Provisions | A-92 | ||
Section 16.11 | Consent of Partners | A-92 | ||
Section 16.12 | Facsimile Signatures | A-92 | ||
A-iv
FIRST AMENDED AND RESTATED AGREEMENT
OF LIMITED PARTNERSHIP OF RHINO RESOURCE PARTNERS LP
THIS FIRST AMENDED AND RESTATED AGREEMENT OF LIMITED PARTNERSHIP OF RHINO RESOURCE PARTNERS LP dated as of , 2010, is entered into by and between Rhino GP LLC, a Delaware limited liability company, as the General Partner, and Rhino Energy Holdings LLC, a Delaware limited liability company, as the Organizational Limited Partner, together with any other Persons who become Partners in the Partnership or parties hereto as provided herein. In consideration of the covenants, conditions and agreements contained herein, the parties hereto hereby agree as follows:
ARTICLE I
DEFINITIONS
Section 1.1 Definitions. The following definitions shall be for all purposes, unless otherwise clearly indicated to the contrary, applied to the terms used in this Agreement.
"Acquisition" means any transaction in which any Group Member acquires (through an asset acquisition, merger, stock acquisition or other form of investment) control over all or a portion of the assets, properties or business of another Person for the purpose of increasing or expanding, for a period exceeding the short-term, the operating capacity of the Partnership Group from the operating capacity of the Partnership Group existing immediately prior to such transaction. For purposes of this definition, the short-term generally refers to a period not exceeding 12 months.
"Additional Book Basis" means the portion of any remaining Carrying Value of an Adjusted Property that is attributable to positive adjustments made to such Carrying Value as a result of Book-Up Events. For purposes of determining the extent that Carrying Value constitutes Additional Book Basis:
(a) Any negative adjustment made to the Carrying Value of an Adjusted Property as a result of either a Book-Down Event or a Book-Up Event shall first be deemed to offset or decrease that portion of the Carrying Value of such Adjusted Property that is attributable to any prior positive adjustments made thereto pursuant to a Book-Up Event or Book-Down Event.
(b) If Carrying Value that constitutes Additional Book Basis is reduced as a result of a Book-Down Event and the Carrying Value of other property is increased as a result of such Book-Down Event, an allocable portion of any such increase in Carrying Value shall be treated as Additional Book Basis; provided, that the amount treated as Additional Book Basis pursuant hereto as a result of such Book-Down Event shall not exceed the amount by which the Aggregate Remaining Net Positive Adjustments after such Book-Down Event exceeds the remaining Additional Book Basis attributable to all of the Partnership's Adjusted Property after such Book-Down Event (determined without regard to the application of this clause (b) to such Book-Down Event).
"Additional Book Basis Derivative Items" means any Book Basis Derivative Items that are computed with reference to Additional Book Basis. To the extent that the Additional Book Basis attributable to all of the Partnership's Adjusted Property as of the beginning of any taxable period exceeds the Aggregate Remaining Net Positive Adjustments as of the beginning of such period (the "Excess Additional Book Basis"), the Additional Book Basis Derivative Items for
such period shall be reduced by the amount that bears the same ratio to the amount of Additional Book Basis Derivative Items determined without regard to this sentence as the Excess
Additional Book Basis bears to the Additional Book Basis as of the beginning of such period. With respect to a Disposed of Adjusted Property, the Additional Book Basis Derivative items shall be the amount of Additional Book Basis taken into account in computing gain or loss from the disposition of such Disposed of Adjusted Property.
"Adjusted Capital Account" means the Capital Account maintained for each Partner as of the end of each taxable period of the Partnership, (a) increased by any amounts that such Partner is obligated to restore under the standards set by Treasury Regulation Section 1.704-1(b)(2)(ii)(c) (or is deemed obligated to restore under Treasury Regulation Sections 1.704-2(g) and 1.704-2(i)(5)) and (b) decreased by (i) the amount of all losses and deductions that, as of the end of such taxable period, are reasonably expected to be allocated to such Partner in subsequent taxable periods under Sections 704(e)(2) and 706(d) of the Code and Treasury Regulation Section 1.751-1(b)(2)(ii), and (ii) the amount of all distributions that, as of the end of such taxable period, are reasonably expected to be made to such Partner in subsequent taxable periods in accordance with the terms of this Agreement or otherwise to the extent they exceed offsetting increases to such Partner's Capital Account that are reasonably expected to occur during (or prior to) the taxable period in which such distributions are reasonably expected to be made (other than increases as a result of a minimum gain chargeback pursuant to Section 6.1(d)(i) or 6.1(d)(ii)). The foregoing definition of Adjusted Capital Account is intended to comply with the provisions of Treasury Regulation Section 1.704-1(b)(2)(ii)(d) and shall be interpreted consistently therewith. The "Adjusted Capital Account" of a Partner in respect of any Partnership Interest shall be the amount that such Adjusted Capital Account would be if such Partnership Interest were the only interest in the Partnership held by such Partner from and after the date on which such Partnership Interest was first issued.
"Adjusted Operating Surplus" means, with respect to any period, (a) Operating Surplus generated with respect to such period; (b) less (i) the amount of any net increase in Working Capital Borrowings (or the Partnership's proportionate share of any net increase in Working Capital Borrowings in the case of Subsidiaries that are not wholly owned) with respect to that period; and (ii) the amount of any net decrease in cash reserves (or the Partnership's proportionate share of any net decrease in cash reserves in the case of Subsidiaries that are not wholly owned) for Operating Expenditures with respect to such period not relating to an Operating Expenditure made with respect to such period; and (c) plus (i) the amount of any net decrease in Working Capital Borrowings (or the Partnership's proportionate share of any net decrease in Working Capital Borrowings in the case of Subsidiaries that are not wholly owned) with respect to that period; (ii) the amount of any net increase in cash reserves (or the Partnership's proportionate share of any net increase in cash reserves in the case of Subsidiaries that are not wholly owned) for Operating Expenditures with respect to such period required by any debt instrument for the repayment of principal, interest or premium; and (iii) any net decrease made in subsequent periods in cash reserves for Operating Expenditures initially established with respect to such period to the extent such decrease results in a reduction in Adjusted Operating Surplus in subsequent periods pursuant to clause (b)(ii) above. Adjusted Operating Surplus does not include that portion of Operating Surplus included in clause (a)(i) of the definition of Operating Surplus.
"Adjusted Property" means any property the Carrying Value of which has been adjusted pursuant to Section 5.5(d)(i) or 5.5(d)(ii).
"Affiliate" means, with respect to any Person, any other Person that directly or indirectly through one or more intermediaries controls, is controlled by or is under common control with, the Person in question. As used herein, the term "control" means the possession, direct or indirect, of the power to direct or cause the direction of the management and policies of a Person, whether through ownership of voting securities, by contract or otherwise.
"Aggregate Quantity of IDR Reset Common Units" is defined in Section 5.11(a).
"Aggregate Remaining Net Positive Adjustments" means, as of the end of any taxable period, the sum of the Remaining Net Positive Adjustments of all the Partners.
"Agreed Allocation" means any allocation, other than a Required Allocation, of an item of income, gain, loss or deduction pursuant to the provisions of Section 6.1, including a Curative Allocation (if appropriate to the context in which the term "Agreed Allocation" is used).
"Agreed Value" of any Contributed Property means the fair market value of such property at the time of contribution and in the case of an Adjusted Property, the fair market value of such Adjusted Property on the date of the revaluation event as described in Section 5.5(d), in both cases as determined by the General Partner. In making such determination, the General Partner shall use such method as it determines to be appropriate.
"Agreement" means this First Amended and Restated Agreement of Limited Partnership of Rhino Resource Partners LP, as it may be amended, supplemented or restated from time to time.
"Assignee" means a Person to whom one or more Limited Partner Interest have been transferred in a manner permitted under this Agreement, but who has not been admitted as a Substituted Limited Partner.
"Agreement" means this First Amended and Restated Agreement of Limited Partnership of Rhino Resource Partners LP, as it may be amended, supplemented or restated from time to time.
"Associate" means, when used to indicate a relationship with any Person, (a) any corporation or organization of which such Person is a director, officer, manager, general partner or managing member or is, directly or indirectly, the owner of 20% or more of any class of voting stock or other voting interest; (b) any trust or other estate in which such Person has at least a 20% beneficial interest or as to which such Person serves as trustee or in a similar fiduciary capacity; and (c) any relative or spouse of such Person, or any relative of such spouse, who has the same principal residence as such Person.
"Available Cash" means, with respect to any Quarter ending prior to the Liquidation Date:
(a) the sum of (i) all cash and cash equivalents (including amounts available for working capital purposes under a credit facility, commercial paper facility or other similar financing arrangement) of the Partnership Group (or the Partnership's proportionate share of cash and cash equivalents in the case of Subsidiaries that are not wholly owned) on hand at the end of such Quarter, and (ii) if the General Partner so determines, all or any portion of any additional cash and cash equivalents of the Partnership Group (or the Partnership's proportionate share of cash and cash equivalents in the case of Subsidiaries that are not wholly owned) on hand on the date of determination of Available Cash with respect to such Quarter resulting from Working Capital Borrowings made subsequent to the end of such Quarter, less
(b) the amount of any cash reserves established by the General Partner (or the Partnership's proportionate share of cash reserves in the case of Subsidiaries that are not wholly owned) to (i) provide for the proper conduct of the business of the Partnership Group (including reserves for future capital expenditures and for anticipated future credit needs of the Partnership Group) subsequent to such Quarter, (ii) comply with applicable law
or any loan agreement, security agreement, mortgage, debt instrument or other agreement or obligation to which any Group Member is a party or by which it is bound or its assets are subject or (iii) provide funds for distributions under Section 6.4 or 6.5 in respect of any one or more of the next four Quarters;
provided,however, that the General Partner may not establish cash reserves pursuant to clause (iii) above if the effect of such reserves would be that the Partnership is unable to distribute the Minimum Quarterly Distribution on all Common Units, plus any Cumulative Common Unit Arrearage on all Common Units, with respect to such Quarter; and, provided further, that disbursements made by a Group Member or cash reserves established, increased or reduced after the end of such Quarter but on or before the date of determination of Available Cash with respect to such Quarter shall be deemed to have been made, established, increased or reduced, for purposes of determining Available Cash, within such Quarter if the General Partner so determines.
Notwithstanding the foregoing, "Available Cash" with respect to the Quarter in which the Liquidation Date occurs and any subsequent Quarter shall equal zero.
"Board of Directors" means, with respect to the Board of Directors of the General Partner, its board of directors or board of managers, as applicable, if a corporation or limited liability company, or if a limited partnership, the board of directors or board of managers of the general partner of the General Partner.
"Book Basis Derivative Items" means any item of income, deduction, gain or loss that is computed with reference to the Carrying Value of an Adjusted Property (e.g., depreciation, depletion, or gain or loss with respect to an Adjusted Property).
"Book-Down Event" means an event that triggers a negative adjustment to the Capital Accounts of the Partners pursuant to Section 5.5(d).
"Book-Tax Disparity" means with respect to any item of Contributed Property or Adjusted Property, as of the date of any determination, the difference between the Carrying Value of such Contributed Property or Adjusted Property and the adjusted basis thereof for federal income tax purposes as of such date. A Partner's share of the Partnership's Book-Tax Disparities in all of its Contributed Property and Adjusted Property will be reflected by the difference between such Partner's Capital Account balance as maintained pursuant to Section 5.5 and the hypothetical balance of such Partner's Capital Account computed as if it had been maintained strictly in accordance with federal income tax accounting principles.
"Book-Up Event" means an event that triggers a positive adjustment to the Capital Accounts of the Partners pursuant to Section 5.5(d).
"Business Day" means Monday through Friday of each week, except that a legal holiday recognized as such by the government of the United States of America or the State of Kentucky shall not be regarded as a Business Day.
"Capital Account" means the capital account maintained for a Partner pursuant to Section 5.5. The "Capital Account" of a Partner in respect of any Partnership Interest shall be the amount that such Capital Account would be if such Partnership Interest were the only interest in the Partnership held by such Partner from and after the date on which such Partnership Interest was first issued.
"Capital Contribution" means any cash, cash equivalents or the Net Agreed Value of Contributed Property that a Partner contributes to the Partnership or that is contributed or
deemed contributed to the Partnership on behalf of a Partner (including, in the case of an underwritten offering of Units, the amount of any underwriting discounts or commissions).
"Capital Improvement" means any (a) addition or improvement to the capital assets owned by any Group Member, (b) acquisition of existing, or the construction of new or the improvement or replacement of existing, capital assets or (c) capital contribution by a Group Member to a Person that is not a Subsidiary in which a Group Member has an equity interest, or after such capital contribution will have an equity interest, to fund such Group Member's pro rata share of the cost of the addition or improvement to or the acquisition of existing, or the construction of new or the improvement or replacement of existing, capital assets by such Person, in each case if such addition, improvement, replacement, acquisition or construction is made to increase for a period longer than the short-term the operating capacity of the Partnership Group, in the case of clauses (a) and (b), or such Person, in the case of clause (c), from the operating capacity of the Partnership Group or such Person, as the case may be, existing immediately prior to such addition, improvement, replacement, acquisition or construction. For purposes of this definition, the short-term generally refers to a period not exceeding 12 months.
"Capital Surplus" means Available Cash distributed by the Partnership in excess of Operating Surplus, as described in Section 6.3(a).
"Carrying Value" means (a) with respect to a Contributed Property or Adjusted Property, the Agreed Value of such property reduced (but not below zero) by all depreciation, amortization and cost recovery deductions charged to the Partners' and Assignees' Capital Accounts in respect of such property, and (b) with respect to any other Partnership property, the adjusted basis of such property for federal income tax purposes, all as of the time of determination; provided that the Carrying Value of any property shall be adjusted from time to time in accordance with Sections 5.5(d)(i) and 5.5(d)(ii) and to reflect changes, additions or other adjustments to the Carrying Value for dispositions and acquisitions of Partnership properties, as deemed appropriate by the General Partner.
"Cause" means a court of competent jurisdiction has entered a final, non-appealable judgment finding the General Partner liable for actual fraud or willful misconduct in its capacity as a general partner of the Partnership.
"Certificate" means (a) a certificate (i) substantially in the form of Exhibit A to this Agreement, (ii) issued in global form in accordance with the rules and regulations of the Depositary or (iii) in such other form as may be adopted by the General Partner, issued by the Partnership evidencing ownership of one or more Common Units or (b) a certificate, in such form as may be adopted by the General Partner, issued by the Partnership evidencing ownership of one or more other Partnership Interests.
"Certificate of Limited Partnership" means the Certificate of Limited Partnership of the Partnership filed with the Secretary of State of the State of Delaware as referenced in Section 7.2, as such Certificate of Limited Partnership may be amended, supplemented or restated from time to time.
"Citizenship Certification" means a properly completed certificate in such form as may be specified by the General Partner by which an Assignee or a Limited Partner certifies that he (and if he is a nominee holding for the account of another Person, that to the best of his knowledge such other Person) is an Eligible Citizen Holder.
"claim" (as used in Section 7.12(c)) is defined in Section 7.12(c).
"Closing Date" means the first date on which Common Units are sold by the Partnership to the Underwriters pursuant to the provisions of the Underwriting Agreement.
"Closing Price" means, in respect of any class of Limited Partner Interests, as of the date of determination, the last sale price on such day, regular way, or in case no such sale takes place on such day, the average of the closing bid and asked prices on such day, regular way, in either case as reported in the principal consolidated transaction reporting system with respect to securities listed or admitted to trading on the principal National Securities Exchange on which the respective Limited Partner Interests are listed or admitted to trading or, if such Limited Partner Interests are not listed or admitted to trading on any National Securities Exchange, the last quoted price on such day or, if not so quoted, the average of the high bid and low asked prices on such day in the over-the-counter market, as reported by the primary reporting system then in use in relation to such Limited Partner Interests of such class, or, if on any such day such Limited Partner Interests of such class are not quoted by any such organization, the average of the closing bid and asked prices on such day as furnished by a professional market maker making a market in such Limited Partner Interests of such class selected by the General Partner, or if on any such day no market maker is making a market in such Limited Partner Interests of such class, the fair value of such Limited Partner Interests on such day as determined by the General Partner.
"Code" means the Internal Revenue Code of 1986, as amended and in effect from time to time. Any reference herein to a specific section or sections of the Code shall be deemed to include a reference to any corresponding provision of any successor law.
"Combined Interest" is defined in Section 11.3(a).
"Commences Commercial Service" means the date a Capital Improvement is first put into commercial service following completion of construction, acquisition, development and testing, as applicable.
"Commission" means the United States Securities and Exchange Commission.
"Common Unit" means a Partnership Interest representing a fractional part of the Partnership Interests of all Limited Partners and Assignees, and having the rights and obligations specified with respect to Common Units in this Agreement. The term "Common Unit" does not refer to or include any Subordinated Unit prior to its conversion into a Common Unit pursuant to the terms hereof.
"Common Unit Arrearage" means, with respect to any Common Unit, whenever issued, with respect to any Quarter within the Subordination Period, the excess, if any, of (a) the Minimum Quarterly Distribution with respect to a Common Unit in respect of such Quarter over (b) the sum of all Available Cash distributed with respect to a Common Unit in respect of such Quarter pursuant to Section 6.4(a)(i).
"Conflicts Committee" means a committee of the Board of Directors of the General Partner composed entirely of two or more directors, each of whom (a) is not an officer, director or employee of the General Partner or any Person controlling the General Partner, (b) is not a holder of any ownership interest in the General Partner and (c) meets the independence standards required of directors who serve on an audit committee of a board of directors established by the Securities Exchange Act and the rules and regulations of the Commission thereunder and by the National Securities Exchange on which any class of Partnership Interests is listed or admitted to trading.
"Contributed Property" means each property or other asset, in such form as may be permitted by the Delaware Act, but excluding cash, contributed to the Partnership. Once the
Carrying Value of a Contributed Property is adjusted pursuant to Section 5.5(d), such property shall no longer constitute a Contributed Property, but shall be deemed an Adjusted Property.
"Contribution Agreement" means that certain Contribution, Conveyance and Assumption Agreement, dated as of , 2010, among the General Partner, the Partnership, Rhino Energy Holdings and certain other parties, together with the additional conveyance documents and instruments contemplated or referenced thereunder, as such may be amended, supplemented or restated from time to time.
"Cumulative Common Unit Arrearage" means, with respect to any Common Unit, whenever issued, and as of the end of any Quarter, the excess, if any, of (a) the sum of the Common Unit Arrearages with respect to an Initial Common Unit for each of the Quarters within the Subordination Period ending on or before the last day of such Quarter over (b) the sum of any distributions theretofore made pursuant to Section 6.4(a)(ii) and the second sentence of Section 6.5 with respect to an Initial Common Unit (including any distributions to be made in respect of the last of such Quarters).
"Curative Allocation" means any allocation of an item of income, gain, deduction, loss or credit pursuant to the provisions of Section 6.1(d)(xi).
"Current Market Price" means, in respect of any class of Limited Partner Interests, as of the date of determination, the average of the daily Closing Prices per Limited Partner Interest of such class for the 20 consecutive Trading Days immediately prior to such date.
"Deferred Issuance and Distribution" means both (a) the issuance by the Partnership of a number of additional Common Units that is equal to the excess, if any, of (x) 562,500486,600 minus (y) the aggregate number, if any, of Common Units actually purchased by and issued to the Underwriters pursuant to the Over-Allotment Option on the Option Closing Date(s), and (b) reimbursement(s) of pre-formation capital expenditures in an amount equal to the total amount of cash, if any, contributed by the Underwriters to the Partnership on or in connection with any Option Closing Date with respect to Common Units issued by the Partnership upon the applicable exercise of the Over-Allotment Option in accordance with Section 5.3(b), if any.
"Delaware Act" means the Delaware Revised Uniform Limited Partnership Act, 6 Del C. Section 17-101, et seq., as amended, supplemented or restated from time to time, and any successor to such statute.
"Departing General Partner" means a former General Partner from and after the effective date of any withdrawal or removal of such former General Partner pursuant to Section 11.1 or 11.2.
"Depositary" means, with respect to any Units issued in global form, The Depository Trust Company and its successors and permitted assigns.
"Disposed of Adjusted Property" has the meaning assigned to such term in Section 6.1(d)(xii)(B).
"Economic Risk of Loss" has the meaning set forth in Treasury Regulation Section 1.752-2(a).
"Eligible Citizen Holder" means a Limited Partner or Assignee whose nationality, citizenship or other related status would not, in the determination of the General Partner, create a substantial risk of cancellation or forfeiture of any property in which a Group Member has an interest.
"Eligibility Certification" means a Citizenship Certification or a Rate Eligibility Certification.
"Estimated Incremental Quarterly Tax Amount" is defined in Section 6.9.
"Estimated Maintenance Capital Expenditures" means an estimate made in good faith by the Board of Directors (with the concurrence of the Conflicts Committee) of the average quarterly Maintenance Capital Expenditures that the Partnership will need to incur over the long term to maintain the operating capacity of the Partnership Group (including the Partnership's proportionate share of the average quarterly Maintenance Capital Expenditures of its Subsidiaries that are not wholly owned) existing at the time the estimate is made. The Board of Directors (with the concurrence of the Conflicts Committee) will be permitted to make such estimate in any manner it determines reasonable. The estimate will be made at least annually and whenever an event occurs that is likely to result in a material adjustment to the amount of future Estimated Maintenance Capital Expenditures. The Partnership shall disclose to its Partners any change in the amount of Estimated Maintenance Capital Expenditures in its reports made in accordance with Section 8.3 to the extent not previously disclosed. Any adjustments to Estimated Maintenance Capital Expenditures shall be prospective only.
"Event of Withdrawal" is defined in Section 11.1(a).
"Excess Distribution" is defined in Section 6.1(d)(iii)(A).
"Excess Distribution Unit" is defined in Section 6.1(d)(iii)(A).
"Expansion Capital Expenditures" means cash expenditures for Acquisitions or Capital Improvements, and shall not include Maintenance Capital Expenditures or Investment Capital Expenditures. Expansion Capital Expenditures shall include interest (and related fees) on debt incurred to finance the construction of a Capital Improvement and paid in respect of the period beginning on the date that a Group Member enters into a binding obligation to commence construction of a Capital Improvement and ending on the earlier to occur of the date that such Capital Improvement Commences Commercial Service and the date that such Capital Improvement is abandoned or disposed of. Debt incurred to fund such construction period interest payments or to fund distributions on equity issued (including incremental Incentive Distributions related thereto) to fund the construction of a Capital Improvement as described in clause (a)(iv) of the definition of Operating Surplus shall also be deemed to be debt incurred to finance the construction of a Capital Improvement. Where capital expenditures are made in part for Expansion Capital Expenditures and in part for other purposes, the General Partner shall determine the allocation between the amounts paid for each.
"Final Subordinated Units" is defined in Section 6.1(d)(x)(A).
"First Liquidation Target Amount" is defined in Section 6.1(c)(i)(D).
"First Target Distribution" means $0.51175 per Unit per Quarter (or, with respect to periods of less than a full fiscal quarter, it means the product of such amount multiplied by a fraction of which the numerator is the number of days in such period, and the denominator is the total
number of days in such quarter), subject to adjustment in accordance with Sections 5.11, 6.6 and 6.9.
"Fully Diluted Weighted Average Basis" means, when calculating the number of Outstanding Units for any period, a basis that includes (1) the weighted average number of Outstanding Units plus (2) all Partnership Interests and options, rights, warrants, phantom units and appreciation rights relating to an equity interest in the Partnership (a) that are convertible into or exercisable or exchangeable for Units or for which Units are issuable, each case that are senior to or pari passu with the Subordinated Units, (b) whose conversion, exercise or exchange price is less than the Current Market Price on the date of such calculation, (c) that may be converted into or exercised or exchanged for such Units prior to or during the Quarter immediately following the end of the period for which the calculation is being made without the satisfaction of any contingency beyond the control of the holder other than the payment of consideration and the compliance with administrative mechanics applicable to such conversion, exercise or exchange and (d) that were not converted into or exercised or exchanged for such Units during the period for which the calculation is being made;provided,however, that for purposes of determining the number of Outstanding Units on a Fully Diluted Weighted Average Basis when calculating whether the Subordination Period has ended or the Subordinated Units are entitled to convert into Common Units pursuant to Section 5.7, such Partnership Interests, options, rights, warrants and appreciation rights shall be deemed to have been Outstanding Units only for the four Quarters that comprise the last four Quarters of the measurement period;provided,further, that if consideration will be paid to any Group Member in connection with such conversion, exercise or exchange, the number of Units to be included in such calculation shall be that number equal to the difference between (i) the number of Units issuable upon such conversion, exercise or exchange and (ii) the number of Units that such consideration would purchase at the Current Market Price.
"General Partner" means Rhino GP LLC, a Delaware limited liability company, and its successors and permitted assigns that are admitted to the Partnership as general partner of the Partnership, in its capacity as general partner of the Partnership (except as the context otherwise requires).
"General Partner Interest" means the ownership interest of the General Partner in the Partnership (in its capacity as a general partner without reference to any Limited Partner Interest held by it) and includes any and all benefits to which the General Partner is entitled as provided in this Agreement, together with all obligations of the General Partner to comply with the terms and provisions of this Agreement.
"Gross Liability Value" means, with respect to any Liability of the Partnership described in Treasury Regulation Section 1.752-7(b)(3)(i), the amount of cash that a willing assignor would pay to a willing assignee to assume such Liability in an arm's-length transaction.
"Group" means a Person that with or through any of its Affiliates or Associates has any contract, arrangement, understanding or relationship for the purpose of acquiring, holding, voting (except voting pursuant to a revocable proxy or consent given to such Person in response to a proxy or consent solicitation made to 10 or more Persons), exercising investment power or disposing of any Partnership Interests with any other Person that beneficially owns, or whose Affiliates or Associates beneficially own, directly or indirectly, Partnership Interests.
"Group Member" means a member of the Partnership Group.
"Group Member Agreement" means the partnership agreement of any Group Member, other than the Partnership, that is a limited or general partnership, the limited liability company agreement of any Group Member that is a limited liability company, the certificate of incorporation and bylaws or similar organizational documents of any Group Member that is a corporation, the joint venture agreement or similar governing document of any Group Member that is a joint venture and the governing or organizational or similar documents of any other Group Member that is a Person other than a limited or general partnership, limited liability company, corporation or joint venture, as such may be amended, supplemented or restated from time to time.
"Holder" as used in Section 7.12, is defined in Section 7.12(a).
"Hedge Contract" means any exchange, swap, forward, cap, floor, collar, option or other similar agreement or arrangement entered into for the purpose of reducing the exposure of the Partnership Group to fluctuations in interest rates or the price of hydrocarbons, other than for speculative purposes.
"Holder" as used in Section 7.12, is defined in Section 7.12(a).
"IDR Reset Common Unit" has the meaning assigned to such term in Section 5.11(a).
"IDR Reset Election" is defined in Section 5.11(a).
"Incentive Distribution Right" means a non-voting Limited Partner Interest which will confer upon the holder thereof only the rights and obligations specifically provided in this Agreement with respect to Incentive Distribution Rights (and no other rights otherwise available to or other obligations of a holder of a Partnership Interest). Notwithstanding anything in this Agreement to the contrary, the holder of an Incentive Distribution Right shall not be entitled to vote such Incentive Distribution Right on any Partnership matter except as may otherwise be required by law.
"Incentive Distributions" means any amount of cash distributed to the holders of the Incentive Distribution Rights pursuant to Section 6.4.
"Incremental Income Taxes" is defined in Section 6.9.
"Indemnified Persons" is defined in Section 7.12(c).
"Indemnitee" means (a) any General Partner, (b) any Departing General Partner, (c) any Person who is or was an Affiliate of the General Partner or any Departing General Partner, (d) any Person who is or was a manager, managing member, director, officer, employee, agent, fiduciary or trustee of any Group Member, a General Partner, any Departing General Partner or any of their respective Affiliates, (e) any Person who is or was serving at the request of a General Partner, any Departing General Partner or any of their respective Affiliates as an officer, director, manager, managing member, employee, agent, fiduciary or trustee of another Person owing a fiduciary duty to any Group Member; provided that a Person shall not be an Indemnitee by reason of providing, on a fee-for-services basis, trustee, fiduciary or custodial services, (f) any Person who controls a General Partner or Departing General Partner and (g) any Person the General Partner designates as an "Indemnitee" for purposes of this Agreement.
"Ineligible Citizen Holder" means a Person whom the General Partner has determined does not constitute an Eligible Citizen Holder and as to whose Partnership interest the General Partner has become the substitute Limited Partner, pursuant to Section 4.8(a).
"Ineligible Holder" means an Ineligible Citizen Holder or a Rate Ineligible Holder.
"Initial Common Units" means the Common Units sold in the Initial Offering.
"Initial Limited Partners" means the Organizational Limited Partner (with respect to the Common Units and Subordinated Units received by it pursuant to Section 5.2), the General Partner (with respect to the Incentive Distribution Rights) and the Underwriters, in each case upon being admitted to the Partnership in accordance with Section 10.1.
"Initial Offering" means the initial offering and sale of Common Units to the public, as described in the Registration Statement, including any Common Units issued pursuant to the exercise of the Over-Allotment Option.
"Initial Unit Price" means (a) with respect to the Common Units and the Subordinated Units, the initial public offering price per Common Unit at which the Underwriters offered the Common Units to the public for sale as set forth on the cover page of the prospectus included as part of the Registration Statement and first issued at or after the time the Registration Statement first became effective or (b) with respect to any other class or series of Units, the price per Unit at which such class or series of Units is initially sold by the Partnership, as determined by the General Partner, in each case adjusted as the General Partner determines to be appropriate to give effect to any distribution, subdivision or combination of Units.
"Interim Capital Transactions" means the following transactions if they occur prior to the Liquidation Date: (a) borrowings, refinancings or refundings of indebtedness (other than Working Capital Borrowings and other than for items purchased on open account or for a deferred purchase price in the ordinary course of business) by any Group Member and sales of debt securities of any Group Member; (b) sales of equity interests of any Group Member (including the Common Units sold to the Underwriters in the Initial Offering or pursuant to the exercise of the Over-Allotment Option), (c) sales or other voluntary or involuntary dispositions of any assets of any Group Member other than (i) sales or other dispositions of inventory, accounts receivable and other assets in the ordinary course of business, and (ii) sales or other dispositions of assets as part of normal retirements or replacements and (d) capital contributions received.
"Investment Capital Expenditures" means capital expenditures other than Maintenance Capital Expenditures and Expansion Capital Expenditures.
"Liability" means any liability or obligation of any nature, whether accrued, contingent or otherwise.
"Limited Partner" means, unless the context otherwise requires, (a) each Initial Limited Partner, each additional Person that becomes a Limited Partner pursuant to the terms of this Agreement and any Departing General Partner upon the change of its status from General Partner to Limited Partner pursuant to Section 11.3, in each case, in such Person's capacity as a limited partner of the Partnership and (b) solely for purposes of Articles V, VI, VII, IX and XII, each Assignee; provided, however, that when the term "Limited Partner" is used herein in the context of any vote or other approval, including Articles XIII and XIV, such term shall not, solely for such purpose, include any holder of an Incentive Distribution Right (solely with respect to its Incentive Distribution Rights and not with respect to any other Limited Partner Interest held by such Person) except as may otherwise be required by law.
"Limited Partner Interest" means the ownership interest of a Limited Partner or Assignee in the Partnership, which may be evidenced by Common Units, Subordinated Units, Incentive
Distribution Rights or other Partnership Interests or a combination thereof or interest therein, and includes any and all benefits to which such Limited Partner or Assignee is entitled as provided in this Agreement, together with all obligations of such Limited Partner or Assignee to comply with the terms and provisions of this Agreement;provided,however, that when the term "Limited Partner Interest" is used herein in the context of any vote or other approval, including Articles XIII and XIV, such term shall not, solely for such purpose, include any Incentive Distribution Right except as may otherwise be required by law.
"Liquidation Date" means (a) in the case of an event giving rise to the dissolution of the Partnership of the type described in clauses (a) and (b) of the first sentence of Section 12.2, the date on which the applicable time period during which the holders of Outstanding Units have the right to elect to continue the business of the Partnership has expired without such an election being made, and (b) in the case of any other event giving rise to the dissolution of the Partnership, the date on which such event occurs.
"Liquidator" means one or more Persons selected by the General Partner to perform the functions described in Section 12.4 as liquidating trustee of the Partnership within the meaning of the Delaware Act.
"LTIP" means the Long-Term Incentive Plan of the General Partner, as may be amended, or any equity compensation plan successor thereto.
"Maintenance Capital Expenditures" means cash expenditures (including expenditures for the addition or improvement to or replacement of the capital assets owned by any Group Member or for the acquisition of existing, or the construction or development of new, capital assets) if such expenditures are made to maintain, including for a period longer than the short-term, the operating capacity of the Partnership Group. Maintenance Capital Expenditures shall not include (a) Expansion Capital Expenditures or (b) Investment Capital Expenditures. Maintenance Capital Expenditures shall include interest (and related fees) on debt incurred and distributions on equity issued, other than equity issued on the Closing Date or the Option Closing Date, in each case, to finance the construction or development of a replacement asset and paid during the period beginning on the date that a Group Member enters into a binding obligation to commence constructing or developing a replacement asset and ending on the earlier to occur of the date that such replacement asset Commences Commercial Service and the date that such replacement asset is abandoned or disposed of. Debt incurred to pay or equity issued, other than equity issued on the Closing Date or the Option Closing Date, to fund construction or development period interest payments, or such construction or development period distributions on equity, shall also be deemed to be debt or equity, as the case may be, incurred to finance the construction or development of a replacement asset and the incremental Incentive Distributions paid relating to newly issued equity shall be deemed to be distributions paid on equity issued to finance the construction or development of a replacement asset. For purposes of this definition, the short-term generally refers to a period not exceeding 12 months.
"Merger Agreement" is defined in Section 14.1.
"Minimum Quarterly Distribution" means $0.445 per Unit per Quarter (or with respect to periods of less than a full fiscal quarter, it means the product of such amount multiplied by a fraction of which the numerator is the number of days in such period and the denominator is the total number of days in such quarter), subject to adjustment in accordance with Sections 5.11, 6.6 and 6.9.
"National Securities Exchange" means an exchange registered with the Commission under Section 6(a) of the Securities Exchange Act (or any successor to such Section) and any other securities exchange (whether or not registered with the Commission under Section 6(a) (or successor to such Section) of the Securities Exchange Act) that the General Partner shall designate as a National Securities Exchange for purposes of this Agreement.
"Net Agreed Value" means, (a) in the case of any Contributed Property, the Agreed Value of such property reduced by any Liabilities either assumed by the Partnership upon such contribution or to which such property is subject when contributed and (b) in the case of any property distributed to a Partner or Assignee by the Partnership, the Partnership's Carrying Value of such property (as adjusted pursuant to Section 5.5(d)(ii)) at the time such property is distributed, reduced by any Liability either assumed by such Partner or Assignee upon such distribution or to which such property is subject at the time of distribution.
"Net Income" means, for any taxable period, the excess, if any, of the Partnership's items of income and gain (other than those items taken into account in the computation of Net Termination Gain or Net Termination Loss) for such taxable period over the Partnership's items of loss and deduction (other than those items taken into account in the computation of Net Termination Gain or Net Termination Loss) for such taxable period. The items included in the calculation of Net Income shall be determined in accordance with Section 5.5(b) and shall not include any items specially allocated under Section 6.1(d);provided, that the determination of the items that have been specially allocated under Section 6.1(d) shall be made without regard to any reversal of such items under Section 6.1(d)(xii).
"Net Loss" means, for any taxable period, the excess, if any, of the Partnership's items of loss and deduction (other than those items taken into account in the computation of Net Termination Gain or Net Termination Loss) for such taxable period over the Partnership's items of income and gain (other than those items taken into account in the computation of Net Termination Gain or Net Termination Loss) for such taxable period. The items included in the calculation of Net Loss shall be determined in accordance with Section 5.5(b) and shall not include any items specially allocated under Section 6.1(d);provided, that the determination of the items that have been specially allocated under Section 6.1(d) shall be made without regard to any reversal of such items under Section 6.1(d)(xii).
"Net Positive Adjustments" means, with respect to any Partner, the excess, if any, of the total positive adjustments over the total negative adjustments made to the Capital Account of such Partner pursuant to Book-Up Events and Book-Down Events.
"Net Termination Gain" means, for any taxable period, the sum, if positive, of all items of income, gain, loss or deduction (determined in accordance with Section 5.5(b)) that are (a) recognized (i) after the Liquidation Date or (ii) upon the sale, exchange or other disposition of all or substantially all of the assets of the Partnership Group, taken as a whole, in a single transaction or a series of related transactions (excluding any disposition to a member of the Partnership Group), or (b) deemed recognized by the Partnership pursuant to Section 5.5(d); provided, however, the items included in the determination of Net Termination Gain shall not include any items of income, gain or loss specially allocated under Section 6.1(d).
"Net Termination Loss" means, for any taxable period, the sum, if negative, of all items of income, gain, loss or deduction (determined in accordance with Section 5.5(b)) that are (a) recognized (i) after the Liquidation Date or (ii) upon the sale, exchange or other disposition of all or substantially all of the assets of the Partnership Group, taken as a whole, in a single transaction or a series of related transactions (excluding any disposition to a member of the
Partnership Group), or (b) deemed recognized by the Partnership pursuant to Section 5.5(d); provided, however, items included in the determination of Net Termination Loss shall not include any items of income, gain or loss specially allocated under Section 6.1(d).
"Nonrecourse Built-in Gain" means with respect to any Contributed Properties or Adjusted Properties that are subject to a mortgage or pledge securing a Nonrecourse Liability, the amount of any taxable gain that would be allocated to the Partners pursuant to Section 6.2(b) if such properties were disposed of in a taxable transaction in full satisfaction of such liabilities and for no other consideration.
"Nonrecourse Deductions" means any and all items of loss, deduction or expenditure (including any expenditure described in Section 705(a)(2)(B) of the Code) that, in accordance with the principles of Treasury Regulation Section 1.704-2(b), are attributable to a Nonrecourse Liability.
"Nonrecourse Liability" has the meaning set forth in Treasury Regulation Section 1.752-1(a)(2).
"Notice of Election to Purchase" is defined in Section 15.1(b).
"Notional General Partner Units" means notional units used solely to calculate the General Partner's Percentage Interest. Notional General Partner Units shall not constitute "Units" for any purpose of this Agreement. There shall initially be 506,000 Notional General Partner Units (resulting in the General Partner's Percentage Interest being 2% after giving effect to any exercise of the Over-Allotment Option and the Deferred Issuance and Distribution). If the General Partner makes additional Capital Contributions pursuant to Section 5.2(b) to maintain its Percentage Interest, the number of Notional General Partner Units shall be increased proportionally to reflect the maintenance of such Percentage Interest.
"Operating Expenditures" means all Partnership Group cash expenditures (or the Partnership's proportionate share of expenditures in the case of Subsidiaries that are not wholly owned), including, but not limited to, taxes, reimbursements of expenses of the General Partner and its Affiliates, payments made in the ordinary course of business under any Hedge Contracts (provided that (i) with respect to amounts paid in connection with the initial purchase of an Hedge Contract, such amounts shall be amortized over the life of such Hedge Contract and (ii) payments made in connection with the termination of any Hedge Contract prior to the expiration of its stipulated settlement or termination date shall be included in equal quarterly installments over the remaining scheduled life of such Hedge Contract), officer compensation, repayment of Working Capital Borrowings, debt service payments and Estimated Maintenance Capital Expenditures, subject to the following:
(a) repayments of Working Capital Borrowings deducted from Operating Surplus pursuant to clause (b)(iii) of the definition of "Operating Surplus" shall not constitute Operating Expenditures when actually repaid;
(b) payments (including prepayments and prepayment penalties) of principal of and premium on indebtedness other than Working Capital Borrowings shall not constitute Operating Expenditures; and
(c) Operating Expenditures shall not include (i) Expansion Capital Expenditures, (ii) actual Maintenance Capital Expenditures, (iii) Investment Capital Expenditures, (iv) payment of transaction expenses (including taxes) relating to Interim Capital Transactions, (v) distributions to Partners, or (vi) repurchases of Partnership Interests, other than repurchases of Partnership Interests to satisfy obligations under employee benefit plans, or reimbursements of expenses of the General Partner for such purchases. Where capital expenditures are made in part for Maintenance Capital Expenditures and in part for other purposes, the General Partner shall determine the allocation between the amounts paid for each.
"Operating Surplus" means, with respect to any period ending prior to the Liquidation Date, on a cumulative basis and without duplication,
(a) the sum of (i) $25.0 million, (ii) all cash receipts of the Partnership Group (or the Partnership's proportionate share of cash receipts in the case of Subsidiaries that are not wholly owned) for the period beginning on the Closing Date and ending on the last day of such period, but excluding cash receipts from Interim Capital Transactions and provided that cash receipts from the termination of any Hedge Contract prior to the expiration of its stipulated settlement or termination date shall be included in equal quarterly installments over the remaining scheduled life of such Hedge Contract, (iii) all cash receipts of the Partnership Group (or the Partnership's proportionate share of cash receipts in the case of Subsidiaries that are not wholly owned) after the end of such period but on or before the date of determination of Operating Surplus with respect to such period resulting from Working Capital Borrowings, and (iv) the amount of cash distributions paid (including incremental Incentive Distributions) on equity issued, other than equity issued on the Closing Date or the Option Closing Date, to finance all or a portion of the construction, acquisition or improvement of a Capital Improvement or replacement of a capital asset and paid in respect of the period beginning on the date that the Group Member enters into a binding obligation to commence the construction, acquisition or improvement of a Capital Improvement or replacement of a capital asset and ending on the earlier to occur of the date the Capital Improvement or replacement capital asset Commences Commercial Service and the date that it is abandoned or disposed of (equity issued, other than equity issued on the Closing Date or the Option Closing Date, to fund the construction period interest payments on debt incurred, or construction period distributions on equity issued, to finance the construction, acquisition or improvement of a Capital Improvement or replacement of a capital asset shall also be deemed to be equity issued to finance the construction, acquisition or improvement of a Capital Improvement or replacement of a capital asset for purposes of this clause (iv)), less
(b) the sum of (i) Operating Expenditures for the period beginning on the Closing Date and ending on the last day of such period; (ii) the amount of cash reserves established by the General Partner (or the Partnership's proportionate share of cash reserves in the case of Subsidiaries that are not wholly owned) to provide funds for future Operating Expenditures; (iii) all Working Capital Borrowings not repaid within twelve months after having been incurred and (iv) any cash loss realized on disposition of an Investment Capital Expenditure;
provided,however, that disbursements made (including contributions to a Group Member or disbursements on behalf of a Group Member) or cash reserves established, increased or reduced after the end of such period but on or before the date of determination of Available Cash with respect to such period shall be deemed to have been made, established, increased or reduced, for purposes of determining Operating Surplus, within such period if the General Partner so determines.
Notwithstanding the foregoing, "Operating Surplus" with respect to the Quarter in which the Liquidation Date occurs and any subsequent Quarter shall equal zero. Cash receipts from an Investment Capital Expenditure shall be treated as cash receipts only to the extent they are a return on principal, but in no event shall a return of principal be treated as cash receipts.
"Opinion of Counsel" means a written opinion of counsel (who may be regular counsel to the Partnership or the General Partner or any of its Affiliates) acceptable to the General Partner.
"Option Closing Date" means the date or dates on which any Common Units are sold by the Partnership to the Underwriters upon exercise of the Over-Allotment Option.
"Organizational Limited Partner" means Rhino Energy Holdings LLC, a Delaware limited liability company, in its capacity as the organizational limited partner of the Partnership pursuant to this Agreement.
"Outstanding" means, with respect to Partnership Interests, all Partnership Interests that are issued by the Partnership and reflected as outstanding on the Partnership's books and records as of the date of determination;provided,however, that if at any time any Person or Group (other than the General Partner or its Affiliates) beneficially owns 20% or more of the Outstanding Partnership Interests of any class then Outstanding, none of the Partnership Interests owned by such Person or Group shall be voted on any matter and shall not be considered to be Outstanding when sending notices of a meeting of Limited Partners to vote on any matter (unless otherwise required by law), calculating required votes, determining the presence of a quorum or for other similar purposes under this Agreement, except that Partnership Interests so owned shall be considered to be Outstanding for purposes of Section 11.1(b)(iv) (such Partnership Interests shall not, however, be treated as a separate class of Partnership Interests for purposes of this Agreement or the Delaware Act);provided,further, that the foregoing limitation shall not apply to (i) any Person or Group who acquired 20% or more of the Outstanding Partnership Interests of any class then Outstanding directly from the General Partner or its Affiliates (other than the Partnership), (ii) any Person or Group who acquired 20% or more of the Outstanding Partnership Interests of any class then Outstanding directly or indirectly from a Person or Group described in clause (i)provided that, at or prior to such acquisition, the General Partner shall have notified such Person or Group in writing that such limitation shall not apply, or (iii) any Person or Group who acquired 20% or more of any Partnership Interests issued by the Partnership provided that, at or prior to such acquisition, the General Partner shall have notified such Person or Group in writing that such limitation shall not apply.
"Over-Allotment Option" means the over-allotment option granted to the Underwriters by the Partnership pursuant to the Underwriting Agreement.
"Partner Nonrecourse Debt" has the meaning set forth in Treasury Regulation Section 1.704-2(b)(4).
"Partner Nonrecourse Debt Minimum Gain" has the meaning set forth in Treasury Regulation Section 1.704-2(i)(2).
"Partner Nonrecourse Deductions" means any and all items of loss, deduction or expenditure (including any expenditure described in Section 705(a)(2)(B) of the Code) that, in accordance with the principles of Treasury Regulation Section 1.704-2(i), are attributable to a Partner Nonrecourse Debt.
"Partners" means the General Partner and the Limited Partners.
"Partnership" means Rhino Resource Partners LP, a Delaware limited partnership.
"Partnership Group" means the Partnership and its Subsidiaries treated as a single consolidated entity.
"Partnership Interest" means any class or series of equity interest in the Partnership (but excluding any options, rights, warrants and appreciation rights relating to an equity interest in the Partnership), including Common Units, Subordinated Units and Incentive Distribution Rights.
"Partnership Minimum Gain" means that amount determined in accordance with the principles of Treasury Regulation Sections 1.704-2(b)(2) and 1.704-2(d).
"Percentage Interest" means as of any date of determination (a) as to the General Partner, with respect to the General Partner Interest (calculated based upon a number of Notional General Partner Units), and as to any Unitholder with respect to Units, the product obtained by multiplying (i) 100% less the percentage applicable to clause (b) below by (ii) the quotient obtained by dividing (A) the number of Notional General Partner Units deemed held by the General Partner or the number of Units held by such Unitholder, as the case may be, by (B) the total number of Outstanding Units and Notional General Partner Units, and (b) as to the holders of other Partnership Interests issued by the Partnership in accordance with Section 5.6, the percentage established as a part of such issuance. The Percentage Interest with respect to an Incentive Distribution Right shall at all times be zero.
"Person" means an individual or a corporation, firm, limited liability company, partnership, joint venture, trust, unincorporated organization, association, government agency or political subdivision thereof or other entity.
"Per Unit Capital Amount" means, as of any date of determination, the Capital Account, stated on a per Unit basis, underlying any class of Units held by a Person other than the General Partner or any Affiliate of the General Partner who holds Units.
"Plan of Conversion" is defined in Section 14.1.
"Pro Rata" means (a) when used with respect to Units or any class thereof, apportioned equally among all designated Units in accordance with their relative Percentage Interests, (b) when used with respect to Partners and Assignees or Record Holders, apportioned among all Partners and Assignees or Record Holders in accordance with their relative Percentage Interests and (c) when used with respect to holders of Incentive Distribution Rights, apportioned equally among all holders of Incentive Distribution Rights in accordance with the relative number or percentage of Incentive Distribution Rights held by each such holder.
"Purchase Date" means the date determined by the General Partner as the date for purchase of all Outstanding Limited Partner Interests of a certain class (other than Limited Partner Interests owned by the General Partner and its Affiliates) pursuant to Article XV.
"Quarter" means, unless the context requires otherwise, a fiscal quarter of the Partnership, or, with respect to the fiscal quarter of the Partnership that includes the Closing Date, the portion of such fiscal quarter after the Closing Date.
"Rate Eligible Holder" means a Limited Partner or Assignee whose federal income tax status would not, in the determination of the General Partner, have the material adverse effect described in sectionSection 4.8(b)(i).
"Rate Eligibility Certification" is defined in Section 4.8(b)(ii).
"Rate Ineligible Holder" is defined in Section 4.8(b)(iii).
"Recapture Income" means any gain recognized by the Partnership (computed without regard to any adjustment required by Section 734 or Section 743 of the Code) upon the disposition of any property or asset of the Partnership, which gain is characterized as ordinary income because it represents the recapture of deductions previously taken with respect to such property or asset.
"Record Date" means the date established by the General Partner or otherwise in accordance with this Agreement for determining (a) the identity of the Record Holders entitled to notice of, or to vote at, any meeting of Limited Partners or entitled to vote by ballot or give approval of Partnership action in writing without a meeting or entitled to exercise rights in respect of any lawful action of Limited Partners or (b) the identity of Record Holders entitled to receive any report or distribution or to participate in any offer.
"Record Holder" means (a) with respect to Partnership Interests of any class of Partnership Interests for which a Transfer Agent has been appointed, the Person in whose name a Partnership Interest of such class is registered on the books of the Transfer Agent as of the opening of business on a particular Business Day, or (b) with respect to other classes of Partnership Interests, the Person in whose name any such other Partnership Interest is registered on the books that the General Partner has caused to be kept as of the opening of business on such Business Day.
"Redeemable Interests" means any Partnership Interests for which a redemption notice has been given, and has not been withdrawn, pursuant to Section 4.9.
"Registration Statement" means the Registration Statement on Form S-1 (Registration No. 333-166550) as it has been or as it may be amended or supplemented from time to time, filed by the Partnership with the Commission under the Securities Act to register the offering and sale of the Common Units in the Initial Offering.
"Remaining Net Positive Adjustments" means as of the end of any taxable period, (i) with respect to the Unitholders holding Common Units or Subordinated Units, the excess of (a) the Net Positive Adjustments of the Unitholders holding Common Units or Subordinated Units as of the end of such period over (b) the sum of those Partners' Share of Additional Book Basis Derivative Items for each prior taxable period, (ii) with respect to the General Partner (as holder of the General Partner Interest), the excess of (a) the Net Positive Adjustments of the General Partner as of the end of such period over (b) the sum of the General Partner's Share of Additional Book Basis Derivative Items with respect to the General Partner Interest for each prior taxable period, and (iii) with respect to the holders of Incentive Distribution Rights, the excess of (a) the Net Positive Adjustments of the holders of Incentive Distribution Rights as of the end of such period over (b) the sum of the Share of Additional Book Basis Derivative Items of the holders of the Incentive Distribution Rights for each prior taxable period.
"Required Allocations" means any allocation of an item of income, gain, loss or deduction pursuant to Section 6.1(d)(i), Section 6.1(d)(ii), Section 6.1(d)(iv), Section 6.1(d)(v), Section 6.1(d)(vi), Section 6.1(d)(vii) or Section 6.1(d)(ix).
"Reset MQD" is defined in Section 5.11(e).
"Reset Notice" is defined in Section 5.11(b).
"Retained Converted Subordinated Unit" is defined in Section 5.5(c)(ii).
"Second Liquidation Target Amount" is defined in Section 6.1(c)(i)(E).
"Second Target Distribution" means $0.55625 per Unit per Quarter (or, with respect to periods of less than a full fiscal quarter, it means the product of such amount multiplied by a fraction of which the numerator is the number of days in such period, and the denominator is the total number of days in such quarter), subject to adjustment in accordance with Section 5.11, Section 6.6 and Section 6.9.
"Securities Act" means the Securities Act of 1933, as amended, supplemented or restated from time to time and any successor to such statute.
"Securities Exchange Act" means the Securities Exchange Act of 1934, as amended, supplemented or restated from time to time and any successor to such statute.
"Share of Additional Book Basis Derivative Items" means in connection with any allocation of Additional Book Basis Derivative Items for any taxable period, (i) with respect to the Unitholders holding Common Units or Subordinated Units, the amount that bears the same ratio to such Additional Book Basis Derivative Items as the Unitholders' Remaining Net Positive Adjustments as of the end of such taxable period bears to the Aggregate Remaining Net Positive Adjustments as of that time, (ii) with respect to the General Partner (in respect of the General Partner Interest), the amount that bears the same ratio to such Additional Book Basis Derivative Items as the General Partner's Remaining Net Positive Adjustments as of the end of such taxable period bears to the Aggregate Remaining Net Positive Adjustment as of that time, and (iii) with respect to the Partners holding Incentive Distribution Rights, the amount that bears the same ratio to such Additional Book Basis Derivative Items as the Remaining Net Positive Adjustments of the Partners holding the Incentive Distribution Rights as of the end of such period bears to the Aggregate Remaining Net Positive Adjustments as of that time.
"Special Approval" means approval by a majority of the members of the Conflicts Committee acting in good faith.
"Subordinated Unit" means a Partnership Interest representing a fractional part of the Partnership Interests of all Limited Partners and Assignees and having the rights and obligations specified with respect to Subordinated Units in this Agreement. The term "Subordinated Unit" does not refer to or include a Common Unit. A Subordinated Unit that is convertible into a Common Unit shall not constitute a Common Unit until such conversion occurs.
"Subordination Period" means the period commencing on the Closing Date and ending on the first to occur of the following dates:
(a) the first Business Day following the distribution of Available Cash to Partners pursuant to Section 6.3(a) in respect of any Quarter beginning with the Quarter ending JuneSeptember 30, 2013 in respect of which (i) (A) distributions of Available Cash from Operating Surplus on each of (I) the Outstanding Common Units and Subordinated Units and any other Outstanding Units that are senior or equal in right of distribution to the Subordinated Units, and (II) the General Partner Interest, in each case with respect to each of the three consecutive, non-overlapping four-Quarter periods immediately preceding such date equaled or exceeded the sum of the Minimum Quarterly Distribution on (I) all Outstanding Common Units and Subordinated Units and any other Outstanding Units that are senior or equal in right of distribution to the Subordinated Units and (II) the General Partner Interest, in each case in respect of such periods and (B) the Adjusted Operating Surplus for each of the three consecutive, non-overlapping four-Quarter periods immediately preceding such date equaled or exceeded the sum of the Minimum Quarterly Distribution on all of the (I) Common Units, Subordinated Units and any other Units that are senior or equal in right of distribution to the Subordinated Units and (II) General Partner Interest, in each case that were Outstanding during such periods on a Fully Diluted Weighted Average Basis, and (ii) there are no Cumulative Common Unit Arrearages;
(b) the first Business Day following the distribution of Available Cash to Partners pursuant to Section 6.3(a) in respect of any Quarter beginning with the Quarter ending JuneSeptember 30, 2010 in respect of which (i) (A) distributions of Available Cash from Operating Surplus on each of (I) the Outstanding Common Units and Subordinated Units and any other Outstanding Units that are senior or equal in right of distribution to the Subordinated Units, and (II) the General Partner Interest, in each case with respect to the four-Quarter period immediately preceding such date equaled or exceeded 150% of the Minimum Quarterly Distribution on all of (I) the Outstanding Common Units and Subordinated Units and any other Outstanding Units that are senior or equal in right of distribution to the Subordinated Units and (II) the General Partner Interest, in each case in respect of such period, and (B) the Adjusted Operating Surplus for the four-Quarter period immediately preceding such date equaled or exceeded 150% of the sum of the Minimum Quarterly Distribution on all of (I) the Common Units and Subordinated Units and any other Units that are senior or equal in right of distribution to the Subordinated Units, (II) the General Partner Interest, in each case that were Outstanding during such period on a Fully Diluted Weighted Average Basis and (III) and the corresponding Incentive Distributions and (ii) there are no Cumulative Common Unit Arrearages;
(c) the first date on which there are no longer outstanding any Subordinated Units due to the conversion of Subordinated Units into Common Units pursuant to Section 5.7 or otherwise; and
(d) the date on which the General Partner is removed as general partner of the Partnership upon the requisite vote by holders of Outstanding Units under circumstances where Cause does not exist and no Units held by the General Partner and its Affiliates are voted in favor of such removal.
"Subsidiary" means, with respect to any Person, (a) a corporation of which more than 50% of the voting power of shares entitled (without regard to the occurrence of any contingency) to vote in the election of directors or other governing body of such corporation is owned, directly
or indirectly, at the date of determination, by such Person, by one or more Subsidiaries of such Person or a combination thereof, (b) a partnership (whether general or limited) in which such Person or a Subsidiary of such Person is, at the date of determination, a general or limited partner of such partnership, but only if more than 50% of the partnership interests of such partnership (considering all of the partnership interests of the partnership as a single class) is owned, directly or indirectly, at the date of determination, by such Person, by one or more Subsidiaries of such Person, or a combination thereof, or (c) any other Person (other than a corporation or a partnership) in which such Person, one or more Subsidiaries of such Person, or a combination thereof, directly or indirectly, at the date of determination, has (i) at least a majority ownership interest or (ii) the power to elect or direct the election of a majority of the directors or other governing body of such Person.
"Substituted Limited Partner" means a person who is admitted as a Limited Partner to the Partnership pursuant to Section 10.2 with all of the rights of a Limited Partner and who is shown as a Limited Partner on the books and records of the Partnership.
"Surviving Business Entity" is defined in Section 14.2(b)(ii).
"Target Distribution" means, collectively, the First Target Distribution, Second Target Distribution and Third Target Distribution.
"Third Target Distribution" means $0.6675 per Unit per Quarter (or, with respect to periods of less than a full fiscal quarter, it means the product of such amount multiplied by a fraction of which the numerator is the number of days in such period, and the denominator is the total number of days in such quarter), subject to adjustment in accordance with Sections 5.11, 6.6 and 6.9.
"Trading Day" means, for the purpose of determining the Current Market Price of any class of Limited Partner Interests, a day on which the principal National Securities Exchange on which such class of Limited Partner Interests is listed or admitted to trading is open for the transaction of business or, if Limited Partner Interests of a class are not listed or admitted to trading on any National Securities Exchange, a day on which banking institutions in New York City generally are open.
"Transaction Documents" means the Registration Rights Agreement and the Contribution Agreement.
"Transfer Application" means an application and agreement for transfer of Units in the form set forth on the back of a Certificate or in a form substantially to the same effect in a separate instrument.
"transfer" is defined in Section 4.4(a).
"Transfer Agent" means such bank, trust company or other Person (including the General Partner or one of its Affiliates) as may be appointed from time to time by the Partnership to act as registrar and transfer agent for any class of Partnership Interests;provided, that if no Transfer Agent is specifically designated for any class of Partnership Interests, the General Partner shall act in such capacity.
"Underwriter" means each Person named as an underwriter in Schedule I to the Underwriting Agreement who purchases Common Units pursuant thereto.
"Underwriting Agreement" means that certain Underwriting Agreement, dated as of , 2010, among the Underwriters, the Partnership, the General Partner and other parties thereto, providing for the purchase of Common Units by the Underwriters.
"Unit" means a Partnership Interest that is designated as a "Unit" and shall include Common Units and Subordinated Units but shall not include (i) the General Partner Interest or (ii) Incentive Distribution Rights.
"Unitholders" means the holders of Units.
"Unit Majority" means (i) during the Subordination Period, at least a majority of the Outstanding Common Units (excluding Common Units owned by the General Partner and its Affiliates), voting as a class, and at least a majority of the Outstanding Subordinated Units, voting as a class, and (ii) after the end of the Subordination Period, at least a majority of the Outstanding Common Units, voting as a single class.
"Unpaid MQD" is defined in Section 6.1(c)(i)(B).
"Unrealized Gain" attributable to any item of Partnership property means, as of any date of determination, the excess, if any, of (a) the fair market value of such property as of such date (as determined under Section 5.5(d)) over (b) the Carrying Value of such property as of such date (prior to any adjustment to be made pursuant to Section 5.5(d) as of such date).
"Unrealized Loss" attributable to any item of Partnership property means, as of any date of determination, the excess, if any, of (a) the Carrying Value of such property as of such date (prior to any adjustment to be made pursuant to Section 5.5(d) as of such date) over (b) the fair market value of such property as of such date (as determined under Section 5.5(d)).
"Unrecovered Initial Unit Price" means at any time, with respect to a Unit, the Initial Unit Price less the sum of all distributions constituting Capital Surplus theretofore made in respect of an Initial Common Unit and any distributions of cash (or the Net Agreed Value of any distributions in kind) in connection with the dissolution and liquidation of the Partnership theretofore made in respect of an Initial Common Unit, adjusted as the General Partner determines to be appropriate to give effect to any distribution, subdivision, combination or reorganization of such Units.
"Unrestricted Person" means (a) each Indemnitee, (b) each Partner, (c) each Person who is or was a member, partner, director, officer, employee or agent of any Group Member, a General Partner or any Departing General Partner or any Affiliate of any Group Member, a General Partner or any Departing General Partner and (d) any Person the General Partner designates as an "Unrestricted Person" for purposes of this Agreement.
"U.S. GAAP" means United States generally accepted accounting principles, as in effect from time to time, consistently applied.
"Wexford" means Wexford Capital LP, a Delaware limited partnership.
"Withdrawal Opinion of Counsel" is defined in Section 11.1(b).
"Working Capital Borrowings" means borrowings used solely for working capital purposes or to pay distributions to Partners, made pursuant to a credit facility, commercial paper facility or other similar financing arrangement; provided that when incurred it is the intent of the borrower to repay such borrowings within 12 months from sources other than additional Working Capital Borrowings.
Section 1.2 Construction. Unless the context requires otherwise: (a) any pronoun used in this Agreement shall include the corresponding masculine, feminine or neuter forms; (b) references to Articles and Sections refer to Articles and Sections of this Agreement; (c) the terms "include", "includes", "including" or words of like import shall be deemed to be followed by the words "without limitation"; and (d) the terms "hereof", "herein" or "hereunder" refer to this Agreement as a whole and not to any particular provision of this Agreement. The and headings contained in this Agreement are for reference purposes only, and shall not affect in any way the meaning or interpretation of this Agreement.
ARTICLE II
ORGANIZATION
Section 2.1 Formation. The General Partner and the Organizational Limited Partner have previously formed the Partnership as a limited partnership pursuant to the provisions of the Delaware Act and hereby amend and restate the original Agreement of Limited Partnership of Rhino Resource Partners LP in its entirety. This amendment and restatement shall become effective on the date of this Agreement. Except as expressly provided to the contrary in this Agreement, the rights, duties (including fiduciary duties), liabilities and obligations of the Partners and the administration, dissolution and termination of the Partnership shall be governed by the Delaware Act. All Partnership Interests shall constitute personal property of the owner thereof for all purposes.
Section 2.2 Name. The name of the Partnership shall be "Rhino Resource Partners LP". The Partnership's business may be conducted under any other name or names as determined by the General Partner, including the name of the General Partner. The words "Limited Partnership," "L.P.," "Ltd." or similar words or letters shall be included in the Partnership's name where necessary for the purpose of complying with the laws of any jurisdiction that so requires. The General Partner may change the name of the Partnership at any time and from time to time and shall notify the Limited Partners of such change in the next regular communication to the Limited Partners.
Section 2.3 Registered Office; Registered Agent; Principal Office; Other Offices. Unless and until changed by the General Partner, the registered office of the Partnership in the State of Delaware shall be located at 2711 Centerville Road, Suite 400, Wilmington, Delaware 19808, and the registered agent for service of process on the Partnership in the State of Delaware at such registered office shall be Corporation Trust Company. The principal office of the Partnership shall be located at 424 Lewis Hargett Circle, Suite 250, Lexington, Kentucky 40503, or such other place as the General Partner may from time to time designate by notice to the Limited Partners. The Partnership may maintain offices at such other place or places within or outside the State of Delaware as the General Partner determines to be necessary or appropriate. The address of the General Partner shall be 424 Lewis Hargett Circle, Suite 250, Lexington, Kentucky 40503, or such
other place as the General Partner may from time to time designate by notice to the Limited Partners.
Section 2.4 Purpose and Business. The purpose and nature of the business to be conducted by the Partnership shall be to (a) engage directly in, or enter into or form, hold and dispose of any corporation, partnership, joint venture, limited liability company or other arrangement to engage indirectly in, any business activity that is approved by the General Partner, in its sole discretion, and that lawfully may be conducted by a limited partnership organized pursuant to the Delaware Act and, in connection therewith, to exercise all of the rights and powers conferred upon the Partnership pursuant to the agreements relating to such business activity, and (b) do anything necessary or appropriate to the foregoing, including the making of capital contributions or loans to a Group Member;provided,however, that the General Partner shall not cause the Partnership to engage, directly or indirectly, in any business activity that the General Partner determines would be reasonably likely to cause the Partnership to be treated as an association taxable as a corporation or otherwise taxable as an entity for federal income tax purposes. To the fullest extent permitted by law, the General Partner shall have no duty or obligation to propose or approve, and may, in its sole discretion, decline to propose or approve, the conduct by the Partnership of any business.
Section 2.5 Powers. The Partnership shall be empowered to do any and all acts and things necessary, appropriate, proper, advisable, incidental to or convenient for the furtherance and accomplishment of the purposes and business described in Section 2.4 and for the protection and benefit of the Partnership.
Section 2.6 Term. The term of the Partnership commenced upon the filing of the Certificate of Limited Partnership in accordance with the Delaware Act and shall continue in existence until the dissolution of the Partnership in accordance with the provisions of Article XII. The existence of the Partnership as a separate legal entity shall continue until the cancellation of the Certificate of Limited Partnership as provided in the Delaware Act.
Section 2.7 Title to Partnership Assets. Title to Partnership assets, whether real, personal or mixed and whether tangible or intangible, shall be deemed to be owned by the Partnership as an entity, and no Partner or Assignee, individually or collectively, shall have any ownership interest in such Partnership assets or any portion thereof. Title to any or all of the Partnership assets may be held in the name of the Partnership, the General Partner, one or more of its Affiliates or one or more nominees, as the General Partner may determine. The General Partner hereby declares and warrants that any Partnership assets for which record title is held in the name of the General Partner or one or more of its Affiliates or one or more nominees shall be held by the General Partner or such Affiliate or nominee for the use and benefit of the Partnership in accordance with the provisions of this Agreement;provided,however, that the General Partner shall use reasonable efforts to cause record title to such assets (other than those assets in respect of which the General Partner determines that the expense and difficulty of conveyancing makes transfer of record title to the Partnership impracticable) to be vested in the Partnership as soon as reasonably practicable; provided, further , that, prior to the withdrawal or removal of the General Partner or as soon thereafter as practicable, the General Partner shall use reasonable efforts to effect the transfer of record title to the Partnership and, prior to any such transfer, will provide for the use of such assets in a manner satisfactory to the General Partner. All Partnership assets shall be recorded as the property of the Partnership in its books and records, irrespective of the name in which record title to such Partnership assets is held.
ARTICLE III
RIGHTS OF LIMITED PARTNERS
Section 3.1 Limitation of Liability. The Limited Partners and the Assignees shall have no liability under this Agreement except as expressly provided in this Agreement or the Delaware Act.
Section 3.2 Management of Business. No Limited Partner or Assignee, in its capacity as such, shall participate in the operation, management or control (within the meaning of the Delaware Act) of the Partnership's business, transact any business in the Partnership's name or have the power to sign documents for or otherwise bind the Partnership. Any action taken by any Affiliate of the General Partner or any officer, director, employee, manager, member, general partner, agent or trustee of the General Partner or any of its Affiliates, or any officer, director, employee, manager, member, general partner, agent or trustee of a Group Member, in its capacity as such, shall not be deemed to be participating in the control of the business of the Partnership by a limited partner of the Partnership (within the meaning of Section 17-303(a) of the Delaware Act) and shall not affect, impair or eliminate the limitations on the liability of the Limited Partners or Assignees under this Agreement.
Section 3.3 Outside Activities of the Limited Partners. Subject to the provisions of Section 7.5, which shall continue to be applicable to the Persons referred to therein, regardless of whether such Persons shall also be Limited Partners or Assignees, any Limited Partner shall be entitled to and may have business interests and engage in business activities in addition to those relating to the Partnership, including business interests and activities in direct competition with the Partnership Group. Neither the Partnership nor any of the other Partners or Assignees shall have any rights by virtue of this Agreement in any business ventures of any Limited Partner or Assignee.
Section 3.4 Rights of Limited Partners
(a) In addition to other rights provided by this Agreement or by applicable law, and except as limited by Section 3.4(b), each Limited Partner shall have the right, for a purpose reasonably related to such Limited Partner's interest as a Limited Partner in the Partnership, the reasonableness of which having been determined by the General Partner, upon reasonable written demand stating the purpose of such demand, and at such Limited Partner's own expense:
(i) to obtain true and full information regarding the status of the business and financial condition of the Partnership;
(ii) promptly after its becoming available, to obtain a copy of the Partnership's federal, state and local income tax returns for each year;
(iii) to obtain a current list of the name and last known business, residence or mailing address of each Partner;
(iv) to obtain a copy of this Agreement and the Certificate of Limited Partnership and all amendments thereto, together with copies of the executed copies of all powers of attorney pursuant to which this Agreement, the Certificate of Limited Partnership and all amendments thereto have been executed;
(v) to obtain true and full information regarding the amount of cash and a description and statement of the Net Agreed Value of any other Capital Contribution by each Partner and that each Partner has agreed to contribute in the future, and the date on which each became a Partner; and
(vi) to obtain such other information regarding the affairs of the Partnership as is just and reasonable.
(b) The General Partner may keep confidential from the Limited Partners, for such period of time as the General Partner deems reasonable, (i) any information that the General Partner reasonably believes to be in the nature of trade secrets or (ii) other information the disclosure of which the General Partner believes (A) is not in the best interests of the Partnership Group, (B) could damage the Partnership Group or its business or (C) that any Group Member is required by law or by agreement with any third party to keep confidential (other than agreements with Affiliates of the Partnership the primary purpose of which is to circumvent the obligations set forth in this Section 3.4).
ARTICLE IV
CERTIFICATES; RECORD HOLDERS; TRANSFER OF PARTNERSHIP INTERESTS;
REDEMPTION OF PARTNERSHIP INTERESTS
Section 4.1 Certificates. Notwithstanding anything otherwise to the contrary herein, unless the General Partner shall determine otherwise in respect of some or all of any or all classes of Partnership Interests, Partnership Interests shall not be evidenced by certificates. Certificates that may be issued shall be executed on behalf of the Partnership by the Chairman of the Board, President or any Executive Vice President or Vice President and the Chief Financial Officer or the Secretary or any Assistant Secretary of the General Partner. If a Transfer Agent has been appointed for a class of Partnership Interests, no Certificate for such class of Partnership Interests shall be valid for any purpose until it has been countersigned by the Transfer Agent; provided, however, that if the General Partner elects to cause the Partnership to issue Partnership Interests of such class in global form, the Certificate shall be valid upon receipt of a certificate from the Transfer Agent certifying that the Partnership Interests have been duly registered in accordance with the directions of the Partnership. Subject to the requirements of Section 6.7(c), if Common Units are evidenced by Certificates, on or after the date on which Subordinated Units are converted into Common Units pursuant to the terms of Section 5.7, the Record Holders of such Subordinated Units (i) if the Subordinated Units are evidenced by Certificates, may exchange such Certificates for Certificates evidencing Common Units or (ii) if the Subordinated Units are not evidenced by Certificates, shall be issued Certificates evidencing Common Units.
Section 4.2 Mutilated, Destroyed, Lost or Stolen Certificates.
(a) If any mutilated Certificate is surrendered to the Transfer Agent, the appropriate officers of the General Partner on behalf of the Partnership shall execute, and the Transfer Agent shall countersign and deliver in exchange therefor, a new Certificate evidencing the same number and type of Partnership Interests as the Certificate so surrendered.
(b) The appropriate officers of the General Partner on behalf of the Partnership shall execute and deliver, and the Transfer Agent shall countersign, a new Certificate in place of any Certificate previously issued if the Record Holder of the Certificate:
(i) makes proof by affidavit, in form and substance satisfactory to the General Partner, that a previously issued Certificate has been lost, destroyed or stolen;
(ii) requests the issuance of a new Certificate before the General Partner has notice that the Certificate has been acquired by a purchaser for value in good faith and without notice of an adverse claim;
(iii) if requested by the General Partner, delivers to the General Partner a bond, in form and substance satisfactory to the General Partner, with surety or sureties and with fixed or open penalty as the General Partner may direct to indemnify the Partnership, the Partners, the General Partner and the Transfer Agent against any claim that may be made on account of the alleged loss, destruction or theft of the Certificate; and
(iv) satisfies any other reasonable requirements imposed by the General Partner.
If a Limited Partner or Assignee fails to notify the General Partner within a reasonable period of time after such Limited Partner or Assignee has notice of the loss, destruction or theft of a Certificate, and a transfer of the Limited Partner Interests represented by the Certificate is registered before the Partnership, the General Partner or the Transfer Agent receives such notification, the Limited Partner or the Assignee shall be precluded from making any claim against the Partnership, the General Partner or the Transfer Agent for such transfer or for a new Certificate.
(c) As a condition to the issuance of any new Certificate under this Section 4.2, the General Partner may require the payment of a sum sufficient to cover any tax or other governmental charge that may be imposed in relation thereto and any other expenses (including the fees and expenses of the Transfer Agent) reasonably connected therewith.
Section 4.3 Record Holders. The Partnership shall be entitled to recognize the Record Holder as the Partner or Assignee with respect to any Partnership Interest and, accordingly, shall not be bound to recognize any equitable or other claim to, or interest in, such Partnership Interest on the part of any other Person, regardless of whether the Partnership shall have actual or other notice thereof, except as otherwise provided by law or any applicable rule, regulation, guideline or requirement of any National Securities Exchange on which such Partnership Interests are listed or admitted to trading. Without limiting the foregoing, when a Person (such as a broker, dealer, bank, trust company or clearing corporation or an agent of any of the foregoing) is acting as nominee, agent or in some other representative capacity for another Person in acquiring and/or holding Partnership Interests, as between the Partnership on the one hand, and such other Persons on the other, such representative Person shall be (a) the Record Holder of such Partnership Interest and (b) bound by this Agreement and shall have the rights and obligations of a Partner or Assignee, as the case may be, hereunder as, and to the extent, provided herein.
Section 4.4 Transfer Generally.
(a) The term "transfer," when used in this Agreement with respect to a Partnership Interest, shall mean a transaction (i) by which the General Partner assigns its General Partner Interest to another Person, and includes a sale, assignment, gift, pledge, encumbrance, hypothecation, mortgage, exchange or any other disposition by law or otherwise or (ii) by which the holder of a Limited Partner Interest assigns such Limited Partner Interest to another Person who is or becomes a Limited Partner or an Assignee, and includes a sale,
assignment, gift, exchange or any other disposition by law or otherwise, excluding a pledge, encumbrance, hypothecation or mortgage but including any transfer upon foreclosure of any pledge, encumbrance, hypothecation or mortgage.
(b) No Partnership Interest shall be transferred, in whole or in part, except in accordance with the terms and conditions set forth in this Article IV. Any transfer or purported transfer of a Partnership Interest not made in accordance with this Article IV shall be, to the fullest extent permitted by law, null and void.
(c) Nothing contained in this Agreement shall be construed to prevent a disposition by any stockholder, member, partner or other owner of the General Partner or any Limited Partner of any or all of the shares of stock, membership interests, partnership interests or other ownership interests in the General Partner or Limited Partner and the term "transfer" shall not mean any such disposition.
Section 4.5 Registration and Transfer of Limited Partner Interests.
(a) The General Partner shall keep or cause to be kept on behalf of the Partnership a register in which, subject to such reasonable regulations as it may prescribe and subject to the provisions of Section 4.5(b), the Partnership will provide for the registration and transfer of Limited Partner Interests.
(b) The Partnership shall not recognize any transfer of Limited Partner Interests evidenced by Certificates until the Certificates evidencing such Limited Partner Interests are surrendered for registration of transfer and any such Certificates are accompanied by a Transfer Application, properly completed and including a Citizenship Certification, duly executed by the transferee (or the transferee's attorney-in-fact duly authorized in writing). No charge shall be imposed by the General Partner for such transfer; provided, that as a condition to the issuance of any new Certificate under this Section 4.5, the General Partner may require the payment of a sum sufficient to cover any tax or other governmental charge that may be imposed with respect thereto. Upon surrender of a Certificate for registration of transfer of any Limited Partner Interests evidenced by a Certificate, and subject to the provisions hereof, the appropriate officers of the General Partner on behalf of the Partnership shall execute and deliver, and in the case of Certificates evidencing Limited Partner Interests for which a Transfer Agent has been appointed, the Transfer Agent shall countersign and deliver, in the name of the holder or the designated transferee or transferees, as required pursuant to the holder's instructions, one or more new Certificates evidencing the same aggregate number and type of Limited Partner Interests as was evidenced by the Certificate so surrendered.
(c) By acceptance of the transfer of any Limited Partner Interests in accordance with this Section 4.5 and except as provided in Section 4.8, each transferee of a Limited Partner Interest (including any nominee holder or an agent or representative acquiring such Limited Partner Interests for the account of another Person) (i) shall be deemed to have requested admission as a Substituted Limited Partner, if such transferee has completed and delivered a Transfer Application (including a Citizenship Certification), (ii) shall become bound, and shall be deemed to have agreed to be bound, by the terms of this Agreement, (iii) represents that the transferee has the capacity, power and authority to enter into this Agreement and (iv) makes the consents, acknowledgements and waivers contained in this Agreement, all with or without execution of this Agreement by such Person. The transfer of any Limited Partner Interests and the admission of any new Limited Partner shall not constitute an amendment to this Agreement.
(d) Until admitted as a Substituted Limited Partner pursuant to Section 10.2, the Record Holder of a Limited Partner Interest shall be an Assignee in respect of such Limited Partner Interest. Limited Partners may include custodians, nominees or any other individual or entity in its own or any representative capacity.
(e) Subject to (i) the foregoing provisions of this Section 4.5, (ii) Section 4.3, (iii) Section 4.7, (iv) with respect to any class or series of Limited Partner Interests, the provisions of any statement of designations or an amendment to this Agreement establishing such class or series, (v) any contractual provisions binding on any Limited Partner and (vi) provisions of applicable law including the Securities Act, Limited Partner Interests (other than the Incentive Distribution Rights) shall be freely transferable.
(f) The General Partner and its Affiliates shall have the right at any time to transfer their Subordinated Units, Common Units and Incentive Distribution Rights to one or more Persons.
Section 4.6 Transfer of the General Partner's General Partner Interest.
(a) Subject to Section 4.6(c) below, prior to JuneSeptember 30, 2020, the General Partner shall not transfer all or any part of its General Partner Interest to a Person unless such transfer (i) has been approved by the prior written consent or vote of the holders of at least a majority of the Outstanding Common Units (excluding Common Units held by the General Partner and its Affiliates) or (ii) is of all, but not less than all, of its General Partner Interest to (A) an Affiliate of the General Partner (other than an individual) or (B) another Person (other than an individual) in connection with the merger or consolidation of the General Partner with or into such other Person or the transfer by the General Partner of all or substantially all of its assets to such other Person.
(b) Subject to Section 4.6(c) below, on or after JuneSeptember 30, 2020, the General Partner may at its option transfer all or any part of its General Partner Interest without Unitholder approval.
(c) Notwithstanding anything herein to the contrary, no transfer by the General Partner of all or any part of its General Partner Interest to another Person shall be permitted unless (i) the transferee agrees to assume the rights and duties of the General Partner under this Agreement and to be bound by the provisions of this Agreement, (ii) the Partnership receives an Opinion of Counsel that such transfer would not result in the loss of limited liability under the Delaware Act of any Limited Partner or cause the Partnership to be treated as an association taxable as a corporation or otherwise to be taxed as an entity for federal income tax purposes (to the extent not already so treated or taxed) and (iii) such transferee also agrees to purchase all (or the appropriate portion thereof, if applicable) of the partnership or membership interest held by the General Partner as the general partner or managing member, if any, of each other Group Member. In the case of a transfer pursuant to and in compliance with this Section 4.6, the transferee or successor (as the case may be) shall, subject to compliance with the terms of Section 10.3, be admitted to the Partnership as the General Partner effective immediately prior to the transfer of the General Partner Interest, and the business of the Partnership shall continue without dissolution.
Section 4.7 Restrictions on Transfers.
(a) Except as provided in Section 4.7(d) below, but notwithstanding the other provisions of this Article IV, no transfer of any Partnership Interests shall be made if such transfer would (i) violate the then applicable federal or state securities laws or rules and
regulations of the Commission, any state securities commission or any other governmental authority with jurisdiction over such transfer, (ii) terminate the existence or qualification of the Partnership under the laws of the jurisdiction of its formation, or (iii) cause the Partnership to be treated as an association taxable as a corporation or otherwise to be taxed as an entity for federal income tax purposes (to the extent not already so treated or taxed).
(b) The General Partner may impose restrictions on the transfer of Partnership Interests if it determines, with the advice of counsel, that such restrictions are necessary or advisable to (i) avoid a significant risk of the Partnership becoming taxable as a corporation or otherwise becoming taxable as an entity for federal income tax purposes or (ii) preserve the uniformity of the Limited Partner Interests (or any class or classes thereof). The General Partner may impose such restrictions by amending this Agreement;provided,however, that any amendment that would result in the delisting or suspension of trading of any class of Limited Partner Interests on the principal National Securities Exchange on which such class of Limited Partner Interests is then listed or admitted to trading must be approved, prior to such amendment being effected, by the holders of at least a majority of the Outstanding Limited Partner Interests of such class.
(c) The transfer of a Subordinated Unit that has converted into a Common Unit shall be subject to the restrictions imposed by Section 6.7.
(d) Nothing contained in this Article IV, or elsewhere in this Agreement, shall preclude the settlement of any transactions involving Partnership Interests entered into through the facilities of any National Securities Exchange on which such Partnership Interests are listed or admitted to trading.
(e) Each certificate evidencing Partnership Interests shall bear a conspicuous legend in substantially the following form:
THE HOLDER OF THIS SECURITY ACKNOWLEDGES FOR THE BENEFIT OF RHINO RESOURCE PARTNERS LP THAT THIS SECURITY MAY NOT BE SOLD, OFFERED, RESOLD, PLEDGED OR OTHERWISE TRANSFERRED IF SUCH TRANSFER WOULD (A) VIOLATE THE THEN APPLICABLE FEDERAL OR STATE SECURITIES LAWS OR RULES AND REGULATIONS OF THE SECURITIES AND EXCHANGE COMMISSION, ANY STATE SECURITIES COMMISSION OR ANY OTHER GOVERNMENTAL AUTHORITY WITH JURISDICTION OVER SUCH TRANSFER, (B) TERMINATE THE EXISTENCE OR QUALIFICATION OF RHINO RESOURCE PARTNERS LP UNDER THE LAWS OF THE STATE OF DELAWARE, OR (C) CAUSE RHINO RESOURCE PARTNERS LP TO BE TREATED AS AN ASSOCIATION TAXABLE AS A CORPORATION OR OTHERWISE TO BE TAXED AS AN ENTITY FOR FEDERAL INCOME TAX PURPOSES (TO THE EXTENT NOT ALREADY SO TREATED OR TAXED). RHINO GP LLC, THE GENERAL PARTNER OF RHINO RESOURCE PARTNERS LP, MAY IMPOSE ADDITIONAL RESTRICTIONS ON THE TRANSFER OF THIS SECURITY IF IT RECEIVES AN OPINION OF COUNSEL THAT SUCH RESTRICTIONS ARE NECESSARY TO AVOID A SIGNIFICANT RISK OF RHINO RESOURCE PARTNERS LP BECOMING TAXABLE AS A CORPORATION OR OTHERWISE BECOMING TAXABLE AS AN ENTITY FOR FEDERAL INCOME TAX PURPOSES. THE RESTRICTIONS SET FORTH ABOVE SHALL NOT PRECLUDE THE SETTLEMENT OF ANY TRANSACTIONS INVOLVING THIS SECURITY ENTERED INTO THROUGH THE FACILITIES OF ANY NATIONAL SECURITIES EXCHANGE ON WHICH THIS SECURITY IS LISTED OR ADMITTED TO TRADING.
Section 4.8 Eligibility Certificates; Ineligible Holders.
(a) (i) If an Assignee fails to furnish a properly completed Citizenship Certification in a Transfer Application or if, upon receipt of such Citizenship Certification or otherwise, the General Partner determines that such Assignee is not an Eligible Citizen Holder, the Limited Partner Interests owned by such Assignee shall be subject to redemption in accordance with the provisions of Section 4.9.
(ii) The General Partner may request any Limited Partner or Assignee to furnish to the General Partner, within 30 days after receipt of such request, an executed Citizenship Certification or such other information concerning his nationality, citizenship or other related status (or, if the Limited Partner or Assignee is a nominee holding for the account of another Person, the nationality, citizenship or other related status of such Person) as the General Partner may request. If a Limited Partner or Assignee fails to furnish to the General Partner within the aforementioned 30-day period such Citizenship Certification or other requested information or if upon receipt of such Citizenship Certification or other requested information the General Partner determines that a Limited Partner or Assignee is not an Eligible Citizen Holder, the Limited Partner Interests owned by such Limited Partner or Assignee shall be subject to redemption in accordance with the provisions of Section 4.9. In addition, the General Partner may require that the status of any such Limited Partner or Assignee be changed to that of an Ineligible Citizen Holder and, thereupon, such Ineligible Citizen Holder shall cease to be a Partner and shall have no voting rights (whether arising hereunder, under the Delaware Act, at law, in equity or otherwise) in respect of his Limited Partner Interests or the Partnership. The General Partner shall be substituted for such Ineligible Citizen Holder as the Limited Partner or Assignee in respect of such Ineligible Citizen Holder's Limited Partner Interests and shall vote such Limited Partner Interests in accordance with Section 4.8(c).
(b) (i) If at any time the General Partner determines, with the advice of counsel, that the Partnership's status other than as an association taxable as a corporation for U.S. federal income tax purposes or the failure of the Partnership otherwise to be subject to an entity-level tax for U.S. federal, state or local income tax purposes, coupled with the tax status (or lack of proof of the U.S. federal income tax status) of one or more Limited Partners or Assignees, has or will reasonably likely have a material adverse effect on the maximum applicable rate that can be charged to customers by Subsidiaries of the Partnership, then the General Partner may adopt such amendments to this Agreement as it determines to be necessary or advisable to obtain such proof of the federal income tax status of the Limited Partners and Assignees and, to the extent relevant, their beneficial owners, as the General Partner determines to be necessary to establish those Limited Partners and Assignees whose U.S. federal income tax status does not or would not have a material adverse effect on the maximum applicable rate that can be charged to customers by Subsidiaries of the Partnership.
(ii) Such amendments may include provisions requiring all Limited Partners and Assignees to certify as to their (and their beneficial owners') status as Rate Eligible Holders upon demand and on a regular basis, as determined by the General Partner, and may require transferees of Units to so certify prior to being admitted to the Partnership as a Substituted Limited Partner (any such required certificate, a "Rate Eligibility Certification").
(iii) Such amendments may provide that any Limited Partner or Assignee who fails to furnish to the General Partner within a reasonable period requested proof of its (and
its beneficial owners') status as a Rate Eligible Holder or if upon receipt of such Rate Eligibility Certification or other requested information the General Partner determines that a Limited Partner or Assignee is not a Rate Eligible Holder (such a Limited Partner or Assignee a "Rate Ineligible Holder"), the Limited Partner Interests owned by such Limited Partner or Assignee shall be subject to redemption in accordance with the provisions of Section 4.9. In addition, the General Partner shall be substituted for all Limited Partners and Assignees that are Rate Ineligible Holders as the Limited Partner or Assignee in respect of the Rate Ineligible Holder's Limited Partner Interests.
(c) The General Partner shall, in exercising voting rights in respect of Limited Partner Interests held by it on behalf of Ineligible Holders, distribute the votes in the same ratios as the votes of Limited Partners (including the General Partner and its Affiliates) in respect of Limited Partner Interests other than those of Ineligible Holders are cast, either for, against or abstaining as to the matter.
(d) Upon dissolution of the Partnership, an Ineligible Holder shall have no right to receive a distribution in kind pursuant to Section 12.4 but shall be entitled to the cash equivalent thereof, and the Partnership shall provide cash in exchange for an assignment of the Ineligible Holder's share of any distribution in kind. Such payment and assignment shall be treated for Partnership purposes as a purchase by the Partnership from the Ineligible Holder of his Limited Partner Interest (representing his right to receive his share of such distribution in kind).
(e) At any time after he can and does certify that he has become an Eligible Holder, an Ineligible Holder may, upon application to the General Partner, request that with respect to any Limited Partner Interests of such Ineligible Holder not redeemed pursuant to Section 4.9, such Ineligible Holder be admitted as a Substituted Limited Partner, and upon approval of the General Partner, such Ineligible Holder shall be admitted as a Substituted Limited Partner and shall no longer constitute an Ineligible Holder and the General Partner shall cease to be deemed to be the Limited Partner or Assignee in respect of the Ineligible Holder's Limited Partner Interests.
Section 4.9 Redemption of Partnership Interests of Ineligible Holders.
(a) If at any time a Limited Partner or Assignee fails to furnish an Eligibility Certification or other information requested within the time period specified in Section 4.8 or in amendments adopted pursuant to Section 4.8(b) or in a Transfer Application, or if upon receipt of such Eligibility Certification, Transfer Application or other information, the General Partner determines, with the advice of counsel, that a Limited Partner or Assignee is an Ineligible Holder, the Partnership may, unless the Limited Partner or Assignee establishes to the satisfaction of the General Partner that such Limited Partner or Assignee is not an Ineligible Holder or has transferred his Limited Partner Interests to a Person who is an Eligible Holder and who furnishes an Eligibility Certification, Transfer Application or other information, as the case may be, to the General Partner prior to the date fixed for redemption as provided below, redeem the Limited Partner Interest of such Limited Partner or Assignee as follows:
(i) The General Partner shall, not later than the 30th day before the date fixed for redemption, give notice of redemption to the Limited Partner or Assignee, at his last address designated on the records of the Partnership or the Transfer Agent, by registered or certified mail, postage prepaid. The notice shall be deemed to have been given when so mailed. The notice shall specify the Redeemable Interests, the date fixed for redemption, the place of payment, that payment of the redemption price will be made
upon redemption of the Redeemable Interests (or, if later in the case of Redeemable Interests evidenced by Certificates, upon surrender of the Certificate evidencing the Redeemable Interests and that on and after the date fixed for redemption no further allocations or distributions to which the Limited Partner would otherwise be entitled in respect of the Redeemable Interests will accrue or be made.
(ii) The aggregate redemption price for Redeemable Interests shall be an amount equal to the Current Market Price (the date of determination of which shall be the date fixed for redemption) of Limited Partner Interests of the class to be so redeemed multiplied by the number of Limited Partner Interests of each such class included among the Redeemable Interests. The redemption price shall be paid, as determined by the General Partner, in cash or by delivery of a promissory note of the Partnership in the principal amount of the redemption price, bearing interest at the rate of 8% annually and payable in three equal annual installments of principal together with accrued interest, commencing one year after the redemption date.
(iii) The Limited Partner or Assignee or his duly authorized representative shall be entitled to receive the payment for the Redeemable Interests at the place of payment specified in the notice of redemption on the redemption date (or, if later in the case of Redeemable Interests evidenced by Certificates, upon surrender by or on behalf of the Limited Partner or Assignee at the place specified in the notice of redemption, of the Certificate evidencing the Redeemable Interests, duly endorsed in blank or accompanied by an assignment duly executed in blank).
(iv) After the redemption date, Redeemable Interests shall no longer constitute issued and Outstanding Limited Partner Interests.
(b) The provisions of this Section 4.9 shall also be applicable to Limited Partner Interests held by a Limited Partner or Assignee as nominee of a Person determined to be other than an Eligible Holder.
(c) Nothing in this Section 4.9 shall prevent the recipient of a notice of redemption from transferring his Limited Partner Interest before the redemption date if such transfer is otherwise permitted under this Agreement. Upon receipt of notice of such a transfer, the General Partner shall withdraw the notice of redemption, provided the transferee of such Limited Partner Interest certifies to the satisfaction of the General Partner that he is an Eligible Holder. If the transferee fails to make such certification, such redemption shall be effected from the transferee on the original redemption date.
ARTICLE V
CAPITAL CONTRIBUTIONS AND ISSUANCE OF PARTNERSHIP INTERESTS
Section 5.1 Organizational Contributions. In connection with the formation of the Partnership under the Delaware Act, the General Partner made an initial Capital Contribution to the Partnership in the amount of $20.00 in exchange for a General Partner Interest equal to a 2% Percentage Interest and has been admitted as the General Partner of the Partnership. The Organizational Limited Partner made an initial Capital Contribution to the Partnership in the amount of $980.00 in exchange for a Limited Partner Interest equal to a 98% Percentage Interest and has been admitted as a Limited Partner of the Partnership. As of the Closing Date, and effective with the admission of another Limited Partner to the Partnership, the interests of the Organizational Limited Partner shall be redeemed as provided in the Contribution Agreement and the initial Capital Contributions of (i) the Organizational Limited Partner and (ii) the General
Partner shall thereupon be refunded. Ninety-eight percent of any interest or other profit that may have resulted from the investment or other use of such initial Capital Contributions shall be allocated and distributed to the Organizational Limited Partner, and the balance thereof shall be allocated and distributed to the General Partner.
Section 5.2 Contributions by the General Partner and its Affiliates.
(a) On the Closing Date and pursuant to the Contribution Agreement: (i) the General Partner shall contribute to the Partnership, as a Capital Contribution, the GP Contribution (as defined in the Contribution Agreement), in exchange for (A) the continuation of its General Partner Interest equal to a 2% Percentage Interest (after giving effect to any exercise of the Over-Allotment Option and the Deferred Issuance and Distribution), subject to all of the rights, privileges and duties of the General Partner under this Agreement, and (B)(ii) the Partnership shall issue to the General Partner the Incentive Distribution Rights as an incentive fee to incentivize the General Partner to expand the profitability of the business of the Partnership Group and (ii)to increase distributions to Limited Partners, and (iii) the Organizational Limited Partner shall contribute to the Partnership, as a Capital Contribution, the Holdings Contribution (as defined in the Contribution Agreement) in exchange for 8,084,5008,666,400 Common Units, 12,397,000 Subordinated Units and the right to receive the Deferred Issuance and Distribution.
(b) Upon the issuance of any additional Limited Partner Interests by the Partnership (other than the Common Units issued in the Initial Offering, the Common Units and Subordinated Units issued pursuant to Section 5.2(a) (including any common unitsCommon Units issued pursuant to the Deferred Issuance and Distribution), the Common Units issued upon conversion of the Subordinated Units and any Common Units issued pursuant to Section 5.11), the General Partner may, in order to maintain its Percentage Interest, make additional Capital Contributions in an amount equal to the product obtained by multiplying (i) the quotient determined by dividing (A) the General Partner's Percentage Interest by (B) 100 less the General Partner's Percentage Interest times (ii) the amount contributed to the Partnership by the Limited Partners in exchange for such additional Limited Partner Interests. Except as set forth in Section 12.8, the General Partner shall not be obligated to make any additional Capital Contributions to the Partnership.
Section 5.3 Contributions by Initial Limited Partners.
(a) On the Closing Date and pursuant to the Underwriting Agreement, each Underwriter shall contribute cash to the Partnership in exchange for the issuance by the Partnership of Common Units to each Underwriter, all as set forth in the Underwriting Agreement.
(b) Upon the exercise, if any, of the Over-Allotment Option, each Underwriter shall contribute cash to the Partnership in exchange for the issuance by the Partnership of Common Units to each Underwriter, all as set forth in the Underwriting Agreement.
(c) No Limited Partner will be required to make any additional Capital Contribution to the Partnership pursuant to this Agreement.
Section 5.4 Interest and Withdrawal. No interest shall be paid by the Partnership on Capital Contributions. No Partner shall be entitled to the withdrawal or return of its Capital Contribution, except to the extent, if any, that distributions made pursuant to this Agreement or upon liquidation of the Partnership may be considered as such by law and then only to the extent provided for in this Agreement. Except to the extent expressly provided in this
Agreement, no Partner shall have priority over any other Partner either as to the return of Capital Contributions or as to profits, losses or distributions. Any such return shall be a compromise to which all Partners agree within the meaning of Section 17-502(b) of the Delaware Act.
Section 5.5 Capital Accounts.
(a) The Partnership shall maintain for each Partner (or a beneficial owner of Partnership Interests held by a nominee in any case in which the nominee has furnished the identity of such owner to the Partnership in accordance with Section 6031(c) of the Code or any other method acceptable to the General Partner) owning a Partnership Interest a separate Capital Account with respect to such Partnership Interest in accordance with the rules of Treasury Regulation Section 1.704-1(b)(2)(iv). Such Capital Account shall be increased by (i) the amount of all Capital Contributions made to the Partnership with respect to such Partnership Interest and (ii) all items of Partnership income and gain (including income and gain exempt from tax) computed in accordance with Section 5.5(b) and allocated with respect to such Partnership Interest pursuant to Section 6.1, and decreased by (x) the amount of cash or Net Agreed Value of all actual and deemed distributions of cash or property made with respect to such Partnership Interest and (y) all items of Partnership deduction and loss computed in accordance with Section 5.5(b) and allocated with respect to such Partnership Interest pursuant to Section 6.1.
(b) For purposes of computing the amount of any item of income, gain, loss or deduction that is to be allocated pursuant to Article VI and is to be reflected in the Partners' Capital Accounts, the determination, recognition and classification of any such item shall be the same as its determination, recognition and classification for federal income tax purposes (including any method of depreciation, cost recovery or amortization used for that purpose),provided, that:
(i) Solely for purposes of this Section 5.5, the Partnership shall be treated as owning directly its proportionate share (as determined by the General Partner based upon the provisions of the applicable Group Member Agreement) of all property owned by (x) any other Group Member that is classified as a partnership for federal income tax purposes and (y) any other partnership, limited liability company, unincorporated business or other entity classified as a partnership for federal income tax purposes of which a Group Member is, directly or indirectly, a partner, member or other equity holder.
(ii) All fees and other expenses incurred by the Partnership to promote the sale of (or to sell) a Partnership Interest that can neither be deducted nor amortized under Section 709 of the Code, if any, shall, for purposes of Capital Account maintenance, be treated as an item of deduction at the time such fees and other expenses are incurred and shall be allocated among the Partners pursuant to Section 6.1.
(iii) Except as otherwise provided in Treasury Regulation Section 1.704-1(b)(2)(iv)(m), the computation of all items of income, gain, loss and deduction shall be made without regard to any election under Section 754 of the Code that may be made by the Partnership and, as to those items described in Section 705(a)(1)(B) or 705(a)(2)(B) of the Code, without regard to the fact that such items are not includable in gross income or are neither currently deductible nor capitalized for federal income tax purposes. To the extent an adjustment to the adjusted tax basis of any Partnership asset pursuant to Section 734(b) or 743(b) of the Code is required, pursuant to Treasury Regulation Section 1.704-1(b)(2)(iv)(m), to be taken into
account in determining Capital Accounts, the amount of such adjustment in the Capital Accounts shall be treated as an item of gain or loss.
(iv) Any income, gain or loss attributable to the taxable disposition of any Partnership property shall be determined as if the adjusted basis of such property as of
such date of disposition were equal in amount to the Partnership's Carrying Value with respect to such property as of such date.
(v) In accordance with the requirements of Section 704(b) of the Code, any deductions for depreciation, cost recovery or amortization attributable to any Contributed Property shall be determined as if the adjusted basis of such property on the date it was acquired by the Partnership were equal to the Agreed Value of such property. Upon an adjustment pursuant to Section 5.5(d) to the Carrying Value of any Partnership property subject to depreciation, cost recovery or amortization, any further deductions for such depreciation, cost recovery or amortization attributable to such property shall be determined under the rules prescribed by Treasury Regulation Section 1.704-3(d)(2) as if the adjusted basis of such property were equal to the Carrying Value of such property immediately following such adjustment.
(vi) The Gross Liability Value of each Liability of the Partnership described in Treasury Regulation Section 1.752-7(b)(3)(i) shall be adjusted at such times as provided in this Agreement for an adjustment to Carrying Values. The amount of any such adjustment shall be treated for purposes hereof as an item of loss (if the adjustment increases the Carrying Value of such Liability of the Partnership) or an item of gain (if the adjustment decreases the Carrying Value of such Liability of the Partnership).
(c) (i) A transferee of a Partnership Interest shall succeed to a pro rata portion of the Capital Account of the transferor relating to the Partnership Interest so transferred.
(ii) Subject to Section 6.7(c), immediately prior to the transfer of a Subordinated Unit or of a Subordinated Unit that has converted into a Common Unit pursuant to Section 5.7 by a holder thereof (other than a transfer to an Affiliate unless the General Partner elects to have this subparagraph 5.5(c)(ii) apply), the Capital Account maintained for such Person with respect to its Subordinated Units or converted Subordinated Units will (A) first, be allocated to the Subordinated Units or converted Subordinated Units to be transferred in an amount equal to the product of (x) the number of such Subordinated Units or converted Subordinated Units to be transferred and (y) the Per Unit Capital Amount for a Common Unit, and (B) second, any remaining balance in such Capital Account will be retained by the transferor, regardless of whether it has retained any Subordinated Units or converted Subordinated Units. Following any such allocation, the transferor's Capital Account, if any, maintained with respect to the retained Subordinated Units or retained converted Subordinated Units, if any, will have a balance equal to the amount allocated under clause (B) hereinabove, and the transferee's Capital Account established with respect to the transferred Subordinated Units or transferred converted Subordinated Units will have a balance equal to the amount allocated under clause (A) hereinabove.
(d) (i) Consistent with Treasury Regulation Section 1.704-1(b)(2)(iv)(f), on an issuance of additional Partnership Interests for cash or Contributed Property, the issuance of Partnership Interests as consideration for the provision of services, or the conversion of the General Partner's Combined Interest to Common Units pursuant to Section 11.3(b), the Carrying Value of each Partnership property immediately prior to such issuance shall be adjusted upward or downward to reflect any Unrealized Gain or Unrealized Loss attributable to such
Partnership property, and any such Unrealized Gain or Unrealized Loss shall be treated, for purposes of maintaining Capital Accounts, as if it had been recognized on an actual sale of each such property for an amount equal to its fair market value immediately prior to such issuance and had been allocated among the Partners at such time pursuant to Section 6.1 in the same manner as any item of gain or loss actually recognized following an event giving
rise to the dissolution of the Partnership would have been allocated;provided, however, that in the event of an issuance of Partnership Interests for a de minimis amount of cash or Contributed Property, or in the event of an issuance of a de minimis amount of Partnership Interests as consideration for the provision of services, the General Partner may determine that such adjustments are unnecessary for the proper administration of the Partnership. In determining such Unrealized Gain or Unrealized Loss, the aggregate fair market value of all Partnership property (including cash or cash equivalents) immediately prior to the issuance of additional Partnership Interests shall be determined by the General Partner using such method of valuation as it may adopt. In making its determination of the fair market values of individual properties, the General Partner may determine that it is appropriate to first determine an aggregate value for the Partnership, based on the current trading price of the Common Units, and taking fully into account the fair market value of the Partnership Interests of all Partners at such time, and then allocate such aggregate value among the individual properties of the Partnership (in such manner as it determines appropriate).
(ii) In accordance with Treasury Regulation Section 1.704-1(b)(2)(iv)(f), immediately prior to any actual or deemed distribution to a Partner of any Partnership property (other than a distribution of cash that is not in redemption or retirement of a Partnership Interest), the Carrying Value of all Partnership property shall be adjusted upward or downward to reflect any Unrealized Gain or Unrealized Loss attributable to such Partnership property, and any such Unrealized Gain or Unrealized Loss shall be treated, for purposes of maintaining Capital Accounts, as if it had been recognized on an actual sale of each such property immediately prior to such distribution for an amount equal to its fair market value, and had been allocated among the Partners, at such time, pursuant to Section 6.1 in the same manner as any item of gain or loss actually recognized following an event giving rise to the dissolution of the Partnership would have been allocated. In determining such Unrealized Gain or Unrealized Loss the aggregate fair market value of all Partnership property (including cash or cash equivalents) immediately prior to a distribution shall (A) in the case of an actual distribution that is not made pursuant to Section 12.4 or in the case of a deemed distribution, be determined in the same manner as that provided in Section 5.5(d)(i) or (B) in the case of a liquidating distribution pursuant to Section 12.4, be determined by the Liquidator using such method of valuation as it may adopt.
Section 5.6 Issuances of Additional Partnership Interests.
(a) The Partnership may issue additional Partnership Interests and options, rights, warrants and appreciation rights relating to the Partnership Interests (including as described in Section 7.4(c)) for any Partnership purpose at any time and from time to time to such Persons for such consideration and on such terms and conditions as the General Partner shall determine, all without the approval of any Limited Partners.
(b) Each additional Partnership Interest authorized to be issued by the Partnership pursuant to Section 5.6(a) may be issued in one or more classes, or one or more series of any such classes, with such designations, preferences, rights, powers and duties (which may be senior to existing classes and series of Partnership Interests), as shall be fixed by the General Partner, including (i) the right to share in Partnership profits and losses or items
thereof; (ii) the right to share in Partnership distributions; (iii) the rights upon dissolution and liquidation of the Partnership; (iv) whether, and the terms and conditions upon which, the Partnership may or shall be required to redeem the Partnership Interest (including sinking fund provisions); (v) whether such Partnership Interest is issued with the privilege of conversion or exchange and, if so, the terms and conditions of such conversion or
exchange; (vi) the terms and conditions upon which each Partnership Interest will be issued, evidenced by certificates and assigned or transferred; (vii) the method for determining the Percentage Interest as to such Partnership Interest; and (viii) the right, if any, of each such Partnership Interest to vote on Partnership matters, including matters relating to the relative rights, preferences and privileges of such Partnership Interest.
(c) The General Partner shall take all actions that it determines to be necessary or appropriate in connection with (i) each issuance of Partnership Interests and options, rights, warrants and appreciation rights relating to Partnership Interests pursuant to this Section 5.6, including Common Units issued in connection with the Deferred Issuance and Distribution, (ii) the conversion of the Combined Interest into Units pursuant to the terms of this Agreement, (iii) the issuance of Common Units pursuant to Section 5.11, (iv) reflecting admission of such additional Limited Partners in the books and records of the Partnership as the Record Holder of such Limited Partner Interest and (v) all additional issuances of Partnership Interests. The General Partner shall determine the relative rights, powers and duties of the holders of the Units or other Partnership Interests being so issued. The General Partner shall do all things necessary to comply with the Delaware Act and is authorized and directed to do all things that it determines to be necessary or appropriate in connection with any future issuance of Partnership Interests or in connection with the conversion of the Combined Interest into Units pursuant to the terms of this Agreement, including compliance with any statute, rule, regulation or guideline of any federal, state or other governmental agency or any National Securities Exchange on which the Units or other Partnership Interests are listed or admitted to trading.
(d) No fractional Units shall be issued by the Partnership.
Section 5.7 Conversion of Subordinated Units.
(a) All of the Subordinated Units shall convert into Common Units on a one-for-one basis on the first Business Day following the distribution of Available Cash to Partners pursuant to Section 6.3(a) in respect of the final Quarter of the Subordination Period.
(b) Notwithstanding any other provision of this Agreement, all the then Outstanding Subordinated Units may convert into Common Units on a one-for-one basis as set forth in, and pursuant to the terms of, Section 11.4.
(c) A Subordinated Unit that has converted into a Common Unit shall be subject to the provisions of Section 6.7.
Section 5.8 Limited Preemptive Right. Except as provided in this Section 5.8 and in Section 5.2 or as otherwise provided in a separate agreement by the Partnership, no Person shall have any preemptive, preferential or other similar right with respect to the issuance of any Partnership Interest, whether unissued, held in the treasury or hereafter created. The General Partner shall have the right, which it may from time to time assign in whole or in part to any of its Affiliates or the beneficial owners thereof, to purchase Partnership Interests from the Partnership whenever, and on the same terms that, the Partnership issues Partnership Interests to Persons other than the General Partner and its Affiliates or such beneficial owners, to the extent necessary to maintain the Percentage Interests of the General Partner and its Affiliates and such beneficial owners equal to that which existed immediately prior to the issuance of such Partnership Interests.
Section 5.9 Splits and Combinations.
(a) Subject to Section 5.9(d), Section 6.6 and Section 6.9 (dealing with adjustments of distribution levels), the Partnership may make a Pro Rata distribution of Partnership Interests to all Record Holders or may effect a subdivision or combination of Partnership Interests so long as, after any such event, each Partner shall have the same Percentage Interest in the Partnership as before such event, and any amounts calculated on a per Unit basis (including any Common Unit Arrearage or Cumulative Common Unit Arrearage) or stated as a number of Units are proportionately adjusted retroactive to the beginning of the Partnership.
(b) Whenever such a distribution, subdivision or combination of Partnership Interests is declared, the General Partner shall select a Record Date as of which the distribution, subdivision or combination shall be effective and shall send notice thereof at least 20 days prior to such Record Date to each Record Holder as of a date not less than 10 days prior to the date of such notice. The General Partner also may cause a firm of independent public accountants selected by it to calculate the number of Partnership Interests to be held by each Record Holder after giving effect to such distribution, subdivision or combination. The General Partner shall be entitled to rely on any certificate provided by such firm as conclusive evidence of the accuracy of such calculation.
(c) Promptly following any such distribution, subdivision or combination, the Partnership may issue Certificates to the Record Holders of Partnership Interests as of the applicable Record Date representing the new number of Partnership Interests held by such Record Holders, or the General Partner may adopt such other procedures that it determines to be necessary or appropriate to reflect such changes. If any such combination results in a smaller total number of Partnership Interests Outstanding, the Partnership shall require, as a condition to the delivery to a Record Holder of such new Certificate, the surrender of any Certificate held by such Record Holder immediately prior to such Record Date.
(d) The Partnership shall not issue fractional Units upon any distribution, subdivision or combination of Units. If a distribution, subdivision or combination of Units would result in the issuance of fractional Units but for the provisions of Section 5.6(d) and this Section 5.9(d), each fractional Unit shall be rounded to the nearest whole Unit (and a 0.5 Unit shall be rounded to the next higher Unit).
Section 5.10 Fully Paid and Non-Assessable Nature of Limited Partner Interests. All Limited Partner Interests issued pursuant to, and in accordance with the requirements of, this Article V shall be fully paid and non-assessable Limited Partner Interests in the Partnership, except as such non-assessability may be affected by Section 17-607 or 17-804 of the Delaware Act.
Section 5.11 Issuance of Common Units in Connection with Reset of Incentive Distribution Rights.
(a) Subject to the provisions of this Section 5.11, the holder of the Incentive Distribution Rights (or, if there is more than one holder of the Incentive Distribution Rights, the holders of a majority in interest of the Incentive Distribution Rights) shall have the right, at any time when there are no Subordinated Units outstanding and the Partnership has made a distribution pursuant to Section 6.4(b)(v) for each of the four most recently completed Quarters and the amount of each such distribution did not exceed Adjusted Operating Surplus for such Quarter, to make an election (the "IDR Reset Election") to cause the Minimum Quarterly Distribution and the Target Distributions to be reset in accordance
with the provisions of Section 5.11(e) and, in connection therewith, the holder or holders of the Incentive Distribution Rights will become entitled to receive their respective proportionate share of a number of Common Units (the "IDR Reset Common Units") derived by dividing (i) the average amount of cash distributions made by the Partnership for the two full Quarters immediately preceding the giving of the Reset Notice (as defined in Section 5.11(b)) in respect of the Incentive Distribution Rights by (ii) the average of the cash distributions made by the Partnership in respect of each Common Unit for the two full Quarters immediately preceding the giving of the Reset Notice (the "Reset MQD") (the number of Common Units determined by such quotient is referred to herein as the "Aggregate Quantity of IDR Reset Common Units"). The Percentage Interest of the General Partner after the issuance of the Aggregate Quantity of IDR Reset Common Units shall equal the Percentage Interest of the General Partner prior to the issuance of the Aggregate Quantity of IDR Reset Common Units and the General Partner shall not be obligated to make any additional Capital Contribution to the Partnership in order to maintain its Percentage Interest in connection therewith. The making of the IDR Reset Election in the manner specified in Section 5.11(b) shall cause the Minimum Quarterly Distribution and the Target Distributions to be reset in accordance with the provisions of Section 5.11(e) and, in connection therewith, the holder or holders of the Incentive Distribution Rights will become entitled to receive Common Units on the basis specified above, without any further approval required by the General Partner or the Unitholders, at the time specified in Section 5.11(c) unless the IDR Reset Election is rescinded pursuant to Section 5.11(d).
(b) To exercise the right specified in Section 5.11(a), the holder of the Incentive Distribution Rights (or, if there is more than one holder of the Incentive Distribution Rights, the holders of a majority in interest of the Incentive Distribution Rights) shall deliver a written notice (the "Reset Notice") to the Partnership. Within 10 Business Days after the receipt by the Partnership of such Reset Notice, the Partnership shall deliver a written notice to the holder or holders of the Incentive Distribution Rights of the Partnership's determination of the aggregate number of Common Units that each holder of Incentive Distribution Rights will be entitled to receive.
(c) The holder or holders of the Incentive Distribution Rights will be entitled to receive the Aggregate Quantity of IDR Reset Common Units on the fifteenth Business Day after receipt by the Partnership of the Reset Notice;provided, however, that the issuance of Common Units to the holder or holders of the Incentive Distribution Rights shall not occur prior to the approval of the listing or admission for trading of such Common Units by the principal National Securities Exchange upon which the Common Units are then listed or admitted for trading if any such approval is required pursuant to the rules and regulations of such National Securities Exchange.
(d) If the principal National Securities Exchange upon which the Common Units are then traded has not approved the listing or admission for trading of the Common Units to be issued pursuant to this Section 5.11 on or before the 30th calendar day following the Partnership's receipt of the Reset Notice and such approval is required by the rules and regulations of such National Securities Exchange, then the holder of the Incentive Distribution Rights (or, if there is more than one holder of the Incentive Distribution Rights, the holders of a majority in interest of the Incentive Distribution Rights) shall have the right to either rescind the IDR Reset Election or elect to receive other Partnership Interests having such terms as the General Partner may approve, with the approval of the Conflicts Committee, that will provide (i) the same economic value, in the aggregate, as the Aggregate Quantity of IDR Reset Common Units would have had at the time of the Partnership's receipt of the Reset Notice, as determined by the General Partner, and (ii) for the subsequent
conversion (on terms acceptable to the National Securities Exchange upon which the Common Units are then traded) of such Partnership Interests into Common Units within not more than 12 months following the Partnership's receipt of the Reset Notice upon the satisfaction of one or more conditions that are reasonably acceptable to the holder of the Incentive Distribution Rights (or, if there is more than one holder of the Incentive Distribution Rights, the holders of a majority in interest of the Incentive Distribution Rights).
(e) The Minimum Quarterly Distribution, First Target Distribution, Second Target Distribution and Third Target Distribution shall be adjusted at the time of the issuance of Common Units or other Partnership Interests pursuant to this Section 5.11 such that (i) the Minimum Quarterly Distribution shall be reset to equal to the Reset MQD, (ii) the First Target Distribution shall be reset to equal 115% of the Reset MQD, (iii) the Second Target Distribution shall be reset to equal 125% of the Reset MQD and (iv) the Third Target Distribution shall be reset to equal 150% of the Reset MQD.
(f) Upon the issuance of IDR Reset Common Units pursuant to Section 5.11(a), the Capital Account maintained with respect to the Incentive Distribution Rights shall (A) first, be allocated to IDR Reset Common Units in an amount equal to the product of (x) the Aggregate Quantity of IDR Reset Common Units and (y) the Per Unit Capital Amount for an Initial Common Unit, and (B) second, any remaining balance in such Capital Account will be retained by the holder of the Incentive Distributions Rights. In the event that there is not a sufficient Capital Account associated with the Incentive Distribution Rights to allocate the full Per Unit Capital Amount for an Initial Common Unit to the IDR Reset Common Units in accordance with clause (A) of this Section 5.11(f), the IDR Reset Common Units shall be subject to Sections 6.1(d)(x)(B) and (C).
ARTICLE VI
ALLOCATIONS AND DISTRIBUTIONS
Section 6.1 Allocations for Capital Account Purposes. For purposes of maintaining the Capital Accounts and in determining the rights of the Partners among themselves, the Partnership's items of income, gain, loss and deduction (computed in accordance with Section 5.5(b)) for each taxable period shall be allocated among the Partners as provided herein below.
(a) Net Income. Net Income for each taxable period and all items of income, gain, loss and deduction taken into account in computing Net Income for such taxable period shall be allocated as follows:
(i) First, to the General Partner until the aggregate of the Net Income allocated to the General Partner pursuant to this Section 6.1(a)(i) and the Net Termination Gain allocated to the General Partner pursuant to Section 6.1(c)(i)(A) or Section 6.1(c)(iv)(A) for the current and all previous taxable periods is equal to the aggregate of the Net Loss allocated to the General Partner pursuant to Section 6.1(b)(ii) for all previous taxable periods and the Net Termination Loss allocated to the General Partner pursuant to Section 6.1(c)(ii)(D) or Section 6.1(c)(iii)(B) for the current and all previous taxable periods; and
(ii) The balance, if any, (x) to the General Partner in accordance with its Percentage Interest, and (y) to all Unitholders, Pro Rata, a percentage equal to 100% less the percentage applicable to subclause (x).
(b) Net Loss. Net Loss for each taxable period and all items of income, gain, loss and deduction taken into account in computing Net Loss for such taxable period shall be allocated as follows:
(i) First, to the General Partner and the Unitholders, Pro Rata; provided, that Net Losses shall not be allocated pursuant to this Section 6.1(b)(i) to the extent that such allocation would cause any Unitholder to have a deficit balance in its Adjusted Capital Account at the end of such taxable period (or increase any existing deficit balance in its Adjusted Capital Account); and
(ii) The balance, if any, 100% to the General Partner.
(c) Net Termination Gains and Losses. Net Termination Gain or Net Termination Loss (including a pro rata part of each item of income, gain, loss and deduction taken into account in computing Net Termination Gain or Net Termination Loss) for such taxable period shall be allocated in the manner set forth in this Section 6.1(c). All allocations under this Section 6.1(c) shall be made after Capital Account balances have been adjusted by all other allocations provided under this Section 6.1 and after all distributions of Available Cash provided under Section 6.4 and Section 6.5 have been made; provided, however , that solely for purposes of this Section 6.1(c), Capital Accounts shall not be adjusted for distributions made pursuant to Section 12.4.
(i) Except as provided in Section 6.1(c)(iv), Net Termination Gain (including a pro rata part of each item of income, gain, loss, and deduction taken into account in computing Net Termination Gain) shall be allocated:
(A) First, to the General Partner until the aggregate of the Net Termination Gain allocated to the General Partner pursuant to this Section 6.1(c)(i)(A) or Section 6.1(c)(iv)(A) and the Net Income allocated to the General Partner pursuant to Section 6.1(a)(i) for the current and all previous taxable periods is equal to the aggregate of the Net Loss allocated to the General Partner pursuant to Section 6.1(b)(ii) for all previous taxable periods and the Net Termination Loss allocated to the General Partner pursuant to Section 6.1(c)(ii)(D) or Section 6.1(c)(iii)(B) for all previous taxable periods;
(B) Second, (x) to the General Partner in accordance with its Percentage Interest and (y) to all Unitholders holding Common Units, Pro Rata, a percentage equal to 100% less the General Partner's Percentage Interest, until the Capital Account in respect of each Common Unit then Outstanding is equal to the sum of (1) its Unrecovered Initial Unit Price, (2) the Minimum Quarterly Distribution for the Quarter during which the Liquidation Date occurs, reduced by any distribution pursuant to Section 6.4(a)(i) or Section 6.4(b)(i) with respect to such Common Unit for such Quarter (the amount determined pursuant to this clause (2) is hereinafter referred to as the "Unpaid MQD") and (3) any then existing Cumulative Common Unit Arrearage;
(C) Third, if such Net Termination Gain is recognized (or is deemed to be recognized) prior to the conversion of the last Outstanding Subordinated Unit into a Common Unit, (x) to the General Partner in accordance with its Percentage Interest and (y) to all Unitholders holding Subordinated Units, Pro Rata, a percentage equal to 100% less the General Partner's Percentage Interest, until the Capital Account in respect of each Subordinated Unit then Outstanding equals the sum of (1) its Unrecovered Initial Unit Price, determined for the taxable period (or portion thereof) to which this allocation of gain relates, and (2) the Minimum Quarterly Distribution for the Quarter
during which the Liquidation Date occurs, reduced by any distribution pursuant to Section 6.4(a)(iii) with respect to such Subordinated Unit for such Quarter;
(D) Fourth, 100% to the General Partner and all Unitholders, Pro Rata, until the Capital Account in respect of each Common Unit then Outstanding is equal to the sum of (1) its Unrecovered Initial Unit Price, (2) the Unpaid MQD, (3) any then existing Cumulative Common Unit Arrearage, and (4) the excess of (aa) the First Target Distribution less the Minimum Quarterly Distribution for each Quarter of the Partnership's existence over (bb) the cumulative per Unit amount of any distributions of Available Cash that is deemed to be Operating Surplus made pursuant to Section 6.4(a)(iv) and Section 6.4(b)(ii) (the sum of (1), (2), (3) and (4) is hereinafter referred to as the "First Liquidation Target Amount");
(E) Fifth, (x) to the General Partner in accordance with its Percentage Interest, (y) 13% to the holders of the Incentive Distribution Rights, Pro Rata, and (z) to all Unitholders, Pro Rata, a percentage equal to 100% less the sum of the percentages applicable to subclauses (x) and (y) of this clause (E), until the Capital Account in respect of each Common Unit then Outstanding is equal to the sum of (1) the First Liquidation Target Amount, and (2) the excess of (aa) the Second Target Distribution less the First Target Distribution for each Quarter of the Partnership's existence over (bb) the cumulative per Unit amount of any distributions of Available Cash that is deemed to be Operating Surplus made pursuant to Section 6.4(a)(v) and Section 6.4(b)(iii) (the sum of (1) and (2) is hereinafter referred to as the "Second Liquidation Target Amount");
(F) Sixth, (x) to the General Partner in accordance with its Percentage Interest, (y) 23% to the holders of the Incentive Distribution Rights, Pro Rata, and (z) to all Unitholders, Pro Rata, a percentage equal to 100% less the sum of the percentages applicable to subclauses (x) and (y) of this clause (F), until the Capital Account in respect of each Common Unit then Outstanding is equal to the sum of (1) the Second Liquidation Target Amount, and (2) the excess of (aa) the Third Target Distribution less the Second Target Distribution for each Quarter of the Partnership's existence over (bb) the cumulative per Unit amount of any distributions of Available Cash that is deemed to be Operating Surplus made pursuant to Section 6.4(a)(vi) and Section 6.4(b)(iv); and
(G) Finally, (x) to the General Partner in accordance with its Percentage Interest, (y) 48% to the holders of the Incentive Distribution Rights, Pro Rata, and (z) to all Unitholders, Pro Rata, a percentage equal to 100% less the sum of the percentages applicable to subclauses (x) and (y) of this clause (G).
(ii) Except as otherwise provided by Section 6.1(c)(iii) Net Termination Loss (including a pro rata part of each item of income, gain, loss, and deduction taken into account in computing Net Termination Loss) shall be allocated:
(A) First, if Subordinated Units remain Outstanding, (x) to the General Partner in accordance with its Percentage Interest and (y) to all Unitholders holding Subordinated Units, Pro Rata, a percentage equal to 100% less General Partner's Percentage Interest, until the Capital Account in respect of each Subordinated Unit then Outstanding has been reduced to zero;
(B) Second, (x) to the General Partner in accordance with its Percentage Interest and (y) to all Unitholders holding Common Units, Pro Rata, a percentage equal to 100% less General Partner's Percentage Interest, until the Capital Account in respect of each Common Unit then Outstanding has been reduced to zero;
(C) Third, to the General Partner and the Unitholders, Pro Rata; provided that Net Termination Loss shall not be allocated pursuant to this Section 6.1(c)(ii)(C) to the extent such allocation would cause any Unitholder to have a deficit balance in its Adjusted Capital Account (or increase any existing deficit in its Adjusted Capital Account); and
(D) Fourth, the balance, if any, 100% to the General Partner.
(iii) Any Net Termination Loss deemed recognized pursuant to Section 5.5(d) prior to a Liquidation Date shall be allocated:
(A) First, to the General Partner and the Unitholders, Pro Rata; provided that Net Termination Loss shall not be allocated pursuant to this Section 6.1(c)(iii)(A) to the extent such allocation would cause any Unitholder to have a deficit balance in its Adjusted Capital Account at the end of such taxable period (or increase any existing deficit in its Adjusted Capital Account); and
(B) The balance, if any, to the General Partner.
(iv) If a Net Termination Loss has been allocated pursuant to Section 6.1(c)(iii), subsequent Net Termination Gain is deemed recognized pursuant to Section 5.5(d) prior to a Liquidation Date shall be allocated:
(A) First, to the General Partner until the aggregate Net Termination Gain allocated to the General Partner pursuant to this Section 6.1(c)(iv)(A) is equal to the aggregate Net Termination Loss previously allocated pursuant to Section 6.1(c)(iii)(B);
(B) Second, to the General Partner and the Unitholders, Pro Rata, until the aggregate Net Termination Gain allocated pursuant to this Section 6.1(c)(iv)(B) is equal to the aggregate Net Termination Loss previously allocated pursuant to Section 6.1(c)(iii)(A); and
(C) The balance, if any, pursuant to the provisions of Section 6.1(c)(i).
(d) Special Allocations. Notwithstanding any other provision of this Section 6.1, the following special allocations shall be made for such taxable period:
(i) Partnership Minimum Gain Chargeback. Notwithstanding any other provision of this Section 6.1, if there is a net decrease in Partnership Minimum Gain during any Partnership taxable period, each Partner shall be allocated items of Partnership income and gain for such period (and, if necessary, subsequent periods) in the manner and amounts provided in Treasury Regulation Sections 1.704-2(f)(6), 1.704-2(g)(2) and 1.704-2(j)(2)(i), or any successor provision. For purposes of this Section 6.1(d), each Partner's Adjusted Capital Account balance shall be determined, and the allocation of income or gain required hereunder shall be effected, prior to the application of any other allocations pursuant to this Section 6.1(d) with respect to such taxable period (other than an allocation pursuant to Section 6.1(d)(vi) and Section 6.1(d)(vii)). This Section 6.1(d)(i) is intended to comply with the Partnership Minimum Gain chargeback requirement in Treasury Regulation Section 1.704-2(f) and shall be interpreted consistently therewith.
(ii) Chargeback of Partner Nonrecourse Debt Minimum Gain. Notwithstanding the other provisions of this Section 6.1 (other than Section 6.1(d)(i)), except as provided in Treasury
Regulation Section 1.704-2(i)(4), if there is a net decrease in Partner Nonrecourse Debt Minimum Gain during any Partnership taxable period, any Partner with a share of Partner Nonrecourse Debt Minimum Gain at the beginning of such taxable period shall be allocated items of Partnership income and gain for such period (and, if necessary, subsequent periods) in the manner and amounts provided in Treasury Regulation Sections 1.704-2(i)(4) and 1.704-2(j)(2)(ii), or any successor provisions. For purposes of this Section 6.1(d), each Partner's Adjusted Capital Account balance shall be determined, and the allocation of income or gain required hereunder shall be effected, prior to the application of any other allocations pursuant to this Section 6.1(d), other than Section 6.1(d)(i) and other than an allocation pursuant to Section 6.1(d)(vi) and Section 6.1(d)(vii), with respect to such taxable period. This Section 6.1(d)(ii) is intended to comply with the chargeback of items of income and gain requirement in Treasury Regulation Section 1.704-2(i)(4) and shall be interpreted consistently therewith.
(iii) Priority Allocations.
(A) If the amount of cash or the Net Agreed Value of any property distributed (except cash or property distributed pursuant to Section 12.4) with respect to a Unit exceeds the amount of cash or the Net Agreed Value of property distributed with respect to another Unit (the amount of the excess, an "Excess Distribution" and the Unit with respect to which the greater distribution is paid, an "Excess Distribution Unit"), then (1) there shall be allocated gross income and gain to each Unitholder receiving an Excess Distribution with respect to the Excess Distribution Unit until the aggregate amount of such items allocated with respect to such Excess Distribution Unit pursuant to this Section 6.1(d)(iii)(A) for the current taxable period and all previous taxable periods is equal to the amount of the Excess Distribution; and (2) the General Partner shall be allocated gross income and gain with respect to each such Excess Distribution in an amount equal to the product obtained by multiplying (aa) the quotient determined by dividing (x) the General Partner's Percentage Interest at the time when the Excess Distribution occurs by (y) a percentage equal to 100% less the General Partner's Percentage Interest at the time when the Excess Distribution occurs, times (bb) the total amount allocated in clause (1) above with respect to such Excess Distribution.
(B) After the application of Section 6.1(d)(iii)(A), all or any portion of the remaining items of Partnership gross income or gain for the taxable period, if any, shall be allocated (1) to the holders of Incentive Distribution Rights, Pro Rata, until the aggregate amount of such items allocated to the holders of Incentive Distribution Rights pursuant to this Section 6.1(d)(iii)(B) for the current taxable period and all previous taxable periods is equal to the cumulative amount of all Incentive Distributions made to the holders of Incentive Distribution Rights from the Closing Date to a date 45 days after the end of the current taxable period; and (2) to the General Partner an amount equal to the product of (aa) an amount equal to the quotient determined by dividing (x) the General Partner's Percentage Interest by (y) the sum of 100 less the General Partner's Percentage Interest times (bb) the sum of the amounts allocated in clause (1) above.
(iv) Qualified Income Offset. In the event any Partner unexpectedly receives any adjustments, allocations or distributions described in Treasury Regulation Sections 1.704-1(b)(2)(ii)(d)(4), 1.704-1(b)(2)(ii)(d)(5), or 1.704-1(b)(2)(ii)(d)(6), items of Partnership gross income and gain shall be specially allocated to such Partner in an amount and manner sufficient to eliminate, to the extent required by the Treasury Regulations promulgated under Section 704(b) of the Code, the deficit balance, if any, in its Adjusted Capital Account created by such adjustments, allocations or distributions as quickly as
possible; provided, that an allocation pursuant to this Section 6.1(d)(iv) shall be made only if and to the extent that such Partner would have a deficit balance in its Adjusted Capital Account as adjusted after all other allocations provided for in this Section 6.1 have been tentatively made as if this Section 6.1(d)(iv) were not in this Agreement.
(v) Gross Income Allocation. In the event any Partner has a deficit balance in its Capital Account at the end of any taxable period in excess of the sum of (A) the amount such Partner is required to restore pursuant to the provisions of this Agreement and (B) the amount such Partner is deemed obligated to restore pursuant to Treasury Regulation Sections 1.704-2(g) and 1.704-2(i)(5), such Partner shall be specially allocated items of Partnership gross income and gain in the amount of such excess as quickly as possible; provided, that an allocation pursuant to this Section 6.1(d)(v) shall be made only if and to the extent that such Partner would have a deficit balance in its Capital Account as adjusted after all other allocations provided for in this Section 6.1 have been tentatively made as if Section 6.1(d)(iv) and this Section 6.1(d)(v) were not in this Agreement.
(vi) Nonrecourse Deductions. Nonrecourse Deductions for any taxable period shall be allocated to the Partners Pro Rata. If the General Partner determines that the Partnership's Nonrecourse Deductions should be allocated in a different ratio to satisfy the safe harbor requirements of the Treasury Regulations promulgated under Section 704(b) of the Code, the General Partner is authorized, upon notice to the other Partners, to revise the prescribed ratio to the numerically closest ratio that does satisfy such requirements.
(vii) Partner Nonrecourse Deductions. Partner Nonrecourse Deductions for any taxable period shall be allocated 100% to the Partner that bears the Economic Risk of Loss with respect to the Partner Nonrecourse Debt to which such Partner Nonrecourse Deductions are attributable in accordance with Treasury Regulation Section 1.704-2(i). If more than one Partner bears the Economic Risk of Loss with respect to a Partner Nonrecourse Debt, such Partner Nonrecourse Deductions attributable thereto shall be allocated between or among such Partners in accordance with the ratios in which they share such Economic Risk of Loss.
(viii) Nonrecourse Liabilities. For purposes of Treasury Regulation Section 1.752-3(a)(3), the Partners agree that Nonrecourse Liabilities of the Partnership in excess of the sum of (A) the amount of Partnership Minimum Gain and (B) the total amount of Nonrecourse Built-in Gain shall be allocated among the Partners Pro Rata.
(ix) Code Section 754 Adjustments. To the extent an adjustment to the adjusted tax basis of any Partnership asset pursuant to Section 734(b) or 743(b) of the Code is required, pursuant to Treasury Regulation Section 1.704-1(b)(2)(iv)(m), to be taken into account in determining Capital Accounts, the amount of such adjustment to the Capital Accounts shall be treated as an item of gain (if the adjustment increases the basis of the asset) or loss (if the adjustment decreases such basis), and such item of gain or loss shall be specially allocated to the Partners in a manner consistent with the manner in which their Capital Accounts are required to be adjusted pursuant to such Section of the Treasury Regulations.
(x) Economic Uniformity; Changes in Law.
(A) At the election of the General Partner with respect to any taxable period ending upon, or after, the termination of the Subordination Period, all or a portion of the remaining items of Partnership gross income or gain for such taxable period, after taking into account allocations pursuant to Section 6.1(d)(iii), shall be allocated 100% to each
Partner holding Subordinated Units that are Outstanding as of the termination of the Subordination Period ("Final Subordinated Units") in the proportion of the number of Final Subordinated Units held by such Partner to the total number of Final Subordinated Units then Outstanding, until each such Partner has been allocated an amount of gross income or gain that increases the Capital Account maintained with respect to such Final Subordinated Units to an amount that after taking into account the other allocations of income, gain, loss and deduction to be made with respect to such taxable period will equal the product of (A) the number of Final Subordinated Units held by such Partner and (B) the Per Unit Capital Amount for a Common Unit. The purpose of this allocation is to establish uniformity between the Capital Accounts underlying Final Subordinated Units and the Capital Accounts underlying Common Units held by Persons other than the General Partner and its Affiliates immediately prior to the conversion of such Final Subordinated Units into Common Units. This allocation method for establishing such economic uniformity will be available to the General Partner only if the method for allocating the Capital Account maintained with respect to the Subordinated Units between the transferred and retained Subordinated Units pursuant to Section 5.5(c)(ii) does not otherwise provide such economic uniformity to the Final Subordinated Units.
(B) With respect to an event triggering an adjustment to the Carrying Value of Partnership property pursuant to Section 5.5(d) during any taxable period of the Partnership ending upon, or after, the issuance of IDR Reset Common Units pursuant to Section 5.11, after the application of Section 6.1(d)(x)(A), any Unrealized Gains and Unrealized Losses shall be allocated among the Partners in a manner that to the nearest extent possible results in the Capital Accounts maintained with respect to such IDR Reset Common Units issued pursuant to Section 5.11 equaling the product of (A) the Aggregate Quantity of IDR Reset Common Units and (B) the Per Unit Capital Amount for an Initial Common Unit.
(C) With respect to any taxable period during which an IDR Reset Unit is transferred to any Person who is not an Affiliate of the transferor, all or a portion of the remaining items of Partnership gross income or gain for such taxable period shall be allocated 100% to the transferor Partner of such transferred IDR Reset Unit until such transferor Partner has been allocated an amount of gross income or gain that increases the Capital Account maintained with respect to such transferred IDR Reset Unit to an amount equal to the Per Unit Capital Amount for an Initial Common Unit.
(D) For the proper administration of the Partnership and for the preservation of uniformity of the Limited Partner Interests (or any class or classes thereof), the General Partner shall (i) adopt such conventions as it deems appropriate in determining the amount of depreciation, amortization and cost recovery deductions; (ii) make special allocations of income, gain, loss, deduction, Unrealized Gain or Unrealized Loss; and (iii) amend the provisions of this Agreement as appropriate (x) to reflect the proposal or promulgation of Treasury Regulations under Section 704(b) or Section 704(c) of the Code or (y) otherwise to preserve or achieve uniformity of the Limited Partner Interests (or any class or classes thereof). The General Partner may adopt such conventions, make such allocations and make such amendments to this Agreement as provided in this Section 6.1(d)(x)(D) only if such conventions, allocations or amendments would not have a material adverse effect on the Partners, the holders of any class or classes of Limited Partner Interests issued and Outstanding or the Partnership, and if such allocations are consistent with the principles of Section 704 of the Code.
(xi) Curative Allocation.
(A) Notwithstanding any other provision of this Section 6.1, other than the Required Allocations, the Required Allocations shall be taken into account in making the Agreed Allocations so that, to the extent possible, the net amount of items of gross income, gain, loss and deduction allocated to each Partner pursuant to the Required Allocations and the Agreed Allocations, together, shall be equal to the net amount of such items that would have been allocated to each such Partner under the Agreed Allocations had the Required Allocations and the related Curative Allocation not otherwise been provided in this Section 6.1. In exercising its discretion under this Section 6.1(d)(xi)(A), the General Partner may take into account future Required Allocations that, although not yet made, are likely to offset other Required Allocations previously made. Allocations pursuant to this Section 6.1(d)(xi)(A) shall only be made with respect to Required Allocations to the extent the General Partner determines that such allocations will otherwise be inconsistent with the economic agreement among the Partners.
(B) The General Partner shall, with respect to each taxable period, (1) apply the provisions of Section 6.1(d)(xi)(A) in whatever order is most likely to minimize the economic distortions that might otherwise result from the Required Allocations, and (2) divide all allocations pursuant to Section 6.1(d)(xi)(A) among the Partners in a manner that is likely to minimize such economic distortions.
(xii) Corrective and Other Allocations. In the event of any allocation of Additional Book Basis Derivative Items or any Book-Down Event or any recognition of a Net Termination Loss, the following rules shall apply:
(A) Except as provided in Section 6.1(d)(xii)(B), in the case of any allocation of Additional Book Basis Derivative Items (other than an allocation of Unrealized Gain or Unrealized Loss under Section 5.5(d) hereof), the General Partner shall allocate such Additional Book Basis Derivative Items to (1) the holders of Incentive Distribution Rights and the General Partner to the same extent that the Unrealized Gain or Unrealized Loss giving rise to such Additional Book Basis Derivative Items was allocated to them pursuant to Section 5.5(d) and (2) all Unitholders, Pro Rata, to the extent that the Unrealized Gain or Unrealized Loss giving rise to such Additional Book Basis Derivative Items was allocated to any Unitholders pursuant to Section 5.5(d).
(B) In the case of any allocation of Additional Book Basis Derivative Items (other than an allocation of Unrealized Gain or Unrealized Loss under Section 5.5(d) hereof or an allocation of Net Termination Gain or Net Termination Loss pursuant to Section 6.1(c) hereof) as a result of a sale or other taxable disposition of any Partnership asset that is an Adjusted Property ("Disposed of Adjusted Property"), the General Partner shall allocate (1) additional items of gross income and gain (aa) away from the holders of Incentive Distribution Rights and (bb) to the Unitholders, or (2) additional items of deduction and loss (aa) away from the Unitholders and (bb) to the holders of Incentive Distribution Rights, to the extent that the Additional Book Basis Derivative Items allocated to the Unitholders exceed their Share of Additional Book Basis Derivative Items with respect to such Disposed of Adjusted Property. Any allocation made pursuant to this Section 6.1(d)(xii)(B) shall be made after all of the other Agreed Allocations have been made as if this Section 6.1(d)(xii) were not in this Agreement and, to the extent necessary, shall require the reallocation of items that have been allocated pursuant to such other Agreed Allocations.
(C) In the case of any negative adjustments to the Capital Accounts of the Partners resulting from a Book-Down Event or from the recognition of a Net Termination Loss, such negative adjustment (1) shall first be allocated, to the extent of the Aggregate Remaining Net Positive Adjustments, in such a manner, as determined by the General Partner, that to the extent possible the aggregate Capital Accounts of the Partners will equal the amount that would have been the Capital Account balances of the Partners if no prior Book-Up Events had occurred, and (2) any negative adjustment in excess of the Aggregate Remaining Net Positive Adjustments shall be allocated pursuant to Section 6.1(c) hereof.
(D) For purposes of this Section 6.1(d)(xii), the Unitholders shall be treated as being allocated Additional Book Basis Derivative Items to the extent that such Additional Book Basis Derivative Items have reduced the amount of income that would otherwise have been allocated to the Unitholders under this Agreement. In making the allocations required under this Section 6.1(d)(xii), the General Partner may apply whatever conventions or other methodology it determines will satisfy the purpose of this Section 6.1(d)(xii). Without limiting the foregoing, if an Adjusted Property is contributed by the Partnership to another entity classified as a partnership for federal income tax purposes (the "lower tier partnership"), the General Partner may make allocations similar to those described in Sections 6.1(d)(xii)(A)—(C) to the extent the General Partner determines such allocations are necessary to account for the Partnership's allocable share of income, gain, loss and deduction of the lower tier partnership that relate to the contributed Adjusted Property in a manner that is consistent with the purpose of this Section 6.1(d)(xii).
(xiii) Special Curative Allocation in Event of Liquidation Prior to End of Subordination Period. Notwithstanding any other provision of this Section 6.1 (other than the Required Allocations), if the Liquidation Date occurs prior to the conversion of the last Outstanding Subordinated Unit, then items of income, gain, loss and deduction for the taxable period that includes the Liquidation Date (and, if necessary, items arising in previous taxable periods to the extent the General Partner determines such items may be so allocated), shall be specially allocated among the Partners in the manner determined appropriate by the General Partner so as to cause, to the maximum extent possible, the Capital Account in respect of each Common Unit to equal the amount such Capital Account would have been if all prior allocations of Net Termination Gain and Net Termination Loss had been made pursuant to Section 6.1(c)(i) or Section 6.1(c)(ii), as applicable.
Section 6.2 Allocations for Tax Purposes.
(a) Except as otherwise provided herein, for federal income tax purposes, each item of income, gain, loss and deduction shall be allocated among the Partners in the same manner as its correlative item of "book" income, gain, loss or deduction is allocated pursuant to Section 6.1.
(b) In an attempt to eliminate Book-Tax Disparities attributable to a Contributed Property or Adjusted Property, items of income, gain, loss, depreciation, amortization and cost recovery deductions shall be allocated for federal income tax purposes among the Partners in the manner provided under Section 704(c) of the Code, and the Treasury Regulations promulgated under Section 704(b) and 704(c) of the Code, as determined appropriate by the General Partner (taking into account the General Partner's discretion under Section 6.1(d)(x)(D)); provided, that the General Partner shall apply the principles of Treasury Regulation Section 1.704-3(d) in all events.
(c) The General Partner may determine to depreciate or amortize the portion of an adjustment under Section 743(b) of the Code attributable to unrealized appreciation in any Adjusted Property (to the extent of the unamortized Book-Tax Disparity) using a predetermined rate derived from the depreciation or amortization method and useful life applied to the unamortized Book-Tax Disparity of such property, despite any inconsistency of such approach with Treasury Regulation Section 1.167(c)-l(a)(6) or any successor regulations thereto. If the General Partner determines that such reporting position cannot reasonably be taken, the General Partner may adopt depreciation and amortization conventions under which all purchasers acquiring Limited Partner Interests in the same month would receive depreciation and amortization deductions, based upon the same applicable rate as if they had purchased a direct interest in the Partnership's property. If the General Partner chooses not to utilize such aggregate method, the General Partner may use any other depreciation and amortization conventions to preserve the uniformity of the intrinsic tax characteristics of any Limited Partner Interests, so long as such conventions would not have a material adverse effect on the Limited Partners or the Record Holders of any class or classes of Limited Partner Interests.
(d) In accordance with Treasury Regulation Sections 1.1245-1(e) and 1.1250-1(f), any gain allocated to the Partners upon the sale or other taxable disposition of any Partnership asset shall, to the extent possible, after taking into account other required allocations of gain pursuant to this Section 6.2, be characterized as Recapture Income in the same proportions and to the same extent as such Partners (or their predecessors in interest) have been allocated any deductions directly or indirectly giving rise to the treatment of such gains as Recapture Income.
(e) All items of income, gain, loss, deduction and credit recognized by the Partnership for federal income tax purposes and allocated to the Partners in accordance with the provisions hereof shall be determined without regard to any election under Section 754 of the Code that may be made by the Partnership;provided, however, that such allocations, once made, shall be adjusted (in the manner determined by the General Partner) to take into account those adjustments permitted or required by Sections 734 and 743 of the Code.
(f) Each item of Partnership income, gain, loss and deduction shall, for federal income tax purposes, be determined for each taxable period and prorated on a monthly basis and shall be allocated to the Partners as of the opening of the National Securities Exchange on which the Partnership Interests are listed or admitted to trading on the first Business Day of each month; provided, however, such items for the period beginning on the Closing Date and ending on the last day of the month in which the Over-Allotment Option is exercised in full or the expiration of the Over-Allotment Option occurs shall be allocated to the Partners as of the opening of the National Securities Exchange on which the Partnership Interests are listed or admitted to trading on the first Business Day of the next succeeding month; and provided, further, that gain or loss on a sale or other disposition of any assets of the Partnership or any other extraordinary item of income, gain, loss or deduction as determined by the General Partner, shall be allocated to the Partners as of the opening of the National Securities Exchange on which the Partnership Interests are listed or admitted to trading on the first Business Day of the month in which such item is recognized for federal income tax purposes. The General Partner may revise, alter or otherwise modify such methods of allocation to the extent permitted or required by Section 706 of the Code and the regulations or rulings promulgated thereunder.
(g) Allocations that would otherwise be made to a Limited Partner under the provisions of this Article VI shall instead be made to the beneficial owner of Limited Partner Interests held by a nominee in any case in which the nominee has furnished the identity of such owner to the Partnership in accordance with Section 6031(c) of the Code or any other method determined by the General Partner.
Section 6.3 Requirement and Characterization of Distributions; Distributions to Record Holders.
(a) Within 45 days following the end of each Quarter commencing with the Quarter ending on JuneSeptember 30, 2010, an amount equal to 100% of Available Cash with respect to such Quarter shall be distributed in accordance with this Article VI by the Partnership to Partners as of the Record Date selected by the General Partner. All amounts of Available Cash distributed by the Partnership on any date from any source shall be deemed to be Operating Surplus until the sum of all amounts of Available Cash theretofore distributed by the Partnership to the Partners pursuant to Section 6.4 equals the Operating Surplus from the Closing Date through the close of the immediately preceding Quarter. Any remaining amounts of Available Cash distributed by the Partnership on such date shall, except as otherwise provided in Section 6.5, be deemed to be "Capital Surplus." All distributions required to be made under this Agreement shall be made subject to Sections 17-607 and 17-804 of the Delaware Act.
(b) Notwithstanding Section 6.3(a), in the event of the dissolution and liquidation of the Partnership, all cash received during or after the Quarter in which the Liquidation Date occurs, other than from Working Capital Borrowings, shall be applied and distributed solely in accordance with, and subject to the terms and conditions of, Section 12.4.
(c) Each distribution in respect of a Partnership Interest shall be paid by the Partnership, directly or through any Transfer Agent or through any other Person or agent, only to the Record Holder of such Partnership Interest as of the Record Date set for such distribution. Such payment shall constitute full payment and satisfaction of the Partnership's liability in respect of such payment, regardless of any claim of any Person who may have an interest in such payment by reason of an assignment or otherwise.
Section 6.4 Distributions of Available Cash from Operating Surplus.
(a) During Subordination Period. Available Cash with respect to any Quarter within the Subordination Period that is deemed to be Operating Surplus pursuant to the provisions of Section 6.3 or 6.5 shall be distributed as follows, except as otherwise contemplated by Section 5.6(b) in respect of other Partnership Interests issued pursuant thereto:
(i) First, (x) to the General Partner in accordance with its Percentage Interest and (y) to the Unitholders holding Common Units, Pro Rata, a percentage equal to 100% less the General Partner's Percentage Interest, until there has been distributed in respect of each Common Unit then Outstanding an amount equal to the Minimum Quarterly Distribution for such Quarter;
(ii) Second, (x) to the General Partner in accordance with its Percentage Interest and (y) to the Unitholders holding Common Units, Pro Rata, a percentage equal to 100% less the General Partner's Percentage Interest, until there has been distributed in respect of each Common Unit then Outstanding an amount equal to the Cumulative Common Unit Arrearage existing with respect to such Quarter;
(iii) Third, (x) to the General Partner in accordance with its Percentage Interest and (y) to the Unitholders holding Subordinated Units, Pro Rata, a percentage equal to 100% less the General Partner's Percentage Interest, until there has been distributed in respect of each Subordinated Unit then Outstanding an amount equal to the Minimum Quarterly Distribution for such Quarter;
(iv) Fourth, to the General Partner and all Unitholders, Pro Rata, until there has been distributed in respect of each Unit then Outstanding an amount equal to the excess of the First Target Distribution over the Minimum Quarterly Distribution for such Quarter;
(v) Fifth, (A) to the General Partner in accordance with its Percentage Interest; (B) 13% to the holders of the Incentive Distribution Rights, Pro Rata; and (C) to all Unitholders, Pro Rata, a percentage equal to 100% less the sum of the percentages applicable to subclauses (A) and (B) of this clause (v) until there has been distributed in respect of each Unit then Outstanding an amount equal to the excess of the Second Target Distribution over the First Target Distribution for such Quarter;
(vi) Sixth, (A) to the General Partner in accordance with its Percentage Interest, (B) 23% to the holders of the Incentive Distribution Rights, Pro Rata; and (C) to all Unitholders, Pro Rata, a percentage equal to 100% less the sum of the percentages applicable to subclauses (A) and (B) of this clause (vi), until there has been distributed in respect of each Unit then Outstanding an amount equal to the excess of the Third Target Distribution over the Second Target Distribution for such Quarter; and
(vii) Thereafter, (A) to the General Partner in accordance with its Percentage Interest; (B) 48% to the holders of the Incentive Distribution Rights, Pro Rata; and (C) to all Unitholders, Pro Rata, a percentage equal to 100% less the sum of the percentages applicable to subclauses (A) and (B) of this clause (vii);
provided,however, if the Minimum Quarterly Distribution, the First Target Distribution, the Second Target Distribution and the Third Target Distribution have been reduced to zero pursuant to the second sentence of Section 6.6(a), the distribution of Available Cash that is deemed to be Operating Surplus with respect to any Quarter will be made solely in accordance with Section 6.4(a)(vii).
(b) After Subordination Period. Available Cash with respect to any Quarter after the Subordination Period that is deemed to be Operating Surplus pursuant to the provisions of Section 6.3 or Section 6.5 shall be distributed as follows, except as otherwise contemplated by Section 5.6(b) in respect of additional Partnership Interests issued pursuant thereto:
(i) First, 100% to the General Partner and the Unitholders, Pro Rata, until there has been distributed in respect of each Unit then Outstanding an amount equal to the Minimum Quarterly Distribution for such Quarter;
(ii) Second, 100% to the General Partner and the Unitholders, Pro Rata, until there has been distributed in respect of each Unit then Outstanding an amount equal to the excess of the First Target Distribution over the Minimum Quarterly Distribution for such Quarter;
(iii) Third, (A) to the General Partner in accordance with its Percentage Interest; (B) 13% to the holders of the Incentive Distribution Rights, Pro Rata; and (C) to all Unitholders, Pro Rata, a percentage equal to 100% less the sum of the percentages applicable to subclauses (A) and (B) of this clause (iii), until there has been distributed in respect of each
Unit then Outstanding an amount equal to the excess of the Second Target Distribution over the First Target Distribution for such Quarter;
(iv) Fourth, (A) to the General Partner in accordance with its Percentage Interest; (B) 23% to the holders of the Incentive Distribution Rights, Pro Rata; and (C) to all Unitholders, Pro Rata, a percentage equal to 100% less the sum of the percentages applicable to subclauses (A) and (B) of this clause (iv), until there has been distributed in respect of each Unit then Outstanding an amount equal to the excess of the Third Target Distribution over the Second Target Distribution for such Quarter; and
(v) Thereafter, (A) to the General Partner in accordance with its Percentage Interest; (B) 48% to the holders of the Incentive Distribution Rights, Pro Rata; and (C) to all Unitholders, Pro Rata, a percentage equal to 100% less the sum of the percentages applicable to subclauses (A) and (B) of this clause (v);
provided,however, if the Minimum Quarterly Distribution, the First Target Distribution, the Second Target Distribution and the Third Target Distribution have been reduced to zero pursuant to the second sentence of Section 6.6(a), the distribution of Available Cash that is deemed to be Operating Surplus with respect to any Quarter will be made solely in accordance with Section 6.4(b)(v).
Section 6.5 Distributions of Available Cash from Capital Surplus. Available Cash that is deemed to be Capital Surplus pursuant to the provisions of Section 6.3(a) shall be distributed, unless the provisions of Section 6.3 require otherwise, 100% to the General Partner and the Unitholders, Pro Rata, until the Minimum Quarterly Distribution has been reduced to zero pursuant to the second sentence of Section 6.6(a). Available Cash that is deemed to be Capital Surplus shall then be distributed (a) to the General Partner in accordance with its Percentage Interest and (b) to all Unitholders holding Common Units, Pro Rata, a percentage equal to 100% less the General Partner's Percentage Interest, until there has been distributed in respect of each Common Unit then Outstanding an amount equal to the Cumulative Common Unit Arrearage. Thereafter, all Available Cash shall be distributed as if it were Operating Surplus and shall be distributed in accordance with Section 6.4.
Section 6.6 �� Adjustment of Minimum Quarterly Distribution and Target Distribution Levels.
(a) The Minimum Quarterly Distribution, First Target Distribution, Second Target Distribution, Third Target Distribution, Common Unit Arrearages and Cumulative Common Unit Arrearages shall be proportionately adjusted in the event of any distribution, combination or subdivision (whether effected by a distribution payable in Units or otherwise) of Units or other Partnership Interests in accordance with Section 5.9. In the event of a distribution of Available Cash that is deemed to be from Capital Surplus, the then applicable Minimum Quarterly Distribution, First Target Distribution, Second Target Distribution and Third Target Distribution, shall be reduced in the same proportion that the distribution had to the fair market value of the Common Units immediately prior to the announcement of the distribution. If the Common Units are publicly traded on a National Securities Exchange, the fair market value will be the Current Market Price before the ex-dividend date. If the Common Units are not publicly traded, the fair market value will be determined by the Board of Directors.
(b) The Minimum Quarterly Distribution, First Target Distribution, Second Target Distribution and Third Target Distribution, shall also be subject to adjustment pursuant to Section 5.11 and Section 6.9.
Section 6.7 Special Provisions Relating to the Holders of Subordinated Units.
(a) Except with respect to the right to vote on or approve matters requiring the vote or approval of a percentage of the holders of Outstanding Common Units and the right to participate in allocations of income, gain, loss and deduction and distributions made with respect to Common Units, the holder of a Subordinated Unit shall have all of the rights and obligations of a Unitholder holding Common Units hereunder; provided, however, that immediately upon the conversion of Subordinated Units into Common Units pursuant to Section 5.7, the Unitholder holding a Subordinated Unit shall possess all of the rights and obligations of a Unitholder holding Common Units hereunder with respect to such converted Subordinated Units, including the right to vote as a Common Unitholder and the right to participate in allocations of income, gain, loss and deduction and distributions made with respect to Common Units; provided, however, that such converted Subordinated Units shall remain subject to the provisions of Sections 5.5(c)(ii), 6.1(d)(x), 6.7(b) and 6.7(c).
(b) A Unitholder shall not be permitted to transfer a Subordinated Unit or a Subordinated Unit that has converted into a Common Unit pursuant to Section 5.7 (other than a transfer to an Affiliate) if the remaining balance in the transferring Unitholder's Capital Account with respect to the retained Subordinated Units or retained converted Subordinated Units would be negative after giving effect to the allocation under Section 5.5(c)(ii)(B).
(c) The Unitholder holding a Common Unit that has resulted from the conversion of a Subordinated Unit pursuant to Section 5.7 shall not be issued a Common Unit Certificate pursuant to Section 4.1, if the Common Units are evidenced by Certificates, and shall not be permitted to transfer such Common Unit to a Person that is not an Affiliate of the holder until such time as the General Partner determines, based on advice of counsel, that each such Common Unit should have, as a substantive matter, like intrinsic economic and federal income tax characteristics, in all material respects, to the intrinsic economic and federal income tax characteristics of an Initial Common Unit. In connection with the condition imposed by this Section 6.7(c), the General Partner may take whatever steps are required to provide economic uniformity to such Common Units in preparation for a transfer of such Common Units, including the application of Sections 5.5(c)(ii), 6.1(d)(x) and 6.7(b);provided, however, that no such steps may be taken that would have a material adverse effect on the Unitholders holding Common Units.
Section 6.8 Special Provisions Relating to the Holders of Incentive Distribution Rights. Notwithstanding anything to the contrary set forth in this Agreement, the holders of the Incentive Distribution Rights (a) shall (i) possess the rights and obligations provided in this Agreement with respect to a Limited Partner pursuant to Article III and Article VII and (ii) have a Capital Account as a Partner pursuant to Section 5.5 and all other provisions related thereto and (b) shall not (i) be entitled to vote on any matters requiring the approval or vote of the holders of Outstanding Units, except as provided by law, (ii) be entitled to any distributions other than as provided in Sections 6.4 and 12.4 or (iii) be allocated items of income, gain, loss or deduction other than as specified in this Article VI.
Section 6.9 Entity-Level Taxation. If legislation is enacted or the official interpretation of existing legislation is modified by a governmental authority, which after giving effect to such enactment or modification, results in a Group Member becoming subject to federal, state or local or non-U.S. income or withholding taxes in excess of the amount of such taxes due from the Group Member prior to such enactment or modification (including, for the avoidance of doubt, any increase in the rate of such taxation applicable to the Group Member), then the General
Partner may, in its sole discretion, reduce the Minimum Quarterly Distribution, First Target Distribution, Second Target Distribution and Third Target Distribution by the amount of income or withholding taxes that are payable by reason of any such new legislation or interpretation (the "Incremental Income Taxes"), or any portion thereof selected by the General Partner, in the manner provided in this Section 6.9. If the General Partner elects to reduce the Minimum Quarterly Distribution, First Target Distribution, Second Target Distribution and Third Target Distribution for any Quarter with respect to all or a portion of any Incremental Income Taxes, the General Partner shall estimate for such Quarter the Partnership Group's aggregate liability (the "Estimated Incremental Quarterly Tax Amount") for all (or the relevant portion of) such Incremental Income Taxes; provided that any difference between such estimate and the actual liability for Incremental Income Taxes (or the relevant portion thereof) for such Quarter may, to the extent determined by the General Partner, be taken into account in determining the Estimated Incremental Quarterly Tax Amount with respect to each Quarter in which any such difference can be determined. For each such Quarter, the Minimum Quarterly Distribution, First Target Distribution, Second Target Distribution and Third Target Distribution, shall be the product obtained by multiplying (a) the amounts therefor that are set out herein prior to the application of this Section 6.9 times (b) the quotient obtained by dividing (i) Available Cash with respect to such Quarter by (ii) the sum of Available Cash with respect to such Quarter and the Estimated Incremental Quarterly Tax Amount for such Quarter, as determined by the General Partner. For purposes of the foregoing, Available Cash with respect to a Quarter will be deemed reduced by the Estimated Incremental Quarterly Tax Amount for that Quarter.
ARTICLE VII
MANAGEMENT AND OPERATION OF BUSINESS
Section 7.1 Management.
(a) The General Partner shall conduct, direct and manage all activities of the Partnership. Except as otherwise expressly provided in this Agreement, all management powers over the business and affairs of the Partnership shall be exclusively vested in the General Partner, and no Limited Partner shall have any management power over the business and affairs of the Partnership. In addition to the powers now or hereafter granted a general partner of a limited partnership under applicable law or that are granted to the General Partner under any other provision of this Agreement, the General Partner, subject to Section 7.3, shall have full power and authority to do all things and on such terms as it determines to be necessary or appropriate to conduct the business of the Partnership, to exercise all powers set forth in Section 2.5 and to effectuate the purposes set forth in Section 2.4, including the following:
(i) the making of any expenditures, the lending or borrowing of money, the assumption or guarantee of, or other contracting for, indebtedness and other liabilities, the issuance of evidences of indebtedness, including indebtedness that is convertible or exchangeable into Partnership Interests, and the incurring of any other obligations;
(ii) the making of tax, regulatory and other filings, or rendering of periodic or other reports to governmental or other agencies having jurisdiction over the business or assets of the Partnership;
(iii) the acquisition, disposition, mortgage, pledge, encumbrance, hypothecation or exchange of any or all of the assets of the Partnership or the merger or other combination of the Partnership with or into another Person (the matters described in this clause (iii) being subject, however, to any prior approval that may be required by Section 7.3 or Article XIV);
(iv) the use of the assets of the Partnership (including cash on hand) for any purpose consistent with the terms of this Agreement, including the financing of the conduct of the operations of the Partnership Group; subject to Section 7.6(a), the lending of funds to other Persons (including other Group Members); the repayment or guarantee of obligations of any Group Member; and the making of capital contributions to any Group Member;
(v) the negotiation, execution and performance of any contracts, conveyances or other instruments (including instruments that limit the liability of the Partnership under contractual arrangements to all or particular assets of the Partnership, with the other party to the contract to have no recourse against the General Partner or its assets other than its interest in the Partnership, even if same results in the terms of the transaction being less favorable to the Partnership than would otherwise be the case);
(vi) the distribution of Partnership cash;
(vii) the selection, employment, retention and dismissal of employees (including employees having titles such as "president," "vice president," "secretary" and "treasurer") and agents, outside attorneys, accountants, consultants and contractors of the General Partner or the Partnership Group and the determination of their compensation and other terms of employment or hiring;
(viii) the maintenance of insurance for the benefit of the Partnership Group, the Partners and Indemnitees;
(ix) the formation of, or acquisition of an interest in, and the contribution of property and the making of loans to, any further limited or general partnerships, joint ventures, corporations, limited liability companies or other Persons (including the acquisition of interests in, and the contributions of property to, any Group Member from time to time) subject to the restrictions set forth in Section 2.4;
(x) the control of any matters affecting the rights and obligations of the Partnership, including the bringing and defending of actions at law or in equity and otherwise engaging in the conduct of litigation, arbitration or mediation and the incurring of legal expense and the settlement of claims and litigation;
(xi) the indemnification of any Person against liabilities and contingencies to the extent permitted by law;
(xii) the entering into of listing agreements with any National Securities Exchange and the delisting of some or all of the Limited Partner Interests from, or requesting that trading be suspended on, any such exchange (subject to any prior approval that may be required under Section 4.7);
(xiii) the purchase, sale or other acquisition or disposition of Partnership Interests, or the issuance of options, rights, warrants and appreciation rights relating to Partnership Interests;
(xiv) the undertaking of any action in connection with the Partnership's participation in any Group Member; and
(xv) the entering into of agreements with any of its Affiliates to render services to a Group Member or to itself in the discharge of its duties as General Partner of the Partnership.
(b) Notwithstanding any other provision of this Agreement, any Group Member Agreement, the Delaware Act or any applicable law, rule or regulation, each of the Partners and each other Person who may acquire an interest in Partnership Interests or is otherwise bound by this Agreement hereby (i) approves, ratifies and confirms the execution, delivery and performance by the parties thereto of this Agreement, the Underwriting Agreement, the Contribution Agreement and the other agreements described in or filed as exhibits to the Registration Statement that are related to the transactions contemplated by the Registration Statement (in each case other than this Agreement, without giving effect to any amendments, supplements or restatements after the date hereof); (ii) agrees that the General Partner (on its own or on behalf of the Partnership) is authorized to execute, deliver and perform the agreements referred to in clause (i) of this sentence and the other agreements, acts, transactions and matters described in or contemplated by the Registration Statement on behalf of the Partnership without any further act, approval or vote of the Partners or the other Persons who may acquire an interest in Partnership Interests or is otherwise bound by this Agreement; and (iii) agrees that the execution, delivery or performance by the General Partner, any Group Member or any Affiliate of any of them of this Agreement or any agreement authorized or permitted under this Agreement (including the exercise by the General Partner or any Affiliate of the General Partner of the rights accorded pursuant to Article XV) shall not constitute a breach by the General Partner of any duty that the General Partner may owe the Partnership or the Limited Partners or any other Persons under this Agreement (or any other agreements) or of any duty existing at law, in equity or otherwise.
Section 7.2 Certificate of Limited Partnership. The General Partner has caused the Certificate of Limited Partnership to be filed with the Secretary of State of the State of Delaware as required by the Delaware Act. The General Partner shall use all reasonable efforts to cause to be filed such other certificates or documents that the General Partner determines to be necessary or appropriate for the formation, continuation, qualification and operation of a limited partnership (or a partnership in which the limited partners have limited liability) in the State of Delaware or any other state in which the Partnership may elect to do business or own property. To the extent the General Partner determines such action to be necessary or appropriate, the General Partner shall file amendments to and restatements of the Certificate of Limited Partnership and do all things to maintain the Partnership as a limited partnership (or a partnership or other entity in which the limited partners have limited liability) under the laws of the State of Delaware or of any other state in which the Partnership may elect to do business or own property. Subject to the terms of Section 3.4(a), the General Partner shall not be required, before or after filing, to deliver or mail a copy of the Certificate of Limited Partnership, any qualification document or any amendment thereto to any Limited Partner.
Section 7.3 Restrictions on the General Partner's Authority. Except as provided in Article XII and Article XIV, the General Partner may not sell, exchange or otherwise dispose of all or substantially all of the assets of the Partnership Group, taken as a whole, in a single transaction or a series of related transactions without the approval of holders of a Unit Majority;provided, however, that this provision shall not preclude or limit the General Partner's ability to mortgage, pledge, hypothecate or grant a security interest in all or substantially all of the assets of the Partnership Group and shall not apply to any forced sale of any or all of the assets of the Partnership Group pursuant to the foreclosure of, or other realization upon, any such encumbrance.
Section 7.4 Reimbursement of the General Partner.
(a) Except as provided in this Section 7.4 and elsewhere in this Agreement, the General Partner shall not be compensated for its services as a general partner or managing member of any Group Member.
(b) The General Partner shall be reimbursed on a monthly basis, or such other basis as the General Partner may determine, for (i) all direct and indirect expenses it incurs or payments it makes on behalf of the Partnership Group (including salary, bonus, incentive compensation, employment benefits and other amounts paid to any Person, including Affiliates of the General Partner, to perform services for the Partnership Group or for the General Partner in the discharge of its duties to the Partnership Group), and (ii) all other expenses allocable to the Partnership Group or otherwise incurred by the General Partner in connection with operating the Partnership Group's business (including expenses allocated to the General Partner by its Affiliates). The General Partner shall determine the expenses that are allocable to the General Partner or the Partnership Group. Reimbursements pursuant to this Section 7.4 shall be in addition to any reimbursement to the General Partner as a result of indemnification pursuant to Section 7.7.
(c) The General Partner, without the approval of the Limited Partners (who shall have no right to vote in respect thereof), may propose and adopt on behalf of the Partnership benefit plans, programs and practices (including plans, programs and practices involving the issuance of Partnership Interests or options to purchase or rights, warrants or appreciation rights or phantom or tracking interests relating to Partnership Interests), or cause the Partnership to issue Partnership Interests in connection with, or pursuant to, any benefit plan, program or practice maintained or sponsored by the General Partner or any of its Affiliates, in each case for the benefit of employees and directors of the General Partner or any of its Affiliates, in respect of services performed, directly or indirectly, for the benefit of the Partnership Group. The Partnership agrees to issue and sell to the General Partner or any of its Affiliates any Partnership Interests that the General Partner or such Affiliates are obligated to provide to any employees and directors pursuant to any such benefit plans, programs or practices. Expenses incurred by the General Partner in connection with any such plans, programs and practices (including the net cost to the General Partner or such Affiliates of Partnership Interests purchased by the General Partner or such Affiliates, from the Partnership, to fulfill options or awards under such plans, programs and practices) shall be reimbursed in accordance with Section 7.4(b). Any and all obligations of the General Partner under any benefit plans, programs or practices adopted by the General Partner as permitted by this Section 7.4(c) shall constitute obligations of the General Partner hereunder and shall be assumed by any successor General Partner approved pursuant to Section 11.1 or Section 11.2 or the transferee of or successor to all of the General Partner's General Partner Interest pursuant to Section 4.6.
(d) The General Partner and its Affiliates may charge any member of the Partnership Group a management fee to the extent necessary to allow the Partnership Group to reduce the amount of any state franchise or income tax or any tax based upon the revenues or gross margin of any member of the Partnership Group if the tax benefit produced by the payment of such management fee or fees exceeds the amount of such fee or fees.
Section 7.5 Outside Activities.
(a) The General Partner, for so long as it is the General Partner of the Partnership (i) agrees that its sole business will be to act as a general partner or managing member, as
the case may be, of the Partnership and any other partnership or limited liability company of which the Partnership is, directly or indirectly, a partner or member and to undertake activities that are ancillary or related thereto (including being a Limited Partner in the Partnership) and (ii) shall not engage in any business or activity or incur any debts or liabilities except in connection with or incidental to (A) its performance as general partner or managing member, if any, of one or more Group Members or as described in or contemplated by the Registration Statement, (B) the acquiring, owning or disposing of debt securities or equity interests in any Group Member or (C) the guarantee of, and mortgage, pledge, or encumbrance of any or all of its assets in connection with, any indebtedness of any Affiliate of the General Partner.
(b) Each Unrestricted Person (other than the General Partner) shall have the right to engage in businesses of every type and description and other activities for profit and to engage in and possess an interest in other business ventures of any and every type or description, whether in businesses engaged in or anticipated to be engaged in by any Group Member, independently or with others, including business interests and activities in direct competition with the business and activities of any Group Member, and none of the same shall constitute a breach of this Agreement or any duty otherwise existing at law, in equity or otherwise, to any Group Member or any Partner. None of any Group Member, any Limited Partner or any other Person shall have any rights by virtue of this Agreement, any Group Member Agreement, or the partnership relationship established hereby in any business ventures of any Unrestricted Person.
(c) Subject to the terms of Sections 7.5(a) and (b), but otherwise notwithstanding anything to the contrary in this Agreement, (i) the engaging in competitive activities by any Unrestricted Person (other than the General Partner) in accordance with the provisions of this Section 7.5 is hereby approved by the Partnership and all Partners, (ii) it shall be deemed not to be a breach of any fiduciary duty or any other obligation of any type whatsoever of the General Partner or any other Unrestricted Person for the Unrestricted Persons (other than the General Partner) to engage in such business interests and activities in preference to or to the exclusion of the Partnership and (iii) the Unrestricted Persons shall have no obligation hereunder or as a result of any duty otherwise existing at law, in equity or otherwise, to present business opportunities to the Partnership. Notwithstanding anything to the contrary in this Agreement, the doctrine of corporate opportunity, or any analogous doctrine, shall not apply to any Unrestricted Person (including the General Partner). No Unrestricted Person (including the General Partner) who acquires knowledge of a potential transaction, agreement, arrangement or other matter that may be an opportunity for the Partnership, shall have any duty to communicate or offer such opportunity to the Partnership, and such Unrestricted Person (including the General Partner) shall not be liable to the Partnership, to any Limited Partner or any other Person for breach of any fiduciary or other duty by reason of the fact that such Unrestricted Person (including the General Partner) pursues or acquires for itself, directs such opportunity to another Person or does not communicate such opportunity or information to the Partnership; provided such Unrestricted Person does not engage in such business or activity as a result of or using confidential or proprietary information provided by or on behalf of the Partnership to such Unrestricted Person.
(d) The General Partner and each of its Affiliates may acquire Units or other Partnership Interests in addition to those acquired on the Closing Date and, except as otherwise provided in this Agreement, shall be entitled to exercise, at their option, all rights relating to all Units and/or other Partnership Interests acquired by them. The term "Affiliates" when used in this Section 7.5(d) with respect to the General Partner shall not include any Group Member.
(e) Notwithstanding anything to the contrary in this Agreement, (i) to the extent that any provision of this Agreement purports or is interpreted to have the effect of restricting the fiduciary duties that might otherwise, as a result of Delaware or other applicable law, be owed by the General Partner to the Partnership and the Limited Partners, or to constitute a waiver or consent by the Limited Partners to any such restriction, such provisions shall be deemed to have been approved by the Partners and (ii) nothing in this Agreement shall limit or otherwise affect any separate contractual obligations outside of this Agreement of any Person (including any Unrestricted Person) to the Partnership or any of its Affiliates, including under any of the Transaction Documents.Affiliates.
Section 7.6 Loans from the General Partner; Loans or Contributions from the Partnership or Group Members.
(a) The General Partner or any of its Affiliates may, but shall be under no obligation to, lend to any Group Member, and any Group Member may borrow from the General Partner or any of its Affiliates, funds needed or desired by the Group Member for such periods of time and in such amounts as the General Partner may determine; provided, however , that in any such case the lending party may not charge the borrowing party interest at a rate greater than the rate that would be charged the borrowing party or impose terms less favorable to the borrowing party than would be charged or imposed on the borrowing party by unrelated lenders on comparable loans made on an arm's-length basis (without reference to the lending party's financial abilities or guarantees), all as determined by the General Partner. The borrowing party shall reimburse the lending party for any costs (other than any additional interest costs) incurred by the lending party in connection with the borrowing of such funds. For purposes of this Section 7.6(a) and Section 7.6(b), the term "Group Member" shall include any Affiliate of a Group Member that is controlled by the Group Member.
(b) The Partnership may lend or contribute to any Group Member, and any Group Member may borrow from the Partnership, funds on terms and conditions determined by the General Partner. No Group Member may lend funds to the General Partner or any of its Affiliates (other than another Group Member).
(c) No borrowing by any Group Member or the approval thereof by the General Partner shall be deemed to constitute a breach of any duty hereunder or otherwise existing at law, in equity or otherwise, of the General Partner or its Affiliates to the Partnership or the Limited Partners by reason of the fact that the purpose or effect of such borrowing is directly or indirectly to (i) enable distributions to the General Partner or its Affiliates (including in their capacities as Limited Partners) to exceed the General Partner's Percentage Interest of the total amount distributed to all Partners or (ii) hasten the expiration of the Subordination Period or the conversion of any Subordinated Units into Common Units.
Section 7.7 Indemnification.
(a) To the fullest extent permitted by law but subject to the limitations expressly provided in this Agreement, all Indemnitees shall be indemnified and held harmless by the Partnership from and against any and all losses, claims, damages, liabilities, joint or several, expenses (including legal fees and expenses), judgments, fines, penalties, interest, settlements or other amounts arising from any and all threatened pending or completed claims, demands, actions, suits or proceedings, whether civil, criminal, administrative or investigative, and whether formal or informal and including appeals, in which any Indemnitee may be involved, or is threatened to be involved, as a party or otherwise, by
reason of its status as an Indemnitee and acting (or refraining to act) in such capacity;
provided, that the Indemnitee shall not be indemnified and held harmless pursuant to this Agreement if there has been a final and non-appealable judgment entered by a court of competent jurisdiction determining that, in respect of the matter for which the Indemnitee is seeking indemnification pursuant to this Agreement, the Indemnitee acted in bad faith or engaged in fraud, willful misconduct or, in the case of a criminal matter, acted with knowledge that the Indemnitee's conduct was unlawful. Any indemnification pursuant to this Section 7.7 shall be made only out of the assets of the Partnership, it being agreed that the General Partner shall not be personally liable for such indemnification and shall have no obligation to contribute or loan any monies or property to the Partnership to enable it to effectuate such indemnification.
(b) To the fullest extent permitted by law, expenses (including legal fees and expenses) incurred by an Indemnitee who is indemnified pursuant to Section 7.7(a) in defending any claim, demand, action, suit or proceeding shall, from time to time, be advanced by the Partnership prior to a final and non-appealable judgment entered by a court of competent jurisdiction determining that, in respect of the matter for which the Indemnitee is seeking indemnification pursuant to this Section 7.7, the Indemnitee is not entitled to be indemnified upon receipt by the Partnership of any undertaking by or on behalf of the Indemnitee to repay such amount if it shall be ultimately determined that the Indemnitee is not entitled to be indemnified as authorized by this Section 7.7.
(c) The indemnification provided by this Section 7.7 shall be in addition to any other rights to which an Indemnitee may be entitled under any agreement, pursuant to any vote of the holders of Outstanding Limited Partner Interests, as a matter of law, in equity or otherwise, both as to actions in the Indemnitee's capacity as an Indemnitee and as to actions in any other capacity (including any capacity under the Underwriting Agreement), and shall continue as to an Indemnitee who has ceased to serve in such capacity and shall inure to the benefit of the heirs, successors, assigns and administrators of the Indemnitee.
(d) The Partnership may purchase and maintain (or reimburse the General Partner or its Affiliates for the cost of) insurance, on behalf of the General Partner, its Affiliates and such other Persons as the General Partner shall determine, against any liability that may be asserted against, or expense that may be incurred by, such Person in connection with the Partnership's activities or such Person's activities on behalf of the Partnership, regardless of whether the Partnership would have the power to indemnify such Person against such liability under the provisions of this Agreement.
(e) For purposes of this Section 7.7, the Partnership shall be deemed to have requested an Indemnitee to serve as fiduciary of an employee benefit plan whenever the performance by it of its duties to the Partnership also imposes duties on, or otherwise involves services by, it to the plan or participants or beneficiaries of the plan; excise taxes assessed on an Indemnitee with respect to an employee benefit plan pursuant to applicable law shall constitute "fines" within the meaning of Section 7.7(a); and action taken or omitted by it with respect to any employee benefit plan in the performance of its duties for a purpose reasonably believed by it to be in the best interest of the participants and beneficiaries of the plan shall be deemed to be for a purpose that is in the best interests of the Partnership.
(f) In no event may an Indemnitee subject the Limited Partners to personal liability by reason of the indemnification provisions set forth in this Agreement.
(g) An Indemnitee shall not be denied indemnification in whole or in part under this Section 7.7 because the Indemnitee had an interest in the transaction with respect to which the indemnification applies if the transaction was otherwise permitted by the terms of this Agreement.
(h) The provisions of this Section 7.7 are for the benefit of the Indemnitees and their heirs, successors, assigns, executors and administrators and shall not be deemed to create any rights for the benefit of any other Persons.
(i) No amendment, modification or repeal of this Section 7.7 or any provision hereof shall in any manner terminate, reduce or impair the right of any past, present or future Indemnitee to be indemnified by the Partnership, nor the obligations of the Partnership to indemnify any such Indemnitee under and in accordance with the provisions of this Section 7.7 as in effect immediately prior to such amendment, modification or repeal with respect to claims arising from or relating to matters occurring, in whole or in part, prior to such amendment, modification or repeal, regardless of when such claims may arise or be asserted.
Section 7.8 Liability of Indemnitees.
(a) Notwithstanding anything to the contrary set forth in this Agreement, no Indemnitee shall be liable for monetary damages to the Partnership, the Limited Partners or any other Persons who have acquired interests in the Partnership Interests, for losses sustained or liabilities incurred as a result of any act or omission of an Indemnitee unless there has been a final and non-appealable judgment entered by a court of competent jurisdiction determining that, in respect of the matter in question, the Indemnitee acted in bad faith or engaged in fraud, willful misconduct or, in the case of a criminal matter, acted with knowledge that the Indemnitee's conduct was criminal.
(b) Subject to its obligations and duties as General Partner set forth in Section 7.1(a), the General Partner may exercise any of the powers granted to it by this Agreement and perform any of the duties imposed upon it hereunder either directly or by or through its agents, and the General Partner shall not be responsible for any misconduct or negligence on the part of any such agent appointed by the General Partner in good faith.
(c) To the extent that, at law or in equity, an Indemnitee has duties (including fiduciary duties) and liabilities relating thereto to the Partnership or to the Partners, the General Partner and any other Indemnitee acting in connection with the Partnership's business or affairs shall not be liable to the Partnership or to any Partner for its good faith reliance on the provisions of this Agreement.
(d) Any amendment, modification or repeal of this Section 7.8 or any provision hereof shall be prospective only and shall not in any way affect the limitations on the liability of the Indemnitees under this Section 7.8 as in effect immediately prior to such amendment, modification or repeal with respect to claims arising from or relating to matters occurring, in whole or in part, prior to such amendment, modification or repeal, regardless of when such claims may arise or be asserted.
Section 7.9 Resolution of Conflicts of Interest; Standards of Conduct and Modification of Duties.
(a) Unless otherwise expressly provided in this Agreement or any Group Member Agreement, whenever a potential conflict of interest exists or arises between the General Partner or any of its Affiliates, on the one hand, and the Partnership, any Group Member or any Partner, on the other, any resolution or course of action by the General Partner or its Affiliates in respect of such conflict of interest shall be permitted and deemed approved by all Partners, and shall not constitute a breach of this Agreement, of any Group Member Agreement, of any agreement contemplated herein or therein, or of any duty stated or implied by law or equity, if the resolution or course of action in respect of such conflict of interest is (i) approved by Special Approval, (ii) approved by the vote of a majority of the Common Units (excluding Common Units owned by the General Partner and its Affiliates), (iii) on terms no less favorable to the Partnership than those generally being provided to or available from unrelated third parties or (iv) fair and reasonable to the Partnership, taking into account the totality of the relationships between the parties involved (including other transactions that may be particularly favorable or advantageous to the Partnership). The General Partner shall be authorized but not required in connection with its resolution of such conflict of interest to seek Special Approval or Unitholder approval of such resolution, and the General Partner may also adopt a resolution or course of action that has not received Special Approval or Unitholder approval. If Special Approval is sought, then it shall be presumed that, in making its decision, the Conflicts Committee acted in good faith, and if neither Special Approval nor Unitholder approval is sought and the Board of Directors determines that the resolution or course of action taken with respect to a conflict of interest satisfies either of the standards set forth in clauses (iii) or (iv) above, then it shall be presumed that, in making its decision, the Board of Directors acted in good faith, and in any proceeding brought by any Limited Partner or by or on behalf of such Limited Partner or any other Limited Partner or the Partnership challenging such approval, the Person bringing or prosecuting such proceeding shall have the burden of overcoming such presumption. Notwithstanding anything to the contrary in this Agreement or any duty otherwise existing at law or equity, the existence of the conflicts of interest described in the Registration Statement are hereby approved by all Partners and shall not constitute a breach of this Agreement or of any duty hereunder or existing at law, in equity or otherwise.
(b) Whenever the General Partner, or any committee of the Board of Directors (including the Conflicts Committee), makes a determination or takes or declines to take any other action, or any of its Affiliates causes the General Partner to do so, in its capacity as the general partner of the Partnership as opposed to in its individual capacity, whether under this Agreement, any Group Member Agreement or any other agreement contemplated hereby or otherwise, then, unless another express standard is provided for in this Agreement, the General Partner, such committee or such Affiliates causing the General Partner to do so, shall make such determination or take or decline to take such other action in good faith and shall not be subject to any other or different standards (including fiduciary standards) imposed by this Agreement, any Group Member Agreement, any other agreement contemplated hereby or under the Delaware Act or any other law, rule or regulation or at equity. In order for a determination or other action to be in "good faith" for purposes of this Agreement, the Person or Persons making such determination or taking or declining to take such other action must believe that the determination or other action is in the best interests of the Partnership.
(c) Whenever the General Partner makes a determination or takes or declines to take any other action, or any of its Affiliates causes it to do so, in its individual capacity as
opposed to in its capacity as the general partner of the Partnership, whether under this Agreement, any Group Member Agreement or any other agreement contemplated hereby or otherwise, then the General Partner, or such Affiliates causing it to do so, are entitled, to the fullest extent permitted by law, to make such determination or to take or decline to take such other action free of any duty (including any fiduciary duty) or obligation whatsoever to the Partnership, any Limited Partner and any other Person bound by this Agreement, and the General Partner, or such Affiliates causing it to do so, shall not, to the fullest extent permitted by law, be required to act in good faith or pursuant to any other standard imposed by this Agreement, any Group Member Agreement, any other agreement contemplated hereby or under the Delaware Act or any other law, rule or regulation or at equity. By way of illustration and not of limitation, whenever the phrases, "at the option of the General Partner," "in its sole discretion" or some variation of those phrases, are used in this Agreement, it indicates that the General Partner is acting in its individual capacity. For the avoidance of doubt, whenever the General Partner votes or transfers its Partnership Interests, or refrains from voting or transferring its Partnership Interests, it shall be acting in its individual capacity.
(d) The General Partner's organizational documents may provide that determinations to take or decline to take any action in its individual, rather than representative, capacity may or shall be determined by its members, if the General Partner is a limited liability company, stockholders, if the General Partner is a corporation, or the members or stockholders of the General Partner's general partner, if the General Partner is a partnership.
(e) Notwithstanding anything to the contrary in this Agreement, the General Partner and its Affiliates shall have no duty or obligation, express or implied, to (i) sell or otherwise dispose of any asset of the Partnership Group other than in the ordinary course of business or (ii) permit any Group Member to use any facilities or assets of the General Partner and its Affiliates, except as may be provided in contracts entered into from time to time specifically dealing with such use. Any determination by the General Partner or any of its Affiliates to enter into such contracts shall be in its sole discretion.
(f) Except as expressly set forth in this Agreement or the Delaware Act, neither the General Partner nor any other Indemnitee shall have any duties or liabilities, including fiduciary duties, to the Partnership or any Limited Partner and the provisions of this Agreement, to the extent that they restrict, eliminate or otherwise modify the duties and liabilities, including fiduciary duties, of the General Partner or any other Indemnitee otherwise existing at law or in equity, are agreed by the Partners to replace such other duties and liabilities of the General Partner or such other Indemnitee.
(g) The Unitholders hereby authorize the General Partner, on behalf of the Partnership as a partner or member of a Group Member, to approve of actions by the general partner or managing member of such Group Member similar to those actions permitted to be taken by the General Partner pursuant to this Section 7.9.
Section 7.10 Other Matters Concerning the General Partner.
(a) The General Partner may rely upon, and shall be protected in acting or refraining from acting upon, any resolution, certificate, statement, instrument, opinion, report, notice, request, consent, order, bond, debenture or other paper or document believed by it to be genuine and to have been signed or presented by the proper party or parties.
(b) The General Partner may consult with legal counsel, accountants, appraisers, management consultants, investment bankers and other consultants and advisers selected by it, and any act taken or omitted to be taken in reliance upon the advice or opinion (including an Opinion of Counsel) of such Persons as to matters that the General Partner reasonably believes to be within such Person's professional or expert competence shall be conclusively presumed to have been done or omitted in good faith and in accordance with such advice or opinion.
(c) The General Partner shall have the right, in respect of any of its powers or obligations hereunder, to act through any of its duly authorized officers, a duly appointed attorney or attorneys-in-fact or the duly authorized officers of the Partnership.
Section 7.11 Purchase or Sale of Partnership Interests. The General Partner may cause the Partnership to purchase or otherwise acquire Partnership Interests; provided that, except as permitted pursuant to Section 4.9, the General Partner may not cause any Group Member to purchase Subordinated Units during the Subordination Period. As long as Partnership Interests are held by any Group Member, such Partnership Interests shall not be considered Outstanding for any purpose, except as otherwise provided herein. The General Partner or any Affiliate of the General Partner may also purchase or otherwise acquire and sell or otherwise dispose of Partnership Interests for its own account, subject to the provisions of Articles IV and X.
Section 7.12 Registration Rights of the General Partner and its Affiliates.
(a) If (i) the General Partner or any Affiliate of the General Partner (including for purposes of this Section 7.12, any Person that is an Affiliate of the General Partner at the date hereof notwithstanding that it may later cease to be an Affiliate of the General Partner) holds Partnership Interests that it desires to sell and (ii) Rule 144 of the Securities Act (or any successor rule or regulation to Rule 144) or another exemption from registration is not available to enable such holder of Partnership Interests (the "Holder") to dispose of the number of Partnership Interests it desires to sell at the time it desires to do so without registration under the Securities Act, then at the option and upon the request of the Holder, the Partnership shall file with the Commission as promptly as practicable after receiving such request, and use all commercially reasonable efforts to cause to become effective and remain effective for a period of not less than six months following its effective date or such shorter period as shall terminate when all Partnership Interests covered by such registration statement have been sold, a registration statement under the Securities Act registering the offering and sale of the number of Partnership Interests specified by the Holder; provided, however, that the Partnership shall not be required to effect more than three registrations pursuant to this Section 7.12(a); and provided further, however, that if the Conflicts Committee determines that a postponement of the requested registration would be in the best interests of the Partnership and its Partners due to a pending transaction, investigation or other event, the filing of such registration statement or the effectiveness thereof may be deferred for up to six months, but not thereafter. In connection with any registration pursuant to the immediately preceding sentence, the Partnership shall (i) promptly prepare and file (A) such documents as may be necessary to register or qualify the securities subject to such registration under the securities laws of such states as the Holder shall reasonably request; provided, however, that no such qualification shall be required in any jurisdiction where, as a result thereof, the Partnership would become subject to general service of process or to taxation or qualification to do business as a foreign corporation or partnership doing business in such jurisdiction solely as a result of such registration, and (B) such documents as may be necessary to apply for listing or to list the Partnership Interests subject to such registration on such National Securities Exchange as the Holder shall reasonably request, and (ii) do any and all other acts and things that may be necessary or appropriate to enable the
Holder to consummate a public sale of such Partnership Interests in such states. Except as set forth in Section 7.12(c), all costs and expenses of any such registration and offering (other than the underwriting discounts and commissions) shall be paid by the Partnership, without reimbursement by the Holder.
(b) If the Partnership shall at any time propose to file a registration statement under the Securities Act for an offering of Partnership Interests for cash (other than an offering relating solely to a benefit plan), the Partnership shall use all commercially reasonable efforts to include such number or amount of Partnership Interests held by any Holder in such registration statement as the Holder shall request; provided, that the Partnership is not required to make any effort or take any action to so include the Partnership Interests of the Holder once the registration statement becomes or is declared effective by the Commission, including any registration statement providing for the offering from time to time of Partnership Interests pursuant to Rule 415 of the Securities Act. If the proposed offering pursuant to this Section 7.12(b) shall be an underwritten offering, then, in the event that the managing underwriter or managing underwriters of such offering advise the Partnership and the Holder in writing that in their opinion the inclusion of all or some of the Holder's Partnership Interests would adversely and materially affect the timing or success of the offering, the Partnership shall include in such offering only that number or amount, if any, of Partnership Interests held by the Holder that, in the opinion of the managing underwriter or managing underwriters, will not so adversely and materially affect the offering. Except as set forth in Section 7.12(c), all costs and expenses of any such registration and offering (other than the underwriting discounts and commissions) shall be paid by the Partnership, without reimbursement by the Holder.
(c) If underwriters are engaged in connection with any registration referred to in this Section 7.12, the Partnership shall provide indemnification, representations, covenants, opinions and other assurance to the underwriters in form and substance reasonably satisfactory to such underwriters. Further, in addition to and not in limitation of the Partnership's obligation under Section 7.7, the Partnership shall, to the fullest extent permitted by law, indemnify and hold harmless the Holder, its officers, directors and each Person who controls the Holder (within the meaning of the Securities Act) and any agent thereof (collectively, "Indemnified Persons") from and against any and all losses, claims, damages, liabilities, joint or several, expenses (including legal fees and expenses), judgments, fines, penalties, interest, settlements or other amounts arising from any and all claims, demands, actions, suits or proceedings, whether civil, criminal, administrative or investigative, in which any Indemnified Person may be involved, or is threatened to be involved, as a party or otherwise, under the Securities Act or otherwise (hereinafter referred to in this Section 7.12(c) as a "claim" and in the plural as "claims") based upon, arising out of or resulting from any untrue statement or alleged untrue statement of any material fact contained in any registration statement under which any Partnership Interests were registered under the Securities Act or any state securities or Blue Sky laws, in any preliminary prospectus (if used prior to the effective date of such registration statement), or in any summary or final prospectus or free writing prospectus or in any amendment or supplement thereto (if used during the period the Partnership is required to keep the registration statement current), or arising out of, based upon or resulting from the omission or alleged omission to state therein a material fact required to be stated therein or necessary to make the statements made therein not misleading;provided, however, that the Partnership shall not be liable to any Indemnified Person to the extent that any such claim arises out of, is based upon or results from an untrue statement or alleged untrue statement or omission or alleged omission made in such registration statement, such preliminary, summary or final prospectus or free writing prospectus or such amendment or supplement, in reliance upon and in conformity with written information furnished to the Partnership by or on behalf of such Indemnified Person specifically for use in the preparation thereof.
(d) The provisions of Section 7.12(a) and Section 7.12(b) shall continue to be applicable with respect to the General Partner (and any of the General Partner's Affiliates) after it ceases to be a general partner of the Partnership, during a period of two years subsequent to the effective date of such cessation and for so long thereafter as is required for the Holder to sell all of the Partnership Interests with respect to which it has requested during such two-year period inclusion in a registration statement otherwise filed or that a registration statement be filed;provided, however, that the Partnership shall not be required to file successive registration statements covering the same Partnership Interests for which registration was demanded during such two-year period. The provisions of Section 7.12(c) shall continue in effect thereafter.
(e) The rights to cause the Partnership to register Partnership Interests pursuant to this Section 7.12 may be assigned (but only with all related obligations) by a Holder to a transferee or assignee of such Partnership Interests, provided (i) the Partnership is, within a reasonable time after such transfer, furnished with written notice of the name and address of such transferee or assignee and the Partnership Interests with respect to which such registration rights are being assigned; and (ii) such transferee or assignee agrees in writing to be bound by and subject to the terms set forth in this Section 7.12.
(f) Any request to register Partnership Interests pursuant to this Section 7.12 shall (i) specify the Partnership Interests intended to be offered and sold by the Person making the request, (ii) express such Person's present intent to offer such Partnership Interests for distribution, (iii) describe the nature or method of the proposed offer and sale of Partnership Interests, and (iv) contain the undertaking of such Person to provide all such information and materials and take all action as may be required in order to permit the Partnership to comply with all applicable requirements in connection with the registration of such Partnership Interests.
Section 7.13 Reliance by Third Parties. Notwithstanding anything to the contrary in this Agreement, any Person dealing with the Partnership shall be entitled to assume that the General Partner and any officer of the General Partner authorized by the General Partner to act on behalf of and in the name of the Partnership has full power and authority to encumber, sell or otherwise use in any manner any and all assets of the Partnership and to enter into any authorized contracts on behalf of the Partnership, and such Person shall be entitled to deal with the General Partner or any such officer as if it were the Partnership's sole party in interest, both legally and beneficially. Each Limited Partner hereby waives, to the fullest extent permitted by law, any and all defenses or other remedies that may be available against such Person to contest, negate or disaffirm any action of the General Partner or any such officer in connection with any such dealing. In no event shall any Person dealing with the General Partner or any such officer or its representatives be obligated to ascertain that the terms of this Agreement have been complied with or to inquire into the necessity or expedience of any act or action of the General Partner or any such officer or its representatives. Each and every certificate, document or other instrument executed on behalf of the Partnership by the General Partner or its representatives shall be conclusive evidence in favor of any and every Person relying thereon or claiming thereunder that (a) at the time of the execution and delivery of such certificate, document or instrument, this Agreement was in full force and effect, (b) the Person executing and delivering such certificate, document or instrument was duly authorized and empowered to do so for and on behalf of the Partnership and (c) such certificate, document or instrument was duly executed and delivered in accordance with the terms and provisions of this Agreement and is binding upon the Partnership.
ARTICLE VIII
BOOKS, RECORDS, ACCOUNTING AND REPORTS
Section 8.1 Records and Accounting. The General Partner shall keep or cause to be kept at the principal office of the Partnership appropriate books and records with respect to the Partnership's business, including all books and records necessary to provide to the Limited Partners any information required to be provided pursuant to Section 3.4(a). Any books and records maintained by or on behalf of the Partnership in the regular course of its business, including the record of the Record Holders of Units or other Partnership Interests, books of account and records of Partnership proceedings, may be kept on, or be in the form of, computer disks, hard drives, magnetic tape, photographs, micrographics or any other information storage device; provided, that the books and records so maintained are convertible into clearly legible written form within a reasonable period of time. The books of the Partnership shall be maintained, for financial reporting purposes, on an accrual basis in accordance with U.S. GAAP. The Partnership shall not be required to keep books maintained on a cash basis and the General Partner shall be permitted to calculate cash-based measures, including Operating Surplus and Adjusted Operating Surplus, by making such adjustments to its accrual basis books to account for non-cash items and other adjustments as the General Partner determines to be necessary or appropriate.
Section��Section 8.2 Fiscal Year. The fiscal year of the Partnership shall be a fiscal year ending December 31.
Section 8.3 Reports.
(a) As soon as practicable, but in no event later than 90 days after the close of each fiscal year of the Partnership, the General Partner shall cause to be mailed or made available, by any reasonable means, to each Record Holder of a Unit as of a date selected by the General Partner, an annual report containing financial statements of the Partnership for such fiscal year of the Partnership, presented in accordance with U.S. GAAP, including a balance sheet and statements of operations, Partnership equity and cash flows, such statements to be audited by a firm of independent public accountants selected by the General Partner.
(b) As soon as practicable, but in no event later than 45 days after the close of each Quarter except the last Quarter of each fiscal year, the General Partner shall cause to be mailed or made available, by any reasonable means to each Record Holder of a Unit, as of a date selected by the General Partner, a report containing unaudited financial statements of the Partnership and such other information as may be required by applicable law, regulation or rule of any National Securities Exchange on which the Units are listed or admitted to trading, or as the General Partner determines to be necessary or appropriate.
(c) The General Partner shall be deemed to have made a report available to each Record Holder as required by this Section 8.3 if it has either (i) filed such report with the Commission via its Electronic Data Gathering, Analysis and Retrieval system and such report is publicly available on such system or (ii) made such report available on any publicly available website maintained by the Partnership.
ARTICLE IX
TAX MATTERS
Section 9.1 Tax Returns and Information. The Partnership shall timely file all returns of the Partnership that are required for federal, state and local income tax purposes on the basis of the accrual method and the taxable period or years that it is required by law to adopt, from time to time, as determined by the General Partner. In the event the Partnership is required to use a taxable period other than a year ending on December 31, the General Partner shall use reasonable efforts to change the taxable period of the Partnership to a year ending on December 31. The tax information reasonably required by Record Holders for federal and state income tax reporting purposes with respect to a taxable period shall be furnished to them within 90 days of the close of the calendar year in which the Partnership's taxable period ends. The classification, realization and recognition of income, gain, losses and deductions and other items shall be on the accrual method of accounting for federal income tax purposes.
Section 9.2 Tax Elections.
(a) The Partnership shall make the election under Section 754 of the Code in accordance with applicable regulations thereunder, subject to the reservation of the right to seek to revoke any such election upon the General Partner's determination that such revocation is in the best interests of the Limited Partners. Notwithstanding any other provision herein contained, for the purposes of computing the adjustments under Section 743(b) of the Code, the General Partner shall be authorized (but not required) to adopt a convention whereby the price paid by a transferee of a Limited Partner Interest will be deemed to be the lowest quoted closing price of the Limited Partner Interests on any National Securities Exchange on which such Limited Partner Interests are listed or admitted to trading during the calendar month in which such transfer is deemed to occur pursuant to Section 6.2(f) without regard to the actual price paid by such transferee.
(b) Except as otherwise provided herein, the General Partner shall determine whether the Partnership should make any other elections permitted by the Code.
Section 9.3 Tax Controversies. Subject to the provisions hereof, the General Partner is designated as the Tax Matters Partner (as defined in the Code) and is authorized and required to represent the Partnership (at the Partnership's expense) in connection with all examinations of the Partnership's affairs by tax authorities, including resulting administrative and judicial proceedings, and to expend Partnership funds for professional services and costs associated therewith. Each Partner agrees to cooperate with the General Partner and to do or refrain from doing any or all things reasonably required by the General Partner to conduct such proceedings.
Section 9.4 Withholding; Tax Payments.
(a) The General Partner may treat taxes paid by the Partnership on behalf of, all or less than all of the Partners, either as a distribution of cash to such Partners or as a general expense of the Partnership, as determined appropriate under the circumstances by the General Partner
(b) Notwithstanding any other provision of this Agreement, the General Partner is authorized to take any action that may be required to cause the Partnership and other Group Members to comply with any withholding requirements established under the Code or any other federal, state or local law including pursuant to Sections 1441, 1442, 1445 and 1446 of
the Code. To the extent that the Partnership is required or elects to withhold and pay over to any taxing authority any amount resulting from the allocation or distribution of income to any Partner (including by reason of Section 1446 of the Code), the General Partner may treat the amount withheld as a distribution of cash pursuant to Section 6.3 in the amount of such withholding from such Partner.
ARTICLE X
ADMISSION OF PARTNERS
Section 10.1 Admission of Limited Partners.
(a) Upon the issuance by the Partnership of Common Units, Subordinated Units and Incentive Distribution Rights to the General Partner, the Organizational Limited Partner and the Underwriters as described in Article V in connection with the Initial Offering, such parties shall be automatically admitted to the Partnership as Initial Limited Partners in respect of the Common Units, Subordinated Units or Incentive Distribution Rights issued to them.
(b) By acceptance of the transfer of any Limited Partner Interests in accordance with Article IV or the acceptance of any Limited Partner Interests issued pursuant to Article V or pursuant to a merger or consolidation or conversion pursuant to Article XIV, and except as provided in Section 4.8, each transferee of, or other such Person acquiring, a Limited Partner Interest (including any nominee holder or an agent or representative acquiring such Limited Partner Interests for the account of another Person) (i) shall be admitted to the Partnership as a Limited Partner with respect to the Limited Partner Interests so transferred or issued to such Person when any such transfer or admission is reflected in the books and records of the Partnership and such Limited Partner becomes the Record Holder of the Limited Partner Interests so transferred, (ii) shall become bound, and shall be deemed to have agreed to be bound, by the terms of this Agreement, (iii) represents that the transferee or other recipient has the capacity, power and authority to enter into this Agreement and (iv) makes the consents, acknowledgements and waivers contained in this Agreement, all with or without execution of this Agreement by such Person. The transfer of any Limited Partner Interests and the admission of any new Limited Partner shall not constitute an amendment to this Agreement. A Person may become a Limited Partner or Record Holder of a Limited Partner Interest without the consent or approval of any of the Partners. A Person may not become a Limited Partner without acquiring a Limited Partner Interest and until such Person is reflected in the books and records of the Partnership as the Record Holder of such Limited Partner Interest. The rights and obligations of a Person who is an Ineligible Holder shall be determined in accordance with Section 4.8.
(c) The name and mailing address of each Limited Partner shall be listed on the books and records of the Partnership maintained for such purpose by the Partnership or the Transfer Agent. The General Partner shall update the books and records of the Partnership from time to time as necessary to reflect accurately the information therein (or shall cause the Transfer Agent to do so, as applicable). A Limited Partner Interest may be represented by a Certificate, as provided in Section 4.1.
(d) Any transfer of a Limited Partner Interest shall not entitle the transferee to share in the profits and losses, to receive distributions, to receive allocations of income, gain, loss, deduction or credit or any similar item or to any other rights to which the transferor was entitled until the transferee becomes a Limited Partner pursuant to Section 10.1(b).
Section 10.2 Admission of Substituted Limited Partners. By transfer of a Limited Partner Interest in accordance with Article IV, the transferor shall have given the transferee the right to seek admission as a Substituted Limited Partner subject to the conditions of, and in the manner permitted under, this Agreement. Notwithstanding any other provision of this Agreement, a permitted transferee of a Limited Partner Interest who does not execute and deliver a Transfer Application (including a Citizenship Certification) shall not be admitted as a Limited Partner and shall have only the rights of an Assignee hereunder, which rights shall include (a) the right to transfer such Limited Partner Interest to a purchaser or other transferee and (b) the right to transfer the right to request admission as a Substituted Limited Partner to such purchaser or other transferee in respect of the transferred Limited Partner Interests. Notwithstanding the foregoing sentence or any provision of this Section 10.2 or other provision of this Agreement, any transferee or other owner or holder of a Limited Partner Interest who does not execute and deliver a properly completed Citizenship Certification shall be subject in all respects to the provisions of this Agreement that apply in such event, including the provisions of Sections 4.8 and 4.9 hereof. No transferor of a Limited Partner Interest or other Person shall have any obligation or responsibility to provide a Transfer Application to a transferee or to assist or participate in any way with respect to or to ensure the completion or delivery thereof or have any liability or responsibility if the transferee neglects or chooses not to execute and deliver a properly completed Transfer Application. Each transferee of a Limited Partner Interest (including any nominee holder or an agent acquiring such Limited Partner Interest for the account of another Person) who executes and delivers a properly completed Transfer Application, containing a Citizenship Certification, shall, by virtue of such execution and delivery, be admitted to the Partnership as a Substituted Limited Partner with respect to the Limited Partner Interests so transferred to such Person at such time as such transfer is recorded in the books and records of the Partnership. The General Partner shall periodically, but no less frequently than on the first Business Day of each calendar quarter, cause any unrecorded transfers of Limited Partner Interests with respect to which a properly completed, duly executed and delivered Transfer Application has been received to be recorded in the books and records of the Partnership. Subject to Section 4.8, with respect to voting rights hereunder attributable to Limited Partner Interests that are held by Assignees, the General Partner shall be deemed to be the Limited Partner with respect thereto and shall, in exercising the voting rights in respect of such Limited Partner Interests on any matter, vote such Limited Partner Interests at the written direction of the Assignee who is the Record Holder of such Limited Partner Interests. If no such written direction is received, such Limited Partner Interests will not be voted. Except as expressly provided in this Agreement, an Assignee shall have no other rights of a Limited Partner hereunder, under the Delaware Act, at law, in equity or otherwise.
Section 10.3 Admission of Successor General Partner. A successor General Partner approved pursuant to Section 11.1 or Section 11.2 or the transferee of or successor to all of the General Partner Interest pursuant to Section 4.6 who is proposed to be admitted as a successor General Partner shall be admitted to the Partnership as the General Partner, effective immediately prior to the withdrawal or removal of the predecessor or transferring General Partner, pursuant to Section 11.1 or 11.2 or the transfer of the General Partner Interest pursuant to Section 4.6,provided,however, that no such successor shall be admitted to the Partnership until compliance with the terms of Section 4.6 has occurred and such successor has executed and delivered such other documents or instruments as may be required to effect such admission. Any such successor shall, subject to the terms hereof, carry on the business of the members of the Partnership Group without dissolution.
Section 10.4 Amendment of Agreement and Certificate of Limited Partnership. To effect the admission to the Partnership of any Partner, the General Partner shall take all steps necessary or appropriate under the Delaware Act to amend the records of the Partnership to reflect such
admission and, if necessary, to prepare as soon as practicable an amendment to this Agreement and, if required by law, the General Partner shall prepare and file an amendment to the Certificate of Limited Partnership.
ARTICLE XI
WITHDRAWAL OR REMOVAL OF PARTNERS
Section 11.1 Withdrawal of the General Partner.
(a) The General Partner shall be deemed to have withdrawn from the Partnership upon the occurrence of any one of the following events (each such event herein referred to as an "Event of Withdrawal");
(i) The General Partner voluntarily withdraws from the Partnership by giving written notice to the other Partners;
(ii) The General Partner transfers all of its General Partner Interest pursuant to Section 4.6;
(iii) The General Partner is removed pursuant to Section 11.2;
(iv) The General Partner (A) makes a general assignment for the benefit of creditors; (B) files a voluntary bankruptcy petition for relief under Chapter 7 of the United States Bankruptcy Code; (C) files a petition or answer seeking for itself a liquidation, dissolution or similar relief (but not a reorganization) under any law; (D) files an answer or other pleading admitting or failing to contest the material allegations of a petition filed against the General Partner in a proceeding of the type described in clauses (A)-(C) of this Section 11.1(a)(iv); or (E) seeks, consents to or acquiesces in the appointment of a trustee (but not a debtor-in-possession), receiver or liquidator of the General Partner or of all or any substantial part of its properties;
(v) A final and non-appealable order of relief under Chapter 7 of the United States Bankruptcy Code is entered by a court with appropriate jurisdiction pursuant to a voluntary or involuntary petition by or against the General Partner; or
(vi) (A) in the event the General Partner is a corporation, a certificate of dissolution or its equivalent is filed for the General Partner, or 90 days expire after the date of notice to the General Partner of revocation of its charter without a reinstatement of its charter, under the laws of its state of incorporation; (B) in the event the General Partner is a partnership or a limited liability company, the dissolution and commencement of winding up of the General Partner; (C) in the event the General Partner is acting in such capacity by virtue of being a trustee of a trust, the termination of the trust; (D) in the event the General Partner is a natural person, his death or adjudication of incompetency; and (E) otherwise in the event of the termination of the General Partner.
If an Event of Withdrawal specified in Section 11.1(a)(iv), (v) or (vi)(A), (B), (C) or (E) occurs, the withdrawing General Partner shall give notice to the Limited Partners within 30 days after such occurrence. The Partners hereby agree that only the Events of Withdrawal described in this Section 11.1 shall result in the withdrawal of the General Partner from the Partnership.
(b) Withdrawal of the General Partner from the Partnership upon the occurrence of an Event of Withdrawal shall not constitute a breach of this Agreement under the following circumstances: (i) at any time during the period beginning on the Closing Date and ending at 11:59 pm, prevailing Central Time, on JuneSeptember 30, 2020, the General Partner voluntarily withdraws by giving at least 90 days' advance notice of its intention to withdraw to the Limited Partners; provided, that prior to the effective date of such withdrawal, the withdrawal is approved by Unitholders holding at least a majority of the Outstanding Common Units (excluding Common Units held by the General Partner and its Affiliates) and the General Partner delivers to the Partnership an Opinion of Counsel ("Withdrawal Opinion of Counsel") that such withdrawal (following the selection of the successor General Partner) would not result in the loss of the limited liability under the Delaware Act of any Limited Partner or cause any Group Member to be treated as an association taxable as a corporation or otherwise to be taxed as an entity for federal income tax purposes (to the extent not already so treated or taxed); (ii) at any time after 11:59 pm, prevailing Central Time, on JuneSeptember 30, 2020, the General Partner voluntarily withdraws by giving at least 90 days' advance notice to the Unitholders, such withdrawal to take effect on the date specified in such notice; (iii) at any time that the General Partner ceases to be the General Partner pursuant to Section 11.1(a)(ii) or is removed pursuant to Section 11.2; or (iv) notwithstanding clause (i) of this sentence, at any time that the General Partner voluntarily withdraws by giving at least 90 days' advance notice of its intention to withdraw to the Limited Partners, such withdrawal to take effect on the date specified in the notice, if at the time such notice is given one Person and its Affiliates (other than the General Partner and its Affiliates) own beneficially or of record or control at least 50% of the Outstanding Units. The withdrawal of the General Partner from the Partnership upon the occurrence of an Event of Withdrawal shall also constitute the withdrawal of the General Partner as general partner or managing member, if any, to the extent applicable, of the other Group Members. If the General Partner gives a notice of withdrawal pursuant to Section 11.1(a)(i), the holders of a Unit Majority, may, prior to the effective date of such withdrawal, elect a successor General Partner. The Person so elected as successor General Partner shall automatically become the successor general partner or managing member, to the extent applicable, of the other Group Members of which the General Partner is a general partner or a managing member. If, prior to the effective date of the General Partner's withdrawal pursuant to Section 11.1(a)(i), a successor is not selected by the Unitholders as provided herein or the Partnership does not receive a Withdrawal Opinion of Counsel, the Partnership shall be dissolved in accordance with Section 12.1 unless the business of the Partnership is continued pursuant to Section 12.2. Any successor General Partner elected in accordance with the terms of this Section 11.1 shall be subject to the provisions of Section 10.3.
Section 11.2 Removal of the General Partner. The General Partner may be removed if such removal is approved by the Unitholders holding at least 662/3% of the Outstanding Units (including Units held by the General Partner and its Affiliates) voting as a single class. Any such action by such holders for removal of the General Partner must also provide for the election of a successor General Partner by the Unitholders holding a majority of the outstanding Common Units, voting as a class, and a majority of the outstanding Subordinated Units, voting as a class (including, in each case, Units held by the General Partner and its Affiliates). Such removal shall be effective immediately following the admission of a successor General Partner pursuant to Section 10.3. The removal of the General Partner shall also automatically constitute the removal of the General Partner as general partner or managing member, to the extent applicable, of the other Group Members of which the General Partner is a general partner or a managing member. If a Person is elected as a successor General Partner in accordance with the terms of this Section 11.2, such Person shall, upon admission pursuant to Section 10.3, automatically become a successor general partner or managing member, to the extent applicable, of the other Group
Members of which the General Partner is a general partner or a managing member. The right of the holders of Outstanding Units to remove the General Partner shall not exist or be exercised unless the Partnership has received an opinion opining as to the matters covered by a Withdrawal Opinion of Counsel. Any successor General Partner elected in accordance with the terms of this Section 11.2 shall be subject to the provisions of Section 10.3.
Section 11.3 Interest of Departing General Partner and Successor General Partner.
(a) In the event of (i) withdrawal of the General Partner under circumstances where such withdrawal does not violate this Agreement or (ii) removal of the General Partner by the holders of Outstanding Units under circumstances where Cause does not exist, if the successor General Partner is elected in accordance with the terms of Section 11.1 or Section 11.2, the Departing General Partner shall have the option, exercisable prior to the effective date of the withdrawal or removal of such Departing General Partner, to require its successor to purchase its General Partner Interest and its or its Affiliates' general partner interest (or equivalent interest), if any, in the other Group Members and all of its or its Affiliates' Incentive Distribution Rights (collectively, the "Combined Interest") in exchange for an amount in cash equal to the fair market value of such Combined Interest, such amount to be determined and payable as of the effective date of its withdrawal or removal. If the General Partner is removed by the Unitholders under circumstances where Cause exists or if the General Partner withdraws under circumstances where such withdrawal violates this Agreement, and if a successor General Partner is elected in accordance with the terms of Section 11.1 or Section 11.2 (or if the business of the Partnership is continued pursuant to Section 12.2 and the successor General Partner is not the former General Partner), such successor shall have the option, exercisable prior to the effective date of the withdrawal or removal of such Departing General Partner (or, in the event the business of the Partnership is continued, prior to the date the business of the Partnership is continued), to purchase the Combined Interest for such fair market value of such Combined Interest. In either event, the Departing General Partner shall be entitled to receive all reimbursements due such Departing General Partner pursuant to Section 7.4, including any employee-related liabilities (including severance liabilities), incurred in connection with the termination of any employees employed by the Departing General Partner or its Affiliates (other than any Group Member) for the benefit of the Partnership or the other Group Members.
For purposes of this Section 11.3(a), the fair market value of the Combined Interest shall be determined by agreement between the Departing General Partner and its successor or, failing agreement within 30 days after the effective date of such Departing General Partner's withdrawal or removal, by an independent investment banking firm or other independent expert selected by the Departing General Partner and its successor, which, in turn, may rely on other experts, and the determination of which shall be conclusive as to such matter. If such parties cannot agree upon one independent investment banking firm or other independent expert within 45 days after the effective date of such withdrawal or removal, then the Departing General Partner shall designate an independent investment banking firm or other independent expert, the Departing General Partner's successor shall designate an independent investment banking firm or other independent expert, and such firms or experts shall mutually select a third independent investment banking firm or independent expert, which third independent investment banking firm or other independent expert shall determine the fair market value of the Combined Interest. In making its determination, such third independent investment banking firm or other independent expert may consider the value of the Units, including the then current trading price of Units on any National Securities Exchange on which Units are then listed or admitted to trading, the value of the Partnership's assets, the rights and obligations of the Departing General Partner, the value of the Incentive Distribution Rights and the General Partner Interest and other factors it may deem relevant.
(b) If the Combined Interest is not purchased in the manner set forth in Section 11.3(a), the Departing General Partner (or its transferee) shall become a Limited Partner and the Combined Interest shall be converted into Common Units pursuant to a valuation made by an investment banking firm or other independent expert selected pursuant to Section 11.3(a), without reduction in such Partnership Interest (but subject to proportionate dilution by reason of the admission of its successor). Any successor General Partner shall indemnify the Departing General Partner (or its transferee) as to all debts and liabilities of the Partnership arising on or after the date on which the Departing General Partner (or its transferee) becomes a Limited Partner. For purposes of this Agreement, conversion of the Combined Interest to Common Units will be characterized as if the Departing General Partner (or its transferee) contributed the Combined Interest to the Partnership in exchange for the newly issued Common Units.
(c) If a successor General Partner is elected in accordance with the terms of Section 11.1 or Section 11.2 (or if the business of the Partnership is continued pursuant to Section 12.2 and the successor General Partner is not the former General Partner) and the option described in Section 11.3(a) is not exercised by the party entitled to do so, the successor General Partner shall, at the effective date of its admission to the Partnership, contribute to the Partnership cash in the amount equal to the product of (x) the quotient obtained by dividing (A) the Percentage Interest of the General Partner Interest of the Departing General Partner by (B) a percentage equal to 100% less the Percentage Interest of the General Partner Interest of the Departing General Partner and (y) the Net Agreed Value of the Partnership's assets on such date. In such event, such successor General Partner shall, subject to the following sentence, be entitled to its Percentage Interest of all Partnership allocations and distributions to which the Departing General Partner was entitled. In addition, the successor General Partner shall cause this Agreement to be amended to reflect that, from and after the date of such successor General Partner's admission, the successor General Partner's interest in all Partnership distributions and allocations shall be its Percentage Interest.
Section 11.4 Termination of Subordination Period, Conversion of Subordinated Units and Extinguishment of Cumulative Common Unit Arrearages. Notwithstanding any provision of this Agreement, if the General Partner is removed as general partner of the Partnership under circumstances where Cause does not exist:
(a) the Subordinated Units held by any Person will immediately and automatically convert into Common Units on a one-for-one basis, provided (i) neither such Person nor any of its Affiliates voted any of its Units in favor of the removal and (ii) such Person is not an Affiliate of the successor General Partner; and
(b) if all of the Subordinated Units convert into Common Units pursuant to Section 11.4(a), all Cumulative Common Unit Arrearages on the Common Units will be extinguished and the Subordination Period will end;
provided,however, that such converted Subordinated Units shall remain subject to the provisions of Sections 5.5(c)(ii), 6.1(d)(x) and 6.7.
Section 11.5 Withdrawal of Limited Partners. No Limited Partner shall have any right to withdraw from the Partnership;provided,however, that when a transferee of a Limited Partner's Limited Partner Interest becomes a Record Holder of the Limited Partner Interest so transferred, such transferring Limited Partner shall cease to be a Limited Partner with respect to the Limited Partner Interest so transferred.
ARTICLE XII
DISSOLUTION AND LIQUIDATION
Section 12.1 Dissolution. The Partnership shall not be dissolved by the admission of Substituted Limited Partners or additional Limited Partners or by the admission of a successor General Partner in accordance with the terms of this Agreement. Upon the removal or withdrawal of the General Partner, if a successor General Partner is elected pursuant to Section 11.1, 11.2 or 12.2, the Partnership shall not be dissolved and such successor General Partner is hereby authorized to, and shall, continue the business of the Partnership. Subject to Section 12.2, the Partnership shall dissolve, and its affairs shall be wound up, upon:
(a) an Event of Withdrawal of the General Partner as provided in Section 11.1(a) (other than Section 11.1(a)(ii)), unless a successor is elected and such successor is admitted to the Partnership pursuant to this Agreement;
(b) an election to dissolve the Partnership by the General Partner that is approved by the holders of a Unit Majority;
(c) the entry of a decree of judicial dissolution of the Partnership pursuant to the provisions of the Delaware Act; or
(d) at any time there are no Limited Partners, unless the Partnership is continued without dissolution in accordance with the Delaware Act.
Section 12.2 Continuation of the Business of the Partnership After Dissolution. Upon (a) an Event of Withdrawal caused by the withdrawal or removal of the General Partner as provided in Section 11.1(a)(i) or (iii) and the failure of the Partners to select a successor to such Departing General Partner pursuant to Section 11.1 or Section 11.2, then within 90 days thereafter, or (b) an event constituting an Event of Withdrawal as defined in Section 11.1(a)(iv), (v) or (vi), then, to the maximum extent permitted by law, within 180 days thereafter, the holders of a Unit Majority may elect to continue the business of the Partnership on the same terms and conditions set forth in this Agreement by appointing as a successor General Partner a Person approved by the holders of a Unit Majority. Unless such an election is made within the applicable time period as set forth above, the Partnership shall conduct only activities necessary to wind up its affairs. If such an election is so made, then:
(i) the Partnership shall continue without dissolution unless earlier dissolved in accordance with this Article XII;
(ii) if the successor General Partner is not the former General Partner, then the interest of the former General Partner shall be treated in the manner provided in Section 11.3; and
(iii) the successor General Partner shall be admitted to the Partnership as General Partner, effective as of the Event of Withdrawal, by agreeing in writing to be bound by this Agreement;provided, that the right of the holders of a Unit Majority to approve a successor General Partner and to continue the business of the Partnership shall not exist and may not be exercised unless the Partnership has received an Opinion of Counsel that (x) the exercise of the right would not result in the loss of limited liability under the Delaware Act of any Limited Partner and (y) neither the Partnership nor any Group Member would be treated as an association taxable as a corporation or otherwise be taxable as an entity for federal
income tax purposes upon the exercise of such right to continue (to the extent not already so treated or taxed).
Section 12.3 Liquidator. Upon dissolution of the Partnership, unless the business of the Partnership is continued pursuant to Section 12.2, the General Partner shall select one or more Persons to act as Liquidator. The Liquidator (if other than the General Partner) shall be entitled to receive such compensation for its services as may be approved by holders of at least a majority of the Outstanding Common Units and Subordinated Units, voting as a single class. The Liquidator (if other than the General Partner) shall agree not to resign at any time without 15 days' prior notice and may be removed at any time, with or without cause, by notice of removal approved by holders of at least a majority of the Outstanding Common Units and Subordinated Units, voting as a single class. Upon dissolution, removal or resignation of the Liquidator, a successor and substitute Liquidator (who shall have and succeed to all rights, powers and duties of the original Liquidator) shall within 30 days thereafter be approved by holders of at least a majority of the Outstanding Common Units and Subordinated Units, voting as a single class. The right to approve a successor or substitute Liquidator in the manner provided herein shall be deemed to refer also to any such successor or substitute Liquidator approved in the manner herein provided. Except as expressly provided in this Article XII, the Liquidator approved in the manner provided herein shall have and may exercise, without further authorization or consent of any of the parties hereto, all of the powers conferred upon the General Partner under the terms of this Agreement (but subject to all of the applicable limitations, contractual and otherwise, upon the exercise of such powers, other than the limitation on sale set forth in Section 7.3) necessary or appropriate to carry out the duties and functions of the Liquidator hereunder for and during the period of time required to complete the winding up and liquidation of the Partnership as provided for herein.
Section 12.4 Liquidation. The Liquidator shall proceed to dispose of the assets of the Partnership, discharge its liabilities, and otherwise wind up its affairs in such manner and over such period as determined by the Liquidator, subject to Section 17-804 of the Delaware Act and the following:
(a) The assets may be disposed of by public or private sale or by distribution in kind to one or more Partners on such terms as the Liquidator and such Partner or Partners may agree. If any property is distributed in kind, the Partner receiving the property shall be deemed for purposes of Section 12.4(c) to have received cash equal to its fair market value; and contemporaneously therewith, appropriate cash distributions must be made to the other Partners. The Liquidator may defer liquidation or distribution of the Partnership's assets for a reasonable time if it determines that an immediate sale or distribution of all or some of the Partnership's assets would be impractical or would cause undue loss to the Partners. The Liquidator may distribute the Partnership's assets, in whole or in part, in kind if it determines that a sale would be impractical or would cause undue loss to the Partners.
(b) Liabilities of the Partnership include amounts owed to the Liquidator as compensation for serving in such capacity (subject to the terms of Section 12.3) and amounts to Partners otherwise than in respect of their distribution rights under Article VI. With respect to any liability that is contingent, conditional or unmatured or is otherwise not yet due and payable, the Liquidator shall either settle such claim for such amount as it thinks appropriate or establish a reserve of cash or other assets to provide for its payment. When paid, any unused portion of the reserve shall be distributed as additional liquidation proceeds.
(c) All property and all cash in excess of that required to discharge liabilities as provided in Section 12.4(b) shall be distributed to the Partners in accordance with, and to the extent of, the positive balances in their respective Capital Accounts, as determined after taking into account all Capital Account adjustments (other than those made by reason of distributions pursuant to this Section 12.4(c)) for the taxable period of the Partnership during which the liquidation of the Partnership occurs (with such date of occurrence being determined pursuant to Treasury Regulation Section 1.704-1(b)(2)(ii)(g)), and such distribution shall be made by the end of such taxable period (or, if later, within 90 days after said date of such occurrence).
Section 12.5 Cancellation of Certificate of Limited Partnership. Upon the completion of the distribution of Partnership cash and property as provided in Section 12.4 in connection with the liquidation of the Partnership, the Certificate of Limited Partnership and all qualifications of the Partnership as a foreign limited partnership in jurisdictions other than the State of Delaware shall be canceled and such other actions as may be necessary to terminate the Partnership shall be taken.
Section 12.6 Return of Contributions. The General Partner shall not be personally liable for, and shall have no obligation to contribute or loan any monies or property to the Partnership to enable it to effectuate, the return of the Capital Contributions of the Limited Partners or Unitholders, or any portion thereof, it being expressly understood that any such return shall be made solely from Partnership assets.
Section 12.7 Waiver of Partition. To the maximum extent permitted by law, each Partner hereby waives any right to partition of the Partnership property.
Section 12.8 Capital Account Restoration. No Limited Partner shall have any obligation to restore any negative balance in its Capital Account upon liquidation of the Partnership. The General Partner shall be obligated to restore any negative balance in its Capital Account upon liquidation of its interest in the Partnership by the end of the taxable period of the Partnership during which such liquidation occurs, or, if later, within 90 days after the date of such liquidation.
ARTICLE XIII
AMENDMENT OF PARTNERSHIP AGREEMENT; MEETINGS; RECORD DATE
Section 13.1 Amendments to be Adopted Solely by the General Partner. Each Partner agrees that the General Partner, without the approval of any Partner or Assignee, may amend any provision of this Agreement and execute, swear to, acknowledge, deliver, file and record whatever documents may be required in connection therewith, to reflect:
(a) a change in the name of the Partnership, the location of the principal place of business of the Partnership, the registered agent of the Partnership or the registered office of the Partnership;
(b) admission, substitution, withdrawal or removal of Partners in accordance with this Agreement;
(c) a change that the General Partner determines to be necessary or appropriate to qualify or continue the qualification of the Partnership as a limited partnership or a partnership in which the Limited Partners have limited liability under the laws of any state or to ensure that the Group Members will not be treated as associations taxable as corporations or otherwise taxed as entities for federal income tax purposes;
(d) a change that the General Partner determines (i) does not adversely affect the Limited Partners (including any particular class of Partnership Interests as compared to other classes of Partnership Interests) in any material respect, (ii) to be necessary or appropriate to (A) satisfy any requirements, conditions or guidelines contained in any opinion, directive, order, ruling or regulation of any federal or state agency or judicial authority or contained in any federal or state statute (including the Delaware Act) or (B) facilitate the trading of the Units (including the division of any class or classes of Outstanding Units into different classes to facilitate uniformity of tax consequences within such classes of Units) or comply with any rule, regulation, guideline or requirement of any National Securities Exchange on which the Units are or will be listed or admitted to trading, (iii) to be necessary or appropriate in connection with action taken by the General Partner pursuant to Section 5.9 or (iv) is required to effect the intent expressed in the Registration Statement or the intent of the provisions of this Agreement or is otherwise contemplated by this Agreement;
(e) a change in the fiscal year or taxable period of the Partnership and any other changes that the General Partner determines to be necessary or appropriate as a result of a change in the fiscal year or taxable period of the Partnership including, if the General Partner shall so determine, a change in the definition of "Quarter" and the dates on which distributions are to be made by the Partnership;
(f) an amendment that is necessary, in the Opinion of Counsel, to prevent the Partnership, or the General Partner or its directors, officers, trustees or agents from in any manner being subjected to the provisions of the Investment Company Act of 1940, as amended, the Investment Advisers Act of 1940, as amended, or "plan asset" regulations adopted under the Employee Retirement Income Security Act of 1974, as amended, regardless of whether such are substantially similar to plan asset regulations currently applied or proposed by the United States Department of Labor;
(g) an amendment that the General Partner determines to be necessary or appropriate in connection with the creation, authorization or issuance of any class or series of Partnership Interests and options, rights, warrants and appreciation rights relating to the Partnership Interests pursuant to Section 5.6;
(h) any amendment expressly permitted in this Agreement to be made by the General Partner acting alone;
(i) an amendment effected, necessitated or contemplated by a Merger Agreement approved in accordance with Section 14.3;
(j) an amendment that the General Partner determines to be necessary or appropriate to reflect and account for the formation by the Partnership of, or investment by the Partnership in, any corporation, partnership, joint venture, limited liability company or other entity, in connection with the conduct by the Partnership of activities permitted by the terms of Section 2.4 or 7.1(a);
(k) a merger, conveyance or conversion pursuant to Section 14.3(d); or
(l) any other amendments substantially similar to the foregoing.
Section 13.2 Amendment Procedures. Amendments to this Agreement may be proposed only by the General Partner. To the fullest extent permitted by law, the General Partner shall have no duty or obligation to propose or approve any amendment to this Agreement and may
decline to do so in its sole discretion, and, in declining to propose or approve an amendment, to the fullest extent permitted by law shall not be required to act in good faith or pursuant to any other standard imposed by this Agreement, any Group Member Agreement, any other agreement contemplated hereby or under the Delaware Act or any other law, rule or regulation or at equity. An amendment shall be effective upon its approval by the General Partner and, except as otherwise provided by Section 13.1 or 13.3, the holders of a Unit Majority, unless a greater or different percentage is required under this Agreement or by Delaware law. Each proposed amendment that requires the approval of the holders of a specified percentage of Outstanding Units shall be set forth in a writing that contains the text of the proposed amendment. If such an amendment is proposed, the General Partner shall seek the written approval of the requisite percentage of Outstanding Units or call a meeting of the Unitholders to consider and vote on such proposed amendment. The General Partner shall notify all Record Holders upon final adoption of any amendments. The General Partner shall be deemed to have notified all Record Holders as required by this Section 13.2 if it has either (i) filed such amendment with the Commission via its Electronic Data Gathering, Analysis and Retrieval system and such amendment is publicly available on such system or (ii) made such amendment available on any publicly available website maintained by the Partnership
Section 13.3 Amendment Requirements.
(a) Notwithstanding the provisions of Section 13.1 and Section 13.2, no provision of this Agreement that establishes a percentage of Outstanding Units (including Units deemed owned by the General Partner) required to take any action shall be amended, altered, changed, repealed or rescinded in any respect that would have the effect of (i) in the case of any provision of this Agreement other than Section 11.2 or Section 13.4, reducing such percentage or (ii) in the case of Section 11.2 or Section 13.4, increasing such percentage, unless such amendment is approved by the written consent or the affirmative vote of holders of Outstanding Units whose aggregate Outstanding Units constitute not less than the voting requirement sought to be reduced or increased, as applicable.
(b) Notwithstanding the provisions of Section 13.1 and Section 13.2, no amendment to this Agreement may (i) enlarge the obligations of (including requiring any holder of a class of Partnership Interests to make additional Capital Contributions to the Partnership) any Limited Partner without its consent, unless such shall be deemed to have occurred as a result of an amendment approved pursuant to Section 13.3(c), or (ii) enlarge the obligations of, restrict, change or modify in any way any action by or rights of, or reduce in any way the amounts distributable, reimbursable or otherwise payable to, the General Partner or any of its Affiliates without its consent, which consent may be given or withheld at its option.
(c) Except as provided in Section 14.3 or Section 13.1, any amendment that would have a material adverse effect on the rights or preferences of any class of Partnership Interests in relation to other classes of Partnership Interests must be approved by the holders of not less than a majority of the Outstanding Partnership Interests of the class affected. If the General Partner determines an amendment does not satisfy the requirements of Section 13.1(d)(i) because it adversely affects one or more classes of Partnership Interests, as compared to other classes of Partnership Interests, in any material respect, such amendment shall only be required to be approved by the adversely affected class or classes.
(d) Notwithstanding any other provision of this Agreement, except for amendments pursuant to Section 13.1 and except as otherwise provided by Section 14.3(b), no amendments shall become effective without the approval of the holders of at least 90% of the Outstanding Units voting as a single class unless the Partnership obtains an Opinion of Counsel to the effect that such amendment will not affect the limited liability of any Limited
Partner under applicable partnership law of the state under whose laws the Partnership is organized.
(e) Except as provided in Section 13.1, this Section 13.3 shall only be amended with the approval of the holders of at least 90% of the Outstanding Units.
Section 13.4 Special Meetings. All acts of Limited Partners to be taken pursuant to this Agreement shall be taken in the manner provided in this Article XIII. Special meetings of the Limited Partners may be called by the General Partner or by Limited Partners owning 20% or more of the Outstanding Units of the class or classes for which a meeting is proposed. Limited Partners shall call a special meeting by delivering to the General Partner one or more requests in writing stating that the signing Limited Partners wish to call a special meeting and indicating the general or specific purposes for which the special meeting is to be called. Within 60 days after receipt of such a call from Limited Partners or within such greater time as may be reasonably necessary for the Partnership to comply with any statutes, rules, regulations, listing agreements or similar requirements governing the holding of a meeting or the solicitation of proxies for use at such a meeting, the General Partner shall send a notice of the meeting to the Limited Partners either directly or indirectly through the Transfer Agent. A meeting shall be held at a time and place determined by the General Partner on a date not less than 10 days nor more than 60 days after the time notice of the meeting is given as provided in Section 16.1. Limited Partners shall not vote on matters that would cause the Limited Partners to be deemed to be taking part in the management and control of the business and affairs of the Partnership so as to jeopardize the Limited Partners' limited liability under the Delaware Act or the law of any other state in which the Partnership is qualified to do business.
Section 13.5 Notice of a Meeting. Notice of a meeting called pursuant to Section 13.4 shall be given to the Record Holders of the class or classes of Units for which a meeting is proposed in writing by mail or other means of written communication in accordance with Section 16.1. The notice shall be deemed to have been given at the time when deposited in the mail or sent by other means of written communication.
Section 13.6 Record Date. For purposes of determining the Limited Partners entitled to notice of or to vote at a meeting of the Limited Partners or to give approvals without a meeting as provided in Section 13.11 the General Partner may set a Record Date, which shall not be less than 10 nor more than 60 days before (a) the date of the meeting (unless such requirement conflicts with any rule, regulation, guideline or requirement of any National Securities Exchange on which the Units are listed or admitted to trading or U.S. federal securities laws, in which case the rule, regulation, guideline or requirement of such National Securities Exchange or U.S. federal securities laws shall govern) or (b) in the event that approvals are sought without a meeting, the date by which Limited Partners are requested in writing by the General Partner to give such approvals. If the General Partner does not set a Record Date, then (a) the Record Date for determining the Limited Partners entitled to notice of or to vote at a meeting of the Limited Partners shall be the close of business on the day next preceding the day on which notice is given, and (b) the Record Date for determining the Limited Partners entitled to give approvals without a meeting shall be the date the first written approval is deposited with the Partnership in care of the General Partner in accordance with Section 13.11.
Section 13.7 Adjournment. When a meeting is adjourned to another time or place, notice need not be given of the adjourned meeting and a new Record Date need not be fixed, if the time and place thereof are announced at the meeting at which the adjournment is taken, unless such adjournment shall be for more than 45 days. At the adjourned meeting, the Partnership may transact any business which might have been transacted at the original meeting. If the
adjournment is for more than 45 days or if a new Record Date is fixed for the adjourned meeting, a notice of the adjourned meeting shall be given in accordance with this Article XIII.
Section 13.8 Waiver of Notice; Approval of Meeting; Approval of Minutes. The transactions of any meeting of Limited Partners, however called and noticed, and whenever held, shall be as valid as if it had occurred at a meeting duly held after regular call and notice, if a quorum is present either in person or by proxy. Attendance of a Limited Partner at a meeting shall constitute a waiver of notice of the meeting, except when the Limited Partner attends the meeting for the express purpose of objecting, at the beginning of the meeting, to the transaction of any business because the meeting is not lawfully called or convened; and except that attendance at a meeting is not a waiver of any right to disapprove the consideration of matters required to be included in the notice of the meeting, but not so included, if the disapproval is expressly made at the meeting.
Section 13.9 Quorum and Voting. The holders of a majority of the Outstanding Units of the class or classes for which a meeting has been called (including Outstanding Units deemed owned by the General Partner) represented in person or by proxy shall constitute a quorum at a meeting of Limited Partners of such class or classes unless any such action by the Limited Partners requires approval by holders of a greater percentage of such Units, in which case the quorum shall be such greater percentage. At any meeting of the Limited Partners duly called and held in accordance with this Agreement at which a quorum is present, the act of Limited Partners holding Outstanding Units that in the aggregate represent a majority of the Outstanding Units entitled to vote and be present in person or by proxy at such meeting shall be deemed to constitute the act of all Limited Partners, unless a greater or different percentage is required with respect to such action under the provisions of this Agreement, in which case the act of the Limited Partners holding Outstanding Units that in the aggregate represent at least such greater or different percentage shall be required. The Limited Partners present at a duly called or held meeting at which a quorum is present may continue to transact business until adjournment, notwithstanding the withdrawal of enough Limited Partners to leave less than a quorum, if any action taken (other than adjournment) is approved by the required percentage of Outstanding Units specified in this Agreement (including Outstanding Units deemed owned by the General Partner). In the absence of a quorum any meeting of Limited Partners may be adjourned from time to time by the affirmative vote of holders of at least a majority of the Outstanding Units entitled to vote at such meeting (including Outstanding Units deemed owned by the General Partner) represented either in person or by proxy, but no other business may be transacted, except as provided in Section 13.7.
Section 13.10 Conduct of a Meeting. The General Partner shall have full power and authority concerning the manner of conducting any meeting of the Limited Partners or solicitation of approvals in writing, including the determination of Persons entitled to vote, the existence of a quorum, the satisfaction of the requirements of Section 13.4, the conduct of voting, the validity and effect of any proxies and the determination of any controversies, votes or challenges arising in connection with or during the meeting or voting. The General Partner shall designate a Person to serve as chairman of any meeting and shall further designate a Person to take the minutes of any meeting. All minutes shall be kept with the records of the Partnership maintained by the General Partner. The General Partner may make such other regulations consistent with applicable law and this Agreement as it may deem advisable concerning the conduct of any meeting of the Limited Partners or solicitation of approvals in writing, including regulations in regard to the appointment of proxies, the appointment and duties of inspectors of votes and approvals, the submission and examination of proxies and other evidence of the right to vote, and the revocation of approvals in writing.
Section 13.11 Action Without a Meeting. If authorized by the General Partner, any action that may be taken at a meeting of the Limited Partners may be taken without a meeting, without a vote and without prior notice, if an approval in writing setting forth the action so taken is signed by Limited Partners owning not less than the minimum percentage of the Outstanding Units (including Outstanding Units deemed owned by the General Partner) that would be necessary to authorize or take such action at a meeting at which all the Limited Partners were present and voted (unless such provision conflicts with any rule, regulation, guideline or requirement of any National Securities Exchange on which the Units are listed or admitted to trading, in which case the rule, regulation, guideline or requirement of such National Securities Exchange shall govern). Prompt notice of the taking of action without a meeting shall be given to the Limited Partners who have not approved in writing. The General Partner may specify that any written ballot, if any, submitted to Limited Partners for the purpose of taking any action without a meeting shall be returned to the Partnership within the time period, which shall be not less than 20 days, specified by the General Partner. If a ballot returned to the Partnership does not vote all of the Units held by the Limited Partners, the Partnership shall be deemed to have failed to receive a ballot for the Units that were not voted. If approval of the taking of any action by the Limited Partners is solicited by any Person other than by or on behalf of the General Partner, the written approvals shall have no force and effect unless and until (a) they are deposited with the Partnership in care of the General Partner and (b) an Opinion of Counsel is delivered to the General Partner to the effect that the exercise of such right and the action proposed to be taken with respect to any particular matter (i) will not cause the Limited Partners to be deemed to be taking part in the management and control of the business and affairs of the Partnership so as to jeopardize the Limited Partners' limited liability, and (ii) is otherwise permissible under the state statutes then governing the rights, duties and liabilities of the Partnership and the Partners. Nothing contained in this Section 13.11 shall be deemed to require the General Partner to solicit all Limited Partners in connection with a matter approved by the holders of the requisite percentage of Units acting by written consent without a meeting.
Section 13.12 Right to Vote and Related Matters. Only those Record Holders of the Outstanding Units on the Record Date set pursuant to Section 13.6 (and also subject to the limitations contained in the definition of "Outstanding") shall be entitled to notice of, and to vote at, a meeting of Limited Partners or to act with respect to matters as to which the holders of the Outstanding Units have the right to vote or to act. All references in this Agreement to votes of, or other acts that may be taken by, the Outstanding Units shall be deemed to be references to the votes or acts of the Record Holders of such Outstanding Units.
(b) With respect to Units that are held for a Person's account by another Person (such as a broker, dealer, bank, trust company or clearing corporation, or an agent of any of the foregoing), in whose name such Units are registered, such other Person shall, in exercising the voting rights in respect of such Units on any matter, and unless the arrangement between such Persons provides otherwise, vote such Units in favor of, and at the direction of, the Person who is the beneficial owner, and the Partnership shall be entitled to assume it is so acting without further inquiry. The provisions of this Section 13.12(b) (as well as all other provisions of this Agreement) are subject to the provisions of Section 4.3.
Section 13.13 Voting of Incentive Distribution Rights.
(a) For so long as a majority of the Incentive Distribution Rights are held by the General Partner and its Affiliates, the holders of the Incentive Distribution Rights shall not be entitled to vote such Incentive Distribution Rights on any Partnership matter except as may otherwise be required by law and the holders of the Incentive Distribution Rights, in their capacity as such, shall be deemed to have approved any matter approved by the General Partner.
(b) If less than a majority of the Incentive Distribution Rights are held by the General Partner and its Affiliates, the Incentive Distribution Rights will be entitled to vote on all matters submitted to a vote of Unitholders, other than amendments and other matters that the General Partner determines do not adversely affect the holders of the Incentive Distribution Rights in any material respect. On any matter in which the holders of Incentive Distribution Rights are entitled to vote, such holders will vote together with the Subordinated Units, prior to the end of the Subordination Period, or together with the Common Units, thereafter, in either case as a single class except as otherwise required by Section 13.3(c). The relative voting power of the Incentive Distribution Rights and the Subordinated Units or Common Units, as applicable, will be set in the same proportion as cumulative cash distributions, if any, in respect of the Incentive Distribution Rights for the four consecutive Quarters prior to the record date for the vote bears to the cumulative cash distributions in respect of such class of Units for such four Quarters.
(c) In connection with any equity financing, or anticipated equity financing, by the Partnership of an Expansion Capital Expenditure, the General Partner may, without the approval of the holders of the Incentive Distribution Rights, temporarily or permanently reduce the amount of Incentive Distributions that would otherwise be distributed to such holders, provided that in the judgment of the General Partner, such reduction will be in the long-term best interest of such holders.
ARTICLE XIV
MERGER, CONSOLIDATION OR CONVERSION
Section 14.1 Authority. The Partnership may merge or consolidate with or into one or more corporations, limited liability companies, statutory trusts or associations, real estate investment trusts, common law trusts or unincorporated businesses, including a partnership (whether general or limited (including a limited liability partnership)) or convert into any such entity, whether such entity is formed under the laws of the State of Delaware or any other state of the United States of America, pursuant to a written plan of merger or consolidation ("Merger Agreement") or a written plan of conversion ("Plan of Conversion"), as the case may be, in accordance with this Article XIV.
Section 14.2 Procedure for Merger, Consolidation or Conversion. Merger, consolidation or conversion of the Partnership pursuant to this Article XIV requires the prior consent of the General Partner, provided, however , that, to the fullest extent permitted by law, the General Partner shall have no duty or obligation to consent to any merger, consolidation or conversion of the Partnership and may decline to do so free of any fiduciary duty or obligation whatsoever to the Partnership, any Limited Partner or Assignee and, in declining to consent to a merger, consolidation or conversion, shall not be required to act in good faith or pursuant to any other standard imposed by this Agreement, any other agreement contemplated hereby or under the Delaware Act or any other law, rule or regulation or at equity.
(b) If the General Partner shall determine to consent to the merger or consolidation, the General Partner shall approve the Merger Agreement, which shall set forth:
(i) the name and jurisdiction of formation or organization of each of the business entities proposing to merge or consolidate;
(ii) the name and jurisdiction of formation or organization of the business entity that is to survive the proposed merger or consolidation (the "Surviving Business Entity");
(iii) the terms and conditions of the proposed merger or consolidation;
(iv) the manner and basis of exchanging or converting the equity interests of each constituent business entity for, or into, cash, property or interests, rights, securities or obligations of the Surviving Business Entity; and (i) if any interests, securities or rights of any constituent business entity are not to be exchanged or converted solely for, or into, cash, property or interests, rights, securities or obligations of the Surviving Business Entity, then the cash, property or interests, rights, securities or obligations of any general or limited partnership, corporation, trust, limited liability company, unincorporated business or other entity (other than the Surviving Business Entity) which the holders of such interests, securities or rights are to receive in exchange for, or upon conversion of their interests, securities or rights, and (ii) in the case of equity interests represented by certificates, upon the surrender of such certificates, which cash, property or interests, rights, securities or obligations of the Surviving Business Entity or any general or limited partnership, corporation, trust, limited liability company, unincorporated business or other entity (other than the Surviving Business Entity), or evidences thereof, are to be delivered;
(v) a statement of any changes in the constituent documents or the adoption of new constituent documents (the articles or certificate of incorporation, articles of trust, declaration of trust, certificate or agreement of limited partnership, certificate of formation or limited liability company agreement or other similar charter or governing document) of the Surviving Business Entity to be effected by such merger or consolidation;
(vi) the effective time of the merger, which may be the date of the filing of the certificate of merger pursuant to Section 14.4 or a later date specified in or determinable in accordance with the Merger Agreement (provided , that if the effective time of the merger is to be later than the date of the filing of such certificate of merger, the effective time shall be fixed at a date or time certain and stated in the certificate of merger); and
(vii) such other provisions with respect to the proposed merger or consolidation that the General Partner determines to be necessary or appropriate.
(c) If the General Partner shall determine to consent to the conversion, the General Partner shall approve the Plan of Conversion, which shall set forth:
(i) the name of the converting entity and the converted entity;
(ii) a statement that the Partnership is continuing its existence in the organizational form of the converted entity;
(iii) a statement as to the type of entity that the converted entity is to be and the state or country under the laws of which the converted entity is to be incorporated, formed or organized;
(iv) the manner and basis of exchanging or converting the equity securities of each constituent business entity for, or into, cash, property or interests, rights, securities or
obligations of the converted entity or another entity, or for the cancellation of such equity securities;
(v) in an attachment or exhibit, the certificate of limited partnership of the Partnership; and
(vi) in an attachment or exhibit, the certificate of limited partnership, articles of incorporation, or other organizational documents of the converted entity;
(vii) the effective time of the conversion, which may be the date of the filing of the articles of conversion or a later date specified in or determinable in accordance with the Plan of Conversion (provided , that if the effective time of the conversion is to be later than the date of the filing of such articles of conversion, the effective time shall be fixed at a date or time certain and stated in such articles of conversion); and
(viii) such other provisions with respect to the proposed conversion that the General Partner determines to be necessary or appropriate.
Section 14.3 Approval by Limited Partners.
(a) Except as provided in Section 14.3(d), the General Partner, upon its approval of the Merger Agreement or the Plan of Conversion, as the case may be, shall direct that the Merger Agreement or the Plan of Conversion and the merger, consolidation or conversion contemplated thereby, as applicable, be submitted to a vote of Limited Partners, whether at a special meeting or by written consent, in either case in accordance with the requirements of Article XIII. A copy or a summary of the Merger Agreement or the Plan of Conversion, as the case may be, shall be included in or enclosed with the notice of a special meeting or the written consent.
(b) Except as provided in Sections 14.3(d) and 14.3(e), the Merger Agreement or Plan of Conversion, as the case may be, shall be approved upon receiving the affirmative vote or consent of the holders of a Unit Majority unless the Merger Agreement or Plan of Conversion, as the case may be, contains any provision that, if contained in an amendment to this Agreement, the provisions of this Agreement or the Delaware Act would require for its approval the vote or consent of a greater percentage of the Outstanding Units or of any class of Limited Partners, in which case such greater percentage vote or consent shall be required for approval of the Merger Agreement or the Plan of Conversion, as the case may be.
(c) Except as provided in Sections 14.3(d) and 14.3(e), after such approval by vote or consent of the Limited Partners, and at any time prior to the filing of the certificate of merger or certificate of conversion pursuant to Section 14.4, the merger, consolidation or conversion may be abandoned pursuant to provisions therefor, if any, set forth in the Merger Agreement or Plan of Conversion, as the case may be.
(d) Notwithstanding anything else contained in this Article XIV or in this Agreement, the General Partner is permitted, without Limited Partner approval, to convert the Partnership or any Group Member into a new limited liability entity, to merge the Partnership or any Group Member into, or convey all of the Partnership's assets to, another limited liability entity that shall be newly formed and shall have no assets, liabilities or operations at the time of such conversion, merger or conveyance other than those it receives from the Partnership or other Group Member if (i) the General Partner has received an
Opinion of Counsel that the conversion, merger or conveyance, as the case may be, would not result in the loss of the limited liability under the Delaware Act of any Limited Partner or cause the Partnership or any Group Member to be treated as an association taxable as a corporation or otherwise to be taxed as an entity for federal income tax purposes (to the extent not already treated as such), (ii) the sole purpose of such conversion, merger, or conveyance is to effect a mere change in the legal form of the Partnership into another limited liability entity and (iii) the governing instruments of the new entity provide the Limited Partners and the General Partner with substantially the same rights and obligations as are herein contained.
(e) Additionally, notwithstanding anything else contained in this Article XIV or in this Agreement, the General Partner is permitted, without Limited Partner approval, to merge or consolidate the Partnership with or into another entity if (A) the General Partner has received an Opinion of Counsel that the merger or consolidation, as the case may be, would not result in the loss of the limited liability under the Delaware Act of any Limited Partner or cause the Partnership or any Group Member to be treated as an association taxable as a corporation or otherwise to be taxed as an entity for federal income tax purposes (to the extent not already treated as such), (B) the merger or consolidation would not result in an amendment to this Agreement, other than any amendments that could be adopted pursuant to Section 13.1, (C) the Partnership is the Surviving Business Entity in such merger or consolidation, (D) each Unit outstanding immediately prior to the effective date of the merger or consolidation is to be an identical Unit of the Partnership after the effective date of the merger or consolidation, and (E) the number of Partnership Interests to be issued by the Partnership in such merger or consolidation does not exceed 20% of the Partnership Interests (other than Incentive Distribution Rights) Outstanding immediately prior to the effective date of such merger or consolidation.
(f) Pursuant to Section 17-211(g) of the Delaware Act, an agreement of merger or consolidation approved in accordance with this Article XIV may (a) effect any amendment to this Agreement or (b) effect the adoption of a new partnership agreement for the Partnership if it is the Surviving Business Entity. Any such amendment or adoption made pursuant to this Section 14.3 shall be effective at the effective time or date of the merger or consolidation.
Section 14.4 Certificate of Merger. Upon the required approval by the General Partner and the Unitholders of a Merger Agreement or the Plan of Conversion, as the case may be, a certificate of merger or certificate of conversion, as applicable, shall be executed and filed with the Secretary of State of the State of Delaware in conformity with the requirements of the Delaware Act.
Section 14.5 Effect of Merger, Consolidation or Conversion.
(a) At the effective time of the certificate of merger:
(i) all of the rights, privileges and powers of each of the business entities that has merged or consolidated, and all property, real, personal and mixed, and all debts due to any of those business entities and all other things and causes of action belonging to each of those business entities, shall be vested in the Surviving Business Entity and after the merger or consolidation shall be the property of the Surviving Business Entity to the extent they were of each constituent business entity;
(ii) the title to any real property vested by deed or otherwise in any of those constituent business entities shall not revert and is not in any way impaired because of the merger or consolidation;
(iii) all rights of creditors and all liens on or security interests in property of any of those constituent business entities shall be preserved unimpaired; and
(iv) all debts, liabilities and duties of those constituent business entities shall attach to the Surviving Business Entity and may be enforced against it to the same extent as if the debts, liabilities and duties had been incurred or contracted by it.
(b) At the effective time of the certificate of conversion, for all purposes of the laws of the State of Delaware:
(i) the Partnership shall continue to exist, without interruption, but in the organizational form of the converted entity rather than in its prior organizational form;
(ii) all rights, title, and interests to all real estate and other property owned by the Partnership shall remain vested in the converted entity in its new organizational form without reversion or impairment, without further act or deed, and without any transfer or assignment having occurred, but subject to any existing liens or other encumbrances thereon;
(iii) all liabilities and obligations of the Partnership shall continue to be liabilities and obligations of the converted entity in its new organizational form without impairment or diminution by reason of the conversion;
(iv) all rights of creditors or other parties with respect to or against the prior interest holders or other owners of the Partnership in their capacities as such in existence as of the effective time of the conversion will continue in existence as to those liabilities and obligations and are enforceable against the converted entity by such creditors and obligees to the same extent as if the liabilities and obligations had originally been incurred or contracted by the converted entity;
(v) the Partnership Interests that are to be converted into partnership interests, shares, evidences of ownership, or other rights or securities in the converted entity or cash as provided in the plan of conversion shall be so converted, and Partners shall be entitled only to the rights provided in the Plan of Conversion.
ARTICLE XV
RIGHT TO ACQUIRE LIMITED PARTNER INTERESTS
Section 15.1 Right to Acquire Limited Partner Interests.
(a) Notwithstanding any other provision of this Agreement, if at any time the General Partner and its Affiliates hold more than 80% of the total Limited Partner Interests of any class then Outstanding, the General Partner shall then have the right, which right it may assign and transfer in whole or in part to the Partnership or any Affiliate of the General Partner, exercisable in its sole discretion, to purchase all, but not less than all, of such Limited Partner Interests of such class then Outstanding held by Persons other than the General Partner and its Affiliates, at the greater of (x) the Current Market Price as of the date
three days prior to the date that the notice described in Section 15.1(b) is mailed and (y) the highest price paid by the General Partner or any of its Affiliates for any such Limited Partner Interest of such class purchased during the 90-day period preceding the date that the notice described in Section 15.1(b) is mailed.
(b) If the General Partner, any Affiliate of the General Partner or the Partnership elects to exercise the right to purchase Limited Partner Interests granted pursuant to Section 15.1(a), the General Partner shall deliver to the Transfer Agent notice of such election to purchase (the "Notice of Election to Purchase") and shall cause the Transfer Agent to mail a copy of such Notice of Election to Purchase to the Record Holders of Limited Partner Interests of such class (as of a Record Date selected by the General Partner) at least 10, but not more than 60, days prior to the Purchase Date. Such Notice of Election to Purchase shall also be published for a period of at least three consecutive days in at least two daily newspapers of general circulation printed in the English language and published in the Borough of Manhattan, New York. The Notice of Election to Purchase shall specify the Purchase Date and the price (determined in accordance with Section 15.1(a)) at which Limited Partner Interests will be purchased and state that the General Partner, its Affiliate or the Partnership, as the case may be, elects to purchase such Limited Partner Interests, upon surrender of Certificates representing such Limited Partner Interests in the case of Limited Partner Interests evidenced by Certificates, in exchange for payment, at such office or offices of the Transfer Agent as the Transfer Agent may specify, or as may be required by any National Securities Exchange on which such Limited Partner Interests are listed or admitted to trading. Any such Notice of Election to Purchase mailed to a Record Holder of Limited Partner Interests at his address as reflected in the records of the Transfer Agent shall be conclusively presumed to have been given regardless of whether the owner receives such notice. On or prior to the Purchase Date, the General Partner, its Affiliate or the Partnership, as the case may be, shall deposit with the Transfer Agent cash in an amount sufficient to pay the aggregate purchase price of all of such Limited Partner Interests to be purchased in accordance with this Section 15.1. If the Notice of Election to Purchase shall have been duly given as aforesaid at least 10 days prior to the Purchase Date, and if on or prior to the Purchase Date the deposit described in the preceding sentence has been made for the benefit of the holders of Limited Partner Interests subject to purchase as provided herein, then from and after the Purchase Date, notwithstanding that any Certificate shall not have been surrendered for purchase, all rights of the holders of such Limited Partner Interests (including any rights pursuant to Article III, Article IV, Article V, Article VI, and Article XII) shall thereupon cease, except the right to receive the purchase price (determined in accordance with Section 15.1(a)) for Limited Partner Interests therefor, without interest, upon surrender to the Transfer Agent of the Certificates representing such Limited Partner Interests in the case of Limited Partner Interests evidenced by Certificates, and such Limited Partner Interests shall thereupon be deemed to be transferred to the General Partner, its Affiliate or the Partnership, as the case may be, on the record books of the Transfer Agent and the Partnership, and the General Partner or any Affiliate of the General Partner, or the Partnership, as the case may be, shall be deemed to be the owner of all such Limited Partner Interests from and after the Purchase Date and shall have all rights as the owner of such Limited Partner Interests (including all rights as owner of such Limited Partner Interests pursuant to Article III, Article IV, Article V, Article VI and Article XII).
(c) In the case of Limited Partner Interests evidenced by Certificates, at any time from and after the Purchase Date, a holder of an Outstanding Limited Partner Interest subject to purchase as provided in this Section 15.1 may surrender his Certificate evidencing such Limited Partner Interest to the Transfer Agent in exchange for payment of the amount described in Section 15.1(a), therefor, without interest thereon.
ARTICLE XVI
GENERAL PROVISIONS
Section 16.1 Addresses and Notices; Written Communications.
(a) Any notice, demand, request, report or proxy materials required or permitted to be given or made to a Partner or Assignee under this Agreement shall be in writing and shall be deemed given or made when delivered in person or when sent by first class United States mail or by other means of written communication to the Partner or Assignee at the address described below. Any notice, payment or report to be given or made to a Partner or Assignee hereunder shall be deemed conclusively to have been given or made, and the obligation to give such notice or report or to make such payment shall be deemed conclusively to have been fully satisfied, upon sending of such notice, payment or report to the Record Holder of such Partnership Interests at his address as shown on the records of the Transfer Agent or as otherwise shown on the records of the Partnership, regardless of any claim of any Person who may have an interest in such Partnership Interests by reason of any assignment or otherwise. Notwithstanding the foregoing, if (i) a Partner shall consent to receiving notices, demands, requests, reports or proxy materials via electronic mail or by the Internet or (ii) the rules of the Commission shall permit any report or proxy materials to be delivered electronically or made available via the Internet, any such notice, demand, request, report or proxy materials shall be deemed given or made when delivered or made available via such mode of delivery. An affidavit or certificate of making of any notice, payment or report in accordance with the provisions of this Section 16.1 executed by the General Partner, the Transfer Agent or the mailing organization shall be prima facie evidence of the giving or making of such notice, payment or report. If any notice, payment or report given or made in accordance with the provisions of this Section 16.1 is returned marked to indicate that such notice, payment or report was unable to be delivered, such notice, payment or report and, in the case of notices, payments or reports returned by the United States Postal Service (or other physical mail delivery mail service outside the United States of America), any subsequent notices, payments and reports shall be deemed to have been duly given or made without further mailing (until such time as such Record Holder or another Person notifies the Transfer Agent or the Partnership of a change in his address) or other delivery if they are available for the Partner or Assignee at the principal office of the Partnership for a period of one year from the date of the giving or making of such notice, payment or report to the other Partners and Assignees. Any notice to the Partnership shall be deemed given if received by the General Partner at the principal office of the Partnership designated pursuant to Section 2.3. The General Partner may rely and shall be protected in relying on any notice or other document from a Partner, Assignee or other Person if believed by it to be genuine.
(b) The terms "in writing", "written communications," "written notice" and words of similar import shall be deemed satisfied under this Agreement by use of e-mail and other forms of electronic communication.
Section 16.2 Further Action. The parties shall execute and deliver all documents, provide all information and take or refrain from taking action as may be necessary or appropriate to achieve the purposes of this Agreement.
Section 16.3 Binding Effect. This Agreement shall be binding upon and inure to the benefit of the parties hereto and their heirs, executors, administrators, successors, legal representatives and permitted assigns.
Section 16.4 Integration. ThisExcept for agreements with Affiliates of the General Partner, this Agreement constitutes the entire agreement among the parties hereto pertaining to the subject matter hereof and supersedes all prior agreements and understandings pertaining thereto.
Section 16.5 Creditors. None of the provisions of this Agreement shall be for the benefit of, or shall be enforceable by, any creditor of the Partnership.
Section 16.6 Waiver. No failure by any party to insist upon the strict performance of any covenant, duty, agreement or condition of this Agreement or to exercise any right or remedy consequent upon a breach thereof shall constitute waiver of any such breach of any other covenant, duty, agreement or condition.
Section 16.7 Third-Party Beneficiaries. Each Partner agrees that (a) any Indemnitee shall be entitled to assert rights and remedies hereunder as a third-party beneficiary hereto with respect to those provisions of this Agreement affording a right, benefit or privilege to such Indemnitee and (b) any Unrestricted Person shall be entitled to assert rights and remedies hereunder as a third-party beneficiary hereto with respect to those provisions of this Agreement affording a right, benefit or privilege to such Unrestricted Person.
Section 16.8 Counterparts. This Agreement may be executed in counterparts, all of which together shall constitute an agreement binding on all the parties hereto, notwithstanding that all such parties are not signatories to the original or the same counterpart. Each party shall become bound by this Agreement immediately upon affixing its signature hereto or, in the case of a Person acquiring a Limited Partner Interest, pursuant to Section 10.1(a) without execution hereof.
Section 16.9 Applicable Law; Forum, Venue and Jurisdiction.
(a) This Agreement shall be construed in accordance with and governed by the laws of the State of Delaware, without regard to the principles of conflicts of law.
(b) Each of the Partners and each Person holding any beneficial interest in the Partnership (whether through a broker, dealer, bank, trust company or clearing corporation or an agent of any of the foregoing or otherwise):
(i) irrevocably agrees that any claims, suits, actions or proceedings (A) arising out of or relating in any way to this Agreement (including any claims, suits or actions to interpret, apply or enforce the provisions of this Agreement or the duties, obligations or liabilities among Partners or of Partners to the Partnership, or the rights or powers of, or restrictions on, the Partners or the Partnership), (B) brought in a derivative manner on behalf of the Partnership, (C) asserting a claim of breach of a fiduciary duty owed by any director, officer, or other employee of the Partnership or the General Partner, or owed by the General Partner, to the Partnership or the Partners, (D) asserting a claim arising pursuant to any provision of the Delaware Act or (E) asserting a claim governed by the internal affairs doctrine shall be exclusively brought in the Court of Chancery of the State of Delaware, in each case regardless of whether such claims, suits, actions or proceedings sound in contract, tort, fraud or otherwise, are based on common law, statutory, equitable, legal or other grounds, or are derivative or direct claims;
(ii) irrevocably submits to the exclusive jurisdiction of the Court of Chancery of the State of Delaware in connection with any such claim, suit, action or proceeding;
(iii) agrees not to, and waives any right to, assert in any such claim, suit, action or proceeding that (A) it is not personally subject to the jurisdiction of the Court of Chancery of the State of Delaware or of any other court to which proceedings in the Court of Chancery of the State of Delaware may be appealed, (B) such claim, suit, action or proceeding is brought in an inconvenient forum, or (C) the venue of such claim, suit, action or proceeding is improper;
(iv) expressly waives any requirement for the posting of a bond by a party bringing such claim, suit, action or proceeding; and
(v) consents to process being served in any such claim, suit, action or proceeding by mailing, certified mail, return receipt requested, a copy thereof to such party at the address in effect for notices hereunder, and agrees that such services shall constitute good and sufficient service of process and notice thereof; provided, nothing in clause (v) hereof shall affect or limit any right to serve process in any other manner permitted by law.
Section 16.10 Invalidity of Provisions. If any provision or part of a provision of this Agreement is or becomes for any reason, invalid, illegal or unenforceable in any respect, the validity, legality and enforceability of the remaining provisions and part thereof contained herein shall not be affected thereby and this Agreement shall, to the fullest extent permitted by law, be reformed and construed as if such invalid, illegal or unenforceable provision, or part of a provision, had never been contained herein, and such provision or part reformed so that it would be valid, legal and enforceable to the maximum extent possible.
Section 16.11 Consent of Partners. Each Partner hereby expressly consents and agrees that, whenever in this Agreement it is specified that an action may be taken upon the affirmative vote or consent of less than all of the Partners, such action may be so taken upon the concurrence of less than all of the Partners and each Partner shall be bound by the results of such action.
Section 16.12 Facsimile Signatures. The use of facsimile signatures affixed in the name and on behalf of the transfer agent and registrar of the Partnership on Certificates representing Units is expressly permitted by this Agreement.
[REMAINDER OF THIS PAGE INTENTIONALLY LEFT BLANK.]
IN WITNESS WHEREOF, the parties hereto have executed this Agreement as of the date first written above.
| GENERAL PARTNER: RHINO GP LLC | ||||
By: | ||||
| Name: | ||||
| Title: | ||||
| ORGANIZATIONAL LIMITED PARTNER: RHINO ENERGY HOLDINGS LLC | ||||
By: | ||||
| Name: | ||||
| Title: | ||||
EXHIBIT A
to the First Amended and Restated
Agreement of Limited Partnership of
Rhino Resource Partners LP
Certificate Evidencing Common Units
Representing Limited Partner Interests in
Rhino Resource Partners LP
| No. | Common Units |
In accordance with Section 4.1 of the First Amended and Restated Agreement of Limited Partnership of Rhino Resource Partners LP, as amended, supplemented or restated from time to time (the "Partnership Agreement"), Rhino Resource Partners LP, a Delaware limited partnership (the "Partnership"), hereby certifies that (the "Holder") is the registered owner of Common Units representing limited partner interests in the Partnership (the "Common Units") transferable on the books of the Partnership, in person or by duly authorized attorney, upon surrender of this Certificate properly endorsed. The rights, preferences and limitations of the Common Units are set forth in, and this Certificate and the Common Units represented hereby are issued and shall in all respects be subject to the terms and provisions of, the Partnership Agreement. Copies of the Partnership Agreement are on file at, and will be furnished without charge on delivery of written request to the Partnership at, the principal office of the Partnership located at 424 Lewis Hargett Circle, Suite 250, Lexington, Kentucky 40503. Capitalized terms used herein but not defined shall have the meanings given them in the Partnership Agreement.
THE HOLDER OF THIS SECURITY ACKNOWLEDGES FOR THE BENEFIT OF RHINO RESOURCE PARTNERS LP THAT THIS SECURITY MAY NOT BE SOLD, OFFERED, RESOLD, PLEDGED OR OTHERWISE TRANSFERRED IF SUCH TRANSFER WOULD (A) VIOLATE THE THEN APPLICABLE FEDERAL OR STATE SECURITIES LAWS OR RULES AND REGULATIONS OF THE SECURITIES AND EXCHANGE COMMISSION, ANY STATE SECURITIES COMMISSION OR ANY OTHER GOVERNMENTAL AUTHORITY WITH JURISDICTION OVER SUCH TRANSFER, (B) TERMINATE THE EXISTENCE OR QUALIFICATION OF RHINO RESOURCE PARTNERS LP UNDER THE LAWS OF THE STATE OF DELAWARE, OR (C) CAUSE RHINO RESOURCE PARTNERS LP TO BE TREATED AS AN ASSOCIATION TAXABLE AS A CORPORATION OR OTHERWISE TO BE TAXED AS AN ENTITY FOR FEDERAL INCOME TAX PURPOSES (TO THE EXTENT NOT ALREADY SO TREATED OR TAXED). RHINO GP LLC, THE GENERAL PARTNER OF RHINO RESOURCE PARTNERS LP, MAY IMPOSE ADDITIONAL RESTRICTIONS ON THE TRANSFER OF THIS SECURITY IF IT RECEIVES AN OPINION OF COUNSEL THAT SUCH RESTRICTIONS ARE NECESSARY TO AVOID A SIGNIFICANT RISK OF RHINO RESOURCE PARTNERS LP BECOMING TAXABLE AS A CORPORATION OR OTHERWISE BECOMING TAXABLE AS AN ENTITY FOR FEDERAL INCOME TAX PURPOSES. THE RESTRICTIONS SET FORTH ABOVE SHALL NOT PRECLUDE THE SETTLEMENT OF ANY TRANSACTIONS INVOLVING THIS SECURITY ENTERED INTO THROUGH THE FACILITIES OF ANY NATIONAL SECURITIES EXCHANGE ON WHICH THIS SECURITY IS LISTED OR ADMITTED TO TRADING.
The Holder, by accepting this Certificate, is deemed to have (i) requested admission as, and agreed to become, a Limited Partner and to have agreed to comply with and be bound by and to have executed the Partnership Agreement, (ii) represented and warranted that the Holder has all right, power and authority and, if an individual, the capacity necessary to enter into the Partnership Agreement and (iii) made the waivers and given the consents and approvals contained in the Partnership Agreement.
Exhibit A
This Certificate shall not be valid for any purpose unless it has been countersigned and registered by the Transfer Agent and Registrar. This Certificate shall be governed by and construed in accordance with the laws of the State of Delaware.
| Dated: | Rhino Resource Partners LP | |
Countersigned and Registered by: | By: Rhino GP LLC | |
Computershare Trust Company, N.A., | By: | |
| As Transfer Agent and Registrar | ||
| Name: | ||
Title: | ||
By: | ||
Name: | ||
Title: |
Exhibit A
[Reverse of Certificate]
ABBREVIATIONS
The following abbreviations, when used in the inscription on the face of this Certificate, shall be construed as follows according to applicable laws or regulations:
| TEN COM—as tenants in common | UNIF GIFT/TRANSFERS MIN ACT | |
| TEN ENT—as tenants by the entireties | Custodian | |
| JT TEN—as joint tenants with right of survivorship and not as tenants in common | (Cust) (Minor) | |
| Under Uniform Gifts/Transfers to CD Minors Act (State) |
Additional abbreviations, though not in the above list, may also be used.
ASSIGNMENT OF COMMON UNITS OF
RHINO RESOURCE PARTNERS LP
FOR VALUE RECEIVED, hereby assigns, conveys, sells and transfers unto
(Please print or typewrite name and address of assignee) | (Please insert Social Security or other identifying number of assignee) | |||
Common Units representing limited partner interests evidenced by this Certificate, subject to the Partnership Agreement, and does hereby irrevocably constitute and appoint as its attorney-in-fact with full power of substitution to transfer the same on the books of Rhino Resource Partners LP | ||||
Date: | NOTE: The signature to any endorsement hereon must correspond with the name as written upon the face of this Certificate in every particular. without alteration, enlargement or change. | |||
THE SIGNATURE(S) MUST BE GUARANTEED BY AN ELIGIBLE GUARANTOR INSTITUTION (BANKS, STOCKBROKERS, SAVINGS AND LOAN ASSOCIATIONS AND CREDIT UNIONS WITH MEMBERSHIP IN AN APPROVED SIGNATURE GUARANTEE MEDALLION PROGRAM), PURSUANT TO S.E.C. RULE 17Ad-15 | (Signature) (Signature) | |||
No transfer of the Common Units evidenced hereby will be registered on the books of the Partnership, unless the Certificate evidencing the Common Units to be transferred is surrendered for registration or transfer. | ||||
Exhibit A
APPLICATION FOR TRANSFER OF COMMON UNITS
Transferees of Common Units must execute and deliver this application to Rhino Resource Partners LP, 424 Lewis Hargett Circle, Suite 250, Lexington, Kentucky 40503; Attention: Chief Financial Officer, to be admitted as limited partners to Rhino Resource Partners LP.
The undersigned ("Assignee") hereby applies for transfer to the name of the Assignee of the Common Units evidenced hereby and hereby certifies to Rhino Resource Partners LP (the "Partnership") that the Assignee (including to the best of Assignee's knowledge, any person for whom the Assignee will hold the Common Units) is an Eligible Citizen Holder.1
The Assignee (a) requests admission as a Substituted Limited Partner and agrees to comply with and be bound by, and hereby executes, the First Amended and Restated Agreement of Limited Partnership of the Partnership, as amended, supplemented or restated to the date hereof (the "Partnership Agreement"), (b) represents and warrants that the Assignee has all right, power and authority and, if an individual, the capacity necessary to enter into the Partnership Agreement, and (c) makes the waivers and gives the consents and approvals contained in the Partnership Agreement. Capitalized terms not defined herein have the meanings assigned to such terms in the Partnership Agreement. This application constitutes a Citizenship Certification, as defined in the Partnership Agreement.
| Date: | ||||
| Social Security or other identifying number | Signature of Assignee | |||
| Purchase Price including commissions, if any | Name and Address of Assignee | |||
Exhibit A
| Type of Entity (check one): | ||||||
o Individual | o Partnership | o Corporation | ||||
o Trust | o Other (specify) | |||||
Nationality (check one): | ||||||
o U.S. Citizen, Resident or Domestic Entity | o Non-resident Alien | |||||
o Foreign Corporation | ||||||
If the U.S. Citizen, Resident or Domestic Entity box is checked, the following certification must be completed. | ||||||
Under Section 1445(e) of the Internal Revenue Code of 1986, as amended (the "Code"), the Partnership must withhold tax with respect to certain transfers of property if a holder of an interest in the Partnership is a foreign person. To inform the Partnership that no withholding is required with respect to the undersigned interestholder's interest in it, the undersigned hereby certifies the following (or, if applicable, certifies the following on behalf of the interestholder). | ||||||
Complete Either A or B:
1. is not a foreign corporation, foreign partnership, foreign trust (Name of Interestholder) or foreign estate (as those terms are defined in the Code and Treasury Regulations).
Exhibit A
The interestholder agrees to notify the Partnership within sixty (60) days of the date the interestholder becomes a foreign person. | ||||
The interestholder understands that this certificate may be disclosed to the Internal Revenue Service by the Partnership and that any false statement contained herein could be punishable by fine, imprisonment or both. | ||||
Under penalties of perjury, I declare that I have examined this certification and, to the best of my knowledge and belief, it is true, correct and complete and, if applicable, I further declare that I have authority to sign this document on behalf of: | ||||
| Name of Interestholder | ||||
| Signature and Date | ||||
| Title (if applicable) | ||||
Note: If the Assignee is a broker, dealer, bank, trust company, clearing corporation, other nominee holder or an agent of any of the foregoing, and is holding for the account of any other person, this application should be completed by an officer thereof or, in the case of a broker or dealer, by a registered representative who is a member of a registered national securities exchange or a member of the National Association of Securities Dealers, Inc., or, in the case of any other nominee holder, a person performing a similar function. If the Assignee is a broker, dealer, bank, trust company, clearing corporation, other nominee owner or an agent of any of the foregoing, the above certification as to any person for whom the Assignee will hold the Common Units shall be made to the best of the Assignee's knowledge. | ||||
Exhibit A
APPLICATION FOR TRANSFER OF COMMON UNITS
Transferees of Common Units must execute and deliver this application to Rhino Resource Partners LP, 424 Lewis Hargett Circle, Suite 250, Lexington, Kentucky 40503; Attention: Chief Financial Officer, to be admitted as limited partners to Rhino Resource Partners LP.
The undersigned ("Assignee") hereby applies for transfer to the name of the Assignee of the Common Units evidenced hereby and hereby certifies to Rhino Resource Partners LP (the "Partnership") that the Assignee (including to the best of Assignee's knowledge, any person for whom the Assignee will hold the Common Units) is an Eligible Citizen Holder.1
The Assignee (a) requests admission as a Substituted Limited Partner and agrees to comply with and be bound by, and hereby executes, the First Amended and Restated Agreement of Limited Partnership of the Partnership, as amended, supplemented or restated to the date hereof (the "Partnership Agreement"), (b) represents and warrants that the Assignee has all right, power and authority and, if an individual, the capacity necessary to enter into the Partnership Agreement, and (c) makes the waivers and gives the consents and approvals contained in the Partnership Agreement. Capitalized terms not defined herein have the meanings assigned to such terms in the Partnership Agreement. This application constitutes a Citizenship Certification, as defined in the Partnership Agreement.
| Date: |
Social Security or other identifying number | Signature of Assignee | |
Purchase Price including commissions, if any | Name and Address of Assignee |
| Type of Entity (check one): | |||||||||
o Individual | o Partnership | o Corporation | |||||||
o Trust | o Other (specify) | ||||||||
Nationality (check one): | |||||||||
o U.S. Citizen, Resident or Domestic Entity | o Non-resident Alien | ||||||||
o Foreign Corporation | |||||||||
If the U.S. Citizen, Resident or Domestic Entity box is checked, the following certification must be completed.
Under Section 1445(e) of the Internal Revenue Code of 1986, as amended (the "Code"), the Partnership must withhold tax with respect to certain transfers of property if a holder of an interest in the Partnership is a foreign person. To inform the Partnership that no withholding is required with respect to the undersigned interestholder's interest in it, the undersigned hereby certifies the following (or, if applicable, certifies the following on behalf of the interestholder).
Complete Either A or B:
A. Individual Interestholder
1. I am not a non-resident alien for purposes of U.S. income taxation.
2. My U.S. taxpayer identification number (Social Security Number) is .
3. My home address is .
B. Partnership, Corporation or Other Interestholder
1. is not a foreign corporation, foreign partnership, foreign trust (Name of Interestholder) or foreign estate (as those terms are defined in the Code and Treasury Regulations).
2. The interestholder's U.S. employer identification number is .
3. The interestholder's office address and place of incorporation (if applicable) is .
The interestholder agrees to notify the Partnership within sixty (60) days of the date the interestholder becomes a foreign person.
The interestholder understands that this certificate may be disclosed to the Internal Revenue Service by the Partnership and that any false statement contained herein could be punishable by fine, imprisonment or both.
Under penalties of perjury, I declare that I have examined this certification and, to the best of my knowledge and belief, it is true, correct and complete and, if applicable, I further declare that I have authority to sign this document on behalf of:
| Name of Interestholder | ||||
| Signature and Date | ||||
| Title (if applicable) |
Note: If the Assignee is a broker, dealer, bank, trust company, clearing corporation, other nominee holder or an agent of any of the foregoing, and is holding for the account of any other person, this application should be completed by an officer thereof or, in the case of a broker or dealer, by a registered representative who is a member of a registered national securities exchange or a member of the National Association of Securities Dealers, Inc., or, in the case of any other nominee holder, a person performing a similar function. If the Assignee is a broker, dealer, bank, trust company, clearing corporation, other nominee owner or an agent of any of the foregoing, the above certification as to any person for whom the Assignee will hold the Common Units shall be made to the best of the Assignee's knowledge.
APPENDIX C
Glossary of Terms
adjusted operating surplus: For any period, operating surplus (excluding any amounts attributable to the items in the first bullet point under the definition of operating surplus) generated during that period is adjusted to:
Appalachian Region: Coal producing area in Alabama, eastern Kentucky, Maryland, Ohio, Pennsylvania, Tennessee, Virginia and West Virginia. The Appalachian Region is divided into the Northern, Central and Southern Appalachian regions.
ash: Inorganic material consisting of iron, alumina, sodium and other incombustible matter that are contained in coal. The composition of the ash can affect the burning characteristics of coal.
assigned reserves: Proven and probable reserves that have the permits and infrastructure necessary for mining.
as received: Represents an analysis of a sample as received at a laboratory.
available cash: For any quarter ending prior to liquidation:
quarter resulting from working capital borrowings made subsequent to the end of such quarter;
provided, however, that our general partner may not establish cash reserves pursuant to clause (b)(3) immediately above unless our general partner has determined that the establishment of reserves will not prevent us from distributing the minimum quarterly distribution on all common units and any cumulative common unit arrearages thereon for that quarter; andprovided, further, that disbursements made by us or cash reserves established, increased or reduced after the end of that quarter but on or before the date of determination of available cash for that quarter shall be deemed to have been made, established, increased or reduced, for purposes of determining available cash, within that quarter if our general partner so determines.
Btu: British thermal unit, or Btu, is the amount of heat required to raise the temperature of one pound of water one degree Fahrenheit.
capital account: The capital account maintained for a partner under our partnership agreement. The capital account of a partner for a common unit, a subordinated unit, an incentive distribution right or any other partnership interest will be the amount which that capital account would be if that common unit, subordinated unit, incentive distribution right or other partnership interest were the only interest in us held by a partner.
capital surplus: All available cash distributed by us on any date from any source will be treated as distributed from operating surplus until the sum of all available cash distributed since the closing of the initial public offering equals the operating surplus from the closing of the initial public offering through the end of the quarter immediately preceding that distribution. Any excess available cash distributed by us on that date will be deemed to be capital surplus.
Central Appalachia: Coal producing area in eastern Kentucky, Virginia and southern West Virginia.
closing price: The last sale price on a day, regular way, or in case no sale takes place on that day, the average of the closing bid and asked prices on that day, regular way, in either case, as reported in the principal consolidated transaction reporting system for securities listed or admitted to trading on the principal national securities exchange on which the units of that class are listed or admitted to trading. If the units of that class are not listed or admitted to trading on any national securities exchange, the last quoted price on that day. If no quoted price exists, the average of the high bid and low asked prices on that day in the over-the-counter market, as reported by the NYSE or any other system then in use. If on any day the units of that class are not quoted by any organization of that type, the average of the closing bid and asked prices on that day as furnished by a professional market maker making a market in the units of the class
selected by our general partner. If on that day no market maker is making a market in the units of that class, the fair value of the units on that day as determined by our general partner.
coal seam: Coal deposits occur in layers typically separated by layers of rock. Each layer is called a "seam." A seam can vary in thickness from inches to a hundred feet or more.
coke: A hard, dry carbon substance produced by heating coal to a very high temperature in the absence of air. Coke is used in the manufacture of iron and steel.
compliance coal: Coal that when combusted emits no greater than 1.2 pounds of sulfur dioxide per million Btus and requires no blending or sulfur-reduction technology to comply with current sulfur dioxide emissions under the Clean Air Act.
current market price: For any class of units as of any date, the average of the daily closing prices for the 20 consecutive trading days immediately prior to that date.
EIA: Energy Information Administration.
interim capital transactions: The following transactions if they occur prior to liquidation:
fossil fuel: A hydrocarbon such as coal, petroleum or natural gas that may be used as a fuel.
Four Corners area: Coal producing area located in northwestern New Mexico, northeastern Arizona, southeastern Utah and southwestern Colorado.
GAAP: Generally accepted accounting principles in the United States.
high-vol metallurgical coal: Metallurgical coal that has a volatility content of 32% or greater of its total weight.
Illinois Basin: Coal producing area in Illinois, Indiana and western Kentucky.
Interior region: Coal producing area consisting of the Illinois Basin, Arkansas, Kansas, Louisiana, Mississippi, Missouri, Oklahoma and Texas.
limestone: A rock predominantly composed of the mineral calcite (calcium carbonate (CaCO2)).
lignite: The lowest rank of coal. It is brownish-black with a high moisture content commonly above 35% by weight and heating value commonly less than 8,000 Btu.
low-vol metallurgical coal: Metallurgical coal that has a volatility content of 17% to 22% of its total weight.
mid-vol metallurgical coal: Metallurgical coal that has a volatility content of 23% to 31% of its total weight.
metallurgical coal: The various grades of coal suitable for carbonization to make coke for steel manufacture. Its quality depends on four important criteria: volatility, which affects coke yield; the level of impurities including sulfur and ash, which affects coke quality; composition, which affects coke strength; and basic characteristics, which affect coke oven safety. Metallurgical coal typically has a particularly high Btu but low ash and sulfur content.
MSHA: Mine Safety and Health Administration.
non-reserve coal deposits: Non-reserve coal deposits are coal-bearing bodies that have been sufficiently sampled and analyzed in trenches, outcrops, drilling and underground workings to assume continuity between sample points, and therefore warrants further exploration stage work. However, this coal does not qualify as a commercially viable coal reserve as prescribed by standards of the SEC until a final comprehensive evaluation based on unit cost per ton, recoverability and other material factors concludes legal and economic feasibility. Non-reserve coal deposits may be classified as such by either limited property control or geologic limitations, or both.
non-reserve limestone deposits: Similar to non-reserve coal deposits, non-reserve limestone deposits are limestone-bearing bodies that have been sufficiently sampled and analyzed in trenches, outcrops, drilling, and underground workings to assume continuity between sample points, and therefore warrants further exploration stage work. However, this limestone does not qualify as a commercially viable limestone reserve as prescribed by standards of the SEC until a final comprehensive evaluation based on unit cost per ton, recoverability, and other material factors concludes legal and economic feasibility. Non-reserve limestone deposits may be classified as such by either limited property control or geologic limitations, or both.
Northern Appalachia: Coal producing area in Maryland, Ohio, Pennsylvania and northern West Virginia.
operating expenditures: All of our cash expenditures, including, but not limited to, taxes, reimbursement of expenses of our general partner and its affiliates, payments made in the ordinary course of business under interest rate hedge agreements or commodity hedge agreements (provided that (i) with respect to amounts paid in connection with the initial purchase of an interest rate hedge contract or commodity hedge contract, such amounts shall be amortized over the life of the applicable hedge contract and (ii) payments made in connection with the termination of any interest rate hedge contract or commodity hedge contract prior the expiration of its stipulated settlement or termination date shall be included in equal quarterly installments over the remaining scheduled life of such hedge contract), officer compensation,
repayment of working capital borrowings, debt service payments and estimated maintenance capital expenditures, provided that operating expenditures will not include:
operating surplus: Operating surplus consists of:
provided that cash receipts from the termination of a commodity hedge or interest rate hedge prior to its specified termination date shall be included in operating surplus in equal quarterly installments over the remaining scheduled life of such commodity hedge or interest rate hedge;plus
a binding obligation to commence the construction, acquisition or improvement of a capital improvement or replacement of a capital asset and ending on the earlier to occur of the date the capital improvement or capital asset commences commercial service and the date that it is abandoned or disposed of;less
overburden: Layers of earth and rock covering a coal seam. In surface mining operations, overburden is removed prior to coal extraction.
Powder River Basin: Coal producing area located in northeastern Wyoming and southeastern Montana.
preparation plant: Usually located on a mine site, although one plant may serve several mines. A preparation plant is a facility for crushing, sizing and washing coal to prepare it for use by a particular customer. The washing process separates higher ash coal and may also remove some of the coal's sulfur content.
probable (indicated) reserves: Reserves for which quantity and grade and/or quality are computed from information similar to that used for proven (measured) reserves, but the sites for inspection, sampling, and measurement are farther apart or are otherwise less adequately spaced. The degree of assurance, although lower than that for proven (measured) reserves, is high enough to assume continuity between points of observation.
proven (measured) reserves: Reserves for which (a) quantity is computed from dimensions revealed in outcrops, trenches, workings or drill holes; grade and/or quality are computed from the results of detailed sampling and (b) the sites for inspection, sampling and measurement are spaced so closely and the geologic character is so well defined that size, shape, depth and mineral content of reserves are well-established.
reclamation: The process of restoring land to its prior condition, productive use or other permitted condition following mining activities. The process commonly includes "recontouring" or reshaping the land to its approximate original appearance, restoring topsoil and planting native grass and shrubs. Reclamation operations are typically conducted concurrently with mining operations. Reclamation is closely regulated by both state and federal laws.
reserve: That part of a mineral deposit which could be economically and legally extracted or produced at the time of the reserve determination.
steam coal: Coal used by power plants and industrial steam boilers to produce electricity, steam or both. It generally is lower in Btu heat content and higher in volatile matter than metallurgical coal.
sulfur: One of the elements present in varying quantities in coal that contributes to environmental degradation when coal is burned. Sulfur dioxide (SO2) is produced as a gaseous by-product of coal combustion.
surface mine: A mine in which the coal lies near the surface and can be extracted by removing the covering layer of soil overburden. Surface mines are also known as open-pit mines.
tons: A "short" or net ton is equal to 2,000 pounds. A "long" or British ton is 2,240 pounds. A "metric" tonne is approximately 2,205 pounds. The short ton is the unit of measure referred to in this prospectus.
Uinta Basin: Coal producing area located in western Colorado and eastern Utah.
units: Refers to both common units and subordinated units.
Western Bituminous region: Coal producing area located in western Colorado and eastern Utah.
Western United States region: Coal producing area that includes the Powder River Basin, the Western Bituminous region, the Four Corners area and the Uinta Basin.
working capital borrowings: Borrowings that our general partner intends for us to use for working capital purposes or to pay distributions to partners, made pursuant to a credit agreement or similar financing arrangement;provided, that when incurred it is the intent of the borrower to repay such borrowings within 12 months from sources other than additional working capital borrowings.
TABLE OF CONTENTS
| | Page | |||
|---|---|---|---|---|
Summary | 1 | |||
Risk Factors | 23 | |||
Use of Proceeds | ||||
Capitalization | ||||
Dilution | ||||
Cash Distribution Policy and Restrictions on Distributions | ||||
Provisions of Our Partnership Agreement Relating to Cash Distributions | 77 | |||
Selected Historical Consolidated and Pro Forma Condensed Consolidated Financial and Operating Data | 94 | |||
Management's Discussion and Analysis of Financial Condition and Results of Operations | 98 | |||
The Coal Industry | ||||
Business | ||||
Management | ||||
Executive Officer Compensation | 194 | |||
Security Ownership of Certain Beneficial Owners and Management | 210 | |||
Certain Relationships and Related Party Transactions | 211 | |||
Conflicts of Interest and Fiduciary Duties | 214 | |||
Description of the Common Units | 224 | |||
The Partnership Agreement | 227 | |||
Units Eligible for Future Sale | 244 | |||
Material Tax Consequences | 246 | |||
Investment in Rhino Resource Partners LP by Employee Benefit Plans | 269 | |||
Underwriting | 271 | |||
Validity of Our Common Units | 276 | |||
Experts | 276 | |||
Where You Can Find More Information | 277 | |||
Forward-Looking Statements | 277 | |||
Index to Financial Statements | F-1 | |||
Appendix A—Form of First Amended and Restated Agreement of Limited Partnership of Rhino Resource Partners LP | A-1 | |||
Appendix B—Application for Transfer of Common Units | B-1 | |||
Appendix C—Glossary of Terms | C-1 | |||
3,750,0003,244,000 Common Units

Representing
Limited Partner Interests
PROSPECTUS
RAYMOND JAMES
RBC CAPITAL MARKETS
STIFEL NICOLAUS WEISEL
, 2010
INFORMATION NOT REQUIRED IN THE PROSPECTUS
Item 13. Other Expenses of Issuance and Distribution.
Set forth below are the expenses (other than the underwriting discount) expected to be incurred in connection with the issuance and distribution of the securities registered hereby. With the exception of the Securities and Exchange Commission registration fee, the FINRA filing fee and the NYSE listing fee, the amounts set forth below are estimates.
SEC registration fee | $ | 5,704 | ||
FINRA filing fee | 9,556 | |||
NYSE listing fee | 42,450 | |||
Printing and engraving expenses | 250,000 | |||
Fees and expenses of legal counsel | 1,250,000 | |||
Accounting fees and expenses | 300,000 | |||
Transfer agent fees | 3,500 | |||
Miscellaneous | 176,290 | |||
Total | $ | 2,037,500 | ||
Item 14. Indemnification of Directors and Officers.
The section of the prospectus entitled "The Partnership Agreement—Indemnification" discloses that we will generally indemnify officers, directors and affiliates of our general partner to the fullest extent permitted by the law against all losses, claims, damages or similar events and is incorporated herein by this reference. Reference is also made to the Underwriting Agreement to be filed as an amendment (Exhibit 1.1) to this registration statement, which provides for the indemnification of the registrant and its general partner and their officers and directors, and any person who controls the registrant and its general partner, including indemnification for liabilities under the Securities Act. Subject to any terms, conditions or restrictions set forth in the partnership agreement, Section 17-108 of the Delaware Revised Uniform Limited Partnership Act empowers a Delaware limited partnership to indemnify and hold harmless any partner or other person from and against all claims and demands whatsoever. As of the consummation of this offering, the general partner of the registrant will maintain directors and officers liability insurance for the benefit of its directors and officers.
Item 15. Recent Sales of Unregistered Securities.
On April 19, 2010, in connection with the formation of Rhino Resource Partners LP, or the Partnership, the Partnership issued (i) to Rhino GP LLC, its general partner, the 2.0% general partner interest in the Partnership for $20 and (ii) to Rhino Energy Holdings LLC the 98.0% limited partner interest in the Partnership for $980. The issuance was exempt from registration under Section 4(2) of the Securities Act of 1933. There have been no other sales of unregistered securities within the past three years.
II-1
Item 16. Exhibits and Financial Statement Schedules.
| Exhibit Number | Description | ||
|---|---|---|---|
| 1.1 | ** | Form of Underwriting Agreement | |
| 3.1 | *** | Certificate of Limited Partnership of Rhino Resource Partners LP | |
| 3.2 | * | Form of First Amended and Restated Agreement of Limited Partnership of Rhino Resource Partners LP (incorporated by reference to Appendix A to the Prospectus contained within the Registrant's Registration Statement on Form S-1) | |
| 4.1 | *** | Form of Registration Rights Agreement | |
| 5.1 | *** | Opinion of Vinson & Elkins L.L.P. as to the legality of the securities being registered | |
| 8.1 | *** | Opinion of Vinson & Elkins L.L.P. relating to tax matters | |
| 10.1 | *** | Credit Agreement by and among CAM Holdings LLC, the Guarantors Party Thereto, the Lenders Party Thereto, PNC Bank, National Association, as Administrative Agent, PNC National Markets LLC and National City Bank as Joint Lead Arrangers, and Wachovia Bank, National Association, Royal Bank of Canada and Raymond James Bank, FSB, as Co-Documentations Agents dated as of August 30, 2006 | |
| 10.2 | *** | First Amendment to the Credit Agreement dated December 28, 2006 by and among CAM Holdings LLC, each of the Guarantors (as defined therein), the Lenders Party Thereto, and PNC Bank, National Association, as administrative agent for the Lenders | |
| 10.3 | *** | Second Amendment to the Credit Agreement and Consent dated March 8, 2007 by and among Rhino Energy LLC, a Delaware limited liability company formerly known as CAM Holdings LLC, each of the Guarantors (as defined therein), the Lenders Party Thereto, and PNC Bank, National Association, as administrative agent for the Lenders | |
| 10.4 | *** | Third Amendment to the Credit Agreement dated February 29, 2008 by and among Rhino Energy LLC, a Delaware limited liability company formerly known as CAM Holdings LLC, each of the Guarantors (as defined therein), the Lenders Party Thereto, and PNC Bank, National Association, as administrative agent for the Lenders | |
| 10.5 | *** | Fourth Amendment to the Credit Agreement dated May 15, 2008 by and among Rhino Energy LLC, a Delaware limited liability company formerly known as CAM Holdings LLC, each of the Guarantors (as defined therein), the Lenders Party Thereto, and PNC Bank, National Association, as administrative agent for the Lenders | |
| 10.6 | *** | Fifth Amendment to the Credit Agreement dated June 1, 2008 by and among Rhino Energy LLC, a Delaware limited liability company formerly known as CAM Holdings LLC, each of the Guarantors (as defined therein), the Lenders Party Thereto, and PNC Bank, National Association, as administrative agent for the Lenders | |
| 10.7 | *** | Sixth Amendment to the Credit Agreement dated November 4, 2008 by and among Rhino Energy LLC, a Delaware limited liability company formerly known as CAM Holdings LLC, each of the Guarantors (as defined therein), the Lenders Party Thereto, and PNC Bank, National Association, as administrative agent for the Lenders | |
| 10.8 | *** | Seventh Amendment to the Credit Agreement dated March 31, 2009 by and among Rhino Energy LLC, a Delaware limited liability company formerly known as CAM Holdings LLC, each of the Guarantors (as defined therein), the Lenders Party Thereto, and PNC Bank, National Association, as administrative agent for the Lenders | |
| 10.9 | *** | Eighth Amendment to the Credit Agreement | |
| 10.10 | *** | Form of Contribution, Conveyance and Assumption Agreement | |
| 10.11 | *** | Form of Long-Term Incentive Plan | |
| 10.12 | *** | Form of Long-Term Incentive Plan Grant Agreement | |
| 10.13 | *** | Employment Agreement of David G. Zatezalo dated March 31, 2010 | |
| 10.14 | *** | Employment Agreement of Richard A. Boone dated April 16, 2008 | |
| 10.15 | *** | Employment Agreement of Christopher N. Moravec dated March 31, 2010 | |
II-2
| Exhibit Number | Description | ||
|---|---|---|---|
| 10.16 | *** | Employment Agreement of Andrew W. Cox dated January 2, 2007 | |
| 10.17 | *** | Employment Agreement of Reford C. Hunt dated September 1, 2006 | |
| 10.18 | *** | First Amendment to Employment Agreement of Reford C. Hunt dated October 31, 2006 | |
| 10.19 | *** | Second Amendment to Employment Agreement of Reford C. Hunt dated March 10, 2008 | |
| 10.20 | *** | Assignment Agreement and Amendment to Employment Agreement of Reford C. Hunt dated August 26, 2008 | |
| 10.21 | *** | Third Amendment to Employment Agreement of Reford C. Hunt dated April 26, 2010 | |
| 10.22 | *** | Form of Long-Term Incentive Plan Grant Agreement—Restricted Units (Directors who are not Principals of Wexford) | |
| 10.23 | *** | Form of Long-Term Incentive Plan Grant Agreement—Restricted Units (Directors who are Principals of Wexford) | |
| 21.1 | *** | List of Subsidiaries of Rhino Resource Partners LP | |
| 23.1 | * | Consent of Deloitte & Touche LLP | |
| 23.2 | * | Consent of Deloitte & Touche LLP | |
| 23.3 | * | Consent of Marshall Miller & Associates, Inc. | |
| 23.5 | *** | Consent of Vinson & Elkins L.L.P. (contained in Exhibit 5.1) | |
| 23.6 | *** | Consent of Vinson & Elkins L.L.P. (contained in Exhibit 8.1) | |
| 24.1 | Powers of Attorney (included on the signature page) | ||
| 99.1 | *** | Consent of Mark L. Plaumann, Director Nominee | |
| 99.2 | *** | Consent of Douglas Lambert, Director Nominee | |
| 99.3 | *** | Consent of James F. Tompkins, Director Nominee | |
REPORT OF INDEPENDENT REGISTERED PUBLIC ACCOUNTING FIRM
To the Members of
Rhino Energy LLC
Lexington, Kentucky
We have audited the consolidated financial statements of Rhino Energy LLC (the "Company") for the three years in the period ended December 31, 2009, and have issued our report thereon dated May 5, 2010, included elsewhere in this Registration Statement. Our audits also included the consolidated financial statement schedule appearing in Item 16(b) of this Registration Statement. This consolidated financial statement schedule is the responsibility of the Company's management. Our responsibility is to express an opinion based on our audits. In our opinion, such consolidated financial statement schedule, when considered in relation to the basic consolidated financial statements taken as a whole, presents fairly in all material respects the information set forth therein.
/s/ Deloitte & Touche LLP
Cincinnati, Ohio
May 5, 2010
II-3
| | Balance at Beginning of Period | Additions | Deductions | Balance at End of Period | |||||||||
|---|---|---|---|---|---|---|---|---|---|---|---|---|---|
For the year ended December 31, 2009 | |||||||||||||
Allowance for doubtful accounts | $ | — | $ | 18,992 | $ | — | $ | 18,992 | |||||
For the year ended December 31, 2008 | |||||||||||||
Allowance for doubtful accounts | $ | — | $ | — | $ | — | $ | — | |||||
For the year ended December 31, 2007 | |||||||||||||
Allowance for doubtful accounts | $ | 175,242 | $ | — | $ | 175,242 | $ | — | |||||
The undersigned registrant hereby undertakes to provide to the underwriters at the closing specified in the underwriting agreement, certificates in such denominations and registered in such names as required by the underwriters to permit prompt delivery to each purchaser.
Insofar as indemnification for liabilities arising under the Securities Act of 1933 may be permitted to directors, officers and controlling persons of the registrant pursuant to the foregoing provisions, or otherwise, the registrant has been advised that in the opinion of the Securities and Exchange Commission such indemnification is against public policy as expressed in the Securities Act of 1933 and is, therefore, unenforceable. In the event that a claim for indemnification against such liabilities (other than the payment by the registrant of expenses incurred or paid by a director, officer or controlling person of the registrant in the successful defense of any action, suit or proceeding) is asserted by such director, officer or controlling person in connection with the securities being registered, the registrant will, unless in the opinion of its counsel the matter has been settled by controlling precedent, submit to a court of appropriate jurisdiction of the question whether such indemnification by it is against public policy as expressed in the Securities Act of 1933 and will be governed by the final adjudication of such issue.
The undersigned registrant hereby undertakes that:
The undersigned registrant undertakes to send to each common unitholder, at least on an annual basis, a detailed statement of any transactions with registrant or its subsidiaries, and of fees, commissions, compensation and other benefits paid, or accrued to registrant or its subsidiaries for the fiscal year completed, showing the amount paid or accrued to each recipient and the services performed.
The registrant undertakes to provide to the common unitholders the financial statements required by Form 10-K for the first full fiscal year of operations of the partnership.
II-4
Pursuant to the requirements of the Securities Act of 1933, the registrant has duly caused this Registration Statement to be signed on its behalf by the undersigned, thereunto duly authorized, in the City of Lexington, State of Kentucky, on July 23,August 27, 2010.
| RHINO RESOURCE PARTNERS LP | ||||
By: | Rhino GP LLC, Its General Partner | |||
/s/ DAVID G. ZATEZALO | ||||
| David G. Zatezalo President, | ||||
Each person whose signature appears below appoints David G. Zatezalo and Richard A. Boone, and each of them, any of whom may act without the joinder of the other, as his true and lawful attorneys-in-fact and agents, with full power of substitution and resubstitution, for him and in his name, place and stead, in any and all capacities, to sign any and all amendments (including post-effective amendments) to this Registration Statement and any Registration Statement (including any amendment thereto) for this offering that is to be effective upon filing pursuant to Rule 462(b) under the Securities Act of 1933 and to file the same, with all exhibits thereto, and all other documents in connection therewith, with the Securities and Exchange Commission, granting unto said attorneys-in-fact and agents full power and authority to do and perform each and every act and thing requisite and necessary to be done, as fully to all intents and purposes as he might or would do in person, hereby ratifying and confirming all that said attorneys-in-fact and agents or any of them of their or his substitute and substitutes, may lawfully do or cause to be done by virtue hereof.
Pursuant to the requirements of the Securities Act of 1933, this Registration Statement has been signed below by the following persons in the capacities indicated on July 23,August 27, 2010.
| Signature | Title | |||
|---|---|---|---|---|
| /s/ DAVID G. ZATEZALO David G. Zatezalo | President, (Principal Executive Officer) | |||
* Richard A. Boone | Senior Vice President and Chief Financial Officer (Principal Financial Officer and Principal Accounting Officer) | |||
* Mark D. Zand | Chairman of the Board | |||
* Jay L. Maymudes | Director | |||
* Arthur H. Amron | Director | |||
* Kenneth A. Rubin | Director | |||
/s/ JOSEPH M. JACOBS Joseph M. Jacobs | Director | |||
*By: | /s/ DAVID G. ZATEZALO David G. Zatezalo, Attorney-in-fact | |||
II-5
| Exhibit Number | Description | ||
|---|---|---|---|
| 1.1 | ** | Form of Underwriting Agreement | |
3.1 | *** | Certificate of Limited Partnership of Rhino Resource Partners LP | |
3.2 | * | Form of First Amended and Restated Agreement of Limited Partnership of Rhino Resource Partners LP (incorporated by reference to Appendix A to the Prospectus contained within the Registrant's Registration Statement on Form S-1) | |
4.1 | *** | Form of Registration Rights Agreement | |
5.1 | *** | Opinion of Vinson & Elkins L.L.P. as to the legality of the securities being registered | |
8.1 | *** | Opinion of Vinson & Elkins L.L.P. relating to tax matters | |
10.1 | *** | Credit Agreement by and among CAM Holdings LLC, the Guarantors Party Thereto, the Lenders Party Thereto, PNC Bank, National Association, as Administrative Agent, PNC National Markets LLC and National City Bank as Joint Lead Arrangers, and Wachovia Bank, National Association, Royal Bank of Canada and Raymond James Bank, FSB, as Co-Documentations Agents dated as of August 30, 2006 | |
10.2 | *** | First Amendment to the Credit Agreement dated December 28, 2006 by and among CAM Holdings LLC, each of the Guarantors (as defined therein), the Lenders Party Thereto, and PNC Bank, National Association, as administrative agent for the Lenders | |
10.3 | *** | Second Amendment to the Credit Agreement and Consent dated March 8, 2007 by and among Rhino Energy LLC, a Delaware limited liability company formerly known as CAM Holdings LLC, each of the Guarantors (as defined therein), the Lenders Party Thereto, and PNC Bank, National Association, as administrative agent for the Lenders | |
10.4 | *** | Third Amendment to the Credit Agreement dated February 29, 2008 by and among Rhino Energy LLC, a Delaware limited liability company formerly known as CAM Holdings LLC, each of the Guarantors (as defined therein), the Lenders Party Thereto, and PNC Bank, National Association, as administrative agent for the Lenders | |
10.5 | *** | Fourth Amendment to the Credit Agreement dated May 15, 2008 by and among Rhino Energy LLC, a Delaware limited liability company formerly known as CAM Holdings LLC, each of the Guarantors (as defined therein), the Lenders Party Thereto, and PNC Bank, National Association, as administrative agent for the Lenders | |
10.6 | *** | Fifth Amendment to the Credit Agreement dated June 1, 2008 by and among Rhino Energy LLC, a Delaware limited liability company formerly known as CAM Holdings LLC, each of the Guarantors (as defined therein), the Lenders Party Thereto, and PNC Bank, National Association, as administrative agent for the Lenders | |
10.7 | *** | Sixth Amendment to the Credit Agreement dated November 4, 2008 by and among Rhino Energy LLC, a Delaware limited liability company formerly known as CAM Holdings LLC, each of the Guarantors (as defined therein), the Lenders Party Thereto, and PNC Bank, National Association, as administrative agent for the Lenders | |
II-6
| Exhibit Number | Description | ||
|---|---|---|---|
| 10.8* | ** | Seventh Amendment to the Credit Agreement dated March 31, 2009 by and among Rhino Energy LLC, a Delaware limited liability company formerly known as CAM Holdings LLC, each of the Guarantors (as defined therein), the Lenders Party Thereto, and PNC Bank, National Association, as administrative agent for the Lenders | |
10.9 | *** | Eighth Amendment to the Credit Agreement | |
10.10 | *** | Form of Contribution, Conveyance and Assumption Agreement | |
10.11 | *** | Form of Long-Term Incentive Plan | |
10.12 | *** | Form of Long-Term Incentive Plan Grant Agreement | |
10.13 | *** | Employment Agreement of David G. Zatezalo dated March 31, 2010 | |
10.14 | *** | Employment Agreement of Richard A. Boone dated April 16, 2008 | |
10.15 | *** | Employment Agreement of Christopher N. Moravec dated March 31, 2008 | |
10.16 | *** | Employment Agreement of Andrew W. Cox dated January 2, 2007 | |
10.17 | *** | Employment Agreement of Reford C. Hunt dated September 1, 2006 | |
10.18 | *** | First Amendment to Employment Agreement of Reford C. Hunt dated October 31, 2006 | |
10.19 | *** | Second Amendment to Employment Agreement of Reford C. Hunt dated March 10, 2008 | |
10.20 | *** | Assignment Agreement and Amendment to Employment Agreement of Reford C. Hunt dated August 26, 2008 | |
10.21 | *** | Third Amendment to Employment Agreement of Reford C. Hunt dated April 26, 2010 | |
10.22 | *** | Form of Long-Term Incentive Plan Grant Agreement—Restricted Units (Directors who are not Principals of Wexford) | |
10.23 | *** | Form of Long-Term Incentive Plan Grant Agreement—Restricted Units (Directors who are Principals of Wexford) | |
21.1 | *** | List of Subsidiaries of Rhino Resource Partners LP | |
23.1 | * | Consent of Deloitte & Touche LLP | |
23.2 | * | Consent of Deloitte & Touche LLP | |
23.3 | * | Consent of Marshall Miller & Associates, Inc. | |
23.5 | *** | Consent of Vinson & Elkins L.L.P. (contained in Exhibit 5.1) | |
23.6 | *** | Consent of Vinson & Elkins L.L.P. (contained in Exhibit 8.1) | |
24.1 | * | Powers of Attorney (included on the signature page) | |
99.1 | *** | Consent of Mark L. Plaumann, Director Nominee | |
99.2 | *** | Consent of Douglas Lambert, Director Nominee | |
99.3 | *** | Consent of James F. Tompkins, Director Nominee | |
II-7