As filed with the Securities and Exchange Commission on January 10,24, 2011
Registration No. 333-170203
UNITED STATES
SECURITIES AND EXCHANGE COMMISSION
Washington, D.C. 20549
Amendment No. 24
to
FORM S-1
REGISTRATION STATEMENT
UNDER
THE SECURITIES ACT OF 1933
BankUnited, Inc.
(Exact name of registrant as specified in its charter)
| Delaware (State or other jurisdiction of incorporation or organization) | 6035 (Primary Standard Industrial Classification Code Number) | 27-0162450 (I.R.S. Employer Identification Number) |
14817 Oak Lane
Miami Lakes, Florida 33016
(305) 569-2000
(Address, including zip code, and telephone number, including area code, of registrant's principal executive offices)
John A. Kanas
Chairman, President and Chief Executive Officer
BankUnited, Inc.
14817 Oak Lane
Miami Lakes, Florida 33016
(305) 569-2000
(Name, address, including zip code, and telephone number, including area code, of agent for service)
| Copies to: | ||
Richard B. Aftanas, Esq. Skadden, Arps, Slate, Meagher & Flom LLP Four Times Square New York, New York 10036 (212) 735-3000 | Richard D. Truesdell, Jr., Esq. Davis Polk & Wardwell LLP 450 Lexington Avenue New York, New York 10017 (212) 450-4000 | |
Approximate date of commencement of proposed sale to the public:
As soon as practicable after the effective date of this Registration Statement.
If any of the securities being registered on this form are to be offered on a delayed or continuous basis pursuant to Rule 415 of the Securities Act of 1933 check the following box. o
If this Form is filed to register additional securities for an offering pursuant to Rule 462(b) under the Securities Act, please check the following box and list the Securities Act registration statement number of the earlier effective registration statement for the same offering. o
If this Form is a post-effective amendment filed pursuant to Rule 462(c) under the Securities Act, check the following box and list the Securities Act registration statement number of the earlier effective registration statement for the same offering. o
If this Form is a post-effective amendment filed pursuant to Rule 462(d) under the Securities Act, check the following box and list the Securities Act registration statement number of the earlier effective registration statement for the same offering. o
Indicate by check mark whether the registrant is a large accelerated filer, an accelerated filer, a non-accelerated filer, or a smaller reporting company. See the definitions of "large accelerated filer," "accelerated filer" and "smaller reporting company" in Rule 12b-2 of the Securities Exchange Act of 1934.
| Large accelerated filer o | Accelerated filer o | Non-accelerated filer ý (Do not check if a smaller reporting company) | Smaller reporting company o |
The Registrant hereby amends this Registration Statement on such date or dates as may be necessary to delay its effective date until the Registrant shall file an amendment which specifically states that this Registration Statement shall thereafter become effective in accordance with Section 8(a) of the Securities Act of 1933 or until this Registration Statement shall become effective on such date as the Securities and Exchange Commission, acting pursuant to said Section 8(a), may determine.
The information in this preliminary prospectus is not complete and may be changed. Neither we nor the selling stockholders may sell these securities until the registration statement filed with the Securities and Exchange Commission is effective. This preliminary prospectus is not an offer to sell nor does it seek an offer to buy these securities in any jurisdiction where the offer or sale is not permitted.
Subject to Completion. Dated January 10,24, 2011
PROSPECTUS
26,250,000 Shares
![]()
BankUnited, Inc.
Common Stock
This is the initial public offering of our common stock. We are offering 4,000,000 shares of our common stock. The selling stockholders identified in this prospectus are offering an additional 22,250,000 shares. We will not receive any of the proceeds from the sale of the shares being sold by the selling stockholders.
Prior to this offering there has been no public market for our common stock. It is currently estimated that the public offering price per share of our common stock will be between $$23.00 and $$25.00 per share. We intend to apply to list ourOur common stock has been approved for listing on the New York Stock Exchange under the symbol "BKU."
See "Risk Factors" on page 13 to read about factors you should consider before buying our common stock.
Neither the Securities and Exchange Commission nor any other regulatory body has approved or disapproved of these securities or passed upon the adequacy or accuracy of this prospectus. Any representation to the contrary is a criminal offense.
| | Per Share | Total | |||||
|---|---|---|---|---|---|---|---|
Initial public offering price | $ | $ | |||||
Underwriting discounts | $ | $ | |||||
Proceeds, before expenses, to us | $ | $ | |||||
Proceeds, before expenses, to the selling stockholders | $ | $ | |||||
To the extent that the underwriters sell more than 26,250,000 shares of our common stock, the underwriters have the option to purchase up to an additional 3,937,500 shares of our common stock from the selling stockholders at the initial public offering price less the underwriting discount, within 30 days from the date of this prospectus, to cover over-allotments.
The underwriters expect to deliver the shares of our common stock against payment in New York, New York on , 2011.
| Morgan Stanley | BofA Merrill Lynch | |
Deutsche Bank Securities | Goldman, Sachs & Co. |
Keefe, Bruyette & Woods | RBC Capital Markets | UBS Investment Bank |
Prospectus dated , 2011
We, the selling stockholders and the underwriters have not authorized anyone to provide any information other than that contained in this prospectus or in any free writing prospectus prepared by or on behalf of us or to which we have referred you. We, the selling stockholders and the underwriters take no responsibility for, and can provide no assurance as to the reliability of, any other information that others may give you. We are not, and the selling stockholders and underwriters are not, making an offer of these securities in any jurisdiction where the offer is not permitted. You should not assume that the information contained in this prospectus is accurate as of any date other than the date on the front of this prospectus.
TABLE OF CONTENTS
PROSPECTUS SUMMARY | 1 | |
RISK FACTORS | 13 | |
CAUTIONARY NOTE REGARDING FORWARD-LOOKING STATEMENTS | 26 | |
REORGANIZATION | 27 | |
USE OF PROCEEDS | 29 | |
DIVIDEND POLICY | 30 | |
CAPITALIZATION | 31 | |
DILUTION | 32 | |
SELECTED HISTORICAL CONSOLIDATED FINANCIAL INFORMATION | 34 | |
MANAGEMENT'S DISCUSSION AND ANALYSIS OF FINANCIAL CONDITION AND RESULTS OF OPERATIONS | 38 | |
BUSINESS | ||
REGULATION AND SUPERVISION | ||
MANAGEMENT | ||
COMPENSATION DISCUSSION AND ANALYSIS | ||
CERTAIN RELATIONSHIPS AND RELATED PARTY TRANSACTIONS | 148 | |
PRINCIPAL AND SELLING STOCKHOLDERS | 150 | |
DESCRIPTION OF OUR CAPITAL STOCK | 155 | |
SHARES ELIGIBLE FOR FUTURE SALE | ||
CERTAIN MATERIAL U.S. FEDERAL INCOME TAX CONSEQUENCES FOR NON-U.S. HOLDERS OF COMMON STOCK | ||
UNDERWRITERS | ||
LEGAL MATTERS | ||
EXPERTS | ||
WHERE YOU CAN FIND MORE INFORMATION | ||
INDEX TO CONSOLIDATED FINANCIAL STATEMENTS | F-1 |
The shares of our common stock that you purchase in this offering will not be a bank deposit and will not be insured or guaranteed by the FDIC or any other government agency. Your investment will be subject to investment risk, and you must be capable of affording the loss of your entire investment.
For investors outside the United States: None of we, the selling stockholders or any of the underwriters have done anything that would permit this offering or possession or distribution of this prospectus in any jurisdiction where action for that purpose is required, other than in the United States. You are required to inform yourselves about and to observe any restrictions relating to this offering and the distribution of this prospectus.
MARKET AND INDUSTRY DATA AND FORECASTS
This prospectus includes market and industry data and forecasts that we have developed from independent research firms, publicly available information, various industry publications, other
i
published industry sources or our internal data and estimates. Independent research reports, industry publications and other published industry sources generally indicate that the information contained therein was obtained from sources believed to be reliable, but do not guarantee the accuracy and completeness of such information. Although we believe that the publications and reports are reliable, none of we, the selling stockholders or the underwriters have independently verified the data. Our internal data, estimates and forecasts are based on information obtained from our investors, trade and business organizations and other contacts in the markets in which we operate and our management's understanding of industry conditions. Although we believe that such information is reliable, we have not had such information verified by any independent sources.
ii
This summary highlights selected information contained elsewhere in this prospectus. This summary may not contain all of the information that you should consider before investing in our common stock. You should read the entire prospectus carefully, including the section entitled "Risk Factors," our financial statements and the related notes thereto and management's discussion and analysis thereof included elsewhere in this prospectus, before making an investment decision to purchase our common stock. Unless we state otherwise or the context otherwise requires, references in this prospectus to "we," "our," "us," and the "Company" for all periods subsequent to the Acquisition (as defined below) refer to BankUnited, Inc., a Delaware corporation, and its consolidated subsidiaries. References in this prospectus to "BankUnited" and the "Bank" for all periods beginning May 22, 2009 refer to BankUnited, a federal savings association, formed to acquire substantially all of the assets (including loans, employees and certain operations), and assume all of the non-brokered deposits and substantially all other liabilities, of the Failed Bank (as defined below).
Summary
BankUnited, Inc. is a savings and loan holding company with two wholly-owned subsidiaries: BankUnited, which is one of the largest independent depository institutions headquartered in Florida by assets, and BankUnited Investment Services, Inc., or BankUnited Investment Services, a Florida insurance agency which provides comprehensive wealth management products and financial planning services. BankUnited is a federally-chartered, federally-insured savings association headquartered in Miami Lakes, Florida, with $11.2 billion of assets, more than 1,100 professionals and 78 branches in 13 counties at September 30, 2010. Our goal is to build a premier, large regional bank with a low-risk, long-term value-oriented business model focused on small and medium sized businesses and consumers. We endeavor to provide personalized customer service and offer a full range of traditional banking products and financial services to both our commercial and consumer customers, who are predominantly located in Florida.
BankUnited, Inc. was organized by a management team led by our Chairman, President and Chief Executive Officer, John A. Kanas, on April 28, 2009 and was initially capitalized with $945.0 million by a group of investors. On May 21, 2009, BankUnited was granted a savings association charter and the newly formed bank acquired substantially all of the assets and assumed all of the non-brokered deposits and substantially all other liabilities of BankUnited, FSB, or the Failed Bank, from the Federal Deposit Insurance Corporation, or the FDIC, in a transaction which we refer to as the Acquisition. Concurrently with the Acquisition, we entered into two loss sharing agreements, or the Loss Sharing Agreements, which cover certain legacy assets, including the entire legacy loan portfolio and other real estate owned, or OREO, and certain purchased investment securities, including private-label mortgage-backed securities and non-investment grade securities. We refer to assets covered by the Loss Sharing Agreements as Covered Assets (or, in certain cases, Covered Loans or Covered Securities).
Since the Bank's establishment in May 2009, we have pursued our new strategy and as part of this strategy we have recruited a new executive management team, substantially enhanced our middle management team, redesigned the Bank's underwriting functions, and have begun the process of improving the Bank's information technology systems and optimizing our existing branch network. For the nine months ended September 30, 2010, the Company was one of the most profitable and well-capitalized bank holding companies in the United States, having earned 1.9% on its average assets and 17.7% on its average common stockholder's equity, and achieved a 41.9% efficiency ratio. BankUnited's tier 1 leverage ratio was 10.1% and its tier 1 risk-based capital ratio was 42.5% at September 30, 2010. The Company's tangible common equity ratio was 10.7% at September 30, 2010.
We intend to invest our excess capital to grow opportunistically both organically and through acquisitions.
Our management team is led by Mr. Kanas, a veteran of the banking industry who built North Fork Bancorporation, or North Fork, into a leading regional bank based in New York. At the time of its sale to Capital One Financial Corporation, or Capital One, in December 2006, North Fork was one of the top 25 bank holding companies in the United States. Mr. Kanas served as the Chairman of North Fork from 1986 to 2006 and President and Chief Executive Officer of North Fork from 1977 to 2006. Through organic growth and over 15 acquisitions, Mr. Kanas oversaw the growth and expansion of North Fork from less than $1 billion in assets in 1977 to nearly $60 billion in assets by 2006. According to FactSet Research Systems, while for the five-year period prior to its sale to Capital One, North Fork generated a total annualized return of 11.2%, which equaled the median total annualized return of the top fifty U.S. bank holding companies (excluding North Fork) by assets, for the ten-year period, North Fork generated a total annualized return of 20.5%, compared to a median total annualized return of 14.5%. North Fork distinguished itself as one of the most efficient banking companies in the United States through Mr. Kanas' vision of safe and prudent expansion, cost control and capital management. North Fork was sold to Capital One in December 2006 for $13.2 billion, or 4.0 times tangible equity, a transaction multiple higher than both the median transaction multiple of 3.2 for sales of banks with assets between $10 billion and $30 billion and the median transaction multiple of 3.0 for sales in the banking industry during the period from 2000 to 2006.
The Acquisition
On May 21, 2009, BankUnited entered into a purchase and assumption agreement, or the Purchase and Assumption Agreement, with the FDIC, Receiver of the Failed Bank, to acquire substantially all of the assets and assume all of the non-brokered deposits and substantially all other liabilities of the Failed Bank. Excluding the effects of acquisition accounting adjustments, BankUnited acquired $13.6 billion of assets and assumed $12.8 billion of liabilities. The fair value of the assets acquired was $10.9 billion and the fair value of the liabilities assumed was $13.1 billion. BankUnited received a net cash consideration from the FDIC in the amount of $2.2 billion.
The Acquisition consisted of assets with a fair value of $10.9 billion, including $5.0 billion of loans (with a corresponding unpaid principal balance, or UPB, of $11.2 billion), a $3.4 billion FDIC indemnification asset, $538.9 million of investment securities, $1.2 billion of cash and cash equivalents, $177.7 million of foreclosed assets, $243.3 million of Federal Home Loan Bank, or FHLB, stock and $347.4 million of other assets. Liabilities with a fair value of $13.1 billion were also assumed, including $8.3 billion of non-brokered deposits, $4.6 billion of FHLB advances, and $112.2 million of other liabilities.
Concurrently with the Acquisition, the Bank entered into the Loss Sharing Agreements with the FDIC that cover certain legacy assets, including the entire loan portfolio and OREO, and certain purchased investment securities, including private-label mortgage-backed securities and non-investment grade securities. The Bank acquired other BankUnited, FSB assets that are not covered by the Loss Sharing Agreements with the FDIC including cash, certain investment securities purchased at fair market value and other tangible assets. The Loss Sharing Agreements do not apply to subsequently acquired, purchased or originated assets. At September 30, 2010, the Covered Assets consisted of assets with a book value of $4.3 billion. The total UPB (or, for investment securities, unamortized cost basis) of the Covered Assets at September 30, 2010 was $8.9 billion.
Pursuant to the terms of the Loss Sharing Agreements, the Covered Assets are subject to a stated loss threshold whereby the FDIC will reimburse the Bank for 80% of losses up to the $4.0 billion stated threshold and 95% of losses in excess of the $4.0 billion stated threshold, calculated, in each case, based on UPB (or, for investment securities, unamortized cost basis) plus certain interest and
expenses. The carrying value of the FDIC indemnification asset at September 30, 2010 was $2.7 billion. The Bank will reimburse the FDIC for its share of recoveries with respect to losses for which the FDIC paid the Bank a reimbursement under the Loss Sharing Agreements. The FDIC's obligation to reimburse the Company for losses with respect to the Covered Assets began with the first dollar of loss incurred. We have received $997.2 million from the FDIC in reimbursements under the Loss Sharing Agreements for claims filed for losses incurred as of September 30, 2010. See "Business—The Acquisition—Loss Sharing Agreements."
Several elements of our Acquisition are favorable relative to other FDIC-assisted transactions and position the Company to generate significant value. At the time of the Acquisition, bank failures were on the rise and the U.S. Treasury's unprecedented Supervisory Capital Assessment Program for the largest U.S. bank holding companies was underway. Due in part to the distress in the banking system, economic uncertainty and poor capital markets conditions, the Covered Loans and OREO were purchased by the Bank in a bidding process for 76.5% of their $11.4 billion in UPB as of the Acquisition date, which represented the fair market value for those assets at that time. The discount was one of the largest relative to other FDIC-assisted transactions and reflected, in addition to the abovementioned factors, the poor quality of the assets acquired as noted by the ratio of non-performing assets to total assets of 23.5% at May 21, 2009. In addition, our bid included the granting of a warrant to the FDIC, allowing the FDIC to participate in the economic upside of the transaction if certain performance levels are achieved. Along with the pricing terms, the Loss Sharing Agreements and the size of the transaction enable the Company to generate significant capital even in severe loss scenarios. For example, in the worst case scenario of a 100% credit loss on all Covered Loans and OREO, we would recover no less than 89.7% of the UPB as of the Acquisition date, assuming compliance with the terms of the Loss Sharing Agreements.
Furthermore, the Loss Sharing Agreements include attractive provisions that optimize our flexibility and reduce our risk associated with the Covered Assets, including the following:
We view our relationship with the FDIC as a long-term partnership in which both parties are economically aligned to minimize credit losses on the Covered Assets.
Our Competitive Strengths
We believe that we are especially well positioned to create value for our stockholders.
experience and a history of high performance at nationally recognized mid- to large-cap financial institutions. Many of our management team members have extensive experience working together at North Fork and have successfully executed operating business models similar to ours in the past. In addition, our management has a successful track record of growing bank franchises both organically and through acquisitions.
Risks We Face
There are a number of risks that you should consider before buying our common stock. These risks are discussed more fully in the section entitled "Risk Factors" beginning on page 13. These risks include, but are not limited to:
ability to foreclose and hence delay the collection of payments for single family residential loans under the Loss Sharing Agreements; and
Our Business
Our primary business is to offer a full range of traditional banking products and financial services coupled with high-touch, personalized customer service to both our commercial and consumer customers, who are predominantly located in Florida. We offer a full array of lending products to cater to our customers' needs, including, but not limited to, small business loans, commercial real estate loans, equipment loans, term loans, asset-backed loans, letters of credit, commercial lines of credit, residential mortgage loans, home equity and consumer loans. We also offer traditional depository products, including checking accounts, money market deposit accounts, savings accounts and certificates of deposit, repo products and cash management services. Through dedicated financial consultants and licensed bankers, BankUnited Investment Services provides comprehensive wealth management products and services, including mutual funds, annuities, life insurance, individual securities and succession, estate and financial planning services. We believe that our customers are attracted to us because we offer the resources and sophistication of a large bank as well as the responsiveness and relationship-based approach of a community bank.
Our Market Area
We view our market as the southeast region of the United States with a current focus on Florida, and in particular the Miami metropolitan statistical area, or MSA. We believe Florida represents a long-term attractive banking market. According to estimates from SNL Financial, from June 30, 2000 to June 30, 2010, Florida added 2.9 million new residents, the third most of any U.S. state, and, at June 30, 2010, had a total population of 18.9 million and a median household income of $49,910. Additionally, the state has 1.9 million active businesses. We believe Florida's population provides tremendous opportunities for us to grow our business. At June 30, 2010, BankUnited ranked 11th in deposit market share in Florida and 6th in the Miami MSA, according to SNL Financial.
Florida's economy and banking industry continue to face significant challenges. Since 2007, many Florida banks have experienced capital constraints and liquidity challenges as a result of significant losses from loans with poor credit quality and investments that have had sizeable decreases in value or realized losses. The undercapitalization and increased regulation of the banking sector have caused many banks to reduce lending to new and existing clients and focus primarily on improving their balance sheets, putting pressure on commercial borrowers to look for new banking relationships. As of September 30, 2010, 40 banks with $31.8 billion in assets have failed since 2008 in Florida. Given our competitive strengths, including an experienced management team, robust capital position and scalable platform, we believe these challenges present significant acquisition and organic growth opportunities for us.
Over time, we will look to expand our branch network outside of Florida in selected markets such as New York, where our management team has had significant experience and has the competitive advantage of having managed one of the most successful regional banks in that market. However, for a limited period of time, certain of our executive officers are subject to non-compete agreements which may restrict them from operating in New York, New Jersey and Connecticut.
Our Business Strategy
Since the Acquisition, we have focused on the financial needs of small and medium sized businesses and consumers throughout Florida. Through BankUnited, we deliver a comprehensive range
of traditional depository and lending products, online services and cash management tools for businesses. We also offer on a national basis commercial lease financing services and municipal leasing services. Through our non-bank subsidiary, BankUnited Investment Services, we offer a suite of products including mutual funds, annuities, life insurance, individual securities and other wealth management services.
Our goal is to build a premier, large regional bank in attractive growth markets, employing the following key elements:
With the changes implemented as discussed above, we have increased our core deposits (defined as total deposits less certificates of deposit, or CDs) since the Acquisition to September 30, 2010 from $2.1 billion to $3.8 billion and lowered our cost of deposits (excluding the impact of accretion from fair value adjustments due to acquisition accounting) from 3.5% to 1.6%. In addition, since the Acquisition to September 30, 2010, we have generated $429.5 million of new commercial and commercial real estate loan commitments.
Additional Information
Our principal executive offices are located at 14817 Oak Lane, Miami Lakes, Florida 33016. Our telephone number is (305) 569-2000. Our Internet address is www.bankunited.com. Information on, or accessible through, our website is not part of this prospectus.
We are currently a direct, wholly-owned subsidiary of BU Financial Holdings LLC, or the LLC, a Delaware limited liability company, and whose common equity interests are referred to herein as units. Prior to the completion of this offering, we will effect a reorganization so that our investors, our named executive officers and all other members of the LLC will hold equity interests in us directly rather than indirectly through the LLC. Immediately prior to the consummation of this offering, the LLC will be liquidated and all interests in the registrant, BankUnited, Inc., a Delaware corporation, will be distributed to the members of the LLC in accordance with its amended and restated limited liability company agreement dated as of May 21, 2009, or the LLC Agreement. There are currently 36 holders of units in the LLC. All of the transactions necessary to effect the liquidation are collectively referred to herein as the "Reorganization." For additional information, see "Compensation Discussion and Analysis—Executive Officer Compensation—Equity-Based Compensation."
The Offering
Common stock offered by us | 4,000,000 shares of common stock | |
Common stock offered by the selling stockholders | 22,250,000 shares of common stock | |
Over-allotment option | 3,937,500 shares of common stock from the selling stockholders | |
Common stock to be outstanding after this offering | 96,971,850 shares of common stock | |
Use of proceeds | We estimate that the net proceeds to us from this offering after deducting estimated underwriting discounts and commissions and offering expenses will be approximately | |
Dividend policy | We initially anticipate paying a quarterly dividend of | |
New York Stock Exchange symbol | BKU | |
Risk factors | Please read the section entitled "Risk Factors" beginning on page 13 for a discussion of some of the factors you should consider before buying our common stock. |
References in this section to the number of shares of our common stock to be outstanding after this offering are based on 92,971,850 shares of our common stock outstanding and excludesas of January 10, 2011. Such references exclude:
Unless otherwise indicated, the information presented in this prospectus:
Summary Historical Consolidated Financial Data
You should read the summary historical consolidated financial information set forth below in conjunction with "Management's Discussion and Analysis of Financial Condition and Results of Operations," "Capitalization" and the consolidated financial statements and the related notes thereto included elsewhere in this prospectus. The summary historical consolidated financial information set forth below at and for the nine months ended September 30, 2010 is derived from our unaudited interim condensed consolidated financial statements included elsewhere in this prospectus and includes all adjustments (consisting of normal recurring adjustments) that we considered necessary for a fair presentation of the financial position and the results of operations for these periods. Operating results for the nine months ended September 30, 2010 are not necessarily indicative of the results that may be expected for the year ended December 31, 2010. The summary historical consolidated financial information set forth below at December 31, 2009 and for the period from April 28, 2009 (date of inception) to December 31, 2009 has been derived from our audited consolidated financial statements included elsewhere in this prospectus. The summary historical consolidated financial information set forth below for each of the periods from October 1, 2008 to May 21, 2009 and at and for the fiscal years ended September 30, 2008 and 2007 has been derived from the audited consolidated financial statements of the Failed Bank included elsewhere in this prospectus.
Although we were incorporated on April 28, 2009, neither we nor the Bank had any substantive operations prior to the Acquisition on May 21, 2009. Results of operations of the Company for the post-Acquisition periods are not comparable to the results of operations of the Failed Bank for the pre-Acquisition periods. Results of operations for the post-Acquisition periods reflect, among other things, the acquisition method of accounting. See "Management's Discussion and Analysis of Financial Condition and Results of Operations—Periods Presented and Factors Affecting Comparability."
| | BankUnited, Inc. | Failed Bank | |||||||||||||||
|---|---|---|---|---|---|---|---|---|---|---|---|---|---|---|---|---|---|
| | At September 30, 2010 | | At September 30, | ||||||||||||||
| | Actual | As Adjusted(1) | At December 31, 2009 | 2008 | 2007 | ||||||||||||
| | (unaudited) | | | | | ||||||||||||
| | (dollars in thousands, except per share data) | ||||||||||||||||
Consolidated Balance Sheet Data: | |||||||||||||||||
Cash and cash equivalents | $ | 494,586 | $ | 356,215 | $ | 1,223,346 | $ | 512,885 | |||||||||
Investment securities available for sale, at fair value | 3,088,504 | 2,243,143 | 755,225 | 1,098,665 | |||||||||||||
Loans held in portfolio, net | 4,079,234 | 4,588,898 | 11,249,367 | 12,561,693 | |||||||||||||
FDIC indemnification asset | 2,723,059 | 3,279,165 | — | — | |||||||||||||
Goodwill and other intangible assets | 60,759 | 60,981 | 28,353 | 28,353 | |||||||||||||
Total assets | 11,151,301 | 11,129,961 | 14,088,591 | 15,107,310 | |||||||||||||
Deposits | 7,300,460 | 7,666,775 | 8,176,817 | 7,305,788 | |||||||||||||
Federal Home Loan Bank advances | 2,260,006 | 2,079,051 | 5,279,350 | 6,234,360 | |||||||||||||
Total liabilities | 9,908,462 | 10,035,701 | 13,689,821 | 13,904,508 | |||||||||||||
Total stockholder's equity | 1,242,839 | 1,094,260 | 398,770 | 1,202,802 | |||||||||||||
| | BankUnited, Inc. | Failed Bank | |||||||||||||||
|---|---|---|---|---|---|---|---|---|---|---|---|---|---|---|---|---|---|
| | At September 30, 2010 | | At September 30, | ||||||||||||||
| | Actual | As Adjusted(1) | At December 31, 2009 | 2008 | 2007 | ||||||||||||
| | (unaudited) | | | | | ||||||||||||
| | (dollars in thousands, except per share data) | ||||||||||||||||
Consolidated Balance Sheet Data: | |||||||||||||||||
Cash and cash equivalents | $ | 494,586 | 580,763 | $ | 356,215 | $ | 1,223,346 | $ | 512,885 | ||||||||
Investment securities available for sale, at fair value | 3,088,504 | 3,088,504 | 2,243,143 | 755,225 | 1,098,665 | ||||||||||||
Loans held in portfolio, net | 4,079,234 | 4,079,234 | 4,588,898 | 11,249,367 | 12,561,693 | ||||||||||||
FDIC indemnification asset | 2,723,059 | 2,723,059 | 3,279,165 | — | — | ||||||||||||
Goodwill and other intangible assets | 60,759 | 60,759 | 60,981 | 28,353 | 28,353 | ||||||||||||
Total assets | 11,151,301 | 11,237,478 | 11,129,961 | 14,088,591 | 15,107,310 | ||||||||||||
Deposits | 7,300,460 | 7,300,460 | 7,666,775 | 8,176,817 | 7,305,788 | ||||||||||||
Federal Home Loan Bank advances | 2,260,006 | 2,260,006 | 2,079,051 | 5,279,350 | 6,234,360 | ||||||||||||
Total liabilities | 9,908,462 | 9,908,462 | 10,035,701 | 13,689,821 | 13,904,508 | ||||||||||||
Total stockholder's equity | 1,242,839 | 1,329,016 | 1,094,260 | 398,770 | 1,202,802 | ||||||||||||
| | BankUnited, Inc. | Failed Bank | |||||||||||||||
|---|---|---|---|---|---|---|---|---|---|---|---|---|---|---|---|---|---|
| | | Period from April 28, 2009 to December 31, 2009(2) | Period from October 1, 2008 to May 21, 2009(2) | At September 30, | |||||||||||||
| | Nine Months Ended September 30, 2010 | ||||||||||||||||
| | 2008 | 2007 | |||||||||||||||
| | (unaudited) | | | | | ||||||||||||
| | (dollars in thousands, except per share data) | ||||||||||||||||
Consolidated Income Statement Data: | |||||||||||||||||
Interest income | $ | 414,959 | $ | 335,524 | $ | 339,068 | $ | 834,460 | $ | 957,897 | |||||||
Interest expense | 127,495 | 83,856 | 333,392 | 555,594 | 604,558 | ||||||||||||
Net interest income | 287,464 | 251,668 | 5,676 | 278,866 | 353,339 | ||||||||||||
Provision for loan losses | 45,157 | 22,621 | 919,139 | 856,374 | 31,500 | ||||||||||||
Net interest income (loss) after provision for loan losses | 242,307 | 229,047 | (913,463 | ) | (577,508 | ) | 321,839 | ||||||||||
Non-interest income (loss) | 237,520 | 252,828 | (81,431 | ) | (128,859 | ) | 28,367 | ||||||||||
Non-interest expense | 220,048 | 282,454 | 238,403 | 246,480 | 185,634 | ||||||||||||
Income (loss) before income taxes | 259,779 | 199,421 | (1,233,297 | ) | (952,847 | ) | 164,572 | ||||||||||
Provision (benefit) for income before taxes | 102,857 | 80,375 | — | (94,462 | ) | 55,067 | |||||||||||
Net income (loss) | $ | 156,922 | $ | 119,046 | $ | (1,233,297 | ) | $ | (858,385 | ) | $ | 109,505 | |||||
Share Data: | |||||||||||||||||
Earnings (loss) per common share, basic and diluted | $ | 1.69 | $ | 1.29 | $ | (12,332,970 | ) | $ | (8,583,850 | ) | $ | 1,095,054 | |||||
Weighted average common shares outstanding | 92,943,620 | 92,664,910 | 100 | 100 | 100 | ||||||||||||
Other Data (unaudited): | |||||||||||||||||
Financial ratios | |||||||||||||||||
Return on average assets(3) | 1.86 | % | 1.69 | % | (14.26) | % | (5.94) | % | 0.78 | % | |||||||
Return on average common stockholder's equity(3) | 17.72 | % | 18.98 | % | (2,041.04) | % | (75.43) | % | 10.04 | % | |||||||
Yield on earning assets(3) | 7.16 | % | 7.42 | % | 3.91 | % | 5.91 | % | 6.96 | % | |||||||
Cost of interest bearing liabilities(3) | 1.82 | % | 1.39 | % | 3.94 | % | 4.36 | % | 4.91 | % | |||||||
Equity to assets ratio | 11.15 | % | 9.83 | % | (7.25) | % | 2.83 | % | 7.96 | % | |||||||
Interest rate spread(3) | 5.34 | % | 6.03 | % | (0.03) | % | 1.55 | % | 2.05 | % | |||||||
Net interest margin(3) | 4.95 | % | 5.58 | % | 0.06 | % | 1.98 | % | 2.57 | % | |||||||
Loan to deposit ratio | 56.67 | % | 60.15 | % | 128.73 | % | 146.33 | % | 172.74 | % | |||||||
Asset quality ratios | |||||||||||||||||
Non-performing loans to total loans(4)(6) | 0.68 | % | 0.38 | % | 24.58 | % | 11.98 | % | 1.59 | % | |||||||
Non-performing assets to total assets(5) | 1.99 | % | 1.24 | % | 23.53 | % | 11.13 | % | 1.51 | % | |||||||
Allowance for loan losses to total loans | 1.40 | % | 0.49 | % | 11.14 | % | 5.98 | % | 0.46 | % | |||||||
Allowance for loan losses to non-performing loans | 206.28 | % | 130.22 | % | 45.33 | % | 49.96 | % | 29.15 | % | |||||||
Net charge-offs to average loans(3) | 0.31 | % | 0.00 | % | 5.51 | % | 1.58 | % | 0.08 | % | |||||||
| | BankUnited, Inc. | Failed Bank | ||||||||||||
|---|---|---|---|---|---|---|---|---|---|---|---|---|---|---|
| | | | At September 30, | |||||||||||
| | At September 30, 2010 | At December 31, 2009(2) | ||||||||||||
| | 2008 | 2007 | ||||||||||||
| | (unaudited) | | | | ||||||||||
Capital ratios(7) | ||||||||||||||
Tangible common equity to tangible assets(8) | 10.66 | % | 9.33 | % | 2.63 | % | 7.79 | % | ||||||
Tier 1 common capital to total risk weighted assets | 42.46 | % | 40.42 | % | 4.90 | % | 14.64 | % | ||||||
Tier 1 risk-based capital | 42.46 | % | 40.42 | % | 4.90 | % | 14.64 | % | ||||||
Total risk-based capital | 43.27 | % | 40.55 | % | 6.21 | % | 15.37 | % | ||||||
Tier 1 leverage | 10.09 | % | 8.78 | % | 2.89 | % | 7.84 | % | ||||||
A $1.00 increase (decrease) in the assumed initial public offering price of $$24.00 per share would increase (decrease) additional cash and cash equivalents, total assets and total stockholder's equity by $$3.8 million, assuming that the number of shares offered by us, as set forth on the cover of this prospectus, remains the same and after deducting estimated underwriting discounts and commissions and offering expenses.
Investing in our common stock involves a high degree of risk. You should carefully consider the following risk factors, as well as all of the other information contained in this prospectus including our consolidated financial statements and the related notes thereto, before deciding to invest in our common stock. The occurrence of any of the following risks could materially and adversely affect our business, prospects, financial condition, results of operations and cash flow. In such case, the trading price of our common stock could decline and you could lose all or part of your investment.
Risks Related to Our Business
Failure to comply with the terms of our Loss Sharing Agreements with the FDIC may result in significant losses.
In May 2009, we purchased substantially all of the assets and assumed all of the non-brokered deposits and substantially all other liabilities of the Failed Bank in an FDIC-assisted transaction, and presently a substantial portion of BankUnited's revenue is derived from such assets. The purchased loans, commitments, foreclosed assets and certain securities are covered by the Loss Sharing Agreements with the FDIC, which provide that a significant portion of the losses related to the Covered Assets will be borne by the FDIC. Under the Loss Sharing Agreements, we are obligated to comply with certain loan servicing standards, including requirements to participate in government-sponsored loan modification programs. As these standards evolve, we may experience difficulties in complying with the requirements of the Loss Sharing Agreements, which could result in Covered Assets losing some or all of their coverage. BankUnited is subject to audits with the terms of the Loss Sharing Agreements by the FDIC through its designated agent. The required terms of the agreements are extensive and failure to comply with any of the guidelines could result in a specific asset or group of assets losing their loss sharing coverage. See "Business—The Acquisition—Loss Sharing Agreements."
The geographic concentration of our markets in the coastal regions of Florida makes our business highly susceptible to local economic conditions and natural disasters.
Unlike larger financial institutions that are more geographically diversified, our branch offices are primarily concentrated in the coastal regions of Florida. Additionally, a significant portion of our loans secured by real estate are secured by commercial and residential properties in Florida. The Florida economy and our market in particular have been affected by the downturn in commercial and residential property values, and the decline in real estate values in Florida during the downturn has been higher than the national average. Additionally, the Florida economy relies heavily on tourism and seasonal residents, which have also been affected by recent market disruptions. Continued deterioration in economic conditions in the markets we serve or the occurrence of a natural disaster, such as a hurricane, or a man-made catastrophe, such as the Gulf of Mexico oil spill, could result in one or more of the following:
Hurricanes and other catastrophes to which our markets in the coastal regions of Florida are susceptible also can disrupt our operations, result in damage to our properties, reduce or destroy the value of collateral and negatively affect the local economies in which we operate, which could have a material adverse effect on our results of operations.
A decline in existing and new real estate sales decreases lending opportunities, may delay the collection of our cash flow from the Loss Sharing Agreements, and negatively affects our income. We
do not anticipate that the real estate market will improve in the near-term and, accordingly, this could lead to additional valuation adjustments on our loan portfolios.
Delinquencies and defaults in residential mortgages have recently increased, creating a backlog in courts and an increase in the amount of legislative action that might restrict or delay our ability to foreclose and hence delay the collection of payments for single family residential loans under the Loss Sharing Agreements.
For the single family residential loans covered by the Loss Sharing Agreements, we cannot collect loss share payments until we liquidate the properties securing those loans. These loss share payments could be delayed by an extended foreclosure process, including delays resulting from a court backlog, local or national foreclosure moratoriums or other delays, and these delays could have a material adverse effect on our results of operations. Home ownerHomeowner protection laws may also delay the initiation or completion of foreclosure proceedings on specified types of residential mortgage loans. Any such limitations are likely to cause delayed or reduced collections from mortgagors. Any restriction on our ability to foreclose on a loan, any requirement that we forgo a portion of the amount otherwise due on a loan or any requirement that we modify any original loan terms could negatively impact our business, financial condition, liquidity and results of operations.
Our loan portfolio has and will continue to be affected by the ongoing correction in residential and commercial real estate prices and reduced levels of residential and commercial real estate sales.
Soft residential and commercial real estate markets, higher delinquency and default rates, and increasingly volatile and constrained secondary credit markets have affected the mortgage industry generally, and Florida in particular, which is where our business is currently most heavily concentrated. Our financial results may be adversely affected by changes in real estate values. We make credit and reserve decisions based on the current conditions of borrowers or projects combined with our expectations for the future. If the slowdown in the real estate market continues, we could experience higher charge-offs and delinquencies beyond that which is provided in the allowance for loan losses. Although we have the Loss Sharing Agreements with the FDIC, these agreements do not cover 100% of the losses attributable to Covered Assets. In addition, the Loss Sharing Agreements will not mitigate any losses on our non-Covered Assets and our earnings could be adversely affected through a higher than anticipated provision for loan losses on such assets.
Our business is highly susceptible to credit risk on our non-Covered Assets.
As a lender, we are exposed to the risk that our customers will be unable to repay their loans according to their terms and that the collateral securing the payment of their loans (if any) may not be sufficient to assure repayment. Similarly, we have credit risk embedded in our securities portfolio. Our credit standards, procedures and policies may not prevent us from incurring substantial credit losses, particularly in light of market developments in recent years. Recent economic and market developments and the potential for continued economic disruption present considerable risks to us and it is difficult to determine the depth and duration of the economic and financial market problems and the many ways in which they may impact our business in general. The Loss Sharing Agreements only cover certain legacy assets, and credit losses on assets not covered by the Loss Sharing Agreements could have a material adverse effect on our operating results.
Changes in interest rates could have an adverse impact on our results of operations and financial condition.
Our earnings and cash flows depend to a great extent upon the level of our net interest income. Changes in interest rates can increase or decrease our net interest income, because different types of assets and liabilities may react differently, and at different times, to market interest rate changes. Net interest income is the difference between the interest income we earn on loans, investments and other interest earning assets, and the interest we pay on interest bearing liabilities, such as deposits and borrowings. When interest bearing liabilities mature or reprice more quickly than interest earning assets
in a period, an increase in interest rates could reduce net interest income. Similarly, when interest earning assets mature or reprice more quickly than interest bearing liabilities, falling interest rates could reduce net interest income. Additionally, an increase in interest rates may, among other things, reduce the demand for loans and our ability to originate loans and decrease loan repayment rates. A decrease in the general level of interest rates may affect us through, among other things, increased prepayments on our loan and mortgage-backed securities portfolios and increased competition for deposits. Accordingly, changes in the level of market interest rates affect our net yield on interest earning assets, loan origination volume, loan and mortgage-backed securities portfolios, and our overall results. Interest rates are highly sensitive to many factors beyond our control, including general economic conditions and policies of various governmental and regulatory agencies, particularly the Federal Reserve.
We attempt to manage our risk from changes in market interest rates by adjusting the rates, maturity, repricing, and balances of the different types of interest-earning assets and interest bearing liabilities; however, interest rate risk management techniques are not precise, and we may not be able to successfully manage our interest rate risk. As a result, a rapid increase or decrease in interest rates could have an adverse effect on our net interest margin and results of operations.
We depend on our executive officers and key personnel to continue the implementation of our long-term business strategy and could be harmed by the loss of their services.
We believe that our continued growth and future success will depend in large part on the skills of our senior management team. We believe our senior management team possesses valuable knowledge about and experience in the banking industry and that their knowledge and relationships would be very difficult to replicate. Although our senior management team has entered into employment agreements with us, they may not complete the term of their employment agreements or renew them upon expiration. Our success also depends on the experience of our branch managers and lending officers and on their relationships with the customers and communities they serve. The loss of service of one or more of our executive officers or key personnel, or the inability to recruit and retain qualified personnel in the future, could have an adverse effect on our business, financial condition or operating results and the value of our common stock.
Our allowance for credit losses may not be adequate to cover actual credit losses.
We maintain an allowance for loan losses that represents management's estimate of probable losses inherent in our credit portfolio. This estimate requires management to make certain assumptions and involves a high degree of judgment, particularly as our originated loan portfolio is not yet seasoned and has not yet developed an observable loss trend and Covered Loans that did not exhibit evidence of deterioration in credit quality at acquisition, or non-ACI loans, have limited delinquency statistics. Management considers numerous factors, including, but not limited to, internal risk ratings, loss forecasts, collateral values, geographic location, borrower FICO scores, delinquency rates, the proportion of non-performing and restructured loans in the loan portfolio, origination channels, product mix, underwriting practices, industry conditions, economic trends and net charge-off trends.
If management's assumptions and judgments prove to be incorrect, our current allowance may be insufficient and we may be required to increase our allowance for loan losses. In addition, federal and state regulators periodically review our allowance for loan losses and may require us to increase our provision for loan losses or recognize further loan charge-offs, based on judgments different than those of our management. Continued adverse economic conditions could make management's estimate even more complex and difficult to determine. Any increase in our allowance for loan losses will result in a decrease in net income and capital and could have a material adverse effect on our financial condition and results of operations. See "Management's Discussion and Analysis of Financial Condition and Results of Operations—Analysis of the Allowance for Loan Losses" and "Management's Discussion
and Analysis of Financial Condition and Results of Operations—Critical Accounting Policies and Estimates—Accounting for Covered Loans."
We may not be able to find suitable acquisition candidates and may be unable to manage our growth due to acquisitions.
A key component of our growth strategy is to pursue acquisitions of complementary businesses. As consolidation of the banking industry continues, the competition for suitable acquisition candidates may increase. We compete with other banking companies for acquisition opportunities and there are a limited number of candidates that meet our acquisition criteria. Consequently, we may not be able to identify suitable candidates for acquisitions. If we are unable to locate suitable acquisition candidates willing to sell on terms acceptable to us, our net income could decline and we would be required to find other methods to grow our business.
Even if suitable candidates are identified and we succeed in consummating future acquisitions, acquisitions involve risks that the acquired business may not achieve anticipated revenue, earnings or cash flows. There may also be unforeseen liabilities relating to the acquired institution or arising out of the acquisition, asset quality problems of the acquired entity, difficulty operating in markets in which we have had no or only limited experience and other conditions not within our control, such as adverse personnel relations, loss of customers because of change in identity, and deterioration in local economic conditions.
In addition, the process of integrating acquired entities will divert significant management time and resources. We may not be able to integrate successfully or operate profitably any financial institutions we may acquire. We may experience disruption and incur unexpected expenses in integrating acquisitions. Any acquisitions we do make may not enhance our cash flows, business, financial condition, results of operations or prospects and may have an adverse effect on our results of operations, particularly during periods in which the acquisitions are being integrated into our operations.
We face significant competition from other financial institutions and financial services providers, which may decrease our growth or profits.
The primary market we serve is Florida. Consumer and commercial banking in Florida is highly competitive. Our market contains not only a large number of community and regional banks, but also a significant presence of the country's largest commercial banks. We compete with other state and national financial institutions located in Florida and adjoining states as well as savings and loan associations, savings banks and credit unions for deposits and loans. In addition, we compete with financial intermediaries, such as consumer finance companies, mortgage banking companies, insurance companies, securities firms, mutual funds and several government agencies as well as major retailers, all actively engaged in providing various types of loans and other financial services.
The financial services industry could become even more competitive as a result of legislative, regulatory and technological changes and continued consolidation. Banks, securities firms and insurance companies can merge under the umbrella of a financial holding company, which can offer virtually any type of financial service, including banking, securities underwriting, insurance (both agency and underwriting) and merchant banking. Increased competition among financial services companies due to the recent consolidation of certain competing financial institutions may adversely affect our ability to market our products and services. Also, technology has lowered barriers to entry and made it possible for banks to compete in our market without a retail footprint by offering competitive rates, as well as non-banks to offer products and services traditionally provided by banks. Many of our competitors have fewer regulatory constraints and may have lower cost structures. Additionally, due to their size, many competitors may offer a broader range of products and services as well as better pricing for certain products and services than we can.
Our ability to compete successfully depends on a number of factors, including:
Failure to perform in any of these areas could significantly weaken our competitive position, which could adversely affect our growth and profitability, which, in turn, could harm our business, financial condition and results of operations.
Since we engage in lending secured by real estate and may be forced to foreclose on the collateral property and own the underlying real estate, we may be subject to the increased costs and risks associated with the ownership of real property, which could have an adverse effect on our business or results of operations.
A significant portion of our loan portfolio is secured by real property. During the ordinary course of business, we may foreclose on and take title to properties securing certain loans, in which case, we are exposed to the risks inherent in the ownership of real estate. The amount that we, as a mortgagee, may realize after a default is dependent upon factors outside of our control, including:
Certain expenditures associated with the ownership of real estate, principally real estate taxes and maintenance costs, may also adversely affect our operating expenses.
We are dependent on our information technology and telecommunications systems and third-party servicers, and systems failures, interruptions or breaches of security could have an adverse effect on our financial condition and results of operations.
Our business is highly dependent on the successful and uninterrupted functioning of our information technology and telecommunications systems and third-party servicers. We outsource our major systems including our electronic funds transfer, or EFT, transaction processing, cash management and online banking services. We rely on these systems to process new and renewal loans, gather deposits, provide customer service, facilitate collections and share data across our organization. The failure of these systems, or the termination of a third-party software license or service agreement on
which any of these systems is based, could interrupt our operations. Because our information technology and telecommunications systems interface with and depend on third-party systems, we could experience service denials if demand for such services exceeds capacity or such third-party systems fail or experience interruptions. If sustained or repeated, a system failure or service denial could result in a deterioration of our ability to process new and renewal loans, gather deposits and provide customer service, compromise our ability to operate effectively, damage our reputation, result in a loss of customer business, and/or subject us to additional regulatory scrutiny and possible financial liability, any of which could have a material adverse effect on our financial condition and results of operations.
We are currently in the process of implementing substantial changes to our core deposit platform. We may not be able to successfully implement this new core system in an effective manner. In addition, we may incur significant increases in costs and encounter extensive delays in the implementation and rollout of our new operating system. If there are technological impediments, unforeseen complications, errors or breakdowns in implementing this new core operating system or if this new core operating system does not meet the requirements of our customers, our business, financial condition, results of operations or customer perceptions may be adversely affected.
In addition, we provide our customers the ability to bank remotely, including online and over the telephone. The secure transmission of confidential information over the Internet and other remote channels is a critical element of remote banking. Our network could be vulnerable to unauthorized access, computer viruses, phishing schemes and other security breaches. We may be required to spend significant capital and other resources to protect against the threat of security breaches and computer viruses, or to alleviate problems caused by security breaches or viruses. To the extent that our activities or the activities of our customers involve the storage and transmission of confidential information, security breaches and viruses could expose us to claims, litigation and other possible liabilities. Any inability to prevent security breaches or computer viruses could also cause existing customers to lose confidence in our systems and could adversely affect our reputation and our ability to generate business.
BankUnited is a de novo bank, which could be mistaken for the Failed Bank, and this and other reputational risks could affect our results.
BankUnited was established as ade novo federal savings association in order to participate in the FDIC-assisted acquisition of the Failed Bank. There is a reputational risk in being incorrectly associated with the Failed Bank. Our ability to originate and maintain accounts is highly dependent upon consumer and other external perceptions of our business practices and/or our financial health. Adverse perceptions regarding our business practices and/or our financial health could damage our reputation in both the customer and funding markets, leading to difficulties in generating and maintaining accounts as well as in financing them. Adverse developments with respect to the consumer or other external perceptions regarding the practices of our competitors, or our industry as a whole, may also adversely impact our reputation. In addition, adverse reputational impacts on third parties with whom we have important relationships may also adversely impact our reputation. Adverse reputational impacts or events may also increase our litigation risk. We carefully monitor internal and external developments for areas of potential reputational risk and have established governance structures to assist in evaluating such risks in our business practices and decisions.
Three material weaknesses were identified in the first audit period following the Acquisition. Existing or future material weaknesses in our internal controls, if not properly corrected, could result in material misstatements in our financial statements.
We are not yet required to comply with Section 404 of the Sarbanes-Oxley Act of 2002, or to make an assessment of the effectiveness of our internal control over financial reporting under the Sarbanes-Oxley Act of 2002. Furthermore, our independent auditors have not been engaged to express, nor have they expressed, an opinion on the effectiveness of our internal control over financial reporting in
accordance with Sarbanes-Oxley Act of 2002. However, in connection with the audit of our consolidated financial statements for the period from May 22, 2009 through December 31, 2009, which we refer to as the period ended or ending December 31, 2009, we identified three material weaknesses in our system of internal control over financial reporting. A material weakness is a deficiency, or combination of deficiencies in internal controls over financial reporting, that results in a reasonable possibility that a material misstatement of our annual or interim financial statements will not be prevented or detected on a timely basis.
The first material weakness identified relates to the fact that management did not design effective controls over its loan modeling process in order to account for certain loans in accordance with the requirements of Accounting Standards Codification, or ASC, Subtopic 310-30,Loans and Debt Securities Acquired with Deteriorated Credit Quality. A material weakness existed due to the fact that the design of internal control did not provide for an independent review or approval and validation of the loan cash flow model and related assumptions. In addition, the design of internal control over the loan cash flow model did not provide for adequate access, change management, and end-user computing controls including spreadsheets. Furthermore, management's controls were not designed to reflect on a timely basis the impact of changes in market conditions on the loan cash flow model and related assumptions. The second material weakness relates to the fact that management did not maintain effective internal controls over the valuation and resulting writedown to fair market value of OREO properties. Specifically, a material weakness existed due to the fact that the control over the timely recording of OREO values by the Collateral Valuation Department in the Company's sub-ledger system was not operating effectively. The third material weakness relates to the fact that BankUnited did not design effective controls over its financial reporting process in order to ascertain the complete, accurate, and timely preparation of its consolidated financial statements, including the applicable disclosures and footnotes, or design effective review controls to provide for proper accounting of nonroutine transactions. A material weakness existed due to the fact that the design of internal control did not provide for a comprehensive review of interim financial information and the consolidated financial statements to ensure the completeness and accuracy of information supporting various financial statement components.
Steps we are taking to address the identified material weaknesses may not be sufficient to remediate the identified material weaknesses or prevent additional material weaknesses from occurring. If we fail to remediate the material weaknesses or if additional material weaknesses are discovered in the future, we may fail to meet our future reporting obligations and our financial statements may contain material misstatements. Any such failure could also adversely affect the results of the periodic management evaluations and annual auditor attestation reports regarding the effectiveness of our internal controls over financial reporting, and could negatively impact our business, results of operations and reputation.
BankUnited Investment Services offers third-party products including mutual funds, annuities, life insurance, individual securities and other wealth management services which could experience significant declines in value subjecting us to reputational damage and litigation risk.
Through our subsidiary BankUnited Investment Services, we offer third-party products including mutual funds, annuities, life insurance, individual securities and other wealth management products and services. If these products do not generate competitive risk-adjusted returns that satisfy clients in a variety of asset classes, we will have difficulty maintaining existing business and attracting new business. Additionally, our investment services businesses involve the risk that clients or others may sue us, claiming that we have failed to perform under a contract or otherwise failed to carry out a duty owed to them. Our investment services businesses are particularly subject to this risk and this risk may be heightened during periods when credit, equity or other financial markets are deteriorating in value or are particularly volatile, or when clients or investors are experiencing losses. Significant declines in the performance of these third-party products could subject us to reputational damage and litigation risk.
Risks Relating to the Regulation of Our Industry
The enactment of the Dodd-Frank Wall Street Reform and Consumer Protection Act of 2010 may have a material effect on our operations.
On July 21, 2010, President Obama signed into law the Dodd-Frank Wall Street Reform and Consumer Protection Act of 2010, or the Dodd-Frank Act, which imposes significant regulatory and compliance changes. The key effects of the Dodd-Frank Act on our business are:
The changes resulting from the Dodd-Frank Act may impact the profitability of our business activities, require changes to certain of our business practices, impose upon us more stringent capital, liquidity and leverage requirements or otherwise adversely affect our business. These changes may also require us to invest significant management attention and resources to evaluate and make any changes necessary to comply with new statutory and regulatory requirements. Failure to comply with the new requirements or with any future changes in laws or regulations may negatively impact our results of operations and financial condition. For a more detailed description of the Dodd-Frank Act, see "Regulation and Supervision—The Dodd-Frank Act."
We operate in a highly regulated environment and the laws and regulations that govern our operations, corporate governance, executive compensation and accounting principles, or changes in them, or our failure to comply with them, may adversely affect us.
We are subject to extensive regulation, supervision, and legislation that govern almost all aspects of our operations. Intended to protect customers, depositors and deposit insurance funds, these laws and regulations, among other matters, prescribe minimum capital requirements, impose limitations on the business activities in which we can engage, limit the dividend or distributions that BankUnited can pay to us, restrict the ability of institutions to guarantee our debt, and impose certain specific accounting requirements on us that may be more restrictive and may result in greater or earlier charges to earnings or reductions in our capital than generally accepted accounting principles. Compliance with laws and regulations can be difficult and costly, and changes to laws and regulations often impose additional compliance costs. Our failure to comply with these laws and regulations, even if the failure follows good faith effort or reflects a difference in interpretation, could subject us to restrictions on our business activities, fines and other penalties, any of which could adversely affect our results of operations, capital base and the price of our securities. Further, any new laws, rules and regulations could make compliance more difficult or expensive or otherwise adversely affect our business and financial condition.
In addition, as a public company, we will incur significant legal, accounting, insurance and other expenses. Compliance with other rules of the United States Securities and Exchange Commission, or the SEC, and the rules of the stock exchange on which our common stock is listed will increase our legal and financial compliance costs and make some activities more time consuming and costly.
The FDIC's restoration plan and the related increased assessment rate could adversely affect our earnings.
Market developments have significantly depleted the deposit insurance fund, or DIF, of the FDIC and reduced the ratio of reserves to insured deposits. As a result of recent economic conditions and the enactment of the Dodd-Frank Act, the FDIC has increased the deposit insurance assessment rates and thus raised deposit premiums for insured depository institutions. If these increases are insufficient for the DIF to meet its funding requirements, further special assessments or increases in deposit insurance premiums may be required. We are generally unable to control the amount of premiums that we are required to pay for FDIC insurance. If there are additional bank or financial institution failures, we may be required to pay even higher FDIC premiums than the recently increased levels. Any future additional assessments, increases or required prepayments in FDIC insurance premiums may materially adversely affect results of operations.
Federal banking agencies periodically conduct examinations of our business, including compliance with laws and regulations, and our failure to comply with any supervisory actions to which we are or become subject as a result of such examinations may adversely affect us.
Federal banking agencies, including the Office of Thrift Supervision, or OTS, periodically conduct examinations of our business, including compliance with laws and regulations. If, as a result of an examination, a federal banking agency were to determine that the financial condition, capital resources, asset quality, earnings prospects, management, liquidity or other aspects of any of our operations had become unsatisfactory, or that the Company or its management was in violation of any law or regulation, it may take a number of different remedial actions as it deems appropriate. These actions include the power to enjoin "unsafe or unsound" practices, to require affirmative actions to correct any conditions resulting from any violation or practice, to issue an administrative order that can be judicially enforced, to direct an increase in BankUnited's capital, to restrict our growth, to assess civil monetary penalties against our officers or directors, to remove officers and directors and, if it is concluded that such conditions cannot be corrected or there is an imminent risk of loss to depositors, to terminate BankUnited's deposit insurance. If we become subject to such regulatory actions, our business, results of operations and reputation may be negatively impacted.
Many of our new activities and expansion plans require regulatory approvals, and failure to obtain them may restrict our growth.
We intend to complement and expand our business by pursuing strategic acquisitions of banks and other financial institutions. We must generally receive federal regulatory approval before we can acquire an institution or business. In determining whether to approve a proposed acquisition, federal bank regulators will consider, among other factors, the effect of the acquisition on the competition, our financial condition, and our future prospects. The regulators also review current and projected capital ratios and levels, the competence, experience, and integrity of management and its record of compliance with laws and regulations, the convenience and needs of the communities to be served (including the acquiring institution's record of compliance under the Community Reinvestment Act, or CRA) and the effectiveness of the acquiring institution in combating money laundering activities. Such regulatory approvals may not be granted on terms that are acceptable to us, or at all. We may also be required to sell branches as a condition to receiving regulatory approval, which condition may not be acceptable to us or, if acceptable to us, may reduce the benefit of any acquisition.
In addition to the acquisition of existing financial institutions, as opportunities arise, we plan to continuede novo branching as a part of our internal growth strategy and possibly enter into new markets throughde novo branching.De novo branching and any acquisition carries with it numerous risks, including the inability to obtain all required regulatory approvals. The failure to obtain these regulatory approvals for potential future strategic acquisitions andde novo branches may impact our business plans and restrict our growth.
Financial institutions, such as BankUnited, face a risk of noncompliance and enforcement action with the Bank Secrecy Act and other anti-money laundering statutes and regulations.
The federal Bank Secrecy Act, the USA PATRIOT Act, and other laws and regulations require financial institutions, among other duties, to institute and maintain an effective anti-money laundering program and file suspicious activity and currency transaction reports as appropriate. The federal Financial Crimes Enforcement Network, established by the U.S. Treasury Department to administer the Bank Secrecy Act, is authorized to impose significant civil money penalties for violations of those requirements, and has recently engaged in coordinated enforcement efforts with the individual federal banking regulators, as well as the U.S. Department of Justice, Drug Enforcement Administration, and Internal Revenue Service. There is also increased scrutiny of compliance with the rules enforced by the Office of Foreign Assets Control.
In order to comply with regulations, guidelines and examination procedures in this area, we have enhanced our anti-money laundering program by adopting new policies and procedures and selecting a new, robust automated anti-money laundering software solution that is scheduled to be implemented in early 2011. If our policies, procedures and systems are deemed deficient or the policies, procedures and systems of the financial institutions that we have already acquired or may acquire in the future are deficient, we would be subject to liability, including fines and regulatory actions such as restrictions on our ability to pay dividends and the necessity to obtain regulatory approvals to proceed with certain aspects of our business plan, including our acquisition plans.
We are subject to the CRA and fair lending laws, and failure to comply with these laws could lead to material penalties.
The CRA, the Equal Credit Opportunity Act, the Fair Housing Act and other fair lending laws and regulations impose nondiscriminatory lending requirements on financial institutions. The Department of Justice and other federal agencies are responsible for enforcing these laws and regulations. A successful challenge to an institution's performance under the CRA or fair lending laws and regulations could result in a wide variety of sanctions, including the required payment of damages and civil money penalties, injunctive relief, imposition of restrictions on mergers and acquisitions activity, and restrictions on expansion activity. Private parties may also have the ability to challenge an institution's performance under fair lending laws in private class action litigation.
Risks Related to this Offering and Ownership of Our Common Stock
There is no prior public market for our common stock and one may not develop.
Prior to this offering, there has not been a public trading market for our common stock. An active trading market may not develop or be sustained after this offering. If an active trading market does not develop, you may have difficulty selling your shares of common stock at an attractive price, or at all. The initial public offering price for our common stock sold in this offering will be determined by negotiations among us, the selling stockholders and the underwriters. This price may not be indicative of the price at which our common stock will trade after this offering. The market price of our common stock may decline below the initial offering price, and you may not be able to sell your common stock at or above the price you paid in this offering, or at all.
Our stock price may be volatile, and you could lose all or part of your investment as a result.
You should consider an investment in our common stock to be risky, and you should invest in our common stock only if you can withstand a significant loss and wide fluctuation in the market value of your investment. The market price of our common stock could be subject to wide fluctuations in
response to, among other things, the factors described in this "Risk Factors" section, and other factors, some of which are beyond our control. These factors include:
Furthermore, the stock markets have experienced price and volume fluctuations that have affected and continue to affect the market price of equity securities of many companies. These fluctuations have often been unrelated or disproportionate to the operating performance of these companies. These broad market fluctuations, as well as general economic, systemic, political and market conditions, such as recessions, loss of investor confidence, interest rate changes, or international currency fluctuations, may negatively affect the market price of our common stock.
If any of the foregoing occurs, it could cause our stock price to fall and may expose us to securities class action litigation that, even if unsuccessful, could be costly to defend and a distraction to management.
We may not pay cash dividends on our common stock.
Although we intend to pay dividends to our stockholders, we have no obligation to do so and may change our dividend policy at any time without notice to our stockholders. Holders of our common stock are only entitled to receive such cash dividends as our Board may declare out of funds legally available for such payments. Any decision to declare and pay dividends will be dependent on a variety of factors, including our financial condition, earnings, legal requirements and other factors that our Board deems relevant. In addition, our ability to pay dividends may be limited by covenants of any future indebtedness we or our subsidiaries incur. As a result, you many not receive any return on an investment in our common stock unless you sell our common stock for a price greater than that which you paid for it. In addition, since we are a holding company with no significant assets other than the capital stock of our banking subsidiary, we will need to depend upon dividends from the Bank for substantially all of our income. Accordingly, our ability to pay dividends depends primarily upon the receipt of dividends or other capital distributions from the Bank. The Bank's ability to pay dividends to us is subject to, among other things, its earnings, financial condition and need for funds, as well as federal and state governmental policies and regulations applicable to us and the Bank, which limit the amount that may be paid as dividends without prior regulatory approval.
You will incur immediate and substantial dilution in the net tangible book value of the shares you purchase in this offering.
The initial public offering price is likely to be substantially higher than the net tangible book value per share of our common stock based on the total value of our tangible assets less our total liabilities
divided by our shares of common stock outstanding immediately following this offering. Therefore, if you purchase common stock in this offering, you will experience immediate and substantial dilution in net tangible book per share value after completion of this offering. To the extent outstanding options to purchase our common stock are exercised, there will be further dilution. See the section entitled "Dilution."
Our stock price could decline due to the large number of outstanding shares of our common stock eligible for future sale.
Sales of substantial amounts of our common stock in the public market following this offering, or the perception that these sales could occur, could cause the market price of our common stock to decline. These sales could also make it more difficult for us to sell equity or equity relatedequity-related securities in the future, at a time and place that we deem appropriate.
Upon completion of this offering, we will have 96,971,850 outstanding shares of common stock, assuming no exercise of the underwriters' over-allotment option, and an initial public offering price of $ per share, the midpoint of the price range set forth on the cover of this prospectus.stock. Of the outstanding shares, all of the 26,250,000 shares sold in this offering plus any additional(30,187,500 shares sold uponif the underwriters exercise of the underwriters'in full their over-allotment optionoption) will be freely tradable, except that any shares purchased by "affiliates" (as that term is defined in Rule 144 under the Securities Act of 1933, or the Securities Act), only may be sold in compliance with the limitations described in the section entitled "Shares Eligible For Future Sale—Rule 144." Taking into consideration the effect of the lock-up agreements described below and the provisions of Rule 144 and Rule 701 ofunder the Securities Act, the remaining shares of our common stock willmay may be availableeligible for saleresale in the public market as follows:
We, our executive officers, directors and the selling stockholders have agreed with the underwriters, subject to certain exceptions, not to dispose of or hedge any of their shares of common stock or securities convertible into or exchangeable for shares during the period from the date of this prospectus continuing through the date 180 days after the date of this prospectus, except with the prior written consent of Morgan Stanley & Co. Incorporated and Merrill Lynch, Pierce, Fenner & Smith Incorporated. See the section entitled "Underwriters." In addition, (1) each of Mr. Kanas and certain funds affiliated with Blackstone, Carlyle, Centerbridge and WL Ross have separately agreed during the 18 months from the date of this prospectus and (2) our other executive officers have separately agreed during the 12 months from the date of this prospectus not to effect any sales pursuant to Rule 144 under the Securities Act of any of our equity securities. See "Description of Our Capital Stock—Registration Rights." Any future sales of common stock by our executive officers will further be subject to minimum equity ownership requirements to which our executive officers have agreed. See "Compensation Discussion and Analysis—Executive Officer Compensation—Equity Ownership Requirements."
In addition, we intend to file a registration statement on Form S-8 under the Securities Act to register an aggregate of approximately 8.5 million shares of common stock for issuance under our 2009 Stock Option Plan and 2010 Omnibus Equity Incentive Plan. We may issue all of these shares without any action or approval by our stockholders, and these shares once issued (including upon exercise of outstanding options) will be available for sale into the public market subject to the restrictions described above, if applicable to the holder. Any shares issued in connection with acquisitions, the exercise of stock options or otherwise would dilute the percentage ownership held by investors who purchase our shares in this offering.
"Anti-takeover" provisions and the regulations to which we are subject may make it more difficult for a third party to acquire control of us, even if the change in control would be beneficial to stockholders.
We are a savings and loan holding company incorporated in the state of Delaware. Anti-takeover provisions in Delaware law and our certificate of incorporation and by-laws, as well as regulatory approvals that would be required under federal law, could make it more difficult for a third-party to
take control of us and may prevent stockholders from receiving a premium for their shares of our common stock. These provisions could adversely affect the market price of our common stock and could reduce the amount that stockholders might get if we are sold.
Our certificate of incorporation will provide for, among other things:
Delaware law also imposes some restrictions on mergers and other business combinations between us and any holder of 15% or more of our outstanding common stock. See the section entitled "Description of Our Capital Stock—Anti-Takeover Considerations and Special Provisions of our Certificate of Incorporation, By-Laws and Delaware Law." We believe that these provisions protect our stockholders from coercive or otherwise unfair takeover tactics by requiring potential acquirers to negotiate with our Board and by providing our Board with more time to assess any acquisition proposal. However, these provisions apply even if the offer may be determined to be beneficial by some stockholders and could delay or prevent an acquisition that our Board determines is not in our best interest and that of our stockholders.
Furthermore, banking laws impose notice, approval and ongoing regulatory requirements on any shareholder or other party that seeks to acquire direct or indirect "control" of an FDIC-insured depository institution. These laws include the Savings and Loan Holding Company Act, the Bank Holding Company Act of 1956 and the Change in Bank Control Act. These laws could delay or prevent an acquisition.
CAUTIONARY NOTE REGARDING FORWARD-LOOKING STATEMENTS
Some of the statements under "Prospectus Summary," "Risk Factors," "Management's Discussion and Analysis of Financial Condition and Results of Operations," "Business" and elsewhere in this prospectus may contain forward-looking statements that reflect our current views with respect to, among other things, future events and financial performance. We generally identify forward-looking statements by terminology such as "outlook," "believes," "expects," "potential," "continues," "may," "will," "could," "should," "seeks," "approximately," "predicts," "intends," "plans," "estimates," "anticipates" or the negative version of those words or other comparable words. Any forward-looking statements contained in this prospectus are based on the historical performance of us and our subsidiaries or on our current plans, estimates and expectations. The inclusion of this forward-looking information should not be regarded as a representation by us, the underwriters or any other person that the future plans, estimates or expectations contemplated by us will be achieved. Such forward-looking statements are subject to various risks and uncertainties and assumptions relating to our operations, financial results, financial condition, business prospects, growth strategy and liquidity. If one or more of these or other risks or uncertainties materialize, or if our underlying assumptions prove to be incorrect, our actual results may vary materially from those indicated in these statements. These factors should not be construed as exhaustive and should be read in conjunction with the other cautionary statements that are included elsewhere in this prospectus. We do not undertake any obligation to publicly update or review any forward-looking statement, whether as a result of new information, future developments or otherwise. A number of important factors could cause actual results to differ materially from those indicated by the forward-looking statements, including, but not limited to, those factors described in "Risk Factors" and "Management's Discussion and Analysis of Financial Condition and Results of Operations."
We are currently a direct, wholly-owned subsidiary of the LLC. Prior to the completion of this offering, we will effect reorganization so that our investors, our named executive officers and all other members of the LLC will hold equity interests in us directly rather than indirectly through the LLC.
Immediately prior to the consummation of this offering, the LLC will be liquidated and all interests in the registrant, BankUnited, Inc. will be distributed to the members of the LLC in accordance with its LLC Agreement. Following this liquidation, BankUnited, Inc. will be the ultimate parent entity of the group and will have two wholly-owned subsidiaries: BankUnited and BankUnited Investment Services. There are currently 36 holders of units in the LLC. All of the transactions necessary to effect the liquidation are collectively referred to herein as the "Reorganization."
For additional information, see "Compensation Discussion and Analysis—Executive Officer Compensation—Equity-Based Compensation."
The following diagram shows our organizational structure, including our principal subsidiaries only, prior to giving effect to the Reorganization:
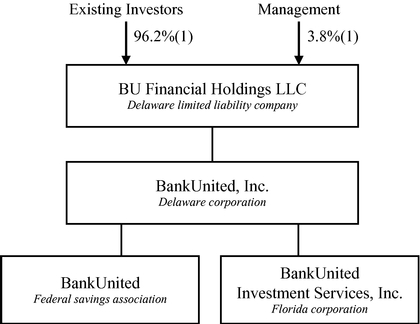
Immediately after the consummation of this offering and after the completion of the Reorganization, the following diagram shows our organization structure, including our principal subsidiaries only:
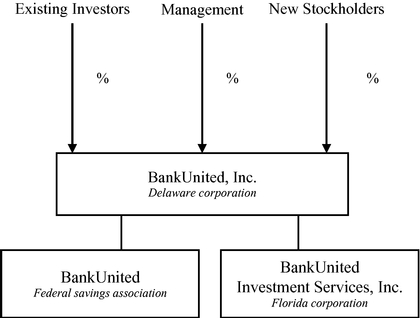

We estimate that the net proceeds to us from the sale of our common stock in this offering will be $$86.2 million, at an assumed initial public offering price of $$24.00 per share, the midpoint of the price range set forth on the cover of this prospectus, and after deducting estimated underwriting discounts and commissions and offering expenses. Each $1.00 increase (decrease) in the assumed initial public offering price of $$24.00 per share, the midpoint of the price range set forth on the cover of this prospectus, would increase (decrease) the net proceeds to us of this offering by $$3.8 million, assuming the number of shares offered by us, as set forth on the cover of this prospectus, remains the same and after deducting estimated underwriting discounts and commissions and offering expenses. We will not receive any proceeds from the sale of shares of our common stock by the selling stockholders. We intend to use the net proceeds of this offering for general corporate purposes.
We initially anticipate paying a quarterly dividend of $$0.14 per share on our common stock, subject to the discretion of our Board and dependent on, among other things, our financial condition, results of operations, capital requirements, restrictions contained in future financing instruments and other factors that our Board may deem relevant. Dividends from the Bank are the principal source of funds for the payment of dividends on our common stock. The Bank is subject to certain restrictions that may limit its ability to pay dividends to us. See "Regulation and Supervision—Regulatory Limits on Dividends and Distributions." During the period ended December 31, 2009, we did not pay a cash dividend to the holder of our common stock. On October 28, 2010, we paid a quarterly dividend of $14.0 million, with a record date of October 15, 2010. On October 28, 2010, we also paid a one-time special dividend of $6.0 million, with a record date of October 19, 2010. On December 9, 2010, we declared another quarterly dividend of $14.0 million, with a record date of January 3, 2011, which will be paid on January 18, 2011.
The following table sets forth our cash and cash equivalents and our capitalization at September 30, 2010:
This table should be read in conjunction with "Selected Historical Consolidated Financial Information," "Management's Discussion and Analysis of Financial Condition and Results of Operations" and the consolidated financial statements and the related notes thereto appearing elsewhere in this prospectus.
| | | At September 30, 2010 | | At September 30, 2010 | ||||||||||||||||||||
|---|---|---|---|---|---|---|---|---|---|---|---|---|---|---|---|---|---|---|---|---|---|---|---|---|
| | | Actual | As Adjusted(1) | | Actual | As Adjusted(1) | ||||||||||||||||||
| | | (unaudited) (dollars in thousands, except per share data) | | (unaudited) (dollars in thousands, except share and per share data) | ||||||||||||||||||||
Cash and cash equivalents | Cash and cash equivalents | $ | 494,586 | $ | Cash and cash equivalents | $ | 494,586 | $ | 580,763 | |||||||||||||||
Other borrowings | Other borrowings | $ | 2,260,006 | $ | Other borrowings | $ | 2,260,006 | $ | 2,260,006 | |||||||||||||||
Stockholder's equity: | Stockholder's equity: | Stockholder's equity: | ||||||||||||||||||||||
Preferred stock $0.01 par value per share: no shares authorized, no shares issued and outstanding, actual; shares authorized, no shares issued and outstanding, as adjusted | — | Preferred stock $0.01 par value per share: no shares authorized, no shares issued and outstanding, actual; 100,000,000 shares authorized, no shares issued and outstanding, as adjusted | — | — | ||||||||||||||||||||
Common stock, $0.01 par value per share: 110,000,000 shares authorized, 92,971,850 shares issued and outstanding, actual; shares authorized, shares issued and outstanding, as adjusted | 93 | Common stock, $0.01 par value per share: 110,000,000 shares authorized, 92,971,850 shares issued and outstanding, actual; 400,000,000 shares authorized, 96,971,850 shares issued and outstanding, as adjusted | 930 | 970 | ||||||||||||||||||||
Paid-in capital | 950,157 | Paid-in capital | 949,320 | 1,035,457 | ||||||||||||||||||||
Paid-in capital from stock-based compensation | 1,083 | Paid-in capital from stock-based compensation | 1,083 | 1,083 | ||||||||||||||||||||
Retained earnings | 261,968 | Retained earnings | 261,968 | 261,968 | ||||||||||||||||||||
Accumulated other comprehensive income | 29,538 | Accumulated other comprehensive income | 29,538 | 29,538 | ||||||||||||||||||||
Total stockholder's equity | Total stockholder's equity | 1,242,839 | Total stockholder's equity | 1,242,839 | 1,329,016 | |||||||||||||||||||
Total capitalization | $ | 3,502,845 | $ | Total capitalization | $ | 3,502,845 | $ | 3,589,022 | ||||||||||||||||
A $1.00 increase (decrease) in the assumed initial public offering price of $$24.00 per share would increase (decrease) total stockholder's equity and total capitalization by $$3.8 million, assuming that the number of shares offered by us, as set forth on the cover of this prospectus, remains the same and after deducting estimated underwriting discounts and commissions and offering expenses.
If you invest in our common stock, your ownership interest will be diluted to the extent of the difference between the initial public offering price per share of our common stock and the as adjusted net tangible book value per share of our common stock upon consummation of this offering. Our historical net tangible book value at September 30, 2010 was $1.2 billion, or $12.71 per share of common stock based on the 92,971,850 shares issued and outstanding as of such date. Net tangible book value per share represents the book value of our total tangible assets less the book value of our total liabilities divided by the number of shares of common stock then issued and outstanding.
After giving effect to our sale of 4,000,000 shares of common stock at an assumed initial public offering price of $$24.00 per share, the midpoint of the price range on the cover of this prospectus, and after deducting estimated underwriting discounts and commissions and offering expenses, our as adjusted net tangible book value at September 30, 2010 would have been $ million,$1.3 billion, or $$13.08 per share. This amount represents an immediate increase in net tangible book value to our existing stockholders of $$0.37 per share and an immediate dilution to new investors of $$10.92 per share.
The following table illustrates this per share dilution:
Assumed initial public offering price per share | Assumed initial public offering price per share | $ | Assumed initial public offering price per share | $ | 24.00 | |||||||||||
Net tangible book value per share at September 30, 2010 | $ | 12.71 | Net tangible book value per share at September 30, 2010 | $ | 12.71 | |||||||||||
Increase per share attributable to this offering | Increase in net tangible book value per share attributable to this offering | 0.37 | ||||||||||||||
As adjusted net tangible book value per share after this offering | As adjusted net tangible book value per share after this offering | As adjusted net tangible book value per share after this offering | 13.08 | |||||||||||||
Net tangible book value dilution per share to new investors in this offering | Net tangible book value dilution per share to new investors in this offering | $ | Net tangible book value dilution per share to new investors in this offering | $ | 10.92 | |||||||||||
Each $1.00 increase (decrease) in the assumed initial public offering price of $$24.00 per share would increase (decrease) our as adjusted net tangible book value by approximately $$3.8 million, or approximately $$0.04 per share, and the pro forma dilution per share to investors in this offering by approximately $$0.96 per share, assuming that the number of shares offered by us, as set forth on the cover of this prospectus, remains the same and after deducting estimated underwriting discounts and commissions and offering expenses. The number of shares offered by us in this offering may be increased or decreased from the number of shares on the cover page of this prospectus. Each increase (decrease) of 1.0 million shares in the number of shares offered by us would increase (decrease) our as adjusted net tangible book value by approximately $$22.8 million, or approximately $$0.10 per share, and the pro forma dilution per share to investors in this offering by approximately $$0.10 per share, assuming the assumed initial public offering price per share of $$24.00 per share, the midpoint of the price range on the cover of this prospectus, remains the same and after deducting estimated underwriting discounts and commissions and offering expenses. The as adjusted information discussed above is illustrative only and will adjust based on the actual initial public offering price and other terms of this offering determined at pricing.
If the underwriters exercise their option to purchase additional shares of our common stock in full in this offering, the net tangible book value per share after this offering would not change since the shares for this option are all being provided by our selling stockholders and we will not receive any of the proceeds from the sale of these shares.
The following table summarizes at September 30, 2010 the average price per share paid by our existing stockholders and by investors participating in this offering, based on an assumed initial public
offering price of $$24.00 per share, the midpoint of the price range on the cover of this prospectus, and before deducting estimated underwriting discounts and commissions and offering expenses.
| |||||||||||||||||||||
| |||||||||||||||||||||
| |||||||||||||||||||||
| | Shares Purchased | Total Consideration | Average Price Per Share | ||||||||||||||||||
|---|---|---|---|---|---|---|---|---|---|---|---|---|---|---|---|---|---|---|---|---|---|
| | Number | Percent | Amount | Percentage | Amount | ||||||||||||||||
Existing stockholders | 92,971,850 | 95.9 | % | $ | 930,250,000 | 90.6 | % | $ | 10.01 | ||||||||||||
New investors | 4,000,000 | 4.1 | 96,000,000 | 9.4 | 24.00 | ||||||||||||||||
Total | 96,971,850 | 100 | % | $ | 1,026,250,000 | 100 | % | ||||||||||||||
Assuming no exercise of the over-allotment option, sales of shares of common stock by the selling stockholders in this offering will reduce the number of shares of common stock held by existing stockholders to ,70,721,850, or approximately %72.9% of the total shares of common stock outstanding after this offering, and will increase the number of shares held by new investors to ,26,250,000, or approximately %27.1% of the total shares of common stock outstanding after this offering. If the underwriters exercise their over-allotment option in full, the number of shares held by existing stockholders will be reduced to 66,784,350 shares, or %68.9% of the total shares outstanding, and the number of shares held by investors participating in this offering will be increased to 30,187,500 shares, or %31.1% of the total shares outstanding.
The above discussion and tables excludes 981,710 shares of our common stock issuable upon the exercise of outstanding stock options at a weighted average exercise price of $$17.04 per share (of which 113,451 shares are issuable upon exercise of vested stock options) as of January 10, 2011 and 7,500,000 shares of common stock reserved for issuance, and not subject to outstanding options, under our benefit plans in each case as of , 2011.the BankUnited, Inc. 2010 Omnibus Equity Incentive Plan. To the extent any of the foregoing options are exercised, there will be further dilution to investors participating in this offering.
SELECTED HISTORICAL CONSOLIDATED FINANCIAL INFORMATION
You should read the selected historical consolidated financial information set forth below in conjunction with "Management's Discussion and Analysis of Financial Condition and Results of Operations," "Capitalization" and the consolidated financial statements and the related notes thereto included elsewhere in this prospectus. The selected historical consolidated financial information set forth below at and for the nine months ended September 30, 2010 is derived from our unaudited interim condensed consolidated financial statements included elsewhere in this prospectus and includes all adjustments (consisting of normal recurring adjustments) that we considered necessary for a fair presentation of the financial position and the results of operations for these periods. Operating results for the nine months ended September 30, 2010 are not necessarily indicative of the results that may be expected for the year ended December 31, 2010. The selected historical consolidated financial information set forth below at December 31, 2009 and for the period from April 28, 2009 (date of inception) to December 31, 2009 has been derived from our audited consolidated financial statements included elsewhere in this prospectus. The selected historical consolidated financial information set forth below at September 30, 2008 and 2007, for each of the periods from October 1, 2008 to May 21, 2009 and for the fiscal years ended September 30, 2008 and 2007 has been derived from the audited consolidated financial statements of the Failed Bank included elsewhere in this prospectus. The selected historical consolidated financial information set forth below at and for the fiscal years ended September 30, 2006 and 2005 has been derived from the unaudited consolidated financial statements of the Failed Bank not included in this prospectus.
Although we were incorporated on April 28, 2009, neither we nor the Bank had any substantive operations prior to the Acquisition on May 21, 2009. Results of operations of the Company for the post-Acquisition periods are not comparable to the results of operations of the Failed Bank for the pre-Acquisition periods. Results of operations for the post-Acquisition periods reflect, among other things, the acquisition method of accounting. See "Management's Discussion and Analysis of Financial Condition and Results of Operations—Periods Presented and Factors Affecting Comparability."
| | | | Failed Bank | |||||||||||||||||
|---|---|---|---|---|---|---|---|---|---|---|---|---|---|---|---|---|---|---|---|---|
| | BankUnited, Inc. | |||||||||||||||||||
| | At September 30, | |||||||||||||||||||
| | At September 30, 2010 | At December 31, 2009 | ||||||||||||||||||
| | 2008 | 2007 | 2006 | 2005 | ||||||||||||||||
| | (unaudited) | | | | (unaudited) | (unaudited) | ||||||||||||||
| | (dollars in thousands, except per share data) | |||||||||||||||||||
CONSOLIDATED BALANCE SHEET DATA: | ||||||||||||||||||||
Cash and cash equivalents | $ | 494,586 | $ | 356,215 | $ | 1,223,346 | $ | 512,885 | $ | 66,600 | $ | 237,950 | ||||||||
Investment securities available for sale, at fair value | 3,088,504 | 2,243,143 | 755,225 | 1,098,665 | 1,520,294 | 1,912,643 | ||||||||||||||
Loans held in portfolio, net | 4,079,234 | 4,588,898 | 11,249,367 | 12,561,693 | 11,400,706 | 8,027,592 | ||||||||||||||
FDIC indemnification asset | 2,723,059 | 3,279,165 | — | — | — | — | ||||||||||||||
Goodwill and other intangible assets | 60,759 | 60,981 | 28,353 | 28,353 | 28,353 | 28,353 | ||||||||||||||
Total assets | 11,151,301 | 11,129,961 | 14,088,591 | 15,107,310 | 13,543,992 | 10,639,895 | ||||||||||||||
Deposits | 7,300,460 | 7,666,775 | 8,176,817 | 7,305,788 | 6,110,855 | 4,766,931 | ||||||||||||||
Federal Home Loan Bank advances | 2,260,006 | 2,079,051 | 5,279,350 | 6,234,360 | 5,174,350 | 3,820,385 | ||||||||||||||
Total liabilities | 9,908,462 | 10,035,701 | 13,689,821 | 13,904,508 | 12,538,156 | 9,870,482 | ||||||||||||||
Total stockholder's equity | 1,242,839 | 1,094,260 | 398,770 | 1,202,802 | 1,005,836 | 769,413 | ||||||||||||||
| | BankUnited, Inc. | Failed Bank | |||||||||||||||||||||
|---|---|---|---|---|---|---|---|---|---|---|---|---|---|---|---|---|---|---|---|---|---|---|---|
| | | Period from April 28, 2009 to December 31, 2009(1) | Period from October 1, 2008 to May 21, 2009(1) | | | | | ||||||||||||||||
| | Nine Months Ended September 30, 2010 | At September 30, | |||||||||||||||||||||
| | 2008 | 2007 | 2006 | 2005 | |||||||||||||||||||
| | (unaudited) | | | | | (unaudited) | (unaudited) | ||||||||||||||||
| | (dollars in thousands, except share data) | ||||||||||||||||||||||
Consolidated Income Statement Data: | |||||||||||||||||||||||
Interest income | $ | 414,959 | $ | 335,524 | $ | 339,068 | $ | 834,460 | $ | 957,897 | $ | 712,807 | $ | 428,692 | |||||||||
Interest expense | 127,495 | 83,856 | 333,392 | 555,594 | 604,558 | 442,333 | 250,873 | ||||||||||||||||
Net interest income | 287,464 | 251,668 | 5,676 | 278,866 | 353,339 | 270,474 | 177,819 | ||||||||||||||||
Provision for loan losses | 45,157 | 22,621 | 919,139 | 856,374 | 31,500 | 10,400 | 3,840 | ||||||||||||||||
Net interest income (loss) after provision for loan losses | 242,307 | 229,047 | (913,463 | ) | (577,508 | ) | 321,839 | 260,074 | 173,979 | ||||||||||||||
Non-interest income (loss) | 237,520 | 252,828 | (81,431 | ) | (128,859 | ) | 28,367 | 32,598 | 18,213 | ||||||||||||||
Non-interest expense | 220,048 | 282,454 | 238,403 | 246,480 | 185,634 | 136,668 | 133,327 | ||||||||||||||||
Income (loss) before income taxes | 259,779 | 199,421 | (1,233,297 | ) | (952,847 | ) | 164,572 | 156,004 | 58,865 | ||||||||||||||
Provision (benefit) for income before taxes | 102,857 | 80,375 | — | (94,462 | ) | 55,067 | 51,794 | 17,909 | |||||||||||||||
Net income (loss) | $ | 156,922 | $ | 119,046 | $ | (1,233,297 | ) | $ | (858,385 | ) | $ | 109,505 | $ | 104,210 | $ | 40,956 | |||||||
Share Data: | |||||||||||||||||||||||
Earnings (loss) per common share, basic and diluted | $ | 1.69 | $ | 1.29 | $ | (12,332,970 | ) | $ | (8,583,850 | ) | $ | 1,095,054 | $ | 1,042,100 | $ | 409,560 | |||||||
Weighted average common shares outstanding | 92,943,620 | 92,664,910 | 100 | 100 | 100 | 100 | 100 | ||||||||||||||||
Other Data (unaudited): | |||||||||||||||||||||||
Financial ratios | |||||||||||||||||||||||
Return on average assets(2) | 1.86 | % | 1.69 | % | (14.26 | )% | (5.94 | )% | 0.78 | % | 0.86 | % | 0.44 | % | |||||||||
Return on average common stockholder's equity(2) | 17.72 | % | 18.98 | % | (2,041.04 | )% | (75.43 | )% | 10.04 | % | 12.04 | % | 5.86 | % | |||||||||
Yield on earning assets(2) | 7.16 | % | 7.42 | % | 3.91 | % | 5.91 | % | 6.96 | % | 6.06 | % | 4.70 | % | |||||||||
Cost of interest bearing liabilities(2) | 1.82 | % | 1.39 | % | 3.94 | % | 4.36 | % | 4.91 | % | 4.16 | % | 3.05 | % | |||||||||
Equity to assets ratio | 11.15 | % | 9.83 | % | (7.25 | )% | 2.83 | % | 7.96 | % | 7.43 | % | 7.23 | % | |||||||||
Interest rate spread(2) | 5.34 | % | 6.03 | % | (0.03 | )% | 1.55 | % | 2.05 | % | 1.90 | % | 1.65 | % | |||||||||
Net interest margin(2) | 4.95 | % | 5.58 | % | 0.06 | % | 1.98 | % | 2.57 | % | 2.30 | % | 1.95 | % | |||||||||
Loan to deposit ratio | 56.67 | % | 60.15 | % | 128.73 | % | 146.33 | % | 172.74 | % | 189.21 | % | 171.15 | % | |||||||||
| | BankUnited, Inc. | Failed Bank | |||||||||||||||||||||
|---|---|---|---|---|---|---|---|---|---|---|---|---|---|---|---|---|---|---|---|---|---|---|---|
| | | Period from April 28, 2009 to December 31, 2009(1) | Period from October 1, 2008 to May 21, 2009(1) | | | | | ||||||||||||||||
| | Nine Months Ended September 30, 2010 | At September 30, | |||||||||||||||||||||
| | 2008 | 2007 | 2006 | 2005 | |||||||||||||||||||
| | (unaudited) | | | | | (unaudited) | (unaudited) | ||||||||||||||||
| | (dollars in thousands, except share data) | ||||||||||||||||||||||
Asset quality ratios | |||||||||||||||||||||||
Non-performing loans to total loans(3)(5) | 0.68 | % | 0.38 | % | 24.58 | % | 11.98 | % | 1.59 | % | 0.18 | % | 0.10 | % | |||||||||
Non-performing assets to total assets(4)(5) | 1.99 | % | 1.24 | % | 23.53 | % | 11.13 | % | 1.51 | % | 0.16 | % | 0.08 | % | |||||||||
Allowance for loan losses to total loans | 1.40 | % | 0.49 | % | 11.14 | % | 5.98 | % | 0.46 | % | 0.32 | % | 0.32 | % | |||||||||
Allowance for loan losses to non-performing loans | 206.28 | % | 130.22 | % | 45.33 | % | 49.96 | % | 29.15 | % | 175.40 | % | 306.94 | % | |||||||||
Net charge-offs to average loans(2) | 0.31 | % | 0.00 | % | 5.51 | % | 1.58 | % | 0.08 | % | 0.00 | % | 0.03 | % | |||||||||
| | | | Failed Bank | |||||||||||||||||
|---|---|---|---|---|---|---|---|---|---|---|---|---|---|---|---|---|---|---|---|---|
| | BankUnited, Inc. | |||||||||||||||||||
| | At September 30, | |||||||||||||||||||
| | At September 30, 2010 | At December 31, 2009(1) | ||||||||||||||||||
| | 2008 | 2007 | 2006 | 2005 | ||||||||||||||||
| | (unaudited) | | | | (unaudited) | (unaudited) | ||||||||||||||
Capital ratios(6) | ||||||||||||||||||||
Tangible common equity to tangible assets(7) | 10.66 | % | 9.33 | % | 2.63 | % | 7.79 | % | 7.23 | % | 6.98 | % | ||||||||
Tier 1 common capital to total risk weighted assets | 42.46 | % | 40.42 | % | 4.90 | % | 14.64 | % | 13.79 | % | 14.03 | % | ||||||||
Tier 1 risk-based capital | 42.46 | % | 40.42 | % | 4.90 | % | 14.64 | % | 13.79 | % | 14.03 | % | ||||||||
Total risk-based capital | 43.27 | % | 40.55 | % | 6.21 | % | 15.37 | % | 14.28 | % | 14.49 | % | ||||||||
Tier 1 leverage | 10.09 | % | 8.78 | % | 2.89 | % | 7.84 | % | 7.31 | % | 7.11 | % | ||||||||
stockholder's equity to total assets. The most directly comparable GAAP financial measure is total stockholder's equity to total assets. See the reconciliation below:
| | | | Failed Bank | |||||||||||||||||
|---|---|---|---|---|---|---|---|---|---|---|---|---|---|---|---|---|---|---|---|---|
| | BankUnited, Inc. | |||||||||||||||||||
| | At September 30, | |||||||||||||||||||
| | At September 30, 2010 | At December 31, 2009 | ||||||||||||||||||
| | 2008 | 2007 | 2006 | 2005 | ||||||||||||||||
| | (unaudited) | | | | (unaudited) | (unaudited) | ||||||||||||||
| | (dollars in thousands) | |||||||||||||||||||
Total stockholder's equity | $ | 1,242,839 | $ | 1,094,260 | $ | 398,770 | $ | 1,202,802 | $ | 1,005,836 | $ | 769,413 | ||||||||
Less: goodwill and other intangible assets, net | 60,759 | 60,981 | 28,353 | 28,353 | 28,353 | 28,353 | ||||||||||||||
Tangible common stockholder's equity | $ | 1,182,080 | $ | 1,033,279 | $ | 370,417 | $ | 1,174,449 | $ | 977,483 | $ | 741,060 | ||||||||
Total assets | $ | 11,151,301 | $ | 11,129,961 | $ | 14,088,591 | $ | 15,107,310 | $ | 13,543,992 | $ | 10,639,895 | ||||||||
Less: goodwill and other intangible assets, net | 60,759 | 60,981 | 28,353 | 28,353 | 28,353 | 28,353 | ||||||||||||||
Tangible assets | $ | 11,090,542 | $ | 11,068,980 | $ | 14,060,238 | $ | 15,078,957 | $ | 13,515,639 | $ | 10,611,542 | ||||||||
Equity to assets | 11.15 | % | 9.83 | % | 2.83 | % | 7.96 | % | 7.43 | % | 7.23 | % | ||||||||
Tangible common equity to tangible assets | 10.66 | % | 9.33 | % | 2.63 | % | 7.79 | % | 7.23 | % | 6.98 | % | ||||||||
Management of the Company believes this non-GAAP financial measure provides an additional meaningful method of evaluating certain aspects of the Company's capital strength from period to period on a basis that may not be otherwise apparent under GAAP. Management also believes that this non-GAAP financial measure, which complements the capital ratios defined by regulators, is useful to investors who are interested in the Company's equity to assets ratio exclusive of the effect of changes in intangible assets on equity and total assets.
MANAGEMENT'S DISCUSSION AND ANALYSIS OF FINANCIAL CONDITION
AND RESULTS OF OPERATIONS
The following discussion should be read in conjunction with the "Selected Historical Consolidated Financial Information," and our financial statements and related notes thereto included elsewhere in this prospectus. In addition to historical information, this discussion contains forward-looking statements that involve risks, uncertainties and assumptions that could cause actual results to differ materially from management's expectations. Factors that could cause such differences are discussed in the sections entitled "Cautionary Note Regarding Forward-Looking Statements" and "Risk Factors." We assume no obligation to update any of these forward-looking statements.
Overview
BankUnited, Inc. is a savings and loan holding company with two wholly-owned subsidiaries: BankUnited, which is one of the largest independent depository institutions headquartered in Florida by assets, and BankUnited Investment Services, a Florida insurance agency. As of the close of business on May 21, 2009, BankUnited entered into the Purchase and Assumption Agreement including the Loss Sharing Agreements with the FDIC to acquire substantially all of the assets and assume all of the non-brokered deposits and substantially all other liabilities of the Failed Bank. The Failed Bank was closed by the OTS and placed into receivership with the FDIC on May 21, 2009. Neither the Company nor the Bank had any substantive operations prior to the Acquisition.
BankUnited has a network of 78 branches in 13 Florida counties as of September 30, 2010. Since the Acquisition, we have focused on providing a full range of commercial and consumer banking services to growing companies and their executives, commercial and middle-market businesses and consumers in Florida's coastal regions. Through BankUnited, we deliver a comprehensive range of traditional depository and lending products, online banking services and cash management tools to our customers. Through its non-bank subsidiary, BankUnited Investment Services, the Company offers wealth management products as well as succession planning, estate planning and financial planning services. The Company recently acquired two businesses to start its leasing platform on a national basis. Through United Capital Business Lending, we offer equipment financing services and through Pinnacle Public Finance, we offer municipal leasing services.
Periods Presented and Factors Affecting Comparability
Financial information presented throughout this "Management's Discussion and Analysis of Financial Condition and Results of Operations" for the nine months ended September 30, 2010 and the period from May 22, 2009 through December 31, 2009 (which we refer to as the post-Acquisition periods) is that of the Company. Historical financial information for the period from October 1, 2008 through May 21, 2009 and the fiscal years ended September 30, 2008, 2007, 2006 and 2005 (which we refer to as the pre-Acquisition periods) is that of the Failed Bank. Results of operations of the Company for the post-Acquisition periods are not comparable to the results of operations of the Failed Bank for the pre-Acquisition periods. Results of operations for the post-Acquisition periods reflect, among other things, the acquisition method of accounting.
Under the acquisition method of accounting, all of the assets acquired and liabilities assumed were initially recorded on the consolidated balance sheet of the Company at their estimated fair values as of May 21, 2009. These estimated fair values differed substantially from the carrying amounts of the assets acquired and liabilities assumed as reflected in the financial statements of the Failed Bank immediately prior to the Acquisition. The most significant reasons for the non-comparability of the consolidated financial statements include:
Acquisition date. The writedown of loans to fair value in conjunction with the application of acquisition accounting and credit protection provided by the Loss Sharing Agreements resulted in a significantly lower provision for loan losses subsequent to the Acquisition;
A summary comparison of the pre-Acquisition carrying amounts and estimated fair values of assets acquired and liabilities assumed as of the Acquisition date follows(dollars in thousands):
| | As Recorded by the Failed Bank | Fair Value Adjustments | Net Cash Received From the FDIC | As Recorded by the Company | ||||||||||||||
|---|---|---|---|---|---|---|---|---|---|---|---|---|---|---|---|---|---|---|
Assets | ||||||||||||||||||
Cash and cash equivalents | $ | 1,160,321 | $ | — | $ | 2,156,393 | $ | 3,316,714 | ||||||||||
Investment securities, at fair value | 608,388 | (69,444 | ) | — | 538,944 | |||||||||||||
FHLB stock | 243,334 | — | — | 243,334 | ||||||||||||||
Loans held in portfolio, net | 11,174,232 | (6,163,904 | ) | — | 5,010,328 | |||||||||||||
FDIC receivable | — | 69,444 | — | 69,444 | ||||||||||||||
FDIC indemnification asset | — | 3,442,890 | — | 3,442,890 | ||||||||||||||
Bank owned life insurance | 129,111 | — | — | 129,111 | ||||||||||||||
Other real estate owned | 199,819 | (22,140 | ) | — | 177,679 | |||||||||||||
Deferred tax asset, net | — | 37,269 | — | 37,269 | ||||||||||||||
Goodwill and other intangible assets | — | 61,150 | — | 61,150 | ||||||||||||||
Other assets | 95,171 | (44,696 | ) | — | 50,475 | |||||||||||||
Total assets | 13,610,376 | (2,689,431 | ) | 2,156,393 | 13,077,338 | |||||||||||||
Liabilities | ||||||||||||||||||
Deposits | 8,225,916 | 108,566 | — | 8,334,482 | ||||||||||||||
Securities sold under agreements to repurchase | 1,310 | — | — | 1,310 | ||||||||||||||
Federal Home Loan Bank advances | 4,429,350 | 201,264 | — | 4,630,614 | ||||||||||||||
Advance payments by borrowers for taxes | — | |||||||||||||||||
and insurance | 52,362 | — | — | 52,362 | ||||||||||||||
Other liabilities | 59,137 | (567 | ) | — | 58,570 | |||||||||||||
Total liabilities | 12,768,075 | 309,263 | — | 13,077,338 | ||||||||||||||
Net Assets | $ | 842,301 | $ | (2,998,694 | ) | $ | 2,156,393 | $ | — | |||||||||
Primary Factors Used to Evaluate Our Business
As a financial institution, we manage and evaluate various aspects of both our results of operations and our financial condition. We evaluate the levels and trends of the line items included in our balance sheet and income statement, as well as various financial ratios that are commonly used in our industry. We analyze these ratios and financial trends against our own historical performance, our budgeted performance and the financial condition and performance of comparable financial institutions in our region and nationally.
Subsequent to the Acquisition, comparison of our financial performance against other financial institutions is impacted by the application of the acquisition method of accounting and the accounting for loans acquired with evidence of deterioration in credit quality, which we refer to as ACI loans, as discussed below.
Results of operations
The primary line items we use to manage and evaluate our results of operations include net interest income, the provision for loan losses, non-interest income, non-interest expense and net income.
Net interest income
Net interest income is the difference between interest earned on interest earning assets and interest incurred on interest bearing liabilities and is the primary driver of core earnings. Net interest income is impacted by the relative mix of interest earning assets and interest bearing liabilities, the ratio of interest earning assets to total assets and of interest bearing liabilities to total funding sources, movements in market interest rates, levels of non-performing assets and pricing pressure from competitors. Due to the revaluation of Covered Assets in conjunction with the application of acquisition accounting and the resultant accretion, generally Covered Assets have higher yields than do assets purchased or originated since May 21, 2009. Net interest income will be impacted in future periods as Covered Assets are repaid or mature and these assets comprise a lower percentage of total interest earning assets. The mix of interest earning assets is influenced by loan demand and by management's continual assessment of the rate of return and relative risk associated with various classes of earning assets.
The mix of interest bearing liabilities is influenced by management's assessment of the need for lower cost funding sources weighed against relationships with customers and growth requirements and is impacted by competition for deposits in the Bank's market and the availability and pricing of other sources of funds.
Key measures that we use to evaluate our net interest income are the level and stability of the net interest margin and the interest rate spread. Net interest margin is calculated by dividing net interest income for the period by average interest earning assets. The interest rate spread is the difference between the yield earned on average interest earning assets and the rate paid on average interest bearing liabilities for the period.
For the post-Acquisition periods, net interest income is also impacted by accretion of fair value adjustments recorded in conjunction with the Acquisition and the accounting for ACI loans. Fair value adjustments of interest earning assets and interest bearing liabilities recorded at Acquisition are accreted to interest income or expense over the lives of the related assets or liabilities. Generally, accretion of fair value adjustments increases interest income and decreases interest expense, and thus has a positive impact on our net interest income, net interest margin and interest rate spread.
At Acquisition, ACI loans were recorded at fair value, measured based on the present value of expected cash flows. The excess of expected cash flows over the recorded fair value at Acquisition, known as accretable yield, is being recognized as interest income over the lives of the underlying loans. Since the post-Acquisition carrying value of ACI loans is based on the amount expected to be collected, and due to the resultant accretion, these loans are not classified as nonaccrual, although they may be contractually delinquent. Accretion related to ACI loans has a positive impact on our net interest income, net interest margin and interest rate spread. The impact of accretion and ACI loan accounting on net interest income makes it difficult to compare our net interest margin and interest rate spread to those reported by other financial institutions.
The accretion of fair value adjustments will continue to have a significant impact on our net interest income as long as Covered Assets represent a significant portion of our interest earning assets as opposed to assets originated or purchased after May 21, 2009. At September 30, 2010, Covered Loans represented 91.7% of our loan portfolio (based on book value) and Covered Securities represented 8.8% of our investment portfolio. In total, covered interest earning assets represented 51.5% of our interest earning assets at September 30, 2010.
Interest expense incurred on our interest bearing liabilities is impacted by the accretion of fair value adjustments on our time deposits and our advances from the FHLB recorded in connection with the Acquisition. However, the impact on interest expense has decreased significantly in 2010 and will continue to decrease in 2011. Accretion of fair value adjustments on time deposits totaled $18.3 million for the nine months ending September 30, 2010 (and is projected to be $21.4 million for 2010) as
compared to $79.9 million for the period ending December 31, 2009. Accretion of fair value adjustments on FHLB advances totaled $19.0 million for the nine months ended September 30, 2010 (and is projected to be $23.9 million for 2010) as compared to $25.1 million for the period ended December 31, 2009. For 2011, accretion of fair value adjustments on time deposits is projected to be $7.0 million, and accretion of fair value adjustments on FHLB advances is projected to be $19.1 million.
Provision for loan losses
The provision for loan losses is the amount of expense that, based on our judgment, is required to maintain the allowance for loan losses at an adequate level to absorb probable losses inherent in the loan portfolio at the balance sheet date and that, in management's judgment, is appropriate under U.S. generally accepted accounting principles. The determination of the amount of the allowance is complex and involves a high degree of judgment and subjectivity.
The risk of loss associated with Covered Loans differs significantly from the risk of loss associated with non-Covered Loans. The Loss Sharing Agreements significantly limit the Company's exposure to credit losses on Covered Loans. Recognition of future losses on Covered Loans is also mitigated by the fair market value of loans established in the application of acquisition accounting. Because the determination of fair value at which the loans acquired from the Failed Bank were initially recorded as of May 21, 2009 encompassed assumptions about expected future cash flows and credit risk, no allowance for loan losses was recorded at the date of acquisition. Fair value adjustments to the carrying amount of acquired loans totaled $6.2 billion.
Covered Loans may be further broken out into two broad categories: (i) ACI loans and (ii) loans that did not exhibit evidence of deterioration in credit quality at acquisition, or non-ACI loans. Subsequent to the Acquisition, an allowance for loan losses related to the ACI loans is recorded only when estimates of future cash flows related to these loans are revised downward, indicating further deterioration in credit quality. An allowance for loan losses for non-ACI loans may be established if factors considered relevant by management indicate that the credit quality of the non-ACI loans has deteriorated.
Since the recording of a provision for loan losses on Covered Loans represents an increase in the amount of reimbursement we expect to receive from the FDIC, we also record an increase in the FDIC indemnification asset for the present value of the projected increase in reimbursement, with a corresponding increase in non-interest income, recorded in "Net loss on indemnification asset resulting from net recoveries" as discussed below in the section entitled "—Non-interest income." Therefore, the impact on our results of operations of any provision for loan losses on Covered Loans is significantly mitigated by an increase in non-interest income. For the nine months ended September 30, 2010 and the period ended December 31, 2009, we recorded provisions for loan losses on Covered Loans of $42.5 million and $21.3 million, respectively. For the nine months ended September 30, 2010 and the period ended December 31, 2009, the impact to earnings from these provisions was significantly mitigated by recording non-interest income of $23.0 million and $14.4 million, respectively.
For the nine months ended September 30, 2010 and the period ended December 31, 2009, we recorded provisions for loan losses of $2.6 million and $1.3 million, respectively, for loans we originated or purchased subsequent to the Acquisition. These loans are not protected by the Loss Sharing Agreements and as such, these provisions are not offset by an increase in non-interest income.
Non-interest income
For the nine months ended September 30, 2010 and the period ended December 31, 2009, the majority of our non-interest income resulted from the resolution of assets covered by our Loss Sharing Agreements with the FDIC and accretion of discount on the FDIC indemnification asset. Typically, the primary components of non-interest income of financial institutions are service charges and fees and
gains or losses related to the sale or valuation of investment securities, loans and other assets. Thus, it is difficult to compare the amount and composition of our non-interest income with that of other financial institutions of our size both regionally and nationally.
The FDIC indemnification asset was initially recorded at its estimated fair value of $3.4 billion, represented by the present value of estimated future cash payments from the FDIC for probable losses on Covered Assets, up to 90 days of past due interest, excluding loans on nonaccrual at Acquisition, and reimbursement of certain expenses. The discount rate of 7.10% used in the initial calculation of fair value was determined using a risk-free yield curve plus a premium reflecting the uncertainty related to the collection, amount and timing of the cash flows and other liquidity concerns. Accretion is a result of discounting and may also increase or decrease from period to period due to changes in expected cash flows from the Covered Loans.
If projected cash flows from the ACI loans increase, the yield on the loans will increase and the discount rate of accretion on the FDIC indemnification asset will decrease as less cash flow is expected to be recovered from the indemnification asset. For the nine months ended September 30, 2010 and the period ended December 31, 2009, the average rate at which income was accreted on the FDIC indemnification asset was 5.32% and 7.10%, respectively.
A rollforward of the FDIC indemnification asset from May 21, 2009 to September 30, 2010 follows(dollars in thousands):
Balance, May 21, 2009 | $ | 3,442,890 | |||
Accretion | 149,544 | ||||
Reduction for claims filed | (290,701 | ) | |||
Net loss on indemnification asset resulting from net recoveries | (22,568 | ) | |||
Balance, December 31, 2009 | 3,279,165 | ||||
Accretion | 116,915 | ||||
Reduction for claims filed | (628,089 | ) | |||
Net loss on indemnification asset resulting from net recoveries | (44,932 | ) | |||
Balance, September 30, 2010 | $ | 2,723,059 | |||
Accretion of the discount on the FDIC indemnification asset results in an increase to the balance of the FDIC indemnification asset with a corresponding increase in non-interest income. We project the amount of accretion will decline in future periods, because our projected cash flows from ACI loans have been increasing, and as a result we expect to collect less cash flow from the indemnification asset as discussed above.
The balance of the FDIC indemnification asset is reduced as claims for reimbursement are filed with the FDIC. The receipt of payments from the FDIC results in an increase to cash.
The balance of the FDIC indemnification asset has also been reduced as a result of decreases in estimated cash flows to be received from the FDIC related to the ultimate resolution of Covered Assets. We record an offsetting entry in the income statement line item "Net loss on indemnification asset resulting from net recoveries." This line item includes the significantly mitigating impact related to loan loss provisions on Covered Loans, the impact of lower projected FDIC reimbursement resulting from the favorable resolution of Covered Loans as described below, and the offsetting impact related to gains or losses on the sale of Covered Loans and impairment of OREO. The table below shows the various components of this income statement line item for the nine months ended September 30, 2010 and period ended December 31, 2009.
Income from resolution of Covered Loans is included in the income statement line item "Income from resolution of Covered Assets, net" and represents the difference in the projected losses from ACI loans and payment received in satisfaction of such loans that were resolved, either by prepayment, sale,
foreclosure, short sale or, for the non-residential portfolio, charge-offs, as well as losses from permanent modification of ACI loans accounted for in pools during the period. Gains and losses from the resolution or permanent modification of Covered Loans are included in this line item. The amount of income recorded in any period will be impacted by the number and UPB of ACI loans resolved and our ability to accurately project cash flows from ACI loans in future periods. In general, we expect the amount of this income to decrease in future periods as we gain additional history in terms of the performance of the loans we acquired, which we will reflect in the update of our projected cash flows from ACI loans each quarter. Income from the resolution of non-ACI loans is not significant.
Under the Purchase and Assumption Agreement, we are permitted to sell on an annual basis up to 2.5% of the Covered Loans, based upon the UPB at Acquisition, or approximately $280.0 million, without prior consent of the FDIC. Any losses incurred from such loan sales are covered under the Loss Sharing Agreements. A loss of $47.1 million was recognized during the period ending December 31, 2009 on non-recourse sales of ACI loans with UPB of $275.0 million to third parties. This loss was significantly mitigated by income of approximately $37.6 million, included in the income statement line item "Net loss on indemnification asset resulting from net recoveries." We may continue to exercise our right to sell Covered Loans in future periods.
The following table summarizes the pre-tax components of the gains and losses associated with the resolution of Covered Assets as described above, plus the provision for loan losses on non-Covered Loans, for the nine months ended September 30, 2010 and period ended December 31, 2009(dollars in thousands):
| | Nine Months Ended September 30, 2010 | Period Ended December 31, 2009 | ||||||||||||||||||
|---|---|---|---|---|---|---|---|---|---|---|---|---|---|---|---|---|---|---|---|---|
| | Transaction Income (Loss) | Net Loss on Indemnification Asset Resulting From Net Recoveries | Net Impact on Earnings | Transaction Income (Loss) | Net Loss on Indemnification Asset Resulting From Net Recoveries | Net Impact on Earnings | ||||||||||||||
Provision for losses on Covered Loans | $ | (42,538 | ) | $ | 22,979 | $ | (19,559 | ) | $ | (21,287 | ) | $ | 14,433 | $ | (6,854 | ) | ||||
Provision for losses on non-Covered Loans | (2,619 | ) | — | (2,619 | ) | (1,334 | ) | — | (1,334 | ) | ||||||||||
Total provision for loan losses | (45,157 | ) | 22,979 | (22,178 | ) | (22,621 | ) | 14,433 | (8,188 | ) | ||||||||||
Income from resolution of Covered Assets, net | 112,777 | 120,954 | ||||||||||||||||||
Net loss on sale of Covered Loans | — | (47,078 | ) | |||||||||||||||||
| 112,777 | (76,978 | ) | 35,799 | 73,876 | (51,201 | ) | 22,675 | |||||||||||||
Gain (loss) on sale of OREO | 2,270 | — | — | — | ||||||||||||||||
Loss due to impairment of OREO | (12,164 | ) | (21,055 | ) | ||||||||||||||||
| (9,894 | ) | 9,067 | (827 | ) | (21,055 | ) | 14,200 | (6,855 | ) | |||||||||||
Total | $ | 57,726 | $ | (44,932 | ) | $ | 12,794 | $ | 30,200 | $ | (22,568 | ) | $ | 7,632 | ||||||
The following table provides further detail of the components of income from resolution of Covered Assets, net:
| | Nine Months Ended September 30, 2010 | Period Ended December 31, 2009 | |||||
|---|---|---|---|---|---|---|---|
Payments in full | $ | 122,500 | $ | 76,428 | |||
Foreclosures | (9,675 | ) | 30,489 | ||||
Short sales | 13,465 | 28,610 | |||||
Modifications | (2,048 | ) | — | ||||
Charge-offs | (15,352 | ) | (14,573 | ) | |||
Recoveries | 3,887 | — | |||||
Income from resolution of Covered Assets, net | $ | 112,777 | $ | 120,954 | |||
The volume of loan resolutions resulting from repayments, modifications and recoveries increased for the nine months ended September 30, 2010 compared to the period ended December 31, 2009 as we augmented and enhanced our mortgage servicing and workout and recovery departments and were increasingly able to work with borrowers to effect resolution of outstanding loans. The impact of modifications on income from resolution of Covered Assets reflects increased participation by borrowers in the HAMP program during 2010. Net gains from foreclosures and short sales declined for the nine months ended September 30, 2010 due to continuing home price deterioration in our primary market areas. The impact of additional historical experience on our ability to estimate future cash flows from these types of resolutions has also reduced the effect of these resolutions on current period earnings.
Certain OREO related expenses, including attorney's fees, foreclosure costs, property preservation costs, maintenance and repair costs, advances for taxes and insurance, appraisal costs, and inspection costs, are also reimbursed under the terms of the Loss Sharing Agreements with the FDIC. Such expenses are recorded in non-interest expense when incurred, and the reimbursement is recorded as "FDIC reimbursement of costs of resolution of covered assets" in non-interest income when submitted to the FDIC. This may result in the expense and the related income from reimbursements being recorded in different periods. During the nine months ended September 30, 2010 and the period ended December 31, 2009, non-interest expense included $41.6 million and $19.7$26.1 million, respectively, of disbursements subject to reimbursement under the Loss Sharing Agreements. For those same periods, $30.1 million and $10.3 million, respectively, of those disbursements were submitted to the FDIC for reimbursement at the 80% level. As of September 30, 2010, $27.3 million of these disbursements remain to be submitted for reimbursement from the FDIC in future periods.
Non-interest expense
Non-interest expense includes employee compensation and benefits, occupancy and equipment, impairment of OREO, foreclosure expense, OREO expense, deposit insurance expense, professional fees, telecommunications and data processing and other expense. For the period ending December 31, 2009, non-interest expense also included two significant non-recurring items. The first of these was the write-off of a receivable from the FDIC in the amount of $69.4 million, which was established at the date of the Acquisition and related to the disputed valuation of certain acquired investment securities. Given that the disagreement over the valuation extended past December 31, 2009 with the likelihood that no additional consideration would be paid, the receivable was written off in 2009. Subsequently, the Company reached a settlement with the FDIC regarding this dispute. Under the settlement, the Company received $24.1 million, which will be reflected in non-interest income during the fourth quarter of 2010. The second of these non-recurring items was $39.8 million in direct costs associated with the Acquisition, consisting primarily of legal and investment banking advisory fees.
Our employee compensation and benefits expense includes expense related to PIUs issued to certain members of executive management. The PIUs are divided into two equal types of profits
interests. Half of the PIUs are time-based and vest with the passage of time following the grant date (which we refer to as Time-based PIUs) and the remaining half of the PIUs will vest immediately prior to the consummation of this offering (which we refer to as IRR-based PIUs). Fair value of PIUs is estimated using a Black-Scholes option pricing model including assumptions as to expected volatility, dividends, terms, and risk-free rates. Beginning with the third quarter of 2009, the fair value is updated quarterly. The fair value of the PIUs has increased since the third quarter of 2009 through September 30, 2010, driven by a reduction in risk-free rates and an increase in expected volatility over that timeframe. The estimated fair value per unit of the Company's PIUs from September 30, 2009 to September 30, 2010 is as follows:
September 30, 2009 | $ | 707.30 | ||
December 31, 2009 | $ | 850.30 | ||
March 31, 2010 | $ | 843.70 | ||
June 30, 2010 | $ | 1,029.85 | ||
September 30, 2010 | $ | 1,238.25 |
For additional information, see "Compensation Discussion and Analysis—Executive Officer Compensation—Equity-Based Compensation."
Compensation expense for the Time-based PIUs is recorded over the vesting period based on their fair value. For the nine months ended September 30, 2010 and the period ended December 31, 2009, we recorded compensation expense related to Time-based PIUs of $20.0 million and $8.8 million, respectively.
In conjunction with this offering, we expect to record compensation expense related to the IRR-basedexchange of PIUs for a combination of common stock and options immediately prior to the consummation of this offering. The amount of compensation expense will be based on the initial public offering price. Assuming an initial public offering price of $$24.00 per share, the midpoint of the price range on the cover of this prospectus, we would expect to incur a charge of approximately $$91.1 million.
OREO expense and foreclosure expense is comprised of net gains or losses on the sale of OREO properties, expenses of holding and maintaining OREO properties such as real estate taxes and insurance, and legal fees and other foreclosure expenses. Impairment of OREO represents further deterioration in the fair value of properties that were initially recorded at fair value at the time of foreclosure. OREO expense, foreclosure expense and impairment of OREO have remained at high levels since the Acquisition due to continuing deterioration in home prices coupled with the high volume of foreclosures.
At September 30, 2010, all OREO properties were covered by the Loss Sharing Agreements with the FDIC. For the post-Acquisition periods, OREO losses are substantially offset by non-interest income related to indemnification by the FDIC. Generally, OREO related expenses are also reimbursed under the terms of the Loss Sharing Agreements with the FDIC.
Other non-interest expense includes expenses related to the increase in fair value of a warrant issued to the FDIC in conjunction with the Acquisition. Specifically, the value of the warrant equals 10% of the value the Company realizes in an IPO or exit event in excess of the valuation that would be implied if the Company was valued at the average price-to-tangible book value multiple for the top quartile of publicly traded U.S. banks and thrifts in excess of $10 billion in assets. The Company has utilized information provided by third parties to assist in the determination of the fair value of the warrant at the Acquisition and at each quarter end beginning with September 30, 2009. The warrant value has increased through September 30, 2010 as the projected timing of the IPO has shortened. In addition, the average price-to-tangible book value multiple for the top quartile of publicly-traded U.S. banks and thrifts in excess of $10 billion in assets has decreased from approximately 2.5 at September 30, 2009 to approximately 2.1 at September 30, 2010. The warrant was initially recorded
with a fair value of $1.5 million at May 21, 2009. For the nine months ended September 30, 2010 and
the period ended December 31, 2009, we recorded $4.5 million and $1.7 million, respectively, of additional non-interest expense reflecting the increase in the fair value of the warrant. In October 2010, the Company and the FDIC agreed to amend the warrant to guarantee a minimum value to the FDIC in the amount of $25.0 million. The Company will recognize at least the difference between the recorded liability of $7.7 million at September 30, 2010 and the guaranteed minimum value of the warrant in non-interest expense in the fourth quarter of 2010.
We evaluate our non-interest expense based on measures including our efficiency ratio and trends in the individual categories of non-interest expense, after giving consideration to the planned growth of our business.
Net income
We evaluate our net income based on measures including return on average assets and return on average common stockholder's equity.
Financial Condition
Balance sheets of the Company for the post-Acquisition periods reflect the impact of the application of acquisition accounting and the resulting adjustment of assets acquired and liabilities assumed to their fair values, and are therefore not comparable in many respects to balance sheets of the Failed Bank for the pre-Acquisition periods. In particular, the carrying amount of investment securities, loans, the FDIC indemnification asset, goodwill and other intangible assets, net deferred tax assets, deposit liabilities, and FHLB advances were materially impacted by these adjustments.
Loans, OREO and certain investment securities, including certain private-label mortgage-backed and non-investment grade securities acquired from the Failed Bank are covered by the Loss Sharing Agreements with the FDIC. The Loss Sharing Agreements afford the Company significant protection against future credit losses related to these assets. Under the Loss Sharing Agreements, the FDIC will cover 80% of losses and certain expenses related to the Covered Assets up to the $4.0 billion stated threshold and 95% of losses and certain expenses that exceed the $4.0 billion stated threshold. The Loss Sharing Agreements last for ten years for single family residential loans and for five years (with recoveries for eight years) for other loan types and investment securities. The Loss Sharing Agreements coverage may be extended for two additional years under certain circumstances.
Of the securities acquired in the Acquisition, $252.9 million at fair value of non-agency mortgage-backed securities and mortgage-backed security mutual funds, trust preferred collateralized debt obligations, Agency preferred stocks, and corporate securities are covered under the non-residential Loss Sharing Agreement. BankUnited will be reimbursed 80% (95% if cumulative losses have exceeded the $4.0 billion stated threshold) of realized losses, other-than-temporary impairments and any reimbursable expenses. BankUnited must pay the FDIC 80% (95% if cumulative losses are greater than the stated threshold) of realized gains and other-than-temporary impairment recoveries. Unrealized mark-to-market changes from the application of fair value accounting do not qualify for loss sharing. BankUnited cannot sell securities covered under the Loss Sharing Agreements without prior approval of the FDIC. To date, the Company has not submitted any claims for reimbursement for the investment securities covered under the Loss Sharing Agreements.
The portfolio of available for sale securities has grown to $3.1 billion at September 30, 2010 from $2.2 billion at December 31, 2009 and $0.5 billion immediately following the Acquisition. Growth of the investment portfolio since the Acquisition has been driven primarily by the deployment of cash acquired into higher yielding assets during a period of diminished loan demand. Our investment strategy has focused on providing liquidity necessary for the day-to-day operations of the Company, adding a suitable balance of high credit quality, diversifying assets on the consolidated balance sheet, managing interest rate risk, and generating acceptable returns given our established risk parameters. We have sought to maintain liquidity and manage interest rate risk by investing a significant portion of
the portfolio in high quality liquid securities consisting primarily of U.S. Government agency floating
rate residential mortgage-backed securities. We have also invested in highly rated structured products including private-label residential mortgage-backed securities and Re-Real Estate Mortgage Investment Conduits, or Re-REMICS, bank preferred stocks and asset-backed securities collateralized primarily by auto loans, credit card receivables, student loans and floor plan loans that, while somewhat less liquid, provide the Company with higher yields. A relatively short effective portfolio duration helps mitigate interest rate risk arising from the currently low level of market interest rates and the longer duration of the loan portfolio acquired from the Failed Bank.
Loans acquired in the Acquisition were recorded at their estimated fair values at Acquisition, which were substantially less than the UPB of the loans. Additionally, the allowance for loan losses, discounts, premiums, and deferred origination fees and costs related to the acquired loans were eliminated in the application of the acquisition method of accounting. Net loans decreased to $4.1 billion at September 30, 2010 from $4.6 billion at December 31, 2009 and $5.0 billion immediately following the Acquisition, primarily due to the resolution of ACI loans.
Residential loan demand in the Company's primary market areas remains depressed, limiting the volume of new residential originations, but there has been growth in the commercial loan portfolio commensurate with a shift in our lending strategy to an emphasis on commercial and commercial real estate lending.
Asset Quality
In discussing asset quality, a distinction must be made between Covered Loans and loans originated or purchased by us since the Acquisition, or the non-Covered Loans. Non-Covered Loans were underwritten under significantly different and generally more conservative standards than the Covered Loans. In particular, credit approval policies have been strengthened, wholesale mortgage origination channels have been eliminated, "no-doc" and option adjustable rate mortgage, or ARM, loan products have been eliminated, and real estate appraisal policies have been improved. Although the risk profile of Covered Loans is higher than that of the non-Covered Loans, our exposure to loss related to the Covered Loans is significantly mitigated by the Loss Sharing Agreements and by the fair value basis recorded in these loans resulting from the application of acquisition accounting.
In monitoring asset quality, we consider the results of our internal credit risk rating process and certain key ratios including the ratio of non-performing loans to total loans, non-performing assets to total assets, portfolio delinquency and charge-off trends, among other factors. Comparison of these metrics to those reported by other financial institutions and to historical metrics of the Failed Bank is difficult because of the impact of the revaluation of the acquired loans and of ACI loan accounting. Our non-performing asset ratios as well as the ratio of the allowance for loan losses to total loans and to non-performing loans are lower as a result of acquisition accounting and ACI loan accounting. ACI loans are not reflected as nonaccrual loans even though they may be contractually delinquent due to continuing discount accretion. Discount accretion continues to be recorded as there continues to be an expectation of future cash flows from these loans.
As of September 30, 2010, substantially all of our non-performing assets are Covered Assets.
Funding Sources
Deposits are our primary funding source, supplemented by FHLB advances. Since the Acquisition, we have worked towards optimizing our deposit mix and lowering our cost of deposits by reducing rate sensitive time deposits. In the future, we expect commercial core deposits will drive core deposit growth. At Acquisition, approximately 74.8% of total deposits were concentrated in time deposits, with consumer core deposits accounting for 21.7% of total deposits and commercial core deposits accounting for 3.5% of total deposits. At September 30, 2010, time deposits accounted for 47.7% of total deposits while consumer core deposits represented 41.3% of the total and commercial core deposits represented 11.0% of total deposits.
The Bank's liquidity needs are primarily met by its cash position, growth in core deposits, cash flow from its amortizing investment and loan portfolios, and reimbursements under the Loss Sharing Agreements. If necessary, the Bank currently has the ability to raise additional liquidity through collateralized borrowings, FHLB advances or the sale of available for sale investment securities. We regularly monitor several measures of liquidity, including liquid assets, defined as cash and cash equivalents, and pledgeable securities, to total assets.
Strengths, Opportunities and Challenges
Management believes that our Company has several key strengths, including:
Management has identified significant opportunities for our Company, including:
We have also identified significant challenges confronting the industry and our Company:
high yielding Covered Assets as they are paid down or mature. The yield on newly acquired assets will depend on prevailing interest rates at the date they are purchased or originated.
Recent Regulatory Actions Impacting the Financial Services Industry
Regulatory policy and actions have become increasingly subject to change and difficult to predict, both in general and as they may be applied specifically to the Company.
On July 21, 2010, the Dodd-Frank Act was signed into law. The Dodd-Frank Act implements far-reaching changes across the financial regulatory landscape, including provisions that, among other things, will:
Many aspects of the Dodd-Frank Act are subject to rulemaking and will take effect over several years, making it difficult to anticipate the overall financial impact on the Company and the financial services industry more generally. Provisions in the legislation that affect deposit insurance assessments and payment of interest on demand deposits could increase the costs associated with deposits. Provisions in the legislation that will impose new capital requirements on the Company could require the Company to seek additional sources of capital in the future.
In addition, other proposals have been offered by the current administration, by members of Congress and international regulatory forums that, if enacted, may have significant and potentially adverse effects on the Company, the full impact of which is difficult to predict at this time. For additional discussion, see "Regulation and Supervision."
Results of Operations for the Post-Acquisition Periods
The Company reported net income of $156.9 million for the nine months ending September 30, 2010 and $119.0 million for the period from April 28, 2009 (date of inception) through December 31, 2009.
Net Interest Income
The following table presents, for the periods indicated, information about (i) average balances, the total dollar amount of interest income from earning assets and the resultant average yields; (ii) average balances, the total dollar amount of interest expense on interest bearing liabilities and the resultant average rates; (iii) net interest income; (iv) the interest rate spread; and (v) the net interest margin. Nonaccrual and restructured loans are included in the average balances presented in this table;
however, interest income foregone on nonaccrual loans is not included. Yields have been calculated on a pre-tax basis(dollars in thousands):
| | Nine Months Ended September 30, 2010 | Period from May 22, 2009 to December 31, 2009 | ||||||||||||||||||||
|---|---|---|---|---|---|---|---|---|---|---|---|---|---|---|---|---|---|---|---|---|---|---|
| | Average Balance | Interest | Yield/ Rate(1) | Average Balance | Interest | Yield/ Rate(1) | ||||||||||||||||
Assets: | ||||||||||||||||||||||
Interest earning assets: | ||||||||||||||||||||||
Investment securities available for sale | $ | 412,196 | $ | 5,894 | 1.91 | % | $ | 69,778 | $ | 1,999 | 4.71 | % | ||||||||||
Mortgage-backed securities | 2,438,608 | 87,488 | 4.78 | % | 889,776 | 43,143 | 7.97 | % | ||||||||||||||
Total investment securities available for sale | 2,850,804 | 93,382 | 4.37 | % | 959,554 | 45,142 | 7.73 | % | ||||||||||||||
Other interest earning assets | 628,914 | 1,485 | 0.32 | % | 1,719,417 | 2,922 | 0.28 | % | ||||||||||||||
Loans receivable | 4,252,602 | 320,092 | 10.04 | % | 4,754,739 | 287,460 | 9.92 | % | ||||||||||||||
Total interest earning assets | 7,732,320 | 414,959 | 7.16 | % | 7,433,710 | 335,524 | 7.42 | % | ||||||||||||||
Allowance for loan losses | (31,230 | ) | (1,031 | ) | ||||||||||||||||||
Noninterest earning assets | 3,558,771 | 4,026,356 | ||||||||||||||||||||
Total assets | $ | 11,259,861 | $ | 11,459,035 | ||||||||||||||||||
Liabilities and Equity: | ||||||||||||||||||||||
Interest bearing liabilities: | ||||||||||||||||||||||
Interest bearing deposits: | ||||||||||||||||||||||
Interest bearing demand | $ | 253,830 | $ | 1,423 | 0.75 | % | $ | 183,416 | $ | 891 | 0.79 | % | ||||||||||
Savings and money market | 2,808,277 | 26,422 | 1.26 | % | 2,153,446 | 25,578 | 1.94 | % | ||||||||||||||
Time deposits | 4,068,348 | 55,786 | 1.83 | % | 5,506,320 | 31,360 | 0.93 | % | ||||||||||||||
Total interest bearing deposits | 7,130,455 | 83,631 | 1.57 | % | 7,843,182 | 57,829 | 1.20 | % | ||||||||||||||
Borrowings: | ||||||||||||||||||||||
Federal Home Loan Bank advances | 2,240,126 | 43,792 | 2.61 | % | 1,974,755 | 26,026 | 2.15 | % | ||||||||||||||
Short term borrowings | 10,358 | 72 | 0.93 | % | 2,091 | 1 | 0.02 | % | ||||||||||||||
Total interest bearing liabilities | 9,380,939 | 127,495 | 1.82 | % | 9,820,028 | 83,856 | 1.39 | % | ||||||||||||||
Non interest bearing demand deposits | 414,350 | 303,810 | ||||||||||||||||||||
Other non-interest bearing liabilities | 280,357 | 313,399 | ||||||||||||||||||||
Total liabilities | 10,075,646 | 10,437,237 | ||||||||||||||||||||
Equity | 1,184,215 | 1,021,798 | ||||||||||||||||||||
Total liabilities and equity | $ | 11,259,861 | $ | 11,459,035 | ||||||||||||||||||
Net interest income | 287,464 | $ | 251,668 | |||||||||||||||||||
Interest rate spread | 5.34 | % | 6.03 | % | ||||||||||||||||||
Net interest margin | 4.95 | % | 5.58 | % | ||||||||||||||||||
Increases and decreases in interest income and interest expense result from changes in average balances (volume) of interest earning assets and liabilities, as well as changes in average interest rates,
which are impacted by accretion of fair value adjustments recorded in conjunction with the Acquisition. The comparison of total interest income and total interest expense for the nine months ended September 30, 2010 to the period ended December 31, 2009 is also impacted by the different number
of days in the comparative periods. The following table shows the effect that these factors had on the interest earned on our interest earning assets and the interest incurred on our interest bearing liabilities for the periods indicated. The effect of changes in volume is determined by multiplying the change in volume by the previous period's average rate. Similarly, the effect of rate changes is calculated by multiplying the change in average rate by the previous period's volume. Changes applicable to both volume and rate have been allocated to volume(dollars in thousands):
| | Nine Months Ended September 30, 2010 Compared to Period Ended December 31, 2009 | ||||||||||||||
|---|---|---|---|---|---|---|---|---|---|---|---|---|---|---|---|
| | Changes in Volume | Changes in Rate | Change due to Number of Days | Total Increase (Decrease) | |||||||||||
Interest Income Attributable to | |||||||||||||||
Investment securities available for sale | $ | 4,270 | $ | (1,467 | ) | $ | 1,092 | $ | 3,895 | ||||||
Mortgage-backed securities | 49,412 | (21,268 | ) | 16,201 | 44,345 | ||||||||||
Total investment securities available for sale | 53,682 | (22,735 | ) | 17,293 | 48,240 | ||||||||||
Other interest earning assets | (2,203 | ) | 499 | 267 | (1,437 | ) | |||||||||
Loans receivable | (30,779 | ) | 4,135 | 59,276 | 32,632 | ||||||||||
Total interest earning assets | 20,700 | (18,101 | ) | 76,836 | 79,435 | ||||||||||
Interest Expense Attributable to | |||||||||||||||
Interest bearing demand deposits | $ | 334 | $ | (58 | ) | $ | 256 | $ | 532 | ||||||
Savings and money market deposit accounts | 7,013 | (10,911 | ) | 4,742 | 844 | ||||||||||
Time deposits | (22,870 | ) | 37,283 | 10,013 | 24,426 | ||||||||||
Total interest bearing deposits | (15,523 | ) | 26,314 | 15,011 | 25,802 | ||||||||||
FHLB advances | 3,022 | 6,884 | 7,860 | 17,766 | |||||||||||
Short term borrowings | 44 | 14 | 13 | 71 | |||||||||||
Total interest bearing liabilities | (12,457 | ) | 33,212 | 22,884 | 43,639 | ||||||||||
Increase (decrease) in net interest income | $ | 33,157 | $ | (51,313 | ) | $ | 53,952 | $ | 35,796 | ||||||
Nine months ending September 30, 2010 compared to period from May 22, 2009 to December 31, 2009
Net interest income was $287.5 million for the nine months ending September 30, 2010 and $251.7 million for the period ending December 31, 2009, for an increase of $35.8 million. The increase in net interest income was comprised of an increase in interest income of $79.4 million partially offset by an increase in interest expense of $43.6 million. On an annualized basis, net interest income was $382.8 million and $414.9 million for the nine months ending September 30, 2010 and period ending December 31, 2009, respectively. The decline of $32.1 million, or 7.7%, in annualized net interest income was comprised of an increase of $33.8 million in interest expense partly offset by an increase of $1.7 million in interest income.
The increase in interest income on an annualized basis reflects increased interest income from investment securities partially offset by a decline in interest income from loans. The increase in interest income from investment securities resulted from an increase in average volume significantly mitigated by a decline in the average yield. The average yield on investment securities declined to 4.37% for the nine months ending September 30, 2010 from 7.73% for the period ending December 31, 2009. The decrease in average yield resulted primarily from new purchases reflecting lower general market rates of interest as well as the continued impact of a shift since the Acquisition in the type of securities purchased, including $1.2 billion of U.S. Government agency floating rate securities and $0.4 billion of
non-mortgage asset-backed securities purchased as of September 30, 2010. The decline in interest income from loans is indicative of a decline in average volume resulting from paydowns and
resolutions, partially offset by an increase in the average yield to 10.04% for the nine months ending September 30, 2010 as compared to 9.92% for the period ending December 31, 2009. The increased yield reflects the origination and purchase of new loans at lower prevailing market rates of interest offset by an increased yield on Covered Loans. The average yield on loans originated and purchased since the Acquisition was 5.28% and 6.35% for the nine months ending September 30, 2010 and period ending December 31, 2009, respectively. The yield on Covered Loans increased to 10.30% for the period ending September 30, 2010 from 9.93% for the period ending December 31, 2009 due to an increase in projected cash flows from the Covered Loans.
Interest expense on deposits increased on an annualized basis by $17.6 million for the nine months ending September 30, 2010 due to lower accretion of fair market value adjustments on time deposits as acquired time deposits matured, partially mitigated by a shift in deposit mix toward lower rate products and a decline in market rates. Accretion of fair value adjustments on time deposits totaled $18.3 million for the nine months ending September 30, 2010 as compared to $79.9 million for the period ending December 31, 2009. The average rate paid on time deposits excluding the impact of accretion was 2.45% for the nine months ending September 30, 2010 and 3.32% for the period ending December 31, 2009. The decline in the adjusted average rate is attributable to lower prevailing rates. Interest expense on FHLB advances and other borrowings increased by $16.2 million on an annualized basis as a result of lower accretion of fair value adjustments, as well as increased volume of outstanding FHLB advances. Accretion of fair value adjustments on FHLB advances totaled $19.0 million for the nine months ended September 30, 2010 as compared to $25.1 million for the period ended December 31, 2009. Accretion decreased the average rate paid on FHLB advances by 122 and 228 basis points for the nine months ending September 30, 2010 and period ended December 31, 2009, respectively. The decline in accretion is due to the maturity and repayment of a portion of the advances outstanding at the Acquisition date, along with the difference in the number of days in the comparative periods.
The net interest margin for the nine months ending September 30, 2010 was 4.95% as compared to 5.58% for the period ending December 31, 2009, a decline of 63 basis points. The average yield on interest earning assets declined by 26 basis points for the nine months ending September 30, 2010 as compared to the period ending December 31, 2009 while the average rate paid on interest bearing liabilities increased by 43 basis points, for a decline in the interest rate spread of 69 basis points. The decline in both net interest margin and interest rate spread resulted primarily from lower accretion of fair value adjustments, particularly on interest bearing liabilities, the origination and purchase of loans and investment securities at lower prevailing market rates of interest, and a shift in the composition of interest earning assets from loans to investment securities as discussed above.
Provision for Loan Losses
Our determination of the amount of the allowance and corresponding provision for loan losses considers ongoing evaluations of the various segments of the Company's loan portfolio and of individually significant credits, levels of non-performing loans and charge-offs, statistical trends and economic and other relevant factors. See "—Analysis of the Allowance for Loan Losses" below for more information about how we determine the appropriate level of the allowance.
Non-Interest Income
The Company reported non-interest income of $237.5 million for the nine months ending September 30, 2010 and $252.8 million for the period from May 22, 2009 to December 31, 2009. The
following table presents a comparison of the categories of non-interest income for the periods indicated(dollars in thousands):
| | Nine Months Ended September 30, 2010 | Period from May 22, 2009 to December 31, 2009 | ||||||
|---|---|---|---|---|---|---|---|---|
Accretion of discount on FDIC indemnification asset | $ | 116,915 | $ | 149,544 | ||||
Income from resolution of Covered Assets, net | 112,777 | 120,954 | ||||||
Net loss on indemnification asset resulting from net recoveries | (44,932 | ) | (22,568 | ) | ||||
FDIC reimbursement of costs of resolution of Covered Assets | 22,393 | 8,095 | ||||||
Net loss on sale of loans | — | (47,078 | ) | |||||
Non-interest income from Covered Assets | 207,153 | 208,947 | ||||||
Service charges on deposits and other fee income | 6,398 | 4,913 | ||||||
Service charges on loans | 1,501 | 1,509 | ||||||
Loan servicing fees | — | 331 | ||||||
Gain on extinguishment of debt | — | 31,303 | ||||||
Loss on sale or exchange of investment securities available for sale | (2,292 | ) | (337 | ) | ||||
Mortgage insurance income | 12,097 | 1,338 | ||||||
Other non-interest income | 12,663 | 4,824 | ||||||
Total non-interest income | $ | 237,520 | $ | 252,828 | ||||
The following table summarizes the pre-tax components of the gains and losses associated with the resolution of Covered Assets, plus the provision for loan losses on non-Covered Loans, for the nine months ended September 30, 2010 and period ended December 31, 2009(dollars in thousands):
| | Nine Months Ended September 30, 2010 | Period Ended December 31, 2009 | ||||||||||||||||||
|---|---|---|---|---|---|---|---|---|---|---|---|---|---|---|---|---|---|---|---|---|
| | Transaction Income (Loss) | Net Loss on Indemnification Asset Resulting From Net Recoveries | Net Impact on Earnings | Transaction Income (Loss) | Net Loss on Indemnification Asset Resulting From Net Recoveries | Net Impact on Earnings | ||||||||||||||
Provision for losses on Covered Loans | $ | (42,538 | ) | $ | 22,979 | $ | (19,559 | ) | $ | (21,287 | ) | $ | 14,433 | $ | (6,854 | ) | ||||
Provision for losses on non-Covered Loans | (2,619 | ) | — | (2,619 | ) | (1,334 | ) | — | (1,334 | ) | ||||||||||
Total provision for loan losses | (45,157 | ) | 22,979 | (22,178 | ) | (22,621 | ) | 14,433 | (8,188 | ) | ||||||||||
Income from resolution of Covered Assets, net | 112,777 | 120,954 | ||||||||||||||||||
Net loss on sale of Covered Loans | — | (47,078 | ) | |||||||||||||||||
| 112,777 | (76,978 | ) | 35,799 | 73,876 | (51,201 | ) | 22,675 | |||||||||||||
Gain (loss) on sale of OREO | 2,270 | — | — | — | ||||||||||||||||
Loss due to impairment of OREO | (12,164 | ) | (21,055 | ) | ||||||||||||||||
| (9,894 | ) | 9,067 | (827 | ) | (21,055 | ) | 14,200 | (6,855 | ) | |||||||||||
Total | $ | 57,726 | $ | (44,932 | ) | $ | 12,794 | $ | 30,200 | $ | (22,568 | ) | $ | 7,632 | ||||||
Nine months ending September 30, 2010 compared to period from May 22, 2009 to December 31, 2009
For the nine months ended September 30, 2010 and the period from May 22, 2009 to December 31, 2009, non-interest income was significantly impacted by the effect of the Acquisition and the related Loss Sharing Agreements with the FDIC. Accretion of discount on the FDIC indemnification asset totaled $116.9 million for the nine months ending September 30, 2010 and $149.5 million for the period ending December 31, 2009. The decrease in accretion for the nine months ending September 30, 2010 as compared to the period ending December 31, 2009 was related to the decrease in the average balance of the indemnification asset as well as a decrease in the average discount rate during the period to 5.32% from 7.10%.
When the Company recognizes gains or losses related to Covered Assets in its consolidated financial statements, changes in the estimated amount recoverable from the FDIC under the Loss Sharing Agreements with respect to those gains or losses are also reflected in the consolidated financial statements. The net impact on earnings before taxes of transactions related to Covered Assets, plus the provision for loan losses on non-Covered Loans, for the nine months ending September 30, 2010 and period ending December 31, 2009 was $12.8 million and $7.6 million, respectively, as detailed in the table above.
Additional impairment arising since the Acquisition related to Covered Loans is recorded in earnings through the provision for losses on Covered Loans. Under the terms of the Loss Sharing Agreements, the Company is entitled to recover from the FDIC a portion of losses on these loans; therefore, the discounted amount of additional expected cash flows from the FDIC related to these losses is recorded in non-interest income in the line item "Net loss on indemnification asset resulting from net recoveries" and reflected as a corresponding increase in the FDIC indemnification asset.
Covered Loans may be resolved through repayment, foreclosure, short sale of the underlying collateral or, for the non-residential portfolio, charge-offs, or sale of the loans. The difference between payment received in resolution of Covered Loans and the amount of projected losses from resolution of those loans as well as losses from permanent modifications of ACI loans accounted for in pools, is recorded in the income statement line item "Income from resolution of covered assets, net". Losses from the resolution or permanent modification of Covered Loans increase the amount recoverable from the FDIC under the Loss Sharing Agreements. Gains from the resolution of Covered Loans reduce the amount recoverable from the FDIC under the Loss Sharing Agreements. These additions to or reductions in amounts recoverable from the FDIC related to the resolution of Covered Loans are recorded in non-interest income in the line item "Net loss on indemnification asset resulting from net recoveries" and reflected as corresponding increases or decreases in the FDIC indemnification asset. For the nine months ending September 30, 2010 and period ending December 31, 2009, ACI loans with an UPB of $1.2 billion and $1.4 billion were resolved, resulting in income of $112.8 million and $121.0 million, respectively.
During the period ending December 31, 2009, Covered Loans with an UPB of $275.0 million and a carrying value of $126.7 million were sold on a non-recourse basis to third parties. A loss on sale of $47.1 million was recognized during the period ending December 31, 2009. The amount recoverable from the FDIC related to this loss was recorded as an increase in the FDIC indemnification asset and a corresponding increase in the non-interest income line item "Net loss on indemnification asset resulting from net recoveries".
The Company records impairment charges related to declines in the net realizable value of OREO properties subject to the Loss Sharing Agreements and recognizes additional gains or losses upon the eventual sale of such OREO properties. The estimated increase or reduction in amounts recoverable from the FDIC with respect to these gains and losses is reflected as an increase or decrease in the FDIC indemnification asset and in non-interest income in the line item "Net loss on indemnification asset resulting from net recoveries".
Net loss on indemnification asset resulting from net recoveries of $(44.9) million and $(22.6) million was recorded for the nine months ending September 30, 2010 and period ending December 31, 2009, respectively, representing the net change in the FDIC indemnification asset resulting from increases or decreases in cash flows estimated to be received from the FDIC related to the ultimate resolution of Covered Assets as discussed in the preceding paragraphs.
For the nine months ended September 30, 2010 and the period ended December 31, 2009, non-interest income includes $22.4 million and $8.1 million, respectively, related to claims that were submitted to the FDIC for reimbursement of certain disbursements made by the Company with respect to resolution of Covered Assets.
The Company prepaid FHLB advances with a principal balance of $2.7 billion during the period ending December 31, 2009. These advances had a carrying amount of $2.8 billion at the time of repayment. The Company recognized a gain of $31.3 million on this transaction.
�� During the nine months ending September 30, 2010, the Company incurred net losses of $2.3 million on the sale or exchange of investment securities available for sale. The majority of this loss related to an exchange of certain non-covered trust preferred securities for preferred stock of the same issuer to achieve higher returns and more favorable tax treatment. Based on the market value of the trust preferred securities at the time of the exchange, the Company recognized a gross realized loss of $2.8 million on the transaction.
Mortgage insurance income represents mortgage insurance proceeds received with respect to Covered Loans in excess of the portion of losses on those loans that is recoverable from the FDIC. Mortgage insurance proceeds up to the amount of losses on Covered Loans reimbursable by the FDIC offsets amounts otherwise recoverable from the FDIC. The increase in mortgage insurance income for the nine months ending September 30, 2010 as compared to the period ending December 31, 2009 is a result of increased efforts by the Company to file and collect insurance claims.
The increase in other non-interest income for the nine months ending September 30, 2010 as compared to the period ending December 31, 2009 related in large part to increased fees earned by the Company's non-bank subsidiary, BankUnited Investment Services, Inc.
Non-Interest Expense
The following table presents the components of non-interest expense for the periods indicated(dollars in thousands):
| | Nine Months Ended September 30, 2010 | Period from May 22, 2009 to December 31, 2009 | ||||||
|---|---|---|---|---|---|---|---|---|
Employee compensation and benefits | $ | 100,334 | $ | 62,648 | ||||
Occupancy and equipment | 19,843 | 19,925 | ||||||
Impairment of OREO | 12,164 | 21,055 | ||||||
Foreclosure expense | 28,384 | 16,632 | ||||||
OREO expense | 10,903 | 7,576 | ||||||
Deposit insurance expense | 10,420 | 11,850 | ||||||
Professional fees | 7,668 | 14,854 | ||||||
Telecommunications and data processing | 8,772 | 6,440 | ||||||
Other non-interest expense | 21,560 | 12,230 | ||||||
| 220,048 | 173,210 | |||||||
Loss on FDIC receivable—securities valuation dispute | — | 69,444 | ||||||
Acquisition related costs | — | 39,800 | ||||||
Acquisition related expense | — | 109,244 | ||||||
Total non-interest expense | $ | 220,048 | $ | 282,454 | ||||
Nine months ending September 30, 2010 compared to period from May 22, 2009 to December 31, 2009
On an annualized basis, non-interest expense as a percentage of average assets was 2.6% for the nine months ended September 30, 2010 as compared to 4.0% for the period ended December 31, 2009. The decline was primarily attributable to non-recurring expenses related to the Acquisition that were incurred during the period ended December 31, 2009, reduced professional fees, lower occupancy costs,
and lower deposit insurance assessments, partially offset by increased employee compensation and benefits cost and OREO and foreclosure expense.
As is typical for financial institutions, employee compensation and benefits represent the single largest component of recurring non-interest expense. On an annualized basis, employee compensation and benefits increased by approximately $32.1 million, or 31.4%, for the nine months ending September 30, 2010 as compared to the period ending December 31, 2009. This increase resulted in part from continued enhancement of our management team and other personnel subsequent to the Acquisition. Employee compensation and benefits also included $20.0 million and $8.8 million for the nine months ended September 30, 2010 and period ending December 31, 2009, respectively, related to Time-based PIUs.
The decline in occupancy and equipment expense for the nine months ended September 30, 2010 resulted primarily from the renegotiation of leases and reduced depreciation.
Professional fees for the period ended December 31, 2009 included non-recurring legal and accounting fees related to certain litigation matters and formation of the Company.
OREO expense, foreclosure expense and impairment of OREO remained at high levels during the nine months ended September 30, 2010 and the period ended December 31, 2009 due to continuing deterioration in home prices and the high volume of foreclosures. The rate of home price deterioration moderated to some extent during 2010, contributing to reduced impairment charges for the nine months ending September 30, 2010 as compared to the period ending December 31, 2009. At September 30, 2010, approximately 5,500 units were in the foreclosure process, down from a peak of approximately 7,300 units in November of 2009.
OREO losses and OREO related expenses for the post-Acquisition periods are substantially offset by non-interest income related to indemnification by the FDIC. During the nine months ending September 30, 2010 and the period ending December 31, 2009, non-interest expense includes approximately $41.6 million and $19.7$26.1 million, respectively, of disbursements subject to reimbursement under the Loss Sharing Agreements. For those same periods, $30.1 and $10.3 million, respectively of these disbursements were submitted to the FDIC for reimbursement at the 80% level. As of September 30, 2010, $27.3 million of these disbursements remain to be submitted for reimbursement from the FDIC in future periods.
The primary components of other non-interest expense are promotion and advertising, loan related expenses, the cost of regulatory examinations, the change in fair value of the warrant issued to the FDIC and general office expense.
Income Taxes
The provision for income taxes for the nine months ending September 30, 2010 and period ending December 31, 2009 was $102.9 million and $80.4 million, respectively. The Company's effective tax rate was 39.6% and 40.3% for the nine months ending September 30, 2010 and period ending December 31, 2009. The Company's effective tax rate differed from the statutory federal tax rate of 35.0% primarily due to the effect of state income taxes and expense related to PIUs. At September 30, 2010 and December 31, 2009, the Company had net deferred tax liabilities of $15.7 million and net deferred tax assets of $22.5 million, respectively. Based on an evaluation of the ultimate realization of deferred tax assets considering the availability of tax loss carrybacks, future taxable income that will result from reversal of existing taxable temporary differences, including negative goodwill recognized for tax purposes, and taxable income expected to be generated from future operations in light of the Company's current level of profitability, we have concluded it is more likely than not that the deferred tax assets will be realized.
Balance Sheet Analysis for the Post-Acquisition Periods
Average interest earning assets increased $298.6 million to $7.7 billion for the nine months ending September 30, 2010 from $7.4 billion for the period ending December 31, 2009. This increase was driven primarily by an increase in the average balance of investment securities resulting from continued deployment of cash acquired in the Acquisition and from reimbursements under the Loss Sharing Agreements. Average non-interest earning assets declined by $467.6 million, largely attributable to the decrease in the FDIC indemnification asset.
Average interest bearing liabilities decreased by $439.1 million to $9.4 billion for the nine months ending September 30, 2010 from $9.8 billion for the period ending December 31, 2009, reflecting a decrease in average interest-bearing deposits partially offset by an increase in outstanding FHLB advances. The reduction in outstanding interest-bearing deposits resulted from a reduction in rates offered and a shift in emphasis away from rate sensitive time deposits. Average non-interest bearing liabilities increased by $77.5 million, primarily as a result of an increase in non-interest bearing demand deposits. Average equity increased by $162.4 million, primarily due to earnings.
Investment Securities Available for Sale
The following table shows the amortized cost and fair value of our investment securities as of the dates indicated. All of our investment securities are classified available for sale(dollars in thousands):
| | At September 30, 2010 | At December 31, 2009 | ||||||||||||
|---|---|---|---|---|---|---|---|---|---|---|---|---|---|---|
| | Amortized Cost | Fair Value | Amortized Cost | Fair Value | ||||||||||
U.S. Treasury securities | $ | — | $ | — | $ | 10,066 | $ | 10,072 | ||||||
U.S. Government agency and sponsored enterprise residential mortgage-backed securities | 1,344,928 | 1,368,239 | 1,288,277 | 1,288,643 | ||||||||||
Other residential collateralized mortgage obligations | 693,398 | 706,280 | 480,478 | 476,839 | ||||||||||
Residential mortgage pass-through certificates | 299,452 | 364,539 | 318,018 | 364,672 | ||||||||||
Nonmortgage asset-backed securities | 426,018 | 427,931 | 30,000 | 30,000 | ||||||||||
Mutual funds and preferred stocks | 121,584 | 124,281 | 43,344 | 43,523 | ||||||||||
State and municipal obligations | 23,473 | 23,678 | 23,214 | 23,356 | ||||||||||
Small Business Administration securities | 66,355 | 66,657 | — | — | ||||||||||
Other debt securities | 3,594 | 6,899 | 3,331 | 6,038 | ||||||||||
Total investment securities available for sale | $ | 2,978,802 | $ | 3,088,504 | $ | 2,196,728 | $ | 2,243,143 | ||||||
Our available for sale securities portfolio consists of the securities acquired in the Acquisition (the "acquired securities") and those purchased by us subsequent to the Acquisition. Investment securities increased by $1.7 billion, from $0.5 billion at May 21, 2009 to $2.2 billion at December 31, 2009 and by an additional $0.9 billion, to $3.1 billion, at September 30, 2010. Purchases of investment securities totaled $1.3 billion and $1.8 billion for the nine months ending September 30, 2010 and period ending December 31, 2009, respectively, offset by pay-downs, maturities and sales of $0.5 billion and $0.2 billion, respectively.
The following tables show, as of September 30, 2010 and December 31, 2009, the breakdown of Covered and non-Covered Securities in the Company's investment portfolio(dollars in thousands):
| | At September 30, 2010 | |||||||||||||||||||||||||
|---|---|---|---|---|---|---|---|---|---|---|---|---|---|---|---|---|---|---|---|---|---|---|---|---|---|---|
| | Covered Securities | Non-Covered Securities | ||||||||||||||||||||||||
| | Amortized Cost | Unrealized Gains | Unrealized Losses | Fair Value | Amortized Cost | Unrealized Gains | Unrealized Losses | Fair Value | ||||||||||||||||||
U.S. Government agency and sponsored enterprise residential mortgage-backed securities | $ | — | $ | — | $ | — | $ | — | $ | 1,344,928 | $ | 23,331 | $ | (20 | ) | $ | 1,368,239 | |||||||||
Other residential collateralized mortgage obligations | 1,729 | 97 | — | 1,826 | 691,669 | 13,852 | (1,067 | ) | 704,454 | |||||||||||||||||
Residential mortgage pass-through certificates | 183,374 | 64,284 | (1,601 | ) | 246,057 | 116,078 | 2,404 | — | 118,482 | |||||||||||||||||
Non mortgage asset-backed securities | — | — | — | — | 426,018 | 1,988 | (75 | ) | 427,931 | |||||||||||||||||
Mutual funds and preferred stocks | 16,408 | — | (936 | ) | 15,472 | 105,176 | 3,633 | — | 108,809 | |||||||||||||||||
State and municipal obligations | — | — | — | — | 23,473 | 211 | (6 | ) | 23,678 | |||||||||||||||||
Small Business Administration securities | — | — | — | — | 66,355 | 354 | (52 | ) | 66,657 | |||||||||||||||||
Other debt securities | 3,594 | 3,305 | — | 6,899 | — | — | — | — | ||||||||||||||||||
Total investment securities available for sale | $ | 205,105 | $ | 67,686 | $ | (2,537 | ) | $ | 270,254 | $ | 2,773,697 | $ | 45,773 | $ | (1,220 | ) | $ | 2,818,250 | ||||||||
| | At December 31, 2009 | |||||||||||||||||||||||||
|---|---|---|---|---|---|---|---|---|---|---|---|---|---|---|---|---|---|---|---|---|---|---|---|---|---|---|
| | Covered Securities | Non-Covered Securities | ||||||||||||||||||||||||
| | Amortized Cost | Unrealized Gains | Unrealized Losses | Fair Value | Amortized Cost | Unrealized Gains | Unrealized Losses | Fair Value | ||||||||||||||||||
U.S. Treasury securities | $ | — | $ | — | $ | — | $ | — | $ | 10,066 | $ | 6 | $ | — | $ | 10,072 | ||||||||||
U.S. Government agency and sponsored enterprise residential mortgage-backed securities | — | — | — | — | 1,288,277 | 3,581 | (3,215 | ) | 1,288,643 | |||||||||||||||||
Other residential collateralized mortgage obligations | 1,747 | 89 | — | 1,836 | 478,731 | 1,007 | (4,735 | ) | 475,003 | |||||||||||||||||
Residential mortgage pass-through certificates | 199,402 | 51,196 | (480 | ) | 250,118 | 118,616 | — | (4,062 | ) | 114,554 | ||||||||||||||||
Asset-backed securities | — | — | — | — | 30,000 | — | — | 30,000 | ||||||||||||||||||
Mutual funds and preferred stocks | 18,094 | 338 | (698 | ) | 17,734 | 25,250 | 661 | (122 | ) | 25,789 | ||||||||||||||||
State and municipal obligations | — | — | — | — | 23,214 | 143 | (1 | ) | 23,356 | |||||||||||||||||
Other debt securities | 3,331 | 2,707 | — | 6,038 | — | — | — | — | ||||||||||||||||||
Total investment securities available for sale | $ | 222,574 | $ | 54,330 | $ | (1,178 | ) | $ | 275,726 | $ | 1,974,154 | $ | 5,398 | $ | (12,135 | ) | $ | 1,967,417 | ||||||||
Covered securities include non-agency mortgage-backed securities and mortgage-backed security mutual funds, trust preferred collateralized debt obligations, Agency preferred stocks, and corporate securities covered under the non-residential Loss Sharing Agreement. BankUnited will be reimbursed 80%, or 95% if cumulative losses exceed the $4.0 billion stated threshold, of realized losses, other than
temporary impairments, and reimbursable expenses associated with the covered securities. BankUnited must pay the FDIC 80%, or 95% if cumulative losses are greater than the stated threshold, of realized gains and other-than-temporary impairment recoveries. To date, the Company has not submitted any claims for reimbursement related to the covered securities.
The following table shows the composition, as of September 30, 2010, of securities added to the portfolio since the Acquisition(dollars in millions):
| | Fair Value | ||||
|---|---|---|---|---|---|
U.S. Government agency and sponsored | $ | 1,238.7 | |||
Other residential collateralized mortgage obligations | 704.5 | ||||
Residential mortgage pass-through certificates | 118.5 | ||||
Nonmortgage asset-backed securities | 427.9 | ||||
Mutual funds and preferred stocks | 108.8 | ||||
State and municipal obligations | 16.8 | ||||
Small Business Administration securities | 66.7 | ||||
Total | $ | 2,681.9 | |||
The following table shows the scheduled maturities adjusted for anticipated prepayments of mortgage-backed and other pass through securities, carrying values and current yields for our investment portfolio as of September 30, 2010. Yields on tax-exempt securities have been calculated on a pre-tax basis(dollars in thousands):
| | Within One Year | After One Year Through Five Years | After Five Years Through Ten Years | After Ten Years | Total | |||||||||||||||||||||||||||
|---|---|---|---|---|---|---|---|---|---|---|---|---|---|---|---|---|---|---|---|---|---|---|---|---|---|---|---|---|---|---|---|---|
| | Carrying Value | Weighted Average Yield | Carrying Value | Weighted Average Yield | Carrying Value | Weighted Average Yield | Carrying Value | Weighted Average Yield | Carrying Value | Weighted Average Yield | ||||||||||||||||||||||
U.S. Government agency and sponsored enterprise residential mortgage-backed securities | $ | 221,207 | 1.44 | % | $ | 527,399 | 1.29 | % | $ | 313,567 | 1.20 | % | $ | 306,066 | 1.28 | % | $ | 1,368,239 | 1.29 | % | ||||||||||||
Other residential collateralized mortgage obligations | 208,398 | 5.91 | % | 425,470 | 5.34 | % | 57,315 | 6.27 | % | 15,097 | 5.49 | % | 706,280 | 5.59 | % | |||||||||||||||||
Residential mortgage pass-through certificates | 77,271 | 10.38 | % | 173,948 | 11.00 | % | 77,619 | 12.14 | % | 35,701 | 15.18 | % | 364,539 | 11.52 | % | |||||||||||||||||
Non mortgage asset-backed securities | 98,414 | 0.67 | % | 320,365 | 2.22 | % | 9,152 | 2.95 | % | — | 0.00 | % | 427,931 | 1.88 | % | |||||||||||||||||
State and municipal obligations | 9,659 | 0.18 | % | 13,745 | 1.95 | % | 274 | 7.61 | % | — | 3.83 | % | 23,678 | 1.29 | % | |||||||||||||||||
Small Business Administration securities | 6,573 | 4.24 | % | 20,380 | 4.22 | % | 24,716 | 3.97 | % | 14,988 | 3.57 | % | 66,657 | 3.99 | % | |||||||||||||||||
Other debt securities | — | — | — | 6,899 | 15.37 | % | 6,899 | 15.37 | % | |||||||||||||||||||||||
| $ | 621,522 | 3.80 | % | $ | 1,481,307 | 3.70 | % | $ | 482,643 | 3.51 | % | $ | 378,751 | 2.81 | % | $ | 2,964,223 | 3.75 | % | |||||||||||||
Mutual funds and preferred stocks with no scheduled maturity | 124,281 | 9.52 | % | |||||||||||||||||||||||||||||
Total investment securities available for sale | $ | 3,088,504 | 3.82 | % | ||||||||||||||||||||||||||||
The effective duration of the investment portfolio as of September 30, 2010 is 0.9 years.
We evaluate the credit quality of individual securities in the portfolio quarterly to determine whether any of the investments in unrealized loss positions are other-than-temporarily impaired. This evaluation considers the duration and severity of impairment; collateral values and levels of subordination or over-collateralization; collateral performance; the credit rating, earnings performance and business prospects of the issuer and other relevant factors. We may consider factors that raise significant concerns about an issuer's ability to continue as a going concern such as negative cash flows from operations, working capital deficiencies, or non-compliance with statutory capital requirements or debt covenants. We may also consider adverse changes in the regulatory or economic environment as well as significant adverse changes in general market conditions of the geographic area or the industry in which individual issuers operate. We consider both our intent to sell investment securities and whether it is more likely than not that we will be required to sell the securities within a period of time sufficient for a recovery in value, which might be until maturity for debt securities or for a reasonable forecasted period of recovery for equity securities.
No securities were determined to be other-than-temporarily impaired during the nine months ending September 30, 2010 or the period ending December 31, 2009. Approximately 94% of the securities purchased since the Acquisition were agency-backed or rated AAA at the time of acquisition. At September 30, 2010, securities in unrealized loss positions included private-label collateralized mortgage obligations with total unrealized losses of $1.1 million, private label residential mortgage pass-through certificates with total unrealized losses of $1.6 million, mutual funds and preferred stocks with total unrealized losses of $0.9 million and other securities in unrealized loss positions totaling $0.2 million. At December 31, 2009, securities in significant unrealized loss positions included U.S. Government agency mortgage-backed securities with total unrealized losses of $3.2 million and private-label mortgage-backed securities with total unrealized losses of $9.3 million. All of these securities had been in unrealized loss positions for less than twelve months at September 30, 2010 and at December 31, 2009.
The timely repayment of principal and interest on the U.S. Government agency mortgage-backed securities is either explicitly or implicitly guaranteed by the full faith and credit of the U.S. Government. Management engaged a third party to perform projected cash flow analyses of the private-label mortgage-backed securities, incorporating CUSIP level collateral default rate, voluntary prepayment rate, severity and delinquency assumptions. Based on the results of this analysis, no credit losses were projected. We do not intend to sell these securities and it is more likely than not that we will be able to retain them for a period of time sufficient for recovery in value. Given the expectation of timely repayment of principal and the limited duration and severity of impairment, we concluded that none of the debt securities were other-than-temporarily impaired. Given the results of our analysis of the underlying issuers and the limited duration and severity of impairment, we considered the impairment of the equity securities to be temporary.
As a member institution of the Federal Home Loan Bank of Atlanta, BankUnited is required to own capital stock in the FHLB. No market exists for this stock, and the Bank's investment can be liquidated only through repurchase by the FHLB. During the nine months ended September 30, 2010, $17.4 million of FHLB stock was redeemed at par. The Company monitors its investment in FHLB stock for impairment through review of recent financial results, dividend payment history and information from credit agencies. As of September 30, 2010, management had not identified any indicators of impairment of FHLB stock.
Loan Portfolio
The loan portfolio comprises the Company's primary interest-earning asset. At September 30, 2010 and December 31, 2009, respectively, 95.7% and 98.4% of real estate loans and 91.7% and 97.3% of total loans were Covered Loans. The following table shows the composition of the Company's loan portfolio and the breakdown of the portfolio between Covered ACI Loans, Covered non-ACI Loans and non-Covered Loans at the dates indicated(dollars in thousands):
| | September 30, 2010 | December 31, 2009 | |||||||||||||||||||||||||||||||
|---|---|---|---|---|---|---|---|---|---|---|---|---|---|---|---|---|---|---|---|---|---|---|---|---|---|---|---|---|---|---|---|---|---|
| | Covered Loans | | | | Covered Loans | | | | |||||||||||||||||||||||||
| | ACI | Non- ACI | Non- Covered Loans | Total Loans | % of Total | ACI | Non- ACI | Non- Covered Loans | Total Loans | % of Total | |||||||||||||||||||||||
Real Estate Loans: | |||||||||||||||||||||||||||||||||
1-4 single family residential | $ | 2,765,552 | $ | 160,784 | $ | 71,234 | $ | 2,997,570 | 71.9 | % | $ | 3,306,306 | $ | 184,669 | $ | 43,110 | $ | 3,534,085 | 76.0 | % | |||||||||||||
Home equity loans and lines of credit | 102,320 | 210,451 | 1,693 | 314,464 | 7.5 | % | 113,578 | 215,591 | 1,615 | 330,784 | 7.1 | % | |||||||||||||||||||||
Multi-family | 68,205 | 5,686 | 15,719 | 89,610 | 2.1 | % | 71,321 | 4,971 | 700 | 76,992 | 1.7 | % | |||||||||||||||||||||
Commercial real estate | 317,533 | 36,555 | 73,930 | 428,018 | 10.3 | % | 363,965 | 39,733 | 24,460 | 428,158 | 9.2 | % | |||||||||||||||||||||
Construction | 9,563 | — | 1,348 | 10,911 | 0.3 | % | 44,812 | 377 | — | 45,189 | 1.0 | % | |||||||||||||||||||||
Land | 50,600 | 172 | 1,591 | 52,363 | 1.2 | % | 43,903 | 173 | — | 44,076 | 0.9 | % | |||||||||||||||||||||
Total real estate loans | 3,313,773 | 413,648 | 165,515 | 3,892,936 | 93.3 | % | 3,943,885 | 445,514 | 69,885 | 4,459,284 | 95.9 | % | |||||||||||||||||||||
Other Loans: | |||||||||||||||||||||||||||||||||
Commercial | 59,384 | 35,764 | 175,022 | 270,170 | 6.5 | % | 81,765 | 48,635 | 51,565 | 181,965 | 3.9 | % | |||||||||||||||||||||
Consumer | 4,517 | — | 3,728 | 8,245 | 0.2 | % | 7,065 | — | 3,151 | 10,216 | 0.2 | % | |||||||||||||||||||||
Total other loans | 63,901 | 35,764 | 178,750 | 278,415 | 6.7 | % | 88,830 | 48,635 | 54,716 | 192,181 | 4.1 | % | |||||||||||||||||||||
Total loans | 3,377,674 | 449,412 | 344,265 | 4,171,351 | 100.0 | % | 4,032,715 | 494,149 | 124,601 | 4,651,465 | 100.0 | % | |||||||||||||||||||||
Unearned discounts and deferred fees and costs, net | — | (32,474 | ) | (1,836 | ) | (34,310 | ) | — | (39,986 | ) | 40 | (39,946 | ) | ||||||||||||||||||||
Allowance for loan losses | (37,342 | ) | (16,587 | ) | (3,878 | ) | (57,807 | ) | (20,021 | ) | (1,266 | ) | (1,334 | ) | (22,621 | ) | |||||||||||||||||
Loans, net | $ | 3,340,332 | $ | 400,351 | $ | 338,551 | $ | 4,079,234 | $ | 4,012,694 | $ | 452,897 | $ | 123,307 | $ | 4,588,898 | |||||||||||||||||
Residential Mortgages
The portfolio contains option ARM, "no-doc" or "reduced-doc" and wholesale production loans originated by the Failed Bank prior to the Acquisition. All of these loans are Covered Loans; therefore, the Company's exposure to future losses on these mortgage loans is mitigated by the Loss Sharing Agreements as well as by the fair value basis recorded in these loans resulting from the application of acquisition accounting. Loans secured by residential real estate have consistently represented the majority of the total loan portfolio. The Covered Loan portfolio includes Covered Loans which have been modified by us under the U.S. Treasury Department's Home Affordable Modification Program, or HAMP, or other loan modification programs.
The non-covered residential loan portfolio includes loans originated and purchased post-Acquisition. Subsequent to the Acquisition, we shut down the broker origination channel of the Failed Bank and we launched our retail-focused origination platform at the end of 2009. We currently originate residential mortgage loans with terms ranging from 10 to 40 years, with either fixed or adjustable interest rates, primarily to customers in the state of Florida. Newly originated residential mortgage loans are primarily closed-end first lien loans for the purchase or re-finance of owner occupied property. At September 30, 2010, $22.8 million, or 32.1%, of our non-covered one-to-four single family residential loan portfolio was originated loans. Significantly all of our newly originated residential mortgage loans are not refinancings of Covered Loans.
We have decided to purchase loans to supplement our nascent mortgage origination platform and to geographically diversify our loan portfolio given the current credit environment of the non-agency mortgage market in Florida. At September 30, 2010, $48.4 million, or 67.9%, of our non-covered residential loan portfolio was purchased loans.
One-to-four single family residential mortgages totaled $3.0 billion, or 71.9%, of the portfolio and $3.5 billion, or 76.0%, of the portfolio at September 30, 2010 and December 31, 2009, respectively. The decline in this portfolio segment subsequent to the Acquisition, both in total and as a percentage of loans, is primarily a result of the resolution of Covered Loans and transfers to OREO.
The following table presents a breakdown of the 1-4 single family residential mortgage portfolio categorized between fixed rate and adjustable rate mortgages at the dates indicated(dollars in thousands):
| | At September 30, 2010 | At December 31, 2009 | |||||||||||||||||||||||||
|---|---|---|---|---|---|---|---|---|---|---|---|---|---|---|---|---|---|---|---|---|---|---|---|---|---|---|---|
| | Covered Loans | Non- Covered Loans | Total | % of Total | Covered Loans | Non- Covered Loans | Total | % of Total | |||||||||||||||||||
1-4 single family residential loans: | |||||||||||||||||||||||||||
Fixed rate loans | $ | 745,384 | $ | 55,805 | $ | 801,189 | 26.7 | % | $ | 645,871 | $ | 42,577 | $ | 688,448 | 19.5 | % | |||||||||||
Adjustable rate loans(1) | 2,180,952 | 15,429 | 2,196,381 | 73.3 | % | 2,845,104 | 533 | 2,845,637 | 80.5 | % | |||||||||||||||||
Total 1-4 single family residential loans | $ | 2,926,336 | $ | 71,234 | $ | 2,997,570 | 100 | % | $ | 3,490,975 | $ | 43,110 | $ | 3,534,085 | 100.0 | % | |||||||||||
At September 30, 2010, 57.8%, 7.5%, 5.9% and 5.8% of 1-4 single family residential loans, based on UPB, were to borrowers domiciled in Florida, California, New Jersey and Illinois, respectively. At December 31, 2009, 56.8%, 8.1%, 5.7%, 5.6% and 4.9% of 1-4 single family residential loans, based on UPB, were to borrowers domiciled in Florida, California, Illinois, New Jersey and Arizona, respectively. No other state represented borrowers with more than 4.0% of 1-4 single family residential loans outstanding.
Other Loans
Other loans include commercial real estate, commercial and consumer loans.
Commercial real estate loans include term loans secured by income producing properties including rental apartments, industrial properties, retail shopping centers, office buildings and hotels as well as real estate secured lines of credit and acquisition, development and construction loans. Commercial real estate loans typically have shorter repayment periods and reprice more frequently than 1-4 single family residential loans. The Company's underwriting standards generally provide for loan terms of five years, with amortization schedules of no more than twenty-five years. Loan to value, or LTV, ratios are typically limited to no more than 80%. In addition, the Company usually obtains personal guarantees of the principals as additional security for most commercial real estate loans.
Commercial loans are typically made to growing companies and middle market businesses and include equipment loans, working capital lines of credit, asset-backed loans, acquisition finance credit facilities and Small Business Administration product offerings. These loans may be structured as term loans, typically with maturities of five years or less, or revolving lines of credit which typically mature annually.
Since the Acquisition, management's loan origination strategy has been more heavily focused on the commercial and commercial real estate portfolio segments, which collectively comprise 77.7% of loans originated or purchased since the Acquisition as of September 30, 2010. In addition, significantly all of our newly originated loans are not refinancings of Covered Loans.
Consumer loans include home equity loans and lines of credit, loans secured by certificates of deposit, auto loans, demand deposit account overdrafts and unsecured personal lines of credit.
The following table sets forth, as of December 31, 2009, the anticipated repayments of our loan portfolio by category, based on UPB. Anticipated repayments are based on contractual maturities adjusted for an estimated rate of prepayments and defaults based on historical trends, current interest rates, types of loans and refinance patterns(dollars in thousands):
| | Due in | ||||||||||||||
|---|---|---|---|---|---|---|---|---|---|---|---|---|---|---|---|
| | One Year or Less | After One Through Five Years | After Five Years | Total | |||||||||||
Real Estate Loans: | |||||||||||||||
1-4 single family residential | $ | 806,914 | $ | 4,717,856 | $ | 2,679,762 | $ | 8,204,532 | |||||||
Home equity loans and lines of credit | 56,089 | 182,646 | 232,887 | 471,622 | |||||||||||
Multi-family | 24,804 | 42,042 | 43,877 | 110,723 | |||||||||||
Commercial real estate | 64,066 | 207,925 | 312,032 | 584,023 | |||||||||||
Construction | 36,641 | 62,721 | 10,472 | 109,834 | |||||||||||
Land | 34,887 | 66,815 | 10,614 | 112,316 | |||||||||||
Total real estate loans | 1,023,401 | 5,280,005 | 3,289,644 | 9,593,050 | |||||||||||
Other Loans: | |||||||||||||||
Commercial | 46,188 | 93,007 | 65,333 | 204,528 | |||||||||||
Consumer | 8,016 | 4,297 | 258 | 12,571 | |||||||||||
Total other loans | 54,204 | 97,304 | 65,591 | 217,099 | |||||||||||
Total loans | $ | 1,077,605 | $ | 5,377,309 | $ | 3,355,235 | $ | 9,810,149 | |||||||
The following table shows the distribution of UPB of those loans that mature in more than one year between fixed and adjustable interest rate loans as of December 31, 2009(dollars in thousands):
| | Interest Rate Type | | ||||||||||
|---|---|---|---|---|---|---|---|---|---|---|---|---|
| | Fixed | Adjustable | Total | |||||||||
Real Estate Loans: | ||||||||||||
1-4 single family residential | $ | 1,110,980 | $ | 6,286,637 | $ | 7,397,617 | ||||||
Home equity loans and lines of credit | 56,268 | 359,265 | 415,533 | |||||||||
Multi-family | 19,845 | 66,074 | 85,919 | |||||||||
Commercial real estate | 243,138 | 276,818 | 519,956 | |||||||||
Construction | 4,982 | 68,212 | 73,194 | |||||||||
Land | 2,162 | 75,267 | 77,429 | |||||||||
Total real estate loans | 1,437,375 | 7,132,273 | 8,569,648 | |||||||||
Other Loans: | ||||||||||||
Commercial | 41,262 | 117,078 | 158,340 | |||||||||
Consumer | 4,384 | 172 | 4,556 | |||||||||
Total other loans | 45,646 | 117,250 | 162,896 | |||||||||
Total loans | $ | 1,483,021 | $ | 7,249,523 | $ | 8,732,544 | ||||||
Asset Quality
We recognize that developing and maintaining a strong credit culture is paramount to the success of the Company. We have established a credit risk management framework and put in place an experienced team to lead the workout and recovery process for the commercial and commercial real estate portfolios. We have also implemented a dedicated internal loan review function that reports directly to our Audit Committee. We have an experienced resolution team in place for covered residential mortgage loans, and have implemented outsourcing arrangements with industry leading firms in certain areas such as OREO resolution.
Loan performance is monitored by our credit, workout and recovery and loan review departments. Commercial and commercial real estate loans are regularly reviewed by our internal loan review department. The Company utilizes an asset risk classification system as part of its efforts to monitor and improve commercial asset quality. Borrowers with credit weaknesses that may jeopardize collectability will likely demonstrate one or more of the following: payment defaults, frequent overdrafts, operating losses, increasing balance sheet leverage, inadequate cash flow, project cost over-runs, unreasonable construction delays, exhausted interest reserves, past due real estate taxes or declining collateral values. Generally, a loan with one or more of these identified weaknesses will be classified substandard. Loans that have credit weaknesses that render collection or liquidation in full highly questionable or improbable based on current circumstances are classified doubtful. Loans exhibiting potential credit weaknesses that deserve management's close attention and that if left uncorrected may result in deterioration of the repayment capacity of the borrower are categorized as special mention.
Non-Covered Loans
At September 30, 2010, six non-covered commercial loans aggregating $6.8 million were rated special mention and three non-covered commercial loans aggregating $0.7 million were classified substandard. At December 31, 2009, no non-covered commercial loans were rated special mention and none were adversely classified.
At September 30, 2010, one non-covered residential loan with a principal balance of $0.4 million was delinquent greater than 30 days. There were no delinquent non-covered home equity loans at September 30, 2010. There were no delinquencies in the non-covered residential mortgage or home equity loan portfolios as of December 31, 2009.
The majority of our non-covered residential mortgage portfolio consists of purchased loans. The credit parameters for purchasing loans are similar to the underwriting guidelines in place for our mortgage origination platform. For purchasing seasoned loans, good payment history is needed. In general, we purchase performing jumbo mortgage pools which have average FICO scores above 700, primarily are owner-occupied and full documentation, and have a current LTV less than 80%. We perform due diligence on the purchased loans for credit, compliance, counterparty, payment history and property valuation.
At September 30, 2010, the purchased loan portfolio had the following characteristics: 73.1% were fixed rate loans, 86.5% were full documentation and had an average FICO score of 771 and average LTV of 74.8.74.8%. The majority of this portfolio was owner-occupied, with 79.7% primary residence and 20.3% second homes. In terms of vintage, 11.1% of the portfolio was originated in 2007, 83.3% in 2008 and 5.5% in 2009.
Similarly, the originated loan portfolio had the following characteristics at September 30, 2010: 89.5% were fixed rate loans, 100% were full documentation and had an average FICO score of 777 and average LTV of 61.1.61.1%. The majority of this portfolio was owner-occupied, with 95.2% primary residence,
residence, 4.4% second home and 0.4% investment properties. In terms of vintage, 22.9% of the portfolio was originated in 2009 and 77.1% in 2010.
Delinquent consumer loans in the originated portfolio were insignificant as of September 30, 2010 and December 31, 2009.
Covered Loans
Covered Loans consist of both ACI loans and non-ACI loans. At September 30, 2010, ACI loans totaled $3.4 billion and non-ACI loans totaled $0.4 billion. Covered 1-4 single family residential loans were placed into homogenous pools at Acquisition and the ongoing credit quality and performance of these loans is monitored on a pool basis. At Acquisition, the fair value of the pools was measured based on the expected cash flows to be derived from each pool. Initial cash flow expectations incorporated significant assumptions regarding prepayment rates, frequency of default and loss severity. For ACI pools, the difference between total contractual payments due and the cash flows expected to be received at Acquisition was recognized as non-accretable difference. The excess of expected cash flows over the recorded fair value of each ACI pool at Acquisition, known as the accretable yield, is being recognized as interest income over the life of each pool. We monitor the pools quarterly to determine whether any material changes have occurred in expected cash flows that would be indicative of impairment or necessitate reclassification between non-accretable difference and accretable yield. Generally, improvements in expected cash flows less than 2% of the UPB of a pool are not recorded. This initial threshold may be revised as we gain greater experience. Generally, commercial and commercial real estate loans are monitored individually due to their size and other unique characteristics.
Residential mortgage loans, including home equity loans, comprised 87.8% of the UPB of the acquired loan portfolio at the Acquisition date. We performed a detailed analysis of the portfolio to determine the key loan characteristics influencing performance. Key characteristics influencing the performance of the residential mortgage portfolio, including home equity loans, were determined to be delinquency status; product type, in particular, amortizing as opposed to option ARM products; current indexed LTV ratio; and original FICO score. The ACI loans in the residential mortgage portfolio were grouped into ten homogenous static pools based on these characteristics, and the non-ACI residential loans were grouped into two homogenous static pools. There were other variables which we initially expected to have a significant influence on performance and which were considered in our analysis; however, the results of our analysis demonstrated that their impact was less significant after controlling for current indexed LTV, product type, and FICO score. Therefore, these additional factors were not used in grouping the covered residential loans into pools and are not used in monitoring ongoing asset quality of the pools. The factors we considered but determined not to be significant included the level and type of documentation required at origination, i.e., whether a loan was originated under full documentation, reduced documentation, or no documentation programs; occupancy, defined as owner occupied vs. non-owner occupied collateral properties; geography; and vintage, i.e., year of origination.
1-4 single family residential non-ACI loans had an aggregate UPB of $212.8 million as of May 21, 2009. As of September 30, 2010, 31.9% of the UPB had been repaid, demonstrating the intent and ability of borrowers in this group to satisfy their mortgage obligations.
At September 30, 2010, 29.5% of the total UPB of the covered 1-4 single family residential loans was contractually delinquent by 60 days or more. However, future losses to the Company related to these loans are significantly mitigated by the Loss Sharing Agreements with the FDIC.
Covered home equity loans and lines of credit had a carrying amount of $312.8 million at September 30, 2010, including ACI loans of $102.3 million and non-ACI loans of $210.5 million. At September 30, 2010, 10.4% of covered home equity loans and lines of credit were 60 days or more contractually delinquent. Of the ACI home equity portfolio, 15.6% was 60 days or more contractually
delinquent while 4.8% of the non-ACI portfolio was 60 days or more delinquent. Losses related to these loans are significantly mitigated by the Loss Sharing Agreements.
Commercial and other Covered Loans were stratified at Acquisition based primarily on product/collateral type and delinquency status. Ongoing asset quality of significant commercial and commercial real estate loans is monitored on an individual basis through the Company's regular credit review and risk rating process. Homogenous groups of smaller balance commercial and consumer loans are monitored collectively.
Non-ACI commercial and other loans had an aggregate UPB of $48.6 million at December 31, 2009. At September 30, 2010, non-ACI commercial and other loans had an aggregate UPB of $35.8 million. The majority of these loans were rated "pass" or "good" at September 30, 2010 and December 31, 2009 and the portfolio segment has limited delinquency history. At September 30, 2010, 25 loans totaling $11.7 million were rated special mention and 35 loans totaling $3.2 million were rated substandard.
Impaired Loans and Non-Performing Assets
Non-performing assets consist of (i) non-accrual loans, including loans that have been restructured and placed on nonaccrual status because of deterioration in the financial condition of the borrower, (ii) accruing loans that are more than 90 days contractually past due as to interest or principal, excluding ACI loans, and (iii) OREO. Impaired loans also include ACI loans for which expected cash flows have been revised downward since Acquisition. Because of discount accretion, these loans have not been classified as nonaccrual loans and we do not consider them to be non-performing assets. As of September 30, 2010 and December 31, 2009, substantially all of the nonaccrual loans and all of the OREO are Covered Assets. One commercial loan originated since the Acquisition with a balance of approximately $34,000 was on nonaccrual status at September 30, 2010. There are no other loans originated since the Acquisition that fall within these categories. The Company's exposure to loss related to Covered Assets is significantly mitigated by the Loss Sharing Agreements with the FDIC and by the fair value basis recorded in these loans resulting from the application of acquisition accounting.
The following table summarizes the Company's impaired loans and other non-performing assets at the dates indicated(dollars in thousands):
| | At September 30, 2010 | At December 31, 2009 | |||||||||
|---|---|---|---|---|---|---|---|---|---|---|---|
Nonaccrual loans | |||||||||||
Real estate loans: | |||||||||||
1-4 single family residential | $ | 13,895 | $ | 14,495 | |||||||
Home equity loans and lines of credit | 9,496 | 2,726 | |||||||||
Multi-family | 377 | — | |||||||||
Commercial real estate | 2,170 | — | |||||||||
Construction | — | — | |||||||||
Land | — | — | |||||||||
Total real estate loans | 25,938 | 17,221 | |||||||||
Other loans: | |||||||||||
Commercial | 2,086 | 150 | |||||||||
Consumer | — | — | |||||||||
Total other loans | 2,086 | 150 | |||||||||
Total nonaccrual loans | 28,024 | 17,371 | |||||||||
Accruing non-ACI and non-Covered Loans 90 days or more past due | — | — | |||||||||
Total non-performing loans | 28,024 | 17,371 | |||||||||
OREO | 194,286 | 120,110 | |||||||||
Total non-performing assets | 222,310 | 137,481 | |||||||||
Impaired ACI loans on accrual status | 319,585 | 567,253 | |||||||||
Total impaired loans and non-performing assets | $ | 541,895 | $ | 704,734 | |||||||
Non-performing loans to total loans(1) | 0.68 | % | 0.38 | % | |||||||
Non-performing assets to total assets | 1.99 | % | 1.24 | % | |||||||
Allowance for loan losses to total loans(1) | 1.40 | % | 0.49 | % | |||||||
Allowance for loan losses to non-performing loans | 206.28 | % | 130.22 | % | |||||||
At September 30, 2010 and December 31, 2009, substantially all of the nonaccrual loans consist of non-ACI loans that have been placed on nonaccrual status. Contractually delinquent ACI loans are not reflected as nonaccrual loans because the discount continues to be accreted. Discount accretion continues to be recorded as there continues to be an expectation of future cash flows from these loans. The carrying value of ACI loans contractually delinquent by more than 90 days but not identified as impaired was $0.9 billion and $1.2 billion at September 30, 2010 and December 31, 2009, respectively. These loans have not been identified as impaired because there has been no significant deterioration in expected cash flows since the date of acquisition.
Non-performing assets reported for the post-Acquisition periods are substantially lower than non-performing assets for the pre-Acquisition periods primarily due to the recording of these assets at their fair value in conjunction with the application of acquisition accounting and the fact that ACI loans are no longer reflected as nonaccrual loans as discussed above. The lower ratio of the allowance for loan losses to total loans at dates subsequent to the Acquisition is a direct result of the fact that no allowance was initially recorded with respect to the acquired loans. Rather, the estimated fair value at
which these loans were initially recorded incorporated significant assumptions related to credit quality and default probabilities. Due to the foregoing factors, the ratios presented in the table above may lack comparability to those of our peers.
Except for ACI loans, loans are placed on nonaccrual status when (i) management has determined that full payment of all contractual principal and interest is in doubt, or (ii) the loan is past due 90 days or more as to principal and/or interest, unless the loan is well-secured and in the process of collection. Residential and consumer loans not accounted for in pools are returned to accrual status as of the date the loan is no longer delinquent in excess of 90 days and ultimate collectability is assured. Commercial real estate and commercial loans are returned to accruing status only after all past due principal and interest have been collected. Except for ACI loans accounted for in pools, loans that are the subject of troubled debt restructurings are placed on nonaccrual status at the time of the modification unless the borrower has no history of missed payments for six months prior to the restructuring. If borrowers perform pursuant to the modified loan terms for at least six months and the remaining loan balances are considered collectable, the loans are returned to accrual status. Interest income foregone on nonaccrual loans amounted to $0.6 million for the nine months ending September 30, 2010 and to $0.6 million for period ending December 31, 2009. Interest income reversed due to loans being placed on nonaccrual status amounted to $183,656 and $76,969 for the nine months ending September 30, 2010 and period ending December 31, 2009, respectively.
A loan modification is considered a troubled debt restructuring if the Company, for economic or legal reasons related to the borrower's financial difficulties, grants a concession to the borrower that the Company would not otherwise grant. These concessions may take the form of temporarily or permanently reduced interest rates, payment abatement periods, extensions of maturity, or in some cases, partial forgiveness of principal. Under generally accepted accounting principles, modified ACI loans accounted for in pools are not considered troubled debt restructurings and are not separated from their respective pools when modified. As of September 30, 2010, there were no ACI loans not accounted for in pools, non-ACI loans, or non-Covered Loans that were the subject of troubled debt restructurings.
Commercial and commercial real estate loans are charged off when, in management's judgment, the carrying amount of the loan is not collectible. Residential real estate loans and secured consumer loans are typically charged off when they become 120 to 180 days past due, depending on the collateral type. Secured loans may be written down to the fair value of the collateral less estimated disposition costs. Unsecured consumer loans are generally charged off when they become 90 days past due. Home equity loans and lines of credit are fully reserved for when they become 120 days past due, and generally fully charged off when they are 180 days past due.
Loss Mitigation Strategies
Although our exposure to loss on Covered Assets is mitigated by the Loss Sharing Agreements, we have implemented strategies designed to minimize losses on these assets. We have increased the quality and experience level of our workout and recovery and mortgage servicing departments. We evaluate each ACI loan to determine the most effective loss mitigation strategy, which may be modification, short sale, or foreclosure. In 2009, we began loan modifications under HAMP for eligible borrowers in the residential ACI portfolio. HAMP is a uniform loan modification process that provides eligible borrowers with sustainable monthly mortgage payments equal to a target 31% of their gross monthly income. As of September 30, 2010, 8,860 borrowers had been counseled regarding their participation in HAMP; 6,761 of those borrowers were initially determined to be potentially eligible for loan modifications under the program. As of September 30, 2010, 1,471 borrowers who did not elect to participate in the program had been sent termination letters and 2,313 borrowers had been denied due to ineligibility. At September 30, 2010, there were 1,878 permanent loan modifications and 225 active trial modifications.
Other Real Estate Owned
All of the OREO properties owned by the Company are Covered Assets. The following table presents the changes in OREO for the nine months ending September 30, 2010 and period ending December 31, 2009(dollars in thousands):
| | At September 30, 2010 | At December 31, 2009 | ||||||
|---|---|---|---|---|---|---|---|---|
Balance at beginning of period | $ | 120,110 | $ | 177,679 | ||||
Transfers from the loan portfolio | 283,220 | 115,192 | ||||||
Sales | (194,903 | ) | (177,408 | ) | ||||
Impairment loss recognized | (12,164 | ) | (21,055 | ) | ||||
Income (loss) from resolution of Covered Loans, net | (1,977 | ) | 25,702 | |||||
Balance at end of period | $ | 194,286 | $ | 120,110 | ||||
Analysis of the Allowance for Loan Losses
The allowance for loan losses at dates subsequent to the Acquisition relates to (i) loans originated or purchased since the Acquisition, (ii) estimated additional losses arising on non-ACI loans subsequent to the Acquisition, and (iii) additional impairment recognized as a result of decreases in expected cash flows on ACI loans due to further credit deterioration. The impact of any additional provision for losses on Covered Loans is significantly mitigated by an increase in the FDIC indemnification asset.
Non-Covered and non-ACI Loans
Based on an analysis of historical performance of the non-ACI residential mortgage and home equity portfolio, OREO and short sale losses and recent trending data, we have concluded that changes in LTV ratios and FICO scores are the leading indicators of performance for this portfolio. The non-ACI residential mortgage portfolio has therefore been divided into homogenous pools based on LTV and FICO score for purposes of calculating the allowance for loan losses. Calculated frequency of roll to loss and severity percentages are applied to the dollar value of loans in each pool to calculate an overall loss allowance. FICO scores are refreshed quarterly and LTV ratios are updated using the Case-Shiller quarterly MSA Home Price Index to adjust the original appraised value of the underlying collateral. Frequency is calculated for each pool using a four month roll to loss percentage, based on the assumption that if an event has occurred with a borrower that will ultimately result in a loss, this will manifest itself as a loan in default and in process of foreclosure within four months. Loss severity given default is estimated based on internal data about OREO sales and short sales from the portfolio.
Due to the lack of similarity between the risk characteristics of non-Covered Loans and Covered Loans in the residential and home equity loan portfolios, management does not believe it is appropriate to use the historical performance of the Failed Bank's residential mortgage portfolio as a basis for calculating the allowance for loan losses applicable to non-Covered Loans. The portfolio of loans originated and purchased since the Acquisition is not seasoned and has not yet developed an observable loss trend. Therefore, the allowance for loan losses for non-covered residential loans is based primarily on management's assessment of the risk of default and on the OTS "Thrift Industry Charge-Off Rates by Asset Type, annualized Net Charge-Off Rates—Twelve Quarter Average" for the southeast region (the "OTS Charge-Off Rates"). We believe use of the twelve quarter average to be appropriate for this portfolio since it takes into account periods of both economic growth and serious economic contraction.
The allowance for non-covered and non-ACI commercial loans is based primarily on the Bank's internal credit risk rating system, the OTS Charge-Off Rates, and management's assessment of portfolio
risk characteristics. The allowance is comprised of specific reserves for significant and classified loans that are individually evaluated and determined to be impaired as well as general reserves for individually evaluated loans determined not to be impaired and smaller balance, non-classified loans. For all commercial and commercial real estate exposures graded substandard or doubtful with committed credit facilities greater than or equal to $1,000,000, a quarterly net realizable value analysis is prepared by the credit, workout and recovery and loan review departments. This analysis forms the basis for specific reserves. Since the originated portfolio is not yet seasoned enough to exhibit a loss trend and the non-ACI portfolio has limited delinquency statistics, we currently use the OTS Charge-Off Rates and management's assessment of risk characteristics by portfolio segment in determining the appropriate general reserve percentages. We believe that loans rated special mention or substandard that are not determined to be individually impaired exhibit characteristics indicative of a heightened level of credit risk. Management may therefore augment general reserve percentages for loans in these categories.
Since the non-covered portfolio is not yet seasoned enough to exhibit a loss trend, the allowance for non-covered and non-ACI consumer loans is based primarily on the OTS Charge-Off Rates and management's assessment of portfolio risk characteristics. We provide a 100% reserve for consumer loans more than 120 days past due and charge them off after 270 days.
In addition to the quantitative calculations described above, a dollar value adjustment is made to the allowance for relevant qualitative factors when there is a material observable trend in those factors not already taken into account in the quantitative calculations. Qualitative factors that may result in an adjustment to the allowance include: levels of and trends in delinquencies and impaired loans; levels of and trends in recoveries of prior charge-offs; trends in volume, type and terms of loans; effects of changes in lending policies and procedures; experience, ability and depth of lending management, loan review and workout and recovery staff; credit concentrations; national, regional and local economic trends; housing and banking industry conditions and trends; emerging trends for particular loan types; and strategic initiatives of the Company that may impact loan performance.
For non-ACI loans, the allowance is calculated based on UPB. The total of UPB, less the calculated allowance, is then compared to the carrying amount of the loans. If the calculated balance net of the allowance is less than the carrying amount, an additional allowance is established. Any such increase in the allowance for non-ACI loans will result in a corresponding increase in the FDIC indemnification asset. For the nine months ended September 30, 2010 and period ended December 31, 2009, we recorded a provision for non-ACI loans of $15.6 million and $1.3 million, respectively.
ACI Loans
For ACI loans, a valuation allowance is established when periodic evaluations of expected cash flows reflect a decrease from the level of cash flows that were estimated to be collected at Acquisition plus any additional expected cash flows arising from revisions in those estimates. We perform a quarterly analysis of expected cash flows for ACI loans.
The analysis of expected cash flows for residential ACI pools incorporates updated pool level expected prepayment rates, default rates, and delinquency levels, and loan level loss severity given default assumptions. Prepayment, delinquency and default curves used for this purpose are derived from roll rates generated from the historical performance of the ACI residential loan portfolio observed over the immediately preceding four quarters. Given the static nature of the pools and unique characteristics of the loans, we believe that regularly updated historical information from the Company's own portfolio is the best available indicator of future performance. Estimates of default probability and severity of loss given default also incorporate updated LTV ratios. Historic and projected values for the Case-Shiller Home Price Index for the relevant MSA are utilized at the individual loan level to project current and future property values. Costs and fees represent an
additional component of loss on default, and are projected using the "Making Home Affordable" cost factors provided by the Federal government.
Our analysis at December 31, 2009 indicated a decrease in expected cash flows due to credit related assumptions related to two ACI residential mortgage pools; therefore, a provision for loan losses of $20.0 million was recorded, along with a corresponding increase in the FDIC indemnification asset of $14.4 million. As of September 30, 2010, our analysis evidenced a significant improvement in expected cash flows related to these two ACI residential pools and an offsetting decrease in expected cash flows due to credit related assumptions related to the ACI home equity loan pool. As a result, the $20.0 million allowance established at December 31, 2009 related to ACI residential pools, along with the increase in the FDIC indemnification asset of $14.4 million, was reversed and a provision for loan losses of $9.4 million, along with a corresponding increase in the FDIC indemnification asset of $6.6 million, was recorded related to the pooled home equity ACI loans during the nine months ending September 30, 2010.
The primary assumptions underlying estimates of expected cash flows for commercial and other loans are default probability and severity of loss given default. Updated assumptions for large balance and delinquent loans in the commercial and commercial real estate ACI portfolios are based on net realizable value analyses prepared at the individual loan level by the Company's workout and recovery department. Updated assumptions for smaller balance commercial loans are based on a combination of the Company's own historical delinquency data and industry level delinquency data. Delinquency data is used as a proxy for defaults as the Company's experience has been that few of these loans return to performing status after being delinquent greater than 60 days. An additional multiplier is also applied in developing assumptions for loans rated special mention, substandard, or doubtful based on the Company's historical loss experience with classified loans. Cash flow estimates for consumer loan pools are based primarily on regularly updated historical performance information.
For the period ended December 31, 2009, there were no decreases in expected cash flows for commercial and other ACI loans; therefore, no allowance for loan losses was provided related to these loans. For the nine months ended September 30, 2010, our analysis indicated a decrease in expected cash flows from certain ACI commercial and commercial real estate loans evaluated individually for credit impairment, resulting in a provision for loan losses of $37.5 million related to these ACI loans. An increase in the FDIC indemnification asset of $19.3 million was recorded related to this provision.
In the aggregate, the provision for losses related to ACI loans was $27.0 million for the nine months ended September 30, 2010, comprised of the $20.0 million reversal and the provisions of $9.4 million and $37.5 million discussed above.
The following table provides an analysis of the allowance for loan losses, provision for loan losses, and net charge-offs for the periods indicated(dollars in thousands):
| | Nine Months Ended September 30, 2010 | Period from May 22, 2009 to December 31, 2009 | ||||||||
|---|---|---|---|---|---|---|---|---|---|---|
Allowance for loan losses, beginning of period | $ | 22,621 | $ | — | ||||||
Provision for loan losses: | ||||||||||
Provision for losses on Covered ACI Loans | 26,973 | 20,021 | ||||||||
Provision for losses on Covered non-ACI Loans | 15,565 | 1,266 | ||||||||
Provision for losses on non-Covered Loans | 2,619 | 1,334 | ||||||||
Total provision for loan losses | 45,157 | 22,621 | ||||||||
Charge-offs: | ||||||||||
1-4 single family residential | — | — | ||||||||
Home equity loans and lines of credit | — | — | ||||||||
Multi-family | (1,248 | ) | — | |||||||
Commercial real estate | (962 | ) | — | |||||||
Construction | (3,500 | ) | — | |||||||
Land | (3,004 | ) | — | |||||||
Commercial | (1,042 | ) | — | |||||||
Consumer | (215 | ) | — | |||||||
Total charge-offs | (9,971 | ) | — | |||||||
Total recoveries | — | — | ||||||||
Net charge-offs | (9,971 | ) | — | |||||||
Allowance for loan losses, end of period | $ | 57,807 | $ | 22,621 | ||||||
Increase in the indemnification asset related to the provision for loan losses on Covered Loans | $ | 22,979 | $ | 14,433 | ||||||
Ratio of net charge-offs to average loans receivable outstanding during the period(1) | 0.31 | % | 0.00 | % | ||||||
The following table shows the distribution of the allowance for loan losses, broken out between Covered and non-Covered Loans, as of September 30, 2010 and December 31, 2009(dollars in thousands):
| | At September 30, 2010 | At December 31, 2009 | |||||||||||||||||||||||||||||
|---|---|---|---|---|---|---|---|---|---|---|---|---|---|---|---|---|---|---|---|---|---|---|---|---|---|---|---|---|---|---|---|
| | Covered | | | | Covered | | | | |||||||||||||||||||||||
| | Non- Covered | | | Non- Covered | | | |||||||||||||||||||||||||
| | ACI | Non-ACI | Total | %(1) | ACI | Non-ACI | Total | %(1) | |||||||||||||||||||||||
1-4 single family residential | $ | — | $ | 473 | $ | 107 | $ | 580 | 71.9 | % | $ | 20,021 | $ | 119 | $ | 65 | $ | 20,205 | 76.0 | % | |||||||||||
Home equity loans and lines of credit | 9,421 | 11,659 | 3 | 21,083 | 7.5 | % | — | 11 | 4 | 15 | 7.1 | % | |||||||||||||||||||
Multi-family | 3,650 | 652 | 260 | 4,562 | 2.1 | % | — | 60 | 11 | 71 | 1.7 | % | |||||||||||||||||||
Commercial real estate | 15,000 | 800 | 651 | 16,451 | 10.3 | % | — | 465 | 303 | 768 | 9.2 | % | |||||||||||||||||||
Construction | — | — | 15 | 15 | 0.3 | % | — | 5 | — | 5 | 1.0 | % | |||||||||||||||||||
Land | 5,923 | 26 | 76 | 6,025 | 1.2 | % | — | 2 | — | 2 | 0.9 | % | |||||||||||||||||||
Commercial | 3,348 | 1,170 | 2,737 | 7,255 | 6.5 | % | — | 604 | 905 | 1,509 | 3.9 | % | |||||||||||||||||||
Consumer | — | — | 29 | 29 | 0.2 | % | — | — | 46 | 46 | 0.2 | % | |||||||||||||||||||
Unallocated | — | 1,807 | — | 1,807 | — | — | — | — | — | — | |||||||||||||||||||||
Total allowance for loan losses | $ | 37,342 | $ | 16,587 | $ | 3,878 | $ | 57,807 | 100.0 | % | $ | 20,021 | $ | 1,266 | $ | 1,334 | $ | 22,621 | 100.0 | % | |||||||||||
Goodwill and Other Intangible Assets
In conjunction with the Acquisition, the Company recognized approximately $59.4 million of goodwill and a $1.8 million core deposit intangible. Goodwill was assigned to BankUnited. The Company performs goodwill impairment testing in the third quarter of each fiscal year or more frequently if events or circumstances indicate that impairment may exist. As of the third quarter of 2010 impairment testing date, the estimated fair value of the reporting unit exceeded its carrying amount; therefore, no impairment was indicated.
Other Assets
Other assets declined subsequent to the Acquisition primarily due to declines in escrow advances, mortgage insurance receivable and accrued interest receivable resulting from including these assets in the valuation of loans acquired in the application of acquisition accounting and the revaluation of furniture, fixtures and equipment in conjunction with the Acquisition. The increase in other assets from December 31, 2009 to September 30, 2010 was primarily attributable to an increase in accrued interest receivable related to growth in the investment and originated loan portfolios.
Deposits
The following table presents information about our deposits for the periods indicated(dollars in thousands):
| | Nine Months Ended September 30, 2010 | Period from May 22, 2009 to December 31, 2009 | |||||||||||||
|---|---|---|---|---|---|---|---|---|---|---|---|---|---|---|---|
| | Average Balance | Average Rate Paid | Average Balance | Average Rate Paid | |||||||||||
Demand deposits: | |||||||||||||||
Non-interest bearing | $ | 414,350 | — | % | $ | 303,810 | — | % | |||||||
Interest bearing | 253,830 | 0.75 | % | 183,416 | 0.79 | % | |||||||||
Savings and money market | 2,808,277 | 1.26 | % | 2,153,446 | 1.94 | % | |||||||||
Time deposits | 4,068,348 | 1.83 | % | 5,506,320 | 0.93 | % | |||||||||
Total deposits | $ | 7,544,805 | 1.48 | % | $ | 8,146,992 | 1.16 | % | |||||||
Excluding the impact of accretion from fair value adjustments due to acquisition accounting, the average rate paid on interest bearing deposits for the nine months ended September 30, 2010 and period ended December 31, 2009 was 1.92% and 2.77%, respectively.
The following table shows scheduled maturities of certificates of deposit with denominations greater than or equal to $100,000 as of September 30, 2010 and December 31, 2009(dollars in thousands):
| | At September 30, 2010 | At December 31, 2009 | ||||||
|---|---|---|---|---|---|---|---|---|
Three months or less | $ | 332,878 | $ | 415,049 | ||||
Over three through six months | 337,908 | 394,805 | ||||||
Over six through twelve months | 430,757 | 684,966 | ||||||
Over twelve months | 395,610 | 411,347 | ||||||
Total | $ | 1,497,153 | $ | 1,906,167 | ||||
Borrowed Funds
The following table sets forth information regarding our short-term borrowings, consisting of securities sold under agreements to repurchase, as of the dates, and for the periods, indicated(dollars in thousands):
| | | | | Yearly Weighted Averages | ||||||||||||
|---|---|---|---|---|---|---|---|---|---|---|---|---|---|---|---|---|
| | Ending Balance | Weighted Average Rate | Maximum Amount At Month-End | |||||||||||||
| | Balance | Rate | ||||||||||||||
For the nine months ended September 30, 2010 | $ | 386 | 0.08 | % | $ | 17,459 | $ | 10,358 | 0.93 | % | ||||||
For the period from May 22, 2009 to December 31, 2009 | $ | 2,972 | 0.01 | % | $ | 2,972 | $ | 2,091 | 0.02 | % | ||||||
The Company also utilizes FHLB advances to finance its operations. FHLB advances are secured by stock in the FHLB required to be purchased in proportion to outstanding advances and qualifying first mortgage, commercial real estate, and home equity loans and mortgage-backed securities. The contractual balance of FHLB advances at September 30, 2010 totaled $2.2 billion, with $1.1 billion, $565.0 million, $505.0 million and $0.4 million maturing in 2012, 2013, 2014 and 2015, respectively. The book value of outstanding FHLB advances decreased from $4.6 billion at Acquisition to $2.1 billion at December 31, 2009 and $2.3 billion at September 30, 2010 primarily due to repayment of outstanding advances with cash received in the Acquisition.
As discussed previously in this "Management's Discussion and Analysis of Financial Condition and Results of Operations," financial information of the Failed Bank for the pre-Acquisition periods lacks direct comparability in many respects to financial information of the Company presented for the post-Acquisition periods.
Results of Operations for the Pre-Acquisition Periods
The Failed Bank reported net losses of $(1.2) billion and $(858.4) million for the period from October 1, 2008 through May 21, 2009 and for the fiscal year ending September 30, 2008, or fiscal 2008, respectively, and net income of $109.5 million for the fiscal year ending September 30, 2007, or fiscal 2007. The net losses for the period ending May 21, 2009 and the fiscal year ending September 30, 2008 resulted primarily from severe deterioration in the Failed Bank's asset quality and the resultant reduction in net interest income, increase in the provision for loan losses, and impairment charges related to investment securities, OREO and mortgage servicing rights.
Net Interest Income
The following table presents, for the periods indicated, information about: (i) average balances, the total dollar amount of interest income from earning assets and the resultant average yields; (ii) average balances, the total dollar amount of interest expense on interest bearing liabilities and the resultant average rates; (iii) net interest income; (iv) the interest rate spread; and (v) the net interest margin. Average balance information is based on daily average balances for the periods indicated. Nonaccrual and restructured loans are included in the average balances presented in this table; however, interest income foregone on nonaccrual loans is not included. Yields have been calculated on a pre-tax basis(dollars in thousands):
| | | | | Fiscal Years Ended September 30, | |||||||||||||||||||||||||
|---|---|---|---|---|---|---|---|---|---|---|---|---|---|---|---|---|---|---|---|---|---|---|---|---|---|---|---|---|---|
| | Period from October 1, 2008 to May 21, 2009 | ||||||||||||||||||||||||||||
| | 2008 | 2007 | |||||||||||||||||||||||||||
| | Average Balance | Interest | Yield/ Rate(1) | Average Balance | Interest | Yield/ Rate | Average Balance | Interest | Yield/ Rate | ||||||||||||||||||||
Assets: | |||||||||||||||||||||||||||||
Interest earning assets: | |||||||||||||||||||||||||||||
Investment securities available for sale | $ | 88,655 | $ | 1,685 | 2.97 | % | $ | 141,935 | $ | 7,417 | 5.23 | % | $ | 221,919 | $ | 10,614 | 4.78 | % | |||||||||||
Mortgage-backed securities | 576,131 | 20,722 | 5.63 | % | 780,279 | 43,017 | 5.51 | % | 1,068,811 | 50,711 | 4.74 | % | |||||||||||||||||
Total investment securities available for sale | 664,786 | 22,407 | 5.28 | % | 922,214 | 50,434 | 5.47 | % | 1,290,730 | 61,325 | 4.75 | % | |||||||||||||||||
Other interest earning assets | 1,325,075 | 3,667 | 0.43 | % | 630,204 | 21,856 | 3.47 | % | 339,315 | 19,711 | 5.81 | % | |||||||||||||||||
Loans receivable | 11,596,788 | 312,994 | 4.22 | % | 12,564,903 | 762,170 | 6.07 | % | 12,133,858 | 876,861 | 7.23 | % | |||||||||||||||||
Total interest earning assets | 13,586,649 | 339,068 | 3.91 | % | 14,117,321 | 834,460 | 5.91 | % | 13,763,903 | 957,897 | 6.96 | % | |||||||||||||||||
Allowance for loan losses | (905,440 | ) | (184,884 | ) | (41,510 | ) | |||||||||||||||||||||||
Noninterest earning assets | 869,381 | 510,000 | 372,661 | ||||||||||||||||||||||||||
Total assets | $ | 13,550,590 | $ | 14,442,437 | $ | 14,095,054 | |||||||||||||||||||||||
Liabilities and Equity: | |||||||||||||||||||||||||||||
Interest bearing liabilities: | |||||||||||||||||||||||||||||
Interest bearing deposits: | |||||||||||||||||||||||||||||
Interest bearing demand | $ | 164,669 | $ | 895 | 0.85 | % | $ | 199,942 | $ | 2,145 | 1.07 | % | $ | 232,451 | $ | 3,858 | 1.66 | % | |||||||||||
Savings and money market accounts | 1,485,455 | 28,009 | 2.95 | % | 1,873,728 | 67,600 | 3.61 | % | 1,736,947 | 79,588 | 4.58 | % | |||||||||||||||||
Time deposits | 6,611,919 | 170,666 | 4.04 | % | 4,929,198 | 223,110 | 4.53 | % | 4,325,561 | 218,889 | 5.06 | % | |||||||||||||||||
Total interest bearing deposits | 8,262,043 | 199,570 | 3.78 | % | 7,002,868 | 292,855 | 4.18 | % | 6,294,959 | 302,335 | 4.80 | % | |||||||||||||||||
Borrowings: | |||||||||||||||||||||||||||||
FHLB advances | 4,965,251 | 133,764 | 4.22 | % | 5,605,211 | 259,000 | 4.62 | % | 5,617,069 | 280,839 | 5.00 | % | |||||||||||||||||
Repurchase agreements | 22,732 | 58 | 0.40 | % | 124,564 | 3,739 | 3.00 | % | 407,962 | 21,384 | 5.24 | % | |||||||||||||||||
Total interest bearing liabilities | 13,250,026 | 333,392 | 3.94 | % | 12,732,643 | 555,594 | 4.36 | % | 12,319,990 | 604,558 | 4.91 | % | |||||||||||||||||
Non-interest bearing demand deposits | 282,215 | 441,570 | 503,353 | ||||||||||||||||||||||||||
Other non-interest bearing liabilities | 113,006 | 130,225 | 180,993 | ||||||||||||||||||||||||||
Total liabilities | 13,645,247 | 13,304,438 | 13,004,336 | ||||||||||||||||||||||||||
Equity | (94,657 | ) | 1,137,999 | 1,090,718 | |||||||||||||||||||||||||
Total liabilities and equity | $ | 13,550,590 | $ | 14,442,437 | $ | 14,095,054 | |||||||||||||||||||||||
Net interest income | $ | 5,676 | $ | 278,866 | $ | 353,339 | |||||||||||||||||||||||
Interest rate spread | (0.03 | )% | 1.55 | % | 2.05 | % | |||||||||||||||||||||||
Net interest margin | 0.06 | % | 1.98 | % | 2.57 | % | |||||||||||||||||||||||
Increases and decreases in interest income and interest expense result from changes in average balances (volume) of interest earning assets and liabilities, as well as changes in average interest rates.
The comparison of total interest income and total interest expense for the period ending May 21, 2009 to the fiscal year ending September 30, 2008 is also impacted by the different number of days in the comparative periods. The following table shows the effect that these factors had on the interest earned on the interest earning assets and the interest incurred on the interest bearing liabilities for the periods indicated. The effect of changes in volume is determined by multiplying the change in volume by the previous period's average rate. Similarly, the effect of rate changes is calculated by multiplying the change in average rate by the previous period's volume. Changes applicable to both volume and rate have been allocated to volume(dollars in thousands):
| | Period from October 1, 2008 to May 21, 2009 Compared to the Fiscal Year Ended September 30, 2008 Increase (Decrease) Due To | Fiscal Year Ended September 30, 2008 Compared to the Fiscal Year Ended September 30, 2007 Increase (Decrease) Due To | |||||||||||||||||||||||
|---|---|---|---|---|---|---|---|---|---|---|---|---|---|---|---|---|---|---|---|---|---|---|---|---|---|
| | Changes in Volume | Changes in Rate | Change due to Number of Days | Total Increase (Decrease) | Changes in Volume | Changes in Rate | Total Increase (Decrease) | ||||||||||||||||||
Interest Income Attributable to | |||||||||||||||||||||||||
Investment securities available for sale | $ | (1,002 | ) | $ | (2,049 | ) | $ | (2,681 | ) | $ | (5,732 | ) | $ | (4,180 | ) | $ | 983 | $ | (3,197 | ) | |||||
Mortgage-backed securities | (7,368 | ) | 598 | (15,525 | ) | (22,295 | ) | (15,907 | ) | 8,213 | (7,694 | ) | |||||||||||||
Total investment securities available for sale | (8,370 | ) | (1,451 | ) | (18,206 | ) | (28,027 | ) | (20,087 | ) | 9,196 | (10,891 | ) | ||||||||||||
Other interest earning assets | 1,949 | (12,230 | ) | (7,908 | ) | (18,189 | ) | 10,088 | (7,943 | ) | 2,145 | ||||||||||||||
Loans receivable | (25,250 | ) | (148,510 | ) | (275,416 | ) | (449,176 | ) | 26,147 | (140,838 | ) | (114,691 | ) | ||||||||||||
Total interest earning assets | (31,671 | ) | (162,191 | ) | (301,530 | ) | (495,392 | ) | 16,148 | (139,585 | ) | (123,437 | ) | ||||||||||||
Interest Expense Attributable to | |||||||||||||||||||||||||
Interest bearing demand deposits | $ | (196 | ) | $ | (281 | ) | $ | (773 | ) | $ | (1,250 | ) | $ | (349 | ) | $ | (1,364 | ) | $ | (1,713 | ) | ||||
Savings and money market deposit accounts | (7,235 | ) | (7,894 | ) | (24,462 | ) | (39,591 | ) | 4,935 | (16,923 | ) | (11,988 | ) | ||||||||||||
Time deposits | 43,727 | (15,418 | ) | (80,753 | ) | (52,444 | ) | 27,322 | (23,101 | ) | 4,221 | ||||||||||||||
Total interest bearing deposits | 36,296 | (23,593 | ) | (105,988 | ) | (93,285 | ) | 31,908 | (41,388 | ) | (9,480 | ) | |||||||||||||
FHLB advances | (17,272 | ) | (14,312 | ) | (93,652 | ) | (125,236 | ) | (548 | ) | (21,291 | ) | (21,839 | ) | |||||||||||
Repurchase agreements | (262 | ) | (2,067 | ) | (1,352 | ) | (3,681 | ) | (8,507 | ) | (9,138 | ) | (17,645 | ) | |||||||||||
Total interest bearing liabilities | 18,762 | (39,972 | ) | (200,992 | ) | (222,202 | ) | 22,853 | (71,817 | ) | (48,964 | ) | |||||||||||||
Decrease in net interest income | $ | (50,433 | ) | $ | (122,219 | ) | $ | (100,538 | ) | $ | (273,190 | ) | $ | (6,705 | ) | $ | (67,768 | ) | $ | (74,473 | ) | ||||
Period from October 1, 2008 through May 21, 2009 compared to the fiscal year ending September 30, 2008
Net interest income was $5.7 million for the period ended May 21, 2009 as compared to $278.9 million for the fiscal year ended September 30, 2008, for a decline of $273.2 million. The decline in net interest income was comprised of a decline in interest income of $495.4 million and a decline in interest expense of $222.2 million. On an annualized basis, net interest income for the period from October 1, 2008 through May 21, 2009 decreased by $270.0 million or 96.8% as compared with the year ending September 30, 2008. The decrease in net interest income was comprised of a decline in annualized interest income of $303.3 million partially offset by a decline in annualized interest expense of $33.3 million.
The decrease in interest income resulted primarily from an increase in non-performing assets, evidenced by a decrease in the average yield on loans of 185 basis points from 6.07% for the year ending September 30, 2008 to 4.22% for the period ending May 21, 2009. Nonaccrual loans grew from $1.2 billion at September 30, 2008 to $2.4 billion at May 21, 2009. Decreases in the average volume of both investment securities and loans outstanding and a decline in market rates on variable rate investment securities also contributed to the decline in interest income. The decline in average volume of loans and investment securities resulted from the reduction in the scope of the Failed Bank's
residential mortgage business and the size of the balance sheet in response to capital requirements and growth restrictions imposed by the OTS.
The decline in interest expense resulted from lower rates paid on both deposits and FHLB advances, reflective of continued repricing of liabilities at lower market rates, partly offset by an increase in the average volume of outstanding interest bearing liabilities.
The net interest margin decreased by 192 basis points from 1.98% for the fiscal year ending September 30, 2008 to 0.06% for the period ending May 21, 2009 while the interest rate spread declined by 158 basis points from 1.55% to (0.03)%. The primary driver of the decline in net interest margin and interest rate spread was the increase in non-performing assets.
Fiscal year ending September 30, 2008 compared to fiscal year ending September 30, 2007
Net interest income decreased to $278.9 million for the fiscal year ending September 30, 2008, representing a decline of $74.4 million, or 21.1%, as compared to the $353.3 million reported for the fiscal year ending September 30, 2007. The decline in net interest income was comprised of a decrease in interest income of $123.4 million offset by a decline in interest expense of $49.0 million.
The decline in interest income was mainly attributable to the decrease in the average yield on loans of 116 basis points offset in part by a $353.4 million increase in the average volume of interest earning assets. The average yield on loans was negatively impacted by the increase in nonaccrual loans and declining market interest rates. Nonaccrual loans increased to $1.2 billion at September 30, 2008 from $0.2 billion at September 30, 2007. The higher level of nonaccrual loans resulted in an adverse impact of approximately 60 basis points on the net interest margin. Another factor affecting the decrease in the average yield on loans was a decrease in prepayment fees from $22.2 million during the year ending September 30, 2007 to $7.6 million during the year ending September 30, 2008, offset in part by accelerated amortization of net deferred costs related to prepayments.
The decline in interest expense is attributable to the repricing of liabilities at lower prevailing interest rates, partially offset by an increase in the average balance of deposits, particularly time deposits.
The net interest margin decreased to 1.98% for fiscal 2008 as compared to 2.57% for fiscal 2007, a decrease of 59 basis points. The overall yield on interest earning assets declined by 105 basis points while the average rate paid on interest bearing liabilities declined by 55 basis points, for a 50 basis point decrease in the interest rate spread. The declines in the net interest margin and interest rate spread were mainly attributable to the decrease in the average yield on loans offset in part by an increase in the average volume of interest earning assets and a decline in the cost of interest bearing liabilities.
Interest income on loans for the pre-Acquisition periods included deferred interest on payment option loans, or loans for which contractual periodic payments did not cover the amount of contractual interest earned. The uncollected interest on these loans was added to the principal balance of the loans (negative amortization). Interest income included deferred interest of $28.2 million for the period ending May 21, 2009, $161.7 million for the fiscal year ending September 30, 2008 and $166.7 million for the fiscal year ending September 30, 2007. Total deferred interest included in outstanding loan balances resulting from negative amortization amounted to $265.3 million at May 21, 2009, $374.5 million at September 30, 2008 and $270.2 million at September 30, 2007.
Provision for Loan Losses
The provision for loan losses recorded by the Failed Bank was $919.1 million, $856.4 million and $31.5 million for the period from October 1, 2008 through May 21, 2009, the fiscal year ending September 30, 2008 and the fiscal year ending September 30, 2007, respectively. The increases in the provision for the period ending May 21, 2009 and the fiscal year ending September 30, 2008 largely reflected severe deterioration in the residential housing market, particularly in Florida and California. Total non-performing loans were $2.7 billion, or 24.6%, of total loans at May 21, 2009 and $1.4 billion, or 12.0%, of total loans at September 30, 2008 as compared to $201.1 million, or 1.6%, of total loans at September 30, 2007. Net charge-offs totaled $407.9 million for the period from October 1, 2008 to May 21, 2009, $199.1 million for the fiscal year ending September 30, 2008 and $9.3 million for the fiscal year ending September 30, 2007. The majority of charge-offs were concentrated in the 1-4 single family residential portfolio.
Non-Interest Income (Loss)
The Failed Bank reported a non-interest loss of $81.4 million for the period from October 1, 2008 to May 21, 2009, a non-interest loss of $128.9 million for the fiscal year ending September 30, 2008 and non-interest income of $28.4 million for the fiscal year ending September 30, 2007.
The following table presents a comparison of the categories of non-interest income (loss) for the periods indicated(dollars in thousands):
| | | Fiscal Years Ended September 30, | |||||||||
|---|---|---|---|---|---|---|---|---|---|---|---|
| | Period from October 1, 2008 to May 21, 2009 | ||||||||||
| | 2008 | 2007 | |||||||||
Service charges on deposits and other fee income | $ | 5,357 | $ | 9,712 | $ | 8,736 | |||||
Service charges on loans | 2,072 | 4,630 | 5,315 | ||||||||
Loan servicing fees | 2,543 | 5,601 | 6,998 | ||||||||
Impairment and amortization of mortgage servicing rights | (26,595 | ) | (8,434 | ) | (4,622 | ) | |||||
Net gain (loss) on sale of investment securities | 39 | (1,465 | ) | (564 | ) | ||||||
Net gain (loss) on sale and writedown of loans held for sale | 196 | (9,784 | ) | 9,777 | |||||||
Other-than-temporary impairment of securities available for sale | (68,609 | ) | (142,035 | ) | (5,042 | ) | |||||
Fees received from BankUnited Financial Corporation | 1,824 | 5,193 | 1,120 | ||||||||
Other non-interest income | 1,742 | 7,723 | 6,649 | ||||||||
Total non-interest income (loss) | $ | (81,431 | ) | $ | (128,859 | ) | $ | 28,367 | |||
Period from October 1, 2008 to May 21, 2009 compared to the fiscal year ending September 30, 2008
The non-interest loss for the period from October 1, 2008 to May 21, 2009 was largely driven by additional impairment charges on securities available for sale and mortgage servicing rights. See the section entitled "—Investment Securities Available for Sale" below for further discussion of impairment charges related to investment securities. The impairment of mortgage servicing assets resulted primarily from termination of the Failed Bank's rights to service loans for the Federal National Mortgage Association (Fannie Mae), or FNMA, and the Federal Home Loan Mortgage Corporation (Freddie Mac), or FHLMC, during the period ending May 21, 2009. A continued decline in secondary market mortgage activity led to a reduced gain (loss) on sale of loans for the period ending May 21, 2009. The reduction in other non-interest income resulted primarily from an adjustment to outstanding mortgage insurance claims receivable.
Fiscal year ending September 30, 2008 compared to the fiscal year ending September 30, 2007
During the fiscal year ending September 30, 2008, the Failed Bank recorded other-than-temporary impairment charges of $142.0 million relating to investment securities compared to $5.0 million for the fiscal year ending September 30, 2007. See the section entitled "Investment Securities Available for Sale" below for further discussion of these impairment charges.
Due to a reduction in the volume of loans serviced for others, impairment charges of $3.0 million and $1.3 million were recorded in fiscal 2008 and fiscal 2007, respectively, related to mortgage servicing rights.
The net loss on sale and writedown of loans held for sale for the year ending September 30, 2008 includes a $3.8 million adjustment at the lower of cost or market to the carrying amount of loans held for sale that were subsequently transferred to the loans held for investment portfolio. The remaining loss on sale of loans resulted from declining demand in the secondary market for the Failed Bank's residential loan portfolio. $381.0 million of residential loans were sold in fiscal 2008, as compared to $949.8 million in fiscal 2007.
Non-Interest Expense
The following table presents the components of non-interest expense for the periods indicated(dollars in thousands):
| | | Fiscal Years Ended September 30, | |||||||||
|---|---|---|---|---|---|---|---|---|---|---|---|
| | Period from October 1, 2008 to May 21, 2009 | ||||||||||
| | 2008 | 2007 | |||||||||
Employee compensation and benefits | $ | 51,695 | $ | 88,893 | $ | 87,958 | |||||
Occupancy and equipment | 25,247 | 46,743 | 41,187 | ||||||||
OREO expense | 34,697 | 17,901 | 594 | ||||||||
Impairment of OREO | 38,742 | 22,749 | 14 | ||||||||
Professional fees | 10,062 | 8,910 | 5,631 | ||||||||
Foreclosure expense | 4,907 | 6,007 | 535 | ||||||||
Deposit insurance expense | 38,299 | 6,147 | 3,119 | ||||||||
Telecommunications and data processing | 9,573 | 13,536 | 13,019 | ||||||||
Other non-interest expense | 25,181 | 35,594 | 33,577 | ||||||||
Total non-interest expense | $ | 238,403 | $ | 246,480 | $ | 185,634 | |||||
Non-interest expense as a percentage of average assets increased to 2.8% (annualized) for the period ended May 21, 2009 from 1.7% for the fiscal year ending September 30, 2008 and 1.3% for the fiscal year ending September 30, 2007. The primary drivers of increasing non-interest expense over this period were increased impairment of OREO, higher OREO expense, foreclosure expense and the deposit insurance expense.
Period from October 1, 2008 to May 21, 2009 compared to the fiscal year ending September 30, 2008
On an annualized basis, employee compensation and benefits as a percentage of average assets remained consistent over the period ending May 21, 2009 and the fiscal year ending September 30, 2008. The total decline in employee compensation and benefits expense of $7.9 million or approximately 9% on an annualized basis was primarily a result of an approximate 70% reduction in the Failed Bank's wholesale residential lending staff and other reductions in the workforce.
OREO expense, foreclosure expense and impairment of OREO continued to increase during the period ending May 21, 2009 due to further deterioration in home prices and the increasing volume of
foreclosures. As of May 21, 2009, there were slightly over 6,000 units in the foreclosure process as compared to approximately 3,000 units at September 30, 2008.
Deposit insurance expense was significantly impacted by additional assessments by the FDIC during the period ending May 21, 2009.
Fiscal year ending September 30, 2008 compared to the fiscal year ending September 30, 2007
Compensation and benefits as a percentage of average assets remained consistent over the fiscal years ending September 30, 2008 and 2007.
Occupancy and equipment expense for the fiscal year ended September 30, 2008 was impacted by the substantial curtailment of the Failed Bank's wholesale residential mortgage business, resulting in restructuring costs of $2.9 million. Depreciation expense for the fiscal year ending September 30, 2008 as compared to the fiscal year ending September 30, 2007 also increased, primarily a result of $1.1 million in additional software depreciation associated with the acquisition of branch operations, information security and systems integration software.
OREO and foreclosure expenses and impairment of OREO began to increase markedly during the fiscal year ending September 30, 2008 due to deterioration in home prices, driving an increasing volume of foreclosures.
The primary components of other non-interest expense for the period ended May 21, 2009 and the fiscal years ended September 30, 2007 and 2008 were loan related expenses, advertising and promotion, the cost of regulatory examinations, and general office expense.
Income Taxes
For the period ending May 21, 2009 and the fiscal years ending September 30, 2008 and 2007, the Failed Bank recorded an income tax provision (benefit) of $0.0, $(94.5) million and $55.1 million, respectively. The Failed Bank's effective tax rate for the period ending May 21, 2009 and the fiscal years ending September 30, 2008 and 2007 was 0.1%, 9.9% and 33.4%, respectively. The effective tax rate varied from the federal statutory tax rate of 35.0% primarily due to state income taxes and the valuation allowance established related to deferred tax assets. The Failed Bank had net deferred tax assets, prior to any valuation allowance, of $730.0 million and $338.1 million at May 21, 2009 and September 30 2008, respectively.
Balance Sheet Analysis for the Pre-Acquisition Periods
Average total assets of the Failed Bank declined by $891.8 million to $13.6 billion for the period ending May 21, 2009 from $14.4 billion for the fiscal year ended September 30, 2008. This decline related primarily to the decline in average loans, which was fueled by increased impairments and foreclosures during the period combined with normal paydowns and a curtailment in lending activity. Average total liabilities increased by $340.8 million to $13.6 billion for the period ending May 21, 2009 from $13.3 billion for the fiscal year ending September 30, 2008. Average deposits increased by $1.1 billion, offset by a $741.8 million decline in average outstanding borrowings.
Average total assets increased by $347.4 million for the fiscal year ended September 30, 2008 as compared to the fiscal year ended September 30, 2007, largely reflective of an increase in average loans. Average total liabilities increased by $300.1 million, primarily attributable to a $646.1 million increase in deposits, offset by a decline in average outstanding borrowings of $295.3 million.
Investment Securities Available for Sale
The following table shows the amortized cost and fair value of the investment securities as of the dates indicated. All of the investment securities were classified available for sale(dollars in thousands):
| | | | At September 30, | |||||||||||||||||
|---|---|---|---|---|---|---|---|---|---|---|---|---|---|---|---|---|---|---|---|---|
| | At May 21, 2009 | |||||||||||||||||||
| | 2008 | 2007 | ||||||||||||||||||
| | Amortized Cost | Fair Value | Amortized Cost | Fair Value | Amortized Cost | Fair Value | ||||||||||||||
U.S. Treasury securities | $ | 35,167 | $ | 35,423 | $ | 45,567 | $ | 45,726 | $ | 25,000 | $ | 24,977 | ||||||||
U.S. Government agency and sponsored enterprise residential mortgage-backed securities | 224,587 | 227,879 | 256,392 | 255,483 | 214,198 | 210,286 | ||||||||||||||
Other residential collateralized mortgage obligations | 3,371 | 1,785 | 3,495 | 3,463 | 4,284 | 4,266 | ||||||||||||||
Residential mortgage pass-through certificates | 323,829 | 230,091 | 430,711 | 394,321 | 714,189 | 701,671 | ||||||||||||||
Mutual funds and preferred stocks | 18,241 | 18,094 | 24,886 | 24,482 | 109,929 | 107,158 | ||||||||||||||
State and Municipal obligations | 22,671 | 22,696 | 22,220 | 22,260 | 47,314 | 46,618 | ||||||||||||||
Other debt securities | 4,317 | 2,976 | 10,752 | 9,490 | 4,000 | 3,689 | ||||||||||||||
Total investment securities available for sale | $ | 632,183 | $ | 538,944 | $ | 794,023 | $ | 755,225 | $ | 1,118,914 | $ | 1,098,665 | ||||||||
Investment securities decreased by $216.3 million from September 30, 2008 to May 21, 2009 primarily due to impairment charges of $68.6 million coupled with paydowns and sales of $106.3 million, offset by purchases of $10.4 million. Investment securities decreased by $343.4 million from $1.1 billion at September 30, 2007 to $755.2 million at September 30, 2008. This decrease resulted primarily from impairment charges of $142.0 million, coupled with paydowns and sales of $395.1 million offset by purchases of $213.4 million.
During the period from October 1, 2008 through May 21, 2009, the Failed Bank recognized other-than-temporary impairment charges of $68.6 million, consisting of $39.4 million related to subordinate tranches of the Failed Bank's 2005 mortgage securitization (the "2005 securities"), $16.1 million related to private-label collateralized mortgage obligations ("CMOs"), $6.4 million related to trust preferred securities, $1.5 million related to FNMA and FHLMC preferred stock and $5.2 million related to a mutual fund. The majority of the impairment charges recorded during the period ending May 21, 2009 represented further deterioration in value of securities for which other-than-temporary impairment charges were initially recorded in fiscal 2008 as discussed below. Additional impairment of the 2005 securities and private-label CMOs was reflective of further deterioration in projected cash flows from the underlying collateral resulting from increasing frequency and severity of defaults. Recognition of other-than-temporary impairment of pooled trust preferred securities was based on a third party discounted cash flow analysis incorporating proprietary collateral default rate assumptions that indicated less than full recovery of principal, as well as consideration of the severity and duration of impairment. Other-than-temporary impairment of FNMA and FHLMC preferred stock was based on further deterioration in the market price of these securities coupled with lack of evidence of improvement in the financial condition of the issuers. Cash flow analysis incorporating updated underlying collateral default assumptions led to further other-than-temporary impairment of the mutual fund investment.
During the fiscal year ending September 30, 2008, the Failed Bank recorded other-than-temporary impairment charges totaling $142.0 million, including $89.3 million relating to the 2005 securities, $5.8 million relating to private-label CMOs, $37.8 million relating to FNMA and FHLMC preferred stocks, $8.1 million relating to a mutual fund, and $1.0 million relating to other debt securities. The determination that unrealized losses on the 2005 securities were other-than-temporary was based on an analysis of discounted expected future cash flows using third party developed models that incorporated proprietary behavioral assumptions about collateral default rates, loss severity levels and voluntary annual prepayment rates. Cash flow projections for the underlying mortgages, given current loss trends, indicated that projected losses could completely erode the value of certain subordinate classes and significantly erode the value of several other subordinate classes of the 2005 securitization, leading to the determination that these securities were other-than-temporarily impaired. Management's determination that certain other private-label CMOs were other-than-temporarily impaired was also based on the analysis of discounted expected future cash flows. The magnitude and duration of unrealized losses was considered in these determinations as well. As a result of significant declines in value of FNMA and FHLMC preferred stock after these entities were placed into conservatorship on September 7, 2008, the cost basis of these investments was well in excess of the market price of the stock at September 30, 2008. The determination that impairment of these securities was other-than-temporary was based on the severity of impairment and uncertainty about the potential for market recovery of the issuers. The mutual fund determined to be other-than-temporarily impaired was a fund that invested primarily in mortgage related investments, the majority of which were subordinate securities with increasing levels of underlying collateral delinquencies and defaults. The severity of impairment combined with the high probability of significant principal loss of the underlying collateral led to the conclusion that the security was other-than-temporarily impaired. The other debt securities consisted of pooled trust preferred securities, collateralized by subordinated debt issued by financial institutions. Management's determination that these securities were other-than-temporarily impaired was based on an analysis of projected collateral cash flows.
During the fiscal year ending September 30, 2007, the Failed Bank recognized other-than-temporary impairment charges of $5.0 million, consisting of $1.3 million on FNMA preferred stock and $3.7 million on two mutual fund investments. Other-than-temporary impairment of FNMA preferred stock was recognized primarily due to the severity and duration of the impairment and deteriorating financial condition of the issuer. Other-than-temporary impairment of the mutual fund investments was attributable to the severity and duration of impairment and deterioration in projected cash flows from the underlying collateral.
Loan Portfolio
The following table presents the composition of the loan portfolio as of the dates indicated(dollars in thousands):
| | | | At September 30, | |||||||||||||||||||||||||||||||
|---|---|---|---|---|---|---|---|---|---|---|---|---|---|---|---|---|---|---|---|---|---|---|---|---|---|---|---|---|---|---|---|---|---|---|
| | At May 21, 2009 | 2008 | 2007 | 2006 | 2005 | |||||||||||||||||||||||||||||
| | Balance | % | Balance | % | Balance | % | Balance | % | Balance | % | ||||||||||||||||||||||||
Real estate loans: | ||||||||||||||||||||||||||||||||||
1-4 single family residential | $ | 8,993,077 | 83.1 | % | $ | 9,916,696 | 84.4 | % | $ | 10,693,832 | 86.3 | % | $ | 9,661,913 | 85.9 | % | $ | 6,678,322 | 84.2 | % | ||||||||||||||
Home equity loans and lines of credit | 505,642 | 4.7 | % | 486,467 | 4.1 | % | 420,386 | 3.4 | % | 355,822 | 3.2 | % | 257,789 | 3.3 | % | |||||||||||||||||||
Multi-family | 129,481 | 1.2 | % | 144,324 | 1.2 | % | 120,058 | 1.0 | % | 85,544 | 0.8 | % | 111,444 | 1.4 | % | |||||||||||||||||||
Commercial real estate | 594,877 | 5.5 | % | 600,261 | 5.1 | % | 496,556 | 4.0 | % | 413,637 | 3.7 | % | 344,503 | 4.3 | % | |||||||||||||||||||
Construction | 187,333 | 1.7 | % | 171,213 | 1.5 | % | 146,557 | 1.2 | % | 174,466 | 1.5 | % | 87,113 | 1.1 | % | |||||||||||||||||||
Land | 219,736 | 2.0 | % | 224,723 | 1.9 | % | 303,294 | 2.5 | % | 337,023 | 3.0 | % | 235,829 | 3.0 | % | |||||||||||||||||||
Total real estate loans | 10,630,146 | 98.2 | % | 11,543,684 | 98.2 | % | 12,180,683 | 98.4 | % | 11,028,405 | 98.1 | % | 7,715,000 | 97.3 | % | |||||||||||||||||||
Other loans: | ||||||||||||||||||||||||||||||||||
Commercial | 181,484 | 1.7 | % | 197,985 | 1.7 | % | 187,951 | 1.5 | % | 194,269 | 1.7 | % | 199,344 | 2.5 | % | |||||||||||||||||||
Consumer | 12,179 | 0.1 | % | 12,740 | 0.1 | % | 16,228 | 0.1 | % | 17,809 | 0.2 | % | 19,415 | 0.2 | % | |||||||||||||||||||
Total other loans | 193,663 | 1.8 | % | 210,725 | 1.8 | % | 204,179 | 1.6 | % | 212,078 | 1.9 | % | 218,759 | 2.7 | % | |||||||||||||||||||
Total loans | 10,823,809 | 100.0 | % | 11,754,409 | 100.0 | % | 12,384,862 | 100.0 | % | 11,240,483 | 100.0 | % | 7,933,759 | 100.0 | % | |||||||||||||||||||
Unearned discount, premiums and deferred costs, net | 190,406 | 210,875 | 235,454 | 196,601 | 119,588 | |||||||||||||||||||||||||||||
Loans held in portfolio, net of discount premiums and deferred costs | 11,014,215 | 11,965,284 | 12,620,316 | 11,437,084 | 8,053,347 | |||||||||||||||||||||||||||||
Allowance for loan losses | (1,227,173 | ) | (715,917 | ) | (58,623 | ) | (36,378 | ) | (25,755 | ) | ||||||||||||||||||||||||
Total loans held in portfolio, net | $ | 9,787,042 | $ | 11,249,367 | $ | 12,561,693 | $ | 11,400,706 | $ | 8,027,592 | ||||||||||||||||||||||||
Loans held for sale | $ | 788 | $ | 10,050 | $ | 174,868 | $ | 9,542 | $ | 12,196 | ||||||||||||||||||||||||
Net loans held in portfolio decreased to $9.8 billion at May 21, 2009 from $11.2 billion at September 30, 2008 and $12.6 billion at September 30, 2007. This decrease was driven by the decline in the Failed Bank's 1-4 single family residential portfolio as discussed below.
Residential Mortgages
1-4 single family residential loans amounted to $9.0 billion or 83.1% of total loans at May 21, 2009, compared to $9.9 billion or 84.4% of total loans at September 30, 2008 and $10.7 billion or 86.3% of total loans at September 30, 2007. Beginning in fiscal 2008, the Failed Bank curtailed growth of the 1-4 single family residential portfolio. Total originations of residential loans were $22.8 million for the period ending May 21, 2009, $1.6 billion for the year ending September 30, 2008 and $4.0 billion for the year ending September 30, 2007.
The Failed Bank also terminated its option ARM and reduced documentation loan programs during fiscal 2008. Originations of option ARM loans totaled $187.0 million for fiscal 2008 and $3.1 billion for fiscal 2007, representing 11.9% and 77.5%, respectively, of total residential loan originations. Option ARM loans generally started with a below market incentive interest rate that adjusted to an applicable index rate plus a defined margin after a specified period of time. Each month, the borrower had the option to make one of several payments, including a minimum payment that may not have covered the interest accrued on the loan for the month, resulting in the deferred interest being added to the loan balance. The contractual terms of Option ARM loans limited the amount of the increase in the loan balance to 115% of the original balance. At the earlier of 5 years from origination or reaching the 115% cap, the loan was contractually reset to be repaid on a fully
amortizing basis over its remaining term. Some residential mortgage loans were also originated under "reduced-doc" and "no-doc" programs requiring reduced or no verification of the borrowers' income, employment and assets.
The following table presents a breakdown of the 1-4 single family residential mortgage portfolio categorized between fixed rate, option adjustable rate mortgages and non-option adjustable rate mortgages at the dates indicated(dollars in thousands):
| | | | At September 30, | ||||||||||||||||||||
|---|---|---|---|---|---|---|---|---|---|---|---|---|---|---|---|---|---|---|---|---|---|---|---|
| | At May 21, 2009 | 2008 | 2007 | ||||||||||||||||||||
| | Total Loans | % of Total | Total Loans | % of Total | Total Loans | % of Total | |||||||||||||||||
1-4 single family residential loans | |||||||||||||||||||||||
Fixed rate loans | $ | 1,774,598 | 19.7 | % | $ | 1,636,063 | 16.5 | % | $ | 1,574,004 | 14.7 | % | |||||||||||
Adjustable rate loans | |||||||||||||||||||||||
Option adjustable rate mortgages(1) | 4,685,090 | 52.1 | % | 6,714,460 | 67.7 | % | 7,596,855 | 71.1 | % | ||||||||||||||
Non-option adjustable rate mortgages | 2,533,389 | 28.2 | % | 1,566,173 | 15.8 | % | 1,522,973 | 14.2 | % | ||||||||||||||
Total | $ | 8,993,077 | 100.0 | % | $ | 9,916,696 | 100.0 | % | $ | 10,693,832 | 100.0 | % | |||||||||||
A breakdown of 1-4 single family residential loans by state as of the dates indicated follows(dollars in millions):
| | | | At September 30, | |||||||||||||||||
|---|---|---|---|---|---|---|---|---|---|---|---|---|---|---|---|---|---|---|---|---|
| | At May 21, 2009 | 2008 | 2007 | |||||||||||||||||
| | Amount | % | Amount | % | Amount | % | ||||||||||||||
Florida | $ | 5,076 | 56.4 | % | $ | 5,508 | 55.5 | % | $ | 5,966 | 55.8 | % | ||||||||
California | 721 | 8.0 | % | 823 | 8.3 | % | 851 | 7.9 | % | |||||||||||
Illinois | 501 | 5.6 | % | 542 | 5.5 | % | 599 | 5.6 | % | |||||||||||
Arizona | 500 | 5.6 | % | 611 | 6.2 | % | 661 | 6.2 | % | |||||||||||
New Jersey | 480 | 5.3 | % | 518 | 5.2 | % | 547 | 5.1 | % | |||||||||||
Virginia | 348 | 3.9 | % | 418 | 4.2 | % | 471 | 4.4 | % | |||||||||||
States with less than 4% | 1,367 | 15.2 | % | 1,497 | 15.1 | % | 1,599 | 15.0 | % | |||||||||||
Total | $ | 8,993 | 100.0 | % | $ | 9,917 | 100.0 | % | $ | 10,694 | 100.0 | % | ||||||||
Asset Quality
Impaired Loans and Non-performing Assets
The following table summarizes the Company's impaired loans, including troubled debt restructurings, and other non-performing assets as of the dates indicated(dollars in thousands):
| | | At September 30, | ||||||||||||||||||
|---|---|---|---|---|---|---|---|---|---|---|---|---|---|---|---|---|---|---|---|---|
| | At May 21, 2009 | |||||||||||||||||||
| | 2008 | 2007 | 2006 | 2005 | ||||||||||||||||
Nonaccrual loans | ||||||||||||||||||||
Real estate loans: | ||||||||||||||||||||
1-4 single family residential | ||||||||||||||||||||
Payment option | $ | 1,674,325 | $ | 968,647 | $ | 149,749 | $ | 11,757 | $ | 3,286 | ||||||||||
Non-payment option | 453,743 | 153,125 | 22,894 | 5,826 | 3,746 | |||||||||||||||
Total 1-4 single family residential | 2,128,068 | 1,121,772 | 172,643 | 17,583 | 7,032 | |||||||||||||||
Home equity loans and lines of credit | 27,263 | 8,866 | 2,251 | 58 | 74 | |||||||||||||||
Multi-family | 21,544 | 10,028 | — | — | — | |||||||||||||||
Commercial real estate | 2,888 | — | 5,593 | — | — | |||||||||||||||
Construction | 78,403 | 58,549 | — | — | — | |||||||||||||||
Land | 94,493 | 38,465 | — | — | — | |||||||||||||||
Total real estate loans | 2,352,659 | 1,237,680 | 180,487 | 17,641 | 7,106 | |||||||||||||||
Other loans: | ||||||||||||||||||||
Commercial | 763 | 65 | 232 | 3,073 | 1,285 | |||||||||||||||
Consumer | 23 | 30 | 91 | 26 | — | |||||||||||||||
Total other loans | 786 | 95 | 323 | 3,099 | 1,285 | |||||||||||||||
Total nonaccrual loans | 2,353,445 | 1,237,775 | 180,810 | 20,740 | 8,391 | |||||||||||||||
Accruing loans 90 days or more past due | — | 71 | 493 | — | — | |||||||||||||||
Other impaired loans still accruing | 353,903 | 195,073 | 19,771 | — | — | |||||||||||||||
Total non-performing loans | 2,707,348 | 1,432,919 | 201,074 | 20,740 | 8,391 | |||||||||||||||
OREO | 177,679 | 135,324 | 27,732 | 729 | 542 | |||||||||||||||
Total non-performing assets | 2,885,027 | 1,568,243 | 228,806 | 21,469 | 8,933 | |||||||||||||||
Troubled debt restructurings in compliance with modified terms(1) | 651,236 | 68,033 | — | — | — | |||||||||||||||
Total impaired loans and non-performing assets | $ | 3,536,263 | $ | 1,636,276 | $ | 228,806 | $ | 21,469 | $ | 8,933 | ||||||||||
Non-performing loans to total loans | 24.58 | % | 11.98 | % | 1.59 | % | 0.18 | % | 0.10 | % | ||||||||||
Non-performing assets to total assets | 23.53 | % | 11.13 | % | 1.51 | % | 0.16 | % | 0.08 | % | ||||||||||
Non-performing loans and troubled debt restructurings to total loans | 30.49 | % | 12.54 | % | 1.59 | % | 0.18 | % | 0.10 | % | ||||||||||
Allowance for loan losses to total loans | 11.14 | % | 5.98 | % | 0.46 | % | 0.32 | % | 0.32 | % | ||||||||||
Allowance for loan losses to non-performing loans | 45.33 | % | 49.96 | % | 29.15 | % | 175.40 | % | 306.94 | % | ||||||||||
The increase in total non-performing assets from $228.8 million at September 30, 2007 to $1.6 billion at September 30, 2008 and $2.9 billion at May 21, 2009 resulted directly from the economic downturn, both nationally and in the Failed Bank's primary geographic markets, particularly the precipitous decline in housing prices. Non-performing loans were concentrated in the option ARM portfolio, and a significant percentage of the non-performing loans were those with higher LTV ratios, originated during periods of historically high housing prices.
Interest income foregone on nonaccrual loans amounted to $88.9 million for the period ending May 21, 2009 as compared to $85.9 million for the fiscal year ending September 30, 2008 and $10.0 million for fiscal 2007. Interest income reversed due to loans being placed on nonaccrual status amounted to $20.1 million for the period ending May 21, 2009 as compared to $39.3 million for the fiscal year ended September 30, 2008 and $8.1 million for the fiscal year ended September 30, 2007.
Nonaccrual loans include troubled debt restructured loans of $177.3 million, and $65.7 million at May 21, 2009 and September 30, 2008, respectively. There were no troubled debt restructured loans included in nonaccrual loans at September 30, 2007, 2006 or 2005. Additional interest income that would have been recognized on troubled debt restructured loans not on nonaccrual status if they had been current based on their original contractual terms was $3.3 million and $0.5 million for the period ended May 21, 2009 and the fiscal year ending September 30, 2008, respectively. Interest income recognized on these loans for the period ended May 21, 2009 and the fiscal year ended September 30, 2008 was $14.6 million and $2.9 million, respectively.
Analysis of the Allowance for Loan Losses
The following table provides an analysis of the allowance for loan losses and net charge-offs for the periods indicated(dollars in thousands):
| | | | Fiscal Years Ended September 30, | | | Fiscal Years Ended September 30, | ||||||||||||||||||||||||||||||||
|---|---|---|---|---|---|---|---|---|---|---|---|---|---|---|---|---|---|---|---|---|---|---|---|---|---|---|---|---|---|---|---|---|---|---|---|---|---|---|
| | | Period from October 1, 2008 to May 21, 2009 | | Period from October 1, 2008 to May 21, 2009 | ||||||||||||||||||||||||||||||||||
| | | 2008 | 2007 | 2006 | 2005 | | 2008 | 2007 | 2006 | 2005 | ||||||||||||||||||||||||||||
Allowance for loan losses, beginning of period | Allowance for loan losses, beginning of period | $ | 715,917 | $ | 58,623 | $ | 36,378 | $ | 25,755 | $ | 24,079 | Allowance for loan losses, beginning of period | $ | 715,917 | $ | 58,623 | $ | 36,378 | $ | 25,755 | $ | 24,039 | ||||||||||||||||
Provision for loan losses | 919,139 | 856,374 | 31,500 | 10,400 | 3,800 | Provision for loan losses | 919,139 | 856,374 | 31,500 | 10,400 | 3,840 | |||||||||||||||||||||||||||
Charge-offs: | Charge-offs: | |||||||||||||||||||||||||||||||||||||
1-4 single family residential | (434,391 | ) | (211,323 | ) | (5,347 | ) | (130 | ) | (972 | ) | 1-4 single family residential | (434,391 | ) | (211,323 | ) | (5,347 | ) | (130 | ) | (972 | ) | |||||||||||||||||
Home equity loans and lines of credit | (12,676 | ) | (9,396 | ) | (620 | ) | (241 | ) | (572 | ) | Home equity loans and lines of credit | (12,676 | ) | (9,396 | ) | (620 | ) | (241 | ) | (572 | ) | |||||||||||||||||
Multi-family | — | — | — | — | — | Multi-family | — | — | — | — | — | |||||||||||||||||||||||||||
Commercial real estate | — | — | — | — | — | Commercial real estate | — | — | — | — | — | |||||||||||||||||||||||||||
Construction | — | (1,218 | ) | — | — | — | Construction | — | (1,218 | ) | — | — | — | |||||||||||||||||||||||||
Land | — | (6,647 | ) | (2,651 | ) | — | — | Land | — | (6,647 | ) | (2,651 | ) | — | — | |||||||||||||||||||||||
Commercial | (879 | ) | (1,468 | ) | (2,425 | ) | (902 | ) | (1,527 | ) | Commercial | (879 | ) | (1,468 | ) | (2,425 | ) | (902 | ) | (1,527 | ) | |||||||||||||||||
Consumer | (1,064 | ) | (257 | ) | (7 | ) | — | (118 | ) | Consumer | (1,064 | ) | (257 | ) | (7 | ) | — | (118 | ) | |||||||||||||||||||
Total charge-offs | (449,010 | ) | (230,309 | ) | (11,050 | ) | (1,273 | ) | (3,189 | ) | Total charge-offs | (449,010 | ) | (230,309 | ) | (11,050 | ) | (1,273 | ) | (3,189 | ) | |||||||||||||||||
Recoveries: | Recoveries: | |||||||||||||||||||||||||||||||||||||
1-4 single family residential | 40,825 | 31,079 | 1,407 | — | — | 1-4 single family residential | 40,825 | 31,079 | 1,407 | — | — | |||||||||||||||||||||||||||
Home equity loans and lines of credit | 111 | 34 | 73 | — | 43 | Home equity loans and lines of credit | 111 | 34 | 73 | — | 43 | |||||||||||||||||||||||||||
Multi-family | — | — | — | — | — | Multi-family | — | — | — | — | — | |||||||||||||||||||||||||||
Commercial real estate | — | — | — | — | 298 | Commercial real estate | — | — | — | — | 298 | |||||||||||||||||||||||||||
Construction | — | — | — | — | — | Construction | — | — | — | — | — | |||||||||||||||||||||||||||
Land | — | — | — | — | — | Land | — | — | — | — | — | |||||||||||||||||||||||||||
Commercial | 189 | 115 | 306 | 1,482 | 705 | Commercial | 189 | 115 | 306 | 1,482 | 705 | |||||||||||||||||||||||||||
Consumer | 2 | 1 | 9 | 14 | 19 | Consumer | 2 | 1 | 9 | 14 | 19 | |||||||||||||||||||||||||||
Total recoveries | 41,127 | 31,229 | 1,795 | 1,496 | 1,065 | Total recoveries | 41,127 | 31,229 | 1,795 | 1,496 | 1,065 | |||||||||||||||||||||||||||
Net charge-offs | (407,883 | ) | (199,080 | ) | (9,255 | ) | 223 | (2,124 | ) | Net charge-offs | (407,883 | ) | (199,080 | ) | (9,255 | ) | 223 | (2,124 | ) | |||||||||||||||||||
Allowance for loan losses, end of period | Allowance for loan losses, end of period | $ | 1,227,173 | $ | 715,917 | $ | 58,623 | $ | 36,378 | $ | 25,755 | Allowance for loan losses, end of period | $ | 1,227,173 | $ | 715,917 | $ | 58,623 | $ | 36,378 | $ | 25,755 | ||||||||||||||||
Ratio of net charge-offs to average loans receivable outstanding during the period | 5.51 | %(1) | 1.58 | % | 0.08 | % | 0.00 | % | 0.03 | % | Ratio of net charge-offs to average loans receivable outstanding during the period | 5.51 | %(1) | 1.58 | % | 0.08 | % | 0.00 | % | 0.03 | % | |||||||||||||||||
The following table allocates the allowance for loan losses by loan category as of the dates indicated(dollars in thousands):
| | | | At September 30, | |||||||||||||||||||||||||||||
|---|---|---|---|---|---|---|---|---|---|---|---|---|---|---|---|---|---|---|---|---|---|---|---|---|---|---|---|---|---|---|---|---|
| | At May 21, 2009 | 2008 | 2007 | 2006 | 2005 | |||||||||||||||||||||||||||
| | Amount | %(1) | Amount | %(1) | Amount | %(1) | Amount | %(1) | Amount | %(1) | ||||||||||||||||||||||
1-4 single family residential | $ | 890,551 | 83.1 | % | $ | 616,486 | 84.4 | % | $ | 33,911 | 86.3 | % | $ | 12,917 | 85.9 | % | $ | 8,292 | 84.2 | % | ||||||||||||
Home equity loans and lines of credit | 41,638 | 4.7 | % | 16,055 | 4.1 | % | 6,850 | 3.4 | % | 3,971 | 3.2 | % | 2,909 | 3.3 | % | |||||||||||||||||
Multi-family | 1,461 | 1.2 | % | 836 | 1.2 | % | 960 | 1.0 | % | 684 | 0.8 | % | 891 | 1.4 | % | |||||||||||||||||
Commercial real estate | 186,130 | 5.5 | % | 891 | 5.1 | % | 8,092 | 4.0 | % | 6,316 | 3.7 | % | 3,076 | 4.3 | % | |||||||||||||||||
Construction | 53,452 | 1.7 | % | 47,495 | 1.5 | % | 1,173 | 1.2 | % | 1,396 | 1.5 | % | 697 | 1.1 | % | |||||||||||||||||
Land | 47,986 | 2.0 | % | 30,699 | 1.9 | % | 2,426 | 2.5 | % | 2,696 | 3.0 | % | 1,886 | 3.0 | % | |||||||||||||||||
Commercial | 5,102 | 1.7 | % | 2,860 | 1.7 | % | 4,331 | 1.5 | % | 7,613 | 1.7 | % | 7,161 | 2.5 | % | |||||||||||||||||
Consumer | 853 | 0.1 | % | 595 | 0.1 | % | 880 | 0.1 | % | 785 | 0.2 | % | 843 | 0.2 | % | |||||||||||||||||
Total allowance for loan losses | $ | 1,227,173 | 100.0 | % | $ | 715,917 | 100.0 | % | $ | 58,623 | 100.0 | % | $ | 36,378 | 100.0 | % | $ | 25,755 | 100.0 | % | ||||||||||||
Other Assets
Goodwill and Other Intangible Assets
Goodwill of $28.4 million at May 21, 2009 and at September 30, 2008 arose from previous business combinations entered into by the Failed Bank. Goodwill impairment tests were performed as of May 21, 2009 and as of September 30, 2008. As of May 21, 2009, the carrying value of the reporting unit to which goodwill was assigned was negative, therefore, the first phase of the goodwill impairment test was passed and no impairment of goodwill was recorded. At September 30, 2008, the carrying value of the reporting unit exceeded its estimated fair value, so the first phase of the goodwill impairment test was failed, indicating potential impairment. The second phase of the goodwill impairment test consists of comparing the carrying amount of goodwill to its implied fair value, derived by performing a pro-forma purchase price allocation of the reporting unit's identifiable assets and liabilities as of the impairment testing date, based on their estimated fair values. Based on this comparison, the implied fair value of goodwill exceeded its carrying amount; therefore, no impairment was indicated.
Other Assets
Other assets totaled $212.3 million and $247.1 million at May 21, 2009 and September 30, 2008, respectively. The most significant components of the decrease in other assets from September 30, 2008 to May 21, 2009 were a $25.9 million decline in mortgage servicing rights arising from impairment charges, and a $18.5 million decline in accrued interest receivable attributable primarily to the decline in total loans outstanding and the increase in non-performing loans.
Deposits
The following table presents information about deposits for the periods indicated(dollars in thousands):
| | | | Fiscal Years Ended September 30, | ||||||||||||||||||
|---|---|---|---|---|---|---|---|---|---|---|---|---|---|---|---|---|---|---|---|---|---|
| | Period from October 1, 2008 to May 21, 2009 | ||||||||||||||||||||
| | 2008 | 2007 | |||||||||||||||||||
| | Average Balance | Average Rate Paid | Average Balance | Average Rate Paid | Average Balance | Average Rate Paid | |||||||||||||||
Demand deposits: | |||||||||||||||||||||
Non-interest bearing | $ | 282,215 | — | % | $ | 441,570 | — | % | $ | 503,353 | — | % | |||||||||
Interest bearing | 164,669 | 0.85 | % | 199,942 | 1.07 | % | 232,451 | 1.66 | % | ||||||||||||
Savings and money market accounts | 1,485,455 | 2.95 | % | 1,873,728 | 3.61 | % | 1,736,947 | 4.58 | % | ||||||||||||
Time deposits | 6,611,919 | 4.04 | % | 4,929,198 | 4.53 | % | 4,325,561 | 5.06 | % | ||||||||||||
Total deposits | $ | 8,544,258 | 3.66 | % | $ | 7,444,438 | 3.93 | % | $ | 6,798,312 | 4.45 | % | |||||||||
Borrowed Funds
The following table sets forth information regarding the short-term borrowings, consisting of securities sold under agreements to repurchase and federal funds purchased, as of the dates, and for the periods, indicated(dollars in thousands):
| | | | | Yearly Weighted Averages | ||||||||||||
|---|---|---|---|---|---|---|---|---|---|---|---|---|---|---|---|---|
| | Ending Balance | Weighted- Average Rate | Maximum Amount At Month-End | |||||||||||||
| | Balance | Rate | ||||||||||||||
For the period from October 1, 2008 to May 21, 2009: | $ | 1,310 | 0.00 | % | $ | 48,114 | $ | 22,732 | 0.40 | % | ||||||
For the fiscal year ended September 30, 2008: | $ | 56,930 | 0.99 | % | $ | 227,218 | $ | 124,564 | 3.00 | % | ||||||
For the fiscal year ended September 30, 2007: | $ | 143,072 | 4.58 | % | $ | 844,435 | $ | 407,962 | 5.24 | % | ||||||
Critical Accounting Policies and Estimates
Our consolidated financial statements are prepared in accordance with U.S. generally accepted accounting principles and follow general practices within the industry in which we operate. Application of these principles requires management to make complex and subjective estimates and judgments that affect the amounts reported in the consolidated financial statements and accompanying notes. We base our estimates on historical experience and on various other assumptions that we believe to be reasonable under current circumstances. These assumptions form the basis for our judgments about the carrying values of assets and liabilities that are not readily available from independent, objective sources. We evaluate our estimates on an ongoing basis. Use of alternative assumptions may have resulted in significantly different estimates. Actual results may differ from these estimates.
Accounting policies are an integral part of our financial statements. A thorough understanding of these accounting policies is essential when reviewing our reported results of operations and our financial position. We believe that the critical accounting policies and estimates discussed below involve additional management judgment due to the complexity and sensitivity of the methods and assumptions used.
Allowance for Loan Losses
The allowance for loan losses represents management's estimate of probable loan losses inherent in the Company's loan portfolio. Determining the amount of the allowance for loan losses is considered a critical accounting estimate because it requires significant judgment and the use of estimates related to the amount and timing of expected future cash flows on impaired loans, estimated losses based on risk characteristics of loans, and consideration of other qualitative factors, all of which may be susceptible to significant change. "Note 1—Summary of Significant Accounting Policies" of the notes to our audited consolidated financial statements describes the methodology used to determine the allowance for loan losses.
Accounting for Covered Loans
A significant portion of the Company's loans acquired on May 21, 2009 and covered by Loss Sharing Agreements demonstrated evidence of deterioration of credit quality since origination. We refer to these loans as ACI Loans. The accounting for these loans and the related FDIC indemnification asset requires the Company to estimate the timing and amount of cash flow to be collected from these loans and to continually update estimates of the cash flows expected to be collected over the life of the loans. These estimates are considered to be critical accounting estimates because they involve significant judgment and assumptions as to the amount and timing of cash flows to be collected.
Covered 1-4 single family residential loans were placed into homogenous pools at Acquisition and the ongoing credit quality and performance of these loans is monitored on a pool basis. We performed a detailed analysis of the acquired loan portfolio to determine the key loan characteristics influencing performance. We determined key characteristics to include delinquency status, product type, in particular, amortizing as opposed to option ARM products, current indexed LTV ratio and original FICO score. At Acquisition, the fair value of the pools was measured based on the expected cash flows to be derived from each pool. Initial cash flow expectations incorporated significant assumptions regarding prepayment rates, frequency of default and loss severity. For ACI pools, the difference between total contractual payments due and the cash flows expected to be received at Acquisition was recognized as non-accretable difference. The excess of expected cash flows over the recorded fair value of each ACI pool at Acquisition is referred to as the accretable yield and is being recognized as interest income over the life of each pool.
We monitor the pools quarterly by updating our expected cash flows to determine whether any material changes have occurred in expected cash flows that would be indicative of impairment or necessitate reclassification between non-accretable difference and accretable yield. The analysis of expected cash flows for residential ACI pools incorporates updated pool level expected prepayment rates, default rates, and delinquency levels, and loan level loss severity given default assumptions. Prepayment, delinquency and default curves used for this purpose are derived from roll rates generated from the historical performance of the ACI residential loan portfolio observed over the immediately preceding four quarters. Generally, improvements in expected cash flows less than 2% of the UPB of a pool are not recorded. This initial threshold may be revised as we gain greater experience. Generally, commercial and commercial real estate loans are monitored individually due to their size and other unique characteristics. The expected cash flows are estimated based on factors which include loan grades established in the Bank's ongoing credit review program, likelihood of default based on observations of specific loans during the credit review process as well as applicable industry data, loss severity based on updated evaluation of cash flow from available collateral, and the contractual terms of the underlying loan agreement.
Other Real Estate Owned
Assets acquired through, or in lieu of, loan foreclosure are held for sale and are initially recorded at the fair value of the collateral at the date of foreclosure based on estimates, including some obtained from third parties, less estimated costs to sell, establishing a new cost basis. Subsequent to foreclosure, valuations are periodically performed by management, and the assets are carried at the lower of cost or fair value, less estimated costs to sell. Significant property improvements that enhance the salability of the property are capitalized to the extent that the carrying value does not exceed estimated realizable value. Legal fees, maintenance and other direct costs of foreclosed properties are expensed as incurred. Given the large number of properties included in OREO, and the judgment involved in estimating fair value of the properties, accounting for OREO is regarded as a critical accounting policy.
Profits Interest Units
The LLC has issued equity awards in the form of PIUs to certain members of management. Compensation expense related to PIU awards is based on the fair value of the underlying unit on the date of the consolidated financial statements. Fair value of PIUs are estimated using a Black-Scholes option pricing model, which requires assumptions as to expected volatility, dividends, terms, and risk free rates. Determining the fair value of the PIUs is considered a critical accounting estimate because it requires significant judgments and the determination of fair value may be material to our consolidated financial statements. See "Note 1—Summary of Significant Accounting Policies" and "Note 15—Due to BUFH for Equity Awards Classified as Liabilities" of the notes to our audited consolidated financial statements for a description of PIUs.
Deferred Tax Asset
Deferred income tax assets and liabilities result from temporary differences between assets and liabilities measured for financial reporting purposes and for income tax return purposes. Realization of tax benefits for deductible temporary differences depends on having sufficient taxable income of an appropriate character within the carryforward periods. Management must evaluate the probability of realizing the deferred tax asset and determine the need for a valuation reserve as of the date of the consolidated financial statements. Given the judgment involved and the amount of the Company's deferred tax asset, this is considered a critical accounting estimate. See "Note 16—Income taxes" in the notes to our audited consolidated financial statements for a discussion of the Company's deferred taxes.
Recent Accounting Pronouncements
In June 2009, the Financial Accounting Standards Board ("FASB") issued guidance modifying the accounting for transfers and servicing of financial assets and removing the concept of a Qualifying Special Purpose Entity. This guidance was effective for transfers of financial assets occurring after December 31, 2009 and was adopted by the Company as of January 1, 2010. The adoption of this guidance did not have a material impact on the Company's financial position, results of operations or cash flows.
In June 2009, the FASB issued guidance impacting the determination of whether an entity is a variable interest entity ("VIE") and identification of the primary beneficiary of a VIE. The objective of this guidance was to improve financial reporting by enterprises involved with VIE's. This guidance was adopted by the Company as of January 1, 2010. Adoption did not have a material impact on the Company's financial position, results of operations or cash flows.
In January 2010, the FASB issued new guidance to improve disclosures about fair value measurements. Disclosure requirements were enhanced to require additional information regarding transfers to and from Levels 1 and 2 of the fair value hierarchy and the reasons for the transfers, and a gross presentation of activity within the rollforward of Level 3 fair value measurements. The guidance clarifies existing disclosure requirements as to the level of disaggregation of classes of assets and
liabilities. In addition, enhanced disclosure is required concerning inputs and valuation techniques used to determine Level 2 and Level 3 fair value measurements. This guidance is generally effective for interim and annual reporting periods beginning after December 15, 2009; however, requirements to disclose separately purchases, sales, issuances, and settlements in the Level 3 rollforward are effective for interim and annual reporting periods beginning after December 15, 2010. The adoption of this guidance did not have a material impact on the Company's financial position, results of operations or cash flows.
In March 2010, the FASB issued new guidance clarifying that a modification of a loan that is part of a pool of loans acquired with deteriorated credit quality should not result in the removal of the loan from the pool. This guidance was effective for any modifications of loans accounted for within a pool in the first interim or annual reporting period ending after July 15, 2010. The adoption of this guidance did not have a material impact on the Company's financial position, results of operations or cash flows.
In July 2010, the FASB issued new guidance requiring expanded disclosures about the credit quality of financing receivables and the allowance for loan losses. Disclosures must be disaggregated by portfolio segment and class and include, among other things, a rollforward of the allowance for loan losses, credit qualify indicators, expanded information about past due and impaired loans and the related allowance, an aging of past due loans, and information about troubled debt restructurings. The required disclosures of information as of the end of a reporting period will be effective for the Company in its annual financial statements for the year ending December 31, 2010. Required disclosures about activity that occurs during a reporting period will be effective for the Company in the quarter ending March 31, 2011. The new guidance will result in additional financial statement disclosures but will not affect the Company's financial condition, results of operations or cash flows.
Liquidity and Capital Resources
To date, stockholder's equity has been influenced primarily by earnings, and to a lesser extent, changes in the unrealized gains, net of taxes, on investment securities available for sale and changes in unrealized losses, net of taxes on cash flow hedges. Stockholder's equity increased $149.3 million, or 15.8%, from $945.0 million at inception to $1.1 billion at December 31, 2009, due to the retention of earnings and increase in unrealized gains on available for sale investment securities. Stockholder's equity increased $148.6 million, or 13.6%, to $1.2 billion at September 30, 2010, primarily due to the retention of earnings.
BankUnited must get approval by the OTS to pay dividends to its parent. Applications were filed with the OTS in August 2010 and November 2010 requesting approval to pay a quarterly dividend from BankUnited to BankUnited, Inc. Approval of the OTS was obtained via letters dated August 31, 2010 and December 3, 2010. A dividend was paid in October 2010 with another declared in December 2010.
Pursuant to the Federal Deposit Insurance Corporation Improvement Act, or FDICIA, the OTS and FDIC have adopted regulations setting forth a five-tier system for measuring the capital adequacy of the financial institutions they supervise. At September 30, 2010 and December 31, 2009, BankUnited had capital levels that exceeded the well-capitalized guidelines. In addition, a condition of approval of BankUnited's application for Federal Deposit Insurance requires BankUnited to maintain a tier 1 leverage ratio at no less than eight percent throughout the first three years of operation. To date, BankUnited has exceeded that requirement.
Liquidity involves our ability to raise funds to support asset growth or reduce assets to meet deposit withdrawals and other borrowing needs, to maintain reserve requirements and to otherwise operate the Company on an ongoing basis. The Bank's liquidity needs are primarily met by its cash position, growth in core deposits, cash flow from its amortizing investment and loan portfolios, and reimbursements under the Loss Sharing Agreements. For additional information regarding our operating, investing, and financing cash flows, see "Consolidated Financial Statements—Consolidated Statements of Cash Flows."
If necessary, the Bank has the ability to raise liquidity through collateralized borrowings, FHLB advances, or the sale of its available for sale investment portfolio. The Company's asset/liability policy has established several measures of liquidity, including liquid assets (defined as cash and cash equivalents, and pledgeable securities) to total assets. The Company's liquidity is considered acceptable if liquid assets divided by total assets exceeds 2.5%. At September 30, 2010, the Company's liquid assets divided by total assets was 13.5%.
As a holding company, BankUnited, Inc. is a corporation separate and apart from our subsidiary BankUnited, and therefore, provides for its own liquidity. BankUnited, Inc.'s main sources of funding include management fees and dividends paid by its subsidiaries, and access to capital markets. There are regulatory limitations that affect the ability of BankUnited to pay dividends to BankUnited, Inc. Management believes that such limitations will not impact our ability to meet our on-going short-term cash obligations. We declared quarterly dividends of $14.0 million on September 17 and December 9, 2010. In addition, on October 19, 2010, we declared a special one-time dividend of $6.0 million.
We expect that after consummation of this offering, our cash and liquidity requirements will be generated by operations, including reimbursements under the Loss Sharing Agreements, and we intend to satisfy our capital requirements over the next 12 months through these sources of liquidity.
Interest Rate Sensitivity
The principal component of the Company's risk of loss arising from adverse changes in the fair value of financial instruments, or market risk, is interest rate risk. The primary objective of the Company's asset/liability management activities is to maximize net interest income, while maintaining acceptable levels of interest rate risk. The Company's Asset Liability Committee, or ALCO, is responsible for establishing policies to limit exposure to interest rate risk, and to ensure procedures are established to monitor compliance with these policies. The guidelines established by ALCO are reviewed and approved by the Company's Board of Directors. However, assets and liabilities with similar repricing characteristics may not reprice at the same time or to the same degree.
Management believes that the simulation of net interest income in different interest rate environments provides the most meaningful measure of the Company's interest rate risk. Income simulation analysis is designed to capture not only the potential of all assets and liabilities to mature or reprice, but also the probability that they will do so. Income simulation also attends to the relative interest rate sensitivities of these items, and projects their behavior over an extended period of time. Finally, income simulation permits management to access the probable effects on the balance sheet not only of changes in interest rates, but also of proposed strategies for responding to them.
The Company's income simulation model analyzes interest rate sensitivity by projecting net interest income over the next twenty four months in a most likely rate scenario based on forward interest rate curves versus net interest income in alternative rate scenarios. Management continually reviews and refines its interest rate risk management process in response to the changing economic climate. Currently, the Company's model projects a plus 100, plus 200, and plus 300 basis point change (with rates increasing 25 basis points per month until the applicable limit is reached) as well as a modified flat scenario incorporating a flattened yield curve. We did not simulate a decrease in interest rates at September 30, 2010 due to the extremely low rate environment.
The Company's ALCO policy has established that interest income sensitivity will be considered acceptable if net interest income in the plus 200 basis point scenario is within 10% of forecasted net interest income in the most likely rate scenario over the next twelve months and within 12% in the second year. At September 30, 2010, the impact on projected net interest income in a plus 200 basis point scenario is 1.4% in the first twelve months and 8.8% in the second year.
These forecasts are within an acceptable level of interest rate risk per the policies established by ALCO. In the event the model indicates an unacceptable level of risk, the Company could undertake a
number of actions that would reduce this risk, including the sale of a portion of its available for sale investment portfolio or the use of risk management strategies such as interest rate swaps and caps.
Many assumptions were used by the Company to calculate the impact of changes in interest rates, including the change in rates. Actual results may not be similar to the Company's projections due to several factors including the timing and frequency of rate changes, market conditions and the shape of the yield curve. Actual results may also differ due to the Company's actions, if any, in response to the changing rates.
Off-Balance Sheet Arrangements
Commitments
We routinely enter into commitments to extend credit to our customers, including commitments to fund loans or lines of credit and commercial and standby letters of credit. The credit risk associated with these commitments is essentially the same as that involved in extending loans to customers and they are subject to our normal credit policies and approval processes. While these commitments represent contractual cash requirements, a significant portion of commitments to extend credit may expire without being drawn upon. The following table details our outstanding commitments to extend credit as of September 30, 2010(dollars in thousands):
| | Covered | Non-Covered | Total | ||||||||
|---|---|---|---|---|---|---|---|---|---|---|---|
Commitments to fund loans | $ | 4,301 | $ | 181,216 | $ | 185,517 | |||||
Unfunded commitments under lines of credit | 174,132 | 125,703 | 299,835 | ||||||||
Commercial and standby letters of credit | 1,933 | 6,896 | 8,829 | ||||||||
Total | $ | 180,366 | $ | 313,815 | $ | 494,181 | |||||
Derivative Financial Instruments
Interest rate swaps are one of the tools we use to manage interest rate risk. These derivative instruments are used to mitigate exposure to changes in interest rates on FHLB advances and time deposits. These interest rate swaps are designated as cash flow hedging instruments. The fair value of these instruments is included in other assets or other liabilities in our consolidated balance sheets and changes in fair value are reported in accumulated other comprehensive income. At September 30, 2010, outstanding interest rate swaps designated as cash flow hedges had an aggregate notional amount of $630.0 million. The aggregate fair value of interest rate swaps designated as cash flow hedges included in other liabilities at September 30, 2010 was $67.7 million.
Contractual Obligations
The following table contains supplemental information regarding our outstanding contractual obligations as of December 31, 2009(dollars in thousands):
| | Total | Less than 1 Year | 1-3 Years | 3-5 Years | More than 5 Years | ||||||||||||
|---|---|---|---|---|---|---|---|---|---|---|---|---|---|---|---|---|---|
Long-term debt obligations | $ | 2,226,938 | $ | 472,849 | $ | 1,245,083 | $ | 509,006 | $ | — | |||||||
Operating lease obligations | 51,837 | 8,665 | 24,393 | 10,871 | 7,908 | ||||||||||||
Service contracts and purchase obligations | — | — | — | — | — | ||||||||||||
Certificates of deposits | 4,633,823 | 3,677,617 | 834,759 | 121,447 | — | ||||||||||||
Other long-term liabilities reflected on the balance sheet | — | — | — | — | — | ||||||||||||
Total | $ | 6,912,598 | $ | 4,159,131 | $ | 2,104,235 | $ | 641,324 | $ | 7,908 | |||||||
Summary
BankUnited, Inc. is a savings and loan holding company with two wholly-owned subsidiaries: BankUnited, which is one of the largest independent depository institution headquartered in Florida by assets, and BankUnited Investment Services, a Florida insurance agency which provides comprehensive wealth management products and financial planning services. BankUnited is a federally-chartered, federally-insured savings association headquartered in Miami Lakes, Florida, with $11.2 billion of assets, more than 1,100 professionals and 78 branches in 13 counties at September 30, 2010. Our goal is to build a premier, large regional bank with a low-risk, long-term value-oriented business model focused on small and medium sized businesses and consumers. We endeavor to provide personalized customer service and offer a full range of traditional banking products and financial services to both our commercial and consumer customers, who are predominantly located in Florida.
BankUnited, Inc. was organized by a management team led by our Chairman, President and Chief Executive Officer, Mr. Kanas, on April 28, 2009 and was initially capitalized with $945.0 million by a group of investors. On May 21, 2009, BankUnited was granted a savings association charter and the newly formed bank acquired substantially all of the assets and assumed all of the non-brokered deposits and substantially all other liabilities of the Failed Bank from the FDIC in the Acquisition. Concurrently with the Acquisition, we entered into the Loss Sharing Agreements, which cover certain legacy assets, including the entire legacy loan portfolio and OREO, and certain purchased investment securities, including private-label mortgage-backed securities and non-investment grade securities.
Since the Bank's establishment in May 2009, we have pursued our new strategy and as part of this strategy we have recruited a new executive management team and substantially enhanced our middle management team, redesigned the Bank's underwriting functions, and have begun the process of improving the Bank's information technology systems and optimizing our existing branch network. For the nine months ended September 30, 2010, the Company was one of the most profitable and well-capitalized bank holding companies in the United States, having earned 1.9% on its average assets and 17.7% on its average common stockholder's equity, and achieved a 41.9% efficiency ratio. BankUnited's tier 1 leverage ratio was 10.1% and its tier 1 risk-based capital ratio was 42.5% at September 30, 2010. The Company's tangible common equity ratio was 10.7% at September 30, 2010. We intend to invest our excess capital to grow opportunistically both organically and through acquisitions.
Our management team is led by Mr. Kanas, a veteran of the banking industry who built North Fork into a leading regional bank. At the time of its sale to Capital One in December 2006, North Fork was one of the top 25 bank holding companies in the United States. Mr. Kanas served as the Chairman of North Fork from 1986 to 2006 and President and Chief Executive Officer of North Fork from 1977 to 2006. Through organic growth and over 15 acquisitions, Mr. Kanas oversaw the growth and expansion of North Fork from less than $1 billion in assets in 1977 to nearly $60 billion in assets by 2006. According to FactSet Research Systems, while for the five-year period prior to its sale to Capital One, North Fork generated a total annualized return of 11.2%, which equaled the median total annualized return of the top fifty U.S. bank holding companies (excluding North Fork) by assets, for the ten-year period, North Fork generated a total annualized return of 20.5%, compared to a median total annualized return of 14.5%. North Fork distinguished itself as one of the most efficient banking companies in the United States through Mr. Kanas' vision of safe and prudent expansion, cost control and capital management. North Fork was sold to Capital One in December 2006 for $13.2 billion, or 4.0 times tangible equity, a transaction multiple higher than both the median transaction multiple of 3.2 for sales of banks with assets between $10 billion and $30 billion and the median transaction multiple of 3.0 for sales in the banking industry during the period from 2000 to 2006.
The Acquisition
Overview
On May 21, 2009 BankUnited entered into the Purchase and Assumption Agreement with the FDIC, Receiver of the Failed Bank, to acquire substantially all of the assets and assume all of the non-brokered deposits and substantially all other liabilities of the Failed Bank. Excluding the effects of acquisition accounting adjustments, BankUnited acquired $13.6 billion of assets and assumed $12.8 billion of liabilities. The fair value of the assets acquired was $10.9 billion and the fair value of the liabilities assumed was $13.1 billion. BankUnited received a net cash consideration from the FDIC in the amount of $2.2 billion.
The Acquisition consisted of assets with a fair value of $10.9 billion, including $5.0 billion of loans (with a corresponding UPB of $11.2 billion), a $3.4 billion FDIC indemnification asset, $538.9 million of investment securities, $1.2 billion of cash and cash equivalents, $177.7 million of foreclosed assets, $243.3 million of FHLB stock and $347.4 million of other assets. Liabilities with a fair value of $13.1 billion were also assumed, including $8.3 billion of non-brokered deposits, $4.6 billion of FHLB advances, and $112.2 million of other liabilities.
Several elements of our Acquisition are favorable relative to other FDIC-assisted transactions and position the Company to generate significant value. At the time of the Acquisition, bank failures were on the rise and the U.S. Treasury's unprecedented Supervisory Capital Assessment Program for the largest U.S. bank holding companies was underway. Due in part to the distress in the banking system, economic uncertainty and poor capital markets conditions, the Covered Loans and OREO were purchased by the Bank in a bidding process for 76.5% of their $11.4 billion in UPB as of the Acquisition date, which represented the fair market value for those assets at that time. The discount was one of the largest relative to other FDIC-assisted transactions and reflected, in addition to the above mentioned factors, the poor quality of the assets acquired as noted by the ratio of non-performing assets to total assets of 23.5% at May 21, 2009. In addition, the Company's bid included the granting of a warrant to the FDIC, allowing the FDIC to participate in the economic upside of the transaction if certain performance levels are achieved. Along with the pricing terms, the Loss Sharing Agreements and the size of the transaction enable the Company to generate significant capital even in severe loss scenarios. For example, in the worst case scenario of a 100% credit loss on all Covered Loans and OREO, we would recover no less than 89.7% of the UPB as of the Acquisition date, assuming compliance with the terms of the Loss Sharing Agreements.
Furthermore, the Loss Sharing Agreements include attractive provisions that optimize our flexibility and reduce our risk associated with the Covered Assets, including the following:
We view our relationship with the FDIC as a long-term partnership in which both parties are economically aligned to minimize credit losses on the Covered Assets.
Loss Sharing Agreements
Concurrently with the Acquisition, the Bank entered into the Loss Sharing Agreements with the FDIC that cover certain legacy assets, including the entire loan portfolio and OREO, and certain purchased investment securities, including private-label mortgage-backed securities and non-investment grade securities. At September 30, 2010, the Covered Assets consisted of assets with a book value of $4.3 billion. The total UPB (or, for investment securities, unamortized cost basis) of the Covered Assets at September 30, 2010 was $8.9 billion. The Bank acquired other BankUnited, FSB assets that are not covered by the Loss Sharing Agreements with the FDIC including cash, certain investment securities purchased at fair market value and other tangible assets. The Loss Sharing Agreements do not apply to subsequently acquired, purchased or originated assets.
Pursuant to the terms of the Loss Sharing Agreements, the Covered Assets are subject to a stated loss threshold whereby the FDIC will reimburse the Bank for 80% of losses up to the $4.0 billion stated threshold and 95% of losses in excess of the $4.0 billion stated threshold, calculated, in each case, based on UPB (or, for investment securities, unamortized cost basis) plus certain interest and expenses. The carrying value of the FDIC indemnification asset at September 30, 2010 was $2.7 billion. The Bank will reimburse the FDIC for its share of recoveries with respect to losses for which the FDIC paid the Bank a reimbursement under the Loss Sharing Agreements. The FDIC's obligation to reimburse the Company for losses with respect to the Covered Assets began with the first dollar of loss incurred.
The Covered Securities acquired in connection with the Acquisition include certain private-label mortgage-backed securities and non-investment grade securities. The Covered Loans acquired in connection with the Acquisition include all:
The Loss Sharing Agreements consist of a single family shared-loss agreement or the Single Family Shared-Loss Agreement, and a commercial and other loans shared-loss agreement, or the Commercial Shared-Loss Agreement. The Single Family Shared-Loss Agreement provides for FDIC loss sharing and the Bank's reimbursement for recoveries to the FDIC for ten years from May 21, 2009 for single family residential loans. The Commercial Shared-Loss Agreement provides for FDIC loss sharing for five years from May 21, 2009 and the Bank's reimbursement for recoveries to the FDIC for eight years from May 21, 2009 for all other Covered Assets.
Under the Purchase and Assumption Agreement, the Bank may sell up to 2.5% of the Covered Loans based on the UPB at Acquisition, or approximately $280.0 million, on an annual basis without prior consent of the FDIC. Any losses incurred from such loan sale are covered under the Loss Sharing Agreements. Any loan sale in excess of the annual 2.5% of the Covered Loans requires approval from the FDIC to be eligible for loss share coverage. However, if the Bank seeks to sell residential or non-residential loans in excess of the agreed 2.5% threshold in the nine months prior to the tenth anniversary or the fifth anniversary, respectively, and the FDIC refuses to consent, then the Single Family Shared-Loss Agreement and the Commercial Shared-Loss Agreement will be extended for two years after their respective anniversaries. The terms of the Loss Sharing Agreements are extended only
with respect to the loans to be included in such sales. The Bank will have the right to sell all or any
portion of such loans without FDIC consent at any time within the nine months prior to the respective extended termination dates, and any losses incurred will be covered under the Loss Sharing Agreements. If exercised, this final sale mechanism ensures no residual credit risk in our Covered Loan portfolio that would otherwise arise from credit losses occurring after the five- and ten-year periods, respectively.
The Loss Sharing Agreements require us to follow specific servicing procedures and to undertake loss mitigation efforts. Additionally, the FDIC has information rights with respect to our performance under the Loss Sharing Agreements, requiring us to maintain detailed compliance records.
We have received $997.2 million from the FDIC in reimbursements under the Loss Sharing Agreements for claims filed for losses incurred as of September 30, 2010.
Our Competitive Strengths
We believe that we are especially well positioned to create value for our stockholders.
significant capacity and delivers comprehensive commercial and consumer products and services. We have made other significant investments in financial reporting and servicing systems. We believe we are creating a technology platform that will allow us to compete effectively with large regional banking institutions.
Our Market Area
We view our market as the southeast region of the United States with a current focus on Florida, and in particular the Miami MSA. We believe Florida represents a long-term attractive banking market. According to estimates from SNL Financial, from June 30, 2000 to June 30, 2010, Florida added 2.9 million new residents, the third most of any U.S. state, and, at June 30, 2010, had a total population of 18.9 million and a median household income of $49,910. Additionally, the state has 1.9 million active businesses. We believe Florida's population provides tremendous opportunities for us to grow our business. At June 30, 2010, BankUnited ranked 11th in deposit market share in Florida and 6th in the Miami MSA, according to SNL Financial.
Florida's economy and banking industry continue to face significant challenges. Since 2007, many Florida banks have experienced capital constraints and liquidity challenges as a result of significant losses from loans with poor credit quality and investments that have had sizeable decreases in value or realized losses. The undercapitalization and increased regulation of the banking sector have caused many banks to reduce lending to new and existing clients and focus primarily on improving their balance sheets, putting pressure on commercial borrowers to look for new banking relationships. As of September 30, 2010, 40 banks with $31.8 billion in assets have failed since 2008 in Florida. Given our competitive strengths, including an experienced management team, robust capital position and scalable platform, we believe these challenges present significant acquisition and organic growth opportunities for us.
Over time, we will look to expand our branch network outside of Florida in selected markets such as New York, where our management team has had significant experience and has the competitive advantage of having managed one of the most successful regional banks in that market. However, Mr. Kanas and Mr. Bohlsen, two of our named executive officers, are subject to non-compete agreements which expire in August 2012 and may restrict them from operating in New York, New Jersey and Connecticut.
Our Business Strategy
Since the Acquisition, we have focused on the financial needs of small and medium sized businesses and consumers throughout Florida. Through BankUnited, we deliver a comprehensive range of traditional depository and lending products, online services and cash management tools for businesses. We also offer on a national basis commercial lease financing services through United Capital Business Lending and municipal leasing services through Pinnacle Public Finance. Through our non-bank subsidiary, BankUnited Investment Services, we offer a suite of products including mutual funds, annuities, life insurance, individual securities and other wealth management services.
Our goal is to build a premier, large regional bank in attractive growth markets, employing the following key elements:
driven, relationship-based, business-focused bank. We have taken an active approach to accomplish this transformation, including:
With the changes implemented as discussed above, we have increased our core deposits since the Acquisition to September 30, 2010 from $2.1 billion to $3.8 billion and lowered our cost of deposits (excluding the impact of accretion from fair value adjustments due to acquisition accounting) from 3.5% to 1.6%. In addition, since the Acquisition to September 30, 2010, we have generated $429.5 million of new commercial and commercial real estate loan commitments.
complementary acquisitions of select banking and banking-related businesses. For example, we recently acquired two leasing businesses, which serve as the platform for us to provide commercial financing services on a national basis.
with our primary regulator. Additionally, we view our relationship with the FDIC as a long-term partnership in which both parties are economically aligned to minimize credit losses on the Covered Assets. We continually collaborate with the FDIC to develop and implement new loss mitigation strategies for the Covered Assets. We have received $997.2 million from the FDIC in reimbursements under the Loss Sharing Agreements for claims filed for losses incurred as of September 30, 2010.
Products and Services
Loan Origination Activities
General. Our primary lending focus is to serve consumers, commercial and middle-market businesses and their executives with a variety of financial products and services, while maintaining a strong and disciplined credit policy and procedures.
We offer a full array of lending products that cater to our customers' needs including small business loans, residential mortgage loans, commercial real estate loans, equipment loans, term loans, asset-backed loans, letters of credit and commercial lines of credit. Our lending products, policies and practices are not the same as that of the BankUnited, FSB. In particular, we do not originate or purchase negatively amortizing residential loans. As part of our loan activities, we also purchase performing residential loans on a national basis.
Concurrently with the Acquisition, nearly all lending was stopped until we developed a new lending policy which we implemented in October 2009. As of September 30, 2010, the loan portfolio includes $344.3 million in loans originated or purchased since the Acquisition. This includes $175.0 million in commercial loans, $92.6 million in commercial real estate loans and $76.7 million in residential and consumer loans. In addition, we have undrawn commitments of $132.0 million, primarily on commercial loans.
Commercial loans. At September 30, 2010, $175.0 million, or 50.8%, of our total new bank loan portfolio consisted of commercial loans. Our commercial loans, which are generally made to small and middle-market businesses primarily in Florida, include equipment loans, lines of credit, acquisition finance credit facilities and an array of Small Business Administration product offerings, and typically have maturities of 5 years or less.
Commercial real estate loans. At September 30, 2010, $92.6 million, or 26.9%, of our new bank loan portfolio consisted of commercial real estate loans. We offer term financing for the acquisition or refinancing of properties, primarily rental apartments, industrial properties, retail shopping centers and free-standing buildings, office buildings and hotels located primarily in Florida. Other products that we provide include secured lines of credit, acquisition, development and construction loan facilities and construction financing.
Residential real estate loans. At September 30, 2010, $71.2 million, or 20.7%, of our new bank loan portfolio consisted of both purchased ($48.4 million) and originated ($22.8 million) residential real estate loans. We have decided to purchase loans to supplement our nascent mortgage origination platform and to geographically diversify our loan portfolio given the current credit market environment of the non-agency mortgage market in Florida. While the credit parameters we use for purchased loans are substantially similar to the underwriting guidelines we use for originated loans, differences include: (i) loans are purchased on a nationwide basis, while originated loans are currently limited to Florida; (ii) purchased loans, on average, have a higher principal balance than originated loans; and (iii) we consider payment history in selecting which seasoned loans to purchase, while such information is not available for originated loans. We provide one-to-four family residential real estate loans with terms ranging from 10 to 40 years, with either fixed or adjustable interest rates. Loans are currently offered to customers primarily in Florida through BankUnited branches and loan officers. We do not originate subprime loans or option ARM loans. Loans are typically closed-end first lien loans for purposes of property purchased, or for refinancing existing loans with or without cashout. The majority of our loans are owner occupied, full documentation loans.
Consumer loans. At September 30, 2010, $5.4 million, or 1.6%, of our total new bank loan portfolio consisted of consumer loans. We offer consumer loans to our customers primarily in Florida for personal, family and household purposes, including home equity loans, auto, boat and personal installment loans.
Lease financing. In the fourth quarter of 2010, we acquired two leasing businesses. We now provide secured loan and lease programs for small and medium sized businesses on a national basis through United Capital Business Lending. These loans and leases are typically used for equipment purchases and upgrades, business expansion and acquisition purposes. Through Pinnacle Public Finance, we also offer tax-exempt leasing to municipalities and governmental entities nationwide for the financing of essential-use assets.
Credit Policy and Procedures
The fundamental principles of the Bank's credit policy and procedures are to maintain high quality credit standards, which enhance the long term value of the Bank to its customers, employees, stockholders and communities. Credit quality is a key corporate objective that is managed in concert with other key objectives including volume growth, earnings and expense management. We recognize that our credit policy and procedures are dynamic and responsive to the market place. It is the foundation of our credit culture.
The Board of Directors of the Bank is responsible for the safety and soundness of the Bank. As such, they are charged to monitor the efforts of the Bank's management activities. Since lending represents risk exposure, our Board and its duly appointed committees seek to ensure that the Bank maintains high credit quality standards.
The Bank has established asset oversight committees to administer the loan portfolio. These committees include: (i) the Enterprise Risk Management Committee; (ii) the Credit Risk Management Committee; (iii) the Asset Recovery Committee; and (iv) the Criticized Asset Committee. These committees meet at least quarterly to review and approve the lending activities of the Bank.
The credit approval process at the Bank provides for the prompt and thorough underwriting and approval or decline of loan requests. The approval method used is a hierarchy of individual lending authorities for new credits and renewals. The Credit Risk Management Committee approves loan authorities for lending and credit personnel, which are ultimately submitted to our Board for ratification. Lending authorities are based on position, capability and experience of the individuals filling these positions. Authorities are periodically reviewed and updated.
The Bank has established in-house borrower lending limits which are significantly lower than its legal lending limit of approximately $169.4 million, at September 30, 2010. The present in-house lending limit is set at $25.0 million based on total credit exposure of a borrower. However, exceptions to this limit may be made up to $40.0 million of total credit exposure if approved by the Chief Lending Officer and Chief Executive Officer of the Bank. These limits are reviewed periodically by the Credit Risk Management Committee and approved annually by our Board.
Deposits
We offer traditional depository products including checking accounts, money market deposit accounts, savings accounts and certificates of deposit with a variety of rates. Our deposits are insured by the FDIC up to statutory limits. At September 30, 2010, the balance of our interest bearing deposits was $6.8 billion, representing 93.3% of our total deposits, and the balance of our non-interest bearing deposits was $492.5 million, representing 6.7% of our total deposits. Our strategy is to increase our mix of core deposits and reduce our time deposits portfolio. We have a service fee schedule, which is competitive with other financial institutions in our market, covering such matters as maintenance fees on checking accounts, per item processing fees on checking accounts, returned check charges and similar fees.
Wealth Management
Through dedicated financial consultants and licensed bankers, BankUnited Investment Services provides a comprehensive wealth management product offering that includes mutual funds, annuities, life insurance, and individual securities. We also provide comprehensive succession planning, estate planning, and financial planning to individuals and business owners. We use a third-party financial services company to provide our trading platform, administrative and back office support, and provide our customers with 24-hour access to account balances and summaries, positions and portfolio views, transaction detail, customized portfolio view, and online statements.
Investments
The primary objectives of our investment policy are to provide liquidity necessary for the day-to-day operations of the Company, provide a suitable balance of high credit and diversified quality assets to the consolidated balance sheet, manage interest rate risk exposure, and generate acceptable returns given the Company's established risk parameters.
The investment policy is reviewed annually by our Board of Directors. Overall investment goals are established by our Board, Chief Executive Officer, Chief Financial Officer, and members of ALCO. The Board has delegated the responsibility of monitoring our investment activities to ALCO. Day-to-day activities pertaining to the investment portfolio are conducted within the Company's Treasury Division under the supervision of the Chief Financial Officer.
As part of the Acquisition, we acquired an investment portfolio with a fair value of $538.9 million. Of these assets, $252.9 million consisted of private-label mortgage-backed securities and corporate securities which are covered by the Commercial Shared-Loss Agreement. The remaining $286.0 million consisted of Treasury securities, municipal securities and mortgage-backed securities issued by the U.S. Government agency and sponsored enterprises, and are not covered by the Loss Sharing Agreements.
Our strategy for investment security purchases since the Acquisition has been to achieve the objectives noted above, with an emphasis on managing interest rate risk exposure and maintaining liquidity in the portfolio.
Marketing and Distribution
We conduct our banking business through 78 branches located in 13 coastal counties throughout Florida as of September 30, 2010. Our distribution network also includes 73 ATMs, fully integrated on-line banking, and a telephone banking service. We target growing companies and commercial and middle-market businesses, as well as individual consumers throughout Florida.
In order to market our deposit products, we use local print advertising and direct mail and provide sales incentives for our employees.
Competition
The primary market we serve is Florida. Our market is highly competitive. Our market contains not only a large number of community and regional banks, but also a significant presence of the country's largest commercial banks. We compete with other state and national financial institutions located in Florida and adjoining states as well as savings associations, savings banks and credit unions for deposits and loans. In addition, we compete with financial intermediaries, such as consumer finance companies, mortgage banking companies, insurance companies, securities firms, mutual funds and several government agencies as well as major retailers, all actively engaged in providing various types of loans and other financial services. Our largest banking competitors in our market include Bank of America, BankAtlantic, BB&T, JPMorgan Chase, Regions Bank, SunTrust Banks, TD Bank and Wells Fargo.
Interest rates, both on loans and deposits, and prices of fee-based services are significant competitive factors among financial institutions generally. Other important competitive factors include office location, office hours, quality of customer service, community reputation, continuity of personnel
and services, and, in the case of larger commercial customers, relative lending limits and ability to offer sophisticated cash management and other commercial banking services. While we continue to provide competitive interest rates on both depository and lending products, we believe that we can compete most successfully by focusing on the financial needs of growing companies and their executives, consumers and commercial and middle-market businesses, and offering them a broad range of personalized services and sophisticated cash management tools tailored to their businesses. We also believe that further volatility and consolidation in the banking industry would create additional opportunities for us to enhance our competitive position.
Information Technology Systems
Information Technology and Bank Operations
We have recently made and continue to make significant investments in our information technology systems for our banking and lending operations and cash management activities. We believe this is a necessary investment in order to enhance our capabilities to offer new products and overall customer experience, and to provide scale for future growth and acquisitions. Critical enhancements include the consolidation of all residential servicing to a leading servicing platform, upgrading our general ledger system, selecting an automated anti-money laundering software solution and enhancing other ancillary systems. We are also in the process of converting our core deposit banking system to more effectively automate bank transactions for our branches, improve our commercial and consumer loan origination, electronic banking and direct response marketing processes, as well as enhance cash management, streamlined reporting, reconciliation support, and sales support.
The majority of our systems including our EFT, transaction processing and our online banking services are hosted by third-party service providers. Additionally, we rely on a leading third-party provider to provide a comprehensive, fully integrated solution that gives us the ability to automate areas of our residential loan servicing, including loan set-up and maintenance, customer service,
cashiering, escrow administration, investor accounting, default management, corporate accounting and federal regulatory reporting. The scalability of this new infrastructure will support our growth strategy. In addition, the capability of these vendors to automatically switch over to standby systems allows us to recover our systems and provide business continuity very quickly in case of a disaster.
Loan Servicing
Substantially all of our loans are serviced by us. Since the Acquisition, we have invested heavily in our loan servicing platform to ensure we are taking best efforts in minimizing losses on the Covered Loans. Additionally, we have been an active participant in HAMP since 2009, which focuses on helping at-risk homeowners avoid foreclosure by reducing payments through interest rate reduction, term extension, principal forbearance and principal forgiveness. As of September 30, 2010, 8,860 borrowers have been counseled regarding their participation in HAMP, resulting in 1,878 permanent loan modifications and 225 active trial modifications.
Employees
At September 30, 2010, we employed 1,145 full-time employees and 24 part-time employees. None of our employees are parties to a collective bargaining agreement. We believe that our relations with our employees are good.
Facilities
We currently lease 120,672 square feet of office and operations space in Miami Lakes, Florida. This space includes our principal executive offices, operations center and a retail branch. We provideAt September 30, 2010, we provided banking services at 78 branch locations in 13 Florida counties. Of the 78 branch properties, we leaseleased 75 locations and ownowned 3 locations.
WeAt September 30, 2010, we also dedicatededicated approximately 2,100 square feet of office and operations space in Miami Lakes, Florida to house BankUnited Investment Services, 10,619 square feet of office and operations space in
Hunt Valley, Maryland to house United Business Capital Lending, and 5,488 square feet of office and operations space in Scottsdale, Arizona to house Pinnacle Public Finance.
We believe that our facilities are in good condition and are adequate to meet our operating needs for the foreseeable future.
Legal Proceedings
From time to time we are a party to various litigation matters incidental to the conduct of our business. We are not presently party to any legal proceedings the resolution of which we believe would have a material adverse effect on our business, operating results, financial condition or cash flow.
The U.S. banking industry is highly regulated under federal and state law. These regulations affect the operations of the Company and its subsidiaries. You should understand that the primary objective of the U.S. bank regulatory system is the protection of depositors, not the protection of stockholders.
Statutes, regulations and policies limit the activities in which we may engage and the conduct of our permitted activities. Further, the regulatory system imposes reporting and information collection obligations. We incur significant costs relating to compliance with these laws and regulations. Banking statutes, regulations and policies are continually under review by federal and state legislatures and regulatory agencies, and a change in them, including changes in how they are interpreted or implemented, could have a material adverse effect on our business.
The material statutory and regulatory requirements that are applicable to us are summarized below. The description below is not intended to summarize all laws and regulations applicable to us.
BankUnited as a Federal Savings Association
BankUnited is a federal savings association organized under the federal Home Owners' Loan Act, or HOLA. A federal savings association is commonly referred to as a federal thrift. As a federal thrift, BankUnited is currently subject to ongoing and comprehensive supervision, regulation, examination and enforcement by the OTS. Recent changes in the law will, in the future, shift principal regulatory jurisdiction over BankUnited from the OTS to the OCC. We are in the process of evaluating the potential practical implications of this shift in regulatory jurisdiction, such as possible changes in how the Bank's regulators will examine it and what new or different standards they may apply to the Bank. To date, the Bank's regulators have not announced any details about their plans for the shift in regulatory jurisdiction and, consequently, we are not in a position at this time to know or ascertain what the actual practical implications of the shift will be for the Bank. Because BankUnited does not have plans to convert to a national bank, the existing OTS regulations will continue to apply to BankUnited, although the OCC may decide to modify these regulations.
The Company as a Savings and Loan Holding Company
Any entity that acquires direct or indirect control of a thrift must obtain prior approval of the OTS to become a savings and loan holding company, or SLHC. The Company, which controls BankUnited, received OTS approval on May 21, 2009, to become a SLHC. As a SLHC, the Company is currently subject to ongoing and comprehensive supervision, regulation, examination and enforcement by the OTS. This OTS jurisdiction also extends to any company that is directly or indirectly controlled by us. Recent changes in the law will, in the future, shift principal regulatory jurisdiction over the Company to the Federal Reserve. We are in the process of evaluating the potential practical implications of this shift in regulatory jurisdiction, such as possible changes in how the Company's regulators will examine it and what new or different standards they may apply to the Company; however, as a result of this shift, we expect that BankUnited, Inc. will be subject to specific minimum capital ratios for the first time. To date, the Company's regulators have not announced any details about their plans for the shift in regulatory jurisdiction and, consequently, we are not in a position at this time to know or ascertain what the actual practical implications of the shift will be.
FDIC Deposit Insurance
The FDIC is an independent federal agency that insures the deposits of federally insured depository institutions up to applicable limits. The FDIC also has certain regulatory, examination and enforcement powers with respect to FDIC-insured institutions. The deposits of BankUnited are insured by the FDIC up to applicable limits. As a general matter, the maximum deposit insurance amount is $250,000 per depositor.
Broad Supervision, Examination and Enforcement Powers
A principal objective of the U.S. bank regulatory system is to protect depositors by ensuring the financial safety and soundness of banks. To that end, the banking regulators have broad regulatory, examination, and enforcement authority. The regulators regularly examine the operations of federal thrifts and SLHCs. In addition, federal thrifts and SLHCs are subject to periodic reporting requirements.
The regulators have various remedies available if they determine that the financial condition, capital resources, asset quality, earnings prospects, management, liquidity or other aspects of a banking organization's operations are unsatisfactory. The regulators may also take action if they determine that the banking organization or its management is violating or has violated any law or regulation. The regulators have the power to, among other things:
The FDIC may terminate a depository institution's deposit insurance upon a finding that the institution's financial condition is unsafe or unsound or that the institution has engaged in unsafe or unsound practices or has violated any applicable rule, regulation, order or condition enacted or imposed by the institution's regulatory agency. Engaging in unsafe or unsound practices or failing to comply with applicable laws, regulations and supervisory agreements could subject the Company, and subsidiaries of the Company, or their officers, directors, and institution-affiliated parties to the remedies described above and other sanctions.
Conditions of Approval Orders
On May 21, 2009, we received approvals from the OTS and FDIC for the organization of BankUnited as a federal thrift, for the Company to become a SLHC, and for BankUnited to obtain federal deposit insurance. Those approval orders contained conditions related to the conduct of our business. Those conditions include, among other things, the following requirements:
The Dodd-Frank Act
On July 21, 2010, President Obama signed the Dodd-Frank Act into law. The Dodd-Frank Act will have a broad impact on the financial services industry, imposing significant regulatory and compliance changes, including the designation of certain financial companies as systemically significant, the imposition of increased capital, leverage, and liquidity requirements, and numerous other provisions designed to improve supervision and oversight of, and strengthen safety and soundness within, the financial services sector. Additionally, the Dodd-Frank Act establishes a new framework of authority to conduct systemic risk oversight within the financial system to be distributed among new and existing federal regulatory agencies, including the Financial Stability Oversight Council, or Council, the Federal Reserve, the OCC, and the FDIC. Of particular relevance to the Company, the Dodd-Frank Act makes fundamental changes to the federal supervisory oversight structure for federal thrifts and SLHCs.
The following items provide a brief description of certain provisions of the Dodd-Frank Act.
Many of the requirements of the Dodd-Frank Act will be implemented over time and most will be subject to regulations implemented over the course of several years. Given the uncertainty associated with the manner in which the provisions of the Dodd-Frank Act will be implemented by the various regulatory agencies and through regulations, the full extent of the impact such requirements will have on our operations is unclear. The changes resulting from the Dodd-Frank Act may impact the profitability of our business activities, require changes to certain of our business practices, impose upon us more stringent capital, liquidity and leverage requirements or otherwise adversely affect our business. These changes may also require us to invest significant management attention and resources to evaluate and make any changes necessary to comply with new statutory and regulatory requirements. Failure to comply with the new requirements may negatively impact our results of operations and financial condition. While we cannot predict what effect any presently contemplated or future changes in the laws or regulations or their interpretations would have on us, these changes could be materially adverse to our investors.
Notice and Approval Requirements Related to Control
Banking laws impose notice, approval, and ongoing regulatory requirements on any stockholder or other party that seeks to acquire direct or indirect "control" of an FDIC-insured depository institution. These laws include the Savings and Loan Holding Company Act, the Bank Holding Company Act of 1956 and the Change in Bank Control Act. Among other things, these laws require regulatory filings by a stockholder or other party that seeks to acquire direct or indirect "control" of an FDIC-insured depository institution. The determination whether an investor "controls" a depository institution is based on all of the facts and circumstances surrounding the investment. As a general matter, a party is deemed to control a depository institution or other company if the party owns or controls 25% or more of any class of voting stock. Subject to rebuttal, a party may be presumed to control a depository institution or other company if the investor owns or controls 10% or more of any class of voting stock. Ownership by affiliated parties, or parties acting in concert, is typically aggregated for these purposes. If a party's ownership of the Company were to exceed certain thresholds, the investor could be deemed to "control" the Company for regulatory purposes. This could subject the investor to regulatory filings or other regulatory consequences.
Permissible Activities and Investments
Banking laws generally restrict the ability of the Company and its subsidiaries from engaging in activities other than those determined by the Federal Reserve to be so closely related to banking as to be a proper incident thereto. The Gramm-Leach-Bliley Financial Modernization Act of 1999, or GLB
Act, expanded the scope of permissible activities for a bank holding company that qualifies as a financial holding company. Under the regulations implementing the GLB Act, a financial holding company may engage in additional activities that are financial in nature or incidental or complementary to a financial activity. Those activities include, among other activities, certain insurance and securities activities. Qualifications for becoming a financial holding company include, among other things, meeting certain specified capital standards and achieving certain management ratings in examinations. Under the Dodd-Frank Act, SLHCs like the Company must be well-capitalized and well managed in the same manner as bank holding companies in order to engage in the expanded financial activities permissible only for a financial holding company.
In addition, as a general matter, the establishment or acquisition by the Company of a depository institution or, in certain cases, a non-banking financing entity, requires prior regulatory approval.
Regulatory Capital Requirements and Prompt Corrective Action
The regulators view capital levels as important indicators of an institution's financial soundness. As a general matter, FDIC-insured depository institutions and their holding companies are required to maintain minimum capital relative to the amount and types of assets they hold. The final supervisory judgment on an institution's capital adequacy is based on the regulator's individualized assessment of numerous factors.
BankUnited is subject to various regulatory capital adequacy requirements. The FDICIA requires that the federal regulatory agencies adopt regulations defining five capital tiers for depository institutions: well-capitalized, adequately capitalized, undercapitalized, significantly undercapitalized and critically undercapitalized. Failure to meet minimum capital requirements can initiate certain mandatory, and possibly additional discretionary, actions by regulators that could have a direct material adverse effect on our financial condition.
The regulators have established quantitative measures that require that an FDIC-insured depository institution (such as BankUnited) to maintain minimum ratios of capital to risk-weighted assets. There are two main categories of capital under the guidelines. Tier 1 capital includes common equity holders' equity, qualifying preferred stock and trust preferred securities, less goodwill and certain other deductions (including a portion of servicing assets and the unrealized net gains and losses, after taxes, on securities available for sale). Tier 2 capital includes preferred stock not qualifying as tier 1 capital, subordinated debt, the allowance for credit losses and net unrealized gains on marketable equity securities, subject to limitations by the guidelines. Tier 2 capital is limited to the amount of tier 1 capital (i.e., at least half of the total capital must be in the form of tier 1 capital). Under the risk-based guidelines, capital is compared with the relative risk related to the balance sheet. To derive the risk included in the balance sheet, a risk weighting is applied to each balance sheet asset and off-balance sheet item, primarily based on the relative credit risk of the counterparty. For example, claims guaranteed by the U.S. government or one of its agencies are risk-weighted at 0% and certain real-estate related loans risk-weighted at 50%. Off-balance sheet items, such as loan commitments and derivatives, are also applied a risk weight after calculating balance sheet equivalent amounts.
In order to be deemed well-capitalized, FDIC-insured depository institutions (such as BankUnited) currently are required to (i) maintain a total risk-based capital ratio of 10% or greater, a tier 1 risk-based capital ratio of 6% or greater and a tier 1 leverage ratio of 5% or greater (measured as tier 1 capital to adjusted total assets) and (ii) not be subject to any written agreement, order, capital directive or prompt corrective action issued by its banking regulator(s) to meet and maintain a specific capital level for any capital measure. The regulators may set higher capital requirements for an individual institution when particular circumstances warrant. The OTS requires BankUnited to maintain a tier 1 capital to adjusted total assets leverage ratio of not less than 8% for the first three years of its operation. At September 30, 2010, the Bank's tier 1 leverage ratio was equal to 10.1%.
By January 2012, the OCC will assume the OTS' powers with respect to federal savings associations (like BankUnited), as well as rulemaking authority over all savings associations (except for the limited rulemaking authority transferred to the Federal Reserve). Although the federal banking agencies have substantially similar capital adequacy standards and utilize the same accounting standards, some differences in capital standards exist, such as the regulatory treatment of noncumulative perpetual preferred stock and the risk-weightings assigned to certain assets. The OCC also limits the amount of subordinated debt and intermediate-term preferred stock that may be treated as part of tier 2 capital to 50% of tier 1 capital, whereas the OTS does not prescribe such a restriction. Finally, the OCC recognizes an additional category, "tier 3 capital," consisting of forms of unsecured, subordinated debt that can be allocated for market risk and is included in the total risk-based capital ratio numerator.
At this time the bank regulatory agencies are more inclined to impose higher capital requirements in order to meet well-capitalized standards, and future regulatory change could impose higher capital standards as a routine matter. The regulators may also set higher capital requirements for holding companies whose circumstances warrant it. For example, holding companies experiencing internal growth or making acquisitions are expected to maintain strong capital positions substantially above the minimum supervisory levels, without significant reliance on intangible assets.
As an additional means to identify problems in the financial management of depository institutions, the FDI Act requires federal bank regulatory agencies to establish certain non-capital safety and soundness standards for institutions for which they are the primary federal regulator. The standards relate generally to operations and management, asset quality, interest rate exposure and executive compensation. The agencies are authorized to take action against institutions that fail to meet such standards.
OTS regulations do not require savings and loan holding companies, such as the Company, to maintain specific minimum capital ratios. As a result of the Dodd-Frank Act, the risk-based and leverage capital standards currently applicable to U.S. insured depository institutions and U.S. bank holding companies will in the future become applicable to savings and loan holding companies (such as the Company). The Dodd-Frank Act generally authorizes the Federal Reserve to promulgate capital requirements for savings and loan holding companies.
The Federal Reserve requires bank holding companies to maintain a minimum tier 1 leverage ratio, tier 1 risk-based capital ratio and total risk-based capital ratio. In addition, the Federal Reserve requires bank holding companies that engage in trading activities to adjust their risk-based capital ratios to take into consideration market risks that may result from movements in market prices of covered trading positions in trading accounts, or from foreign exchange or commodity positions, whether or not in trading accounts, including changes in interest rates, equity prices, foreign exchange rates or commodity prices. Any capital required to be maintained under these provisions may consist of tier 3 capital. Also, the Federal Reserve considers a "tangible tier 1 leverage ratio" (deducting all intangibles) and other indications of capital strength in evaluating proposals for expansion or engaging in new activities.
In addition, the Dodd-Frank Act further requires the federal banking agencies to adopt capital requirements which address the risks that the activities of an institution poses to the institution and the public and private stakeholders, including risks arising from certain enumerated activities. The federal banking agencies will likely change existing capital guidelines or adopt new capital guidelines in the future pursuant to the Dodd-Frank Act, the implementation of Basel III (described below) or other regulatory or supervisory changes.
The FDI Act requires federal bank regulatory agencies to take "prompt corrective action" with respect to FDIC-insured depository institutions that do not meet minimum capital requirements. A depository institution's treatment for purposes of the prompt corrective action provisions will depend
upon how its capital levels compare to various capital measures and certain other factors, as established by regulation. Under this system, the federal banking regulators have established five capital categories, well-capitalized, adequately capitalized, undercapitalized, significantly undercapitalized and critically undercapitalized, in which all institutions are placed. The federal banking regulators have also specified by regulation the relevant capital levels for each of the other categories. Federal banking regulators are required to take various mandatory supervisory actions and are authorized to take other discretionary actions with respect to institutions in the three undercapitalized categories. The severity of the action depends upon the capital category in which the institution is placed. Generally, subject to a narrow exception, the banking regulator must appoint a receiver or conservator for an institution that is critically undercapitalized.
Basel, Basel II and Basel III Accords
The current risk-based capital guidelines that apply to the Bank are based on the 1988 capital accord of the International Basel Committee on Banking Supervision, a committee of central banks and bank supervisors, as implemented by the OTS. In 2008, the OTS began to phase-in capital standards based on a second capital accord, referred to as Basel II, for large or "core" international banks (total assets of $250 billion or more or consolidated foreign exposures of $10 billion or more). Basel II emphasizes internal assessment of credit, market and operational risk, as well as supervisory assessment and market discipline in determining minimum capital requirements.
On September 12, 2010, the Group of Governors and Heads of Supervision, the oversight body of the Basel Committee, announced agreement on the calibration and phase-in arrangements for a strengthened set of capital requirements, known as Basel III. Basel III increases the minimum tier 1 common equity ratio to 4.5%, net of regulatory deductions, and introduces a capital conservation buffer of an additional 2.5% of common equity to risk-weighted assets, raising the target minimum common equity ratio to 7%. Basel III increases the minimum tier 1 capital ratio to 8.5% inclusive of the capital conservation buffer, increases the minimum total capital ratio to 10.5% inclusive of the capital buffer and introduces a countercyclical capital buffer of up to 2.5% of common equity or other fully loss absorbing capital for periods of excess credit growth. Basel III also introduces a non-risk adjusted tier 1 leverage ratio of 3%, based on a measure of total exposure rather than total assets, and new liquidity standards. The Basel III capital and liquidity standards will be phased in over a multi-year period. The final package of Basel III reforms will be submitted to the Seoul G20 Leaders Summit in November, 2010 for endorsement by G20 leaders, and then will be subject to individual adoption by member nations, including the United States. The federal banking agencies will likely implement changes to the capital adequacy standards applicable to the insured depository institutions and their holding companies in light of Basel III.
Qualified Thrift Lender Test
Federal banking laws require a thrift to meet the QTL test by maintaining at least 65% of its "portfolio assets" in certain "qualified thrift investments," such as residential housing related loans, certain consumer and small business loans and residential mortgage-backed securities, on a monthly average basis in at least nine months out of every twelve months. A thrift that fails the QTL test must either operate under certain restrictions on its activities or convert to a bank charter. The Dodd-Frank Act imposes additional restrictions on the ability of any thrift that fails to become or remain a QTL to pay dividends. Specifically, the thrift is not only subject to the general dividend restrictions as would apply to a national bank (as under prior law), but also is prohibited from paying dividends at all (regardless of its financial condition) unless required to meet the obligations of a company that controls the thrift, permissible for a national bank and specifically approved by the OCC and the Federal Reserve. In addition, violations of the QTL test now are treated as violations of federal banking laws
subject to remedial enforcement action. At September 30, 2010, BankUnited was in compliance with the QTL test.
HOLA limits the amount of non-residential mortgage loans a federal savings association, such as BankUnited, may make. Separate from the QTL test, the law limits a federal savings association to a maximum of 20% of its total assets in commercial loans not secured by real estate, however, only 10% can be large commercial loans not secured by real estate (defined as loans in excess of $2 million). Commercial loans secured by real estate can be made in an amount up to four times an institution's total capital. An institution can also have leases, in addition to the above items, up to 10% of its assets. Commercial paper, corporate bonds, and consumer loans taken together cannot exceed 35% of a savings association's assets. For this purpose, however, residential mortgage loans and credit card loans are not considered consumer loans, and are both unlimited in amount. The foregoing limitations are established by statute, and cannot be waived by the OTS. At September 30, 2010, BankUnited was in compliance with all these limits.
Regulatory Limits on Dividends and Distributions
Federal law currently impose limitations upon certain capital distributions by thrifts, such as certain cash dividends, payments to repurchase or otherwise acquire its shares, payments to stockholders of another institution in a cash-out merger and other distributions charged against capital. The OTS regulates all capital distributions by BankUnited directly or indirectly to us, including dividend payments. BankUnited currently must file an application to receive the approval of the OTS for any proposed capital distribution.
BankUnited may not pay dividends to us if, after paying those dividends, it would fail to meet the required minimum levels under risk-based capital guidelines and the minimum leverage and tangible capital ratio requirements, or in the event the OTS notified BankUnited that it was in need of more than normal supervision. Under the FDI Act, an insured depository institution such as BankUnited is prohibited from making capital distributions, including the payment of dividends, if, after making such distribution, the institution would become "undercapitalized." Payment of dividends by BankUnited also may be restricted at any time at the discretion of the appropriate regulator if it deems the payment to constitute an unsafe and unsound banking practice. Additionally, the Dodd-Frank Act imposes additional restrictions on the ability of any thrift that fails to become or remain a QTL to pay dividends.
Reserve Requirements
Pursuant to regulations of the Federal Reserve, all banks and thrifts are required to maintain average daily reserves at mandated ratios against their transaction accounts. In addition, reserves must be maintained on certain non-personal time deposits. These reserves must be maintained in the form of vault cash or in an account at a Federal Reserve Bank.
Limits on Transactions with Affiliates and Insiders
Banks and thrifts are subject to restrictions on their ability to conduct transactions with affiliates and other related parties. Section 23A of the Federal Reserve Act imposes quantitative limits, qualitative requirements, and collateral requirements on certain transactions by a bank or thrift with, or for the benefit of, its affiliates. Transactions covered by Section 23A include loans, extensions of credit, investment in securities issued by an affiliate, and acquisitions of assets from an affiliate. Section 23B of the Federal Reserve Act requires that most types of transactions by a bank or thrift with, or for the benefit or, an affiliate be on terms at least as favorable to the bank or thrift as if the transaction were conducted with an unaffiliated third party.
The Dodd-Frank Act generally enhances the restrictions on transactions with affiliates under Section 23A and 23B of the Federal Reserve Act, including an expansion of the definition of "covered transactions" and an increase in the amount of time for which collateral requirements regarding covered credit transactions must be satisfied. The ability of the Federal Reserve to grant exemptions from these restrictions is also narrowed by the Dodd-Frank Act, including by requiring coordination with other bank regulators.
The Federal Reserve's Regulation O and OTS regulations impose restrictions and procedural requirements in connection with the extension of credit by a bank or thrift to directors, executive officers, principal stockholders, and their related interests.
Examination Fees
The OTS currently charges fees to recover the costs of examining federal thrifts and their affiliates, processing applications and other filings, and covering direct and indirect expenses in regulating thrifts and their affiliates. The Dodd-Frank Act provides various agencies with the authority to assess additional supervision fees.
Deposit Insurance Assessments
FDIC-insured depository institutions are required to pay deposit insurance assessments to the FDIC. The amount of a particular institution's deposit insurance assessment is based on that institution's risk classification under an FDIC risk-based assessment system. An institution's risk classification is assigned based on its capital levels and the level of supervisory concern the institution poses to the regulators. Deposit insurance assessments fund the DIF, which is currently under-funded. The FDIC recently raised assessment rates to increase funding for the DIF.
The Dodd-Frank Act changes the way an insured depository institution's deposit insurance premiums are calculated. The assessment base will no longer be the institution's deposit base, but rather its average consolidated total assets less its average tangible equity. The Dodd-Frank Act also makes changes to the minimum designated reserve ratio of the DIF, increasing the minimum from 1.15 percent to 1.35 percent of the estimated amount of total insured deposits, eliminating the upper limit for the reserve ratio designated by the FDIC each year, and eliminating the requirement that the FDIC pay dividends to depository institutions when the reserve ratio exceeds certain thresholds.
Continued action by the FDIC to replenish the DIF as well as the changes contained in the Dodd-Frank Act may result in higher assessment rates, which could reduce our profitability or otherwise negatively impact our operations.
Depositor Preference
The FDI Act provides that, in the event of the "liquidation or other resolution" of an insured depository institution, the claims of depositors of the institution (including the claims of the FDIC as subrogee of insured depositors) and certain claims for administrative expenses of the FDIC as a receiver will have priority over other general unsecured claims against the institution. If we invest in or acquire an insured depository institution that fails, insured and uninsured depositors, along with the FDIC, will have priority in payment ahead of unsecured, non-deposit creditors, including us, with respect to any extensions of credit they have made to such insured depository institution.
Federal Home Loan Bank System
BankUnited is a member of the Federal Home Loan Bank of Atlanta, which is one of the twelve regional FHLB's composing the FHLB system. Each FHLB provides a central credit facility primarily for its member institutions as well as other entities involved in home mortgage lending. Any advances
from a FHLB must be secured by specified types of collateral, and all long-term advances may be obtained only for the purpose of providing funds for residential housing finance. As a member of the FHLB of Atlanta, BankUnited is required to acquire and hold shares of capital stock in the FHLB of Atlanta. BankUnited has always been in compliance with this requirement with an investment in FHLB of Atlanta stock.
Anti-Money Laundering and OFAC
Under federal law, financial institutions must maintain anti-money laundering programs that include established internal policies, procedures and controls; a designated compliance officer; an ongoing employee training program; and testing of the program by an independent audit function. Financial institutions are also prohibited from entering into specified financial transactions and account relationships and must meet enhanced standards for due diligence and customer identification in their dealings with foreign financial institutions and foreign customers. Financial institutions must take reasonable steps to conduct enhanced scrutiny of account relationships to guard against money laundering and to report any suspicious transactions, and law enforcement authorities have been granted increased access to financial information maintained by financial institutions. Bank regulators routinely examine institutions for compliance with these obligations and they must consider an institution's compliance in connection with the regulatory review of applications, including applications for banking mergers and acquisitions. The regulatory authorities have imposed "cease and desist" orders and civil money penalty sanctions against institutions found to be violating these obligations.
The Office of Foreign Assets Control, or OFAC, is responsible for helping to insure that U.S. entities do not engage in transactions with certain prohibited parties, as defined by various Executive Orders and Acts of Congress. OFAC sends bank regulatory agencies lists of persons and organizations suspected of aiding, harboring or engaging in terrorist acts, known as Specially Designated Nationals and Blocked Persons. If the Company or BankUnited find a name on any transaction, account or wire transfer that is on an OFAC list, the Company or BankUnited must freeze such account, file a suspicious activity report and notify the appropriate authorities.
Consumer Laws and Regulations
Thrifts and other financial institutions are subject to numerous laws and regulations intended to protect consumers. These laws include, among others:
Many states and local jurisdictions have consumer protection laws analogous, and in addition, to those listed above. These federal, state and local laws regulate the manner in which financial institutions deal with customers when taking deposits, making loans, or conducting other types of transactions. Failure to comply with these laws and regulations could give rise to regulatory sanctions, customer rescission rights, action by state and local attorneys general, and civil or criminal liability. The creation of the CFPB by the Dodd-Frank Act is likely to lead to enhanced and strengthened enforcement of consumer financial protection laws.
The Community Reinvestment Act
The CRA is intended to encourage banks to help meet the credit needs of their service areas, including low and moderate-income neighborhoods, consistent with safe and sound operations. The bank regulators examine and assign each bank a public CRA rating. The CRA then requires bank regulators to take into account the federal banking bank's record in meeting the needs of its service area when considering an application by a bank to establish or relocate a branch or to conduct certain mergers or acquisitions. The Federal Reserve is required to consider the CRA records of a bank holding company's (BHC) controlled banks when considering an application by the BHC to acquire a bank or thrift or to merge with another BHC. When the Company or BankUnited applies for regulatory approval to make certain investments, the regulators will consider the CRA record of target institutions and the Company's depository institution subsidiaries. An unsatisfactory CRA record could substantially delay approval or result in denial of an application. The regulatory agency's assessment of the institution's record is made available to the public. Since the Acquisition, bank regulators have not conducted a CRA exam of BankUnited.
Changes in Laws, Regulations or Policies
Federal, state and local legislators and regulators regularly introduce measures or take actions that would modify the regulatory requirements applicable to banks, thrifts, their holding companies and other financial institutions. Changes in laws, regulations or regulatory policies could adversely affect the operating environment for the Company in substantial and unpredictable ways, increase our cost of doing business, impose new restrictions on the way in which we conduct our operations or add significant operational constraints that might impair our profitability. We cannot predict whether new legislation will be enacted and, if enacted, the effect that it, or any implementing regulations, would have on our business, financial condition or results of operations. The Dodd-Frank Act imposes substantial changes to the regulatory framework applicable to us and our subsidiaries. The majority of these changes will be implemented over time by various regulatory agencies. The full effect that these changes will have on us remains uncertain at this time and may have a material adverse effect on our business and results of operations.
Executive Officers and Directors
The following table sets forth information regarding our directors and executive officers as of January 10, 2011.
Name | Age | Position | |||
|---|---|---|---|---|---|
John A. Kanas | 64 | Chairman, President and Chief Executive Officer | |||
John Bohlsen | 68 | Vice Chairman, Chief Lending Officer and Director | |||
Douglas J. Pauls | 52 | Chief Financial Officer | |||
Rajinder P. Singh | 40 | Chief Operating Officer | |||
Chinh E. Chu | 44 | Director | |||
Ambassador Sue M. Cobb | 73 | Director | |||
Eugene F. DeMark | 63 | Director | |||
Richard S. LeFrak | 63 | Director | |||
Wilbur L. Ross, Jr. | 73 | Director | |||
Pierre Olivier Sarkozy | 41 | Director | |||
Lance N. West | 49 | Director | |||
John A. Kanas has served on our Board since its inception in May 2009. He has also served as our Chairman, President and Chief Executive Officer since May 2009. Mr. Kanas serves as the Committee Chairman of our Executive Committee. Prior to joining BankUnited, Mr. Kanas was President and Chief Executive Officer of North Fork Bancorporation, Inc. from 1977 until its acquisition by Capital One in December 2006, at which time North Fork was one of the top 25 bank holding companies in the United States. He also served as Chairman of North Fork from 1986 to 2006. In December 2006, he became President of Capital One's banking segment, which included North Fork, the former Hibernia Bank in Louisiana and Texas and Capital One Direct Bank in Richmond, Virginia. Mr. Kanas retired from that position in August 2007. Between August 2007 and May 2009, Mr. Kanas was an independent consultant. Mr. Kanas holds a B.A. degree from Long Island University. He is a past president of the New York State Bankers Association. Mr. Kanas was also a member of the NYSE Listed Company Advisory Committee and is currently a member of the board of trustees of Long Island University and Weill Cornell Medical College. In 2005, Mr. Kanas was recognized by "Institutional Investor" as the best regional bank CEO in America. In May 2007, Mr. Kanas received the Woodrow Wilson Award for Corporate Citizenship and was also conferred an Honorary Doctorate of Humane Letters by Dowling College. Mr. Kanas' qualifications to serve on our Board include his 29-year career at North Fork, his extensive experience in the banking industry and his long-standing relationships within the business, political and charitable communities.
John Bohlsen has served on our Board since its inception in May 2009. He is also our Vice Chairman and has served as Chief Lending Officer since May 2009. From December 2006 until August 2007, Mr. Bohlsen led the Commercial Banking division for Capital One's banking subsidiary, which included North Fork, the former Hibernia Bank in Louisiana and Texas and Capital One Direct Bank in Richmond, Virginia. Mr. Bohlsen was a part of North Fork's management team when they were acquired by Capital One in December 2006. During his tenure at North Fork from January 1986 to December 2006, he served on the board of directors, and became Vice Chairman in 1989. Mr. Bohlsen also served as Chairman of several bank management committees during that time. Between August 2007 and May 2009, Mr. Bohlsen was active in other business activities involving restaurants and other real estate endeavors. He is active in various outside businesses involving real estate and construction, and is president of a restaurant operating company doing business in the New York metropolitan area. Mr. Bohlsen has a B.S. and a M.B.A. from Michigan State University. In addition, he is a veteran of
the U.S. Navy, having served as an officer during the Vietnam War. Mr. Bohlsen has served on many professional, academic and community boards and organizations, and he and his family are well known for their philanthropic endeavors. Mr. Bohlsen's qualifications to serve on our Board include his extensive experience in the banking industry and his previous experience serving as a director on the board of a public company.
Douglas J. Pauls has been our Chief Financial Officer since September 2009. Between March 2009 and August 2009, Mr. Pauls was self-employed as a consultant. From April 2008 until February 2009, Mr. Pauls served as Executive Vice President of Finance for TD Bank, NA following TD Bank's acquisition of Commerce Bancorp, Inc. in March 2008. Mr. Pauls served as Chief Financial Officer of Commerce Bancorp from March 2002 up until the acquisition by TD Bank in April 2008. Mr. Pauls was a member of the three person Office of the Chairman, responsible for overall management, policy making and strategic direction of Commerce Bancorp. From October 1995 to March 2002, Mr. Pauls served as the Chief Accounting Officer of Commerce Bancorp, its Senior Vice President from January 1999 to April 2006 and its Executive Vice President from April 2006 to April 2008. Earlier in his career, Mr. Pauls was a Senior Manager in the Audit Department of Ernst & Young in Philadelphia and Pittsburgh, Pennsylvania. Mr. Pauls received a B.A. in Economics magna cum laude from Dickinson College. Mr. Pauls currently serves on the board of trustees of Dickinson College and as a Member of the Committees on Finance, Budget and Audit, and Student Life.
Rajinder P. Singh is our Chief Operating Officer and has been with us since our inception in May 2009. Prior to joining us, Mr. Singh led the financial services practice of WL Ross & Co., a private equity firm and investor in BankUnited from April 2008 to May 2009. From December 2006 through April 2008, Mr. Singh served as Executive Vice President for Capital One's banking segment which includes retail, small business and commercial banking businesses in New York, New Jersey, Connecticut, Louisiana and Texas and a national direct deposit gathering franchise. Mr. Singh was a member of Capital One's Bank Leadership Team and chaired the Deposit Pricing Committee. He also served on Capital One's ALCO and brand board. Previously, Mr. Singh served as Head of Corporate Development and Strategy for North Fork from February 2005 to December 2006. During his tenure, North Fork was acquired by Capital One for $13.2 billion. Prior to joining North Fork in February 2005, Mr. Singh spent nine years at FleetBoston Financial Corporation and last served as Managing Director of Corporate Development and Strategy. Mr. Singh earned his M.B.A. from Carnegie Mellon University in Pittsburgh and his B.S. in chemical engineering from the Indian Institute of Technology in New Delhi.
Chinh E. Chu has served on our Board since its inception in May 2009. He is a Senior Managing Director in the Blackstone Private Equity Group, or Blackstone, one of our principal investors. Since joining Blackstone in 1990, Mr. Chu has led Blackstone's investments in Stiefel Laboratories, ReAble Therapeutics' acquisition of DJ Orthopedics, Biomet, Catalent Pharma Solutions, Alliant, ReAble Therapeutics, Celanese, Nalco, SunGard Data Systems, Nycomed and LIFFE. He has also been involved in Blackstone's investments in FGIC, Sirius Satellite Radio, StorageApps, Haynes International, Prime Succession/Rose Hills, Interstate Hotels, HFS and Alco Holdings. Mr. Chu is currently a director of Alliant, Graham Packaging Company Inc., Healthmarkets, DJO Incorporated, Catalent Pharma Solutions, SunGard Data Systems, Allied Barton and Bayview, and previously served on the board of directors of Celanese Corporation. Before joining Blackstone, Mr. Chu worked at Salomon Brothers in the Mergers and Acquisitions Department. Mr. Chu received a B.S. in Finance from the University of Buffalo, where he graduated summa cum laude. Mr. Chu's qualifications to serve on our Board include his significant experience overseeing the business of Blackstone's numerous portfolio companies, including significant public company experience, and his significant financial, investment and strategic business planning experience.
Sue M. Cobb, Ambassador of the United States of America, ret., has served on our Board since January 2010. Since February 2007, Ambassador Cobb has been engaged in private sector business
activities with Cobb Partners, Inc., a privately held Florida-based investment firm. From September 2001 to February 2005, she served as the United States Ambassador to Jamaica. Ambassador Cobb was Secretary of State of Florida from December 2005 to January 2007. From 2002 to 2008, Ambassador Cobb was engaged at the U.S. Department of State's Leadership and Management School as co-chair of periodic mandatory seminars for newly designated U.S. ambassadors. Ambassador Cobb served seven years as chair of the board of the Federal Reserve Bank, Miami Branch. She was the founding partner of the Public Finance Department of the Greenberg Traurig law firm where she practiced as a public finance attorney. She currently sits on the board of directors of the Durango Mountain Resort and Kirkwood Associates Inc., both private resort development companies. Ambassador Cobb is President of the American Friends of Jamaica, a New York-based charitable institution, and President of Miami-based Cobb Family Foundation. She is an active member of the Center for Strategic and International Studies, The Council of American Ambassadors, and the Council on Foreign Relations. Ambassador Cobb has also been an officer and director of many civic and charitable organizations and has received numerous awards including national honors from the nations of Jamaica and Iceland. Previously, she has been the University of Miami Alumnus of the year, the Red Cross Humanitarian of the Year and the Silver Medallion Awardee from the National Conference of Christians and Jews for contributions to civic causes and humanity. Ambassador Cobb received a B.A. from Stanford University and a J.D. from the University of Miami School of Law. Ambassador Cobb's qualifications to serve on our Board include her broad and diverse background in leadership and management, including experience with public companies as the Audit Committee Chair of the LNR Property Corporation, a public real estate investment, finance and management company.
Eugene F. DeMark has served on our Board since September 2010. From June 1969 until his retirement in October 2009, Mr. DeMark worked for KPMG LLP, a global professional services firm. Mr. DeMark served as the Advisory Northeast Area Managing Partner at KPMG LLP from October 2005 until his retirement. Since his retirement, Mr. DeMark has been an independent consultant. Starting in January 2010, Mr. DeMark has advised our Audit and Compensation Committees. Between 1988 and 2001, Mr. DeMark had been the Northeast Area Managing Partner of the Information, Communications and Entertainment Practice and the KPMG's Long Island Office Managing Partner. During his career at KPMG, Mr. DeMark has had responsibilities to lead a number of specialized practices in Banking, High Technology, Media and Entertainment and Aerospace and Defense. He joined the Firm in 1969 and was elected to its partnership in 1979. On special assignments, he worked on the research staff of the Commission on Auditor's Responsibilities, the predecessor to the Treadway Commission, formed to assess increases in fraudulent financial reporting. Mr. DeMark also developed the firm's first study guide on SEC reporting. Mr. DeMark holds a B.B.A. degree from Hofstra University and is a Certified Public Accountant and is a member of the American Institute of Certified Public Accountants (AICPA) and the New York State Society of Certified Public Accountants. Mr. DeMark has served as chairman of the Long Island chapter of multiple sclerosis, president of the Nassau County council of the Boy Scouts of America and Northeast Regional board member of the National organization, president of the Nassau Chapter of the National Association of Accountants, Treasurer of the New Long Island Partnership and chairman of the Economic Development Task Force—Project Long Island. Mr. DeMark also was active in the United Way on Long Island and New York and served on its board of directors and chaired the nominating committee. Mr. DeMark's qualifications to serve on our Board include his 40 years of financial experience at KPMG LLP, including 35 years in various positions in the firm's audit practice.
Richard S. LeFrak has served on our Board since its inception in May 2009. He also serves as the Committee Chairman of our Compensation Committee. Mr. LeFrak is currently the Chairman and CEO of the LeFrak Organization, a privately held real estate and development company. He joined the LeFrak Organization in 1968, was appointed its President in 1975, and was elected Chairman of its board of directors and CEO in 2003. Mr. LeFrak serves on the board of a number of organizations, including the board of trustees of Amherst College, and the board of trustees of the Prostate Cancer
Foundation. He also has served as a member of the board of trustees of the American Museum of Natural History, the board of trustees of the Trinity School, and as a Member of the New York State Banking board. Mr. LeFrak also presides over the LeFrak Foundation, a private philanthropy whose mission encompasses a broad, but focused agenda, including the support of charitable organizations, institutions of higher learning, hospitals, research facilities and cultural programs that sustain and encourage literary, performing and visual arts. Mr. LeFrak graduated cum laude from Amherst College in 1967, and went on to study law at Columbia University, from which he received his J.D. in 1970. In 1998, Mr. LeFrak received an Honorary Doctorate Degree from Amherst College. Mr. LeFrak's qualifications to serve on our Board include his 35 years of experience in the development, rehabilitation and marketing of real estate as well as his long-standing relationships within the business, political and charitable communities.
Wilbur L. Ross, Jr.has served on our Board since its inception in May 2009. Mr. Ross is the Chairman and Chief Executive Officer of WL Ross & Co. LLC, or WL Ross, a private equity firm and one of our principal investors, a position he has held since April 2000. Mr. Ross is also the managing member of the general partner of WL Ross Group, L.P., which in turn is the managing member of the general partner of WLR Recovery Fund L.P., WLR Recovery Fund II L.P., WLR Recovery Fund III L.P., WLR Recovery Fund IV L.P., Asia Recovery Fund L.P., Asia Recovery Co-Investment Fund L.P., Absolute Recovery Hedge Fund L.P., India Asset Recovery Fund and Japan Real Estate Recovery Fund, the Chairman of the Investment Committee of the Taiyo Fund and the Chairman of Invesco Private Capital. Mr. Ross is also non-executive Chairman of: International Coal Group, Inc., a leading producer of coal in Northern and Central Appalachia and the Illinois basin; International Textile Group, Inc., a global, diversified textile provider that produces automotive safety, apparel, government uniform, technical and specialty textiles; Nano-Tex, Inc., a fabric innovations company located in the United States; IPE-Ross Management Ltd., an investment partnership investing in middle market European buyouts; and the International Automotive Components Group SL, a joint venture company with interests in automotive interior plastics. Mr. Ross is also an executive officer of Invesco Private Equity; American Home Mortgage Services, Inc. and Plascar Participacoes SA. Mr. Ross is a board member of: Arcelor Mittal N.V.; Compagnie Européenne de Wagons SARL in Luxembourg; Insuratex, Ltd., an insurance company in Bermuda; Plascar Participacoes SA; Phoenix International Insurance Company; The Greenbrier Companies, a supplier of transportation equipment and services to the railroad industry; IAC Acquisition Corporation Limited; IAC Group SARL; and Masters Capital Nanotechnology Fund. Mr. Ross is also a member of the Business Roundtable. Previously, Mr. Ross served as the Executive Managing Director at Rothschild Inc., an investment banking firm, from October 1974 to March 2000. Mr. Ross was previously a director of Mittal Steel Co. N.V. from April 2005 to June 2006, a director of International Steel Group from February 2002 to April 2005, a director of Montpelier Re Holdings Ltd. from 2006 to March 2010, and a director of Syms Corp. from 2000 through 2007. Mr. Ross was also formerly Chairman of the Smithsonian Institution National board and currently is a board member of Whitney Museum of American Art, the Japan Society, the Yale University School of Management and Chairman of the Palm Beach Fire Fighters Retirement Fund. He holds an A.B. from Yale University and an M.B.A., with distinction, from Harvard University. Mr. Ross' qualifications to serve on our Board include his significant experience in finance and his knowledge of the capital markets.
Pierre Olivier Sarkozy has served on our Board since its inception in May 2009. Since March 2008, Mr. Sarkozy has served as Managing Director of the Carlyle Group, or Carlyle, one of our principal investors, and head of the Carlyle Global Financial Services Partners fund, one of the Carlyle affiliated funds that has invested in us. From January 2003 until March 2008, Mr. Sarkozy was Global Co-Head of the Financial Institutions Group at UBS Investment Bank. Prior to joining UBS, Mr. Sarkozy worked for 11 years at Credit Suisse First Boston, where he was the Managing Director in charge of the Depository Institutions Group. Mr. Sarkozy received his Masters in Medieval History (with Honors) from St. Andrews University in Scotland. Mr. Sarkozy's qualifications to serve on our Board include his
extensive experience working with depository institutions and his expertise in structuring bank mergers and acquisitions.
Lance N. West has served on our Board since its inception in May 2009. Since May 2006, Mr. West has been a Partner and Senior Managing Director of Centerbridge Partners LP, or Centerbridge, a $10 billion multi-strategy, private investment management company that focuses on distressed debt and private equity opportunities and one of our principal investors. From January 1999 until May 2006, Mr. West was a Partner and Managing Director at Goldman, Sachs & Co., where he was head of the firm's Principal Finance Group, a proprietary investment platform focusing on a variety of private and public equity and debt investments in the Americas, with a particular emphasis on real estate and financial institutions. Mr. West was a member of Goldman's Asian Special Situations Group and was a member of the Investment Committees for Goldman's American Special Situations and Specialty Lending Groups. From January 1992 until January 1999, Mr. West served as Chairman and CEO of Greenthal Realty Partners LP and GRP Financial in New York, which Mr. West founded as a Resolution Trust Company Standard Asset Management and Disposition Contracts Asset Manager providing real estate asset management, special servicing and distressed debt investment management. Prior to founding GRP, Mr. West was an executive vice president with The Charles H. Greenthal Group, Inc., a real estate asset management and investment company, and a member of the technical staff at AT&T Bell Laboratories from 1982 to 1984. Mr. West earned his M.S. in Electrical Engineering from the California Institute of Technology in 1983 and graduated magna cum laude with a B.S. in Electrical Engineering from Tufts University in 1982. Mr. West is currently chairman of Green Tree Investment Holdings LLC, a credit focused mortgage loan servicer. Mr. West is a member of the board of overseers of Tufts University, and a member of the Chair's Council for the Humanities and Social Sciences division at the California Institute of Technology. Mr. West's qualifications to serve on our Board include his extensive financial and investment experience as well as his real estate experience.
Composition of Board
The Board currently consists of nine members, Messrs. Kanas, Bohlsen, Chu, DeMark, LeFrak, Ross, Sarkozy and West and Ambassador Cobb. Following the completion of this offering, we expect our Board towill consist of nine directors, seven of whom we expect towill qualify as independent directors under the corporate governance standards of the exchange on which we list our common stock and the independence requirements of Rule 10A-3 of the SecuritiesNew York Stock Exchange, Act of 1934, or the Exchange Act.NYSE.
Each member of the Board will hold office for a one year term until the next annual meeting or until their successor has been elected and qualified.
See "Certain Relationships and Related Party Transactions—Director Nomination Agreement." The Board has determined that our Chief Executive Officer will continue to serve as the Chairman of our Board of Directors.
Risk Management and Oversight
Our Board oversees our risk management process, including the company-wide approach to risk management, carried out by our management. Our full Board determines the appropriate risk for us generally, assesses the specific risks faced by us, and reviews the steps taken by management to manage those risks. While our full Board maintains the ultimate oversight responsibility for the risk management process, its committees oversee risk in certain specified areas. In particular, our compensation committee is responsible for overseeing the management of risks relating to our executive compensation plans and arrangements, and the incentives created by the compensation awards it administers. Our audit committee oversees management of enterprise risks as well as financial risks and, effective upon the consummation of this offering, will also be responsible for overseeing
potential conflicts of interests. Effective upon the listing of our common stock on an exchange, our nominating and corporate governance committee will be responsible for overseeing the management of
risks associated with the independence of our Board. Pursuant to our Board's instruction, management regularly reports on applicable risks to the relevant committee or the full Board, as appropriate, with additional review or reporting on risks conducted as needed or as requested by our Board and its committees.
Committees of Our Board of Directors
Upon completion of this offering, the standing committees of our Board will include the executive committee, audit committee, compensation committee, and nominating and corporate governance committee.
Executive Committee. The executive committee acts on behalf of our Board between regularly scheduled Board meetings, usually when time is critical. At the time of this offering, we expect the members of the committee will be Messrs. Kanas (Chairman), Bohlsen, Chu, Ross, Sarkozy and West.
Audit Committee. The audit committee will assist our Board in its oversight of the integrity of our financial statements, our independent registered public accounting firm's qualifications and independence and the performance of our independent registered public accounting firm. The audit committee will review the audit plans and findings of our independent registered public accounting firm and our internal audit and risk review staff, as well as the results of regulatory examinations, and track management's corrective action plans where necessary; review our financial statements, including any significant financial items and/or changes in accounting policies, with our senior management and independent registered public accounting firm; review our financial risk and control procedures, compliance programs and significant tax, legal and regulatory matters; and have the sole discretion to appoint annually our independent registered public accounting firm, and set clear hiring policies for employees or former employees of the independent registered public accounting firm. Our audit committee will also review and approve all related party transactions and review reports and disclosures regarding the Company's compliance with applicable laws, rules and regulations. At the time of this offering, we expect the members of the committee will be Messrs. DeMark (Chairman) and LeFrakRoss and Ambassador Cobb, each of whom qualifies as an "independent" director as defined under New York Stock Exchange, orthe NYSE rules and Rule 10A-3 of the Securities Exchange Act of 1934, or the Exchange Act. All of the members of the audit committee are financially literate and have accounting or related financial management expertise within the meaning of the NYSE rules. The Board also has determined that Mr. DeMark qualifies as an "audit committee financial expert" as defined by the SEC.
Compensation Committee. The compensation committee reviews and recommends policies relating to compensation and benefits of our officers and directors and is further responsible for determining the compensation of the Chief Executive Officer. The compensation committee reviews and approves corporate goals and objectives relevant to compensation of our Chief Executive Officer and other executive officers, evaluates the performance of these officers in light of those goals and objectives, and recommends the compensation of these officers based on such evaluations. The compensation committee also administers the issuance of stock options and other awards under our stock plans. The compensation committee will review and evaluate, at least annually, the performance of the compensation committee and its members, including compliance of the compensation committee with its charter. At the time of this offering, we expect the members of the committee will be Messrs. LeFrak (Chairman), Sarkozy and West and Ambassador Cobb, each of whom qualifies as an "independent" director as defined under the applicable rules and regulations of the SEC, the NYSE and the Internal Revenue Service.
Nominating and Corporate Governance Committee. The nominating and corporate governance committee will be responsible for making recommendations to our Board regarding candidates for directorships and the size and composition of our Board. In addition, the nominating and corporate governance committee will be responsible for overseeing our corporate governance guidelines and
reporting and making recommendations to our Board concerning governance matters. At the time of
this offering, we expect the members of the committee will be Messrs. Chu, Ross, Sarkozy and West, each of whom qualifies as an "independent" director as defined under the applicable rules and regulations of the SEC, the NYSE and the Internal Revenue Service.
Compensation Committee Interlocks and Insider Participation
During 2009, our compensation committee consisted of Messrs. LeFrak, Sarkozy, West and Ambassador Cobb. None of them has at any time in the last fiscal year been one of our officers or employees, and none has had any relationships with our company of the type that is required to be disclosed under Item 404 of Regulation S-K. None of our executive officers serves or has served as a member of the board of directors, compensation committee or other board committee performing equivalent functions of any entity that has one or more executive officers serving as one of our directors or on our compensation committee.
Corporate Governance Guidelines, Code of Business Conduct and Code of Ethics
Our Board has adopted Corporate Governance Guidelines, which set forth a flexible framework within which our Board, assisted by Board committees, directs the affairs of the Company. The Guidelines address, among other things, the composition and functions of the Board, director independence, compensation of directors, management succession and review, Board committees and selection of new directors.
We have adopted a codeCode of business conduct and ethics that appliesConduct, which is applicable to all directors, officers, employees, agents (including consultants and contractors) and temporary personnel of the Company. We have a separate Code of Ethics for Principal Executive and Senior Financial Officers, which contains provisions specifically applicable to our employees, officersprincipal executive officer, principal financial officer, principal accounting officer and directors, including those officers responsiblecontroller (or persons performing similar functions).
The Corporate Governance Guidelines, the Code of Conduct and the Code of Ethics for financial reporting. The code of business conductPrincipal Executive and ethicsSenior Financial Officers will be available on our website at www.bankunited.com. We expect that any amendments to the code,these codes, or any waivers of itstheir requirements, will be disclosed on our website.
COMPENSATION DISCUSSION AND ANALYSIS
Executive Compensation
The following Compensation Discussion and Analysis provides information regarding the objectives and elements of our compensation philosophy, policies and practices with respect to the compensation of our executive officers who appear in the "—Summary Compensation Table" below (referred to collectively throughout this section as our "named executive officers"). Our named executive officers for the fiscal year ended December 31, 2010 were:
Messrs. Kanas and Pauls are named executive officers based on their roles as our Chief Executive Officer and Chief Financial Officer, respectively, and Messrs. Bohlsen and Singh are named executive officers by reason of being our two most highly compensated executive officers (other than our Chief Executive Officer and Chief Financial Officer) who were serving as executive officers at the end of the last fiscal year.
Objectives of Our Executive Compensation Program
Our executive compensation philosophy is primarily based on pay-for-performance. Accordingly, our executive compensation programs are designed to achieve the following objectives:
Setting Executive Compensation
Our current executive compensation program is largely based on arrangements that were negotiated at the time that our Company was founded. BankUnited, Inc. was organized by a management team led by Messrs. Kanas, Singh, Bohlsen and our former Chief Financial Officer on April 28, 2009. At that time, the founding members of the management team directly negotiated the terms of their compensation with the investors. Mr. Pauls replaced our former Chief Financial Officer, and as a result, Mr. Pauls' compensation components are similar to those provided to our former Chief Financial Officer prior to his departure. The level of Mr. Pauls' compensation was negotiated by him and the Company and was ultimately subject to approval by our Board.
Role of Compensation Committee
Since our inception, our compensation committee has been responsible for such matters as the determination of discretionary bonus amounts, if any, to be paid to our named executive officers, the implementation of our Stock Option Plan in which executives other than our named executive officers
participate, including the determination of grant amounts, vesting terms and exercise prices and the approval of a new Omnibus Equity Incentive Plan to be implemented in connection with this offering.
In addition, our compensation committee was responsible for vetting and approving our 401(k) plan and Nonqualified Deferred Compensation Plan.
Role of Compensation Consultant
We have not engaged any compensation consultants. However, we may revisit the use of a compensation consultant following completion of this offering.
Risk Oversight
The audit committee of our Board, which is comprised of non-employee directors, is currently responsible for risk oversight within our Company, including with respect to compensation practices. Our Enterprise Risk Officer has been mandated to develop an Enterprise Risk Management framework to identify, manage and mitigate risks across our Company. This framework, which involves ongoing participation and oversight by our Board, captures compensation-related risk amongst various other dimensions of risk. In addition, our Company is subject to oversight by the OTS. To date, the OTS has played a role in our executive compensation practice, including reviewing and commenting on the employment agreements we have entered into with our named executive officers, and going forward, we will comply with the rules and regulations developed by the OTS. We do not believe that our overall compensation policies and practices create risks that are reasonably likely to have a material adverse effect on our Company.
Executive Officer Compensation
Principal Components of Compensation of Our Named Executive Officers
The compensation package offered to our executive officers, including our named executive officers, consists of:
Plan. Messrs. Kanas, Pauls, Bohlsen and Singh receive a car allowance and, in addition, Messrs. Kanas and Bohlsen are provided with a company-paid driver.
Compensation Mix
Our current compensation package is designed to provide a strong link between the compensation of our executives and the success of our Company and our stockholders generally. The cash components—base salary and discretionary cash bonus compensation—collectively represent what we believe is appropriate pay for expected performance during the year. The equity-based compensation component is designed to encourage high performance by closely aligning an executive's pay with the interests of our stockholders. The allocation between different elements of compensation with respect to our named executive officers has been a product of individual negotiations to date.
Employment Agreements
We have entered into employment agreements with each of our named executive officers. The employment agreements set forth the compensatory terms of each of our named executive officers' employment. For additional information regarding each named executive officer's employment agreement see "—Employment Agreements with Named Executive Officers."
Base Salary
We provide our executive officers and other employees with base salary to compensate them for services rendered during the year. We believe that, with respect to our named executive officers, base salary should compensate the executives for their service and performance but that superior contributions and performance should be rewarded by other forms of compensation, including long-term equity-based compensation. The base salary for each of our named executive offers was set in his employment agreement when the named executive officer commenced employment with us. To date, we have not granted any increase in base salary for any of our named executive officers.
Discretionary Cash Bonuses
Pursuant to their employment agreements, Messrs. Kanas, Pauls, Bohlsen and Singh are eligible to receive discretionary cash bonuses, as determined in the sole discretion of our Board. To date, our Board has not awarded bonuses to these executives and has not established any performance targets for such awards. To the extent that bonuses are awarded in the future, the determination of the amounts of such bonuses will be determined in accordance with the BankUnited, Inc. Policy on Incentive Compensation Arrangements, which when adopted, will provideprovides that bonus amounts are to be based upon the past, present, and expected future contributions of an employee or group of employees to the overall success, safety, and soundness of the organization. Factors considered in evaluating those contributions will include, among other things: overall individual performance, organizational performance, individual contribution to organizational performance, business segment performance, and level of individual responsibilities. The BankUnited, Inc. Policy on Incentive Compensation Arrangements will beis designed to balance risk and financial results in a manner that does not encourage employees to expose the Company to imprudent risks.
Equity-Based Compensation
Profits Interest Units
Pursuant to the LLC Agreement and related award agreements, Messrs. Kanas, Pauls, Bohlsen and Singh each received equity-based compensation in the form of PIUs in the LLC upon commencement of employment with us. The PIUs represent the right of the holder to share in distributions from the LLC after our investors have received certain returns on their investment. At the time of the inception of our Company, PIUs representing the right to receive an amount equal to ten percent of
the increase in the value of our Company after returns to our investors have been made were allocated to a pool for grants to the founding members of our management team. Mr. Pauls, who was not employed by us at the time of our inception, received his PIUs when he commenced employment with us in September 2009.
The PIUs are divided into two equal types of profits interests units. Half of the PIUs are Time-based PIUs and the remaining half of the PIUs are IRR-based PIUs. All of the PIUs available for grant under the LLC Agreement have been granted to Messrs. Kanas, Pauls, Bohlsen and Singh.
The Time-based PIUs generally vest in equal annual installments on each of the first three anniversaries of the date of grant. One-third of the Time-based PIUs granted to each of Messrs. Kanas, Pauls, Bohlsen and Singh are currently vested. With respect to Messrs. Kanas, Bohlsen and Singh, one-third of their Time-based PIUs will become vested in accordance with their terms on each of May 21, 2011 and May 21, 2012, if such individuals remain employed by us as of such date. With respect to Mr. Pauls, one-third of his Time-based PIUs will become vested in accordance with their terms on each of September 1, 2011 and September 1, 2012, if he remains employed by us as of such date. The unvested Time-based PIUs would vest on an accelerated basis upon the occurrence of certain events, such as change in control.
The IRR-based PIUs generally vest after our investors have received certain returns on their investment. In addition, pursuant to the terms of the LLC Agreement, following an initial public offering, the IRR-based PIUs would become eligible to vest commencing on the date that is four months after the initial public offering based on the trading price of our common stock four months after the effective date of this offering. Based on the anticipated offering price and the implied equity value of the Company resulting from such offering price, the Board of Directors of the LLC determined that the IRR-based PIUs would vest in accordance with their terms on the date that is four months after the consummation of this offering and as a result no longer provided a significant retention benefit. As a result, the Board of Directors of the LLC approved, contingent upon consummation of this offering, the vesting in full of IRR-based PIUs that were issued pursuant to the LLC Agreement and related award agreements such that, immediately prior to the consummation of the Reorganization, all IRR-based PIUs will be vested.
The PIUs are described further below following "—Grants of Plan-Based Awards—2010 Grants of Plan-Based Awards."
Immediately prior to the consummation of this offering, as part of the Reorganization, our named executive officers will receive a combination of common stock (both shares not subject to vesting schedules and restricted and unrestricted)shares that are subject to vesting schedules) and options to purchase common stock (both vested and unvested) as well as certain dividend equivalent rights, in each case, in respect of the PIUs held by our named executive officers. Such shares of common stock to be received by our named executive officers will not be newly issued shares that are dilutive to stockholders, but will be allocated from the pool of shares currently held by the LLC that would otherwise have been distributed pro rata to certain funds affiliated with Blackstone, Carlyle, Centerbridge and WL Ross, whom we refer to as the Sponsors, as well as the other unit holders of the LLC in respect of their units as part of the liquidation of the LLC. Any such shares later forfeited by our named executive officers would be
distributed pro rata back to the then-unit holders and not to us. Such shares have not been registered under the Securities Act and may only be sold pursuant to registration under the Securities Act or an exemption therefrom. The shares issuable upon exercise of options will be newly issued shares that will be issued under the BankUnited, Inc. 2010 Omnibus Equity Incentive Plan described below, which will be covered by a registration statement on Form S-8 that we intend to file upon consummation of this offering.
In addition, our Stock Option Plan will be replaced by anin connection with the IPO, the BankUnited, Inc. 2010 Omnibus Equity Incentive Plan, which will beis more suitable for a public company.company, will become effective and post-IPO we will no longer issue new options under the BankUnited, Inc. 2009 Stock Option Plan.
The Board of Directors of the LLC approved, contingent upon consummation of this offering, the vesting in full of the IRR-based PIUs that are held by our named executive officers such that, immediately prior to the consummation of the Reorganization, all IRR-based PIUs will be vested. In addition, each of our named executive officers will be permitted to sell the same fractional amount of common stock (including shares issuableto be received upon the liquidation of the LLC and the corresponding conversion of PIUs to stock and options) as Blackstone, Carlyle, Centerbridge and WL Ross, who we collectively refer to as the Sponsors are permitted to sell in connection with this offering.
Holdback Agreements
In exchange for the foregoing, post-offering,Post-offering, each of (1) Mr. Kanas hasand certain funds affiliated with Blackstone, Carlyle, Centerbridge and WL Ross have separately agreed toduring the 18 months from the date of this prospectus and (2) our other executive officers have separately agreed during the 12 months from the date of this prospectus not to selleffect any equity securities of the company other thansales pursuant to Rule 144 under the exerciseSecurities Act of "piggyback registration rights" as described below underany of our equity securities. See "Description of Our Capital Stock—Registration Rights" for a period of eighteen months following this offering and each of Messrs. Pauls, Bohlsen and Singh has agreed to not to sell any equity securities of the Company (other than pursuant to the exercise of "piggyback
registration rights" as described below under "Description of Our Capital Stock—Registration Rights") for a period of twelve months following the offering.Rights."
Liquidation of the LLC and Treatment of Interests in the LLC
Any liquidation of the LLC in connection with, or in order to facilitate, an initial public offering of our common stock must be implemented in accordance with the terms of the LLC Agreement, which contemplates the Reorganization. In accordance with the terms of the LLC Agreement, the following transactions will occur immediately prior to the consummation of this offering in connection with the liquidation of the LLC (based on an assumed initial offering price of $$24.00 per share, the midpoint of the price range set forth on the cover of this prospectus, and after deducting estimated underwriting discounts and commissions):
shares of our common stock that would be issuable upon exercise of the options received by such holder described above.
above; and
options after the date of this offering and prior to such vesting date as though such holder owned the number of shares of our common stock that would be issuable upon the vesting and exercise of the options.
The allocation between shares of our common stock (whether or not restricted) and options (but not the aggregate number of shares of our common stock and shares subject to options) will be different from what is set forth above to the extent the actual initial public offering price per share in this offering, after deducting underwriting discounts and commissions, differs from the assumed initial public offering price, after deducting estimated underwriting discounts and commissions. If the actual initial public offering price per share in this offering, after deducting underwriting discounts and commissions, is $1.00 greater than the assumed initial public offering price, after deducting estimated underwriting discounts and commissions, in respect of the vested IRR-based PIUs and vested Time-based PIUs, our named executive officers would receive:
and, in respect of the unvested Time-based PIUs, our named executive officers would receive:
Table The allocation between shares of Contents
Ifour common stock (whether or not restricted) and options (but not the aggregate number of shares of our common stock and shares subject to options) will be different from what is set forth above to the extent the actual initial public offering price per share in this offering, after deducting underwriting discounts and commissions, differs from the assumed initial public offering price, after deducting estimated underwriting discounts and commissions. In general, the higher the actual initial offering price, our named executive officers will be allocated more shares and less options; the lower the actual initial offering price, less shares and more options. If the actual initial public offering price per share in this offering, after deducting underwriting discounts and commissions, is $1.00 lessgreater than the assumed initial public offering price, after deducting estimated underwriting discounts and commissions, commissions:
and,
If the actual initial public offering price per share in this offering, after deducting underwriting discounts and commissions, is $1.00 less than the assumed initial public offering price per share in this offering, after deducting estimated underwriting discounts and commissions:
Equity Ownership Requirements
In connection with the formation of our Company, certain of our named executive officers were required to invest a portion of their personal assets in our Company. Mr. Kanas invested $23,500,000, Mr. Bohlsen invested $10,000,000 and Mr. Singh invested $1,000,000. Mr. Pauls invested $1,000,000 in our Company in connection with the commencement of his employment. The amounts that our named executive officers were initially required to invest vary and each executive's investment amount is in relation to his net worth.
In connection with this offering and in exchange for the PIU vesting described above, we will adoptadopted a policy that we expectto which our named executive officers will agree toagreed relating to the minimum amount of equity securities that such named executive officers must retain for so long as they are employed by us. This policy, which may be waived from time to time by the Compensation Committee, will provide that so long as Mr. Kanas is Chairman and CEO, he will not sell equity if, after giving effect to such sale, his retained equity (including vested and unvested equity, including options) has a
value that is less than twelve times his base salary. Additionally, for Messrs. Pauls, Bohlsen and Singh, so long as they are employed and are named executive officers of the Company, they will not sell equity if, after giving effect to such sale, their respective retained equity (including vested and unvested equity, including options) has a value that is less than five times their respective base salary. We believe that requiring members of our senior management to invest and maintain ownership in our Company serves to align their interests with the interests of our stockholders generally.
Tax and Accounting Implications
The employment agreement of each of Messrs. Kanas, Pauls, Bohlsen, and Singh provides that prior to the time our Company undergoes an initial public offering, we and the applicable executive agree to discuss the structure of his base salary and bonus compensation in order to maintain the deductibility of compensation under Section 162(m) of the Internal Revenue Code. In addition, transition provisions under Section 162(m) may apply for a period of three years following the consummation of this offering to certain compensation arrangements that were entered into by a corporation before it was publicly held.
Summary Compensation Table
The following summary compensation table sets forth the total compensation paid or accrued for the year ended December 31, 2010, to our Chief Executive Officer, Chief Financial Officer and our two other most highly compensated executive officers who were serving as executive officers on December 31, 2010. We refer to these officers as our "named executive officers."
Name and Principal Position | Year | Salary ($) | Bonus ($) | Stock Awards ($)(5) | Change In Pension Value and Nonqualified Deferred Compensation Earnings ($)(6) | All Other Compensation ($)(7) | Total ($) | ||||||||||||||||
|---|---|---|---|---|---|---|---|---|---|---|---|---|---|---|---|---|---|---|---|---|---|---|---|
| John A. Kanas, | 2010 | 2,250,000 | — | 131,276 | 7,139 | 107,283 | 2,495,698 | ||||||||||||||||
| Chairman, President and Chief Executive Officer(1) | 2009 | 1,377,620 | — | 35,763,663 | 238 | 83,980 | 37,225,501 | ||||||||||||||||
Douglas J. Pauls, | 2010 | 650,000 | — | 10,592 | 2,044 | 44,250 | 706,886 | ||||||||||||||||
| Chief Financial Officer(2) | 2009 | 267,941 | — | 2,914,076 | 62 | 59,521 | 3,241,600 | ||||||||||||||||
John Bohlsen, | 2010 | 1,250,000 | — | 67,338 | 3,071 | 62,283 | 1,382,692 | ||||||||||||||||
| Vice Chairman and Chief Lending Officer(3) | 2009 | 765,345 | — | 18,279,207 | 102 | 50,886 | 19,095,540 | ||||||||||||||||
| Rajinder P. Singh, | 2010 | 1,000,000 | — | 58,448 | 3,071 | 55,218 | 1,116,737 | ||||||||||||||||
| Chief Operating Officer(4) | 2009 | 612,276 | — | 15,894,969 | 102 | 23,302 | 16,530,649 | ||||||||||||||||
Grants of Plan-Based Awards
The following table sets forth certain information with respect to the plan-based awards granted to each of our named executive officers during 2010:
2010 Grants of Plan-Based Awards
Name | Grant Date | All Other Stock Awards: Number of Shares of Stock or Units (#)(1) | Closing Price on Date of Grant ($/Sh)(2) | Grant Date Fair Value of Stock and Option Awards ($)(3) | |||||||||
|---|---|---|---|---|---|---|---|---|---|---|---|---|---|
Mr. Kanas | 3/11/2010 | 134 | 850 | 113,940 | |||||||||
| 9/30/2010 | 14 | 1,238 | 17,336 | ||||||||||
Mr. Pauls | 3/11/2010 | 11 | 850 | 9,354 | |||||||||
| 9/30/2010 | 1 | 1,238 | 1,238 | ||||||||||
Mr. Bohlsen | 3/11/2010 | 69 | 850 | 58,671 | |||||||||
| 9/30/2010 | 7 | 1,238 | 8,667 | ||||||||||
Mr. Singh | 3/11/2010 | 60 | 850 | 51,018 | |||||||||
| 9/30/2010 | 6 | 1,238 | 7,430 | ||||||||||
were valued prior to the March 11, 2010 grants, and as of September 30, 2010 with respect to the grants on such date in accordance with FASB ASC Topic 718.
Management Profits Interest Units
On May 21, 2009, we granted management PIUs to certain of our named executive officers. Each PIU represents the right of the holder to share in distributions from the LLC after certain preferred allocations have been made. Mr. Pauls received his PIUs on September 1, 2009, after commencing employment with us on August 4, 2009. Half of the PIUs vest with the passage of time and half vest upon attainment of certain investment returns.
With regard to the Time-based PIUs, in general: one-third vested on May 21, 2010, and one-third will become vested on each of May 21, 2011 and May 21, 2012. With respect to Mr. Pauls' PIUs, one-third vested on September 1, 2010, and one-third will become vested on each of September 1, 2011 and September 1, 2012.
IRR-based PIUs will become vested pursuant to the terms of LLC Agreement.
In the event of a change of control, all of the unvested Time-based PIUs will vest. "Change of control" means either: the sale or disposition of substantially all of our assets to persons other than our investor members and outside members and their respective affiliates; or the date upon which persons other than our investor members or outside members gain 50% or more of the voting power of our Company. In the event that a named executive officer's (other than Mr. Pauls) employment is terminated without cause or he resigns for good reason, 100% of his Time-based PIUs will vest as of the termination date.
If a named executive officer's employment with us terminates due to his death or disability and, in the case of Mr. Pauls, due to his termination without cause or resignation for good reason, he shall become entitled to the number of Time-based PIUs that would have vested over the twelve-month period following the termination date.
Each named executive officer who holds PIUs is subject to certain anti-dilution protection whereby he will receive additional grants of PIUs upon the issuance of additional units in the LLC. The anti-dilution protection ensures that the economic value of the PIUs granted to the executive remains unaffected by subsequent events.
Employment Agreements with Named Executive Officers
On July 10, 2009, Messrs. Kanas, Bohlsen, and Singh entered into employment agreements with the LLC, BankUnited, Inc. and BankUnited, which set forth the terms of their employment. On September 1, 2009, Mr. Pauls entered into employment agreements with the LLC, BankUnited, Inc. and BankUnited, which set forth the terms of his employment. On August 18, 2010, we amended and restated the original employment agreements with each of our named executive officers to remove the LLC and BankUnited, Inc. as parties to the agreement, leaving BankUnited as the sole employer. In addition, on August 18, 2010, each of our named executive officers entered into new employment agreements with the LLC and BankUnited, Inc. Our named executive officers did not become entitled to new or additional compensation as a result of the amendments and entry into the new employment agreements; rather the compensation and benefits provided to our named executive officers under the original employment agreements was allocated between the amended and restated employment agreements with BankUnited and the new employment agreements with the LLC and BankUnited, Inc.
In general, the initial term of employment provided under each named executive officer's amended and restated employment agreement with BankUnited and employment agreement with the LLC and BankUnited, Inc. expires on July 10, 2012 (in the case of Mr. Pauls, who commenced his employment later than our other named executive officers, the initial term of employment expires on September 1, 2012). The Board of BankUnited or the LLC and BankUnited, Inc., as applicable, may elect to extend the term of employment for additional one-year periods unless either BankUnited, the LLC and
BankUnited, Inc., as applicable, or the named executive officer gives the other party at least ninety days' notice of intent not to renew.
In addition, each named executive officer's amended and restated employment agreement with BankUnited contains certain regulatory language required by the OTS, which provides for the suspension or termination of BankUnited's obligations under the agreement in the event of certain events affecting the executive's ability to work for BankUnited or if BankUnited is in default of certain of its regulatory obligations.
Each named executive officer's employment agreement with BankUnited, as amended and restated, and new employment agreement with the LLC and BankUnited, Inc. are summarized below.
John Kanas
Amended and Restated Agreement with BankUnited
The agreement provides Mr. Kanas an annual base salary of $1,125,000, which may be increased (but not decreased) at the sole discretion of the board of directors of BankUnited. During each full fiscal year, Mr. Kanas will be eligible to earn a discretionary bonus as determined by the board of directors of BankUnited.
Mr. Kanas is entitled to participate in BankUnited's employee benefit plans (other than annual bonus and incentive plans) on the same basis as those benefits are available to BankUnited's other senior executives. Those benefits include: participation in group life, hospitalization, medical, dental, health, accident and short and long term disability plans, four weeks annual paid vacation, and reimbursement for reasonable business expenses. In addition, Mr. Kanas is eligible for payment of professional dues and professional membership fees, participation in an excess 401(k) plan, an automobile allowance, and a driver (at market cost).
Agreement with the LLC and BankUnited, Inc.
The agreement provides Mr. Kanas an annual base salary of $1,125,000, which may be increased (but not decreased) at the sole discretion of the board of directors of the LLC and BankUnited, Inc. During each full fiscal year, Mr. Kanas will be eligible to earn a discretionary bonus as determined by the board of directors of the LLC and BankUnited, Inc.
Douglas Pauls
Amended and Restated Agreement with BankUnited
The agreement provides Mr. Pauls an annual base salary of $552,500, which may be increased (but not decreased) at the sole discretion of the board of directors of BankUnited. During each full fiscal year, Mr. Pauls will be eligible to earn a discretionary bonus as determined by the board of directors of BankUnited.
Mr. Pauls is entitled to participate in BankUnited's employee benefit plans (other than annual bonus and incentive plans) on the same basis as those benefits are available to BankUnited's other senior executives. In addition, Mr. Pauls is eligible to participate in our excess 401(k) plan and to receive an automobile allowance.
Agreement with the LLC and BankUnited, Inc.
The agreement provides Mr. Pauls an annual base salary of $97,500, which may be increased (but not decreased) at the sole discretion of the board of directors of the LLC and BankUnited, Inc. During each full fiscal year, Mr. Pauls will be eligible to earn a discretionary bonus as determined by the board of directors of the LLC and BankUnited, Inc.
John Bohlsen
Amended and Restated Agreement with BankUnited
The agreement provides Mr. Bohlsen an annual base salary of $1,062,500, which may be increased (but not decreased) at the sole discretion of the board of directors of BankUnited. During each full fiscal year, Mr. Bohlsen will be eligible to earn a discretionary bonus as determined by the board of directors of BankUnited.
Mr. Bohlsen will be entitled to participate in BankUnited's employee benefit plans (other than annual bonus and incentive plans) on the same basis as those benefits are available to BankUnited's other senior executives. In addition, Mr. Bohlsen is eligible for payment of professional dues and professional membership fees, participation in an excess 401(k) plan, an automobile allowance, and a driver (at market cost).
Agreement with the LLC and BankUnited, Inc.
The agreement provides Mr. Bohlsen an annual base salary of $187,500, which may be increased (but not decreased) at the sole discretion of the board of directors of the LLC and BankUnited, Inc. During each full fiscal year, Mr. Bohlsen will be eligible to earn a discretionary bonus as determined by the board of directors of the LLC and BankUnited, Inc.
Rajinder Singh
Amended and Restated Agreement with BankUnited
The agreement provides Mr. Singh an annual base salary of $750,000, which may be increased (but not decreased) at the sole discretion of the board of directors of BankUnited. During each full fiscal year, Mr. Singh will be eligible to earn a discretionary bonus as determined by the board of directors of BankUnited.
Mr. Singh will be entitled to participate in BankUnited's employee benefit plans (other than annual bonus and incentive plans) on the same basis as those benefits are available to BankUnited's other senior executives. In addition, Mr. Singh is eligible for payment of professional dues and professional membership fees, participation in an excess 401(k) plan, and an automobile allowance.
Agreement with the LLC and BankUnited, Inc.
The agreement provides Mr. Singh an annual base salary of $250,000, which may be increased (but not decreased) at the sole discretion of the board of directors of the LLC and BankUnited, Inc. During each full fiscal year, Mr. Singh will be eligible to earn a discretionary bonus as determined by the board of directors of the LLC and BankUnited, Inc.
For a description of severance payments and benefits made available under the employment agreements, see the section below entitled "—Potential Payments Upon Termination or Change-in-Control."
BankUnited, Inc. 2010 Omnibus Equity Incentive Plan
In connection with this offering, we will adopthave adopted the BankUnited, Inc. 2010 Omnibus Equity Incentive Plan, or the Plan, which will become effective upon the later to occur of the effectiveness of this offering and our common stock being listed and approved for listing upon notice of issuance on the New York Stock Exchange, and will continue in effect until the tenth anniversary of that date.
Purpose
The purposes of the Plan are to provide additional incentives to selected employees, directors, or independent contractors of and consultants to us or certain of our affiliates, in order to strengthen their commitment, motivate them to faithfully and diligently perform their responsibilities and to attract
and retain competent and dedicated persons who are essential to the success of our business and whose efforts will impact our long-term growth and profitability.
The Plan provides for the grant of share options (all share options granted under the Plan are intended to be non-qualified share options and are not intended to qualify as "incentive stock options" within the meaning of Section 422 of the Internal Revenue Code of 1986, as amended (the "Internal Revenue Code")), share appreciation rights ("SARs"), restricted shares, deferred shares, performance shares, unrestricted shares and other share-based awards.
Plan Administration
The Plan may be administered by our Board or by a committee of directors designated by our Board (the "Administrator"). The Administrator has broad administrative authority to interpret the Plan and may prescribe, amend and rescind rules and make all other determinations necessary or desirable for the administration of the Plan. Pursuant to its administrative authority, the Administrator may, among other things: select the persons who will receive awards and determine the types of awards to be granted; determine the terms and conditions of those awards, and amend the terms and conditions of outstanding awards.
Shares of Common Stock Subject to Awards
The number of shares of our common stock available for issuance under the Plan is .7,500,000. Once the Plan becomes subject to Section 162(m) of the Internal Revenue Code, the aggregate awards granted during any single year to a person who is likely to be a "covered employee" (within the meaning of Section 162(m) of the Internal Revenue Code) may not exceed 1,000,000 shares of our common stock.
The shares of our common stock issued under the Plan may consist of authorized but unissued shares or shares that we may reacquire in the open market, in private transactions, or otherwise. If any shares of common stock subject to an award granted under the Plan are forfeited, cancelled, exchanged or surrendered or if an award otherwise terminates or expires without a distribution of shares to the participant, those shares will again be available for awards under the Plan.
The Plan provides that, in the event of a merger, consolidation, recapitalization, share dividend or other change in corporate structure affecting our common stock, the Administrator will make, in its sole discretion, an equitable substitution or proportional adjustment in (i) the aggregate number of shares of common stock reserved for issuance under the Plan, (ii) the maximum number of shares of common stock that may be subject to awards granted to a participant in any calendar year, (iii) the kind, number and exercise price subject to outstanding share options and SARs granted under the Plan, and (iv) the kind, number and purchase price of shares of common stock subject to outstanding awards of restricted shares, deferred shares, performance shares or other share-based awards granted under the Plan. In addition, in the event of a merger, amalgamation, consolidation, reclassification, spin-off, spin-out, repurchase, reorganization, recapitalization, share dividend or other change in corporate structure affecting the common stock, the Administrator may, in its discretion, terminate all awards in exchange for the payment of cash or in-kind consideration.
Awards
General. The terms and conditions of each award granted under the Plan will be set forth in an award agreement in a form to be determined by the Administrator.
Share Options. The exercise period of a share option may not exceed ten years from the date of grant and the exercise price may not be less than 100% of the fair market value of a share of common stock on the date of grant.
An optionee will have no rights to dividends or distributions or other rights of a stockholder with respect to the shares of common stock subject to a share option until the optionee has given written notice of exercise and paid the exercise price and applicable withholding taxes.
Unless the award agreement provides otherwise, in the event of an optionee's termination of employment or service for any reason other than for cause, retirement, disability or death, the optionee's share options (to the extent exercisable at the time of such termination) generally will remain exercisable until 90 days after such termination and will then expire. Unless the applicable share option agreement provides otherwise, in the event of an optionee's termination of employment or service due to retirement, disability or death, the optionee's share options (to the extent exercisable at the time of such termination) generally will remain exercisable until one year after such termination and will then expire. Share options that were not exercisable on the date of termination of the optionee's employment or service for any reason other than for cause will expire at the close of business on the date of such termination. In the event of an optionee's termination of employment or service for cause, the optionee's outstanding share options will expire at the commencement of business on the date of such termination.
Share Appreciation Rights. SARs may be granted under the Plan either alone ("free-standing SAR") or in conjunction with all or part of any share option granted under the Plan ("tandem SAR"). A free-standing SAR granted under the Plan will entitle its holder to receive, at the time of exercise, an amount per share equal to the excess of the fair market value (at the date of exercise) of a share of common stock over a specified price fixed by the Administrator on the date of grant (which shall be no less than fair market value at the date of grant). A tandem SAR granted under the Plan will entitle its holder to receive, at the time of exercise of the SAR and surrender of the applicable portion of the related share option, an amount per share equal to the excess of the fair market value (at the date of exercise) of a share of common stock over the exercise price of the related share option. The exercise price of a SAR may not be less than 100% of the fair market value of a share of common stock on the date of grant. The exercise period of a free-standing SAR may not exceed ten years from the date of grant. The exercise period of a tandem SAR will expire upon the expiration of its related award.
Participants who are granted SARs shall have no rights as stockholders of BankUnited, Inc. with respect to the grant or exercise of such rights.
In the event of a participant's termination of employment or service, free-standing SARs will be exercisable at such times and subject to such terms and conditions as determined by the Administrator in the applicable award agreement, while tandem SARs will be exercisable at such times and subject to the terms and conditions applicable to the related share option.
Restricted Shares, Deferred Shares and Performance Shares. Restricted shares, deferred shares and performance shares may be issued either alone or in addition to other awards granted under the Plan. The Administrator will determine the purchase price and performance objectives, if any, with respect to the grant of restricted shares, deferred shares and performance shares. Subject to the provisions of the Plan and the applicable award agreement, the Administrator has the sole discretion to provide for the lapse of restrictions in installments or the acceleration or waiver of restrictions (in whole or part) under
certain circumstances, including the attainment of certain performance goals, a participant's termination of employment or service or a participant's death or disability.
Unless the award agreement provides otherwise, participants with restricted shares and performance shares will generally have all of the rights of a shareholder, including dividend or distribution rights. Participants with deferred shares will generally not have the rights of stockholders, but, during the restricted period, deferred shares may be credited with dividend or distribution equivalent rights, if the award agreement so provides.
The rights of a participant with respect to restricted shares, deferred shares and performance shares upon termination of the participant's employment or service will be set forth in the applicable award agreement.
Performance shares may be subject to the achievement of one or more of the following performance goals: (i) earnings, including one or more of operating income, earnings before or after taxes, earnings before or after interest, depreciation, amortization, adjusted EBITDA, economic earnings, or extraordinary or special items or book value per share (which may exclude nonrecurring items); (ii) pre-tax income or after-tax income; (iii) earnings per share (basic or diluted); (iv) operating profit; (v) revenue, revenue growth or rate of revenue growth; (vi) return on assets (gross or net), return on investment, return on capital, or return on equity; (vii) operating expenses; (viii) share price or total shareholder return; (ix) implementation or completion of critical projects or processes; (x) cumulative earnings per share growth; (xi) net interest margin, operating margin or profit margin; (xii) efficiency ratio, cost targets, reductions and savings, productivity and efficiencies; (xiii) strategic business criteria, consisting of one or more objectives based on meeting specified market penetration, geographic business expansion, customer satisfaction, employee satisfaction, human resources management, supervision of litigation, information technology, and goals relating to acquisitions, divestitures, joint ventures and similar transactions, and budget comparisons; (xiv) personal professional objectives, including any of the foregoing performance goals, the implementation of policies and plans, the negotiation of transactions, the development of long term business goals, formation of joint ventures, and the completion of other corporate transactions; and (xv) any combination of, or a specified increase in, any of the foregoing. Performance goals not specified in the Plan may be used to the extent that an award is not intended to comply with Section 162(m) of the Internal Revenue Code. If required to deduct the compensation under Section 162(m) of the Internal Revenue Code, no payment shall be made to a participant that is likely to be a "covered employee" (within the meaning of Section 162(m) of the Internal Revenue Code) prior to the certification by a committee composed entirely of individuals that meet the qualifications of an "outside director" within the meaning of Section 162(m) of the Internal Revenue Code that the performance goals have been attained.
Other Share-Based Awards. The Administrator may grant other share-based awards upon terms and conditions determined by the Administrator at the date of grant or thereafter.
Treatment of Outstanding Awards upon a Change in Control
The Plan provides that, unless otherwise determined by the Administrator and evidenced in an award agreement, if a change in control occurs, then (i) any unvested or unexercisable portion of an award carrying a right to exercise shall become fully vested and exercisable and (ii) the restrictions, deferral limitations, payment conditions and forfeiture conditions applicable to any other award granted under the Plan will lapse and such unvested awards will be deemed fully vested and any performance conditions imposed with respect to such awards will be deemed to be fully achieved.
For purposes of the Plan a "change in control" means, in general: (i) a person or entity acquires securities representing 50% or more of our voting power; (ii) certain mergers or amalgamations involving us or any of our subsidiaries and another corporation; (iii) an unapproved change in the majority membership of our Board; (iv) the approval by stockholders of a plan of complete liquidation or dissolution of our company; or (v) the consummation of an agreement for certain sales or dispositions of all or substantially all of our assets.
Determination of Fair Market Value
The fair market value of a share of common stock will be determined by the Administrator in its sole discretion, subject to certain limitations, including if our common stock is admitted to trading on a national securities exchange, the fair market value of a share of common stock will be the closing sales price per share on the applicable date, or if no sale was reported on that date, for the last preceding date on which there was a sale of shares of common stock on the exchange.
BankUnited, Inc. 2009 Stock Option Plan
We also maintain the BankUnited, Inc. 2009 Stock Option Plan, pursuant to which awards of stock options have been granted to employees other than our named executive officers. In connection with this offering and the adoption of the BankUnited, Inc. 2010 Omnibus Equity Incentive Plan, all future grants of stock options will be made under the new plan.
Option Exercises and Stock Vested
The following table contains information regarding PIUs held by our named executive officers, which vested during fiscal year 2010:
2010 Option Exercises and Stock Vested
| | Stock Awards | ||||||
|---|---|---|---|---|---|---|---|
Name | Number of Shares Acquired on Vesting (#)(1) | Value Realized on Vesting ($)(2) | |||||
Mr. Kanas | 8,444 | 7,123,821 | |||||
Mr. Pauls | 688 | 708,514 | |||||
Mr. Bohlsen | 4,316 | 3,640,999 | |||||
Mr. Singh | 3,753 | 3,166,190 | |||||
Outstanding Equity Awards at Fiscal Year-End
The following table shows grants of equity awards outstanding on December 31, 2010 for each of our named executive officers:
Outstanding Equity Awards at 2010 Fiscal Year-End
| | Stock Awards | ||||||
|---|---|---|---|---|---|---|---|
Name | Number of Shares or Units of Stock That Have Not Vested (#)(1) | Market Value of Shares or Units of Stock That Have Not Vested ($)(2) | |||||
Mr. Kanas | 42,268 | 52,338,911 | |||||
Mr. Pauls | 3,444 | 4,264,560 | |||||
Mr. Bohlsen | 21,603 | 26,750,517 | |||||
Mr. Singh | 18,786 | 23,262,082 | |||||
2011 and May 21, 2012. With respect to Mr. Pauls' PIUs, one-third vested on September 1, 2010, and one-third will become vested on each of September 1, 2011 and September 1, 2012. IRR-based PIUs will become vested pursuant to the terms of LLC Agreement.
Nonqualified Deferred Compensation
Messrs. Kanas, Pauls, Bohlsen and Singh are eligible to participate in our Nonqualified Deferred Compensation Plan, which allows each executive the ability to defer compensation in excess of annual IRS limits (for 2009 and 2010, the limit is $16,500) that are applicable to our qualified 401(k) plan. Each executive is also eligible to receive company matching contributions under the plan. For the 2010 plan year, we contributed an amount equal to four and one-half percent of each executive's eligible compensation to the plan on his behalf. For subsequent plan years, we will contribute one hundred percent of the first one percent plus seventy percent of the next five percent of eligible compensation that the executive elects to defer under the plan. Amounts deferred by the executive are vested at all times and amounts that we contribute on his behalf will become vested upon the earlier to occur of a change in control (as defined in the plan), the executive's death, disability, attainment of "Normal Retirement Age" under our 401(k) plan or completion of two years of service. Amounts deferred under our Nonqualified Deferred Compensation Plan are distributed upon a date specified by the executive, which may be no earlier than January 1 of the third plan year following the plan year in which the compensation would have otherwise been paid to the executive, or upon the earliest to occur of the executive's separation from service, disability or a change in control.
The table below shows contributions to our Nonqualified Deferred Compensation Plan by our named executive officers and by us on behalf of our named executive officers during 2010.
Nonqualified Deferred Compensation Table
Name | Executive Contributions in Last FY ($) | Registrant Contributions in Last FY ($) | Aggregate Earnings in Last FY ($) | Aggregate Withdrawals/ Distributions ($) | Aggregate Balance at Last FYE ($) | |||||||||||
|---|---|---|---|---|---|---|---|---|---|---|---|---|---|---|---|---|
Mr. Kanas | 105,300 | 78,975 | 12,087 | — | 309,619 | |||||||||||
Mr. Pauls | 40,500 | 18,225 | 3,446 | — | 91,498 | |||||||||||
Mr. Bohlsen | 45,300 | 33,975 | 5,200 | — | 133,198 | |||||||||||
Mr. Singh | 45,300 | 33,975 | 5,200 | — | 133,198 | |||||||||||
Potential Payments upon Termination or Change-in-Control
Each named executive officer's amended and restated employment agreement with BankUnited and new employment agreement with the LLC and BankUnited, Inc. provide for severance payments and benefits, to the extent applicable, in the event of a termination of employment. The following description of the severance payments and benefits apply generally with respect to each named executive officer's amended and restated employment agreement with BankUnited and employment agreement with the LLC and BankUnited, Inc. except as specifically noted.
A named executive officer's employment may be terminated at any time and for any reason upon at least thirty days' notice. A named executive officer's employment may also be terminated for "cause" (as defined below).
If a named executive officer's employment is terminated for cause, or if he resigns at a time when grounds for cause exist, or if he resigns without "good reason" (as defined below) he is entitled to receive:
(A) the base salary accrued through the date of termination, which must be paid within fifteen days following the date of such termination;
(B) any annual bonus awarded but unpaid at the time of the termination for the preceding fiscal year (unless payment is otherwise deferred, in which case it will be paid at the earliest possible time); and
(C) any fully vested employee benefits to which he is entitled.
Together, (A)-(C) will be referred to as the "accrued rights."
In the event that a named executive officer dies, his employment will automatically terminate. If he becomes disabled, BankUnited or the LLC and BankUnited, Inc., as applicable, may terminate his employment. For purposes of the employment agreement, "disability" means the failure of a named executive officer to perform his duties for six consecutive months, or for an aggregate of nine months in any consecutive twelve-month period.
In the event that a named executive officer's employment is terminated due to death or disability, his estate is entitled to receive the accrued rights. In addition, the named executive officer (to the extent applicable) and his dependents are generally entitled to receive continued coverage under the group health plans of BankUnited or the LLC and BankUnited, Inc., as applicable, at the sole expense of BankUnited or the LLC and BankUnited, Inc., as applicable, for twenty-four months following his disability or death. If the continued coverage cannot be provided for longer than eighteen months, BankUnited or the LLC and BankUnited, Inc., as applicable, shall pay the named executive officer or his estate, on the first business day of every month, an amount equal to the premium we would
otherwise have paid. In the case of Mr. Pauls, he (to the extent applicable) and his dependents are entitled to receive continued coverage under the group health plans of BankUnited or the LLC and BankUnited, Inc., as applicable, at the sole expense of BankUnited or the LLC and BankUnited, Inc., as applicable, for six months following the disability or death.
A named executive officer's employment may be terminated by BankUnited or the LLC and BankUnited, Inc., as applicable, without cause or voluntarily by him for good reason.
If Messrs. Kanas' or Bohlsen's employment is terminated without cause or for good reason, he is entitled to receive:
(A) the accrued rights;
(B) two times the sum of his base salary and any bonus paid to him for the preceding fiscal year (minus $250,000 under the amended and restated employment agreement with BankUnited), minus the present value of any other cash severance benefits, payable within sixty days following his termination; and
(C) continued coverage under the group health plans of BankUnited or the LLC and BankUnited, Inc., as applicable, for the named executive officer and his dependents until the earlier of twenty-four months from his date of termination, and the date upon which the named executive officer becomes eligible for comparable coverage from another employer. If coverage cannot be provided for longer than eighteen months, the named executive officer will receive the premium amounts in cash on the first business day of every month.
If Mr. Pauls' employment is terminated without cause or if he resigns for good reason, he is entitled to receive:
(A) the accrued rights;
(B) the number of months, up to a maximum of twelve, in which Mr. Pauls was employed with us, multiplied by his monthly base salary, minus the present value of any other cash severance benefits, payable within sixty days following his termination; and
(C) continued coverage under the group health plans of BankUnited or the LLC and BankUnited, Inc., as applicable, for Mr. Pauls and his dependents until the earlier of six months from his date of termination, and the date upon which Mr. Pauls becomes eligible for comparable coverage from another employer.
If Mr. Singh's employment is terminated without cause or if he resigns for good reason, he is entitled to receive:
(A) the accrued rights;
(B) two times the sum of Mr. Singh's base salary and any bonus paid to him for the preceding fiscal year, minus the present value of any other cash severance benefits, payable within sixty days following his termination; and
(C) continued coverage under the group health plans of BankUnited or the LLC and BankUnited, Inc., as applicable, for Mr. Singh and his dependents until the earlier of twenty-four months from his date of termination, and the date upon which Mr. Singh becomes eligible for comparable coverage from another employer. If coverage cannot be provided for longer than eighteen months, Mr. Singh will receive the premium amounts in cash on the first business day of every month.
Payment of the amounts other than the accrued rights are contingent upon the named executive officer executing a general release of claims in favor of BankUnited or the LLC and BankUnited, Inc., as applicable.
If any compensation paid to a named executive officer becomes subject to the excise tax under Section 4999 of the Internal Revenue Code, BankUnited will pay the named executive officer an amount equal to half of the amount that would be necessary to put him in the same position as he would have been in had he not been subject to the excise tax.
Each named executive officer is subject to non-competition and non-solicitation covenants for eighteen months post-termination. In addition, he is subject to perpetual non-disparagement and confidentiality covenants.
For purposes of the employment agreements, "cause" generally means a named executive officer's: (A) personal dishonesty, (B) incompetence or willful misconduct, (C) willful or intentional failure to perform certain duties, (D) willful violation of any law, rule, or regulation or (E) willful and material breach of any material provision of the employment agreement.
"Good reason" generally means a material reduction in the named executive officer's salary or benefits, a material diminution in his reporting relationship or responsibilities (in the case of Messrs. Bohlsen or Singh, such a diminution will not constitute good reason so long as Mr. Kanas is the Chief Executive Officer of the Company or Chairman of our Board if the diminution was approved by Mr. Kanas), the failure of BankUnited or the LLC and BankUnited, Inc., as applicable, to pay compensation, or notice by BankUnited or the LLC and BankUnited, Inc., as applicable, that it or they will not be extending his term. In the case of Mr. Kanas, "good reason" also includes his removal as Chief Executive Officer or Chairman of our Board (except, in the case of the latter, for regulatory
reasons). In order for any of the above events to constitute "good reason," the named executive officer must provide notice of his intention to resign within sixty days of the occurrence of the event.
The following tables show the severance payments and benefits that would have become payable to each named executive officer assuming the termination of his employment or a change in control occurred as of December 31, 2010.
Mr. Kanas
| | Cash Severance ($)(1) | Continued Benefits ($)(2) | Value of Accelerated Equity ($)(3) | Excise Tax Gross-Up ($)(4) | Total ($) | |||||||||||
|---|---|---|---|---|---|---|---|---|---|---|---|---|---|---|---|---|
Death/Disability | — | 30,121 | 10,467,782 | — | 10,497,903 | |||||||||||
For Cause/Without Good Reason | — | — | — | — | — | |||||||||||
Without Cause/For Good Reason | 4,000,000 | 30,121 | 20,935,564 | — | 24,965,685 | |||||||||||
Change in Control | — | — | 52,338,911 | — | 52,338,911 | |||||||||||
Mr. Pauls
| | Cash Severance ($)(1) | Continued Benefits ($)(2) | Value of Accelerated Equity ($)(3) | Excise Tax Gross-Up ($)(4) | Total ($) | |||||||||||
|---|---|---|---|---|---|---|---|---|---|---|---|---|---|---|---|---|
Death/Disability | — | 7,530 | 852,912 | — | 860,442 | |||||||||||
For Cause/Without Good Reason | — | — | — | — | — | |||||||||||
Without Cause/For Good Reason | 650,000 | 7,530 | 852,912 | — | 1,510,442 | |||||||||||
Change in Control | — | — | 4,264,560 | — | 4,264,560 | |||||||||||
Mr. Bohlsen
| | Cash Severance ($)(1) | Continued Benefits ($)(2) | Value of Accelerated Equity ($)(3) | Excise Tax Gross-Up ($)(4) | Total ($) | |||||||||||
|---|---|---|---|---|---|---|---|---|---|---|---|---|---|---|---|---|
Death/Disability | — | 30,121 | 5,350,103 | — | 5,380,224 | |||||||||||
For Cause/Without Good Reason | — | — | — | — | — | |||||||||||
Without Cause/For Good Reason | 2,000,000 | 30,121 | 10,700,207 | — | 12,730,328 | |||||||||||
Change in Control | — | — | 26,750,517 | — | 26,750,517 | |||||||||||
Mr. Singh
| | Cash Severance ($)(1) | Continued Benefits ($)(2) | Value of Accelerated Equity ($)(3) | Excise Tax Gross-Up ($)(4) | Total ($) | |||||||||||
|---|---|---|---|---|---|---|---|---|---|---|---|---|---|---|---|---|
Death/Disability | — | 30,121 | 4,652,416 | — | 4,682,537 | |||||||||||
For Cause/Without Good Reason | — | — | — | — | — | |||||||||||
Without Cause/For Good Reason | 2,000,000 | 30,121 | 9,304,833 | — | 11,334,954 | |||||||||||
Change in Control | — | — | 23,262,082 | — | 23,262,082 | |||||||||||
Director Compensation
The following table shows compensation paid, earned or awarded to each of the non-employee members of our Board for 2010.
Name | Fees Earned or Paid in Cash ($) | Stock Awards ($) | Option Awards ($) | Non-Equity Incentive Plan Compensation ($) | Change in Pension Value and Nonqualified Deferred Compensation Earnings ($) | All Other Compensation ($) | Total ($) | Fees Earned or Paid in Cash ($) | Stock Awards ($) | Option Awards ($) | Non-Equity Incentive Plan Compensation ($) | Change in Pension Value and Nonqualified Deferred Compensation Earnings ($) | All Other Compensation ($) | Total ($) | ||||||||||||||||||||
|---|---|---|---|---|---|---|---|---|---|---|---|---|---|---|---|---|---|---|---|---|---|---|---|---|---|---|---|---|---|---|---|---|---|---|
Chinh E. Chu | — | — | — | — | — | — | — | |||||||||||||||||||||||||||
Richard S. LeFrak | — | — | — | — | — | — | — | |||||||||||||||||||||||||||
Wilbur L. Ross, Jr. | — | — | — | — | — | — | — | |||||||||||||||||||||||||||
P. Olivier Sarkozy | — | — | — | — | — | — | — | |||||||||||||||||||||||||||
Lance N. West | — | — | — | — | — | — | — | |||||||||||||||||||||||||||
Eugene F. DeMark | 32,917 | 32,917 | 32,917 | — | — | — | — | — | 32,917 | |||||||||||||||||||||||||
Ambassador Sue M. Cobb. | 50,000 | 50,000 | 50,000 | — | — | — | — | — | 50,000 | |||||||||||||||||||||||||
Steven J. Saiontz(1) | 45,695 | 45,695 | 45,695 | — | — | — | — | — | 45,695 | |||||||||||||||||||||||||
In general, the members of our Board are either investors or agents of investors in our Company and, other than Mr. DeMark and Ambassador Cobb, they do not receive any compensation from us for service on our Board. Mr. DeMark is entitled to receive an annual retainer fee equal to $100,000 and Ambassador Cobb is entitled to receive an annual retainer fee equal to $50,000. Mr. Kanas and Mr. Bohlsen are also members of our Board but do not receive any additional compensation for their services on our Board.
The following table sets forth the compensation for future services expected to be paid to our non-employee directors following the completion of this offering.
Name | Retainer Fees | |||
|---|---|---|---|---|
Chinh E. Chu | — | |||
Ambassador Sue M. Cobb | 50,000 | |||
Eugene F. DeMark | 100,000 | |||
Richard S. LeFrak | — | |||
Wilbur L. Ross, Jr. | — | |||
Pierre Olivier Sarkozy | — | |||
Lance N. West | — | |||
Directors who are also our employees have not received and will not receive any compensation from us for service on our Board or Board committees.
CERTAIN RELATIONSHIPS AND RELATED PARTY TRANSACTIONS
In addition to the director and executive officer compensation arrangements discussed above under "Compensation Discussion and Analysis—Executive Officer Compensation," the following is a summary of material provisions of various transactions we have entered into with our executive officers, directors (including nominees), 5% or greater stockholders and any of their immediate family members since April 28, 2009, the date BankUnited, Inc. was incorporated. We believe the terms and conditions set forth in such agreements are reasonable and customary for transactions of this type.
Registration Rights Agreement
The LLC Agreement entered into in connection with the Acquisition contains registration rights provisions with respect to sales of shares of the applicable holding company of BankUnited that is used as the public vehicle in connection with any initial public offering. In accordance with the LLC Agreement, in connection with this offering, BankUnited, Inc., the Sponsors, and Messrs. Kanas, Bohlsen, Singh and Pauls, who we collectively refer to as the Management Members, expect to enter into a registration rights agreement that will, among other things, amend and restate these registration rights provisions. For a further description of these rights, see "Description of Our Capital Stock—Registration Rights."
Transaction Fee Agreement
In connection with the Acquisition, we entered into a Transaction Fee Agreement with each of our Sponsors. In consideration for the Sponsors conducting financial and structural analysis, due diligence investigations and negotiations related to the Acquisition, the following transaction fees were paid to each of the Sponsors at the closing of the Acquisition on May 21, 2009:
We also reimbursed our Sponsors for certain expenses related to the Acquisition in an aggregate amount of $2.5 million.
Director Nomination Agreement
In connection with this offering, we will enter into a director nomination agreement with each of our Sponsors and Mr. Kanas that will provide for the rights of our Sponsors and Mr. Kanas to nominate individuals to our Board. The Sponsors and Mr. Kanas will have the right to nominate individuals to our Board at each meeting of stockholders where directors are to be elected and, subject to limited exceptions, we will include in the slate of nominees recommended to our stockholders for election as directors the number of individuals designated by the Sponsors and Mr. Kanas as follows:
In addition, each of Blackstone, Carlyle, WL Ross and Centerbridge has the right to appoint one non-voting observer to attend all meetings of our Board until such time as such Sponsor ceases to own 5% of our outstanding common stock.
Statement of Policy Regarding Transactions with Related Persons
Transactions by us with related parties are subject to a formal written policy, as well as regulatory requirements and restrictions. These requirements and restrictions include Sections 23A and 23B of the Federal Reserve Act (which govern certain transactions by BankUnited with its affiliates) and the Federal Reserve's Regulation O (which governs certain loans by BankUnited to its executive officers, directors, and principal stockholders). We have adopted policies to comply with these regulatory requirements and restrictions. In addition, certain of our investors entered into Rebuttal of Control Agreements with the OTS in connection with their initial investments in us. The Rebuttal of Control Agreements limit the ability of these investors to conduct transactions with us or our affiliates. We have adopted a policy to assist these investors in complying with this aspect of their respective Rebuttal of Control Agreements. In connection with this offering, we intend to supplement this
Our Board has also adopted a written policy in order to complygoverning the approval of related party transactions that complies with all applicable requirements of the SEC and the NYSE concerning related party transactions. Related party transactions are transactions in which our Company is a participant, the amount involved exceeds $120,000 and a related party has or will have a direct or indirect material interest. Related parties of our Company include directors (including nominees for election as directors), executive officers, 5% stockholders of our Company and the immediate family members of these persons. The General Counsel of BankUnited, in consultation with management and outside counsel, as appropriate, will review potential related party transactions to determine if they are subject to our Related Party Transactions Policy. If so, the transaction will be referred for approval or ratification to the Nominating and Corporate Governance Committee. In determining whether to approve a related party transaction, the Corporate Governance Committee will consider, among other factors, the fairness of the proposed transaction, the direct or indirect nature of the director's, executive officer's or related party's interest in the transaction, the direct or indirect nature of the director's, executive officer's or related party's interest in the transaction, the appearance of an improper conflict of interests for any director or executive officer of the Company taking into account the size of the transaction and the financial position of the director, executive officer or related party, whether the transaction would impair an outside director's independence, the acceptability of the transaction to the Company's regulators and the potential violations of other Company policies. Our Related Party Transactions Policy will be available on our website at www.bankunited.com, as Annex B to our Corporate Governance Guidelines.
PRINCIPAL AND SELLING STOCKHOLDERS
The following table sets forth information about the beneficial ownership of our common stock at January 10, 2011 and as adjusted to reflect the sale of the shares of common stock by us and the selling stockholders in this offering, for:
Unless otherwise noted below, the address of each beneficial owner listed on the table is c/o BankUnited, Inc., 14817 Oak Lane, Miami Lakes, FL 33016. We have determined beneficial ownership in accordance with the rules of the SEC. Except as indicated by the footnotes below, we believe, based on the information furnished to us, that the persons and entities named in the tables below have sole voting and investment power with respect to all shares of common stock that they beneficially own, subject to applicable community property laws. We have based our calculation of the percentage of beneficial ownership on 92,971,850 shares of common stock outstanding on January 10, 2011, and 96,971,850 shares of common stock outstanding after the completion of this offering.
In computing the number of shares of common stock beneficially owned by a person and the percentage ownership of that person, we deemed outstanding shares of common stock subject to options or warrants held by that person that are currently exercisable or exercisable within sixty days of January 10, 2011. We, however, did not deem these shares outstanding for the purpose of computing the percentage ownership of any other person. Beneficial ownership representing less than 1% is denoted with an asterisk (*).
The LLC is currently our sole stockholder. Immediately prior to the consummation of this offering, the LLC will be liquidated and all interests in us will be distributed to the members of the LLC in accordance with the LLC Agreement. This section, reflectsincluding the 1-to-100 ratio of outstanding units ofcolumn "Shares Beneficially Owned Before the LLC to shares of our outstanding common stock held by the LLC. This section, however, does not giveOffering", gives effect to the Reorganization (including any shares of common stock and options to purchase shares of our common stock to be received in respect of PIUs held by our named executive officers), which information (including the allocation between shares of common stock and options to be received by our named executive officers in respect of their PIUs and the number of shares to be distributed to the unit holders of the LLC as part of the liquidation of the LLC) depends on the actual initial public offering price per share in this offering. See "Reorganization" and "Compensation Discussion and Analysis—Executive Officer Compensation—Equity-Based Compensation."
| | | Shares Beneficially Owned Before the Offering | | Shares Beneficially Owned After the Offering | | Shares Beneficially Owned Before the Offering | | Shares Beneficially Owned After the Offering | ||||||||||||||||||||||
|---|---|---|---|---|---|---|---|---|---|---|---|---|---|---|---|---|---|---|---|---|---|---|---|---|---|---|---|---|---|---|
| | | Shares being offered | | Shares being offered | ||||||||||||||||||||||||||
Name of beneficial owner | Name of beneficial owner | Number | % | Number | % | Name of beneficial owner | Number | % | Number | % | ||||||||||||||||||||
Executive Officers and Directors: | Executive Officers and Directors: | Executive Officers and Directors: | ||||||||||||||||||||||||||||
John A. Kanas | John A. Kanas | 2,350,000 | 2.5 | % | John A. Kanas | 6,473,993 | 6.8 | % | 988,662 | 5,485,331 | 5.6 | % | ||||||||||||||||||
John Bohlsen | John Bohlsen | 1,000,000 | 1.1 | % | John Bohlsen | 3,119,242 | 3.3 | % | 458,076 | 2,661,166 | 2.7 | % | ||||||||||||||||||
Douglas J. Pauls | Douglas J. Pauls | 100,000 | * | Douglas J. Pauls | 441,225 | * | 59,069 | 382,156 | * | |||||||||||||||||||||
Rajinder P. Singh | Rajinder P. Singh | 100,000 | * | Rajinder P. Singh | 1,986,531 | 2.1 | % | 217,560 | 1,768,971 | 1.8 | % | |||||||||||||||||||
Chinh E. Chu | Chinh E. Chu | — | — | Chinh E. Chu | — | — | — | — | — | |||||||||||||||||||||
Ambassador Sue M. Cobb | Ambassador Sue M. Cobb | 179,502 | * | Ambassador Sue M. Cobb | 170,206 | * | 42,388 | 127,818 | * | |||||||||||||||||||||
Eugene F. DeMark | Eugene F. DeMark | 25,036 | * | Eugene F. DeMark | 24,709 | * | 6,154 | 18,555 | * | |||||||||||||||||||||
Richard S. LeFrak(14) | 2,053,846 | 2.2 | % | |||||||||||||||||||||||||||
Richard S. LeFrak(7) | Richard S. LeFrak(7) | 1,935,364 | 2.1 | % | 481,984 | 1,453,380 | 1.5 | % | ||||||||||||||||||||||
Wilbur L. Ross, Jr. | Wilbur L. Ross, Jr. | 21,809,890 | 23.5 | % | Wilbur L. Ross, Jr. | 20,551,724 | 22.1 | % | 5,118,216 | 15,433,508 | 15.9 | % | ||||||||||||||||||
Pierre Olivier Sarkozy(7) | — | — | ||||||||||||||||||||||||||||
Lance N. West(8) | — | — | ||||||||||||||||||||||||||||
| | Shares Beneficially Owned Before the Offering | | Shares Beneficially Owned After the Offering | ||||||||||
|---|---|---|---|---|---|---|---|---|---|---|---|---|---|
| | Shares being offered | ||||||||||||
Name of beneficial owner | Number | % | Number | % | |||||||||
All executive officers and directors as a group (11 persons)(9) | 27,618,274 | 29.7 | % | ||||||||||
Greater than 5% Stockholders: | |||||||||||||
Investment funds affiliated with WL Ross & Co. LLC(6) | 21,809,890 | 23.5 | % | ||||||||||
Investment funds affiliated with The Carlyle Group: | |||||||||||||
DBD Cayman, Ltd.(10) | 12,029,671 | 12.9 | % | ||||||||||
TCG Holdings, L.L.C.(11) | 9,780,219 | 10.5 | % | ||||||||||
Investment funds affiliated with Centerbridge Partners, L.P.(12) | 17,115,385 | 18.4 | % | ||||||||||
Investment funds affiliated with The Blackstone Group(13) | 21,809,890 | 23.5 | % | ||||||||||
Other Selling Stockholders: | |||||||||||||
LF Moby LLC(14) | 2,053,846 | 2.2 | % | ||||||||||
Cobb Family Twenty-Second Century Fund I(5) | 62,826 | * | |||||||||||
Cobb Family Foundation(5) | 26,925 | * | |||||||||||
Investment funds affiliated with East Rock Capital Management: | |||||||||||||
EREF Special Situations LLC(15) | 1,760,440 | 1.9 | % | ||||||||||
East Rock Focus Fund, L.P(16) | 195,604 | * | |||||||||||
Davy Global Opportunities Fund(17) | 489,011 | * | |||||||||||
Rishi Bansal(18) | 180,830 | * | |||||||||||
Scott J. Skorobohaty(19) | 52,586 | * | |||||||||||
Raymond Barbone(20) | 30,148 | * | |||||||||||
| | Shares Beneficially Owned Before the Offering | | Shares Beneficially Owned After the Offering | ||||||||||||||
|---|---|---|---|---|---|---|---|---|---|---|---|---|---|---|---|---|---|
| | Shares being offered | ||||||||||||||||
Name of beneficial owner | Number | % | Number | % | |||||||||||||
Pierre Olivier Sarkozy(9) | — | — | — | — | — | ||||||||||||
Lance N. West(10) | — | — | — | — | — | ||||||||||||
All executive officers and directors as a group (11 persons)(11) | 34,702,995 | 36.0 | % | 7,372,109 | 27,330,885 | 27.3 | % | ||||||||||
Greater than 5% Stockholders: | |||||||||||||||||
Investment funds affiliated with WL Ross & Co. LLC(8) | 20,551,724 | 22.1 | % | 5,118,216 | 15,433,508 | 15.9 | % | ||||||||||
Investment funds affiliated with The Carlyle Group: | |||||||||||||||||
DBD Cayman Holdings, Ltd.(12) | 11,335,704 | 12.2 | % | 2,823,052 | 8,512,652 | 8.8 | % | ||||||||||
TCG Holdings, L.L.C.(13) | 9,216,020 | 9.9 | % | 2,295,164 | 6,920,856 | 7.1 | % | ||||||||||
Investment funds affiliated with Centerbridge Partners, L.P.(14) | 16,128,035 | 17.3 | % | 4,016,537 | 12,111,498 | 12.5 | % | ||||||||||
Investment funds affiliated with The Blackstone Group(15) | 20,551,724 | 22.1 | % | 5,118,216 | 15,433,508 | 15.9 | % | ||||||||||
Other Selling Stockholders: | |||||||||||||||||
LF Moby LLC(7) | 1,935,364 | 2.1 | % | 481,984 | 1,453,380 | 1.5 | % | ||||||||||
Cobb Family Twenty-Second Century Fund I(6) | 59,572 | * | 14,836 | 44,736 | * | ||||||||||||
Cobb Family Foundation(6) | 25,531 | * | 6,358 | 19,173 | * | ||||||||||||
Investment funds affiliated with East Rock Capital, LLC: | |||||||||||||||||
EREF Special Situations, LLC(16) | 1,658,884 | 1.8 | % | 413,130 | 1,245,754 | 1.3 | % | ||||||||||
East Rock Focus Fund, L.P(17) | 184,320 | * | 45,903 | 138,417 | * | ||||||||||||
Davy Global Opportunities Fund(18) | 460,801 | * | 114,758 | 346,043 | * | ||||||||||||
Rishi Bansal(19) | 172,314 | * | 35,234 | 137,080 | * | ||||||||||||
Scott J. Skorobohaty(20) | 50,261 | * | 10,597 | 39,664 | * | ||||||||||||
Raymond Barbone(21) | 28,986 | * | 5,299 | 23,687 | * | ||||||||||||
Also includes 1,250,000 shares of common stock held by the Kanas 2010 Annuity Trust, which is a grantor retained annuity trust. Mr. Kanas is the trustee of the Kanas 2010 Annuity Trust. Mr. Kanas disclaims any beneficial ownership of these shares except to the extent of his pecuniary interests therein, if any. The Kanas 2010 Annuity Trust is not expected to be a selling stockholder in this offering. Mr. Kanas intends to sell shares in this offering from shares of common stock he directly holds and shares of vested common stock he will receive in respect of his PIUs in the Reorganization. The Kanas 2010 Annuity Trust may only be a selling stockholder to the extent the number of shares Mr. Kanas will sell in this offering exceeds the number of shares he directly holds and shares of vested common stock and options he will receive in respect of his PIUs in the Reorganization. The address of the Kanas 2010 Annuity Trust is 32 Adelaide Ave., East Moriches, NY 11940.
Also includes 1,000,000 shares of common stock held by the Bohlsen 2010 Annuity Trust, which is a grantor retained annuity trust. Mr. Bohlsen is the trustee of the Bohlsen 2010 Annuity Trust.
Mr. Bohlsen disclaims any beneficial ownership of these shares except to the extent of his pecuniary interests therein, if any. The Bohlsen 2010 Annuity Trust is not expected to be a selling stockholder in this offering. Mr. Bohlsen intends to sell shares in this offering from shares of vested common stock he will receive in respect of his PIUs in the Reorganization. The Bohlsen 2010 Annuity Trust may only be a selling stockholder to the extent the number of shares Mr. Bohlsen will sell in this offering exceeds the number of shares of vested common stock and options he will receive in respect of his PIUs in the Reorganization. The address of the Bohlsen 2010 Annuity Trust is 135 The Helm, East Islip, NY 11730.
Partner, LP, which is the general partner of Carlyle Strategic Partners II, L.P. and CSP II Co-Investment, L.P. DBD Cayman Holdings is controlled by its Class Aordinary members, William E. Conway, Jr., Daniel A. D'Aniello and David M. Rubenstein and all action relating to the investment and disposition of the DBD Cayman Holdings Shares requires their approval. William E. Conway, Jr., Daniel A. D'Aniello and David M. Rubenstein each disclaim beneficial ownership of the DBD Cayman Holdings Shares. The address of each of the entities and persons identified in this note is c/o The Carlyle Group, 1001 Pennsylvania Avenue NW, Suite 220 South, Washington, D.C. 20004.
Partnership V, L.P. and Blackstone Participation Partnership V, L.P. Mr. Chu is a member of Blackstone Management Associates V L.L.C., which has investment and voting control over the shares held or controlled by eachBlackstone Capital Partners V L.P. and Blackstone Capital Partners V-AC L.P., and Mr. Chu is a member of BCP V Side-by-Side GP L.L.C., which has investment and voting control over the shares held or controlled by Blackstone Funds.Family Investment Partnership V, L.P. and Blackstone Participation Partnership V, L.P. Mr. Chu disclaims beneficial ownership of such shares. Mr. Chu is a member of our Board and Mr. Chu is a Senior Managing Director of The Blackstone Group. The address of each of the entities and persons identified in this note is c/o The Blackstone Group, 345 Park Avenue, New York, NY 10154.
DESCRIPTION OF OUR CAPITAL STOCK
The following descriptions areinclude summaries of the material terms of our amended and restated certificate of incorporation and by-laws.by-laws, which will become effective prior to completion of this offering. Reference is made to the more detailed provisions of, and the descriptions are qualified in their entirety by reference to, the amended and restated certificate of incorporation and by-laws, copies of which are filed with the SEC as exhibits to the registration statement of which this prospectus is a part, and applicable law. The descriptions of the common stock and preferred stock reflect changes to our capital structure that will occur upon the closing of this offering.
General
Upon the closing of this offering, our amended and restated certificate of incorporation will authorize us to issue up to 400,000,000 shares of common stock, $0.01 par value per share, and 100,000,000 shares of preferred stock, $0.01 par value per share.
At January 10, 2011, there were outstanding:
In addition, at January 10, 2011, there were 113,610 shares issuable upon exercise of outstanding vested stock options.
Upon completion of this offering, there will be outstanding 96,971,850 shares of common stock (assuming an initial public offering price of $ per share, the midpoint of the price range set forth on the cover of this prospectus) and no outstanding shares of preferred stock.
Common Stock
Voting Rights
Each holder of our common stock is entitled to one vote for each share on all matters submitted to a vote of the holders of our common stock, voting together as a single class, including the election of directors. Our stockholders do not have cumulative voting rights in the election of directors. Accordingly, holders of a majority of the voting shares are able to elect all of the directors.
Dividends
Subject to the prior rights of holders of preferred stock, holders of our common stock are entitled to receive dividends, if any, as may be declared from time to time by our Board.
Liquidation
Subject to the prior rights of our creditors and the satisfaction of any liquidation preference granted to the holders of any then outstanding shares of preferred stock, in the event of our liquidation, dissolution or winding up, holders of our common stock will be entitled to share ratably in the net assets legally available for distribution to stockholders.
Preferred Stock
TheOur Board has the authority, without action by our stockholders, to issue preferred stock and to fix voting powers for each class or series of preferred stock, and to provide that any class or series may be subject to redemption, entitled to receive dividends, entitled to rights upon dissolution, or convertible or exchangeable for shares of any other class or classes of capital stock. The rights with respect to a series or class of preferred stock may be greater than the rights attached to our common stock. It is not possible to state the actual effect of the issuance of any shares of our preferred stock on the rights of
holders of our common stock until our Board determines the specific rights attached to that preferred
stock. The effect of issuing preferred stock could include, among other things, one or more of the following:
Registration Rights
The LLC Agreement contains registration rights provisions with respect to sales of shares of the applicable holding company of BankUnited that is used as the public vehicle in connection with any initial public offering. In accordance with the LLC Agreement and in connection with this offering, BankUnited, Inc., the Sponsors and the Management Members expect to enter into a registration rights agreement that will, among other things, amend and restate these registration rights provisions.
Pursuant to the registration rights agreement, Blackstone, Carlyle, Centerbridge and WL Ross will be provided with demand registration rights, which will be exercisable after expiration of the lockup provisions applicable to them described in the section entitled "Underwriters." The demand registration rights require us to register the shares of common stock beneficially owned by the demanding Sponsor with the SEC for sale by it to the public, provided that the value of the registrable securities proposed to be sold by such demanding Sponsor is at least the lesser of $50.0 million or the value of all registrable securities held by such Sponsor. The registration rights provisions also provide that we may be required under certain circumstances to file a shelf registration statement for an offering to be made on a continuous basis pursuant to Rule 415 of the Securities Act. We may postpone the filing of such a registration statement or suspend the effectiveness of any registration statement for a reasonable "blackout period" not in excess of 90 days if our Board determines that such registration or offering could materially interfere with a bona fide business or financing transaction of the Company or is reasonably likely to require premature disclosure of material, non-public information, the premature disclosure of which the Board reasonably determines in the exercise of its good faith judgment would not be in the best interests of the Company; provided that we shall not postpone the filing of a registration statement or suspend the effectiveness of any registration statement for more than 90 days in the aggregate in any 360-day period.
In addition, pursuant to the registration rights provisions, in the event that we are registering additional shares of common stock for sale to the public, whether on our own behalf (except in connection with a registration on Form S-4 or Form S-8 or any successor or similar form or in a registration of securities solely relating to an offering and sale to employees pursuant to any employee stock plan or other employee benefit plan arrangement) or through a demand registration on behalf of a Sponsor (as described above), we are required to give notice of such registration to all parties to the registration rights agreement that hold registrable securities (which includes members of our management that hold shares of our common stock) of the intention to effect such a registration. Such notified persons have piggyback registration rights providing them the right to have us include the shares of common stock owned by them in any such registration if we have received written requests for inclusion therein within prescribed time limits, subject to other provisions under the registration rights agreement.
Pursuant to the registration rights agreement, post-offering, each of (1) Mr. Kanas and certain funds affiliated with Blackstone, Carlyle, Centerbridge and WL Ross have separately agreed during the 18 months from the date of this prospectus and (2) our other executive officers have separately agreed
during the 12 months from the date of this prospectus not to effect any sales pursuant to Rule 144 under the Securities Act of any of our equity securities.
FDIC Warrant
In connection with the Acquisition, we issued a warrant to the FDIC allowing the FDIC to participate in the economic upside of the transaction if we achieve certain valuation levels upon an IPO or sale. We granted the FDIC certain registration rights pursuant to a registration rights agreement in connection with the warrant.
The warrant becomes exercisable for a sixty-day period beginning on the tenth day after the consummation of a qualifying IPO or exit event in which the total tangible equity value arising from the IPO or exit event (as calculated pursuant to the terms of the warrant) exceeds the valuation that would be implied if we were valued at the average price-to-tangible-book-value multiple for the top quartile of publicly-traded U.S. banks and thrifts with assets in excess of $10 billion, as published by SNL Financial (the "Incremental Value"). The warrant, however, would expire upon the consummation of an IPO or exit event that does not constitute a qualifying IPO or qualifying exit event.
If the warrant were to become exercisable as a result of a qualifying IPO, the FDIC would be entitled to receive a number of shares of our common stock, at an exercise price of $0.01 per share (the par value of one share of our common stock), equal to the quotient obtained by dividing (a) the warrant value, which is equal to 10% of the Incremental Value, by (b) the difference between (i) the price per share of our common stock paid by the managing underwriters in the IPO and (ii) the exercise price per share. The warrant is also redeemable by us for cash after it becomes exercisable at a redemption price equal to the warrant value.
Based on an assumed initial public offering price of $25.00 per share, the high end of the price range set forth on the cover of this prospectus, this offering will not constitute a qualifying IPO, and the warrant accordingly would expire upon the consummation of this offering.
In October 2010, we and the FDIC agreed to amend the warrant to guarantee a minimum value to the FDIC from the warrant in the amount of $25.0 million. We expect that (i) this offering will not constitute a qualifying IPO, (ii) the warrant will expire upon the consummation of this offering and the attendant registration rights will terminate and (iii) we will pay the FDIC $25.0 million not later than the tenth business day following the warrant's expiration pursuant to the agreement in principle reached with the FDIC in October 2010.
Corporate Opportunity
Our amended and restated certificate of incorporation provides that the doctrine of "corporate opportunity" will not apply against the Sponsors, any of their affiliates or any of our directors or officers, and that the Company renounces any interest or expectancy in any business opportunities that are presented to any of the Sponsors or any of their affiliates or to any of the directors or officers of the Company, even if such opportunity is of a character that could be taken by the Company. To the extent that the Sponsors, any of their affiliates, or any of our directors and officers participate in any such business opportunity, they may have differing interests than our other stockholders.
Anti-Takeover Considerations and Special Provisions of our Certificate of Incorporation, By-Laws and Delaware Law
The following sets forth certain provisions of the Delaware General Corporation Law, or DGCL, and our amended and restated certificate of incorporation and our amended and restated by-laws. Banking laws also impose notice approval and ongoing regulatory requirements on any stockholder or other party that seeks to acquire direct or indirect "control" of an FDIC-insured depository institution.
For additional information, see the section entitled "Regulation and Supervision—Notice and Approval Requirements Related to Control."
Requirements for Advance Notification of Stockholder Nominations and Proposals
Our amended and restated certificate of incorporation and amended and restated by-laws will establish advance notice procedures with respect to stockholder proposals and the nomination of candidates for election as directors, other than nominations made by or at the direction of our Board or a committee of our Board.
Stockholder Meetings
Our amended and restated certificate of incorporation and amended and restated by-laws will provide that special meetings of the stockholders may be called for any purpose or purposes at any time by a majority of the boardour Board or by the Chief Executive Officer or the President. In addition, our amended and restated certificate of incorporation will provide that a holder, or a group of holders, of commoncapital stock holding 25.0% or more than 25.0% of the total voting power of the outstanding shares of our commoncapital stock may cause us to call a special meeting of the stockholders for any purpose or purposes at any time.
No Action by Stockholders Without a Meeting
Our amended and restated certificate of incorporation and amended and restated by-laws will provide that stockholders are not entitled to act by written consent.
Amendments to our Amended and Restated Certificate of Incorporation and By-Laws
Our amended and restated certificate of incorporation and amended and restated by-laws may not be amended withoutBoard, by the affirmative vote of at least %a majority of the total votingBoard, has the power without the assent or vote of the outstandingstockholders to adopt, amend, alter or repeal the by-laws. The by-laws also may be adopted, amended, altered or repealed by the affirmative vote of the holders of a majority of the votes entitled to be cast by the shares of our common stock.outstanding capital stock entitled to vote thereon, subject to a specified exception relating to indemnification and advancement of expenses.
No Cumulative Voting
The DGCL provides that stockholders are not entitled to the right to cumulate votes in the election of directors unless an entity's certificate of incorporation provides otherwise. Our amended and restated certificate of incorporation and amended and restated by-laws do not provide for cumulative voting in the election of directors.
Director Removal
Except as may otherwise be required by applicable law and subject to the DGCL,rights of holders of preferred stock then outstanding, our amended and restated certificate of incorporation and amended and restated by-laws will provide that stockholderstockholders may not remove directors without cause.
"Blank Check" Preferred Stock
Our amended and restated certificate of incorporation and amended and restated by-laws will authorize the issuance of "blank check" preferred stock with such designations, rights and preferences as may be determined from time to time by our Board.
Section 203
We have elected to "opt out" of Section 203 of the DGCL, which prohibits a Delaware corporation from engaging in any business combination with any interested stockholder for a period of
three years after the date that such stockholder became an interested stockholder, with the following exceptions:
In general, Section 203 defines business combination to include the following:
In general, Section 203 defines an "interested stockholder" as an entity or person who, together with the person's affiliates and associates, beneficially owns, or within three years prior to the time of determination of interested stockholder status did own, 15.0% or more of the outstanding voting stock of the corporation.
A Delaware corporation may "opt out" of Section 203 with an expressed provision in its original certificate of incorporation or an expressed provision in its certificate of incorporation or by-laws resulting from amendments approved by holders of at least a majority of the corporation's outstanding voting shares.
Limitations on Liability and Indemnification of Directors and Officers
The DGCL authorizes corporations to limit or eliminate the personal liability of directors to corporations and their stockholders for monetary damages for breaches of directors' fiduciary duties. Our certificate of incorporation includes a provision that eliminates the personal liability of directors
for monetary damages for breach of fiduciary duty as a director to the fullest extent permitted by Delaware law.
Section 102(b)(7) of the DGCL permits a corporation to provide in its certificate of incorporation that a director of the corporation shall not be personally liable to the corporation or its stockholders
for monetary damages for breach of fiduciary duty as a director, except for liability (i) for any breach of the director's duty of loyalty to the corporation or its stockholders, (ii) for acts or omissions not in good faith or which involve intentional misconduct or a knowing violation of law, (iii) under Section 174 of the DGCL (regarding, among other things, the payment of unlawful dividends or unlawful stock purchases or redemptions), or (iv) for any transaction from which the director derived an improper personal benefit. Our amended and restated certificate of incorporation will provide for such limitation of liability.
Section 145(a) of the DGCL empowers a corporation to indemnify any director, officer, employee or agent, or former director, officer, employee or agent, who was or is a party or is threatened to be made a party to any threatened, pending or completed action, suit or proceeding, whether civil, criminal, administrative or investigative (other than an action by or in the right of the corporation) by reason of such person's service as a director, officer, employee or agent of the corporation, or such person's service, at the corporation's request, as a director, officer, employee or agent of another corporation or enterprise, against expenses (including attorneys' fees), judgments, fines and amounts paid in settlement actually and reasonably incurred by such person in connection with such action, suit or proceeding; provided that such director or officer acted in good faith and in a manner reasonably believed to be in or not opposed to the best interests of the corporation, and, with respect to any criminal action or proceeding; provided that such director or officer had no reasonable cause to believe his conduct was unlawful.
Section 145(b) of the DGCL empowers a corporation to indemnify any person who was or is a party or is threatened to be made a party to any threatened, pending or completed action or suit by or in the right of the corporation to procure a judgment in its favor by reason of the fact that such person is or was a director, officer, employee or agent of the corporation, or is or was serving at the request of the corporation as a director, officer, employee or agent of another enterprise, against expenses (including attorneys' fees) actually and reasonably incurred in connection with the defense or settlement of such action or suit; provided that such director or officer acted in good faith and in a manner he or she reasonably believed to be in or not opposed to the best interests of the corporation, except that no indemnification may be made in respect of any claim, issue or matter as to which such director or officer shall have been adjudged to be liable to the corporation unless and only to the extent that the Delaware Court of Chancery or the court in which such action or suit was brought shall determine upon application that, despite the adjudication of liability but in view of all the circumstances of the case, such director or officer is fairly and reasonably entitled to indemnity for such expenses which the court shall deem proper. Notwithstanding the preceding sentence, except as otherwise provided in the by-laws, we shall be required to indemnify any such person in connection with a proceeding (or part thereof) commenced by such person only if the commencement of such proceeding (or part thereof) by any such person was authorized by our Board.
In addition, our amended and restated certificate of incorporation will provide that we must indemnify our directors and officers to the fullest extent authorized by law. We will also be required to advance certain expenses to our directors and officers and carry directors' and officers' insurance providing indemnification for our directors and officers for some liabilities. We believe that these indemnification provisions and the directors' and officers' insurance are useful to attract and retain qualified directors and executive officers.
Prior to completion of this offering, we intend to enter into separate indemnification agreements with each of our directors and officers. Each indemnification agreement is expected to provide, among
other things, for indemnification to the fullest extent permitted by law and our amended and restated certificate of incorporation and by-laws against (i) any and all expenses and liabilities, including judgments, fines, penalties, interest and amounts paid in settlement of any claim with our approval and counsel fees and disbursements, (ii) any liability pursuant to a loan guarantee, or otherwise, for any of our indebtedness, and (iii) any liabilities incurred as a result of acting on behalf of us (as a fiduciary or
otherwise) in connection with an employee benefit plan. The indemnification agreements will provide for the advancement or payment of expenses to the indemnitee and for reimbursement to us if it is found that such indemnitee is not entitled to such indemnification under applicable law and our amended and restated certificate of incorporation and by-laws. Insofar as indemnification for liabilities arising under the Securities Act may be permitted to directors, officers or persons controlling us pursuant to the foregoing provisions, in the opinion of the SEC, such indemnification is against public policy as expressed in the Securities Act and is therefore unenforceable.
Listing
We applied to list ourOur common stock has been approved for listing on the NYSE under the symbol "BKU."
Transfer Agent and Registrar
The transfer agent and registrar for our common stock is expected to be the Registrar and Transfer Company.
SHARES ELIGIBLE FOR FUTURE SALE
Prior to this offering, there has been no public market for our common stock, and we cannot predict the effect, if any, that sales of shares or availability of any shares for sale will have on the market price of our common stock prevailing from time to time. Sales of substantial amounts of common stock (including shares issued on the exercise of options, warrants or convertible securities, if any), or the perception that such sales could occur, could adversely affect the market price of our common stock and our ability to raise additional capital through a future sale of securities.
Upon completion of this offering, we will have 96,971,850 shares of common stock issued and outstanding assuming an initial public offering price of $ per share, the midpointoutstanding. All of the price range set forth on the cover of this prospectus. All of the26,250,000 shares of our common stock sold in this offering (or 30,187,500 shares if the underwriters exercise their over-allotment option in full) will be freely tradable without restriction or further registration under the Securities Act, except that any shares held by any of our "affiliates" as that term is defined in Rule 144 under the Securities Act generally may be sold in the public market only in compliance with Rule 144 as described below. Upon completion of this offering, approximately %69.1% of our outstanding common stock (or %65.1% if the underwriters' over-allotment option is exercised in full) will be held by "affiliates" as that terms is defined in Rule 144.
In addition to the issued and outstanding shares of our common stock, we intend to file a registration statement on Form S-8 to register an aggregate of approximately 8.5 million shares of common stock reserved for issuance under our incentive and stock option programs. That registration statement will become effective upon filing, and shares of common stock covered by such registration statement are eligible for sale in the public market immediately after the effective date of such registration statement, subject to the lock-up agreements described below.
Lock-Up Agreements
See the section entitled "Underwriters" for a description of lock-up agreements in connection with this offering.
Holdback Agreements
See the section entitled "Description of Our Capital Stock—Registration Rights" for a description of the holdback agreements to which our named executive officers and certain funds affiliated with Blackstone, Carlyle, Centerbridge and WL Ross have agreed in connection with this offering.
Equity ownership requirements
See the section entitled "Compensation Discussion and Analysis—Executive Officer Compensation—Equity Ownership Requirements" for a description of the minimum equity ownership requirements to which our executive officers have agreed.
Rule 144
In general, under Rule 144 under the Securities Act, a person (or persons whose shares are aggregated) who is not deemed to have been an affiliate of ours at any time during the three months preceding a sale, and who has beneficially owned restricted securities within the meaning of Rule 144 for at least six months (including any period of consecutive ownership of preceding non-affiliated holders) would be entitled to sell those shares, subject only to the availability of current public information about us. A non-affiliated person who has beneficially owned restricted securities within the meaning of Rule 144 for at least one year would be entitled to sell those shares without regard to the provisions of Rule 144.
A person (or persons whose shares are aggregated) who is deemed to be an affiliate of ours and who has beneficially owned restricted securities within the meaning of Rule 144 for at least six months
would be entitled to sell within any three-month period a number of shares that does not exceed the greater of one percent of the then outstanding shares of our common stock or the average weekly trading volume of our common stock reported through the NYSE during the four calendar weeks preceding such sale. Such sales are also subject to certain manner of sale provisions, notice requirements and the availability of current public information about us.
Rule 701
In general, under Rule 701 of the Securities Act, most of our employees, consultants or advisors who purchased shares from us in connection with a qualified compensatory stock plan or other written agreement are eligible to resell those shares 90 days after the date of this prospectus in reliance on Rule 144, but without compliance with the holding period or certain other restrictions contained in Rule 144.
Registration Rights
Following the completion of this offering, our existing stockholders will have rights, subject to certain conditions, to require us to include their shares in registration statements that we may file for ourselves or other existing stockholders and the Sponsors will have demand registration rights. Registration of these shares under the Securities Act will result in these shares becoming freely tradable without restriction under the Securities Act upon effectiveness of the registration statement. See the section of this prospectus entitled "Description of Our Capital Stock—Registration Rights."
CERTAIN MATERIAL U.S. FEDERAL INCOME TAX CONSEQUENCES
FOR NON-U.S. HOLDERS OF COMMON STOCK
The following is a summary of certain U.S. federal income tax consequences relevant to non-U.S. Holders (as defined below) of the ownership and disposition of our common stock. The following summary is based on current provisions of the Internal Revenue Code of 1986, as amended, or the Code, Treasury regulations and judicial and administrative authority, all of which are subject to change, possibly with retroactive effect. State, local, estate and foreign tax consequences are not summarized, nor are tax consequences to special classes of investors including, but not limited to, tax-exempt organizations, insurance companies, banks or other financial institutions, partnerships or other entities classified as partnerships for U.S. federal income tax purposes, dealers in securities, persons liable for the alternative minimum tax, traders in securities that elect to use a mark-to-market method of accounting for their securities holdings, persons who have acquired our common stock as compensation or otherwise in connection with the performance of services, or persons that will hold our common stock as a position in a hedging transaction, "straddle," "conversion transaction" or other risk reduction transaction. Tax consequences may vary depending upon the particular status of an investor. The summary is limited to non-U.S. Holders who will hold our common stock as "capital assets" (generally, property held for investment). Each potential investor should consult its own tax advisor as to the U.S. federal, state, local, foreign and any other tax consequences of the purchase, ownership and disposition of our common stock.
You are a non-U.S. Holder if you are a beneficial owner of our common stock for U.S. federal income tax purposes that is neither an entity or arrangement treated as a partnership nor (i) a citizen or individual resident of the United States; (ii) a corporation (or other entity that is taxable as a corporation) created or organized in the United States or under the laws of the United States or of any State (or the District of Columbia); (iii) an estate if the income of such estate falls within the federal income tax jurisdiction of the United States regardless of the source of such income; nor (iv) a trust (a) if a United States court is able to exercise primary supervision over its administration and one or more United States persons have the authority to control all of the substantial decisions of the trust, or (b) that has in effect a valid election under applicable Treasury regulations to be treated as a U.S. person.
If an entity or arrangement treated as a partnership for U.S. federal income tax purposes holds our common stock, the tax consequences to a partner relating to an investment in our common stock will generally depend upon the status of the partner and the activities of the partnership. If you are treated as a partner in such an entity holding our common stock, you should consult your tax advisor as to the particular U.S. federal income tax consequences applicable to you.
Distributions
Distributions with respect to our common stock will be treated as dividends when paid to the extent of our current or accumulated earnings and profits as determined for U.S. federal income tax purposes. Generally, distributions treated as dividends paid to a non-U.S. holder with respect to our common stock will be subject to a 30% U.S. withholding tax, or such lower rate as may be specified by an applicable income tax treaty. Distributions that are effectively connected with such non-U.S. holder's conduct of a trade or business in the United States (and, if a tax treaty applies, are attributable to a U.S. permanent establishment of such holder) are generally subject to U.S. federal income tax on a net income basis and are exempt from the 30% withholding tax (assuming compliance with certain certification requirements). Any such effectively connected distributions received by a non-U.S. holder that is a corporation may also, under certain circumstances, be subject to an additional "branch profits tax" at a 30% rate or such lower rate as may be applicable under an income tax treaty.
For purposes of obtaining a reduced rate of withholding under an income tax treaty, a non-U.S. holder will generally be required to provide a U.S. taxpayer identification number as well as certain information concerning the holder's country of residence and entitlement to tax treaty benefits. A non-U.S. holder can generally meet the certification requirement by providing a properly executed IRS Form W-8BEN (if the
holder is claiming the benefits of an income tax treaty) or Form W-8ECI (if the dividends are effectively connected with a trade or business in the United States) or suitable substitute form.
Sale or Redemption
A non-U.S. holder generally will not be subject to U.S. federal income or withholding tax on gain realized on the sale, exchange or other disposition (other than a redemption, which may be subject to withholding tax or certification requirements under certain circumstances) of our common stock except for (i) in the case of certain non-resident alien individuals that are present in the United States for 183 or more days in the taxable year of the sale or disposition, or (ii) if the gain is effectively connected with the conduct by the non-U.S. holder of a trade or business within the United States (and, if a tax treaty applies, is attributable to a U.S. permanent establishment maintained by such non-U.S. holder).
Information Reporting and Backup Withholding
Payment of dividends, and the tax withheld with respect thereto, is subject to information reporting requirements. These information reporting requirements apply regardless of whether withholding was reduced or eliminated by an applicable income tax treaty. Under the provisions of an applicable income tax treaty or agreement, copies of the information returns reporting such dividends and withholding may also be made available to the tax authorities in the country in which the non-U.S. holder resides. U.S. backup withholding will generally apply on payment of dividends to non-U.S. holders unless such non-U.S. holders furnish to the payor a Form W-8BEN (or other applicable form), or otherwise establish an exemption and the payor does not have actual knowledge or reason to know that the holder is a U.S. person, as defined under the Code, that is not an exempt recipient.
Payment of the proceeds of a sale of our common stock within the United States or conducted through certain U.S.-related financial intermediaries is subject to information reporting and, depending on the circumstances, backup withholding, unless the non-U.S. holder, or beneficial owner thereof, as applicable, certifies that it is a non-U.S. holder on Form W-8BEN (or other applicable form), or otherwise establishes an exemption and the payor does not have actual knowledge or reason to know the holder is a U.S. person, as defined under the Code, that is not an exempt recipient.
Any amount withheld under the backup withholding rules from a payment to a non-U.S. holder is allowable as a credit against such non-U.S. holder's U.S. federal income tax, which may entitle the non-U.S. holder to a refund, provided that the non-U.S. holder timely provides the required information to the IRS. Moreover, certain penalties may be imposed by the IRS on a non-U.S. holder who is required to furnish information but does not do so in the proper manner. Non-U.S. holders should consult their tax advisors regarding the application of backup withholding in their particular circumstances and the availability of and procedure for obtaining an exemption from backup withholding under current Treasury regulations.
Recent Legislation Relating to Foreign Accounts
Recently enacted legislation will require, after December 31, 2012, withholding at a rate of 30 percent on dividends in respect of, and gross proceeds from the sale of, our common stock held by or through certain foreign financial institutions (including investment funds), unless such institution enters into an agreement with the Secretary of the Treasury to report, on an annual basis, information with respect to shares in the institution held by certain United States persons and by certain non-U.S. entities that are wholly- or partially-owned by United States persons. Accordingly, the entity through which our common stock is held will affect the determination of whether such withholding is required. Similarly, dividends in respect of, and gross proceeds from the sale of, our common stock held by an investor that is a non-financial non-U.S. entity will be subject to withholding at a rate of 30 percent, unless such entity either (i) certifies to us that such entity does not have any "substantial United States owners" or (ii) provides certain information regarding the entity's "substantial United States owners," which we will in turn provide to the Secretary of the Treasury.Non-U.S. Holders are encouraged to consult with their tax advisors regarding the possible implications of the legislation on their investment in our common stock.
Under the terms and subject to the conditions in an underwriting agreement dated the date of this prospectus, the underwriters named below, for whom Morgan Stanley & Co. Incorporated and Merrill Lynch, Pierce, Fenner & Smith Incorporated are acting as representatives, have severally agreed to purchase, and we and the selling stockholders have agreed to sell to them, severally, the number of shares indicated below:
Name | Number of Shares | ||||
|---|---|---|---|---|---|
| Morgan Stanley & Co. Incorporated | |||||
| Merrill Lynch, Pierce, Fenner & Smith Incorporated | |||||
| Deutsche Bank Securities Inc. | |||||
| Goldman, Sachs & Co. | |||||
| Keefe, Bruyette & Woods, Inc. | |||||
| RBC Capital Markets, LLC | |||||
| UBS Securities LLC | |||||
| Total | 26,250,000 | ||||
The underwriters and the representatives are collectively referred to as the "underwriters" and the "representatives," respectively. The underwriters are offering the shares of common stock subject to their acceptance of the shares from us and the selling stockholders and subject to prior sale. The underwriting agreement provides that the obligations of the several underwriters to pay for and accept delivery of the shares of common stock offered by this prospectus are subject to the approval of certain legal matters by their counsel and to certain other conditions. The underwriters are obligated to take and pay for all of the shares of common stock offered by this prospectus if any such shares are taken. However, the underwriters are not required to take or pay for the shares covered by the underwriters' over-allotment option described below.
The underwriters initially propose to offer part of the shares of common stock directly to the public at the offering price listed on the cover of this prospectus and part to certain dealers at a price that represents a concession not in excess of $ a share under the public offering price. After the initial offering of the shares of common stock, the offering price and other selling terms may from time to time be varied by the representatives. The offering of the shares by the underwriters is subject to receipt and acceptance and subject to the underwriters' right to reject any order in whole or in part.
The selling stockholders have granted to the underwriters an option, exercisable for 30 days from the date of this prospectus, to purchase up to 3,937,500 additional shares of common stock at the public offering price listed on the cover of this prospectus, less underwriting discounts and commissions. The underwriters may exercise this option solely for the purpose of covering over-allotments, if any, made in connection with the offering of the shares of common stock offered by this prospectus. To the extent the option is exercised, each underwriter will become obligated, subject to certain conditions, to purchase about the same percentage of the additional shares of common stock as the number listed next to the underwriter's name in the preceding table bears to the total number of shares of common stock listed next to the names of all underwriters in the preceding table.
The following table shows the per share and total public offering price, underwriting discounts and commissions, and proceeds before expenses to us and the selling stockholders. These amounts are
shown assuming both no exercise and full exercise of the underwriters' option to purchase up to an additional shares of common stock.
| | | Total | |||||||||
|---|---|---|---|---|---|---|---|---|---|---|---|
| | Per Share | No Exercise | Full Exercise | ||||||||
Public offering price | $ | $ | $ | ||||||||
Underwriting discounts and commissions to be paid by: | |||||||||||
Us | $ | $ | $ | ||||||||
The selling stockholders | $ | $ | $ | ||||||||
Proceeds, before expenses, to us | $ | $ | $ | ||||||||
Proceeds, before expenses, to the selling stockholders | $ | $ | $ | ||||||||
We estimate that the total offering expenses, exclusive of the underwriting discounts and commissions, are approximately $ .$5.0 million. We have agreed with the underwriters to pay all fees and expenses related to the review and qualification of this offering by the Financial Industry Regulatory Authority, Inc. and "blue sky" expenses in an aggregate amount not to exceed $75,000 and to split the cost of any aircraft chartered in connection with the road show for this offering.
The underwriters have informed us that they do not intend sales to discretionary accounts to exceed 5% of the total number of shares of common stock offered by them.
We applied to list ourOur common stock has been approved for listing on the NYSE under the trading symbol "BKU"."BKU."
We, our executive officers and directors, and the selling stockholders have agreed that, subject to specified exceptions, without the prior written consent of Morgan Stanley & Co. Incorporated and Merrill Lynch, Pierce, Fenner & Smith Incorporated on behalf of the underwriters, we and they will not, during the period ending 180 days after the date of this prospectus:
whether any such transaction described above is to be settled by delivery of common stock or such other securities, in cash or otherwise. In addition, each such person agrees that, without the prior written consent of Morgan Stanley & Co. Incorporated and Merrill Lynch, Pierce, Fenner & Smith Incorporated on behalf of the underwriters, it will not, during the period ending 180 days after the date of this prospectus, make any demand for, or exercise any right with respect to, the registration of any shares of common stock or any security convertible into or exercisable or exchangeable for common stock.
The 180-day restricted period described in the preceding paragraph will be extended if:
in which case the restrictions described in the preceding paragraph will continue to apply until the expiration of the 18-day period beginning on the issuance of the earnings release or the occurrence of the material news or material event.
With respect to us, the restrictions described above do not apply to:
With respect to our directors, officers and the selling stockholders, the restrictions described above do not apply to:
stockholder or transfers (other than for value) to any corporation, partnership or other business entity that is the direct or indirect affiliate of the director, officer or such selling stockholder;
provided that in the case of any transfer or distribution pursuant to the third, fourth, fifth, sixth or seventh bullet above, (x) each donee, distributee or transferee shall sign and deliver a lock-up letter substantially in the form of the letter signed by our directors, officers and selling stockholders, and (y) no filing under Section 16(a) of the Exchange Act (other than a filing on a Form 5 made after the expiration of the 180-day period referred to above), reporting a reduction in beneficial ownership of shares of common stock, shall be required or shall be voluntarily made during the restricted period referred to in the foregoing sentence.
In order to facilitate the offering of the common stock, the underwriters may engage in transactions that stabilize, maintain or otherwise affect the price of the common stock. Specifically, the underwriters may sell more shares than they are obligated to purchase under the underwriting agreement, creating a short position. A short sale is covered if the short position is no greater than the number of shares available for purchase by the underwriters under the over-allotment option. The underwriters can close out a covered short sale by exercising the over-allotment option or purchasing shares in the open market. In determining the source of shares to close out a covered short sale, the underwriters will consider, among other things, the open market price of shares compared to the price available under the over-allotment option. The underwriters may also sell shares in excess of the over-allotment option, creating a naked short position. The underwriters must close out any naked short position by purchasing shares in the open market. A naked short position is more likely to be created if the underwriters are concerned that there may be downward pressure on the price of the common stock in the open market after pricing that could adversely affect investors who purchase in this offering. As an additional means of facilitating this offering, the underwriters may bid for, and purchase, shares of common stock in the open market to stabilize the price of the common stock. These activities may raise or maintain the market price of the common stock above independent market levels or prevent or retard a decline in the market price of the common stock. The underwriters are not required to engage in these activities and may end any of these activities at any time.
The underwriters may also impose a penalty bid. This occurs when a particular underwriter repays to the underwriters a portion of the underwriting discount received by it because the representatives have purchased shares sold by or for the account of such underwriter in stabilizing or other short covering transaction.
We, the selling stockholders and the several underwriters have agreed to indemnify each other against certain liabilities under the Securities Act.
A prospectus in electronic format may be made available on websites maintained by one or more underwriters, or selling group members, if any, participating in this offering. The representatives may agree to allocate a number of shares of common stock to underwriters for sale to their online
brokerage account holders. Internet distributions will be allocated by the representatives to underwriters that may make Internet distributions on the same basis as other allocations.
Pricing of the Offering
Prior to this offering, there has been no public market for our common stock. The initial public offering price will be determined by negotiations between us, the selling stockholders and the representatives. Among the factors considered in determining the initial public offering price will be our future prospects and those of our industry in general, our revenues, earnings and certain other financial and operating information in recent periods, and the price-earnings ratios, price-revenues ratios, market prices of securities, and certain financial and operating information of companies engaged in activities similar to ours.
Selling Restrictions
European Economic Area
In relation to each member State of the European Economic Area which has implemented the Prospectus Directive (each, a "Relevant Member State") an offer to the public of any shares which are the subject of the offering contemplated by this prospectus (the "Shares") may not be made in that Relevant Member State, except that an offer to the public in that Relevant Member State of any Shares may be made at any time under the following exemptions under the Prospectus Directive, if they have been implemented in that Relevant Member State:
(a) to any legal entity which is a qualified investor as defined in the Prospectus Directive;
(b) to fewer than 100 or, if the Relevant Member State has implemented the relevant provision of the 2010 PD Amending Directive, 150, natural or legal persons (other than qualified investors as defined in the Prospectus Directive), as permitted under the Prospectus Directive, subject to obtaining the prior consent of Morgan Stanley & Co. Incorporated and Merrill Lynch, Pierce, Fenner & Smith Incorporation for any such offer; or
(c) in any other circumstances falling within Article 3(2) of the Prospectus Directive, provided that no such offer of Shares shall result in a requirement for the publication by us or any underwriter of a prospectus pursuant to Article 3 of the Prospectus Directive.
For the purposes of this provision, the expression an "offer to the public" in relation to any Shares in any Relevant Member State means the communication in any form and by any means of sufficient information on the terms of the offer and any Shares to be offered so as to enable an investor to decide to purchase any Shares, as the same may be varied in that Member State by any measure implementing the Prospectus Directive in that Member State, the expression "Prospectus Directive" means Directive 2003/71/EC (and the amendments thereto, including the 2010 PD Amending Directive, to the extent implemented in the Relevant Member State), and includes any relevant implementing measure in the Relevant Member State, and the expression "2010 PD Amending Directive" means Directive 2010/73/EU.
United Kingdom
Each initial purchaser has represented and agreed that:
(a) it has only communicated or caused to be communicated and will only communicate or cause to be communicated an invitation or inducement to engage in investment activity (within the meaning of Section 21 of the FSMA) received by it in connection with the issue or sale of the Shares in circumstances in which Section 21(1) of the FSMA does not apply to us; and
(b) it has complied and will comply with all applicable provisions of the FSMA with respect to anything done by it in relation to the Shares in, from or otherwise involving the United Kingdom.
Hong Kong
The shares may not be offered or sold by means of any document other than (i) in circumstances which do not constitute an offer to the public within the meaning of the Companies Ordinance (Cap.32, Laws of Hong Kong), or (ii) to "professional investors" within the meaning of the Securities and Futures Ordinance (Cap.571, Laws of Hong Kong) and any rules made thereunder, or (iii) in other circumstances which do not result in the document being a "prospectus" within the meaning of the Companies Ordinance (Cap.32, Laws of Hong Kong), and no advertisement, invitation or document relating to the shares may be issued or may be in the possession of any person for the purpose of issue (in each case whether in Hong Kong or elsewhere), which is directed at, or the contents of which are likely to be accessed or read by, the public in Hong Kong (except if permitted to do so under the laws of Hong Kong) other than with respect to shares which are or are intended to be disposed of only to persons outside Hong Kong or only to "professional investors" within the meaning of the Securities and Futures Ordinance (Cap.571, Laws of Hong Kong) and any rules made thereunder.
Japan
The securities have not been and will not be registered under the Financial Instruments and Exchange Law of Japan (the Financial Instruments and Exchange Law) and each underwriter has agreed that it will not offer or sell any securities, directly or indirectly, in Japan or to, or for the benefit of, any resident of Japan (which term as used herein means any person resident in Japan, including any corporation or other entity organized under the laws of Japan), or to others for re-offering or resale, directly or indirectly, in Japan or to a resident of Japan, except pursuant to an exemption from the registration requirements of, and otherwise in compliance with, the Financial Instruments and Exchange Law and any other applicable laws, regulations and ministerial guidelines of Japan.
Singapore
This prospectus has not been registered as a prospectus with the Monetary Authority of Singapore. Accordingly, this prospectus and any other document or material in connection with the offer or sale, or invitation for subscription or purchase, of the shares may not be circulated or distributed, nor may the shares be offered or sold, or be made the subject of an invitation for subscription or purchase, whether directly or indirectly, to persons in Singapore other than (i) to an institutional investor under Section 274 of the Securities and Futures Act, Chapter 289 of Singapore, or SFA, (ii) to a relevant person, or any person pursuant to Section 275(1A), and in accordance with the conditions, specified in Section 275 of the SFA or (iii) otherwise pursuant to, and in accordance with the conditions of, any other applicable provision of the SFA.
Where the shares are subscribed or purchased under Section 275 by a relevant person which is: (a) a corporation (which is not an accredited investor) the sole business of which is to hold investments and the entire share capital of which is owned by one or more individuals, each of whom is an accredited investor; or (b) a trust (where the trustee is not an accredited investor) whose sole purpose is to hold investments and each beneficiary is an accredited investor, shares, debentures and units of shares and debentures of that corporation or the beneficiaries' rights and interest in that trust shall not be transferable for 6 months after that corporation or that trust has acquired the shares under Section 275 except: (1) to an institutional investor under Section 274 of the SFA or to a relevant person, or any person pursuant to Section 275(1A), and in accordance with the conditions, specified in Section 275 of the SFA; (2) where no consideration is given for the transfer; or (3) by operation of law.
Switzerland
We have not and will not register with the Swiss Financial Market Supervisory Authority, or FINMA, as a foreign collective investment scheme pursuant to Article 119 of the Federal Act on Collective Investment Scheme of 23 June 2006, as amended, or CISA, and accordingly the securities being offered pursuant to this prospectus have not and will not be approved, and may not be licenseable, with FINMA. Therefore, the securities have not been authorized for distribution by FINMA as a foreign collective investment scheme pursuant to Article 119 CISA and the securities offered hereby may not be offered to the public (as this term is defined in Article 3 CISA) in or from Switzerland. The securities may solely be offered to "qualified investors," as this term is defined in Article 10 CISA, and in the circumstances set out in Article 3 of the Ordinance on Collective Investment Scheme of 22 November 2006, as amended, or CISO, such that there is no public offer. Investors, however, do not benefit from protection under CISA or CISO or supervision by FINMA. This prospectus and any other materials relating to the securities are strictly personal and confidential to each offeree and do not constitute an offer to any other person. This prospectus may only be used by those qualified investors to whom it has been handed out in connection with the offer described herein and may neither directly or indirectly be distributed or made available to any person or entity other than its recipients. It may not be used in connection with any other offer and shall in particular not be copied and/or distributed to the public in Switzerland or from Switzerland. This prospectus does not constitute an issue prospectus as that term is understood pursuant to Article 652a and/or 1156 of the Swiss Federal Code of Obligations. We have not applied for a listing of the securities on the SIX Swiss Exchange or any other regulated securities market in Switzerland, and consequently, the information presented in this prospectus does not necessarily comply with the information standards set out in the listing rules of the SIX Swiss Exchange and corresponding prospectus schemes annexed to the listing rules of the SIX Swiss Exchange.
Dubai International Financial Centre
This prospectus relates to an Exempt Offer in accordance with the Offered Securities Rules of the Dubai Financial Services Authority, or DFSA. This prospectus is intended for distribution only to persons of a type specified in the Offered Securities Rules of the DFSA. It must not be delivered to, or relied on by, any other person. The DFSA has no responsibility for reviewing or verifying any documents in connection with Exempt Offers. The DFSA has not approved this prospectus nor taken steps to verify the information set forth herein and has no responsibility for the prospectus. The securities to which this prospectus relates may be illiquid and/or subject to restrictions on their resale. Prospective purchasers of the securities offered should conduct their own due diligence on the securities. If you do not understand the contents of this prospectus you should consult an authorized financial advisor.
Relationships with Underwriters
The underwriters and their respective affiliates are full service financial institutions engaged in various activities, which may include securities trading, commercial and investment banking, financial advisory, investment management, investment research, principal investment, hedging, financing, valuation and brokerage activities. From time to time, the underwriters and/or their respective affiliates have directly and indirectly engaged, or may engage, in various financial advisory, investment banking and commercial banking services for us and our affiliates, for which they received, or may receive, customary compensation, fees and expense reimbursement. In the ordinary course of their various business activities, the underwriters and their respective affiliates may make or hold a broad array of investments and actively trade debt and equity securities (or related derivative securities) and financial instruments (including bank loans) for their own account and for the accounts of their customers, and such investment and securities activities may involve securities and/or instruments of ours. The
underwriters and their respective affiliates may also make investment recommendations and/or publish or express independent research views in respect of such securities or instruments and may at any time hold, or recommend to clients that they acquire, long and/or short positions in such securities and instruments. In addition, Merrill Lynch, Pierce, Fenner & Smith Incorporated provided investment banking advice to the investors in the Acquisition who, for the most part, make up the selling stockholders in this offering.
Relationship with Solebury Capital LLC
Pursuant to an engagement agreement, we engaged Solebury Capital LLC, or Solebury, a FINRA member, to provide certain financial consulting services (which do not include underwriting services) in connection with this offering. We agreed to pay Solebury, only upon successful completion of this offering, a fee of $600,000 and, at our sole discretion, an additional potential incentive fee of $200,000. We also agreed to reimburse Solebury for reasonable and documented out-of-pocket expenses up to a maximum of $10,000 and have provided indemnification of Solebury pursuant to the engagement agreement. Solebury's services include an initial analysis of the market for new security issuances, an assessment of our financial position and business model and assistance in preparing presentation materials. Solebury is not acting as an underwriter and has no contact with any public or institutional investor on behalf of the Company or the underwriters. In addition, Solebury will not underwrite or purchase any of the offered securities or otherwise participate in any such undertaking.
The validity of the common stock and other certain legal matters will be passed upon for us by Skadden, Arps, Slate, Meagher & Flom LLP, New York, New York. The underwriters are being represented by Davis Polk & Wardwell LLP, New York, New York.
The consolidated financial statements of BankUnited, Inc. and subsidiaries as of December 31, 2009, and for the period from April 28, 2009 (date of inception) through December 31, 2009, have been included herein in reliance upon the report of KPMG LLP, independent registered public accounting firm, appearing elsewhere herein, and upon the authority of said firm as experts in accounting and auditing.
The consolidated financial statements of BankUnited, FSB as of May 21, 2009 and for the period from October 1, 2008 to May 21, 2009, and the consolidated financial statements of BankUnited, FSB as of September 30, 2008 and 2007, and for each of the two years in the period ended September 30, 2008, all included in this prospectus, have been so included in reliance on the report of PricewaterhouseCoopers LLP, an independent registered certified public accounting firm, given on the authority of said firm as experts in auditing and accounting.
WHERE YOU CAN FIND MORE INFORMATION
We have filed with the SEC a registration statement on Form S-1 under the Securities Act with respect to the common stock offered hereby. This prospectus does not contain all of the information set forth in the registration statement and the exhibits and schedules thereto. For further information with respect to us and our common stock, reference is made to the registration statement and the exhibits and any schedules filed therewith. Statements contained in this prospectus as to the contents of any contract or other document referred to are not necessarily complete and in each instance, if such contract or document is filed as an exhibit, reference is made to the copy of such contract or other document filed as an exhibit to the registration statement, each statement being qualified in all respects by such reference. A copy of the registration statement, including the exhibits and schedules thereto, may be read and copied at the SECs Public Reference Room at 100 F Street, N.E., Washington, D.C. 20549. Information on the operation of the Public Reference Room may be obtained by calling the SEC at 1-800-SEC-0330. In addition, the SEC maintains an Internet website that contains reports, proxy statements and other information about issuers, like us, that file electronically with the SEC. The address of that site is www.sec.gov.
As a result of the offering, we will become subject to the full informational requirements of the Exchange Act. We will fulfill our obligations with respect to such requirements by filing periodic reports and other information with the SEC. We intend to furnish our stockholders with annual reports containing consolidated financial statements certified by an independent public accounting firm. We also maintain an Internet site at www.bankunited.com. Information on, or accessible through, our website is not part of this prospectus.
INDEX TO CONSOLIDATED FINANCIAL STATEMENTS
| | Page | ||
|---|---|---|---|
BankUnited, Inc. (a wholly-owned subsidiary of BU Financial Holdings LLC)—Condensed Consolidated Financial Statements for the Nine Months Ended September 30, 2010 and the Period Ended September 30, 2009 (Unaudited) | |||
Condensed Consolidated Balance Sheets as of September 30, 2010 and December 31, 2009 (Unaudited) | F-2 | ||
Condensed Consolidated Statements of Income for the nine months ended September 30, 2010 and the period ended September 30, 2009 (Unaudited) | F-3 | ||
Condensed Consolidated Statements of Cash Flows for the nine months ended September 30, 2010 and the period ended September 30, 2009 (Unaudited) | F-4 | ||
Condensed Consolidated Statements of Stockholder's Equity and Comprehensive Income for the nine months ended September 30, 2010 and the period ended September 30, 2009 (Unaudited) | F-5 | ||
Notes to Condensed Consolidated Financial Statements (Unaudited) | F-6 | ||
BankUnited, Inc. (a wholly-owned subsidiary of BU Financial Holdings LLC)—Consolidated Financial Statements for the Period from April 28, 2009 (date of inception) through December 31, 2009 | |||
Report of Independent Registered Certified Public Accounting Firm | F-29 | ||
Consolidated Balance Sheet as of December 31, 2009 | F-30 | ||
Consolidated Statement of Income for the period from April 28, 2009 (date of inception) through December 31, 2009 | F-31 | ||
Consolidated Statement of Cash Flows for the period from April 28, 2009 (date of inception) through December 31, 2009 | F-32 | ||
Consolidated Statement of Stockholder's Equity and Comprehensive Income for the period from April 28, 2009 (date of inception) through December 31, 2009 | F-34 | ||
Notes to Consolidated Financial Statements | F-35 | ||
BankUnited, FSB and Subsidiaries (a wholly-owned subsidiary of BankUnited Financial Corporation)—Consolidated Financial Statements for the Period from October 1, 2008 through May 21, 2009, and the Fiscal Years Ended September 30, 2008 and September 30, 2007 | |||
Report of Independent Registered Certified Public Accounting Firm | F-82 | ||
Consolidated Balance Sheets as of May 21, 2009, September 30, 2008 and September 30, 2007 | F-83 | ||
Consolidated Statements of Operations for the period from October 1, 2008 through May 21, 2009, and the fiscal years ended September 30, 2008 and September 30, 2007 | F-84 | ||
Consolidated Statements of Cash Flows for the period from October 1, 2008 through May 21, 2009, and the fiscal years ended September 30, 2008 and September 30, 2007 | F-85 | ||
Consolidated Statements of Stockholder's Equity (Deficit) for the period from October 1, 2008 through May 21, 2009, and the fiscal years ended September 30, 2008 and September 30, 2007 | F-87 | ||
Consolidated Statements of Other Comprehensive Income (Loss) for the period from October 1, 2008 through May 21, 2009, and the fiscal years ended September 30, 2008 and September 30, 2007 | F-88 | ||
Notes to Consolidated Financial Statements | F-89 | ||
BANKUNITED, INC. AND SUBSIDIARIES
CONDENSED CONSOLIDATED BALANCE SHEETS
(Dollars in thousands, except per share data)
| | September 30, 2010 (Unaudited) | December 31, 2009 (Derived from audited financial statements) | |||||||
|---|---|---|---|---|---|---|---|---|---|
ASSETS | |||||||||
Cash and due from banks | $ | 54,575 | $ | 60,593 | |||||
Due from Federal Reserve Bank | 437,215 | 290,192 | |||||||
Federal funds sold | 2,796 | 5,430 | |||||||
Cash and cash equivalents | 494,586 | 356,215 | |||||||
Investment securities available for sale, at fair value (including covered securities of $270,254 and $275,726) | 3,088,504 | 2,243,143 | |||||||
Federal Home Loan Bank stock | 225,902 | 243,334 | |||||||
Loans held for sale | 534 | — | |||||||
Loans (including covered loans of $3,794,612 and $4,486,878) | 4,137,041 | 4,611,519 | |||||||
Allowance for loan losses | (57,807 | ) | (22,621 | ) | |||||
Loans, net | 4,079,234 | 4,588,898 | |||||||
FDIC indemnification asset | 2,723,059 | 3,279,165 | |||||||
Bank owned life insurance | 135,993 | 132,330 | |||||||
Other real estate owned, covered by loss sharing agreements | 194,286 | 120,110 | |||||||
Deferred tax asset, net | — | 22,533 | |||||||
Income tax receivable | 48,359 | — | |||||||
Goodwill and other intangible assets | 60,759 | 60,981 | |||||||
Other assets | 100,085 | 83,252 | |||||||
Total assets | $ | 11,151,301 | $ | 11,129,961 | |||||
LIABILITIES AND STOCKHOLDER'S EQUITY | |||||||||
Liabilities: | |||||||||
Demand deposits: | |||||||||
Non-interest bearing | $ | 492,495 | $ | 332,941 | |||||
Interest bearing | 306,208 | 222,052 | |||||||
Savings and money market | 3,022,752 | 2,592,642 | |||||||
Time | 3,479,005 | 4,519,140 | |||||||
Total deposits | 7,300,460 | 7,666,775 | |||||||
Securities sold under agreements to repurchase | 386 | 2,972 | |||||||
Federal Home Loan Bank advances | 2,260,006 | 2,079,051 | |||||||
Due to FDIC | 111,056 | 114,006 | |||||||
Income taxes payable | — | 82,701 | |||||||
Deferred tax liability, net | 15,691 | — | |||||||
Advance payments by borrowers for taxes and insurance | 55,896 | 31,237 | |||||||
Other liabilities | 164,967 | 58,959 | |||||||
Total liabilities | 9,908,462 | 10,035,701 | |||||||
Commitments and contingencies | |||||||||
Stockholder's equity: | |||||||||
Common Stock, par value $0.01 per share: | |||||||||
Authorized, 110,000,000 shares; 92,971,850 and 92,767,310 shares issued and outstanding | 930 | 928 | |||||||
Paid-in capital | 949,320 | 946,822 | |||||||
Paid-in capital from stock-based compensation | 1,083 | 210 | |||||||
Retained earnings | 261,968 | 119,046 | |||||||
Accumulated other comprehensive income | 29,538 | 27,254 | |||||||
Total stockholder's equity | 1,242,839 | 1,094,260 | |||||||
Total liabilities and stockholder's equity | $ | 11,151,301 | $ | 11,129,961 | |||||
The accompanying notes are an integral part of these condensed consolidated financial statements
BANKUNITED, INC. AND SUBSIDIARIES
CONDENSED CONSOLIDATED STATEMENTS OF INCOME—UNAUDITED
(Dollars in thousands, except per share data)
| | Nine Months Ended September 30 2010 | Period from April 28, 2009 Through September 30 2009 | |||||||
|---|---|---|---|---|---|---|---|---|---|
Interest income: | |||||||||
Interest and fees on loans | $ | 320,092 | $ | 172,003 | |||||
Interest and dividends on investment securities available for sale | 93,382 | 21,651 | |||||||
Other | 1,485 | 1,962 | |||||||
Total interest income | 414,959 | 195,616 | |||||||
Interest expense: | |||||||||
Interest on deposits | 83,631 | 33,509 | |||||||
Interest on borrowings | 43,864 | 15,001 | |||||||
Total interest expense | 127,495 | 48,510 | |||||||
Net interest income before provision for loan losses | 287,464 | 147,106 | |||||||
Provision for loan losses | 45,157 | 2,288 | |||||||
Net interest income after provision for loan losses | 242,307 | 144,818 | |||||||
Non-interest income: | |||||||||
Accretion of discount on FDIC indemnification asset | 116,915 | 89,449 | |||||||
Income from resolution of covered assets, net | 112,777 | 79,560 | |||||||
Net loss on indemnification asset resulting from net recoveries | (44,932 | ) | (51,123 | ) | |||||
FDIC reimbursement of costs of resolution of covered assets | 22,393 | 2,489 | |||||||
Service charges | 7,899 | 3,949 | |||||||
Loss on sale or exchange of investment securities available for sale | (2,292 | ) | — | ||||||
Mortgage insurance income | 12,097 | 630 | |||||||
Gain on extinguishment of debt | — | 31,303 | |||||||
Other non-interest income | 12,663 | 2,735 | |||||||
Total non-interest income | 237,520 | 158,992 | |||||||
Non-interest expense: | |||||||||
Employee compensation and benefits | 100,334 | 35,813 | |||||||
Occupancy and equipment | 19,843 | 11,672 | |||||||
Impairment of other real estate owned | 12,164 | 8,716 | |||||||
Foreclosure expense | 28,384 | 9,248 | |||||||
Other real estate owned related expense | 10,903 | 3,670 | |||||||
Deposit insurance expense | 10,420 | 8,873 | |||||||
Professional fees | 7,668 | 4,690 | |||||||
Telecommunications and data processing | 8,772 | 3,646 | |||||||
Other non-interest expense | 21,560 | 5,511 | |||||||
Loss on FDIC receivable | — | 69,444 | |||||||
Acquisition related costs | — | 39,685 | |||||||
Total non-interest expense | 220,048 | 200,968 | |||||||
Income before income taxes | 259,779 | 102,842 | |||||||
Provision for income taxes | 102,857 | 41,191 | |||||||
Net income | $ | 156,922 | $ | 61,651 | |||||
Earnings per common share: | |||||||||
Basic and diluted | $ | 1.69 | $ | .67 | |||||
Weighted average number of common shares outstanding: | |||||||||
Basic and diluted | 92,943,620 | 92,600,000 | |||||||
The accompanying notes are an integral part of these condensed consolidated financial statements
BANKUNITED, INC. AND SUBSIDIARIES
CONDENSED CONSOLIDATED STATEMENTS OF CASH FLOWS—UNAUDITED
(Dollars in thousands)
| | Nine Months Ended September 30 2010 | Period from April 28, 2009 Through September 30 2009 | |||||||||
|---|---|---|---|---|---|---|---|---|---|---|---|
Cash flows from operating activities: | |||||||||||
Net income | $ | 156,922 | $ | 61,651 | |||||||
Adjustments to reconcile net income to net cash used in operating activities: | |||||||||||
Accretion of fair values of assets acquired and liabilities assumed | (336,219 | ) | (232,183 | ) | |||||||
Amortization of fees, discounts and premiums, net | (24,591 | ) | (10,649 | ) | |||||||
Provision for loan losses | 45,157 | 2,288 | |||||||||
Accretion of FDIC indemnification asset | (116,915 | ) | (89,449 | ) | |||||||
Income from resolution of covered assets | (112,777 | ) | (79,560 | ) | |||||||
Net loss on indemnification asset resulting from net recoveries | 44,932 | 51,123 | |||||||||
Increase in cash surrender value of bank owned life insurance | (3,836 | ) | (1,904 | ) | |||||||
Loss on sale or exchange of investment securities available for sale, net | 2,292 | — | |||||||||
Income from life insurance proceeds | (544 | ) | — | ||||||||
Gain on sale of real estate owned, net | (2,270 | ) | (486 | ) | |||||||
Loss on disposal of properties and equipment | 316 | — | |||||||||
Stock-based compensation | 873 | — | |||||||||
Change in fair value of equity awards classified as liabilities | 24,490 | 4,963 | |||||||||
Depreciation and amortization | 1,765 | 6 | |||||||||
Impairment of other real estate owned | 12,164 | 8,716 | |||||||||
Deferred income taxes | 38,884 | (913 | ) | ||||||||
Gain on extinguishment of debt | — | (31,303 | ) | ||||||||
Loss on FDIC receivable | — | 69,444 | |||||||||
Other: | — | — | |||||||||
Loans originated for sale, net of repayments | (534 | ) | — | ||||||||
(Increase) decrease in other assets | (46,811 | ) | 24,660 | ||||||||
(Decrease) increase in other liabilities | (76,845 | ) | 35,100 | ||||||||
Decrease in due to FDIC | (2,950 | ) | (16,781 | ) | |||||||
Net cash used in operating activities | (396,497 | ) | (205,277 | ) | |||||||
Cash flows from investing activities: | |||||||||||
Net cash acquired in a business combination | — | 1,160,321 | |||||||||
Cash received from FDIC related to business combination, net | — | 2,274,206 | |||||||||
Purchase of investment securities available for sale | (1,331,883 | ) | (227,172 | ) | |||||||
Proceeds from repayments of investment securities available for sale | 494,324 | 64,227 | |||||||||
Proceeds from sale of investment securities available for sale | 67,867 | 6,801 | |||||||||
Maturities and calls of investment securities available for sale | 10,000 | 20,000 | |||||||||
Loan repayments and resolutions, net of originations | 594,343 | 369,246 | |||||||||
Proceeds from redemption of FHLB stock | 17,432 | — | |||||||||
Decrease in FDIC indemnification asset for claims filed | 628,089 | 68,975 | |||||||||
Bank owned life insurance proceeds | 717 | — | |||||||||
Purchase of office properties and equipment | (20,979 | ) | (801 | ) | |||||||
Proceeds from sale of other real estate owned | 197,173 | 122,788 | |||||||||
Net cash provided by investing activities | 657,083 | 3,858,591 | |||||||||
Cash flows from financing activities: | |||||||||||
Net (decrease) increase in deposits | (347,989 | ) | 38,245 | ||||||||
Additions to Federal Home Loan Bank advances | 605,000 | — | |||||||||
Repayments of Federal Home Loan Bank advances | (405,000 | ) | (2,795,112 | ) | |||||||
Net decrease in securities sold under agreements to repurchase | (2,586 | ) | (30 | ) | |||||||
Increase in advances from borrowers for taxes and insurance | 25,860 | 19,232 | |||||||||
Capital contribution | 2,500 | 947,000 | |||||||||
Net cash used in financing activities | (122,215 | ) | (1,790,665 | ) | |||||||
Net increase in cash and cash equivalents | 138,371 | 1,862,649 | |||||||||
Cash and cash equivalents, beginning of period | 356,215 | — | |||||||||
Cash and cash equivalents, end of period | $ | 494,586 | $ | 1,862,649 | |||||||
Supplemental disclosure of cash flow activity: | |||||||||||
Interest paid on deposits and borrowings | $ | 168,200 | $ | 157,537 | |||||||
Income taxes paid | $ | 197,166 | $ | — | |||||||
Supplemental schedule of non-cash investing and financing activities: | |||||||||||
Transfers from loans to real estate owned | $ | 283,220 | $ | 49,431 | |||||||
Dividends declared on common stock | $ | 14,000 | $ | — | |||||||
Restructuring of Federal Home Loan Bank advances | $ | — | $ | 505,000 | |||||||
The accompanying notes are an integral part of these condensed consolidated financial statements
BANKUNITED, INC. AND SUBSIDIARIES
CONDENSED CONSOLIDATED STATEMENTS OF STOCKHOLDER'S EQUITY AND
COMPREHENSIVE INCOME—UNAUDITED
(Dollars in thousands)
| | Common Stock | Paid-in Capital | Paid-in Capital From Stock Based Compensation | Retained Earnings | Accumulated Other Comprehensive Income (Loss) | Total Stockholder's Equity | ||||||||||||||||
|---|---|---|---|---|---|---|---|---|---|---|---|---|---|---|---|---|---|---|---|---|---|---|
Balance at December 31, 2009 | $ | 928 | $ | 946,822 | $ | 210 | $ | 119,046 | $ | 27,254 | $ | 1,094,260 | ||||||||||
Comprehensive income: | ||||||||||||||||||||||
Net income | — | — | — | 156,922 | — | 156,922 | ||||||||||||||||
Other comprehensive income: | ||||||||||||||||||||||
Unrealized gains on investment securities available for sale arising during the period, net of taxes of $23,511 | — | — | — | — | 37,437 | 37,437 | ||||||||||||||||
Reclassification adjustment for: | ||||||||||||||||||||||
Realized losses on investment securities available for sale, net of tax benefit of $884 | — | — | — | — | 1,408 | 1,408 | ||||||||||||||||
Unrealized losses on cash flow hedges, net of tax benefit of $24,034 | — | — | — | — | (38,270 | ) | (38,270 | ) | ||||||||||||||
Reclassification adjustment for: | ||||||||||||||||||||||
Realized losses on cash flow hedges, net of tax benefit of $1,070 | — | — | — | — | 1,709 | 1,709 | ||||||||||||||||
Total comprehensive income | 159,206 | |||||||||||||||||||||
Capital contribution | 2 | 2,498 | — | — | — | 2,500 | ||||||||||||||||
Dividends | — | — | — | (14,000 | ) | — | (14,000 | ) | ||||||||||||||
Stock-based compensation | — | — | 873 | — | — | 873 | ||||||||||||||||
Balance at September 30, 2010 | $ | 930 | $ | 949,320 | $ | 1,083 | $ | 261,968 | $ | 29,538 | $ | 1,242,839 | �� | |||||||||
Balance at April 28, 2009 (date of inception) | $ | — | $ | — | $ | — | $ | — | $ | — | $ | — | ||||||||||
Initial capital contribution | 925 | 924,075 | — | — | — | 925,000 | ||||||||||||||||
Additional capital contributions | 2 | 21,998 | — | — | — | 22,000 | ||||||||||||||||
Comprehensive income: | ||||||||||||||||||||||
Net income | — | — | — | 61,651 | — | 61,651 | ||||||||||||||||
Other comprehensive income: | ||||||||||||||||||||||
Unrealized gains on investment securities available for sale arising during the period, net of taxes of $13,448 | — | — | — | — | 21,414 | 21,414 | ||||||||||||||||
Unrealized losses on cash flow hedges arising during the period, net of tax benefit of $3,756 | — | — | — | — | (5,980 | ) | (5,980 | ) | ||||||||||||||
Total comprehensive income | 77,085 | |||||||||||||||||||||
Balance at September 30, 2009 | $ | 927 | $ | 946,073 | $ | — | $ | 61,651 | $ | 15,434 | $ | 1,024,085 | ||||||||||
The accompanying notes are an integral part of these condensed consolidated financial statements
BANKUNITED, INC. AND SUBSIDIARIES
NOTES TO CONDENSED CONSOLIDATED FINANCIAL STATEMENTS—UNAUDITED
September 30, 2010
Note 1 Basis of Presentation
BankUnited, Inc., formerly known as BU Financial Corporation, was organized on April 28, 2009 as the holding company for BankUnited ("BankUnited" or the "Bank"), a federally-chartered, federally-insured savings association, and is headquartered in Miami Lakes, Florida. After the close of business on May 21, 2009, BankUnited acquired certain assets and assumed certain liabilities of BankUnited, FSB from the Federal Deposit Insurance Corporation ("FDIC"). Business operations began on May 22, 2009. BankUnited, Inc.'s wholly-owned subsidiaries include BankUnited and BankUnited Investment Services, Inc. (collectively the "Company"). BankUnited provides a full range of banking and bank-related services to individual and corporate customers through 78 branch offices located in 13 Florida counties. The Company is a wholly-owned subsidiary of BU Financial Holdings LLC ("BUFH"), which was formed on April 27, 2009 as a limited liability company under the laws of the State of Delaware.
The condensed consolidated financial statements included herein have been prepared without audit pursuant to the instructions to Form S-1 and Article 10 of Regulation S-X of the Securities and Exchange Commission (the "SEC") and should be read in conjunction with the Company's audited consolidated financial statements and the notes thereto as of and for the period ended December 31, 2009 included in the Company's registration statement on Form S-1. Certain information and footnote disclosures normally included in financial statements prepared in accordance with accounting principles generally accepted in the United States of America ("GAAP") have been condensed or omitted pursuant to such rules and regulations.
These condensed consolidated financial statements were compiled in accordance with the accounting policies set forth in Note 1—Summary of Significant Accounting Policies of the Notes to Consolidated Financial Statements in the Company's Consolidated Financial Statements as of and for the period ended December 31, 2009 included in the Company's registration statement on Form S-1. The accompanying condensed consolidated financial statements reflect all adjustments, consisting of normal recurring adjustments that, in the opinion of management, are necessary to reflect a fair statement of the Company's consolidated financial condition, results of operations and cash flows. Operating results for the nine months ended September 30, 2010 are not necessarily indicative of the results that may be expected for the year ended December 31, 2010.
The condensed consolidated financial statements include the accounts of the Company and its consolidated subsidiaries. All significant intercompany transactions have been eliminated.
Accounting Estimates
In preparing the condensed consolidated financial statements, management is required to make estimates and assumptions that affect the reported amounts of assets and liabilities, revenues, and expenses and disclosures of contingent assets and liabilities. Management has made significant estimates in certain areas, such as the allowance for loan losses, the amount and timing of expected cash flows from covered assets and the FDIC indemnification asset, the valuation of other real estate owned, the valuation of Profits Interest Units and the warrant issued to the FDIC, the valuation of deferred tax assets, the evaluation of investment securities for other-than-temporary impairment and the fair values of financial instruments. Management has used information provided by third parties to assist in the determination of estimates of the fair values of investment securities, stock options and other equity awards.
BANKUNITED, INC. AND SUBSIDIARIES
NOTES TO CONDENSED CONSOLIDATED FINANCIAL STATEMENTS—UNAUDITED (Continued)
September 30, 2010
Note 1 Basis of Presentation (Continued)
Significant estimates were also made in the determination of the fair values of assets acquired and liabilities assumed in the BankUnited FSB acquisition, including loans acquired with evidence of credit impairment since origination, the FDIC indemnification asset, goodwill and other intangible assets. Actual results could differ from these estimates. The current economic environment has increased the degree of uncertainty inherent in these estimates and assumptions.
Recent Accounting Pronouncements
In June 2009, the Financial Accounting Standards Board ("FASB") issued guidance modifying the accounting for transfers and servicing of financial assets and removing the concept of a Qualifying Special Purpose Entity. This guidance was effective for transfers of financial assets occurring after December 31, 2009 and was adopted by the Company as of January 1, 2010. The adoption of this guidance did not have a material impact on the Company's financial position, results of operations, or cash flows.
In June 2009, the FASB issued guidance impacting the determination of whether an entity is a variable interest entity ("VIE") and identification of the primary beneficiary of a VIE. The objective of this guidance was to improve financial reporting by enterprises involved with VIE's. This guidance was adopted by the Company as of January 1, 2010. Adoption did not have a material impact on the Company's financial position, results of operations, or cash flows.
In January 2010, the FASB issued new guidance to improve disclosures about fair value measurements. Disclosure requirements were enhanced to require additional information regarding transfers to and from Levels 1 and 2 of the fair value hierarchy and the reasons for the transfers, and a gross presentation of activity within the rollforward of Level 3 fair value measurements. The guidance clarifies existing disclosure requirements as to the level of disaggregation of classes of assets and liabilities. In addition, enhanced disclosure is required concerning inputs and valuation techniques used to determine Level 2 and Level 3 fair value measurements. This guidance is generally effective for interim and annual reporting periods beginning after December 15, 2009; however, requirements to disclose separately purchases, sales, issuances, and settlements in the Level 3 rollforward are effective for interim and annual reporting periods beginning after December 15, 2010. The adoption of this guidance did not have a material impact on the Company's financial position, results of operations, or cash flows.
In March 2010, the FASB issued new guidance clarifying that a modification of a loan that is part of a pool of loans acquired with deteriorated credit quality should not result in the removal of the loan from the pool. This guidance was effective for any modifications of loans accounted for within a pool in the first interim or annual reporting period ending after July 15, 2010. The adoption of this guidance did not have a material impact on the Company's financial position, results of operations, or cash flows.
In July 2010, the FASB issued new guidance requiring expanded disclosures about the credit quality of financing receivables and the allowance for loan losses. Disclosures must be disaggregated by portfolio segment and class and include, among other things, a rollforward of the allowance for loan losses, credit quality indicators, expanded information about past due and impaired loans and the related allowance, an aging of past due loans, and information about troubled debt restructurings. The required disclosures of information as of the end of a reporting period will be effective for the
BANKUNITED, INC. AND SUBSIDIARIES
NOTES TO CONDENSED CONSOLIDATED FINANCIAL STATEMENTS—UNAUDITED (Continued)
September 30, 2010
Note 1 Basis of Presentation (Continued)
Company in its annual financial statements for the year ending December 31, 2010. Required disclosures about activity that occurs during a reporting period will be effective for the Company in the quarter ending March 31, 2011. The new guidance will result in additional financial statement disclosures but will not affect the Company's financial condition, results of operations or cash flows.
Note 2 Acquisition
On May 21, 2009, BankUnited entered into a purchase and assumption agreement (the "FSB Agreement") with the FDIC, as receiver, pursuant to which BankUnited acquired certain assets and assumed substantially all of the deposits and liabilities of BankUnited, FSB (the "Acquisition").
Prior to the Acquisition, BankUnited, FSB was a community bank headquartered in Coral Gables, Florida and operated 85 banking branches in 13 counties in Florida. Excluding the effects of purchase accounting adjustments, the Bank acquired $13.6 billion in assets and assumed $12.8 billion of the deposits and liabilities of BankUnited, FSB. The Bank received net consideration in the amount of $2.2 billion, net of liabilities due to the FDIC in the amount of $156.8 million.
In connection with the Acquisition, the Bank entered into loss sharing agreements with the FDIC that cover single family residential mortgage loans, commercial real estate, commercial and industrial and consumer loans, certain investment securities and other real estate owned ("OREO"), collectively referred to as the "covered assets". The Bank acquired other BankUnited, FSB assets that are not covered by the loss sharing agreements with the FDIC including cash balances of $1.2 billion, certain investment securities purchased at fair value and other tangible assets. Pursuant to the terms of the loss sharing agreements, the covered assets are subject to a stated loss threshold whereby the FDIC will reimburse the Bank for 80% of losses of up to $4.0 billion, and 95% of losses in excess of this amount. The Bank will reimburse the FDIC for its share of recoveries with respect to losses for which the FDIC paid the Bank a reimbursement under the loss sharing agreements. The FDIC's obligation to reimburse the Company for losses with respect to covered assets begins with the first dollar of loss incurred. The expected reimbursements under the loss sharing agreements were recorded as an indemnification asset at its estimated fair value of $3.4 billion on the acquisition date. The indemnification asset reflects the present value of the expected net cash reimbursement related to the loss sharing agreements.
BANKUNITED, INC. AND SUBSIDIARIES
NOTES TO CONDENSED CONSOLIDATED FINANCIAL STATEMENTS—UNAUDITED (Continued)
September 30, 2010
Note 3 Investment Securities Available for Sale
Investment securities available for sale at September 30, 2010 and December 31, 2009, consisted of the following (in thousands):
| | September 30, 2010 | |||||||||||||||||||||||||
|---|---|---|---|---|---|---|---|---|---|---|---|---|---|---|---|---|---|---|---|---|---|---|---|---|---|---|
| | Covered Securities | Non-Covered Securities | ||||||||||||||||||||||||
| | | Gross Unrealized | | | Gross Unrealized | | ||||||||||||||||||||
| | Amortized Cost | Fair Value | Amortized Cost | Fair Value | ||||||||||||||||||||||
| | Gains | Losses | Gains | Losses | ||||||||||||||||||||||
U.S. Government agency and sponsored enterprise residential mortgage-backed securities | $ | — | $ | — | $ | — | $ | — | $ | 1,344,928 | $ | 23,331 | $ | (20 | ) | $ | 1,368,239 | |||||||||
Other residential collateralized mortgage obligations | 1,729 | 97 | — | 1,826 | 691,669 | 13,852 | (1,067 | ) | 704,454 | |||||||||||||||||
Residential mortgage pass-through certificates | 183,374 | 64,284 | (1,601 | ) | 246,057 | 116,078 | 2,404 | — | 118,482 | |||||||||||||||||
Nonmortgage asset backed securities | — | — | — | — | 426,018 | 1,988 | (75 | ) | 427,931 | |||||||||||||||||
Mutual funds and preferred stocks | 16,408 | — | (936 | ) | 15,472 | 105,176 | 3,633 | — | 108,809 | |||||||||||||||||
State and municipal obligations | — | — | — | — | 23,473 | 211 | (6 | ) | 23,678 | |||||||||||||||||
Small Business Administration securities | — | — | — | — | 66,355 | 354 | (52 | ) | 66,657 | |||||||||||||||||
Other debt securities | 3,594 | 3,305 | — | 6,899 | — | — | — | — | ||||||||||||||||||
Total | $ | 205,105 | $ | 67,686 | $ | (2,537 | ) | $ | 270,254 | $ | 2,773,697 | $ | 45,773 | $ | (1,220 | ) | $ | 2,818,250 | ||||||||
| | December 31, 2009 | |||||||||||||||||||||||||
|---|---|---|---|---|---|---|---|---|---|---|---|---|---|---|---|---|---|---|---|---|---|---|---|---|---|---|
| | Covered Securities | Not Covered Securities | ||||||||||||||||||||||||
| | | Gross Unrealized | | | Gross Unrealized | | ||||||||||||||||||||
| | Amortized Cost | Fair Value | Amortized Cost | Fair Value | ||||||||||||||||||||||
| | Gains | Losses | Gains | Losses | ||||||||||||||||||||||
U.S. Treasury securities | $ | — | $ | — | $ | — | $ | — | $ | 10,066 | $ | 6 | $ | — | $ | 10,072 | ||||||||||
U.S. Government agency and sponsored enterprise residential mortgage-backed securities | — | — | — | — | 1,288,277 | 3,581 | (3,215 | ) | 1,288,643 | |||||||||||||||||
Other residential collateralized mortgage obligations | 1,747 | 89 | — | 1,836 | 508,731 | 1,007 | (4,735 | ) | 505,003 | |||||||||||||||||
Residential mortgage pass-through certificates | 199,402 | 51,196 | (480 | ) | 250,118 | 118,616 | — | (4,062 | ) | 114,554 | ||||||||||||||||
Mutual funds and preferred stocks | 18,094 | 338 | (698 | ) | 17,734 | 25,250 | 661 | (122 | ) | 25,789 | ||||||||||||||||
State and municipal obligations | — | — | — | — | 23,214 | 143 | (1 | ) | 23,356 | |||||||||||||||||
Other debt securities | 3,331 | 2,707 | — | 6,038 | — | — | — | — | ||||||||||||||||||
Total | $ | 222,574 | $ | 54,330 | $ | (1,178 | ) | $ | 275,726 | $ | 1,974,154 | $ | 5,398 | $ | (12,135 | ) | $ | 1,967,417 | ||||||||
Investment securities available for sale at September 30, 2010 by contractual maturity, adjusted for anticipated prepayments of mortgage-backed and other pass-through securities, are shown below (in thousands):
| | Amortized Cost | Fair Value | ||||||
|---|---|---|---|---|---|---|---|---|
Due in one year or less | $ | 599,604 | $ | 621,522 | ||||
Due after one year through five years | 1,431,860 | 1,481,307 | ||||||
Due after five years through ten years | 462,241 | 482,643 | ||||||
Due after ten years | 363,513 | 378,751 | ||||||
Mutual funds and preferred stocks | 121,584 | 124,281 | ||||||
Total | $ | 2,978,802 | $ | 3,088,504 | ||||
BANKUNITED, INC. AND SUBSIDIARIES
NOTES TO CONDENSED CONSOLIDATED FINANCIAL STATEMENTS—UNAUDITED (Continued)
September 30, 2010
Note 3 Investment Securities Available for Sale (Continued)
Based on the Company's proprietary model and prepayment assumptions, the weighted average life of the mortgage-backed securities portfolio as of September 30, 2010 and December 31, 2009 was 4.42 and 4.50 years, respectively. The model results are based on assumptions that may differ from the eventual outcome.
Information pertaining to investment securities available for sale with gross unrealized losses aggregated by investment category follows. All of the securities in unrealized loss positions have been in continuous unrealized loss positions for less than twelve months at September 30, 2010 and December 31, 2009 (in thousands):
| | September 30, 2010 | December 31, 2009 | ||||||||||||
|---|---|---|---|---|---|---|---|---|---|---|---|---|---|---|
| | Fair Value | Unrealized Losses | Fair Value | Unrealized Losses | ||||||||||
U.S. Government agency and sponsored enterprise residential mortgage-backed securities | $ | 640 | $ | (20 | ) | $ | 812,669 | $ | (3,215 | ) | ||||
Other residential collateralized mortgage obligations | 188,849 | (1,067 | ) | 340,846 | (4,735 | ) | ||||||||
Residential mortgage pass-through certificates | 7,835 | (1,601 | ) | 115,872 | (4,542 | ) | ||||||||
Nonmortgage asset backed securities | 76,050 | (75 | ) | — | — | |||||||||
Mutual funds and preferred stocks | 15,472 | (936 | ) | 27,257 | (820 | ) | ||||||||
State and municipal obligations | 3,458 | (6 | ) | 1,109 | (1 | ) | ||||||||
Small Business Administration securities | 7,141 | (52 | ) | — | — | |||||||||
Total | $ | 299,445 | $ | (3,757 | ) | $ | 1,297,753 | $ | (13,313 | ) | ||||
The Company monitors its investment securities available for sale for other than temporary impairment, or OTTI, on an individual security basis considering numerous factors including the Company's intent to hold securities in an unrealized loss position, the likelihood that the Company will be required to sell these securities before an anticipated recovery in value, the length and severity of impairment, the earnings performance, credit rating, asset quality, and business prospects of the issuer, and changes in the regulatory and economic environment. The relative significance of each of these factors varies depending on the circumstances related to each security.
The Company does not intend to sell securities that are in an unrealized loss position and it is more likely than not that it will not be required to sell these securities prior to recovery of the amortized cost basis. Management has completed an assessment of each security in an unrealized loss position for credit impairment and concluded that no OTTI exists at September 30, 2010.
During the nine months ended September 30, 2010, the Company exchanged certain non-covered trust preferred securities for preferred stock of the same issuer to achieve higher returns and more favorable tax treatment. Based on the market value of the trust preferred securities at the time of the exchange, the Company recognized a gross realized loss of $2.8 million. During the nine months ended September 30, 2010, proceeds from sale of investment securities available for sale amounted to $67.9 million, resulting in gross realized losses of $46.4 thousand and gross realized gains of $565.2 thousand.
The carrying value of securities pledged as collateral for borrowings from the Federal Home Loan Bank ("FHLB"), public deposits, interest rate swaps and securities sold under agreements to repurchase and to secure borrowing capacity at the Federal Reserve Bank, totaled $614.7 million at September 30, 2010.
BANKUNITED, INC. AND SUBSIDIARIES
NOTES TO CONDENSED CONSOLIDATED FINANCIAL STATEMENTS—UNAUDITED (Continued)
September 30, 2010
Note 4 Loans and Allowance for Loan Losses
At September 30, 2010 and December 31, 2009, loans receivable consisted of the following (dollars in thousands):
| | September 30, 2010 | |||||||||||||||||
|---|---|---|---|---|---|---|---|---|---|---|---|---|---|---|---|---|---|---|
| | Covered Loans | | | | ||||||||||||||
| | Acquired Credit Impaired | Non-ACI | Non-Covered Loans | Total | Percent of Total | |||||||||||||
Real Estate Loans: | ||||||||||||||||||
1-4 single family residential | $ | 2,765,552 | $ | 160,784 | $ | 71,234 | $ | 2,997,570 | 71.9 | % | ||||||||
Home equity loans and lines of credit | 102,320 | 210,451 | 1,693 | 314,464 | 7.5 | % | ||||||||||||
Multi-family | 68,205 | 5,686 | 15,719 | 89,610 | 2.1 | % | ||||||||||||
Commercial real estate | 317,533 | 36,555 | 73,930 | 428,018 | 10.3 | % | ||||||||||||
Construction | 9,563 | — | 1,348 | 10,911 | 0.3 | % | ||||||||||||
Land | 50,600 | 172 | 1,591 | 52,363 | 1.2 | % | ||||||||||||
Total real estate loans | 3,313,773 | 413,648 | 165,515 | 3,892,936 | 93.3 | % | ||||||||||||
Other Loans: | ||||||||||||||||||
Commercial | 59,384 | 35,764 | 175,022 | 270,170 | 6.5 | % | ||||||||||||
Consumer | 4,517 | — | 3,728 | 8,245 | 0.2 | % | ||||||||||||
Total commercial and consumer loans | 63,901 | 35,764 | 178,750 | 278,415 | 6.7 | % | ||||||||||||
Total loans | 3,377,674 | 449,412 | 344,265 | 4,171,351 | 100.0 | % | ||||||||||||
Unearned discount and deferred fees and costs, net | — | (32,474 | ) | (1,836 | ) | (34,310 | ) | |||||||||||
Loans net of discount and deferred costs | 3,377,674 | 416,938 | 342,429 | 4,137,041 | ||||||||||||||
Allowance for loan losses | (37,342 | ) | (16,587 | ) | (3,878 | ) | (57,807 | ) | ||||||||||
Loans, net | $ | 3,340,332 | $ | 400,351 | $ | 338,551 | $ | 4,079,234 | ||||||||||
BANKUNITED, INC. AND SUBSIDIARIES
NOTES TO CONDENSED CONSOLIDATED FINANCIAL STATEMENTS—UNAUDITED (Continued)
September 30, 2010
Note 4 Loans and Allowance for Loan Losses (Continued)
| | December 31, 2009 | |||||||||||||||||
|---|---|---|---|---|---|---|---|---|---|---|---|---|---|---|---|---|---|---|
| | Covered Loans | | | | ||||||||||||||
| | Acquired Credit Impaired | Non-ACI | Non-Covered Loans | Total | Percent of Total | |||||||||||||
Real Estate Loans: | ||||||||||||||||||
1-4 single family residential | $ | 3,306,306 | $ | 184,669 | $ | 43,110 | $ | 3,534,085 | 76.0 | % | ||||||||
Home equity loans and lines of credit | 113,578 | 215,591 | 1,615 | 330,784 | 7.1 | % | ||||||||||||
Multi-family | 71,321 | 4,971 | 700 | 76,992 | 1.7 | % | ||||||||||||
Commercial real estate | 363,965 | 39,733 | 24,460 | 428,158 | 9.2 | % | ||||||||||||
Construction | 44,812 | 377 | — | 45,189 | 1.0 | % | ||||||||||||
Land | 43,903 | 173 | — | 44,076 | 0.9 | % | ||||||||||||
Total real estate loans | 3,943,885 | 445,514 | 69,885 | 4,459,284 | 95.9 | % | ||||||||||||
Other Loans: | ||||||||||||||||||
Commercial | 81,765 | 48,635 | 51,565 | 181,965 | 3.9 | % | ||||||||||||
Consumer | 7,065 | — | 3,151 | 10,216 | 0.2 | % | ||||||||||||
Total commercial and consumer loans | 88,830 | 48,635 | 54,716 | 192,181 | 4.1 | % | ||||||||||||
Total loans | 4,032,715 | 494,149 | 124,601 | 4,651,465 | 100.00 | % | ||||||||||||
Unearned discount and deferred fees and costs, net | — | (39,986 | ) | 40 | (39,946 | ) | ||||||||||||
Loans net of discount and deferred costs | 4,032,715 | 454,163 | 124,641 | 4,611,519 | ||||||||||||||
Allowance for loan losses | (20,021 | ) | (1,266 | ) | (1,334 | ) | (22,621 | ) | ||||||||||
Loans, net | $ | 4,012,694 | $ | 452,897 | $ | 123,307 | $ | 4,588,898 | ||||||||||
Covered loans represent loans acquired from the FDIC subject to the loss sharing agreements. Covered loans are further broken out into (i) loans acquired with evidence of credit impairment, which we call acquired credit impaired, or ACI loans and (ii) loans that did not evidence credit impairment at acquisition, or non-ACI loans. Loans originated by the Company after May 21, 2009 are excluded from the loss sharing agreement and are classified as non-covered loans. The unpaid principal balance of ACI loans as of September 30, 2010 and December 31, 2009 was $7.9 billion and $9.3 billion, respectively.
The accretable yield on ACI loans represents the amount by which undiscounted expected future cash flows exceed carrying value of the loans. Changes in accretable yield on ACI loans for the nine
BANKUNITED, INC. AND SUBSIDIARIES
NOTES TO CONDENSED CONSOLIDATED FINANCIAL STATEMENTS—UNAUDITED (Continued)
September 30, 2010
Note 4 Loans and Allowance for Loan Losses (Continued)
months ended September 30, 2010 and the period ended September 30, 2009 were as follows (in thousands):
| | September 30, 2010 | September 30, 2009 | ||||||
|---|---|---|---|---|---|---|---|---|
Balance at beginning of period | $ | 1,734,234 | $ | 2,004,337 | ||||
Reclassifications from non-accretable difference | 315,255 | — | ||||||
Accretion during the period | (291,565 | ) | (161,454 | ) | ||||
Balance at end of period | $ | 1,757,924 | $ | 1,842,883 | ||||
The following tables present total 1-4 single family residential loans categorized between fixed rate mortgages and adjustable rate mortgages ("ARMs") as of September 30, 2010 and December 31, 2009 (dollars in thousands):
| | September 30, 2010 | |||||||||||||||||
|---|---|---|---|---|---|---|---|---|---|---|---|---|---|---|---|---|---|---|
| | Covered Loans | | | | ||||||||||||||
| | Acquired Credit Impaired | Non-ACI | Non-Covered Loans | Total | Percent of Total | |||||||||||||
1-4 single family residential loans: | ||||||||||||||||||
Fixed rate loans | $ | 680,074 | $ | 65,310 | $ | 55,805 | $ | 801,189 | 26.7 | % | ||||||||
ARM Loans | 2,085,478 | 95,474 | 15,429 | 2,196,381 | 73.3 | % | ||||||||||||
Total(1) | $ | 2,765,552 | $ | 160,784 | $ | 71,234 | $ | 2,997,570 | 100 | % | ||||||||
| | December 31, 2009 | |||||||||||||||||
|---|---|---|---|---|---|---|---|---|---|---|---|---|---|---|---|---|---|---|
| | Covered Loans | | | | ||||||||||||||
| | Acquired Credit Impaired | Non-ACI | Non-Covered Loans | Total | Percent of Total | |||||||||||||
1-4 single family residential loans: | ||||||||||||||||||
Fixed rate loans | $ | 569,529 | $ | 76,342 | $ | 42,577 | $ | 688,448 | 19.5 | % | ||||||||
ARM Loans | 2,736,777 | 108,327 | 533 | 2,845,637 | 80.5 | % | ||||||||||||
Total(1) | $ | 3,306,306 | $ | 184,669 | $ | 43,110 | $ | 3,534,085 | 100 | % | ||||||||
At September 30, 2010, based on unpaid principal balance, 65.3% of all outstanding loans were to customers domiciled in Florida. Loans to customers domiciled in California, Illinois, New Jersey, Virginia and Arizona represented 6.1%, 4.8%, 4.8%, 3.3% and 3.2%, respectively. No other state represented borrowers with more than 3.0% of loans outstanding.
As of September 30, 2010, the Company had pledged real estate loans with unpaid principal balances of approximately $5.3 billion and a carrying amount of approximately $2.4 billion, representing lendable collateral value of approximately $2.6 billion, as security for FHLB advances.
BANKUNITED, INC. AND SUBSIDIARIES
NOTES TO CONDENSED CONSOLIDATED FINANCIAL STATEMENTS—UNAUDITED (Continued)
September 30, 2010
Note 4 Loans and Allowance for Loan Losses (Continued)
The allowance for loan losses reflects management's estimate of credit losses inherent in the loan portfolio at the balance sheet date and an amount management considers to be appropriate under the requirements of GAAP. The computation of the allowance for loan losses includes elements of judgment and high levels of subjectivity.
The following table summarizes changes in the allowance for loan losses for the nine months ended September 30, 2010 and the period ended September 30, 2009 (in thousands):
| | September 30, | ||||||||
|---|---|---|---|---|---|---|---|---|---|
| | 2010 | 2009 | |||||||
Balance at beginning of period | $ | 22,621 | $ | — | |||||
Provision for loan losses: | |||||||||
ACI loans | 26,973 | 2,288 | |||||||
Non-ACI loans | 15,565 | — | |||||||
Non-Covered Loans | 2,619 | — | |||||||
Total | 45,157 | 2,288 | |||||||
Charge-offs: | |||||||||
ACI loans | (9,652 | ) | — | ||||||
Non-ACI loans | (244 | ) | — | ||||||
Non-Covered Loans | (75 | ) | — | ||||||
Total | (9,971 | ) | — | ||||||
Recoveries | — | — | |||||||
Balance at end of period | $ | 57,807 | $ | 2,288 | |||||
At December 31, 2009, our evaluation of expected cash flows from ACI loans was indicative of credit deterioration in certain residential ACI loan pools and an allowance for loan losses of approximately $20.0 million was established related to those pools. As of September 30, 2010, our analysis evidenced a significant improvement in expected cash flows related to these ACI residential pools and a decrease in expected cash flows due to credit related assumptions related to ACI home equity loan pools. As a result, the allowance of $20.0 million established at December 31, 2009 related to ACI residential pools was reversed and a provision for loan losses of $9.4 million was recorded related to ACI home equity loan pools during the nine months ended September 30, 2010. In addition, for the nine months ended September 30, 2010, our analysis indicated a decrease in expected cash flows from certain commercial and commercial real estate loans evaluated individually for credit impairment, resulting in a provision for loan losses of $37.5 million related to these ACI loans. In the aggregate, the provision for losses related to ACI loans was $27.0 million for the nine months ended September 30, 2010.
Increases in the indemnification asset of $23.0 million and $1.6 million were reflected as a component of net loss on indemnification asset resulting from net recoveries in non-interest income for the nine months ended September 30, 2010 and the period ended September 30, 2009, respectively, related to the provision for loan losses on covered loans, including both ACI and non-ACI loans.
BANKUNITED, INC. AND SUBSIDIARIES
NOTES TO CONDENSED CONSOLIDATED FINANCIAL STATEMENTS—UNAUDITED (Continued)
September 30, 2010
Note 4 Loans and Allowance for Loan Losses (Continued)
The following tables present the Company's investment in impaired loans as of and for the nine months ended September 30, 2010 and period ended December 31, 2009 (in thousands):
| | September 30, 2010 | |||||||||||||||
|---|---|---|---|---|---|---|---|---|---|---|---|---|---|---|---|---|
| | Impaired loans in accrual status | Loans in non-accrual status | Specific allowance allocated to impaired loans | Average recorded investment in impaired loans | ||||||||||||
Covered loans: | ||||||||||||||||
1-4 single family residential | $ | — | $ | 13,895 | $ | — | $ | 187,006 | ||||||||
Home equity loans and lines of credit | 102,892 | 9,496 | 9,421 | 34,899 | ||||||||||||
Multi-family | 43,798 | 377 | 3,650 | 16,018 | ||||||||||||
Commercial real estate | 142,246 | 2,170 | 15,504 | 54,907 | ||||||||||||
Construction | — | — | — | 593 | ||||||||||||
Land | 16,752 | — | 5,923 | 7,963 | ||||||||||||
Commercial and industrial | 13,897 | 2,052 | 3,348 | 8,007 | ||||||||||||
Consumer | — | — | — | — | ||||||||||||
Subtotal | 319,585 | 27,990 | 37,846 | 309,393 | ||||||||||||
Non-covered loans: | ||||||||||||||||
Commercial | — | 34 | — | — | ||||||||||||
Total | $ | 319,585 | $ | 28,024 | $ | 37,846 | $ | 309,393 | ||||||||
| | December 31, 2009 | ||||||||||||||
|---|---|---|---|---|---|---|---|---|---|---|---|---|---|---|---|
| | Impaired loans in accrual status | Loans in non-accrual status | Specific allowance allocated to impaired loans | Average recorded investment in impaired loans | |||||||||||
Covered loans: | |||||||||||||||
1-4 single family residential | $ | 567,253 | $ | 14,495 | $ | 20,021 | $ | 13,295 | |||||||
Home equity loans and lines of credit | — | 2,726 | — | 1,418 | |||||||||||
Commercial | — | 150 | 30 | 37 | |||||||||||
Total | $ | 567,253 | $ | 17,371 | $ | 20,051 | $ | 14,750 | |||||||
Impaired loans in accrual status in the table above include 1-4 single family residential and home equity ACI loans accounted for in pools for which impairment is evaluated on the expected aggregate cash flows of the pools as well as commercial and commercial real estate loans evaluated individually for impairment based on estimates of future cash flows at the individual loan level. These loans are classified as accruing loans due to discount accretion. Discount accretion is being recorded as there continues to be an expectation of future cash flows from these loans and pools.
1-4 single family residential and home equity ACI loans that are contractually delinquent by more than 90 days and accounted for in pools that have not been identified as impaired and on which discount continues to be accreted totaled $0.8 billion and $1.2 billion at September 30, 2010 and December 31, 2009, respectively. The carrying amount of commercial and commercial real estate ACI loans that are contractually delinquent in excess of ninety days but not identified as impaired because there has been no significant deterioration in cash flows expected at acquisition totaled $86.9 million at September 30, 2010.
Substantially all of the nonaccrual loans consist of non-ACI loans that have been placed on non-accrual status.
BANKUNITED, INC. AND SUBSIDIARIES
NOTES TO CONDENSED CONSOLIDATED FINANCIAL STATEMENTS—UNAUDITED (Continued)
September 30, 2010
Note 4 Loans and Allowance for Loan Losses (Continued)
Interest income foregone on non-accrual loans, including interest income reversed when loans were placed on non-accrual status, totaled $752.2 thousand and $336.0 thousand for the nine months ended September 30, 2010 and period ended September 30, 2009, respectively.
Note 5 FDIC Indemnification Asset
Covered loans may be resolved through repayment, short sale of the underlying collateral, foreclosure or, for the non-residential portfolio, charge-offs, or sale of loans. For loans resolved through repayment, short sale or foreclosure, the difference between the payments received in satisfaction of the loans and the carrying value of the loans is recognized in the income statement line item "Income from resolution of covered assets, net." Losses from the resolution of covered loans increase the amount recoverable from the FDIC under the loss sharing agreements. Gains from the resolution of covered loans reduce the amount recoverable from the FDIC under the loss sharing agreements. These additions to or reductions in amounts recoverable from the FDIC related to the resolution of covered loans are recorded in the income statement line item "Net loss on indemnification asset resulting from net recoveries" and reflected as corresponding increases or decreases in the FDIC indemnification asset.
Changes in the FDIC indemnification asset for the nine months ended September 30, 2010 and the period ended September 30, 2009 were as follows (in thousands):
| | September 30, 2010 | September 30, 2009 | ||||||
|---|---|---|---|---|---|---|---|---|
Balance at beginning of period | $ | 3,279,165 | $ | 3,442,890 | ||||
Accretion | 116,915 | 89,449 | ||||||
Reduction for claims filed | (628,089 | ) | (68,975 | ) | ||||
Loss on indemnification asset resulting from net recoveries | (44,932 | ) | (51,123 | ) | ||||
Balance at end of period | $ | 2,723,059 | $ | 3,412,241 | ||||
The Company recognizes additional covered losses or recoveries on FDIC indemnified assets through earnings. The following table summarizes the pre-tax components of the gains and losses
BANKUNITED, INC. AND SUBSIDIARIES
NOTES TO CONDENSED CONSOLIDATED FINANCIAL STATEMENTS—UNAUDITED (Continued)
September 30, 2010
Note 5 FDIC Indemnification Asset (Continued)
associated with the resolution of FDIC indemnified assets, plus the provision for loan losses on non-covered loans, for the nine months ended September 30, 2010 (in thousands):
| | September 30, 2010 | ||||||||||
|---|---|---|---|---|---|---|---|---|---|---|---|
| | Transaction income (loss) | Net loss on indemnification asset from net recoveries | Net impact on pre-tax earnings | ||||||||
Provision for losses on covered loans | $ | (42,538 | ) | $ | 22,979 | $ | (19,559 | ) | |||
Provision for losses on non-covered loans | (2,619 | ) | — | (2,619 | ) | ||||||
Total provision for loan losses | (45,157 | ) | 22,979 | (22,178 | ) | ||||||
Income from resolution of covered assets, net | 112,777 | (76,978 | ) | 35,799 | |||||||
Gain (loss) on sale of OREO | 2,270 | ||||||||||
Loss due to impairment of OREO | (12,164 | ) | |||||||||
| (9,894 | ) | 9,067 | (827 | ) | |||||||
Total | $ | 57,726 | $ | (44,932 | ) | $ | 12,794 | ||||
For the period ended September 30, 2009, income from resolution of covered assets, net totaled $79.6 million, offset by an FDIC indemnification loss of $59.7 million. The provision for losses on covered loans totaled $2.3 million and impairment charges on OREO totaled $8.7 million for the period ended September 30, 2009. These transactions were offset by FDIC indemnification income of $8.6 million.
For the nine months ended September 30, 2010 and the period ended September 30, 2009 non-interest expense includes approximately $41.6 million and $12.2$12.0 million, respectively, of disbursements subject to reimbursement under the loss sharing agreements. For those same periods, $30.1 million and $5.5$4.0 million, respectively, of those disbursements were submitted to the FDIC for reimbursement at the 80% level. As of September 30, 2010, $27.3 million of those disbursements remain to be submitted for reimbursement from the FDIC in future periods.
Note 6 Other Real Estate Owned
An analysis of other real estate owned ("OREO") for the nine months ended September 30, 2010 and the period ended September 30, 2009 follows (in thousands):
| | September 30, 2010 | September 30, 2009 | ||||||
|---|---|---|---|---|---|---|---|---|
Balance at beginning of period | $ | 120,110 | $ | 177,679 | ||||
Transfers from loan portfolio | 283,220 | 49,431 | ||||||
Sales | (194,903 | ) | (122,302 | ) | ||||
Impairment | (12,164 | ) | (8,716 | ) | ||||
(Decrease) Increase from resolution of covered loans | (1,977 | ) | 19,282 | |||||
Balance at end of period | $ | 194,286 | $ | 115,374 | ||||
BANKUNITED, INC. AND SUBSIDIARIES
NOTES TO CONDENSED CONSOLIDATED FINANCIAL STATEMENTS—UNAUDITED (Continued)
September 30, 2010
Note 6 Other Real Estate Owned (Continued)
All of the Company's other real estate owned is covered under the loss sharing agreements.
Note 7 Regulatory Capital
BankUnited's regulatory capital levels as of September 30, 2010 and December 31, 2009 were as follows (dollars in thousands):
| | September 30, 2010 | ||||||||||||||||||
|---|---|---|---|---|---|---|---|---|---|---|---|---|---|---|---|---|---|---|---|
| | Actual | Required to be considered well capitalized | Required to be considered adequately capitalized | ||||||||||||||||
| | Ratio | Amount | Ratio | Amount | Ratio | Amount | |||||||||||||
Tier 1 leverage ratio(1) | 10.09 | % | $ | 1,108,019 | 8.00 | % | $ | 878,509 | 8.00 | % | $ | 878,509 | |||||||
Tier 1 risk-based capital ratio | 42.46 | % | $ | 1,108,019 | 6.00 | % | $ | 156,574 | 4.00 | % | $ | 104,382 | |||||||
Total risk-based capital ratio | 43.27 | % | $ | 1,129,295 | 10.00 | % | $ | 260,988 | 8.00 | % | $ | 208,790 | |||||||
| | December 31, 2009 | ||||||||||||||||||
|---|---|---|---|---|---|---|---|---|---|---|---|---|---|---|---|---|---|---|---|
| | Actual | Required to be considered well capitalized | Required to be considered adequately capitalized | ||||||||||||||||
| | Ratio | Amount | Ratio | Amount | Ratio | Amount | |||||||||||||
Tier 1 leverage ratio(1) | 8.78 | % | $ | 966,749 | 8.00 | % | $ | 880,865 | 8.00 | % | $ | 880,865 | |||||||
Tier 1 risk-based capital ratio | 40.42 | % | $ | 966,749 | 6.00 | % | $ | 143,506 | 4.00 | % | $ | 95,670 | |||||||
Total risk-based capital ratio | 40.55 | % | $ | 969,716 | 10.00 | % | $ | 239,141 | 8.00 | % | $ | 191,313 | |||||||
Note 8 Derivatives and Hedging Activities
The Company uses interest rate swaps to manage interest rate risk related to certain products and instruments used to finance its operations that expose the Company to variability in cash flows due to changes in interest rates. These instruments include FHLB advances and certificates of deposits with maturities of one year.
Management believes it is prudent to limit the variability of its interest payments. To meet this objective, management enters into LIBOR-based interest rate swaps to manage fluctuations in cash flows resulting from interest rate risk attributable to changes in the benchmark interest rate of LIBOR.
In addition to using derivative instruments as an interest rate risk management tool, the Company enters into interest rate swaps to help certain of its borrowers manage their exposure to interest rate fluctuations. To mitigate interest rate risk associated with these derivative contracts, the Company enters into offsetting derivative contract positions with financial institution counterparties. The Company manages credit risk, or the risk of default by its borrowers, though its normal loan underwriting and credit monitoring policies and procedures. These interest rate swap contracts are not
BANKUNITED, INC. AND SUBSIDIARIES
NOTES TO CONDENSED CONSOLIDATED FINANCIAL STATEMENTS—UNAUDITED (Continued)
September 30, 2010
Note 8 Derivatives and Hedging Activities (Continued)
designated as hedging instruments; therefore, changes in the fair value of these derivatives are recognized immediately in earnings.
The following tables set forth certain information concerning the Company's derivative financial instruments and related hedged items at September 30, 2010 and December 31, 2009 (dollars in thousands):
| | September 30, 2010 | |||||||||||||||||||||
|---|---|---|---|---|---|---|---|---|---|---|---|---|---|---|---|---|---|---|---|---|---|---|
| | | | | | | | Fair value | |||||||||||||||
| | | | | Remaining life in years | Notional amount | Balance sheet location | ||||||||||||||||
| | Hedged item | Pay rate | Receive rate | Gain | Loss | |||||||||||||||||
Derivatives designated as | ||||||||||||||||||||||
cash flow hedges | ||||||||||||||||||||||
Pay-fixed interest rate swaps | Variability of interest cash flows on certificates of deposit | 3.11% | 12-Month Libor | 5.1 | $ | 225,000 | Other liabilities | $ | — | $ | (21,281 | ) | ||||||||||
Purchased interest rate forward-starting swaps: | Variability of interest cash flows on FHLB advances | 3.42% - 3.76% | 3-Month Libor | 4.6 - 6.5 | 405,000 | Other liabilities | — | (46,459 | ) | |||||||||||||
Derivatives not designated as hedges | ||||||||||||||||||||||
Pay-fixed interest rate swaps | 3.68% | 69% of 1-Month Libor | 5.0 | 9,404 | Other liabilities | — | (224 | ) | ||||||||||||||
Pay-variable interest rate swaps | 69% of 1-Month Libor | 3.68% | 5.0 | 9,404 | Other assets | 224 | — | |||||||||||||||
Total | $ | 648,808 | $ | 224 | $ | (67,964 | ) | |||||||||||||||
| | December 31, 2009 | |||||||||||||||||||||
|---|---|---|---|---|---|---|---|---|---|---|---|---|---|---|---|---|---|---|---|---|---|---|
| | | | | | | | Fair value | |||||||||||||||
| | | | | Remaining life in years | Notional amount | Balance sheet location | ||||||||||||||||
| | Hedged item | Pay rate | Receive rate | Gain | Loss | |||||||||||||||||
Derivatives Designated as | ||||||||||||||||||||||
Cash Flow Hedges | ||||||||||||||||||||||
Pay-fixed interest rate swaps | Variability of interest cash flows on certificates of deposit | 3.11% | 12-Month Libor | 5.9 | $ | 225,000 | Other assets | $ | 1,517 | $ | — | |||||||||||
Purchased interest rate forward-starting swaps: | Variability of interest cash flows on FHLB advances | 3.42% - 3.76% | 3-Month Libor | 5.0 - 7.0 | 405,000 | Other liabilities | — | (4,016 | ) | |||||||||||||
Total | $ | 630,000 | $ | 1,517 | $ | (4,016 | ) | |||||||||||||||
Interest expense for the nine months ended September 30, 2010 includes $279.1 thousand of losses due to hedge ineffectiveness arising from differences between the critical terms of interest rate swaps and the hedged debt obligations. There were no losses due to hedge ineffectiveness for the period ended September 30, 2009.
Changes in the fair value of interest rate swaps designated as hedging instruments of the variability of cash flows associated with floating-rate debt obligations are reported in accumulated other comprehensive income ("AOCI"). These amounts subsequently are reclassified into interest expense as a yield adjustment in the same period in which the related interest on the floating-rate debt obligations affects earnings. Effective hedge results initially recorded in AOCI and subsequently reclassified into earnings increased interest expense by $8.9 million in the nine months ended September 30, 2010. There was no impact on earnings for the period ended September 30, 2009.
BANKUNITED, INC. AND SUBSIDIARIES
NOTES TO CONDENSED CONSOLIDATED FINANCIAL STATEMENTS—UNAUDITED (Continued)
September 30, 2010
Note 8 Derivatives and Hedging Activities (Continued)
During the nine months ended September 30, 2010 and the period ended September 30, 2009, no derivative positions were discontinued, and none of the gains and losses reported in AOCI were reclassified into earnings as a result of the discontinuance of cash flow hedges or because of the early extinguishment of debt.
Note 9 Equity Awards
Profits Interest Units
BUFH has a class of authorized membership interests identified as Profits Interest Units ("PIU"). PIU are only issued to management members of the Company who own common units of BUFH. As such, the related liability and expense are recorded in the consolidated financial statements of the Company. There are two types of PIU: Time-Based PIU and IRR-Based PIU. The holders of PIU have no voting rights with respect to their PIU but have certain rights with respect to profits of the Company and distributions of profits from the Company. The holders of PIU are not required to make any capital contribution to the Company in exchange for their PIU. Furthermore, the holders of PIU are entitled to receive priority distribution catch-up payments in respect of Time-Based PIU that have become vested and which did not participate in earlier interim distributions of profits.
The Company has classified these equity awards as a liability to BUFH in the accompanying condensed consolidated balance sheet. At September 30, 2010, the estimated fair value of the IRR-Based PIU was $63.9 million. Included in compensation expense is approximately $20.0 million and $4.3 million associated with the Time-based PIU for the nine months ended September 30, 2010 and the period ended September 30, 2009, respectively.
The following table summarizes information about Time-Based and IRR-Based PIU at September 30, 2010:
| | Outstanding | |||||||
|---|---|---|---|---|---|---|---|---|
| | Number of units awarded | Fair value per unit | ||||||
Time-based PIU | 51,651.03 | $ | 1,238.25 | |||||
IRR-based PIU | 51,651.03 | $ | 1,238.25 | |||||
Total awards | 103,302.06 | |||||||
Total fair value | $ | 127,913,776 | ||||||
Cumulative expense through September 30, 2010 | $ | 28,780,435 | ||||||
Unrecognized compensation expense | $ | 99,133,341 | ||||||
Warrant to FDIC
In connection with the Acquisition of BankUnited, FSB, BUFH issued a warrant to the FDIC. The related liability and expense are recorded in the condensed consolidated financial statements of the Company. The warrant becomes exercisable upon the occurrence of an IPO or exit event in which the total tangible equity value arising from the IPO or exit event exceeds a threshold value. At September 30, 2010, the warrant has a remaining contractual term of 8.64 years.
BANKUNITED, INC. AND SUBSIDIARIES
NOTES TO CONDENSED CONSOLIDATED FINANCIAL STATEMENTS—UNAUDITED (Continued)
September 30, 2010
Note 9 Equity Awards (Continued)
The warrant is redeemable by BUFH or the Company for cash after it becomes exercisable at a redemption price equal to the warrant value. The Company has classified this warrant as a liability to BUFH in the accompanying condensed consolidated balance sheet. Included in other liabilities is approximately $7.7 million and $3.2 million at September 30, 2010 and December 31, 2009, respectively, representing the fair value of this instrument. The Company has recognized expense of $4.5 million and $0.7 million related to the increase in fair value of this instrument for the nine months ended September 30, 2010 and the period ended September 30, 2009, respectively.
See Note 12, Subsequent Events, for additional discussion of the IRR-Based PIU and the warrant issued to the FDIC.
Note 10 Fair Value Measurements
The Company categorizes its assets and liabilities measured at fair value in three levels within a fair value hierarchy, based on the markets in which the assets and liabilities are traded and the reliability and transparency of the assumptions used to determine fair value. These levels are as follows:
Level 1—Assets or liabilities for which the identical item is traded on an active exchange, such as publicly-traded instruments or futures contracts.
Level 2—Assets and liabilities valued based on observable market data for similar instruments.
Level 3—Assets or liabilities for which significant valuation assumptions are not readily observable in the market. These instruments are valued based on the best available data, some of which is internally-developed, and considering risk premiums that a market participant would require. Valuation techniques include use of option pricing models, discounted cash flow models and similar techniques.
In instances where there is limited or no observable market data, fair value measurements for assets and liabilities are based primarily upon the Company's own estimates or a combination of such estimates and independent vendor or broker pricing. When determining fair value measurements for assets and liabilities and the related level within the fair value hierarchy in which those measurements should be categorized, the Company considers the principal or most advantageous market in which it would transact and considers assumptions that market participants would use when pricing the asset or liability. When possible, the Company looks to active and observable markets to price identical assets or liabilities and when identical assets and liabilities are not traded in active markets, the Company looks to observable market data for similar assets and liabilities. It is the Company's policy to maximize the use of observable inputs and minimize the use of unobservable inputs. Unobservable inputs are only used to measure fair value to the extent that observable inputs are not available. The need to use unobservable inputs generally results from the lack of market liquidity resulting in diminished observability of both actual trades and assumptions that would otherwise be available to value these instruments, or the lack of observable indicators of the value of underlying collateral. Although third party price indications may be available for a security, limited trading activity would make it difficult to support the observability of these quotations.
The following is a description of the methodologies used to estimate the fair values of financial instruments measured at fair value on a recurring basis, and the level within the fair value hierarchy in which those measurements are typically classified.
BANKUNITED, INC. AND SUBSIDIARIES
NOTES TO CONDENSED CONSOLIDATED FINANCIAL STATEMENTS—UNAUDITED (Continued)
September 30, 2010
Note 10 Fair Value Measurements (Continued)
Assets and Liabilities Measured at Fair Value on a Recurring Basis:
Investment securities available for sale—When available, fair value measurements are based on quoted prices in active markets and as such, are classified within Level 1. These securities typically include U.S. Government treasury or agency securities, preferred stock of U.S. Government agencies and mutual funds. If quoted market prices are not available, fair values are estimated using quoted prices of securities with similar characteristics, discounted cash flows or other pricing models. Investment securities available for sale that the Company classifies within Level 2 include U.S. Government Agency mortgage-backed securities and collateralized mortgage obligations, preferred stock of other issuers, nonmortgage asset backed securities, state and municipal obligations and small business administration securities. Investment securities available for sale classified within Level 3 of the fair value hierarchy include private label mortgage pass-through certificates and collateralized mortgage obligations, certain nonmortgage asset backed securities and other debt securities for which fair value estimation requires the use of unobservable inputs. The Company values these securities using third party proprietary pricing models that incorporate observable and unobservable inputs.
Derivative financial instruments—Interest rate swaps are predominantly traded in over-the-counter markets and, as such, values are determined using widely accepted discounted cash flow models, or Level 2 measurements. These discounted cash flow models use projections of future cash payments and receipts that are discounted at mid-market rates. These valuations are adjusted for credit risk at the reporting date, considering collateral posted and the impact of master netting agreements.
Equity awards classified as liabilities—The estimated fair value of equity awards is derived primarily using the Black-Sholes option pricing model. Since the Company's Common Stock is not publicly traded on an exchange, significant inputs to the model are not observable, resulting in Level 3 classification.
BANKUNITED, INC. AND SUBSIDIARIES
NOTES TO CONDENSED CONSOLIDATED FINANCIAL STATEMENTS—UNAUDITED (Continued)
September 30, 2010
Note 10 Fair Value Measurements (Continued)
The following table presents financial instruments measured at fair value on a recurring basis as of September 30, 2010 and December 31, 2009 (in thousands):
| | September 30, 2010 | |||||||||||||||
|---|---|---|---|---|---|---|---|---|---|---|---|---|---|---|---|---|
| | Level 1 | Level 2 | Level 3 | Total | ||||||||||||
Investment Securities Available for Sale: | ||||||||||||||||
U.S. Government agency and sponsored enterprise residential mortgage-backed securities | $ | — | $ | 1,368,239 | $ | — | $ | 1,368,239 | ||||||||
Other residential collateralized mortgage obligations | — | — | 706,280 | 706,280 | ||||||||||||
Residential mortgage pass-through certificates | — | — | 364,539 | 364,539 | ||||||||||||
Nonmortgage asset backed securities | — | 295,126 | 132,805 | 427,931 | ||||||||||||
Mutual funds and preferred stocks | 25,832 | 98,449 | — | 124,281 | ||||||||||||
State and municipal obligations | — | 23,428 | 250 | 23,678 | ||||||||||||
Small Business Administration securities | — | 66,657 | — | 66,657 | ||||||||||||
Other debt securities | — | 2,857 | 4,042 | 6,899 | ||||||||||||
Derivative assets | — | 224 | — | 224 | ||||||||||||
Total assets at fair value | $ | 25,832 | $ | 1,854,980 | $ | 1,207,916 | $ | 3,088,728 | ||||||||
Equity awards classified as liabilities | $ | — | $ | — | $ | 36,451 | $ | 36,451 | ||||||||
Derivative liabilities | — | 67,964 | — | 67,964 | ||||||||||||
Total liabilities at fair value | $ | — | $ | 67,964 | $ | 36,451 | $ | 104,415 | ||||||||
| | December 31, 2009 | |||||||||||||||
|---|---|---|---|---|---|---|---|---|---|---|---|---|---|---|---|---|
| | Level 1 | Level 2 | Level 3 | Total | ||||||||||||
Investment Securities Available for Sale: | ||||||||||||||||
U.S. Treasury securities | $ | 10,072 | $ | — | $ | — | $ | 10,072 | ||||||||
U.S. Government agency and sponsored enterprise residential mortgage-backed securities | — | 1,288,643 | — | 1,288,643 | ||||||||||||
Other residential collateralized mortgage obligations | — | — | 506,839 | 506,839 | ||||||||||||
Residential mortgage pass-through certificates | — | — | 364,672 | 364,672 | ||||||||||||
Mutual funds and preferred stocks | 17,646 | 25,877 | — | 43,523 | ||||||||||||
State and Municipal obligations | — | 23,106 | 250 | 23,356 | ||||||||||||
Other debt securities | — | 2,760 | 3,278 | 6,038 | ||||||||||||
Derivative assets | — | 1,517 | — | 1,517 | ||||||||||||
Total assets at fair value | $ | 27,718 | $ | 1,341,903 | $ | 875,039 | $ | 2,244,660 | ||||||||
Equity awards classified as liabilities | $ | — | $ | — | $ | 11,961 | $ | 11,961 | ||||||||
Derivative liabilities | — | 4,016 | — | 4,016 | ||||||||||||
Total liabilities at fair value | $ | — | $ | 4,016 | $ | 11,961 | $ | 15,977 | ||||||||
The following table includes changes in Level 3 financial instruments that are measured at fair value on a recurring basis for the nine months ended September 30, 2010 and the period ended September 30, 2009. Level 3 financial instruments typically include unobservable components, but may
BANKUNITED, INC. AND SUBSIDIARIES
NOTES TO CONDENSED CONSOLIDATED FINANCIAL STATEMENTS—UNAUDITED (Continued)
September 30, 2010
Note 10 Fair Value Measurements (Continued)
also include some observable components that may be validated to external sources. The gains or (losses) in the following table may include changes to fair value due in part to observable factors that may be part of the valuation methodology (in thousands):
| | September 30, 2010 | |||||||||||||||||||
|---|---|---|---|---|---|---|---|---|---|---|---|---|---|---|---|---|---|---|---|---|
| | Other residential collateralized mortgage obligations | Residential mortgage pass-thru certificates | State and municipal obligations | Other debt securities | Nonmortgage asset backed securities | Equity awards | ||||||||||||||
Balance at December 31, 2009 | $ | 506,839 | $ | 364,672 | $ | 250 | $ | 3,278 | $ | — | $ | (11,961 | ) | |||||||
Net gains (losses) for the period included in: | ||||||||||||||||||||
Net income | — | — | — | — | — | (24,490 | ) | |||||||||||||
Other comprehensive income | 16,520 | 18,432 | — | 740 | 675 | — | ||||||||||||||
Reclassifications | (30,000 | ) | — | — | — | 30,000 | — | |||||||||||||
Purchases, sales and settlements, net | 212,921 | (18,565 | ) | — | 24 | 102,130 | — | |||||||||||||
Balance at September 30, 2010 | $ | 706,280 | $ | 364,539 | $ | 250 | $ | 4,042 | $ | 132,805 | $ | (36,451 | ) | |||||||
| | September 30, 2009 | |||||||||||||||||||
|---|---|---|---|---|---|---|---|---|---|---|---|---|---|---|---|---|---|---|---|---|
| | Other residential collateralized mortgage obligations | Residential mortgages pass-thru certificates | State and municipal Obligations | Other debt securities | Nonmortgage asset backed securities | Equity awards | ||||||||||||||
Balance at May 22, 2009 | $ | 1,785 | $ | 230,092 | $ | 250 | $ | 1,676 | $ | — | $ | (1,464 | ) | |||||||
Net gains (losses) for the period included in: | ||||||||||||||||||||
Net income | — | — | — | — | — | (4,963 | ) | |||||||||||||
Other comprehensive income | (9,105 | ) | 35,836 | — | 996 | — | — | |||||||||||||
Purchases, sales and settlements, net | 220,031 | (23,738 | ) | — | 411 | — | — | |||||||||||||
Balance at September 30, 2009 | $ | 212,711 | $ | 242,190 | $ | 250 | $ | 3,083 | $ | — | $ | (6,427 | ) | |||||||
Financial Instruments Measured at Fair Value on a Non-Recurring Basis:
The measurement of impairment of collateral dependent impaired loans is based on the fair value of the underlying collateral. The carrying amount of OREO is initially measured based on the fair value of the real estate owned and subsequently carried at the lower of cost or estimated fair value. Fair value of the loan collateral or real estate owned property is generally estimated using both market and income approach valuation techniques incorporating observable market data to formulate an opinion of the estimated fair value. When current appraisals are not available, we use our judgment
BANKUNITED, INC. AND SUBSIDIARIES
NOTES TO CONDENSED CONSOLIDATED FINANCIAL STATEMENTS—UNAUDITED (Continued)
September 30, 2010
Note 10 Fair Value Measurements (Continued)
regarding changes in market conditions, based on observable market inputs, to adjust the latest appraised value available. As a result, the estimated fair value is classified within level 3 of the fair value hierarchy. As of September 30, 2010 and December 31, 2009, the Company had $194.3 million and $120.1 million, respectively, of OREO and did not have any collateral dependent impaired loans. Impairment write-downs on OREO for the nine months ended September 30, 2010 and the period ended September 30, 2009 totaled $12.2 million and $8.7 million, respectively.
Goodwill, other intangible assets and the FDIC indemnification asset were initially recorded at estimated fair value and are reviewed for impairment annually, or more frequently if events or changes in circumstances indicate the carrying amount maybe impaired. Any adjustments to fair value resulting from impairment incorporate significant assumptions that are not observable in the market. The resulting fair value measurements are therefore classified within level 3 of the fair value hierarchy. No such fair value measurements were recorded during the nine months ended September 30, 2010 or the period ended September 30, 2009.
The following table presents the carrying value and fair value of financial instruments as of September 30, 2010 and December 31, 2009 (in thousands):
| | September 30, 2010 | December 31, 2009 | |||||||||||||
|---|---|---|---|---|---|---|---|---|---|---|---|---|---|---|---|
| | Carrying value | Fair value | Carrying value | Fair value | |||||||||||
Assets: | |||||||||||||||
Cash and cash equivalents | $ | 494,586 | $ | 494,586 | $ | 356,215 | $ | 356,215 | |||||||
Investment securities available for sale | 3,088,504 | 3,088,504 | 2,243,143 | 2,243,143 | |||||||||||
Federal Home Loan Bank stock | 225,902 | 225,902 | 243,334 | 243,334 | |||||||||||
Loans held for sale | 534 | 534 | — | — | |||||||||||
Loans: | |||||||||||||||
Covered | 3,740,683 | 3,794,809 | 4,465,591 | 5,138,549 | |||||||||||
Non-covered | 338,551 | 343,864 | 123,307 | 128,778 | |||||||||||
FDIC Indemnification asset | 2,723,059 | 2,708,171 | 3,279,165 | 3,279,165 | |||||||||||
Income tax receivable | 48,359 | 48,359 | — | — | |||||||||||
Accrued interest receivable | 13,908 | 13,908 | 9,591 | 9,591 | |||||||||||
Derivative assets | 224 | 224 | 1,517 | 1,517 | |||||||||||
Liabilities: | |||||||||||||||
Deposits | $ | 7,300,460 | $ | 7,333,718 | $ | 7,666,775 | $ | 7,690,422 | |||||||
Securities sold under agreements to repurchase | 386 | 386 | 2,972 | 2,972 | |||||||||||
Federal Home Loan Bank advances | 2,260,006 | 2,384,680 | 2,079,051 | 2,114,431 | |||||||||||
Due to FDIC | 111,056 | 111,056 | 114,006 | 114,006 | |||||||||||
Accrued interest payable | 9,557 | 9,557 | 12,561 | 12,561 | |||||||||||
Income taxes payable | — | — | 82,701 | 82,701 | |||||||||||
Advance payments by borrowers for taxes and insurance | 55,896 | 55,896 | 31,237 | 31,237 | |||||||||||
Equity awards classified as liabilities | 36,451 | 36,451 | 11,961 | 11,961 | |||||||||||
Derivative liabilities | 67,964 | 67,964 | 4,016 | 4,016 | |||||||||||
BANKUNITED, INC. AND SUBSIDIARIES
NOTES TO CONDENSED CONSOLIDATED FINANCIAL STATEMENTS—UNAUDITED (Continued)
September 30, 2010
Note 10 Fair Value Measurements (Continued)
The following methods and assumptions were used to estimate the fair value of each class of financial instruments:
Certain financial instruments are carried at amounts that approximate fair value due to their short-term nature and generally negligible credit risk. These financial instruments include cash and cash equivalents, income tax receivable, accrued interest receivable, securities sold under agreements to repurchase, due to FDIC, accrued interest payable, accrued income taxes, and advance payments by borrowers for taxes and insurance.
Investment securities available for sale:
Fair value measurements are based upon quoted market prices for identical assets when available. If quoted market prices are not available, fair values are measured using quoted prices of securities with similar characteristics, discounted cash flows or other pricing models.
Federal Home Loan Bank stock:
There is no market for this stock, which is subject to redemption by the FHLB under certain circumstances. The stock is carried at par, which has historically represented the redemption price and is therefore considered to approximate fair value. FHLB stock is evaluated quarterly for potential impairment.
Covered loans:
Fair values are estimated based on a discounted cash flow analysis. Estimates of future cash flows incorporate various factors including the type of loan and related collateral, classification status, whether the interest rate is fixed or variable, term of loan and whether or not the loan is amortizing. The fair values of loans accounted for in pools are estimated on a pool basis. Other loans may be grouped based on risk characteristics and fair value estimated in the aggregate when applying the discounted cash flow valuation techniques. Discount rates are based on current market rates for new originations of comparable loans and include adjustments for liquidity concerns. Estimated credit losses are encompassed in projected future cash flows, therefore the discount rate does not include a factor for credit losses.
Non-covered loans:
Fair values are estimated using a discounted cash flow analysis with a discount rate based on interest rates currently being offered for loans with similar terms to borrowers of similar credit quality. The allowance for loan losses is considered a reasonable estimate of the required adjustment to fair value to reflect the impact of credit risk. The fair value of loans held for sale is based on secondary market pricing and approximated carrying value at September 30, 2010.
FDIC indemnification asset:
The fair value of the FDIC indemnification asset has been estimated using a discounted cash flow technique incorporating assumptions about the timing and amount of future projected cash payments from the FDIC related to the resolution of covered assets. The discount rate was determined by
BANKUNITED, INC. AND SUBSIDIARIES
NOTES TO CONDENSED CONSOLIDATED FINANCIAL STATEMENTS—UNAUDITED (Continued)
September 30, 2010
Note 10 Fair Value Measurements (Continued)
adjusting the risk free rate to incorporate credit risk, uncertainty in the estimate of future cash flows and illiquidity.
Deposits:
The fair value of demand deposits, savings accounts and money market deposits is the amount payable on demand at the reporting date. The fair value of time deposits is estimated using discounted cash flow analysis based on rates currently offered for deposits of similar remaining maturities.
FHLB advances:
The fair value of the borrowings is estimated by discounting the future cash flows using the current rate at which similar borrowings with similar remaining maturities could be obtained.
Equity awards:
Equity awards are valued using Black-Scholes and binomial option pricing models incorporating assumptions about the remaining term of the awards and the value and volatility of the Company's common stock.
Derivative assets and liabilities:
Derivative assets and liabilities consist of interest rate swaps that are valued using discounted cash flow models.
Note 11 Earnings per Share
Basic earnings per common share are computed by dividing income available to common shareholders by the weighted-average number of common shares outstanding during each period. Diluted earnings per common share are based on the weighted-average number of common shares outstanding during the period, plus the dilutive effect of securities or other contracts to issue common shares ("Common Stock Equivalents"). CSE are excluded from the computation of earnings per common share in periods in which they have an anti-dilutive effect. Outstanding stock options are potentially dilutive securities, but are not included in the calculation of diluted earnings per common share because to do so would be anti-dilutive. Shares that the Company may be obligated to issue pursuant to BUFH's PIU and the FDIC warrant represent contingently issuable shares and are not included in the calculation of diluted earnings per common share because the conditions necessary to issue the shares have not been satisfied as of the end of the reporting period. Therefore, at September 30, 2010 and 2009, the weighted average number of shares used to compute basic and diluted earnings per common share is the same.
Note 12 Subsequent Events
Subsequent events have been evaluated through the date that the condensed consolidated financial statements were issued.
BANKUNITED, INC. AND SUBSIDIARIES
NOTES TO CONDENSED CONSOLIDATED FINANCIAL STATEMENTS—UNAUDITED (Continued)
September 30, 2010
Note 12 Subsequent Events (Continued)
Settlement of dispute with the FDIC:
In October 2010, the Company reached a settlement with the FDIC regarding a dispute related to the purchase price assigned to certain investment securities acquired in the Acquisition of BankUnited FSB. Under the terms of the settlement, the Company received $24.1 million from the FDIC. The Company will recognize the results of this settlement in earnings during the quarter ending December 31, 2010.
Minimum guaranteed value of the FDIC warrant:
In October 2010, the Company and the FDIC agreed to amend the warrant issued to the FDIC to guarantee a minimum value to the FDIC of $25.0 million. The Company will recognize the difference between the recorded liability of $7.7 million at September 30, 2010 and the guaranteed minimum value of the warrant in earnings during the quarter ending December 31, 2010.
Dividends declared:
In October 2010, the Company declared a dividend payable to BUFH in the amount of $6.0 million. In December 2010, we declared a quarterly dividend of $14.0 million.
IRR-Based PIU:
In October 2010, the Board of Directors of BUFH approved, contingent upon consummation of an IPO, the vesting of all issued and outstanding IRR-Based PIU immediately prior to the IPO.
Sale of Covered Loans
Under its loss sharing agreement with the FDIC, BankUnited is permitted to sell up to 2.5% of the unpaid principal balance of the residential and commercial loan portfolio acquired in the Acquisition of BankUnited FSB, with certain restrictions, on an annual basis without prior consent from the FDIC. In November 2010, BankUnited entered into an agreement to sell covered loans with an unpaid principal balance of approximately $272.2 million and a carrying amount of approximately $143.8 million for a price of approximately $66.7 million. A loss of approximately $77.1 million will be incurred on the sale, partly mitigated by an increase in the FDIC indemnification asset of approximately $61.7 million.
Stock Split:
The Board of Directors authorized a 10-for-1 split of the Company's outstanding common shares effective January 10, 2011. Stockholder's equity has been retroactively adjusted to give effect to the stock split for all periods presented by reclassifying from paid-in capital to common stock the par value of the additional shares issued. All share and per share data have been retroactively restated for all periods presented to reflect this stock split.
Report of Independent Registered Public Accounting Firm
The Board of Directors and Stockholder
BankUnited, Inc.:
We have audited the accompanying consolidated balance sheet of BankUnited, Inc. and subsidiaries (the Company) as of December 31, 2009, and the related consolidated statements of income, stockholder's equity and comprehensive income, and cash flows for the period from April 28, 2009 (date of inception) through December 31, 2009. These consolidated financial statements are the responsibility of the Company's management. Our responsibility is to express an opinion on these consolidated financial statements based on our audit.
We conducted our audit in accordance with the standards of the Public Company Accounting Oversight Board (United States). Those standards require that we plan and perform the audit to obtain reasonable assurance about whether the financial statements are free of material misstatement. An audit includes examining, on a test basis, evidence supporting the amounts and disclosures in the financial statements. An audit also includes assessing the accounting principles used and significant estimates made by management, as well as evaluating the overall financial statement presentation. We believe that our audit provides a reasonable basis for our opinion.
In our opinion, the consolidated financial statements referred to above present fairly, in all material respects, the financial position of BankUnited, Inc. and subsidiaries as of December 31, 2009, and the results of their operations and their cash flows for the period from April 28, 2009 (date of inception) through December 31, 2009, in conformity with U.S. generally accepted accounting principles.
/s/ KPMG LLP
October 25, 2010, except for Note 22,
as to which the date is January 10, 2011
Miami, Florida
Certified Public Accountants
BANKUNITED, INC. AND SUBSIDIARIES
CONSOLIDATED BALANCE SHEET
December 31, 2009
(Dollars in thousands, except per share amounts)
ASSETS | ||||||
Cash and due from banks | $ | 60,593 | ||||
Due from Federal Reserve Bank | 290,192 | |||||
Federal funds sold | 5,430 | |||||
Cash and cash equivalents | 356,215 | |||||
Investment securities available for sale, at fair value (including covered securities of $275,726) | 2,243,143 | |||||
Federal Home Loan Bank stock | 243,334 | |||||
Loans held in portfolio, net of discounts, premiums and deferred costs (including covered loans of $4,486,878) | 4,611,519 | |||||
Allowance for loan losses | (22,621 | ) | ||||
Loans held in portfolio, net | 4,588,898 | |||||
Federal Deposit Insurance Corporation ("FDIC") indemnification asset, net | 3,279,165 | |||||
Bank owned life insurance | 132,330 | |||||
Other real estate owned, covered by loss sharing agreements | 120,110 | |||||
Deferred tax asset, net | 22,533 | |||||
Goodwill and other intangible assets, net | 60,981 | |||||
Other assets | 83,252 | |||||
Total assets | $ | 11,129,961 | ||||
LIABILITIES AND STOCKHOLDER'S EQUITY | ||||||
Liabilities: | ||||||
Demand deposits: | ||||||
Non-interest bearing | $ | 332,941 | ||||
Interest bearing | 222,052 | |||||
Savings and money market | 2,592,642 | |||||
Time Deposits | 4,519,140 | |||||
Total deposits | 7,666,775 | |||||
Securities sold under agreements to repurchase | 2,972 | |||||
Federal Home Loan Bank advances | 2,079,051 | |||||
Due to FDIC | 114,006 | |||||
Income taxes payable | 82,701 | |||||
Advance payments by borrowers for taxes and insurance | 31,237 | |||||
Other liabilities | 58,959 | |||||
Total liabilities | 10,035,701 | |||||
Commitments and contingencies | ||||||
Stockholder's equity: | ||||||
Common Stock, par value $0.01 per share: | ||||||
Authorized, 110,000,000 shares; 92,767,310 shares issued and outstanding | 928 | |||||
Paid-in capital | 946,822 | |||||
Non-vested stock options | 210 | |||||
Retained earnings | 119,046 | |||||
Accumulated other comprehensive income, net of tax | 27,254 | |||||
Total stockholder's equity | 1,094,260 | |||||
Total liabilities and stockholder's equity | $ | 11,129,961 | ||||
The accompanying notes are an integral part of these consolidated financial statements.
BANKUNITED, INC. AND SUBSIDIARIES
CONSOLIDATED STATEMENT OF INCOME
For the Period from April 28, 2009 (date of inception) through December 31, 2009
(In thousands, except per share data)
Interest income: | |||||||
Interest and fees on loans | $ | 287,460 | |||||
Interest and dividends on investment securities available for sale | 45,142 | ||||||
Interest and dividends on other interest-earning assets | 2,922 | ||||||
Total interest income | 335,524 | ||||||
Interest expense: | |||||||
Interest on deposits | 57,829 | ||||||
Interest on borrowings | 26,027 | ||||||
Total interest expense | 83,856 | ||||||
Net interest income before provision for loan losses | 251,668 | ||||||
Provision for loan losses | 22,621 | ||||||
Net interest income after provision for loan losses | 229,047 | ||||||
Non-interest income: | |||||||
Accretion of discount on FDIC indemnification asset | 149,544 | ||||||
Income from resolution of covered assets, net | 120,954 | ||||||
Loss on sale of loans, net | (47,078 | ) | |||||
Gain on extinguishment of debt | 31,303 | ||||||
Net loss on indemnification asset resulting from net recoveries | (22,568 | ) | |||||
FDIC reimbursement of costs of resolution of covered assets | 8,095 | ||||||
Service charges | 6,753 | ||||||
Other non-interest income | 5,825 | ||||||
Total non-interest income | 252,828 | ||||||
Non-interest expense: | |||||||
Employee compensation and benefits | 62,648 | ||||||
Occupancy and equipment | 19,925 | ||||||
Impairment of other real estate owned | 21,055 | ||||||
Professional fees | 14,854 | ||||||
Foreclosure expense | 16,632 | ||||||
Deposit insurance expense | 11,850 | ||||||
Other real estate owned related expense | 7,576 | ||||||
Telecommunications and data processing | 6,440 | ||||||
Other non-interest expense | 12,230 | ||||||
Loss on FDIC receivable | 69,444 | ||||||
Acquisition related costs | 39,800 | ||||||
Total non-interest expense | 282,454 | ||||||
Income before income taxes | 199,421 | ||||||
Provision for income taxes | 80,375 | ||||||
Net income | $ | 119,046 | |||||
Earnings Per Common Share: Basic and diluted | $ | 1.29 | |||||
Weighted average number of common shares outstanding: Basic and diluted | 92,664,910 | ||||||
The accompanying notes are an integral part of these consolidated financial statements.
BANKUNITED, INC. SUBSIDIARIES
CONSOLIDATED STATEMENT OF CASH FLOWS
For the Period from April 28, 2009 (date of inception) through December 31, 2009
(In thousands)
Cash flows from operating activities: | ||||||||
Net income | $ | 119,046 | ||||||
Adjustments to reconcile net income to net cash used in operating activities: | ||||||||
Accretion of fair values of assets acquired | (273,488 | ) | ||||||
Accretion of fees, discounts and premiums, net | (19,107 | ) | ||||||
Accretion of fair values of liabilities assumed | (105,045 | ) | ||||||
Provision for loan losses | 22,621 | |||||||
Accretion of discount on FDIC indemnification asset | (149,544 | ) | ||||||
Income from resolution of covered assets, net | (120,954 | ) | ||||||
Loss on sale of loans, net | 47,078 | |||||||
Gain on extinguishment of debt | (31,303 | ) | ||||||
Net loss on indemnification asset resulting from net recoveries | 22,568 | |||||||
Increase in bank owned life insurance cash surrender value | (3,219 | ) | ||||||
Loss on sale of investment securities available for sale, net | 337 | |||||||
Loss on sale of other real estate owned, net | 807 | |||||||
Compensation expense on non-vested stock options | 210 | |||||||
Expense on equity awards classified as liabilties | 10,497 | |||||||
Depreciation and amortization | 1,201 | |||||||
Impairment of other real estate owned | 21,055 | |||||||
Loss on FDIC receivable | 69,444 | |||||||
Deferred income tax benefit | (2,325 | ) | ||||||
Other: | ||||||||
Increase in other assets | (20,675 | ) | ||||||
Increase in other liabilities | 67,111 | |||||||
Decrease in due to FDIC | (9,447 | ) | ||||||
Net cash used in operating activities | (353,132 | ) | ||||||
Cash flows from investing activities: | ||||||||
Net cash acquired in a business combination | 1,160,321 | |||||||
Cash received from FDIC related to business combination, net | 2,274,206 | |||||||
Purchases of investment securities available for sale | (1,824,870 | ) | ||||||
Proceeds from repayments of investment securities available for sale | 177,074 | |||||||
Proceeds from sale of investment securities available for sale | 9,271 | |||||||
Net decrease in loans held in portfolio | 525,934 | |||||||
Proceeds from sale of loans | 79,635 | |||||||
Decrease in FDIC indemnification asset for claims filed | 290,701 | |||||||
Purchases of office properties and equipment | (4,890 | ) | ||||||
Proceeds from sale of other real estate owned | 176,601 | |||||||
Net cash provided by investing activities | 2,863,983 | |||||||
BANKUNITED, INC. SUBSIDIARIES
CONSOLIDATED STATEMENT OF CASH FLOWS (Continued)
For the Period from April 28, 2009 (date of inception) through December 31, 2009
(In thousands)
Cash flows from financing activities: | ||||||||
Net decrease in deposits | (587,811 | ) | ||||||
Additions to Federal Home Loan Bank advances | 300,000 | |||||||
Repayments of Federal Home Loan Bank advances | (2,795,112 | ) | ||||||
Net increase in other borrowings | 1,662 | |||||||
Decrease in advances from borrowers for taxes and insurance | (21,125 | ) | ||||||
Capital contribution | 947,750 | |||||||
Net cash used in financing activities | (2,154,636 | ) | ||||||
Net increase in cash and cash equivalents | 356,215 | |||||||
Cash and cash equivalents at beginning of period | — | |||||||
Cash and cash equivalents at end of period | $ | 356,215 | ||||||
Supplemental disclosures of cash flow activities: | ||||||||
Interest paid on deposits and borrowings | $ | 227,421 | ||||||
Income taxes paid | $ | — | ||||||
Supplemental disclosures of non-cash investing and financing activities: | ||||||||
Transfers from loans to real estate owned | $ | 115,192 | ||||||
Restructuring of Federal Home Loan Bank advances | $ | 505,000 | ||||||
The accompanying notes are an integral part of these consolidated financial statements.
BANKUNITED, INC. AND SUBSIDIARIES
CONSOLIDATED STATEMENT OF STOCKHOLDER'S EQUITY AND COMPREHENSIVE INCOME
For the Period from April 28, 2009 (date of inception) through December 31, 2009
(In thousands)
| | Common Stock Par Value | Paid-in Capital | Non-vested Stock Options | Retained Earnings | Accumulated Other Comprehensive Income, net of tax | Total Stockholder's Equity | |||||||||||||||||
|---|---|---|---|---|---|---|---|---|---|---|---|---|---|---|---|---|---|---|---|---|---|---|---|
Balance at April 28, 2009 (date of inception) | $ | — | $ | — | $ | — | $ | — | $ | — | $ | — | |||||||||||
Initial capital contribution | 925 | 924,075 | — | — | — | 925,000 | |||||||||||||||||
Additional capital contribution | 3 | 22,747 | — | — | — | 22,750 | |||||||||||||||||
Net income | — | — | — | 119,046 | — | 119,046 | |||||||||||||||||
Other comprehensive income, net of tax | |||||||||||||||||||||||
Unrealized gains on investment securities available for sale, net of taxes of $17,870 | — | — | — | — | 28,546 | 28,546 | |||||||||||||||||
Unrealized losses on cash flow hedges, net of tax benefit of $(1,070) | — | — | — | — | (1,709 | ) | (1,709 | ) | |||||||||||||||
Less reclassification adjustment for: | |||||||||||||||||||||||
Realized losses on cash flow hedges, net of tax benefit of $261 | — | — | — | — | 417 | 417 | |||||||||||||||||
Total comprehensive income, net of tax | — | — | — | 119,046 | 27,254 | 146,300 | |||||||||||||||||
Non-vested stock options | — | — | 210 | — | — | 210 | |||||||||||||||||
Balance at December 31, 2009 | $ | 928 | $ | 946,822 | $ | 210 | $ | 119,046 | $ | 27,254 | $ | 1,094,260 | |||||||||||
The accompanying notes are an integral part of these consolidated financial statements.
BANKUNITED, INC. AND SUBSIDIARIES
NOTES TO CONSOLIDATED FINANCIAL STATEMENTS
December 31, 2009
Note 1 Summary of Significant Accounting Policies
BankUnited, Inc., formerly known as BU Financial Corporation, was organized on April 28, 2009 as the holding company for BankUnited ("BankUnited" or the "Bank") a federally-chartered, federally-insured savings association and is headquartered in Miami Lakes, Florida. After the close of business on May 21, 2009, BankUnited acquired certain assets and assumed certain liabilities of BankUnited, FSB from the Federal Deposit Insurance Corporation ("FDIC"). Business operations began on May 22, 2009. BankUnited, Inc.'s wholly-owned subsidiaries include BankUnited and BankUnited Investment Services, Inc. (collectively, the "Company"). BankUnited provides a full range of banking and bank-related services to individual and corporate customers through 78 branch offices located in 13 Florida counties. BankUnited, Inc. is a wholly-owned subsidiary of BU Financial Holdings LLC ("BUFH"), which was formed on April 27, 2009 as a limited liability company under the laws of the State of Delaware.
The accounting and reporting policies of the Company and the methods of applying those policies that materially affect the accompanying consolidated financial statements conform with accounting principles generally accepted in the United States ("GAAP") and where applicable to general practices in the banking industry or guidelines prescribed by bank regulatory agencies.
Effective July 1, 2009, the Financial Accounting Standards Board ("FASB") established the Accounting Standards Codification ("ASC" or "Codification") as the source of authoritative GAAP for companies to use in the preparation of financial statements. The guidance contained in the Codification supersedes all existing accounting and reporting standards for public and non-public companies. The Company has adopted the Codification, as required, and as a result, references to accounting literature contained in its Consolidated Financial Statement disclosures reflect the new ASC structure.
Accounting Estimates and Assumptions
In preparing the consolidated financial statements, management is required to make estimates and assumptions that affect the reported amounts of assets and liabilities, revenues and expenses, and valuation and disclosures of contingent assets and liabilities. Management has made significant estimates in certain areas, such as the allowance for loan losses, accounting for covered loans, the valuation of other real estate owned, the accounting for Profits Interest Units and the determination of the valuation allowance for deferred tax assets.
Other estimates are also made in the determination of the fair value of assets acquired and liabilities assumed, including estimates of loans acquired with evidence of credit impairment since origination, the FDIC indemnification asset, goodwill and other intangible assets associated with the BankUnited, FSB acquisition, other-than-temporary impairment of investment securities and fair value of financial instruments. In addition, management has used information provided by third parties to assist in the determination of estimates regarding costs and fair values associated with the Company's investment securities, stock options and equity awards. Actual results could differ from those estimates. The current economic environment has increased the degree of uncertainty inherent in those estimates and assumptions.
Fair Value Measurements
The Company uses fair value measurements to record fair value adjustments to certain assets and liabilities and to determine fair value disclosures. Fair value is defined as the price that would be
BANKUNITED, INC. AND SUBSIDIARIES
NOTES TO CONSOLIDATED FINANCIAL STATEMENTS (Continued)
December 31, 2009
Note 1 Summary of Significant Accounting Policies (Continued)
received to sell an asset or paid to transfer a liability in an orderly transaction between market participants at the measurement date. Securities available for sale, derivative instruments and certain equity awards are recorded at fair value on a recurring basis. Additionally, from time to time, the Company may be required to record other assets at fair value on a nonrecurring basis. Such assets would include collateral dependent impaired loans, other real estate owned, goodwill and other intangible assets. These nonrecurring fair value adjustments typically involve application of lower-of-cost-or-market accounting or impairment write-downs of individual assets.
ASC Topic 825,Financial Instruments allows the Company an irrevocable option for measurement of eligible financial assets or financial liabilities at fair value on an instrument by instrument basis (the fair value option). Subsequent to the initial adoption of ASC Topic 825, the Company may elect to account for eligible financial assets and financial liabilities at fair value. Such an election may be made at the time an eligible financial asset, financial liability or firm commitment is recognized or when certain specified reconsideration events occur. The Company has not elected the fair value option for any eligible financial instrument as of December 31, 2009.
Transfers of Financial Assets
Transfers of financial assets are accounted for as sales, when control over the assets has been surrendered. A gain or loss is recognized in earnings upon completion of the sale based on the difference between the sales proceeds and the carrying value of the assets. Control over the transferred assets is deemed to have been surrendered when: (i) the assets have been isolated from the Company, (ii) the transferee obtains the right (free of conditions that constrain it from taking advantage of that right) to pledge or exchange the transferred assets, and (iii) the Company does not maintain effective control over the transferred assets through an agreement to repurchase them before their maturity.
Principles of Consolidation
The consolidated financial statements of the Company include the accounts of BankUnited, Inc., and its wholly-owned subsidiaries, BankUnited and BankUnited Investment Services, Inc. All significant intercompany balances and transactions have been eliminated in consolidation.
Cash and Cash Equivalents
Cash and cash equivalents include cash and due from banks, amounts deposited at the Federal Reserve Bank and federal funds sold. Cash equivalents have original maturities of three months or less and, accordingly, the carrying amount of these instruments is deemed to be a reasonable estimate of fair value.
The Bank must comply with Federal Reserve Board regulations requiring the maintenance of reserves against its net transaction accounts. As of December 31, 2009, cash reserves maintained by the Bank at the Federal Reserve Bank for this purpose exceeded this requirement.
Investment Securities Available for Sale
Investment securities for which the Company may not have the intent or ability to hold to maturity, and marketable equity securities, are classified as available for sale. Securities designated as available for sale are carried at fair value with unrealized gains and losses, net of any tax effect,
BANKUNITED, INC. AND SUBSIDIARIES
NOTES TO CONSOLIDATED FINANCIAL STATEMENTS (Continued)
December 31, 2009
Note 1 Summary of Significant Accounting Policies (Continued)
included in accumulated other comprehensive income as a component of stockholder's equity. Interest income and dividends on securities are recognized in interest income on an accrual basis. Premiums and discounts on debt securities are amortized as an adjustment to yield over the expected life of the security using the level yield method. Realized gains and losses on sales of available for sale securities are determined using the specific identification method and are recognized in earnings for the period.
The Company reviews available for sale securities for impairment on a quarterly basis or more frequently if events and circumstances indicate that a potential loss may have occurred. An investment security is impaired if its fair value is lower than its amortized cost basis. The Company considers many factors in determining whether the decline in fair value below amortized cost is an other-than-temporary impairment ("OTTI"), including, but not limited to, adverse changes in expected cash flows, the length of time and extent to which the fair value has been less than amortized cost, the Company's intent and ability to hold the security for a period of time sufficient for a recovery in value and issuer-specific factors such as the issuer's financial condition, external credit ratings and general market conditions. For a debt security for which there has been a decline in the fair value below amortized cost basis, the Company recognizes OTTI if (i) management has the intent to sell the security, (ii) it is more likely than not that the Company will be required to sell the security before recovery of its amortized cost basis, or (iii) the Company does not expect to recover the entire amortized cost basis of the security. For any debt securities that are considered other-than-temporarily impaired, the OTTI write-down is separated into an amount representing the credit loss, which is recognized in earnings, and the amount related to all other factors, which is recognized in other comprehensive income. If the Company intends to sell the security, or if it is more likely than not it will be required to sell the security before recovery, an OTTI write-down is recognized in earnings equal to the entire difference between the amortized cost basis and fair value of the security. The measurement of the credit loss component is equal to the difference between the debt security's amortized cost basis and the present value of its expected future cash flows discounted at the security's effective yield. For marketable equity securities, OTTI evaluations focus on whether evidence exists that supports recovery of the unrealized loss within a timeframe consistent with temporary impairment.
The Company uses third party sources to assist in the determination of the fair value of its investment securities, which are subject to validation procedures performed by management. The third-party pricing sources use proprietary models to determine the fair value of the Company's collateralized mortgage obligations and mortgage pass-through certificates. Management performs validation procedures related to these fair value estimates using a third-party developed model, and proprietary behavioral assumptions which incorporate observable and unobservable inputs that it believes market participants would use in valuing these securities. These inputs take into account market-based observable inputs that are available and are reflective of the structural and collateral characteristics of the respective securities.
FHLB Stock
The Company's investment in the stock of the Federal Home Loan Bank of Atlanta ("FHLB") is carried at cost, since these securities are restricted. Because of the nature of this investment, carrying value approximates fair value. Periodically and as conditions warrant, the Company reviews its investment in FHLB stock for impairment and adjusts the carrying value of the investment if it is determined to be impaired.
BANKUNITED, INC. AND SUBSIDIARIES
NOTES TO CONSOLIDATED FINANCIAL STATEMENTS (Continued)
December 31, 2009
Note 1 Summary of Significant Accounting Policies (Continued)
Loans
The Company's loans held in portfolio consists primarily of real estate loans collateralized by first mortgages and also includes home equity loans and lines of credit, multi-family, commercial real estate, construction, land and other commercial and consumer loans. Loans held in portfolio are loans which management has the intent and ability to hold for the foreseeable future and are considered held for investment. Changes in events and circumstances related to these assets, as well as developments regarding management's view of the foreseeable future, may result in a change in the intent to hold such assets for investment. A significant portion of the Company's loans held in portfolio consist of loans acquired on May 21, 2009, from the FDIC which may be covered under the loss sharing agreements with the FDIC. The Company segregates its loan portfolio between covered and not covered.
Covered Loans
A significant portion of the Company's covered loans consist of loans acquired on May 21, 2009 with evidence of deterioration of credit quality since origination (acquired credit-impaired or "ACI" loans). Consequently, it is probable that, at acquisition, the Company will be unable to collect all contractual payments due. These loans were initially recorded at fair value, which represents the present value of all cash flows expected to be received, including estimated prepayments. The difference between the total contractual payments due and the cash flows expected to be received at acquisition is recognized as non-accretable difference. The excess of all cash flows expected at acquisition over the Company's initial investment in the loans is recognized as interest income on a level-yield basis over the life of the loans (accretable yield).
The Company is required to have reasonable expectations about the timing and amount of cash flows to be collected and continue to estimate the cash flows expected to be collected over the life of the loan. Acquired credit-impaired loans are reviewed each reporting period to determine whether any material changes occurred in expected cash flows that would result in a reclassification between non-accretable difference and accretable yield. If it is probable that the Company will be unable to collect all the cash flows expected at acquisition, plus additional cash flows expected to be collected arising from changes in estimates after acquisition, the loan is considered impaired and a valuation allowance is established by a charge to earnings. If, based on current information and events, it is probable that there is a material increase in cash flows previously expected to be collected or if actual cash flows are materially greater than cash flows previously expected, the Company first reduces any valuation allowance previously established by the increase in the present value of cash flows expected to be collected and recalculates the amount of accretable yield for the loan. The adjustment due to an increase in expected cash flows is accounted for as a change in estimate and the amount of periodic accretion is adjusted over the remaining life of the loan.
The Company has aggregated certain loans that were acquired on May 21, 2009 and have similar risk characteristics into homogenous pools, and uses a composite interest rate and expectations of cash flows expected to be collected for each pool. Loans that do not have similar risk characteristics are analyzed on a loan by loan basis, based on interest rates and expectations of cash flows expected to be collected for each individual loan. The total acquisition price of the loans is assigned to each individual pool or loan on the basis of its relative fair value at acquisition date.
BANKUNITED, INC. AND SUBSIDIARIES
NOTES TO CONSOLIDATED FINANCIAL STATEMENTS (Continued)
December 31, 2009
Note 1 Summary of Significant Accounting Policies (Continued)
The Company may resolve a covered ACI loan through a sale of the loan, by working with the customer and obtaining partial or full pre-payment, by short sale of the underlying collateral, by foreclosure of the underlying collateral, or, for the non-residential portfolio, by charge-off. In the event of a sale of the loan, the Company recognizes a gain or loss on sale of loans, based on the difference between the sales proceeds and the carrying value of the loan. For loans resolved through agreed pre-payments, short sale or foreclosure the Company recognizes the difference between the payment received in satisfaction of the loan and the carrying value of the loan in the income statement line item "Income from resolution of covered assets, net." Gains and losses from the resolution of covered loans are included in this line item. The accretable discount related to loans sold that are not treated as pools is recognized in earnings immediately as interest income.
Acquired loans with no evidence of deterioration of credit quality since origination are recorded at the estimated fair value on the acquisition date and are subsequently carried at the principal amount outstanding, net of premiums, discounts, unearned income, deferred loan fees and costs, and allowance for loan losses.
Loans not Covered
Loans originated by the Company are carried at the principal amount outstanding, net of premiums, discounts, unearned income, deferred loan fees and costs, and allowance for loan losses.
Interest income on non-ACI and originated loans is accrued based on the principal amount outstanding, except for those loans classified as non-accrual. Non-refundable loan origination and commitment fees, net of direct costs of originating or acquiring loans, and fair value adjustments for acquired loans, are deferred and recognized over the estimated lives of the related loans as an adjustment to the loans' effective yield.
Impaired Loans
An ACI pool or loan is considered to be impaired when it is probable that the Company will be unable to collect all the cash flows expected at acquisition, plus additional cash flows expected to be collected arising from changes in estimates after acquisition. All other loans are considered impaired when, based on current information and events, it is probable that the Company will be unable to collect the scheduled payments of principal or interest when due, according to the contractual terms of the loan agreement. Factors considered by management in determining impairment include payment status, collateral value, and the probability of collecting expected or scheduled principal and interest payments when due.
In certain situations due to economic or legal reasons related to a borrower's financial difficulties, the Company may grant a concession to the borrower for other than an insignificant period of time that it would not otherwise consider. At that time, the related loan is classified as a troubled-debt restructuring ("TDR") and considered impaired. The concessions granted may include rate reductions, principal forgiveness, payment forbearance and other actions intended to minimize the economic loss and to avoid foreclosure or repossession of the collateral. Troubled-debt restructured loans are placed on non-accrual status at the time of the modifications unless the borrower has no history of missed payments for six months prior to the restructuring. If borrowers perform pursuant to the modified loan terms for at least six months and the remaining loan balances are considered collectible, the loans are
BANKUNITED, INC. AND SUBSIDIARIES
NOTES TO CONSOLIDATED FINANCIAL STATEMENTS (Continued)
December 31, 2009
Note 1 Summary of Significant Accounting Policies (Continued)
returned to accrual status. Modified loans that form part of an established pool of ACI loans are not considered TDRs and are not separated from the pool and classified as impaired loans.
Nonaccrual Loans
Except for ACI loans accounted for on a pool basis, loans are placed on non-accrual status when management has determined that (i) full payment of all contractual principal and interest is in doubt, and for ACI loans not accounted for on a pool basis, when it is probable that the Company will be unable to collect all the cash flows expected at acquisition plus additional cash flows expected to be collected arising from changes in estimates after acquisition, or (ii) the loan is past due 90 days or more as to principal and/or interest unless the loan is well-secured and in the process of collection.
Except for ACI loans accounted for on a pool basis, when a loan is placed on non-accrual status, uncollected interest accrued in the current year is reversed and charged to interest income. Subsequent payments of interest are recognized as income on a cash basis, or if collection of principal is doubtful, they are applied to principal on a cost recovery basis. For residential mortgage loans and consumer loans not treated as pools, the accrued interest at the date the loan is placed on nonaccrual status, and forgone interest during the nonaccrual period, are recorded as interest income as of the date the loan is no longer delinquent in excess of 90 days. Commercial real estate and commercial loans are returned to accruing status only after all past due principal and interest have been collected.
Allowance for Loan Losses
The Company's allowance for loan losses ("ALL") is established for both performing loans and non-performing loans. The Company's ALL is the amount considered adequate to absorb probable losses within the portfolio based on management's evaluation of the size and current risk characteristics of the loan portfolio and is an amount management considers to be appropriately determined in accordance with GAAP. Such evaluation considers numerous factors, including, but not limited to, internal risk ratings, loss forecasts, collateral values, geographic location, borrower FICO scores, delinquency rates, non-performing and restructured loans, origination channels, product mix, underwriting practices, industry conditions, economic trends and net charge-off trends.
For ACI loans, a valuation allowance is established when it is probable that the Company will be unable to collect all the cash flows expected at acquisition plus additional cash flows expected to be collected arising from changes in estimate after acquisition. A specific allowance is established when subsequent evaluations of expected cash flows from ACI loans reflect a decrease in those estimates.
For all other loans, specific allowances for loan losses are established for large commercial, corporate, and commercial real estate impaired loans that are evaluated on an individual basis. The specific allowance established for these loans is based on a thorough analysis of the most probable source of repayment, including the present value of the loan's expected future cash flows, the loan's estimated market value, or the estimated fair value of the underlying collateral less costs of disposition. General allowances are established for loans grouped based on similar characteristics. In this process, general allowance factors established are based on an analysis of historical loss and recovery experience and expected loss given default derived from the Company's internal risk rating process and proprietary roll-to-loss model. Other adjustments for qualitative factors may be made to the allowance for the pools after an assessment of internal and external influences on credit quality and loss severity that are
BANKUNITED, INC. AND SUBSIDIARIES
NOTES TO CONSOLIDATED FINANCIAL STATEMENTS (Continued)
December 31, 2009
Note 1 Summary of Significant Accounting Policies (Continued)
not fully reflected in the historical loss or risk rating data. For these measurements, the Company uses assumptions and methodologies that are relevant to estimating the level of impairment and probable losses in the loan portfolio. To the extent that the data supporting such assumptions has limitations, management's judgment and experience play a key role in recording the allowance estimates.
Additions to the ALL are made by provisions charged to earnings. Furthermore, an improvement in the expected cash flows related to ACI loans would result in a reduction of the required specific allowance with a corresponding credit to the provision. The allowance is decreased by charge-offs due to losses and increased by recoveries. Losses on unsecured consumer loans are recognized at 90-days past due. Residential real estate loans and secured consumer loans are typically charged-off when they become 120 to 180-days past due, depending on the collateral type. Secured loans may be written-down to the collateral's fair value less estimated disposition costs, with previously accrued unpaid interest reversed. Subsequent charge-offs may be required as a result of changes in the fair value of collateral or other repayment prospects. The Company reports recoveries at the time received on a cash basis.
FDIC Indemnification Asset
An FDIC indemnification asset results from the loss sharing agreement with the FDIC and is measured separately from the related covered assets. It is not contractually embedded in the covered assets and it is not transferrable with the covered assets should the Company choose to dispose of them.
The FDIC indemnification asset is initially recorded at fair value which represents the present value of the estimated cash payments expected from the FDIC for probable losses on covered assets, past due interest and reimbursement of certain expenses. Covered assets consist primarily of loans acquired from the FDIC. The discount rate in this calculation was determined using a risk-free yield curve plus a premium reflecting the uncertainty related to the collection, amounts and timing of the cash flows and other liquidity concerns. The accretion due to discounting and changes in cash flows expected is included in non-interest income for the period. Decreases in cash flows expected to be collected from the FDIC are generally recognized in income prospectively consistent with the approach taken to recognize increases in expected cash flows on covered loans. Increases to the FDIC indemnification asset that result from impairment of cash flows on covered loans are recognized in income in the same period that the allowance for credit losses on the related loans is recognized. The ultimate collectability of this asset is dependent upon the performance of the underlying covered assets, the passage of time and claims paid by the FDIC.
Excess cash received over carrying value and the excess of carrying value over cash received from the resolution of ACI loans are netted and recognized as income from resolution of covered assets, net in the accompanying consolidated statement of income. Decreases and increases to the estimated cash flows to be received from the FDIC related to the resolution of assets are recognized separately as a net loss on indemnification asset resulting from net recoveries in the consolidated statement of income and as corresponding decreases or increases in the FDIC indemnification asset.
Office Properties and Equipment, net
Included in other assets are office properties and equipment which are carried at cost less accumulated depreciation and amortization. Depreciation is calculated based on the straight line
BANKUNITED, INC. AND SUBSIDIARIES
NOTES TO CONSOLIDATED FINANCIAL STATEMENTS (Continued)
December 31, 2009
Note 1 Summary of Significant Accounting Policies (Continued)
method using the estimated service lives of the assets. Repair and maintenance costs are charged to operations as incurred, and improvements are capitalized. The lives of improvements to existing buildings are based on the lesser of the estimated remaining life of the building or the estimated useful life of the improvements. Leasehold improvements are amortized over the shorter of the expected term of the lease at inception, considering options to extend that are reasonably assured, or their useful lives. The estimated useful life for branch buildings is 30 years, for furniture, fixtures and equipment is 5-7 years, and for computer equipment and software is 3 years.
Bank Owned Life Insurance
Bank owned life insurance is carried at an amount that could be realized under the insurance contracts as of the date of the consolidated balance sheet, which is the cash surrender value adjusted for charges or other amounts due that are probable at settlement. Changes in the cash surrender value of the policy are recorded in earnings.
Other Real Estate Owned
Assets acquired through, or in lieu of loan foreclosure are held for sale and are initially recorded at the estimated fair value of the collateral at the date of foreclosure based on estimates, including some obtained from third parties, less estimated costs to sell, establishing a new cost basis. Subsequent to foreclosure, valuations are periodically performed by management, and the assets are carried at the lower of cost or fair value, less estimated costs to sell. Significant property improvements, which enhance the salability of the property, are capitalized to the extent that the carrying value does not exceed their estimated realizable values. Legal fees, maintenance and other direct costs of foreclosed properties are expensed as incurred.
Goodwill and Other Intangible Assets
Goodwill is an asset representing the future economic benefits from other assets acquired that are not individually identified and separately recognized. Goodwill is measured as the excess of the consideration transferred, net of the fair value of identifiable assets acquired and liabilities assumed at the acquisition date. Goodwill is assigned to the units that are expected to benefit from the synergies of the business combination. The Company's goodwill was assigned to BankUnited at the acquisition date. Goodwill and other identifiable intangible assets with indefinite lives are not amortized and instead are tested for impairment. The Company performs its impairment testing annually in the third quarter of the fiscal year or more frequently if events or circumstances exist that indicate a possible reduction in the fair value of the business below its carrying value. The Company measures impairment using the present value of estimated future cash flows. The analysis is based upon available information regarding expected future cash flows and discount rates. Discount rates are based upon the cost of capital specific to the industry in which the Company operates. If the carrying value of the reporting unit exceeds its fair value, a second analysis is performed to measure the fair value of all assets and liabilities. If, based on the second analysis, it is determined that the fair value of the assets and liabilities of the reporting unit is less than the carrying value, the Company would recognize impairment for the excess of carrying value over fair value.
Other intangible assets consist of core deposit intangible assets. Core deposit intangible assets, initially recorded at fair value, are amortized on a straight-line basis over their estimated useful lives
BANKUNITED, INC. AND SUBSIDIARIES
NOTES TO CONSOLIDATED FINANCIAL STATEMENTS (Continued)
December 31, 2009
Note 1 Summary of Significant Accounting Policies (Continued)
and evaluated for impairment whenever events or changes in circumstances indicate the carrying amount of the asset may not be recoverable.
Income Taxes
As a corporation, the Company and its subsidiaries, other than BU REIT, Inc., file a consolidated federal corporate income tax return, as well as combined state corporate income tax returns where combined filings are required for companies that are considered to be unitary with related entities. BU REIT, Inc., an indirect wholly-owned subsidiary of BankUnited, files a separate federal income tax return.
The Company accounts for income taxes under the asset and liability method. Income tax expense or benefit is comprised of the current and deferred tax provisions for the period. The current tax provision represents amounts that are payable to or receivable from taxing authorities based on current period taxable income or loss. The deferred tax provision reflects changes in deferred tax assets and liabilities during the period as a result of current period operations. Deferred income tax assets and liabilities result from temporary differences between assets and liabilities measured for financial reporting purposes and for income tax return purposes. These assets and liabilities are measured using the enacted tax rates and laws that are currently in effect.
The Company recognizes a liability for uncertain tax positions. An uncertain tax position is defined as a position in a previously filed tax return or a position expected to be taken in a future tax return that is not based on clear and unambiguous tax law and which is reflected in measuring current or deferred income tax assets and liabilities for interim or annual periods. The Company must recognize the tax benefit from an uncertain tax position only if it is more-likely-than-not that the tax position will be sustained on examination by the taxing authorities, based on the technical merits of the position. The Company measures the tax benefits recognized based on the largest benefit that has a greater than 50% likelihood of being realized upon ultimate resolution. The Company recognizes interest and penalties related to uncertain tax benefits in its provision for income taxes. At December 31, 2009, there were no significant uncertain tax positions.
Stock-Based Compensation
The Company sponsors a stock plan under which nonqualified stock options may be granted periodically to key employees of the Company or its affiliates at an exercise price at or above the estimated fair market value of the underlying stock on the date of the grant.
Compensation cost is measured based on the estimated fair value of the award at the grant date and is recognized in the consolidated financial statements on a straight-line basis over the requisite service period. The fair value of stock options is estimated at the date of grant using a Black-Scholes option pricing model to calculate the fair values of options awarded. This model requires assumptions as to expected volatility, dividends, terms, and risk free rates. Since the Company's Common Stock is not currently traded in an exchange, expected volatility is measured based on the volatility of the common stock of peer companies. The expected term represents the period of time that options are expected to be outstanding from the grant date. The risk free interest rate is based on the U.S. Treasury yield curve in effect at the time of grant for the appropriate life of each option. The expected dividend yield was determined based on the expected dividends to be declared.
BANKUNITED, INC. AND SUBSIDIARIES
NOTES TO CONSOLIDATED FINANCIAL STATEMENTS (Continued)
December 31, 2009
Note 1 Summary of Significant Accounting Policies (Continued)
Due to BUFH for Other Equity Awards Classified as Liabilities
Due to BUFH for other equity awards classified as liabilities consist of instruments with characteristics of both equity and liabilities. They include a warrant to the FDIC and Profits Interest Units ("PIU") issued by BUFH, and are recorded in other liabilities, at fair value, in the accompanying consolidated balance sheet.
Compensation expense related to PIU awards is based on the fair value of the underlying unit on the date of the consolidated financial statements. Time-based PIU expense, which is serviced-based, is recognized over the vesting period using the straight-line method. IRR-based PIU expense, which is performance-based, is recognized upon consummation of an IPO or change in control liquidity event. See Note 15,Due to BUFH for Equity Awards Classified as Liabilities, and Note 22,Subsequent Events.
Derivative Financial Instruments and Hedging Activities
The Company records all contracts that satisfy the definition of a derivative financial instrument ("derivative") at fair value in the consolidated financial statements. A derivative is a financial instrument that derives its cash flows and therefore, its value, by reference to an underlying instrument, index or referenced interest rate. The Company does not hold any derivatives for trading purposes.
Derivatives are used as a risk management tool to hedge the Company's exposure to changes in interest rates or other identified market risks. When a derivative is entered into, the Company prepares written hedge documentation and designates the derivative as (i) a hedge of the fair value of a recognized asset or liability (fair value hedge) or (ii) a hedge of a forecasted transaction, such as the variability of cash flows to be received or paid related to a recognized asset or liability (cash flow hedge). The written hedge documentation includes identification of, among other items, the risk management objective, hedging instrument, hedged item and methodologies for assessing and measuring hedge effectiveness and ineffectiveness, along with support for management's assertion that the hedge will be highly effective.
Methodologies related to assessing hedge effectiveness are consistent between similar types of hedge transactions and have included (i) statistical regression analysis, and (ii) comparison of the critical terms of the hedged item and the hedging derivative. Changes in the fair value of a derivative that is highly effective and that has been designated and qualifies as a fair value hedge are recorded in current period earnings, along with the changes in the fair value of the hedged item that are attributable to the hedged risk. Changes in the fair value of a derivative that is highly effective and that has been designated and qualifies as a cash flow hedge are initially recorded in accumulated other comprehensive income and reclassified to earnings in the same period that the hedged item impacts earnings; and any ineffective portion is recorded in current period earnings. Assessments of hedge effectiveness and measurements of hedge ineffectiveness are performed at least quarterly for ongoing effectiveness.
The Company discontinues hedge accounting prospectively when it is determined that the derivative is no longer effective in offsetting changes in the fair value or cash flows of the hedged item, the derivative expires or is sold, terminated, or exercised, or management determines that the designation of the derivative as a hedging instrument is no longer appropriate. When hedge accounting is discontinued because it is determined that the derivative no longer qualifies as an effective fair value
BANKUNITED, INC. AND SUBSIDIARIES
NOTES TO CONSOLIDATED FINANCIAL STATEMENTS (Continued)
December 31, 2009
Note 1 Summary of Significant Accounting Policies (Continued)
hedge, the Company continues to carry the derivative on the balance sheet at its fair value, with any changes to the fair value recognized in earnings.
Earnings per Common Share
Basic earnings per common share are computed by dividing income available to common shareholders by the weighted-average number of common shares outstanding during each period. Diluted earnings per common share are based on the weighted-average number of common shares outstanding during the period, plus the dilutive effect of securities or other contracts to issue common shares ("common stock equivalents"). Common stock equivalents are excluded from the computation of earnings per common share in periods in which they have an anti-dilutive effect. Non-vested stock options are potentially dilutive securities, but are not included in the calculation of diluted earnings per common share because to do so would be antidilutive. The Company's obligation for BUFH's PIUs and common units that may be issued related to the FDIC warrant represents contingently issuable units and are not included in the calculation of net income per common share because the conditions necessary to issue the units have not been satisfied as of the end of the reporting period. Therefore, at December 31, 2009, the weighted average number of shares used to compute basic and diluted income per common unit is the same.
Segment Reporting
The Company operates one reportable segment of business, Community Banking, which includes BankUnited, the Company's banking subsidiary. Through BankUnited, the Company provides a broad range of retail and commercial banking services. Management makes operating decisions and assesses performance based on an ongoing review of these banking operations, which constitute the Company's only operating segment.
Accounting Policies Recently Adopted and Pending Adoption
In June 2009, the FASB issued new guidance impacting transfers and servicing of financial assets. The objective of this guidance is to improve the relevance, representational faithfulness, and comparability of the information that a reporting entity provides in its financial reports about a transfer of financial assets; the effects of a transfer on its financial position, financial performance, and cash flows; and a transferor's continuing involvement in transferred financial assets. This guidance is effective for financial asset transfers occurring after December 31, 2009. The adoption of this guidance is not expected to be material to the Company's financial position, results of operations, or cash flows.
In May 2009, the FASB issued new guidance regarding subsequent events. The new guidance establishes general standards of accounting for and disclosure of events that occur after the balance sheet date but before financial statements are issued or are available to be issued. The adoption of this guidance was not material to the Company's financial position, results of operations, or cash flows.
In June 2009, the FASB issued new guidance impacting consolidation of variable interest entities. The objective of this guidance is to improve financial reporting by enterprises involved with variable interest entities and to provide more relevant and reliable information to users of financial statements.
BANKUNITED, INC. AND SUBSIDIARIES
NOTES TO CONSOLIDATED FINANCIAL STATEMENTS (Continued)
December 31, 2009
Note 1 Summary of Significant Accounting Policies (Continued)
This guidance was effective as of January 1, 2010. The adoption of this guidance was not material to the Company's financial position, results of operations, or cash flows.
In August 2009, the FASB amended the measurement of liabilities at fair value and related disclosures. The amendment provides additional guidance on how to measure the fair value of a liability. The amendment clarifies that when estimating the fair value of a liability the entity is not required to include a separate adjustment to other inputs relating to the existence of a restriction that prevents the transfer of a liability. The amendment also clarifies that the quoted price in an active market at the measurement date of a liability when traded as an asset represents a Level 1 fair value measurement. The adoption of this guidance is not expected to be material to the Company's financial position, results of operations, or cash flows.
In September 2009, the FASB issued new guidance that creates a practical expedient to measure the fair value of an alternative investment that does not have a readily determinable fair value. This guidance also requires certain additional disclosures. This guidance was effective for interim and annual periods ending after December 15, 2009. The adoption of this guidance did not have a material impact on the Company's financial position, results of operations, or cash flows.
In January 2010, the FASB issued new guidance to improve disclosures regarding fair value measurements and disclosures. Fair value measurements and disclosures were enhanced to require additional information regarding transfers to and from Level 1 and 2 and the reasons for the transfers, and a gross presentation of activity within the rollforward of Level 3. The guidance clarifies existing disclosure requirements on the level of disaggregation of classes of assets and liabilities. In addition, enhanced disclosure is required concerning inputs and valuation techniques used to determine Level 2 and Level 3 measurements. This guidance is generally effective for interim and annual reporting periods beginning after December 15, 2009; however, requirements to disclose separately purchases, sales, issuances, and settlements in the Level 3 reconciliation are effective for fiscal years beginning after December 15, 2010 (and for interim periods within such years). The adoption of this guidance is not expected to have a material impact on the Company's financial position, results of operations, or cash flows.
In March 2010, the FASB issued new guidance impacting receivables. The new guidance clarifies that a modification to a loan that is part of a pool of loans that were acquired with deteriorated credit quality should not result in the removal of the loan from the pool. This guidance is effective for any modifications of loans accounted for within a pool in the first interim or annual reporting period ending after July 15, 2010. The adoption of this guidance is not expected have a material effect on the Company's financial position, results of operations, or cash flows.
In July 2010, the FASB issued new guidance to provide additional information to assist financial statement users in assessing an entity's credit risk exposures and evaluating the adequacy of its allowance for loan losses. The new guidance requires disclosures regarding loans and the allowance for loan losses that are disaggregated by portfolio segment and class of financing receivable. A portfolio segment is defined as the level at which an entity develops and documents a systematic method for determining its allowance for loan losses. Classes of financing receivables are a disaggregation of portfolio segments. Existing disclosure requirements were amended to require a rollforward of the allowance for loan losses by portfolio segment, with the ending balance broken out by basis of
BANKUNITED, INC. AND SUBSIDIARIES
NOTES TO CONSOLIDATED FINANCIAL STATEMENTS (Continued)
December 31, 2009
Note 1 Summary of Significant Accounting Policies (Continued)
impairment method, as well as the recorded investment in the respective loans. Nonaccrual and impaired loans by class must also be shown. The update also requires disclosures regarding: (1) credit quality indicators by class, (2) aging of past due loans by class, (3) TDRs by class and their effect on the allowance for loan losses, (4) TDRs during the previous 12 months that defaulted during the reporting period by class and their effect on the allowance for loan losses, and (5) significant purchases and sales of loans disaggregated by portfolio segment. For public entities, disclosures as of the end of a period are effective for interim and annual reporting periods ending on or after December 15, 2010. Activity related disclosures are effective for interim and annual reporting periods beginning on or after December 15, 2010. For non-public entities, the disclosures are effective for annual reporting periods ending on or after December 15, 2011. The adoption of this guidance is not expected to have a material impact on the Company's financial position, results of operations or cash flows.
Note 2 Acquisition
On May 21, 2009, BankUnited, a wholly-owned subsidiary of the Company, entered into a purchase and assumption agreement (the "FSB Agreement") with the FDIC, as receiver, pursuant to which BankUnited acquired certain assets and assumed substantially all of the deposits and liabilities of BankUnited, FSB (the "Acquisition").
Prior to the Acquisition, BankUnited, FSB was a community bank headquartered in Coral Gables, Florida and operated 85 banking branches in 13 counties in Florida. Excluding the effects of purchase accounting adjustments, the Bank acquired $13.6 billion in assets and assumed $12.8 billion of the deposits and liabilities of BankUnited, FSB. The Bank received net consideration in the amount of $2.2 billion partially offset by liabilities due to the FDIC in the amount of $156.8 million.
In connection with the Acquisition, the Bank entered into a loss sharing agreement with the FDIC that covers single family residential mortgage loans, commercial real estate and commercial and industrial loans, certain investment securities and other real estate owned ("OREO") collectively, referred to as the "covered assets". The Bank acquired other BankUnited, FSB assets that are not covered by the loss sharing agreement with the FDIC including cash balances of $1.2 billion, certain investment securities purchased at fair market value and other tangible assets. Pursuant to the terms of the loss sharing agreement, the covered assets are subject to a stated loss threshold whereby the FDIC will reimburse the Bank for 80% of losses of up to $4.0 billion, and 95% of losses in excess of this amount. The Bank will reimburse the FDIC for its share of recoveries with respect to losses for which the FDIC paid the Bank a reimbursement under the loss sharing agreement. The FDIC's obligation to reimburse the Company for losses with respect to covered assets begins with the first dollar of loss incurred. The expected reimbursements under the loss sharing agreements were recorded as an indemnification asset at its estimated fair value of $3.4 billion on the acquisition date. The indemnification asset reflects the present value of the expected net cash reimbursement related to the loss sharing agreement described above.
The amounts covered by the loss sharing agreement are the pre-acquisition book values of the underlying covered assets, the contractual balance of unfunded commitments that were acquired, plus certain interest and expenses. The loss sharing agreement is subject to certain servicing procedures as specified in the agreement with the FDIC. The loss sharing agreement applicable to single family residential mortgage loans provide for FDIC loss sharing and the Bank's reimbursement of recoveries
BANKUNITED, INC. AND SUBSIDIARIES
NOTES TO CONSOLIDATED FINANCIAL STATEMENTS (Continued)
December 31, 2009
Note 2 Acquisition (Continued)
to the FDIC for ten years. The loss sharing agreements applicable to all other covered assets provide for FDIC loss sharing for five years and the Bank reimbursement of recoveries to the FDIC for 8 years. Under the loss sharing agreement, the Bank may sell up to 2.5% of the acquired residential and commercial loan portfolio, with certain restrictions, based on the unpaid principal balance ("UPB") on an annual basis without prior consent from FDIC. If the Bank seeks to sell residential or non-residential loans in excess of the agreed 2.5% threshold, nine months prior to the tenth anniversary or fifth anniversary, respectively, and does not receive approval from the FDIC, the loss sharing agreements are extended for a period of two years after the respective anniversaries. The loss sharing term is extended only with respect to the loans to be included in such sales. The Bank will have the right to sell all or any portion of such loans without FDIC consent, at any time within nine months prior to the respective extended termination dates.
In connection with the pre-approval of loan sales under the loss sharing agreement, the Bank may sell, in 2010, up to approximately $280 million of covered residential and commercial loans. Management has not concluded as to whether they will exercise the right and, if so, which covered loans may be sold. As such, the Company is unable to quantify any potential gain or loss related to this provision of the agreement. Any gain or loss will be significantly offset by a corresponding adjustment to the FDIC indemnification asset.
The Bank has determined that the Acquisition of the net assets of BankUnited, FSB constitutes a business combination as defined by the FASB ASC Topic 805,Business Combinations. Accordingly, the assets acquired and liabilities assumed were recorded at their fair values. Fair values were determined based on the requirements of FASB ASC Topic 820,Fair Value Measurements. The determination of the initial fair value of loans purchased in the acquisition and the initial fair value of the related FDIC indemnification asset involves a high degree of judgment and complexity. The carrying value of the acquired loans and the FDIC indemnification asset reflect management's best estimate of the amount to be realized on each of these assets. However, the amount the Company realizes on these assets could differ materially from the carrying value reflected in these consolidated financial statements, based upon the timing and amount of collections on the acquired loans in future periods. The fair value estimates require that management make assumptions about discount rates, future expected cash flows, market conditions and other future events that are highly subjective in nature and subject to change.
The Company believes that the FDIC loss-sharing agreement mitigates the Company's risk of loss on assets acquired. Nonetheless, to the extent the actual values realized for the acquired assets are different from the estimates, the FDIC indemnification asset will generally be impacted in an offsetting manner due to the loss sharing support from the FDIC. Additionally, the tax treatment of FDIC assisted acquisitions is complex and subject to interpretations that may result in future adjustments of deferred taxes as of the acquisition date.
The Bank recognized approximately $59.4 million of goodwill and a $1.8 million core deposit intangible in connection with this transaction. The amount of goodwill recorded represents the residual difference in the fair value of the net assets acquired by the Bank.
BANKUNITED, INC. AND SUBSIDIARIES
NOTES TO CONSOLIDATED FINANCIAL STATEMENTS (Continued)
December 31, 2009
Note 2 Acquisition (Continued)
The following table summarizes the reconciliation of the carrying amount of the acquired assets and assumed liabilities to their fair value as of the acquisition date (in thousands):
| | As Recorded by BankUnited FSB | Acquisition Fair Value Adjustments | As Recorded by the Company | ||||||||
|---|---|---|---|---|---|---|---|---|---|---|---|
Assets | |||||||||||
Cash and cash equivalents | $ | 1,160,321 | $ | — | $ | 1,160,321 | |||||
Investment securities, at fair value | 608,388 | (69,444 | ) | 538,944 | |||||||
FHLB stock | 243,334 | — | 243,334 | ||||||||
Loans held in portfolio, net | 11,174,232 | (6,163,904 | ) | 5,010,328 | |||||||
FDIC receivable | — | 69,444 | 69,444 | ||||||||
FDIC indemnification asset | — | 3,442,890 | 3,442,890 | ||||||||
Bank owned life insurance | 129,111 | — | 129,111 | ||||||||
Other real estate owned | 199,819 | (22,140 | ) | 177,679 | |||||||
Deferred tax asset, net | — | 37,269 | 37,269 | ||||||||
Goodwill and other intangible assets | — | 61,150 | 61,150 | ||||||||
Other assets | 95,171 | (44,696 | ) | 50,475 | |||||||
Total assets | 13,610,376 | (2,689,431 | ) | 10,920,945 | |||||||
Liabilities | |||||||||||
Deposits | 8,225,916 | 108,566 | 8,334,482 | ||||||||
Securities sold under agreements to repurchase | 1,310 | — | 1,310 | ||||||||
FHLB advances | 4,429,350 | 201,264 | 4,630,614 | ||||||||
Advance payments by borrowers for taxes and insurance | 52,362 | — | 52,362 | ||||||||
Other liabilities | 59,137 | (567 | ) | 58,570 | |||||||
Total liabilities | 12,768,075 | 309,263 | 13,077,338 | ||||||||
Due to (from) FDIC for net assets acquired (liabilities assumed) | $ | 842,301 | $ | (2,998,694 | ) | $ | (2,156,393 | ) | |||
The following is a description of the methods used to determine the fair values of significant assets and liabilities presented above.
Cash and cash equivalents, other assets, securities sold under agreements to repurchase and escrows:
The carrying amount of these assets is a reasonable estimate of fair value based on the short-term nature of these assets.
Investment securities:
Fair values for securities are based on quoted market prices, where available. If quoted market prices are not available, fair value estimates are based on observable inputs including quoted market prices for similar instruments, quoted market prices that are not in an active market or other inputs that are observable in the market. In the absence of observable inputs, fair value is estimated based on pricing models and/or discounted cash flow methodologies.
BANKUNITED, INC. AND SUBSIDIARIES
NOTES TO CONSOLIDATED FINANCIAL STATEMENTS (Continued)
December 31, 2009
Note 2 Acquisition (Continued)
FHLB stock:
Investment in FHLB stock is recognized at cost as a reasonable estimate for fair value, as these instruments represent restricted securities that had no evidence of impairment.
Loans:
Fair values for loans were based on a discounted cash flow methodology that considered factors including the type of loan and related collateral, delinquency and credit classification status, fixed or variable interest rate, term of loan and whether or not the loan was amortizing, and current discount rates. Additional assumptions used include default rates, loss severity, payment curves, loss curves and prepayment speeds. Certain residential loans were grouped together according to similar characteristics and were treated in the aggregate when applying various valuation techniques. The discount rates used for loans are based on market rates for new originations of comparable loans at the time of acquisition, and include adjustments for liquidity concerns.
FDIC receivable:
The FDIC receivable represents the amount due from the FDIC related to a dispute of the purchase price of certain investment securities for which the FDIC assigned a value that the Company believes is higher than the price required by the FSB Agreement.
The purchase and assumption agreement with the FDIC incorporates dispute resolution procedures that describe the process by which disputes regarding interpretation, application, calculation of loss or calculation of payments regarding the loss share must be resolved. The Company recognized a receivable from the FDIC in the amount of $69.4 million representing the purchase price dispute related to certain investment securities which the Company believes were assigned a value by the FDIC that was higher than required by the FSB Agreement. In 2009, the Company recognized an impairment charge on the full amount of the FDIC receivable due to concerns over collectability.
See Note 22,Subsequent Events, for additional discussion of the purchase price dispute.
FDIC indemnification asset:
Fair value was estimated using projected cash flows related to the loss sharing agreements based on the expected reimbursements of the losses and the applicable loss sharing percentages. These cash flows were discounted using a risk-free yield curve plus a premium reflecting the uncertainty related to the collection, amounts and timing of the cash flows and other liquidity concerns.
Bank owned life insurance:
The fair value of bank owned life insurance is based on the cash surrender value of the underlying insurance contract.
OREO:
OREO is presented at the estimated fair value, net of related costs of disposal.
BANKUNITED, INC. AND SUBSIDIARIES
NOTES TO CONSOLIDATED FINANCIAL STATEMENTS (Continued)
December 31, 2009
Note 2 Acquisition (Continued)
Deferred tax asset, net:
Deferred tax asset, net represents the net tax-effected differences between the book basis and tax basis of certain acquired assets and liabilities including the acquired investment securities and loans, loss share receivable, time deposits and FHLB advances.
Goodwill and other intangible assets:
Goodwill:
The amount of goodwill recorded reflects the market share and related benefits that are expected to result from the acquisition, and represents the residual difference in the fair value of the net liability assumed by Company along with the payment from the FDIC for assuming this liability. The goodwill was assigned to BankUnited, as the Company's community banking segment.
Core deposit intangible:
This intangible asset represents the value of the relationships with deposit customers. The fair value of this intangible asset was estimated based on the present value of the expected cost savings attributable to the core deposit funding relative to an alternative source of funding. In determining the value, proper consideration was given to expected customer attrition rates, cost of the deposit base, reserve requirements and the net maintenance cost attributable to customer deposits.
Other assets:
The fair value of other assets was determined based on management's assessment of the collectability and realizability of such assets at acquisition date.
Deposits:
The fair values used for the demand and savings deposits that comprise the transaction accounts acquired equal the amount payable on demand at the acquisition date. The fair values for time deposits are estimated using a discounted cash flow calculation that applies interest rates being offered at the acquisition date to the contractual cash flows on such deposits.
Advances from FHLB:
The fair values of the FHLB advances are estimated using a discounted cash flow calculation that applies interest rates being offered at the acquisition date to the contractual cash flows on such advances.
Other liabilities:
The fair value of other liabilities is based primarily on the carrying amounts, which is a reasonable estimate based on the short-term nature of these liabilities. Included in other liabilities is the estimated fair value of the warrant issued to the FDIC in connection with the acquisition, amounting to $1.5 million.
BANKUNITED, INC. AND SUBSIDIARIES
NOTES TO CONSOLIDATED FINANCIAL STATEMENTS (Continued)
December 31, 2009
Note 2 Acquisition (Continued)
A summary of the covered loans acquired as of May 21, 2009 and the related discount is as follows (in thousands):
| | Acquired Credit-Impaired | | | |||||||||||||||
|---|---|---|---|---|---|---|---|---|---|---|---|---|---|---|---|---|---|---|
| | Unpaid Principal Balance | Additional Contractual Cash Flows | Total Estimated Contractual Cash Flows on Acquired Credit- Impaired Loans | Other Loans | Total | |||||||||||||
Real Estate Loans: | ||||||||||||||||||
One-to-four family residential | $ | 9,114,641 | $ | 4,047,208 | $ | 13,161,849 | $ | 212,847 | $ | 13,374,696 | ||||||||
Home equity loans and lines of credit | 284,222 | 82,164 | 366,386 | 220,434 | 586,820 | |||||||||||||
Multi-family | 124,785 | 48,072 | 172,857 | 6,032 | 178,889 | |||||||||||||
Commercial real estate | 566,990 | 245,204 | 812,194 | 40,582 | 852,776 | |||||||||||||
Construction | 187,025 | 99,338 | 286,363 | 377 | 286,740 | |||||||||||||
Land | 220,100 | 54,636 | 274,736 | 173 | 274,909 | |||||||||||||
Total real estate loans | 10,497,763 | 4,576,622 | 15,074,385 | 480,445 | 15,554,830 | |||||||||||||
Other Loans | ||||||||||||||||||
Commercial | 131,590 | 21,746 | 153,336 | 51,434 | 204,770 | |||||||||||||
Consumer | 13,000 | 348 | 13,348 | — | 13,348 | |||||||||||||
Total commercial and consumer loans | 144,590 | 22,094 | 166,684 | 51,434 | 218,118 | |||||||||||||
| $ | 10,642,353 | $ | 4,598,716 | 15,241,069 | 531,879 | 15,772,948 | ||||||||||||
Less: Non-accretable difference | 8,714,344 | — | 8,714,344 | |||||||||||||||
Cash flows expected to be collected | 6,526,725 | |||||||||||||||||
Accretable discount | 2,004,337 | 43,939 | 2,048,276 | |||||||||||||||
Total | $ | 4,522,388 | $ | 487,940 | $ | 5,010,328 | ||||||||||||
The estimated contractual cash flows for the acquired non-credit-impaired loans, at acquisition date was $713.0 million.
At December 31, 2009, the Company concluded that, other than new instances of impairment of certain ACI loans, there had been no material changes in the assumptions utilized to determine the fair value of assets acquired and liabilities assumed. Except for the aforementioned instances of impairment on ACI loans requiring specific reserves of $20.0 million described herein, expected cash flows and the present value of future cash flows related to assets acquired have not changed materially since the analysis performed at acquisition on May 21, 2009. Unpaid principal balances of acquired loans were reduced during the period ended December 31, 2009 by approximately $1.4 billion since the acquisition date through repayments by borrowers, loan sales, transfers to OREO and charge-offs of customer loan balances.
BANKUNITED, INC. AND SUBSIDIARIES
NOTES TO CONSOLIDATED FINANCIAL STATEMENTS (Continued)
December 31, 2009
Note 2 Acquisition (Continued)
The following table presents the components of the FDIC indemnification asset at May 21, 2009 (in thousands):
| | Loans | OREO | Total | ||||||||
|---|---|---|---|---|---|---|---|---|---|---|---|
Estimated portion of gross losses subject to FDIC indemnification | |||||||||||
Residential | $ | 4,119,357 | $ | 18,860 | $ | 4,138,217 | |||||
Commercial | 411,095 | — | 411,095 | ||||||||
Estimated portion of gross losses subject to FDIC indemnification | 4,530,452 | 18,860 | 4,549,312 | ||||||||
Fair value discount | 1,103,681 | 2,741 | 1,106,422 | ||||||||
FDIC indemnification asset at May 21, 2009 | $ | 3,426,771 | $ | 16,119 | $ | 3,442,890 | |||||
Changes in the FDIC indemnification asset for the period from May 22, 2009 through December 31, 2009 were as follows (in thousands):
Balance May 22, 2009 | $ | 3,442,890 | |||
Accretion | 149,544 | ||||
Reduction for claims filed | (290,701 | ) | |||
Loss on indemnification asset resulting from net recoveries | (22,568 | ) | |||
Balance December 31, 2009 | $ | 3,279,165 | |||
The Company recognizes additional covered losses or recoveries on FDIC indemnified assets through charges or credits, respectively, in the consolidated statement of income. The following table summarizes the components of the gains and losses associated with the resolution of covered FDIC indemnified assets (in thousands):
| | Transaction Income (Loss) | FDIC Indemnification Income (Loss) | Net Impact to Pre- Tax Earnings | |||||||||
|---|---|---|---|---|---|---|---|---|---|---|---|---|
Provision on covered loans | $ | (21,287 | ) | $ | 14,433 | $ | (6,854 | ) | ||||
Provision on loans not covered | (1,334 | ) | — | (1,334 | ) | |||||||
Total | (22,621 | ) | 14,433 | (8,188 | ) | |||||||
Income from resolution of covered assets, net | 120,954 | |||||||||||
Net loss on sale of loans | (47,078 | ) | ||||||||||
Total | 73,876 | (51,201 | ) | 22,675 | ||||||||
Net loss due to impairment of OREO | (21,055 | ) | 14,200 | (6,855 | ) | |||||||
Total | $ | 30,200 | $ | (22,568 | ) | $ | 7,632 | |||||
In connection with the loss sharing agreements with the FDIC, the Company will be reimbursed for a portion of certain expenses associated with covered assets, for which a loss has been incurred. This may result in the expenses and the related income from reimbursement being recorded in different periods. During the period ended December 31, 2009, the Company recognized $19.7$26.1 million of expenses subject to reimbursement under the loss sharing agreement and $8.1 million of
BANKUNITED, INC. AND SUBSIDIARIES
NOTES TO CONSOLIDATED FINANCIAL STATEMENTS (Continued)
December 31, 2009
Note 2 Acquisition (Continued)
reimbursement income associated with such expenses. The Company estimates that an additional $7.7$15.8 million, related to expenses incurred during the period ended December 31, 2009, will be filed for reimbursement with the FDIC in future periods.
Note 3 Investment Securities Available for Sale
Investment securities available for sale at December 31, 2009, are summarized as follows (in thousands):
| | Covered Securities | Not Covered Securities | ||||||||||||||||||||||||
|---|---|---|---|---|---|---|---|---|---|---|---|---|---|---|---|---|---|---|---|---|---|---|---|---|---|---|
| | | Gross Unrealized | | | Gross Unrealized | | ||||||||||||||||||||
| | Amortized Cost | Fair Value | Amortized Cost | Fair Value | ||||||||||||||||||||||
| | Gains | Losses | Gains | Losses | ||||||||||||||||||||||
U.S. Treasury securities | $ | — | $ | — | $ | — | $ | — | $ | 10,066 | $ | 6 | $ | — | $ | 10,072 | ||||||||||
U.S. Government agencies and sponsored enterprises mortgage-backed securities | — | — | — | — | 1,288,277 | 3,581 | (3,215 | ) | 1,288,643 | |||||||||||||||||
Other collateralized mortgage obligations | 1,747 | 89 | — | 1,836 | 508,731 | 1,007 | (4,735 | ) | 505,003 | |||||||||||||||||
Mortgage pass-through certificates | 199,402 | 51,196 | (480 | ) | 250,118 | 118,616 | — | (4,062 | ) | 114,554 | ||||||||||||||||
Mutual funds and preferred stocks | 18,094 | 338 | (698 | ) | 17,734 | 25,250 | 661 | (122 | ) | 25,789 | ||||||||||||||||
State and Municipal obligations | — | — | — | — | 23,214 | 143 | (1 | ) | 23,356 | |||||||||||||||||
Other debt securities | 3,331 | 2,707 | — | 6,038 | — | — | — | — | ||||||||||||||||||
Total | $ | 222,574 | $ | 54,330 | $ | (1,178 | ) | $ | 275,726 | $ | 1,974,154 | $ | 5,398 | $ | (12,135 | ) | $ | 1,967,417 | ||||||||
Investment securities available for sale at December 31, 2009, by contractual maturity, and adjusted for anticipated prepayments, are shown below (in thousands):
| | Amortized Cost | Fair Value | ||||||
|---|---|---|---|---|---|---|---|---|
Due in one year or less | $ | 426,872 | $ | 435,292 | ||||
Due after one year through five years | 1,045,895 | 1,067,208 | ||||||
Due after five years through ten years | 444,442 | 453,503 | ||||||
Due after ten years | 236,175 | 243,617 | ||||||
Mutual funds and preferred stock | 43,344 | 43,523 | ||||||
Total | $ | 2,196,728 | $ | 2,243,143 | ||||
Based on BankUnited's proprietary model and assumptions, the weighted average life of the mortgage-backed securities portfolio as of December 31, 2009 was 4.5 years. The model results are based on assumptions that may differ from the eventual outcome.
BANKUNITED, INC. AND SUBSIDIARIES
NOTES TO CONSOLIDATED FINANCIAL STATEMENTS (Continued)
December 31, 2009
Note 3 Investment Securities Available for Sale (Continued)
The Company monitors its investment securities available for sale for OTTI. Impairment is evaluated on an individual security basis considering numerous factors, and their relative significance varies depending on the situation. The following table shows aggregate fair value and the aggregate amount by which cost exceeds fair value of investments that are in a loss position at December 31, 2009 (in thousands):
| | Fair Value | Unrealized Losses | ||||||
|---|---|---|---|---|---|---|---|---|
Available for sale securities: | ||||||||
U.S. Government agencies and sponsored enterprises mortgage-backed securities | $ | 812,669 | $ | (3,215 | ) | |||
Other collateralized mortgage obligations | 340,846 | (4,735 | ) | |||||
Mortgage pass-through certificates | 115,872 | (4,542 | ) | |||||
Mutual funds and preferred stocks | 27,257 | (820 | ) | |||||
State and municipal obligations | 1,109 | (1 | ) | |||||
Total | $ | 1,297,753 | $ | (13,313 | ) | |||
The Company has evaluated the nature of unrealized losses in the available for sale securities to determine if OTTI exists. The unrealized losses relate to specific market conditions and do not represent credit-related impairments. Furthermore, the Company does not intend to sell these securities and it is more likely than not that it will be able to retain the securities for a period of time sufficient for a recovery in value to the amortized cost basis. Management has completed an assessment of each security for credit impairment and has determined that no individual security had OTTI as of December 31, 2009. The following describes the basis under which the Company has evaluated OTTI.
U.S. Government agencies and sponsored enterprises mortgage-backed securities ("MBS"):
The unrealized losses associated with U.S. Government agencies and Sponsored Enterprises MBS are primarily driven by changes in interest rates. These securities have either an explicit or implicit government guarantee.
Other collateralized mortgage obligations ("CMO") and mortgage pass-through certificates:
These securities are assessed for impairment using a third-party developed model, and proprietary behavioral assumptions using default and loss severity levels, and Voluntary Annual Prepayment Rates ("VPRs"). The results of this evaluation were not indicative of deterioration in expected cash flows or OTTI at December 31, 2009.
Mutual funds and preferred stock:
The Company evaluates its investment in mutual funds for OTTI based on the quoted market value per share. The preferred stock in the investment portfolio was issued by U.S. Government sponsored enterprises.
BANKUNITED, INC. AND SUBSIDIARIES
NOTES TO CONSOLIDATED FINANCIAL STATEMENTS (Continued)
December 31, 2009
Note 3 Investment Securities Available for Sale (Continued)
State and municipal obligations:
The securities were generally underwritten in accordance with the Company's own investment standards prior to the decision to purchase, without relying on a bond issuer's guarantee in making the investment decision. These investments are mostly investment grade and will continue to be monitored as part of our ongoing impairment analysis, but are expected to perform in accordance with terms, even if the rating agencies reduce the credit rating of the bond issuers.
The fair values of the Company's investment securities could decline in the future if the underlying performance of the collateral for the residential MBS or other securities deteriorate and the Company's credit enhancement levels do not provide sufficient protection to the Company's contractual principal and interest. As a result, there is a risk that OTTI may occur in the future.
Proceeds from sale of investment securities available for sale during the period ended December 31, 2009 amounted to $9.3 million, resulting in gross realized losses of $381,000 and gross realized gains of $44,000, respectively, which is included in other non-interest income in the consolidated statement of income.
As part of the Company's liquidity management strategy, the Company pledges securities to secure borrowings from the FHLB. The Company also pledges securities to collateralize public deposits and securities sold under agreements to repurchase and due to the Federal Reserve. The carrying value of pledged securities totaled $618.0 million at December 31, 2009.
Note 4 FHLB Stock
BankUnited, as a member institution of the Federal Home Loan Bank of Atlanta, is required to own capital stock in the FHLB. The required stock ownership is based generally on (i) membership requirement and (ii) activity based requirement related to the levels that BankUnited borrows from the FHLB. In connection therewith, the Bank holds stock with the aggregate carrying value of $243.3 million. The stock is restricted and can only be repurchased by the FHLB. No market exists for this stock and there is no quoted market price. Redemption of FHLB stock has historically been at par value, which is BankUnited's carrying value. The redemption of any excess stock BankUnited holds is at the discretion of the FHLB. Stock redemptions have recently been limited due to the FHLB's objective of increasing liquidity.
While the Company currently has no intentions to terminate its FHLB membership, the ability to redeem its investment in FHLB stock would be subject to the conditions imposed by the FHLB. Based on the capital adequacy and the liquidity position of the FHLB, management believes there is no impairment related to the carrying amount of the Company's FHLB stock as of December 31, 2009. The Company will continue to monitor its investment in FHLB stock through the review of recent financial results, dividend payment history and information from credit agencies.
BANKUNITED, INC. AND SUBSIDIARIES
NOTES TO CONSOLIDATED FINANCIAL STATEMENTS (Continued)
December 31, 2009
Note 5 Loans
At December 31, 2009, loans receivable consisted of the following (amounts in thousands):
| | December 31, 2009 | |||||||||||||||||
|---|---|---|---|---|---|---|---|---|---|---|---|---|---|---|---|---|---|---|
| | Covered Loans | | | | ||||||||||||||
| | Acquired Credit Impaired | Non-ACI | Non-Covered Loans | Total | Percent of Total | |||||||||||||
Real Estate Loans: | ||||||||||||||||||
1-4 single family residential | $ | 3,306,306 | $ | 184,669 | $ | 43,110 | $ | 3,534,085 | 75.98 | % | ||||||||
Home equity loans and lines of credit | 113,578 | 215,591 | 1,615 | 330,784 | 7.11 | % | ||||||||||||
Multi-family | 71,321 | 4,971 | 700 | 76,992 | 1.66 | % | ||||||||||||
Commercial real estate | 363,965 | 39,733 | 24,460 | 428,158 | 9.20 | % | ||||||||||||
Construction | 44,812 | 377 | — | 45,189 | 0.97 | % | ||||||||||||
Land | 43,903 | 173 | — | 44,076 | 0.95 | % | ||||||||||||
Total real estate loans | 3,943,885 | 445,514 | 69,885 | 4,459,284 | 95.87 | % | ||||||||||||
Other Loans: | ||||||||||||||||||
Commercial | 81,765 | 48,635 | 51,565 | 181,965 | 3.91 | % | ||||||||||||
Consumer | 7,065 | — | 3,151 | 10,216 | 0.22 | % | ||||||||||||
Total commercial and consumer loans | 88,830 | 48,635 | 54,716 | 192,181 | 4.13 | % | ||||||||||||
Total loans | 4,032,715 | 494,149 | 124,601 | 4,651,465 | 100.00 | % | ||||||||||||
Unearned discounts and deferred fees and costs, net | — | (39,986 | ) | 40 | (39,946 | ) | ||||||||||||
Loans net of discount and deferred costs | 4,032,715 | 454,163 | 124,641 | 4,611,519 | ||||||||||||||
Allowance for loan losses | (20,021 | ) | (1,266 | ) | (1,334 | ) | (22,621 | ) | ||||||||||
Loans, net | $ | 4,012,694 | $ | 452,897 | $ | 123,307 | $ | 4,588,898 | ||||||||||
Covered loans represent loans acquired from the FDIC subject to the loss sharing agreements. Loans originated by the company after May 21, 2009 are excluded from the loss sharing agreement and are classified as other loans (not covered). At December 31, 2009, ACI loans had unpaid principal balances of $9.3 billion.
At December 31, 2009, the majority of all outstanding loans were to customers domiciled in Florida (63.8%), California (6.8%), Illinois (4.8%) New Jersey (4.7%) and Arizona (4.1%). No other state represented borrowers with more than 4.0% of loans outstanding.
During the period from May 22, 2009 through December 31, 2009, the Company sold acquired credit-impaired loans to various third parties on a non-recourse basis with a carrying value of $129.8 million for total gross cash proceeds of $84.6 million, including $3.1 million in escrow advances. The Company incurred transaction costs of $1.9 million and recognized a loss on sale of $47.1 million.
As part of the Company's liquidity management strategy, the Company pledges loans to secure FHLB borrowings. Pledged loans must meet specific requirements of eligibility and the unpaid principal balance is discounted based on criteria established by the FHLB. As of December 31, 2009, the
BANKUNITED, INC. AND SUBSIDIARIES
NOTES TO CONSOLIDATED FINANCIAL STATEMENTS (Continued)
December 31, 2009
Note 5 Loans (Continued)
Company had pledged real estate loans with a carrying value and unpaid principal balance of approximately $2.8 billion and $6.1 billion, respectively, ($3.0 billion in lendable collateral value) for advances from the FHLB.
The following table presents total 1-4 single family residential loans categorized between fixed rate mortgages and adjustable rate mortgages ("ARMs") as of December 31, 2009 (amounts in thousands):
| | December 31, 2009 | |||||||||||||||||
|---|---|---|---|---|---|---|---|---|---|---|---|---|---|---|---|---|---|---|
| | Covered Loans | | | | ||||||||||||||
| | Acquired Credit Impaired | Non-ACI | Non-Covered Loans | Total | Percent of Total | |||||||||||||
1-4 single family residential loans: | ||||||||||||||||||
Fixed rate loans | $ | 569,529 | $ | 76,342 | $ | 42,577 | $ | 688,448 | 19.5 | % | ||||||||
ARM Loans | 2,736,777 | 108,327 | 533 | 2,845,637 | 80.5 | % | ||||||||||||
Total(1) | $ | 3,306,306 | $ | 184,669 | $ | 43,110 | $ | 3,534,085 | 100 | % | ||||||||
Included in ARM loans above are payment option ARMs representing 46.8% of total loans outstanding, excluding deferred costs, unearned discounts, premiums and allowance for loan losses as of December 31, 2009.
The accretable yield on credit-impaired loans represents the amount by which the undiscounted expected cash flows exceed the carrying value. The following table presents the changes in the accretable yield related to acquired credit-impaired loans for the period from May 22, 2009 through December 31, 2009 (in thousands):
| | Accretable Yield | ||||
|---|---|---|---|---|---|
Balance at May 22, 2009 | $ | 2,004,337 | |||
Accretion during the period | (270,104 | ) | |||
Balance at December 31, 2009 | $ | 1,734,233 | |||
The Company has established a process to determine the adequacy of the allowance for loan losses that assesses the risks and losses inherent in the portfolio. As of December 31, 2009, the Company evaluated the expected cash flows for ACI loans and determined that credit deterioration had occurred in certain residential pools. As a result, a provision for loan losses amounting to $20.0 million was recorded applicable to ACI loans. The Bank recorded $14.4 million in non-interest income (included in net loss on indemnification asset resulting from net recoveries), representing the estimated present value increase in the FDIC indemnification asset.
BANKUNITED, INC. AND SUBSIDIARIES
NOTES TO CONSOLIDATED FINANCIAL STATEMENTS (Continued)
December 31, 2009
Note 5 Loans (Continued)
The following table summarizes changes in the allowance for loan losses for the period from May 22, 2009 through December 31, 2009 (in thousands):
Balance as of May 22, 2009 | $ | — | |||
Provision for losses on ACI loans | 20,021 | ||||
Provision for losses on non-ACI loans | 1,266 | ||||
Provision for losses on non-covered loans | 1,334 | ||||
Net charge-offs/recoveries | — | ||||
Balance as of December 31, 2009 | $ | 22,621 | |||
The total allowance reflects management's estimate of credit losses inherent in the loan portfolio at the balance sheet date. The computation of the allowance for loan losses includes elements of judgment and high level of subjectivity. The Company considers the allowance for loan losses to be adequate to cover credit losses inherent in the loan portfolio at December 31, 2009.
Certain loans have been classified as impaired based on the Company's inability to collect all amounts due under the contractual terms of the loan. The following table shows the Company's investment in impaired and non-performing loans as of and for the period ended December 31, 2009 (in thousands):
| | Acquired Credit Impaired Loans on Accrual Status(1) | Non-ACI Impaired Loans on Non-Accrual Status | Specific Allowance Allocated to Impaired Loans | Average Recorded Investment in Impaired Loans | |||||||||||
|---|---|---|---|---|---|---|---|---|---|---|---|---|---|---|---|
Covered loans: | |||||||||||||||
1-4 single family residential | $ | 567,253 | $ | 14,495 | $ | 20,021 | $ | 13,295 | |||||||
Home equity loans and lines of credit | — | 2,726 | — | 1,418 | |||||||||||
Commercial | — | 150 | 30 | 37 | |||||||||||
Total | $ | 567,253 | $ | 17,371 | $ | 20,051 | $ | 14,750 | |||||||
1-4 single family residential ACI loans are treated as pools and are classified as accruing loans due to discount accretion. In addition, the total carrying value of ACI loans accounted for as pools that are past due in excess of ninety days for either principal or interest or both amounts to $1.2 billion at December 31, 2009.
Had loans in non-accrual status been in accrual, the Company would have recognized additional interest income of approximately $636,000 for the period ended December 31, 2009.
BANKUNITED, INC. AND SUBSIDIARIES
NOTES TO CONSOLIDATED FINANCIAL STATEMENTS (Continued)
December 31, 2009
Note 6 Office Properties and Equipment, net
Included in other assets are office properties and equipment, net. At December 31, 2009 office properties and equipment, net are summarized as follows (in thousands):
Branch buildings | $ | 2,130 | |||
Leasehold improvements | 7 | ||||
Furniture, fixtures and equipment | 6,034 | ||||
Computer equipment and software | 3,676 | ||||
Total | 11,847 | ||||
Less: accumulated depreciation | (1,201 | ) | |||
Office properties and equipment, net | $ | 10,646 | |||
In connection with the acquisition of certain assets and assumption of certain liabilities of BankUnited, FSB, the Company purchased assets from the FDIC for a total purchase price of $6.9 million. Depreciation expense was $1.2 million during the period ended December 31, 2009.
The Company and its subsidiaries lease premises and equipment under cancelable and non-cancelable leases, some of which contain renewal options under various terms. The leased properties are used primarily for banking purposes. Total rental expense on operating leases for the period ended December 31, 2009, was $9.3 million.
As of December 31, 2009, the Company had entered into non-cancelable operating leases with approximate minimum future rentals as follows (in thousands):
Years Ending December 31, | ||||||
2010 | $ | 8,665 | ||||
2011 | 8,728 | |||||
2012 | 8,451 | |||||
2013 | 7,214 | |||||
2014 | 5,196 | |||||
Thereafter through 2019 | 13,583 | |||||
Total | $ | 51,837 | ||||
Note 7 Other Real Estate Owned
An analysis of other real estate owned for the period from May 22, 2009 through December 31, 2009 follows (in thousands):
Balance at May 22, 2009 | $ | 177,679 | |||
Transfers from loan portfolio, net | 115,192 | ||||
Income from resolution of covered assets | 25,702 | ||||
Sales | (177,408 | ) | |||
Impairment loss | (21,055 | ) | |||
Balance at December 31, 2009 | $ | 120,110 | |||
BANKUNITED, INC. AND SUBSIDIARIES
NOTES TO CONSOLIDATED FINANCIAL STATEMENTS (Continued)
December 31, 2009
Note 7 Other Real Estate Owned (Continued)
As of December 31, 2009, all of the Company's other real estate owned was covered under the loss sharing agreements.
Note 8 Deposits
At December 31, 2009, BankUnited had outstanding non-interest bearing deposits of $332.9 million and interest bearing deposits of $7.3 billion.
The following table sets forth average amounts and weighted average rates paid on each of BankUnited's deposit categories for the period ended December 31, 2009 (amounts in thousands):
| | Amount | Rate | ||||||
|---|---|---|---|---|---|---|---|---|
Transaction accounts, demand: | ||||||||
Non-interest bearing | $ | 303,810 | 0.00 | % | ||||
Interest bearing | 183,416 | 0.79 | % | |||||
Money market accounts | 1,205,446 | 1.93 | % | |||||
Savings accounts | 948,000 | 1.94 | % | |||||
Time deposits | 5,506,320 | 3.32 | % | |||||
Total average deposits | $ | 8,146,992 | 2.77 | % | ||||
Time deposits accounts with balances of $100,000 or more totaled approximately $1.9 billion at December 31, 2009, including $463.1 million with balances of $250,000 or more. The following table sets forth maturities of time deposits equal to or greater than $100,000 as of December 31, 2009 (in thousands):
Three months or less | $ | 415,049 | |||
Over 3 months through 6 months | 394,805 | ||||
Over 6 months through 12 months | 684,966 | ||||
Over 12 months through 24 months | 316,882 | ||||
Over 24 months through 36 months | 44,828 | ||||
Over 36 months through 48 months | 22,099 | ||||
Over 48 months through 60 months | 27,538 | ||||
Total | $ | 1,906,167 | |||
Included in the table above are $196.9 million of time deposits issued to the State of Florida which are collateralized by mortgage-backed securities with a fair value of $269.0 million at December 31, 2009.
Interest expense on deposits includes a reduction for amortization of the fair value adjustment for time deposits amounting to $79.9 million during the period from May 22, 2009 through December 31,
BANKUNITED, INC. AND SUBSIDIARIES
NOTES TO CONSOLIDATED FINANCIAL STATEMENTS (Continued)
December 31, 2009
Note 8 Deposits (Continued)
2009. Interest expense on deposits for the period ended December 31, 2009, is as follows (in thousands):
Transaction and money market accounts | $ | 15,173 | |||
Savings accounts | 11,295 | ||||
Time deposits | 31,361 | ||||
Total | $ | 57,829 | |||
Note 9 Securities Sold under Agreements to Repurchase
The following sets forth information concerning repurchase agreements for the period ended December 31, 2009 (amounts in thousands):
Maximum amount of outstanding agreements at any month end during the period | $ | 2,972 | ||
Average amount outstanding during the period | $ | 2,091 | ||
Weighted average interest rate for the period | 0.02 | % |
As of December 31, 2009, the Company had pledged mortgage-backed securities with a fair value of approximately $5.1 million for securities sold under agreements to repurchase. The agreements are overnight agreements with an average interest rate of 0.01% at December 31, 2009.
Note 10 Advances from the FHLB
Advances from the FHLB outstanding as of December 31, 2009 incur interest and have contractual repayments as follows (amounts in thousands):
| | Amount | Range of Interest Rates | |||||||||
|---|---|---|---|---|---|---|---|---|---|---|---|
Repayable during the year ending December 31, | |||||||||||
2010 | $ | 405,000 | 4.93 | % | 4.99 | % | |||||
2012 | 540,000 | 3.33 | % | 4.83 | % | ||||||
2013 | 565,000 | 2.38 | % | 4.77 | % | ||||||
2014 | 505,000 | 3.91 | % | 4.48 | % | ||||||
2015 | 350 | 0.00 | % | 0.00 | % | ||||||
Total contractual outstanding | 2,015,350 | ||||||||||
Fair value adjustment | 63,701 | ||||||||||
Total carrying value | $ | 2,079,051 | |||||||||
The fair value adjustment is being amortized as a reduction to interest expense over the remaining term of the advances using the effective yield method. The fair value amortization amounted to $25.1 million during the period ended December 31, 2009.
The terms of a security agreement with the FHLB include a specific assignment of collateral that requires the maintenance of qualifying first mortgage, commercial real estate loans, home equity lines of credit and mortgage-backed securities as pledged collateral with unpaid principal amounts at least
BANKUNITED, INC. AND SUBSIDIARIES
NOTES TO CONSOLIDATED FINANCIAL STATEMENTS (Continued)
December 31, 2009
Note 10 Advances from the FHLB (Continued)
equal to 100% of the FHLB advances, when discounted at various percentages of their unpaid principal balance. As of December 31, 2009 the Company had pledged investment securities and mortgage loans with an aggregate carrying amount of approximately $3.0 billion for advances from the FHLB.
During the period ended December 31, 2009, the Company elected to prepay $2.71 billion of FHLB advances with a carrying value of $2.83 billion, for an aggregate cash payment of $2.80 billion. The Company recognized a gain of $31.3 million on extinguishment of debt.
Also, during the period ended December 31, 2009, the Company restructured $505.0 million in principal amount of FHLB Advances. The original advances had a weighted average interest rate and maturity of 3.69% and 1.8 years at the date of restructuring, respectively, and the new advances have a weighted average interest rate and maturity of 4.22% and 4.8 years, respectively. No gain or loss was recognized on the restructuring transactions.
Note 11 Derivative Financial Instruments and Hedging Activities
The Company uses interest rate swaps to manage interest rate risks. Certain products and instruments used to finance its operations expose the Company to variability in interest payments due to changes in interest rates. These products and instruments include FHLB advances and certain time deposits.
Management believes it is prudent to limit the variability of short and long term interest payments for FHLB advances and certain time deposits. To meet this objective, management enters into LIBOR-based interest rate swaps to manage fluctuations in cash flows resulting from interest rate risk attributable to changes in the benchmark interest rate of LIBOR.
During the period ended December 31, 2009, no derivative positions were discontinued, and hence no amount of the gains and losses reported into Accumulated Other Comprehensive Income ("AOCI") were reclassified into earnings as a result of the discontinuance of cash flow hedges or because of the early extinguishment of debt.
The following tables set forth certain information concerning the Company's derivative financial instruments, which are included in other assets (liabilities) representing a gain or (loss), respectively, in the accompanying consolidated balance sheet, and related hedged items at December 31, 2009 (amounts in thousands):
| | | | | | | Fair value | |||||||||||||||
|---|---|---|---|---|---|---|---|---|---|---|---|---|---|---|---|---|---|---|---|---|---|
| | | | | Remaining Life (years) | Notional Amount | ||||||||||||||||
| | Hedged item | Pay Rate | Receive Rate | Gain | Loss | ||||||||||||||||
Derivatives designated as cash flow hedges: | |||||||||||||||||||||
Pay-fixed interest rate swaps: | |||||||||||||||||||||
Certificates of deposit | Variability of interest rates | 3.11% | 12-Month Libor | 5.9 | $ | 225,000 | $ | 1,517 | $ | — | |||||||||||
Purchased interest rate forward-starting swaps: | |||||||||||||||||||||
Advances from FHLB | Variability of interest rates | 3.42%-3.76% | 3-Month Libor | 5.0-7.0 | 405,000 | — | (4,016 | ) | |||||||||||||
Total | $ | 630,000 | $ | 1,517 | $ | (4,016 | ) | ||||||||||||||
BANKUNITED, INC. AND SUBSIDIARIES
NOTES TO CONSOLIDATED FINANCIAL STATEMENTS (Continued)
December 31, 2009
Note 11 Derivative Financial Instruments and Hedging Activities (Continued)
Changes in the fair value of interest rate swaps designated as hedging instruments of the variability of cash flows associated with floating-rate debt obligations are reported in AOCI. These amounts subsequently are reclassified into interest expense as a yield adjustment in the same period in which the related interest on the floating-rate debt obligations affects earnings.
Effective hedge results initially recorded in AOCI and subsequently reclassified into earnings increased interest expense by $678,000 in the period ended December 31, 2009. This amount was offset by a gain of $280,000 due to hedge ineffectiveness arising from differences between the critical terms of the interest rate swap and the hedged debt obligation. Net interest expense relating to interest rate swaps was $398,000, representing less than one half of one percent of the Company's total interest expense for the period ended December 31, 2009.
Note 12 Regulatory Capital
BankUnited's regulatory capital levels at December 31, 2009 were as follows (amounts in thousands):
| | Actual | Required to be considered well-capitalized | Required to be considered adequately | ||||||||||||||||
|---|---|---|---|---|---|---|---|---|---|---|---|---|---|---|---|---|---|---|---|
| | Ratio | Amount | Ratio | Amount | Ratio | Amount | |||||||||||||
Tier 1 leverage ratio(1) | 8.78 | % | $ | 966,749 | 8.00 | % | $ | 880,865 | 8.00 | % | $ | 880,865 | |||||||
Tier 1 risk-based capital ratio | 40.42 | % | 966,749 | 6.00 | % | 143,506 | 4.00 | % | 95,670 | ||||||||||
Total risk based capital ratio | 40.55 | % | 969,716 | 10.00 | % | 239,141 | 8.00 | % | 191,313 | ||||||||||
For purposes of risk based capital computations, the FDIC Indemnification asset, as well as covered assets, are risk-weighted at 20% due to the conditional guarantee represented by the loss sharing agreements.
Regulations from the Office of Thrift Supervision ("OTS") require that savings institutions submit notice to the OTS prior to making a capital distribution if (a) they would not be well-capitalized after the distribution, (b) the distribution would result in the retirement of any of the institution's common or preferred stock or debt counted as its regulatory capital, or (c) like the Bank, the institution is a subsidiary of a holding company.
A savings institution must apply to the OTS to pay a capital distribution if (a) the institution would not be adequately capitalized following the distribution, (b) the institution's total distributions for the calendar year exceeds the institution's net income for the calendar year to date plus its net income (less distributions) for the preceding two years, or (c) the distribution would otherwise violate applicable law or regulation or an agreement with or condition imposed by the OTS.
If neither the savings institution nor the proposed capital distribution meet any of the foregoing criteria, then no notice or application is required to be filed with the OTS before making a capital
BANKUNITED, INC. AND SUBSIDIARIES
NOTES TO CONSOLIDATED FINANCIAL STATEMENTS (Continued)
December 31, 2009
Note 12 Regulatory Capital (Continued)
distribution. The OTS may disapprove or deny a capital distribution if in the view of the OTS, the capital distribution would constitute an unsafe or unsound practice.
In connection with the approval order for BankUnited, the Company submitted a business plan to the OTS. Under the business plan, the Company has committed to the OTS that the Bank will not declare or pay any dividends during the first year of operations. Subsequent declaration and payment of dividends may be limited by regulation or by guidelines prescribed in the business plan.
Note 13 Stock-Based Compensation and Other Benefit Plans
Stock-Based Compensation
On July 9, 2009, the Company adopted a stock compensation plan (the "Plan") pursuant to which the Company's Board of Directors may grant up to 2,312,500 stock options of the Company to key employees of the Company and its affiliates. Stock options can be granted with an exercise price equal to or greater than the stock's fair value at the date of grant. The Company's Board of Directors determine the time or times (currently 3 years) at which a stock option shall vest or become exercisable, provided however, that each stock option shall expire on the tenth anniversary of the date of the grant, unless it is earlier exercised or forfeited. Shares of Common Stock delivered under the Plan may be authorized but unsold Common Stock, or previously issued Common Stock acquired by the Company. Unvested stock options may vest before the end of the scheduled vesting term in cases of change in control of the Company.
The grant-date fair value of each option award is estimated on the date of grant. Management has used information provided by third parties to assist in the determination of estimates regarding fair values associated with the Company's stock options.
Since the Company's shares are not publicly traded and its shares are not traded privately, expected volatility is estimated based on a range of the average historical volatility of similar entities with publicly traded shares. The risk-free rate for the expected term of the option is based on the U.S. Treasury yield curve at the date of grant. Because the Company has no historical information, the Company used the contractual term as the expected term and no expected forfeitures were assumed. The expected dividend yield was determined based on the expected dividends to be declared. The weighted average assumptions for 2009 are provided in the following table:
Expected volatility | 27.30 | % | ||
Expected dividend yield | 3.50 | % | ||
Expected term (years) | 10 | |||
Risk-free interest rate | 3.85 | % |
BANKUNITED, INC. AND SUBSIDIARIES
NOTES TO CONSOLIDATED FINANCIAL STATEMENTS (Continued)
December 31, 2009
Note 13 Stock-Based Compensation and Other Benefit Plans (Continued)
A summary of the status of stock options as of and for the period ended December 31, 2009 is as follows:
| | | Weighted average | ||||||||||||
|---|---|---|---|---|---|---|---|---|---|---|---|---|---|---|
| | Number | Remaining Contractual Term | Fair Value | Excercise Price | ||||||||||
Balance April 28, 2009 | — | — | $ | — | $ | — | ||||||||
Granted | 384,680 | 9.74 | 6.47 | 11.32 | ||||||||||
Vested | — | — | — | — | ||||||||||
Canceled or forfeited | — | — | — | — | ||||||||||
Nonvested options at December 31, 2009 | 384,680 | 9.74 | $ | 6.47 | $ | 11.32 | ||||||||
Remaining options available for grant under the Plan | 1,927,820 | |||||||||||||
The options have an aggregate intrinsic value of $2.5 million. The options have a weighted average fair value at grant date of $2.5 million. As of December 31, 2009, none of the options are vested. At December 31, 2009, there was $2.3 million of total unrecognized compensation cost related to unvested stock options granted under the Plan. That cost is expected to be recognized over a weighted average period of 2.74 years.
Deferred Compensation Plan
Effective October 1, 2009, the Company established a non-qualified deferred compensation plan (the "Deferred Compensation Plan") for a select group of management or highly-compensated employees whereby a participant, upon election, defers a portion of eligible compensation into an account with the Company. The Deferred Compensation Plan provides for Company contributions equal to 4.5% of eligible compensation for the period ended December 31, 2009. For subsequent years, Company contributions are equal to 100% of the first 1%, plus 70% of the next 5% of eligible compensation the participant defers. The Company accrued interest on the deferred obligation at an annual rate of 6% for the period ended December 31, 2009. The Company will continue to credit each participants' account at an annual rate of 6% through the year ending December 31, 2010 and thereafter at an amount determined by the Company's Compensation Committee. A participant's elective deferrals and interest thereon are at all times 100% vested. Company contributions and interest thereon will become 100% vested upon the earlier of a change of control or the participant's death, disability, attainment of normal retirement age or the completion of two years of service. Participant deferrals and any associated earnings shall be paid upon separation from service or the specified distribution year elected. The specified distribution year can be no earlier than the third calendar year after the calendar year in which the participant deferrals and or Company contributions are made. A participant may elect to be paid in a lump sum or in five, ten or fifteen annual installments. Deferred compensation expense for this plan was $103,000 for the period ended December 31, 2009.
BankUnited 401(k) Plan
The Company sponsors the BankUnited 401(k) Plan, a tax-qualified, deferred compensation plan, (the "401(k) Plan"). Under the terms of the 401(k) Plan, eligible employees may contribute up to the
BANKUNITED, INC. AND SUBSIDIARIES
NOTES TO CONSOLIDATED FINANCIAL STATEMENTS (Continued)
December 31, 2009
Note 13 Stock-Based Compensation and Other Benefit Plans (Continued)
limits set by law. Employees are eligible to participate in the plan after one month of service. Prior service with BankUnited, FSB counts towards the vesting period. BankUnited's matching contributions are fully vested after two years of service. The 401(k) Plan allows a matching employer contribution equal to 100% of elective deferrals that do not exceed 1% of compensation, plus 70% of elective deferrals that exceed 1% but are less that 6% of compensation. The matching contributions are made in the form of cash and allocated to the 401(k) Plan participants' investments. For the period ended December 31, 2009, BankUnited made matching contributions of approximately $788,000.
Note 14 Stockholder's Equity
On May 21, 2009, the Company's capital structure consisted of 1.0 million authorized and 925,000 issued shares of common stock with a par value of $0.01 per share. The common stock has voting rights of one vote per share. On November 5, 2009, the Board of Directors approved an increase in the number of authorized common shares from 1.0 million shares to 11.0 million shares. On November 5, 2009, the Board of Directors also authorized a 10-for-1 stock split on the outstanding shares resulting in 9,276,731 common shares. All share and per share data have been retroactively restated for all periods presented to reflect this stock split.
Note 15 Due to BUFH for Equity Awards Classified as Liabilities
Profits Interest Units of BUFH
PIU are only issued to management members of the Company who own common units of BUFH. As such, the related liability and expenses are recorded in the consolidated financial statements of the Company. The holders of PIU are not required to make any capital contribution to BUFH or the Company in exchange for their PIU. Furthermore, the holders of PIU are entitled to receive priority distribution catch-up payments in respect of Time-based PIU that have become vested and which did not participate in earlier interim distributions of profits.
The Board of BUFH has discretionary authority, but shall not be required, to allocate to any active management member or other employee of BUFH or the Company or its subsidiaries any unallocated PIU that may exist from time to time, including any PIU that are forfeited.
At December 31, 2009, the pool of IRR-based PIU and Time-based PIU consisted each of 51,500 PIU, all of which have been allocated to management members. In connection with anti-dilution provisions of BUFH, each time additional common units are issued in respect of each additional capital contribution, up to $1.2 billion in aggregate capital contributions, BUFH shall issue an additional number of IRR-based and Time-based PIU in respect of such capital contribution, so that the PIU retain the same relative economic interest as existed prior to the additional contribution. Additional PIU are not issued for capital contributions in excess of $1.2 billion.
Time-based PIU vest over a period of three years from the grant date, with earlier vesting permitted under certain circumstances. IRR-based PIU vest when the common unit holders of BUFH have received aggregate distributions equal to their original investment ($925.0 million) plus an aggregate internal rate of return equal to 15% (the IRR hurdle) per annum, compounded annually, on their original investment in BUFH.
BANKUNITED, INC. AND SUBSIDIARIES
NOTES TO CONSOLIDATED FINANCIAL STATEMENTS (Continued)
December 31, 2009
Note 15 Due to BUFH for Equity Awards Classified as Liabilities (Continued)
If BUFH or the Company completes an Initial Public Offering ("IPO") or change in control liquidity event, unvested IRR-based PIU of BUFH will convert into a combination of restricted shares and unvested stock options. Under the original terms of the IRR-based PIU, beginning four months after the IPO or change in control liquidity event and for each month thereafter, BUFH would have determined whether the IRR hurdle above had been met, assuming, among other things, that distributions were made to the common unit holders based on the volume and weighted average stock price of BUFH's shares in the 90-day period prior to such determination. If the IRR hurdle had been met, the stock options would have vested and the restrictions on the restricted stock would have lapsed. BUFH believes that the likelihood of vesting of the IRR-based PIU prior to an IPO or change in control liquidity event is remote. Therefore, under the original terms of the IRR-based PIU, BUFH and the Company would have recognized compensation expense related to IRR-based PIU upon consummation of an IPO or change in control liquidity event unless it had been less than probable that the IRR hurdle will be met. If and when it would have become probable in the future that the performance IRR hurdle will be met, a catch up adjustment would have been made. However, in October 2010, the Board of Directors of BUFH approved, contingent upon consummation of an IPO, the vesting of all issued and outstanding IRR-based PIU immediately prior to the IPO (See Note 22,Subsequent Events). At December 31, 2009, the estimated fair value of the IRR-based PIU was $43.8 million.
Fair value of PIU is estimated using a Black-Scholes option pricing model. This model requires assumptions as to expected volatility, dividends, terms, and risk free rates. Since the BUFH's Common Unit is not currently traded, expected volatility is measured based on the volatility of the common stock of peer companies. The expected term represents the period of time that PIU are expected to be outstanding from the grant date. The risk free interest rate is based on the U.S. Treasury yield curve in effect at the time of grant for the appropriate expected life of each unit. The Company uses the same assumptions in its evaluation of fair value of stock options and PIU.
The PIU agreements include certain provisions under which the holder of the PIU may have the right to sell to BUFH and BUFH has the obligation to purchase from the holder of the PIU, or BUFH may have the right to purchase from the PIU holder and the PIU holder has the obligation to sell to BUFH, the PIUs awarded to that holder at fair value or, under certain circumstances, at the lesser of cost or fair value.
The Company has classified these equity awards as a liability due to BUFH in the accompanying consolidated balance sheet, based on the relevant terms, conditions, and redemption features of these instruments. Included in compensation expense is approximately $8.8 million associated with the Time-based PIU for the period ended December 31, 2009.
BANKUNITED, INC. AND SUBSIDIARIES
NOTES TO CONSOLIDATED FINANCIAL STATEMENTS (Continued)
December 31, 2009
Note 15 Due to BUFH for Equity Awards Classified as Liabilities (Continued)
The following table summarizes information about time-based and performance based PIU at December 31, 2009:
| | Outstanding | |||||||
|---|---|---|---|---|---|---|---|---|
| | Number of units awarded | Weighted average fair value | ||||||
Time-based PIU as of December 31, 2009 | 51,500 | $ | 850.30 | |||||
IRR-based PIU as of December 31, 2009 | 51,500 | $ | 850.30 | |||||
Total awards | 103,000 | |||||||
At December 31, 2009, there is $78.8 million, including $35.0 million related to Time-based PIU and $43.8 million related to IRR-based PIU, of total unrecognized compensation cost related to unvested PIU granted.
Warrant to FDIC
In connection with the acquisition of certain assets and assumption of certain liabilities of BankUnited, FSB, BUFH issued a warrant to the FDIC. As such, the related liability and expense is recorded in the consolidated financial statements of the Company. The warrant becomes exercisable upon the occurrence of an IPO or exit event in which the total tangible equity value arising from the IPO or exit event exceeds a threshold value. Specifically, the value of the warrant (the "warrant value") equals 10% of the value BUFH or the Company realizes in an IPO or exit event in excess of the valuation that would be implied if BUFH or the Company was valued at the average price-to-tangible book value multiple for the top quartile of publicly-traded U.S. banks and thrifts in excess of $10 billion.
In the event that the warrant is exercisable due to an IPO, the FDIC will be entitled to acquire a number of common shares of the registrant equal to the amount obtained by dividing (i) the warrant value by (ii) the applicable IPO price minus the exercise price per share. If the exercisability event is an exit event, the FDIC will be entitled to acquire a number of common shares of the entity acquiring BUFH or the Company, equal to the amount obtained by dividing (i) the warrant value (ii) by the applicable exit event price minus the exercise price per share, unless the common shares do not meet certain criteria, in which case the FDIC shall receive substitute securities having an aggregate value of the sum of the warrant value and the exercise price. Nonetheless, in accordance with the terms of the warrant, BUFH or the Company could elect not to issue the required securities and in turn issue securities agreed upon by BUFH or the Company and the FDIC. The warrant has an exercise price equal to par value or if par value is $0.00, the exercise price will be $0.01.
The warrant has an original contractual life of 10 years and an exercise period of 60 days. At December 31, 2009, the warrant has a remaining contractual term of 9.39 years.
The warrant is redeemable by BUFH or the Company for cash after it becomes exercisable at a redemption price equal to the warrant value. The Company has classified this warrant as a liability to BUFH in the accompanying consolidated balance sheet. Included in other liabilities is approximately $3.2 million related the fair value of this instrument as of December 31, 2009. The Company has
BANKUNITED, INC. AND SUBSIDIARIES
NOTES TO CONSOLIDATED FINANCIAL STATEMENTS (Continued)
December 31, 2009
Note 15 Due to BUFH for Equity Awards Classified as Liabilities (Continued)
recognized expense of $1.7 million related to the increase in fair value of this instrument for the period since May 22, 2009 through December 31, 2009.
See Note 22,Subsequent Events, for additional discussion of the warrant issued to the FDIC.
Note 16 Income Taxes
The components of the provision for income taxes for the period ended December 31, 2009 is as follows (in thousands):
Current income tax expense | ||||||
Federal | $ | 70,910 | ||||
State | 11,790 | |||||
Total current income tax expense | 82,700 | |||||
Deferred income tax expense (benefit) | ||||||
Federal | (1,994 | ) | ||||
State | (331 | ) | ||||
Total deferred income tax benefit | (2,325 | ) | ||||
| $ | 80,375 | |||||
A reconciliation of the expected income tax expense at the statutory federal income tax rate of 35% to the Company's actual income tax expense and effective tax rate for the period ended December 31, 2009 is as follows (amounts in thousands):
| | Amount | % | |||||||
|---|---|---|---|---|---|---|---|---|---|
Tax expense at federal income tax rate | $ | 69,797 | 35.00 | % | |||||
Increases resulting from: | |||||||||
State tax, net of federal benefit | 7,448 | 3.73 | % | ||||||
Liability for PIU | 3,078 | 1.54 | % | ||||||
Other, net | 52 | 0.03 | % | ||||||
Total | $ | 80,375 | 40.30 | % | |||||
Deferred income tax assets and liabilities result from temporary differences between assets and liabilities measured for financial reporting purposes and for income tax return purposes. These assets and liabilities are measured using the enacted tax rates and laws that are currently in effect and are
BANKUNITED, INC. AND SUBSIDIARIES
NOTES TO CONSOLIDATED FINANCIAL STATEMENTS (Continued)
December 31, 2009
Note 16 Income Taxes (Continued)
reported net in the accompanying consolidated balance sheet. The significant components of the net deferred tax assets and liabilities at December 31, 2009 were as follows (in thousands):
Deferred tax assets: | |||||||
Excess tax basis of assets acquired over carrying value | |||||||
Loans | $ | 524,140 | |||||
Investment securities | 15,159 | ||||||
| 539,299 | |||||||
Fair value adjustments on liabilities assumed | 35,632 | ||||||
Acquisition costs | 14,756 | ||||||
Provision for loan loss | 3,159 | ||||||
Impairment losses on OREO | 1,624 | ||||||
Unrealized losses included in other comprehensive income | 1,546 | ||||||
Other | 1,234 | ||||||
Gross deferred tax assets | 597,250 | ||||||
Deferred tax liabilities: | |||||||
Deferred tax gain | 448,863 | ||||||
Excess carrying value of investment securities acquired over tax basis | 106,617 | ||||||
Unrealized gains included in other comprehensive income | 18,607 | ||||||
Other | 630 | ||||||
Gross deferred tax liabilities | 574,717 | ||||||
Net deferred tax asset | $ | 22,533 | |||||
Realization of tax benefits for deductible temporary differences depends on having sufficient taxable income of an appropriate character within the carryforward periods. Sources of taxable income that may allow for the realization of these tax benefits include: (1) taxable income for the period ended December 31, 2009 that would be available through carryback in future years, (2) future taxable income that will result from reversal of existing taxable temporary differences, including the negative tax on goodwill, and (3) taxable income generated from future operations. Management has evaluated the probability of realization of the deferred tax asset and believes that it is more likely than not that the deferred tax asset will be realized.
Note 17 Commitments and Contingencies
The Company issues off-balance sheet financial instruments in connection with BankUnited's lending activities and to meet the financing needs of its customers. These financial instruments include commitments to fund loans, lines of credit, and commercial and standby letters of credit. These commitments expose the Company to varying degrees of credit and market risk which are essentially the same as those involved in extending loans to customers, and are subject to the Company's credit policies. The Company follows the same credit policies in making commitments as it does for instruments recorded on the Company's consolidated balance sheet. Collateral is obtained based on management's assessment of the customer's credit risk. The Company's exposure to credit loss is represented by the contractual amount of these commitments. Amounts funded under non-cancelable
BANKUNITED, INC. AND SUBSIDIARIES
NOTES TO CONSOLIDATED FINANCIAL STATEMENTS (Continued)
December 31, 2009
Note 17 Commitments and Contingencies (Continued)
commitments in effect at the date of acquisition are covered under the loss sharing agreement if certain conditions are met.
Financial Instruments Commitments
Total commitments at December 31, 2009 were as follows (in thousands):
| | Commitments | | ||||||||||
|---|---|---|---|---|---|---|---|---|---|---|---|---|
| | Covered | Not Covered | Total | |||||||||
Commitments to fund loans | ||||||||||||
Residential | $ | — | $ | 2,495 | $ | 2,495 | ||||||
Commercial and commercial real estate | — | 21,606 | 21,606 | |||||||||
Construction | 19,140 | 15,528 | 34,668 | |||||||||
Unfunded commitments under lines of credit | 229,756 | 33,201 | 262,957 | |||||||||
Commercial and standby letters of credit | — | 11,175 | 11,175 | |||||||||
Total | $ | 248,896 | $ | 84,005 | $ | 332,901 | ||||||
Commitments to fund loans:
These are agreements to lend funds to customers as long as there is no violation of any condition established in the contract. Commitments to fund loans generally have fixed expiration dates or other termination clauses and may require payment of a fee. Many of these commitments are expected to expire without being funded and, therefore, the total commitment amounts do not necessarily represent future liquidity requirements. The Company evaluates each customer's creditworthiness on a case-by-case basis. The amount of collateral required in connection with an extension of credit is based on management's credit evaluation of the counter-party.
Unfunded commitments under lines of credit:
To accommodate the financial needs of customers, the Company makes commitments under various terms to lend funds to consumers and businesses. Unfunded commitments under lines of credit include consumer, commercial, and commercial real estate lines of credit to existing customers. Many of these commitments have fixed expiration dates or other termination clauses and may require payment of a fee. Since many of these commitments are expected to expire without being funded, the total commitment amounts do not necessarily represent future liquidity requirements. The amount of collateral obtained, if it is deemed necessary by BankUnited, is based on management's credit evaluation of the customer.
Commercial and standby letters of credit:
Letters of credit are conditional commitments issued by the Company to guarantee the performance of a customer to a third party. Those letters of credit are primarily issued to support trade transactions or guarantee arrangements. Fees collected on standby letters of credit represent the fair value of those commitments and are deferred and amortized over their term, which is typically one year or less. The credit risk involved in issuing letters of credit is essentially the same as that involved in
BANKUNITED, INC. AND SUBSIDIARIES
NOTES TO CONSOLIDATED FINANCIAL STATEMENTS (Continued)
December 31, 2009
Note 17 Commitments and Contingencies (Continued)
extending loan facilities to customers. BankUnited generally holds collateral supporting those commitments if deemed necessary.
Other Commitments
Employment Agreements:
The Company has employment and change in control agreements with certain members of senior management. The employment agreements, which establish the duties and compensation of the executives, have terms ranging from one year to three years, with provisions for extensions, and include specific provisions for salary, bonus, other benefits and termination payments in certain circumstances.
Legal Proceedings
The Company, from time to time, is involved as plaintiff or defendant in various legal actions arising in the normal course of business. While the ultimate outcome of any such proceedings cannot be predicted with certainty, it is the opinion of management, based upon advice of legal counsel, that no proceedings exist, either individually or in the aggregate, which, if determined adversely to the Company, would have a material effect on the Company's consolidated balance sheet, results of operations or cash flows.
Note 18 Related Party Transactions
In association with the acquisition of certain assets and assumption of certain liabilities of BankUnited, FSB on May 21, 2009, the Company paid fees and other costs to related parties in the amount of $20.0 million and $2.5 million, respectively.
BANKUNITED, INC. AND SUBSIDIARIES
NOTES TO CONSOLIDATED FINANCIAL STATEMENTS (Continued)
December 31, 2009
Note 19 BankUnited, Inc.
The following summarizes the major categories of BankUnited, Inc.'s (holding company only) Balance Sheet at December 31, 2009 (in thousands):
Condensed Balance Sheet
Assets: | ||||||
Cash and cash equivalents | $ | 27,717 | ||||
Deferred tax asset, net | 13,623 | |||||
Investment in subsidiary | 1,055,196 | |||||
Due from subsidiary | 7,323 | |||||
Other assets | 3,167 | |||||
Total assets | $ | 1,107,026 | ||||
Liabilities and Stockholder's Equity: | ||||||
Due to parent—Equity awards classified as liabilities | $ | 11,961 | ||||
Other liabilities | 805 | |||||
Total liabilities | 12,766 | |||||
Stockholder's equity | 1,094,260 | |||||
Total liabilities and stockholder's equity | $ | 1,107,026 | ||||
The following summarizes the major categories of BankUnited, Inc.'s (holding company only) Statement of Income for the period ended December 31, 2009 (in thousands):
Condensed Statement of Income
Non-interest income: | ||||||
Service charges | $ | 3,183 | ||||
Equity in income of subsidiary | 152,943 | |||||
Total non-interest income | 156,126 | |||||
Non-interest expense: | ||||||
Employee compensation and benefits | 12,124 | |||||
Acquisition related costs | 39,800 | |||||
Other non-interest expense | 1,111 | |||||
Total non-interest expense | 53,035 | |||||
Income before income taxes | 103,091 | |||||
Income tax benefit | (15,955 | ) | ||||
Net income | $ | 119,046 | ||||
BANKUNITED, INC. AND SUBSIDIARIES
NOTES TO CONSOLIDATED FINANCIAL STATEMENTS (Continued)
December 31, 2009
Note 19 BankUnited, Inc. (Continued)
The following summarizes the major categories of BankUnited, Inc.'s (holding company only) Statement of Cash Flows for the period ended December 31, 2009 (in thousands):
Condensed Statements of Cash Flows
Cash flows from operating activities: | |||||||
Net income | $ | 119,046 | |||||
Adjustments to reconcile net income to net cash used in operating activities: | |||||||
Equity in undistributed earnings of subsidiary | (152,943 | ) | |||||
Expense on equity awards classified as liabilities | 10,497 | ||||||
Compensation expense on non-vested stock options | 210 | ||||||
Deferred income tax benefit | (13,057 | ) | |||||
Increase in due from subsidiary | (6,424 | ) | |||||
Increase in other assets | (3,167 | ) | |||||
Increase in other liabilities | 805 | ||||||
Net cash used in operating activities | (45,033 | ) | |||||
Cash flows from investing activities: | |||||||
Capital contributions to subsidiary | (875,000 | ) | |||||
Net cash used in investing activities | (875,000 | ) | |||||
Cash flows from financing activities: | |||||||
Capital contribution | 947,750 | ||||||
Net cash provided by financing activities | 947,750 | ||||||
Increase in cash and cash equivalents | 27,717 | ||||||
Cash and cash equivalents at beginning of period | — | ||||||
Cash and cash equivalents at ending of period | $ | 27,717 | |||||
Note 20 Fair Value Measurements
The Company groups its assets and liabilities measured at fair value in three levels, based on the markets in which the assets and liabilities are traded and the reliability of the assumptions used to determine fair value. These levels are as follows:
Level 1—Assets or liabilities for which the identical item is traded on an active exchange, such as publicly-traded instruments or futures contracts.
Level 2—Assets and liabilities valued based on observable market data for similar instruments.
Level 3—Assets or liabilities for which significant valuation assumptions are not readily observable in the market; instruments valued based on the best available data, some of which is internally-developed, and considers risk premiums that a market participant would require. Valuation techniques include use of option pricing models, discounted cash flow models and similar techniques.
BANKUNITED, INC. AND SUBSIDIARIES
NOTES TO CONSOLIDATED FINANCIAL STATEMENTS (Continued)
December 31, 2009
Note 20 Fair Value Measurements (Continued)
In instances where there is limited or no observable market data, fair value measurements for assets and liabilities are based primarily upon the Company's own estimates or combination of such estimates and independent vendor or broker pricing. When determining the fair value measurements for assets and liabilities and the related fair value hierarchy, the Company considers the principal or most advantageous market in which it would transact and considers assumptions that market participants would use when pricing the asset or liability (observable inputs). When possible, the Company looks to active and observable markets to price identical assets or liabilities and when identical assets and liabilities are not traded in active markets, the Company looks to market observable data for similar assets and liabilities. It is the Company's policy to maximize the use of observable inputs and minimize the use of unobservable inputs. Unobservable inputs are only used to measure fair value to the extent that observable inputs are not available. The need to use unobservable inputs generally results from the lack of market liquidity, resulting in diminished observability of both actual trades and assumptions that would otherwise be available to value these instruments, or the value of the underlying collateral is not market observable. Although third party price indications may be available for a security, limited trading activity would make it difficult to support the observability of these quotations.
The following is a description of the valuation methodologies used for assets and liabilities measured at fair value on a recurring basis, as well as the general classification of each instrument under the valuation hierarchy:
Assets and Liabilities Carried at Fair Value on a Recurring Basis
Investment securities available for sale—Investment securities available-for-sale are carried at fair value on a recurring basis. When available, fair value is based on quoted prices in an active market and, as such, would be classified as Level 1 (e.g., U.S. Government agencies and sponsored enterprises securities, preferred stock of U.S. Government agencies and mutual funds). If quoted market prices are not available, fair values are estimated using quoted prices of securities with similar characteristics, discounted cash flows or other pricing models. Investment securities available for sale that the Company classifies as Level 2 include U.S. Government agencies mortgage-backed securities and collateralized mortgage obligations, preferred stock of other issuers and State and municipal obligations. All other investment securities available for sale are classified as Level 3 and include private label mortgage pass-through certificates, collateralized debt obligations and other debt securities, for which fair value estimation requires the use of unobservable inputs. The Company values these securities using third party proprietary pricing models that incorporate observable and unobservable inputs.
Derivative financial instruments—Interest rate swaps are predominantly traded in over-the-counter markets and, as such, values are determined using widely accepted discounted cash flow models, or Level 2 measurements. These discounted cash flow models use projections of future cash payments/receipts that are discounted at mid-market rates. These valuations are adjusted for the unsecured credit risk at the reporting date, which considers collateral posted and the impact of master netting agreements.
Equity awards classified as liabilities—The estimated fair value of equity awards is derived primarily using the Black-Scholes option pricing model. Since the Company's Common Stock is not
BANKUNITED, INC. AND SUBSIDIARIES
NOTES TO CONSOLIDATED FINANCIAL STATEMENTS (Continued)
December 31, 2009
Note 20 Fair Value Measurements (Continued)
publicly traded in an exchange, significant inputs to the model are not market observable, resulting in Level 3 measurement.
The following table presents the financial instruments measured at fair value on a recurring basis as of December 31, 2009, on the consolidated balance sheet utilizing the hierarchy discussed above (in thousands):
| | Level 1 | Level 2 | Level 3 | Total | |||||||||||
|---|---|---|---|---|---|---|---|---|---|---|---|---|---|---|---|
Investment Securities Available for Sale: | |||||||||||||||
U.S. Treasury securities | $ | 10,072 | $ | — | $ | — | $ | 10,072 | |||||||
U.S. Government agencies and government sponsored entities mortgage-backed securities | — | 1,288,643 | — | 1,288,643 | |||||||||||
Other collateralized mortgage obligations | — | — | 506,839 | 506,839 | |||||||||||
Mortgage pass-through certificates | — | — | 364,672 | 364,672 | |||||||||||
Mutual funds and preferred stocks | 17,646 | 25,877 | — | 43,523 | |||||||||||
State and Municipal obligations | — | 23,106 | 250 | 23,356 | |||||||||||
Other debt securities | — | 2,760 | 3,278 | 6,038 | |||||||||||
Derivative assets | — | 1,517 | — | 1,517 | |||||||||||
Total assets at fair value | $ | 27,718 | $ | 1,341,903 | $ | 875,039 | $ | 2,244,660 | |||||||
Equity awards classified as liabilities | $ | — | $ | — | $ | 11,961 | $ | 11,961 | |||||||
Derivative liabilities | — | 4,016 | — | 4,016 | |||||||||||
Total liabilities at fair value | $ | — | $ | 4,016 | $ | 11,961 | $ | 15,977 | |||||||
The following table includes changes in Level 3 financial instruments that are measured at fair value on a recurring basis as of December 31, 2009. Level 3 financial instruments typically include unobservable components, but may also include some observable components that may be validated to external sources. The gains or (losses) in the following table may include changes to fair value due in part to unobservable factors that may be part of the valuation methodology (in thousands):
| | Other Collateralized Mortgage Obligations | Mortgage Pass-thru Certificates | State and Municipal Obligations | Other Debt Securities | Equity Awards classified as liabilities | ||||||||||||
|---|---|---|---|---|---|---|---|---|---|---|---|---|---|---|---|---|---|
Balance at May 22, 2009 | $ | 1,785 | $ | 230,092 | $ | 250 | $ | 1,676 | $ | (1,464 | ) | ||||||
Total net gains (losses) for the period included in: | |||||||||||||||||
Net income (losses) | — | — | — | — | (10,497 | ) | |||||||||||
Other comprehensive income (loss), gross | (3,639 | ) | 46,654 | — | 1,400 | — | |||||||||||
Purchases, sales or settlements, net | 507,263 | 69,161 | — | (73 | ) | — | |||||||||||
Discount amortization | 1,430 | 18,765 | — | 275 | — | ||||||||||||
Net transfer in/out of Level 3 | — | — | — | — | — | ||||||||||||
Balance at December 31, 2009 | $ | 506,839 | $ | 364,672 | $ | 250 | $ | 3,278 | $ | (11,961 | ) | ||||||
BANKUNITED, INC. AND SUBSIDIARIES
NOTES TO CONSOLIDATED FINANCIAL STATEMENTS (Continued)
December 31, 2009
Note 20 Fair Value Measurements (Continued)
Assets and Liabilities Measured at Fair Value on a Non-Recurring Basis
Loans and other real estate owned are measured for impairment using the fair value of the collateral or real estate owned and they are carried at the lower of cost or estimated fair value. Fair value of the loan collateral or real estate owned property is primarily determined using estimates which generally use the market and income approach valuation technique and use observable market data to formulate an opinion of the estimated fair value. When current appraisals are not available, we use our judgment regarding changes in market conditions, based on observable market inputs, to adjust the latest appraised value available. As a result, the estimated fair value is considered Level 3. As of December 31, 2009, the Company had $120.1 million of other real estate owned and did not have any collateral dependent impaired loans. Impairment write-downs on real estate owned for the period ended December 31, 2009, amounted to $21.1 million.
Goodwill, other intangible assets and FDIC indemnification asset are initially recorded at estimated fair value and measured for impairment on a non-recurring basis. These assets are reviewed for impairment at least annually, or whenever events or changes in circumstances indicate the carrying amount may not be recoverable. The estimated fair value of these assets are based on the market and income approach using significant assumptions that are unobservable in the market. As a result, the estimated fair value is considered Level 3.
Note 21 Fair Value of Financial Instruments
The following table presents the carrying value and fair value of financial instruments as of December 31, 2009 (in thousands):
| | Carrying Value | Fair Value | |||||||
|---|---|---|---|---|---|---|---|---|---|
Assets: | |||||||||
Cash and cash equivalents | $ | 356,215 | $ | 356,215 | |||||
Investment securities available for sale | 2,243,143 | 2,243,143 | |||||||
FHLB stock | 243,334 | 243,334 | |||||||
Loans held in portfolio | |||||||||
Covered | 4,465,591 | 5,138,549 | |||||||
Not covered | 123,307 | 128,778 | |||||||
FDIC Indemnification asset | 3,279,165 | 3,279,165 | |||||||
Bank owned life insurance | 132,330 | 132,330 | |||||||
Accrued interest receivable | 9,591 | 9,591 | |||||||
Derivative assets | 1,517 | 1,517 | |||||||
Liabilities: | |||||||||
Demand deposits, savings, money market and certificates of deposit | $ | 7,666,775 | $ | 7,690,422 | |||||
Securities sold under agreements to repurchase | 2,972 | 2,972 | |||||||
Advances from the FHLB | 2,079,051 | 2,114,431 | |||||||
Due to FDIC | 114,006 | 114,006 | |||||||
Accrued interest payable | 12,561 | 12,561 | |||||||
Income taxes payable | 82,701 | 82,701 | |||||||
Advance payments by borrowers for taxes and insurance | 31,237 | 31,237 | |||||||
Other liabilities | 30,421 | 30,421 | |||||||
Equity awards classified as liabilities | 11,961 | 11,961 | |||||||
Derivative liabilities | 4,016 | 4,016 | |||||||
BANKUNITED, INC. AND SUBSIDIARIES
NOTES TO CONSOLIDATED FINANCIAL STATEMENTS (Continued)
December 31, 2009
Note 21 Fair Value of Financial Instruments (Continued)
The following methods and assumptions were used to estimate the fair value of each class of financial instruments not carried at fair value on recurring basis:
Certain financial instruments are carried at amounts that approximate fair value, due to their short-term nature or their generally negligible credit risk. The Company's financial instruments for which fair value approximates the carrying amount at December 31, 2009, include cash and cash equivalents, FHLB stock, FDIC indemnification asset, accrued interest receivable, demand deposits, savings and money market accounts, securities sold under agreements to repurchase, due to FDIC, accrued interest payable, income taxes payable, advance payments by borrowers for taxes and insurance and other liabilities.
Investment securities available for sale:
When available, fair value is based on quoted prices in an active market and as such, would be classified as Level 1 (e.g., U.S. Government agencies and sponsored enterprises securities, preferred stock of U.S. Government agencies and mutual funds). If quoted market prices are not available, fair values are estimated using quoted prices of securities with similar characteristics, discounted cash flows or other pricing models. Investment securities available for sale that the Company classifies as Level 2 include U.S. Government agencies, mortgage-backed securities and collateralized mortgage obligations, preferred stock of other issuers and State and municipal obligations. All other investment securities available for sale are classified as Level 3 and include private label mortgage pass-through certificates, collateralized debt obligations and other debt securities, for which fair value estimation requires the use of unobservable inputs. The Company values these securities using third party proprietary pricing models that incorporate observable and unobservable inputs.
Loans receivable, covered:
Fair values for loans were based on a discounted cash flow methodology that considered various factors including the type of loan and related collateral, classification status, fixed or variable interest rate, term of loan and whether or not the loan was amortizing, and current discount rates. Loans were grouped together according to similar characteristics and were treated in the aggregate when applying various valuation techniques. The discount rates used for loans are based on current market rates for new originations of comparable loans and include adjustments for liquidity concerns. The estimated fair value is not an exit price fair value under ASC 820Fair Value Measurement and Disclosures, when this valuation technique is used.
Loans receivable, not covered:
Fair values for all performing loans are estimated using a discounted cash flow analysis, utilizing interest rates currently being offered for loans with similar terms to borrowers of similar credit quality. In addition, the fair value reflects the decrease in loan values as estimated in the allowance for loan losses calculation. The estimated fair value is not an exit price fair value under ASC 820Fair Value Measurement and Disclosures, when this valuation technique is used.
BANKUNITED, INC. AND SUBSIDIARIES
NOTES TO CONSOLIDATED FINANCIAL STATEMENTS (Continued)
December 31, 2009
Note 21 Fair Value of Financial Instruments (Continued)
Bank Owned Life Insurance:
The estimated fair value of Bank Owned Life Insurance is based on the cash surrender value of the underlying insurance contracts.
Deposits:
The fair value of demand deposits, savings accounts and money market deposits is the amount payable on demand at the reporting date. The fair value of fixed-maturity time deposits are estimated using discounted cash flow analysis using the rates currently offered for deposits of similar remaining maturities.
Advances from the FHLB:
The fair value of the borrowings is estimated by discounting the future cash flows using the current rate at which similar borrowings with similar remaining maturities could be made.
Equity awards classified as liabilities:
The estimated fair value of equity awards is derived primarily using the Black-Scholes option pricing model. Since the Company's Common Stock is not publicly traded in an exchange, significant inputs to the model are not market observable.
Derivative financial instruments:
Fair values are determined using discounted cash flow models. These discounted cash flow models use projections of future cash payments/receipts that are discounted at mid-market rates. These valuations are adjusted for the unsecured credit risk at the reporting date, which considers collateral posted and the impact of master netting agreements.
Note 22 Subsequent Events
Subsequent events have been evaluated through the date that the consolidated financial statements were available to be issued. The Company has not identified any events that would have a material impact on the financial position, result of operations or cash flows of the Company as of and for the period ended December 31, 2009. The following items represent significant events that occurred subsequent to December 31, 2009:
Settlement of FDIC dispute:
During October 2010, the Company reached a settlement with the FDIC regarding the Company's dispute on the purchase price assigned to certain investment securities acquired. Under the settlement, the Company received $24.1 million from the FDIC. The Company will recognize the results of this settlement in 2010.
BANKUNITED, INC. AND SUBSIDIARIES
NOTES TO CONSOLIDATED FINANCIAL STATEMENTS (Continued)
December 31, 2009
Note 22 Subsequent Events (Continued)
Minimum guaranteed value on the FDIC warrant:
During October 2010, the Company amended the warrant issued to the FDIC to guarantee a minimum value to the FDIC in the amount of $25.0 million. The Company will recognize the difference between the recorded liability of $3.2 million at December 31, 2009, and the guaranteed minimum value of the warrant in 2010.
Dividends declared:
In September 2010, BankUnited declared a dividend of $30 million to BankUnited, Inc., which was paid in October 2010. BankUnited, Inc. has declared $20 million in dividends to BUFH, which will be paid in October 2010.
IRR-based PIU:
In October 2010, the Board of Directors of BUFH approved, contingent upon consummation of an IPO, the vesting of all issued and outstanding IRR-based PIU immediately prior to the IPO.
Name change:
Effective October 22, 2010, BU Financial Corporation changed its name to BankUnited, Inc.
Stock split:
The Board of Directors authorized a 10-for-1 split of the Company's outstanding common shares effective January 10, 2011. Stockholder's equity has been retroactively adjusted to give effect to the stock split for all periods presented by reclassifying from paid-in capital to common stock the par value of the additional shares issued. All share and per share data have been retroactively restated for all periods presented to reflect this stock split.
Report of Independent Registered Certified Public Accounting Firm
To the Board of Directors and
Stockholders of BankUnited, Inc.:
We have audited the accompanying consolidated statements of financial condition of BankUnited FSB and its subsidiaries (the "Bank") as of May 21, 2009, September 30, 2008 and September 30, 2007, and the related consolidated statements of operations, of comprehensive (loss) income, of stockholder's equity (deficit), and of cash flows for the period from October 1, 2008 through May 21, 2009 and the fiscal years ended September 30, 2008 and 2007. These financial statements are the responsibility of the Bank's management. Our responsibility is to express an opinion on these financial statements based on our audits.
We conducted our audits in accordance with the standards of the Public Company Accounting Oversight Board (United States). Those standards require that we plan and perform the audit to obtain reasonable assurance about whether the financial statements are free of material misstatement. An audit includes examining, on a test basis, evidence supporting the amounts and disclosures in the financial statements. An audit also includes assessing the accounting principles used and significant estimates made by management, as well as evaluating the overall financial statement presentation. We believe that our audits provide a reasonable basis for our opinion.
In our opinion, the consolidated financial statements referred to above present fairly, in all material respects, the financial position of the Bank and its subsidiaries at May 21, 2009 and September 30, 2008 and 2007, and the results of their operations and their cash flows for each of the fiscal periods then ended in conformity with accounting principles generally accepted in the United States of America.
As discussed in Note 1 to the consolidated financial statements, the Office of Thrift Supervision seized the Bank on May 21, 2009, and named the Federal Deposit Insurance Corporation ("FDIC") as receiver. Immediately thereafter, substantially all assets and liabilities were acquired by BankUnited, a wholly-owned subsidiary of BankUnited, Inc.
/s/ PricewaterhouseCoopers LLP
Fort Lauderdale, Florida
October 27, 2010
BANKUNITED, FSB AND SUBSIDIARIES
CONSOLIDATED BALANCE SHEETS
As of May 21, 2009, September 30, 2008 and September 30, 2007
(In thousands)
| | | May 21, 2009 | September 30, 2008 | September 30, 2007 | | May 21, 2009 | September 30, 2008 | September 30, 2007 | ||||||||||||||||
|---|---|---|---|---|---|---|---|---|---|---|---|---|---|---|---|---|---|---|---|---|---|---|---|---|
ASSETS | ASSETS | ASSETS | ||||||||||||||||||||||
Cash and due from banks | Cash and due from banks | $ | 215,941 | $ | 169,543 | $ | 477,170 | Cash and due from banks | $ | 215,941 | $ | 169,543 | $ | 477,170 | ||||||||||
Due from Federal Reserve Bank | Due from Federal Reserve Bank | 919,755 | 76,983 | 34,057 | Due from Federal Reserve Bank | 919,755 | 76,983 | 34,057 | ||||||||||||||||
Federal funds sold | Federal funds sold | 7,584 | 976,820 | 1,658 | Federal funds sold | 7,584 | 976,820 | 1,658 | ||||||||||||||||
Cash and cash equivalents | 1,143,280 | 1,223,346 | 512,885 | Cash and cash equivalents | 1,143,280 | 1,223,346 | 512,885 | |||||||||||||||||
Investment securities available for sale, at fair value | Investment securities available for sale, at fair value | 538,944 | 755,225 | 1,098,665 | Investment securities available for sale, at fair value | 538,944 | 755,225 | 1,098,665 | ||||||||||||||||
Federal Home Loan Bank stock | Federal Home Loan Bank stock | 243,334 | 262,571 | 305,385 | Federal Home Loan Bank stock | 243,334 | 262,571 | 305,385 | ||||||||||||||||
Loans held for sale | Loans held for sale | 788 | 10,050 | 174,868 | Loans held for sale | 788 | 10,050 | 174,868 | ||||||||||||||||
Loans held in portfolio, net of discounts, premiums and deferred costs | Loans held in portfolio, net of discounts, premiums and deferred costs | 11,014,215 | 11,965,284 | 12,620,316 | Loans held in portfolio, net of discounts, premiums and deferred costs | 11,014,215 | 11,965,284 | 12,620,316 | ||||||||||||||||
Allowance for loan losses | (1,227,173 | ) | (715,917 | ) | (58,623 | ) | Allowance for loan losses | (1,227,173 | ) | (715,917 | ) | (58,623 | ) | |||||||||||
Loans held in portfolio, net | 9,787,042 | 11,249,367 | 12,561,693 | Loans held in portfolio, net | 9,787,042 | 11,249,367 | 12,561,693 | |||||||||||||||||
Bank owned life insurance | Bank owned life insurance | 129,111 | 126,956 | 122,100 | Bank owned life insurance | 129,111 | 126,956 | 122,100 | ||||||||||||||||
Other real estate owned | Other real estate owned | 177,679 | 135,324 | 27,732 | Other real estate owned | 177,679 | 135,324 | 27,732 | ||||||||||||||||
Deferred tax asset, net | Deferred tax asset, net | — | 50,306 | — | Deferred tax asset, net | — | 50,306 | — | ||||||||||||||||
Goodwill and other intangible assets | Goodwill and other intangible assets | 28,353 | 28,353 | 28,353 | Goodwill and other intangible assets | 28,353 | 28,353 | 28,353 | ||||||||||||||||
Other assets | Other assets | 212,331 | 247,093 | 275,629 | Other assets | 212,331 | 247,093 | 275,629 | ||||||||||||||||
Total assets | $ | 12,260,862 | $ | 14,088,591 | $ | 15,107,310 | Total assets | $ | 12,260,862 | $ | 14,088,591 | $ | 15,107,310 | |||||||||||
LIABILITIES AND STOCKHOLDER'S EQUITY (DEFICIT) | LIABILITIES AND STOCKHOLDER'S EQUITY (DEFICIT) | LIABILITIES AND STOCKHOLDER'S EQUITY (DEFICIT) | ||||||||||||||||||||||
Liabilities: | Liabilities: | Liabilities: | ||||||||||||||||||||||
Demand deposits: | Demand deposits: | |||||||||||||||||||||||
Non-interest bearing | $ | 247,646 | $ | 293,370 | $ | 557,901 | Non-interest bearing | $ | 247,646 | $ | 293,370 | $ | 557,901 | |||||||||||
Interest bearing | 155,906 | 170,051 | 225,901 | Interest bearing | 155,906 | 170,051 | 225,901 | |||||||||||||||||
Savings and money market | 1,682,937 | 1,253,324 | 1,980,966 | Savings and money market | 1,682,937 | 1,253,324 | 1,980,966 | |||||||||||||||||
Certificates of deposits | 6,469,418 | �� | 6,460,072 | 4,541,020 | Certificates of deposits | 6,469,418 | 6,460,072 | 4,541,020 | ||||||||||||||||
Total deposits | 8,555,907 | 8,176,817 | 7,305,788 | Total deposits | 8,555,907 | 8,176,817 | 7,305,788 | |||||||||||||||||
Securities sold under agreements to repurchase | 1,310 | 56,930 | 143,072 | Securities sold under agreements to repurchase | 1,310 | 56,930 | 143,072 | |||||||||||||||||
Advances from Federal Home Loan Bank | 4,429,350 | 5,279,350 | 6,234,360 | Advances from Federal Home Loan Bank | 4,429,350 | 5,279,350 | 6,234,360 | |||||||||||||||||
Deferred tax liability | — | — | 29,935 | Deferred tax liability | — | — | 29,935 | |||||||||||||||||
Income taxes payable | — | — | 20,843 | Income taxes payable | — | — | 20,843 | |||||||||||||||||
Advance payments by borrowers for taxes and insurance | 52,362 | 91,223 | 97,455 | Advance payments by borrowers for taxes and insurance | 52,362 | 91,223 | 97,455 | |||||||||||||||||
Other liabilities | 110,906 | 85,501 | 73,055 | Other liabilities | 110,906 | 85,501 | 73,055 | |||||||||||||||||
Total liabilities | 13,149,835 | 13,689,821 | 13,904,508 | Total liabilities | 13,149,835 | 13,689,821 | 13,904,508 | |||||||||||||||||
Commitments and contingencies | Commitments and contingencies | Commitments and contingencies | ||||||||||||||||||||||
Stockholder's Equity (Deficit) | Stockholder's Equity (Deficit) | Stockholder's Equity (Deficit) | ||||||||||||||||||||||
Common Stock, $0.01 par value, 100 shares authorized, issued and outstanding | — | — | — | Common Stock, $0.01 par value, 100 shares authorized, issued and outstanding | — | — | — | |||||||||||||||||
Paid-in capital | 793,928 | 793,928 | 713,928 | Paid-in capital | 793,928 | 793,928 | 713,928 | |||||||||||||||||
Retained earnings (deficit) | (1,589,662 | ) | (356,360 | ) | 502,027 | Retained earnings (deficit) | (1,589,662 | ) | (356,360 | ) | 502,027 | |||||||||||||
Accumulated other comprehensive loss, net of tax | (93,239 | ) | (38,798 | ) | (13,153 | ) | Accumulated other comprehensive loss, net of tax | (93,239 | ) | (38,798 | ) | (13,153 | ) | |||||||||||
Total stockholder's equity (deficit) | (888,973 | ) | 398,770 | 1,202,802 | Total stockholder's equity (deficit) | (888,973 | ) | 398,770 | 1,202,802 | |||||||||||||||
Total liabilities and stockholder's equity (deficit) | $ | 12,260,862 | $ | 14,088,591 | $ | 15,107,310 | Total liabilities and stockholder's equity (deficit) | $ | 12,260,862 | $ | 14,088,591 | $ | 15,107,310 | |||||||||||
The accompanying notes are an integral part of these consolidated financial statements.
BANKUNITED, FSB AND SUBSIDIARIES
CONSOLIDATED STATEMENTS OF OPERATIONS
For the Period from October 1, 2008 through May 21, 2009, and the Years Ended
September 30, 2008 and September 30, 2007
(In thousands, except per share amounts)
| | Period from October 1, 2008 through May 21, 2009 | Year Ended September 30, 2008 | Year Ended September 30, 2007 | ||||||||||
|---|---|---|---|---|---|---|---|---|---|---|---|---|---|
Interest income: | |||||||||||||
Interest and fees on loans | $ | 312,994 | $ | 762,170 | $ | 876,861 | |||||||
Interest and dividends on investment securities available for sale | 22,407 | 50,434 | 61,325 | ||||||||||
Interest and dividends on other interest-earning assets | 3,667 | 21,856 | 19,711 | ||||||||||
Total interest income | 339,068 | 834,460 | 957,897 | ||||||||||
Interest expense: | |||||||||||||
Interest on deposits | 199,570 | 292,855 | 302,335 | ||||||||||
Interest on borrowings | 133,822 | 262,739 | 302,223 | ||||||||||
Total interest expense | 333,392 | 555,594 | 604,558 | ||||||||||
Net interest income before provision for loan losses | 5,676 | 278,866 | 353,339 | ||||||||||
Provision for loan losses | 919,139 | 856,374 | 31,500 | ||||||||||
Net interest income (loss) after provision for loan losses | (913,463 | ) | (577,508 | ) | 321,839 | ||||||||
Non-interest income (loss): | |||||||||||||
Other than temporary impairment on investment securities available for sale | (68,609 | ) | (142,035 | ) | (5,042 | ) | |||||||
Amortization and impairment of mortgage servicing rights | (26,595 | ) | (8,434 | ) | (4,622 | ) | |||||||
Gain (loss) on sale of loans, net | 196 | (9,784 | ) | 9,777 | |||||||||
Service charges | 11,796 | 25,136 | 22,169 | ||||||||||
Gain (loss) on sale of investments, net | 39 | (1,465 | ) | (564 | ) | ||||||||
Other non-interest income | 1,742 | 7,723 | 6,649 | ||||||||||
Total non-interest income (loss) | (81,431 | ) | (128,859 | ) | 28,367 | ||||||||
Non-interest expense: | |||||||||||||
Employee compensation and benefits | 51,695 | 88,893 | 87,958 | ||||||||||
Occupancy and equipment | 25,247 | 46,743 | 41,187 | ||||||||||
Impairment and other real estate owned related expense | 73,439 | 40,650 | 608 | ||||||||||
Professional fees | 10,062 | 8,910 | 5,631 | ||||||||||
Foreclosure expense | 4,907 | 6,007 | 535 | ||||||||||
Deposit insurance expense | 38,299 | 6,147 | 3,119 | ||||||||||
Telecommunications and data processing | 9,573 | 13,536 | 13,019 | ||||||||||
Other non-interest expense | 25,181 | 35,594 | 33,577 | ||||||||||
Total non-interest expense | 238,403 | 246,480 | 185,634 | ||||||||||
Income (loss) before income taxes | (1,233,297 | ) | (952,847 | ) | 164,572 | ||||||||
Income tax expense (benefit) | — | (94,462 | ) | 55,067 | |||||||||
Net income (loss) | $ | (1,233,297 | ) | $ | (858,385 | ) | $ | 109,505 | |||||
Earnings (Loss) Per Share: | |||||||||||||
Basic | $ | (12,332,970 | ) | $ | (8,583,850 | ) | $ | 1,095,054 | |||||
Weighted average number of common shares outstanding: | |||||||||||||
Basic | 100 | 100 | 100 | ||||||||||
The accompanying notes are an integral part of these consolidated financial statements.
BANKUNITED, FSB AND SUBSIDIARIES
CONSOLIDATED STATEMENTS OF CASH FLOWS
For the Period from October 1, 2008 through May 21, 2009, and the Years Ended
September 30, 2008 and September 30, 2007
(In thousands)
| | Period from October 1, 2008 through May 21, 2009 | Year Ended September 30, 2008 | Year Ended September 30, 2007 | |||||||||||
|---|---|---|---|---|---|---|---|---|---|---|---|---|---|---|
Cash flows from operating activities: | ||||||||||||||
Net (loss) income | $ | (1,233,297 | ) | $ | (858,385 | ) | $ | 109,505 | ||||||
Adjustments to reconcile net (loss) income to net cash used for operating activities: | ||||||||||||||
Provision for loan losses | 919,139 | 856,374 | 31,500 | |||||||||||
Provision for recourse liability on loans sold | — | 12,400 | — | |||||||||||
Negative amortization of option adjustable rate mortgage payment loans | (28,198 | ) | (161,664 | ) | (166,666 | ) | ||||||||
Other-than-temporary impairment on investment securities | 68,609 | 142,035 | 5,042 | |||||||||||
Impairment of other real estate owned | 38,742 | 22,749 | 14 | |||||||||||
Depreciation and amortization | 7,791 | 15,330 | 12,943 | |||||||||||
Amortization of fees, discounts and premiums, net | 10,886 | 53,930 | 69,949 | |||||||||||
Amortization of mortgage servicing rights | 1,596 | 5,391 | 3,329 | |||||||||||
Impairment of mortgage servicing rights | 24,999 | 3,043 | 1,293 | |||||||||||
Increase in bank owned life insurance cash surrender value | (2,155 | ) | (4,856 | ) | (4,933 | ) | ||||||||
Net loss on sale of other real estate owned and other assets | 22,211 | 8,784 | 29 | |||||||||||
Net (gain) loss on sale of loans | (113 | ) | 3,857 | — | ||||||||||
Net gain on sale of loans held for sale | (83 | ) | (6,473 | ) | (9,777 | ) | ||||||||
Net (gain) loss on sale of investment securities available for sale | (39 | ) | 414 | 564 | ||||||||||
Deferred tax expense (benefit) | 50,306 | (78,486 | ) | (175 | ) | |||||||||
Other: | ||||||||||||||
Proceeds from sale of loans held for sale, including those sold as mortgage-backed securities | 45,140 | 1,160,121 | 1,251,059 | |||||||||||
Loans originated for sale, net of repayments | (35,795 | ) | (999,505 | ) | (1,268,021 | ) | ||||||||
Increase (decrease) in other assets | 510 | (117,503 | ) | (37,018 | ) | |||||||||
Increase in other liabilities | 25,405 | 19,505 | 25,639 | |||||||||||
Net cash (used in) provided by operating activities | (84,346 | ) | 77,061 | 24,276 | ||||||||||
Cash flows from investing activities: | ||||||||||||||
Purchase of investment securities available for sale | (10,427 | ) | (213,414 | ) | (38,992 | ) | ||||||||
Proceeds from repayments of investment securities available for sale | 96,428 | 270,345 | 382,277 | |||||||||||
Proceeds from sale of investment securities available for sale | 9,847 | 124,357 | 80,937 | |||||||||||
Proceeds from sale of loans held in portfolio | 7,563 | — | — | |||||||||||
Net decrease (increase) in loans held in portfolio | 340,767 | 369,153 | (1,261,064 | ) | ||||||||||
Purchase of Federal Home Loan Bank stock | (113 | ) | (43,045 | ) | (181,353 | ) | ||||||||
Proceed from repayments of Federal Home Loan Bank stock | 19,350 | 85,859 | 131,310 | |||||||||||
Purchase of office properties and equipment | (828 | ) | (7,221 | ) | (31,539 | ) | ||||||||
Proceeds from sale of other real estate owned and other assets | 107,089 | 63,723 | 4,109 | |||||||||||
Net cash provided by (used in) investing activities | 569,676 | 649,757 | (914,315 | ) | ||||||||||
BANKUNITED, FSB AND SUBSIDIARIES
CONSOLIDATED STATEMENTS OF CASH FLOWS (Continued)
For the Period from October 1, 2008 through May 21, 2009, and the Years Ended
September 30, 2008 and September 30, 2007
(In thousands)
| | Period from October 1, 2008 through May 21, 2009 | Year Ended September 30, 2008 | Year Ended September 30, 2007 | |||||||||||
|---|---|---|---|---|---|---|---|---|---|---|---|---|---|---|
Cash flows from financing activities: | ||||||||||||||
Net increase in deposits | 379,090 | 871,029 | 1,194,900 | |||||||||||
Additions to Federal Home Loan Bank advances | 50,000 | 3,045,000 | 5,175,000 | |||||||||||
Repayments of Federal Home Loan Bank advances | (900,000 | ) | (4,000,010 | ) | (4,114,990 | ) | ||||||||
Capital contribution from parent | — | 160,000 | — | |||||||||||
Net decrease in securities sold under repurchase agreements | (55,620 | ) | (86,142 | ) | (923,317 | ) | ||||||||
(Decrease) increase in advances from borrowers for taxes and insurance | (38,861 | ) | (6,232 | ) | 4,736 | |||||||||
Dividends paid on stock | (5 | ) | (2 | ) | (5 | ) | ||||||||
Net cash (used in) provided by financing activities | (565,396 | ) | (16,357 | ) | 1,336,324 | |||||||||
(Decrease) increase in cash and cash equivalents | (80,066 | ) | 710,461 | 446,285 | ||||||||||
Cash and cash equivalents at beginning of period | 1,223,346 | 512,885 | 66,600 | |||||||||||
Cash and cash equivalents at end of period | $ | 1,143,280 | $ | 1,223,346 | $ | 512,885 | ||||||||
Supplemental disclosure of cash flow activity: | ||||||||||||||
Interest paid on deposits and borrowings | $ | 317,614 | $ | 556,783 | $ | 598,558 | ||||||||
Income taxes (received) paid | $ | (45,712 | ) | $ | — | $ | 40,800 | |||||||
Supplemental schedule of non-cash investing and financing activities: | ||||||||||||||
Transfers from loans to real estate owned | $ | 209,694 | $ | 202,520 | $ | 30,528 | ||||||||
Transfers of loans held for sale to portfolio | $ | — | $ | 19,919 | $ | 38,603 | ||||||||
Transfer of loans from portfolio to loans held for sale | $ | 7,459 | $ | 242 | $ | 264,707 | ||||||||
Capital contribution receivable from parent | $ | — | $ | — | $ | 80,000 | ||||||||
Exchange loans for mortgages backed securities | $ | — | $ | 776,796 | $ | 291,440 | ||||||||
The accompanying notes are an integral part of these consolidated financial statements.
BANKUNITED, FSB AND SUBSIDIARIES
CONSOLIDATED STATEMENTS OF STOCKHOLDER'S EQUITY (DEFICIT)
For the Period from October 1, 2008 through May 21, 2009, and the Years Ended
September 30, 2008 and September 30, 2007
(In thousands)
| | Common Stock | Paid-in Capital | Retained Earnings (Deficit) | Accumulated Other Comprehensive Income (Loss) | Total Stockholders' Equity (Deficit) | |||||||||||||
|---|---|---|---|---|---|---|---|---|---|---|---|---|---|---|---|---|---|---|
Balance at September 30, 2006 | $ | — | $ | 633,928 | $ | 392,527 | $ | (20,619 | ) | $ | 1,005,836 | |||||||
Capital contribution | 80,000 | 80,000 | ||||||||||||||||
Comprehensive income: | ||||||||||||||||||
Net income | 109,505 | 109,505 | ||||||||||||||||
Other comprehensive income | 7,466 | 7,466 | ||||||||||||||||
Total comprehensive income | 116,971 | |||||||||||||||||
Payment of cash dividends | (5 | ) | (5 | ) | ||||||||||||||
Balance at September 30, 2007 | — | 713,928 | 502,027 | (13,153 | ) | 1,202,802 | ||||||||||||
Capital contribution | 80,000 | 80,000 | ||||||||||||||||
Comprehensive loss: | ||||||||||||||||||
Net loss | (858,385 | ) | (858,385 | ) | ||||||||||||||
Other comprehensive income | (25,645 | ) | (25,645 | ) | ||||||||||||||
Total comprehensive loss | (884,030 | ) | ||||||||||||||||
Payment of cash dividends | (2 | ) | (2 | ) | ||||||||||||||
Balance at September 30, 2008 | — | 793,928 | (356,360 | ) | (38,798 | ) | 398,770 | |||||||||||
Comprehensive loss: | ||||||||||||||||||
Net loss | (1,233,297 | ) | (1,233,297 | ) | ||||||||||||||
Other comprehensive income | (54,441 | ) | (54,441 | ) | ||||||||||||||
Total comprehensive loss | (1,287,738 | ) | ||||||||||||||||
Payment of cash dividends | (5 | ) | (5 | ) | ||||||||||||||
Balance at May 21, 2009 | $ | — | $ | 793,928 | $ | (1,589,662 | ) | $ | (93,239 | ) | $ | (888,973 | ) | |||||
The accompanying notes are an integral part of these consolidated financial statements.
BANKUNITED, FSB AND SUBSIDIARIES
CONSOLIDATED STATEMENTS OF OTHER COMPREHENSIVE INCOME (LOSS)
For the Period from October 1, 2008 through May 21, 2009, and the Years Ended
September 30, 2008 and September 30, 2007
(In thousands)
| | Period from October 1, 2008 through May 21, 2009 | Year Ended September 30, 2008 | Year Ended September 30, 2007 | |||||||||
|---|---|---|---|---|---|---|---|---|---|---|---|---|
Net income (loss) | $ | (1,233,297 | ) | $ | (858,385 | ) | $ | 109,505 | ||||
Other comprehensive income (loss), net of tax: | ||||||||||||
Unrealized gains (losses) arising during the period on securities, net of tax expense (benefit)(1) | (65,914 | ) | (37,303 | ) | 4,442 | |||||||
Unrealized losses on cash flow hedges, net of tax benefit(1) | — | — | (221 | ) | ||||||||
Less reclassification adjustment for: | ||||||||||||
Realized losses on securities sold included in net income, net of tax benefit(1) | (22 | ) | (414 | ) | (381 | ) | ||||||
Other-than-temporary impairment on investment securities included in net income (loss), net of tax benefit(1) | (11,451 | ) | (11,258 | ) | (2,864 | ) | ||||||
Realized gains on cash flow hedges, net of tax expense(1) | — | 14 | — | |||||||||
Total other comprehensive income (loss), net of tax | (54,441 | ) | (25,645 | ) | 7,466 | |||||||
Total comprehensive income (loss) | $ | (1,287,738 | ) | $ | (884,030 | ) | $ | 116,971 | ||||
| | Period from October 1, 2008 through May 21, 2009 | Year Ended September 30, 2008 | Year Ended September 30, 2007 | ||||||||||||||||
|---|---|---|---|---|---|---|---|---|---|---|---|---|---|---|---|---|---|---|---|
| | Deferred Tax Expense (Benefit) | Deferred Tax Asset Valuation Allowance | Deferred Tax Expense (Benefit) | Deferred Tax Asset Valuation Allowance | Deferred Tax Expense (Benefit) | Deferred Tax Asset Valuation Allowance | |||||||||||||
Unrealized gains (losses) arising during the period on securities | $ | (35,492 | ) | $ | 35,492 | $ | (20,086 | ) | $ | 20,086 | $ | 2,392 | — | ||||||
Unrealized losses on cash flow hedges | — | — | — | — | (119 | ) | — | ||||||||||||
Realized losses on securities sold included in net income | (12 | ) | 12 | (223 | ) | 223 | (205 | ) | — | ||||||||||
Other-than-temporary impairment on investment securities included in net income (loss) | (6,166 | ) | 6,166 | (6,062 | ) | 6,062 | (1,542 | ) | — | ||||||||||
Realized gains on cash flow hedges | — | — | (7 | ) | — | — | |||||||||||||
The accompanying notes are an integral part of these consolidated financial statements.
BANKUNITED, FSB AND SUBSIDIARIES
NOTES TO CONSOLIDATED FINANCIAL STATEMENTS
Note 1 Summary of Significant Accounting Policies
BankUnited, FSB ("BankUnited" or the "Bank") was founded in 1984 and offers a full range of consumer and commercial banking products and services to individual and corporate customers through its branch network in Florida. The consolidated financial statements include the accounts of the Bank and its wholly-owned subsidiaries Bay Holdings, Inc., CRE Properties Inc., T&D Properties of South Florida, Inc. and BU Delaware, Inc. and its wholly-owned subsidiary BU REIT, Inc. BankUnited Financial Corporation ("BKUNA"), the parent company, is a Florida corporation organized in 1993 as the holding company for the Bank.
At the close of business on May 21, 2009, the Bank was seized by the Office of Thrift Supervision and the Federal Deposit Insurance Corporation ("FDIC") was appointed as Receiver. Immediately thereafter, a de novo institution ("New BankUnited") acquired certain assets and assumed certain liabilities of the former BankUnited. The change in control of the Bank may affect the accounting policies followed by the Bank under its new ownership.
Regulatory Matters
On September 19, 2008, the Bank reached an agreement with the Office of Thrift Supervision (the "OTS") on regulatory consent orders (the "Orders"). The Orders, among other things, required that BankUnited continue its capital augmentation plan to raise additional capital and to provide an alternative capital strategy to be implemented in the event the capital raising efforts in the capital augmentation plan are unsuccessful (together, the "Capital Plan"). The Capital Plan was approved by the OTS, and on November 1, 2008, the Bank's Board of Directors ("Board") approved and adopted the Capital Plan and began its implementation. Additionally, the Orders required that the Bank's Board prepare and submit to the OTS a comprehensive business plan covering the last three months of calendar year 2008, all of calendar years 2009 and 2010, and the first three quarters of calendar 2011 ("Business Plan"). The Business Plan includes a detailed description of the Bank's plans to improve earnings, preserve and enhance capital and franchise value, and strengthen liquidity.
The Orders required the Bank to meet and maintain a minimum Tier One Core Capital Ratio of 7% and a minimum total Risk-Based Capital Ratio of 14% on and after December 31, 2008. As of December 31, 2008, due primarily to establishing reserves for loan losses and its inability to raise additional equity, the Bank was not in compliance with the capital ratios as required by the Orders. As a result, the Bank was subject to enforcement action by federal regulators, including placing the Bank into receivership.
The Orders prohibit the Bank from paying dividends or capital distributions without receiving the prior written approval of the OTS. The Orders also require, among other things, that BankUnited notify the OTS prior to adding directors or senior executive officers; limit certain kinds of severance and indemnification payments; and obtain OTS approval before entering into, renewing, extending, or revising any compensatory or benefits arrangements with any director or officer.
Additionally, the Orders required the Bank to restrict or prohibit the origination of payment option adjustable rate mortgages ("option ARM loans"), prepare a plan to ensure the Bank maintains and adheres to its allowance for loan losses policies, procedures, time frames and calculation inputs; restricts assets growth; and appoint a regulatory compliance committee.
BANKUNITED, FSB AND SUBSIDIARIES
NOTES TO CONSOLIDATED FINANCIAL STATEMENTS (Continued)
Note 1 Summary of Significant Accounting Policies (Continued)
Effective April 14, 2009, the Board entered into a Stipulation and Consent to Prompt Corrective Action Directive ("PCA Directive") with the OTS. The PCA Directive addresses the Bank's failure to operate under an accepted capital restoration plan and imposes various corrective measures and operational limitations mandated by statute. As of January 30, 2009, the Bank was critically undercapitalized for purposes of the Prompt Corrective Action provisions of the Federal Deposit Insurance Act. The PCA Directive was issued when the OTS notified the Bank that its previously filed capital restoration plan was unacceptable and directs the Bank to be recapitalized by a merger with or an acquisition by another financial institution or another entity, or through the sale of all or substantially all of the Bank's assets and liabilities to another financial institution or another entity within twenty days pursuant to a written definitive agreement, which the Bank is required to execute within fifteen days of the effective date of the PCA Directive, unless such timeframes are extended in writing by the OTS.
Accounting Estimates and Assumptions
The accounting and reporting policies of the Bank and the methods of applying those policies that materially affect the accompanying consolidated financial statements conform with accounting principles generally accepted in the United States ("GAAP") and where applicable to general practices in the banking industry or guidelines prescribed by regulatory agencies. The consolidated financial statements of the Bank include the accounts of BankUnited, FSB and its wholly-owned subsidiaries. All significant intercompany balances and transactions have been eliminated in consolidation.
In preparing the consolidated financial statements, management is required to make estimates and assumptions that affect the reported amounts of assets and liabilities, revenues and expenses and valuation and disclosures of contingent assets and liabilities. Management has made significant estimates in certain areas, including the determination of the allowance for loan losses, reserve for recourse liability for loans sold, valuing certain financial instruments and other assets, the valuation of mortgage servicing rights, the determination of other-than-temporary impairment losses on available-for-sale investment securities, determination of the valuation allowance for deferred tax assets and goodwill impairment. Actual results could differ from those estimates. The current economic environment has increased the degree of uncertainty inherent in those estimates and assumptions.
Financial Statement Reclassifications
Certain prior period amounts have been reclassified to conform to the May 21, 2009 consolidated financial statements presentation.
Fair Value Measurements
In September 2006, the Financial Accounting Standards Board ("FASB") issued a new accounting standard on fair value measurements. The standard defines fair value, establishes a framework for measuring fair value and expands disclosure about fair value measurements. The standard changed key concepts in fair value measures including the establishment of a fair value hierarchy and the concept of the most advantageous or principal market. This standard did not require any new fair value measurement. The Bank adopted this statement for its financial assets and liabilities effective
BANKUNITED, FSB AND SUBSIDIARIES
NOTES TO CONSOLIDATED FINANCIAL STATEMENTS (Continued)
Note 1 Summary of Significant Accounting Policies (Continued)
October 1, 2008. The adoption of this statement did not have a material effect on the Bank's consolidated financial statements.
The Bank uses fair value measurements to record fair value adjustments to certain assets and liabilities and to determine fair value disclosures. Fair value is defined as the price that would be received to sell an asset or paid to transfer a liability in an orderly transaction between market participants at the measurement date. Securities available for sale and derivative instruments are recorded at fair value on a recurring basis. Additionally, from time to time, the Bank may be required to record other financial assets at fair value on a nonrecurring basis, such as impaired loans. These nonrecurring fair value adjustments typically involve application of lower-of-cost-or-market accounting or impairment write-downs of individual assets.
In February 2007, the FASB issued a new accounting standard on the fair value option for financial assets and financial liabilities. This standard allows the Bank an irrevocable option for measurement of eligible financial assets or financial liabilities at fair value on an instrument by instrument basis (the fair value option). Subsequent to the initial adoption of the standard, which the Bank adopted effective October 1, 2008, the Bank may elect to account for eligible financial assets and financial liabilities at fair value. Such an election may be made at the time an eligible financial asset, financial liability or firm commitment is recognized or when certain specified reconsideration events occur. The Bank has not elected the fair value option for any eligible financial instrument during the period ended May 21, 2009.
A fair value measurement assumes that the transaction to sell the asset or transfer the liability occurs in the principal market for the asset or liability or, in the absence of a principal market, the most advantageous market for the asset or liability. The fair value hierarchy distinguishes between assumptions developed based on market data obtained from independent sources (observable inputs) and assumptions made by the Bank about market participant assumptions (unobservable inputs). It is the Bank's policy to maximize the use of observable inputs and minimize the use of unobservable inputs when developing fair value measurements. Because no active market exists for a portion of the Bank's financial assets, fair value estimates are subjective in nature. Additionally, the fair value estimates do not necessarily reflect the price that the Bank might receive if it were to sell at one time its entire holding of a particular financial instrument.
Fair value is based on quoted prices in an active market when available. In certain cases where a quoted price for an asset or liability is not available, the Bank uses quoted market prices for comparable or similar securities, and when not available, uses internal valuation models to estimate its fair value. These models incorporate inputs such as forward yield curves, loan prepayment assumptions, expected loss assumptions, market volatilities and pricing spreads utilizing market-based inputs where readily available. The Bank's estimates of fair value reflect inputs and assumptions which management believes are comparable to those that would be used by other market participants. As an estimate, the fair value cannot be determined with precision and may not be realized in an actual sale or transfer of the asset or liability in a current market exchange.
Cash and Cash Equivalents
Cash and cash equivalents include cash, Federal Home Loan Bank ("FHLB") overnight deposits, federal funds sold and securities purchased under agreements to resell with original maturities of three
BANKUNITED, FSB AND SUBSIDIARIES
NOTES TO CONSOLIDATED FINANCIAL STATEMENTS (Continued)
Note 1 Summary of Significant Accounting Policies (Continued)
months or less. The collateral held by the Bank for securities purchased under agreements to resell consists of the securities underlying those agreements.
The Bank must comply with Federal Reserve Board regulations requiring the maintenance of reserves against its net transaction accounts. As of May 21, 2009, and September 30, 2008 and 2007, cash reserves maintained by the Bank at the Federal Reserve Bank for this purpose exceeded this requirement.
Investment Securities Available for Sale
Investment securities available for sale are carried at fair value, net of unrealized gains and losses, and net of discount accretion and premium amortization computed using the level yield method. Net unrealized gains and losses are included in other comprehensive income (loss) net of applicable income taxes (benefit). Gains or losses on sales of investment and mortgage-backed securities available for sale are recognized on the specific identification basis.
The Bank reviews available for sale securities for impairment on a quarterly basis or more frequently if events and circumstances indicate that a potential loss may have occurred. An investment security is impaired if its fair value is lower than its amortized cost basis. The Bank considers many factors in determining whether the decline in fair value below amortized cost is an other-than-temporary impairment ("OTTI"), including, but not limited to, adverse changes in expected cash flows, the length of time and extent to which the fair value has been less than amortized cost, the Bank's intent and ability to hold the security for a period of time sufficient for a recovery in value and issuer-specific factors such as the issuer's financial condition, external credit ratings and general market conditions.
The Bank uses third party sources to assist in the determination of the fair value of its investment securities, which are subject to validation procedures performed by management. The third-party pricing sources use proprietary models to determine the fair value of the Bank's collateralized mortgage obligations and mortgage pass-through certificates. Management reviews and documents all assumptions used by both internal and third party sources to ensure they are market based and reflective of the structural and collateral characteristics of the respective securities.
Loans Receivable
Loans held in portfolio
The Bank's loans held in portfolio consists primarily of real estate loans collateralized by first mortgages and also includes commercial real estate, commercial land, consumer and home equity loans and lines of credit. Loans held in portfolio are loans which management has the intent and ability to hold for the foreseeable future, are considered held for investment, and, accordingly, are carried at amortized cost. The length of the foreseeable future is a management judgment which is determined based on the type of loan, asset/liability strategies, including available investment opportunities and funding sources, expected liquidity demands, long-term business strategies and current economic and market conditions. Evaluation of these factors requires a significant degree of judgment. Management's view of the foreseeable future may change based on changes in these conditions.
BANKUNITED, FSB AND SUBSIDIARIES
NOTES TO CONSOLIDATED FINANCIAL STATEMENTS (Continued)
Note 1 Summary of Significant Accounting Policies (Continued)
Mortgage loans held for sale
BankUnited originates loans that are held for sale in the secondary market to government-sponsored entities and other investors. Loans held for sale are recorded at the lower of cost or fair value, determined in the aggregate, or at fair value when they are designated as the hedged item in a hedging relationship. Origination fees and costs for loans held for sale are capitalized as part of the cost of the loan. Fair value is derived from observable current market prices, when available, and includes loan servicing value. When market data is not available, the Bank estimates fair value based on third party indications of fair value, which may also include adjustments made for specific loan characteristics. Management reviews and documents all assumptions used by both internal and third party sources to ensure they are market based and reflective of the structural and collateral characteristics of the respective assets. Adjustments to reflect unrealized gains and losses resulting from changes in fair value and realized gains and losses upon ultimate sale of the loans are classified as noninterest income in the consolidated statements of operations.
BankUnited transfers certain residential mortgage loans to the held for sale classification at the lower of cost or fair value. At the time of transfer, any losses are recorded as a component of noninterest income, with subsequent losses also recorded as a component of noninterest income in the consolidated statements of operations. BankUnited may also transfer loans from held for sale to held in portfolio. At the time of transfer, any difference between the carrying amount of the loan and its outstanding principal balance is recorded as a component of noninterest income. Subsequently the discount on the loan is recognized as an adjustment to yield using the interest method. Triggers for transfer of loans to the held for sale category would include loans for which the Bank no longer had the intent or ability to hold the loans for the foreseeable future, or to maturity. Triggers for transfers to held in portfolio would include those loans that are no longer saleable due to credit, performance, or market conditions.
Non-Accrual Loans
The Bank typically classifies loans as nonaccrual when one of the following events occurs: (i) interest or principal has been in default, unless the loan is well-secured and in the process of collection; (ii) collection of recorded interest or principal is not anticipated; or (iii) income for the loan is recognized on a cash basis due to the deterioration in the financial condition of the debtor. Consumer and residential mortgage loans are typically placed on nonaccrual when payments have been in default more than 150 days. All other loans are typically placed on nonaccrual when the loans become 90 days past due, or the collection of principal or interest is deemed doubtful.
When a loan is placed on nonaccrual, unpaid interest is reversed against interest income. Interest income on nonaccrual loans, if recognized, is either recorded using the cash basis method of accounting or recognized at the end of the loan term after the principal has been reduced to zero, depending on the type of loan. If and when borrowers demonstrate the ability to repay a loan in accordance with the contractual terms of a loan classified as nonaccrual, the loan may be returned to accrual status. If a nonaccrual loan is returned to accruing status, the accrued interest at the date the loan is placed on nonaccrual status, and foregone interest during the nonaccrual period, are recorded as interest income only after all principal has been collected for commercial real estate and commercial loans. For residential mortgage loans and consumer loans, the accrued interest at the date the loan is placed on
BANKUNITED, FSB AND SUBSIDIARIES
NOTES TO CONSOLIDATED FINANCIAL STATEMENTS (Continued)
Note 1 Summary of Significant Accounting Policies (Continued)
nonaccrual status, and forgone interest during the nonaccrual period, are recorded as interest income as of the date the loan no longer meets the applicable criteria.
Loans whose terms have been modified in troubled debt restructurings are placed on nonaccrual status, until the Bank determines that future collection of principal and interest is reasonably assured. Generally, a nonaccrual loan that is restructured remains on nonaccrual for a period of six months to demonstrate the borrower can meet the restructured terms. Payment performance immediately prior to the restructuring may be considered when making this determination. Where the borrower of a restructured residential mortgage loan has no history of missed payments for at least six months prior to the restructuring, the loans remain on accrual status at the time of the modification.
Impaired Loans
Loans are considered impaired when, based on current information and events, it is probable that the Bank will be unable to collect the scheduled payments of principal or interest when due, according to the contractual terms of the loan agreement. Factors considered by management in determining impairment include payment status, collateral value, and the probability of collecting scheduled principal and interest payments when due. When a loan is deemed impaired, the amount of specific allowance required is measured by a complete analysis of the most probable source of repayment, including the present value of the loan's expected future cash flows, the fair value of the underlying collateral less costs of disposition, or the loan's estimated fair value. In these measurements, the Bank uses assumptions and methodologies that are relevant to estimating the level of impairment and unrealized losses in the loan portfolio. To the extent that the data supporting such assumptions has limitations, management's judgment and experience play a key role in recording the specific allowance estimates. BankUnited generally applies cash receipts on impaired loans not performing according to contractual terms to reduce the carrying value of the loan, unless the Bank believes it will recover the remaining principal balance of the loan, in which case the Bank may recognize interest income. The Bank includes impairment losses in the allowance for loan losses through a charge to provision for loan losses.
The Bank accounts for loans as troubled debt restructurings, when due to a deterioration in a borrower's financial position, the Bank grants concessions that would not otherwise be considered. Troubled debt restructured loans are tested for impairment and where the borrower has no history of missed payments for six months prior to the restructuring, the loan remains on accrual status at the time of the modification. Other troubled debt restructured loans are placed in nonaccrual status at the time of the modifications. If borrowers perform pursuant to the modified loan terms for at least six months and the remaining loan balances are considered collectible, the loans are returned to accrual status.
Allowance for Loan Losses
The Bank's allowance for loan losses is established for both performing loans and non-performing loans. BankUnited's allowance for loan losses is established and maintained at a level management deems prudent and adequate to cover probable losses on loans based upon a periodic evaluation of current information relating to the risks inherent in BankUnited's loan portfolio. In evaluating the allowance for loan losses, management evaluates both quantitative and qualitative elements which may
BANKUNITED, FSB AND SUBSIDIARIES
NOTES TO CONSOLIDATED FINANCIAL STATEMENTS (Continued)
Note 1 Summary of Significant Accounting Policies (Continued)
require the exercise of judgment. When evaluating loan loss allowances, management reviews performing and non-performing loans separately.
Additions to the allowance are made by provisions charged to current operations. The allowance is decreased by charge-offs due to losses and increased by recoveries.
For commercial loans and commercial loans secured by real estate, losses are recognized at the time they are identified. For the period ended May 21, 2009 and for the fiscal year ended September 30, 2008, losses on one-to-four family residential loans were charged-off at the time they become 270 days past due. The amount of the loss equals the excess of the recorded investment in the loan over estimated the fair value of the collateral, less costs to sell. Previously, the Bank's policy was to recognize charge-offs as the losses on one-to-four family residential loans were identified at the completion of the foreclosure process and repossession of the collateral, which could be an undetermined length of time, generally in excess of 270 days.
During the fiscal year ended September 30, 2007, the Bank's policy was to fully reserve the entire balance of home equity lines when they reached 91 days delinquent, and recognize charge-offs as the losses were identified. Subsequent to September 30, 2007, the policy was revised to continue to fully reserve for loans at 91 days past due and require that loans that reach 270 days delinquent be charged-off.
Recoveries are reported at the time received, except for balances recoverable under mortgage insurance policies. Recoveries under mortgage insurance policies are recorded at the time collection of the claim from the mortgage insurance company is deemed probable. Claims are deemed probable of collection at approximately the time of repossession of the property and the filing of the claim. Recoveries under mortgage insurance policies are reported at the lesser of the amount of the loss for the related loan or the amount recoverable under the mortgage insurance policy, net of a valuation allowance for potential rejections of mortgage insurance claims.
Reserve for Recourse Liability for Loans Sold
The Bank has established a reserve for recourse liability for loans sold. The reserve is established and maintained at a level management deems prudent and adequate to cover probable losses under representations and warranties on loans securitized or sold. The reserve is based upon periodic evaluation of current information relating to the inherent risks, and takes into account historical experiences and trends, and current and projected market, industry, and economic conditions.
Unearned Discounts, Premiums, and Deferred Costs
Loan origination fees and certain direct loan origination costs are included in the carrying value of loans, and amortized over the contractual maturities of the loans as an adjustment to interest income. Prepayments of loans result in acceleration of the amortization of these items. Commitment fees and costs relating to commitments are recognized over the commitment period. If the commitment is subsequently exercised during the commitment period, the remaining unamortized commitment fee at the time of exercise is recognized over the life of the loan as an adjustment of yield.
BANKUNITED, FSB AND SUBSIDIARIES
NOTES TO CONSOLIDATED FINANCIAL STATEMENTS (Continued)
Note 1 Summary of Significant Accounting Policies (Continued)
FHLB Stock and Other Earning Assets
The Bank's investment in the stock of the FHLB Atlanta is carried at cost since these are restricted securities. Periodically and as conditions warrant, the Bank reviews its investment in FHLB stock for impairment and adjusts the carrying value of the investment if it is determined to be impaired.
Office Properties and Equipment, net
Office properties and equipment are carried at cost less accumulated depreciation. Building and leasehold improvements are carried at amortized cost. The estimated useful life of newly constructed branch office buildings is 30 years. The lives of improvements to existing buildings are based on the lesser of the remaining life of the original building or the useful life of the improvement. Leasehold improvements are amortized over the shorter of the expected term of the lease at inception, considering options to extend that are reasonably assured, or their useful lives, whichever is shorter. The estimated useful life for furniture, fixtures and equipment is 7 - 10 years, and for computer equipment and software is 3 - 5 years. Depreciation is calculated based on the straight line method using the estimated service lives of the assets. Repair and maintenance costs are charged to operations as incurred, and improvements are capitalized.
Other Real Estate Owned
Property acquired through foreclosure or deed in lieu of foreclosure is initially recorded at estimated fair value, based on independent appraisal by third parties, less estimated costs to sell the property. Any excess of the loan balance over the fair value less estimated costs to sell the property is charged to the allowance for loan losses at the time of foreclosure. The carrying value is reviewed periodically and, when necessary, any decline in the value of the real estate less estimated cost to sell is charged to operations. Significant property improvements, which enhance the salability of the property, are capitalized to the extent that the carrying values do not exceed their estimated realizable values. Legal fees, maintenance and other direct costs of foreclosed properties are expensed as incurred. The amount the Bank ultimately recovers from foreclosed properties may differ substantially from the net carrying value of these assets because of future market factors that are beyond its control or because of changes in the Bank's strategy for sale of the properties.
Mortgage Servicing Rights and Transfers
Mortgage Servicing Rights
BankUnited recognizes mortgage servicing rights ("MSR") as an asset when it sells loans and retains the right to service those loans. The value of servicing assets is derived from estimated future revenues from contractually specified servicing fees, late charges, prepayment fees and other ancillary revenues that are expected to be more than adequate compensation to cover the costs associated with performing the service, and is generally expressed as a percent of the unpaid principal balance of the loans being serviced. Estimated future revenues are determined using the estimated future balance of the underlying mortgage loan portfolio, which, absent new purchases, declines over time from prepayments and cash flows. MSR assets are carried at the lower of aggregate cost or market and amortized in proportion to and over the period of estimated net servicing income. BankUnited charges
BANKUNITED, FSB AND SUBSIDIARIES
NOTES TO CONSOLIDATED FINANCIAL STATEMENTS (Continued)
Note 1 Summary of Significant Accounting Policies (Continued)
impairment as a direct write-down of its MSR assets. BankUnited does not currently utilize a valuation allowance for recognizing impairment of its MSR assets. BankUnited assesses the MSR assets for impairment on a disaggregated basis by strata based on the fair value of those assets.
The estimated fair value of mortgage servicing rights is estimated using various assumptions including future cash flows, market discount rates, as well as expected prepayment rates, servicing costs and other factors. Changes in these factors could result in impairment of the servicing asset and a charge against earnings. For purposes of evaluating impairment, the Bank stratifies its mortgage servicing portfolio on the basis of certain risk characteristics, including loan type. Impairment related to mortgage servicing rights is recorded in other non-interest income. Contractually specified servicing fees, late fees and other ancillary income related to the servicing of mortgage loans are recorded in other non-interest income.
Transfers
When BankUnited sells (transfers) mortgage loans for securitization it may acquire beneficial interests in the securities created as well as the rights to service the loans underlying the securities. Gains or losses on these transactions are recognized only for the portion of securities that are not acquired by BankUnited. Expenses related to the transaction are not deferred but are included in the gain or loss calculation. The book values of securities retained by BankUnited are based on their relative fair values at the date of transfer. BankUnited classifies retained securities as available for sale in its consolidated balance sheets, which are carried at fair value. BankUnited obtains fair values of its retained securities, at both the date of securitization and at each reporting date, from independent third parties.
Goodwill
Goodwill represents the excess of purchase price over the fair value of net assets acquired. The excess purchase price, which is related to banking acquisitions, is tested for impairment on an annual basis, or more often if events or circumstances indicate that there may be impairment. Adverse changes in the economic environment, declining operations, or other factors could result in a decline in the implied fair value.
The goodwill impairment test is performed in two phases during the fourth quarter of each fiscal year (performed as of May 21, 2009 for the period then ended). The first phase is used to identify potential impairment by comparing the fair value of the reporting unit with its carrying amount, including goodwill. The fair value of the reporting unit is determined based upon the present value of estimated future cash flows, using a discount rate that approximates the cost of capital in the industry in which the Bank operates. If the fair value is less than the carrying value, then the second phase is required to identify the amount of impairment by comparing the carrying amount of goodwill to its implied fair value. If the implied fair value is less than the carrying amount, a loss would be recognized in other non-interest expense to reduce the carrying amount to the implied fair value.
Performing an impairment test involves estimating the fair value of a reporting unit, which requires the Bank to make assumptions about future market conditions and its ability to perform as planned. When available, the Bank uses external data in its assumptions.
BANKUNITED, FSB AND SUBSIDIARIES
NOTES TO CONSOLIDATED FINANCIAL STATEMENTS (Continued)
Note 1 Summary of Significant Accounting Policies (Continued)
Bank Owned Life Insurance
Bank owned life insurance is carried at an amount that could be realized under the insurance contract as of the date of the consolidated balance sheets. The change in contract value is recorded as an adjustment to the premiums paid in determining the expense or income to be recognized under the contract.
Income Taxes
BankUnited and its subsidiaries, other than BU REIT, Inc., are part of the consolidated federal income tax return of BKUNA. BKUNA, BankUnited and its subsidiaries filed separate income tax returns in various state jurisdictions through fiscal year 2006. Beginning with the taxable year ended September 30, 2007, BKUNA, BankUnited and its subsidiaries filed combined state income tax returns where combined filings are required for companies that are considered to be unitary with related entities. The Bank and its subsidiaries have a Tax Sharing Agreement with BKUNA, whereby the Bank pays to or receives cash from BKUNA as if the Bank filed separate tax returns. Any amount of current tax due to or receivable from BKUNA is included in their intercompany balance. Income taxes are accounted for on a separate return basis.
The Bank accounts for income taxes using the asset and liability method, recording deferred tax assets and liabilities by applying federal and state statutory tax rates currently in effect to its cumulative temporary differences. Temporary differences are differences between financial statement carrying amounts and the corresponding tax bases of assets and liabilities. Under the asset and liability method, income tax expense or benefit is comprised of the current and deferred tax provisions (benefit) for the year. The current tax provision (benefit) represents amounts that are payable to or receivable from taxing authorities based on current year taxable income or loss. The deferred tax provision (benefit) reflects changes in deferred tax assets and liabilities during the year as a result of current year operations.
Generally accepted accounting principles require that when determining the need for a valuation allowance against a deferred tax asset, management must assess both positive and negative evidence with regard to the realization of the deferred tax asset. To the extent available sources of taxable income are insufficient to absorb tax losses, a valuation allowance is necessary. Sources of taxable income for this analysis include prior years' carry-backs, the expected reversals of taxable temporary differences between book and tax income, prudent and feasible tax-planning strategies, and future taxable income. A valuation allowance is recognized for a deferred tax asset if, based on the available evidence, it is more likely than not that some portion or all of the deferred tax asset will not be realized. Subsequent changes in the tax laws require adjustment to these assets and liabilities with the cumulative effect included in income from continuing operations for the period in which the change was enacted. In computing the income tax provision, the Bank evaluates the technical merits of its income tax positions based on current legislative, judicial, and regulatory guidance.
The Bank recognizes a liability for uncertain tax positions. An uncertain tax position is defined as a position in a previously filed tax return or a position expected to be taken in a future tax return that is not based on clear and unambiguous tax law and which is reflected in measuring current or deferred income tax assets and liabilities for interim or annual periods. The Bank must recognize the tax benefit from an uncertain tax position only if it is more-likely-than-not that the tax position will be sustained
BANKUNITED, FSB AND SUBSIDIARIES
NOTES TO CONSOLIDATED FINANCIAL STATEMENTS (Continued)
Note 1 Summary of Significant Accounting Policies (Continued)
on examination by the taxing authorities, based on the technical merits of the position. The Bank measures the tax benefits recognized based on the largest benefit that has a greater than 50% likelihood of being realized upon ultimate resolution. The Bank recognizes interest and penalties related to uncertain tax benefits in its provision for income taxes. At May 21, 2009 and September 30, 2008 there were no significant uncertain tax positions.
Earnings (Loss) per Share
Basic earnings (loss) per share are computed by dividing income available to common stockholders by the weighted-average number of common shares outstanding during each period. Diluted earnings per share are based on the weighted-average number of common shares outstanding during the period, plus the dilutive effect of securities or other contracts to issue common stock ("common share equivalents"). Common share equivalents are excluded from the computation of earnings (loss) per share in periods in which they have an anti-dilutive effect. The Bank does not have securities which qualify as common share equivalents that could potentially dilute earnings per share; therefore the weighted average number of shares used to compute basic and diluted income (loss) per share is the same.
Segment Reporting
Public companies are required to report certain financial information about significant revenue-producing segments of the business for which such information is available and utilized by the chief operating decision maker. Specific information to be reported for individual operating segments includes a measure of profit and loss, certain revenue and expense items, and total assets. As a community-oriented financial institution, substantially all of BankUnited's operations involve the delivery of loan and deposit products to customers. Management makes operating decisions and assesses performance based on an ongoing review of these banking operations, which constitute BankUnited's only operating segment.
Derivative Instruments Held for Purposes Other than Trading
BankUnited enters into derivative contracts as a means of reducing its interest rate exposures. No derivatives are held for trading purposes. At inception these contracts are evaluated in order to determine if they qualify for hedge accounting. The hedging instrument must be highly effective in achieving offsetting changes in the hedge instrument and hedged item attributable to the risk being hedged. Any ineffectiveness, which arises during the hedging relationship is recognized in non-interest expense in the period in which it arises. All derivatives are valued at fair value and included in other assets or other liabilities. For cash flow hedges, the unrealized changes in fair value to the extent effective are recognized in other comprehensive income. The fair value of cash flow hedges related to forecasted transactions is recognized in non-interest expense in the period when the forecasted transaction occurs. Any ineffectiveness related to cash flow-hedges is recorded in interest expense.
Residential mortgage loan commitments related to loans to be sold and forward sales contracts for loans to be sold are accounted for as derivatives at fair value. The commitments and forward sales contracts are recorded as either assets or liabilities in the consolidated balance sheets with the changes in fair value recorded in non-interest expense.
BANKUNITED, FSB AND SUBSIDIARIES
NOTES TO CONSOLIDATED FINANCIAL STATEMENTS (Continued)
Note 1 Summary of Significant Accounting Policies (Continued)
Accounting Policies Recently Adopted and Pending Adoption
As discussed in Note 1 to the consolidated financial statements, BankUnited was closed by the OTS on May 21, 2009. The impact of accounting policies pending adoption is dependent upon the method of application of those policies by New BankUnited management.
In April 2009, the FASB issued new guidance regarding the recognition and presentation of other-than-temporary impairments. This guidance amends the other-than-temporary impairment guidance for debt securities to make the guidance more operational and to improve the presentation and disclosure of OTTI on debt and equity securities in the financial statements. This guidance does not amend existing recognition and measurement guidance related to OTTI of equity securities.
In May 2009, the FASB issued new guidance regarding subsequent events. The new guidance establishes general standards of accounting for and disclosures of events that occur after the balance sheet date but before financial statements are issued or are available to be issued.
In June 2009, the FASB issued new guidance impacting transfers and servicing of financial assets. The objective of this guidance is to improve the relevance, representational faithfulness, and comparability of the information that a reporting entity provides in its financial reports about a transfer of financial assets; the effects of a transfer on its financial position, financial performance, and cash flows; and a transferor's continuing involvement in transferred financial assets. This guidance is effective for financial asset transfers occurring after December 31, 2009.
In June 2009, the FASB issued new guidance impacting consolidation of variable interest entities. The objective of this guidance is to improve financial reporting by enterprises involved with variable interest entities and to provide more relevant and reliable information to users of financial statements. This guidance was effective as of January 1, 2010.
Effective July 1, 2009, the Financial Accounting Standards Board ("FASB") established the Accounting Standards Codification ("ASC" or "Codification") as the source of authoritative GAAP for companies to use in the preparation of financial statements. The guidance contained in the Codification supersedes all existing accounting and reporting standards for public and non-public companies.
In August 2009, the FASB amended the measurement of liabilities at fair value and related disclosures. The amendment provides additional guidance on how to measure the fair value of a liability. The amendment clarifies that when estimating the fair value of a liability the entity is not required to include a separate adjustment to other inputs relating to the existence of a restriction that prevents the transfer of a liability. The amendment also clarifies that the quoted price in an active market at the measurement date of a liability when traded as an asset represents a Level 1 fair value measurements.
In September 2009, the FASB issued new guidance that creates a practical expedient to measure the fair value of an alternative investment that does not have a readily determinable fair value. This guidance also requires certain additional disclosures. This guidance was effective for interim and annual periods ending after December 15, 2009.
In February 2010, the FASB issued new guidance impacting fair value measurements and disclosures. The new guidance requires a gross presentation of purchases and sales of Level 3 activities and adds a new requirement to disclose transfers in and out of Level 1 and Level 2 measurements. The
BANKUNITED, FSB AND SUBSIDIARIES
NOTES TO CONSOLIDATED FINANCIAL STATEMENTS (Continued)
Note 1 Summary of Significant Accounting Policies (Continued)
guidance related to the transfers between Level 1 and Level 2 measurements is effective for the Bank on January 1, 2010. The guidance that requires increased disaggregation of the Level 3 activities is effective for the Bank on January 1, 2011.
In March 2010, the FASB issued new guidance impacting purchased receivables. The new guidance clarifies that a modification to a loan that is part of a pool of loans that was acquired with deteriorated credit quality should not result in the removal of the loan from the pool. This guidance is effective for any modifications of loans accounted for within a pool in the first interim or annual reporting period ending after July 15, 2010.
In July 2010, the FASB issued new guidance impacting the disclosure of financing receivables and the allowance for credit losses. The new guidance requires additional disclosures that will allow users to understand the nature of credit risk inherent in a company's loan portfolios, how that risk is analyzed and assessed in arriving at the allowance for credit losses, and changes and reasons for those changes in the allowance for credit losses. The new disclosures that relate to information as of the end of the reporting period is effective as of December 31, 2010, whereas the disclosures related to activity that occurred during the reporting periods is effective January 1, 2011.
Note 2 Investment Securities Available for Sale
Investment securities available for sale at May 21, 2009, and September 30, 2008 and 2007 are summarized as follows (in thousands):
| | May 21, 2009 | |||||||||||||
|---|---|---|---|---|---|---|---|---|---|---|---|---|---|---|
| | | Gross Unrealized | | |||||||||||
| | Amortized Cost | Fair Value | ||||||||||||
| | Gains | Losses | ||||||||||||
U.S. Treasury securities | $ | 35,167 | $ | 261 | $ | (5 | ) | $ | 35,423 | |||||
U.S. Government agencies and sponsored enterprises mortgage-backed securities | 224,587 | 4,294 | (1,002 | ) | 227,879 | |||||||||
Other collateralized mortgage obligations | 3,371 | — | (1,586 | ) | 1,785 | |||||||||
Mortgage pass-through certificates | 323,829 | — | (93,738 | ) | 230,091 | |||||||||
Mutual funds and preferred stocks | 18,241 | 230 | (377 | ) | 18,094 | |||||||||
State and Municipal obligations | 22,671 | 33 | (8 | ) | 22,696 | |||||||||
Other debt securities | 4,317 | — | (1,341 | ) | 2,976 | |||||||||
Total | $ | 632,183 | $ | 4,818 | $ | (98,057 | ) | $ | 538,944 | |||||
BANKUNITED, FSB AND SUBSIDIARIES
NOTES TO CONSOLIDATED FINANCIAL STATEMENTS (Continued)
Note 2 Investment Securities Available for Sale (Continued)
| | September 30, 2008 | |||||||||||||
|---|---|---|---|---|---|---|---|---|---|---|---|---|---|---|
| | | Gross Unrealized | | |||||||||||
| | Amortized Cost | Fair Value | ||||||||||||
| | Gains | Losses | ||||||||||||
U.S. Treasury securities | $ | 45,567 | $ | 159 | $ | — | $ | 45,726 | ||||||
U.S. Government agencies and sponsored enterprises mortgage-backed securities | 256,392 | 798 | (1,707 | ) | 255,483 | |||||||||
Other collateralized mortgage obligations | 3,495 | — | (32 | ) | 3,463 | |||||||||
Mortgage pass-through certificates | 430,711 | — | (36,390 | ) | 394,321 | |||||||||
Mutual funds and preferred stocks | 24,886 | — | (404 | ) | 24,482 | |||||||||
State and Municipal obligations | 22,220 | 120 | (80 | ) | 22,260 | |||||||||
Other debt securities | 10,752 | — | (1,262 | ) | 9,490 | |||||||||
Total | $ | 794,023 | $ | 1,077 | $ | (39,875 | ) | $ | 755,225 | |||||
| | September 30, 2007 | |||||||||||||
|---|---|---|---|---|---|---|---|---|---|---|---|---|---|---|
| | | Gross Unrealized | | |||||||||||
| | Amortized Cost | Fair Value | ||||||||||||
| | Gains | Losses | ||||||||||||
U.S. Treasury securities | $ | 25,000 | $ | — | $ | (23 | ) | $ | 24,977 | |||||
U.S. Government agencies and sponsored enterprises mortgage-backed securities | 214,198 | 274 | (4,186 | ) | 210,286 | |||||||||
Other collateralized mortgage obligations | 4,284 | — | (18 | ) | 4,266 | |||||||||
Mortgage pass-through certificates | 714,189 | 980 | (13,498 | ) | 701,671 | |||||||||
Mutual funds and preferred stocks | 109,929 | — | (2,771 | ) | 107,158 | |||||||||
State and Municipal obligations | 47,314 | 35 | (731 | ) | 46,618 | |||||||||
Other debt securities | 4,000 | — | (311 | ) | 3,689 | |||||||||
Total | $ | 1,118,914 | $ | 1,289 | $ | (21,538 | ) | $ | 1,098,665 | |||||
Investment securities available for sale at May 21, 2009 by contractual maturity, and adjusted for anticipated prepayments, are shown below (in thousands):
| | May 21, 2009 | |||||||
|---|---|---|---|---|---|---|---|---|
| | Amortized Cost | Fair Value | ||||||
Due in one year or less | $ | 159,964 | $ | 139,782 | ||||
Due after one year through five years | 272,567 | 229,362 | ||||||
Due after five years through ten years | 92,254 | 77,346 | ||||||
Due after ten years | 89,157 | 74,360 | ||||||
Mutual funds and preferred stock | 18,241 | 18,094 | ||||||
Total | $ | 632,183 | $ | 538,944 | ||||
Based on BankUnited's proprietary model and assumptions, the weighted average life of the mortgage-backed securities portfolio as of May 21, 2009 was 4.87 years. The model results are based on assumptions that may differ from the eventual outcome.
BANKUNITED, FSB AND SUBSIDIARIES
NOTES TO CONSOLIDATED FINANCIAL STATEMENTS (Continued)
Note 2 Investment Securities Available for Sale (Continued)
The Bank monitors its investment securities available for sale for OTTI. Impairment is evaluated on an individual security basis considering numerous factors, and their relative significance varies depending on the situation. The following table shows aggregate fair value and the aggregate amount by which cost exceeds fair value of investments that are in a loss position at May 21, 2009, and September 30, 2008 and 2007 (in thousands):
| | May 21, 2009 | |||||||||||||||||||
|---|---|---|---|---|---|---|---|---|---|---|---|---|---|---|---|---|---|---|---|---|
| | Less than 12 Months | 12 Months or Greater | Total | |||||||||||||||||
| | Fair Value | Unrealized Losses | Fair Value | Unrealized Losses | Fair Value | Unrealized Losses | ||||||||||||||
Available for sale securities: | ||||||||||||||||||||
U.S. Treasury securities | $ | 5,005 | $ | (5 | ) | $ | — | $ | — | $ | 5,005 | $ | (5 | ) | ||||||
U.S. Government agencies and sponsored enterprises mortgage-backed securities | 26,417 | (946 | ) | 3,199 | (56 | ) | 29,616 | (1,002 | ) | |||||||||||
Other collateralized mortgage obligations | 1,340 | (1,464 | ) | 445 | (122 | ) | 1,785 | (1,586 | ) | |||||||||||
Mortgage pass-through certificates | 10,123 | (8,481 | ) | 176,440 | (85,257 | ) | 186,563 | (93,738 | ) | |||||||||||
Mutual funds and preferred stocks | 17,307 | (377 | ) | — | — | 17,307 | (377 | ) | ||||||||||||
State and municipal obligations | 3,841 | (8 | ) | — | — | 3,841 | (8 | ) | ||||||||||||
Other debt securities | 1,676 | (1,341 | ) | — | — | 1,676 | (1,341 | ) | ||||||||||||
Total | $ | 65,709 | $ | (12,622 | ) | $ | 180,084 | $ | (85,435 | ) | $ | 245,793 | $ | (98,057 | ) | |||||
| | September 30, 2008 | |||||||||||||||||||
|---|---|---|---|---|---|---|---|---|---|---|---|---|---|---|---|---|---|---|---|---|
| | Less than 12 Months | 12 Months or Greater | Total | |||||||||||||||||
| | Fair Value | Unrealized Losses | Fair Value | Unrealized Losses | Fair Value | Unrealized Losses | ||||||||||||||
Available for sale securities: | ||||||||||||||||||||
U.S. Government agencies and sponsored enterprises mortgage-backed securities | $ | 132,031 | $ | (849 | ) | $ | 35,783 | $ | (858 | ) | $ | 167,814 | $ | (1,707 | ) | |||||
Other collateralized mortgage obligations | — | — | 660 | (32 | ) | 660 | (32 | ) | ||||||||||||
Mortgage pass-through certificates | 205,155 | (22,251 | ) | 108,487 | (14,139 | ) | 313,642 | (36,390 | ) | |||||||||||
Mutual funds and preferred stocks | — | — | 21 | (404 | ) | 21 | (404 | ) | ||||||||||||
State and municipal obligations | 8,980 | (80 | ) | — | — | 8,980 | (80 | ) | ||||||||||||
Other debt securities | 6,490 | (1,262 | ) | — | — | 6,490 | (1,262 | ) | ||||||||||||
Total | $ | 352,656 | $ | (24,442 | ) | $ | 144,951 | $ | (15,433 | ) | $ | 497,607 | $ | (39,875 | ) | |||||
BANKUNITED, FSB AND SUBSIDIARIES
NOTES TO CONSOLIDATED FINANCIAL STATEMENTS (Continued)
Note 2 Investment Securities Available for Sale (Continued)
| | September 30, 2007 | |||||||||||||||||||
|---|---|---|---|---|---|---|---|---|---|---|---|---|---|---|---|---|---|---|---|---|
| | Less than 12 Months | 12 Months or Greater | Total | |||||||||||||||||
| | Fair Value | Unrealized Losses | Fair Value | Unrealized Losses | Fair Value | Unrealized Losses | ||||||||||||||
Available for sale securities: | ||||||||||||||||||||
U.S. Treasury securities | $ | — | $ | — | $ | 24,977 | $ | (23 | ) | $ | 24,977 | $ | (23 | ) | ||||||
U.S. Government agencies and sponsored enterprises mortgage-backed securities | — | — | 155,478 | (4,186 | ) | 155,478 | (4,186 | ) | ||||||||||||
Other collateralized mortgage obligations | — | — | 959 | (18 | ) | 959 | (18 | ) | ||||||||||||
Mortgage pass-through certificates | 115,584 | (5,205 | ) | 426,293 | (8,293 | ) | 541,877 | (13,498 | ) | |||||||||||
Mutual funds and preferred stocks | 28,452 | (2,771 | ) | — | — | 28,452 | (2,771 | ) | ||||||||||||
State and municipal obligations | 5,580 | (7 | ) | 27,638 | (724 | ) | 33,218 | (731 | ) | |||||||||||
Other debt securities | 1,889 | (111 | ) | 1,800 | (200 | ) | 3,689 | (311 | ) | |||||||||||
Total | $ | 151,505 | $ | (8,094 | ) | $ | 637,145 | $ | (13,444 | ) | $ | 788,650 | $ | (21,538 | ) | |||||
Management has completed an assessment of each security with unrealized losses for impairment. The following describes the basis under which the Bank has evaluated OTTI.
U.S. Government Agencies and Sponsored Enterprises Mortgage-backed Securities ("MBS"):
The unrealized losses associated with U.S. Government agencies and Sponsored Enterprises MBS are primarily driven by changes in interest rates and not due to credit losses. These securities do not have any OTTI given the explicit or implicit government guarantee. There was no OTTI as of May 21, 2009, and September 30, 2008 and 2007, respectively.
Other Collateralized Mortgage Obligations ("CMO") and Mortgage Pass-Through Certificates:
These securities are assessed for impairment using a third party developed model, and proprietary behavioral assumptions using default and loss severity levels, and Voluntary Annual Prepayment Rates ("VPRs"). Based upon its assessment of the unrealized losses associated with these securities, management concluded that OTTI of $55.6 million and $95.1 million existed during the period ended May 21, 2009 and the year ended September 30, 2008, respectively. There was no OTTI for the year ended September 30, 2007. The Bank considers the remaining unrealized losses in this portfolio as of May 21, 2009, and September 30, 2008 and 2007 to be temporary.
Mutual Funds and Preferred Stock:
The Bank evaluates its investment in mutual funds for OTTI based on the quoted market value per share. The preferred stock in the investment portfolio was issued by U.S. Government sponsored enterprises. Based upon its assessment of the securities, management concluded that OTTI of $6.6 million, $45.9 million, and $5.0 million existed during the period ended May 21, 2009, and the years ended September 30, 2008 and 2007, respectively. The Bank considers the remaining decline in the value of investment securities classified as available for sale as of May 21, 2009, and September 30, 2008 and 2007 to be temporary.
BANKUNITED, FSB AND SUBSIDIARIES
NOTES TO CONSOLIDATED FINANCIAL STATEMENTS (Continued)
Note 2 Investment Securities Available for Sale (Continued)
State and Municipal Obligations:
The unrealized losses associated with securities of State and municipal obligations are primarily driven by changes in interest rates and are not due to the credit quality of the securities. These investments are primarily investment grade. The securities were generally underwritten in accordance with the Bank's own investment standards prior to the decision to purchase, without relying on a bond issuer's guarantee in making the investment decision. These investments will continue to be monitored as part of the Bank's ongoing impairment analysis, but are expected to perform in accordance with terms, even if the rating agencies reduce the credit rating of the bond issuers. As a result, the Bank expects to recover the entire amortized cost basis of these securities.
Other Debt Securities:
These securities are assessed for impairment using a third party developed model, and proprietary behavioral assumptions using default and loss severity levels, and Voluntary Annual Prepayment Rates ("VPRs"). Based upon its assessment of the securities, management concluded that OTTI of $6.4 million and $1.0 million existed during the period ended May 21, 2009 and the year ended September 30, 2008, respectively. There was no OTTI for other debt securities for the year ended September 30, 2007.
For the remaining unrealized losses, the Bank believes that these securities will recover their losses in the foreseeable future and management has the intent and ability to hold the securities until the price recovers.
The fair values of the Bank's investment securities could decline in the future if the underlying performance of the collateral for the residential MBS or other securities deteriorate and the Bank's credit enhancement levels do not provide sufficient protection to the Bank's contractual principal and interest. As a result, there is a risk that OTTI may occur in the future.
Proceeds from sales of investment securities were $9.8 million, $124.4 million, and $80.9 million for the period from October 1, 2008 through May 21, 2009, and for the fiscal years ended September 30, 2008, and September 30, 2007, respectively. Realized gains from these sales were $371.9 thousand, and $329.8 thousand for the fiscal years ended September 30, 2008, and September 30, 2007, respectively. There were no gains recognized during the period from October 1, 2008 through May 21, 2009. Realized losses from these sales were $38.9 thousand, $1.8 million, and $894.0 thousand for the period from October 1, 2008 through May 21, 2009, and for the fiscal years ended September 30, 2008, and September 30, 2007, respectively.
As part of the Bank's liquidity management strategy, the Bank pledges securities to secure borrowings from the FHLB. The Bank also pledges securities to collateralize public deposits and securities sold under agreements to repurchase and due to the Federal Reserve. The carrying value of pledged securities totaled $474.8 million, $667.7 million, and $302.6 million at May 21, 2009, September 30, 2008, and September 30, 2007, respectively.
BANKUNITED, FSB AND SUBSIDIARIES
NOTES TO CONSOLIDATED FINANCIAL STATEMENTS (Continued)
Note 3 FHLB Stock
BankUnited, as a member institution of the Federal Home Loan Bank of Atlanta, is required to own capital stock in the FHLB. The required stock ownership is based generally on (i) membership requirement and (ii) activity based requirement related to the levels that BankUnited borrows from the FHLB. In connection therewith, the Bank held stock with the aggregate carrying value of $243.3 million, $262.6 million, and $305.4 million as of May 21, 2009, September 30, 2008, and September 30, 2007, respectively. The stock is restricted and can only be repurchased by the FHLB. No market exists for this stock and there is no quoted market price. Redemption of FHLB stock has historically been at par value, which is BankUnited's carrying value. The redemption of any excess stock BankUnited holds is at the discretion of the FHLB.
In evaluating OTTI of the FHLB stock, the Bank considered the most recent financial results, the resumption of dividends on common stock in the second quarter of 2009 and information from credit rating agencies. Management believes that there is no OTTI in its investment in FHLB stock as of May 21, 2009, September 30, 2008 and September 30, 2007.
Note 4 Loans Receivable
At May 21, 2009, September 30, 2008, and September 30, 2007 loans receivable consisted of the following (amounts in thousands):
| | May 21, 2009 | September 30, 2008 | September 30, 2007 | ||||||||||||||||||
|---|---|---|---|---|---|---|---|---|---|---|---|---|---|---|---|---|---|---|---|---|---|
| | Total | Percent of Total | Total | Percent of Total | Total | Percent of Total | |||||||||||||||
Real Estate Loans: | |||||||||||||||||||||
1-4 single family residential | $ | 8,993,077 | 91.9 | % | $ | 9,916,696 | 88.2 | % | $ | 10,693,832 | 85.1 | % | |||||||||
Home equity loans and lines of credit | 505,642 | 5.2 | % | 486,467 | 4.3 | % | 420,386 | 3.3 | % | ||||||||||||
Multi-family | 129,481 | 1.3 | % | 144,324 | 1.3 | % | 120,058 | 1.0 | % | ||||||||||||
Commercial real estate | 594,877 | 6.1 | % | 600,261 | 5.3 | % | 496,556 | 4.0 | % | ||||||||||||
Construction | 187,333 | 1.9 | % | 171,213 | 1.5 | % | 146,557 | 1.2 | % | ||||||||||||
Land | 219,736 | 2.2 | % | 224,723 | 2.0 | % | 303,294 | 2.4 | % | ||||||||||||
Total real estate loans | 10,630,146 | 108.6 | % | 11,543,684 | 102.6 | % | 12,180,683 | 97.0 | % | ||||||||||||
Other Loans: | |||||||||||||||||||||
Commercial | 181,484 | 1.9 | % | 197,985 | 1.8 | % | 187,951 | 1.5 | % | ||||||||||||
Consumer | 12,179 | 0.1 | % | 12,740 | 0.1 | % | 16,228 | 0.1 | % | ||||||||||||
Total commercial and consumer loans | 193,663 | 2.0 | % | 210,725 | 1.9 | % | 204,179 | 1.6 | % | ||||||||||||
Total loans held in portfolio | 10,823,809 | 110.6 | % | 11,754,409 | 104.5 | % | 12,384,862 | 98.6 | % | ||||||||||||
Unearned discounts, premiums and deferred costs, net | 190,406 | 1.9 | % | 210,875 | 1.9 | % | 235,454 | 1.9 | % | ||||||||||||
Allowance for loan losses | (1,227,173 | ) | (12.5 | )% | (715,917 | ) | (6.4 | )% | (58,623 | ) | (0.5 | )% | |||||||||
Total loans held in portfolio, net | $ | 9,787,042 | 100.0 | % | $ | 11,249,367 | 100.0 | % | $ | 12,561,693 | 100.0 | % | |||||||||
BANKUNITED, FSB AND SUBSIDIARIES
NOTES TO CONSOLIDATED FINANCIAL STATEMENTS (Continued)
Note 4 Loans Receivable (Continued)
The following table provides a detail of loans to customers for states with balances of 4.4% of the portfolio and higher (dollars in millions):
| | | | September 30, | ||||||||||||||||
|---|---|---|---|---|---|---|---|---|---|---|---|---|---|---|---|---|---|---|---|
| | May 21, 2009 | ||||||||||||||||||
| | 2008 | 2007 | |||||||||||||||||
| | Amount | Percent of Total | Amount | Percent of Total | Amount | Percent of Total | |||||||||||||
Florida | $ | 6,928 | 63.7 | % | $ | 7,340 | 62.4 | % | $ | 7,710 | 61.4 | % | |||||||
California | 723 | 6.6 | % | 824 | 7.0 | % | 872 | 6.9 | % | ||||||||||
Arizona | 515 | 4.7 | % | 611 | 5.2 | % | 668 | 5.3 | % | ||||||||||
Illinois | 505 | 4.6 | % | 544 | 4.6 | % | 626 | 5.0 | % | ||||||||||
New Jersey | 480 | 4.4 | % | 518 | 4.4 | % | 553 | 4.4 | % | ||||||||||
As part of the Bank's liquidity management strategy, the Bank pledges loans to secure FHLB borrowings. Pledged loans must meet specific requirements of eligibility and the unpaid principal balance is discounted based on criteria established by the FHLB. As of May 21, 2009, the Bank had pledged real estate loans with an unpaid principal balance of approximately $7.6 billion ($4.6 billion in lendable collateral value) for advances from the FHLB. As of September 30, 2008, the Bank had pledged real estate loans with an unpaid principal balance of approximately $8.5 billion ($6.1 billion in lendable collateral value) for advances from the FHLB. As of September 30, 2007, the Bank had pledged real estate loans with an unpaid principal balance of approximately $9.1 billion ($7.2 billion in lendable collateral value) for advances from the FHLB.
The following table presents total 1-4 single family residential loans categorized between fixed rate mortgages and adjustable rate mortgages ("ARMs") as of May 21, 2009, and September 30, 2008 and September 30, 2007 (dollars in thousands):
| | | | September 30, | ||||||||||||||||||
|---|---|---|---|---|---|---|---|---|---|---|---|---|---|---|---|---|---|---|---|---|---|
| | May 21, 2009 | ||||||||||||||||||||
| | 2008 | 2007 | |||||||||||||||||||
| | Amount | Percent of Total | Amount | Percent of Total | Amount | Percent of Total | |||||||||||||||
1-4 single family residential loans: | |||||||||||||||||||||
Fixed rate loans | $ | 1,774,598 | 19.7 | % | $ | 1,636,063 | 16.5 | % | $ | 1,574,004 | 14.7 | % | |||||||||
Adjustable rate loans (ARM): | |||||||||||||||||||||
Monthly payment option(1) | 3,876,584 | 43.1 | % | 5,494,871 | 55.4 | % | 6,496,835 | 60.8 | % | ||||||||||||
Select-My-Payment(1) | 808,506 | 9.0 | % | 1,219,589 | 12.3 | % | 1,100,020 | 10.3 | % | ||||||||||||
Non option ARM | 2,533,389 | 28.2 | % | 1,566,173 | 15.8 | % | 1,522,973 | 14.2 | % | ||||||||||||
Total(2) | $ | 8,993,077 | 100.0 | % | $ | 9,916,696 | 100.0 | % | $ | 10,693,832 | 100.0 | % | |||||||||
BANKUNITED, FSB AND SUBSIDIARIES
NOTES TO CONSOLIDATED FINANCIAL STATEMENTS (Continued)
Note 4 Loans Receivable (Continued)
portfolio, were negatively amortizing and approximately $270.2 million, or 3.6%, of the total payment option portfolio results were from negative amortization. These loans are subject to interest rate caps.
The following table summarizes changes in the allowance for loan losses for the period from October 1, 2006 through May 21, 2009 (in thousands):
Balance as of September 30, 2006 | $ | 36,378 | |||
Provision | 31,500 | ||||
Charge-offs | (11,050 | ) | |||
Recoveries | 1,795 | ||||
Balance as of September 30, 2007 | 58,623 | ||||
Provision | 856,374 | ||||
Charge-offs | (230,309 | ) | |||
Recoveries | 31,229 | ||||
Balance as of September 30, 2008 | 715,917 | ||||
Provision | 919,139 | ||||
Charge-offs | (449,010 | ) | |||
Recoveries | 41,127 | ||||
Balance as of May 21, 2009 | $ | 1,227,173 | |||
The total allowance reflects management's estimate of credit losses inherent in the loan portfolio at the balance sheet date. The computation of the allowance for loan losses includes elements of judgment and high level of subjectivity. The Bank considers the allowance for loan losses to be adequate to cover credit losses inherent in the loan portfolio at May 21, 2009, September 30, 2008, and September 30, 2007.
Certain loans have been classified as impaired based on the Bank's inability to collect all amounts due under the contractual terms of the loan. The following table shows the Bank's investment in
BANKUNITED, FSB AND SUBSIDIARIES
NOTES TO CONSOLIDATED FINANCIAL STATEMENTS (Continued)
Note 4 Loans Receivable (Continued)
impaired and non-accrual loans as of and for the period ended May 21, 2009 and September 30, 2008 and September 30, 2007 (in thousands):
| | | September 30, | |||||||||||
|---|---|---|---|---|---|---|---|---|---|---|---|---|---|
| | May 21, 2009 | ||||||||||||
| | 2008 | 2007 | |||||||||||
Impaired loans on non-accrual: | |||||||||||||
Real Estate Loans: | |||||||||||||
1-4 single family residential: | |||||||||||||
Payment option | $ | 1,674,325 | $ | 968,647 | $ | 149,749 | |||||||
Non-payment option | 453,743 | 153,125 | 22,894 | ||||||||||
Total one-to-four family(1) | 2,128,068 | 1,121,772 | 172,643 | ||||||||||
Home equity loans and lines of credit | 27,263 | 8,866 | 2,251 | ||||||||||
Multi-family | 21,544 | 10,028 | — | ||||||||||
Commercial real estate | 2,888 | — | 5,593 | ||||||||||
Construction | 78,403 | 58,549 | — | ||||||||||
Land | 94,493 | 38,465 | — | ||||||||||
Total real estate loans | 2,352,659 | 1,237,680 | 180,487 | ||||||||||
Other Loans: | |||||||||||||
Commercial | 763 | 65 | 232 | ||||||||||
Consumer | 23 | 30 | 91 | ||||||||||
Total commercial and consumer loans | 786 | 95 | 323 | ||||||||||
Total non-accrual loans | 2,353,445 | 1,237,775 | 180,810 | ||||||||||
Impaired Loans and still accruing: | |||||||||||||
Real Estate Loans: | |||||||||||||
1-4 single family residential(2) | 804,218 | 181,911 | — | ||||||||||
Commercial real estate | 162,937 | 70,670 | 8,651 | ||||||||||
Construction | 1,379 | — | — | ||||||||||
Land | 22,780 | 8,672 | 9,697 | ||||||||||
Total real estate loans | 991,314 | 261,253 | 18,348 | ||||||||||
Other Loans: | |||||||||||||
Commercial | 13,271 | 1,302 | 907 | ||||||||||
Consumer | 554 | 550 | 516 | ||||||||||
Total commercial and consumer loans | 13,825 | 1,853 | 1,423 | ||||||||||
Other loans past due 90 days and still accruing | — | 71 | 493 | ||||||||||
Total non-accrual and impaired loans | $ | 3,358,584 | $ | 1,500,952 | $ | 201,074 | |||||||
BANKUNITED, FSB AND SUBSIDIARIES
NOTES TO CONSOLIDATED FINANCIAL STATEMENTS (Continued)
Note 4 Loans Receivable (Continued)
Had loans in non-accrual status been in accrual, the Bank would have recognized additional interest income of approximately $88.9 million, $85.9 million and $10.0 million for the period ended May 21, 2009, September 30, 2008, and September 30, 2007, respectively.
Interest income recognized on non-accrual loans amounted to $6.0 million, $32.0 million, and $6.2 million for the period ended May 21, 2009, September 30, 2008, and September 30, 2007, respectively.
The following table presents information related to the Bank's impaired loans and allocated reserves as of May 21, 2009 and September 30, 2008 and 2007 (in thousands):
| | | | September 30, | ||||||||||||||||||
|---|---|---|---|---|---|---|---|---|---|---|---|---|---|---|---|---|---|---|---|---|---|
| | May 21, 2009 | ||||||||||||||||||||
| | 2008 | 2007 | |||||||||||||||||||
| | Outstanding Principal | Specific Reserves | Outstanding Principal | Specific Reserves | Outstanding Principal | Specific Reserves | |||||||||||||||
Impaired loans with specific reserves: | |||||||||||||||||||||
1-4 single family residential | $ | 1,464,787 | $ | 381,013 | $ | 967,573 | $ | 263,136 | $ | 923 | $ | 407 | |||||||||
Home equity loans and lines of credit | 12,944 | 12,944 | 7,672 | 7,672 | — | — | |||||||||||||||
Commercial real estate | 188,373 | 133,683 | 107,042 | 25,147 | — | — | |||||||||||||||
Commercial | 1,755 | 1,272 | 160 | 160 | 232 | 232 | |||||||||||||||
Total | 1,667,860 | 528,913 | 1,082,446 | 296,115 | 1,155 | 639 | |||||||||||||||
Impaired loans without specific reserves: | |||||||||||||||||||||
1-4 single family residential | 1,467,498 | — | 336,110 | — | 171,720 | — | |||||||||||||||
Home equity loans and lines of credit | 14,319 | — | 1,194 | — | 2,251 | — | |||||||||||||||
Commercial real estate | 196,051 | — | 79,342 | — | 23,941 | — | |||||||||||||||
Commercial | 12,279 | 1,207 | 907 | ||||||||||||||||||
Consumer | 577 | — | 580 | — | 607 | — | |||||||||||||||
Loans past due 90 days and still accruing | — | 71 | 493 | ||||||||||||||||||
Total | 1,690,724 | — | 418,505 | — | 199,919 | — | |||||||||||||||
Total impaired loans | $ | 3,358,584 | $ | 528,913 | $ | 1,500,952 | $ | 296,115 | $ | 201,074 | $ | 639 | |||||||||
Specific reserves related to troubled debt restructured loans amounted to $56.5 million, and $24.7 million at May 21, 2009 and September 30, 2008, respectively.
Loans Held For Sale
Loans held for sale are accounted for under the lower of cost or fair value method. Lower of cost or fair value adjustments are recorded in earnings under non-interest income. During the period from
BANKUNITED, FSB AND SUBSIDIARIES
NOTES TO CONSOLIDATED FINANCIAL STATEMENTS (Continued)
Note 4 Loans Receivable (Continued)
October 1, 2008 through May 21, 2009, the Bank transferred $7.5 million of loans from loans held in portfolio to loans held for sale and recorded a loss of $6 thousand, which is included in other non-interest income. During the years ended September 30, 2008 and September 30, 2007, the Bank transferred $20.0 million, and $37.8 million, respectively, of loans from loans held for sale to loans held in portfolio and recorded a loss of $2.3 million, and $0.0 million, respectively, which is included in other non-interest income.
Note 5 Servicing and Transfers of Mortgage Loans
Servicing
As of May 21, 2009, September 30, 2008, and September 30, 2007 the Bank had mortgage servicing rights ("MSR") with a carrying amount of $1.1 million, $27.1 million and $20.6 million, respectively. MSRs are included with Other Assets on the consolidated balance sheet. The Bank accounted for MSRs using the amortization method (i.e., lower of cost or fair value) with impairment recognized as a reduction to non-operating income.
On November 17, 2008, Freddie Mac notified the Bank that they were terminating the Seller/Servicer Eligibility Contract with the Bank effective as of November 17, 2008. The Bank had the right to market the servicing rights until April 2009. Since the Bank was unable to sell the servicing rights, the termination of this agreement required the Bank to write-off the recorded Freddie Mac servicing asset, which totaled $2.3 million, at February 28, 2009. On March 17, 2009, the Bank provided to Fannie Mae a notification whereby it voluntary terminated the Mortgage Selling and Servicing Contract between the Bank and Fannie Mae, effective as of April 1, 2009. The voluntarily termination required the Bank to write-off the recorded Fannie Mae servicing asset, which totaled $15.8 million, at February 28, 2009. The termination of these contracts is consistent with the Bank's strategy of no longer being active in the wholesale residential lending business. At May 21, 2009, the remaining carrying value of the MSR of $1.1 million, which approximates fair value, relates primarily to the servicing of remaining private label mortgage loans.
BANKUNITED, FSB AND SUBSIDIARIES
NOTES TO CONSOLIDATED FINANCIAL STATEMENTS (Continued)
Note 5 Servicing and Transfers of Mortgage Loans (Continued)
The following table provides activity related to the Bank's MSR assets from October 1, 2006 through May 21, 2009:
| | MSR From Loan Sales | MSR Securitization | Total MSR | ||||||||
|---|---|---|---|---|---|---|---|---|---|---|---|
| | (in thousands) | ||||||||||
Balance October 1, 2006 | $ | 15,628 | $ | 4,631 | $ | 20,259 | |||||
New MSR assets from loan sales | 4,994 | — | 4,994 | ||||||||
Amortization of MSR assets | (2,263 | ) | (1,066 | ) | (3,329 | ) | |||||
Impairment of MSR assets | (659 | ) | (634 | ) | (1,293 | ) | |||||
Balance September 30, 2007 | $ | 17,700 | $ | 2,931 | $ | 20,631 | |||||
Fair Value at September 30, 2007 | $ | 18,100 | $ | 2,931 | $ | 21,031 | |||||
Balance October 1, 2007 | $ | 17,700 | $ | 2,931 | $ | 20,631 | |||||
New MSR assets from loan sales | 14,885 | — | 14,885 | ||||||||
MSR servicing sales | (14 | ) | — | (14 | ) | ||||||
Amortization of MSR assets | (4,026 | ) | (1,365 | ) | (5,391 | ) | |||||
Impairment of MSR assets | (3,043 | ) | — | (3,043 | ) | ||||||
Balance September 30, 2008 | $ | 25,502 | $ | 1,566 | $ | 27,068 | |||||
Fair Value at September 30, 2008 | $ | 26,646 | $ | 1,973 | $ | 28,619 | |||||
Balance October 1, 2008 | $ | 25,502 | $ | 1,566 | $ | 27,068 | |||||
New MSR assets from loan sales | 668 | — | 668 | ||||||||
MSR servicing sales | — | — | — | ||||||||
Amortization of MSR assets | (1,435 | ) | (161 | ) | (1,596 | ) | |||||
Impairment of MSR assets | (24,449 | ) | (550 | ) | (24,999 | ) | |||||
Balance May 21, 2009 | $ | 286 | $ | 855 | $ | 1,141 | |||||
Transfers
On September 26, 2005, the Bank sold mortgage loans for securitization to a trust ("BUMT 2005-1") in a sale transaction. The BUMT 2005-1 securities are held in a trust established by a third party for the purpose of issuing securities arising from the securitization of one-to-four family residential mortgage loans originated by the Bank. The Bank's Trust 2005-1 is not controlled by, or affiliated with the Bank or any of its subsidiaries. The investors and the securitization trust have no recourse to the Bank's assets for failure of debtors to pay when due.
While the Bank does not retain credit risk on the loans it has securitized, it has potential liability, under representations and warranties it made to the trust purchasing the loans. Upon securitization of the mortgage loans, the Bank acquired subordinated securities, including an interest only strip (collectively retained securities), and recognized the value of the rights to servicing the underlying loans (MSRs). The Bank has classified the retained securities as available for sale.
Considerable judgment is required to determine the fair values of the Bank's retained securities. Unlike government securities and other highly liquid investments, the precise market value of retained securities cannot be readily determined because these assets are not actively traded in stand-alone
BANKUNITED, FSB AND SUBSIDIARIES
NOTES TO CONSOLIDATED FINANCIAL STATEMENTS (Continued)
Note 5 Servicing and Transfers of Mortgage Loans (Continued)
markets. Accordingly, the Bank utilizes independent third parties specializing in secondary market transactions to assist in the determination of the fair values of its retained securities through the use of discounted cash flow models. BankUnited values these securities using third party proprietary pricing models that incorporate observable and unobservable inputs. Unobservable inputs include BankUnited's expectation of projected prepayment speeds, discount rates and projected loss severity and default rates. The estimated fair value of the Bank's retained securities amounted to $27.2 million, $75.3 million and $179.0 million as of May 21, 2009 and September 2008 and 2007, respectively.
At May 21, 2009, September 30, 2008 and September 30, 2007, BankUnited was servicing loans for others of approximately $43.7 million, $2.2 billion and $1.6 billion, respectively.
Note 6 Office Properties and Equipment, net
Included in other assets are office properties and equipment, net. At May 21, 2009, September 30, 2008 and September 30, 2007, office properties and equipment, net are summarized as follows (in thousands):
| | | September 30, | |||||||||
|---|---|---|---|---|---|---|---|---|---|---|---|
| | May 21, 2009 | ||||||||||
| | 2008 | 2007 | |||||||||
| | (Dollars in thousands) | ||||||||||
Branch buildings | $ | 3,738 | $ | 3,733 | $ | 3,530 | |||||
Leasehold Improvements | 47,481 | 47,515 | 44,330 | ||||||||
Furniture, fixtures and equipment | 31,679 | 32,551 | 35,491 | ||||||||
Computer equipment and software | 38,037 | 37,318 | 31,440 | ||||||||
Total | 120,935 | 121,117 | 114,791 | ||||||||
Less: accumulated depreciation | (70,344 | ) | (62,869 | ) | (48,043 | ) | |||||
Office properties and equipment, net | $ | 50,591 | $ | 58,248 | $ | 66,748 | |||||
Depreciation expense was $7.8 million, $15.3 million and $13.0 million, for the period from October 1, 2008 through May 21, 2009, and the fiscal years ended September 30, 2008 and 2007, respectively.
Total rental expense on operating leases for the period from October 1, 2008 through May 21, 2009, and for the fiscal years ended September 30, 2008 and September 30, 2007, was $10.9 million, $16.2 million, and $16.1 million, respectively.
The Bank and its subsidiaries lease premises and equipment under cancelable and non-cancelable leases, some of which contain renewal options under various terms. The leased properties are used primarily for banking purposes.
BANKUNITED, FSB AND SUBSIDIARIES
NOTES TO CONSOLIDATED FINANCIAL STATEMENTS (Continued)
Note 6 Office Properties and Equipment, net (Continued)
As of May 21, 2009, the Bank had entered into non-cancelable operating leases with approximate minimum future rentals as follows (in thousands):
Periods Ending May 21, | |||||||
2010 | $ | 12,442 | |||||
2011 | 11,262 | ||||||
2012 | 10,039 | ||||||
2013 | 8,457 | ||||||
2014 | 6,159 | ||||||
Thereafter through 2026 | 9,052 | ||||||
Total | $ | 57,411 | |||||
Note 7 Other Real Estate Owned
An analysis of other real estate owned for the period from October 1, 2006 through May 21, 2009, as follows (in thousands):
Balance as of September 30, 2006 | $ | 729 | |||
Transfers from loan portfolio, net | 30,528 | ||||
Transfers from other assets | 51 | ||||
Sales | (3,562 | ) | |||
Impairment | (14 | ) | |||
Balance as of September 30, 2007 | 27,732 | ||||
Transfers from loan portfolio, net | 202,520 | ||||
Transfers to other assets | (50 | ) | |||
Sales | (72,129 | ) | |||
Impairment | (22,749 | ) | |||
Balance as of September 30, 2008 | 135,324 | ||||
Transfers from loan portfolio, net | 209,694 | ||||
Sales | (128,597 | ) | |||
Impairment | (38,742 | ) | |||
Balance as of May 21, 2009 | $ | 177,679 | |||
Note 8 Deposits
At May 21, 2009, the Bank had outstanding non-interest bearing deposits of $247.6 million and interest bearing deposits of $8.3 billion. At September 30, 2008, the Bank had outstanding non-interest bearing deposits of $293.3 million and interest bearing deposits of $7.9 billion. At September 30, 2007, the Bank had outstanding non-interest bearing deposits of $557.9 million and interest bearing deposits of $6.7 billion. Deposits as of May 21, 2009 and September 30, 2008 include brokered time deposits amounting to $348.4 million and $773.9 million, respectively. There were no brokered deposits as of September 30, 2007.
BANKUNITED, FSB AND SUBSIDIARIES
NOTES TO CONSOLIDATED FINANCIAL STATEMENTS (Continued)
Note 8 Deposits (Continued)
The following table sets forth average amounts and weighted average rates paid on each of the Bank's deposit categories for the period ended May 21, 2009, September 30, 2008, and September 30, 2007 (amounts in thousands):
| | | | September 30, | |||||||||||||||||
|---|---|---|---|---|---|---|---|---|---|---|---|---|---|---|---|---|---|---|---|---|
| | May 21, 2009 | |||||||||||||||||||
| | 2008 | 2007 | ||||||||||||||||||
| | Amount | Rate | Amount | Rate | Amount | Rate | ||||||||||||||
Transaction accounts, demand: | ||||||||||||||||||||
Non-interest bearing | $ | 282,215 | $ | 441,570 | $ | 503,353 | ||||||||||||||
Interest bearing | 164,669 | 0.85 | % | 199,942 | 1.07 | % | 232,451 | 1.66 | % | |||||||||||
Money market accounts | 784,043 | 3.11 | % | 548,812 | 3.65 | % | 280,864 | 4.63 | % | |||||||||||
Savings accounts | 701,412 | 2.78 | % | 1,324,916 | 3.59 | % | 1,456,083 | 4.59 | % | |||||||||||
Certificates of deposit | 6,611,919 | 4.04 | % | 4,929,198 | 4.53 | % | 4,325,561 | 5.06 | % | |||||||||||
Total average deposits | $ | 8,544,258 | 3.66 | % | $ | 7,444,438 | 3.93 | % | $ | 6,798,312 | 4.45 | % | ||||||||
Time deposit accounts with balances of $100,000 or more totaled approximately $2.8 billion at May 21, 2009, including $865.1 million with balances of $250,000 or more. Time deposits accounts with balances of $100,000 or more totaled approximately $3.0 billion at September 30, 2008, including $1.3 billion with balances of $250,000 or more. Time deposit accounts with balances of $100,000 or more totaled approximately $2.1 billion at September 30, 2007, including $676.5 million with balances of $250,000 or more.
The following table sets forth maturities of time deposits equal to or greater than $100,000 as of May 21, 2009, September 30, 2008, and September 30, 2007 (in thousands):
| | | September 30, | |||||||||
|---|---|---|---|---|---|---|---|---|---|---|---|
| | May 21, 2009 | ||||||||||
| | 2008 | 2007 | |||||||||
Three months or less | $ | 826,504 | $ | 628,755 | $ | 543,137 | |||||
Over 3 through 6 months | 593,413 | 726,180 | 844,072 | ||||||||
Over 6 through 12 months | 1,070,345 | 853,366 | 402,476 | ||||||||
Over 12 through 24 months | 195,730 | 653,815 | 95,475 | ||||||||
Over 24 through 36 months | 109,398 | 118,840 | 119,232 | ||||||||
Over 36 through 48 months | 3,427 | 42,191 | 55,000 | ||||||||
Over 48 through 60 months | 526 | 754 | 31,321 | ||||||||
Over 60 months | — | — | — | ||||||||
Total | $ | 2,799,343 | $ | 3,023,901 | $ | 2,090,713 | |||||
Included in the table above are $211.9 million, $259.4 million, and $293.4 million of time deposits issued to the State of Florida which are collateralized by a letter of credit of $325 million, $345 million and $155 million at May 21, 2009, September 30, 2008, and September 30, 2007, respectively.
BANKUNITED, FSB AND SUBSIDIARIES
NOTES TO CONSOLIDATED FINANCIAL STATEMENTS (Continued)
Note 8 Deposits (Continued)
Interest expense on deposits for the period from October 1, 2008 through May 21, 2009, and the fiscal years ended September 30, 2008 and September 30, 2007, is as follows (in thousands):
| | | September 30, | |||||||||
|---|---|---|---|---|---|---|---|---|---|---|---|
| | May 21, 2009 | ||||||||||
| | 2008 | 2007 | |||||||||
Transaction accounts | $ | 895 | $ | 2,146 | $ | 3,858 | |||||
Money market | 15,576 | 20,017 | 13,008 | ||||||||
Savings accounts | 12,433 | 47,583 | 66,580 | ||||||||
Certificates of deposit | 170,666 | 223,109 | 218,889 | ||||||||
Total | $ | 199,570 | $ | 292,855 | $ | 302,335 | |||||
On October 3, 2008, the Emergency Economic Stabilization Act ("EESA") of 2008 became effective. This legislation was passed in response to the financial crisis affecting the banking system and financial markets and threats to investment banks and other financial institutions. The EESA temporarily raises the basic limit on federal deposit insurance coverage from $100,000 to $250,000 per depositor until December 31, 2009. The legislation did not increase coverage for retirement accounts and it continues to be $250,000.
On October 14, 2008, the FDIC announced the Temporary Liquidity Guarantee Program ("TLGP") to strengthen confidence and encourage liquidity in the banking system. The new program provides full deposit insurance coverage for non-interest bearing deposit transaction accounts in FDIC-insured institutions, regardless of the dollar amount. These are mainly payment-processing accounts, such as payroll accounts used by businesses, which frequently exceed the maximum limit of $250,000.
Note 9 Securities Sold under Agreements to Repurchase
The following sets forth information concerning repurchase agreements for the period from October 1, 2008 through May 21, 2009, and the fiscal years ended September 30, 2008 and September 30, 2007 (amounts in thousands):
| | | September 30, | ||||||||
|---|---|---|---|---|---|---|---|---|---|---|
| | May 21, 2009 | |||||||||
| | 2008 | 2007 | ||||||||
Maximum amount outstanding at any month end during the period | $ | 48,114 | $ | 177,218 | $ | 829,435 | ||||
Average amount outstanding during the period | $ | 22,732 | $ | 114,368 | $ | 377,014 | ||||
Weighted average interest rate for the period | 0.40 | % | 3.00 | % | 5.29 | % | ||||
Interest expense on securities sold under agreements to repurchase aggregated $58 thousand, $3.4 million and $19.9 million for the period from October 1, 2008 through May 21, 2009, and the fiscal years ended September 30, 2008 and September 30, 2007, respectively.
As of May 21, 2009, September 30, 2008, and September 30, 2007, the Bank had pledged mortgage-backed securities with a fair value of approximately $30.4 million, $79.4 million and $143.0 million, respectively, for securities sold under agreements to repurchase. The agreements are overnight agreements with an average interest rate of 0.00%, 0.99%, and 4.58% at May 21, 2009, September 30, 2008, and September 30, 2007, respectively.
BANKUNITED, FSB AND SUBSIDIARIES
NOTES TO CONSOLIDATED FINANCIAL STATEMENTS (Continued)
Note 10 FHLB Advances
Advances from the FHLB outstanding as of May 21, 2009 incur interest and have contractual repayments as follows (amounts in thousands):
| | Amount | Range of Interest Rates | |||||||||
|---|---|---|---|---|---|---|---|---|---|---|---|
Repayable During Period Ending May 21, | |||||||||||
2010 | $ | 2,300,000 | 2.52 | % | 5.24 | % | |||||
2011 | 605,000 | 2.47 | % | 4.97 | % | ||||||
2012 | 235,000 | 2.81 | % | 4.36 | % | ||||||
2013 | 750,000 | 3.09 | % | 4.83 | % | ||||||
2014 | — | — | — | ||||||||
2015 | 100 | 0.00 | % | 0.00 | % | ||||||
2016 | 364,250 | 0.00 | % | 4.79 | % | ||||||
2017 | — | — | — | ||||||||
2018 | 175,000 | 2.76 | % | 2.95 | % | ||||||
Total Carrying Value | $ | 4,429,350 | |||||||||
The terms of a security agreement with the FHLB include a specific assignment of collateral that requires the maintenance of qualifying first mortgage, commercial real estate loans, home equity lines of credit and mortgage-backed securities as pledged collateral with unpaid principal amounts at least equal to 100% of the FHLB advances, when discounted at various percentages of their unpaid principal balance. As of May 21, 2009, September 30, 2008 and September 30, 2007, the Bank had pledged investment securities and mortgage loans with an aggregate carrying amount of approximately $7.9 billion, $8.8 billion and $9.1 billion, respectively, for advances from the FHLB.
Interest expense for FHLB Advances was $133.8 million, $259.0 million and $280.8 million, for the period from October 1, 2008 through May 21, 2009, and the fiscal years ended September 30, 2008 and 2007, respectively.
Note 11 Derivatives and Hedging Activities
The Bank uses derivative instruments as part of its interest rate risk management activities to reduce risks associated with its loan origination and borrowing activities. Derivatives used for interest rate risk management include loan commitments and forward contracts that relate to the pricing of specific on-balance sheet instruments and forecasted transactions. The Bank recognizes all derivatives as either assets or liabilities on the consolidated balance sheets and reports them at fair value with realized and unrealized gains and losses included in either earnings or in other comprehensive income, depending on the purpose for which the derivative is held and whether the derivative qualifies for hedge accounting.
Loan Commitments
The Bank commits to originate one-to-four family residential mortgage loans with potential borrowers at specified interest rates for short periods of time, usually thirty days. If potential borrowers meet underwriting standards, these loan commitments obligate the Bank to fund the loans, but do not obligate the potential borrowers to accept the loans. If the borrowers do not allow the commitments to expire, the loans are funded, and either placed into the Bank's loan portfolio or held for sale. Based on
BANKUNITED, FSB AND SUBSIDIARIES
NOTES TO CONSOLIDATED FINANCIAL STATEMENTS (Continued)
Note 11 Derivatives and Hedging Activities (Continued)
historical experience, the interest rate environment, and the underlying loan characteristics, the Bank estimates the amount of commitments that will ultimately become loans held for sale and accounts for those as derivatives during the commitment period. As derivatives, the changes in the fair value of the commitments are recorded in current earnings under other non-interest expense with an offset to the consolidated balance sheets in other liabilities. Fair values are based solely on the relationship of observable market interest rates and are calculated with the assistance of third parties.
Forward Sales Contracts
The Bank enters into forward sales contracts in order to economically hedge fair value exposure of loan commitments and fair value exposure to a change in interest rates of loans held for sale. Fair value changes of forward sales contracts, not eligible for hedge accounting, are recorded in earnings under non-interest expense with an offset in other liabilities. Hedge accounting was not applied to these contracts in the period from October 1, 2007 through May 21, 2009. Loans held for sale do not include any payment option loans.
Interest Rate Swaps
The Bank had an interest rate swap agreement that expired during the year ended September 30, 2007. As of May 21, 2009 and September 30, 2008, the Bank had no interest rate swap agreements outstanding.
The following table summarizes certain information with respect to the use of derivatives and their impact on the Bank's consolidated statements of operations during the period ended May 21, 2009 and the years ended September 30, 2008 and September 30, 2007:
| | | September 30, | |||||||||
|---|---|---|---|---|---|---|---|---|---|---|---|
| | May 21, 2009 | ||||||||||
| | 2008 | 2007 | |||||||||
| | (in thousands) | ||||||||||
Interest Rate Swaps | |||||||||||
Net gain (loss) recorded in non-interest income related to swaps | $ | — | $ | 14 | $ | (327 | ) | ||||
Other Derivatives(1) | |||||||||||
Gain (loss) recorded in non-interest expense related to loan commitments | $ | 183 | $ | 97 | $ | (9 | ) | ||||
Loss recorded in non-interest expense related to forward sales contracts | $ | (435 | ) | $ | (627 | ) | $ | (763 | ) | ||
Total net loss recorded in earnings due to derivatives | $ | (252 | ) | $ | (516 | ) | $ | (1,099 | ) | ||
Note 12 Regulatory Capital
See Note 1 for a discussion of regulatory matters affecting regulatory capital.
BANKUNITED, FSB AND SUBSIDIARIES
NOTES TO CONSOLIDATED FINANCIAL STATEMENTS (Continued)
Note 12 Regulatory Capital (Continued)
On September 5, 2008, BankUnited received notification that the OTS reclassified the Bank's regulatory capital status from well-capitalized to adequately capitalized due to the deterioration in the Bank's non-traditional mortgage loan portfolio, the concentration of risk associated with that portfolio, and a resultant need for significant additional capital. As of May 21, 2009, the Bank had negative regulatory capital which created significant capital deficiencies in Tier 1 leverage, Tier 1 risk-based and total risk-based capital ratios.
BankUnited's regulatory capital levels as of September 30, 2008 and September 30, 2007 were as follows (amounts in thousands):
| | September 30, 2008 | ||||||||||||||||||
|---|---|---|---|---|---|---|---|---|---|---|---|---|---|---|---|---|---|---|---|
| | Actual | Required to be considered well-capitalized(1) | Required to be considered adequately capitalized | ||||||||||||||||
| | Ratio | Amount | Ratio | Amount | Ratio | Amount | |||||||||||||
Tier 1 leverage ratio | 2.89 | % | $ | 406,599 | 5.00 | % | $ | 703,458 | 4.00 | % | $ | 562,767 | |||||||
Tier 1 risk-based capital ratio | 4.90 | % | 403,795 | 6.00 | % | 494,443 | 4.00 | % | 329,629 | ||||||||||
Total risk based capital ratio | 6.21 | % | 512,446 | 10.00 | % | 825,195 | 8.00 | % | 660,156 | ||||||||||
| | September 30, 2007 | ||||||||||||||||||
|---|---|---|---|---|---|---|---|---|---|---|---|---|---|---|---|---|---|---|---|
| | Actual | Required to be considered well-capitalized | Required to be considered adequately capitalized | ||||||||||||||||
| | Ratio | Amount | Ratio | Amount | Ratio | Amount | |||||||||||||
Tier 1 leverage ratio | 7.84 | % | $ | 1,183,375 | 5.00 | % | $ | 754,703 | 4.00 | % | $ | 603,763 | |||||||
Tier 1 risk-based capital ratio | 14.64 | % | 1,173,788 | 6.00 | % | 481,061 | 4.00 | % | 320,707 | ||||||||||
Total risk based capital ratio | 15.37 | % | 1,232,706 | 10.00 | % | 802,021 | 8.00 | % | 641,617 | ||||||||||
No capital distributions were made by the Bank during the period ended May 21, 2009, and for the fiscal years ended September 30, 2008 and 2007.
In each of the fiscal years ended September 30, 2008 and September 30, 2007, BKUNA, the Bank's sole shareholder at that time, contributed $80 million, in additional capital to the Bank.
Note 13 Benefit Plans
BankUnited 401(k) Plan
The Bank sponsors a 401(k) profit sharing plan (the "401(k) Plan") for eligible employees. Under the terms of the 401(k) Plan, eligible employees may contribute up to the limits set by law. Employees are eligible to participate in the plan after one month of service and the Bank's matching contributions begin vesting after two years of service at the rate of 25% per year up to 100% by the fifth year of service. The Bank makes matching contributions to the 401(k) Plan equal to 75% of the eligible employee pre-tax contribution up to 6% of salary. The matching contributions are made in the form of cash and allocated to the 401(k) Plan participants' investments. For the period from October 1, 2008 through May 21, 2009 and for the fiscal years ended September 30, 2008 and September 30, 2007, the
BANKUNITED, FSB AND SUBSIDIARIES
NOTES TO CONSOLIDATED FINANCIAL STATEMENTS (Continued)
Note 13 Benefit Plans (Continued)
Bank made matching contributions of approximately $1.4 million, $2.4 million and $2.1 million, respectively.
Note 14 Income Taxes
The components of the provision (benefit) for income taxes for the period from October 1, 2008 through May 21, 2009 and for the fiscal years ended September 30, 2008 and September 30, 2007, is as follows (in thousands):
| | | September 30, | ||||||||||
|---|---|---|---|---|---|---|---|---|---|---|---|---|
| | May 21, 2009 | |||||||||||
| | 2008 | 2007 | ||||||||||
Current income tax expense (benefit): | ||||||||||||
Federal | $ | (50,306 | ) | $ | (15,976 | ) | $ | 55,196 | ||||
State | — | — | 46 | |||||||||
Total current income tax expense (benefit): | (50,306 | ) | (15,976 | ) | 55,242 | |||||||
Deferred income tax expense (benefit): | ||||||||||||
Federal | (382,587 | ) | (320,645 | ) | (175 | ) | ||||||
State | (19,787 | ) | (30,890 | ) | — | |||||||
Valuation allowance | 452,680 | 273,049 | — | |||||||||
Total deferred income tax expense (benefit) | 50,306 | (78,486 | ) | (175 | ) | |||||||
Total income tax expense (benefit) | $ | — | $ | (94,462 | ) | $ | 55,067 | |||||
A reconciliation of the expected income tax expense (benefit) at the statutory federal income tax rate of 35% to the Bank's actual income tax expense and effective tax rate for the period from October 1, 2008 through May 21, 2009 and for the fiscal years ended September 30, 2008 and September 30, 2007, is as follows (amounts in thousands):
| | | | September 30, | ||||||||||||||||||
|---|---|---|---|---|---|---|---|---|---|---|---|---|---|---|---|---|---|---|---|---|---|
| | May 21, 2009 | ||||||||||||||||||||
| | 2008 | 2007 | |||||||||||||||||||
| | Amount | % | Amount | % | Amount | % | |||||||||||||||
Tax expense (benefit) at federal income tax rate | $ | (431,808 | ) | 35.0 | % | $ | (334,260 | ) | 35.0 | % | $ | 57,601 | 35.0 | % | |||||||
Increases (decreases) resulting from: | |||||||||||||||||||||
State tax, net of federal benefit | (19,787 | ) | 1.6 | % | (30,890 | ) | 3.2 | % | 46 | 0.0 | % | ||||||||||
Tax exempt income | (1,184 | ) | 0.2 | % | (2,017 | ) | 0.2 | % | (2,737 | ) | (1.7 | )% | |||||||||
Other | 99 | 0.0 | % | (344 | ) | 0.1 | % | 157 | 0.1 | % | |||||||||||
Valuation allowance | 452,680 | (36.7 | )% | 273,049 | (28.6 | )% | — | 0.0 | % | ||||||||||||
Total | $ | — | 0.1 | % | $ | (94,462 | ) | 9.9 | % | $ | 55,067 | 33.4 | % | ||||||||
Deferred income tax assets and liabilities result from temporary differences between assets and liabilities measured for financial reporting purposes and for income tax return purposes. These assets and liabilities are measured using the enacted tax rates and laws that are currently in effect and are reported net in the accompanying Consolidated Balance Sheets. The significant components of the net
BANKUNITED, FSB AND SUBSIDIARIES
NOTES TO CONSOLIDATED FINANCIAL STATEMENTS (Continued)
Note 14 Income Taxes (Continued)
deferred tax assets and liabilities at May 21, 2009, September 30, 2008, and September 30, 2007 were as follows (in thousands):
| | | September 30, | |||||||||||
|---|---|---|---|---|---|---|---|---|---|---|---|---|---|
| | May 21, 2009 | ||||||||||||
| | 2008 | 2007 | |||||||||||
Deferred tax assets: | |||||||||||||
Allowance for loan losses and other reserves | $ | 521,487 | $ | 293,069 | $ | 16,568 | |||||||
Impairment losses on available for sale securities | 84,822 | 58,549 | — | ||||||||||
Unrealized losses in other comprehensive income | 4,043 | 16,810 | 7,061 | ||||||||||
Non-accrual interest | 15,518 | 9,615 | 3,054 | ||||||||||
AMT credit carryover | 3,250 | — | — | ||||||||||
Impairment on other real estate owned and other expenses | — | 8,802 | 1,845 | ||||||||||
Reserve for recourse liability | 4,748 | 4,748 | — | ||||||||||
NOL carryforward | 151,220 | — | — | ||||||||||
Other | 2,182 | 1,402 | 452 | ||||||||||
Gross deferred tax assets | 787,270 | 392,995 | 28,980 | ||||||||||
Valuation allowance | (730,041 | ) | (287,823 | ) | — | ||||||||
Net deferred tax asset | $ | 57,229 | $ | 105,172 | $ | 28,980 | |||||||
Deferred tax liabilities: | |||||||||||||
Deferrals and amortization | 186 | — | 7,341 | ||||||||||
Sale of mortgage servicing rights | — | 10,113 | — | ||||||||||
Other real estate owned expenses | 5,945 | — | — | ||||||||||
Deferred REIT income | 50,783 | 44,381 | 51,342 | ||||||||||
Other | 315 | 372 | 232 | ||||||||||
Gross deferred liabilities | $ | 57,229 | $ | 54,866 | $ | 58,915 | |||||||
Net deferred tax asset (liability) | $ | — | $ | 50,306 | $ | (29,935 | ) | ||||||
Realization of tax benefits for deductible temporary differences depends on having sufficient taxable income of an appropriate character within the carryforward periods. Sources of taxable income that may allow for the realization of these tax benefits include: (1) taxable income that would be available through carryback in future years, (2) future taxable income that will result from reversal of existing taxable temporary differences, (3) taxable income generated from future operations, and (4) prudent and feasible tax planning strategies.
At May 21, 2009 and September 30, 2008, the Bank had deferred tax assets net of deferred tax liabilities, before valuation allowances, of $730.0 and $338.1 million. The Bank's net deferred tax asset before valuation allowances resulted primarily from an increase in its allowance for loan losses and the recognition of other-than-temporary impairment losses on certain securities available for sale. At May 21, 2009 and September 30, 2008, after considering all available evidence the Bank determined that it was more likely than not that only a portion of its deferred tax assets in each fiscal period will not be realized. The determination that a valuation allowance was needed was primarily based on the current level of losses the Bank is experiencing, in addition to the uncertainty with respect to its future forecasted results. As a result of this determination, the Bank recorded a valuation allowance of $730.0
BANKUNITED, FSB AND SUBSIDIARIES
NOTES TO CONSOLIDATED FINANCIAL STATEMENTS (Continued)
Note 14 Income Taxes (Continued)
and $287.8 million against its net deferred tax assets at May 21, 2009 and September 30, 2008, respectively.
The Bank determined that it is more likely than not that it will realize $50.3 million of its net deferred tax assets as a result of the future carryback of losses generated by the deferred tax assets that will reverse during fiscal year 2009 and will be carried back to fiscal year 2007. This carryback is expected to result in a refund of $50.3 million of income taxes paid by the Bank in 2007.
As of May 21, 2009, the Bank had a net operating loss carryforward for Federal tax purposes of $432.1 million which will expire in 2029. The Bank's state income tax net operating loss carryforward is approximately $951 million which will begin to expire in 2027. The Federal and State net operating loss deferred tax asset is completely offset by a valuation allowance.
The Bank adopted the provisions of FIN 48 effective October 1, 2007. The adoption of FIN 48 did not have a material effect on the Bank's financial condition, as the Bank recognized no increase in its liability for unrecognized income tax benefits. In addition, the Bank had no liabilities recorded for unrecognized income tax benefits for fiscal year 2007. For the period ended May 21, 2009, the Bank did not have any material unrecognized income tax benefits and, accordingly, the company continued to have a zero liability balance relating to FIN 48. The Company has elected to account for any applicable interest and penalties on uncertain tax positions as a component of income tax expense.
BKUNA federal returns through 2005 have been examined by the Internal Revenue Service ("IRS"), and therefore, it remains subject to examination for its fiscal years ended September 30, 2006, 2007 and 2008. Generally, the state jurisdictions in which the Bank files income tax returns are subject to examination for a period of up to four years after the returns are filed.
Note 15 Commitments and Contingencies
Reserve for Recourse Liability for Loans Sold
BankUnited has sold and securitized loans (hereinafter referred to as loan sales or loans sold) without recourse to government sponsored entities and private investors. When a loan sold to an investor without recourse contains fraudulent representations, errors, omissions or negligence on the part of the seller or any party involved in the origination, including the borrower or appraiser, or a breach of other representations and warranties, the Bank may be required to repurchase the loan or indemnify the investor for losses sustained.
The estimated losses related to forecasted loan repurchase activity and make whole indemnity claims meet the criteria for accrual of a loss contingency as of September 30, 2008. Management estimated the amount of potential losses related to the Bank's recourse obligations as of September 30, 2008 based on various sensitivity analyses taking into account historical experience and trends and current and projected market, industry and economic conditions. These factors are used to develop forecasted repurchase activity and estimated severity of losses. This analysis resulted in the Bank recording a provision for recourse liability amounting to $12.4 million during the year ended September 30, 2008, which is included in gain (loss) on sale of loans in the consolidated statement of operations. The reserve for recourse liability on loans sold is included in other liabilities in the consolidated balance sheets as of May 21, 2009 and September 30, 2008. The Bank accounts for loans repurchased under recourse provisions at fair value on the date of repurchase, and recognizes an adjustment to the reserve for recourse liability for any difference between the fair value of the loan and the amount due to the investor.
BANKUNITED, FSB AND SUBSIDIARIES
NOTES TO CONSOLIDATED FINANCIAL STATEMENTS (Continued)
Note 15 Commitments and Contingencies (Continued)
A summary of the activity in the reserve for the period ended May 21, 2009 and the year ended September 30, 2008 is as follows (no such reserve was deemed necessary at September 30, 2007):
| | For The Period Ended May 21, 2009 | For The Year Ended September 30, 2008 | ||||||
|---|---|---|---|---|---|---|---|---|
Balance at beginning of period | $ | 8,663 | $ | — | ||||
Provision for recourse liability | — | 12,400 | ||||||
Mark-to-market adjustment for loans repurchased | (1,635 | ) | (3,689 | ) | ||||
Make whole indemnifications | (2,786 | ) | (48 | ) | ||||
Balance at end of period | $ | 4,242 | $ | 8,663 | ||||
Financial Instruments Commitments
The Bank issues off-balance sheet financial instruments in connection with BankUnited's lending activities and to meet the financing needs of its customers. These financial instruments include commitments to fund loans, lines of credit, and commercial and standby letters of credit. These commitments expose the Bank to varying degrees of credit and market risk which are essentially the same as those involved in extending loans to customers, and are subject to the Bank's credit policies. The Bank follows the same credit policies in making commitments as it does for instruments recorded on the Bank's consolidated balance sheet. Collateral is obtained based on management's assessment of the customer's credit risk. The Bank's exposure to credit loss is represented by the contractual amount of these commitments.
Total commitments at May 21, 2009 were as follows (in thousands):
Commitments to fund loans | ||||||
Commercial and commercial real estate | $ | 18,438 | ||||
Construction | 25,148 | |||||
Unfunded commitments under line of credit | 294,748 | |||||
Commercial and standby letters of credit | 27,149 | |||||
Total | $ | 365,483 | ||||
Commitments to fund loans:
These are agreements to lend funds to customers as long as there is no violation of any condition established in the contract. Commitments to fund loans generally have fixed expiration dates or other termination clauses and may require payment of a fee. Many of these commitments are expected to expire without being funded, and therefore the total commitment amounts do not necessarily represent future liquidity requirements. The Bank evaluates each customer's creditworthiness on a case-by-case basis. The amount of collateral required in connection with an extension of credit is based on management's credit evaluation of the counterparty.
Unfunded commitments under lines of credit:
To accommodate the financial needs of customers, the Bank makes commitments under various terms to lend funds to consumers and businesses. Unfunded commitments under lines of credit include consumer, commercial and commercial real estate lines of credit to existing customers. Many of these
BANKUNITED, FSB AND SUBSIDIARIES
NOTES TO CONSOLIDATED FINANCIAL STATEMENTS (Continued)
Note 15 Commitments and Contingencies (Continued)
commitments have fixed expiration dates or other termination clauses and may require payment of a fee. Since many of these commitments are expected to expire without being funded, the total commitment amounts do not necessarily represent future liquidity requirements. The amount of collateral obtained, if it is deemed necessary, is based on management's credit evaluation of the customer.
Commercial and standby letters of credit:
Letters of credit are conditional commitments issued by the Bank to guarantee the performance of a customer to a third party. Those letters of credit are primarily issued to support trade transactions or guarantee arrangements. Fees collected on standby letters of credit represent the fair value of those commitments and are deferred and amortized over their term, which is typically one year or less. The credit risk involved in issuing letters of credit is essentially the same as that involved in extending loan facilities to customers. BankUnited generally holds collateral supporting those commitments if deemed necessary.
Other Commitments
Employment Agreements. The Bank has employment and change in control agreements with certain members of senior management. The employment agreements, which establish the duties and compensation of the executives, have terms ranging from one year to five years, and include specific provisions for salary, bonus, other benefits and termination payments in certain circumstances. In addition to other provisions, the change in control agreements provide for severance payments in the event of a change in control.
Operating leases. BankUnited leases premises and equipment under cancelable and non-cancelable operating leases, some of which contain renewal options under various terms.
Legal Proceedings.
BankUnited and its subsidiaries, from time to time, are involved as plaintiff or defendant in other various legal actions arising in the normal course of their businesses. While the ultimate outcome of any such proceedings cannot be predicted with certainty, it is the opinion of management, based on advice of legal counsel, that no proceedings exist, either individually or in the aggregate, which, if determined adversely to BankUnited and its subsidiaries, would have a material effect on BankUnited's consolidated financial condition, results of operations or cash flows.
As discussed in note 1 to the consolidated financial statements, the OTS seized the Bank on May 21, 2009 and appointed the FDIC as receiver. Pursuant to the terms of the Purchase and Assumption Agreement under which the New BankUnited purchased certain assets and assumed certain deposits and other liabilities of the Bank, all defensive litigation liabilities of the Bank were retained by the FDIC, as receiver, except those defensive litigation liabilities that relate to an asset purchased by New BankUnited and that are subject to a loss sharing agreement, which such liabilities were assumed by New BankUnited.
Note 16 Related Party Transactions
The Bank has a Management Agreement with BKUNA dated October 1, 2006. The Management Agreement requires that BKUNA reimburse the Bank for management and other services provided to BKUNA on a monthly basis. BKUNA paid management fees to the Bank in conjunction with the
BANKUNITED, FSB AND SUBSIDIARIES
NOTES TO CONSOLIDATED FINANCIAL STATEMENTS (Continued)
Note 16 Related Party Transactions (Continued)
Management Agreement amounting to $0.6 million, $1.1 million and $1.1 million for the period ended May 21, 2009 and for the years ended September 30, 2008 and 2007, respectively. The management fees paid by BKUNA are included in non-interest income—service charges in the consolidated statements of operations.
The Bank and BU Financial Services (BUFS), a wholly-owned subsidiary of BKUNA, entered into a Fee Agreement dated October 1, 2007. The Fee Agreement requires that BUFS reimburse the Bank for management and other services provided to BUFS on a monthly basis. BUFS paid management fees to the Bank in conjunction with the Fee Agreement amounting to $1.2 million and $4.1 million for the period ended May 21, 2009 and for the year ended September 30, 2008, respectively. The fees received are included in non-interest income—service charges in the consolidated statements of operations.
The Bank has entered into a Tax Sharing Agreement with BKUNA, whereby the Bank pays to or receives cash from BKUNA as if the Bank filed separate tax returns. Any amount of current tax due to or receivable from BKUNA is included in the intercompany balance.
The consolidated balance sheets include $10.6 million, $1.9 million and $1.7 million in other assets as of May 21, 2009 and September 30, 2008 and 2007, respectively, related to amounts receivable from BKUNA and BUFS related to the intercompany agreements discussed above and other intercompany transaction in the ordinary course of business, including amounts related to intercompany settlement of current taxes due or payable. In addition, included in interest bearing demand deposits in the accompanying consolidated balance sheets as of May 21, 2009 and September 30, 2008 and 2007 are $18.1 million, $29.1 million and $204.5 million, respectively, of deposits from BKUNA and BUFS.
BKUNA had a capital commitment to the Bank as of September 30, 2007 amounting to $80 million which was recorded as a capital contribution and is included in other assets. The capital commitment was paid on October 1, 2007.
From time to time, the Bank makes loans in the ordinary course of business as a financial institution to directors, officers and employees of the Bank, as well as to members of their immediate families and affiliates, to the extent consistent with applicable laws and regulations. As of May 21, 2009, September 30, 2008, and September 30, 2007 these loans totaled $1.7 million, $2.0 million, and $2.0 million, respectively.
For the period ended May 21, 2009 and the years ended September 30, 2008 and September 30, 2007, the Bank retained the law firm of Camner, Lipsitz and Poller, P.A ("CLP"), as general counsel. The Bank's and BKUNA's former Chief Executive Officer and Chairman of the Board of Directors, until October 20, 2008 is the senior managing director of CLP and one of two of the shareholders of the law firm. For the period ended May 21, 2009 and the years ended September 30, 2008 and September 30, 2007, the Bank paid CLP approximately $3.2 million, $7.1 million, and $4.9 million respectively, in legal fees and reimbursable expenses, related to loan closings, foreclosures, litigation, corporate and other matters.
CLP subleases approximately 2,223 square feet of office space in Coral Gables, Florida from the Bank. The sublease extends through January 31, 2014 and may be renewed for up to four additional five-year terms, subject to the Bank exercising its right to renew under the master lease. Under the terms of the sublease the minimum annual rental payments for the property is $65.7 thousand. Payments from CLP to the Bank during the period from October 1, 2008 to May 21, 2009 and the fiscal years ended September 30, 2008, and September 30, 2007, totaled $55 thousand, $81 thousand
BANKUNITED, FSB AND SUBSIDIARIES
NOTES TO CONSOLIDATED FINANCIAL STATEMENTS (Continued)
Note 16 Related Party Transactions (Continued)
and $79 thousand, respectively, which included payments for tenant improvements of $8 thousand, $13 thousand, and $23 thousand, respectively. The Bank believes that the terms of the sublease reflect market rates comparable to those prevailing in the area for similar rental properties involving non-affiliated parties at the time the sublease was made.
For the period ended May 21, 2009 and the fiscal years ended September 30, 2008 and September 30, 2007, BankUnited obtained policies for directors' and officers' liability insurance, banker's blanket bond insurance, commercial multi-peril insurance, workers' compensation insurance and BankUnited's health and dental insurance through HBA Insurance Group, of which a director of the Bank, is a member of the Board of Directors and shareholder. For the period ended May 21, 2009 and the years ended September 30, 2008 and September 30, 2007, the Bank paid HBA Insurance Group $490 thousand, $350 thousand, and $319 thousand, respectively, in commissions on premiums paid for these policies.
The Bank paid the firm of Rachlin, LLP $10 thousand and $75 thousand for consulting services for the period ended May 21, 2009 and the year ended September 30, 2008, respectively. The managing partner of Rachlin, LLP is a member of the Bank's Board of Directors.
Note 17 Fair Value
The Bank groups its assets and liabilities measured at fair value in three levels, based on the markets in which the assets and liabilities are traded and the reliability of the assumptions used to determine fair value. These levels are as follows:
Level 1—Assets or liabilities for which the identical item is traded on an active exchange, such as publicly-traded instruments or futures contracts.
Level 2—Assets and liabilities valued based on observable market data for similar instruments.
Level 3—Assets or liabilities for which significant valuation assumptions are not readily observable in the market; instruments valued based on the best available data, some of which is internally-developed, and considers risk premiums that a market participant would require. Valuation techniques include use of option pricing models, discounted cash flow models and similar techniques.
In instances where there is limited or no observable market data, fair value measurements for assets and liabilities are based primarily upon the Bank's own estimates or combination of such estimates and independent vendor or broker pricing. When determining the fair value measurements for assets and liabilities and the related fair value hierarchy, the Bank considers the principal or most advantageous market in which it would transact and considers assumptions that market participants would use when pricing the asset or liability (observable inputs). When possible, the Bank looks to active and observable markets to price identical assets or liabilities and when identical assets and liabilities are not traded in active markets, the Bank looks to market observable data for similar assets and liabilities. It is the Bank's policy to maximize the use of observable inputs and minimize the use of unobservable inputs. Unobservable inputs are only used to measure fair value to the extent that observable inputs are not available. The need to use unobservable inputs generally results from the lack of market liquidity, resulting in diminished observability of both actual trades and assumptions that would otherwise be available to value these instruments, or the value of the underlying collateral is not market observable. Although third party price indications may be available for a security, limited trading activity would make it difficult to support the observability of these quotations.
BANKUNITED, FSB AND SUBSIDIARIES
NOTES TO CONSOLIDATED FINANCIAL STATEMENTS (Continued)
Note 17 Fair Value (Continued)
The following is a description of the valuation methodologies used for financial assets and liabilities measured at fair value on a recurring basis, as well as the general classification of each instrument under the valuation hierarchy.
Assets and Liabilities Carried at Fair Value on a Recurring Basis
Investment securities available for sale—Investment securities available-for-sale are carried at fair value on a recurring basis. When available, fair value is based on quoted prices in an active market and as such would be classified as Level 1 (e.g., U.S. Government agencies and sponsored enterprises securities, preferred stock of U.S. Government agencies and mutual funds). If quoted market prices are not available, fair values are estimated using quoted prices of securities with similar characteristics, discounted cash flows or other pricing models. Investment securities available for sale that the Bank classifies as Level 2 include U.S. Government agencies mortgage-backed securities and collateralized mortgage obligations, preferred stock of other issuers and State and municipal obligations. All other investment securities available for sale are classified as Level 3 and include private label mortgage pass-through certificates, collateralized debt obligations and other debt securities, for which fair value estimation requires the use of unobservable inputs. The Bank values these securities using third party proprietary pricing models that incorporate observable and unobservable inputs.
The following table presents the financial instruments measured at fair value on a recurring basis as of May 21, 2009 on the consolidated balance sheet utilizing the hierarchy discussed above (in thousands):
| | May 21, 2009 | ||||||||||||||
|---|---|---|---|---|---|---|---|---|---|---|---|---|---|---|---|
| | Level 1 | Level 2 | Level 3 | Total | |||||||||||
Investment Securities Available for Sale: | |||||||||||||||
U.S. Treasury securities | $ | 35,423 | $ | — | $ | — | $ | 35,423 | |||||||
U.S. Government agencies and sponsored enterprises mortgage-backed securities | — | 227,879 | — | 227,879 | |||||||||||
Other collateralized mortgage obligations | — | — | 1,785 | 1,785 | |||||||||||
Mortgage pass-through certificates | — | — | 230,091 | 230,091 | |||||||||||
Mutual funds and preferred stocks | 17,981 | 113 | — | 18,094 | |||||||||||
State and municipal obligations | — | 22,446 | 250 | 22,696 | |||||||||||
Other debt securities | — | 1,300 | 1,676 | 2,976 | |||||||||||
Total assets at fair value | $ | 53,404 | $ | 251,738 | $ | 233,802 | $ | 538,944 | |||||||
The following table identifies changes in Level 3 financial instruments that are measured at fair value on a recurring basis as of May 21, 2009. Level 3 financial instruments typically include unobservable components, but may also include some observable components that may be validated to
BANKUNITED, FSB AND SUBSIDIARIES
NOTES TO CONSOLIDATED FINANCIAL STATEMENTS (Continued)
Note 17 Fair Value (Continued)
external sources. The gains or losses in the following table may include changes to fair value due in part to unobservable factors that may be part of the valuation methodology (in thousands):
| | Other Collateralized Mortgages Obligations | Mortgages Pass-through Certificates | State and Municipal obligations | Other Debt Securities | ||||||||||
|---|---|---|---|---|---|---|---|---|---|---|---|---|---|---|
Balance September 30, 2008 | $ | 3,463 | $ | 394,321 | $ | 250 | $ | 6,490 | ||||||
Total net gains (losses) for the year included in: | ||||||||||||||
Other comprehensive income | (1,554 | ) | (57,543 | ) | (0 | ) | (80 | ) | ||||||
Purchases, sales or settlements, net | (124 | ) | (106,687 | ) | (0 | ) | (4,734 | ) | ||||||
Balance May 21, 2009 | $ | 1,785 | $ | 230,091 | $ | 250 | $ | 1,676 | ||||||
Financial Assets and Liabilities Measured at Fair Value on a Non-Recurring Basis
Loans are measured for impairment using the fair value of the collateral. Fair value of the loan collateral is primarily determined using estimates which generally use the market and income approach valuation technique and use observable market data to formulate an opinion of the estimated fair value. When current appraisals are not available, the Bank uses its judgment regarding changes in market conditions, based on observable market inputs, to adjust the latest appraised value available. As a result, the estimated fair value is considered Level 3.
Fair Value of Financial Instruments
The following table presents the carrying value and fair value of financial instruments as of May 21, 2009 and for the fiscal years ended September 30, 2008 and September 30, 2007 (in thousands):
| | May 21, 2009 | September 30, 2008 | September 30, 2007 | |||||||||||||||||
|---|---|---|---|---|---|---|---|---|---|---|---|---|---|---|---|---|---|---|---|---|
| | Carrying Value | Fair Value | Carrying Value | Fair Value | Carrying Value | Fair Value | ||||||||||||||
Financial Instruments: | ||||||||||||||||||||
Assets: | ||||||||||||||||||||
Cash and cash equivalents | $ | 1,143,280 | $ | 1,143,280 | $ | 1,223,346 | $ | 1,223,346 | $ | 512,885 | $ | 512,885 | ||||||||
Investment securities available for sale, at fair value | 538,944 | 538,944 | 755,225 | 755,225 | 1,098,665 | 1,098,665 | ||||||||||||||
Federal Home Loan Bank stock | 243,334 | 243,334 | 262,571 | 262,571 | 305,385 | 305,385 | ||||||||||||||
Loans held for sale | 788 | 788 | 10,050 | 10,050 | 174,868 | 174,868 | ||||||||||||||
Loans held in portfolio, net | 9,787,042 | 5,010,328 | 11,249,367 | 11,264,161 | 12,561,693 | 12,531,026 | ||||||||||||||
Bank owned life insurance | 129,111 | 129,111 | 126,956 | 126,956 | 122,100 | 122,100 | ||||||||||||||
Accrued interest receivable | 43,310 | 43,310 | 66,394 | 66,394 | 85,853 | 85,853 | ||||||||||||||
Liabilities: | ||||||||||||||||||||
Demand deposits, savings, money market and certificates of deposit | 8,555,907 | 8,664,473 | 8,176,817 | 8,176,839 | 7,305,788 | 7,309,925 | ||||||||||||||
Securities sold under agreements to repurchase | 1,310 | 1,310 | 56,930 | 56,930 | 143,072 | 143,072 | ||||||||||||||
Advances from Federal Home Loan Bank | 4,429,350 | 4,630,614 | 5,279,350 | 5,357,556 | 6,234,360 | 6,253,423 | ||||||||||||||
Accrued interest payable | 52,283 | 52,283 | 36,505 | 36,505 | 37,694 | 37,694 | ||||||||||||||
Income taxes payable | — | — | — | — | 20,843 | 20,843 | ||||||||||||||
Advance payments by borrowers for taxes and insurance | 52,362 | 52,362 | 91,223 | 91,223 | 97,455 | 97,455 | ||||||||||||||
Other liabilities | 58,623 | 58,623 | 48,923 | 48,923 | 34,576 | 34,576 | ||||||||||||||
Derivative instruments | — | — | 73 | 73 | 785 | 785 | ||||||||||||||
BANKUNITED, FSB AND SUBSIDIARIES
NOTES TO CONSOLIDATED FINANCIAL STATEMENTS (Continued)
Note 17 Fair Value (Continued)
The following methods and assumptions were used to estimate the fair value of each class of financial instruments not carried at fair value on recurring basis:
Certain financial instruments are carried at amounts that approximate fair value, due to their short-term nature or their generally negligible credit risk. The Bank's financial instruments for which fair value approximates the carrying amount at May 21, 2009, September 30, 2008, and September 30, 2007 include cash and cash equivalents, FHLB stock, accrued interest receivable, Bank owned life insurance, demand deposits, savings and money market accounts, securities sold under agreements to repurchase, income taxes payable, advance payments by borrowers for taxes and insurance and other liabilities.
Loans receivable
Fair values for all performing loans are estimated using a discounted cash flow analysis, utilizing interest rates currently being offered for loans with similar terms to borrowers of similar credit quality.
Bank Owned Life Insurance—The estimated fair value of Bank Owned Life Insurance is based on the cash surrender value.
Deposits:
The fair value of demand deposits, savings accounts and money market deposits is the amount payable on demand at the reporting date. The fair value of fixed-maturity certificates of deposit are estimated using discounted cash flow analysis using the rates currently offered for deposits of similar remaining maturities.
FHLB advances:
The fair value of the borrowings is estimated by discounting the future cash flows using the current rate at which similar borrowings with similar remaining maturities could be made.
Through and including , 2011 (25 days after the date of this prospectus), all dealers that buy, sell or trade our common stock, whether or not participating in this offering, may be required to deliver a prospectus. This delivery requirement is in addition to the obligation of dealers to deliver a prospectus when acting as underwriters and with respect to their unsold allotments or subscriptions.
26,250,000 Shares
![]()
BankUnited, Inc.
Common Stock
Prospectus
, 2011
Morgan Stanley | BofA Merrill Lynch | |
Deutsche Bank Securities | Goldman, Sachs & Co. |
Keefe, Bruyette & Woods | RBC Capital Markets | UBS Investment Bank |
PART II
INFORMATION NOT REQUIRED IN PROSPECTUS
Item 13. Other Expenses of Issuance and Distribution.
The following table sets forth the costs and expenses, other than underwriting discounts and commissions, payable by us in connection with the sale of the common stock being registered. All amounts, except the SEC registration fee and the FINRA filing fee, are estimates.
SEC registration fee | $ | 21,390 | $ | 87,619 | ||||
FINRA filing fee | 30,500 | 75,500 | ||||||
NYSE listing fees and expenses | 250,000 | 250,000 | ||||||
Transfer agent and registrar fees and expenses | 10,000 | 10,000 | ||||||
Printing fees and expenses | 750,000 | 750,000 | ||||||
Legal fees and expenses | 2,500,000 | 2,500,000 | ||||||
Accounting fees and expenses | 1,250,000 | 1,250,000 | ||||||
Miscellaneous | 100,000 | 100,000 | ||||||
Total | $ | 4,911,890 | $ | 5,023,119 | ||||
Item 14. Indemnification of Directors and Officers.
Section 102(b)(7) of the DGCL permits a corporation to provide in its certificate of incorporation that a director of the corporation shall not be personally liable to the corporation or its stockholders for monetary damages for breach of fiduciary duty as a director, except for liability (i) for any breach of the director's duty of loyalty to the corporation or its stockholders, (ii) for acts or omissions not in good faith or which involve intentional misconduct or a knowing violation of law, (iii) under Section 174 of the DGCL (regarding, among other things, the payment of unlawful dividends or unlawful stock purchases or redemptions), or (iv) for any transaction from which the director derived an improper personal benefit. Our amended and restated certificate of incorporation will provide for such limitation of liability.
Section 145(a) of the DGCL empowers a corporation to indemnify any director, officer, employee or agent, or former director, officer, employee or agent, who was or is a party or is threatened to be made a party to any threatened, pending or completed action, suit or proceeding, whether civil, criminal, administrative or investigative (other than an action by or in the right of the corporation) by reason of such person's service as a director, officer, employee or agent of the corporation, or such person's service, at the corporation's request, as a director, officer, employee or agent of another corporation or enterprise, against expenses (including attorneys' fees), judgments, fines and amounts paid in settlement actually and reasonably incurred by such person in connection with such action, suit or proceeding; provided that such director or officer acted in good faith and in a manner reasonably believed to be in or not opposed to the best interests of the corporation, and, with respect to any criminal action or proceeding; provided that such director or officer had no reasonable cause to believe his conduct was unlawful.
Section 145(b) of the DGCL empowers a corporation to indemnify any person who was or is a party or is threatened to be made a party to any threatened, pending or completed action or suit by or in the right of the corporation to procure a judgment in its favor by reason of the fact that such person is or was a director, officer, employee or agent of the corporation, or is or was serving at the request of the corporation as a director, officer, employee or agent of another enterprise, against expenses (including attorneys' fees) actually and reasonably incurred in connection with the defense or settlement of such action or suit; provided that such director or officer acted in good faith and in a manner he or she reasonably believed to be in or not opposed to the best interests of the corporation,
II-1
except that no indemnification may be made in respect of any claim, issue or matter as to which such director or officer shall have been adjudged to be liable to the corporation unless and only to the extent that the Delaware Court of Chancery or the court in which such action or suit was brought shall determine upon application that, despite the adjudication of liability but in view of all the circumstances of the case, such director or officer is fairly and reasonably entitled to indemnity for such expenses which the court shall deem proper. Notwithstanding the preceding sentence, except as otherwise provided in the by-laws, we shall be required to indemnify any such person in connection with a proceeding (or part thereof) commenced by such person only if the commencement of such proceeding (or part thereof) by any such person was authorized by the board.
In addition, our amended and restated certificate of incorporation will provide that we must indemnify our directors and officers to the fullest extent authorized by law. We are also expressly required to advance certain expenses to our directors and officers and carry directors' and officers' insurance providing indemnification for our directors and officers for some liabilities. We believe that these indemnification provisions and the directors' and officers' insurance are useful to attract and retain qualified directors and executive officers.
Prior to completion of this offering, we intend to enter into separate indemnification agreements with each of our directors and executive officers. Each indemnification agreement is expected to provide, among other things, for indemnification to the fullest extent permitted by law and our amended and restated certificate of incorporation and by-laws against (i) any and all expenses and liabilities, including judgments, fines, penalties, interest and amounts paid in settlement of any claim with our approval and counsel fees and disbursements, (ii) any liability pursuant to a loan guarantee, or otherwise, for any of our indebtedness, and (iii) any liabilities incurred as a result of acting on behalf of us (as a fiduciary or otherwise) in connection with an employee benefit plan. The indemnification agreements will provide for the advancement or payment of expenses to the indemnitee and for reimbursement to us if it is found that such indemnitee is not entitled to such indemnification under applicable law and our amended and restated certificate of incorporation and by-laws. Insofar as indemnification for liabilities arising under the Securities Act may be permitted to directors, officers or persons controlling us pursuant to the foregoing provisions, in the opinion of the SEC, such indemnification is against public policy as expressed in the Securities Act and is therefore unenforceable.
The proposed form of Underwriting Agreement filed as Exhibit 1.1 to this Registration Statement provides for indemnification of directors and officers of the Registrant by the underwriters against certain liabilities.
Item 15. Recent Sales of Unregistered Securities.
In the three years preceding the filing of this registration statement, BankUnited, Inc. has issued the following securities:
On April 28, 2009, in connection with its incorporation and initial capitalization, BankUnited, Inc. issued 1,000 shares of its common stock to BU Financial Holdings LLC for $10, which shares were subsequently canceled at the time of the Acquisition.
Since the Acquisition on May 21, 2009, BankUnited, Inc. issued an aggregate of 92,971,850.8 shares of its common stock to BU Financial Holdings LLC for consideration of $930.3 million in capital investment transactions.
The issuances of securities described in the preceding paragraphs were made in reliance upon the exemption from registration under Section 4(2) of the Securities Act of 1933, as amended, for transactions by an issuer not involving a public offering. BankUnited, Inc. did not offer or sell the securities by any form of general solicitation or general advertising, informed the purchaser that the
II-2
securities had not been registered under the Securities Act and were subject to restrictions on transfer, and made offers only to the purchaser, whom BankUnited, Inc. believed had the knowledge and experience in financial and business matters to evaluate the merits and risks of an investment in the securities.
BankUnited, Inc. granted certain of its employees (none of whom are named executive officers) 1,031,700 options to purchase an aggregate of 1,031,700 shares of our common stock under our 2009 Stock Option Plan. 49,990 of these options were forfeited subsequent to grant. These grants were exempt from the registration requirements of the Securities Act pursuant to Rule 701 promulgated thereunder inasmuch as they were offered and sold under written compensatory benefit plans and otherwise in compliance with the provisions of Rule 701.
The information presented in the preceding paragraphs does not give effect to the reorganization transactions described in the prospectus.
Item 16. Exhibits and Financial Statements Schedules.
(a) Exhibits: The list of exhibits is set forth under "Exhibit Index" at the end of this registration statement and is incorporated herein by reference.
(b) Financial Statement Schedules: None.
The undersigned Registrant hereby undertakes to provide to the underwriters at the closing specified in the Underwriting Agreement certificates in such denominations and registered in such names as required by the underwriters to permit prompt delivery to each purchaser.
Insofar as indemnification for liabilities arising under the Securities Act of 1933 may be permitted to directors, officers and controlling persons of the Registrant pursuant to the foregoing provisions, or otherwise, the Registrant has been advised that, in the opinion of the SEC such indemnification is against public policy as expressed in the Securities Act and is, therefore, unenforceable. In the event that a claim for indemnification against such liabilities (other than the payment by the Registrant of expenses incurred or paid by a director, officer or controlling person of the Registrant in the successful defense of any action, suit or proceeding) is asserted by such director, officer or controlling person in connection with the securities being registered, the Registrant will, unless in the opinion of its counsel the matter has been settled by controlling precedent, submit to a court of appropriate jurisdiction the question whether such indemnification by it is against public policy as expressed in the Securities Act and will be governed by the final adjudication of such issue.
The Registrant hereby undertakes that:
(1) For purposes of determining any liability under the Securities Act of 1933, the information omitted from the form of prospectus filed as part of this Registration Statement in reliance upon Rule 430A and contained in a form of prospectus filed by the Registrant pursuant to Rule 424(b)(1) or (4) or 497(h) under the Securities Act shall be deemed to be part of this Registration Statement as of the time it was declared effective.
(2) For purposes of determining any liability under the Securities Act of 1933, each post-effective amendment that contains a form of prospectus shall be deemed to be a new registration statement relating to the securities offered therein, and the offering of such securities at that time shall be deemed to be the initial bona fide offering thereof.
II-3
Pursuant to the requirements of the Securities Act of 1933, the registrant has duly caused this amendment to the registration statement to be signed on its behalf by the undersigned, thereunto duly authorized in the City of Miami Lakes, State of Florida, on January 10,24, 2011.
BANKUNITED, INC. | ||||
By: | /s/ JOHN A. KANAS | |||
Name: John A. Kanas Title: Chairman, President and Chief Executive Officer | ||||
Pursuant to the requirements of the Securities Act of 1933, this amendment to the registration statement has been signed by the following persons in the capacities and on the dates indicated.
Signature | Title | Date | ||||
|---|---|---|---|---|---|---|
| /s/ JOHN A. KANAS John A. Kanas | Chairman, President and Chief Executive Officer (Principal Executive Officer) | January | ||||
/s/ DOUGLAS J. PAULS Douglas J. Pauls | Chief Financial Officer (Principal Financial and Accounting Officer) | January | ||||
* John Bohlsen | Vice Chairman, Chief Lending Officer and Director | January | ||||
* Chinh E. Chu | Director | January | ||||
* Ambassador Sue M. Cobb | Director | January | ||||
* Eugene F. DeMark | Director | January | ||||
* Richard S. LeFrak | Director | January | ||||
II-4
Signature | Title | Date | ||||
|---|---|---|---|---|---|---|
| * Wilbur L. Ross, Jr. | Director | January | ||||
* Pierre Olivier Sarkozy | Director | January | ||||
* Lance N. West | Director | January | ||||
*By: | /s/ JOHN A. KANAS Attorney-in-Fact | |||||
II-5
| Exhibit Number | Description | ||
|---|---|---|---|
| 1.1 | Form of Underwriting | ||
2.1a | Purchase and Assumption Agreement, dated as of May 21, 2009, among the Federal Deposit Insurance Corporation, Receiver of BankUnited, FSB, Coral Cables, Florida, the Federal Deposit Insurance Corporation and BankUnited (Single Family Shared-Loss Agreement and Commercial and Other Shared-Loss Agreement included as Exhibits 4.15A and 4.15B thereto, respectively)**† | ||
2.1b | Addendum to Purchase and Assumption Agreement, dated as of May 21, 2009, by and among the Federal Deposit Insurance Corporation, Receiver of BankUnited, FSB, Coral Gables, Florida, BankUnited, and the Federal Deposit Insurance | ||
2.1c | Amendment No. 1 to the BankUnited Single Family Shared-Loss Agreement with the FDIC, dated as of November 2, | ||
2.1d | Amendment No. 2 the BankUnited Single Family Shared-Loss Agreement with the FDIC, dated as of December 22, | ||
3.1 | Form of Amended and Restated Certificate of Incorporation** | ||
3.2 | Form of Amended and Restated By-Laws** | ||
4.1 | Specimen common stock certificate** | ||
5.1 | Opinion of Skadden, Arps, Slate, Meagher & Flom | ||
Amended and Restated Limited Liability Company Agreement of BU Financial Holdings LLC, dated as of May 21, 2009, by and among John A. Kanas, Rajinder P. Singh, John N. DiGiacomo, John Bohlsen and the other parties listed on Schedule A thereto (Schedule A as of | |||
10.1b | Joinders to the Amended and Restated Limited Liability Company Agreement | ||
10.2a | Employment Agreement, dated August 18, 2010, among BU Financial Holdings LLC, BankUnited, Inc. (formerly known as BU Financial Corporation) and John A. Kanas** | ||
10.2b | Amended and Restated Employment Agreement, dated August 18, 2010, between BankUnited, a federally chartered thrift institution and John A. Kanas** | ||
10.3a | Employment Agreement, dated August 18, 2010, among BU Financial Holdings LLC, BankUnited, Inc. (formerly known as BU Financial Corporation) and John Bohlsen** | ||
10.3b | Amended and Restated Employment Agreement, dated August 18, 2010, between BankUnited, a federally chartered thrift institution and John Bohlsen** | ||
10.4a | Employment Agreement, dated August 18, 2010, among BU Financial Holdings LLC, BankUnited, Inc. (formerly known as BU Financial Corporation) and Douglas J. Pauls** | ||
10.4b | Amended and Restated Employment Agreement, dated August 18, 2010, between BankUnited, a federally chartered thrift institution and Douglas J. Pauls** | ||
10.5a | Employment Agreement, dated August 18, 2010, among BU Financial Holdings LLC, BankUnited, Inc. (formerly known as BU Financial Corporation) and Rajinder P. Singh** | ||
10.5b | Amended and Restated Employment Agreement, dated August 18, 2010, between BankUnited, a federally chartered thrift institution and Rajinder P. Singh** | ||
10.6 | BankUnited Nonqualified Deferred Compensation Plan** | ||
10.7 | BankUnited, Inc. (formerly known as BU Financial Corporation) 2009 Stock Option Plan** | ||
| Exhibit Number | Description | ||
|---|---|---|---|
| BankUnited, Inc. 2010 Omnibus Equity Incentive Plan** | |||
10.9 | Form of Registration Rights Agreement by and among BankUnited, Inc., John A. Kanas, Rajinder P. Singh, Douglas J. Pauls and John Bohlsen, and each of the other parties | ||
10.10 | Form of Director Nomination Agreement by and among BankUnited, Inc., John A. Kanas and the other parties thereto** | ||
10.11 | Transaction Fee Agreement, dated May 21, 2009, among BU Financial Holdings LLC, Blackstone Management Partners L.L.C., Carlyle Investment Management L.L.C., Centerbridge Advisors, LLC and WL Ross & Co. LLC** | ||
10.12 | BU Financial Holdings LLC Warrant to the Federal Deposit Insurance Corporation dated May 21, 2009** | ||
10.13 | Form of indemnification agreement between BankUnited, Inc. and each of its directors and executive officers** | ||
10.14 | |||
21.1 | Subsidiaries of BankUnited, Inc.** | ||
23.1 | Consent of KPMG LLP | ||
23.2 | Consent of PricewaterhouseCoopers LLP | ||
23.3 | Consent of Skadden, Arps, Slate, Meagher & Flom LLP (included in Exhibit 5.1) | ||
24.1 | Power of Attorney** | ||