

Use these links to rapidly review the document
TABLE OF CONTENTS
INDEX TO CONSOLIDATED FINANCIAL STATEMENTS
As filed with the Securities and Exchange Commission on January 29,April 4, 2016
Registration No. 333-208565
UNITED STATES
SECURITIES AND EXCHANGE COMMISSION
Washington, D.C. 20549
Amendment No. 13
to
FORM S-1
REGISTRATION STATEMENT
UNDER
THE SECURITIES ACT OF 1933
BATS GLOBAL MARKETS, INC.
(Exact Name of Registrant as Specified in Its Charter)
| DELAWARE (State or Other Jurisdiction of Incorporation or Organization) | 6200 (Primary Standard Industrial Classification Code Number) | 46-3583191 (I.R.S. Employer Identification Number) |
8050 Marshall Drive, Suite 120
Lenexa, Kansas 66214
(913) 815-7000
(Address, Including Zip Code, and Telephone Number, Including Area Code, of Registrant's Principal Executive Offices)
Eric Swanson, Esq.
Executive Vice President, General
Counsel and SecretaryBATSBats Global Markets, Inc.
8050 Marshall Drive, Suite 120
Lenexa, Kansas 66214
(913) 815-7000
(Name, Address, Including Zip Code, and Telephone Number, Including Area Code, of Agent for Service)
| Copies to: | ||
Deanna L. Kirkpatrick, Esq. Davis Polk & Wardwell LLP 450 Lexington Avenue New York, New York 10017 (212) 450-4000 | Gregory A. Fernicola, Esq. Phyllis G. Korff, Esq. Skadden, Arps, Slate, Meagher & Flom LLP Four Times Square New York, New York 10036 (212) 735-3000 | |
Approximate date of commencement of proposed sale to the public:As soon as practicable after the effective date of this Registration Statement.
If any of the securities being registered on this form are to be offered on a delayed or continuous basis pursuant to Rule 415 under the Securities Act of 1933, check the following box. o
If this form is filed to register additional securities for an offering pursuant to Rule 462(b) under the Securities Act, check the following box and list the Securities Act registration statement number of the earlier effective registration statement for the same offering. o
If this form is a post-effective amendment filed pursuant to Rule 462(c) under the Securities Act, check the following box and list the Securities Act registration statement number of the earlier effective registration statement for the same offering. o
If this form is a post-effective amendment filed pursuant to Rule 462(d) under the Securities Act, check the following box and list the Securities Act registration statement number of the earlier effective registration statement for the same offering. o
Indicate by check mark whether the registrant is a large accelerated filer, an accelerated filer, a non-accelerated filer, or a smaller reporting company. See the definitions of "large accelerated filer," "accelerated filer" and "smaller reporting company" in Rule 12b-2 of the Exchange Act.
| Large accelerated filer o | Accelerated filer o | Non-accelerated filer ý (Do not check if a smaller reporting company) | Smaller reporting company o |
| Title of Each Class of Securities to Be Registered | Proposed Maximum Aggregate Offering Price(1)(2) | Amount of Registration Fee(3) | Amount To Be Registered(1) | Proposed Maximum Aggregate Offering Price Per Share | Proposed Maximum Aggregate Offering Price(2) | Amount of Registration Fee(3) | ||||||
|---|---|---|---|---|---|---|---|---|---|---|---|---|
Common Stock, par value $0.01 per share | $100,000,000 | $10,070 | 12,880,000 | $19.00 | $244,720,000 | $24,644 | ||||||
|
|
| ||||||||||
The Registrant hereby amends this Registration Statement on such date or dates as may be necessary to delay its effective date until the Registrant shall file a further amendment which specifically states that this Registration Statement shall thereafter become effective in accordance with Section 8(a) of the Securities Act of 1933 or until the Registration Statement shall become effective on such date as the Commission, acting pursuant to said Section 8(a), may determine.
The information in this prospectus is not complete and may be changed. We may not sell these securities until the registration statement filed with the Securities and Exchange Commission is effective. This prospectus is not an offer to sell these securities and is not soliciting an offer to buy these securities in any state where the offer or sale is not permitted.
PRELIMINARY PROSPECTUS (Subject to Completion)
Issued January 29,April 4, 2016
11,200,000 Shares
BATSBats Global Markets, Inc.
COMMON STOCK
BATSThe selling stockholders of Bats Global Markets, Inc. is offering shares of common stock, and the selling stockholders identified in this prospectus are offering 11,200,000 shares of common stock. We will not receive any proceeds from the sale of common stock by the selling stockholders in this offering. This is the initial public offering of our shares, and no public market exists for our shares. We anticipate that the initial public offering price will be between $$17.00 and $$19.00 per share.
Upon completion of this offering, our principal investors will collectively own approximately %82.1% of the total voting power of our capital stock. See "Principal and Selling Stockholders."
We intendhave applied to list the common stock on BATSBats BZX Exchange, Inc. (BZX) under the symbol "BATS."
Investing in our common stock involves risks. See "Risk Factors" beginning on page 17.19.
PRICE $ A SHARE
| | Per Share | Total | ||
|---|---|---|---|---|
Price to public | $ | $ | ||
Underwriting discounts and commissions(1) | $ | $ | ||
Proceeds to | ||||
| $ | $ | ||
| ||||
WeCertain of our selling stockholders named herein have granted the underwriters the option to purchase an additional 1,680,000 shares of common stock. The underwriters may exercise this option at any time within 30 days from the date of this prospectus.
The Securities and Exchange Commission and state securities regulators have not approved or disapproved these securities or determined if this prospectus is truthful or complete. Any representation to the contrary is a criminal offense.
The underwriters expect to deliver the shares of common stock to purchasers on , 2016.
| Morgan Stanley | Citigroup |
BofA Merrill Lynch Credit Suisse Goldman, Sachs & Co. J.P. Morgan
Jefferies Barclays Deutsche Bank Securities Nomura Rosenblatt Securities Sandler O'Neill + Partners, L.P.
, 2016

| | Page | |||
|---|---|---|---|---|
Prospectus Summary | 1 | |||
The Offering | ||||
Summary Historical and Pro Forma Financial and Operating Data | ||||
Risk Factors | ||||
Special Note Regarding Forward-Looking Statements | ||||
Recent Acquisitions | ||||
Unaudited Selected Pro Forma Financial Data | ||||
Use of Proceeds | ||||
Dividend Policy | ||||
Capitalization | ||||
Dilution | ||||
Selected Financial and Operating Data | ||||
Management's Discussion and Analysis of Financial Condition and Results of Operations | ||||
Business | ||||
Regulation | ||||
Management | ||||
Executive Compensation | ||||
Certain Relationships and Related Transactions | ||||
Principal and Selling Stockholders | ||||
Description of Capital Stock | ||||
Material U.S. Federal Tax Considerations for Non-U.S. Holders | ||||
Shares Eligible for Future Sale | ||||
Underwriters (Conflicts of Interest) | ||||
Validity of Common Stock | ||||
Experts | ||||
Where You Can Find More Information | ||||
| ||||
Index to Consolidated Financial Statements | F-1 | |||
We, the selling stockholders and the underwriters have not authorized anyone to provide you with any information other than that contained in this prospectus or in any free writing prospectus prepared by or on behalf of us or to which we have referred you. We, the selling stockholders and the underwriters take no responsibility for, and can provide no assurance as to the reliability of, any other information that others may give you. We, the selling stockholders and the underwriters are offering to sell, and seeking offers to buy, shares of our common stock only in jurisdictions where offers and sales are permitted. The information contained in this prospectus is accurate only as of the date of this prospectus, or other earlier date stated in this prospectus, regardless of the time of delivery of this prospectus or of any sale of our common stock.
i
This summary highlights information contained elsewhere in this prospectus. This summary may not contain all of the information that you should consider before deciding to invest in our common stock. You should read this entire prospectus carefully, including the "Risk Factors" section and the financial statements and the notes to those statements included in this prospectus.
In this prospectus, unless the context otherwise requires, "BATS,"Bats," the "company," "we," "us" and "our" refer to BATSBats Global Markets, Inc. (or prior to the acquisition of Direct Edge Holdings LLC, or Direct Edge, in January 2014, BATSBats Global Markets Holdings, Inc.) and its consolidated subsidiaries: BZX, BYX, EDGX and EDGA (each, a national securities exchange), BATSBats Trading, Inc. (a U.S. broker-dealer), BATSBats Trading Limited (a U.K. operator of our multilateral trading facility and our Regulated Market, under its Recognised Investment Exchange status, and known as "BATS Chi-X"Bats Europe"), Chi-X Europe Limited (a stand-alone U.K. broker-dealer) and BATSBats Hotspot (operator of our institutional spot foreign currency, or FX, market). We have defined certain industry-related and other terms in a glossary appended to this prospectus. Please see the glossary for our definition of "market share" and other terms.
Our Company
We are a leading global operator of securities exchanges and other electronic markets enabled by world-class technology. We provide trade execution, market data, trade reporting, connectivity and risk management solutions to brokers, market makers, asset managers and other market participants, ultimately benefiting retail and institutional investors across multiple asset classes. Our principal objective is to improve markets by maximizing efficiency and mitigating trade execution risk for market participants. Our asset class focus currently comprises listed cash equity securities in the United States and Europe, listed equity options in the United States and institutional spot FX globally, as well as exchange-traded products, or ETPs, including exchange-traded funds, or ETFs, in the United States and Europe. Trade execution comprised 44.7%44.6% of our revenues less cost of revenues, and market data and connectivity, or non-transaction revenues, comprised 55.3%55.4% of our revenues less cost of revenues for the nine monthsyear ended September 30,December 31, 2015.
We are the second largest exchange operator in U.S. listed cash equity securities trading by market share, the largest exchange operator of ETFs and other ETPs by market share, and the largest European exchange operator as measured by notional value traded.traded as of December 31, 2015. In addition, for each of the six consecutive months ended December 31, 2015, excluding the Chinese exchanges, we were the largest equities market operator globally as measured by notional value traded. Moreover, during 2015 we operated the fastest growing market in the United States for exchange traded options as measured by market share.
We improve markets by maximizing efficiency and mitigating trade execution risk, in part by offering low-cost, innovativemarket-leading pricing and low-latency trade execution enabled by resilient and robust proprietary technology. For example, during the three monthsyear ended September 30,December 31, 2015, our net capture, including auctions, in the U.S. equities market was approximately 40%42% of the rate reported by NASDAQ Group's U.S. equities operations and Intercontinental Exchange's New York Stock Exchange, or NYSE, operations, while our net capture, including auctions, in the European listed equity securities market was approximately 54%94% of the rate reported by the London Stock Exchange's European equities operations. During the third quarter ofyear ended December 31, 2015, our net capture in the U.S. listed equity options market was 6%8% to 20%19% of the rate reported by the Chicago Board Options Exchange, or CBOE, NYSE Arca, NYSE MKT, NASDAQ Options Market and NASDAQ PHLX. We offer the same low-cost, market-leading pricing for our market data products. During the year ended December 31, 2015, our pricing for market data for the U.S. equities market was a combined $12,500 per month for data from BZX, BYX, EDGX and EDGA. This is approximately 8% of the prices reported by NYSE and NASDAQ operations to receive data for all of their respective markets during the same period.
Our market data pricing in Europe was €59.50 per month for pan-European data during the year ended December 31, 2015. This is approximately 11% of the cost of receiving data from the other exchanges across Europe during the same period. Participants can also purchase our FX market data for $5,000 per month. This is approximately 8% of the price currently charged by EBS Market.
We develop, own and operate the BATSBats trading platforms, which deploy our proprietary technology designed to offer some of the fastest and most reliable trading systems available. Our diverse exchange platforms are designed to facilitate price discovery by encouraging the quoting of competitive displayed, or lit, prices, but also offer opportunities to post undisplayed, or dark, trading
interest on our U.S. and European order books. The core offerings and products driving our volume and leading market positions include:
For the nine monthsyear ended September 30,December 31, 2015, we had a 21.1% share of the overall U.S. equity market, a 22.4% share of the trading of ETPs and a 9.9%9.6% share of the U.S. equity options market. In Europe, for the nine monthsyear ended September 30,December 31, 2015, we had a 24.2%24.4% share of European trading in the securities available for trading on BATS Chi-XBats Europe. In addition, we had $27.8$25.8 billion average daily notional value, or ADNV, in our Global FX segment from the BATSBats Hotspot Acquisition on March 13, 2015 to September 30,December 31, 2015. Globally, for the nine monthsyear ended September 30,December 31, 2015, we had an 11.5%11.1% share of the publicly reported institutional spot FX market.
For the two months ended February 29, 2016, we had a 21.4% share of the overall U.S. equity market, a 24.5% share of the trading of ETPs and a 10.2% share of the U.S. equity options market. For ETPs, during the two months ended December 31, 2015, we had 19 new listings, or 27.9% of all newly listed ETPs in the United States. During the two months ended February 29, 2016, we had 13 new listings, or 50.0% of all newly listed ETPs in the United States. We also had 69 total listings as of February 29, 2016, or 3.7% of all listings in the United States. In Europe, for the two months ended February 29, 2016, we had a 24.3% share of European trading in the securities available for trading on Bats Europe. In addition, for the two months ended February 29, 2016, we had $31.7 billion ADNV in our Global FX segment and 12.0% of the publicly reported institutional spot FX market.
Our revenue consists primarily of transaction fees, regulatory fees, market data fees and port fees. On a consolidated basis, our revenues less cost of revenues were $285.8$384.4 million for the nine monthsyear ended September 30,December 31, 2015, which represents a 27.7%25.0% increase from the $223.8$307.5 million generated for the nine monthsyear ended September 30,December 31, 2014. Non-transaction revenues were 55.3%55.4% of revenues less cost of revenues for the nine months ended September 30, 2015. On a consolidated basis, we generated $307.5 million in revenues less cost of revenues for the year ended December 31, 2014.2015. Adjusting for growth through acquisitions, our organic compound annual growth rate of revenues less cost of revenue for the last four years was 12.8%12.4%. For the nine months year
ended September 30,December 31, 2015, our Normalized EBITDA margin was 60.4%61.2%, an increase from 54.1%compared to 54.7% for the nine monthsyear ended September 30,December 31, 2014. We use the non-GAAP measure of Normalized EBITDA margin to measure our performance. Normalized EBITDA margin is a non-GAAP measure that is reconciled to net income in the section titled "—Summary Historical and Pro Forma Financial and Operating Data."
Our History
We were formed in 2005 as an alternative to the NYSE and the NASDAQ Stock Market, or NASDAQ, in response to increased consolidation among U.S. listed cash equity market centers. Since our founding, we have achieved the following milestones:
Industry Developments
Significant regulatory and technological developments have transformed the markets in which we operate and have been the primary drivers of our growth and development:
for trading listed cash equity securities. MiFID was designed to increase competition in pan-European trading and authorized the creation of MTFs. In particular, to create competition among markets, MiFID abolished the "concentration rule," which required firms to route orders only to national stock exchanges, and extended the concept of "passporting," which allowed firms authorized to carry on business in one European Economic Area, or EEA, member state to carry on business in other EEA member states.
costs and greater liquidity. We believe these trends will persist, generating significant growth opportunities for our product offerings.
Our Competitive Strengths
As a result of these industry developments, newer trading centers like ours are better able to compete against competing exchanges based on technology, price and customer experience. We believe that the following competitive strengths position us well to capitalize on these industry dynamics:
trading in the securities available for trading on BATS Chi-XBats Europe for the nine monthsyear ended September 30,December 31, 2015. In addition, we have a substantial presence in the FX markets with our recent BATSBats Hotspot Acquisition, with an 11.5%a 11.1% market share of the publicly reported institutional spot FX market for the nine monthsyear ended September 30,December 31, 2015. The combination of our attractive market positions, the quality of our markets and the expertise of our teams have enabled us to grow our market share across our markets over the last four years.
execution of transformational acquisitions. We do so by leveraging our vast industry expertise and through a continuous dialogue with regulators and key market participants. For example:
relationships with our principal investors and their affiliates, we benefit from access to the strategic insights and industry expertise of some of the most active market participants. For example, we offer several products that enable our customers to monitor their order handling on our markets in real-time, such as our user dashboard and latency reports, both of which are web-based tools designed to provide customers with real-time information about their connectivity to our platform and the speed at which their orders are processed and executed within our markets. We also operate one of the few market centers in Europe that offers routing services to other venues that publicly display quotes, or lit venues, which we believe provides an added incentive to use our market. Additionally, EDGX has typically been the preferred exchange destination for retail limit orders as we provide a service model for the retail trading community's unique needs, competitive rates and a general advocacy and support for retail investors.
Our Growth Strategies
We believe that we are well positioned to leverage our competitive strengths to enhance our market position, develop new products and services and continue expanding into new asset classes and geographies. We continually analyze new opportunities and, in particular, intend to pursue the following growth strategies:
functionality on the platform to specifically target more marketable flow from retail customers, more auction flow and growing complex order flow from institutional investors. In addition, we are continuing to explore the development of index and other higher-margin proprietary options products to trade on our exchanges.
Recent Developments
In March 2016, we agreed to acquire ETF.com, a leading provider of ETF data, news and analysis, which had approximately $3.0 million in annual revenue for 2015. The transaction closed on April 1, 2016.
In March 2016, together with T3Index, a research-driven financial indexing firm, we launched the Bats-T3P SPY Volatility Index, or SPYIX, an index measuring expected 30-day volatility in the most actively traded security worldwide, the SPDR S&P 500 ETF, or SPY. The SPYIX is calculated using prices from highly-active, electronically-traded multiple-listed SPY options, which we believe to be an improvement over the slower, manually-traded, floor-based S&P 500 index options used to calculate other volatility benchmarks. SPYIX also includes important features designed to enhance critical stability during periods of low liquidity in the market, namely its proprietary "price-dragging" technique which helps reduce erratic movements in the index.
In February 2016, we unveiled an updated corporate brand, including a new logo and naming conventions, all developed in-house by Bats associates. We expect the project will cost approximately $350,000 to fully implement. It is anticipated that the rebrand will be completed on or around April 30, 2016.
In November 2015, we launched our second options exchange, EDGX Options, with a customer priority, "pro rata" market model as a complement to our existing BZX Options exchange featuring a
price/time-priority price-time-priority model. See "Management's Discussion and Analysis of Financial Condition and Results of Operation—Our Model" for further information on our pricing models.
In October 2015, we launched in the United States "The BATSBats ETF Marketplace," a market specifically structured and designed for ETF issuers and their investors, introducing the BATSBats ETP Issuer Incentive Program and the BATSBats Lead Market Maker, or LMM, Program. The BATSBats ETP Issuer Incentive Program is an innovative program that rewards issuers as their ETP listings grow on BZX. Traditionally, ETP issuers have paid an annual exchange fee to the listing venue that increases as the product becomes more successful. The BATSBats ETP Issuer Incentive Program rewards ETP issuers for their product's success with a rebate based on the product's consolidated average daily volume, or CADV. The BATSBats LMM Program is a rewards-based program that incentivizes market makers for their participation in BZX-listed ETPs. First, LMMs receive larger incentives for providing liquidity and reduced costs for removing liquidity in their assigned ETPs. Second, LMMs receive additional economic incentives for making markets in additional ETP products listed on BATS.Bats. The BATSBats LMM Program is supplemented by BATS'Bats' Competitive Liquidity Provider, or CLP, program, which is also a rewards-based program designed to incent market makers to make tighter quote spreads with increased liquidity for BZX-listed ETPs.
Reclassification and Stock Split
In conjunction withImmediately prior to the completion of this offering, we intend to reclassify each share of our existing capital stock designated as Class A non-voting common stock as one share of common stock. We also intend to reclassify each share of our existing capital stock designated as Class B non-voting common stock as one share of non-voting common stock. In addition, immediately following the stock reclassification described above and prior to the completion of this offering, we intend to declare a -for-1-for-2.91 stock split of all outstanding common stock and non-voting common stock. See "Description of Capital Stock."
Risk Factors
Investing in our common stock involves substantial risk. Please read "Risk Factors" beginning on page 1719 for a discussion of certain factors you should consider in evaluating an investment in our common stock. Some of these risks include:
extent that they vote similarly, will be able, by virtue of their ability to elect our board of
directors, to control our policies and operations and may have interests that differ from those of other stockholders; and
Principal Investors
Immediately prior to this offering, thirteen affiliates of our customers, as well as International Securities Exchange Holdings, Inc. (owned by Deutsche Börse), or ISE, and BGM Holding, L.P., and its affiliates, collectively owned 77,904,035 shares of our common stock and 12,152,158 shares of non-voting common stock, representing approximately %93.3% of the total voting power of our capital stock. We refer to these investors as our "principal investors." Upon completion of this offering, our principal investors will collectively own approximately 72,000,805 shares of our common stock and 7,980,017 shares of non-voting common stock, representing approximately %82.1% of the total voting power of our capital stock. See "Principal and Selling Stockholders." These principal investors are affiliates of Bank of America Merrill Lynch, Citadel, Citigroup, Credit Suisse, Deutsche Bank Securities, Goldman Sachs, Instinet, J.P. Morgan, KCG, Lime, Morgan Stanley, Tradebot Ventures and WEDBUSH.
Conflicts of Interest
Merrill Lynch, Pierce, Fenner & Smith Incorporated, Citigroup, Goldman, Sachs & Co., Jefferies LLC and Nomura Securities International, Inc., underwriters of this offering, or their affiliates (as defined in FINRA Rule 5121), will each receive more than 5% of net offering proceeds and will have a "conflict of interest" pursuant to the Financial Industry Regulatory Authority, or FINRA, Rule 5121(f)(5)(C)(ii). Accordingly, this offering will be made in compliance with the applicable provisions of FINRA Rule 5121. As such, any underwriter that has a conflict of interest pursuant to FINRA Rule 5121 will not confirm sales to accounts in which it exercises discretionary authority without the prior written consent of the customer. Pursuant to FINRA Rule 5121, a "qualified independent underwriter" (as defined in FINRA Rule 5121) must participate in the preparation of the prospectus and perform its usual standard of due diligence with respect to the prospectus. Sandler O'Neill & Partners, L.P. has agreed to act as qualified independent underwriter for the offering and to perform a due diligence investigation and review and participate in the preparation of the prospectus. See "Underwriters (Conflicts of Interest)."
Corporate Information
BATS Global Markets Holdings, Inc. was incorporated in Delaware in August 2013. In connection with the Direct Edge Acquisition, BATS Global Markets Holdings, Inc. changed its name to BATS Global Markets, Inc. and became a single new holding company. Concurrently, Direct Edge and BATS Global Markets, Inc. (which was renamed BATS Global Markets Holdings, Inc.) each became intermediate holding companies held by the new BATS Global Markets, Inc. Direct Edge was dissolved on December 31, 2015. In February 2016, BATS Global Markets, Inc. changed its name to Bats Global Markets, Inc., and BATS Global Markets Holdings, Inc. changed its name to Bats Global Markets Holdings, Inc.
We are headquartered in the Kansas City area with additional offices in New York, London, Chicago and Singapore. Our principal executive offices are located at 8050 Marshall Drive, Suite 120, Lenexa, Kansas 66214, and our telephone number is (913) 815-7000. Our website is www.bats.com. Information contained on or accessible from our website is not incorporated by reference into this prospectus.
Common stock | ||
|
| |
| 11,200,000 shares | |
|
| |
Capital stock |
| |
Common stock | 87,699,410 shares | |
Non-voting common stock(1) | 7,980,017 shares | |
Total | 95,679,427 shares | |
Option to purchase additional common stock |
| |
Voting rights: |
| |
Common stock | One vote per share | |
Non-voting common stock | Only as required by applicable law | |
Use of proceeds | We | |
| ||
|
Dividend policy | The board of directors is expected to adopt a policy with respect to the payment of dividends on our capital stock following this offering. We currently expect that we will pay quarterly cash dividends following the offering, with the annual amount initially determined based on a payout ratio of earnings within a | |
BZX symbol | BATS |
Conflicts of interest | Merrill Lynch, Pierce, Fenner & Smith Incorporated, Citigroup, Goldman, Sachs & Co., Jefferies LLC and Nomura Securities International, Inc., underwriters of this offering, or their affiliates (as defined in FINRA Rule 5121), will each receive more than 5% of net offering proceeds and will have a "conflict of interest" pursuant to FINRA Rule 5121(f)(5)(C)(ii). Accordingly, this offering will be made in compliance with the applicable provisions of FINRA Rule 5121. As such, any underwriter that has a conflict of interest pursuant to FINRA Rule 5121 will not confirm sales to accounts in which it exercises discretionary authority without the prior written consent of the customer. Pursuant to FINRA Rule 5121, a "qualified independent underwriter" (as defined in FINRA Rule 5121) must participate in the preparation of the prospectus and perform its usual standard of due diligence with respect to the prospectus. Sandler O'Neill & Partners, L.P. has agreed to act as qualified independent underwriter for the offering and to perform a due diligence investigation and review and participate in the preparation of the prospectus. See "Underwriters (Conflicts of Interest)." |
Unless the context requires otherwise, all references to the number of shares of our common stock and non-voting common stock to be outstanding after this offering are based on the number of shares outstanding as of December 31, 2015 and give effect to our reclassification and stock split to be consummated in conjunction withimmediately prior to the completion of this offering, as described under "—Reclassification and Stock Split," and 275,586887,778 shares of unvested restricted stock as of September 30,December 31, 2015, but exclude:
Unless otherwise indicated, all information in this prospectus assumes that the underwriters do not exercise their option to purchase up to 1,680,000 additional shares of common stock from us.certain of the selling stockholders named herein.
SUMMARY HISTORICAL AND PRO FORMA FINANCIAL AND OPERATING DATA
The following summary historical and pro forma financial and operating data should be read in conjunction with "Management's Discussion and Analysis of Financial Condition and Results of Operations," the unaudited pro forma financial statements and the accompanying notes, and the consolidated financial statements and the accompanying notes, in each case included elsewhere in this prospectus. We have derived the summary consolidated statements of operations data for the nine monthsyears ended September 30,December 31, 2015, and 2014 and 2013 and the statementstatements of financial condition data as of September 30,December 31, 2015 and 2014 from our unauditedaudited consolidated financial statements and related notes included elsewhere in this prospectus. We have derived the summary consolidated statements of operations data for the years ended December 31, 2014, 2013 and 2012 and the statement of financial condition data as of December 31, 2014 and 2013 from our audited consolidated financial statements and related notes which are not included elsewhere in this prospectus.
We have derived the summary unaudited pro forma consolidated statements of operations data for the nine months ended September 30, 2015 and for the year ended December 31, 20142015 from the unaudited consolidated pro forma condensed combined financial statements and related notes included in this prospectus. The unaudited pro forma condensed combined statement of operations is intended to provide information about how the Direct Edge and BATSBats Hotspot acquisitionsAcquisition might have affected our historical statement of operations if theyit had been consummated as of January 1, 2014.2015. The following unaudited pro forma condensed combined statement of operations is provided for informational purposes only and does not necessarily reflect the results of operations that would have actually resulted had the Direct Edge Acquisition and BATSBats Hotspot Acquisition occurred as of January 1, 2014,2015, nor should it be taken as necessarily indicative of our future results of operations.
| | Nine Months Ended September 30, | Year Ended December 31, | Year Ended December 31, | ||||||||||||||||||||||||||||||||
|---|---|---|---|---|---|---|---|---|---|---|---|---|---|---|---|---|---|---|---|---|---|---|---|---|---|---|---|---|---|---|---|---|---|---|---|
| | Pro Forma 2015(2) | 2015 | 2014 | Pro Forma 2014(2) | 2014 | 2013 | 2012 | Pro Forma 2015(1) | 2015 | 2014 | 2013 | ||||||||||||||||||||||||
| | (in millions, except per share data) | (in millions, except share and per share data) | |||||||||||||||||||||||||||||||||
Consolidated Statements of Operations Data: | |||||||||||||||||||||||||||||||||||
Revenues: | |||||||||||||||||||||||||||||||||||
Transaction fees | $ | 979.1 | $ | 970.1 | $ | 707.7 | $ | 1,095.3 | $ | 1,009.9 | $ | 612.8 | $ | 645.3 | $ | 1,299.2 | $ | 1,290.2 | $ | 1,009.9 | $ | 612.8 | |||||||||||||
Regulatory transaction fees | 207.0 | 207.0 | 186.5 | 282.0 | 272.0 | 127.4 | 148.1 | 275.7 | 275.7 | 272.0 | 127.4 | ||||||||||||||||||||||||
Market data fees | 99.4 | 99.4 | 81.2 | 114.3 | 110.3 | 59.4 | 60.3 | 131.0 | 131.0 | 110.3 | 59.4 | ||||||||||||||||||||||||
Port fees and other | 58.8 | 58.7 | 49.0 | 68.7 | 66.0 | 41.9 | 31.0 | 81.9 | 81.8 | 66.0 | 41.9 | ||||||||||||||||||||||||
| | | | | | | | | | | | | | | | | | | | | | | | | | | | | | | | | | | | |
Total revenues | 1,344.3 | 1,335.2 | 1,024.4 | 1,560.3 | 1,458.2 | 841.5 | 884.7 | 1,787.8 | 1,778.7 | 1,458.2 | 841.5 | ||||||||||||||||||||||||
Cost of revenues: | |||||||||||||||||||||||||||||||||||
Liquidity payments | 805.7 | 805.7 | 578.5 | 858.4 | 831.4 | 474.7 | 508.2 | 1,070.7 | 1,070.7 | 831.4 | 474.7 | ||||||||||||||||||||||||
Section 31 fees | 207.0 | 207.0 | 186.5 | 282.0 | 272.0 | 127.4 | 148.1 | 275.7 | 275.7 | 272.0 | 127.4 | ||||||||||||||||||||||||
Routing, clearing and other fees | 36.7 | 36.7 | 35.6 | 55.4 | 47.3 | 42.6 | 51.5 | ||||||||||||||||||||||||||||
Routing and clearing | 47.9 | 47.9 | 47.3 | 42.6 | |||||||||||||||||||||||||||||||
| | | | | | | | | | | | | | | | | | | | | | | | | | | | | | | | | | | | |
Total cost of revenues | 1,049.4 | 1,049.4 | 800.6 | 1,195.8 | 1,150.7 | 644.7 | 707.8 | 1,394.3 | 1,394.3 | 1,150.7 | 644.7 | ||||||||||||||||||||||||
| | | | | | | | | | | | | | | | | | | | | | | | | | | | | | | | | | | | |
Revenues less cost of revenues | 294.9 | 285.8 | 223.8 | 364.5 | 307.5 | 196.8 | 176.9 | 393.5 | 384.4 | 307.5 | 196.8 | ||||||||||||||||||||||||
Operating expenses: | |||||||||||||||||||||||||||||||||||
Compensation and benefits | 61.8 | 58.4 | 66.2 | 102.4 | 87.0 | 41.5 | 48.4 | 83.5 | 79.7 | 87.0 | 41.5 | ||||||||||||||||||||||||
Other operating expenses | 101.3 | 92.4 | 73.3 | 135.4 | 100.9 | 53.7 | 69.2 | 123.0 | 122.4 | 100.9 | 53.7 | ||||||||||||||||||||||||
| | | | | | | | | | | | | | | | | | | | | | | | | | | | | | | | | | | | |
Total operating expenses | 163.1 | 150.8 | 139.5 | 237.8 | 187.9 | 95.2 | 117.6 | 206.5 | 202.1 | 187.9 | 95.2 | ||||||||||||||||||||||||
| | | | | | | | | | | | | | | | | | | | | | | | | | | | | | | | | | | | |
| | Nine Months Ended September 30, | Year Ended December 31, | Year Ended December 31, | ||||||||||||||||||||||||||||||||
|---|---|---|---|---|---|---|---|---|---|---|---|---|---|---|---|---|---|---|---|---|---|---|---|---|---|---|---|---|---|---|---|---|---|---|---|
| | Pro Forma 2015(2) | 2015 | 2014 | Pro Forma 2014(2) | 2014 | 2013 | 2012 | Pro Forma 2015(1) | 2015 | 2014 | 2013 | ||||||||||||||||||||||||
| | (in millions, except per share data) | (in millions, except share and per share data) | |||||||||||||||||||||||||||||||||
Operating income | 131.8 | 135.0 | 84.3 | 126.7 | 119.6 | 101.6 | 59.3 | 187.0 | 182.3 | 119.6 | 101.6 | ||||||||||||||||||||||||
Interest and investment expense and other | (34.6 | ) | (31.6 | ) | (32.7 | ) | (46.8 | ) | (39.3 | ) | (26.0 | ) | (1.2 | ) | |||||||||||||||||||||
Interest expense and other | (46.4 | ) | (43.6 | ) | (39.3 | ) | (26.0 | ) | |||||||||||||||||||||||||||
| | | | | | | | | | | | | | | | | | | | | | | | | | | | | | | | | | | | |
Income before income tax provision | 97.2 | 103.4 | 51.6 | 79.9 | 80.3 | 75.6 | 58.1 | 140.6 | 138.7 | 80.3 | 75.6 | ||||||||||||||||||||||||
Income tax provision | 40.2 | 42.9 | 20.7 | 30.9 | 31.1 | 28.8 | 26.5 | 57.3 | 56.5 | 31.1 | 28.8 | ||||||||||||||||||||||||
| | | | | | | | | | | | | | | | | | | | | | | | | | | | | | | | | | | | |
Net income | $ | 57.0 | $ | 60.5 | $ | 30.9 | $ | 49.0 | $ | 49.2 | $ | 46.8 | $ | 31.6 | $ | 83.3 | $ | 82.2 | $ | 49.2 | $ | 46.8 | |||||||||||||
| | | | | | | | | | | | | | | | | | | | | | | | | | | | | | | | | | | | | |
| | | | | | | | | | | | | | | | | | | | | | | | | | | | | | | | | | | | |
Earnings per share: | |||||||||||||||||||||||||||||||||||
Earnings per share(3): | |||||||||||||||||||||||||||||||||||
Basic | $ | 1.75 | $ | 1.86 | $ | 0.98 | $ | 1.51 | $ | 1.56 | $ | 2.07 | $ | 1.40 | $ | 2.53 | $ | 1.56 | $ | 2.07 | |||||||||||||||
Diluted | $ | 1.74 | $ | 1.85 | $ | 0.98 | $ | 1.50 | $ | 1.55 | $ | 2.06 | $ | 1.39 | $ | 2.51 | $ | 1.55 | $ | 2.06 | |||||||||||||||
Pro forma earnings per share(3): | |||||||||||||||||||||||||||||||||||
Pro forma earnings per share(4): | |||||||||||||||||||||||||||||||||||
Basic | * | * | * | * | * | $ | 2.56 | * | * | * | |||||||||||||||||||||||||
Diluted | * | * | * | * | * | $ | 2.55 | * | * | * | |||||||||||||||||||||||||
Weighted average shares outstanding: | |||||||||||||||||||||||||||||||||||
Pro forma as adjusted earnings per share(5): | |||||||||||||||||||||||||||||||||||
Basic | $ | 0.88 | * | * | * | ||||||||||||||||||||||||||||||
Diluted | $ | 0.88 | * | * | * | ||||||||||||||||||||||||||||||
Weighted average shares outstanding(3): | |||||||||||||||||||||||||||||||||||
Basic | 32.5 | 31.6 | 22.6 | ||||||||||||||||||||||||||||||||
Diluted | 32.7 | 31.8 | 22.7 | ||||||||||||||||||||||||||||||||
Pro forma weighted average common shares outstanding(4): | |||||||||||||||||||||||||||||||||||
Basic | 32.5 | * | * | * | |||||||||||||||||||||||||||||||
Diluted | 32.7 | * | * | * | |||||||||||||||||||||||||||||||
Pro forma as adjusted weighted average common shares outstanding(5): | |||||||||||||||||||||||||||||||||||
Basic | 32.5 | 32.5 | 31.4 | 32.5 | 31.6 | 22.6 | 22.5 | 94.6 | * | * | * | ||||||||||||||||||||||||
Diluted | 32.7 | 32.7 | 31.5 | 32.6 | 31.8 | 22.7 | 22.7 | 95.2 | * | * | * | ||||||||||||||||||||||||
Distributions per share | $ | 0.31 | $ | 7.67 | $ | 7.82 | $ | — | $ | 17.62 | $ | — | $ | — | $ | 7.82 | $ | — | |||||||||||||||||
| | | As of December 31, | As of December 31, | |||||||||||||||||
|---|---|---|---|---|---|---|---|---|---|---|---|---|---|---|---|---|---|---|---|---|
| | As of September 30, 2015 | 2015 | 2014 | 2013 | ||||||||||||||||
| | 2014 | 2013 | �� | (in millions) | ||||||||||||||||
| | (in millions) | |||||||||||||||||||
Consolidated Statement of Financial Condition Data: | ||||||||||||||||||||
Consolidated Statements of Financial Condition Data: | ||||||||||||||||||||
Cash and cash equivalents | $ | 77.9 | $ | 122.2 | $ | 87.2 | $ | 75.1 | $ | 122.2 | $ | 87.2 | ||||||||
Financial investments | 0.5 | 68.4 | 25.2 | 47.7 | 68.4 | 25.2 | ||||||||||||||
Goodwill and intangible assets, net | 993.7 | 598.2 | 247.0 | 980.3 | 598.2 | 247.0 | ||||||||||||||
Total assets | 1,288.8 | 1,006.6 | 456.9 | 1,316.9 | 1,006.6 | 456.9 | ||||||||||||||
Total liabilities | 924.8 | 702.4 | 316.9 | 937.0 | 702.4 | 316.9 | ||||||||||||||
Long-term debt | 737.2 | 474.4 | 246.0 | 687.5 | 474.4 | 246.0 | ||||||||||||||
Stockholders' equity | 364.0 | 304.2 | 140.0 | 379.9 | 304.2 | 140.0 | ||||||||||||||
Selected Operating Data
The following table presents selected operating data for our four segments: U.S. Equities, European Equities, U.S. Options and Global FX for the periods presented. The information set forth below is not necessarily indicative of our future operations and should be read in conjunction with "Management's Discussion and Analysis of Financial Condition and Results of Operations."
| | Nine Months Ended September 30, | Year Ended December 31, | Year Ended December 31, | |||||||||||||||||||||||
|---|---|---|---|---|---|---|---|---|---|---|---|---|---|---|---|---|---|---|---|---|---|---|---|---|---|---|
| | 2015 | 2014 | 2014 | 2013 | 2012 | 2015 | 2014 | 2013 | ||||||||||||||||||
| | (in millions except for trading days, percentages and as noted below) | (in millions except for trading days, earnings per share, percentages and as noted below) | ||||||||||||||||||||||||
U.S. Equities: | ||||||||||||||||||||||||||
Market average daily volume (ADV) | 6,864.8 | 6,214.0 | 6,414.2 | 6,187.0 | 6437.2 | |||||||||||||||||||||
Average daily volume (ADV) (in billions of shares): | ||||||||||||||||||||||||||
Matched shares | 1.5 | 1.2 | 0.6 | |||||||||||||||||||||||
Routed shares | 0.1 | 0.1 | 0.1 | |||||||||||||||||||||||
| | | | | | | | | | | | ||||||||||||||||
Total touched shares | 1.6 | 1.3 | 0.7 | |||||||||||||||||||||||
| | | | | | | | | | | | ||||||||||||||||
| | | | | | | | | |||||||||||||||||||
| | | | | | | | | | | | ||||||||||||||||
Market ADV | 6.9 | 6.4 | 6.2 | |||||||||||||||||||||||
| | | | | | | | | | | | ||||||||||||||||
| | | | | | | | | |||||||||||||||||||
| | | | | | | | | | | | ||||||||||||||||
Number of trading days | 188 | 188 | 252 | 252 | 250 | 252 | 252 | 252 | ||||||||||||||||||
Net capture per one hundred touched shares(1) | $ | 0.021 | $ | 0.022 | $ | 0.022 | $ | 0.024 | $ | 0.023 | $ | 0.021 | $ | 0.022 | $ | 0.024 | ||||||||||
Market share(2) | 21.1 | % | 18.9 | % | 19.4 | % | 10.4 | % | 11.9 | % | 21.1 | % | 19.4 | % | 10.4 | % | ||||||||||
European Equities: | ||||||||||||||||||||||||||
Average daily notional value (ADNV) | € | 52,394.2 | € | 38,124.1 | € | 39,659.3 | € | 32,613.6 | € | 30,857.6 | ||||||||||||||||
Average daily notional value (ADNV) (in billions): | ||||||||||||||||||||||||||
Matched and touched | € | 12.4 | € | 8.6 | € | 7.5 | ||||||||||||||||||||
Market ADNV | € | 50.8 | € | 39.7 | € | 32.6 | ||||||||||||||||||||
Number of trading days | 192 | 192 | 256 | 256 | 257 | 257 | 256 | 256 | ||||||||||||||||||
Net capture per matched notional value (in basis points)(1) | 0.132 | 0.164 | 0.162 | 0.167 | 0.113 | 0.133 | 0.162 | 0.167 | ||||||||||||||||||
Market share(2) | 24.2 | % | 21.3 | % | 21.6 | % | 23.1 | % | 24.6 | % | 24.4 | % | 21.6 | % | 23.1 | % | ||||||||||
U.S. Options: | ||||||||||||||||||||||||||
Market average daily value (in thousands of contracts) | 16,271.1 | 16,281.5 | 16,586.3 | 15,934.2 | 15,651.6 | |||||||||||||||||||||
ADV (in millions of contracts): | ||||||||||||||||||||||||||
Matched contracts | 1.5 | 0.8 | 0.6 | |||||||||||||||||||||||
Routed contracts | 0.1 | — | — | |||||||||||||||||||||||
| | | | | | | | | | | | ||||||||||||||||
Total touched contracts | 1.6 | 0.8 | 0.6 | |||||||||||||||||||||||
| | | | | | | | | | | | ||||||||||||||||
| | | | | | | | | |||||||||||||||||||
| | | | | | | | | | | | ||||||||||||||||
Market ADV | 16.1 | 16.6 | 15.9 | |||||||||||||||||||||||
Number of trading days | 188 | 188 | 252 | 252 | 250 | 252 | 252 | 252 | ||||||||||||||||||
Net capture per touched contract(1) | $ | 0.024 | $ | 0.049 | $ | 0.046 | $ | 0.058 | $ | 0.063 | $ | 0.030 | $ | 0.046 | $ | 0.058 | ||||||||||
Market share(2) | 9.9 | % | 4.2 | % | 4.8 | % | 3.7 | % | 3.3 | % | 9.6 | % | 4.8 | % | 3.7 | % | ||||||||||
Global FX: | ||||||||||||||||||||||||||
ADNV (in billions) | $ | 27.8 | * | * | * | * | $ | 25.8 | * | * | ||||||||||||||||
Number of trading days | 194 | * | * | * | * | 209 | * | * | ||||||||||||||||||
Net capture per one million dollars traded(1) | $ | 3.01 | * | * | * | * | $ | 2.95 | * | * | ||||||||||||||||
Other Data: | ||||||||||||||||||||||||||
EBITDA(3) | $ | 166.1 | $ | 92.8 | $ | 136.0 | $ | 116.6 | $ | 75.7 | $ | 226.1 | $ | 136.0 | $ | 116.6 | ||||||||||
EBITDA margin(4) | 58.1 | % | 41.5 | % | 44.2 | % | 59.2 | % | 42.8 | % | 58.8 | % | 44.2 | % | 59.2 | % | ||||||||||
Normalized EBITDA(3) | $ | 172.5 | $ | 121.0 | $ | 168.1 | $ | 124.1 | $ | 101.3 | $ | 235.3 | $ | 168.1 | $ | 124.1 | ||||||||||
Normalized EBITDA margin(5) | 60.4 | % | 54.1 | % | 54.7 | % | 63.1 | % | 57.3 | % | 61.2 | % | 54.7 | % | 63.1 | % | ||||||||||
Pro Forma EBITDA(3) | $ | 173.1 | $ | 119.0 | $ | 183.0 | * | * | $ | 233.1 | * | * | ||||||||||||||
Pro Forma EBITDA margin(6) | 58.7 | % | 44.6 | % | 50.2 | % | * | * | 59.2 | % | * | * | ||||||||||||||
Adjusted earnings(7) | $ | 103.6 | $ | 75.2 | $ | 55.1 | ||||||||||||||||||||
Adjusted earnings margin(8) | 27.0 | % | 24.5 | % | 28.0 | % | ||||||||||||||||||||
Diluted Adjusted earnings per share(9) | $ | 3.17 | $ | 2.37 | $ | 2.42 | ||||||||||||||||||||
Non-transaction revenue as a percentage of revenues less cost of revenues | 55.3 | % | 58.2 | % | 57.3 | % | 51.5 | % | 51.6 | % | 55.4 | % | 57.3 | % | 51.5 | % | ||||||||||
Capital expenditures | $ | 12.3 | $ | 17.6 | $ | 25.2 | $ | 3.6 | $ | 6.9 | $ | 13.9 | $ | 25.2 | $ | 3.6 | ||||||||||
regulatory assessment charged to a member in 2013. Pro Forma EBITDA is defined as EBITDA before costs related to the Direct Edge Acquisition and the BATSBats Hotspot Acquisition, had such acquisitionsacquisition been completed on January 1, 2014.2015. EBITDA, Normalized EBITDA and Pro Forma EBITDA do not represent, and should not be considered as, alternatives to net income or cash flows from operations, each as determined in accordance with generally accepted accounting principles in the United States, or U.S. GAAP. We have presented EBITDA, Normalized EBITDA and Pro Forma EBITDA because we consider them important supplemental measures of our performance and believe that they are frequently used by analysts, investors and other interested parties in the evaluation of companies. In addition, we use Normalized EBITDA as a measure of operating performance for preparation of our forecasts, evaluating our leverage ratio for the debt to earnings covenant included in our outstanding credit facility and calculating employee and executive bonuses. Other companies may calculate EBITDA, Normalized EBITDA and Pro Forma EBITDA differently than we do. EBITDA, Normalized EBITDA and Pro Forma EBITDA have limitations as analytical tools, and you should not consider them in isolation or as substitutes for analysis of our results as reported under U.S. GAAP.
The following is a reconciliation of net income to EBITDA, Normalized EBITDA and Pro Forma EBITDA:
| | Nine Months Ended September 30, | Year Ended December 31, | Year Ended December 31, | |||||||||||||||||||||||
|---|---|---|---|---|---|---|---|---|---|---|---|---|---|---|---|---|---|---|---|---|---|---|---|---|---|---|
| | 2015 | 2014 | 2014 | 2013 | 2012 | 2015 | 2014 | 2013 | ||||||||||||||||||
| | (in millions) | (in millions) | ||||||||||||||||||||||||
Net income | $ | 60.5 | $ | 30.9 | $ | 49.2 | $ | 46.8 | $ | 31.6 | $ | 82.2 | $ | 49.2 | $ | 46.8 | ||||||||||
Interest | 34.2 | 20.3 | 27.3 | 25.8 | 0.6 | 46.6 | 27.3 | 25.8 | ||||||||||||||||||
Income tax provision | 42.9 | 20.7 | 31.1 | 28.8 | 26.5 | 56.5 | 31.1 | 28.8 | ||||||||||||||||||
Depreciation and amortization | 28.5 | 20.9 | 28.4 | 15.2 | 17.0 | 40.8 | 28.4 | 15.2 | ||||||||||||||||||
| | | | | | | | | | | | | | | | | | | | | | | | | | | |
EBITDA | 166.1 | 92.8 | 136.0 | 116.6 | 75.7 | 226.1 | 136.0 | 116.6 | ||||||||||||||||||
Acquisition-related costs | 6.4 | 14.6 | 18.5 | 5.2 | 19.3 | 8.2 | 18.5 | 5.2 | ||||||||||||||||||
IPO costs | 0.5 | — | — | 0.6 | 6.3 | 1.5 | — | 0.6 | ||||||||||||||||||
Loss on extinguishment of debt | — | 13.6 | 13.6 | — | — | — | 13.6 | — | ||||||||||||||||||
Other one-time items | (0.5 | ) | — | — | 1.7 | — | ||||||||||||||||||||
Impairment of intangible assets | — | — | 3.5 | |||||||||||||||||||||||
Debt restructuring | 0.5 | — | — | |||||||||||||||||||||||
Gain on extinguishment of revolving credit facility | (1.0 | ) | — | — | ||||||||||||||||||||||
Regulatory assessment | — | — | (1.8 | ) | ||||||||||||||||||||||
| | | | | | | | | | | | | | | | | | | | | | | | | | | |
Normalized EBITDA | $ | 172.5 | $ | 121.0 | $ | 168.1 | $ | 124.1 | $ | 101.3 | $ | 235.3 | $ | 168.1 | $ | 124.1 | ||||||||||
| | | | | | | | | | | | | | | | | | | | | | | | | | | | |
| | | | | | | | | | | | | | | | | | | | | | | | | | | |
| | Nine Months Ended September 30, | Year Ended December 31, | ||||||||||||
|---|---|---|---|---|---|---|---|---|---|---|---|---|---|---|
| | 2015 | 2014 | 2014 | Year Ended December 31, 2015 | ||||||||||
| | (in millions) | (in millions) | ||||||||||||
Pro forma net income | $ | 57.0 | $ | 23.0 | $ | 49.0 | $ | 83.3 | ||||||
Pro forma interest | 36.2 | 35.6 | 48.4 | 48.4 | ||||||||||
Pro forma income tax provision | 40.2 | 15.4 | 30.9 | 57.3 | ||||||||||
Pro forma depreciation and amortization | 39.3 | 36.5 | 44.7 | 44.1 | ||||||||||
Acquisition costs | 0.4 | (7) | 8.5 | (8) | 10.0 | (9) | ||||||||
| | | | | | | | | | | | | | | |
Pro Forma EBITDA | $ | 173.1 | $ | 119.0 | $ | 183.0 | $ | 233.1 | ||||||
| | | | | | | | | | | | | | | | |
| | | | | | | | | | | | | | | |
The following is a reconciliation of net income to the Direct Edge Acquisition.Adjusted earnings:
| | Year Ended December 31, | |||||||||
|---|---|---|---|---|---|---|---|---|---|---|
| | 2015 | 2014 | 2013 | |||||||
| | (in millions) | |||||||||
Net income | $ | 82.2 | $ | 49.2 | $ | 46.8 | ||||
Amortization | 26.9 | 10.3 | 5.9 | |||||||
Tax effect of amortization | (11.0 | ) | (4.0 | ) | (2.2 | ) | ||||
Acquisition-related costs | 8.2 | 18.5 | 5.2 | |||||||
IPO costs | 1.5 | — | 0.6 | |||||||
Loss on extinguishment of debt | — | 13.6 | — | |||||||
Impairment of intangible assets | — | — | 3.5 | |||||||
Debt restructuring | 0.5 | — | — | |||||||
Gain on extinguishment of revolving credit facility | (1.0 | ) | — | — | ||||||
Regulatory assessment | — | — | (1.8 | ) | ||||||
Tax effect of other items | (3.7 | ) | (12.4 | ) | (2.9 | ) | ||||
| | | | | | | | | | | |
Adjusted earnings | $ | 103.6 | $ | 75.2 | $ | 55.1 | ||||
| | | | | | | | | | | |
| | | | | | | | | | | |
| | | | | | | | | | | |
You should carefully consider the following risks and all of the information set forth in this prospectus before investing in our common stock.
Risks Relating to Our Business
We face intense competition and compete with a broad range of market participants globally, including our principal investors. Further consolidation and alliances among our securities trading competitors could impair our competitive position.
The market for trade execution services is intensely competitive in the asset classes and geographies in which we operate. Increased competition may result in a decline in our share of trading activity and a decline in our revenues from transaction fees and market data fees, thereby adversely affecting our operating results.
In the United States, the competition among securities exchanges and other securities execution venues has become more intense with regulatory changes. The U.S. listed cash equity securities marketplace has evolved dramatically in the years following the SEC's adoption of Regulation NMS. We compete in the U.S. listed cash equity securities market against NYSE and NASDAQ, other regional exchanges and several ATSs. Market participants now have multiple venues for the execution of orders, including national securities exchanges as well as numerous off-exchange venues, including ATSs operating "dark pools" that do not publicly display quotations, "lit" ATSs that publicly display quotations operating as ECNs and broker-dealers who internalize orders off-exchange. For example, dark pool venues compete with us by offering low cost executions and differ from "lit" ATSs in the degree of transparency with respect to quotes and trades they offer and in restrictions on who may access these systems. Unlike "lit" venues that publicly display orders, dark pools do not display orders publicly or privately. In addition, while dark pools are required to publicly report trade executions, unlike lit venues that are national securities exchanges, such as BZX, BYX, EDGX and EDGA, those public reports do not immediately identify the dark pool responsible for the trade execution. Hence, dark pools are less transparent than lit venues. Moreover, dark pools with trading volume below certain levels have discretion to offer access on discriminatory terms, effectively blocking access to certain types of market participants. These features of dark pools, which are not available to national securities exchanges, such as BZX, BYX, EDGX and EDGA, can appeal to trading participants who seek to minimize the public disclosure of their trading interest or limit the types of other trading participants that can access their orders. In addition, various broker-dealers internalize their order flow or route their orders to third-party ATSs. Based on publicly available data regarding reported trades, for the nine monthsyear ended September 30,December 31, 2015, off-exchange trading accounted for approximately 35.3%35.4% of consolidated U.S. listed equity volume, and for the year ended December 31, 2014, off-exchange trading accounted for approximately 36.2% of consolidated U.S. equity volume. If off-exchange trading expands further, it will adversely affect our market share in the United States. In addition, newer market entrants with different models may seek status as national securities exchanges, further competing with our exchange business. For example, on August 21, 2015, a subsidiary of an ATS operator, IEX Group, Inc. filed an application with the SEC to register as a national securities exchange.
The market for execution services within listed cash equity securities in Europe has become significantly more competitive since MiFID came into effect in 2007. MiFID will be superseded and enhanced by MiFID II and MiFIR, which isare expected to be implemented at the beginning of 2017.2018. MiFID created a structure for pan-European competition versus other exchange monopolies throughout the E.U. countries. As a result, new MTFs emerged that have captured significant market share from existing national exchanges. Our major competitors in Europe include the London Stock Exchange Group, or
Exchange Group, or LSE, which also includes an MTF, Turquoise, Euronext, Deutsche Börse, NASDAQ, SIX Swiss Exchange and Bolsas y Mercados Españoles, or BME.
The market for the trading of U.S. listed equity options is also intensely competitive, with thirteen authorizedfourteen U.S. options exchanges as of September 30, 2015, andthe date of this prospectus (not including a fourteenth currentlysecond U.S. options exchange of Miami International Holdings, Inc., planned for launch in the third quarter of 2016, pending approval,SEC approval) competing for market share. Our primary competitors in the U.S. options market are CBOE, NYSE, NASDAQ, ISE and Boston Options Exchange Group, LLC, or BOX. As a result of our size and limited product offerings, certain of our competitors have advantages in terms of greater market share and name recognition in the market for trading U.S. listed equity options. These advantages enable our competitors to provide products and services we do not offer, including proprietary products. For instance, some products offered uniquely by CBOE (for example, products based on the VIX volatility index) are not traded on our platform. On March 9, 2016, NASDAQ announced that it had agreed to acquire ISE, which operates three options exchanges. Additionally, a rule change recently adopted by the Options Clearing Corporation, or the OCC, concerning a proposed capital plan that, ifand affirmed on review by the SEC in February 2016, concerns a capital plan that could effectively allow itsthe OCC's shareholder exchanges, which include CBOE, ISE, NASDAQ and NYSE, to monetize for their benefit the OCC's monopoly over options clearing. We believe that the proposed capital plan has the potential to result in a wealth transfer from options investors to the OCC's shareholder exchanges, stifling future competition in the options market and increasing the costs of trading listed options.
The spot FX market remains severely fragmented, with transparent automated marketplaces such as BATSBats Hotspot challenging ICAP plc (Electronic Booking System)(EBS BrokerTec), or ICAP, and Thomson Reuters (Reuters Matching, FXall). While the spot FX market recently has been experiencing a shift from competing interbank platforms to ECNs, the electronification of spot FX may encounter resistance from clients that still prefer to utilize the phone, Reuters Conversational Dealing, Instant Bloomberg Chat, Bloomberg terminals and key banking relationships for price discovery and trading. Furthermore, electronification of FX appears to be experiencing more resistance outside the United States. The electronic FX market is also intensely competitive, with multiple venues such as EBS, Reuters Matching, FXall, FX Connect, CME Group, Currenex, 360T, Bloomberg, FastMatch, Gain GTX and others competing for market share. Additionally, exchange operators are actively expanding into the global FX market. For example Deutsche Börse has recently completed its acquisition of 360T and NASDAQ has announced its plans to launch an FX trading market. Moreover, the current market may experience consolidation, such as the recent acquisition of Molten Markets by ICAP.
We compete in the spot FX market based on our ability to execute our customers' trades at competitive prices, to retain our existing customers and to attract new customers. Certain of our competitors have larger customer bases, more established name recognition, and a greater market share in certain markets, such as Europe. These advantages may enable them, among other things, to:
In recent years, the securities trading industry has witnessed increased consolidation among market participants, such as the November 2013 acquisition of NYSE by Intercontinental Exchange and our own acquisition of Direct Edge in January 2014. More recently, in March 2016, the London Stock
Exchange and Deutsche Börse executed a merger agreement aimed at creating the largest exchange operator in Europe. Additional consolidations and alliances among market participants may create larger internal liquidity pools that may attract trading volume and liquidity away from BZX, BYX, EDGX, EDGA and BATS Chi-XBats Europe's exchanges and, therefore, lead to
decreased revenues. In addition, consolidations or alliances among our current competitors may achieve cost reductions or other increases in efficiency, which may allow our competitors to offer lower prices or better customer service than we do. These post-merger competitors may be able to achieve efficiencies that allow them to offer lower transaction fees or other financial incentives, which may hinder our ability to stay competitive in the listed cash equity securities market and to further penetrate the options market. In addition, these mergers may result in stronger competitors for us than the premerger entities as stand-alone businesses in other markets that we may decide to enter, such as futures and other derivative products.
In addition, BATSBats is dependent upon certain third parties for its ETP listings business, some of which are direct competitors of BATS.Bats. For example, BATSBats does not currently offer intraday net asset values, or INAVs, calculation services for ETP issuers, which the SEC requires ETP issuers to calculate and distribute for their funds. NYSE Arca, owned by Intercontinental Exchange, is the primary provider of INAVs for equity ETP issuers. In December 2015, Intercontinental Exchange completed its acquisition of financial market data provider Interactive Data Corp., or IDC. IDC provides data and calculation services for ETP issuers to generate INAVs for fixed-income funds. As a result of Intercontinental Exchange's acquisition of IDC, Intercontinental Exchange would increase its competitive advantage in the INAV calculation space, which could result in ETP issuers listing on BZX not to be able to obtain comparable commercial terms from IDC for IDC's provision of INAV calculation services for BZX-listed ETPs.
Further, we may face competition from our principal investors. Our principal investors or their affiliates may already have or may acquire an ownership interest in competing businesses (including national securities exchanges, dark pools, MTFs, ATSs or ECNs). These businesses may compete with us, either in relation to existing product and service offerings or any diversification of our product and service offerings into new asset classes and/or new geographic locations. For example, certain of our principal investors have a material interest in another MTF, Turquoise, and are planning to launch a new trading venue, "Plato." Furthermore, many of our principal investors operate off-exchange market-making desks, internalization platforms, dark pools, "lit" ATSs and ECNs and smart order routers, each of which potentially competes with us.
If we are unable to compete successfully in this environment, our business, financial condition and operating results may be adversely affected. Also, if our share of total trading volumes decreases relative to our competitors, we may be less attractive to market participants as a source of liquidity, and we may lose additional trading volume and associated transaction fees, market data fees and connectivity fees as a result.
Our market data fees and net transaction fees may be reduced due to declines in our market share, trading volumes or regulatory changes, and our lack of revenue diversification may adversely affect our operating results and place us at a competitive disadvantage.
We derived 34.8%34.1% and 44.7%44.6% of our revenues less cost of revenues from market data fees and net transaction fees, respectively, for the nine monthsyear ended September 30,December 31, 2015. We derived 35.9% and 42.7% of our revenues less cost of revenues from market data fees and net transaction fees, respectively, for the year ended December 31, 2014. Approximately 84.5%84.0% and 83.5%83.8% of our market data fees for the nine months ended September 30, 2015 and for the yearyears ended December 31, 2015 and 2014, respectively, represent our share of tape fees from the U.S. tape plans based on a formula, required by Regulation NMS, which takes into account both trading and quoting activity. For purposes of calculating this percentage, we have not attributed any incremental costs associated with providing trading and quoting information to the U.S. tape plans. Transaction fees represent fees that we earn for trade execution on BZX (including our U.S. listed equity options
market), BYX, EDGX (including our U.S. listed equity options market), EDGA and BATS Chi-XBats Europe, whether a trade is executed internally on BZX, BYX, EDGX, EDGA or BATS Chi-XBats Europe or routed to another market center.
Net transaction fees represent transaction fees less the liquidity payments and routing and clearing costs that we incurred to earn those transaction fees.
The occurrence of any event that reduces the amount of market data fees or transaction fees that we receive, whether as a result of fee reductions, fewer members subscribing to the U.S. tape plans, declines in market share or trading volumes (or notional volume in the case of BATS Chi-XBats Europe) or regulatory changes, will have a direct negative impact on our operating results and future profitability. For example, if our market share of U.S. listed cash equities and U.S. listed equity options trading, or our European cash equities trading, were to decline, our share of market data fees could also decline. In addition, if the amount of trading volume on BZX, BYX, EDGX or EDGA or notional value traded on BATS Chi-XBats Europe decreases, we will lose transaction fees. Moreover, market data fees could decline as a result of a reduction in the numbers of market data users, for example because of consolidation among market data subscribers or due to a decline in professional subscriptions as a result of staff reductions in the financial services industry or otherwise. For a discussion of the factors that may impact trading volumes, see "—Current economic conditions could adversely affect our business and financial condition." Regulatory changes could also impact the manner in which we set our transaction fees, the fees we receive from market data, or our cost in providing such services. See "—We operate in a highly regulated industry. Regulatory changes and changes in market structure could have a material adverse effect on our business and those of many of our clients."
In addition, our dependence upon revenues derived primarily from our transaction-based businesses may place us at a competitive disadvantage. Some of our competitors derive a more significant portion of their revenues from more than one source as a result of more diversified product and service offerings and in more numerous geographies. For example, NYSE, LSE, Euronext and NASDAQ may realize substantial revenue from listing fees and index licensing fees, and some of our FX competitors may realize substantial revenue from market data and port fees. In addition, many of our competitors also offer technology outsourcing. As a result, lower transaction fees or market data fees may impact our operating results and future profitability more significantly than our competitors', providing them with a competitive advantage in pricing their products and services or withstanding a reduction in trading volume.
Our industry is characterized by intense price competition.
The securities trading industry and FX market are characterized by intense price competition. We may be required to adjust pricing to respond to actions by new or existing competitors, which could adversely impact operating results. We also compete with respect to the pricing of market data and with respect to value-added market data such as historical market data. If we are unable to compete successfully with respect to the pricing of our services and products, our business, financial condition and operating results may be adversely affected. Furthermore, to attract market share, we may offer "inverted" pricing specials or no-transaction fee trading from time to time. For example, our BATSBats Hotspot Platform has at times offered trading of spot gold and silver pairs without any transaction fee, or waived taker fees for certain currency pairs, and previously offered free trading for all transactions on BATSBats Hotspot's London-based matching engine through 2015. In addition, BZX recently began offering to pay an incentive fee to exchange-traded investment funds that list their shares on BZX. These forms of promotions may adversely affect our profitability.
Our revenues are positively correlated with overall market volume, which can be impacted by a number of factors, including market prolonged diminished volatility.
A significant percentage of our revenue is tied directly to the volume of securities traded on our markets. Trading volume on our markets can be influenced by a number of factors, including market
volatility. The U.S. listed cash equity market trading volume was flat from 2012 through 2014 and increased 7.8% in 2015 from 2014 trading volumes. In addition, other events may affect overall market
volume on a sustained basis, including rule-making under Dodd-Frank. For example, the provision commonly known as the Volcker Rule restricts banking entities from engaging in certain kinds of proprietary trading, including with respect to listed equity securities and listed equity options. Still in its early stages of adoption, the Volcker Rule could have an adverse impact on U.S. equity market volumes and BATS'Bats' U.S. equity exchanges. For example, if banking entities reduce their trading activity and that activity is not replaced by other market participants, we may face a decline in our trading volumes, which could lower our revenues and may adversely affect our operating results.
Revenue from our FX business is influenced by the general level of trading activity in the FX market. Our FX revenue and operating results may vary significantly from period to period due primarily to movements and trends in the world's currency markets and to fluctuations in trading levels. We have generally experienced greater trading volume and higher revenue in periods of volatile currency markets. Significant swings in the market volatility can also result in increased customer trading losses, higher turnover and reduced trading volume. In the event we experience lower levels of currency volatility, our revenue and profitability may be negatively affected.
Like other financial services firms, our FX business and profitability are directly affected by factors that are beyond our control, such as economic and political conditions, government or central bank actions like the unexpected actions of the Swiss National Bank on January 15, 2015, broad trends in business and finance, changes in the volume of foreign currency transactions, changes in supply and demand for currencies, movements in currency exchange rates, changes in the financial strength of market participants, legislative and regulatory changes, changes in how such transactions are processed and disruptions due to terrorism, war or extreme weather events. Any one or more of these factors, or other factors, may adversely affect our FX business and results of operations and cash flows. A weakness in equity markets could result in reduced trading activity in the FX market and therefore could have a material adverse effect on our FX business, financial condition and results of operations and cash flows.
System limitations, failures or security breaches could harm our business.
Our business depends on the integrity and performance of our computer and communications systems. If our systems cannot expand to cope with increased demand or otherwise fail to perform, we could experience unanticipated disruptions in service, slower response times and delays in the introduction of new products and services. These consequences could result in trading outages, lower trading volumes, financial losses, decreased customer service and satisfaction and regulatory sanctions. Our markets have experienced occasional systems failures and delays in the past and could experience future systems failures and delays.
For example, on March 23, 2012, we experienced a serious technical failure on BZX, forcing us to cancel our planned IPO. The failure resulted from a software bug that appeared during the BATSBats IPO auction. In addition to forcing us to cancel our IPO, the technological failure played a role in the halting of another issuer's stock for five minutes. These technical failures damaged our reputation and resulted in increased regulatory scrutiny of the event by the SEC and other governmental authorities. We have since investigated that incident and adopted various policy and procedure enhancements, including implementation of an independent software quality assurance department, but there can be no guarantee that we will not suffer a similar technological failure in the future that damages our reputation and results in increased regulatory scrutiny by the SEC and other governmental authorities.
Our systems and operations also are vulnerable to damage or interruption from human error, natural disasters, power loss, cyber attacks, sabotage or terrorism, computer viruses, unauthorized access, intentional acts of vandalism and similar events. Persons who circumvent security measures
could wrongfully access and use our information or our customers' information or cause interruptions or malfunctions in our operations. Although we currently maintain and expect to maintain security
measures designed to protect the integrity of our systems, multiple computer facilities designed to provide redundancy and back-up to reduce the risk of system disruptions and facilities expected to maintain service during a system disruption, such security measures, systems and facilities may prove inadequate. Any breach in security or system failure that allows unauthorized access, causes an interruption in service or decreases the responsiveness of our systems could impair our reputation, damage our brand name and negatively impact our business, financial condition and operating results.
We operate in a highly regulated industry. Regulatory changes and changes in market structure could have a material adverse effect on our business and those of many of our clients.
Our securities markets and their participants are highly regulated and are subject to extensive regulation in the United States and Europe. In recent years, the securities trading industry and, in particular, the securities markets have also been subject to significant regulatory changes. Moreover, in the past several years, the securities markets have been the subject of increasing governmental and public scrutiny in response to the global economic crisis. For example, on July 21, 2010, Dodd-Frank was enacted, introducing significant changes to financial industry regulation. Dodd-Frank may also affect the structure, size, depth and liquidity of the financial markets generally and will require that certain standardized derivative products, likely including currency derivative products, be traded on a Swap Execution Facility, or SEF, or designated contract market, or DCM. Similarly, in Europe, the European Commission, or E.C., has proposed a draft delegated regulation in the context of the MiFID II reforms which would introduce a harmonized definition of currency derivative products across the European Union. If the proposed regulation is adopted in its current draft form, it would likely mean that a number of currency products which may have been treated as spot transactions (and outside the scope of the MiFID and certain other derivative rules) would thereafter be treated as derivative products (and consequently within the scope of the MiFID and certain other derivative rules). This may adversely impact the overall level of activity conducted in such products, although, to the extent that any such products are declared by the European Securities Markets Authority, or ESMA, to be subject to an obligation to trade on certain trading venues, this could lead to a greater proportion of the remaining activity taking place on trading venues.
In addition, Congress, regulators and some media have been increasingly scrutinizing electronic trading and the structure of equity markets in recent years. The SEC continues to consider various potential market structure changes, which could result in reduced trading volumes, or which could negatively affect our business. For example, in June 2014, the Chair of the SEC announced that the SEC was conducting a comprehensive review of market structure. As part of that review, in January 2015, the SEC appointed a special market structure advisory committee of industry participants to review possible regulatory changes. In response to the SEC's efforts, many market participants, including BATS,Bats, have publicly announced recommendations for regulatory changes. Reforms recommended by various market participants have included: (i) the elimination of maker-taker pricing or a drastic reduction in access fees charged by exchanges, (ii) increased transparency around order handling practices, (iii) implementation of a so-called trade-at prohibition, which would restrict execution of a trade by a market center that was not displaying the best available quotation, such as off-exchange trading in listed equities, (iv) limitations on high frequency trading and restrictions on, and enhanced oversight of, broker-dealers' automated trading algorithms, (v) limitations on the distribution of direct, or proprietary, market data feeds by exchanges, (vi) changes to the governance models of the consolidated market data national market system plans, or SIPs, including potentially providing for increased representation by non-SROs, as well as increasing the SIPs' technological capacity, (vii) elimination of Self Regulatory Organization, or SRO, status for securities exchanges and (ix) limitations on or elimination of Rule 611 of Regulation NMS, which currently requires all market participants to execute trades at prices no worse than the best bid or offer displayed by an exchange or
other automated trading center. To the extent the SEC decides to adopt some or all of these recommendations, our business could be negatively impacted. For example, elimination of maker-taker
pricing or a reduction in access fees could make it more difficult to incentivize market makers to display orders on our exchanges, and could reduce our net transaction fees. Implementation of a trade-at prohibition could restrict our ability to execute non-displayed orders on our exchanges. New restrictions on high frequency trading or broker-dealers' use of automated trading algorithms could result in decreases in market volumes which could negatively affect our revenue. Additional restrictions on our ability to distribute proprietary market data could make it more difficult to derive revenue from the sale of such market data. Changes to the SIPs, including by providing for greater non-SRO participation or mandating further technological investments, could negatively impact the costs and revenues of the SIPs, which in turn could negatively impact the amount of revenue we receive from the SIPs. Elimination of SRO status for securities exchanges could have the effect of eliminating our ability to assert the legal defense of quasi-governmental immunity to shield us from civil liability for actions we take in furtherance of our SRO responsibilities, which in turn could subject us to liability for monetary damages in lawsuits. Elimination or limitation on Rule 611 could reduce market participants' need to execute trades on our exchanges when such exchange is displaying the best available price, reducing our trading volumes and revenues.
Over the last several years the SEC and other regulators have proposed various specific market structure changes in addition to those described above. See "Regulation." Actions on any of the specific regulatory issues currently under review in the United States and Europe could have a material impact on our business. The SEC, FINRA and the national securities exchanges have proposed, adopted, or are in the process of implementing several initiatives aimed at addressing the oversight, integrity and resilience of the markets. These include large trader reporting, market access risk control rules, limit up/limit down trading price bands and market-wide circuit-breakers, among other initiatives. In addition, in July 2012, the SEC adopted a rule requiring FINRA and the securities exchanges, such as BZX, BYX, EDGX and EDGA, to develop a consolidated audit trail, or CAT, that will allow regulators to efficiently and accurately track all activity in listed securities throughout the U.S. markets. While we support these initiatives and believe they will strengthen the U.S. equity market structure, these and potential future market structure reforms could involve significant implementation and ongoing costs for our U.S. exchange subsidiaries and other market participants. We believe our customers would likely bear a portion of these expenses through increased trading costs, and could result in lower transaction volumes. For example, the costs of developing, building and operating the CAT are expected to be significant. Although the manner in which the costs of the CAT will be allocated among the exchanges, FINRA and market participants has not yet been finalized, to the extent that FINRA and the national securities exchanges impose new quoting or trading fees in order to fund the CAT, market participants may alter their trading activities, causing volumes to decline.
Effective November 2015, the SEC's Regulation SCI requires providers of certain key market infrastructure, including BZX, BYX, EDGX and EDGA, to have comprehensive policies and procedures in place surrounding their technology. Regulation SCI, which stands for "Systems Compliance and Integrity," replaces the current voluntary compliance program with rules whose violation may be the subject of enforcement actions. Self-regulatory organizations, such as BZX, BYX, EDGX and EDGA, certain ATSs, the SIPs and certain clearing agencies are required to take specific measures to ensure that the core technology meets these new Regulation SCI standards, to conduct business continuity testing and to provide certain notifications in the event of systems disruptions and other events. While we support this regulation and do not anticipate material changes will be necessary for continued compliance, the burdens associated with compliance with such rule could negatively impact our business by increasing our operational expenses.
In addition, the SEC recently approved a two-year "tick pilot" program to impose wider minimum quoting and/or trading increments, or tick sizes, in certain illiquid securities in an effort to incent
liquidity provision in those securities. The tick pilot is scheduled to begin by October 3, 2016, and among other criteria, will generally include stocks of companies with $3 billion or less in market
capitalization, an average trading volume of one million shares or less, and a volume weighted average price of at least $2.00 for each trading day during the measurement period prior to the effective date of the pilot. The tick pilot will consist of a control group of approximately 1,400 securities and three test groups with 400 securities in each selected by a stratified sampling. During the pilot: (i) pilot securities in the control group will be quoted at the current tick size increment of $0.01 per share and will trade at the currently permitted increments; (ii) pilot securities in the first test group will be quoted in $0.05 minimum increments, but will continue to trade at any price increment that is currently permitted; (iii) the second test group will be quoted in $0.05 minimum increments and will trade at $0.05 minimum increments, subject to a midpoint exception, a retail investor exception, and a negotiated trade exception; and (iv) pilot securities in the third test group will be subject to the same terms as the second test group and will also be subject to a "trade-at" requirement to prevent price matching by a venue not displaying at a price of a trading center's best "protected" bid or offer, unless an enumerated exception applies. The exchanges, including BZX, BYX, EDGX and EDGA, and FINRA are required to submit their initial assessments on the tick pilot's impact 18 months after the pilot begins based on data generated during the first 12 months of its operation. The tick pilot will require BZX, BYX, EDGX and EDGA to devote additional significant resources to implement and report on the program, increasing our costs. In addition, for tick pilot test group securities where execution at price increments narrower than the permitted quote is permitted, the implementation of the tick pilot could incentivize additional trading away from the exchanges, reducing the volume of orders executed on BZX, BYX, EDGX and EDGA.
The continued growth of high frequency trading, and what, if any, response is appropriate, has also been the subject of extensive Congressional and regulatory consideration. High frequency trading generally refers to certain types of computer-executed automated trading strategies. A number of exchanges and other market participants have also been the subject of private litigation and regulatory enforcement actions alleging that high frequency trading firms have received unfair advantages at the expense of other traders. High frequency trading accounts for a significant percentage of the daily volume in the U.S. and European equity markets and these actions and other efforts to slow trading could lead to a reduction in trading volumes, negatively impacting all trading markets, including our business.
Our customers are also highly regulated. The SEC, FINRA, the Commodity Futures Trading Commission, or CFTC, the Board of Governors of the Federal Reserve System, or Federal Reserve, the Federal Deposit Insurance Corporation, or FDIC, the OCC, the U.K. Financial Conduct Authority, or FCA, and other regulatory authorities could impose regulatory changes that could adversely impact the attractiveness of, and the ability of our customers to use, our markets. Regulatory changes by the SEC, FINRA, CFTC, Federal Reserve, FDIC, OCC, FCA or other regulatory authorities could result in the loss of a significant number of customers or a reduction in trading activity on our markets.
The implementation of MiFID II in Europe will result in an alteration of the existing MiFID structure that has encouraged competition among market centers in Europe. The impact of MiFID II and MiFIR, is likely to be significant, and could reduce trading volumes and trading fees, while increasing our costs of operating in Europe.
For example, MiFID II and MiFIR introduce a number of new rules which apply directly to European trading venues such as our MTF and RM. These rules include provisions governing high frequency algorithmic trading and specific obligations on firms operating RMs to put in place systems, procedures and arrangements to ensure the trading venue is resilient, has sufficient capacity to cope with order flow, has effective business continuity arrangements, etc. In particular, there are new rules specifically governing tick sizes, synchronization of business clocks and the imposition of limits on the ratio of orders to transactions which RMs will need to implement.
MiFIR also introduces a much broader transparency regime for RMs and MTFs covering not only pre-and post-trade transparency for equities but also for equity-like instruments, derivatives and fixed income instruments. Waivers from transparency are subject to venue-specific and European-wide volume caps which may curtail participants' ability to conduct dark book trading.
In addition to the new trading venue and transparency rules noted above, MiFID II introduces enhanced internal organizational and compliance monitoring requirements for RMs which will require the enhancement of internal compliance arrangements, processes and procedures.
These additional requirements, individually and in aggregate, could have a material adverse effect on our business and cash flows, financial condition and results of our European operations. They imply additional implementation expenditure but potentially also additional ongoing compliance resources. They may also have an adverse impact on the volume of trading that takes place on our venues thereby potentially reducing revenue.
MiFIR may also have an adverse impact on our U.S. listed cash equity operations as a result of the introduction of a mandatory equity trading rule which would require E.U. investment firms to trade equities which are either admitted to trading on an RM or traded on an E.U. trading venue only on RMs, MTFs with systematic internalisers or with third-country trading venues which have been specifically assessed to be equivalent. Since a significant number of U.S. listed cash equities can be traded on E.U. trading venues, E.U. investment firms may be required to undertake trades in such U.S. listed cash equities only on those European markets unless and until an equivalence assessment is made in respect of our U.S. exchanges.
On February 14, 2013, the E.C. published a proposal for a directive for a common Financial Transaction Tax, or FTT, in Belgium, Germany, Estonia, Greece, Spain, France, Italy, Austria, Portugal, Slovenia and Slovakia or the participating Member States.
The proposed FTT has a broad scope and could, if introduced in the form originally proposed, apply to certain transactions relating to financial instruments (including secondary market transactions) in certain circumstances.
Under the February 14, 2013 proposal, the FTT could apply in certain circumstances to persons both within and outside of the participating Member States. Generally, it would apply to certain transactions relating to financial instruments where at least one party is a financial institution (as defined therein), and at least one party is established in a participating Member State. A financial institution may be, or be deemed to be, "established" in a participating Member State in a broad range of circumstances, including (a) by transacting with a person established in a participating Member State or (b) where the financial instrument which is the subject of the transaction is issued in a participating Member State.
The FTT proposal remains subject to negotiation between the participating Member States. Ten out of the eleven participating Member States agreed on certain core principles at their December 2015 meeting, Estonia having withdrawn from the group. The next key deadline for the resolution of remaining issues is in June 2016. The FTT proposal may be altered prior to any implementation, the timing of which remains unclear. Additional E.U. Member States may decide to participate and/or certain of the participating Member States may decide to withdraw.
Legislators in the U.S. have also sponsored bills to impose an FTT on certain financial market transactions, including transactions in securities on an exchange.
If implemented, an FTT may, among other matters, make listing the affected financial instruments on an exchange less attractive for issuers than would be the case absent implementation of the FTT. By raising the cost of trading for our customers, an FTT may reduce the volume of transactions and the liquidity and market efficiency of the capital markets, reducing revenues.
In addition, Dodd-Frank will likely result in exchange or execution platform trading and clearing of many swaps, which could give greater liquidity and accessibility to derivatives that compete with options traded on our U.S. listed equity options markets. The Camp Tax Reform proposals, introduced as legislation in 2014 as a means to unifying taxthe taxation of derivatives could result in adverse tax consequences to market participants, which may lead to fewer investors using listed equity options to reduce the risks of owning stock or generating additional income from their stock holdings. The proposals, if adopted as proposed, may reduce the volume of transactions in the U.S. listed equity options market. Furthermore, the SEC continues to consider whether to impose a cap on transaction fees charged by options exchanges similar to the caps applied to equity exchanges. Transaction fee caps would limit the amount of fees that we can charge to access our liquidity and, accordingly, the payments we can pay to market participants to attract liquidity.
In addition to its other SRO responsibilities, BZX, as an ETP listing market, also is responsible for overseeing each listed company's compliance with BZX's listing standards. Our listings department evaluates applications submitted by issuers interested in listing their securities on BZX to determine whether the quantitative and qualitative listing standards have been satisfied. Once securities are listed, our listings department monitors each issuer's ongoing compliance with BZX's continued listing standards. Failure to comply with these SRO responsibilities could result in potential sanctions or fines and a negative impact on our reputation or branding.
The legislative and regulatory environment in which the FX market operates is evolving and has undergone significant changes in the recent past and there may be future regulatory changes in the FX industry. FX market participants have seen an increasing number of law enforcement actions and regulatory inquiries into their business practices. The governmental bodies and regulatory organizations that regulate parts of the FX market have enacted, proposed and may consider additional legislative and regulatory initiatives and may adopt new or revised laws and regulations. Changes in the interpretation or enforcement of existing laws and regulations by these entities, or the adoption of new legal or regulatory requirements, may also adversely affect our FX business. For example, the New York State Department of Financial Services recently issued a consent order with Barclays Bank PLC, or Barclays, pursuant to which Barclays agreed, among other things, to pay a $150 million fine over the "last look" function in its electronic FX trading business. The Hotspot Platform contains "last look" functionality that may be used by certain platform participants. Changes in how "last look" is viewed by governmental bodies or regulatory organizations may have an adverse impact on the acceptance of "last look" functionality in the FX market generally as well as on our FX business.
We plan on expanding our FX business, which will expose us to additional risks, including increased regulatory oversight.
In September 2015, BATSBats Hotspot launched a London matching engine to target specific currency pairs that are more active in Europe and attract more participation from Europe and Asia, complementing BATSBats Hotspot's New York area matching engine and giving investors two distinct pools of liquidity to drive price formation globally. This business expansion brings increased risk and potentially increased regulatory scrutiny.
BATSBats Hotspot may launch a SEF. Launching the SEF would require BATSBats Hotspot to comply with additional regulatory obligations, as the SEF will be registered with and regulated by the CFTC. For example, under Dodd-Frank and CFTC rules, SEFs must establish and enforce trading and market monitoring procedures and maintain comprehensive business records, among other requirements. Similarly, BATSBats Hotspot may also launch an MTF or other venue in the United Kingdom that would be registered with and regulated by the FCA, and subject to corresponding obligations.
Changes to the regulators and agencies governing European financial markets could adversely affect our business.
A number of changes in the regulators and agencies governing European financial markets have been enacted or proposed since the financial crisis. In 2010, the U.K. Government announced plans to reform the U.K. regulatory regime by abolishing the Financial Services Authority and replacing it with two regulators, one covering prudential risks and the other covering conduct of business matters. Accordingly, on April 1, 2013, the FCA became the primary regulator of BATS Chi-XBats Europe. In addition, three independent European agencies now regulate the financial markets, banking and insurance industries, with the mandate of contributing to the stability of the European Union's financial system by ensuring the integrity, transparency, efficiency and orderly functioning of securities markets, as well as by enhancing investor protection. In particular, ESMA fosters supervisory convergence both among national securities regulators and across financial sectors by working closely with the other competent European Supervisory Authorities, or ESAs.
Until such changes have been in effect for a longer period of time, we cannot fully estimate what long term effect they will have on the oversight and operation of our European market, clearing and other operations, but we do expect it to affect our business, potentially leading to increased regulation and oversight of our operations and the European capital markets generally.
Regulatory changes or future court rulings may have an adverse impact on our revenue from proprietary market data products.
Regulatory and legal developments could reduce the amount of revenue that we earn from our proprietary market data products. In the United States, we generally are required to seek approval fromfile with the SEC forany changes to the fees that we charge for our securities market data products. In recent years, certain industry groups have objected to the ability of exchanges to charge for certain market data products. Specifically, Securities Industry and Financial Markets Association, or SIFMA, has filed a number of denial of access applications with the SEC to set aside proposed rule changes to establish or modify fees for BATSBats market data products and related services. Each application is being held in abeyance pending a decision on a separate SIFMA denial of access application currently before the SEC's Chief Administrative Law Judge, or ALJ, regarding fees proposed by NASDAQ and NYSE for their respective market data products. An adverse ruling in that matter could cause the SEC to more closely examine exchange market data fees, which in turn could result in our having to reduce the fees we charge for market data. The SEC also has authority to undertake such review at its own discretion. If such an examination is conducted, and the results are detrimental to our U.S. securities exchanges' ability to charge for market data, there could be a negative impact on our revenues. We cannot predict how the ALJ will rule on the matter or whether, or in what form, any regulatory changes will be implemented, or their potential impact on our business. A determination by the SEC, for example, to link securities market data fees to marginal costs, to take a more active role in the market data rate-setting process, or to reduce the current levels of securities market data fees could have an adverse effect on our securities market data revenues.
We believe BATS Chi-XBats Europe currently offers market data to customers on a non-discriminatory basis at a reasonable cost. As regulators determine how market data should be disaggregated and what is a reasonable commercial basis for providing market data, as set out in MiFID II and MiFIR, it could affect our ability to offer market data products in the same manner that we do today thereby causing an adverse effect on our European market data revenues. While MiFID II aims to encourage a commercial solution to a consolidated tape in Europe, should this fail to materialize, policy makers might be encouraged to implement a mandatory solution that could impact our ability to develop our own commercial offering.
We have indirect exposure to the European sovereign debt crisis.
BATS Chi-XBats Europe may from time to time hold cash reserves in U.K. sovereign government debt, commonly known as Gilts. In addition, many of its customers are banks who may hold investments in Euro-denominated sovereign debt. To the extent those customers are negatively impacted by those investments, they may be less able to pay amounts owed to us or renew service agreements with us. Such developments could negatively affect our business. Further, to the extent that sovereign debt concerns depress economic activity, it may negatively impact the number of transactions processed on our trading venues, resulting in lower revenue.
In addition, an exit from the Euro by an E.U. Member State or an ongoing recession in the Euro zone and the related Euro crisis could lead to foreign exchange volatility and a potential loss of revenues if trading volumes are negatively impacted across all of our trading platforms. In particular, a referendum to vote on the United Kingdom's continued membership in the European Union is anticipated by the end of 2017.scheduled to take place on June 23, 2016. Should the United Kingdom vote to withdraw from the European Union, there may be an unfavorable business environment for companies with operations in the United Kingdom that do business in the European Union. In such a case, BATS Chi-XBats Europe may move some or all of its operations to the European Union and the related costs and expenses could have a material adverse effect on our business.
We are dependent on the members of our senior management team and other key personnel.
We are highly dependent upon our Chief Executive Officer and President, Chris Concannon, and the CEO of BATS Chi-XBats Europe, Mark Hemsley. Both of these individual'sindividuals' talents and leadership have been, and continue to be, critical to our success. The diminution or loss of the services of any one of these individuals for any reason, and any negative market or industry perception arising from that diminution or loss, would have a material adverse effect on our business.
Our success also depends largely on the efforts and abilities of the other key members of our senior management team. Many of these individuals have worked together closely since our inception in 2005.
Members of our senior management team are subject to employment agreements, each with a term of three years, with automatic one-year annual extensions. Notwithstanding the foregoing, an employment agreement and the corresponding employment relationship between us and our senior management may be terminated at any time by either party with or without cause or advance notice. Accordingly, it is possible that one or more members of our senior management team could resign to work elsewhere. Because each member of our senior management team has a different area of specialization, the departure of any one of these individuals could create a deficiency in one of the core aspects of our business, particularly given our small number of employees relative to our competitors.
We are also dependent on the efforts of our team of technology professionals, many of whom have been with us for several years, and on our ability to recruit and retain highly skilled and often specialized personnel, particularly in light of the rapid pace of technological advances. The level of competition in our industry for individuals with this level of experience or these skills is intense. Significant losses of key personnel, particularly to competitors, could make it difficult for us to compete successfully. In addition, we may be unable to attract and retain qualified management and personnel in the future, including in relation to any diversification of our product and service offerings into new asset classes and/or new geographic locations.
We do not maintain "key person" life insurance policies on any of our executive officers, managers, key employees or technical personnel. The loss of the services of these persons for any reason, as well as any negative market or industry perception arising from those losses, could have a material adverse effect on our business, financial condition and operating results.
We may not be able to keep up with rapid technological and other competitive changes affecting our industries, and we may be unable to further diversify our business.
The markets in which we compete are characterized by rapidly changing technology, evolving industry standards and regulations, frequent enhancements to existing products and services, the adoption of new services and products and changing customer demands and regulatory requirements. If our platforms fail to function as expected, our business would be negatively affected. In addition, our business, financial condition and operating results may be adversely affected if we cannot successfully develop, introduce and/or market new services and products or if we need to adopt costly and customized technology for our services and products. Further, our failure to anticipate or respond adequately to changes in technology, customer preferences and regulatory requirements or any significant delays in product development efforts could have a material adverse effect on our business, financial condition and operating results.
In addition, we will face significant challenges as we seek to diversify our product and service offerings. We may, for example, diversify our equities business by competing with NYSE, NASDAQ and other exchanges and non-exchange trading platforms for new asset classes and in new geographic locations and new or existing listings. We may also diversify our FX business by competing with ICAP plc (Electronic Booking System)(EBS BrokerTec), Thomson Reuters and others for new asset classes and in new geographic locations. We will face substantial competition from these market centers, some of which have greater brand recognition than we do and offer a broader range of services than we currently offer. Accordingly, we may not be able to increase our revenues, compete successfully by further diversifying our product and service offerings or meet ongoing and changing regulatory requirements.
We generate a significant percentage of our total revenues from, and are provided with significant liquidity in our markets by, customers who are affiliates of our principal investors, who are not contractually obligated to continue to use our services or purchase our products and who also use the services of our competitors.
We earn a significant percentage of our revenue from customers who are affiliates of our principal investors. For the nine months ended September 30, 2015 and 2014, 46.7% and 49.9% of our total transaction fees were generated by affiliates of our principal investors, respectively. For the years ended December 31, 2015, 2014 and 2013, 45.1%, 43.2%, and 2012, 49.0%, 46.6% and 45.7%36.3% of our total transaction fees, respectively, were generated by affiliates of our principal investors. One of our principal investors accounted for 11%, 12% and 10% of our total transaction fees during the nine monthsyears ended September 30,December 31, 2015, and the years 2014 and 2013, respectively. None of our principal investors accounted for more than 10% of our total revenues during the 2012 year. In addition, affiliates of our principal investors also provide us with liquidity for which we provide them with a rebate. For the nine months ended September 30, 2015 and 2014, 52.4% and 53.8% of our total liquidity payments was generated by affiliates of our principal investors, respectively. For the years ended December 31, 2015, 2014 and 2013, 52.2%, 51.5%, and 2012, 54.8%, 53.4% and 52.8%50.8% of our total liquidity payments, respectively, were generated by affiliates of our principal investors. For the nine monthsyears ended September 30,December 31, 2015 and 2014, none of our principal investors accounted for more than 10% of total liquidity rebates paid. For the yearsyear ended December 31, 2014, 2013, and 2012, an affiliate of one of our principal investorsinvestor accounted for 9%, 12% and 10%, respectively,11% of total liquidity rebates paid. None of our customers is contractually or otherwise obligated to continue to use our services or purchase our products. In addition, affiliates of our principal investors and our other customers have made, and may continue to make, investments in businesses that directly compete with us. Our customers also trade, and will continue to trade, on markets operated by our competitors. The loss of, or a significant reduction in, participation on our markets by these customers may have a material adverse effect on our business, financial condition and results of operations.
We may not be able to successfully integrate BATSBats Hotspot, which may result in an inability to realize the anticipated benefits of the BATSBats Hotspot Acquisition.
Integrating BATSBats Hotspot's operations will involve complex technological, operational and personnel-related challenges. This process will be time-consuming and may disrupt the business of the combined company. Difficulties, costs and delays could be encountered with respect to:
For these reasons, we may not achieve the anticipated financial and strategic benefits, including cost savings from operational efficiencies and synergies, from the acquisition of BATSBats Hotspot's businesses, and any actual cost savings and synergies may be lower than we currently expect and may take a longer time to achieve than we currently anticipate.
We may have difficulty executing our growth strategy and managing our growth effectively.
We have experienced significant growth in our business since our inception in 2005, with material expansions into diverse businesses including European listed cash equity securities, U.S. listed equity options and global institutional spot FX trading. While our securities market share has increased, there is no guarantee this will continue in the future. Continuing to grow our businesses will require increased investment in our facilities, personnel and financial and management systems and controls. Unless our growth results in an increase in our revenues that is proportionate to the increase in our costs associated with this growth, our future profitability will be adversely affected. Furthermore, failure to successfully expand into new asset classes or new geographies may adversely affect our growth strategy and our future profitability.
As part of our growth strategy, we intend to continue evaluating potential acquisition opportunities and strategic alliances. Any such transaction may be effected quickly, may occur at any time and may be significant in size relative to our existing assets and operations. The market for acquisition targets and strategic alliances is highly competitive, particularly in light of increasing consolidation in the securities trading industry and FX industry, which may adversely affect our ability to find acquisition candidates or strategic partners that fit our growth strategy and our investment parameters. These transactions involve numerous risks, including, among others:
Failure to successfully manage any acquisition or strategic alliance we may make in the future could adversely affect our growth strategy and our future profitability. Furthermore, future acquisitions or strategic alliances may require significant resources and may result in significant unanticipated losses, costs or liabilities.
Future acquisitions may be effected through the issuance of our common stock, which could substantially dilute the ownership percentage of our current stockholders.
If our goodwill or intangible assets become impaired we may be required to record a significant charge to earnings.
As a result of our acquisitions of Chi-X Europe on November 30, 2011, Direct Edge on January 31, 2014 and BATSBats Hotspot on March 13, 2015, we have recorded approximately $1,042.5 million of goodwill and other acquired intangible assets. We assess the potential impairment of goodwill at least annually, or more frequently when events or changes in circumstances signal indicators of impairment are present. Adverse changes in economic conditions or our operations could affect the assumptions we use to calculate the fair value, which in turn could result in an impairment charge in future periods that would impact our results of operations and financial position.
The regulatory framework under which we operate and new regulatory requirements or new interpretations of existing regulatory requirements could require substantial time and resources for compliance, which could make it difficult and costly for us to operate our business.
Our securities markets operate in a highly regulated industry and may be subject to regulatory actions or other legal proceedings that could lead to censures, fines or other penalties if we fail to comply with our legal and regulatory obligations or our customers fail to comply with their obligations. The securities trading industry is subject to significant regulatory oversight and could be subject to increased governmental and public scrutiny in the future in response to global conditions and events. In the United States, our markets are regulated by the SEC and our broker-dealer subsidiary is regulated by the SEC, FINRA and other applicable SROs. In the United Kingdom, our markets are subject to local and/or E.U. regulation. As a result, our RMs may be subject to audits, investigations, administrative proceedings and enforcement actions relating to compliance with applicable rules and regulations.
In January 2015, the SEC completed two separate investigations into the development of order types: one related to BZX and BYX and another related to EDGX and EDGA. While the SEC concluded its investigation with no action taken with regards to BZX and BYX, the SEC accepted our offer of settlement with respect to EDGX and EDGA, which included a monetary penalty and an agreement to implement certain measures aimed at preventing future violations of the Exchange Act and the rules and regulations promulgated thereunder. In the future, we could be subject to SEC or other regulatory investigations or enforcement proceedings that could result in substantial sanctions, including revocation of our operating licenses. Any such investigations or proceedings, whether successful or unsuccessful, could result in substantial costs, the diversion of resources, including management time, and potential harm to our reputation, which could have a material adverse effect on our business, results of operations or financial condition. In addition, our exchanges could be required to modify or restructure their regulatory functions in response to any changes in the regulatory environment, or they may be required to rely on third parties to perform regulatory and oversight functions, each of which may require us to incur substantial expenses and may harm our reputation if our regulatory services are deemed inadequate.
In addition, our registered broker-dealer subsidiary, BATSBats Trading, is subject to regulation by the SEC, FINRA and other SROs. As a registered broker-dealer, BATSBats Trading is subject to regulations concerning all aspects of its business, including trading practices, order handling, best execution, anti-money laundering, handling of material non-public information, safeguarding data, reporting, record retention, market access and the conduct of its officers, employees and other associated persons. In addition, BATSBats Trading is subject to regulatory requirements intended to ensure its general financial soundness and liquidity, which require that it comply with certain minimum capital requirements. The
SEC and FINRA impose rules that require notification when a broker-dealer's net capital falls below
certain predefined criteria, dictate the ratio of debt to equity in the regulatory capital composition of a broker-dealer and constrain the ability of a broker-dealer to expand its business under certain circumstances. Additionally, the SEC's uniform net capital rule and FINRA rules impose certain requirements that may have the effect of prohibiting a broker-dealer from distributing or withdrawing capital and requiring prior notice to the SEC and FINRA for certain withdrawals of capital. Any failure to comply with applicable broker-dealer regulations could have a material adverse effect on the operation of our business, financial condition and operating results.
Our European securities business is subject to regulatory oversight in the United Kingdom by the FCA, which through the "passporting" process provides authorization to carry on business in other EEA member states. The authorities may revoke this authorization if we do not suitably carry out our regulated business activities. The authorities are also entitled to request that we adopt measures in order to ensure that we continue to fulfill the authorities' requirements. Any failure by us to meet these requirements or any revocation by the authorities of our authorization to carry on business in other EEA member states would materially affect our ability to operate a trading venue on a pan-European basis and could adversely affect our business, financial condition and results of operations. We currently operate both an RIE and a routing broker in the United Kingdom.
In addition, the regulatory authorities in certain foreign jurisdictions may require securities exchanges to be named on certain designated exchange lists maintained by such authorities. The failure of any of our exchanges to be named on any such list may make it difficult for certain foreign investors to invest, or prevent certain foreign investors from investing, in our listed securities, which may put our listings business in such jurisdictions at a competitive disadvantage compared to other securities exchanges that have been named on such designated exchange's lists. Failure to comply with the applicable foreign regulations may also subject us or our customers in such jurisdictions to regulatory actions or other legal proceedings that could lead to fines or other penalties.
We have self-regulatory obligations that may create conflicts of interests.
We have obligations to regulate and monitor activities in our markets and ensure compliance with applicable law and the rules of our markets by market participants. In the United States, the SEC and others have expressed concern about potential conflicts of interest of "for-profit" markets performing the regulatory functions of an SRO. For example, we are responsible for identifying possible violations of the securities laws by our members and taking regulatory action against those members if such violations are confirmed. Although our U.S. exchanges outsource certain of their regulatory functions to FINRA, we could be conflicted in pursuing such regulatory actions against our customers because to do so could result in a loss of trading volumes on our markets. Any failure by us to diligently and fairly regulate our markets or to otherwise fulfill our regulatory obligations could significantly harm our reputation, prompt SEC scrutiny and adversely affect our business and reputation.
Our ability to implement or amend rules could be limited or delayed because of regulatory oversight, review or approval, which could negatively affect our ability to implement needed changes or expand our products or services.
Our exchanges registered with the SEC must submit proposed rule changes to the SEC for its review and, in many cases, its approval. Even where a proposed rule change may be effective upon filing with the SEC, the SEC retains the right to suspend and disapprove such rule changes. The rule review process can be lengthy and can significantly delay the implementation of proposed rule changes that we believe are necessary to the operation of our markets. If the SEC delays or does not allow one of our exchanges to implement a rule change, this could negatively affect our ability to make needed changes or implement business activities. In addition, we must compete with ATSs that are not subject to the same SEC approval process and therefore may have lower regulatory and surveillance costs than us. There is a risk that other trading venues will be able to charge lower fees than us because they
spend significantly less on regulation, attracting trading to those venues. The SEC has also been actively enforcing exchanges' compliance with these requirements, including entering an order against EDGX and EDGA for alleged failures to properly maintain SEC-approved rules relating to all of its order types. See "—Failures in our compliance systems could subject us to significant legal and regulatory costs. Furthermore, if our risk management methods are not effective, our business, reputation and financial results may be adversely affected."
Similarly, the SEC must approve amendments to our exchange subsidiaries' certificates of incorporation and bylaws, as well as certain amendments to our certificate of incorporation and bylaws. The SEC may decide not to approve a proposed amendment or may delay such approval in a manner
that could negatively affect our ability to make a desired change, which could prevent or delay us from improving the operations of our markets or recognize income from new products.
We depend on third-party service providers for certain services that are important to our business. An interruption or cessation of such service by any third-party could have a material adverse effect on our business.
We depend on a number of service providers, including but not limited to, banking and clearing organizations such as the National Securities Clearing Corporation, or NSCC, and the OCC, and its member clearing firms; LCH.Clearnet Group, EuroCCP, SIX x-clear AG; data center providers such as Equinix, which hosts our primary data centers in the United States and Europe, and CenturyLink, which hosts our backup data center in the United States; the Consolidated Tape Association, or CTA, and the Options Price Reporting Authority, LLC, or OPRA; and various vendors of communications and networking products and services.
We also rely on third-party broker-dealers for routing and clearing services in certain circumstances. Specifically, we may route an order from a customer away from our markets to another trading venue if there is insufficient liquidity on our markets to match the order and/or if the customer is utilizing one of our smart-order routing strategies. We may use a third-party broker-dealer to establish back-up connectivity to another exchange in the event that our connection to such exchange fails, because we do not have a direct connection to such exchange or to take advantage of tiered pricing rates at such exchange. Once we (or such third-party) fill an order on another market, the executed trade is sent to a clearing broker to match the details of the trade with the clearing broker for the other party to the trade. We rely on affiliates of Bank of America Merrill Lynch, Citigroup, Morgan Stanley, Wedbush Securities, Credit Suisse and Lime Brokerage, each of which is an affiliate of one of our principal investors, to route orders that are not routed directly by us and to clear certain trades routed to other markets.
In addition, we currently rely on FINRA to perform certain regulatory functions on our behalf pursuant to a regulatory services agreement, or RSA, which we entered into in 2014. Under the RSA, we maintain ultimate responsibility for the regulatory activities.
We cannot assure you that any of these providers will be able to continue to provide these services in an efficient manner or that they will be able to adequately expand their services to meet our needs. An interruption or malfunction in or the cessation of an important service by any third-party and our inability to make alternative arrangements in a timely manner, or at all, could have a material adverse impact on our business, financial condition and operating results.
Financial or other problems experienced by third parties could have an adverse effect on our business.
We are exposed to credit risk from third parties, including customers, clearing agents and counterparties. For example, we are exposed to credit risk for transaction fees we bill to customers on a monthly basis in arrears. Our customers and other third parties may default on their obligations to us due to lack of liquidity, operational failure, bankruptcy or other reasons.
In addition, with respect to orders BATSBats Trading routes to other markets for execution on behalf of our customers, BATSBats Trading is exposed to some counterparty credit risk in the case of failure to perform on the part of our clearing firms, Wedbush Securities, Bank of America Merrill Lynch or Morgan Stanley, as well as failure on the part of our routing brokers (e.g., Morgan Stanley, Credit Suisse, NASDAQ, Lime Brokerage and Bank of America Merrill Lynch) to pass back transactional rebates. Wedbush Securities, Bank of America Merrill Lynch and Morgan Stanley guarantee trades until one day after the trade date, after which time NSCC provides a guarantee. Thus, BATSBats Trading is potentially exposed to credit risk to the counterparty to a trade routed to another market center between the trade date and one day after the trade date in the event that Wedbush Securities, Bank of America Merrill Lynch or Morgan Stanley fails to perform.
With respect to U.S. equities, BATSBats Trading has counterparty credit risk exposure to Wedbush Securities and Morgan Stanley related to clearing until the day following the trade date. BATSBats Trading uses Wedbush Securities to clear trades routed through Credit Suisse as well as for trades routed directly to other exchanges and optionally dark pools. Morgan Stanley clears trades routed through the Morgan Stanley routing brokers and also clears executions routed to most dark pools. BATSBats Trading maintains counterparty credit risk exposure from routing brokers (i.e., Morgan Stanley, Credit Suisse, NASDAQ) with respect to rebates earned until completion of the routing brokers next invoice cycle following the execution.
BATSBats Trading is subject to counterparty credit risk exposure from Wedbush Securities and Bank of America Merrill Lynch related to U.S. listed equity options until the day following the trade date. For U.S. listed equity options, BATSBats Trading uses Wedbush Securities to clear trades routed through Lime Brokerage as well as trades sent directly to another exchange. Bank of America Merrill Lynch is used to clear trades routed through its own routing broker. Counterparty credit risk also exists with respect to rebates earned from routing brokers (Lime Brokerage and Bank of America Merrill Lynch) until completion of the routing brokers' next invoice cycle has completed for an execution.
Our exposure to credit risk may be further impacted by volatile securities markets that may affect the ability of our customers and other third parties to satisfy their contractual obligations to us. Moreover, we may not be successful in managing our credit risk through reporting and control procedures or by maintaining credit standards. Any losses arising from such defaults or other credit losses could adversely affect our financial condition and operating results.
BATSBats Hotspot is not a counterparty to any FX transactions occurring on the BATSBats Hotspot Platform and it does not have any direct counterparty risk associated with such transactions. All transactions occurring on the BATSBats Hotspot Platform occur bilaterally between two banks or prime brokers as counterparties to the trade. While BATSBats Hotspot does not have direct counterparty risk, BATSBats Hotspot may suffer a decrease in transaction volume if a bank or prime broker experiences an event that causes other prime brokers to decrease or revoke the credit available to the prime broker experiencing the event. Therefore, BATSBats Hotspot may have risk that is related to the credit of the banks and prime brokers that trade FX on the BATSBats Hotspot Platform.
We may be required to inject further capital into EuroCCP.
BATSBats Trading Limited owns 25% of EuroCCP, a Dutch domiciled clearing house. EuroCCP is one of three interoperable central counterparties, or CCPs, used to clear trades conducted on BATS Chi-XBats Europe. If EuroCCP were to experience financial difficulties, BATS Chi-XBats Europe might be required to inject further capital into it in order to maintain its working or regulatory capital. In a worst case scenario, EuroCCP might have its regulatory license suspended or withdrawn, or it might have to wind down. This would result in a loss to BATS Chi-XBats Europe of its investment in EuroCCP and a withdrawal of EuroCCP as a clearing house to the BATS Chi-XBats Europe markets.
We may be required to assume ownership of a position in securities in connection with our order routing service, which could subject us to trading losses when we dispose of that position.
We offer a smart-order routing service through our broker-dealer subsidiary, BATSBats Trading, which provides our customers with access to other market centers when we route their orders to those market centers for execution. In connection with this service, however, we may assume ownership of a position in securities. This may occur, for example, when a market center to which we have routed a customer's order experiences systems problems and is unable to determine the status of that order. When this happens, we may make a business decision to provide a cancellation notice to our customer, relieving our customer of any liability with respect to the order. We may be informed later, however, that the order was executed at the market center to which we routed it, in which case BATSBats Trading would be required to take ownership of that securities position. Our clearing brokers, Wedbush Securities, Bank of America Merrill Lynch and Morgan Stanley, maintain error accounts on behalf of BATSBats Trading
into which such positions settle, and we require the respective clearing broker to trade out of those positions as expeditiously as possible, which could result in our incurring trading losses.
Current economic conditions could adversely affect our business and financial condition.
Our business performance is impacted by a number of factors, including general economic conditions and other factors that are generally beyond our control. A long-term continuation of challenging economic conditions is likely to negatively impact our business. Poor economic conditions may result in a decline in trading volume and a reduction in the demand for our products and could affect the ability of our customers to meet their obligations to us.
Securities market data revenues may also be significantly affected by global market conditions. Adverse market conditions may cause reductions in the number of recipients of our market data.
Securities and FX trading volume is directly affected by economic, political and market conditions, broad trends in business and finance, unforeseen market closures or other disruptions in trading, the level and volatility of interest rates, inflation, changes in price levels of securities and the overall level of investor confidence. In recent years, trading volumes across our markets have fluctuated significantly depending on market conditions and other factors beyond our control. In addition, trading volume in a particular stock could be negatively impacted by a significant reverse stock split which materially reduces the number of shares of such stock in the market. It is not possible to accurately forecast volatility or trading volumes. Because a significant percentage of our revenue is tied directly to the volume of securities traded on our markets, it is possible that a general decline in trading volumes could lower revenues and may adversely affect our operating results if we are unable to offset falling volumes through increased market share or other pricing actions.
In Europe, countries such as Portugal, Ireland, Italy, Greece and Spain have been particularly affected by the recent financial and economic conditions. The European Union, the European Central Bank and the International Monetary Fund have prepared rescue packages for some of the affected countries. Other Euro-zone countries have been forced to take actions to mitigate similar developments in their economies. We cannot predict with any certainty whether these packages or other rescue plans will ultimately be successful or the effect that they may have on our business, results of operations, cash flows and financial condition.
Fluctuations in our quarterly operating results may negatively affect the valuation of our common stock.
Our business experiences seasonal fluctuations, reflecting reduced trading activity generally during the third quarter of each year and during the last month of theeach year. In addition, the financial services
industry is risky and unpredictable and is directly affected by many national and international factors beyond our control, including:
Any one of these factors could have a material adverse effect on our business, financial condition and operating results by causing a substantial decline in the financial services markets and reducing trading volumes. As a result, it is possible that our operating results or other operating metrics may fail to meet the expectations of stock market analysts and investors. If this happens, the market price of our common stock may be adversely affected.
The occurrence or perception of unauthorized disclosure of confidential information could harm our business.
In the course of our business, we receive, process, transmit and store confidential information. Our treatment of such information is subject to contractual restrictions. While we take measures to protect against unauthorized access to such information, these measures may be inadequate, and any failure on our part to protect this information may subject us to contractual liability and damages, loss of business, penalties and unfavorable publicity. Even the mere perception of a security breach or inadvertent disclosure of confidential information could harm our reputation. The occurrence of any of these events could have an adverse effect on our business.
Our inability to protect our intellectual property rights and claims by others that we infringe their intellectual property rights could adversely affect our business.
To protect our intellectual property rights, we rely on a combination of trademark and copyright laws in the United States and similar laws in other countries, trade secret protection, confidentiality agreements and other contractual arrangements with our employees, customers and others. Despite these measures, any of our intellectual property rights could be challenged, invalidated, circumvented or misappropriated, and any application for registration of such rights could be denied. We may be unable to detect the unauthorized use of our proprietary information or take appropriate steps to enforce our intellectual property rights. Failure to protect our intellectual property adequately could harm our brand and affect our ability to compete effectively. Defending our intellectual property rights could result in the expenditure of significant financial and managerial resources, which could adversely affect our business, financial condition and operating results. Further, the laws of certain countries do not protect intellectual property rights to the same extent as the laws of the United States. Therefore, in certain jurisdictions, we may be unable to protect our intellectual property and proprietary technology adequately against unauthorized third-party copying or use, which could adversely affect our competitive position.
Although we own patents covering our proprietary business processes related to the BATSBats 1000 Index and our proprietary business processes related to our now defunct European market-on-close
product, as well as having filed patent applications further covering the administration of the BATSBats 1000 Index, our national best bid or best offer, or NBBO, Setter and Joiner pricing, our primary market auction, the business process related to operating an exchange based on the net asset value of an ETP, our CLP Program and our retail price improvement, or RPI, Program, we do not anticipate relying upon patents as a primary means of protecting our rights in our intellectual property. In any event, there can be no assurance that our patent applications will be approved, that any issued patents will adequately protect our intellectual property or that such patents will not be challenged by third parties.
Finally, third parties may claim that we or customers indemnified by us are infringing upon their intellectual property rights. Even if we believe that such claims are without merit, they can be time-consuming and costly to defend and divert management resources and attention. Successful claims of intellectual property infringement also might require us to redesign infringing technology, enter into costly settlement or license agreements, pay costly damage awards or face a temporary or permanent injunction prohibiting us from using infringing technology. If we are found to be infringing and cannot, or do not, license the infringed technology on reasonable pricing terms or at all, or substitute similar technology from another source, our business, financial condition and results of operations could be adversely impacted.
Our use of open source software code may subject our software to general release or require us to re-engineer our software, which could harm our business.
We have used open source software code to create our proprietary software for use in our business. Companies that incorporate open source software into their products have, from time to time, faced claims challenging the ownership of open source software. As a result, we could be subject to suits by parties claiming ownership of what we believe to be open source software. In addition, some open source software licenses require users who distribute open source software as part of their software to publicly disclose all or part of the source code in their software and make any derivative works of the open source code available on unfavorable terms or at no cost. Open source license terms may be ambiguous, and many of the risks associated with usage of open source software cannot be eliminated. We believe that our use of open source software is in compliance with the relevant open source software licenses and does not require disclosure of any of our source code. However, if we were found to have inappropriately used open source software, we may be required to release our proprietary source code, re-engineer or discontinue use of our software or take other remedial action.
We are subject to risks relating to litigation, potential securities law liability and other liability.
Many aspects of our business, including trading, market data services and listings, and the business of our members, potentially involve substantial liability risks. These risks include, among others, potential liability from disputes over terms of a trade and the claim that a system failure or delay caused monetary loss to a member or that an unauthorized trade occurred. For example, dissatisfied members that have traded on our electronic platform or those on whose behalf such members have traded, may make claims regarding the quality of trade execution, or allege improperly confirmed or settled trades, abusive trading practices, security and confidentiality breaches, mismanagement or even fraud against us or our members. In addition, because of the ease and speed with which sizable trades can be executed on our electronic platform, members can lose substantial amounts by inadvertently entering trade orders or by entering them inaccurately. A large number of significant error trades could result in member dissatisfaction and a decline in member willingness to trade in our electronic markets.
In addition, SROs such as BZX, BYX, EDGX and EDGA are required by federal law to perform a variety of functions that would otherwise be performed by a governmental agency. As such, and similar to sovereign immunity accorded to governments, U.S. federal courts have held that SROs are immune from civil damages for conduct undertaken as part of their statutorily delegated adjudicatory, regulatory and prosecutorial authority. This immunity, however, only covers certain of our activities in
the United States, and we could be exposed to liability under national and local laws, court decisions and rules and regulations promulgated by regulatory agencies.
Furthermore, in the United States, our securities markets are subject to oversight by the SEC. As a result, we could be subject to investigations and judicial or administrative proceedings that result in substantial penalties if we were found to be out of compliance with our obligations under the federal securities laws. Any such liability or penalties could have a material adverse effect on our business. We have from time to time received inquiries and investigative requests from the SEC's Office of Compliance Inspections and Examinations as well as the SEC's Division of Enforcement seeking information about our and our members' compliance with the federal securities laws. For example, in January 2015, the SEC completed two separate investigations into the development of order types, one related to BZX and BYX and another related to EDGX and EDGA. While the SEC concluded its investigation with no action taken with regards to BZX and BYX, the SEC accepted our offer of settlement with respect to EDGX and EDGA which included a monetary penalty and an agreement to implement certain measures aimed at preventing future violations of the Exchange Act and the rules and regulations promulgated thereunder.
From time to time we are also involved in various legal proceedings arising in the ordinary course of our business. While we do not believe that the outcome of any of these legal proceedings will have a material impact on our consolidated financial position, results of operations or cash flows, litigation is subject to many uncertainties, and the outcome of individual litigated matters is not predictable with assurance.
On April 18, 2014, the City of Providence, Rhode Island filed a securities class action lawsuit in the Southern District of New York against BATSBats and Direct Edge, as well as 14 other securities exchanges. The action purports to be brought on behalf of all public investors who purchased and/or sold shares of stock in the United States between April 18, 2009 and the present on a registered public stock exchange (Exchange Defendants) or a U.S.-based alternate trading venue and were injured as a result of the misconduct detailed in the complaint, which includes allegations that the defendants committed fraud through a variety of business practices associated with, among other things, what is commonly referred to as high frequency trading. On May 2, 2014 and May 20, 2014, American European Insurance Company and Harel Insurance Co., Ltd. each filed substantially similar class action lawsuits against the Exchange Defendants which were ultimately consolidated with the City of Providence, Rhode Island securities class action lawsuit. On June 18, 2015, Judge Jesse Furman of the Southern District of New York held oral argument on the pending Motion to Dismiss and thereafter, on August 26, 2015, the Court issued an Opinion and Order granting Defendant's Motion to Dismiss, dismissing the Complaint in full. Plaintiff filed a Notice of Appeal of the dismissal on September 24, 2015 and its appeal brief on January 7, 2016. Respondent's brief will be due on or before April 7, 2016.
On May 23, 2014 and May 30, 2014, Harold R. Lanier filed three class action lawsuits in the Southern District of New York against BATSBats and other securities exchanges. The complaints were identical in all substantive respects, but each related to the dissemination of market data under a different market system: (i) the NASDAQ Unlisted Trading Privileges, or UTP, Plan Market System; (ii) the OPRA Market System; and (iii) the Consolidated Quotation System, or CQS, and the Consolidated Tape System, or CTS. Each of the actions purported to be brought on behalf of all subscribers who entered into contracts with the exchanges for the receipt of market data and were injured as a result of the misconduct detailed in the complaints, which includes allegations that the defendants did not provide market data services in a non-discriminatory manner or provide subscribers with "valid" data (i.e., data that is accurate and not stale). On January 16, 2015, Judge Katherine Forrest of the Southern District of New York held oral argument on the pending Motion to Dismiss and thereafter, on April 28, 2015, the Court filed an Opinion and Order granting the Exchange Defendants' Motion to Dismiss, terminating all three class action lawsuits with prejudice. On May 20, 2015, Plaintiff filed a Notice of Appeal of the dismissal and on September 1, 2015, Appellant filed its
appeal brief. Respondent's brief was filed on November 24, 2015 and Appellant's reply brief was filed on December 8, 2015. Oral argument has been scheduled forarguments were held on March 3, 2016.
In addition to potential sanctions, censure, monetary penalties and disruption of our business, an investigation, inquiry, regulatory enforcement action and the related publicity could impair our reputation and damage our brand name, particularly with our members and other market participants. This could result in a decrease of our share of total trading volumes relative to our competitors, which may make us less attractive to market participants as a source of liquidity and cause us to lose additional trading volume and associated fees, which would adversely affect our business, reputation, financial condition and operating results.
Our European business is subject to regulatory oversight in the United Kingdom by the FCA, which through the "passporting" process provides authorization to carry on business in other EEA member states. In addition, our operations are regulated at the European Union level. If a regulatory authority makes a finding of non-compliance, conditional fines could be imposed, and our licenses could be revoked. Any such fine or revocation of a license could have a material adverse effect on our business.
Failures in our compliance systems could subject us to significant legal and regulatory costs. Furthermore, if our risk management methods are not effective, our business, reputation and financial results may be adversely affected.
Our ability to comply with all applicable laws and rules is largely dependent on our establishment and maintenance of compliance, audit, risk and reporting systems and procedures, as well as our ability to attract and retain qualified compliance, audit and risk management personnel. These systems and procedures may not be fully effective. We face the risk of intervention by regulatory authorities, including extensive examination and surveillance activity. In the case of actual or alleged non-compliance with applicable laws or regulations, we could be subject to investigations and judicial or administrative proceedings that may result in substantial penalties, settlements or civil lawsuits, including by customers, for damages, which can be substantial. In the past, the SEC has brought actions against exchange operators for failing to fulfill their obligations to have an effective regulatory system. Any failure to comply with applicable laws and rules could adversely affect our business, reputation, financial condition and operating results and, in extreme cases, our ability to conduct our business or portions thereof.
Additionally, we have adopted policies and procedures to identify, monitor and manage our risks. For example, our Global Policy for Enterprise Risk Management, or ERM, adopts a framework for identifying and managing risks in both our U.S. and European operations. In the U.S., the ERM framework is overseen by the U.S. exchanges' Audit Committee, as well as the company's Audit Committee, and ultimately the company's board of directors. The ERM framework is also periodically reviewed by the SEC's Office of Compliance Inspections and Examinations as part of routine inspections. The policy created a firm-wide risk committee that regularly reviews known and emerging risks, as well as the maintenance of the risk register. The European ERM framework is overseen by the BATSBats Trading Limited Audit, Risk and Compliance Committee as well as the company's Audit Committee, and ultimately the company's board of directors. The FCA has also reviewed and approved the framework and maintains continuous dialogue with European executive management on risk-related matters. The framework has been in place formally since January 2013 and, in addition to the policy and strategy, comprises a risk appetite statement and risk register. We also maintain a vendor management policy that is intended to both manage the business relationships and mitigate the risks associated with utilizing outside vendors and other third-party service providers. We employ a vendor risk tool to facilitate this process.
These policies and procedures, however, may not be fully effective. If our policies and procedures are not fully effective or we are not always successful in monitoring or evaluating the risks to which we are or may be exposed, our business, reputation, financial condition and operating results could be materially adversely affected.
Damage to our reputation could have a material adverse effect on our business.
We believe one of our competitive strengths is our strong industry reputation. Various issues may give rise to reputational risk, including issues relating to:
Damage to our reputation could cause a reduction in the trading volume on our exchanges or cause us to lose customers. This, in turn, may have a material adverse effect on our business, financial condition and operating results.
Because we have operations outside of the United States, we are exposed to currency risk.
We have operations in the United States, the United Kingdom, continental Europe and Singapore. We therefore have significant exposure to exchange rate movements between the British pound, the Euro, the Singapore dollar and the U.S. dollar. Significant inflation or changes in foreign exchange rates with respect to one or more of these currencies could occur as a result of general economic conditions, acts of war or terrorism, changes in governmental monetary or tax policy or changes in local interest rates. These exchange rate differences will affect the translation of our non-U.S. results of operations and financial condition into U.S. dollars as part of our consolidated financial statements.
Changes in tax laws, regulations or policies could have a material adverse effect on our financial results.
Like other corporations, we are subject to taxes at the federal, state and local levels, as well as in non-U.S. jurisdictions. Changes in tax laws, regulations or policies could result in us having to pay higher taxes, which would in turn reduce our net income. For example, in 2015, our tax liability
increased as a result of legislative changes in New York and New York City. In computing our tax obligation in federal, state and local and non-U.S. jurisdictions, we take various tax positions on matters that are not entirely free from doubt. We cannot assure you that upon review of these positions the applicable tax authorities will agree with our positions. A successful challenge by a tax authority could result in additional taxes being imposed on us.
The requirements of being a public company may strain our resources, divert management's attention and affect our ability to attract and retain qualified board members.
As a public company, we will be subject to the reporting requirements of the Exchange Act, the Sarbanes-Oxley Act of 2002, or the Sarbanes-Oxley Act, and BZX listing requirements. The requirements of these rules and regulations will increase our legal and financial compliance costs, make some activities more difficult, time-consuming or costly and may also place undue strain on our systems and resources. The Exchange Act requires, among other things, that we file annual, quarterly and current reports with respect to our business and financial condition. The Sarbanes-Oxley Act requires, among other things, that we maintain effective disclosure controls and procedures and internal controls for financial reporting. Our management will be required to report on the effectiveness of our internal control over financial reporting and our independent registered public accounting firm will be required to attest to such internal control over financial reporting. In order to maintain and improve the
effectiveness of our disclosure controls and procedures and internal control over financial reporting, significant resources and management oversight will be required. As a result, management's attention may be diverted from other business concerns, which could have a material adverse effect on our business, financial condition and results of operations. Failure to maintain an effective internal control environment could result in our not being able to accurately report our financial results, prevent or detect fraud or provide timely and reliable financial information pursuant to the reporting obligations we will have as a public company, which could have a material adverse effect on our business, financial condition and results of operations. Further, it could cause our investors to lose confidence in the financial information we report, which could adversely affect the price of our common stock.
These rules and regulations could also make it more difficult for us to attract and retain qualified independent members of our board of directors. Additionally, we expect these rules and regulations to make it more difficult and more expensive for us to obtain director and officer liability insurance. We may be required to accept reduced coverage or incur substantially higher costs to obtain coverage.
Risks Relating to Our Indebtedness
We have a substantial amount of debt and the cost of servicing those obligations could adversely affect our business, financial condition or operating results and such risk could increase if we incur more debt. We may be required to prepay our obligations.
We have a substantial amount of indebtedness and other liabilities. As of September 30,December 31, 2015, total liabilities were $924.8$937.0 million, of which $737.2$687.5 million represents long-term debt obligations, total assets were $1,288.8$1,316.9 million and total equity was $364.0$379.9 million. As of December 31, 2014, total liabilities were $702.4 million, of which $474.4 million represents long-term debt obligations, total assets were $1,006.6 million and total equity was $304.2 million. We may not have sufficient funds to satisfy all such obligations as a result of a variety of factors, some of which may be beyond our control. If the opportunity for a strategic acquisition arises, we may be required to incur additional debt for these purposes or to fund working capital needs, which we may not be able to obtain. The amount of debt we carry and the terms of our indebtedness could adversely affect us in several ways, including:
In the event that we fail to comply with the covenants in any current or future loan agreements, there could be an event of default under the applicable instrument. As a result, all amounts outstanding under our current or any future debt instruments may become immediately due and payable. If interest rates were to increase significantly or if we are unable to generate sufficient cash flow from operations in the future, we may not be able to service debt under any current or future loan agreements and may have to refinance all or a portion of our debt, structure our debt differently, obtain additional financing or sell assets to repay such debt.
Restrictive covenants in our credit facility may adversely affect us. Our credit facility requires us not to have a debt to earnings ratio above certain amounts as set forth in the credit facility.
Our ability to secure additional financing for growth or to refinance any of our existing debt is also dependent upon the availability of credit in the marketplace, which has experienced severe disruptions due to the recent economic crisis. If we are unable to secure additional financing or such financing is not available at acceptable terms, we may be unable to secure financing for growth or refinance our debt obligations, if necessary.
In the event that we need debt financing in the future, recent uncertainty in the credit markets could affect our ability to obtain debt financing on reasonable terms.
In the event we were to require additional debt financing in the future, the ongoing uncertainty in the credit markets, including the European sovereign debt crisis, could materially impact our ability to obtain debt financing on reasonable terms. The inability to access debt financing on reasonable terms could materially impact our ability to make acquisitions, refinance existing debt or materially expand our business in the future.
Increases in interest rates will adversely impact our results of operations.
For the approximately $800$700 million amount outstanding under our current credit facility, as well as borrowings incurred under our revolving credit facility, increases in variable interest rates will increase the amount of interest expense that we pay for our borrowings and have a negative impact on our results of operations. As of September 30,December 31, 2015, the one-month London Interbank Offered Rate, or LIBOR, was 0.193%0.430%. Any increase in the LIBOR will increase our interest expense on approximately $737.2$121.9 million of debt. If the LIBOR were to exceed the floor interest rate of 1.00%, we would incur a negative impact of higher interest expense on the remaining balance of our debt.
Any reduction in our credit rating could increase the cost of our funding from the capital markets.
Our long-term debt is currently rated speculative grade by two of the major rating agencies. These rating agencies regularly evaluate us and their ratings of our long-term debt are based on a number of factors, including our financial strength as well as factors not entirely within our control, including
conditions affecting the financial services industry generally. There can be no assurance that we will maintain our current ratings. Our failure to maintain those ratings could adversely affect the cost and other terms upon which we are able to obtain future funding and increase our cost of capital.
Risks Relating to an Investment in Our Common Stock
Volatility in our stock price could adversely affect your investment in our common stock.
There has not been a public market for our stock prior to this offering. We cannot predict the extent to which a trading market for our common stock will develop or how liquid that market might become. If you purchase shares of common stock in this offering, you will pay a price that was not established in the public trading markets. The initial public offering price will be determined by negotiations between us, the underwriters and the selling stockholders. You may not be able to resell your shares above the initial public offering price and may suffer a loss on your investment.
Broad market and industry factors may adversely affect the market price of our common stock, regardless of our actual operating performance. Factors that could cause fluctuations in our stock price may include, among other things:
We plan to list our security on our own market, BZX. Any technical failures or outages associated with that listing could negatively impact our stock and subject us to reputational harm and regulatory scrutiny, and a loss of business.
Upon completion of the offering, we plan to list our security on our own exchange, BZX. Our security will be the first corporate listing on BZX and to the extent we suffer a technological failure or outage associated with that listing, we could suffer a loss of business, and incur reputational harm and regulatory scrutiny and potentially regulatory sanctions. In addition, such a failure or outage could result in the cancellation of the offering. For example, on March 23, 2012, we experienced a serious technical failure on BZX, forcing us to cancel our planned IPO. The failure resulted from a software bug that appeared during the BATSBats IPO auction. In addition to forcing us to cancel our IPO, the technological failure played a role in the halting of another issuer's stock for five minutes. Ultimately, the technological failure caused us to withdraw our IPO, which was a widely reported, high-profile event that damaged our reputation and resulted in increased regulatory scrutiny of the event by the
SEC and other governmental authorities. We have since investigated that incident and adopted various policy and procedure enhancements, including implementation of an independent software quality assurance department, but there can be no guarantee that we will not suffer a similar failure in conjunction with this planned offering of securities. Moreover, we are inexperienced with overseeing the additional operational and regulatory issues associated with corporate listings. To the extent we suffer an operational or regulatory failure associated with our listing of BATSBats or another corporate listing, we could damage our reputation and subject ourselves to increased regulatory scrutiny by the SEC and other governmental authorities.
We will be controlled by our principal investors, whose interests may differ from those of other stockholders.
Upon completion of this offering, our principal investors will collectively own approximately 72,000,805 shares of our common stock and 7,980,017 shares of our non-voting common stock, representing approximately %82.1% of the total voting power of our capital stock. We are not a party to any voting agreement with any of our stockholders, other than the Investor Rights Agreement dated as of January 31, 2014, among us and our stockholders (which, pursuant to its terms, will terminate upon consummation of this offering, except for the registration rights contained therein), which we refer to as the Investor Rights Agreement, and we are not aware of any other voting agreements among our principal investors; however, they may enter into voting agreements in the future or otherwise vote in a similar manner. To the extent that all of these principal investors vote similarly, they will be able, by virtue of their ability to elect our board of directors, to control our policies and operations, including, without limitation, the determination of our strategic plans, appointment of management, future
issuances of our common stock or other securities, the payments of dividends on our capital stock, entering into extraordinary transactions and the approval of major financing decisions, and their interests may not in all cases be aligned with your interests. This concentrated control will limit your ability to influence corporate matters. As a result, the market price of our common stock could be adversely affected.
Affiliates of our principal investors are also significant customers. See "Certain Relationships and Related Transactions." As a result, the interests of these investors could conflict with your interests as holders of our common stock in a number of ways. For example:
Accordingly, our principal investors may have different business objectives, any of which could adversely impact the market price of your shares of common stock.
Certain affiliates of the underwriters of this offering are our principal investors, some of which are also selling stockholders, and therefore, they have interests in this offering beyond customary underwriting discounts and commissions.
Each of Morgan Stanley & Co. LLC, Citigroup Global Markets Inc., Credit Suisse Securities (USA) LLC, J.P. Morgan Securities LLC, Merrill Lynch, Pierce, Fenner & Smith Incorporated,
Goldman, Sachs & Co. and Nomura Securities International, Inc., who are underwriters of this offering, is an affiliate of one of our principal investors. Certain affiliates of the underwriters of this offering are participating as selling stockholders in this offering. There may be a conflict of interest between their interests as selling stockholders (e.g., to maximize the value of their investment) and their respective interests as underwriters (e.g., in negotiating the initial public offering price) as well as your interest as a purchaser. As affiliates of participants in this offering that may seek to realize the value of their investment in us, these underwriters could have interests beyond customary underwriting discounts and commissions. See "Certain Relationships and Related Transactions—Underwriters (Conflicts of Interest)." Merrill Lynch, Pierce, Fenner & Smith Incorporated, Citigroup, Goldman, Sachs & Co., Jefferies LLC and Nomura Securities International, Inc., underwriters of this offering, or their affiliates (as defined in FINRA Rule 5121), will each receive more than 5% of net offering proceeds and will have a "conflict of interest" pursuant to FINRA Rule 5121(f)(5)(C)(ii). Accordingly, this offering will be made in compliance with the applicable provisions of FINRA Rule 5121. Pursuant to FINRA Rule 5121, a "qualified independent underwriter" (as defined in FINRA Rule 5121) must participate in the preparation of the prospectus and perform its usual standard of due diligence with respect to the prospectus. Sandler O'Neill & Partners, L.P. has agreed to act as qualified independent underwriter for the offering and to perform a due diligence investigation and review and participate in the preparation of the prospectus. Although the qualified independent underwriter has participated in the preparation of the prospectus and conducted due diligence, we cannot assure you that this will adequately address any potential conflicts of interest. See "Underwriters (Conflicts of Interest)."
If securities or industry analysts do not publish research or reports about us, or if they adversely change their recommendations regarding our common stock, then our stock price and trading volume could decline.
The trading market for our common stock will be influenced by the research and reports that industry or securities analysts publish about us, our industry and our markets. If no analyst elects to cover us and publish research or reports about us, the market for our common stock could be severely limited, and our stock price could be adversely affected. In addition, if one or more analysts ceases coverage of us or fails to regularly publish reports on us, we could lose visibility in the financial markets, which in turn could cause our stock price or trading volume to decline. If one or more analysts who elect to cover us adversely changes their recommendations regarding our common stock, our stock price could decline. In addition, SEC rules may make it impractical for analysts associated with some of our principal investors to cover us.
Our share price may decline due to the large number of shares eligible for future sale.
Sales of substantial amounts of our common stock, or the possibility of such sales, may adversely affect the market price of our common stock. These sales may also make it more difficult for us to raise capital through the issuance of equity securities at a time and at a price we deem appropriate. See "Shares Eligible for Future Sale" for a discussion of possible future sales of common stock.
Upon completion of this offering, we will have 87,699,410 shares of common stock and 7,980,017 shares of non-voting common stock outstanding. Shares of non-voting common stock are convertible into common stock at the option of the holder in connection with any "qualified transfer." See "Description of Capital Stock." Of these shares, the 11,200,000 shares of common stock sold in this offering will be freely transferable without restriction or registration under the Securities Act of 1933, as amended, or the Securities Act, except for any shares purchased by one of our existing "affiliates," as that term is defined in Rule 144 under the Securities Act. In addition, all of our executive officers and directors and the holders of substantially all of our capital stock are subject to lock-up agreements with the underwriters of this offering that restrict such persons' ability to transfer shares of our common stock for periods of at least 180 days, and for a portion of the shares, 360 and 540 days, from the date of this prospectus. The remaininglock-up agreements limit the number of shares of common stock that
may be sold immediately following this offering. Approximately 35,014,040 shares will be availablebecome eligible for sale inupon expiration of the public market within 180 days or one year, as applicable.180-day lock-up period, approximately 27,659,993 additional shares will become eligible for sale upon expiration of the 360-day lock-up period and approximately 27,660,022 additional shares will become eligible for sale upon expiration of the 540-day lock-up period. See "Shares Eligible for Future Sale."
In addition to outstanding shares eligible for sale, upon completion of this offering, we intend to file a registration statement under the Securities Act covering all 6,984,754 shares of common stock subject to outstanding options or issuable pursuant to our stock option plans.equity incentive plans as of December 31, 2015. Shares registered under such registration statement will be available for sale in the open market, subject to vesting restrictions and/or exercise and other restrictions. See "Shares Eligible for Future Sale—Stock Options."
Additionally, the Investor Rights Agreement provides for certain registration rights, including demand registration rights. For a more detailed description of these registration rights, see "Description of Capital Stock—Registration Rights."
Upon completion of this offering, our principal investors will collectively own approximately 72,000,805 shares of our common stock and 7,980,017 shares of our non-voting common stock, representing approximately %82.1% of the total voting power of our capital stock. See "Principal and Selling Stockholders."
Your ownership of our company may be diluted if additional capital stock is issued to raise capital, to finance acquisitions, in connection with strategic transactions or pursuant to stock options or other equity compensation awards.
We may seek to raise additional funds, finance acquisitions or develop strategic relationships by issuing equity or convertible debt securities, which would reduce the percentage ownership of existing stockholders. As of September 30,December 31, 2015, after giving effect to the reclassification and stock split, 668,7541,946,038 shares of common stock were issuable upon the exercise of outstanding stock options, and an aggregate of 811,655 shares6,984,754 of common stock were reserved for future issuance under our equity
incentive plans. In addition, as of September 30,December 31, 2015, after giving effect to the reclassification and stock split, 32.8 million95,679,427 shares of common stock and non-voting common stock were outstanding, which included 275,586887,778 shares of unvested restricted stock. Shares of non-voting common stock are convertible into common stock at the option of the holder in connection with any "qualified transfer." See "Description of Capital Stock." Our board of directors has the authority, without action or vote of the stockholders, to issue all or any part of our authorized but unissued shares of common stock, non-voting common stock or preferred stock, including pursuant to stock options or other equity compensation awards. Following our reclassification and -for-1-for-2.91 stock split, 278,509,852 shares of common stock, 16,847,842 shares of non-voting common stock and 43,500,000 shares of preferred stock will be authorized and unissued under our amended and restated certificate of incorporation. Future issuances of common stock or non-voting common stock would reduce your influence over matters on which stockholders vote and would be dilutive to earnings per share, as applicable. In addition, any newly issued preferred stock could have rights, preferences and privileges senior to those of our common stock and non-voting common stock. Those rights, preferences and privileges could include, among other things, the establishment of dividends that must be paid prior to declaring or paying dividends or other distributions to holders of our common stock and non-voting common stock or greater or preferential liquidation rights, which could negatively affect the rights of holders of our common stock.
Provisions in our amended and restated certificate of incorporation and bylaws, Delaware law and FINRA rules might discourage, delay or prevent a change of control of our company or changes in our management and, therefore, depress the trading price of our common stock.
Pending approval by the SEC of amendments to our certificate of incorporation and bylaws pursuant to the rule filing process under Section 19(b) of the Exchange Act, ourOur organizational documents will contain provisions that may have the effect of discouraging or delaying a change in control of us or unsolicited acquisition proposals that a stockholder might consider favorable. These provisions generally include:
In addition, Section 203 of the Delaware General Corporation Law may delay or prevent a change in control of our company. Section 203 imposes certain restrictions on mergers, business combinations and other transactions between us and holders of 15% or more of our common stock. Anti-takeover
provisions could depress the price of our common stock by acting to delay or prevent a change in control of our company.
Further, BATSBats Trading is a member of FINRA and subject to FINRA rules, which could impede or delay a change of control. FINRA's NASD Rule 1017 generally provides that FINRA approval must be obtained in connection with any transaction resulting in a single person or entity acquiring, directly or indirectly, 25% or more of a FINRA member firm's or its parent company's equity. Our European subsidiaries, BATSBats Trading Limited and Chi-X Europe Limited, are also regulated by the FCA in the United Kingdom, as an RIE and an Authorised Firm, respectively, and are also subject to change in control rules. FCA approval must be obtained for any transaction that would result in a single person or entity acquiring, directly or indirectly, 20% of BATS Chi-XBats Europe or 10% of Chi-X Europe Limited, including through ownership of its parent company's equity.
The existence of the foregoing provisions and anti-takeover measures could limit the price that investors might be willing to pay in the future for shares of our common stock. They could also deter potential acquirers of our company, thereby reducing the likelihood that you could receive a premium for your common stock in an acquisition. See "Description of Capital Stock—Certain Provisions of Our Amended and Restated Certificate of Incorporation and Bylaws" for a discussion of these provisions.
Our amended and restated certificate of incorporation will provide that the Court of Chancery of the State of Delaware will be the exclusive forum for substantially all disputes between us and our stockholders, which could limit our stockholders' ability to obtain a favorable judicial forum for disputes with us or our directors, officers or employees.
Our amended and restated certificate of incorporation will provide that the Court of Chancery of the State of Delaware is the exclusive forum for any derivative action or proceeding brought on our behalf, any action asserting a breach of fiduciary duty, any action asserting a claim against us arising pursuant to the Delaware General Corporation Law, our certificate of incorporation or our bylaws or any action asserting a claim against us that is governed by the internal affairs doctrine. This choice of forum provision may limit a stockholder's ability to bring a claim in a judicial forum that it finds favorable for disputes with us or our directors, officers or other employees and may discourage these types of lawsuits. Alternatively, if a court were to find the choice of forum provision contained in our certificate of incorporation to be inapplicable or unenforceable in an action, we may incur additional costs associated with resolving such action in other jurisdictions.
We intend to pay dividends to our stockholders, but the decisions to declare future dividends on our capital stock will be at the discretion of our board of directors based upon a review of relevant considerations. Accordingly, there can be no guarantee that we will pay future dividends to our stockholders.
In 2012, our board of directors declared two cash dividend payments of $4.42 and $13.20 per share of outstanding common stock, which were paid in August and December 2012, respectively. In 2014, in accordance with our merger agreement to acquire Direct Edge, we made working capital distributions to stockholders of the company who held shares prior to the acquisition of $3.38 and $0.07 per share, which were paid in January and April 2014, respectively. In addition, in 2014, our board of directors declared cash dividend payments of $4.07, $0.15 and $0.15 per share of outstanding common stock.stock, which were paid in February 2014, October 2014 and January 2015, respectively. In 2015, in accordance with our merger agreement to acquire Direct Edge, we paid a $7.0 million indemnification liability distribution to stockholders of the company who held shares prior to the acquisition. Our board of directors did not declare any dividend payments in 2015. Future declarations of dividends and the establishment of future record and payment dates are subject to approval by our board of directors.
The board of directors is expected to adopt a policy with respect to the payment of dividends on capital stock following this offering. We currently expect that we will pay quarterly cash dividends following the offering, with the annual amount initially determined based on a payout ratio of earnings within a determined range.range of 30-40% of net income. Notwithstanding the current expectations for our future dividend policy, the timing, declaration, amount of, and payment of any dividends is within the discretion of the board of directors and will depend upon many factors, including our financial condition, earnings, corporate strategy, debt covenants, legal requirements, regulatory constraints, industry practice, ability to access capital markets and other factors deemed relevant by the board of directors. Any of these factors, individually or in combination, could restrict the company's ability to pay dividends. Accordingly, there can be no assurance that the board of directors will not reduce the amount of dividends or cause the company to cease paying dividends altogether.
SPECIAL NOTE REGARDING FORWARD-LOOKING STATEMENTS
We have made statements under the captions "Prospectus Summary," "Risk Factors," "Management's Discussion and Analysis of Financial Condition and Results of Operations," "Business" and in other sections of this prospectus that are forward-looking statements. In some cases, you can identify these statements by forward-looking words such as "may," "might," "will," "should," "expects," "plans," "anticipates," "could," "believes," "estimates," "predicts," "potential" or "continue," the negative of these terms and other comparable terminology. These forward-looking statements, which are subject to risks, uncertainties and assumptions about us, may include projections of our future financial performance, our anticipated growth strategies and anticipated trends in our business. These statements are only predictions based on our current expectations and projections about future events. There are important factors that could cause our actual results, level of activity, performance or achievements to differ materially from the results, level of activity, performance or achievements expressed or implied by the forward-looking statements, including those factors discussed under the caption entitled "Risk Factors." You should specifically consider the numerous risks outlined under "Risk Factors."
Although we believe the expectations reflected in the forward-looking statements are reasonable, we cannot guarantee future results, level of activity, performance or achievements. Moreover, neither we nor any other person assumes responsibility for the accuracy and completeness of any of these forward-looking statements. We are under no duty to update any of these forward-looking statements after the date of this prospectus to conform our prior statements to actual results or revised expectations.
Direct Edge Acquisition
On January 31, 2014, we acquired 100% of the ownership interests of Direct Edge through a merger with former Direct Edge members receiving 30% of equity interest in the newly formed combined company, BATSBats Global Markets, Inc. The results of Direct Edge's operations have been reflected in the U.S. Equities segment since January 31, 2014.
Direct Edge developed and operated electronic markets for the trading of listed cash equity securities in the United States. Direct Edge was headquartered in Jersey City, New Jersey and only had operations in the United States. Direct Edge operated two national securities exchanges, EDGX and EDGA, and also operated a routing broker-dealer, Direct Edge ECN LLC, d/b/a DE Route, providing routed transaction services for listed cash equity securities for EDGX and EDGA.
As of January 12, 2015, the EDGX and EDGA exchange operations were migrated onto the BATSBats technology platform, or Direct Edge Integration. In conjunction with the Direct Edge Integration, Direct Edge began routing all trades through the BATS'Bats' affiliated broker-dealer, BATSBats Trading, and no longer routed trades through DE Route, which is no longer registered as a broker-dealer and is no longer in operation.
Strategic rationale
We believe that our combination with Direct Edge will further our position as a leading global exchange operator. We expect to continue to benefit from synergies as a result of the acquisition, including the Direct Edge Integration, which was completed in the first quarter 2015. We believe the combination has improved our competitive position, enhanced our profitability through scale and cost efficiencies and provides us with additional opportunities to influence market structure developments for the benefit of our customers.
BATSBats Hotspot Acquisition
On March 13, 2015, we completed the acquisition of BATSBats Hotspot from KCG Holdings, Inc. for $365 million in cash at closing and additional contingent consideration payments with an acquisition-date fair value of $62.6 million. KCG Holdings, Inc. is one of our principal investors. The operations of BATSBats Hotspot are reflected in the Global FX segment since March 13, 2015. BATSBats Hotspot provides institutional spot FX services through an electronic marketplace where buyers and sellers worldwide can trade directly and anonymously with each other.
BATSBats Hotspot provides an independent, transparent electronic marketplace for institutional spot FX trading. The BATSBats Hotspot Platform includes true price competition with full depth of book display, centralized price discovery, tailored liquidity solutions to suit client needs, a diverse client base of banks, institutions, hedge funds, high frequency traders, corporates and Commodity Trading Advisors, direct and anonymous market access, multiple means of access and flexible real-time and historical market data services. BATSBats Hotspot's model provides full market transparency and greater control of the trading process, enabling better trade execution and lower execution costs. BATSBats Hotspot additionally offers separate, private pools of disclosed FX liquidity. Bats Hotspot was headquartered in Jersey City, New Jersey, and has operations in the United States, the United Kingdom and Singapore.
Strategic rationale
We believe that our acquisition of BATSBats Hotspot represents further expansion into non-equity trading businesses for BATSBats as it enters the world's largest asset class. Approximately half of the FX market is comprised of spot trading and the other half includes forwards, swaps and options. As BATSBats Hotspot only participates in the institutional spot market, product expansion into the other FX markets
is a significant opportunity. Large financial institutions comprise a portion of the FX trading market. As these institutions face increased regulatory pressure to provide greater transparency to their clients and to reduce their risk exposure, we expect more trading volume will migrate to electronic platforms, including BATSBats Hotspot. We believe there are geographic expansion opportunities for BATSBats Hotspot, which when acquired, operated in a data center located in Jersey City, New Jersey. We have recently expanded its operations by adding trading operations in London, United Kingdom, which is the largest trading center for the FX market. We also recently moved our technology into a stronger trading environment located in Secaucus, New Jersey that hosts a significantly larger number of overall trading participants. In addition to the product and geographic expansion opportunities noted above, we plan to explore additional non-transactional revenue sources including market data and connectivity charges.
UNAUDITED SELECTED PRO FORMA FINANCIAL DATA
The following unaudited selected pro forma financial data and explanatory notes are intended to provide information about how the Direct Edge Acquisition and BATSBats Hotspot Acquisition might have affected our historical consolidated statement of operations if they had it been consummated as of January 1, 2014.2015. An unaudited pro forma statement of financial condition as of September 30,December 31, 2015 is not presented, as Direct Edge and BATSBats Hotspot's statements of financial condition, including related acquisition adjustments, have already been included in our consolidated statement of financial condition and accompanying notes as of September 30,December 31, 2015 included elsewhere in this prospectus.
The following unaudited pro forma condensed combined financial data is provided for informational purposes only and does not necessarily reflect our results of operations or financial position had the acquisition occurred as of the date indicated, nor should it be taken as necessarily indicative of our future results of operation or financial position. The following unaudited pro forma condensed combined financial data should be read in conjunction with "Management's Discussion and Analysis of Financial Condition and Results of Operations" and our consolidated financial statements and the accompanying notes included elsewhere in this prospectus.
Unaudited Pro Forma Condensed Combined Statement of
Operations for the Nine MonthsYear Ended September 30,December 31, 2015 (under U.S. GAAP)
| | BATS Global Markets, Inc. (Historical) | KCG Hotspot FX (Historical)(1) | Pro Forma Adjustments(2) | BATS Global Markets, Inc. Pro Forma | Bats Global Markets, Inc. (Historical) | KCG Hotspot FX (Historical)(1) | Pro Forma Adjustments(2) | Bats Global Markets, Inc. Pro Forma | ||||||||||||||||||
|---|---|---|---|---|---|---|---|---|---|---|---|---|---|---|---|---|---|---|---|---|---|---|---|---|---|---|
| | (in millions, except per share data) | (in millions, except per share data) | ||||||||||||||||||||||||
Revenues: | ||||||||||||||||||||||||||
Transaction fees | $ | 970.1 | $ | 9.0 | $ | — | $ | 979.1 | $ | 1,290.2 | $ | 9.0 | $ | — | $ | 1,299.2 | ||||||||||
Regulatory transaction fees | 207.0 | — | — | 207.0 | 275.7 | — | — | 275.7 | ||||||||||||||||||
Market data fees | 99.4 | — | — | 99.4 | 131.0 | — | — | 131.0 | ||||||||||||||||||
Other | 58.7 | 0.1 | — | 58.8 | 81.8 | 0.1 | — | 81.9 | ||||||||||||||||||
| | | | | | | | | | | | | | | | | | | | | | | | | | | |
Total revenues | 1,335.2 | 9.1 | — | 1,344.3 | 1,778.7 | 9.1 | — | 1,787.8 | ||||||||||||||||||
Cost of revenues: | ||||||||||||||||||||||||||
Liquidity payments | 805.7 | — | — | 805.7 | 1,070.7 | — | — | 1,070.7 | ||||||||||||||||||
Section 31 fees | 207.0 | — | — | 207.0 | 275.7 | — | — | 275.7 | ||||||||||||||||||
Routing and clearing | 36.7 | — | — | 36.7 | 47.9 | — | — | 47.9 | ||||||||||||||||||
| | | | | | | | | | | | | | | | | | | | | | | | | | | |
Total cost of revenues | 1,049.4 | — | — | 1,049.4 | 1,394.3 | — | — | 1,394.3 | ||||||||||||||||||
| | | | | | | | | | | | | | | | | | | | | | | | | | | |
Revenues less cost of revenues | 285.8 | 9.1 | — | 294.9 | 384.4 | 9.1 | — | 393.5 | ||||||||||||||||||
Operating expenses: | ||||||||||||||||||||||||||
Compensation and benefits | 58.4 | 4.0 | (0.6) | (6) | 61.8 | 79.7 | 4.0 | (0.2) | (3) | 83.5 | ||||||||||||||||
Depreciation and amortization | 28.5 | 1.4 | 9.4 | (7) | 39.3 | 40.8 | 1.4 | 1.9 | (4) | 44.1 | ||||||||||||||||
Changes in fair value of contingent consideration liability | 1.7 | — | 1.1 | (8) | 2.8 | |||||||||||||||||||||
Change in fair value of contingent consideration liability | 2.8 | — | 1.1 | (5) | 3.9 | |||||||||||||||||||||
General and administrative | 62.2 | 0.7 | (3.7) | (6) | 59.2 | 78.8 | 0.7 | (4.5) | (3) | 75.0 | ||||||||||||||||
| | | | | | | | | | | | | | | | | | | | | | | | | | | |
Total operating expenses | 150.8 | 6.1 | 6.2 | 163.1 | 202.1 | 6.1 | (1.7 | ) | 206.5 | |||||||||||||||||
| | | | | | | | | | | | | | | | | | | | | | | | | | | |
Operating income (loss) | 135.0 | 3.0 | (6.2 | ) | 131.8 | |||||||||||||||||||||
Interest and investment expense | (34.2 | ) | — | (2.0) | (9) | (36.2 | ) | |||||||||||||||||||
Other income | 2.6 | — | (1.0) | (10) | 1.6 | |||||||||||||||||||||
Operating income | 182.3 | 3.0 | 1.7 | 187.0 | ||||||||||||||||||||||
Interest expense, net | (46.6 | ) | — | (1.8) | (6) | (48.4 | ) | |||||||||||||||||||
Other income (loss) | 3.0 | — | (1.0) | (7) | 2.0 | |||||||||||||||||||||
| | | | | | | | | | | | | | | | | | | | | | | | | | | |
Income (loss) before income tax provision | 103.4 | 3.0 | (9.2 | ) | 97.2 | 138.7 | 3.0 | (1.1 | ) | 140.6 | ||||||||||||||||
Income tax provision | 42.9 | 1.1 | (3.8) | (12) | 40.2 | |||||||||||||||||||||
Income tax provision (benefit) | 56.5 | 1.1 | (0.3) | (8) | 57.3 | |||||||||||||||||||||
| | | | | | | | | | | | | | | | | | | | | | | | | | | |
Net income (loss) | $ | 60.5 | $ | 1.9 | $ | (5.4 | ) | $ | 57.0 | $ | 82.2 | $ | 1.9 | $ | (0.8 | ) | $ | 83.3 | ||||||||
| | | | | | | | | | | | | | | | | | | | | | | | | | | | |
| | | | | | | | | | | | | | | | | | | | | | | | | | | |
Earnings per share: | ||||||||||||||||||||||||||
Basic | $ | 1.86 | * | * | $ | 1.75 | $ | 2.53 | * | * | $ | 2.56 | ||||||||||||||
Diluted earnings per share | $ | 1.85 | * | * | $ | 1.74 | ||||||||||||||||||||
Diluted | $ | 2.51 | * | * | $ | 2.55 | ||||||||||||||||||||
Weighted average shares outstanding: | ||||||||||||||||||||||||||
Basic | 32.5 | * | * | 32.5 | 32.5 | * | * | 32.5 | ||||||||||||||||||
Diluted | 32.7 | * | * | 32.7 | 32.7 | * | * | 32.7 | ||||||||||||||||||
See footnotes under "Unaudited Pro Forma Condensed Combined Statement of Operations for the Year Ended December 31, 2014 (under U.S. GAAP)" below.
Unaudited Pro Forma Condensed Combined Statement ofOperations for the Year Ended December 31, 2014 (under U.S. GAAP)
| | BATS Global Markets, Inc. (Historical) | Direct Edge Holdings LLC (Historical)(4) | KCG Hotspot FX (Historical) | Pro Forma Adjustments(2) | BATS Global Markets, Inc. Pro Forma | |||||||||||
|---|---|---|---|---|---|---|---|---|---|---|---|---|---|---|---|---|
| | (in millions, except per share data) | |||||||||||||||
Revenues: | ||||||||||||||||
Transaction fees | $ | 1,009.9 | $ | 38.8 | $ | 47.1 | $ | (0.5) | (5) | $ | 1,095.3 | |||||
Regulatory transaction fees(3) | 272.0 | 10.1 | — | (0.1) | (5) | 282.0 | ||||||||||
Market data fees | 110.3 | 4.0 | — | — | 114.3 | |||||||||||
Other | 66.0 | 2.3 | 0.4 | — | 68.7 | |||||||||||
| | | | | | | | | | | | | | | | | |
Total revenues | 1,458.2 | 55.2 | 47.5 | (0.6 | ) | 1,560.3 | ||||||||||
Cost of revenues: | ||||||||||||||||
Liquidity payments | 831.4 | 27.0 | — | — | 858.4 | |||||||||||
Section 31 fees(3) | 272.0 | 10.1 | — | (0.1) | (5) | 282.0 | ||||||||||
Routing and clearing | 47.1 | 8.6 | — | (0.5) | (5) | 55.2 | ||||||||||
Other | 0.2 | — | — | — | 0.2 | |||||||||||
| | | | | | | | | | | | | | | | | |
Total cost of revenues | 1,150.7 | 45.7 | — | (0.6 | ) | 1,195.8 | ||||||||||
| | | | | | | | | | | | | | | | | |
Revenues less cost of revenues | 307.5 | 9.5 | 47.5 | — | 364.5 | |||||||||||
Operating expenses: | ||||||||||||||||
Compensation and benefits | 87.0 | 29.1 | 19.7 | (33.4) | (6) | 102.4 | ||||||||||
Depreciation and amortization | 28.4 | 0.6 | 2.4 | 13.3 | (7) | 44.7 | ||||||||||
Changes in fair value of contingent consideration liability | — | — | — | 4.4 | (8) | 4.4 | ||||||||||
General and administrative | 72.5 | 10.2 | 5.3 | (1.7) | (6) | 86.3 | ||||||||||
| | | | | | | | | | | | | | | | | |
Total operating expenses | 187.9 | 39.9 | 27.4 | (17.4 | ) | 237.8 | ||||||||||
| | | | | | | | | | | | | | | | | |
Operating income (loss) | 119.6 | (30.4 | ) | 20.1 | 17.4 | 126.7 | ||||||||||
Interest and investment (expense) income | (27.3 | ) | — | — | (21.1) | (9) | (48.4 | ) | ||||||||
Other (expense) income | (12.0 | ) | — | — | 13.6 | (11) | 1.6 | |||||||||
| | | | | | | | | | | | | | | | | |
Income (loss) before income tax provision | 80.3 | (30.4 | ) | 20.1 | 9.9 | 79.9 | ||||||||||
Income tax provision (benefit) | 31.1 | (9.0 | ) | 7.8 | 1.0 | (12) | 30.9 | |||||||||
| | | | | | | | | | | | | | | | | |
Net income (loss) | $ | 49.2 | $ | (21.4 | ) | $ | 12.3 | $ | 8.9 | $ | 49.0 | |||||
| | | | | | | | | | | | | | | | | |
| | | | | | | | | | | | | | | | | |
| | | | | | | | | | | | | | | | | |
Earnings per share: | ||||||||||||||||
Basic | $ | 1.56 | * | * | * | $ | 1.51 | |||||||||
Diluted | $ | 1.55 | * | * | * | $ | 1.50 | |||||||||
Weighted average shares outstanding: | ||||||||||||||||
Basic | 31.6 | * | * | * | 32.5 | |||||||||||
Diluted | 31.8 | * | * | * | 32.6 | |||||||||||
Represents all acquisition-related costs, such as fees to investment bankers, attorneys, accountants and other professional advisors, equity award change in control payments and severance to employees, of $8.5 million and $26.6 million for us and Direct Edge, respectively, for the year ended December 31, 2014. Expenses related to retention payments to employees of $10.0 million for us were not reflected in the pro forma adjustments as these expenses are not directly attributable to the Direct Edge Acquisition.
Notes to the Unaudited Pro Forma
Condensed Combined Statement of Operations
(unaudited)
1. Basis of Presentation
The Direct Edge Acquisition and the BATSBats Hotspot Acquisition areis accounted for under the acquisition method of accounting in accordance with Accounting Standards Codification, or ASC, Topic 805-10, "Business Combinations—Overall," or ASC 805-10. We have accounted for the transactionstransaction by using our historical information and accounting policies and adding the assets and liabilities of Direct Edge and BATSBats Hotspot as of the respective acquisition datesdate at their respective fair values. Pursuant to ASC 805-10, under the acquisition method, the total purchase price (consideration transferred), as described in Note 3,Purchase Price Allocation, is measured at the acquisition closing date. The assets and liabilities of Direct Edge and BATSBats Hotspot have been measured based on various estimates and valuations using assumptions that our management believes are reasonable utilizing information currently available. Use of different estimates and judgments could yield different results.
The process for estimating the fair values of identifiable intangible assets and certain tangible assets requires the use of significant estimates and assumptions, including estimating future cash flows and developing appropriate discount rates. The excess of the purchase price (consideration transferred) over the estimated amounts of identifiable assets and liabilities of Direct Edge and BATSBats Hotspot as of the respective effective datesdate of the acquisition was allocated to goodwill in accordance with ASC 805-10.
Under ASC 805-10, acquisition-related transaction costs (e.g., investment banking, advisory, legal, valuation, and other professional fees) are not included as a component of consideration transferred but are required to be expensed as incurred.
2. Accounting Policies
Upon completion of the acquisitions,acquisition, we reviewed Direct Edge's and BATSBats Hotspot's respective accounting policies and identified differences between thein accounting policies of the two companies.policies. The unaudited pro forma condensed combined statement of operations reflects adjustments to conform Direct Edge's and BATSBats Hotspot's respective results to record certain referral fees.
3. Purchase Price Allocation
Direct Edge
The acquisition-date fair value of the consideration transferred totaled $386.2 million, which consisted of the following (in millions):
Cash paid at closing | $ | 12.5 | ||
Fair value of share outlay | 344.5 | (a) | ||
Change in control payments | 29.2 | |||
| | | | | |
Total consideration to former Direct Edge members | $ | 386.2 | ||
| | | | | |
| | | | | |
| | | | | |
Under the purchase method of accounting, the total purchase price for the Direct Edge Acquisition is allocated to acquired tangible and intangible assets based on their respective fair values
as of the acquisition date as determined by us and a third-party valuation firm. The allocation of the purchase price and the estimated useful life of the acquired intangible assets is as follows:
| | Purchase Price Allocation (in millions) | Estimated Useful Life (in years) | |||||
|---|---|---|---|---|---|---|---|
Customer relationships | $ | 43.0 | 16 | ||||
Trade name | 1.6 | 1 | |||||
Non-compete agreements | 3.9 | 2 | |||||
Licenses and registration | 71.9 | Infinite | |||||
| | | | | | | | |
Total acquired intangible assets | 120.4 | ||||||
Goodwill | 253.5 | ||||||
| | | | | | | | |
Total intangible assets | 373.9 | ||||||
Current assets | 131.6 | ||||||
Property and equipment | 10.4 | ||||||
Liabilities | (129.7 | ) | |||||
| | | | | | | | |
Total cost of acquisition | $ | 386.2 | |||||
| | | | | | | | |
| | | | | | | | |
| | | | | | | | |
Of the total purchase price, approximately $12.3 million has been allocated to net tangible assets and working capital acquired, and approximately $48.5 million has been allocated to amortizable intangible assets acquired. The amortization related to the amortizable intangible assets is reflected as a pro forma adjustment to the unaudited pro forma condensed combined consolidated statement of operations.
Of the total estimated purchase price, approximately $253.5 million has been allocated to goodwill. Goodwill represents the excess of the purchase price of an acquired business over the fair value of the underlying net tangible and intangible assets.
BATSBats Hotspot
The acquisition-date fair value of the consideration transferred totaled $430.1 million, which consisted of the following (in millions):
Cash paid at closing | $ | 365.0 | $ | 365.0 | ||||
Contingent consideration liability | 62.6 | (a) | 62.6 | (a) | ||||
Working capital payment | 2.5 | 2.5 | ||||||
| | | | | | | | | |
Total consideration to former BATS Hotspot stockholders | $ | 430.1 | ||||||
Total consideration to former Bats Hotspot stockholders | $ | 430.1 | ||||||
| | | | | | | | | | |
| | | | | | | | | |
Under the purchase method of accounting, the total purchase price for the BATSBats Hotspot Acquisition is allocated to acquired tangible and intangible assets based on their respective fair values
as of the acquisition date as determined by us and a third-party valuation firm. The allocation of the purchase price and the estimated useful life of the acquired intangible assets is as follows:
| | Purchase Price Allocation (in millions) | Estimated Useful Life (in years) | Purchase Price Allocation (in millions) | Estimated Useful Life (in years) | ||||||||||
|---|---|---|---|---|---|---|---|---|---|---|---|---|---|---|
Customer relationships | $ | 81.2 | 18 | $ | 81.2 | 18 | ||||||||
Technology | 12.6 | 6 | 12.6 | 6 | ||||||||||
Non-compete agreements | 1.9 | 1 | 1.9 | 1 | ||||||||||
Trade name | 15.3 | Infinite | 15.3 | Indefinite | ||||||||||
| | | | | | | | | | | | | | ||
Total acquired intangible assets | 111.0 | 111.0 | ||||||||||||
Goodwill | 308.2 | 308.2 | ||||||||||||
| | | | | | | | | | | | | | ||
Total intangible assets | 419.2 | 419.2 | ||||||||||||
Current assets | 11.8 | 11.8 | ||||||||||||
Property and equipment | 0.3 | 0.3 | ||||||||||||
Liabilities | (1.2 | ) | (1.2 | ) | ||||||||||
| | | | | | | | | | | | | | ||
Total cost of acquisition | $ | 430.1 | $ | 430.1 | ||||||||||
| | | | | | | | | | | | | | | |
| | | | | | | | | | | | | | ||
Of the total purchase price, approximately $11.0$10.9 million has been allocated to net tangible assets and working capital acquired, and approximately $95.7 million has been allocated to amortizable intangible assets acquired. The amortization related to the amortizable intangible assets is reflected as a pro forma adjustment to the unaudited pro forma condensed combined consolidated statementsstatement of income.operations.
Of the total estimated purchase price, approximately $308.2 million has been allocated to goodwill. Goodwill represents the excess of the purchase price of an acquired business over the fair value of the underlying net tangible and intangible assets.
In accordance with ASC 350,Intangibles—Goodwill and Other, goodwill is not amortized but instead is tested for impairment on an annual basis and whenever events or circumstances dictate. In the event that we determine that the value of goodwill has become impaired, we will incur an accounting charge for the amount of impairment during the fiscal quarter in which the determination is made.
We estimate that our net proceeds from this offering will be approximately $ million, based on an assumed initial public offering price of $ per share, which is the mid-point of the price range set forth on the cover page of this prospectus, and after deducting underwriting discounts and commissions and estimated offering expenses payable by us of $ million. We intend to use the net proceeds received by us in connection with this offering to pay down our Amended 2014 Loan in the amount of $ and for general corporate purposes, including funding potential future strategic alliances or acquisitions that are complementary to our business or that enable us to enter new markets or provide new products or services. We are not currently a party to any agreements or commitments for any such alliances or acquisitions, and we have no current understandings with respect to any such transactions.
For information on the interest rate and maturity date of our Amended 2014 Loan, see Note 8 to our Condensed Consolidated Financial Statements (unaudited) for the nine months ended September 30, 2015 included herein.
Affiliates of certain of the underwriters are lenders under our Amended 2014 Loan and will receive net proceeds from this offering in connection with the repayment in part of our Amended 2014 Loan.
We will not receive any proceeds from the sale of our common stock by the selling stockholders in this offering.offering, including any shares sold by certain of the selling stockholders in connection with the exercise of the underwriters' option to purchase additional shares.
The board of directors is expected to adopt a policy with respect to the payment of dividends on capital stock following this offering. We currently expect that we will pay quarterly cash dividends following the offering, with the annual amount initially determined based on a payout ratio of earnings within a determined range.range of 30-40% of net income. Notwithstanding the current expectations for our future dividend policy, the timing, declaration, amount, and payment of any dividends is within the discretion of the board of directors and will depend upon many factors, including our financial condition, earnings, corporate strategy, debt covenants, legal requirements, regulatory constraints, industry practice, ability to access capital markets and other factors deemed relevant by the board of directors.
In 2012, our board of directors declared two cash dividend payments of $4.42 and $13.20 per share of outstanding common stock, which were paid in August and December 2012, respectively. In 2014, in accordance with our merger agreement to acquire Direct Edge, we made working capital distributions to stockholders of the company who held shares prior to the acquisition of $3.38 and $0.07 per share, which were paid in January and April 2014, respectively. In addition, in 2014, our board of directors declared cash dividend payments of $4.07, $0.15 and $0.15 per share of outstanding common stock.stock, which were paid in February 2014, October 2014 and January 2015, respectively. In 2015, in accordance with our merger agreement to acquire Direct Edge, we paid a $7.0 million indemnification liability distribution to stockholders of the company who held shares prior to the acquisition. Our board of directors did not declare any dividend payments in 2015. Future declarations of dividends and the establishment of future record and payment dates are subject to approval by our board of directors.
The following table sets forth our cash and cash equivalents, financial investments and capitalization as of September 30,December 31, 2015:
This table should be read in conjunction with "Management's Discussion and Analysis of Financial Condition and Results of Operations" and the consolidated financial statements and notes thereto appearing elsewhere in this prospectus.
| | September 30, 2015 | December 31, 2015 | |||||||||||||||
|---|---|---|---|---|---|---|---|---|---|---|---|---|---|---|---|---|---|
| | Actual | Pro Forma(1) | Pro Forma As Adjusted(1)(2) | Actual | Pro Forma(1) | ||||||||||||
| | (unaudited) | (unaudited) | |||||||||||||||
| | (in millions, except share data) | (in millions, except share data) | |||||||||||||||
Cash and cash equivalents | $ | 77.9 | $ | 77.9 | $ | 75.1 | $ | 75.1 | |||||||||
Financial investments | 0.5 | 0.5 | 47.7 | 47.7 | |||||||||||||
| | | | | | | | | | | | | | | | | | | |
| | | | | | | | | | | | | | | | | | |
Debt | $ | 737.2 | $ | 737.2 | $ | 687.5 | $ | 687.5 | |||||||||
| | | | | | | | | | | | | | | | | | |
Stockholders' equity: | |||||||||||||||||
Common stock, $0.01 par value: 55,000,000 shares authorized, 25,613,507 shares issued and 25,502,356 shares outstanding, actual; 125,000,000 shares authorized, 28,593,070 shares issued and outstanding on a pro forma basis; 125,000,000 shares authorized, shares issued and outstanding on a pro forma as adjusted basis | 0.3 | 0.3 | |||||||||||||||
Non-Voting Class A common stock, par value $0.01 per share: 10,000,000 shares authorized, 3,090,714 shares issued and outstanding, actual; no shares authorized, issued and outstanding on a pro forma basis; no shares authorized, issued and outstanding on a pro forma as adjusted basis | — | — | |||||||||||||||
Non-Voting Class B common stock, par value $0.01 per share: 10,000,000 shares authorized, 4,176,000 shares issued and outstanding, actual; no shares authorized, issued and outstanding on a pro forma basis; no shares authorized, issued and outstanding on a pro forma as adjusted basis | — | — | |||||||||||||||
Non-voting common stock, $0.01 par value: no shares authorized, issued and outstanding, actual; 10,000,000 shares authorized, 4,176,000 shares issued and outstanding on a pro forma basis; 10,000,000 shares authorized, shares issued and outstanding on a pro forma as adjusted basis | — | — | |||||||||||||||
Common stock, $0.01 par value: 55,000,000 shares authorized, 25,770,322 shares issued and 25,612,852 shares outstanding, actual; 362,500,000 shares authorized, 83,985,615 shares issued and 83,527,269 outstanding on a pro forma basis | 0.3 | 0.3 | |||||||||||||||
Non-Voting Class A common stock, par value $0.01 per share: 10,000,000 shares authorized, 3,090,714 shares issued and outstanding, actual; no shares authorized, issued and outstanding on a pro forma basis | — | — | |||||||||||||||
Non-Voting Class B common stock, par value $0.01 per share: 10,000,000 shares authorized, 4,176,000 shares issued and outstanding, actual; no shares authorized, issued and outstanding on a pro forma basis | — | — | |||||||||||||||
Non-voting common stock, $0.01 par value: no shares authorized, issued and outstanding, actual; 29,000,000 shares authorized, 12,152,158 shares issued and outstanding on a pro forma basis | — | — | |||||||||||||||
Treasury stock | (4.4 | ) | (4.4 | ) | (6.5 | ) | (6.5 | ) | |||||||||
Additional paid-in capital | 268.8 | 268.8 | 271.3 | 271.3 | |||||||||||||
Retained earnings | 103.2 | 103.2 | 125.0 | 125.0 | |||||||||||||
Accumulated other comprehensive loss, net | (3.9 | ) | (3.9 | ) | (10.2 | ) | (10.2 | ) | |||||||||
| | | | | | | | | | | | | | | | | | |
Total stockholders' equity | 364.0 | 364.0 | 379.9 | 379.9 | |||||||||||||
| | | | | | | | | | | | | | | | | | |
Total capitalization | $ | 1,101.2 | $ | 1,101.2 | $ | 1,067.4 | $ | 1,067.4 | |||||||||
| | | | | | | | | | | | | | | | | | | |
| | | | | | | | | | | | | | | | | | |
TableContents
The above table does not include:
Dilution is the amount by which the portion of the offering price paid by the purchasers of our common stock in this offering exceeds the net tangible book valuedeficit per share of our common stock after the offering. Our net tangible book valuedeficit as of September 30,December 31, 2015 was $$(600.4) million, or $$(6.28) per share of common stock.stock after giving effect to the reclassification and 1-for-2.91 stock split to be consummated immediately prior to the completion of this offering. Pro forma net tangible book valuedeficit per share is determined by dividing our tangible net worth (total tangible assets less total liabilities) by the aggregate number of shares of common stock and non-voting common stock outstanding upon the consummation of the offering after giving effect to our reclassification and 1-for-2.91 stock split to be consummated immediately prior to the completion of this offering. Our pro forma net tangible book valuedeficit at September 30,December 31, 2015 would have been $$(600.4) million or $$(6.28) per share. This represents dilution to new investors of $$24.28 per share. The following table illustrates this per share dilution:
| |||||||
| |||||||
| |||||||
| |||||||
| |||||||
Assumed initial public offering price per share of common stock | $ | 18.00 | |||||
Pro forma net tangible book deficit per share as of December 31, 2015 | $ | (6.28 | ) | ||||
Reduction in pro forma net tangible book deficit per share attributable to new investors | — | ||||||
| | | | | | | | |
Pro forma net tangible book deficit per share after offering | $ | (6.28 | ) | ||||
| | | | | | | | |
Dilution in net tangible book deficit per share of common stock to new investors | $ | 24.28 | |||||
| | | | | | | | |
| | | | | | | | |
| | | | | | | | |
Dilution is determined by subtracting pro forma net tangible book valuedeficit per share of common stock after the offering from the initial public offering price per share of common stock.
The following table sets forth, on a pro forma basis, as of September 30,December 31, 2015, the number of shares of common stock purchased, the total consideration paid, or to be paid, and the average price per share paid, or to be paid, by existing stockholders and by the new investors, at an assumed initial public offering price of $$18.00 per share of common stock, the mid-point of the range set forth on the cover page of this prospectus, before deducting estimated underwriting discounts and commissions and offering expenses:
| ||||||||||||||||
| ||||||||||||||||
| | | | Total Consideration | | ||||||||||||
|---|---|---|---|---|---|---|---|---|---|---|---|---|---|---|---|---|
| | Shares Purchased | | ||||||||||||||
| | Average Price Per Share | |||||||||||||||
| | Number | Percent | Amount | Percent | ||||||||||||
Existing stockholders | 95,679,427 | 89.5 | % | $ | 817,120,969 | 77.5 | % | $ | 8.54 | |||||||
New investors | 11,200,000 | 10.5 | % | 201,600,000 | 22.5 | % | $ | 18.00 | ||||||||
Sales by the selling stockholders in this offering will reduce the number of shares of common stock held by existing stockholders to ,84,479,427, or approximately %,88.3%, and will increase the number of shares of common stock to be purchased by new investors to 11,200,000 or approximately %,11.7%, of the total shares of common stock outstanding after the offering. In addition, existing stockholders will hold 100% of the non-voting common stock.
As of September 30,December 31, 2015, after giving effect to the reclassification and -for-1-for-2.91 stock split, 668,7541,946,038 shares of common stock were subject to outstanding options, which represents stock options outstanding as of September 30,December 31, 2015 with a weighted average exercise price of $27.84$8.65 per share. As of September 30,December 31, 2015, after giving effect to the reclassification and stock split, 32.8 million87,699,410 shares of common stock were outstanding, which included 275,586887,778 shares of unvested restricted stock. To the extent these options are exercised there will be further dilution to new investors. See "Executive Compensation—Description of Equity Incentive Plans" and Note 1718 to our consolidated financial statements included elsewhere in this prospectus.
SELECTED FINANCIAL AND OPERATING DATA
The following selected financial and operating data should be read in conjunction with "Management's Discussion and Analysis of Financial Condition and Results of Operations" and our consolidated financial statements and the accompanying notes included elsewhere in this prospectus. We have derived the consolidated statements of operations data for the nine months ended September 30, 2015 and 2014 and the consolidated statement of financial condition data as of September 30, 2015 from our unaudited consolidated financial statements and related notes included elsewhere in this prospectus. We have derived the consolidated statement of operations data for the years ended December 31, 2015, 2014 2013 and 20122013 and the consolidated statementstatements of financial condition data as of December 31, 20142015 and 20132014 from our audited consolidated financial statements and related notes included elsewhere in this prospectus. We have derived the consolidated statementstatements of operations data for the years ended December 31, 2012 and 2011 and 2010the consolidated statements of financial condition data as of December 31, 2013, 2012 and 2011 from our audited consolidated financial statements which are not included in this prospectus. We have prepared our unaudited information on the same basis as our audited consolidated financial statements and have included, in our opinion, all adjustments, consisting only of normal recurring adjustments, that we consider necessary for a fair presentation of this financial information.
| | Nine Months Ended September 30, | Year Ended December 31, | Year Ended December 31, | |||||||||||||||||||||||||||||||||||
|---|---|---|---|---|---|---|---|---|---|---|---|---|---|---|---|---|---|---|---|---|---|---|---|---|---|---|---|---|---|---|---|---|---|---|---|---|---|---|
| | 2015 | 2014 | 2014 | 2013 | 2012 | 2011 | 2010 | 2015 | 2014 | 2013 | 2012 | 2011 | ||||||||||||||||||||||||||
| | (in millions, except per share data) | (in millions, except per share data) | ||||||||||||||||||||||||||||||||||||
Consolidated Statements of Operations Data: | ||||||||||||||||||||||||||||||||||||||
Revenues: | ||||||||||||||||||||||||||||||||||||||
Transaction fees | $ | 970.1 | $ | 707.7 | $ | 1,009.9 | $ | 612.8 | $ | 645.3 | $ | 695.4 | $ | 668.3 | $ | 1,290.2 | $ | 1,009.9 | $ | 612.8 | $ | 645.3 | $ | 695.4 | ||||||||||||||
Regulatory transaction fees(1) | 207.0 | 186.5 | 272.0 | 127.4 | 148.1 | 156.4 | 111.0 | 275.7 | 272.0 | 127.4 | 148.1 | 156.4 | ||||||||||||||||||||||||||
Market data fees | 99.4 | 81.2 | 110.3 | 59.4 | 60.3 | 55.4 | 46.0 | 131.0 | 110.3 | 59.4 | 60.3 | 55.6 | ||||||||||||||||||||||||||
Port fees and other | 58.7 | 49.0 | 66.0 | 41.9 | 31.0 | 19.4 | 9.5 | 81.8 | 66.0 | 41.9 | 31.0 | 19.2 | ||||||||||||||||||||||||||
| | | | | | | | | | | | | | | | | | | | | | | | | | | | | | | | | | | | | | | |
Total revenues | 1,335.2 | 1,024.4 | 1,458.2 | 841.5 | 884.7 | 926.6 | 834.8 | 1,778.7 | 1,458.2 | 841.5 | 884.7 | 926.6 | ||||||||||||||||||||||||||
Cost of revenues: | ||||||||||||||||||||||||||||||||||||||
Liquidity payments | 805.7 | 578.5 | 831.4 | 474.7 | 508.2 | 566.1 | 541.7 | 1,070.7 | 831.4 | 474.7 | 508.2 | 566.1 | ||||||||||||||||||||||||||
Section 31 fees(1) | 207.0 | 186.5 | 272.0 | 127.4 | 148.1 | 156.4 | 111.0 | 275.7 | 272.0 | 127.4 | 148.1 | 156.4 | ||||||||||||||||||||||||||
Routing, clearing and other fees | 36.7 | 35.6 | 47.3 | 42.6 | 51.5 | 76.1 | 82.9 | |||||||||||||||||||||||||||||||
Routing and clearing | 47.9 | 47.3 | 42.6 | 51.5 | 76.1 | |||||||||||||||||||||||||||||||||
| | | | | | | | | | | | | | | | | | | | | | | | | | | | | | | | | | | | | | | |
Total cost of revenues | 1,049.4 | 800.6 | 1,150.7 | 644.7 | 707.8 | 798.6 | 735.6 | 1,394.3 | 1,150.7 | 644.7 | 707.8 | 798.6 | ||||||||||||||||||||||||||
| | | | | | | | | | | | | | | | | | | | | | | | | | | | | | | | | | | | | | | |
Revenues less cost of revenues | 285.8 | 223.8 | 307.5 | 196.8 | 176.9 | 128.0 | 99.2 | 384.4 | 307.5 | 196.8 | 176.9 | 128.0 | ||||||||||||||||||||||||||
Operating expenses: | ||||||||||||||||||||||||||||||||||||||
Compensation and benefits | 58.4 | 66.2 | 87.0 | 41.5 | 48.4 | 42.9 | 30.6 | 79.7 | 87.0 | 41.5 | 48.4 | 42.9 | ||||||||||||||||||||||||||
Depreciation and amortization | 28.5 | 20.9 | 28.4 | 15.2 | 17.0 | 8.4 | 6.5 | 40.8 | 28.4 | 15.2 | 17.0 | 8.4 | ||||||||||||||||||||||||||
Systems and data communication | 21.4 | 16.9 | 23.5 | 9.6 | 11.9 | 10.1 | 10.9 | 27.2 | 23.5 | 9.6 | 11.9 | 10.1 | ||||||||||||||||||||||||||
Occupancy | 2.4 | 2.6 | 4.2 | 1.9 | 2.3 | 1.5 | 1.4 | 3.1 | 4.2 | 1.9 | 2.3 | 1.5 | ||||||||||||||||||||||||||
Professional and contract services | 8.9 | 5.0 | 6.5 | 8.1 | 9.2 | 10.3 | 3.1 | 11.1 | 6.5 | 8.1 | 9.2 | 10.3 | ||||||||||||||||||||||||||
Regulatory costs | 8.6 | 8.7 | 12.1 | 5.4 | 5.7 | 5.5 | 4.5 | 11.1 | 12.1 | 5.4 | 5.7 | 5.5 | ||||||||||||||||||||||||||
Change in fair value of contingent consideration liability | 1.7 | — | — | — | 12.4 | 0.3 | — | 2.8 | — | — | 12.4 | 0.3 | ||||||||||||||||||||||||||
Impairment of assets | — | — | — | 3.5 | 0.2 | — | — | — | — | 3.5 | 0.2 | — | ||||||||||||||||||||||||||
General and administrative | 20.9 | 19.2 | 26.2 | 10.0 | 10.5 | 10.7 | 7.4 | 26.3 | 26.2 | 10.0 | 10.5 | 10.7 | ||||||||||||||||||||||||||
| | | | | | | | | | | | | | | | | | | | | | | | | | | | | | | | | | | | | | | |
Total operating expenses | 150.8 | 139.5 | 187.9 | 95.2 | 117.6 | 89.7 | 64.4 | 202.1 | 187.9 | 95.2 | 117.6 | 89.7 | ||||||||||||||||||||||||||
| | | | | | | | | | | | | | | | | | | | | | | | | | | | | | | | | | | | | | | |
Operating income | 135.0 | 84.3 | 119.6 | 101.6 | 59.3 | 38.3 | 34.8 | 182.3 | 119.6 | 101.6 | 59.3 | 38.3 | ||||||||||||||||||||||||||
Interest and investment (expense) income | (34.2 | ) | (20.3 | ) | (27.3 | ) | (25.8 | ) | (0.6 | ) | 0.1 | 0.3 | ||||||||||||||||||||||||||
Interest (expense) income, net | (46.6 | ) | (27.3 | ) | (25.8 | ) | (0.6 | ) | 0.1 | |||||||||||||||||||||||||||||
Loss on extinguishment of debt | — | (13.6 | ) | (13.6 | ) | — | — | — | — | — | (13.6 | ) | — | — | — | |||||||||||||||||||||||
Equity in earnings in EuroCCP | 1.0 | 0.8 | 1.1 | — | — | — | — | 1.2 | 1.1 | — | — | — | ||||||||||||||||||||||||||
Other income (expense) | 1.6 | 0.4 | 0.5 | (0.2 | ) | (0.6 | ) | (0.1 | ) | (0.1 | ) | 1.8 | 0.5 | (0.2 | ) | (0.6 | ) | (0.1 | ) | |||||||||||||||||||
| | | | | | | | | | | | | | | | | | | | | | | | | | | | | | | | | | | | | | | |
Income before income tax provision | 103.4 | 51.6 | 80.3 | 75.6 | 58.1 | 38.3 | 35.0 | 138.7 | 80.3 | 75.6 | 58.1 | 38.3 | ||||||||||||||||||||||||||
Income tax provision | 42.9 | 20.7 | 31.1 | 28.8 | 26.5 | 14.8 | 15.2 | 56.5 | 31.1 | 28.8 | 26.5 | 14.8 | ||||||||||||||||||||||||||
| | | | | | | | | | | | | | | | | | | | | | | | | | | | | | | | | | | | | | | |
Net income | $ | 60.5 | $ | 30.9 | $ | 49.2 | $ | 46.8 | $ | 31.6 | $ | 23.5 | $ | 19.8 | $ | 82.2 | $ | 49.2 | $ | 46.8 | $ | 31.6 | $ | 23.5 | ||||||||||||||
| | | | | | | | | | | | | | | | | | | | | | | | | | | | | | | | | | | | | | | | |
| | | | | | | | | | | | | | | | | | | | | | | | | | | | | | | | | | | | | | | |
Earnings per share: | ||||||||||||||||||||||||||||||||||||||
Basic | $ | 1.86 | $ | 0.98 | $ | 1.56 | $ | 2.07 | $ | 1.40 | $ | 1.29 | $ | 1.11 | $ | 2.53 | $ | 1.56 | $ | 2.07 | $ | 1.40 | $ | 1.29 | ||||||||||||||
Diluted | $ | 1.85 | $ | 0.98 | $ | 1.55 | $ | 2.06 | $ | 1.39 | $ | 1.26 | $ | 1.08 | $ | 2.51 | $ | 1.55 | $ | 2.06 | $ | 1.39 | $ | 1.26 | ||||||||||||||
Weighted average shares outstanding: | ||||||||||||||||||||||||||||||||||||||
Basic | 32.5 | 31.4 | 31.6 | 22.6 | 22.5 | 18.2 | 17.8 | 32.5 | 31.6 | 22.6 | 22.5 | 18.2 | ||||||||||||||||||||||||||
Diluted | 32.7 | 31.5 | 31.8 | 22.7 | 22.7 | 18.7 | 18.3 | 32.7 | 31.8 | 22.7 | 22.7 | 18.7 | ||||||||||||||||||||||||||
Distributions per share | $ | 0.31 | $ | 7.67 | $ | 7.82 | $ | — | $ | 17.62 | $ | — | $ | — | $ | — | $ | 7.82 | $ | — | $ | 17.62 | $ | — | ||||||||||||||
directly to the SEC, and our national securities exchanges then pass these costs along
to our members as regulatory transaction fees, recognizing these amounts as incurred in cost of revenues and revenues, respectively.
| | | As of December 31, | As of December 31, | ||||||||||||||||||||||||||||||||
|---|---|---|---|---|---|---|---|---|---|---|---|---|---|---|---|---|---|---|---|---|---|---|---|---|---|---|---|---|---|---|---|---|---|---|---|
| | As of September 30, 2015 | 2015 | 2014 | 2013 | 2012 | 2011 | |||||||||||||||||||||||||||||
| | 2014 | 2013 | 2012 | 2011 | 2010 | (in millions) | |||||||||||||||||||||||||||||
| | (in millions) | ||||||||||||||||||||||||||||||||||
Consolidated Statement of Financial Condition Data: | |||||||||||||||||||||||||||||||||||
Consolidated Statements of Financial Condition Data: | |||||||||||||||||||||||||||||||||||
Assets: | |||||||||||||||||||||||||||||||||||
Cash and cash equivalents | $ | 77.9 | $ | 122.2 | $ | 87.2 | $ | 82.5 | $ | 99.4 | $ | 150.0 | $ | 75.1 | $ | 122.2 | $ | 87.2 | $ | 82.5 | $ | 99.4 | |||||||||||||
Financial investments | 0.5 | 68.4 | 25.2 | 29.8 | 151.7 | 27.3 | 47.7 | 68.4 | 25.2 | 29.8 | 151.7 | ||||||||||||||||||||||||
Goodwill and intangible assets, net | 993.7 | 598.2 | 247.0 | 251.9 | 246.9 | — | 980.3 | 598.2 | 247.0 | 251.9 | 246.9 | ||||||||||||||||||||||||
| | | | | | | | | | | | | | | | | | | | | | | | | | | | | | | | | | | | |
Total assets | $ | 1,288.8 | $ | 1,006.6 | $ | 456.9 | $ | 469.6 | $ | 594.9 | $ | 256.5 | $ | 1,316.9 | $ | 1,006.6 | $ | 456.9 | $ | 469.6 | $ | 594.9 | |||||||||||||
| | | | | | | | | | | | | | | | | | | | | | | | | | | | | | | | | | | | | |
| | | | | | | | | | | | | | | | | | | | | | | | | | | | | | | | | | | | |
Liabilities and stockholders' equity: | |||||||||||||||||||||||||||||||||||
Long-term debt | $ | 737.2 | $ | 474.4 | $ | 246.0 | $ | 287.6 | $ | — | $ | — | $ | 687.5 | $ | 474.4 | $ | 246.0 | $ | 287.6 | $ | — | |||||||||||||
Total liabilities | 924.8 | 702.4 | 316.9 | 381.9 | 148.3 | 57.8 | 937.0 | 702.4 | 316.9 | 381.9 | 148.3 | ||||||||||||||||||||||||
Total stockholders' equity | 364.0 | 304.2 | 140.0 | 87.7 | 446.6 | 198.7 | 379.9 | 304.2 | 140.0 | 87.7 | 446.6 | ||||||||||||||||||||||||
| | | | | | | | | | | | | | | | | | | | | | | | | | | | | | | | | | | | |
Total liabilities and stockholders' equity | $ | 1,288.8 | $ | 1,006.6 | $ | 456.9 | $ | 469.6 | $ | 594.9 | $ | 256.5 | $ | 1,316.9 | $ | 1,006.6 | $ | 456.9 | $ | 469.6 | $ | 594.9 | |||||||||||||
| | | | | | | | | | | | | | | | | | | | | | | | | | | | | | | | | | | | | |
| | | | | | | | | | | | | | | | | | | | | | | | | | | | | | | | | | | | |
Selected Operating Data
The following table presents selected operating data for U.S. Equities, European Equities, U.S. Options and Global FX for the periods presented. Direct Edge, which is reported in our U.S. Equities segment, was acquired in January 2014. BATSBats Hotspot, which is reported in our Global FX segment, was acquired in March 2015. The information set forth below is not necessarily indicative of our future operations and should be read in conjunction with "Management's Discussion and Analysis of Financial Condition and Results of Operations."
| | Nine Months Ended September 30, | Year Ended December 31, | Year Ended December 31, | |||||||||||||||||||||||
|---|---|---|---|---|---|---|---|---|---|---|---|---|---|---|---|---|---|---|---|---|---|---|---|---|---|---|
| | 2015 | 2014 | 2014 | 2013 | 2012 | 2015 | 2014 | 2013 | ||||||||||||||||||
| | (in millions except for trading days, percentages and as noted below) | (in billions except for trading days, percentages and as noted below) | ||||||||||||||||||||||||
U.S. Equities: | ||||||||||||||||||||||||||
Average daily volume (ADV) (in billions of shares): | ||||||||||||||||||||||||||
Matched shares | 1.5 | 1.2 | 0.6 | |||||||||||||||||||||||
Routed shares | 0.1 | 0.1 | 0.1 | |||||||||||||||||||||||
| | | | | | | | | | | | ||||||||||||||||
Total touched shares | 1.6 | 1.3 | 0.7 | |||||||||||||||||||||||
| | | | | | | | | | | | ||||||||||||||||
| | | | | | | | | |||||||||||||||||||
| | | | | | | | | | | | ||||||||||||||||
Market ADV | 6,864.8 | 6,214.0 | 6,414.2 | 6,187.0 | 6,437.2 | 6.9 | 6.4 | 6.2 | ||||||||||||||||||
| | | | | | | | | | | | ||||||||||||||||
| | | | | | | | | |||||||||||||||||||
| | | | | | | | | | | | ||||||||||||||||
Number of trading days | 188 | 188 | 252 | 252 | 250 | 252 | 252 | 252 | ||||||||||||||||||
Net capture per one hundred touched shares(1) | $ | 0.021 | $ | 0.022 | $ | 0.022 | $ | 0.024 | $ | 0.023 | $ | 0.021 | $ | 0.022 | $ | 0.024 | ||||||||||
Market share(2) | 21.1 | % | 18.9 | % | 19.4 | % | 10.4 | % | 11.9 | % | 21.1 | % | 19.4 | % | 10.4 | % | ||||||||||
European Equities: | ||||||||||||||||||||||||||
Market ADNV | € | 52,394.2 | € | 38,124.1 | € | 39,659.3 | € | 32,613.6 | € | 30,857.6 | ||||||||||||||||
Matched and touched ADNV (in billions) | € | 12.4 | € | 8.6 | € | 7.5 | ||||||||||||||||||||
Market ADNV (in billions) | € | 50.8 | € | 39.7 | € | 32.6 | ||||||||||||||||||||
Number of trading days | 192 | 192 | 256 | 256 | 257 | 257 | 256 | 256 | ||||||||||||||||||
Net capture per matched notional value (in basis points)(1) | 0.132 | 0.164 | 0.162 | 0.167 | 0.113 | 0.133 | 0.162 | 0.167 | ||||||||||||||||||
Market share(2) | 24.2 | % | 21.3 | % | 21.6 | % | 23.1 | % | 24.6 | % | 24.4 | % | 21.6 | % | 23.1 | % | ||||||||||
U.S. Options: | ||||||||||||||||||||||||||
Market ADV (in thousands of contracts) | 16,271.1 | 16,281.5 | 16,586.3 | 15,934.2 | 15,651.6 | |||||||||||||||||||||
ADV (in millions of contracts): | ||||||||||||||||||||||||||
Matched contracts | 1.5 | 0.8 | 0.6 | |||||||||||||||||||||||
Routed contracts | 0.1 | — | — | |||||||||||||||||||||||
| | | | | | | | | | | | ||||||||||||||||
Total touched contracts | 1.6 | 0.8 | 0.6 | |||||||||||||||||||||||
| | | | | | | | | | | | ||||||||||||||||
| | | | | | | | | |||||||||||||||||||
| | | | | | | | | | | | ||||||||||||||||
Market ADV | 16.1 | 16.6 | 15.9 | |||||||||||||||||||||||
Number of trading days | 188 | 188 | 252 | 252 | 250 | 252 | 252 | 252 | ||||||||||||||||||
Net capture per touched contract(1) | $ | 0.024 | $ | 0.049 | $ | 0.046 | $ | 0.058 | $ | 0.063 | $ | 0.030 | $ | 0.046 | $ | 0.058 | ||||||||||
Market share(2) | 9.9 | % | 4.2 | % | 4.8 | % | 3.7 | % | 3.3 | % | 9.6 | % | 4.8 | % | 3.7 | % | ||||||||||
Global FX: | ||||||||||||||||||||||||||
ADNV (in billions) | $ | 27.8 | * | * | * | * | $ | 25.8 | * | * | ||||||||||||||||
Number of trading days | 194 | * | * | * | * | 209 | * | * | ||||||||||||||||||
Net capture per one million dollars traded(1) | $ | 3.01 | * | * | * | * | $ | 2.95 | * | * | ||||||||||||||||
| | Nine Months Ended September 30, | Year Ended December 31, | Year Ended December 31, | |||||||||||||||||||||||||||||||||||
|---|---|---|---|---|---|---|---|---|---|---|---|---|---|---|---|---|---|---|---|---|---|---|---|---|---|---|---|---|---|---|---|---|---|---|---|---|---|---|
| | 2015 | 2014 | 2014 | 2013 | 2012 | 2011 | 2010 | 2015 | 2014 | 2013 | 2012 | 2011 | ||||||||||||||||||||||||||
| | (in millions except for percentages and exchange rates) | (in millions except for percentages, earnings per share and exchange rates) | ||||||||||||||||||||||||||||||||||||
Other Data: | ||||||||||||||||||||||||||||||||||||||
EBITDA(1) | $ | 166.1 | $ | 92.8 | $ | 136.0 | $ | 116.6 | $ | 75.7 | $ | 46.6 | $ | 41.2 | $ | 226.1 | $ | 136.0 | $ | 116.6 | $ | 75.7 | $ | 46.6 | ||||||||||||||
EBITDA margin(2) | 58.1 | % | 41.5 | % | 44.2 | % | 59.2 | % | 42.8 | % | 36.4 | % | 41.5 | % | 58.8 | % | 44.2 | % | 59.2 | % | 42.8 | % | 36.4 | % | ||||||||||||||
Normalized EBITDA(1) | $ | 172.5 | $ | 121.0 | $ | 168.1 | $ | 124.1 | $ | 101.3 | $ | 60.3 | $ | 42.4 | $ | 235.3 | $ | 168.1 | $ | 124.1 | $ | 101.3 | $ | 60.3 | ||||||||||||||
Normalized EBITDA margin(3) | 60.4 | % | 54.1 | % | 54.7 | % | 63.1 | % | 57.3 | % | 47.1 | % | 42.7 | % | 61.2 | % | 54.7 | % | 63.1 | % | 57.3 | % | 47.1 | % | ||||||||||||||
Non transaction revenue as a percentage of revenues less cost of revenues(4) | 55.3 | % | 58.2 | % | 57.3 | % | 51.5 | % | 51.6 | % | 58.4 | % | 55.9 | % | ||||||||||||||||||||||||
Adjusted earnings(4) | $ | 103.6 | $ | 75.2 | $ | 55.1 | $ | 49.1 | 32.1 | |||||||||||||||||||||||||||||
Adjusted earnings margin(5) | 27.0 | % | 24.5 | % | 28.0 | % | 27.8 | % | 25.1 | % | ||||||||||||||||||||||||||||
Diluted Adjusted earnings per share(6) | $ | 3.17 | $ | 2.37 | $ | 2.42 | $ | 2.16 | $ | 1.71 | ||||||||||||||||||||||||||||
Non-transaction revenue as a percentage of revenues less cost of revenues(7) | 55.4 | % | 57.3 | % | 51.5 | % | 51.6 | % | 58.4 | % | ||||||||||||||||||||||||||||
Capital expenditures | $ | 12.3 | $ | 17.6 | $ | 25.2 | $ | 3.6 | $ | 6.9 | $ | 9.6 | $ | 6.4 | $ | 13.9 | $ | 25.2 | $ | 3.6 | $ | 6.9 | $ | 9.6 | ||||||||||||||
Average British pound/U.S. dollar exchange rate | $ | 1.5322 | $ | 1.6691 | $ | 1.6476 | $ | 1.5643 | $ | 1.5847 | $ | 1.6039 | $ | 1.5458 | $ | 1.5283 | $ | 1.6476 | $ | 1.5643 | $ | 1.5847 | $ | 1.6039 | ||||||||||||||
Average Euro/U.S. dollar exchange rate | $ | 1.1155 | $ | 1.3559 | $ | 1.3290 | $ | 1.3280 | $ | 1.2858 | $ | 1.3924 | $ | 1.3275 | $ | 1.1101 | $ | 1.3290 | $ | 1.3280 | $ | 1.2858 | $ | 1.3924 | ||||||||||||||
Average Euro/British pound exchange rate | £ | 0.7280 | £ | 0.8122 | £ | 0.8062 | £ | 0.8489 | £ | 0.8112 | £ | 0.8678 | £ | 0.8583 | £ | 0.7263 | £ | 0.8062 | £ | 0.8489 | £ | 0.8112 | £ | 0.8678 | ||||||||||||||
The following is a reconciliation of net income to EBITDA and Normalized EBITDA:
| | Nine Months Ended September 30, | Year Ended December 31, | Year Ended December 31, | |||||||||||||||||||||||||||||||||||
|---|---|---|---|---|---|---|---|---|---|---|---|---|---|---|---|---|---|---|---|---|---|---|---|---|---|---|---|---|---|---|---|---|---|---|---|---|---|---|
| | 2015 | 2014 | 2014 | 2013 | 2012 | 2011 | 2010 | 2015 | 2014 | 2013 | 2012 | 2011 | ||||||||||||||||||||||||||
| | (in millions) | (in millions) | ||||||||||||||||||||||||||||||||||||
Net income | $ | 60.5 | $ | 30.9 | $ | 49.2 | $ | 46.8 | $ | 31.6 | $ | 23.5 | $ | 19.8 | $ | 82.2 | $ | 49.2 | $ | 46.8 | $ | 31.6 | $ | 23.5 | ||||||||||||||
Interest | 34.2 | 20.3 | 27.3 | 25.8 | 0.6 | (0.1 | ) | (0.3 | ) | 46.6 | 27.3 | 25.8 | 0.6 | (0.1 | ) | |||||||||||||||||||||||
Income tax provision | 42.9 | 20.7 | 31.1 | 28.8 | 26.5 | 14.8 | 15.2 | 56.5 | 31.1 | 28.8 | 26.5 | 14.8 | ||||||||||||||||||||||||||
Depreciation and amortization | 28.5 | 20.9 | 28.4 | 15.2 | 17.0 | 8.4 | 6.5 | 40.8 | 28.4 | 15.2 | 17.0 | 8.4 | ||||||||||||||||||||||||||
| | | | | | | | | | | | | | | | | | | | | | | | | | | | | | | | | | | | | | | |
EBITDA | 166.1 | 92.8 | 136.0 | 116.6 | 75.7 | 46.6 | 41.2 | 226.1 | 136.0 | 116.6 | 75.7 | 46.6 | ||||||||||||||||||||||||||
Acquisition-related costs | 6.4 | 14.6 | 18.5 | 5.2 | 19.3 | 11.4 | — | 8.2 | 18.5 | 5.2 | 19.3 | 11.4 | ||||||||||||||||||||||||||
IPO costs | 0.5 | — | — | 0.6 | 6.3 | 2.3 | 1.2 | 1.5 | — | 0.6 | 6.3 | 2.3 | ||||||||||||||||||||||||||
Loss on extinguishment of debt | — | 13.6 | 13.6 | — | — | — | — | — | 13.6 | — | — | — | ||||||||||||||||||||||||||
Other one-time items | (0.5 | ) | — | — | 1.7 | — | — | — | ||||||||||||||||||||||||||||||
Impairment of intangible assets | — | — | 3.5 | — | — | |||||||||||||||||||||||||||||||||
Debt restructuring | 0.5 | — | — | — | — | |||||||||||||||||||||||||||||||||
Gain on extinguishment of revolving credit facility | (1.0 | ) | — | — | — | — | ||||||||||||||||||||||||||||||||
Regulatory assessment | — | — | (1.8 | ) | — | — | ||||||||||||||||||||||||||||||||
| | | | | | | | | | | | | | | | | | | | | | | | | | | | | | | | | | | | | | | |
Normalized EBITDA | $ | 172.5 | $ | 121.0 | $ | 168.1 | $ | 124.1 | $ | 101.3 | $ | 60.3 | $ | 42.4 | $ | 235.3 | $ | 168.1 | $ | 124.1 | $ | 101.3 | $ | 60.3 | ||||||||||||||
| | | | | | | | | | | | | | | | | | | | | | | | | | | | | | | | | | | | | | | | |
| | | | | | | | | | | | | | | | | | | | | | | | | | | | | | | | | | | | | | | |
also believe that it is frequently used by analysts, investors and other interested parties in the evaluation of companies. We believe that investors may find this non-GAAP measure useful in evaluating our performance compared to that of peer companies in our industry. Other companies may calculate Adjusted earnings differently than we do. Adjusted earnings has limitations as an analytical tool, and you should not consider it in isolation or as a substitute for analysis of our results as reported under U.S. GAAP.
The following is a reconciliation of net income to Adjusted earnings:
| | Year Ended December 31, | |||||||||||||||
|---|---|---|---|---|---|---|---|---|---|---|---|---|---|---|---|---|
| | 2015 | 2014 | 2013 | 2012 | 2011 | |||||||||||
| | (in millions) | |||||||||||||||
Net income | $ | 82.2 | $ | 49.2 | $ | 46.8 | $ | 31.6 | $ | 23.5 | ||||||
Amortization | 26.9 | 10.3 | 5.9 | 6.7 | 0.4 | |||||||||||
Tax effect of amortization | (11.0 | ) | (4.0 | ) | (2.2 | ) | (3.1 | ) | (0.2 | ) | ||||||
Acquisition-related costs | 8.2 | 18.5 | 5.2 | 19.3 | 11.4 | |||||||||||
IPO costs | 1.5 | — | 0.6 | 6.3 | 2.3 | |||||||||||
Loss on extinguishment of debt | — | 13.6 | — | — | — | |||||||||||
Impairment of intangible assets | — | — | 3.5 | — | — | |||||||||||
Debt restructuring | 0.5 | — | — | — | — | |||||||||||
Gain on extinguishment of revolving credit facility | (1.0 | ) | — | — | — | — | ||||||||||
Regulatory assessment | — | — | (1.8 | ) | — | — | ||||||||||
| | | | | | | | | | | | | | | | | |
Tax effect of other items | (3.7 | ) | (12.4 | ) | (2.9 | ) | (11.7 | ) | (5.3 | ) | ||||||
| | | | | | | | | | | | | | | | | |
Adjusted earnings | $ | 103.6 | $ | 75.2 | $ | 55.1 | $ | 49.1 | $ | 32.1 | ||||||
| | | | | | | | | | | | | | | | | |
| | | | | | | | | | | | | | | | | |
| | | | | | | | | | | | | | | | | |
MANAGEMENT'S DISCUSSION AND ANALYSIS
OF FINANCIAL CONDITION AND RESULTS OF OPERATIONS
The following discussion of our financial condition and results of operations should be read in conjunction with our consolidated financial statements and the notes thereto included in this prospectus. The following discussion contains forward-looking statements. Actual results could differ materially from the results discussed in the forward-looking statements. See "Risk Factors" and "Special Note Regarding Forward-Looking Statements" above.
Overview
We are a leading global operator of securities exchanges and other electronic markets enabled by world-class technology. We provide trade execution, market data, trade reporting, connectivity and risk management solutions to brokers, market makers, asset managers and other market participants, ultimately benefiting retail and institutional investors across multiple asset classes. Our principal objective is to improve markets by maximizing efficiency and mitigating trade execution risk for market participants. Our asset class focus currently comprises listed cash equity securities in the United States and Europe, listed equity options in the United States and institutional spot FX globally, as well as ETPs, including ETFs, in the United States and Europe. Trade execution comprised 44.7%44.6% of our revenues less cost of revenues, and market data and connectivity, or non-transaction revenues, comprised 55.3%55.4% of our revenues less cost of revenues for the nineyear ended December 31, 2015.
We are the second largest exchange operator in U.S. listed cash equity securities trading by market share, the largest exchange operator of ETFs and other ETPs by market share, and the largest European exchange operator as measured by notional value traded as of December 31, 2015. In addition, for each of the six consecutive months ended September 30, 2015.December 31, 2015, excluding the Chinese exchanges, we were the largest equities market operator globally as measured by notional value traded. Moreover, during 2015 we operated the fastest growing market in the United States for exchange traded options as measured by market share.
We improve markets by maximizing efficiency and mitigating trade execution risk, in part by offering low-cost, innovativemarket-leading pricing and low-latency trade execution enabled by resilient and robust proprietary technology. For example, during the three monthsyear ended September 30,December 31, 2015, our net capture, including auctions, in the U.S. equities market was approximately 40%42% of the rate reported by NASDAQ Group's U.S. equities operations and Intercontinental Exchange's NYSE operations, while our net capture, including auctions, in the European listed equity securities market was approximately 54%94% of the rate reported by the London Stock Exchange's European equities operations. During the third quarter ofyear ended December 31, 2015, our net capture in the U.S. listed equity options market was 6%8% to 20%19% of the rate reported by CBOE, NYSE Arca, NYSE MKT, NASDAQ Options Market and NASDAQ PHLX. We offer the same low-cost, market-leading pricing for our market data products. During the year ended December 31, 2015, our pricing for market data for the U.S. equities market was a combined $12,500 per month for data from BZX, BYX, EDGX and EDGA. This is approximately 8% of the prices reported by NYSE and NASDAQ operations to receive data for all of their respective markets during the same period. Our market data pricing in Europe was €59.50 per month for pan-European data during the year ended December 31, 2015. This is approximately 11% of the cost of receiving data from the other exchanges across Europe during the same period. Participants can also purchase our FX market data for $5,000 per month. This is approximately 8% of the price currently charged by EBS Market.
We develop, own and operate the BATSBats trading platforms, which deploy our proprietary technology designed to offer some of the fastest and most reliable trading systems available. For the nine monthsyear ended September 30,December 31, 2015, we had a 21.1% share of the overall U.S. equity market, a 22.4% share of the trading of ETPs and a 9.9%9.6% share of the U.S. equity options market. In Europe, for the nine monthsyear ended September 30,
December 31, 2015, we had a 24.2%24.4% share of European trading in the securities available for trading on BATS Chi-XBats Europe. In addition, we had $27.8$25.8 billion ADNV in our Global FX segment from the BATSBats Hotspot Acquisition onfrom March 13, 2015 to September 30,December 31, 2015. Globally, for the nine monthsyear ended September 30,December 31, 2015, we had an 11.5%11.1% share of the publicly reported institutional spot FX market, as reported by BATSBats Hotspot, ICAP and Thomson Reuters. Pro forma for the acquisition of BATSBats Hotspot for the nine monthsyear ended September 30,December 31, 2015, we would have derived 77.0%77.6% of our total revenues from the trading of U.S. listed cash equities securities, 13.9%13.5% of our total revenues from the trading of U.S. listed equity options, 6.7%6.6% of our total revenues from the trading of European listed cash equities securities and 2.4%2.3% of our total revenues from trading globally of institutional spot FX.
Our revenue is primarily tied to the volume of securities traded on our markets and our market share of trading in the overall U.S. and European equity markets, the U.S. equity options market and the global FX market. Trading volume on our markets can be influenced by a number of factors, including overall market volatility. Our revenue increased from $834.8$926.6 million in 20102011 to $1,458.2$1,778.7 million in 2014.2015. This revenue growth is attributable to our increased market share and
increased overall market volume, the introduction of new products and services, and strategic acquisitions of Chi-X Europe, Direct Edge and BATSBats Hotspot.
For the two months ended February 29, 2016, we had a 21.4% share of the overall U.S. equity market, a 24.5% share of the trading of ETPs and a 10.2% share of the U.S. equity options market. For ETPs, during the two months ended February 29, 2016, we had 13 new listings, or 50.0% of all newly listed ETPs in the United States. We also had 69 total listings as of February 29, 2016, or 3.7% of all listings in the United States. In Europe, for the two months ended February 29, 2016, we had a 24.3% share of European trading in the securities available for trading on Bats Europe. In addition, for the two months ended February 29, 2016, we had $31.7 billion ADNV in our Global FX segment and 12.0% of the publicly reported institutional spot FX market.
Our revenue consists primarily of transaction fees, regulatory fees, market data fees and port fees. On a consolidated basis, our revenues less cost of revenues were $285.8$384.4 million for the nine monthsyear ended September 30,December 31, 2015, which represents a 27.7%25.0% increase from the $223.8$307.5 million generated for the nine monthsyear ended September 30,December 31, 2014. Non-transaction revenues were 55.3%55.4% of revenues less cost of revenues for the nine months ended September 30, 2015. On a consolidated basis, we generated $307.5 million in revenues less cost of revenues for the year ended December 31, 2014.2015. Adjusting for growth through acquisitions, our organic compound annual growth rate of revenues less cost of revenue for the last four years was 12.8%12.4%. For the nine monthsyear ended September 30,December 31, 2015, our Normalized EBITDA margin was 60.4%61.2%, an increase from 54.1%compared to 54.7% for the nine monthsyear ended September 30,December 31, 2014. We also use the non-GAAP measure of Normalized EBITDA margin to measure our performance. Normalized EBITDA margin is a non-GAAP measure that is reconciled to net income in the section titled "Summary Historical and Pro Forma Financial and Operating Data."
History
We were formed in 2005 as an alternative to the NYSE and NASDAQ in response to increased consolidation among U.S. listed cash equity market centers. In January 2006, we launched our ECN, a type of ATS, which initially focused on the trading of NASDAQ-listed securities and in May 2006 we expanded to include trading of American Stock Exchange (now NYSE MKT)-listed securities. In February 2007, we expanded to include trading of NYSE-listed securities.
In November 2008, we converted our ECN to a national securities exchange, BZX, which allowed us to participate in and earn market data fees from the U.S. tape plans, reduce our clearing costs and operate a primary listings business. In order to grow our market share of the U.S. equity market, we launched BYX, a national securities exchange, in October 2010. Like BZX, BYX offers trading in listed cash equity securities and ETPs, such as ETFs, but BYX targets different market segments than BZX by offering alternative pricing. In January 2014, we acquired Direct Edge, which operated two national securities exchanges, EDGX and EDGA. For the nine monthsyear ended September 30,December 31, 2015, our exchanges
combined had a 21.1% share of the U.S. equity market, and we were the second largest exchange operator in the United States after Intercontinental Exchange (operator of the NYSE).
In February 2010, in the United States, we began trading U.S. listed equity options on BZX. In order to grow our market share of the U.S. listed equity options market, we launched an additional options exchange on EDGX in November 2015. For the nine monthsyear ended September 30,December 31, 2015, we had a 9.9%9.6% share of the U.S. options market.
Seeking to compete on a pan-European basis against competing national exchanges, we launched our European MTF in October 2008. In November 2011, we acquired Chi-X Europe, then the operator of the largest pan-European MTF. The merged entity became an RIE in May 2013, operating both an MTF and an RM. BATS Chi-XBats Europe offers secondary trading in over four thousand European listed cash equity securities, in addition to ETFs, exchange-traded commodities and international depositary receipts. In December 2013, we acquired a 25% interest in EuroCCP. For the nine monthsyear ended September 30,December 31, 2015, BATS Chi-XBats Europe had a 24.2%24.4% share of European trading in the securities available for trading on BATS Chi-XBats Europe and was the largest pan-European equities exchange in terms of notional market share. BATS Chi-XBats Europe also offer BATS Exchange Traded Reports,Bats Europe Trade Reporting, or BXTR, the largest European OTC equities trade reporting facility.facility launched in 2013.
In March 2015, we acquired BATSBats Hotspot and entered into the institutional spot FX market with a New York area based matching engine. In September 2015, we launched a second FX matching engine near London, complementing BATSBats Hotspot's New York area matching engine and giving
investors two distinct pools of liquidity to drive price formation globally. From the acquisition date of March 13, 2015 to September 30,December 31, 2015, our ADNV on the BATSBats Hotspot market was $27.8$25.8 billion.
Business Segments
We currently operate along four business segments. Our management allocates resources, assesses performance and manages our business according to these segments:
our Global FX segment would have represented 2.4%2.3% of our total revenues for the nine monthsyear ended September 30,December 31, 2015.
Significant Recent TransactionTransactions Affecting Our Results of Operations
2012 Loan
On December 19, 2012, we entered into (i) a term loan agreement in the amount of $300 million and (ii) revolving loans not to exceed $50 million, which we refer to collectively as the 2012 Loan. The proceeds received from the term loan were used to pay a $298.9 million dividend, or $13.20 per share, to all stockholders of BATSBats Global Markets, Inc. during the fourth quarter of 2012. The term of the loan was six years ending on December 19, 2018 with a variable interest rate based on one-month LIBOR (with a floor of 125 basis points) plus a spread of 575 basis points. The original issue discount was $12.5 million, or approximately 4.2%. The revolving loans had similar interest rates and a three-year term, ending on December 19, 2015. We incurred $7.1 million of debt issuance costs, which was capitalized and was being amortized over the term of the loans. The 2012 Loan was extinguished with proceeds from the 2014 Loan described below.
Direct Edge Acquisition
On January 31, 2014, we acquired 100% of the ownership interests of Direct Edge, which we refer to as the Direct Edge Acquisition. We expect to benefit from various synergies as a result of the acquisition, including compensation and benefits expenses and systems and data communication expenses as a result of our recent technology integration migrating the trading platform of the Direct Edge legacy exchanges to the BATSBats technology, which occurred in January 2015. We also intend to benefit from the ability to offer a wider range of pricing options and more valuable market data as our market share increased with the acquisition. We incurred approximately $0.8 million and $18.5 million in acquisition-related costs during the yearyears ended December 31, 2014.2015 and 2014, respectively.
2014 Loan
Upon consummation of the Direct Edge Acquisition on January 31, 2014, we entered into (i) a term loan agreement in the amount of $470 million and (ii) revolving loans not to exceed $100 million, which we refer to collectively as the 2014 Loan. The proceeds received from the 2014 Loan were used to extinguish the 2012 Loan, pay a $132.9 million dividend, or $4.07 per share, to our stockholders and for other corporate purposes. The 2012 Loan, related debt issuance costs and debt discount were extinguished, resulting in a loss of $13.6 million that was recorded in non-operating expense on the statement of income. The term of the 2014 Loan is six years ending on January 31, 2020 with variable interest rate based on one-month LIBOR (with floor of 100 basis points) plus a spread of 400 basis points (375 if leverage ratio falls below 2.25). The original issue discount was $1.2 million, or approximately 0.25%. The revolving loans have an interest rate of LIBOR plus 350 basis points and a three-year term, ending on January 31, 2017. The fee on the undrawn portion of the revolver is 0.5% and principal payments on outstanding balances are made on a quarterly basis. We incurred $8.3 million of debt issuance costs, which was capitalized and is being amortized over the term of the loans.
Upon consummation of the BATSBats Hotspot Acquisition, we amended our 2014 Loan or the Amended(the "Amended 2014 Loan.Loan"). The Amended 2014 Loan increased the spread on the variable interest rate from 400 basis points to 475 basis points and required a 25 basis point amendment fee. The required annual amortization also increased from 5.0% per annum to 7.5% per annum. In addition, under the Amended 2014 Loan, we entered into (i) a new $150 million three-year term loan, or the 2015 Term Loan B-1, and (ii) a new $228 million five-year term loan, or the 2015 Term Loan B-2, both of which were funded immediately prior to the BATSBats Hotspot Acquisition. The 2015 Term Loan B-1 has an
interest rate based on one-month LIBOR plus a spread of 375 basis points and a 100 basis point original issue discount.discount, or $1.5 million. The 2015 Term Loan B-2 has an interest rate based on one-month LIBOR (with a floor of 100 basis points) plus a spread of 475 basis points and a 100 basis point original issue discount.discount, or $2.3 million. In addition, we entered into a new $100 million revolving credit facility with an interest rate based on one-month LIBOR plus a spread of 350 basis points and an undrawn fee of 50 basis points, replacing the revolving credit facility under the 2014 Loan.
Affiliates of certain of our principal investors are lenders under our Amended 2014 Loan.
BATSBats Hotspot Acquisition
On March 13, 2015, we completed the acquisition of BATSBats Hotspot from KCG Holding, Inc. for $365 million in cash at closing and additional contingent consideration payments with an acquisition-date fair value of $62.6 million. We expect to benefit from various synergies as a result of cost savings from consolidation of technology, operations, compensation and occupancy. We also expect to diversify our revenue, while implementing new products and geographies to the Global FX business. We have incurred approximately $6.4$7.4 million in acquisition-related costs during the nine monthsyear ended September 30,December 31, 2015.
As of the acquisition dates, Direct Edge's and BATSBats Hotspot's assets, liabilities and operations, including amortization and depreciation expenses, are reported under our U.S. Equities and Global FX segments, respectively. As a result of these acquisitions, we acquired goodwill and other indefinite-lived intangible assets of approximately $648.9 million that will be assessed for impairment under ASC 350—Intangibles—Goodwill and Other. We also have approximately $231.4 million in identifiable acquired intangible assets, which will result in approximately $22.3 million in amortization expense in 2016. In addition, pursuant to the BATSBats Hotspot Acquisition agreement, a contingent consideration payment will be payable to the former owner of BATSBats Hotspot to account for a portion of certain tax benefits realized by us from the BATSBats Hotspot Acquisition. The payments are contingent on the company generating sufficient taxable income to recognize the tax benefit. We and the former owner have an option to early terminate the contingent consideration arrangement in 2018 for a one-time payment of $50 million from us to the former owner. The fair value of the contingent consideration liability will be reassessed each reporting period, and any change in such liability will be recorded in our results of operations.
Acquisition Synergies
In the Chi-X Europe acquisition in 2011, we realized approximately $14 million in annualized synergies through December 31, 2012. With the Direct Edge Acquisition, we realized approximately $28 million in annualized synergies through December 31, 2015, and with the Hotspot Acquisition, we realized approximately $4 million in annualized synergies through December 31, 2015. We expect to realize an additional $19 million and $5 million in annualized synergies through December 31, 2016 from the Direct Edge and Hotspot Acquisitions, respectively. The following summarizes the total synergies realized or expected, as applicable, listed by expense category, for each of our acquisitions for the time periods indicated:
| | Chi-X Europe | Direct Edge | Hotspot | |||||||||||||
|---|---|---|---|---|---|---|---|---|---|---|---|---|---|---|---|---|
| | Realized as of 12/31/15 | Realized as of 12/31/15 | Additional Expected through 12/31/16 | Realized as of 12/31/15 | Additional Expected through 12/31/16 | |||||||||||
Compensation and benefits | $ | 9.7 | $ | 22.1 | $ | 2.2 | $ | 4.3 | $ | 4.9 | ||||||
Depreciation | 0.1 | — | — | — | — | |||||||||||
Systems and data communication | 4.1 | 0.3 | 7.6 | — | — | |||||||||||
Occupancy | 0.5 | (0.3 | ) | 0.6 | — | — | ||||||||||
Professional fees | — | 1.1 | (0.7 | ) | — | — | ||||||||||
Regulatory costs | — | (1.3 | ) | 0.8 | — | — | ||||||||||
General and administrative | — | 6.3 | 8.0 | — | — | |||||||||||
| | | | | | | | | | | | | | | | | |
| $ | 14.4 | $ | 28.2 | $ | 18.5 | $ | 4.3 | $ | 4.9 | |||||||
Our Model
Like many of our listed cash equity securities and listed equity options competitors, we have adopted a price/time priorityprice-time-priority system, where the first order to our book takes priority. We use both "maker-taker" and "taker-maker" pricing models on our exchanges. The maker-taker pricing model is designed to incentivize market makers to provide liquidity on a continuous basis. Participants are attracted to markets that have continuous and deep liquidity, which provides more opportunity to buy and sell equities immediately and with minimal adverse effect on prices. Because market makers supply a valuable service to markets by providing liquidity, maker-taker pricing rewards them with a rebate.
Under our maker-taker pricing model, on BZX (for both listed cash equity securities and listed equity options), EDGX (for listed cash equity securities and listed equity options, which was launched in November 2015) and on BATS Chi-XBats Europe, a customer posting an order on our book, which we refer to as the liquidity maker or liquidity provider, is paid a rebate for an execution occurring against that order, and a customer executing against an order resting on our book, which we refer to as the liquidity taker or liquidity remover, is charged a fee. We generate a substantial portion of our operating income from the difference between the "maker" rebate and the "taker" fee. We believe this type of fee schedule is attractive to customers who regularly provide liquidity. Although customers must pay a fee to access that liquidity, that fee is explicitly disclosed and charged to all customers on a non-discriminatory basis.
The BYX and EDGA listed cash equity securities "taker-maker" pricing model provides that a liquidity taker will be paid a rebate for executing against an order resting on our book, and the liquidity provider will be charged a fee for posting such an order. In this case, we generate revenues less cost of revenues from the difference between the "maker" fee and the "taker" rebate. Currently, both the fee and the rebate are significantly less than the rebates and fees in place on BZX and EDGX. We believe this appeals to market participants who are primarily interested in the most cost-effective means of accessing resting liquidity, but less concerned about the depth of liquidity available
on the market. In addition, we believe this model appeals to market participants trading lower-priced securities.
Like two-thirds of the listed equity options market, we have adopted a "pro rata" model on listed equity options trading on EDGX. The pro rata model is based on customer priority and pro rata allocations model, meaning orders are given priority based on price, size and capacity rather than simply on price and time. Our EDGX options market will also utilize payment for order flow fees where market makers can incent other members to trade.
For unfilled orders, we also provide our customers a smart-order routing service, enabling the onward routing of unfilled orders to other market centers. In the United States, this is facilitated through our wholly-owned broker-dealer subsidiary, BATSBats Trading. In Europe, BATS Chi-XBats Europe operates an order routing facility through our wholly-owned subsidiary Chi-X Europe Limited and is one of the few market centers in Europe that provides such routing services.
The BATSBats Hotspot Platform uses a price/time priorityprice-time-priority model. The BATSBats Hotspot Platform consists of a mixture of both firm and non-firm liquidity provided by both clients and dedicated liquidity providers and enables BATSBats Hotspot to offer its clients customized liquidity solutions. BATSBats Hotspot clients are charged either a flat or tiered commission rate based upon the notional amount traded on the BATSBats Hotspot Platform. These rates are expressed as U.S. dollars per million notional U.S. dollars traded. The flat commission rate or tiers applicable to each client are determined on a client-by-client basis by management in light of market forces and client activity.
Factors Affecting Results of Operations
In broad terms, our business performance is impacted by a number of drivers including macroeconomic events affecting the risk and return of financial assets, investor sentiment, the regulatory environment for capital markets, and changing technology, particularly in the financial services industry. Our future revenues and net income will continue to be influenced by a number of domestic and international economic trends including:
Currently our business drivers are defined by investors' and companies' cautiously optimistic outlook about the pace of global economic recovery. The U.S. and European listed cash equity securities markets have historically experienced growth in trading volumes. From time to time, however, volumes have declined due to economic performance, volatility and other related factors.
Although some major U.S. market indices reached record levels in 2014, European equity markets have not performed as well and many remain below their pre-financial crisis highs. Since a number of significant structural and political issues continue to confront the global economy, instability could
return at any time, resulting in an increased level of market volatility, oscillating trading volumes and a return of market uncertainty. In contrast, many of the largest customers of our transactional businesses continue to adapt their business models as they address the implementation of regulatory changes initiated following the global financial crisis.
With the acquisitions of Chi-X Europe in 2011 and Direct Edge in 2014, we significantly increased our presence in the European and U.S. listed cash equity securities markets. This lets us compete more readily with other large exchanges in Europe and the United States and better manage the macroeconomic factors and industry pressures discussed above. We operate the largest pan-European
equity exchange by notional value traded and the second largest U.S. cash equities exchange by market share. With the BATSBats Hotspot Acquisition in 2015, we entered the market for the world's largest asset class, FX, to further diversify our product offerings.
Components of Revenues
Transaction Fees
General
Total transaction fees during a period are variable, based on trading volume and pricing per share on our U.S. listed cash equity markets, pricing as a percentage of notional value on our European listed cash equities market, pricing per contract on our U.S. listed equity options market and pricing per million U.S. dollars traded on our institutional spot FX market.
Transaction fees consist of "taker" fees (or in the case of BYX and EDGA, "maker" fees) and routing fees charged on securities that are routed out to another market center. Transaction fees are considered earned upon the execution of the trade and are recognized on a trade-date basis. The "taker" fees (or in the case of BYX and EDGA, "maker" fees) from transactions executed through our markets are recorded on a gross basis in revenues, with "maker" rebates (or in the case of BYX and EDGA, "taker" rebates) recorded on a gross basis in cost of revenues. Transaction fee revenues accounted for 72.7% of our total revenues for the nine months ended September 30, 201572.5%, 69.3% and 69.3%, 72.8% and 72.9% of our total revenues for the years ended December 31, 2015, 2014 2013 and 2012,2013, respectively. Transaction fees from BZX, BYX, EDGX and EDGA were 31.1%30.3%, 10.5%10.6%, 27.0%28.2% and 3.6%3.8%, respectively, of our total transaction fees for the nine monthsyear ended September 30,December 31, 2015, and 51.0%, 8.3%, 29.6% and 5.0%, respectively, of our total transaction fees for the year ended December 31, 2014. The differences are based on the individual pricing strategies for each exchange and the specific customers to which it is tailored.
our total transaction fees for the nine monthsyear ended September 30,December 31, 2015 and 7.9% of our total transaction fees for the year ended December 31, 2014. Pro forma for the acquisitions of Direct Edge and BATSBats Hotspot, our European Equities segment would have represented 7.7%7.5% of our total transaction fees for the nine monthsyear ended September 30,December 31, 2015 and 7.2% of our total transaction fees for the year ended December 31, 2014.
U.S. Options accounted for 17.8%17.2% of our total transaction fees for the nine monthsyear ended September 30,December 31, 2015 and 11.3% of our total transaction fees for the year ended December 31, 2014. Pro forma for the acquisitions of Direct Edge and BATSBats Hotspot, our U.S. Options segment would have represented 17.6%17.1% of our total transaction fees for the nine monthsyear ended September 30,December 31, 2015 and 10.2% of our total transaction fees for the year ended December 31, 2014. As of September 30, 2015December 31, 2014 all U.S. Options transaction fees were earned by BZX. The EDGX Options platform launched in November 2015, however transaction fees from BZX still comprised 100.0% of the transaction fees earned by our U.S. Options segment for the year ended December 31, 2015.
Trading volumes
Transaction fees for all of our markets are primarily dependent on overall market volume and our market share thereof. Each of our markets have historically experienced growth in trading volumes. From time to time, however, volumes have declined due to economic performance, volatility and other related factors.
Pricing
We strive to keep our pricing as competitive and innovativemarket-leading as possible. We generally assess prices on a per-share basis in our U.S. listed cash equities markets, as a percentage of notional value traded in our European listed cash equity securities market, on a per-contract basis in our U.S. listed equity options market and per million U.S. dollars traded in our foreign currency market.
In order to remain competitive in the U.S. listed cash equity securities market, we have historically maintained a competitively lower net capture spread between our "taker" fee (or in the case of BYX and EDGA, "maker" fee) and our "maker" rebate (or in the case of BYX and EDGA, "taker" rebate) when compared to competing exchanges. In Europe, we also use a low net capture spread "maker-taker" pricing model. We regularly monitor the pricing and net capture spread of our competitors and our relative position, and may make pricing changes to reach market share or other targets. Any changes we make to our pricing may significantly impact our revenues and cost of revenues.
BATSBats Hotspot clients are charged either a flat or tiered commission rate expressed as U.S. dollars per million notional U.S. dollars traded. Rates are determined on a client-by-client basis by BATSBats Hotspot management and sales in light of market forces and client activity in order to maximize revenue and volume. Additionally, from time to time BATSBats Hotspot may offer certain special limited duration pricing programs such as free trading of spot gold and silver pairs or free trading for all transactions on BATSBats Hotspot's London-based matching engine.
Regulatory Transaction Fees
BZX, BYX, EDGX and EDGA, as national securities exchanges, are assessed fees pursuant to Section 31 of the Exchange Act. BATS Chi-XBats Europe and BATSBats Hotspot are not assessed any Section 31 fees because they are not U.S. national securities exchanges. BATS Chi-XBats Europe's regulatory fees are assessed by reference to the oversight costs of the FCA relating to RIEs. Section 31 fees are assessed on the notional value of equities and options traded and are designed to recover the costs to the U.S. government of supervision and regulation of securities markets and securities professionals. These fees are paid directly to the SEC by our four exchanges. Our exchanges, in turn,
collect regulatory transaction fees from our customers that equal the Section 31 fees that we pay to the SEC and recognize these amounts as incurred in revenues and costs of revenues, respectively. We are paid these Section 31 fees as principal, and therefore these fees are reported gross in our consolidated statements of income. Regulatory transaction fees received are included in cash and cash equivalents and financial investments in our consolidated statements of financial condition. As required by law, the amounts due to the SEC are remitted semiannually in March and September. Because we hold the cash received until payment is remitted to the SEC, we earn interest on the related cash balances. Regulatory transaction fees accounted for 15.5% of total revenues for the nine months ended September 30, 2015,, 18.7% and 18.7%, 15.1% and 16.7% of our total revenues in 2015, 2014 2013 and 2012,2013, respectively.
Market Data Fees
We earn market data fees from U.S. tape plans, including the UTP Plan, CTA Plan, CQS Plan and OPRA. Fees, net of plan costs, from UTP, CTA and CQS are allocated and distributed to plan participants according to their share of tape fees based on a formula, required by Regulation NMS, that takes into account both trading and quoting activity. Market data fees from OPRA are allocated based upon the share of total options transactions cleared for each of the OPRA members.
We also charge data subscribers directly for proprietary market data of our U.S. equities, U.S. options and European equities markets. The proprietary market data fees are recognized as the service is provided. Market data fees accounted for 7.4% of total revenues for the nine months ended September 30, 2015, 7.6% and 7.6%, 7.1% and 6.8% of total revenues in 2015, 2014 2013 and 2012,2013, respectively.
Port Fees and Other
Port fees and other revenues consist primarily of logical and physical port fees, which represent fees paid for connectivity to our equities and options markets. Revenues for providing access to our markets are recognized when the service is provided. Port fees and other revenues accounted for 4.6%, 4.4% of total revenues for the nine months ended September 30, 2015, and 4.4%, 5.0% and 3.6% of our total revenues in 2015, 2014 and 2013, and 2012, respectively.
Components of Cost of Revenues
Liquidity Payments
Liquidity payments are directly correlated to the volume of securities traded on our markets. As mentioned above, we record the liquidity rebate paid to market participants providing liquidity, in the case of BZX, EDGX and BATS Chi-XBats Europe, as cost of revenue. BYX and EDGA offer a pricing model pursuant to which we rebate liquidity takers for executing against an order resting on our book, which is also recorded as a cost of revenue.
Routing and Clearing
Routing and clearing are also correlated to the volume of securities routed to other market venues. We offer a multitude of order routing strategies to our customers. These strategies allow our customers to access other markets through the use of our smart-order routing tools. Most of these strategies first seek to trade against orders resting on our order books and, if filled in full, are not routed to other markets. Therefore, total routing expenses are inversely correlated to the depth on our order books because as the volume of securities traded by our customers that are matched by us against orders resting on our books increases, routing expenses decrease. In Europe, we are one of the few market centers that provides such routing services to lit venues.
Also, BATSBats Trading, the routing facility for our U.S. listed cash equities and listed equity options markets, incurs clearing fees on all activity routed to other market centers because it relies on third-party clearing firms to provide this service. We continue to seek low cost initiatives for reaching other market centers and periodically negotiate new pricing contracts and methods to reach those markets.
Section 31 Fees
BZX, BYX, EDGX and EDGA are assessed fees pursuant to the Exchange Act designed to recover the costs to the U.S. government of supervision and regulation of securities markets and securities professionals. We treat these fees as a pass-through charge to customers executing eligible listed cash equities and listed equity options trades on BZX, BYX, EDGX and EDGA. Accordingly, we recognize the amount that we are charged under Section 31 as a cost of revenues and the corresponding amount that we charge our customers as regulatory transaction fees revenue. Since the regulatory transaction fees recorded in revenues are equal to the Section 31 fees recorded in cost of revenues, there is no impact on our operating income.
Given that BATS Chi-XBats Europe and BATSBats Hotspot are not U.S. national securities exchanges, they do not pay Section 31 fees.
Other
Other costs of revenues are mostly isolated in nature and non-recurring in the normal course of our business.
Components of Operating Expenses
Compensation and benefits represent our largest operating expense and tend to be driven by our staffing requirements and the general dynamics of the employment market. Additional operating expenses generally support the infrastructure of our markets and technology platforms and are primarily fixed in nature. While these expenses do not vary as a direct result of trading volume, they may increase over time as we enhance capacity and improve performance. As a public corporation, we expect general and administrative and professional costs to increase as we satisfy our obligations under the U.S. securities laws and comply with the Sarbanes-Oxley Act, among others. The increases could include, but are not limited to, an increase in staffing levels to provide support in meeting the operational and regulatory requirements of a public corporation, additional professional fees paid to external auditors, consultants and outside counsels, additional executive risk insurance costs and fees paid to a third-party institution to provide transfer agency services for the maintenance of stockholder records.
Interest and Investment Expense, Net
Interest and investment expense, net represents the interest expense related to our long-term debt, offset by interest income on the investment of excess cash. We invest our excess cash in highly liquid, capital-preserving and short-term financial investments, such as U.S. Treasury securities.
Other Income (Expense)
Other income (expense) primarily consists of foreign currency gains (losses) and our earnings from equity method investments. Foreign currency gains (losses) are recognized by us, as the functional currency of BATS Chi-XBats Europe and the Hotspot Europe entities is the British pound. The functional currency
of Bats Hotspot Asia Pte. Ltd. is the Singapore dollar. Earnings from equity method investments represents our ownership in EuroCCP.
Income Taxes
We have elected to treat BATSBats Trading Limited and Chi-X Europe as branches for U.S. federal income tax purposes. As a result, the taxable income or loss of BATS Chi-XBats Europe and Chi-X Europe is included in our consolidated U.S. federal income tax return. For U.K. tax purposes, BATS Chi-XBats Europe and Chi-X Europe previously incurred tax losses which are expected to bewere fully utilized in 2015. Any U.K. income taxes accrued beginning in 2015 were and will be available to offset our U.S. income taxes as a foreign tax credit. BATSBats Hotspot Europe Limited and BATSBats Hotspot Asia Pte. Ltd. are corporations operating in the United Kingdom and Singapore, respectively. Income generated by both companies is considered indefinitely reinvested and is deferred from U.S. tax until repatriated.
Results of Operations
The following table sets forth our consolidated statements of operations data for each of the periods indicated as a percentage of total revenues:
| | Nine Months Ended September 30, | Year Ended December 31, | Year Ended December 31, | |||||||||||||||||||||||
|---|---|---|---|---|---|---|---|---|---|---|---|---|---|---|---|---|---|---|---|---|---|---|---|---|---|---|
| | 2015 | 2014 | 2014 | 2013 | 2012 | 2015 | 2014 | 2013 | ||||||||||||||||||
Revenues: | ||||||||||||||||||||||||||
Transaction fees | 72.7 | % | 69.1 | % | 69.3 | % | 72.8 | % | 72.9 | % | 72.5 | % | 69.3 | % | 72.8 | % | ||||||||||
Regulatory transaction fees | 15.5 | % | 18.2 | % | 18.7 | % | 15.1 | % | 16.7 | % | 15.5 | % | 18.7 | % | 15.1 | % | ||||||||||
Market data fees | 7.4 | % | 7.9 | % | 7.6 | % | 7.1 | % | 6.8 | % | 7.4 | % | 7.6 | % | 7.1 | % | ||||||||||
Other | 4.4 | % | 4.8 | % | 4.4 | % | 5.0 | % | 3.6 | % | 4.6 | % | 4.4 | % | 5.0 | % | ||||||||||
| | | | | | | | | | | | | | | | | | | | | | | | | | | |
Total revenues | 100.0 | % | 100.0 | % | 100.0 | % | 100.0 | % | 100.0 | % | 100.0 | % | 100.0 | % | 100.0 | % | ||||||||||
Cost of revenues: | ||||||||||||||||||||||||||
Liquidity payments | 60.3 | % | 56.5 | % | 57.0 | % | 56.4 | % | 57.4 | % | 60.2 | % | 57.0 | % | 56.4 | % | ||||||||||
Section 31 fees | 15.5 | % | 18.2 | % | 18.7 | % | 15.1 | % | 16.7 | % | 2.7 | % | 18.7 | % | 15.1 | % | ||||||||||
Routing and clearing | 2.8 | % | 3.5 | % | 3.2 | % | 5.1 | % | 5.9 | % | 15.5 | % | 3.2 | % | 5.1 | % | ||||||||||
Other | — | — | — | — | — | |||||||||||||||||||||
| | | | | | | | | | | | | | | | | | | | | | | | | | | |
Total cost of revenues | 78.6 | % | 78.2 | % | 78.9 | % | 76.6 | % | 80.0 | % | 78.4 | % | 78.9 | % | 76.6 | % | ||||||||||
| | | | | | | | | | | | | | | | | | | | | | | | | | | |
Revenues less cost of revenues | 21.4 | % | 21.8 | % | 21.1 | % | 23.4 | % | 20.0 | % | 21.6 | % | 21.1 | % | 23.4 | % | ||||||||||
Operating expenses: | ||||||||||||||||||||||||||
Compensation and benefits | 4.4 | % | 6.5 | % | 6.0 | % | 4.9 | % | 5.5 | % | 4.5 | % | 6.0 | % | 4.9 | % | ||||||||||
Depreciation and amortization | 2.1 | % | 2.0 | % | 1.9 | % | 1.8 | % | 1.9 | % | 2.3 | % | 1.9 | % | 1.8 | % | ||||||||||
Systems and data communication | 1.6 | % | 1.6 | % | 1.6 | % | 1.1 | % | 1.3 | % | 1.5 | % | 1.6 | % | 1.1 | % | ||||||||||
Occupancy | 0.2 | % | 0.3 | % | 0.3 | % | 0.2 | % | 0.3 | % | 0.2 | % | 0.3 | % | 0.2 | % | ||||||||||
Professional and contract services | 0.7 | % | 0.5 | % | 0.4 | % | 1.0 | % | 1.0 | % | 0.6 | % | 0.4 | % | 1.0 | % | ||||||||||
Regulatory costs | 0.6 | % | 0.8 | % | 0.8 | % | 0.6 | % | 0.6 | % | 0.6 | % | 0.8 | % | 0.6 | % | ||||||||||
Change in fair value of contingent consideration liability | 0.1 | % | — | — | — | 1.4 | % | 0.2 | % | — | — | |||||||||||||||
Impairment of assets | — | — | — | 0.4 | % | — | — | — | 0.4 | % | ||||||||||||||||
General and administrative | 1.6 | % | 1.9 | % | 1.9 | % | 1.3 | % | 1.3 | % | 1.5 | % | 1.9 | % | 1.3 | % | ||||||||||
| | | | | | | | | | | | | | | | | | | | | | | | | | | |
Total operating expenses | 11.3 | % | 13.6 | % | 12.9 | % | 11.3 | % | 13.3 | % | 11.4 | % | 12.9 | % | 11.3 | % | ||||||||||
| | | | | | | | | | | | | | | | | | | | | | | | | | | |
Operating income | 10.1 | % | 8.2 | % | 8.2 | % | 12.1 | % | 6.7 | % | 10.2 | % | 8.2 | % | 12.1 | % | ||||||||||
Interest and investment expense | (2.6 | )% | (2.0 | )% | (1.9 | )% | (3.1 | )% | (0.1 | )% | ||||||||||||||||
Interest expense, net | (2.6 | )% | (1.9 | )% | (3.1 | )% | ||||||||||||||||||||
Loss on extinguishment of debt | — | (1.3 | )% | (0.9 | )% | — | — | — | (0.9 | )% | — | |||||||||||||||
Other income (expense) | 0.2 | % | 0.1 | % | 0.1 | % | — | — | ||||||||||||||||||
Other income | 0.2 | % | 0.1 | % | — | |||||||||||||||||||||
| | | | | | | | | | | | | | | | | | | | | | | | | | | |
Income before income tax provision | 7.7 | % | 5.0 | % | 5.5 | % | 9.0 | % | 6.6 | % | 7.8 | % | 5.5 | % | 9.0 | % | ||||||||||
Income tax provision | 3.2 | % | 2.0 | % | 2.1 | % | 3.4 | % | 3.0 | % | 3.2 | % | 2.1 | % | 3.4 | % | ||||||||||
| | | | | | | | | | | | | | | | | | | | | | | | | | | |
Net income | 4.5 | % | 3.0 | % | 3.4 | % | 5.6 | % | 3.6 | % | 4.6 | % | 3.4 | % | 5.6 | % | ||||||||||
| | | | | | | | | | | | | | | | | | | | | | | | | | | | |
| | | | | | | | | | | | | | | | | | | | | | | | | | | |
Comparison of Nine MonthsYears Ended September 30,December 31, 2015 and 2014
Overview
The following summarizes changes in financial performance for the nine monthsyear ended September 30,December 31, 2015, compared to the nine monthsyear ended September 30,December 31, 2014:
| | Nine Months Ended September 30, | | | Year Ended December 31, | | | ||||||||||||||||||||
|---|---|---|---|---|---|---|---|---|---|---|---|---|---|---|---|---|---|---|---|---|---|---|---|---|---|---|
| | Increase/ (Decrease) | Percent Change | Increase/ (Decrease) | Percent Change | ||||||||||||||||||||||
| | 2015 | 2014 | 2015 | 2014 | ||||||||||||||||||||||
| | (in millions, except percentages and as noted below) | (in millions, except percentages, trading days, earnings per share and as noted below) | ||||||||||||||||||||||||
Total revenues | $ | 1,335.2 | $ | 1,024.4 | $ | 310.8 | 30.3 | % | $ | 1,778.7 | $ | 1,458.2 | $ | 320.5 | 22.0 | % | ||||||||||
Total cost of revenues | 1,049.4 | 800.6 | 248.8 | 31.1 | % | 1,394.3 | 1,150.7 | 243.6 | 21.2 | % | ||||||||||||||||
| | | | | | | | | | | | | | | | | | | | | | | | | | ||
Revenues less cost of revenues | 285.8 | 223.8 | 62.0 | 27.7 | % | 384.4 | 307.5 | 76.9 | 25.0 | % | ||||||||||||||||
Total operating expenses | 150.8 | 139.5 | 11.3 | 8.1 | % | 202.1 | 187.9 | 14.2 | 7.6 | % | ||||||||||||||||
| | | | | | | | | | | | | | | | | | | | | | | | | | ||
Operating income | 135.0 | 84.3 | 50.7 | 60.1 | % | 182.3 | 119.6 | 62.7 | 52.4 | % | ||||||||||||||||
| | | | | | | | | | | | | | | | | | | | | | | | | | ||
Income before income tax provision | 103.4 | 51.6 | 51.8 | 100.4 | % | 138.7 | 80.3 | 58.4 | 72.7 | % | ||||||||||||||||
Income tax provision | 42.9 | 20.7 | 22.2 | 107.2 | % | 56.5 | 31.1 | 25.4 | 81.7 | % | ||||||||||||||||
| | | | | | | | | | | | | | | | | | | | | | | | | | ||
Net income | $ | 60.5 | $ | 30.9 | $ | 29.6 | 95.8 | % | $ | 82.2 | $ | 49.2 | $ | 33.0 | 67.1 | % | ||||||||||
| | | | | | | | | | | | | | | | | | | | | | | | | | | |
| | | | | | | | | | | | | | | | | | | | | | | | | | ||
EBITDA(1) | $ | 166.1 | $ | 92.8 | $ | 73.3 | 79.0 | % | $ | 226.1 | $ | 136.0 | $ | 90.1 | 66.3 | % | ||||||||||
EBITDA margin(2) | 58.1 | % | 41.5 | % | 16.6 | % | * | 58.8 | % | 44.2 | % | 14.6 | % | * | ||||||||||||
Normalized EBITDA(1) | $ | 172.5 | $ | 121.0 | $ | 51.5 | 42.6 | % | $ | 235.3 | $ | 168.1 | $ | 67.2 | 40.0 | % | ||||||||||
Normalized EBITDA margin(3) | 60.4 | % | 54.1 | % | 6.3 | % | * | 61.2 | % | 54.7 | % | 6.5 | % | * | ||||||||||||
Market ADV: | ||||||||||||||||||||||||||
U.S. Equities (in millions of shares) | 6,864.8 | 6,214.0 | 650.8 | 10.5 | % | |||||||||||||||||||||
BATS ETPs (in millions of shares) | 361.7 | 246.3 | 115.4 | 46.9 | % | |||||||||||||||||||||
BATS ETPs: launches (number of launches) | 7 | 2 | 5 | 250.0 | % | |||||||||||||||||||||
BATS ETPs: listings (number of listings) | 35 | 25 | 10 | 40.0 | % | |||||||||||||||||||||
European Equities (in millions of ADNV) | € | 52,394.2 | € | 38,124.1 | € | 14,270.1 | 37.4 | % | ||||||||||||||||||
U.S. Options (in thousands of contracts) | 16,271.1 | 16,281.5 | (10.4 | ) | (0.1 | )% | ||||||||||||||||||||
Global FX (in billions of notional value) | $ | 27.8 | * | * | * | |||||||||||||||||||||
Adjusted earnings(4) | $ | 103.6 | $ | 75.2 | $ | 28.4 | 37.8 | % | ||||||||||||||||||
Adjusted earnings margin(5) | 27.0 | % | 24.5 | % | 2.5 | % | * | |||||||||||||||||||
Diluted Adjusted earnings per share(6) | $ | 3.17 | $ | 2.37 | $ | .8 | 33.8 | % | ||||||||||||||||||
U.S. Equities: | ||||||||||||||||||||||||||
ADV: | ||||||||||||||||||||||||||
Matched shares ADV (in billions) | 1.5 | 1.2 | 0.3 | 25.0 | % | |||||||||||||||||||||
Routed shares ADV (in billions) | 0.1 | 0.1 | — | — | ||||||||||||||||||||||
| | | | | | | | | | | | | | ||||||||||||||
Total touched shares (in billions) | 1.6 | 1.3 | 0.3 | 23.1 | % | |||||||||||||||||||||
| | | | | | | | | | | | | | ||||||||||||||
| | | | | | | | | | | |||||||||||||||||
| | | | | | | | | | | | | | ||||||||||||||
Market ADV (in billions) | 6.9 | 6.4 | 0.5 | 7.8 | % | |||||||||||||||||||||
Trading days | 252 | 252 | — | — | ||||||||||||||||||||||
Bats ETPs (in billions of shares) | 0.4 | 0.3 | 0.1 | 33.3 | % | |||||||||||||||||||||
Bats ETPs: launches (number of launches) | 26 | 5 | 21 | 420.0 | % | |||||||||||||||||||||
Bats ETPs: listings (number of listings) | 56 | 28 | 28 | 100.0 | % | |||||||||||||||||||||
European Equities: | ||||||||||||||||||||||||||
ADNV: | ||||||||||||||||||||||||||
Matched and touched ADNV (in billions) | € | 12.4 | € | 8.6 | € | 3.8 | 44.2 | % | ||||||||||||||||||
Market ADNV (in billions) | € | 50.8 | € | 39.7 | € | 11.1 | 28.0 | % | ||||||||||||||||||
Trading days | 257 | 256 | 1 | 0.4 | % | |||||||||||||||||||||
Average Euro/British pound exchange rate | £0.7263 | £0.8062 | £(0.0799 | ) | (9.9 | )% | ||||||||||||||||||||
U.S. Options: | ||||||||||||||||||||||||||
ADV: | ||||||||||||||||||||||||||
Matched contracts ADV | 1.5 | 0.8 | 0.7 | 87.5 | % | |||||||||||||||||||||
Routed contracts ADV | 0.1 | — | 0.1 | * | ||||||||||||||||||||||
| | | | | | | | | | | | | | ||||||||||||||
Total touched contracts | 1.6 | 0.8 | 0.8 | 100.0 | % | |||||||||||||||||||||
| | | | | | | | | | | | | | ||||||||||||||
| | | | | | | | | | | |||||||||||||||||
| | | | | | | | | | | | | | ||||||||||||||
Market ADV | 16.1 | 16.6 | (0.5 | ) | (3.0 | )% | ||||||||||||||||||||
Trading days | 252 | 252 | — | — | ||||||||||||||||||||||
Global FX: | ||||||||||||||||||||||||||
ADNV (in billions) | $ | 25.8 | * | * | * | |||||||||||||||||||||
Trading days | 209 | * | * | * | ||||||||||||||||||||||
Market share: | ||||||||||||||||||||||||||
U.S. Equities | 21.1 | % | 18.9 | % | 2.2 | % | * | 21.1 | % | 19.4 | % | 1.7 | % | * | ||||||||||||
ETPs | 22.4 | % | 22.3 | % | 0.1 | % | * | 22.4 | % | 22.2 | % | 0.2 | % | * | ||||||||||||
ETPs: launches | 3.4 | % | 1.3 | % | 2.1 | % | * | 10.1 | % | 2.5 | % | 7.6 | % | * | ||||||||||||
ETPs: listings | 2.0 | % | 1.5 | % | 0.5 | % | * | 3.1 | % | 1.7 | % | 1.4 | % | * | ||||||||||||
European Equities | 24.2 | % | 21.3 | % | 2.9 | % | * | 24.4 | % | 21.6 | % | 2.8 | % | * | ||||||||||||
U.S. Options | 9.9 | % | 4.2 | % | 5.7 | % | * | 9.6 | % | 4.8 | % | 4.8 | % | * | ||||||||||||
Maker-taker exchanges(4) | 9.8 | % | 4.2 | % | 5.6 | % | * | |||||||||||||||||||
Net capture: | ||||||||||||||||||||||||||
U.S. Equities (net capture per one hundred touched shares) | $ | 0.021 | $ | 0.022 | $ | (0.001 | ) | (4.5 | )% | $ | 0.021 | $ | 0.022 | $ | (0.001 | ) | (4.5 | )% | ||||||||
European Equities (net capture per matched notional value in basis points) | 0.132 | 0.164 | (0.032 | ) | (19.5 | )% | 0.133 | 0.162 | (0.029 | ) | (17.9 | )% | ||||||||||||||
U.S. Options (net capture per touched contract) | $ | 0.024 | $ | 0.049 | $ | (0.025 | ) | (51.0 | )% | $ | 0.030 | $ | 0.046 | $ | (0.016 | ) | (34.8 | )% | ||||||||
Global FX (net capture per one million dollars traded) | $ | 3.01 | * | * | * | $ | 2.95 | * | * | * | ||||||||||||||||
Average British pound/U.S. dollar exchange rate | 1.5322 | 1.6691 | (0.1369 | ) | (8.2 | )% | $ | 1.5283 | $ | 1.6476 | $ | (0.1652 | ) | (7.2 | )% | |||||||||||
gain on extinguishment of revolving credit facility. EBITDA and Normalized EBITDA do not represent, and should not be considered as, alternatives to net income or cash flows from
operations, each as determined in accordance with U.S. GAAP. We have presented EBITDA and Normalized EBITDA because we consider them important supplemental measures of our performance and believe that they are frequently used by analysts, investors and other interested parties in the evaluation of companies. In addition, we use Normalized EBITDA as a measure of operating performance for preparation of our forecasts, evaluating our leverage ratio for the debt to earnings covenant included in our outstanding credit facility and calculating employee and executive bonuses. Other companies may calculate EBITDA and Normalized EBITDA differently than we do. EBITDA and Normalized EBITDA have limitations as analytical tools, and you should not consider them in isolation or as substitutes for analysis of our results as reported under U.S. GAAP.
The following is a reconciliation of net income to EBITDA and Normalized EBITDA:
| | Nine Months Ended September 30, | Year Ended December 31, | ||||||||||||
|---|---|---|---|---|---|---|---|---|---|---|---|---|---|---|
| | 2015 | 2014 | 2015 | 2014 | ||||||||||
| | (in millions) | (in millions) | ||||||||||||
Net income | $ | 60.5 | $ | 30.9 | $ | 82.2 | $ | 49.2 | ||||||
Interest | 34.2 | 20.3 | 46.6 | 27.3 | ||||||||||
Income tax provision | 42.9 | 20.7 | 56.5 | 31.1 | ||||||||||
Depreciation and amortization | 28.5 | 20.9 | 40.8 | 28.4 | ||||||||||
| | | | | | | | | | | | | | | |
EBITDA | 166.1 | 92.8 | 226.1 | 136.0 | ||||||||||
Acquisition-related costs | 6.4 | 14.6 | 8.2 | 18.5 | ||||||||||
IPO costs | 0.5 | — | 1.5 | — | ||||||||||
Loss on extinguishment of debt | — | 13.6 | — | 13.6 | ||||||||||
Other one-time items | (0.5 | ) | — | |||||||||||
Debt restructuring | 0.5 | — | ||||||||||||
Gain on extinguishment of revolving credit facility | (1.0 | ) | — | |||||||||||
| | | | | | | | | | | | | | | |
Normalized EBITDA | $ | 172.5 | $ | 121.0 | $ | 235.3 | $ | 168.1 | ||||||
| | | | | | | | | | | | | | | | |
| | | | | | | | | | | | | | | |
The following is a reconciliation of net income to Adjusted earnings:
| | Year Ended December 31, | ||||||
|---|---|---|---|---|---|---|---|
| | 2015 | 2014 | |||||
| | (in millions) | ||||||
Net income | $ | 82.2 | $ | 49.2 | |||
Amortization | 26.9 | 10.3 | |||||
Tax effect of amortization | (11.0 | ) | (4.0 | ) | |||
Acquisition-related costs | 8.2 | 18.5 | |||||
IPO costs | 1.5 | — | |||||
Loss on extinguishment of debt | — | 13.6 | |||||
Debt restructuring | 0.5 | — | |||||
Gain on extinguishment of revolving credit facility | (1.0 | ) | — | ||||
Tax effect of other items | (3.7 | ) | (12.4 | ) | |||
| | | | | | | | |
Adjusted earnings | $ | 103.6 | $ | 75.2 | |||
| | | | | | | | |
| | | | | | | | |
| | | | | | | | |
Revenues
Total revenues for the nine monthsyear ended September 30,December 31, 2015 were $1,335.2$1,778.7 million, an increase of $310.8$320.5 million, or 30.3%22.0%, compared to the nine monthsyear ended September 30,December 31, 2014, reflecting, in part, higher transaction fees due to higher market share, up to 9.9%9.6%, in our U.S. Options segment and a 10.5% increase in market volumesup to 21.1% in our U.S. Equities segment. The incremental revenue from the Bats Hotspot Acquisition of
$31.8 million also contributed to the increase. The following summarizes changes in revenues for the nine monthsyear ended September 30,December 31, 2015, compared to the nine monthsyear ended September 30,December 31, 2014:
| | Nine Months Ended September 30, | | | Year Ended December 31, | | | ||||||||||||||||||||
|---|---|---|---|---|---|---|---|---|---|---|---|---|---|---|---|---|---|---|---|---|---|---|---|---|---|---|
| | Increase/ (Decrease) | Percent Change | Increase/ (Decrease) | Percent Change | ||||||||||||||||||||||
| | 2015 | 2014 | 2015 | 2014 | ||||||||||||||||||||||
| | (in millions, except percentages) | (in millions, except percentages) | ||||||||||||||||||||||||
Transaction fees | $ | 970.1 | $ | 707.7 | $ | 262.4 | 37.1 | % | $ | 1,290.2 | $ | 1,009.9 | $ | 280.3 | 27.8 | % | ||||||||||
Regulatory transaction fees | 207.0 | 186.5 | 20.5 | 11.0 | % | 275.7 | 272.0 | 3.7 | 1.4 | % | ||||||||||||||||
Market data fees | 99.4 | 81.2 | 18.2 | 22.4 | % | 131.0 | 110.3 | 20.7 | 18.8 | % | ||||||||||||||||
Other | 58.7 | 49.0 | 9.7 | 19.8 | % | |||||||||||||||||||||
Port fees and other | 81.8 | 66.0 | 15.8 | 23.9 | % | |||||||||||||||||||||
| | | | | | | | | | | | | | | | | | | | | | | | | | ||
Total revenues | $ | 1,335.2 | $ | 1,024.4 | $ | 310.8 | 30.3 | % | $ | 1,778.7 | $ | 1,458.2 | $ | 320.5 | 22.0 | % | ||||||||||
| | | | | | | | | | | | | | | | | | | | | | | | | | | |
| | | | | | | | | | | | | | | | | | | | | | | | | | ||
Transaction Fees
Transaction fees increased $262.4$280.3 million, or 37.1%27.8%, to $970.1$1,290.2 million for the nine monthsyear ended September 30,December 31, 2015, representing 72.7%72.5% of total revenues, compared with $707.7$1,009.9 million for the prior-year period,prior year, or 69.1%69.3% of total revenues. This increase in transaction fees was largely driven by our U.S. Options segment where transaction fees increased $98.0$108.0 million due to increased market share, from 4.2%4.8% in 2014 to 9.9%9.6% in 2015. The U.S. Equities segment contributed $124.0$122.5 million to the increase driven by the additional month of Direct Edge activitya 7.8% increase in 2015 compared to 2014 and a 10.5% increase market volumes. The European Equities segment's transaction fees increased $17.2$18.0 million in 2015 as market ADNV increased 37.4%28.2% over 2014. The Global FX segment also contributed $23.2$31.8 million to 2015 due to the BATSBats Hotspot Acquisition in March 2015.
Regulatory Transaction Fees
Regulatory transaction fees increased $20.5$3.7 million, or 11.0%1.4%, to $207.0$275.7 million for the nine monthsyear ended September 30,December 31, 2015, representing 15.5% of total revenues, compared with $186.5$272.0 million for the prior-year period,prior year, or 18.2%18.7% of total revenues. This increase was largely driven by the additional month of Direct Edge activity in 2015 compared to 2014 and a 10.5%7.8% increase in U.S. Equities market ADV. Additionally, with the increased market share in U.S. Options, additional regulatory fees of $2.6$2.8 million were recognized. Offsetting these increases was a decrease in the Section 31 rate charged, from $22.10 per million notional value traded beginning in the first quarter 2014 to $18.40 per million notional value traded beginning in first quarter 2015.
Market Data Fees
Market data fees increased $18.2$20.7 million, or 22.4%18.8%, to $99.4$131.0 million for the nine monthsyear ended September 30,December 31, 2015, representing 7.4% of total revenues, compared with $81.2$110.3 million for the prior-year period,prior year, or 7.9%7.6% of total revenues. This increase was largely driven by an additional month of Direct Edge activity recorded in 2015 and an 8.1%7.2% increase in the U.S. tape plan pool size from 2014 to 2015 primarily due to price increases in January 2015, contributing $3.6 million and $5.6$6.7 million to the increase, respectively. We also received approximately $3.1 million in audit recoveries from the U.S. tape plans in 2015. The U.S. Options segment also contributed $2.9$3.6 million to the increase as market share increased to 9.9%9.6% in 2015 from 4.2%4.8% in 2014.
Port Fees and Other
Port fees and other revenues increased $9.7$15.8 million, or 19.8%23.9%, to $58.7$81.8 million for the nine monthsyear ended September 30,December 31, 2015, compared with $49.0$66.0 million for the nine monthsyear ended September 30,December 31, 2014. This increase was driven by a U.S. Equities pricing change to logical ports in second quarter 2015 contributing $6.4$12.3 million in 2015. Also contributing to the increase was $2.1 million of additional revenue recorded due to the additional month of Direct Edge activity included in 2015.
Cost of Revenues
Cost of revenues increased $248.8$243.6 million, or 31.1%21.2%, to $1,049.4$1,394.3 million for the nine monthsyear ended September 30,December 31, 2015 from $800.6$1,150.7 million for the nine monthsyear ended September 30,December 31, 2014. The increase was primarily due to a 10.5%7.8% increase in U.S. equities market ADV in 2015 and the increase in our U.S. Equities segment market share from 18.9%19.4% in 2014 to 21.1% in 2015. Our U.S. Options segment market share also increased from 4.2%4.8% in 2014 to 9.9%9.6% in 2015, increasing liquidity payments. The
following summarizes changes in cost of revenues for the nine monthsyear ended September 30,December 31, 2015 compared to the prior-year period:prior year:
| | Nine Months Ended September 30, | | | Year Ended December 31, | | | ||||||||||||||||||||
|---|---|---|---|---|---|---|---|---|---|---|---|---|---|---|---|---|---|---|---|---|---|---|---|---|---|---|
| | Increase/ (Decrease) | Percent Change | Increase/ (Decrease) | Percent Change | ||||||||||||||||||||||
| | 2015 | 2014 | 2015 | 2014 | ||||||||||||||||||||||
| | (in millions, except percentages) | (in millions, except percentages) | ||||||||||||||||||||||||
Liquidity payments | $ | 805.7 | $ | 578.5 | $ | 227.2 | 39.3 | % | $ | 1,070.7 | $ | 831.4 | $ | 239.3 | 28.8 | % | ||||||||||
Section 31 fees | 207.0 | 186.5 | 20.5 | 11.0 | % | 275.7 | 272.0 | 3.7 | 1.4 | % | ||||||||||||||||
Routing and clearing | 36.7 | 35.6 | 1.1 | 3.1 | % | 47.9 | 47.3 | 0.6 | 1.3 | % | ||||||||||||||||
| | | | | | | | | | | | | | | | | | | | | | | | | | ||
Total | $ | 1,049.4 | $ | 800.6 | $ | 248.8 | 31.1 | % | $ | 1,394.3 | $ | 1,150.7 | $ | 243.6 | 21.2 | % | ||||||||||
| | | | | | | | | | | | | | | | | | | | | | | | | | | |
| | | | | | | | | | | | | | | | | | | | | | | | | | ||
Liquidity Payments
Liquidity payments increased $227.2$239.3 million, or 39.3%28.8%, to $805.7$1,070.7 million for the nine monthsyear ended September 30,December 31, 2015, representing 60.3%60.2% of total revenues, compared with $578.5$831.4 million for the prior-year period,prior year, or 56.5%57.0% of total revenues. The U.S. Equities segment contributed $116.5$118.3 million to the increase, driven by $23.5 million from the additional month of Direct Edge activity and a 10.5%7.8% increase in U.S. equities market volumes. The U.S. Options segment liquidity payments increased $94.8$103.0 million, primarily driven by increased rebate payments due to increased market share. The European Equities segment liquidity payments increased $15.9$18.0 million driven by a 37.4%28.0% increase in market ADNV.
Section 31 Fees
Section 31 fees increased $20.5$3.7 million, or 11.0%1.4%, to $207.0$275.7 million for the nine monthsyear ended September 30,December 31, 2015, representing 15.5% of total revenues, compared with $186.5$272.0 million for the prior-year periodprior year or 18.2%18.7% of total revenues for the reasons stated previously under "—Components of Revenues—Regulatory Transaction Fees."
Routing and Clearing
Routing and clearing fees increased $1.1$0.6 million, or 3.1%1.3%, to $36.7$47.9 million for the nine monthsyear ended September 30,December 31, 2015, representing 2.8%2.7% of total revenues, compared with $35.6$47.3 million for the prior-year period,prior year, or 3.5%3.2% of total revenues. This decrease in routing and clearing fees was driven by a decrease of the routed percentage on our U.S. Equities markets from 7.7%7.4% in 2014 to 6.4%6.3% in 2015 and a 3.7%an 8.9% decrease in routed fees per contract in the U.S. Options segment.
Revenues Less Cost of Revenues
Revenues less cost of revenues increased $62.0$76.9 million, or 27.7%25.0%, to $285.8$384.4 million for the nine monthsyear ended September 30,December 31, 2015 compared to $223.8$307.5 million for the nine monthsyear ended September 30,December 31, 2014, primarily as a result of the BATSBats Hotspot Acquisition contributing $23.2$31.8 million to revenues less cost of revenues in the first quarter of 2015 and an increase in market data revenue in the U.S. Equities segment, driven by U.S. tape plan pricing increases put into effect in January 2015 and an increase in market share from 18.9%19.4% in 2014 to 21.1% in 2015 primarily driven by the Direct Edge Acquisition on January 31, 2014.
The following summarizes the components of revenues less cost of revenues for the nine monthsyear ended September 30,December 31, 2015, presented as a percentage of revenues less cost of revenues and compared to the prior-year period:prior year:
| | | | | Percentage of Revenues Less Cost of Revenues | | | | Percentage of Revenues Less Cost of Revenues | ||||||||||||||||||||||||
|---|---|---|---|---|---|---|---|---|---|---|---|---|---|---|---|---|---|---|---|---|---|---|---|---|---|---|---|---|---|---|---|---|
| | Nine Months Ended September 30, | | Nine Months Ended September 30, | Year Ended December 31, | | Year Ended December 31, | ||||||||||||||||||||||||||
| | Percent Change | Percent Change | ||||||||||||||||||||||||||||||
| | 2015 | 2014 | 2015 | 2014 | 2015 | 2014 | 2015 | 2014 | ||||||||||||||||||||||||
| | (in millions) | | | | (in millions) | | | | ||||||||||||||||||||||||
Transaction fees less liquidity payments and routing and clearing costs | $ | 127.7 | $ | 93.6 | 36.4 | % | 44.7 | % | 41.8 | % | $ | 171.6 | $ | 131.2 | 30.8 | % | 44.6 | % | 42.7 | % | ||||||||||||
Market data fees | 99.4 | 81.2 | 22.4 | % | 34.8 | % | 36.3 | % | 131.0 | 110.3 | 18.8 | % | 34.1 | % | 35.9 | % | ||||||||||||||||
Port fees and other revenues less other cost of revenues | 58.7 | 49.0 | 19.8 | % | 20.5 | % | 21.9 | % | ||||||||||||||||||||||||
Port fees | 81.8 | 66.0 | 23.9 | % | 21.3 | % | 21.4 | % | ||||||||||||||||||||||||
| | | | | | | | | | | | | | | | | | | | | | | | | | | | | | | | ||
Revenues less cost of revenues | $ | 285.8 | $ | 223.8 | 27.7 | % | 100.0 | % | 100.0 | % | $ | 384.4 | $ | 307.5 | 25.0 | % | 100.0 | 100.0 | % | |||||||||||||
| | | | | | | | | | | | | | | | | | | | | | | | | | | | | | | | | |
| | | | | | | | | | | | | | | | | | | | | | | | | | | | | | | | ||
Fluctuations in Revenues Less Cost of Revenues
Fluctuations in revenues less cost of revenues are driven by various factors. Volume variances are driven by changes in overall industry volume and our share of those volumes, while net capture variances are driven primarily by pricing changes. The following summarizes the fluctuations in revenues less cost of revenues for the nine monthsyear ended September 30,December 31, 2015 and attributes the fluctuations to various sources:
| | Total | Percentage of Total | Total | Percentage of Total | ||||||||||
|---|---|---|---|---|---|---|---|---|---|---|---|---|---|---|
| | (in millions) | | (in millions) | | ||||||||||
Market volume | $ | 16.4 | 26.5 | % | $ | 17.2 | 22.4 | % | ||||||
Market share | 37.3 | 60.2 | % | 41.1 | 53.4 | % | ||||||||
Net capture | (20.4 | ) | (32.9 | )% | (24.1 | ) | (31.3 | )% | ||||||
BATS Hotspot Acquisition | 23.2 | 37.4 | % | |||||||||||
Bats Hotspot Acquisition | 31.8 | 41.4 | % | |||||||||||
Other | 5.5 | 8.8 | % | 10.9 | 14.1 | % | ||||||||
| | | | | | | | | | | | | | | |
Revenues less cost of revenues | $ | 62.0 | 100.0 | % | $ | 76.9 | 100.0 | % | ||||||
| | | | | | | | | | | | | | | | |
| | | | | | | | | | | | | | | |
Transaction Fees Less Liquidity Payments and Routing and Clearing Costs
Transaction fees less liquidity payments and routing and clearing costs increased $34.1$40.4 million, or 36.4%30.8%, to $127.7$171.6 million for the nine monthsyear ended September 30,December 31, 2015, representing 44.7%44.6% of revenues less cost of revenues, compared with $93.6$131.2 million for the prior-year period,prior year, or 41.8%42.7% of revenues less cost of revenues. The increase was primarily driven by Global FX revenue of $23.2$31.8 million due to the acquisition of BATSBats Hotspot in first quarter 2015, an increase in our market share in the U.S. Equities segment from 18.9%19.4% in 2014 to 21.1% in 2015, and a 10.5%7.8% increase in market ADV in U.S. Equities that contributed $9.0$6.5 million and increased market share in the U.S. Options segment that contributed $1.1$9.2 million. This was offset by decreased net capture in U.S. Options and European Equities with a $7.4$6.6 million and $10.4$12.1 million impact, respectively. U.S. Options net capture decreased 51.0%34.8% from $0.049$0.046 per touched contract in 2014 to $0.024$0.030 per touched contract in 2015. European Equities net capture per matched notional value decreased 19.5%17.9% from 0.164 basis points in 2014 to 0.1320.133 basis points in 2015, as higher market volumes and market share lifted customers into higher rebate tiers.
Market Data Fees
Market data fees increased $18.2$20.7 million, or 22.4%18.8%, to $99.4$131.0 million for the nine monthsyear ended September 30,December 31, 2015, representing 34.8%34.1% of revenues less cost of revenues, compared with $81.2$110.3 million
for the prior-year period,prior year, or 36.3%35.9% of revenues less cost of revenues. For purposes of calculating these percentages, we have not attributed any incremental costs associated with providing trading and quoting information to the U.S. tape plans. This increase was driven primarily by an 8.1%a 7.2% increase in the U.S. tape plan pool size due to a price increase in January 2015, along with increased U.S. Equities and U.S. Options market share, up from 18.9%19.4% in 2014 to 21.1% in 2015 and up from 4.2%4.8% in 2014 to 9.9%9.6% in 2015, respectively.
Port Fees and Other Revenues Less Other Cost of Revenues
Other revenues less other cost of revenuesPort fees increased $9.7$15.8 million, or 19.8%23.9%, to $58.7$81.8 million for the nine monthsyear ended September 30,December 31, 2015, representing 20.5%21.3% of revenues less cost of revenues, compared with $49.0$66.0 million for the prior-year period,prior year, or 21.9%21.4% of revenues less cost of revenues. This increase was due to the U.S. Equities logical port fee pricing changes for logical ports in second quarter 2015 along with an additional month of Direct Edge activity.
Operating Expenses
Total operating expenses increased $11.3$14.2 million, or 8.1%7.6%, to $150.8$202.1 million for the nine monthsyear ended September 30,December 31, 2015, compared with $139.5$187.9 million for the nine monthsyear ended September 30,December 31, 2014. The increase over the prior-year periodprior year was primarily due to the acquisition of BATSBats Hotspot, contributing $27.2$38.4 million in operating expenses in 2015. Offsetting this increase was a $17.5$31.2 million decrease in operating expenses in the U.S. Equities segment due to realized synergies in 2015 from the Direct Edge Acquisition. The following summarizes changes in operating expenses for the nine monthsyear ended September 30,December 31, 2015, compared to the prior-year period:prior year:
| | Nine Months Ended September 30, | | | Year Ended December 31, | | | ||||||||||||||||||||
|---|---|---|---|---|---|---|---|---|---|---|---|---|---|---|---|---|---|---|---|---|---|---|---|---|---|---|
| | Increase/ (Decrease) | Percent Change | Increase/ (Decrease) | Percent Change | ||||||||||||||||||||||
| | 2015 | 2014 | 2015 | 2014 | ||||||||||||||||||||||
| | (in millions) | | | (in millions) | | | ||||||||||||||||||||
Operating Expenses: | ||||||||||||||||||||||||||
Compensation and benefits | $ | 58.4 | $ | 66.2 | $ | (7.8 | ) | (11.8 | )% | $ | 79.7 | $ | 87.0 | $ | (7.3 | ) | (8.4 | )% | ||||||||
Depreciation and amortization | 28.5 | 20.9 | 7.6 | 36.4 | % | 40.8 | 28.4 | 12.4 | 43.7 | % | ||||||||||||||||
Systems and data communication | 21.4 | 16.9 | 4.5 | 26.6 | % | 27.2 | 23.5 | 3.7 | 15.7 | % | ||||||||||||||||
Occupancy | 2.4 | 2.6 | (0.2 | ) | (7.7 | )% | 3.1 | 4.2 | (1.1 | ) | (26.2 | )% | ||||||||||||||
Professional and contract services | 8.9 | 5.0 | 3.9 | 78.0 | % | 11.1 | 6.5 | 4.6 | 70.8 | % | ||||||||||||||||
Regulatory costs | 8.6 | 8.7 | (0.1 | ) | (1.1 | )% | 11.1 | 12.1 | (1.0 | ) | (8.3 | )% | ||||||||||||||
Change in fair value of contingent consideration liability | 1.7 | — | 1.7 | * | 2.8 | — | 2.8 | * | ||||||||||||||||||
General and administrative | 20.9 | 19.2 | 1.7 | 8.9 | % | 26.3 | 26.2 | 0.1 | 0.4 | % | ||||||||||||||||
| | | | | | | | | | | | | | | | | | | | | | | | | | ||
Total operating expenses | $ | 150.8 | $ | 139.5 | $ | 11.3 | 8.1 | % | $ | 202.1 | $ | 187.9 | $ | 14.2 | 7.6 | % | ||||||||||
| | | | | | | | | | | | | | | | | | | | | | | | | | | |
| | | | | | | | | | | | | | | | | | | | | | | | | | ||
Compensation and Benefits
Compensation and benefits decreased by $7.8$7.3 million, or 11.8%8.4%, to $58.4$79.7 million for the nine monthsyear ended September 30,December 31, 2015, representing 4.4%4.5% of total revenues, compared with $66.2$87.0 million for the prior-year period,prior year, or 6.5%6.0% of total revenues. This decrease was driven by severance and retention expense recognized in 2014 related to the Direct Edge Acquisition, and having fewer employees, offset by annual merit increases in fourth quarter 2014 and the additional Global FX
compensation of $10.9$14.5 million driven by the BATSBats Hotspot Acquisition in March 2015. As a result of the Direct Edge technology integration in January 2015, 57 employees were terminated in first quarter 2015.
Depreciation and Amortization
Depreciation and amortization increased by $7.6$12.4 million, or 36.4%43.7%, to $28.5$40.8 million for the nine monthsyear ended September 30,December 31, 2015, compared with $20.9$28.4 million for the nine monthsyear ended September 30,December 31, 2014,
primarily reflecting the additional amortization recorded for the intangible assets acquired with the Direct Edge Acquisition in January 2014 and the BATSBats Hotspot Acquisition in March 2015 of $1.5 million and $7.1 million, respectively.$12.3 million.
Systems and Data Communication
Systems and data communication costs increased by $4.5$3.7 million, or 26.6%15.7%, to $21.4$27.2 million for the nine monthsyear ended September 30,December 31, 2015, compared with $16.9$23.5 million for the nine monthsyear ended September 30,December 31, 2014. The increase was primarily due to a $4.1 million acceleration of expense for the legacy Direct Edge data center agreement terminated early in 2015.
Occupancy
Occupancy expenses stayed relatively flat, decreasing $0.2decreased $1.1 million, or 7.7%26.2%, to $2.4$3.1 million for the nine monthsyear ended September 30,December 31, 2015, compared with $2.6$4.2 million for the nine monthsyear ended September 30,December 31, 2014. This decrease was primarily driven by the termination of the lease of the Direct Edge office space in the fourth quarter of 2014.
Professional and Contract Services
Professional and contract services fees increased by $3.9$4.6 million, or 78.0%70.8%, to $8.9$11.1 million for the nine monthsyear ended September 30,December 31, 2015, compared with $5.0$6.5 million for the prior-year period.prior year. The increase was primarily due to professional fees incurred in 2015 related to the BATSBats Hotspot acquisition.Acquisition and the services rendered in preparation of being a public company.
Regulatory Costs
Regulatory costs also stayed relatively flat, decreasing $0.1decreased $1.0 million to $8.6$11.1 million for the nine monthsyear ended September 30,December 31, 2015 compared with $12.1 million for the nine monthsyear ended September 30, 2014.December 31, 2014 driven by the end of the transition of regulatory service agreement vendors.
Change in Fair Value of Contingent Consideration Liability
Change in fair value of contingent consideration liability was $1.7$2.8 million for the nine monthsyear ended September 30,December 31, 2015, due to the fair value adjustment of the contingent consideration liability recorded with the acquisition of BATSBats Hotspot in March 2015.
General and Administrative
General and administrative expenses increased by $1.7$0.1 million, or 8.9%0.4%, to $20.9$26.3 million for the nine monthsyear ended September 30,December 31, 2015, compared with $19.2$26.2 million for the prior-year period.prior year. This increase was due primarily to the $6.0 million accelerated expense of legacy Direct Edge servers that are no longer being used after the Direct Edge technology integration in January 2015 and a $1.2 million reserve for sale taxes for certain physical and logical ports, offset by a $1.5 million value-added tax, or VAT, credit received in 2015. The remaining decrease is primarily a result of the synergies achieved from the Direct Edge Integration in 2015.
Operating Income
As a result of the items above, operating income for the nine monthsyear ended September 30,December 31, 2015 was $135.0$182.3 million, or 47.2%47.4% of revenues less cost of revenues, compared to $84.3$119.6 million, or 37.7%38.9% of revenues less cost of revenues, for the nine monthsyear ended September 30,December 31, 2014, an increase of $50.7$62.7 million, or 60.1%52.4%.
Interest and Investment Expense, Net
Interest and investment expense, net increased by $13.9$19.3 million to $34.2$46.6 million for the nine monthsyear ended September 30,December 31, 2015, compared with $20.3$27.3 million for the prior-year period.prior year. This was due to the additional debt issued in March 2015.
Other Income (Expense)
Other income (expense) increased by $1.2$15.0 million to $1.6$3.0 million for the nine monthsyear ended September 30,December 31, 2015 compared to $0.4$(12.0) million for the nine monthsyear ended September 30,December 31, 2014. This increase was due to the foreign currency gain on the revolving credit facility when it was extinguished in March 2015.2015, offset by the loss on the extinguishment of debt that was repaid in January 2014.
Income Before Income Tax Provision
As a result of the above, income before income tax provision for the nine monthsyear ended September 30,December 31, 2015 was $103.4$138.7 million compared to $51.6$80.3 million for the nine monthsyear ended September 30,December 31, 2014, an increase of $51.8$58.4 million.
Income Tax Provision
For the nine monthsyear ended September 30,December 31, 2015, the income tax provision was $42.9$56.5 million compared with $20.7$31.1 million for the nine monthsyear ended September 30,December 31, 2014. The effective tax rate for the nine monthsyear ended September 30,December 31, 2015 was 41.5%40.7%, compared to 40.1%38.7% for the nine monthsyear ended September 30,December 31, 2014. The increase in the effective tax rate in 2015 compared to 2014 was due to legislative changes in New York and New York City in 2015.2015 and a higher rate attributable to foreign earnings.
Net Income
As a result of the items above, net income for the nine monthsyear ended September 30,December 31, 2015 was $60.5$82.2 million, or 21.2%21.4% of revenues less cost of revenues, compared to $30.9$49.2 million, or 13.8%16.0% of revenues less cost of revenues, for the nine monthsyear ended September 30,December 31, 2014, an increase of $29.6$33.0 million.
Segment Operating Results
The following summarizes our total revenues by segment:
| | | | | Percentage of Total Revenues | | | | Percentage of Total Revenues | ||||||||||||||||||||||||
|---|---|---|---|---|---|---|---|---|---|---|---|---|---|---|---|---|---|---|---|---|---|---|---|---|---|---|---|---|---|---|---|---|
| | Nine Months Ended September 30, | | Nine Months Ended September 30, | Year Ended December 31, | | Year Ended December 31, | ||||||||||||||||||||||||||
| | Percent Change | Percent Change | ||||||||||||||||||||||||||||||
| | 2015 | 2014 | 2015 | 2014 | 2015 | 2014 | 2015 | 2014 | ||||||||||||||||||||||||
| | (in millions) | | | | (in millions) | | | | ||||||||||||||||||||||||
U.S. Equities | $ | 1,034.6 | $ | 870.2 | 18.9 | % | 77.6 | % | 84.9 | % | $ | 1,386.8 | $ | 1,234.5 | 12.3 | % | 78.0 | % | 84.7 | % | ||||||||||||
European Equities | 90.1 | 72.5 | 24.3 | % | 6.7 | % | 7.1 | % | 117.9 | 99.1 | 19.1 | % | 6.6 | % | 6.8 | % | ||||||||||||||||
U.S. Options | 187.3 | 81.7 | 129.3 | % | 14.0 | % | 8.0 | % | 242.2 | 124.6 | 94.4 | % | 13.6 | % | 8.5 | % | ||||||||||||||||
Global FX | 23.2 | — | * | 1.7 | % | — | 31.8 | — | * | 1.8 | % | — | ||||||||||||||||||||
| | | | | | | | | | | | | | | | | | | | | | | | | | | | | | | | ||
Total revenues | $ | 1,335.2 | $ | 1,024.4 | 30.3 | % | 100.0 | % | 100.0 | % | $ | 1,778.7 | $ | 1,458.2 | 22.0 | % | 100.0 | % | 100.0 | % | ||||||||||||
| | | | | | | | | | | | | | | | | | | | | | | | | | | | | | | | | |
| | | | | | | | | | | | | | | | | | | | | | | | | | | | | | | | ||
The following summarizes our revenues less cost of revenues by segment:
| | | | | Percentage of Revenues Less Cost of Revenue | | | | Percentage of Revenues Less Cost of Revenue | ||||||||||||||||||||||||
|---|---|---|---|---|---|---|---|---|---|---|---|---|---|---|---|---|---|---|---|---|---|---|---|---|---|---|---|---|---|---|---|---|
| | Nine Months Ended September 30, | | Nine Months Ended September 30, | Year Ended December 31, | | Year Ended December 31, | ||||||||||||||||||||||||||
| | Percent Change | Percent Change | ||||||||||||||||||||||||||||||
| | 2015 | 2014 | 2015 | 2014 | 2015 | 2014 | 2015 | 2014 | ||||||||||||||||||||||||
| | (in millions) | | | | (in millions) | | | | ||||||||||||||||||||||||
U.S. Equities | $ | 193.8 | $ | 162.8 | 19.0 | % | 67.8 | % | 72.7 | % | $ | 259.4 | $ | 224.3 | 15.6 | % | 67.4 | % | 72.9 | % | ||||||||||||
European Equities | 50.9 | 49.2 | 3.5 | % | 17.8 | % | 22.0 | % | 67.1 | 66.4 | 1.2 | % | 17.5 | % | 21.6 | % | ||||||||||||||||
U.S. Options | 17.9 | 11.8 | 51.7 | % | 6.3 | % | 5.3 | % | 26.1 | 16.8 | 55.4 | % | 6.8 | % | 5.5 | % | ||||||||||||||||
Global FX | 23.2 | — | * | 8.1 | % | — | 31.8 | — | * | 8.3 | % | — | ||||||||||||||||||||
| | | | | | | | | | | | | | | | | | | | | | | | | | | | | | | | ||
Revenues less cost of revenues | $ | 285.8 | $ | 223.8 | 27.7 | % | 100.0 | % | 100.0 | % | $ | 384.4 | $ | 307.5 | 25.0 | % | 100.0 | % | 100.0 | % | ||||||||||||
| | | | | | | | | | | | | | | | | | | | | | | | | | | | | | | | | |
| | | | | | | | | | | | | | | | | | | | | | | | | | | | | | | | ||
U.S. Equities
The following summarizes revenues, cost of revenues, operating expenses and operating income for our U.S. Equities segment:
| | | | | Percentage of Total Revenues | | | | Percentage of Total Revenues | ||||||||||||||||||||||||
|---|---|---|---|---|---|---|---|---|---|---|---|---|---|---|---|---|---|---|---|---|---|---|---|---|---|---|---|---|---|---|---|---|
| | Nine Months Ended September 30, | | Nine Months Ended September 30, | Year Ended December 31, | | Year Ended December 31, | ||||||||||||||||||||||||||
| | Percent Change | Percent Change | ||||||||||||||||||||||||||||||
| | 2015 | 2014 | 2015 | 2014 | 2015 | 2014 | 2015 | 2014 | ||||||||||||||||||||||||
| | (in millions, except percentages and as noted below) | | | | (in millions, except percentages and as noted below) | | | | ||||||||||||||||||||||||
Revenues: | ||||||||||||||||||||||||||||||||
Transaction fees | $ | 699.5 | $ | 575.5 | 21.5 | % | 52.5 | % | 56.2 | % | $ | 938.8 | $ | 816.2 | 15.0 | % | 52.7 | % | 56.0 | % | ||||||||||||
Regulatory transaction fees | 202.4 | 184.5 | 9.7 | % | 15.2 | % | 18.0 | % | 269.6 | 268.7 | 0.3 | % | 15.2 | % | 18.5 | % | ||||||||||||||||
Market data fees | 86.7 | 71.8 | 20.8 | % | 6.5 | % | 7.0 | % | 114.1 | 97.6 | 16.9 | % | 6.5 | % | 6.7 | % | ||||||||||||||||
Port fees and other | 46.0 | 38.4 | 19.8 | % | 3.4 | % | 3.7 | % | 64.3 | 52.0 | 23.7 | % | 3.6 | % | 3.5 | % | ||||||||||||||||
| | | | | | | | | | | | | | | | | | | | | | | | | | | | | | | | ||
Total revenues | 1,034.6 | 870.2 | 18.9 | % | 77.6 | % | 84.9 | % | 1,386.8 | 1,234.5 | 12.3 | % | 78.0 | % | 84.7 | % | ||||||||||||||||
Cost of revenues: | ||||||||||||||||||||||||||||||||
Liquidity payments | 605.0 | 488.5 | 23.8 | % | 45.3 | % | 47.7 | % | 814.1 | 695.8 | 17.0 | % | 45.8 | % | 47.7 | % | ||||||||||||||||
Section 31 fees | 202.4 | 184.5 | 9.7 | % | 15.2 | % | 18.0 | % | 269.6 | 268.7 | 0.3 | % | 15.2 | % | 18.5 | % | ||||||||||||||||
Routing and clearing payments | 33.4 | 34.4 | (2.9 | )% | 2.5 | % | 3.4 | % | ||||||||||||||||||||||||
Routing and clearing | 43.7 | 45.7 | (4.4 | )% | 2.4 | % | 3.1 | % | ||||||||||||||||||||||||
| | | | | | | | | | | | | | | | | | | | | | | | | | | | | | | | ||
Total cost of revenues | 840.8 | 707.4 | 18.9 | % | 63.0 | % | 69.1 | % | 1,127.4 | 1,010.2 | 11.6 | % | 63.4 | % | 69.3 | % | ||||||||||||||||
| | | | | | | | | | | | | | | | | | | | | | | | | | | | | | | | ||
Revenues less cost of revenues | 193.8 | 162.8 | 19.0 | % | 14.5 | % | 15.8 | % | 259.4 | 224.3 | 15.6 | % | 14.6 | % | 15.4 | % | ||||||||||||||||
Operating expenses | 86.9 | 104.4 | (16.8 | )% | 6.5 | % | 10.2 | % | 110.2 | 141.3 | (22.1 | )% | 6.2 | % | 9.7 | % | ||||||||||||||||
| | | | | | | | | | | | | | | | | | | | | | | | | | | | | | | | ||
Operating income | $ | 106.9 | $ | 58.4 | 83.0 | % | 8.0 | % | 5.6 | % | $ | 149.2 | $ | 83.0 | 79.8 | % | 8.4 | % | 5.7 | % | ||||||||||||
| | | | | | | | | | | | | | | | | | | | | | | | | | | | | | | | | |
| | | | | | | | | | | | | | | | | | | | | | | | | | | | | | | | ||
EBITDA(1) | $ | 120.8 | $ | 72.9 | 65.7 | % | 9.0 | % | 7.1 | % | $ | 168.0 | $ | 103.4 | 62.5 | % | 9.4 | % | 7.1 | % | ||||||||||||
EBITDA margin(2) | 62.3 | % | 44.8 | % | * | * | * | 64.8 | % | 46.1 | % | * | * | * | ||||||||||||||||||
Normalized EBITDA(1) | $ | 120.8 | $ | 87.5 | 38.1 | % | 9.0 | % | 8.5 | % | $ | 168.7 | $ | 121.9 | 38.4 | % | 9.5 | % | 8.4 | % | ||||||||||||
Normalized EBITDA margin(2) | 62.3 | % | 53.7 | % | * | * | * | 65.1 | % | 54.3 | % | * | * | * | ||||||||||||||||||
Non-transaction net revenue as percentage of net revenue | 68.5 | % | 67.7 | % | * | * | * | |||||||||||||||||||||||||
ADV (in billions): | ||||||||||||||||||||||||||||||||
Matched shares | 1.5 | 1.2 | 25.0 | % | * | * | ||||||||||||||||||||||||||
Routed shares | 0.1 | 0.1 | — | * | * | |||||||||||||||||||||||||||
| | | | | | | | | | | | | | | | | |||||||||||||||||
Total touched shares | 1.6 | 1.3 | 23.1 | % | * | * | ||||||||||||||||||||||||||
| | | | | | | | | | | | | | | | | |||||||||||||||||
| | | | | | | | | | | | | |||||||||||||||||||||
| | | | | | | | | | | | | | | | | |||||||||||||||||
Market ADV | 6,864.8 | 6,214.0 | 10.5 | % | * | * | 6.9 | 6.4 | 7.8 | % | ||||||||||||||||||||||
BATS ETPs (in millions of shares) | 361.7 | 246.3 | 46.9 | % | * | * | ||||||||||||||||||||||||||
BATS ETPs: launches (number of launches) | 7 | 2 | 250.0 | % | * | * | ||||||||||||||||||||||||||
BATS ETPs: listings (number of listings) | 33 | 23 | 43.5 | % | * | * | ||||||||||||||||||||||||||
Trading days | 252 | 252 | — | * | * | |||||||||||||||||||||||||||
Bats ETPs (in billions of shares) | 0.4 | 0.3 | 33.3 | % | * | * | ||||||||||||||||||||||||||
Bats ETPs: launches (number of launches) | 26 | 5 | 420.0 | % | * | * | ||||||||||||||||||||||||||
Bats ETPs: listings (number of listings) | 56 | 28 | 100.0 | % | * | * | ||||||||||||||||||||||||||
Market share | 21.1 | % | 18.9 | % | * | * | * | 21.1 | % | 19.4 | % | * | * | * | ||||||||||||||||||
Net capture per one hundred touched shares | $ | 0.021 | $ | 0.022 | (4.5 | )% | * | * | $ | 0.021 | $ | 0.022 | (4.5 | )% | * | * | ||||||||||||||||
have presented EBITDA, Normalized EBITDA and Pro FormaNormalized EBITDA because we consider them important supplemental measures of our performance and believe that they are frequently used by analysts, investors and other interested parties in the evaluation of companies. In addition, we use Normalized EBITDA as a measure of operating performance for preparation of our forecasts, evaluating our leverage ratio for the debt to earnings covenant included in our outstanding credit facility and calculating employee and executive bonuses. Other companies may calculate EBITDA Normalized EBITDA and Pro FormaNormalized EBITDA differently than we do. EBITDA Normalized EBITDA and Pro FormaNormalized EBITDA have limitations as analytical tools, and you should not consider them in isolation or as substitutes for analysis of our results as reported under U.S. GAAP.
The following is a reconciliation of net income to EBITDA and Normalized EBITDA:
| | Nine Months Ended September 30, | Year Ended December 31, | ||||||||||||||||||||||||||||||||||||||||||||||||||||||||||||||||||
|---|---|---|---|---|---|---|---|---|---|---|---|---|---|---|---|---|---|---|---|---|---|---|---|---|---|---|---|---|---|---|---|---|---|---|---|---|---|---|---|---|---|---|---|---|---|---|---|---|---|---|---|---|---|---|---|---|---|---|---|---|---|---|---|---|---|---|---|---|
| | 2015 | 2014 | 2015 | 2014 | ||||||||||||||||||||||||||||||||||||||||||||||||||||||||||||||||
| | U.S. Equities | European Equities | U.S. Options | Global FX | Corporate items and eliminations | Total | U.S. Equities | European Equities | U.S. Options | Corporate items and eliminations | Total | U.S. Equities | European Equities | U.S. Options | Global FX | Corporate items and eliminations | Total | U.S. Equities | European Equities | U.S. Options | Corporate items and eliminations | Total | ||||||||||||||||||||||||||||||||||||||||||||||
| | (in millions) | (in millions) | ||||||||||||||||||||||||||||||||||||||||||||||||||||||||||||||||||
Net income (loss) | $ | 106.4 | $ | 26.8 | $ | 7.2 | $ | (3.6 | ) | $ | (76.3 | ) | $ | 60.5 | $ | 43.2 | $ | 22.7 | $ | 5.7 | $ | (40.7 | ) | $ | 30.9 | $ | 85.8 | $ | 18.3 | $ | 9.8 | $ | (6.3 | ) | $ | (25.4 | ) | $ | 82.2 | $ | 40.2 | $ | 37.7 | $ | 8.3 | $ | (37.0 | ) | $ | 49.2 | ||||||||||||||||||
Interest | — | (0.1 | ) | — | — | 34.3 | 34.2 | — | (0.1 | ) | — | 20.4 | 20.3 | — | (0.1 | ) | — | — | 46.7 | 46.6 | — | (0.1 | ) | — | 27.4 | 27.3 | ||||||||||||||||||||||||||||||||||||||||||
Income tax provision (benefit) | 0.6 | — | — | — | 42.3 | 42.9 | 15.5 | — | — | 5.2 | 20.7 | 63.6 | 14.8 | — | 0.1 | (22.0 | ) | 56.5 | 43.3 | (6.1 | ) | — | (6.1 | ) | 31.1 | |||||||||||||||||||||||||||||||||||||||||||
Depreciation and amortization | 13.8 | 6.2 | 1.4 | 7.1 | — | 28.5 | 14.2 | 6.0 | 0.7 | — | 20.9 | 18.6 | 8.3 | 1.6 | 12.3 | — | 40.8 | 19.9 | 7.6 | 0.9 | — | 28.4 | ||||||||||||||||||||||||||||||||||||||||||||||
| | | | | | | | | | | | | | | | | | | | | | | | | | | | | | | | | | | | | | | | | | | | | | | | | | | | | | | | | | | | | | | | | | | | | |
EBITDA | 120.8 | 32.9 | 8.6 | 3.5 | 0.3 | 166.1 | 72.9 | 28.6 | 6.4 | (15.1 | ) | 92.8 | 168.0 | 41.3 | 11.4 | 6.1 | (0.7 | ) | 226.1 | 103.4 | 39.1 | 9.2 | (15.7 | ) | 136.0 | |||||||||||||||||||||||||||||||||||||||||||
Acquisition-related costs | — | — | — | 6.4 | — | 6.4 | 14.6 | — | — | — | 14.6 | 0.7 | — | — | 7.5 | — | 8.2 | 18.5 | — | — | — | 18.5 | ||||||||||||||||||||||||||||||||||||||||||||||
IPO costs | — | — | — | — | 0.5 | 0.5 | — | — | — | — | — | — | — | — | — | 1.5 | 1.5 | — | — | — | — | — | ||||||||||||||||||||||||||||||||||||||||||||||
Loss on extinguishment of debt | — | — | — | — | — | — | — | — | — | 13.6 | 13.6 | — | — | — | — | — | — | — | — | — | 13.6 | 13.6 | ||||||||||||||||||||||||||||||||||||||||||||||
Other one-time items | — | — | — | — | (0.5 | ) | (0.5 | ) | — | — | — | — | — | |||||||||||||||||||||||||||||||||||||||||||||||||||||||
Debt restructuring | — | — | — | — | 0.5 | 0.5 | — | — | — | — | — | |||||||||||||||||||||||||||||||||||||||||||||||||||||||||
Gain on extinguishment of revolving credit facility | — | — | — | — | (1.0 | ) | (1.0 | ) | — | — | — | — | — | |||||||||||||||||||||||||||||||||||||||||||||||||||||||
| | | | | | | | | | | | | | | | | | | | | | | | | | | | | | | | | | | | | | | | | | | | | | | | | | | | | | | | | | | | | | | | | | | | | |
Normalized EBITDA | $ | 120.8 | $ | 32.9 | $ | 8.6 | $ | 9.9 | $ | 0.3 | $ | 172.5 | $ | 87.5 | $ | 28.6 | $ | 6.4 | $ | (1.5 | ) | $ | 121.0 | $ | 168.7 | $ | 41.3 | $ | 11.4 | $ | 13.6 | $ | 0.3 | $ | 235.3 | $ | 121.9 | $ | 39.1 | $ | 9.2 | $ | (2.1 | ) | $ | 168.1 | ||||||||||||||||||||||
| | | | | | | | | | | | | | | | | | | | | | | | | | | | | | | | | | | | | | | | | | | | | | | | | | | | | | | | | | | | | | | | | | | | | | |
| | | | | | | | | | | | | | | | | | | | | | | | | | | | | | | | | | | | | | | | | | | | | | | | | | | | | | | | | | | | | | | | | | | | | |
For the nine monthsyear ended September 30,December 31, 2015, U.S. Equities operating income increased $48.5$66.2 million, to $106.9$149.2 million. The increase in revenues less cost of revenues is driven by an additional month of Direct Edge activityincreased market share in 2015 compared to 2014 and a 10.5%7.8% increase in market ADV from 2014 to 2015. The decrease in operating expenses is driven by a decrease in compensation due to the severance and retention related to the Direct Edge Acquisition recorded in 2014 offset by accelerations of expense in 2015 of $6.0 million for legacy Direct Edge servers and $4.1 million for legacy Direct Edge data center space.
European Equities
The following summarizes revenues, cost of revenues, operating expenses and operating income for our European Equities segment:
| | | | | Percentage of Total Revenues | | | | Percentage of Total Revenues | ||||||||||||||||||||||||
|---|---|---|---|---|---|---|---|---|---|---|---|---|---|---|---|---|---|---|---|---|---|---|---|---|---|---|---|---|---|---|---|---|
| | Nine Months Ended September 30, | | Nine Months Ended September 30, | Year Ended December 31, | | Year Ended December 31, | ||||||||||||||||||||||||||
| | Percent Change | Percent Change | ||||||||||||||||||||||||||||||
| | 2015 | 2014 | 2015 | 2014 | 2015 | 2014 | 2015 | 2014 | ||||||||||||||||||||||||
| | (in millions except for percentages and exchange rates) | | | | (in millions except for percentages and exchange rates) | | | | ||||||||||||||||||||||||
Revenues | $ | 90.1 | $ | 72.5 | 24.3 | % | 6.7 | % | 7.1 | % | ||||||||||||||||||||||
Cost of revenues | 39.2 | 23.3 | 68.2 | % | 2.9 | % | 2.3 | % | ||||||||||||||||||||||||
Revenues: | ||||||||||||||||||||||||||||||||
Transaction fees | $ | 97.8 | $ | 79.9 | 22.4 | % | 5.5 | % | 5.5 | % | ||||||||||||||||||||||
Market data fees | 9.3 | 8.7 | 6.9 | % | 0.5 | % | 0.6 | % | ||||||||||||||||||||||||
Port fees and other | 10.8 | 10.5 | 2.9 | % | 0.6 | % | 0.7 | % | ||||||||||||||||||||||||
| | | | | | | | | | | | | | | | | | ||||||||||||||||
Total revenues | 117.9 | 99.1 | 19.0 | % | 6.6 | % | 6.8 | % | ||||||||||||||||||||||||
| | | | | | | | | | | | | | | | | | ||||||||||||||||
Cost of revenues: | ||||||||||||||||||||||||||||||||
Liquidity payments | 50.6 | 32.6 | 55.2 | % | 2.8 | % | 2.2 | % | ||||||||||||||||||||||||
Routing and clearing | 0.2 | 0.1 | 100.0 | % | 0.1 | % | — | |||||||||||||||||||||||||
| | | | | | | | | | | | | | | | | | ||||||||||||||||
Total cost of revenues | 50.8 | 32.7 | 55.4 | % | 2.9 | % | 2.2 | % | ||||||||||||||||||||||||
| | | | | | | | | | | | | | | | | | | | | | | | | | | | | | | | | |
Revenues less cost of revenues | 50.9 | 49.2 | 3.5 | % | 3.8 | % | 4.8 | % | 67.1 | 66.4 | 1.2 | % | 3.7 | % | 4.6 | % | ||||||||||||||||
Operating expenses | 25.1 | 27.3 | (8.1 | )% | 1.9 | % | 2.7 | % | 35.2 | 36.0 | (2.2 | )% | 2.0 | % | 2.5 | % | ||||||||||||||||
| | | | | | | | | | | | | | | | | | | | | | | | | | | | | | | | | |
Operating income | $ | 25.8 | $ | 21.9 | 17.8 | % | 1.9 | % | 2.1 | % | $ | 31.9 | $ | 30.4 | 4.9 | % | 1.7 | % | 2.1 | % | ||||||||||||
| | | | | | | | | | | | | | | | | | | | | | | | | | | | | | | | | | |
| | | | | | | | | | | | | | | | | | | | | | | | | | | | | | | | | |
EBITDA(1) | $ | 32.9 | $ | 28.6 | 15.0 | % | $ | 41.3 | $ | 39.1 | 5.6 | % | 2.3 | % | 2.7 | % | ||||||||||||||||
EBITDA margin(2) | 64.6 | % | 58.1 | % | * | * | * | 61.5 | % | 58.9 | % | * | * | * | ||||||||||||||||||
Normalized EBITDA(1) | $ | 32.9 | $ | 28.6 | 15.0 | % | $ | 41.3 | $ | 39.1 | 5.6 | % | 2.3 | % | 2.7 | % | ||||||||||||||||
Normalized EBITDA margin(2) | 64.6 | % | 58.1 | % | * | * | * | 61.5 | % | 58.9 | % | * | * | * | ||||||||||||||||||
ADNV (in billions): | ||||||||||||||||||||||||||||||||
Matched and touched ADNV | € | 12.4 | € | 8.6 | 44.2 | % | * | * | ||||||||||||||||||||||||
Market ADNV | € | 52,394.2 | € | 38,124.1 | 37.4 | % | * | * | € | 50.8 | € | 39.7 | 28.0 | % | * | * | ||||||||||||||||
Trading days | 257 | 256 | 0.4 | % | * | * | ||||||||||||||||||||||||||
Market share | 24.2 | % | 21.3 | % | * | * | * | 24.4 | % | 21.6 | % | * | * | * | ||||||||||||||||||
Net capture per matched notional value (in basis points) | 0.132 | 0.164 | (19.5 | )% | * | * | 0.133 | 0.162 | (17.9 | )% | * | * | ||||||||||||||||||||
Average British pound/U.S. dollar exchange rate | $ | 1.5322 | $ | 1.6691 | (8.2 | )% | * | * | $ | 1.5283 | $ | 1.6476 | (7.2 | )% | * | * | ||||||||||||||||
Average Euro/British pound exchange rate | £0.7263 | £0.8062 | (9.9 | )% | * | * | ||||||||||||||||||||||||||
To illustrate the growth without the effect of the exchange rates in our European Equities segment the following table shows revenues, cost of revenues, operating expenses and operating loss for our European Equities segment in British pounds:
| | Nine Months Ended September 30, | | Year Ended December 31, | | ||||||||||||||||
|---|---|---|---|---|---|---|---|---|---|---|---|---|---|---|---|---|---|---|---|---|
| | Percent Change | Percent Change | ||||||||||||||||||
| | 2015 | 2014 | 2015 | 2014 | ||||||||||||||||
| | (in millions) | | (in millions) | | ||||||||||||||||
Transaction fees | £64.0 | £48.6 | 31.7 | % | ||||||||||||||||
Market data | 6.0 | 5.2 | 15.4 | % | ||||||||||||||||
Other | 7.1 | 6.4 | 10.9 | % | ||||||||||||||||
| | | | | | | | | | | |||||||||||
Revenues | £58.8 | £43.5 | 35.2 | % | 77.1 | 60.2 | 28.1 | % | ||||||||||||
Liquidity payments | 33.1 | 19.8 | 67.2 | % | ||||||||||||||||
Routing and clearing | 0.1 | 0.1 | — | |||||||||||||||||
| | | | | | | | | | | |||||||||||
Cost of revenues | 25.6 | 13.9 | 84.2 | % | 33.2 | 19.9 | 66.8 | % | ||||||||||||
| | | | | | | | | | | | | | | | | | | | ||
Revenues less cost of revenues | 33.2 | 29.6 | 12.2 | % | 43.9 | 40.3 | 8.9 | % | ||||||||||||
Operating expenses | 16.4 | 16.4 | — | 23.0 | 21.8 | 5.5 | % | |||||||||||||
| | | | | | | | | | | | | | | | | | | | ||
Operating income | £16.8 | £13.2 | 27.3 | % | £20.9 | £18.5 | 13.0 | % | ||||||||||||
| | | | | | | | | | | | | | | | | | | | | |
| | | | | | | | | | | | | | | | | | | | ||
EBITDA(1) | £21.5 | £17.2 | 25.0 | % | £27.0 | £23.8 | 13.4 | % | ||||||||||||
Normalized EBITDA(1) | £21.5 | £17.2 | 25.0 | % | £27.0 | £23.8 | 13.4 | % | ||||||||||||
| | Nine Months Ended September 30, | | Year Ended December 31, | | ||||||||||||||||
|---|---|---|---|---|---|---|---|---|---|---|---|---|---|---|---|---|---|---|---|---|
| | Percent Change | Percent Change | ||||||||||||||||||
| | 2015 | 2014 | 2015 | 2014 | ||||||||||||||||
| | (in millions) | | (in millions) | | ||||||||||||||||
Net income (loss) | £17.4 | £13.6 | 27.9 | % | ||||||||||||||||
Net income | £16.2 | £19.2 | (15.6 | )% | ||||||||||||||||
Interest | — | — | — | 0.1 | — | * | ||||||||||||||
Income tax provision (benefit) | — | — | — | |||||||||||||||||
Income tax provision | 5.3 | — | * | |||||||||||||||||
Depreciation and amortization | 4.1 | 3.6 | 13.9 | % | 5.4 | 4.6 | 17.4 | % | ||||||||||||
| | | | | | | | | | | | | | | | | | | | ||
EBITDA | 21.5 | 17.2 | 25.0 | % | 27.0 | 23.8 | 13.4 | % | ||||||||||||
Acquisition-related costs | — | — | — | — | — | * | ||||||||||||||
IPO costs | — | — | — | — | — | * | ||||||||||||||
Loss on extinguishment of debt | — | — | — | — | — | * | ||||||||||||||
Other one-time items | — | — | — | |||||||||||||||||
Debt restructuring | — | — | * | |||||||||||||||||
Gain on extinguishment of revolving credit facility | — | — | * | |||||||||||||||||
| | | | | | | | | | | | | | | | | | | | ||
Normalized EBITDA | £21.5 | £17.2 | 25.0 | % | £27.0 | £23.8 | 13.4 | % | ||||||||||||
| | | | | | | | | | | | | | | | | | | | | |
| | | | | | | | | | | | | | | | | | | | ||
For the nine monthsyear ended September 30,December 31, 2015, the European Equities segment's operating income increased $3.9$1.5 million to $25.8$31.9 million compared to the nine monthsyear ended September 30,December 31, 2014. This was driven by a 37.4%28.0% increase in market ADNV offset by a 19.5%17.9% decrease in net capture and an 8.2%a 7.2% decline in the average British pound/U.S. dollar exchange rate. Operating expenses decreased $2.2$0.7 million driven by the $1.5 million VAT credit received in second quarter 2015 and the $0.3 million VAT credit received in the third quarter 2015.
U.S. Options
The following summarizes revenues, cost of revenues, operating expenses and operating income for our U.S. Options segment:
| | | | | Percentage of Total Revenues | | | | Percentage of Total Revenues | ||||||||||||||||||||||||
|---|---|---|---|---|---|---|---|---|---|---|---|---|---|---|---|---|---|---|---|---|---|---|---|---|---|---|---|---|---|---|---|---|
| | Nine Months Ended September 30, | | Nine Months Ended September 30, | Year Ended December 31, | | Year Ended December 31, | ||||||||||||||||||||||||||
| | Percent Change | Percent Change | ||||||||||||||||||||||||||||||
| | 2015 | 2014 | 2015 | 2014 | 2015 | 2014 | 2015 | 2014 | ||||||||||||||||||||||||
| | (in millions) | | | | (in millions) | | | | ||||||||||||||||||||||||
Revenues: | ||||||||||||||||||||||||||||||||
Transaction fees | $ | 172.3 | $ | 74.3 | 131.9 | % | 12.9 | % | 7.2 | % | $ | 221.8 | $ | 113.8 | 94.9 | % | 12.5 | % | 7.8 | % | ||||||||||||
Regulatory transaction fees | 4.6 | 2.0 | 130.0 | % | 0.3 | % | 0.2 | % | 6.1 | 3.3 | 84.8 | % | 0.3 | % | 0.2 | % | ||||||||||||||||
Market data fees | 5.7 | 2.8 | 103.6 | % | 0.4 | % | 0.3 | % | 7.6 | 4.0 | 90.0 | % | 0.4 | % | 0.3 | % | ||||||||||||||||
Other | 4.7 | 2.6 | 80.8 | % | 0.4 | % | 0.3 | % | ||||||||||||||||||||||||
Port fees and other | 6.7 | 3.5 | 91.4 | % | 0.4 | % | 0.2 | % | ||||||||||||||||||||||||
| | | | | | | | | | | | | | | | | | | | | | | | | | | | | | | | ||
Total revenues | 187.3 | 81.7 | 129.3 | % | 14.0 | % | 8.0 | % | 242.2 | 124.6 | 94.4 | % | 13.6 | % | 8.5 | % | ||||||||||||||||
Cost of revenues: | ||||||||||||||||||||||||||||||||
Liquidity payments | 161.6 | 66.8 | 141.9 | % | 12.1 | % | 6.5 | % | 206.0 | 103.0 | 100.0 | % | 11.6 | % | 7.1 | % | ||||||||||||||||
Section 31 fees | 4.6 | 2.0 | 130.0 | % | 0.3 | % | 0.2 | % | 6.1 | 3.3 | 84.8 | % | 0.3 | % | 0.2 | % | ||||||||||||||||
Routing and clearing payments | 3.2 | 1.1 | 190.9 | % | 0.3 | % | 0.1 | % | ||||||||||||||||||||||||
Routing and clearing | 4.0 | 1.5 | 166.7 | % | 0.2 | % | 0.1 | % | ||||||||||||||||||||||||
| | | | | | | | | | | | | | | | | | | | | | | | ��� | | | | | | | | | |
Total cost of revenues | 169.4 | 69.9 | 142.3 | % | 12.7 | % | 6.8 | % | 216.1 | 107.8 | 100.5 | % | 12.1 | % | 7.4 | % | ||||||||||||||||
| | | | | | | | | | | | | | | | | | | | | | | | | | | | | | | | ||
Revenues less cost of revenues | 17.9 | 11.8 | 51.7 | % | 1.3 | % | 1.2 | % | 26.1 | 16.8 | 55.4 | % | 1.5 | % | 1.1 | % | ||||||||||||||||
Operating expenses | 10.7 | 6.1 | 75.4 | % | 0.8 | % | 0.6 | % | 16.3 | 8.5 | 91.8 | % | 0.9 | % | 0.6 | % | ||||||||||||||||
| | | | | | | | | | | | | | | | | | | | | | | | | | | | | | | | ||
Operating income | $ | 7.2 | $ | 5.7 | 26.3 | % | 0.5 | % | 0.6 | % | $ | 9.8 | $ | 8.3 | 18.1 | % | 0.6 | % | 0.5 | % | ||||||||||||
| | | | | | | | | | | | | | | | | | | | | | | | | | | | | | | | | |
| | | | | | | | | | | | | | | | | | | | | | | | | | | | | | | | ||
EBITDA(1) | $ | 8.6 | $ | 6.4 | 34.4 | % | 0.6 | % | 0.6 | % | $ | 11.4 | $ | 9.2 | 23.9 | % | 0.6 | % | 0.6 | % | ||||||||||||
EBITDA margin(2) | 48.0 | % | 54.2 | % | * | * | * | 43.7 | % | 54.8 | % | * | * | * | ||||||||||||||||||
Normalized EBITDA(1) | $ | 8.6 | $ | 6.4 | 34.4 | % | 0.6 | % | 0.6 | % | $ | 11.4 | $ | 9.2 | 23.9 | % | 0.6 | % | 0.6 | % | ||||||||||||
Normalized EBITDA margin(2) | 48.0 | % | 54.2 | % | * | * | * | 43.7 | % | 54.8 | % | * | * | * | ||||||||||||||||||
Market ADV (in thousands of contracts) | 16,271.1 | 16,281.5 | (0.1 | )% | * | * | ||||||||||||||||||||||||||
ADV (in millions): | ||||||||||||||||||||||||||||||||
Matched contracts | 1.5 | 0.8 | 87.5 | % | * | * | ||||||||||||||||||||||||||
Routed contracts | 0.1 | — | * | * | * | |||||||||||||||||||||||||||
| | | | | | | | | | | | | | | | | |||||||||||||||||
Total touched contracts | 1.6 | 0.8 | 100.0 | % | * | * | ||||||||||||||||||||||||||
| | | | | | | | | | | | | | | | | |||||||||||||||||
| | | | | | | | | | | | | |||||||||||||||||||||
| | | | | | | | | | | | | | | | | |||||||||||||||||
Market ADV | 16.1 | 16.6 | (3.0 | )% | * | * | ||||||||||||||||||||||||||
Trading days | 252 | 252 | — | * | * | |||||||||||||||||||||||||||
Market share | 9.9 | % | 4.2 | % | * | * | * | 9.6 | % | 4.8 | % | * | * | * | ||||||||||||||||||
Net capture per touched contract | $ | 0.024 | $ | 0.049 | (51.0 | )% | * | * | $ | 0.030 | $ | 0.046 | (34.8 | )% | * | �� | * | |||||||||||||||
For the nine monthsyear ended September 30,December 31, 2015, the U.S. Options segment's operating income increased $1.5 million to $7.2$9.8 million compared to the nine monthsyear ended September 30,December 31, 2014. Revenues less cost of revenues increased $6.1$9.3 million primarily driven by increased market share, from 4.2%4.8% in 2014 to 9.9% 9.6%
in 2015. Operating expenses increased $4.6$7.8 million driven by increases in compensation due to the preparation of the second Options book (EDGX Options) launched in the November 2015.
Global FX
The following summarizes revenues, cost of revenues, operating expenses and operating income for our Global FX segment:
| | | | | Percentage of Total Revenues | | | | Percentage of Total Revenues | ||||||||||||||||||||||||
|---|---|---|---|---|---|---|---|---|---|---|---|---|---|---|---|---|---|---|---|---|---|---|---|---|---|---|---|---|---|---|---|---|
| | Nine Months Ended September 30, | | Nine Months Ended September 30, | Year Ended December 31, | | Year Ended December 31, | ||||||||||||||||||||||||||
| | Percent Change | Percent Change | ||||||||||||||||||||||||||||||
| | 2015 | 2014 | 2015 | 2014 | 2015 | 2014 | 2015 | 2014 | ||||||||||||||||||||||||
| | (in millions, except as noted below) | | | | (in millions, except as noted below) | | | | ||||||||||||||||||||||||
Revenues | $ | 23.2 | — | * | 1.7 | % | * | |||||||||||||||||||||||||
Revenues (transaction fees) | $ | 31.8 | — | * | 1.8 | % | * | |||||||||||||||||||||||||
Cost of revenues | — | — | — | — | * | — | — | — | — | * | ||||||||||||||||||||||
| | | | | | | | | | | | | | | | | | | | | | | | | | | | | | | | ||
Revenues less cost of revenues | 23.2 | — | * | 1.7 | % | * | 31.8 | — | * | 1.8 | % | * | ||||||||||||||||||||
Operating expenses | 27.2 | — | * | 2.0 | % | * | 38.4 | — | * | 2.2 | % | * | ||||||||||||||||||||
| | | | | | | | | | | | | | | | | | | | | | | | | | | | | | | | ||
Operating loss | $ | (4.0 | ) | — | * | (0.3 | )% | * | $ | (6.6 | ) | — | * | (0.4 | )% | * | ||||||||||||||||
| | | | | | | | | | | | | | | | | | | | | | | | | | | | | | | | | |
| | | | | | | | | | | | | | | | | | | | | | | | | | | | | | | | ||
EBITDA(1) | $ | 3.5 | — | * | 0.3 | % | * | $ | 6.1 | — | * | 0.3 | % | * | ||||||||||||||||||
EBITDA margin(2) | 15.1 | % | — | * | * | * | 19.2 | % | — | * | * | * | ||||||||||||||||||||
Normalized EBITDA(1) | $ | 9.9 | — | * | 0.7 | % | * | $ | 13.6 | — | * | 0.8 | % | * | ||||||||||||||||||
Normalized EBITDA margin(2) | 42.7 | % | — | * | * | * | 42.8 | % | — | * | * | * | ||||||||||||||||||||
ADNV (in billions) | $ | 27.8 | * | * | * | * | $ | 25.8 | * | * | * | * | ||||||||||||||||||||
Net capture per one million dollars traded | $ | 3.01 | * | * | * | * | $ | 2.95 | * | * | * | * | ||||||||||||||||||||
Trading days | 209 | * | * | * | * | |||||||||||||||||||||||||||
For the nine monthsyear ended September 30,December 31, 2015, the Global FX segment's operating loss was $4.0$6.6 million. This was primarily driven by the BATSBats Hotspot Acquisition in March 2015 and the amortization on the intangible assets acquired.
Comparison of Years Ended December 31, 2014 and 2013
Overview
The following summarizes changes in financial performance for the year ended December 31, 2014, compared to the year ended December 31, 2013:
| | Year Ended December 31, | | | Year Ended December 31, | | | ||||||||||||||||||||
|---|---|---|---|---|---|---|---|---|---|---|---|---|---|---|---|---|---|---|---|---|---|---|---|---|---|---|
| | Increase/ (Decrease) | Percent Change | Increase/ (Decrease) | Percent Change | ||||||||||||||||||||||
| | 2014 | 2013 | 2014 | 2013 | ||||||||||||||||||||||
| | (in millions, except percentages and items noted below) | | (in millions, except percentages, trading days, earnings per share and items noted below) | |||||||||||||||||||||||
Total revenues | $ | 1,458.2 | $ | 841.5 | $ | 616.7 | 73.3 | % | $ | 1,458.2 | $ | 841.5 | $ | 616.7 | 73.3 | % | ||||||||||
Total cost of revenues | 1,150.7 | 644.7 | 506.0 | 78.5 | % | 1,150.7 | 644.7 | 506.0 | 78.5 | % | ||||||||||||||||
| | | | | | | | | | | | | | | | | | | | | | | | | | ||
Revenues less cost of revenues | 307.5 | 196.8 | 110.7 | 56.3 | % | 307.5 | 196.8 | 110.7 | 56.3 | % | ||||||||||||||||
Total operating expenses | 187.9 | 95.2 | 92.7 | 97.4 | % | 187.9 | 95.2 | 92.7 | 97.4 | % | ||||||||||||||||
| | | | | | | | | | | | | | | | | | | | | | | | | | ||
Operating income | 119.6 | 101.6 | 18.0 | 17.7 | % | 119.6 | 101.6 | 18.0 | 17.7 | % | ||||||||||||||||
| | | | | | | | | | | | | | | | | | | | | | | | | | ||
Interest and investment income | (27.3 | ) | (25.8 | ) | (1.5 | ) | 5.8 | % | ||||||||||||||||||
Other income (expenses) | (12.0 | ) | (0.2 | ) | (11.8 | ) | * | |||||||||||||||||||
Interest expense, net | (27.3 | ) | (25.8 | ) | (1.5 | ) | 5.8 | % | ||||||||||||||||||
Other expenses | (12.0 | ) | (0.2 | ) | (11.8 | ) | * | |||||||||||||||||||
| | | | | | | | | | | | | | | | | | | | | | | | | | ||
Income before income tax provision | 80.3 | 75.6 | 4.7 | 6.2 | % | 80.3 | 75.6 | 4.7 | 6.2 | % | ||||||||||||||||
Income tax provision | 31.1 | 28.8 | 2.3 | 8.0 | % | 31.1 | 28.8 | 2.3 | 8.0 | % | ||||||||||||||||
| | | | | | | | | | | | | | | | | | | | | | | | | | ||
Net income | $ | 49.2 | $ | 46.8 | $ | 2.4 | 5.1 | % | $ | 49.2 | $ | 46.8 | $ | 2.4 | 5.1 | % | ||||||||||
| | | | | | | | | | | | | | | | | | | | | | | | | | | |
| | | | | | | | | | | | | | | | | | | | | | | | | | ||
EBITDA(1) | $ | 136.0 | $ | 116.6 | $ | 19.4 | 16.6 | % | $ | 136.0 | $ | 116.6 | $ | 19.4 | 16.6 | % | ||||||||||
| | | | | | | | | | | | | | | | | | | | | | | | | | | |
| | | | | | | | | | | | | | | | | | | | | | | | | | ||
EBITDA margin(2) | 44.2 | % | 59.2 | % | 44.2 | % | 59.2 | % | ||||||||||||||||||
Normalized EBITDA(1) | $ | 168.1 | $ | 124.1 | $ | 44.0 | 35.5 | % | $ | 168.1 | $ | 124.1 | $ | 44.0 | 35.5 | % | ||||||||||
Normalized EBITDA margin(2) | 54.7 | % | 63.1 | % | 54.7 | % | 63.1 | % | ||||||||||||||||||
Total market ADV: | ||||||||||||||||||||||||||
U.S. Equities (in millions of shares) | 6,414.2 | 6,187.0 | 227.2 | 3.7 | % | |||||||||||||||||||||
BATS ETPs (in millions of shares) | 268.7 | 264.2 | 4.5 | 1.7 | % | |||||||||||||||||||||
BATS ETPs: launches (number of launches) | 5 | 6 | (1 | ) | (16.7 | )% | ||||||||||||||||||||
BATS ETPs: listings (number of listings) | 28 | 23 | 5 | 21.7 | % | |||||||||||||||||||||
European Equities (in millions of ADNV) | €39,659.3 | €32,613.6 | €7,045.7 | 21.6 | % | |||||||||||||||||||||
U.S. Options (in thousands of contracts) | 16,586.3 | 15,934.2 | 652.1 | 4.1 | % | |||||||||||||||||||||
Adjusted earnings(3) | $ | 75.2 | $ | 55.1 | $ | 20.1 | 36.5 | % | ||||||||||||||||||
Adjusted earnings margin(4) | 24.5 | % | 28.0 | % | (3.5 | )% | * | |||||||||||||||||||
Diluted Adjusted earnings per share(5) | $ | 2.37 | $ | 2.42 | $ | (0.05 | ) | $ | (2.07 | )% | ||||||||||||||||
U.S. Equities: | ||||||||||||||||||||||||||
ADV: | ||||||||||||||||||||||||||
Matched shares ADV (in billions) | 1.2 | 0.6 | 0.6 | 100.0 | % | |||||||||||||||||||||
Routed shares ADV (in billions) | 0.1 | 0.1 | — | — | ||||||||||||||||||||||
| | | | | | | | | | | | | | ||||||||||||||
Total touched shares (in billions) | 1.3 | 0.7 | 0.6 | 85.7 | % | |||||||||||||||||||||
| | | | | | | | | | | | | | ||||||||||||||
| | | | | | | | | | | |||||||||||||||||
| | | | | | | | | | | | | | ||||||||||||||
Market ADV (in billions) | 6.4 | 6.2 | 0.2 | 3.2 | % | |||||||||||||||||||||
Trading days | 252 | 252 | — | — | ||||||||||||||||||||||
Bats ETPs (in billions of shares) | 0.3 | 0.3 | — | 0 | % | |||||||||||||||||||||
Bats ETPs: launches (number of launches) | 5 | 6 | (1 | ) | (16.7 | )% | ||||||||||||||||||||
Bats ETPs: listings (number of listings) | 28 | 23 | 5 | 21.7 | % | |||||||||||||||||||||
European Equities: | ||||||||||||||||||||||||||
ADNV: | ||||||||||||||||||||||||||
Matched and touched ADNV (in billions) | € | 8.6 | € | 7.5 | € | 1.1 | 14.7 | % | ||||||||||||||||||
Market ADNV (in billions) | € | 39.7 | € | 32.6 | € | 7.1 | 21.8 | % | ||||||||||||||||||
Trading days | 256 | 256 | — | — | ||||||||||||||||||||||
Average Euro/British pound exchange rate | £0.8062 | £0.8489 | £(0.0427 | ) | (5.0 | )% | ||||||||||||||||||||
U.S. Options: | ||||||||||||||||||||||||||
ADV: | ||||||||||||||||||||||||||
Matched contracts ADV | 0.8 | 0.6 | 0.2 | 33.3 | % | |||||||||||||||||||||
Routed contracts ADV | — | — | — | — | ||||||||||||||||||||||
| | | | | | | | | | | | | | ||||||||||||||
Total touched contracts | 0.8 | 0.6 | 0.2 | 33.3 | % | |||||||||||||||||||||
| | | | | | | | | | | | | | ||||||||||||||
| | | | | | | | | | | |||||||||||||||||
| | | | | | | | | | | | | | ||||||||||||||
Market ADV | 16.6 | 15.9 | 0.7 | 4.4 | % | |||||||||||||||||||||
Trading days | 252 | 252 | — | — | ||||||||||||||||||||||
Market share: | ||||||||||||||||||||||||||
U.S. Equities | 19.4 | % | 10.4 | % | 19.4 | % | 10.4 | % | ||||||||||||||||||
ETPs | 22.2 | % | 22.9 | % | (0.7 | )% | * | 22.2 | % | 22.9 | % | (0.7 | )% | * | ||||||||||||
ETPs: launches | 2.5 | % | 3.9 | % | (1.4 | )% | * | 2.5 | % | 3.9 | % | (1.4 | )% | * | ||||||||||||
ETPs: listings | 1.7 | % | 1.5 | % | 0.2 | % | * | 1.7 | % | 1.5 | % | 0.2 | % | * | ||||||||||||
European Equities | 21.6 | % | 23.1 | % | 21.6 | % | 23.1 | % | ||||||||||||||||||
U.S. Options | 4.8 | % | 3.7 | % | 4.8 | % | 3.7 | % | ||||||||||||||||||
Maker-taker exchanges(3) | 4.7 | % | 3.7 | % | 1.0 | % | * | |||||||||||||||||||
Net capture: | ||||||||||||||||||||||||||
U.S. Equities (net capture per one hundred touched shares) | $ | 0.022 | $ | 0.024 | $ | (0.002 | ) | (8.3 | )% | $ | 0.022 | $ | 0.024 | $ | (0.002 | ) | (8.3 | )% | ||||||||
European Equities (net capture per matched notional value in basis points) | 0.162 | 0.167 | (0.005 | ) | (3.0 | )% | 0.162 | 0.167 | (0.005 | ) | (3.0 | )% | ||||||||||||||
U.S. Options (net capture per touched contract) | $ | 0.046 | $ | 0.058 | $ | (0.012 | ) | (20.7 | )% | $ | 0.046 | $ | 0.058 | $ | (0.012 | ) | (20.7 | )% | ||||||||
accordance with generally accepted accounting principles in the United States, or U.S. GAAP. We have presented EBITDA and Normalized EBITDA because we consider them important supplemental measures of our performance and believe that they are frequently used by analysts, investors and other interested parties in the evaluation of companies. In addition, we use Normalized EBITDA as a measure of operating performance for preparation of our forecasts, evaluating our leverage ratio for the debt to earnings covenant included in our outstanding credit facility and calculating employee and executive bonuses. Other companies may calculate EBITDA and Normalized EBITDA differently than we do. EBITDA and Normalized EBITDA have limitations as analytical tools, and you should not consider them in isolation or as substitutes for analysis of our results as reported under U.S. GAAP.
The following is a reconciliation of net income to EBITDA and Normalized EBITDA:
| | Year Ended December 31, | Year Ended December 31, | ||||||||||||
|---|---|---|---|---|---|---|---|---|---|---|---|---|---|---|
| | 2014 | 2013 | 2014 | 2013 | ||||||||||
| | (in millions) | (in millions) | ||||||||||||
Net income | $ | 49.2 | $ | 46.8 | $ | 49.2 | $ | 46.8 | ||||||
Interest | 27.3 | 25.8 | 27.3 | 25.8 | ||||||||||
Income tax provision | 31.1 | 28.8 | 31.1 | 28.8 | ||||||||||
Depreciation and amortization | 28.4 | 15.2 | 28.4 | 15.2 | ||||||||||
| | | | | | | | | | | | | | | |
EBITDA | 136.0 | 116.6 | 136.0 | 116.6 | ||||||||||
Acquisition-related costs | 18.5 | 5.2 | 18.5 | 5.2 | ||||||||||
Loss on extinguishment of debt | 13.6 | — | 13.6 | — | ||||||||||
IPO costs | — | 0.6 | — | 0.6 | ||||||||||
Other one-time items | — | 1.7 | ||||||||||||
Impairment of intangible assets | — | 3.5 | ||||||||||||
Regulatory assessment | — | (1.8 | ) | |||||||||||
| | | | | | | | | | | | | | | |
Normalized EBITDA | $ | 168.1 | $ | 124.1 | $ | 168.1 | $ | 124.1 | ||||||
| | | | | | | | | | | | | | | | |
| | | | | | | | | | | | | | | |
The following is a reconciliation of net income to Adjusted earnings:
| | Year Ended December 31, | ||||||
|---|---|---|---|---|---|---|---|
| | 2014 | 2013 | |||||
Net income | $ | 49.2 | $ | 46.8 | |||
Amortization | 10.3 | 5.9 | |||||
Tax effect of amortization | (4.0 | ) | (2.2 | ) | |||
Acquisition-related costs | 18.5 | 5.2 | |||||
IPO costs | — | 0.6 | |||||
Loss on extinguishment of debt | 13.6 | — | |||||
Impairment of intangible assets | — | 3.5 | |||||
Regulatory assessment | — | (1.8 | ) | ||||
Tax effect of other items | (12.4 | ) | (2.9 | ) | |||
| | | | | | | | |
Adjusted earnings | $ | 75.2 | $ | 55.1 | |||
| | | | | | | | |
| | | | | | | | |
| | | | | | | | |
Revenues
Total revenues for the year ended December 31, 2014 were $1,458.2 million, an increase of $616.7 million, or 73.3%, compared to the year ended December 31, 2013, driven primarily by the acquisition of Direct Edge Acquisition in January 2014. The following summarizes changes in revenues for the year ended December 31, 2014, compared to the year ended December 31, 2013:
| | Year Ended December 31, | | | ||||||||||
|---|---|---|---|---|---|---|---|---|---|---|---|---|---|
| | Increase/ (Decrease) | Percent Change | |||||||||||
| | 2014 | 2013 | |||||||||||
| | (in millions) | ||||||||||||
Transaction fees | $ | 1,009.9 | $ | 612.8 | $ | 397.1 | 64.8 | % | |||||
Regulatory transaction fees | 272.0 | 127.4 | 144.6 | 113.5 | % | ||||||||
Market data fees | 110.3 | 59.4 | 50.9 | 85.7 | % | ||||||||
Port fees and other | 66.0 | 41.9 | 24.1 | 57.5 | % | ||||||||
| | | | | | | | | | | | | | |
Total revenues | $ | 1,458.2 | $ | 841.5 | $ | 616.7 | 73.3 | % | |||||
| | | | | | | | | | | | | | |
| | | | | | | | | | | | | | |
| | | | | | | | | | | | | | |
Transaction Fees
Transaction fees increased $397.1 million, or 64.8%, to $1,009.9 million for the year ended December 31, 2014, representing 69.3% of total revenues, compared with $612.8 million for the prior-year period,prior year, or 72.8% of total revenues. This increase in transaction fees was driven by a 3.7%3.2% increase in U.S. equities market ADV and the Direct Edge Acquisition resulting in a market share increase from 10.4% in 2013 to 19.4% in 2014, which combined added $348.9 million in transaction
fees. European Equities transaction fees increased $8.4 million in 2014 as European equities market ADNV increased 21.6%21.8% over 2013, offset by a decrease in market share from 23.1% in 2013 to 21.6% in 2014. U.S. Options transaction fees increased $30.8 million due to an increase in transaction fees per touched contract from $0.547 for 2013 to $0.563 for 2014 and a market share increase from 3.7% in 2013 to 4.8% in 2014.
Regulatory Transaction Fees
Regulatory transaction fees increased $144.6 million, or 113.5%, to $272.0 million for the year ended December 31, 2014, representing 18.7% of total revenues, compared with $127.4 million for the prior-year period,prior year, or 15.1% of total revenues. This increase was driven by the Direct Edge Acquisition, which contributed $113.5 million to the increase. The remaining increase was driven by a Section 31 rate increase. The SEC periodically adjusts the assessment rate, which affects the amount of fees that are passed through to members by national securities exchanges. During the first quarter 2014, the rate increased from $17.40 per million dollars traded to $22.10 per million dollars traded.
Market Data Fees
Market data fees increased $50.9 million, or 85.7%, to $110.3 million for the year ended December 31, 2014, representing 7.6% of total revenues, compared with $59.4 million for the prior-year period,prior year, or 7.1% of total revenues. This increase was primarily driven by our increase in market share from 10.4% in 2013 to 19.4% in 2014 due to the Direct Edge Acquisition, which added $44.3 million to the 2014 results and proprietary market data fees as a result of BZX and BYX equity exchanges beginning to charge for proprietary market data in the third quarter 2014 and inclusion of EDGX and EDGA proprietary market data revenue as of the date of the Direct Edge Acquisition.
Port Fees and Other
Other revenues increased $24.1 million, or 57.5%, to $66.0 million for the year ended December 31, 2014, compared with $41.9 million for the year ended December 31, 2013. This increase is primarily due to the Direct Edge Acquisition, which contributed $22.7 million to the 2014 results. The remaining increase is primarily driven by European Equities as it began charging for certain ports in the third quarter of 2013.
Cost of Revenues
Cost of revenues increased $506.0 million, or 78.5%, to $1,150.7 million for the year ended December 31, 2014 from $644.7 million for the year ended December 31, 2013, driven primarily by the Direct Edge Acquisition and a change to the Section 31 rate in 2014. The following summarizes changes in cost of revenues for the year ended December 31, 2014 compared to the prior-year period:
| | Year Ended December 31, | | | ||||||||||
|---|---|---|---|---|---|---|---|---|---|---|---|---|---|
| | Increase/ (Decrease) | Percent Change | |||||||||||
| | 2014 | 2013 | |||||||||||
| | (in millions) | ||||||||||||
Liquidity payments | $ | 831.4 | $ | 474.7 | $ | 356.7 | 75.1 | % | |||||
Section 31 fees | 272.0 | 127.4 | 144.6 | 113.5 | % | ||||||||
Routing and clearing | 47.3 | 42.6 | 4.7 | 11.0 | % | ||||||||
| | | | | | | | | | | | | | |
Total | $ | 1,150.7 | $ | 644.7 | $ | 506.0 | 78.5 | % | |||||
| | | | | | | | | | | | | | |
| | | | | | | | | | | | | | |
| | | | | | | | | | | | | | |
Liquidity Payments
Liquidity payments increased $356.7 million, or 75.1%, to $831.4 million for the year ended December 31, 2014, representing 57.0% of total revenues, compared with $474.7 million for the prior-year period,prior year, or 56.4% of total revenues. This increase was primarily driven by the Direct Edge Acquisition, which added $281.8 million to the 2014 results. In addition, BYX liquidity payments increased $57.3 million over 2013 due to pricing changes in the second quarter 2014 and increased market share from 2.0% in 2013 to 3.1% in 2014. European Equities liquidity payments increased $3.8 million, driven by a 21.6%21.8% increase in European equities market ADNV. Finally, U.S. Options liquidity payments increased $30.0$29.9 million, driven by a pricing increase and more members receiving higher rebates for achieving volume tiers.
Section 31 Fees
Section 31 fees increased $144.6 million, or 113.5%, to $272.0 million for the year ended December 31, 2014, representing 18.7% of total revenues, compared with $127.4 million for the prior-year period,prior year, or 15.1% of total revenues for the reasons stated previously under "—Components of Revenues—Regulatory Transaction Fees."
Routing and Clearing
Routing and clearing fees increased $4.7 million, or 11.0%, to $47.3 million for the year ended December 31, 2014, representing 3.2% of total revenues, compared with $42.6 million for the prior-year period,prior year, or 5.1% of total revenues. This increase was primarily driven by the increase in routed transactions as a result of the Direct Edge Acquisition offset by a decrease in U.S. Equities fees per 100 routed shares from $0.252 for the year ended December 31, 2013 to $0.181 per routed shares for the year ended December 31, 2014 as pricing changes were made in the second quarter of 2014.
Revenues Less Cost of Revenues
Revenues less cost of revenues increased to $307.5 million in the year ended December 31, 2014 compared to $196.8 million for the year ended December 31, 2013, an increase of 56.3% primarily as a result of the Direct Edge Acquisition. The following summarizes the components of revenues less cost
of revenues in 2014, presented as a percentage of revenues less cost of revenues and compared to the prior-year period:prior year:
| | | | | Percentage of Revenues Less Cost of Revenues | | | | Percentage of Revenues Less Cost of Revenues | ||||||||||||||||||||||||
|---|---|---|---|---|---|---|---|---|---|---|---|---|---|---|---|---|---|---|---|---|---|---|---|---|---|---|---|---|---|---|---|---|
| | Year Ended December 31, | | Year Ended December 31, | | ||||||||||||||||||||||||||||
| | Percent Change | Percentage of Revenues Less Cost of Revenues | Percent Change | Percentage of Revenues Less Cost of Revenues | ||||||||||||||||||||||||||||
| | 2014 | 2013 | 2014 | 2013 | 2014 | 2013 | 2014 | 2013 | ||||||||||||||||||||||||
| | (in millions) | | | | (in millions) | | | | ||||||||||||||||||||||||
Transaction fees less liquidity payments and routing and clearing costs | $ | 131.2 | $ | 95.5 | 37.4 | % | 42.7 | % | 48.5 | % | $ | 131.2 | $ | 95.5 | 37.4 | % | 42.7 | % | 48.5 | % | ||||||||||||
Market data fees | 110.3 | 59.4 | 85.7 | % | 35.9 | % | 30.2 | % | 110.3 | 59.4 | 85.7 | % | 35.9 | % | 30.2 | % | ||||||||||||||||
Regulatory transaction fees less Section 31 fees | — | — | — | — | — | — | — | — | — | — | ||||||||||||||||||||||
Port fees and other revenues less other cost of revenues | 66.0 | 41.9 | 57.5 | % | 21.4 | % | 21.3 | % | ||||||||||||||||||||||||
Port fees | 66.0 | 41.9 | 57.5 | % | 21.4 | % | 21.3 | % | ||||||||||||||||||||||||
| | | | | | | | | | | | | | | | | | | | | | | | | | | | | | | | ||
Revenues less cost of revenues | $ | 307.5 | $ | 196.8 | 56.3 | % | 100.0 | % | 100.0 | % | $ | 307.5 | $ | 196.8 | 56.3 | % | 100.0 | % | 100.0 | % | ||||||||||||
| | | | | | | | | | | | | | | | | | | | | | | | | | | | | | | | | |
| | | | | | | | | | | | | | | | | | | | | | | | | | | | | | | | ||
Fluctuations in Revenues Less Cost of Revenues
Fluctuations in revenues less cost of revenues are driven by various factors. Volume variances are driven by changes in overall industry volume and our share of those volumes, while net capture variances are driven by pricing changes. The following summarizes the fluctuations in revenues less cost
of revenues for the year ended December 31, 2013 to December 31, 2014 and attributes the fluctuations to various sources:
| | Total | Percentage of Total | |||||
|---|---|---|---|---|---|---|---|
| | (in millions) | | |||||
Market volume | $ | 11.2 | 10.1 | % | |||
Market share | 76.1 | 68.7 | % | ||||
Net capture | (10.0 | ) | (9.0 | )% | |||
Routing volume | 2.1 | 1.9 | % | ||||
Other | 31.3 | 28.3 | % | ||||
| | | | | | | | |
Revenues less cost of revenues | $ | 110.7 | 100.0 | % | |||
| | | | | | | | |
| | | | | | | | |
| | | | | | | | |
Transaction Fees Less Liquidity Payments and Routing and Clearing Costs
Transaction fees less liquidity payments and routing and clearing costs increased $35.7 million, or 37.4%, to $131.2 million for the year ended December 31, 2014, representing 42.7% of revenues less cost of revenues, compared with $95.5 million for the prior-year period,prior year, or 48.5% of revenues less cost of revenues. The increase was primarily due to an increase of $30.6 million in U.S. Equities and $4.5 million in European Equities. U.S. Equities market share increased from 10.4% in 2013 to 19.4% in 2014 as a result of the Direct Edge Acquisition along with U.S. equities market ADV increasing by 3.7%3.2% over the prior year. European Equities increased as a result of an increase in European equities market ADNV of 21.6%21.8% for 2014 over the prior year.
Market Data Fees
Market data fees increased $50.9 million, or 85.7%, to $110.3 million for the year ended December 31, 2014, representing 35.9% of revenues less cost of revenues, compared with $59.4 million for the prior-year period,prior year, or 30.2% of revenues less cost of revenues. For purposes of calculating these percentages, we have not attributed any incremental costs associated with providing trading and quoting information to the U.S. tape plans. This increase was largely driven by U.S. Equities market share as it increased from 10.4% in 2013 to 19.4% in 2014 as a result of the Direct Edge Acquisition thus
increasing our share of the U.S. tape plan market data revenue. Also contributing to the increase was a $7.5 million increase in proprietary market data driven by the Direct Edge Acquisition, which added $3.2 million in 2014, and BZX and BYX charging for proprietary market data in third quarter 2013 that contributed $3.0 million to the increase in 2014.
Port Fees and Other Revenues Less Other Cost of Revenues
Port fees and other revenues less other cost of revenues increased to $66.0 million for the year ended December 31, 2014, representing 21.4% of revenues less cost of revenues, compared with $41.9 million for the prior-year period,prior year, or 21.3% of revenues less cost of revenues. This increase is due to the acquisition of Direct Edge Acquisition, which added $22.7 million in 2014. The remaining increase was driven by European Equities charging for Spin and GAP ports in the third quarter of 2013.
Operating Expenses
Total operating expenses increased $92.7 million, or 97.4%, to $187.9 million for the year ended December 31, 2014, compared with $95.2 million for the year ended December 31, 2013. The increase
was primarily due to the acquisition of Direct Edge.Edge Acquisition. The following summarizes changes in operating expenses for the year ended December 31, 2014, compared to the prior-year period:prior year:
| | Year Ended December 31, | | | ||||||||||
|---|---|---|---|---|---|---|---|---|---|---|---|---|---|
| | Increase/ (Decrease) | Percent Change | |||||||||||
| | 2014 | 2013 | |||||||||||
| | (in millions) | | |||||||||||
Operating expenses: | |||||||||||||
Compensation and benefits | $ | 87.0 | $ | 41.5 | $ | 45.5 | 109.6 | % | |||||
Depreciation and amortization | 28.4 | 15.2 | 13.2 | 86.8 | % | ||||||||
Systems and data communication | 23.5 | 9.6 | 13.9 | 144.8 | % | ||||||||
Occupancy | 4.2 | 1.9 | 2.3 | 121.1 | % | ||||||||
Professional and contract services | 6.5 | 8.1 | (1.6 | ) | (19.8 | )% | |||||||
Regulatory costs | 12.1 | 5.4 | 6.7 | 124.1 | % | ||||||||
Impairment of assets | — | 3.5 | (3.5 | ) | (100.0 | )% | |||||||
General and administrative | 26.2 | 10.0 | 16.2 | 162.0 | % | ||||||||
| | | | | | | | | | | | | | |
Total operating expenses | $ | 187.9 | $ | 95.2 | $ | 92.7 | 97.4 | % | |||||
| | | | | | | | | | | | | | |
| | | | | | | | | | | | | | |
| | | | | | | | | | | | | | |
Compensation and Benefits
Compensation and benefits increased by $45.5 million, or 109.6%, to $87.0 million for the year ended December 31, 2014, representing 6.0% of total revenues, compared with $41.5 million for the prior-year period,prior year, or 4.9% of total revenues. This increase was primarily driven by the acquisition of Direct Edge Acquisition, which added 132 employees at the time of acquisition and $41.0 million in expense in 2014. During 2014, severance and retention expense related to the Direct Edge Acquisition was $16.7 million. The remaining increase was due to increased non-acquisition-related net headcount, along with an annual merit increase of approximately 5% effective in the fourth quarter of 2014 and 2013, respectively.
Depreciation and Amortization
Depreciation and amortization increased by $13.2 million, or 86.8%, to $28.4 million for the year ended December 31, 2014, compared with $15.2 million for the year ended December 31, 2013, primarily reflecting the added tangible and intangible assets acquired as a result of the Direct Edge Acquisition that contributed $16.0 million in depreciation and amortization in 2014. This was offset by
an impairment charge in 2013 of $3.5 million of the strategic alliance intangible asset acquired in the Chi-X Europe acquisition in 2011.
Systems and Data Communication
Systems and data communication costs increased by $13.9 million, or 144.8%, to $23.5 million for the year ended December 31, 2014, compared with $9.6 million for the year ended December 31, 2013. The increase was primarily due to the acquisition of Direct Edge as a result of increased data center space in New Jersey and Illinois.
Occupancy
Occupancy expenses increased by $2.3 million, or 121.1%, to $4.2 million for the year ended December 31, 2014, compared with $1.9 million for the year ended December 31, 2013, as a result of the lease assumed in New Jersey related to the Direct Edge Acquisition.
Professional and Contract Services
Professional and contract services fees decreased by $1.6 million, or 19.8%, to $6.5 million for the year ended December 31, 2014, compared with $8.1 million for the prior-year period.prior year. The decrease was primarily due to professional fees incurred in 2013 and 2014 related to the Direct Edge Acquisition.
Regulatory Costs
Regulatory costs increased by $6.7 million, or 124.1%, to $12.1 million for the year ended December 31, 2014, compared with $5.4 million for the year ended December 31, 2013. The increase was primarily due to the Direct Edge Acquisition and transition costs associated with a change in regulatory service providers during 2014.
Impairment of Assets
Impairment of assets decreased $3.5 million for the year ended December 31, 2014, compared with $3.5 million for the year ended December 31, 2013. In December 2013, we wrote off an intangible asset acquired with the Chi-X Europe acquisition as we determined not to use the asset going forward.
General and Administrative
General and administrative expenses increased by $16.2 million, or 162.0%, to $26.2 million for the year ended December 31, 2014, compared with $10.0 million for the prior-year period.prior year. This increase was primarily due to the acquisition of Direct Edge.Edge Acquisition. Direct Edge leased its data center equipment and used independent contractors significantly more than the legacy BATSBats operations.
Operating Income
As a result of the items above, operating income for the year ended December 31, 2014 was $119.6 million, or 38.9% of revenues less cost of revenues, compared to $101.6 million, or 51.6% of revenues less cost of revenues, for the year ended December 31, 2013, an increase of $18.0 million, or 17.7%.
Interest and Investment Expense, Net
Interest and investment expense, net increased by $1.5 million to $27.3 million for the year ended December 31, 2014, compared with $25.8 million for the prior-year period.prior year. This decreaseincrease was primarily due to the additional debt issued in January 2014.
Other Income (Expense)
Other expenses increased by $11.8 million to $12.0 million for the year ended December 31, 2014, compared with $0.2 million for the prior-year period, primarily driven by the $13.6 million loss on extinguishment of debt recorded in connection with the debt issued in January 2014. This was offset by the equity earnings of the EuroCCP investment of $1.1 million.
Income Before Income Tax Provision
As a result of the above, income before income tax provision for the year ended December 31, 2014 was $80.3 million compared to $75.6 million in the year ended December 31, 2013, an increase of $4.7 million.
Income Tax Provision
For the year ended December 31, 2014, the income tax provision was $31.1 million compared with $28.8 million for the year ended December 31, 2013. Our income tax provision increased due to increased earnings before income tax. The effective tax rate for the year ended December 31, 2014 was 38.7%, compared to 38.1% for the year ended December 31, 2013. The increase was due to a discrete benefit recognized in 2013 associated with the release of income tax reserves.
Net Income
As a result of the items above, net income for the year ended December 31, 2014 was $49.2 million, or 16.0% of revenues less cost of revenues, compared to $46.8 million, or 23.8% of revenues less cost of revenues, in the year ended December 31, 2013, an increase of $2.4 million.
Segment Operating Results
The following summarizes our total revenues by segment:
| | Year Ended December 31, | | Percentage of Total Revenues | |||||||||||||
|---|---|---|---|---|---|---|---|---|---|---|---|---|---|---|---|---|
| | Percent Change | |||||||||||||||
| | 2014 | 2013 | 2014 | 2013 | ||||||||||||
| | (in millions) | | | | ||||||||||||
U.S. Equities | $ | 1,234.5 | $ | 662.8 | 86.3 | % | 84.7 | % | 78.8 | % | ||||||
European Equities | 99.1 | 86.4 | 14.7 | % | 6.8 | % | 10.3 | % | ||||||||
U.S. Options | 124.6 | 92.3 | 35.0 | % | 8.5 | % | 10.9 | % | ||||||||
| | | | | | | | | | | | | | | | | |
Total revenues | $ | 1,458.2 | $ | 841.5 | 73.3 | % | 100.0 | % | 100.0 | % | ||||||
| | | | | | | | | | | | | | | | | |
| | | | | | | | | | | | | | | | | |
| | | | | | | | | | | | | | | | | |
The following summarizes our revenues less cost of revenues by segment:
| | Year Ended December 31, | | Percentage of Revenues Less Cost of Revenues | |||||||||||||
|---|---|---|---|---|---|---|---|---|---|---|---|---|---|---|---|---|
| | Percent Change | |||||||||||||||
| | 2014 | 2013 | 2014 | 2013 | ||||||||||||
| | (in millions) | | | | ||||||||||||
U.S. Equities | $ | 224.3 | $ | 123.9 | 81.0 | % | 72.9 | % | 62.9 | % | ||||||
European Equities | 66.4 | 57.6 | 15.3 | % | 21.6 | % | 29.3 | % | ||||||||
U.S. Options | 16.8 | 15.3 | 9.8 | % | 5.5 | % | 7.8 | % | ||||||||
| | | | | | | | | | | | | | | | | |
Revenues less cost of revenues | $ | 307.5 | $ | 196.8 | 56.3 | % | 100.0 | % | 100.0 | % | ||||||
| | | | | | | | | | | | | | | | | |
| | | | | | | | | | | | | | | | | |
| | | | | | | | | | | | | | | | | |
U.S. Equities
The following summarizes revenues, cost of revenues, operating expenses and operating income for our U.S. Equities segment:
| | Year Ended December 31, | | Percentage of Total Revenues | |||||||||||||
|---|---|---|---|---|---|---|---|---|---|---|---|---|---|---|---|---|
| | Percent Change | |||||||||||||||
| | 2014 | 2013 | 2014 | 2013 | ||||||||||||
| | (in millions, except percentages and as noted below) | | | | ||||||||||||
Revenues: | ||||||||||||||||
Transaction fees | $ | 816.2 | $ | 458.3 | 78.1 | % | 56.0 | % | 54.5 | % | ||||||
Regulatory transaction fees | 268.7 | 124.7 | 115.5 | % | 18.5 | % | 14.8 | % | ||||||||
Market data fees | 97.6 | 48.5 | 101.2 | % | 6.7 | % | 5.8 | % | ||||||||
Port fees and other | 52.0 | 31.3 | 66.1 | % | 3.5 | % | 3.7 | % | ||||||||
| | | | | | | | | | | | | | | | | |
Total revenues | 1,234.5 | 662.8 | 86.3 | % | 84.7 | % | 78.8 | % | ||||||||
Cost of revenues: | ||||||||||||||||
Liquidity payments | 695.8 | 372.8 | 86.6 | % | 47.7 | % | 44.3 | % | ||||||||
Section 31 fees | 268.7 | 124.7 | 115.5 | % | 18.5 | % | 14.8 | % | ||||||||
Routing and clearing payments | 45.7 | 41.4 | 10.4 | % | 3.1 | % | 4.9 | % | ||||||||
| | | | | | | | | | | | | | | | | |
Total cost of revenues | 1,010.2 | 538.9 | 87.5 | % | 69.3 | % | 64.0 | % | ||||||||
| | | | | | | | | | | | | | | | | |
Revenues less cost of revenues | 224.3 | 123.9 | 81.0 | % | 15.4 | % | 14.8 | % | ||||||||
Operating expenses | 141.3 | 46.6 | 203.2 | % | 9.7 | % | 5.5 | % | ||||||||
| | | | | | | | | | | | | | | | | |
Operating income | $ | 83.0 | $ | 77.3 | 7.4 | % | 5.7 | % | 9.3 | % | ||||||
| | | | | | | | | | | | | | | | | |
| | | | | | | | | | | | | | | | | |
| | | | | | | | | | | | | | | | | |
EBITDA(1) | $ | 103.4 | $ | 81.7 | 26.6 | % | 7.1 | % | 9.7 | % | ||||||
EBITDA margin(2) | 46.1 | % | 65.9 | % | * | * | * | |||||||||
Normalized EBITDA(1) | $ | 121.9 | $ | 85.0 | 43.4 | % | 8.4 | % | 10.1 | % | ||||||
Normalized EBITDA margin(2) | 54.3 | % | 68.6 | % | * | |||||||||||
Market ADV: | 6,414.2 | 6,187.0 | 3.7 | % | * | * | ||||||||||
BATS ETPs (in millions of shares) | 268.7 | 264.2 | 1.7 | % | * | * | ||||||||||
BATS ETPs: launches (number of launches) | 5 | 6 | (16.7 | )% | * | * | ||||||||||
BATS ETPs: listings (number of listings) | 28 | 23 | 21.7 | % | * | * | ||||||||||
Market share | 19.4 | % | 10.4 | % | * | * | * | |||||||||
Net capture per one hundred touched shares | $ | 0.022 | $ | 0.024 | (8.3 | )% | * | * | ||||||||
isolation or as substitutes for analysis of our results as reported under U.S. GAAP. The following is a reconciliation of net income to EBITDA and Normalized EBITDA:
| | Year Ended December 31, | ||||||||||||||||||||||||||||||
|---|---|---|---|---|---|---|---|---|---|---|---|---|---|---|---|---|---|---|---|---|---|---|---|---|---|---|---|---|---|---|---|
| | 2014 | 2013 | |||||||||||||||||||||||||||||
| | U.S. Equities | European Equities | U.S. Options | Corporate items and eliminations | Total | U.S. Equities | European Equities | U.S. Options | Corporate items and eliminations | Total | |||||||||||||||||||||
| | (in millions) | ||||||||||||||||||||||||||||||
Net income (loss) | $ | 40.2 | $ | 37.7 | $ | 8.3 | $ | (37.0 | ) | $ | 49.2 | $ | 45.1 | $ | 11.9 | $ | 8.4 | $ | (18.6 | ) | $ | 46.8 | |||||||||
Interest | — | (0.1 | ) | — | 27.4 | 27.3 | — | (0.1 | ) | — | 25.9 | 25.8 | |||||||||||||||||||
Income tax provision (benefit) | 43.3 | (6.1 | ) | — | (6.1 | ) | 31.1 | 32.2 | 5.4 | — | (8.8 | ) | 28.8 | ||||||||||||||||||
Depreciation and amortization | 19.9 | 7.6 | 0.9 | — | 28.4 | 4.4 | 9.9 | 0.9 | — | 15.2 | |||||||||||||||||||||
| | | | | | | | | | | | | | | | | | | | | | | | | | | | | | | | |
EBITDA | 103.4 | 39.1 | 9.2 | (15.7 | ) | 136.0 | 81.7 | 27.1 | 9.3 | (1.5 | ) | 116.6 | |||||||||||||||||||
Acquisition-related costs | 18.5 | — | — | — | 18.5 | 4.4 | 0.8 | — | — | 5.2 | |||||||||||||||||||||
IPO costs | — | — | — | — | — | 0.6 | — | — | — | 0.6 | |||||||||||||||||||||
Loss on extinguishment of debt | — | — | — | 13.6 | 13.6 | — | — | — | — | — | |||||||||||||||||||||
Other one-time items | — | — | — | — | — | (1.7 | ) | 3.4 | — | — | 1.7 | ||||||||||||||||||||
| | | | | | | | | | | | | | | | | | | | | | | | | | | | | | | | |
Normalized EBITDA | $ | 121.9 | $ | 39.1 | $ | 9.2 | $ | (2.1 | ) | $ | 168.1 | $ | 85.0 | $ | 31.3 | $ | 9.3 | $ | (1.5 | ) | $ | 124.1 | |||||||||
| | | | | | | | | | | | | | | | | | | | | | | | | | | | | | | | |
| | | | | | | | | | | | | | | | | | | | | | | | | | | | | | | | |
| | | | | | | | | | | | | | | | | | | | | | | | | | | | | | | | |
For the year ended December 31, 2014, U.S. Equities operating income increased $5.7 million to $83.0 million. This was driven by the Direct Edge Acquisition.
European Equities
The following summarizes revenues, cost of revenues, operating expenses and operating income for our European Equities segment:
| | | | | Percentage of Total Revenues | ||||||||||||
|---|---|---|---|---|---|---|---|---|---|---|---|---|---|---|---|---|
| | Year Ended December 31, | | ||||||||||||||
| | Percent Change | |||||||||||||||
| | 2014 | 2013 | 2014 | 2013 | ||||||||||||
| | (in millions) | | | | ||||||||||||
Revenues | $ | 99.1 | $ | 86.4 | 14.7 | % | 6.8 | % | 10.3 | % | ||||||
Cost of revenues | 32.7 | 28.8 | 13.5 | % | 2.2 | % | 3.4 | % | ||||||||
| | | | | | | | | | | | | | | | | |
Revenues less cost of revenues | 66.4 | 57.6 | 15.3 | % | 4.6 | % | 6.9 | % | ||||||||
Operating expenses | 36.0 | 40.2 | (10.4 | )% | 2.5 | % | 4.8 | % | ||||||||
| | | | | | | | | | | | | | | | | |
Operating income | $ | 30.4 | $ | 17.4 | 74.7 | % | 2.1 | % | 2.1 | % | ||||||
| | | | | | | | | | | | | | | | | |
| | | | | | | | | | | | | | | | | |
| | | | | | | | | | | | | | | | | |
EBITDA(1) | $ | 39.1 | $ | 27.1 | 44.3 | % | 2.7 | % | 3.2 | % | ||||||
EBITDA margin(2) | 58.9 | % | 47.0 | % | * | * | * | |||||||||
Normalized EBITDA(1) | $ | 39.1 | $ | 31.3 | 24.9 | % | 2.7 | % | 3.7 | % | ||||||
Normalized EBITDA margin(2) | 58.9 | % | 54.3 | % | * | * | * | |||||||||
Market ADNV | € | 39,659.3 | € | 32,613.6 | 21.6 | % | * | * | ||||||||
Market share | 21.6 | % | 23.1 | % | * | * | * | |||||||||
Net capture per matched notional value (in basis points) | 0.162 | 0.167 | (3.0 | )% | * | * | ||||||||||
Average British pound/U.S. dollar exchange rate | $ | 1.6476 | $ | 1.5643 | 5.3 | % | * | * | ||||||||
To illustrate the growth without the effect of the exchange rates in our European Equities segment the following table summarizes revenues, cost of revenues, operating expenses and operating income for our European Equities segment in British pounds:
| | Year Ended December 31, | | ||||||||
|---|---|---|---|---|---|---|---|---|---|---|
| | Percent Change | |||||||||
| | 2014 | 2013 | ||||||||
| | (in millions) | | ||||||||
Revenues | £ | 60.2 | £ | 55.2 | 9.1 | % | ||||
Cost of revenues | 19.9 | 18.4 | 8.2 | % | ||||||
| | | | | | | | | | | |
Revenues less cost of revenues | 40.3 | 36.8 | 9.5 | % | ||||||
Operating expenses | 21.8 | 25.5 | (14.5 | )% | ||||||
| | | | | | | | | | | |
Operating income | £ | 18.5 | £ | 11.3 | 63.7 | % | ||||
| | | | | | | | | | | |
| | | | | | | | | | | |
| | | | | | | | | | | |
EBITDA(1) | £ | 23.8 | £ | 17.4 | 36.8 | % | ||||
Normalized EBITDA(1) | £ | 23.8 | £ | 20.2 | 17.8 | % | ||||
| | Year Ended December 31, | | ||||||||
|---|---|---|---|---|---|---|---|---|---|---|
| | Percent Change | |||||||||
| | 2014 | 2013 | ||||||||
Net income (loss) | £ | 19.2 | £ | 11.1 | 73.0 | % | ||||
Interest | — | — | * | |||||||
Income tax provision (benefit) | — | — | * | |||||||
Depreciation and amortization | 4.6 | 6.3 | (27.0 | )% | ||||||
| | | | | | | | | | | |
EBITDA | 23.8 | 17.4 | 36.8 | % | ||||||
Acquisition-related costs | — | 0.5 | (100.0 | )% | ||||||
IPO costs | — | — | * | |||||||
Loss on extinguishment of debt | — | — | * | |||||||
Other one-time items | — | 2.3 | (100.0 | )% | ||||||
| | | | | | | | | | | |
Normalized EBITDA | £ | 23.8 | £ | 20.2 | 17.8 | % | ||||
| | | | | | | | | | | |
| | | | | | | | | | | |
| | | | | | | | | | | |
For the year ended December 31, 2014, European Equities operating income increased $13.0 million to $30.4 million. This increase was driven by a 21.6% increase in market ADNV, pricing changes to port fees and increased market data revenue. Also included in the increase was the $1.1 million of equity in earnings from the EuroCCP investment added in 2014.
U.S. Options
The following summarizes revenues, cost of revenues, operating expenses and operating income for our U.S. Options segment:
| | | | | Percentage of Total Revenues | ||||||||||||
|---|---|---|---|---|---|---|---|---|---|---|---|---|---|---|---|---|
| | Year Ended December 31, | | ||||||||||||||
| | Percent Change | |||||||||||||||
| | 2014 | 2013 | 2014 | 2013 | ||||||||||||
| | (in millions and as noted below) | | | | ||||||||||||
Revenues: | ||||||||||||||||
Transaction fees | $ | 113.8 | $ | 83.0 | 37.1 | % | 7.8 | % | 9.8 | % | ||||||
Regulatory transaction fees | 3.3 | 2.7 | 22.2 | % | 0.2 | % | 0.3 | % | ||||||||
Market data fees | 4.0 | 3.7 | 8.1 | % | 0.3 | % | 0.4 | % | ||||||||
Port fees and other | 3.5 | 2.9 | 20.7 | % | 0.2 | % | 0.4 | % | ||||||||
| | | | | | | | | | | | | | | | | |
Total revenues | 124.6 | 92.3 | 35.0 | % | 8.5 | % | 10.9 | % | ||||||||
Cost of revenues: | ||||||||||||||||
Liquidity payments | 103.0 | 73.1 | 40.9 | % | 7.1 | % | 8.7 | % | ||||||||
Section 31 fees | 3.3 | 2.7 | 22.2 | % | 0.2 | % | 0.3 | % | ||||||||
Routing and clearing payments | 1.5 | 1.2 | 25.0 | % | 0.1 | % | 0.2 | % | ||||||||
| | | | | | | | | | | | | | | | | |
Total cost of revenues | 107.8 | 77.0 | 40.0 | % | 7.4 | % | 9.2 | % | ||||||||
| | | | | | | | | | | | | | | | | |
Revenues less cost of revenues | 16.8 | 15.3 | 9.8 | % | 1.1 | % | 1.7 | % | ||||||||
Operating expenses | 8.5 | 6.9 | 23.2 | % | 0.6 | % | 0.8 | % | ||||||||
| | | | | | | | | | | | | | | | | |
Operating income | $ | 8.3 | $ | 8.4 | (1.2 | )% | 0.5 | % | 0.9 | % | ||||||
| | | | | | | | | | | | | | | | | |
| | | | | | | | | | | | | | | | | |
| | | | | | | | | | | | | | | | | |
EBITDA(1) | $ | 9.2 | $ | 9.3 | — | 0.6 | % | 1.1 | % | |||||||
EBITDA margin(2) | 54.8 | % | 60.8 | % | * | * | * | |||||||||
Normalized EBITDA(1) | $ | 9.2 | $ | 9.3 | — | 0.6 | % | 1.1 | % | |||||||
Normalized EBITDA margin(2) | 54.8 | % | 60.8 | % | * | * | * | |||||||||
Market ADV (in thousands of contracts) | 16,586.3 | 15,934.2 | 4.1 | % | * | * | ||||||||||
Market share | 4.8 | % | 3.7 | % | * | * | * | |||||||||
Net capture per touched contract | $ | 0.046 | $ | 0.058 | (20.7 | )% | * | * | ||||||||
For the year ended December 31, 2014, U.S. Options operating income was flat, decreasing $0.1 million to $8.3 million. Net revenue increased $1.5 million, primarily driven by increased market share, from 3.7% in 2013 to 4.8% in 2014. However, operating expenses increased $1.6 million, driven by increases in regulatory fees based on a new RSA and an increase in compensation expenses.
Comparison of Years Ended December 31, 2013 and 2012
Overview
The following summarizes changes in financial performance for the year ended December 31, 2013, compared to the year ended December 31, 2012:
| | Year Ended December 31, | | | ||||||||||
|---|---|---|---|---|---|---|---|---|---|---|---|---|---|
| | Increase/ (Decrease) | Percent Change | |||||||||||
| | 2013 | 2012 | |||||||||||
| | (in millions, except percentages and as noted below) | | |||||||||||
Total revenues | $ | 841.5 | $ | 884.7 | $ | (43.2 | ) | (4.9 | )% | ||||
Total cost of revenues | 644.7 | 707.8 | (63.1 | ) | (8.9 | )% | |||||||
| | | | | | | | | | | | | | |
Revenues less cost of revenues | 196.8 | 176.9 | 19.9 | 11.2 | % | ||||||||
Total operating expenses | 95.2 | 117.6 | (22.4 | ) | (19.0 | )% | |||||||
| | | | | | | | | | | | | | |
Operating income | 101.6 | 59.3 | 42.3 | 71.3 | % | ||||||||
| | | | | | | | | | | | | | |
Interest and investment expense | (25.8 | ) | (0.6 | ) | (25.2 | ) | (4200.0 | )% | |||||
Other income (expenses) | (0.2 | ) | (0.6 | ) | 0.4 | 66.7 | % | ||||||
Income before income tax provision | 75.6 | 58.1 | 17.5 | 30.1 | % | ||||||||
Income tax provision | 28.8 | 26.5 | 2.3 | 8.7 | % | ||||||||
| | | | | | | | | | | | | | |
Net income | $ | 46.8 | $ | 31.6 | $ | 15.2 | 48.1 | % | |||||
| | | | | | | | | | | | | | |
| | | | | | | | | | | | | | |
| | | | | | | | | | | | | | |
EBITDA(1) | $ | 116.6 | $ | 75.7 | $ | 40.9 | 54.0 | % | |||||
EBITDA margin(2) | 59.2 | % | 42.8 | % | |||||||||
Normalized EBITDA(1) | $ | 124.1 | $ | 101.3 | $ | 22.8 | 22.5 | % | |||||
Normalized EBITDA margin(3) | 63.1 | % | 57.3 | % | |||||||||
Total market ADV: | |||||||||||||
U.S. Equities (in millions of shares) | 6,187.0 | 6,437.2 | (250.2 | ) | (3.9 | )% | |||||||
BATS ETPs (in millions of shares) | 264.2 | 244.5 | 19.7 | 8.1 | % | ||||||||
BATS ETPs: launches (number of launches) | 6 | 17 | (11 | ) | (64.7 | )% | |||||||
BATS ETPs: listings (number of listings) | 23 | 17 | 6 | 35.3 | % | ||||||||
European Equities (in millions of ADNV) | € | 32,613.6 | € | 30,857.6 | € | 1,756.0 | 5.7 | % | |||||
U.S. Options (in thousands of contracts) | 15,934.2 | 15,651.6 | 282.6 | 1.8 | % | ||||||||
Market share: | |||||||||||||
U.S. Equities | 10.4 | % | 11.9 | % | |||||||||
ETPs | 22.9 | % | 21.4 | % | 1.5 | % | * | ||||||
ETPs: launches | 3.9 | % | 10.4 | % | (6.5 | )% | * | ||||||
ETPs: listings | 1.5 | % | 1.2 | % | 0.3 | % | * | ||||||
European Equities | 23.1 | % | 24.6 | % | |||||||||
U.S. Options | 3.7 | % | 3.3 | % | |||||||||
Net capture: | |||||||||||||
U.S. Equities (net capture per one hundred touched shares) | $ | 0.024 | $ | 0.023 | $ | 0.001 | 4.3 | % | |||||
European Equities (net capture per matched notional value in basis points) | 0.167 | 0.113 | 0.054 | 47.8 | % | ||||||||
U.S. Options (net capture per touched contract) | $ | 0.058 | $ | 0.063 | $ | (0.005 | ) | (7.9 | )% | ||||
accordance with generally accepted accounting principles in the United States, or U.S. GAAP. We have presented EBITDA and Normalized EBITDA because we consider them important supplemental measures of our performance and believe that they are frequently used by analysts, investors and other interested parties in the evaluation of companies. Other companies may calculate EBITDA and Normalized EBITDA differently than we do. EBITDA and Normalized EBITDA have limitations as analytical tools, and you should not consider them in isolation or as substitutes for analysis of our results as reported under U.S. GAAP.
The following is a reconciliation of net income to EBITDA and Normalized EBITDA:
| | Year Ended December 31, | ||||||
|---|---|---|---|---|---|---|---|
| | 2013 | 2012 | |||||
| | (in millions) | ||||||
Net income | $ | 46.8 | $ | 31.6 | |||
Interest | 25.8 | 0.6 | |||||
Income tax provision | 28.8 | 26.5 | |||||
Depreciation and amortization | 15.2 | 17.0 | |||||
| | | | | | | | |
EBITDA | 116.6 | 75.7 | |||||
IPO costs | 0.6 | 6.3 | |||||
Acquisition-related costs | 5.2 | 19.3 | |||||
Other one-time items | 1.7 | — | |||||
| | | | | | | | |
Normalized EBITDA | $ | 124.1 | $ | 101.3 | |||
| | | | | | | | |
| | | | | | | | |
| | | | | | | | |
Revenues
Total revenues for the year ended December 31, 2013 were $841.5 million, a decrease of $43.2 million, or 4.9%, compared to the year ended December 31, 2012, reflecting lower overall U.S. Equities market activity and lower market share in U.S. Equities and European Equities and a decline in the Section 31 fee assessment rate. The following summarizes changes in revenues for the year ended December 31, 2013, compared to the year ended December 31, 2012:
| | Year Ended December 31, | | | ||||||||||
|---|---|---|---|---|---|---|---|---|---|---|---|---|---|
| | Increase/ (Decrease) | Percent Change | |||||||||||
| | 2013 | 2012 | |||||||||||
| | (in millions) | | |||||||||||
Transaction fees | $ | 612.8 | $ | 645.3 | $ | (32.5 | ) | (5.0 | )% | ||||
Regulatory transaction fees | 127.4 | 148.1 | (20.7 | ) | (14.0 | )% | |||||||
Market data fees | 59.4 | 60.3 | (0.9 | ) | (1.5 | )% | |||||||
Port fees and other | 41.9 | 31.0 | 10.9 | 35.2 | % | ||||||||
| | | | | | | | | | | | | | |
Total revenues | $ | 841.5 | $ | 884.7 | $ | (43.2 | ) | (4.9 | )% | ||||
| | | | | | | | | | | | | | |
| | | | | | | | | | | | | | |
| | | | | | | | | | | | | | |
Transaction Fees
Transaction fees decreased $32.5 million, or 5.0%, to $612.8 million for the year ended December 31, 2013, representing 72.8% of total revenues, compared with $645.3 million for the prior-year period, or 72.9% of total revenues. This decrease in transaction fees was largely driven by a decrease in U.S. Equities market share from 11.9% in 2012 to 10.4% in 2013 and a decrease in
European Equities market share from 24.6% in 2012 to 23.1% in 2013. These decreases were offset by the $13.2 million increase in U.S. Options due to an increased market share from 3.3% in 2012 to 3.7% in 2013. Also contributing to U.S. Options increased transaction revenue was an increase in net capture per touched contract from $0.534 per touched contract in 2012 to $0.547 per touched contract in 2013 as a result of pricing changes in 2013.
Regulatory Transaction Fees
Regulatory transaction fees decreased $20.7 million, or 14.0%, to $127.4 million for the year ended December 31, 2013, representing 15.1% of total revenues, compared with $148.1 million for the prior-year period, or 16.7% of total revenues. This decrease was largely driven by a decrease in the Section 31 fee assessment rate, as established by the SEC. The SEC periodically adjusts the assessment rate, which affects the amount of fees that are passed through to members by national securities exchanges. The Section 31 rate decreased from $22.40 per million notional value traded to $17.40 per million notional value traded in May 2013. Also driving the decrease was a decline in ADV in our U.S. Equities segment by 3.9%.
Market Data Fees
Market data fees decreased $0.9 million, or 1.5%, to $59.4 million for the year ended December 31, 2013, representing 7.1% of total revenues, compared with $60.3 million for the prior-year period, or 6.8% of total revenues. The decrease was driven by a $7.9 million decrease in the market data revenue earned from the U.S. consolidated tape plans as a result of U.S. Equities market share decreasing from 11.9% in 2012 to 10.4% in 2013. Offsetting this decrease was the introduction of proprietary market data fees in European Equities during the fourth quarter of 2012 and proprietary market data fees in U.S. Equities in the third quarter of 2013, which contributed $7.2 million and $3.2 million in 2013, respectively.
Port Fees and Other
Port fees and other revenues increased $10.9 million, or 35.2%, to $41.9 million for the year ended December 31, 2013, representing 5.0% of total revenues compared with $31.0 million for the year ended December 31, 2012. This increase is due to the introduction of port fees in the third quarter of 2012 on BYX and the introduction of secondary datacenter port fees on BZX, which in total contributed $4.8 million to the increase. We also changed the port fee pricing structure in our U.S. Options segment in the second quarter 2013, resulting in an increase in revenue of $0.9 million. The European Equities segment began charging for all physical ports in the second quarter 2012, which contributed an increase of approximately $3.2 million for 2013. The remainder of the increase is due to a $1.8 million regulatory assessment recorded in 2013.
Cost of Revenues
Cost of revenues decreased $63.1 million, or 8.9%, to $644.7 million for the year ended December 31, 2013 from $707.8 million for the year ended December 31, 2012. The decrease was primarily due to a decrease in rebate pricing in the European Equities segment in January 2013 and a decrease in the Section 31 rate from $22.40 per million notional value traded in 2012 to $17.40 per
million notional value traded in 2013. The following summarizes changes in cost of revenues for the year ended December 31, 2013 compared to the prior-year period:
| | Year Ended December 31, | | | ||||||||||
|---|---|---|---|---|---|---|---|---|---|---|---|---|---|
| | Increase/ (Decrease) | Percent Change | |||||||||||
| | 2013 | 2012 | |||||||||||
| | (in millions) | | |||||||||||
Liquidity payments | $ | 474.7 | $ | 508.2 | $ | (33.5 | ) | (6.6 | )% | ||||
Section 31 fees | 127.4 | 148.1 | (20.7 | ) | (14.0 | )% | |||||||
Routing and clearing | 42.6 | 51.5 | (8.9 | ) | (17.3 | )% | |||||||
| | | | | | | | | | | | | | |
Total | $ | 644.7 | $ | 707.8 | $ | (63.1 | ) | (8.9 | )% | ||||
| | | | | | | | | | | | | | |
| | | | | | | | | | | | | | |
| | | | | | | | | | | | | | |
Liquidity Payments
Liquidity payments decreased $33.5 million, or 6.6%, to $474.7 million for the year ended December 31, 2013, representing 56.4% of total revenues, compared with $508.2 million for the prior-year period, or 57.4% of total revenues. The decrease was primarily due to a decrease in our U.S. Equities segment of $28.6 million due to decreased market share, down to 10.4% in 2013 from 11.9% in 2012 and an overall decrease in market volumes of 3.9%. Offsetting the decrease was an increase in U.S. Equities liquidity fees from $0.202 per 100 shares in 2012 to $0.222 per 100 shares in 2013, mainly due to volume mix between BZX and BYX and pricing changes on BZX in fourth quarter of 2013. European Equities liquidity payments decreased $17.9 million as the pricing was changed in January 2013. The liquidity rebate decreased from 0.186 basis points in 2012 to 0.112 basis points in 2013. Offsetting this decrease was a $13.0 million increase in U.S. Options liquidity payments, driven by increased market share, from 3.3% in 2012 to 3.7% in 2013 and an increase in market volumes of 1.8%.
Section 31 Fees
Section 31 fees decreased $20.7 million, or 14.0%, to $127.4 million for the year ended December 31, 2013, representing 15.1% of total revenues, compared with $148.1 million for the prior-year period, or 16.7% of total revenues, for the reasons stated previously under "Regulatory Transaction Fees."
Routing and Clearing
Routing and clearing fees decreased $8.9 million, or 17.3%, to $42.6 million for the year ended December 31, 2013, representing 5.0% of total revenues, compared with $51.5 million for the prior-year period, or 5.8% of total revenues. This decrease in routing and clearing fees was driven by a 16.0% decrease, in the total shares routed in the U.S. Equities segment, which represented 97.2% of total routing and clearing fees for the year ended December 31, 2013.
Revenues Less Cost of Revenues
Revenues less cost of revenues as a percentage of total revenues increased to 23.4% in the year ended December 31, 2013 compared to 20.0% for the year ended December 31, 2012, primarily as a result of the additional port fees introduced across all segments. See the discussion under "Port fees and other" above. Also contributing to the increase was increased transaction fees less liquidity payments and routing and clearing costs, as net capture increased in Europe by 47.8% due to pricing changes in the first quarter of 2013.
The following summarizes the components of revenues less cost of revenues in 2013, presented as a percentage of revenues less cost of revenues and compared to the prior year period:
| | | | | Percentage of Revenues Less Cost of Revenues | ||||||||||||
|---|---|---|---|---|---|---|---|---|---|---|---|---|---|---|---|---|
| | Year Ended December 31, | | ||||||||||||||
| | Percent Change | |||||||||||||||
| | 2013 | 2012 | 2013 | 2012 | ||||||||||||
| | (in millions) | | | | ||||||||||||
Transaction fees less liquidity payments and routing and clearing costs | $ | 95.5 | $ | 85.6 | 11.6 | % | 48.5 | % | 48.4 | % | ||||||
Regulatory transaction fees less Section 31 fees | — | — | — | — | — | |||||||||||
Market data fees | 59.4 | 60.3 | (1.5 | )% | 30.2 | % | 34.1 | % | ||||||||
Port fees and other revenues less other cost of revenues | 41.9 | 31.0 | 35.2 | % | 21.3 | % | 17.5 | % | ||||||||
| | | | | | | | | | | | | | | | | |
Revenues less cost of revenues | $ | 196.8 | $ | 176.9 | 11.2 | % | 100.0 | % | 100.0 | % | ||||||
| | | | | | | | | | | | | | | | | |
| | | | | | | | | | | | | | | | | |
| | | | | | | | | | | | | | | | | |
Fluctuations in Revenues Less Cost of Revenues
Fluctuations in revenues less cost of revenues are driven by various factors. Volume variances are driven by changes in overall industry volume and our share of those volumes, while net capture variances are driven by pricing changes. The following summarizes the fluctuations in revenues less cost of revenues for the year ended December 31, 2012 to December 31, 2013 and attributes the fluctuations to various sources:
| | Total | Percentage of Total | |||||
|---|---|---|---|---|---|---|---|
| | (in millions) | | |||||
Market volume | $ | 0.8 | 4.0 | % | |||
Market share | (12.6 | ) | (63.3 | )% | |||
Net capture | 15.1 | 75.9 | % | ||||
Routing volume | (1.4 | ) | (7.0 | )% | |||
Other | 18.0 | 90.4 | % | ||||
| | | | | | | | |
Revenues less cost of revenues | $ | 19.9 | 100.0 | % | |||
| | | | | | | | |
| | | | | | | | |
| | | | | | | | |
Transaction Fees Less Liquidity Payments and Routing and Clearing Costs
Transaction fees less liquidity payments and routing and clearing costs increased $9.9 million, or 11.6%, to $95.5 million for the year ended December 31, 2013, representing 48.5% of revenues less cost of revenues, compared with $85.6 million for the prior-year period, or 48.4% of revenues less cost of revenues. The increase was primarily due to an increased net capture per matched notional value from 0.113 basis points during 2012 to 0.167 basis points in 2013 as a result of pricing changes made in the January 2013 in the European Equities segment that added $13.4 million to net revenue. In addition, net capture per one hundred touched shares in U.S. Equities increased 4.3% to $0.024 in 2013 from $0.023 in 2012, contributing $2.6 million to revenues less cost of revenues. However, U.S. Equities and European Equities market share dropped, from 11.9% in 2012 to 10.4% in 2013 for U.S. Equities and from 24.6% in 2012 to 23.1% in 2013 for European Equities, which offset transaction fee net revenue by $6.9 million. Lower market volumes in U.S. Equities also decreased net transaction revenue by $1.3 million, while higher market volumes in European Equities increased net transaction revenue by $1.9 million. In the U.S. Options segment, market share increased from 3.3% in 2012 to 3.7% in 2013, adding $1.2 million to net revenue, while net capture fell from $0.063 per touched contract in 2012 to $0.058 per touched contract in 2013, decreasing net transaction fees by $0.8 million.
Market Data Fees
Market data fees decreased $0.9 million, or 1.5%, to $59.4 million for the year ended December 31, 2013, representing 30.2% of revenues less cost of revenues, compared with $60.3 million for the prior-year period, or 34.1% of revenues less cost of revenues. For purposes of calculating these percentages, we have not attributed any incremental costs associated with providing trading and quoting information to the U.S. tape plans. This decrease was largely driven by the decrease in our U.S. Equities market share from 11.9% in 2012 to 10.4% in 2013. Offsetting the decline in market share was the introduction of proprietary market data fees in Europe and the U.S. in the fourth quarter 2012 and third quarter 2013, respectively.
Port Fees and Other Revenues Less Other Cost of Revenues
Port fees and other revenues less other cost of revenues increased $10.9 million, or 35.2%, to $41.9 million for the year ended December 31, 2013, representing 21.3% of revenues less cost of revenues, compared with $31.0 million for the prior-year period, or 17.5% of revenues less cost of revenues. This increase was due to the introduction of port fees on BYX in third quarter 2012 and the introduction of fees for all physical ports following the Chi-X Europe technology convergence to the BATS trading platform in European Equities in the second quarter of 2012, resulting in an increase of $3.6 million and $3.2 million, respectively. The remaining increase was driven by the introduction of secondary datacenter port fees on BZX in third quarter 2012.
Operating Expenses
Total operating expenses decreased $22.4 million, or 19.0%, to $95.2 million for the year ended December 31, 2013, compared with $117.6 million for the year ended December 31, 2012. The decrease was primarily due to the $12.4 million change in the fair value of the contingent consideration owed to the former Chi-X Europe stockholders recorded in 2012. The remaining decrease was primarily driven by a decrease in compensation due to severance and retention bonuses recorded in 2012 in connection with the Chi-X Europe acquisition in 2011 and a decrease in systems and data communication costs as the Chi-X Europe platform was migrated to BATS technology in the second quarter of 2012. The following summarizes changes in operating expenses for the year ended December 31, 2013, compared to the prior-year period:
| | Year Ended December 31, | | | ||||||||||
|---|---|---|---|---|---|---|---|---|---|---|---|---|---|
| | Increase/ (Decrease) | Percent Change | |||||||||||
| | 2013 | 2012 | |||||||||||
| | (in millions) | | |||||||||||
Compensation and benefits | $ | 41.5 | $ | 48.4 | $ | (6.9 | ) | (14.3 | )% | ||||
Depreciation and amortization | 15.2 | 17.0 | (1.8 | ) | (10.6 | )% | |||||||
Systems and data communication | 9.6 | 11.9 | (2.3 | ) | (19.3 | )% | |||||||
Occupancy | 1.9 | 2.3 | (0.4 | ) | (17.4 | )% | |||||||
Professional and contract services | 8.1 | 9.2 | (1.1 | ) | (12.0 | )% | |||||||
Regulatory costs | 5.4 | 5.7 | (0.3 | ) | (5.3 | )% | |||||||
Change in contingent consideration | — | 12.4 | (12.4 | ) | (100.0 | )% | |||||||
Impairment of assets | 3.5 | 0.2 | 3.3 | 1650.0 | % | ||||||||
General and administrative | 10.0 | 10.5 | (0.5 | ) | (4.8 | )% | |||||||
| | | | | | | | | | | | | | |
Total operating expenses | $ | 95.2 | $ | 117.6 | $ | (22.4 | ) | (19.0 | )% | ||||
| | | | | | | | | | | | | | |
| | | | | | | | | | | | | | |
| | | | | | | | | | | | | | |
Compensation and Benefits
Compensation and benefits decreased by $6.9 million to $41.5 million for the year ended December 31, 2013, representing 4.9% of total revenues, compared with $48.4 million for the prior-year
period, or 5.5% of total revenues. The decrease was driven by the $6.3 million of severance and retention bonuses recorded in 2012 in conjunction with the Chi-X Europe acquisition. Incremental stock-based compensation expense of approximately $1.5 million was recorded in 2012 due to the accelerated vesting of unvested stock options as our registration statement on Form S-1 was declared effective in the first quarter of 2012. Offsetting those decreases were increases in headcount in the U.S. and Europe and annual merit raises in October 2013.
Depreciation and amortization
Depreciation and amortization decreased $1.8 million, or 10.6%, to $15.2 million for the year ended December 31, 2013, compared with $17.0 million for the year ended December 31, 2012, primarily reflecting certain equipment and intangible assets becoming fully depreciated and amortized in 2012.
Systems and Data Communication
Systems and data communication costs decreased $2.3 million, or 19.3%, to $9.6 million for the year ended December 31, 2013, compared with $11.9 million for the year ended December 31, 2012. The increase was primarily due to the migration of the Chi-X Europe platform onto BATS technology in the second quarter of 2012. As a result of that migration, the European Equities segment reduced the number of datacenters from three to two and terminated the Chi-X Europe platform license fee. The remainder of the decrease resulted by our move from a New Jersey secondary datacenter to a Chicago secondary datacenter.
Occupancy
Occupancy expenses decreased $0.4 million, or 17.4%, to $1.9 million for the year ended December 31, 2013. The decrease was driven by incremental occupancy expense in Europe as the Chi-X Europe transition was completed in 2012 and a $0.3 million acceleration of rent expense for the former European office space in 2012.
Professional and Contract Services
Professional and contract services fees decreased $1.1 million, or 12.0%, to $8.1 million for the year ended December 31, 2013, compared with $9.2 million for the prior-year period. The decrease was primarily due to $4.4 million of failed IPO expenses in 2012. This decrease was offset by $4.4 million and $0.6 million of legal and consulting fees in connection with the acquisitions of Direct Edge and EuroCCP, respectively, in 2013.
Regulatory Costs
Regulatory costs decreased $0.3 million, or 5.3%, to $5.4 million for the year ended December 31, 2013, compared with $5.7 million for the year ended December 31, 2012. The decrease was primarily due to the resolution of the cases handled by our regulatory service provider in 2013.
Impairment of Assets
Impairment of assets increased $3.3 million for the year ended December 31, 2013 as we wrote off an intangible asset acquired with the Chi-X Europe acquisition. It was determined the asset would not be used going forward.
General and Administrative
General and administrative expenses decreased $0.5 million, or 4.8%, to $10.0 million for the year ended December 31, 2013, compared with $10.5 million for the prior-year period. This decrease was due primarily to failed IPO costs recorded in 2012.
Operating Income
As a result of the items above, operating income for the year ended December 31, 2013 was $101.6 million, or 51.6% of revenues less cost of revenues, compared to $59.3 million, or 33.5% of revenues less cost of revenues, for the year ended December 31, 2012, an increase of $42.3 million, or 71.3%.
Interest and Investment Expense
Interest and investment expense increased by $25.2 million to $25.8 million for the year ended December 31, 2013, compared with $0.6 million for the prior-year period. This increase was primarily due to interest expense on the 2012 Loan.
Other Expense
Other expenses decreasedincreased by $0.4$11.8 million to $0.2$12.0 million for the year ended December 31, 2013,2014, compared with $0.6$0.2 million for the prior-year period asprior year, primarily driven by the result$13.6 million loss on extinguishment of losses on disposaldebt recorded in connection with the debt issued in January 2014. This was offset by the equity earnings of equipment in 2012.the EuroCCP investment of $1.1 million.
Income beforeBefore Income Tax Provision
As a result of the above, income before income tax provision for the year ended December 31, 20132014 was $75.6$80.3 million compared to $58.1$75.6 million in the year ended December 31, 2012,2013, an increase of $17.5$4.7 million.
Income Tax Provision
For the year ended December 31, 2013,2014, the income tax provision was $28.8$31.1 million compared with $26.5$28.8 million for the year ended December 31, 2012.2013. Our income tax provision increased due to increased incomeearnings before income tax offset by a reduction of tax reserves due to the recognition of New York and New York City reserves for all open years in 2012.tax. The effective tax rate for the year ended December 31, 20132014 was 38.1%38.7%, compared to 45.6%38.1% for the year ended December 31, 2012.2013. The increase was due to a discrete benefit recognized in 2013 associated with the release of income tax reserves.
Net Income
As a result of the items above, net income for the year ended December 31, 20132014 was $46.8$49.2 million, or 23.8%16.0% of revenues less cost of revenues, compared to $31.6$46.8 million, or 17.9%23.8% of revenues less cost of revenues, in the year ended December 31, 2012,2013, an increase of $15.2$2.4 million.
Segment Operating Results
The following summarizes our total revenues by segment:
| | Year Ended December 31, | | Percentage of Total Revenues | Year Ended December 31, | | Percentage of Total Revenues | ||||||||||||||||||||||||||
|---|---|---|---|---|---|---|---|---|---|---|---|---|---|---|---|---|---|---|---|---|---|---|---|---|---|---|---|---|---|---|---|---|
| | Percent Change | Percent Change | ||||||||||||||||||||||||||||||
| | 2013 | 2012 | 2013 | 2012 | 2014 | 2013 | 2014 | 2013 | ||||||||||||||||||||||||
| | (in millions) | | | | (in millions) | | | | ||||||||||||||||||||||||
U.S. Equities | $ | 662.8 | $ | 723.2 | (8.4 | )% | 78.8 | % | 81.8 | % | $ | 1,234.5 | $ | 662.8 | 86.3 | % | 84.7 | % | 78.8 | % | ||||||||||||
European Equities | 86.4 | 82.8 | 4.3 | % | 10.3 | % | 9.3 | % | 99.1 | 86.4 | 14.7 | % | 6.8 | % | 10.3 | % | ||||||||||||||||
U.S. Options | 92.3 | 78.7 | 17.3 | % | 10.9 | % | 8.9 | % | 124.6 | 92.3 | 35.0 | % | 8.5 | % | 10.9 | % | ||||||||||||||||
| | | | | | | | | | | | | | | | | | | | | | | | | | | | | | | | ||
Total revenues | $ | 841.5 | $ | 884.7 | (4.9 | )% | 100.0 | % | 100.0 | % | $ | 1,458.2 | $ | 841.5 | 73.3 | % | 100.0 | % | 100.0 | % | ||||||||||||
| | | | | | | | | | | | | | | | | | | | | | | | | | | | | | | | | |
| | | | | | | | | | | | | | | | | | | | | | | | | | | | | | | | ||
The following summarizes our revenues less cost of revenues by segment:
| | | | | Percentage of Revenues Less Cost of Revenues | ||||||||||||||||||||||||||||
|---|---|---|---|---|---|---|---|---|---|---|---|---|---|---|---|---|---|---|---|---|---|---|---|---|---|---|---|---|---|---|---|---|
| | Year Ended December 31, | | Year Ended December 31, | | Percentage of Revenues Less Cost of Revenues | |||||||||||||||||||||||||||
| | Percent Change | Percentage of Revenues Less Cost of Revenues | Percent Change | |||||||||||||||||||||||||||||
| | 2013 | 2012 | 2013 | 2012 | 2014 | 2013 | 2014 | 2013 | ||||||||||||||||||||||||
| | (in millions) | | | | (in millions) | | | | ||||||||||||||||||||||||
U.S. Equities | $ | 123.9 | $ | 127.1 | (2.5 | )% | 62.9 | % | 71.8 | % | $ | 224.3 | $ | 123.9 | 81.0 | % | 72.9 | % | 62.9 | % | ||||||||||||
European Equities | 57.6 | 35.7 | 61.3 | % | 29.3 | % | 20.2 | % | 66.4 | 57.6 | 15.3 | % | 21.6 | % | 29.3 | % | ||||||||||||||||
U.S. Options | 15.3 | 14.1 | 8.5 | % | 7.8 | % | 8.0 | % | 16.8 | 15.3 | 9.8 | % | 5.5 | % | 7.8 | % | ||||||||||||||||
| | | | | | | | | | | | | | | | | | | | | | | | | | | | | | | | ||
Revenues less cost of revenues | $ | 196.8 | $ | 176.9 | 11.2 | % | 100.0 | % | 100.0 | % | $ | 307.5 | $ | 196.8 | 56.3 | % | 100.0 | % | 100.0 | % | ||||||||||||
| | | | | | | | | | | | | | | | | | | | | | | | | | | | | | | | | |
| | | | | | | | | | | | | | | | | | | | | | | | | | | | | | | | ||
U.S. Equities
The following summarizes revenues, cost of revenues, operating expenses and operating income for our U.S. Equities segment:
| | Year Ended December 31, | | Percentage of Total Revenues | Year Ended December 31, | | Percentage of Total Revenues | ||||||||||||||||||||||||||
|---|---|---|---|---|---|---|---|---|---|---|---|---|---|---|---|---|---|---|---|---|---|---|---|---|---|---|---|---|---|---|---|---|
| | Percent Change | Percent Change | ||||||||||||||||||||||||||||||
| | 2013 | 2012 | 2013 | 2012 | 2014 | 2013 | 2014 | 2013 | ||||||||||||||||||||||||
| | (in millions, except percentages and as noted below) | | | | (in millions, except percentages and as noted below) | | | | ||||||||||||||||||||||||
Revenues: | ||||||||||||||||||||||||||||||||
Transaction fees | $ | 458.3 | $ | 500.1 | (8.4 | )% | 54.5 | % | 56.5 | % | $ | 816.2 | $ | 458.3 | 78.1 | % | 56.0 | % | 54.5 | % | ||||||||||||
Regulatory transaction fees | 124.7 | 145.1 | (14.1 | )% | 14.8 | % | 16.4 | % | 268.7 | 124.7 | 115.5 | % | 18.5 | % | 14.8 | % | ||||||||||||||||
Market data fees | 48.5 | 53.3 | (9.0 | )% | 5.8 | % | 6.0 | % | 97.6 | 48.5 | 101.2 | % | 6.7 | % | 5.8 | % | ||||||||||||||||
Port fees and other | 31.3 | 24.7 | 26.7 | % | 3.7 | % | 2.9 | % | 52.0 | 31.3 | 66.1 | % | 3.5 | % | 3.7 | % | ||||||||||||||||
| | | | | | | | | | | | | | | | | | | | | | | | | | | | | | | | ||
Total revenues | 662.8 | 723.2 | (8.4 | )% | 78.8 | % | 81.8 | % | 1,234.5 | 662.8 | 86.3 | % | 84.7 | % | 78.8 | % | ||||||||||||||||
Cost of revenues: | ||||||||||||||||||||||||||||||||
Liquidity payments | 372.8 | 401.4 | (7.1 | )% | 44.3 | % | 45.3 | % | 695.8 | 372.8 | 86.6 | % | 47.7 | % | 44.3 | % | ||||||||||||||||
Section 31 fees | 124.7 | 145.1 | (14.1 | )% | 14.8 | % | 16.4 | % | 268.7 | 124.7 | 115.5 | % | 18.5 | % | 14.8 | % | ||||||||||||||||
Routing and clearing payments | 41.4 | 49.6 | (16.5 | )% | 4.9 | % | 5.7 | % | ||||||||||||||||||||||||
Routing and clearing | 45.7 | 41.4 | 10.4 | % | 3.1 | % | 4.9 | % | ||||||||||||||||||||||||
| | | | | | | | | | | | | | | | | | | | | | | | | | | | | | | | ||
Total cost of revenues | 538.9 | 596.1 | (9.6 | )% | 64.0 | % | 67.4 | % | 1,010.2 | 538.9 | 87.5 | % | 69.3 | % | 64.0 | % | ||||||||||||||||
| | | | | | | | | | | | | | | | | | | | | | | | | | | | | | | | ||
Revenues less cost of revenues | 123.9 | 127.1 | (2.5 | )% | 14.8 | % | 14.4 | % | 224.3 | 123.9 | 81.0 | % | 15.4 | % | 14.8 | % | ||||||||||||||||
Operating expenses | 46.6 | 44.0 | 5.9 | % | 5.5 | % | 5.0 | % | 141.3 | 46.6 | 203.2 | % | 9.7 | % | 5.5 | % | ||||||||||||||||
| | | | | | | | | | | | | | | | | | | | | | | | | | | | | | | | ||
Operating income | $ | 77.3 | $ | 83.1 | (7.0 | )% | 9.3 | % | 9.4 | % | $ | 83.0 | $ | 77.3 | 7.4 | % | 5.7 | % | 9.3 | % | ||||||||||||
| | | | | | | | | | | | | | | | | | | | | | | | | | | | | | | | | |
| | | | | | | | | | | | | | | | | | | | | | | | | | | | | | | | ||
EBITDA(1) | $ | 81.7 | $ | 87.5 | (6.6 | )% | 9.7 | % | 9.9 | % | $ | 103.4 | $ | 81.7 | 26.6 | % | 7.1 | % | 9.7 | % | ||||||||||||
EBITDA margin(2) | 65.9 | % | 68.8 | % | * | * | * | 46.1 | % | 65.9 | % | * | * | * | ||||||||||||||||||
Normalized EBITDA(1) | 85.0 | 90.1 | (5.7 | )% | 10.1 | % | 10.2 | % | $ | 121.9 | $ | 84.9 | 43.6 | % | 8.4 | % | 10.1 | % | ||||||||||||||
Normalized EBITDA margin(2) | 68.6 | % | 70.9 | % | * | * | * | 54.3 | % | 68.6 | % | * | ||||||||||||||||||||
ADV (in billions): | ||||||||||||||||||||||||||||||||
Matched shares | 1.2 | 0.6 | 100.0 | % | * | * | ||||||||||||||||||||||||||
Routed shares | 0.1 | 0.1 | — | * | * | |||||||||||||||||||||||||||
| | | | | | | | | | | | | | | | | |||||||||||||||||
Total touched shares | 1.3 | 0.7 | 85.7 | % | * | * | ||||||||||||||||||||||||||
| | | | | | | | | | | | | | | | | |||||||||||||||||
| | | | | | | | | | | | | |||||||||||||||||||||
| | | | | | | | | | | | | | | | | |||||||||||||||||
Market ADV | 6,187.0 | 6,437.2 | (3.9 | )% | * | * | 6.4 | 6.2 | 3.2 | % | * | * | ||||||||||||||||||||
ETPs (in millions of shares) | 264.2 | 244.5 | 8.1 | % | * | * | ||||||||||||||||||||||||||
ETPs: launches (number of launches) | 6 | 17 | (64.7 | )% | * | * | ||||||||||||||||||||||||||
ETPs: listings (number of listings) | 23 | 17 | 35.3 | % | ||||||||||||||||||||||||||||
Trading days | 252 | 252 | — | * | * | |||||||||||||||||||||||||||
Bats ETPs (in billions of shares) | 0.3 | 0.3 | — | * | * | |||||||||||||||||||||||||||
Bats ETPs: launches (number of launches) | 5 | 6 | (16.7 | )% | * | * | ||||||||||||||||||||||||||
Bats ETPs: listings (number of listings) | 28 | 23 | 21.7 | % | * | * | ||||||||||||||||||||||||||
Market share | 10.4 | % | 8.9 | % | * | * | * | 19.4 | % | 10.4 | % | * | * | * | ||||||||||||||||||
Net capture per one hundred touched shares | $ | 0.024 | $ | 0.023 | 4.3 | % | * | * | $ | 0.022 | $ | 0.024 | (8.3 | )% | * | * | ||||||||||||||||
believe that they are frequently used by analysts, investors and other interested parties in the evaluation of companies. In addition, we use Normalized EBITDA as a measure of operating performance for preparation of our forecasts, evaluating our leverage ratio for the debt to earnings covenant included in our outstanding credit facility and calculating employee and executive bonuses. Other companies may calculate EBITDA and Normalized EBITDA differently than we do. EBITDA and Normalized EBITDA have limitations as analytical tools, and you should not consider them in isolation or as substitutes for analysis of our results as reported under U.S. GAAP.
The following is a reconciliation of net income to EBITDA and Normalized EBITDA:
| | Year Ended December 31, | Year Ended December 31, | ||||||||||||||||||||||||||||||||||||||||||||||||||||||||||||
|---|---|---|---|---|---|---|---|---|---|---|---|---|---|---|---|---|---|---|---|---|---|---|---|---|---|---|---|---|---|---|---|---|---|---|---|---|---|---|---|---|---|---|---|---|---|---|---|---|---|---|---|---|---|---|---|---|---|---|---|---|---|---|
| | 2013 | 2012 | 2014 | 2013 | ||||||||||||||||||||||||||||||||||||||||||||||||||||||||||
| | U.S. Equities | European Equities | U.S. Options | Corporate items and eliminations | Total | U.S. Equities | European Equities | U.S. Options | Corporate items and eliminations | Total | U.S. Equities | European Equities | U.S. Options | Corporate items and eliminations | Total | U.S. Equities | European Equities | U.S. Options | Corporate items and eliminations | Total | ||||||||||||||||||||||||||||||||||||||||||
| | (in millions) | (in millions) | ||||||||||||||||||||||||||||||||||||||||||||||||||||||||||||
Net income (loss) | $ | 45.1 | $ | 11.9 | $ | 8.4 | $ | (18.6 | ) | $ | 46.8 | $ | 44.2 | $ | (16.9 | ) | $ | 7.7 | $ | (3.4 | ) | $ | 31.6 | $ | 40.2 | $ | 37.7 | $ | 8.3 | $ | (37.0 | ) | $ | 49.2 | $ | 45.1 | $ | 11.9 | $ | 8.4 | $ | (18.6 | ) | $ | 46.8 | |||||||||||||||||
Interest | — | (0.1 | ) | — | 25.9 | 25.8 | (0.2 | ) | (0.1 | ) | — | 0.9 | 0.6 | — | (0.1 | ) | — | 27.4 | 27.3 | — | (0.1 | ) | — | 25.9 | 25.8 | |||||||||||||||||||||||||||||||||||||
Income tax provision (benefit) | 32.2 | 5.4 | — | (8.8 | ) | 28.8 | 39.1 | (8.8 | ) | — | (3.8 | ) | 26.5 | 43.3 | (6.1 | ) | — | (6.1 | ) | 31.1 | 32.2 | 5.4 | — | (8.8 | ) | 28.8 | ||||||||||||||||||||||||||||||||||||
Depreciation and amortization | 4.4 | 9.9 | 0.9 | — | 15.2 | 4.4 | 11.5 | 1.1 | — | 17.0 | 19.9 | 7.6 | 0.9 | — | 28.4 | 4.4 | 9.9 | 0.9 | — | 15.2 | ||||||||||||||||||||||||||||||||||||||||||
| | | | | | | | | | | | | | | | | | | | | | | | | | | | | | | | | | | | | | | | | | | | | | | | | | | | | | | | | | | | | | | |
EBITDA | 81.7 | 27.1 | 9.3 | (1.5 | ) | 116.6 | 87.5 | (14.3 | ) | 8.8 | (6.3 | ) | 75.7 | 103.4 | 39.1 | 9.2 | (15.7 | ) | 136.0 | 81.7 | 27.1 | 9.3 | (1.5 | ) | 116.6 | |||||||||||||||||||||||||||||||||||||
Acquisition-related costs | 4.4 | 0.8 | — | — | 5.2 | — | 19.3 | — | — | 19.3 | 18.5 | — | — | — | 18.5 | 4.4 | 0.8 | — | — | 5.2 | ||||||||||||||||||||||||||||||||||||||||||
IPO costs | 0.6 | — | — | — | 0.6 | 2.6 | 0.5 | — | 3.2 | 6.3 | — | — | — | — | — | 0.6 | — | — | — | 0.6 | ||||||||||||||||||||||||||||||||||||||||||
Other one-time items | (1.7 | ) | 3.4 | — | — | 1.7 | — | — | — | — | — | |||||||||||||||||||||||||||||||||||||||||||||||||||
Loss on extinguishment of debt | — | — | — | 13.6 | 13.6 | — | — | — | — | — | ||||||||||||||||||||||||||||||||||||||||||||||||||||
Impairment of intangible assets | — | — | — | — | — | — | 3.5 | — | — | 3.5 | ||||||||||||||||||||||||||||||||||||||||||||||||||||
Regulatory assessment | — | — | — | — | — | (1.8 | ) | — | — | — | (1.8 | ) | ||||||||||||||||||||||||||||||||||||||||||||||||||
| | | | | | | | | | | | | | | | | | | | | | | | | | | | | | | | | | | | | | | | | | | | | | | | | | | | | | | | | | | | | | | |
Normalized EBITDA | $ | 85.0 | $ | 31.3 | $ | 9.3 | $ | (1.5 | ) | $ | 124.1 | $ | 90.1 | $ | 5.5 | $ | 8.8 | $ | (3.1 | ) | $ | 101.3 | $ | 121.9 | $ | 39.1 | $ | 9.2 | $ | (2.1 | ) | $ | 168.1 | $ | 84.9 | $ | 31.4 | $ | 9.3 | $ | (1.5 | ) | $ | 124.1 | ||||||||||||||||||
| | | | | | | | | | | | | | | | | | | | | | | | | | | | | | | | | | | | | | | | | | | | | | | | | | | | | | | | | | | | | | | | |
| | | | | | | | | | | | | | | | | | | | | | | | | | | | | | | | | | | | | | | | | | | | | | | | | | | | | | | | | | | | | | | |
For the year ended December 31, 2013,2014, U.S. Equities operating income decreased $5.8increased $5.7 million to $77.3$83.0 million. Revenues less cost of revenues decreased $3.2 million in 2013 as market share decreased from 11.9% in 2012 to 10.4% in 2013 and volumes decreased 3.9%. Operating expenses increased $2.6 millionThis was driven by professional fees recorded in 2013 for the Direct Edge Acquisition.
European Equities
The following table showssummarizes revenues, cost of revenues, operating expenses and operating income (loss) for our European Equities segment:
| | | | | Percentage of Total Revenues | ||||||||||||||||||||||||||||
|---|---|---|---|---|---|---|---|---|---|---|---|---|---|---|---|---|---|---|---|---|---|---|---|---|---|---|---|---|---|---|---|---|
| | Year Ended December 31, | | Year Ended December 31, | | Percentage of Total Revenues | |||||||||||||||||||||||||||
| | Percent Change | Percentage of Total Revenues | Percent Change | |||||||||||||||||||||||||||||
| | 2013 | 2012 | 2013 | 2012 | 2014 | 2013 | 2014 | 2013 | ||||||||||||||||||||||||
| | (in millions except percentages and exchange rates) | | | | (in millions) | | | | ||||||||||||||||||||||||
Revenues | $ | 86.4 | $ | 82.8 | 4.3 | % | 10.3 | % | 9.3 | % | $ | 99.1 | $ | 86.4 | 14.7 | % | 6.8 | % | 10.3 | % | ||||||||||||
Cost of revenues | 28.8 | 47.1 | (38.9 | )% | 3.4 | % | 5.3 | % | 32.7 | 28.8 | 13.5 | % | 2.2 | % | 3.4 | % | ||||||||||||||||
| | | | | | | | | | | | | | | | | | | | | | | | | | | | | | | | ||
Revenues less cost of revenues | 57.6 | 35.7 | 61.3 | % | 6.9 | % | 4.0 | % | 66.4 | 57.6 | 15.3 | % | 4.6 | % | 6.9 | % | ||||||||||||||||
Operating expenses | 40.2 | 60.9 | (34.0 | )% | 4.7 | % | 6.9 | % | 36.0 | 40.2 | (10.4 | )% | 2.5 | % | 4.8 | % | ||||||||||||||||
| | | | | | | | | | | | | | | | | | | | | | | | | | | | | | | | ||
Operating income (loss) | $ | 17.4 | $ | (25.2 | ) | 169.0 | % | 2.2 | % | (2.9 | )% | |||||||||||||||||||||
Operating income | $ | 30.4 | $ | 17.4 | 74.7 | % | 2.1 | % | 2.1 | % | ||||||||||||||||||||||
| | | | | | | | | | | | | | | | | | | | | | | | | | | | | | | | | |
| | | | | | | | | | | | | | | | | | | | | | | | | | | | | | | | ||
EBITDA(1) | $ | 27.1 | $ | (14.3 | ) | 289.5 | % | 3.2 | % | (1.6 | )% | $ | 39.1 | $ | 27.1 | 44.3 | % | 2.7 | % | 3.2 | % | |||||||||||
EBITDA margin(2) | 47.0 | % | (40.1 | )% | * | * | 58.9 | % | 47.0 | % | * | * | * | |||||||||||||||||||
Normalized EBITDA(1) | $ | 31.3 | $ | 5.5 | 469.1 | % | 3.7 | % | 0.6 | % | $ | 39.1 | $ | 31.4 | 24.5 | % | 2.7 | % | 3.7 | % | ||||||||||||
Normalized EBITDA margin(2) | 54.3 | % | 15.4 | % | * | * | * | 58.9 | % | 54.3 | % | * | * | * | ||||||||||||||||||
ADNV (in billions): | ||||||||||||||||||||||||||||||||
Matched and touched | € | 8.6 | € | 7.5 | 14.7 | % | * | * | ||||||||||||||||||||||||
Market ADNV | € | 32,613.6 | € | 30,857.6 | 5.7 | % | * | * | € | 39.7 | € | 32.6 | 21.8 | % | * | * | ||||||||||||||||
Trading days | 256 | 256 | — | * | * | |||||||||||||||||||||||||||
Average Euro/British pound exchange rate | £0.8062 | £0.8489 | (5.0 | )% | * | * | ||||||||||||||||||||||||||
Market share | 23.1 | % | 24.6 | % | * | * | * | 21.6 | % | 23.1 | % | * | * | * | ||||||||||||||||||
Net capture per matched notional value (in basis points) | 0.167 | 0.113 | 47.8 | % | * | * | 0.162 | 0.167 | (3.0 | )% | * | * | ||||||||||||||||||||
Average British pound/U.S. dollar exchange rate | $ | 1.5643 | $ | 1.5847 | (1.3 | )% | * | * | $ | 1.6476 | $ | 1.5643 | 5.3 | % | * | * | ||||||||||||||||
To illustrate the growth without the effect of the exchange rates in our European Equities segment the following table showssummarizes revenues, cost of revenues, operating expenses and operating lossincome for our European Equities segment in British pounds:
| | Year Ended December 31, | | Year Ended December 31, | | ||||||||||||||||
|---|---|---|---|---|---|---|---|---|---|---|---|---|---|---|---|---|---|---|---|---|
| | Percentage Increase/ (Decrease) | Percent Change | ||||||||||||||||||
| | 2013 | 2012 | 2014 | 2013 | ||||||||||||||||
| | (in millions) | | (in millions) | | ||||||||||||||||
Transaction fees | £48.6 | £45.7 | 6.3 | % | ||||||||||||||||
Market data | 5.2 | 4.6 | 13.0 | % | ||||||||||||||||
Other | 6.4 | 4.9 | 30.6 | % | ||||||||||||||||
| | | | | | | | | | | |||||||||||
Revenues | £ | 55.2 | £ | 52.3 | 5.5 | % | 60.2 | 55.2 | 9.1 | % | ||||||||||
Liquidity payments | 19.8 | 18.4 | 7.6 | % | ||||||||||||||||
Routing and clearing | 0.1 | — | * | |||||||||||||||||
| | | | | | | | | | | |||||||||||
Cost of revenues | 18.4 | 29.7 | (38.0 | )% | 19.9 | 18.4 | 8.2 | % | ||||||||||||
| | | | | | | | | | | | | | | | | | | | ||
Revenues less cost of revenues | 36.8 | 22.6 | 62.8 | % | 40.3 | 36.8 | 9.5 | % | ||||||||||||
Operating expenses | 25.5 | 38.4 | (33.6 | )% | 21.8 | 25.5 | (14.5 | )% | ||||||||||||
| | | | | | | | | | | | | | | | | | | | ||
Operating income | £ | 11.3 | £ | (15.8 | ) | 171.5 | % | £ | 18.5 | £ | 11.3 | 63.7 | % | |||||||
| | | | | | | | | | | | | | | | | | | | | |
| | | | | | | | | | | | | | | | | | | | ||
EBITDA(1) | £ | 17.4 | £ | (8.9 | ) | 295.5 | % | £ | 23.8 | £ | 17.4 | 36.8 | % | |||||||
Normalized EBITDA(1) | £ | 20.2 | £ | 4.2 | 381.0 | % | £ | 23.8 | £ | 20.2 | 17.8 | % | ||||||||
| | Year Ended December 31, | | Year Ended December 31, | | ||||||||||||||||
|---|---|---|---|---|---|---|---|---|---|---|---|---|---|---|---|---|---|---|---|---|
| | Percent Change | Percent Change | ||||||||||||||||||
| | 2013 | 2012 | 2014 | 2013 | ||||||||||||||||
Net income (loss) | £ | 11.1 | £ | (16.1 | ) | 168.9 | % | |||||||||||||
| | (in millions) | | ||||||||||||||||||
Net income | £ | 19.2 | £ | 11.1 | 73.0 | % | ||||||||||||||
Interest | — | 0.1 | * | — | — | * | ||||||||||||||
Income tax provision (benefit) | — | — | * | — | — | * | ||||||||||||||
Depreciation and amortization | 6.3 | 7.1 | (11.3 | )% | 4.6 | 6.3 | (27.0 | )% | ||||||||||||
| | | | | | | | | | | | | | | | | | | | ||
EBITDA | 17.4 | (8.9 | ) | 295.5 | % | 23.8 | 17.4 | 36.8 | % | |||||||||||
Acquisition-related costs | 0.5 | 12.8 | (96.1 | )% | — | 0.5 | (100.0 | )% | ||||||||||||
IPO costs | — | 0.3 | (100.0 | )% | — | — | * | |||||||||||||
Loss on extinguishment of debt | — | — | — | — | �� | * | ||||||||||||||
Other one-time items | 2.3 | — | * | |||||||||||||||||
Impairment of intangible assets | — | 2.3 | (100.0 | )% | ||||||||||||||||
Regulatory assessment | — | — | * | |||||||||||||||||
| | | | | | | | | | | | | | | | | | | | ||
Normalized EBITDA | £ | 20.2 | £ | 4.2 | 381.0 | % | £ | 23.8 | £ | 20.2 | 17.8 | % | ||||||||
| | | | | | | | | | | | | | | | | | | | | |
| | | | | | | | | | | | | | | | | | | | ||
For the year ended December 31, 2013, the2014, European Equities segment's operating income increased $42.6$13.0 million to $17.4$30.4 million. This increase was driven by a 21.8% increase in market ADNV, pricing changes to port fees and increased market data revenue. Also included in the first quarterincrease was the $1.1 million of 2013 andequity in earnings from the addition of proprietary market data fees and port fees. Operating expenses also decreased, driven by the $12.4 million changeEuroCCP investment added in fair value of the contingent consideration owed to the former Chi-X Europe stockholders recorded in 2012.2014.
U.S. Options
The following summarizes revenues, cost of revenues, operating expenses and operating income for our U.S. Options segment:
| | | | | Percentage of Total Revenues | ||||||||||||||||||||||||||||
|---|---|---|---|---|---|---|---|---|---|---|---|---|---|---|---|---|---|---|---|---|---|---|---|---|---|---|---|---|---|---|---|---|
| | Year Ended December 31, | | Year Ended December 31, | | Percentage of Total Revenues | |||||||||||||||||||||||||||
| | Percent Change | Percentage of Total Revenues | Percent Change | |||||||||||||||||||||||||||||
| | 2013 | 2012 | 2013 | 2012 | 2014 | 2013 | 2014 | 2013 | ||||||||||||||||||||||||
| | (in millions except percentages and as noted below) | | | | (in millions, except for trading days and as noted below) | | | | ||||||||||||||||||||||||
Revenues: | ||||||||||||||||||||||||||||||||
Transaction fees | $ | 83.0 | $ | 69.8 | 18.9 | % | 9.8 | % | 7.9 | % | $ | 113.8 | $ | 83.0 | 37.1 | % | 7.8 | % | 9.8 | % | ||||||||||||
Regulatory transaction fees | 2.7 | 3.0 | (10.0 | )% | 0.3 | % | 0.3 | % | 3.3 | 2.7 | 22.2 | % | 0.2 | % | 0.3 | % | ||||||||||||||||
Market data fees | 3.7 | 4.0 | (7.5 | )% | 0.4 | % | 0.5 | % | 4.0 | 3.7 | 8.1 | % | 0.3 | % | 0.4 | % | ||||||||||||||||
Port fees and other | 2.9 | 1.9 | 52.6 | % | 0.4 | % | 0.2 | % | 3.5 | 2.9 | 20.7 | % | 0.2 | % | 0.4 | % | ||||||||||||||||
| | | | | | | | | | | | | | | | | | | | | | | | | | | | | | | | ||
Total revenues | 92.3 | 78.7 | 17.3 | % | 10.9 | % | 8.9 | % | 124.6 | 92.3 | 35.0 | % | 8.5 | % | 10.9 | % | ||||||||||||||||
Cost of revenues: | ||||||||||||||||||||||||||||||||
Liquidity payments | 73.1 | 60.0 | 21.8 | % | 8.7 | % | 6.8 | % | 103.0 | 73.1 | 40.9 | % | 7.1 | % | 8.7 | % | ||||||||||||||||
Section 31 fees | 2.7 | 3.0 | (10.0 | )% | 0.3 | % | 0.3 | % | 3.3 | 2.7 | 22.2 | % | 0.2 | % | 0.3 | % | ||||||||||||||||
Routing and clearing payments | 1.2 | 1.6 | (25.0 | )% | 0.2 | % | 0.2 | % | ||||||||||||||||||||||||
Routing and clearing | 1.5 | 1.2 | 25.0 | % | 0.1 | % | 0.2 | % | ||||||||||||||||||||||||
| | | | | | | | | | | | | | | | | | | | | | | | | | | | | | | | ||
Total cost of revenues | 77.0 | 64.6 | 19.2 | % | 9.2 | % | 7.3 | % | 107.8 | 77.0 | 40.0 | % | 7.4 | % | 9.2 | % | ||||||||||||||||
| | | | | | | | | | | | | | | | | | | | | | | | | | | | | | | | ||
Revenues less cost of revenues | 15.3 | 14.1 | 8.5 | % | 1.7 | % | 1.6 | % | 16.8 | 15.3 | 9.8 | % | 1.1 | % | 1.7 | % | ||||||||||||||||
Operating expenses | 6.9 | 6.4 | 7.8 | % | 0.8 | % | 0.7 | % | 8.5 | 6.9 | 23.2 | % | 0.6 | % | 0.8 | % | ||||||||||||||||
| | | | | | | | | | | | | | | | | | | | | | | | | | | | | | | | ||
Operating income | $ | 8.4 | $ | 7.7 | 9.1 | % | 0.9 | % | 0.9 | % | $ | 8.3 | $ | 8.4 | (1.2 | )% | 0.5 | % | 0.9 | % | ||||||||||||
| | | | | | | | | | | | | | | | | | | | | | | | | | | | | | | | | |
| | | | | | | | | | | | | | | | | | | | | | | | | | | | | | | | ||
EBITDA(1) | $ | 9.3 | $ | 8.8 | 5.7 | % | 1.1 | % | 1.0 | % | $ | 9.2 | $ | 9.3 | (1.1 | )% | 0.6 | % | 1.1 | % | ||||||||||||
EBITDA margin(2) | 60.8 | % | 62.4 | % | * | * | * | 54.8 | % | 60.8 | % | * | * | * | ||||||||||||||||||
Normalized EBITDA(1) | 9.3 | 8.8 | 5.7 | % | 1.1 | % | 1.0 | % | $ | 9.2 | $ | 9.3 | (1.1 | )% | 0.6 | % | 1.1 | % | ||||||||||||||
Normalized EBITDA margin(2) | 60.8 | % | 62.4 | % | * | * | * | 54.8 | % | 60.8 | % | * | * | * | ||||||||||||||||||
Market ADV (in thousands of contracts) | 15,934.2 | 15,651.6 | 1.8 | % | * | * | ||||||||||||||||||||||||||
ADV (in millions): | ||||||||||||||||||||||||||||||||
Matched contracts | 0.8 | 0.6 | 33.3 | % | * | * | ||||||||||||||||||||||||||
Routed contracts | — | — | * | * | * | |||||||||||||||||||||||||||
| | | | | | | | | | | | | | | | | |||||||||||||||||
Total touched contracts | 0.8 | 0.6 | 33.3 | % | * | * | ||||||||||||||||||||||||||
| | | | | | | | | | | | | | | | | |||||||||||||||||
| | | | | | | | | | | | | |||||||||||||||||||||
| | | | | | | | | | | | | | | | | |||||||||||||||||
Market ADV | 16.6 | 15.9 | 4.4 | % | * | * | ||||||||||||||||||||||||||
Trading days | 252 | 252 | — | * | * | |||||||||||||||||||||||||||
Market share | 3.7 | % | 3.3 | % | * | * | * | 4.8 | % | 3.7 | % | * | * | * | ||||||||||||||||||
Net capture per touched contract | $ | 0.058 | $ | 0.063 | (7.9 | )% | * | * | $ | 0.046 | $ | 0.058 | (20.7 | )% | * | * | ||||||||||||||||
For the year ended December 31, 2014, U.S. Options operating income was flat, decreasing $0.1 million to $8.3 million. Net revenue increased $1.5 million, primarily driven by increased market share, from 3.7% in 2013 to 4.8% in 2014. However, operating expenses increased $1.6 million, driven by increases in regulatory fees based on a new RSA and an increase in compensation expenses.
Quarterly Results of Operations
The following table sets forth our quarterly unaudited consolidated statement of income data for each of the eight quarters in the period ended September 30,December 31, 2015. In management's opinion, the data has been prepared on the same basis as the audited consolidated financial statements included elsewhere in this prospectus and reflects all necessary adjustments for a fair presentation of this data. The results of historical periods are not necessarily indicative of the results of operations for a full year or any future period.
| | For the Quarter Ended | For the Quarter Ended | ||||||||||||||||||||||||||||||||||||||||||||||||
|---|---|---|---|---|---|---|---|---|---|---|---|---|---|---|---|---|---|---|---|---|---|---|---|---|---|---|---|---|---|---|---|---|---|---|---|---|---|---|---|---|---|---|---|---|---|---|---|---|---|---|
| | September 30, | June 30, | March 31, | December 31, | September 30, | June 30, | March 31, | December 31, | December 31, | September 30, | June 30, | March 31, | December 31, | September 30, | June 30, | March 31, | ||||||||||||||||||||||||||||||||||
| | 2015 | 2014 | 2013 | 2015 | 2014 | |||||||||||||||||||||||||||||||||||||||||||||
| | (in millions, except per share data and as noted below) | (in millions, except trading days, per share data and as noted below) | ||||||||||||||||||||||||||||||||||||||||||||||||
Statement of Income Data: | ||||||||||||||||||||||||||||||||||||||||||||||||||
Total revenues | $ | 492.0 | $ | 418.2 | $ | 425.0 | $ | 433.8 | $ | 347.5 | $ | 356.2 | $ | 320.7 | $ | 197.1 | $ | 443.5 | $ | 492.0 | $ | 418.2 | $ | 425.0 | $ | 433.8 | $ | 347.5 | $ | 356.2 | $ | 320.7 | ||||||||||||||||||
Total cost of revenues | 388.0 | 319.2 | 342.2 | 350.1 | 270.3 | 278.9 | 251.4 | 150.8 | 344.9 | 388.0 | 319.2 | 342.2 | 350.1 | 270.3 | 278.9 | 251.4 | ||||||||||||||||||||||||||||||||||
| | | | | | | | | | | | | | | | | | | | | | | | | | | | | | | | | | | | | | | | | | | | | | | | | | | |
Revenues less cost of revenues | 104.0 | 99.0 | 82.8 | 83.7 | 77.2 | 77.3 | 69.3 | 46.3 | 98.6 | 104.0 | 99.0 | 82.8 | 83.7 | 77.2 | 77.3 | 69.3 | ||||||||||||||||||||||||||||||||||
Total operating expenses | 49.1 | 50.4 | 51.3 | 48.4 | 48.8 | 50.0 | 40.7 | 26.2 | 51.3 | 49.1 | 50.4 | 51.3 | 48.4 | 48.8 | 50.0 | 40.7 | ||||||||||||||||||||||||||||||||||
| | | | | | | | | | | | | | | | | | | | | | | | | | | | | | | | | | | | | | | | | | | | | | | | | | | |
Operating income | 54.9 | 48.6 | 31.5 | 35.3 | 28.4 | 27.3 | 28.6 | 20.1 | 47.3 | 54.9 | 48.6 | 31.5 | 35.3 | 28.4 | 27.3 | 28.6 | ||||||||||||||||||||||||||||||||||
| | | | | | | | | | | | | | | | | | | | | | | | | | | | | | | | | | | | | | | | | | | | | | | | | | | |
Income before income tax provision | 42.5 | 36.2 | 24.7 | 28.7 | 22.1 | 20.9 | 8.6 | 13.5 | 35.3 | 42.5 | 36.2 | 24.7 | 28.7 | 22.1 | 20.9 | 8.6 | ||||||||||||||||||||||||||||||||||
Income tax provision | 17.2 | 15.8 | 9.9 | 10.4 | 9.4 | 7.2 | 4.1 | 4.9 | 13.6 | 17.2 | 15.8 | 9.9 | 10.4 | 9.4 | 7.2 | 4.1 | ||||||||||||||||||||||||||||||||||
| | | | | | | | | | | | | | | | | | | | | | | | | | | | | | | | | | | | | | | | | | | | | | | | | | | |
Net income | $ | 25.3 | $ | 20.4 | $ | 14.8 | $ | 18.3 | $ | 12.7 | $ | 13.7 | $ | 4.5 | $ | 8.6 | $ | 21.7 | $ | 25.3 | $ | 20.4 | $ | 14.8 | $ | 18.3 | $ | 12.7 | $ | 13.7 | $ | 4.5 | ||||||||||||||||||
| | | | | | | �� | | | | | | | | | | | | | | | | | | | | | | | | | | | | | | | | | | | | | | | | | | | | | |
| | | | | | | | | | | | | | | | | | | | | | | | | | | | | | | | | | | | | | | | | | | | | | | | | | | |
Net income per share: | ||||||||||||||||||||||||||||||||||||||||||||||||||
Basic | $ | 0.77 | $ | 0.63 | $ | 0.46 | $ | 0.56 | $ | 0.41 | $ | 0.43 | $ | 0.16 | $ | 0.38 | $ | 0.66 | $ | 0.78 | $ | 0.63 | $ | 0.46 | $ | 0.56 | $ | 0.41 | $ | 0.43 | $ | 0.16 | ||||||||||||||||||
Diluted | $ | 0.77 | $ | 0.63 | $ | 0.45 | $ | 0.56 | $ | 0.40 | $ | 0.43 | $ | 0.16 | $ | 0.38 | $ | 0.66 | $ | 0.77 | $ | 0.63 | $ | 0.45 | $ | 0.56 | $ | 0.40 | $ | 0.43 | $ | 0.16 | ||||||||||||||||||
Weighted average shares outstanding: | ||||||||||||||||||||||||||||||||||||||||||||||||||
Basic | 32.5 | 32.5 | 32.5 | 32.5 | 32.4 | 32.5 | 29.1 | 22.6 | 32.5 | 32.5 | 32.5 | 32.5 | 32.5 | 32.4 | 32.5 | 29.1 | ||||||||||||||||||||||||||||||||||
Diluted | 32.8 | 32.8 | 32.7 | 32.6 | 32.6 | 32.6 | 29.3 | 22.7 | 32.7 | 32.7 | 32.7 | 32.7 | 32.6 | 32.6 | 32.6 | 29.3 | ||||||||||||||||||||||||||||||||||
Other Data: | ||||||||||||||||||||||||||||||||||||||||||||||||||
EBITDA(1) | $ | 65.9 | $ | 59.6 | $ | 40.6 | $ | 43.0 | $ | 36.6 | $ | 35.2 | $ | 21.2 | $ | 23.6 | $ | 60.0 | $ | 65.9 | $ | 59.6 | $ | 40.6 | $ | 43.0 | $ | 36.6 | $ | 35.2 | $ | 21.2 | ||||||||||||||||||
Normalized EBITDA(1) | 67.3 | 60.0 | 45.2 | 47.0 | 42.0 | 40.8 | 38.3 | 27.6 | 62.8 | 67.3 | 60.0 | 45.2 | 47.0 | 42.0 | 40.8 | 38.3 | ||||||||||||||||||||||||||||||||||
Adjusted earnings(2) | $ | 28.6 | $ | 30.3 | $ | 24.6 | $ | 20.1 | $ | 22.6 | $ | 17.4 | $ | 19.2 | $ | 16.0 | ||||||||||||||||||||||||||||||||||
Diluted Adjusted earnings per share(3) | 0.87 | 0.93 | 0.75 | 0.62 | 0.70 | 0.53 | 0.59 | 0.55 | ||||||||||||||||||||||||||||||||||||||||||
Capital expenditures | (2.1 | ) | (6.6 | ) | (3.6 | ) | (7.6 | ) | (6.2 | ) | (4.9 | ) | (6.5 | ) | (0.7 | ) | 1.6 | 2.1 | 6.6 | 3.6 | 7.6 | 6.2 | 4.9 | 6.5 | ||||||||||||||||||||||||||
Net cash (used in) provided by operating activities | (57.9 | ) | 107.8 | (41.8 | ) | 115.2 | (85.8 | ) | 104.7 | (34.8 | ) | 43.2 | ||||||||||||||||||||||||||||||||||||||
Net cash provided by (used in) investing activities | 108.5 | (54.7 | ) | (351.6 | ) | (83.0 | ) | 101.8 | (75.4 | ) | (2.0 | ) | (20.2 | ) | ||||||||||||||||||||||||||||||||||||
Net cash provided by (used in) operating activities | 81.4 | (57.9 | ) | 107.7 | (41.7 | ) | 115.2 | (85.8 | ) | 104.7 | (34.8 | ) | ||||||||||||||||||||||||||||||||||||||
Net cash (used in) provided by investing activities | (48.8 | ) | 108.5 | (54.7 | ) | (351.6 | ) | (83.0 | ) | 101.8 | (75.4 | ) | (2.0 | ) | ||||||||||||||||||||||||||||||||||||
Net cash (used in) provided by financing activities | (32.5 | ) | (49.7 | ) | 322.3 | (17.4 | ) | (5.9 | ) | (0.9 | ) | 22.0 | (11.3 | ) | (53.3 | ) | (32.5 | ) | (49.7 | ) | 332.2 | (17.4 | ) | (5.9 | ) | (0.9 | ) | 22.0 | ||||||||||||||||||||||
U.S. Equities ADV(2) | 7,320.9 | 6,352.0 | 6,915.8 | 7,002.1 | 5,677.4 | 6,052.6 | 6,943.8 | 6,375.2 | ||||||||||||||||||||||||||||||||||||||||||
European Equities ADNV(3) | € | 49,715.8 | € | 52,915.2 | € | 54,679.0 | € | 44,265.1 | € | 35,455.4 | € | 37,428.2 | € | 41,615.7 | € | 33,338.5 | ||||||||||||||||||||||||||||||||||
U.S. Options contracts(4) | 17,833.2 | 15,010.5 | 15,934.0 | 17,481.6 | 15,921.8 | 15.455.8 | 17,511.6 | 16,157.2 | ||||||||||||||||||||||||||||||||||||||||||
Global FX ADNV(5) | $ | 25.9 | $ | 27.0 | * | * | * | * | * | * | ||||||||||||||||||||||||||||||||||||||||
U.S. Equities: | ||||||||||||||||||||||||||||||||||||||||||||||||||
Matched shares ADV (in billions) | 1.5 | 1.6 | 1.3 | 1.4 | 1.5 | 1.2 | 1.2 | 1.2 | ||||||||||||||||||||||||||||||||||||||||||
Routed shares ADV (in billions) | 0.1 | 0.1 | 0.1 | 0.1 | 0.1 | 0.1 | 0.1 | 0.1 | ||||||||||||||||||||||||||||||||||||||||||
| | | | | | | | | | | | | | | | | | | | | | | | | | | |||||||||||||||||||||||||
Total touched shares ADV (in billions) | 1.6 | 1.7 | 1.4 | 1.5 | 1.6 | 1.3 | 1.3 | 1.3 | ||||||||||||||||||||||||||||||||||||||||||
| | | | | | | | | | | | | | | | | | | | | | | | | | | |||||||||||||||||||||||||
| | | | | | | | | | | | | | | | | | | |||||||||||||||||||||||||||||||||
| | | | | | | | | | | | | | | | | | | | | | | | | | | |||||||||||||||||||||||||
Market ADV (in billions) | 7.1 | 7.3 | 6.4 | 6.9 | 7.0 | 5.7 | 6.1 | 6.9 | ||||||||||||||||||||||||||||||||||||||||||
Trading days | 64 | 64 | 63 | 61 | 64 | 64 | 63 | 61 | ||||||||||||||||||||||||||||||||||||||||||
European Equities: | ||||||||||||||||||||||||||||||||||||||||||||||||||
Matched and touched ADNV (in billions) | € | 11.6 | € | 12.1 | € | 13.0 | € | 13.0 | € | 9.9 | € | 7.7 | € | 7.8 | € | 9.0 | ||||||||||||||||||||||||||||||||||
Market ADNV (in billions) | € | 46.3 | € | 49.7 | € | 52.9 | € | 54.7 | € | 44.3 | € | 35.4 | € | 37.4 | € | 41.6 | ||||||||||||||||||||||||||||||||||
Trading days | 65 | 66 | 63 | 63 | 64 | 66 | 63 | 63 | ||||||||||||||||||||||||||||||||||||||||||
Average Euro/British pound exchange rate | £ | 0.7217 | £ | 0.7178 | £ | 0.7220 | £ | 0.7436 | £ | 0.7887 | £ | 0.7937 | £ | 0.8148 | £ | 0.8278 | ||||||||||||||||||||||||||||||||||
U.S. Options: | ||||||||||||||||||||||||||||||||||||||||||||||||||
Matched contracts ADV (in millions) | 1.4 | 1.9 | 1.5 | 1.4 | 1.1 | 0.8 | 0.6 | 0.6 | ||||||||||||||||||||||||||||||||||||||||||
Routed contracts ADV (in millions) | — | 0.1 | — | — | — | — | — | — | ||||||||||||||||||||||||||||||||||||||||||
| | | | | | | | | | | | | | | | | | | | | | | | | | | |||||||||||||||||||||||||
Total touched contracts ADV (in millions) | 1.4 | 2.0 | 1.5 | 1.4 | 1.1 | 0.8 | 0.6 | 0.6 | ||||||||||||||||||||||||||||||||||||||||||
| | | | | | | | | | | | | | | | | | | | | | | | | | | |||||||||||||||||||||||||
| | | | | | | | | | | | | | | | | | | |||||||||||||||||||||||||||||||||
| | | | | | | | | | | | | | | | | | | | | | | | | | | |||||||||||||||||||||||||
Market ADV (in millions) | 15.6 | 17.8 | 15.0 | 15.9 | 17.5 | 15.9 | 15.5 | 17.5 | ||||||||||||||||||||||||||||||||||||||||||
Trading days | 64 | 64 | 63 | 61 | 64 | 64 | 63 | 61 | ||||||||||||||||||||||||||||||||||||||||||
Global FX ADNV (in billions)(7) | $ | 23.5 | $ | 25.9 | $ | 27.0 | * | * | * | * | * | |||||||||||||||||||||||||||||||||||||||
impairment charges, gain on extinguishment of revolving credit facility and an unusually large regulatory assessment charged to a member in 2013. EBITDA and Normalized EBITDA do not represent, and should not be considered as, an alternative to net income or cash flows from operations, each as determined in accordance with U.S. GAAP. We have presented EBITDA and Normalized EBITDA because we consider them an important supplemental measure of our performance and believe they are frequently used by analysts, investors and other interested parties in the evaluation of companies. In addition, we use Normalized EBITDA as a measure of operating performance for preparation of our forecasts, evaluating our leverage ratio for the debt to earnings covenant included in our outstanding credit facility and calculating employee and executive bonuses. Other companies may calculate EBITDA and Normalized EBITDA differently than we do. EBITDA and Normalized EBITDA have limitations as analytical tools, and you should not consider them in isolation or as a substitute for analysis of our results as reported under U.S. GAAP.
The following is a reconciliation of net income to EBITDA and Normalized EBITDA:
| | For the Quarter Ended | ||||||||||||||||||||||||
|---|---|---|---|---|---|---|---|---|---|---|---|---|---|---|---|---|---|---|---|---|---|---|---|---|---|
| | December 31, | September 30, | June 30, | March 31, | December 31, | September 30, | June 30, | March 31, | |||||||||||||||||
| | 2015 | 2014 | |||||||||||||||||||||||
| | (in millions) | ||||||||||||||||||||||||
Net income | $ | 21.7 | $ | 25.3 | $ | 20.4 | $ | 14.8 | $ | 18.3 | $ | 12.7 | $ | 13.7 | $ | 4.5 | |||||||||
Interest | 12.4 | 12.9 | 13.2 | 8.1 | 6.9 | 6.9 | 6.9 | 6.6 | |||||||||||||||||
Income tax provision | 13.6 | 17.2 | 15.8 | 9.9 | 10.4 | 9.4 | 7.2 | 4.1 | |||||||||||||||||
Depreciation and amortization | 12.3 | 10.5 | 10.2 | 7.8 | 7.4 | 7.6 | 7.4 | 6.0 | |||||||||||||||||
| | | | | | | | | | | | | | | | | | | | | | | | | | |
EBITDA | 60.0 | 65.9 | 59.6 | 40.6 | 43.0 | 36.6 | 35.2 | 21.2 | |||||||||||||||||
Acquisition-related costs | 1.8 | 0.9 | 0.4 | 5.1 | 4.0 | 5.4 | 5.6 | 3.5 | |||||||||||||||||
IPO costs | 1.0 | 0.5 | — | — | — | — | — | — | |||||||||||||||||
Loss on extinguishment of debt | — | — | — | — | — | — | — | 13.6 | |||||||||||||||||
Debt restructuring | — | — | — | 0.5 | — | — | — | — | |||||||||||||||||
Gain on extinguishment of revolving credit facility | — | — | — | (1.0 | ) | — | — | — | — | ||||||||||||||||
| | | | | | | | | | | | | | | | | | | | | | | | | | |
Normalized EBITDA | $ | 62.8 | $ | 67.3 | $ | 60.0 | $ | 45.2 | $ | 47.0 | $ | 42.0 | $ | 40.8 | $ | 38.3 | |||||||||
| | | | | | | | | | | | | | | | | | | | | | | | | | |
| | | | | | | | | | | | | | | | | | | | | | | | | | |
| | | | | | | | | | | | | | | | | | | | | | | | | | |
The following is a reconciliation of net income to EBITDA and Normalized EBITDA:Adjusted earnings:
| | For the Quarter Ended | For the Quarter Ended | ||||||||||||||||||||||||||||||||||||||||||||||||
|---|---|---|---|---|---|---|---|---|---|---|---|---|---|---|---|---|---|---|---|---|---|---|---|---|---|---|---|---|---|---|---|---|---|---|---|---|---|---|---|---|---|---|---|---|---|---|---|---|---|---|
| | September 30, | June 30, | March 31, | December 31, | September 30, | June 30, | March 31, | December 31, | December 31, | September 30, | June 30, | March 31, | December 31, | September 30, | June 30, | March 31, | ||||||||||||||||||||||||||||||||||
| | 2015 | 2014 | 2013 | 2015 | 2014 | |||||||||||||||||||||||||||||||||||||||||||||
| | (in millions) | (in millions) | ||||||||||||||||||||||||||||||||||||||||||||||||
Net income | $ | 25.3 | $ | 20.4 | $ | 14.8 | $ | 18.3 | $ | 12.7 | $ | 13.7 | $ | 4.5 | $ | 8.6 | $ | 21.7 | $ | 25.3 | $ | 20.4 | $ | 14.8 | $ | 18.3 | $ | 12.7 | $ | 13.7 | $ | 4.5 | ||||||||||||||||||
Interest | 12.9 | 13.2 | 8.1 | 6.9 | 6.9 | 6.9 | 6.6 | 6.4 | ||||||||||||||||||||||||||||||||||||||||||
Income tax provision | 17.2 | 15.8 | 9.9 | 10.4 | 9.4 | 7.2 | 4.1 | 4.9 | ||||||||||||||||||||||||||||||||||||||||||
Depreciation and amortization | 10.5 | 10.2 | 7.8 | 7.4 | 7.6 | 7.4 | 6.0 | 3.7 | ||||||||||||||||||||||||||||||||||||||||||
| | | | | | | | | | | | | | | | | | | | | | | | | | ||||||||||||||||||||||||||
EBITDA | 65.9 | 59.6 | 40.6 | 43.0 | 36.6 | 35.2 | 21.2 | 23.6 | ||||||||||||||||||||||||||||||||||||||||||
Amortization | 8.5 | 7.1 | 7.1 | 4.2 | 2.7 | 2.7 | 2.7 | 2.2 | ||||||||||||||||||||||||||||||||||||||||||
Tax effect of amortization | (3.3 | ) | (2.9 | ) | (3.1 | ) | (1.7 | ) | (1.0 | ) | (1.1 | ) | (0.9 | ) | (1.0 | ) | ||||||||||||||||||||||||||||||||||
Acquisition-related costs | 0.9 | 0.4 | 5.1 | 4.0 | 5.4 | 5.6 | 3.5 | 0.6 | 1.8 | 0.9 | 0.4 | 5.1 | 4.0 | 5.4 | 5.6 | 3.5 | ||||||||||||||||||||||||||||||||||
IPO costs | 0.5 | — | — | — | — | — | — | — | 1.0 | 0.5 | — | — | — | — | — | — | ||||||||||||||||||||||||||||||||||
Loss on extinguishment of debt | — | — | — | — | — | — | 13.6 | — | — | — | — | — | — | — | — | 13.6 | ||||||||||||||||||||||||||||||||||
Other one-time items | — | — | (0.5 | ) | — | — | — | — | 3.4 | |||||||||||||||||||||||||||||||||||||||||
Debt restructuring | — | — | — | 0.5 | — | — | — | — | ||||||||||||||||||||||||||||||||||||||||||
Gain on extinguishment of revolving credit facility | — | — | — | (1.0 | ) | — | — | — | — | |||||||||||||||||||||||||||||||||||||||||
Tax effect of other items | (1.1 | ) | (0.6 | ) | (0.2 | ) | (1.8 | ) | (1.4 | ) | (2.3 | ) | (1.9 | ) | (6.8 | ) | ||||||||||||||||||||||||||||||||||
| | | | | | | | | | | | | | | | | | | | | | | | | | | | | | | | | | | | | | | | | | | | | | | | | | | |
Normalized EBITDA | $ | 67.3 | $ | 60.0 | $ | 45.2 | $ | 47.0 | $ | 42.0 | $ | 40.8 | $ | 38.3 | $ | 27.6 | ||||||||||||||||||||||||||||||||||
Adjusted earnings | $ | 28.6 | $ | 30.3 | $ | 24.6 | $ | 20.1 | $ | 22.6 | $ | 17.4 | $ | 19.2 | $ | 16.0 | ||||||||||||||||||||||||||||||||||
| | | | | | | | | | | | | | | | | | | | | | | | | | | | | | | | | | | | | | | | | | | | | | | | | | | | |
| | | | | | | | | | | | | | | | | | | | | | | | | | | | | | | | | | | | | | | | | | | | | | | | | | | |
Seasonality
In the securities and FX industries, quarterly revenue fluctuations are common and are due primarily to seasonal variations in trading volumes, as well as competition and technological and regulatory changes. Our business experiences seasonal fluctuations, reflecting reduced trading activity generally during the third quarter of each year and during the last month of the year. As a result, our operating results for the third or fourth quarter of any year may not be indicative of the results we expect for the full year.
Liquidity and Capital Resources
Historically, we have financed our operations, capital expenditures, dividend payments and other cash needs through cash generated from operations augmented by private placements of our common stock and issuance of debt.
On December 19, 2012, we entered into the 2012 Loan, which comprised (i) a term loan agreement in the amount of $300 million and (ii) revolving loans not to exceed $50 million. The proceeds received from the term loan were used to pay a $298.9 million dividend, or $13.20 per share, to all of our stockholders during the fourth quarter of 2012. The term of the loan was six years ending on December 19, 2018, with a variable interest rate based on one-month LIBOR (with a floor of 125 basis points), plus a spread of 575 basis points. The original issue discount was $12.5 million, or approximately 4.2%. The revolving loans had similar interest rates, including a 0.50% fee on the unused portion, and a three-year term, ending on December 19, 2015. We incurred $7.1 million of debt issuance costs, which was capitalized and was being amortized over the term of the 2012 Loan.
Upon consummation of the Direct Edge Acquisition on January 31, 2014, we entered into the 2014 Loan, which comprised (i) a term loan agreement in the amount of $470 million and (ii) revolving loans not to exceed $100 million. We used the proceeds received from the 2014 Loan to extinguish the 2012 Loan, pay a $132.9 million dividend, or $4.07 per share, to our stockholders, and for other general corporate purposes. The 2012 Loan, related debt issuance costs and debt discount were extinguished
when we entered into the 2014 Loan, resulting in a loss of $13.6 million that was recorded in non-operating expense on the statement of income. The term of the 2014 Loan is six years ending on January 31, 2020, with a variable interest rate based on one-month LIBOR (with a floor of 100 basis points), plus a spread of 400 basis points (which lowers to 375 basis points if the leverage ratio falls below 2.25). The original issue discount was $1.2 million, or approximately 0.25%. The revolving loans have an interest rate of LIBOR plus 350 basis points and a three-year term, ending on January 31, 2017. The fee on the undrawn portion of the revolving loans is 0.50%. Principal payments on outstanding balances are made on a quarterly basis. We incurred $8.3 million of debt issuance costs, which was capitalized and is being amortized over the term of the 2014 Loan.
Upon consummation of the BATSBats Hotspot Acquisition, we amended our 2014 Loan. The Amended 2014 Loan increased the spread on the variable interest rate from 400 basis points to 475 basis points and required a 25 basis point amendment fee. The required annual amortization also increased from 5.0% per annum to 7.5% per annum. In addition, under the Amended 2014 Loan, we entered into (i) a new $150 million three-year term loan, or the 2015 Term Loan B-1, and (ii) a new $228 million five-year term loan, or the 2015 Term Loan B-2, both of which were funded immediately prior to the BATSBats Hotspot Acquisition. The 2015 Term Loan B-1 has an interest rate based on one-month LIBOR plus a spread of 375 basis points and a 100 basis point original issue discount.discount, or $1.5 million. The 2015 Term Loan B-2 has an interest rate based on one-month LIBOR (with a floor of 100 basis points) plus a spread of 475 basis points and a 100 basis point original issue discount.discount, or $2.3 million. In addition, we entered into a new $100 million revolving credit facility with an interest rate based on one-month LIBOR plus a spread of 350 basis points and an undrawn fee of 50 basis points, replacing the revolving credit facility under the 2014 Loan. Debt issuance costs related to the new and restructured debt were $16.5 million for the year ended December 31, 2015, of which $0.2 million was expensed immediately and $6.6 million and $9.7 million were capitalized as debt issuance costs and additional debt discount, respectively, and are being amortized over the term of the loans.
In the near term, we expect that our operations and availability under our revolving credit facility will meet our cash needs to fund our operations, capital expenditures, debt repayments and any dividends.
Cash and cash equivalents include cash in banks and all non-restricted, highly liquid investments with original maturities of three months or less at the time of purchase. Cash and cash equivalents as of September 30,December 31, 2015 decreased $44.3$47.1 million from December 31, 2014 primarily due to payments of Section 31 feeslong-term debt, offset by net income. Cash and cash equivalents as of December 31, 2014 increased $35.0 million from December 31, 2013 primarily due to net cash provided by operating activities, partially offset by net cash used in investing activities and financing activities. See "—Cash Flow" below for further discussion.
Our cash and cash equivalents held outside of the United States in various foreign subsidiaries totaled $37.2$32.8 million as of September 30,December 31, 2015 and $31.3 million as of December 31, 2014. The remaining balance was held in the United States and totaled $40.7$42.3 million as of September 30,December 31, 2015 and $90.9 million as of December 31, 2014. Cash and cash equivalents held outside of the United States in December 31, 2014 was $28.2 million in December 31, 2013. The remaining balance was held in the United States and totaled $59.0 million as of December 31, 2013. Unremitted earnings of subsidiaries outside of the United States are used to finance our international operations and are generally considered to be indefinitely reinvested. It is not our current intent to change this position. However, the majority of cash held outside the United States is available for repatriation, but under current law, could subject us to additional United States income taxes, less applicable foreign tax credits.
Our financial investments include investments with original or acquired maturities longer than three months but that mature in less than one year from the statement of financial condition date and are recorded at fair value. For the periods ending September 30,As of December 31, 2015 and 2014, and December 31, 2014 and 2013, financial investments primarily consisted of U.S. Treasury securities.
Cash Flow
The following table summarizes our cash flow data for the nine months ended September 30, 2015 and 2014 and years ended December 31, 2015, 2014 2013 and 2012:2013:
| | For the Nine Months Ended September 30, | For the Year Ended December 31, | For the Year Ended December 31, | |||||||||||||||||||||||
|---|---|---|---|---|---|---|---|---|---|---|---|---|---|---|---|---|---|---|---|---|---|---|---|---|---|---|
| | 2015 | 2014 | 2014 | 2013 | 2012 | 2015 | 2014 | 2013 | ||||||||||||||||||
| | (in millions) | (in millions) | ||||||||||||||||||||||||
Net cash provided by (used in) operating activities | $ | 8.1 | $ | (14.0 | ) | $ | 99.3 | $ | 63.1 | $ | 65.1 | |||||||||||||||
Net cash (used in) provided by investing activities | (297.8 | ) | 24.4 | (58.6 | ) | (9.8 | ) | 94.5 | ||||||||||||||||||
Net cash provided by operating activities | $ | 89.5 | $ | 99.3 | $ | 63.1 | ||||||||||||||||||||
Net cash used in investing activities | (346.6 | ) | (58.6 | ) | (9.8 | ) | ||||||||||||||||||||
Net cash provided by (used in) financing activities | 239.6 | 15.4 | (2.2 | ) | (46.7 | ) | (175.0 | ) | 196.7 | (2.2 | ) | (46.7 | ) | |||||||||||||
Effect of foreign currency exchange rate changes on cash and cash equivalents | 5.8 | (6.1 | ) | (3.5 | ) | (1.9 | ) | (1.4 | ) | 13.3 | (3.5 | ) | (1.9 | ) | ||||||||||||
| | | | | | | | | | | | | | | | | | | | | | | | | | | |
(Decrease) increase in cash and cash equivalents | $ | (44.3 | ) | $ | 19.7 | $ | 35.0 | $ | 4.7 | $ | (16.8 | ) | $ | (47.1 | ) | $ | 35.0 | $ | 4.7 | |||||||
| | | | | | | | | | | | | | | | | | | | | | | | | | | | |
| | | | | | | | | | | | | | | | | | | | | | | | | | | |
Net Cash Flows Provided by (Used in) Operating Activities
During the nine monthsyear ended September 30,December 31, 2015, net cash used inprovided by operating activities was $52.4$7.3 million lessgreater than net income. The primary adjustments were a decrease of $83.5$29.2 million in Section 31 feesaccounts payable and accrued liabilities and depreciation and amortization of $28.5$40.8 million.
During the nine monthsyear ended September 30, 2014, net cash used in operating activities was $44.9 million lower than net income. The primary adjustments were a decrease in SectionDecember 31, fees payable of $57.9 million, an increase in accounts receivable of $22.8 million, offset by non-cash adjustments for depreciation and amortization of $20.9 million, and the loss on the early extinguishment of debt for $13.6 million.
In 2014, net cash provided by operating activities was $50.1 million higher than net income. The primary adjustments were non-cash adjustments for depreciation and amortization of $28.4 million and the loss on the early extinguishment of debt for $13.6 million.
InDuring the year ended December 31, 2013, net cash provided by operating activities was $16.3 million higher than net income. The primary adjustments were adjustments to reconcile net income to cash of $27.6 million offset by a $14.5 million decrease in Section 31 fees payable.
In 2012, net cash provided by operating activities was $33.5 million higher than net income. The primary adjustments were a non-cash adjustment for depreciation and amortization of $17.0 million and the change in the fair value of the contingent consideration recorded with the Chi-X Europe acquisition of $12.4 million.
Net Cash Flows (Used in) Provided byUsed in Investing Activities
Net cash flows (used in) provided by investing activities for the nine months ended September 30, 2015 and 2014 were ($297.8) million and $24.4 million, respectively, and primarily represented the acquisition of BATS Hotspotused in 2015 for $360.9 million and changes in net purchases and redemptions of available-for-sale securities of $61.4 million in 2015 and $18.2 million in 2014. Purchases of property and equipment were $12.3 million and $17.6 million for the nine months ended September 30, 2015 and 2014, respectively. In 2015, our capital expenditures related to the acquisition of BATS Hotspot and building new datacenter space to house the BATS Hotspot trading platform. In 2014, we built out the datacenter spaces and migrated the EDGX and EDGA exchanges onto BATS technology.
Net cash flows (used in) provided by investing activities for the years ended December 31, 2015, 2014 and 2013 and 2012 were ($58.6)$346.6 million, ($9.8)$58.6 million and $94.5$9.8 million, respectively, and primarily represented changes in net purchases and redemptions of available-for-sale securities of $14.2 million in 2015, $43.2 million in 2014 and $4.1 million in 2013 and $98.1 million in 2012.2013. Purchases of property and equipment were $13.9 million, $25.2 million $3.6 million and $6.9$3.6 million for the years ended December 31, 2015, 2014 2013 and 2012,2013, respectively. In 2014, we built out the datacenter spaces and completed the migration of the EDGX and EDGA exchanges onto BATSBats technology in January 2015. In 2013, and 2012, the majority of these capital expenditures were for the enhancement or the expansion of our trading technology and applications. We continually invest in technology to support our trading platform. See "Business—Technology."
For the remainder of 2015, we expect to spend between $2.0 million and $4.0 million in capital expenditures. We expect to spend $14.0$15.0 million to $18.0$20.0 million in capital expenditures in 2016 primarily for the general maintenance and ongoing enhancement of our data and telecommunications infrastructure and disaster recovery sites.
Net Cash Flows Provided by (Used in) Financing Activities
For the nine monthsyear ended September 30,December 31, 2015, $373.8 million was received in proceeds from long-term debt, offset by $102.4$153.1 million in payments of long-term debt. Debt issuance cost was $19.3$16.5 million. We received $0.7 million from the employee stock purchase plan which was offset by $1.5$3.6 million in treasury stock purchases.
In 2014, in connection with the acquisition of Direct Edge Acquisition, $499.9 million of long-term debt was issued, offset by the payment of the previous loan and additional principal payments made in 2014 of $277.6 million. This was also offset by $215.0 million in dividends paid to our stockholders, $8.3 million of debt issuance cost paid and $1.1 million in purchases of treasury stock.
Financial Assets
The following summarizes our financial assets for the nine months ended September 30, 2015 and 2014 and years ended December 31, 2015, 2014 and 2013:
| | For the Nine Months Ended September 30, | For the Year Ended December 31, | For the Year Ended December 31, | ||||||||||||||||||||
|---|---|---|---|---|---|---|---|---|---|---|---|---|---|---|---|---|---|---|---|---|---|---|---|
| | 2015 | 2014 | 2014 | 2013 | 2015 | 2014 | 2013 | ||||||||||||||||
| | (in millions) | (in millions) | |||||||||||||||||||||
Cash and cash equivalents | $ | 77.9 | $ | 106.9 | $ | 122.2 | $ | 87.2 | $ | 75.1 | $ | 122.2 | $ | 87.2 | |||||||||
Financial investments | 0.5 | 9.0 | 68.4 | 25.2 | 47.7 | 68.4 | 25.2 | ||||||||||||||||
Adjusted Cash(1) | 78.4 | 114.6 | 112.3 | 85.2 | 54.9 | 112.3 | 85.2 | ||||||||||||||||
Debt
The following summarizes our debt obligations for the nine months ended September 30, 2015 and 2014 and years ended December 31, 2015, 2014 and 2013:
| | For the Nine Months Ended September 30 | For the Year Ended December 31 | For the Year Ended December 31, | ||||||||||||||||||||
|---|---|---|---|---|---|---|---|---|---|---|---|---|---|---|---|---|---|---|---|---|---|---|---|
| | 2015 | 2014 | 2014 | 2013 | 2015 | 2014 | 2013 | ||||||||||||||||
| | (in millions) | (in millions) | |||||||||||||||||||||
Term loans outstanding | $ | 737.2 | $ | 457.3 | $ | 446.4 | $ | 246.0 | $ | 687.5 | $ | 446.4 | $ | 246.0 | |||||||||
Revolving credit facility | — | 29.2 | 28.0 | — | — | 28.0 | — | ||||||||||||||||
Current portion of long-term debt | (98.0 | ) | (37.3 | ) | (44.2 | ) | (17.4 | ) | (87.1 | ) | (44.2 | ) | (17.4 | ) | |||||||||
| | | | | | | | | | | | | | | | | | | | | | | | |
Long-term debt | $ | 639.2 | $ | 449.2 | $ | 430.2 | $ | 228.6 | $ | 600.4 | $ | 430.2 | $ | 228.6 | |||||||||
| | | | | | | | | | | | | | | | | | | | | | | | | |
| | | | | | | | | | | | | | | | | | | | | | | | |
At September 30,December 31, 2015, we were in compliance with the covenants of our debt agreements.
In addition to the debt outstanding, as of September 30,December 31, 2015 we had an additional $100.0 million available through our revolving credit facility. Together with Adjusted Cash, we had $178.4$154.9 million available to fund our operations, capital expenditures, potential acquisitions, debt repayments and any dividends as of September 30,December 31, 2015.
Lease and Contractual Obligations
Our principal office is located at 8050 Marshall Drive, Lenexa, Kansas, where we lease approximately 39,000 square feet of space. The lease on this space expires in February 2025 and
contains two five-year renewal options, as well as a one-time option to terminate in November 2019 if certain contingencies under the lease are met. We have an office located at 17 State Street, New York, New York, where we lease approximately 21,000 square feet of space, which expires in April 2024. We have an office at 200 S. Wacker Drive, Chicago, Illinois, where we lease approximately 200 square feet of space, which expires in June 2016. We have an office located at 16 Collyer Quay, Singapore, where we lease approximately 200 square feet of space, which expires July 2016. In addition, following our acquisition of ETF.com, we now have an office located at 222 Sutter Street, Suite 700, San Francisco, California where we lease approximately 2,500 square feet of space, which expires June 30, 2016. The disaster recovery sites in the United States are located in Kansas City, Missouri and Secaucus, New Jersey. In addition, we have agreements with a primary data center in Secaucus, New Jersey and a secondary data center in Chicago, Illinois. Our principal offices in the United Kingdom are at 10 Lower Thames Street, London, where we lease approximately 9,100 square feet of office space, which expires in December 2017. Total rent expense related to these lease obligations for the nine monthsyear ended September 30,December 31, 2015 was $2.4$3.1 million. In the United States, we have an agreement for our primary data center in Secaucus, New Jersey and our secondary data center in Chicago, Illinois. This agreement was effective in January 2014 and is included in the table below. In Europe, our primary data center is in Slough, England. The disaster recovery site for BATS Chi-XBats Europe is in Park Royal, London. Our work area recovery space is available on invocation with a specialist provider.
In addition to our lease obligations, we have contractual obligations related to certain operating leases, data and telecommunications agreements, equipment leases and our long-term debt outstanding.
Future minimum payments under these leases and agreements were as follows as of December 31, 2014:2015:
| | Payments Due by Period | |||||||||||||||
|---|---|---|---|---|---|---|---|---|---|---|---|---|---|---|---|---|
Contractual Obligations | Total | Less than 1 year | 1-3 years | 4-5 years | More than 5 years | |||||||||||
| | | | (in millions) | | | |||||||||||
Operating leases | $ | 19.7 | $ | 2.6 | $ | 4.9 | $ | 4.3 | $ | 7.9 | ||||||
Principal payments of long-term debt | 447.4 | 44.5 | 161.7 | 53.5 | 187.7 | |||||||||||
Interest payments on long-term debt | 78.6 | 21.4 | 46.3 | 10.9 | — | |||||||||||
Payment of outstanding revolver | 28.0 | — | — | — | 28.0 | |||||||||||
Data and telecommunications agreements | 6.4 | 3.0 | 2.7 | 0.7 | — | |||||||||||
Equipment agreements(1) | 6.5 | 3.7 | 2.8 | — | — | |||||||||||
| | | | | | | | | | | | | | | | | |
Total | $ | 586.6 | $ | 75.2 | $ | 218.4 | $ | 69.4 | $ | 223.6 | ||||||
| | | | | | | | | | | | | | | | | |
| | | | | | | | | | | | | | | | | |
| | | | | | | | | | | | | | | | | |
| | Payments Due by Period | |||||||||||||||
|---|---|---|---|---|---|---|---|---|---|---|---|---|---|---|---|---|
Contractual Obligations | Total | Less than 1 year | 1-3 years | 4-5 years | More than 5 years | |||||||||||
| | | | (in millions) | | | |||||||||||
Operating leases | $ | 16.2 | $ | 2.3 | $ | 4.4 | $ | 3.3 | $ | 6.2 | ||||||
Principal payments of long-term debt | 698.7 | 90.7 | 211.8 | 396.2 | — | |||||||||||
Interest payments on long-term debt | 116.4 | 36.9 | 56.8 | 22.7 | — | |||||||||||
Data and telecommunications agreements | 2.4 | 1.0 | 1.4 | — | — | |||||||||||
Equipment agreements | 2.8 | 2.1 | 0.7 | — | — | |||||||||||
| | | | | | | | | | | | | | | | | |
Total | $ | 836.5 | $ | 133.0 | $ | 275.1 | $ | 422.2 | $ | 6.2 | ||||||
| | | | | | | | | | | | | | | | | |
| | | | | | | | | | | | | | | | | |
| | | | | | | | | | | | | | | | | |
Off Balance Sheet Arrangements
As of September 30,December 31, 2015 and December 31, 2014, we did not have any off-balance sheet arrangements.
Guarantees
We use Wedbush Securities and Morgan Stanley to clear our routed cash equities transactions in our U.S. Equities segment. Wedbush Securities and Morgan Stanley guarantee the trade until one day after the trade date, after which time the NSCC provides a guarantee. In the case of failure to perform on the part of one of our clearing firms, Wedbush Securities or Morgan Stanley, we provide the guarantee to the counterparty to the trade. The OCC acts as a central counterparty on all transactions in listed equity options in our U.S. Options segment, and as such, guarantees clearance and settlement of all of our options transactions. We believe that any potential requirement for us to make payments under these guarantees is remote and accordingly, have not recorded any liability in the consolidated financial statements for these guarantees.
Critical Accounting Policies
The preparation of consolidated financial statements in conformity with U.S. GAAP requires our management to make estimates and assumptions that affect the reported amounts of assets and liabilities, disclosure of the amounts of contingent assets and liabilities at the date of the financial statements and the reported amounts of revenues and expenses during the reporting period. Actual results could differ materially from those estimates. Material estimates that are particularly susceptible to significant change in the near term include the following:
Revenue Recognition
Transaction fees are recognized on a trade-date basis. Pursuant to Financial Accounting Standards Board, or FASB, ASC, 605-45,Revenue Recognition: Principal Agent Consideration, revenues from transactions executed through us are recorded on a gross basis in revenues and expenses. Transaction fees also include fees on shares routed out to another market center.
As discussed above, we earn market data fees from the U.S. tape plans, including the UTP, CTA, CQS and OPRA. Fees, net of plan costs, from UTP, CTA and CQS are allocated and distributed to plan participants according to their share of tape fees based on a formula, required by Regulation NMS, that takes into account both trading and quoting activity. Fees from the U.S. tape plans other than OPRA are estimated and recognized on a monthly basis and received quarterly. Market data fees from OPRA are allocated based upon our share of total options transactions cleared, recognized on a monthly basis and received quarterly. We also charge data subscribers directly for proprietary market data in our U.S. Equities and European Equities segments. The proprietary market data fees are recognized on a monthly basis.
In addition, our national securities exchanges are assessed fees pursuant to Section 31 of the Exchange Act. As discussed above, Section 31 fees are designed to recover the costs to the government of supervision and regulation of securities markets and securities professionals. As BZX, BYX, EDGX and EDGA are SEC-registered national securities exchanges, these fees are paid directly to the SEC. The exchanges then pass these costs along to members. The exchanges collect the fees as a pass-through charge from members executing eligible trades and recognize these amounts in revenues and cost of revenues as incurred.
Goodwill and Other Intangible Assets
Our acquisitions of Chi-X Europe, Direct Edge and BATSBats Hotspot resulted in the recording of goodwill and other intangible assets. In accordance with ASC 350—Intangibles—Goodwill and Other, we test the carrying values of goodwill and indefinite-lived intangible assets for impairment at least annually, or more frequently when events or changes in circumstances signal indicators of impairment are present. We perform our annual impairment test of goodwill and other indefinite-lived intangible assets during the fourth quarter of our fiscal year, using the December 1 carrying values. Goodwill is tested for impairment at the reporting unit level in accordance with ASC 350-20. If the carrying value of the reporting unit exceeds its fair value, an impairment loss will be recognized in an amount equal to the excess. If the fair value of indefinite-lived intangible assets is less than their carrying value, an impairment loss will be recognized in an amount equal to the difference. We completed our annual goodwill impairment test in the fourth quarter of 2015 and determined that no impairment existed.
Stock-Based Compensation
We have historically granted stock-based compensation to our employees in the form of stock options and restricted stock. We record the related compensation expense based on the grant date fair value calculated in accordance with the authoritative guidance issued by FASB. We recognize these compensation costs on a straight-line basis over the requisite service period of the award.
We estimate the grant date fair value of stock options using the Black-Scholes valuation model. Stock-based compensation expense related to awards of restricted stock is based on the fair value at the grant date. We recognized compensation expense of approximately $4.2$5.9 million, $1.9 million and $1.3 million for the nine months ended September 30, 2015 and 2014, respectively, and $1.9 million, $2.2 million and $5.6 million for the years ended December 31, 2015, 2014 2013 and 2012,2013, respectively. This expense is included in the compensation and benefits expense in the consolidated statements of income. Assumptions used to estimate compensation expense are determined as follows and have not significantly changed during the years ended December 31, 2015, 2014 2013 and 2012:2013:
No stock options were granted during the nine monthsyear ended September 30,December 31, 2015.
Grant Date | Number of Shares Granted | Exercise Price | Grant Date Fair Value Per Share | Aggregate Grant Date Fair Value | |||||||||
|---|---|---|---|---|---|---|---|---|---|---|---|---|---|
December 1, 2014 | 219,538 | $ | 36.44 | $ | 13.50 | $ | 2,963,763 | ||||||
During 2015, 2014 and 2013, we granted stock options and restricted stock based on market transactions of our common stock, if available. We believe that the best indication of value to price these grants is a current market-based transaction of our common stock, e.g., the purchase or sale of our common stock by independent, non-distressed parties. If a market-based transaction of our common stock is not available, then we obtain a fair value of our common stock based on independent third-party valuation. Each valuation reflected on equal weighting of two valuation analysis techniques: (1) discounted cash flow analysis based on management assumptions and (2) valuation multiples (earnings before interest, taxes, depreciation and amortization and earnings per share) observed from publicly traded companies in a similar industry, a peer group. A combination of factors led to the changes in the fair value of the underlying common stock, including but not limited to, our operating performance, revenues and expenses associated with the entrance into new markets, historical and forecasted industry volumes, market share, pricing within each asset class we operate, amount of debt outstanding and changes in the valuation multiples of the established peer group.
In 2013, we granted 4,751 shares of restricted stock valued at $31.57 per share based on an independent third-party valuation as of April 2013 and 83,855 shares of restricted stock valued at $34.07 per share based on an independent third-party valuation as of October 2013. The April 2013 valuation was based on a discounted cash flow exit multiple of 7.5 times and comparable public company multiples of 8.0 times EBITDA and 12.5 times price-earnings ratio of 2013 forecasted earnings, net of $288.8 million of outstanding debt. The October 2013 valuation was based on a discounted cash flow exit multiple of 8.0 times and comparable public company multiples of 9.5 times EBITDA and 15.0 times price-earnings ratio of 2013 forecasted earnings and 8.5 times EBITDA and 12.5 times price-earnings ratio of 2014 forecasted earnings, net of $266.3 million of outstanding debt.
In 2014, we granted 51,222 shares of restricted stock valued at $35.14 per share based on an independent third-party valuation as of January 2014, 3,559 shares of restricted stock valued at $33.71 per share based on a third-party valuation as of April 2014, 157,279 shares of restricted stock valued at $36.44
$36.44 per share based on a third-party valuation as of October 2014 and 219,538 stock options with an exercise price of $36.44 per share based on an independent third-party valuation of our common stock as of October 2014. The January 2014 valuation was based on discounted cash flow exit multiple of 9.5 times and comparable public company multiples of 9.4 times EBITDA and a 15.3 times price-earnings ratio of 2014 forecasted earnings, net of $376.6 million of outstanding debt and Direct Edge Acquisition closing obligations. The April 2014 valuation was based on a discounted cash flow exit multiple of 9.5 times and comparable public company multiples of 9.8 times EBITDA and 15.7 times price-earnings ratio of 2014 forecasted earnings, offset by $499.7 million of outstanding debt. The October 2014 valuation was based on a discounted cash flow exit multiple of 9.5 times and comparable public company multiples of 9.4 times EBITDA and 15.3 times price-earnings ratio of 2014 forecasted earnings and 8.5 times EBITDA and 14.5 times price-earnings ratio of 2015 forecasted earnings, net of $487.5 million of outstanding debt.
In 2015, we granted 8,582 restricted stock valued at $45.44 per share based on an independent third-party valuation as of April 2015. In 2015 and to date in 2016, we granted 157,715 shares and
236,504 shares, respectively, of restricted stock valued at $45.93 per share based on market transactions between existing stockholders and a third-party valuation as of October 2015. The April 2015 valuation was based on a discounted cash flow exit multiple of 9.5 times and comparable public company multiples of 10.6 times EBITDA and 16.2 times price-earnings ratio of 2015 forecasted earnings and 9.8 times EBITDA and 14.5 times price-earnings ratio of 2016 forecasted earnings, net of $856.9 million of outstanding debt and BATSBats Hotspot Acquisition contingent consideration. The market transactions were agreed to between existing stockholders at a fair value of $45.25 in December 2015 and closed in December 2015 and Januarythrough February 2016. We included a blockageblock trade discount of 1.5% to the market transaction based on a range from an independent third-party analysis. The October 2015 valuation was based on a discounted cash flow exit multiple of 9.5 times and comparable public company multiples of 10.6 times EBITDA and 16.6 times price-earnings ratio of 2015 forecasted earnings and 9.8 times EBITDA and 14.0 times price-earnings ratio of 2016 forecasted earnings, net of $814.2 million of outstanding debt and BATSBats Hotspot Acquisition contingent consideration.
Property and Equipment, Net
Property and equipment are stated at cost, less accumulated depreciation. Depreciation is computed using the straight-line method over the estimated lives of the assets, generally ranging from three to seven years. Expenditures for repairs and maintenance are charged to expense as incurred. Depreciation of leasehold improvements is calculated using the straight-line method over the shorter of the related lease term or the estimated useful life of the assets.
Long-lived assets to be held and used are reviewed to determine whether any events or changes in circumstances indicate that the carrying amount of the asset may not be recoverable. We base the evaluation on such impairment indicators as the nature of the assets, the future economic benefit of the assets, any historical or future profitability measurements, as well as other external market conditions or factors that may be present. If such impairment indicators are present that would indicate that the carrying amount of the asset may not be recoverable, we determine whether an impairment has occurred through the use of an undiscounted cash flow analysis of assets at the lowest level for which identifiable cash flows exist. In the event of impairment, we recognize a loss for the difference between the carrying amount and the estimated value of the asset as measured using quoted market prices or, in the absence of quoted market prices, a discounted cash flow analysis.
Income Taxes
Deferred taxes are provided on a liability method whereby deferred tax assets are recognized for deductible temporary differences and operating loss and tax credit carryforwards and deferred tax liabilities are recognized for taxable temporary differences. Temporary differences are the differences
between the reported amounts of assets and liabilities and their tax bases. Deferred tax assets are reduced by a valuation allowance when, in our opinion, it is more likely than not that all or some portion of the deferred tax assets will not be realized. Deferred tax assets and liabilities are adjusted for the effects of changes in tax laws and rates on the date of enactment.
Foreign Currency
The functional currency of BATS Chi-XBats Europe and certain BATSBats Hotspot operations is the British pound. Certain BATSBats Hotspot operations also use the Singapore dollar as functional currency. We also bill our European customers in their local currencies, which are primarily Euros, but also include Swiss Francs, Norwegian Kroners, Swedish Kronas and Danish Kroners. The assets and liabilities of BATS Chi-XBats Europe and certain BATSBats Hotspot operations are translated from British pounds and Singapore dollars into U.S. dollars using the relevant exchange rate in effect as of each statement of financial condition date. Statements of income and cash flow amounts are translated using the average exchange rate during the period. The cumulative effects of translating the statement of
financial condition accounts from the functional currency into the U.S. dollar at the applicable exchange rates are included in accumulated other comprehensive income (loss). Foreign currency gains and losses are recorded as other income (expense) in our consolidated statements of income and have historically not been material.
Qualitative and Quantitative Disclosures about Market Risk
As a result of our operating activities, we are exposed to market risks such as foreign currency exchange rate risk, equity risk and credit risk. We have implemented policies and procedures to measure, manage and monitor and report risk exposures, which are reviewed regularly by management and our board of directors.
Foreign Currency Exchange Rate Risk
With operations in Europe and Asia, we are subject to currency translation risk as revenues and expenses are denominated in foreign currencies, primarily the British pound, Singapore dollar and the Euro. We also have de minimis exposure to other foreign currencies, including the Swiss Franc, Norwegian Kroner, Swedish Krona and Danish Kroner.
For the nine monthsyear ended September 30,December 31, 2015, our exposure to foreign-denominated revenues and expenses is presented by primary foreign currency in the following table:
| | Nine Months Ended September 30, 2015 | ||||||
|---|---|---|---|---|---|---|---|
| | Euro(1) | British Pound(1) | |||||
| | (in millions, except percentages) | ||||||
Foreign denominated % of: | |||||||
Revenues | 3.6 | % | 2.1 | % | |||
Cost of revenues | (0.6 | ) | (0.2 | ) | |||
Operating expenses | (0.7 | ) | — | ||||
Impact of 10% adverse currency fluctuation on: | |||||||
Revenues | $ | (5.3 | ) | $ | (3.1 | ) | |
Cost of revenues | 0.6 | 0.3 | |||||
Operating expenses | 0.1 | — | |||||
For the year ended December 31, 2014, our exposure to foreign-denominated revenues and expenses is presented by primary foreign currency in the following table:
| | Year Ended December 31, 2014 | Year Ended December 31, 2015 | ||||||||||||
|---|---|---|---|---|---|---|---|---|---|---|---|---|---|---|
| | Euro(1) | British Pound(1) | Euro(1) | British Pound(1) | ||||||||||
| | (in millions, except percentages) | (in millions, except percentages) | ||||||||||||
Foreign denominated % of: | ||||||||||||||
Revenues | 2.9 | % | 2.6 | % | 3.4 | % | 2.4 | % | ||||||
Cost of revenues | (0.6 | ) | (0.4 | ) | 2.7 | % | 0.5 | % | ||||||
Operating expenses | (0.9 | ) | — | 0.8 | % | — | ||||||||
Impact of 10% adverse currency fluctuation on: | ||||||||||||||
Revenues | $ | (4.2 | ) | $ | (3.9 | ) | 6.0 | 4.1 | ||||||
Cost of revenues | 0.7 | 0.5 | 3.7 | 0.8 | ||||||||||
Operating expenses | 0.2 | — | 0.2 | — | ||||||||||
Equity Risk
Our investment in European operations is exposed to volatility in currency exchange rates through translation of our net assets or equity to U.S. dollars. The assets and liabilities of our European business are denominated in British pounds. Fluctuations in currency exchange rates may create volatility in our reported results as we are required to translate foreign currency reported statements of financial condition and operational results into U.S. dollars for consolidated reporting. The translation of these non-U.S. dollar statements of financial condition into U.S. dollars for consolidated reporting results in a cumulative translation adjustment, which is recorded in accumulated other comprehensive loss (income) within stockholders' equity on our consolidated statements of financial condition.
Our primary exposure to this equity risk as of September 30,December 31, 2015 is presented by foreign currency in the following table:
| | British Pound(1) | |||
|---|---|---|---|---|
| | (in millions) | |||
Net equity investment in BATS Chi-X Europe | $ | 274.0 | ||
Impact on consolidated equity of a 10% adverse currency fluctuation | (27.4 | ) | ||
Our primary exposure to this equity risk as of December 31, 2014 is presented by foreign currency in the following table:
| | British Pound(1) | British Pound(1) | ||||||
|---|---|---|---|---|---|---|---|---|
| | (in millions) | (in millions) | ||||||
Net equity investment in BATS Chi-X Europe | $ | 278.2 | ||||||
Net equity investment in Bats Europe | $ | 259.3 | ||||||
Impact on consolidated equity of a 10% adverse currency fluctuation | (27.8 | ) | $ | 25.9 | ||||
Credit Risk
We are exposed to credit risk from third parties, including customers, counterparties and clearing agents. These parties may default on their obligations due to bankruptcy, lack of liquidity, operational failure or other reasons. We limit our exposure to credit risk by rigorously selecting the counterparties with which we make investments and execute agreements. While we provide markets for trading listed cash equity securities in the United States and Europe and listed equity options in the United States, we do not trade securities for our own account. We invest available cash in highly liquid, short-term investments, such as U.S. Treasury securities. Our investment policy is to preserve capital and liquidity. We do not believe there is significant risk associated with these short-term investments.
We do not have counterparty credit risk with respect to trades matched on BZX, BYX, EDGX, EDGA and BATS Chi-XBats Europe. With respect to listed cash equities, we deliver matched trades of our customers to NSCC without taking on counterparty risk for those trades. NSCC acts as a central counterparty on all transactions occurring on BZX, BYX, EDGX and EDGA and, as such, guarantees clearance and settlement of all of our matched equity trades. Similarly, with respect to U.S. listed equity options, we deliver matched trades of our customers to the OCC, which acts as a central counterparty on all transactions occurring on BZX and EDGX and, as such, guarantees clearance and settlement of all of our matched options trades.
In addition, with respect to orders BATSBats Trading routes to other markets for execution on behalf of our customers, BATSBats Trading is exposed to some counterparty credit risk in the case of failure to perform on the part of our clearing firms, Wedbush Securities or Morgan Stanley. Wedbush Securities and Morgan Stanley guarantee trades until one day after the trade date, after which time NSCC provides a guarantee. Thus, BATSBats Trading is potentially exposed to credit risk to the counterparty to a trade routed to another market center between the trade date and one day after the trade date in the event that Wedbush Securities or Morgan Stanley fails. We believe that any potential requirement for us to make payments under these guarantees is remote and accordingly, have not recorded any liability in the consolidated financial statements for these guarantees.
Similarly, with respect to orders in U.S. listed equity options, we route orders for execution to other national securities exchanges through either BATSBats Trading or through affiliates of Bank of America Merrill Lynch and Wedbush Securities, as discussed above. For orders in U.S. listed equity options routed through Bank of America Merrill Lynch or Wedbush Securities and executed on another national securities exchange, BATSBats Trading has counterparty credit risk exposure to Bank of America Merrill Lynch or Wedbush Securities until a trade settles (generally one day after the trade date). For orders in U.S. listed equity options routed directly by BATSBats Trading to, and executed on, another national securities exchange, BATSBats Trading also has counterparty credit exposure to Bank of America Merrill Lynch, which acts as BATSBats Trading's options clearing firm on such transactions. We believe that any potential requirement for us to make payments under these guarantees is remote. Accordingly, we have not recorded any liability in our consolidated financial statements for these guarantees.
Historically, we have not incurred any liability due to a customer's failure to satisfy its contractual obligations as counterparty to a system trade. Credit difficulties or insolvency, or the perceived possibility of credit difficulties or insolvency, of one or more larger or visible market participants could also result in market-wide credit difficulties or other market disruptions.
We do not have counterparty credit risk with respect to institutional spot FX trades occurring on the BATSBats Hotspot Platform because BATSBats Hotspot is not a counterparty to any FX transactions. All transactions occurring on the BATSBats Hotspot Platform occur bilaterally between two banks or prime brokers as counterparties to the trade. While BATSBats Hotspot does not have direct counterparty risk, BATSBats Hotspot may suffer a decrease in transaction volume if a bank or prime broker experiences an event that causes other prime brokers to decrease or revoke the credit available to the prime broker experiencing the event. Therefore, BATSBats Hotspot may have risk that is related to the credit of the banks and prime brokers that trade FX on the BATSBats Hotspot Platform.
We also have credit risk related to transaction fees that are billed in arrears to customers on a monthly basis. Our potential exposure to credit losses on these transactions is represented by the receivable balances in our consolidated statements of financial condition. Our customers are financial institutions whose ability to satisfy their contractual obligations may be impacted by volatile securities markets.
On a regular basis, we review and evaluate changes in the status of our counterparties' creditworthiness. Credit losses such as those described above could adversely affect our consolidated financial position and results of operations. Any such effects to date have been minimal.
Overview
We are a leading global operator of securities exchanges and other electronic markets enabled by world-class technology. We provide trade execution, market data, trade reporting, connectivity and risk management solutions to brokers, market makers, asset managers and other market participants, ultimately benefiting retail and institutional investors across multiple asset classes. Our principal objective is to improve markets by maximizing efficiency and mitigating trade execution risk for market participants. Our asset class focus currently comprises listed cash equity securities in the United States and Europe, listed equity options in the United States and institutional spot FX globally, as well as ETPs, including ETFs, in the United States and Europe. Trade execution comprised 44.7%44.6% of our revenues less cost of revenues, and market data and connectivity, or non-transaction revenues, comprised 55.3%55.4% of our revenues less cost of revenues for the nine monthsyear ended September 30,December 31, 2015.
We are the second largest exchange operator in U.S. listed cash equity securities trading by market share, the largest exchange operator of ETFs and other ETPs by market share, and the largest European exchange operator as measured by notional value traded.traded as of December 31, 2015. In addition, for each of the six consecutive months ended December 31, 2015, excluding the Chinese exchanges, we were the largest equities market operator globally as measured by notional value traded. Moreover, during 2015 we operated the fastest growing market in the United States for exchange traded options as measured by market share.
We improve markets by maximizing efficiency and mitigating trade execution risk, in part by offering low-cost, innovativemarket-leading pricing and low-latency trade execution enabled by resilient and robust proprietary technology. For example, during the three monthsyear ended September 30,December 31, 2015, our net capture, including auctions, in the U.S. equities market was approximately 40%42% of the rate reported by NASDAQ Group's U.S. equities operations and Intercontinental Exchange's NYSE operations, while our net capture, including auctions, in the European listed equity securities market was approximately 54%94% of the rate reported by the London Stock Exchange's European equities operations. During the third quarter ofyear ended December 31, 2015, our net capture in the U.S. listed equity options market was 6%8% to 20%19% of the rate reported by CBOE, NYSE Arca, NYSE MKT, NASDAQ Options Market and NASDAQ PHLX. We offer the same low-cost, market-leading pricing for our market data products. During the year ended December 31, 2015, our pricing for market data for the U.S. equities market was a combined $12,500 per month for data from BZX, BYX, EDGX and EDGA. This is approximately 8% of the prices reported by NYSE and NASDAQ operations to receive data for all of their respective markets during the same period. Our market data pricing in Europe was €59.50 per month for pan-European data during the year ended December 31, 2015. This is approximately 11% of the cost of receiving data from the other exchanges across Europe during the same period. Participants can also purchase our FX market data for $5,000 per month. This is approximately 8% of the price currently charged by EBS Market.
We develop, own and operate the BATSBats trading platforms, which deploy our proprietary technology designed to offer some of the fastest and most reliable trading systems available. Our diverse exchange platforms are designed to facilitate price discovery by encouraging the quoting of competitive lit prices but also offer opportunities to post dark trading interest on our U.S. and European order books. In the United States, we operate four national securities exchanges, BZX, BYX, EDGX and EDGA. All four BATSBats exchanges trade listed cash equity securities and ETPs, while offering different pricing alternatives. BZX also serves as a listing destination for ETPs, and each of BZX and EDGX also operate a market for trading listed equity options. BZX Options is a pure price/time priorityprice-time-priority market, while EDGX Options offers a customer priority, "pro rata" model. We also operate a broker-dealer in the United States, BATSBats Trading, which provides routed transaction services for listed cash equities for BZX, BYX, EDGX and EDGA and listed equity options for BZX and EDGX.
In Europe, BATS Chi-XBats Europe operates both an MTF and RM under its RIE status. BATS Chi-XBats Europe operates two lit books, a periodic auctions book and two dark books on its MTF, and operates one lit book and one dark book on its RM. On these books we offer trading in listed cash equity securities from within 23 European indices and 15 major European markets, in addition to ETFs, exchange-traded commodities and international depositary receipts. With regard to FX, we operate separate New York and London area matching engines that offer access to trading in more than 60 currency pairs and gold and silver bullion. Our platforms are designed to facilitate price discovery by encouraging the quoting of competitive, lit prices but also offer opportunities to post dark
trading interest on our U.S. and European order books. We also operate a broker-dealer in Europe, Chi-X Europe Limited, which provides routed transaction services for listed cash equities within the European markets solely for BATS Chi-XBats Europe.
Our BATSBats Hotspot Platform offers an independent, transparent electronic marketplace structure where institutional buyers and sellers worldwide can trade FX directly, andeither anonymously or on a disclosed basis with each other.
For the nine monthsyear ended September 30,December 31, 2015, we had a 21.1% share of the overall U.S. equity market, a 22.4% share of the trading of ETPs and a 9.9%9.6% share of the U.S. equity options market. In Europe, for the nine monthsyear ended September 30,December 31, 2015, we had a 24.2%24.4% share of European trading in the securities available for trading on BATS Chi-XBats Europe. In addition, we had $27.8$25.8 billion ADNV in our Global FX segment from the BATSBats Hotspot Acquisition on March 13, 2015 to September 30,December 31, 2015. Globally, for the nine monthsyear ended September 30,December 31, 2015, we had an 11.5%11.1% share of the publicly reported institutional spot FX market.
For the two months ended February 29, 2016, we had a 21.4% share of the overall U.S. equity market, a 24.5% share of the trading of ETPs and a 10.2% share of the U.S. equity options market. For ETPs, during the two months ended February 29, 2016, we had 13 new listings, or 50.0% of all newly listed ETPs in the United States. We also had 69 total listings as of February 29, 2016, or 3.7% of all listings in the United States. In Europe, for the two months ended February 29, 2016, we had a 24.3% share of European trading in the securities available for trading on Bats Europe. In addition, for the two months ended February 29, 2016, we had $31.7 billion ADNV in our Global FX segment and 12.0% of the publicly reported institutional spot FX market.
Our revenue consists primarily of transaction fees, regulatory fees, market data fees and port fees. On a consolidated basis, our revenues less cost of revenues were $285.8$384.4 million for the nine monthsyear ended September 30,December 31, 2015, which represents a 27.7%25.0% increase from the $223.8$307.5 million generated for the nine monthsyear ended September 30,December 31, 2014. Non-transaction revenues were 55.3%55.4% of revenues less cost of revenues for the nine months ended September 30, 2015. On a consolidated basis, we generated $307.5 million in revenues less cost of revenues for the year ended December 31, 2014.2015. Adjusting for growth through acquisitions, our organic compound annual growth rate of revenues less cost of revenue for the last four years was 12.8%12.4%. For the nine monthsyear ended September 30,December 31, 2015, our Normalized EBITDA margin was 60.4%61.2%, an increase from 54.1%compared to 54.7% for the nine monthsyear ended September 30,December 31, 2014. We use the non-GAAP measure of Normalized EBITDA margin to measure our performance. Normalized EBITDA margin is a non-GAAP measure that is reconciled to net income in the section titled "Summary Historical and Pro Forma Financial and Operating Data."
The charts below show our share of the U.S. equity market, European equity market, U.S. equity options market and institutional spot FX market for the time periods shown:
BZX, BYX(1), EDGX and EDGA(2) Combined
Share of U.S. Equity Market by Quarter
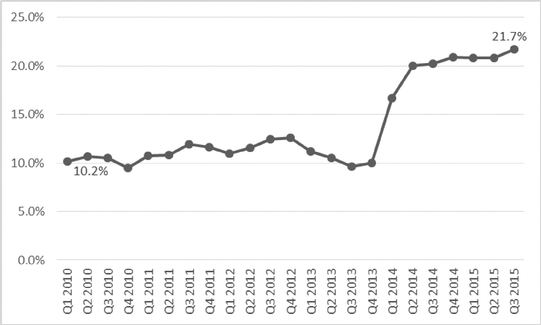
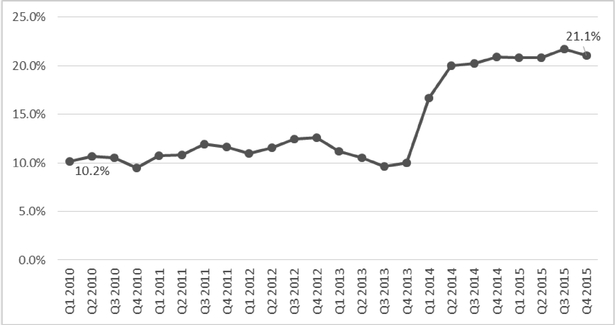
In connection with launching new markets, we have often offered pricing specials which may generate short-term losses, but generally result in significant growth in short- and long-term market share as customers have continued to use our markets even after pricing specials end. For example, we began trading listed cash equity securities and ETPs on BYX during the fourth quarter of 2010 using an inverted pricing model and did not lose market share in BZX as a result of the launch of BYX or when the inverted pricing model was reversed on BYX to provide positive net capture. With the Direct Edge Acquisition, we have implemented diverse pricing alternatives to attract a broader customer group and drive market share in our U.S. Equities segment. Our U.S. Equities market share increased from 18.9%19.4% for the nine monthsyear ended September 30,December 31, 2014 to 21.1% for the nine monthsyear ended September 30,December 31, 2015.
BATS Chi-XBats Europe(1)
Share of European Equity Market by Quarter
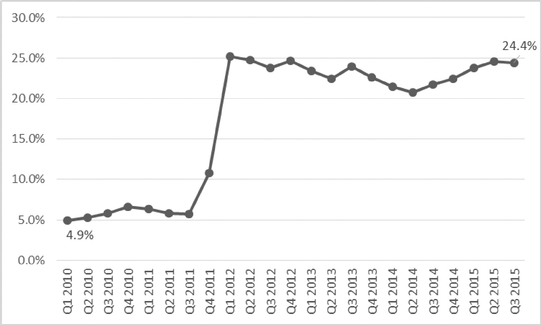
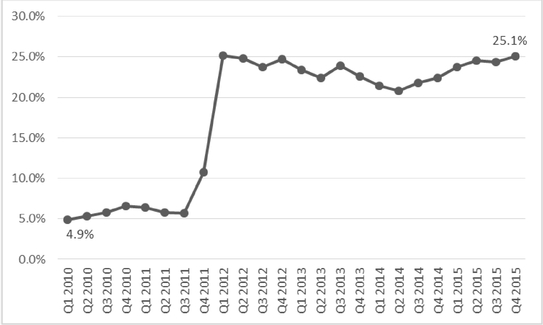
BZX and EDGX(1) Combined
Share of U.S. Equity Options Market by Quarter
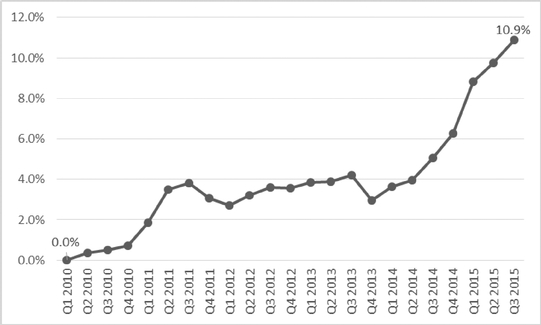
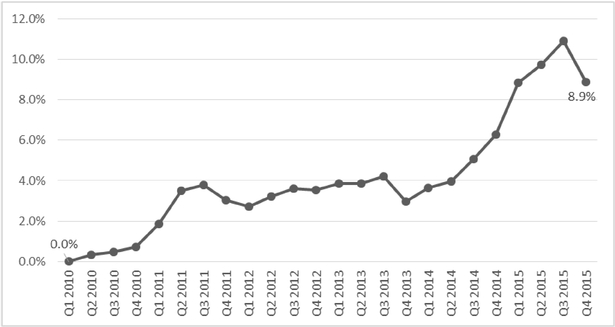
Our market share has significantly increased from the launch of our first options exchange in 2010 to the thirdfourth quarter of 2015. This was primarily a result of increased sales and business efforts, competitive pricing changes, strategic pricing of tiers, movement to a strategic data center and increased customer affinity. As a result of our increased market share, more customers hit our highest pricing tiers, and our net capture per touched contract has decreased from $0.049$0.046 per contract to $0.027$0.030 per contract for the three monthsyear ended September 30,December 31, 2014 and 2015, respectively.
Global FX(1)
Share of Institutional Spot FX Market by Quarter
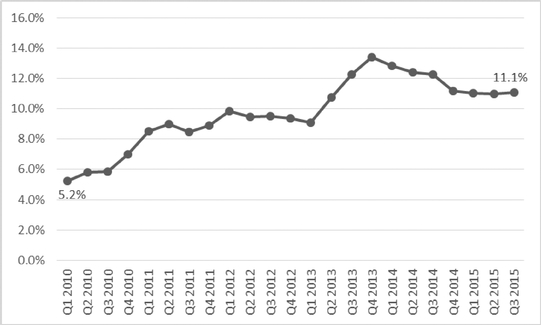
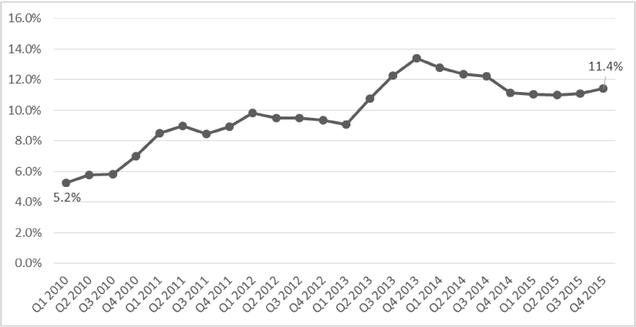
Our BATSBats Hotspot Platform offers an independent, transparent electronic marketplace structure where institutional buyers and sellers worldwide can trade FX directly and anonymously with each other. The BATSBats Hotspot Platform includes true price competition with full depth of book display, centralized price discovery and tailored liquidity solutions. BATSBats Hotspot's model provides full market transparency and greater control of the trading process, enabling better trade execution and lower execution costs. The BATSBats Hotspot Platform uses a price/time priorityprice-time-priority model. The BATSBats Hotspot Platform consists of a mixture of both firm and non-firm liquidity provided by both clients and dedicated liquidity providers and enables BATSBats Hotspot to offer its clients customized liquidity solutions. BATSBats Hotspot clients are charged either a flat or tiered commission rate based upon the notional amount traded on the BATSBats Hotspot Platform. These rates are expressed as U.S. dollars per million notional U.S. dollars traded. The flat commission rate or tiers applicable to each client are determined on a client by client basis by BATSBats Hotspot management and sales in light of market forces and client activity.
All of the BATSBats trading platforms deploy our proprietary technology designed to offer some of the fastest and most reliable trading systems available. They provide market participants with the ability to access, process, display and execute orders on each of our markets and were internally developed by our team of industry market structure and technology professionals with the goal of maximizing
efficiency and mitigating trade execution risk for market participants. Specifically, our securities platform provides access to, and a comprehensive display of, trading interest by market participants at the highest price at which a customer is willing to buy a security, or the best bid, and the lowest price at which a customer is willing to sell that security, or the best offer. In addition, our securities platform provides access to and the display of orders ranked in price/time priorityprice-time-priority at prices lower than the best bid and higher than the best offer. Also known as "depth of book," these orders reflect the size of displayed trading interest available at each successive price increment lower than the best bid and higher than the best offer. Our securities platform also offers opportunities to post dark trading interest on our U.S. and European lit integrated order books. These dark orders, which are often at prices better than the best displayed bids and offers, can provide price improvement to investors seeking to access our markets. Price improvement occurs, for example, when an investor submits an incoming order seeking to sell against the displayed best bid but instead executes against a hidden order that is willing to buy at a higher price than the highest displayed bid on the book. In addition, dark orders can also reduce the potential market impact to investors seeking to trade large orders by providing them the ability to enter those orders into the market without advertising such trading interest to others. Moreover, in Europe, we operate two dark books on our MTF and one dark book on our RM.
Our History
We were formed in 2005 as an alternative to the NYSE and the NASDAQ Stock Market, or NASDAQ, in response to increased consolidation among U.S. listed cash equity market centers. Since our founding, we have achieved the following milestones:
Our Trading Model
Like many of our competitors, we have adopted "maker-taker" and "taker-maker" pricing models in our markets instead of charging a transaction fee for each party to a trade. The maker-taker pricing model is designed to incentivize market makers to provide liquidity on a continuous basis. Participants are attracted to markets that have continuous, deep liquidity, which provides more opportunity to buy and sell equities immediately and with minimal adverse effect on prices. Because market makers supply a valuable service to markets by providing liquidity, maker-taker pricing rewards them with a rebate.
Under our maker-taker pricing model, on BZX (for both listed cash equity securities and listed equity options) and EDGX (for listed cash equity securities and listed equity options) and on certain order books of BATS Chi-XBats Europe, a customer posting an order on our book, which we refer to as the liquidity maker or liquidity provider, is paid a rebate for an execution occurring against that order, and a customer executing against an order resting on our book, which we refer to as the liquidity taker or liquidity remover, is charged a fee. We generate a substantial portion of our operating income from the difference between the maker rebate and the taker fee. We believe this type of fee schedule is attractive to customers who regularly provide liquidity. Although customers must pay a fee to access that liquidity, that fee is explicitly disclosed and charged to all customers.
The BYX and EDGA taker-maker pricing model provides that a liquidity taker will be paid a rebate for executing against an order resting on our book, and the liquidity provider will be charged a fee for posting such an order. In this case, we generate operating income from the difference between the maker fee and the taker rebate. Currently, both the fee and the rebate on each of BYX and EDGA are significantly less than the rebates and fees in place on BZX and EDGX. We believe this appeals to market participants who are primarily interested in the most cost-effective means of accessing resting liquidity, but less concerned about the depth of liquidity available on the market. In addition, we believe this model appeals to market participants trading lower-priced securities.
For unfilled orders, we also provide our customers a smart-order routing service, enabling the onward routing of unfilled orders to other market centers. In the United States, this is facilitated through an order routing facility, our wholly-owned broker-dealer subsidiary, BATSBats Trading. In Europe, BATS Chi-XBats Europe uses a similar approach through its broker-dealer subsidiary, Chi-X Europe Limited, and is one of the few market centers in Europe that provides such routing services to its customers. All orders routed away from BZX, BYX, EDGX and EDGA are sent to BATSBats Trading for routing, which may, in turn, use a third-party broker-dealer to establish back-up connectivity to another exchange in the event that BATSBats Trading's connection to such exchange fails, because BATSBats Trading does not have a direct connection to such exchange or to take advantage of tiered pricing rates at such exchange. We rely on Bank of America Merrill Lynch, Citigroup and affiliates of Citigroup, Morgan Stanley, Credit Suisse and Lime Brokerage, each of which is an affiliate of one of our principal investors, to route orders that are not routed directly by BATSBats Trading. Once BATSBats Trading (or such third-party broker-dealer) fills an order on another market, it sends the executed trade to a clearing broker to match the details of the trade with the clearing broker for the other party to the trade. We rely on Wedbush Securities and Morgan Stanley, both of which are affiliates of our principal investors and members of NSCC, to clear trades in U.S. listed cash equity securities routed by us to other markets; and we rely on Bank of America Merrill Lynch and Wedbush Securities, also affiliates of principal investors and clearing members of the OCC, to clear trades in U.S. listed equity options that
we route to other markets. On the settlement date of the trade, our clearing broker will deliver or receive the matched amount of securities or funds to settle the trade with the other party to the trade.
In addition, in the United States, we derive a substantial portion of our revenue from market data fees from U.S. tape plans, including UTP, CTA, CQS and the OPRA. Fees, net of plan costs, from
UTP, CTA and CQS are allocated and distributed to plan participants like us according to their share of tape fees based on a formula, required by Regulation NMS, which takes into account both trading and quoting activity.
Our Listing Model
BZX and BATS Chi-XBats Europe serve as listing destinations for ETPs. As of September 30,December 31, 2015, BZX had 3556 listings and BATS Chi-XBats Europe had nine listings. In October 2015, we launched on BZX an innovativea market-leading pricing model for issuers called the BATSBats ETP Issuer Incentive Program, as part of the unveiling of the BATSBats ETF Marketplace. Under the traditional model issuers pay an application fee as well as an annual listings fee to an exchange for the listing of each security and the annual listing fee increases as the product grows (as measured by total shares outstanding). When listing on BZX, issuers pay no application fee and no annual fee for listing. Instead, under the BATSBats ETP Issuer Incentive Program, BZX pays the issuer an annual incentive for each security it lists on BZX, and the amount BZX pays increases as the product grows (as measured by CADV), from $3,000 per year up to $400,000 per year. The payments made under the BATSBats ETP Issuer Incentive Program are funded by the increased trading fees BZX receives as the issuer's ADV increases. BZX shares that revenue directly with the issuer in form of an annual rebate.
Both BZX and BATS Chi-XBats Europe also offer issuers the choice of a more traditional market maker program referred to as the BATSBats LMM program on BZX and the BATS Chi-XBats Europe Liquidity Provider Program, or LPP on BATS Chi-XBats Europe. Under the LMM program, a single market marker is selected by the issuer to be its LMM on BZX. The LMM has certain quoting obligations that it must adhere to and BZX pays the LMM an enhanced rebate for executions against its displayed orders in the issuer's security and charges a reduced fee when the LMM executes against other orders in the issuer's security on the BZX book. Under the LPP, BATS Chi-XBats Europe offers two programs designed for participants that wish to provide liquidity by posting and maintaining executable quotes within certain set parameters with the result of providing liquidity on a regular and ongoing basis. The main differences between the two programs relate to the specified price and required time commitments. The minimum term requirement is 30 days. No additional fees or rebates apply to the LPP. BATS Chi-XBats Europe also offers a competitive liquidity program, which is a rebate-based scheme designed to encourage quoting activity and therefore increase liquidity in issuer-sponsored ETFs on BATS'Bats' RM.
Both BZX and BATS Chi-XBats Europe also offer an innovative market maker program for their listed securities, called the CLP program. The CLP program is a supplemental, rewards-based program designed to encourage quoting competition among market makers in securities listed on BZX or BATS Chi-XBats Europe. On both BZX and BATS Chi-XBats Europe the CLP program is funded by the issuer. On BZX, the issuer can choose to fund the CLP program in an annual amount between $5,000 and $100,000; on BATS Chi-XBats Europe, the issuer can choose to fund the CLP program in any amount. The CLP program provides a daily reward to the two or three market makers (depending on the annual amount the issuer commits to the CLP program) quoting the greatest size throughout the trading day at the NBBO. The total daily reward divided between the market makers in each security on BZX ranges between approximately $20 and $400, depending on the annual amount the issuer commits to the CLP program, and on BATS Chi-XBats Europe the total daily reward generally ranges between €100 and €300.
Industry Overview
Market Structure and Regulatory Developments
U.S. Listed Cash Equity Securities
Several regulatory developments, together with innovations in technology and improvements in the speed of communication, have fundamentally changed the way U.S. listed cash equity markets operate over the last 20 years. In 1996, the SEC adopted the "order handling" rules which facilitated the growth of ECNs as alternatives to national securities exchanges for displaying and executing orders.
Under the order handling rules, a market maker may pass an order to an ECN for public display and execution. This "ECN display alternative" provided the basis for ECNs to be viable competitors to national securities exchanges for displaying and executing orders.
In 1998, the SEC adopted Rule 3b-16 and Regulation ATS under the Exchange Act. Rule 3b-16 defines the circumstances under which an ATS constitutes a securities exchange requiring registration, and Regulation ATS provides an exemption from exchange registration for ATSs that comply with certain conditions. After the adoption of Regulation ATS, trading venues like our original ECN were provided the choice of registering as a national securities exchange or an ATS.
Beginning in 2000, the SEC also required trading venues posting to the consolidated tape to move to decimal pricing, or the quoting of stock prices in dollars and cents rather than in dollars and fractions of a dollar. Decimal pricing resulted in narrower trading spreads, providing automated market makers with an advantage over traditional market makers.
Furthermore, the SEC adopted Regulation NMS in 2005 to protect the quality of trade executions. Regulation NMS provides price protection for each exchange's best displayed quotes that are electronically accessible for immediate trade execution and resulted in a dramatic shift to electronic trading as exchanges automated their trading systems to take advantage of this price protection. See "Regulation."
In addition, the SEC published a concept release in early 2010 that focused on equity market structure,structure; in 2012, the SEC adopted a rule requiring FINRA and the national securities exchanges to create a CAT,CAT; and in 2015, the SEC formed an Equity Market Structure Advisory Committee of industry experts to advise the SEC on possible regulatory changes. See "Regulation—Recent Developments."
European Listed Cash Equity Securities
As in the United States, the market for listed cash equities in Europe has changed in response to both regulatory and technological developments. In particular, MiFID marked a fundamental change in the European market for trading listed cash equity securities. To create competition among markets, MiFID abolished the "concentration rule," which required firms to route orders only to national stock exchanges, and extended the concept of "passporting," which allows firms authorized to carry on business in one EEA member state to carry on business in other EEA member states. Abolition of the concentration rule and the extension of passporting paved the way for new entrants to compete against other national stock exchanges from a single location within the European Union. For example, the LSE, which represented 99.5% of on-order book, on-exchange trading in LSE-listed cash equity securities for 2007, has seen its share of on-order book trading in LSE-listed cash equity securities decline to between 50-60%40%-50% for the nine monthsyear ended September 30,December 31, 2015 and its overall share in European cash equity securities was approximately 19.2%18.9% for the nine monthsyear ended September 30,December 31, 2015.
MiFID is currently in the process of being updated. The new legislation, known as MiFID II and MiFIR, is currently scheduled to apply from January 3, 2017, although there is a potentialproposal for a delay until January 2018, and will generally tighten the requirements placed on both exchanges and
investment firms. In particular, use of certain waivers from pre-trade transparency will be capped as a percentage of total market volume and a general trading obligation will require almost all equity trades to be conducted on a duly registered trading venue. Furthermore, MiFID II will apply mandatory, equity-like transparency requirements to non-equity markets, such as fixed income.
U.S. Listed Equity Options
The market for listed equity options, which includes index and multi-listed options, is part of a large and growing global derivatives industry. In general, derivatives trade either through a national securities exchange, another execution facility or OTC (depending on the derivative). One of the most fundamental differences between the U.S. listed cash equities market and the U.S. listed equity options
market is that while listed cash equities trading can be conducted "off-exchange," all U.S. listed equity options trading must take place "on-exchange." As of September 30, 2015,the date of this prospectus, there were thirteenfourteen authorized U.S. options exchanges and(not including a fourteenth currentlysecond U.S. options exchange of Miami International Holdings, Inc., planned for launch in the third quarter of 2016, pending approval.SEC approval).
The most significant changes within the U.S. listed equity options market have been the move to penny-increment price quotes for many options and the shift away from the traditional pricing model, pursuant to which both sides pay a fee, for executing trades. In January 2007, prices for options on several different stocks and ETFs began to be quoted in penny increments as part of an industry-wide pilot program approved by the SEC, called the penny pilot. Additional options classes have been added over time to the penny pilot since the initial rollout. For the month of SeptemberDecember 2015, approximately 72.9%71% of options volume traded in penny increments. The conversion of the U.S. listed equity options market from nickel- or dime-increment price quotes to penny-increment price quotes has contributed to significant growth in overall options market volume as the industry expanded from a total volume of 1.8 billion contracts in 2006 to 16.316.1 billion in 2015.
We began trading listed equity options on BZX in February 2010 and leveraged our experience in the U.S. listed cash equities market to capitalize on these industry developments, and had a 10.9%an 8.9% market share for the thirdfourth quarter of 2015. We began trading listed equity options on EDGX in November 2015.
The U.S. multi-listed options volume can be segregated into three segments: pro-rata; price-time; and complex orders. In a pro-rata model, customer orders are traded before non-customer orders resting at the same price, and non-customer orders are allocated based on their size. In a price-time model, all resting orders at the same price are allocated according to their time of arrival. Complex orders allow trading of multi-leg options strategies such as spread, straddles and covered calls. As shown in the graph below, from August 2015 through December 2015, we believe that 28% of the total U.S. multi-listed options volume traded with price-time allocation, 43% of the total U.S. multi-listed options volume traded with pro-rata allocation model and 29% of the total U.S. multi-listed options volume traded as complex orders. Auction orders comprise a significant percentage of the pro-rata volume.
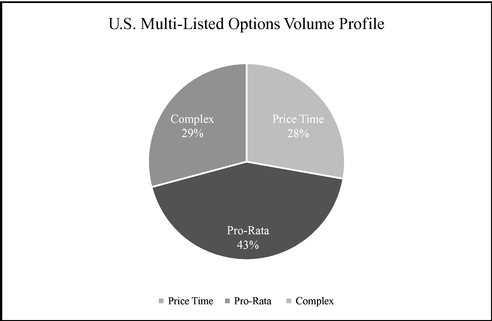
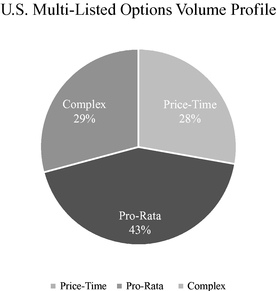
Source: Trade Alert, OPRA data, August 2015-December 2015
BZX Options currently only competes with exchanges operating with a price-time model. Based on the data above, BZX Options operated the largest exchange with a price-time model, with a market share of the U.S. multi-listed options price-time volume was 39% for the period from August 2015 through December 2015. Our newly launched options
exchange, EDGX Options, is designed to compete with exchanges operating with a pro-rata allocation model. In addition, we plan to offer auctions and complex orders in the future to compete for all U.S. options volumes.
Global FX
While the global institutional spot FX market remains largely unregulated, the enactment of Dodd-Frank and its related regulations in the United States. and the ongoing implementation of MiFID II and MiFIR in Europe have impacted the regulatory landscape for currency derivative products. For example, certain standardized currency derivative products are expected to be required to trade on an organized trading venue such as an SEF or DCM in the United States or on an MTF or OTF in Europe. Trading on these venues has also been enabled by technological developments that facilitate the electronic trading of spot FX and currency derivatives. Moreover, this movement is highlighted by the recent publication of the Fair and Effective Markets Review Final Report and the March 2015 Global Preamble: Codes of Best Market Practice and Shared Global Principles, which may lead to additional oversight and regulation in the global FX market.
Competitive Dynamics
U.S. Listed Cash Equity Securities
Market participants now have multiple venues for the execution of orders. Although many of the initial ATSs and ECNs were absorbed or acquired by competing exchanges, a number of other off-exchange venues developed, including "dark pools." Dark pools appeal to participants that wish to minimize the market impact of their orders. However, dark pools generally have higher clearing costs than national securities exchanges and, like ATSs and ECNs, are not eligible to share directly in proceeds of the sale of consolidated market data. Examples of dark pools include crossing networks such as Liquidnet and internal matching engines belonging to individual broker-dealers. By matching a trade internally rather than submitting the trade to an exchange, a broker-dealer can retain more of the spread. The increase in volume of off-exchange trades is shown in the table below by the increase in
trades reported to the trade reporting facilities, which report all off-exchange trades as required by FINRA regulations.
The table below shows the relative market share of the U.S. listed cash equities market of each of the following group of trading venues in 2010 compared to the nine monthsyear ended September 30,December 31, 2015:
| | Nine Months Ended September 30, 2015 | Year Ended December 31, 2010 | Increase/ (Decrease) | Year Ended December 31, 2015 | Year Ended December 31, 2010 | Increase/ (Decrease) | ||||||||||||||
|---|---|---|---|---|---|---|---|---|---|---|---|---|---|---|---|---|---|---|---|---|
BATS | 21.1 | % | 15.3 | %(1) | 5.8 | % | ||||||||||||||
Bats | 21.1 | % | 15.3 | %(1) | 5.8 | % | ||||||||||||||
NYSE | 24.0 | % | 27.7 | % | (3.7 | )% | 24.1 | % | 27.7 | % | (3.6 | )% | ||||||||
NASDAQ | 19.0 | % | 22.1 | % | (3.1 | )% | 18.8 | % | 22.1 | % | (3.3 | )% | ||||||||
FINRA Trade Reporting Facility | 35.3 | % | 33.9 | % | 1.4 | % | 35.4 | % | 33.9 | % | 1.5 | % | ||||||||
Other | 0.6 | % | 1.0 | % | (0.4 | )% | 0.6 | % | 1.0 | % | (0.4 | )% | ||||||||
European Listed Cash Equity Securities
The market for execution services in Europe has become significantly more competitive following the introduction of MiFID. We expect that competition in pan-European trading will continue to increase in the near term, though MiFID II and MiFIR will place more onerous conditions on trading venues and investment firms and restrict certain types of trading activity.
The table below shows the relative market share of the European listed cash equities market of each of the following trading venues in 2011 compared to the nine monthsyear ended September 30,December 31, 2015:
| | Nine Months Ended September 30, 2015 | Year Ended December 31, 2011 | Increase/ (Decrease) | Year Ended December 31, 2015 | Year Ended December 31, 2011 | Increase/ (Decrease) | ||||||||||||||
|---|---|---|---|---|---|---|---|---|---|---|---|---|---|---|---|---|---|---|---|---|
BATS Chi-X Europe | 24.2 | % | 24.2% | (1) | — | |||||||||||||||
Bats Europe | 24.4 | % | 24.2% | (1) | 0.2 | % | ||||||||||||||
LSE and Borsa Italiana | 19.2 | % | 20.2 | % | (1.0 | )% | 18.9 | % | 20.2 | % | (1.3 | )% | ||||||||
Euronext | 14.7 | % | 15.9 | % | (1.2 | )% | 14.7 | % | 15.9 | % | (1.2 | )% | ||||||||
Xetra and Deutsche Börse(2) | 10.2 | % | 12.7 | % | (2.5 | )% | 10.2 | % | 12.7 | % | (2.5 | )% | ||||||||
Turquoise | 9.1 | % | 5.1 | % | 4.0 | % | 9.0 | % | 5.1 | % | 3.9 | % | ||||||||
SIX Swiss Exchange | 6.8 | % | 6.1 | % | 0.7 | % | 6.8 | % | 6.1 | % | 0.7 | % | ||||||||
NASDAQ OMX | 5.5 | % | 6.0 | % | (0.5 | )% | 5.5 | % | 6.0 | % | (0.5 | )% | ||||||||
Bolsa de Madrid | 4.2 | % | 5.7 | % | (1.5 | )% | 4.2 | % | 5.7 | % | (1.5 | )% | ||||||||
Other | 6.1 | % | 4.1 | % | 2.0 | % | 6.3 | % | 4.1 | % | 2.2 | % | ||||||||
Source: | Data internally compiled by us utilizing direct feeds from European trading venues and third-party market data vendors. |
U.S. Listed Equity Options
The market for the trading of U.S. listed equity options is intensely competitive and is in the midst of significant evolution, driven primarily by the recent regulatory changes discussed above, acquisitions of options exchanges by cash equities exchanges and the recent authorization by the SEC of several new options exchanges. For example, in November 2015, we launched our second options exchange, EDGX Options, and ISE intends to launchlaunched a third options exchange, referred to as ISE Mercury, in the near future, pending regulatory approval.February 2016. Today, several U.S. cash equity exchanges operate at least one options market that utilizes maker-taker pricing. As a result of these changes, the U.S. options market is beginning to look more like the U.S. listed cash equity securities market.
The table below shows the relative market share of the U.S. listed equity options market of each of the following trading venues in 2011 compared to the nine monthsyear ended September 30,December 31, 2015:
| | Nine Months Ended September 30, 2015 | Year Ended December 31, 2011 | Increase/ (Decrease) | Year Ended December 31, 2015 | Year Ended December 31, 2011 | Increase/ (Decrease) | ||||||||||||||
|---|---|---|---|---|---|---|---|---|---|---|---|---|---|---|---|---|---|---|---|---|
BATS | 9.9 | % | 3.0 | % | 6.9 | % | ||||||||||||||
Bats | 9.6 | % | 3.0 | % | 6.6 | % | ||||||||||||||
NASDAQ | 24.4 | % | 26.3 | % | (1.9 | )% | 24.2 | % | 26.3 | % | (2.1 | )% | ||||||||
CBOE | 22.2 | % | 26.0 | % | (3.8 | )% | 23.5 | % | 26.0 | % | (2.5 | )% | ||||||||
NYSE | 18.3 | % | 24.6 | % | (6.3 | )% | 18.2 | % | 24.6 | % | (6.4 | )% | ||||||||
ISE | 15.7 | % | 17.1 | % | (1.4 | )% | 15.3 | % | 17.1 | % | (1.8 | )% | ||||||||
Boston Options Exchange | 2.9 | % | 3.0 | % | (0.1 | )% | 2.7 | % | 3.0 | % | (0.3 | )% | ||||||||
Miami Stock Exchange | 6.6 | % | — | 6.6 | % | 6.5 | % | — | 6.5 | % | ||||||||||
Source: | Data as published by OCC. |
Global FX
The institutional spot FX market is fragmented and highly competitive, with transparent automated marketplaces such as BATSBats Hotspot challenging ICAP plc (Electronic Booking System)(EBS BrokerTec) and Thomson Reuters (Reuters Matching, FXall). While the institutional spot FX market recently has been experiencing a shift from other competing interbank platforms to ECNs, the electronification of institutional spot FX may encounter resistance from clients that still prefer to utilize the phone, Reuters Conversational Dealing, Instant Bloomberg Chat, Bloomberg terminals and key banking relationships for price discovery and trading. Furthermore, electronification of FX appears to be experiencing more resistance outside the U.S. The electronic FX market is also intensely competitive, with ICAP plc (Electronic Booking System)(EBS BrokerTec), Thomson Reuters (Reuters Matching, FXall), State Street (Currenex, FX Connect, CME Group, Currenex, 360T,Connect), Deutsche Börse (360T), Bloomberg, FastMatch, Gain GTX, CME Group and others competing for market share. Additionally, exchange operators are actively expanding into the global FX market. For example, Deutsche Börse has recently completed its acquisition of 360T and NASDAQ has announced its plans to launch an FX trading market.360T. Moreover, the current market may experience consolidation, such as the recent acquisition of Molten Markets by ICAP plc (Electronic Booking System)(EBS BrokerTec).
The table below shows the relative market share of the publicly reporting trading venues in 2010 compared to the nine monthsyear ended September 30,December 31, 2015:
| | Nine Months Ended September 30, 2015 | Year Ended December 31, 2010 | Increase/ (Decrease) | Year Ended December 31, 2015 | Year Ended December 31, 2010 | Increase/ (Decrease) | ||||||||||||||
|---|---|---|---|---|---|---|---|---|---|---|---|---|---|---|---|---|---|---|---|---|
BATS Hotspot(1) | 11.5 | % | 6.0 | % | 5.4 | % | ||||||||||||||
Bats Hotspot(1) | 11.1 | % | 6.0 | % | 5.1 | % | ||||||||||||||
EBS | 39.8 | % | 49.0 | % | (9.2 | )% | 39.4 | % | 49.0 | % | (9.6 | )% | ||||||||
Thomson Reuters | 46.0 | % | 45.0 | % | 1.0 | % | 46.0 | % | 45.0 | % | 1.0 | % | ||||||||
Fastmatch | 2.7 | % | 0.0 | % | 2.7 | % | 3.5 | % | 0.0 | % | 3.5 | % | ||||||||
Source: | Data internally compiled by us utilizing publicly reporting institutional spot FX venues. |
Our Competitive Strengths
As a result of these industry developments, newer trading centers like ours are better able to compete against competing exchanges based on technology, price and customer experience. We believe that the following competitive strengths position us well to capitalize on these industry dynamics:
of our attractive market positions, the quality of our markets and the expertise of our teams have enabled us to grow our market share across our markets over the last four years.
maintaining substantially lower fixed costs. This scalability and our low cost structure have driven our Normalized EBITDA marginsmargin to 60.4%61.2% for the nine monthsyear ended September 30,December 31, 2015, which is up 6.3 percentage points fromcompared to 54.7% for the nine monthsyear ended September 30,December 31, 2014. Along with the substantial amount of non-transactional revenue we generate, our operating leverage provides us with opportunities to continuously improve our operating margins and generate significant operating cash flows.
approval, began trading listed equity options within eight months of receiving board approval and launched our first ETF listings within three months of receiving final approval from the Securities and Exchange Commission, or the SEC; and
community's unique needs, competitive rates and a general advocacy and support for retail investors.
Our Growth Strategies
We believe that we are well positioned to leverage our competitive strengths to enhance our market position, develop new products and services and continue expanding into new asset classes and geographies. We continually analyze new opportunities and, in particular, intend to pursue the following growth strategies:
encourage ETP trading to migrate from the more opaque OTC market to regulated exchange markets like BATS Chi-XBats Europe. We also expect continued global industry expansion in ETP launches, trading volumes and assets, which we hope will create additional opportunities for us to serve issuers, liquidity providers and investors.
Our Markets
U.S. Equity MarketNine MonthsYear Ended September 30,December 31, 2015
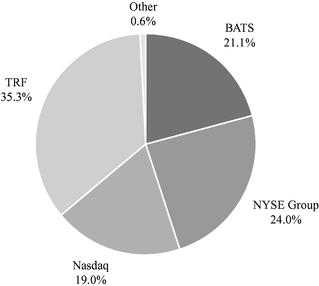
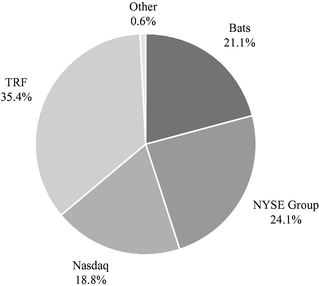
Source: | Data as published through the UTP Plan and CTA Plan feeds. |
The notional value of ETP volume traded in the U.S. is significant and has generally been increasing during the last two years and into the first quarter of 2016.
U.S. ETP Notional Value as a Percentage of U.S. Equity Notional Value 2014-2015
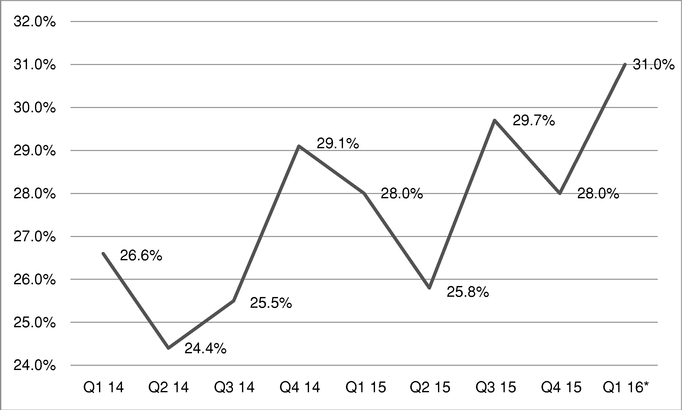
* through March 23, 2016. | ||
Source: | Bloomberg, L.P. | |
As the largest venue for ETP trading, we believe we are well positioned to take advantage of this trend as more volume gravitates to ETPs.
U.S. ETP Market
The Period July 1, 2015 through December 31, 2015
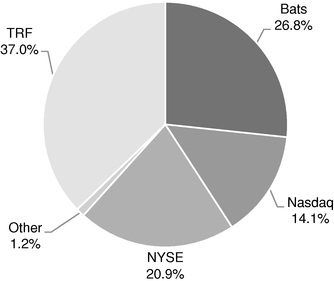
Source: | Data as published through the UTP Plan and CTA Plan feeds. |
European Equity MarketNine MonthsYear Ended September 30,December 31, 2015
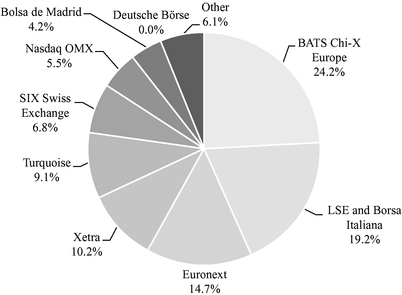
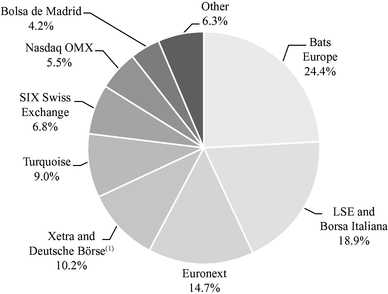
Source: | Data internally compiled by us utilizing direct feeds from European trading venues and third-party market data vendors. Data excludes OTC trades. |
U.S. Equity Options MarketNine MonthsYear Ended September 30,December 31, 2015
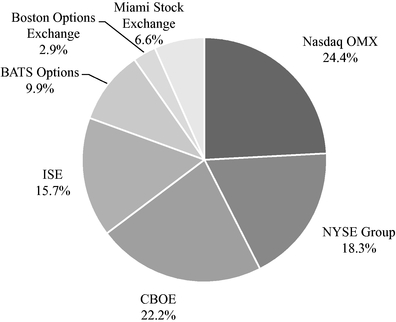
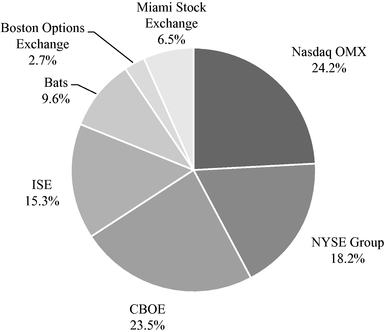
Source: | Data as published by OPRA. |
rate or tiers applicable to each client are determined on a client by client basis by BATSBats Hotspot management and sales in light of market forces and client activity.
Global FX MarketNine MonthsYear Ended September 30,December 31, 2015
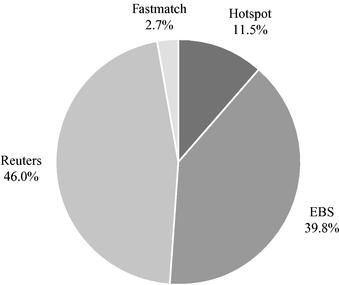
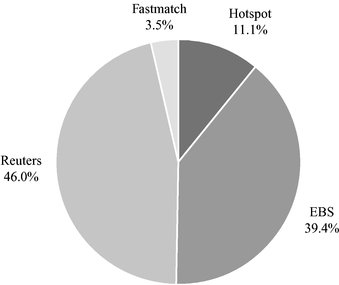
Source: | Data internally compiled by us utilizing publicly reporting spot FX venues. |
Marketing
Our marketing strategy is focused primarily on educating market participants about our value proposition and raising brand awareness through selected media. Through our website and targeted communications aimed at reaching current and potential customers, as well as our presence at industry trade shows and participation in industry forums, we focus on educating customers about the changing dynamics of our industry and the benefits of using our markets.
This is often accomplished through our senior executives via conversations with the media and appearances at major industry events. We are also focused on raising brand awareness through our sponsorship of a major league baseball team, the Kansas City Royals. We believe enhancing brand awareness within the financial community and among current and potential customers is an important part of our marketing effort.
We also developed and now publish a market volume page on our website that provides extensive detail about trading volume on the various execution venues in the United States and Europe. We believe that our market volume pages have become an important resource for market participants to track execution volumes across trading venues and, as a result, have enhanced our brand awareness. In addition, in October 2015, we launched The BATSBats ETF Marketplace, specifically structured and designed for ETF issuers and their investors. The BATSBats ETF Marketplace provides market participants with unique ETF market data and analytics, information on issuers with ETPs listed on BZX and valuable information about issuer and market maker incentive programs offered for ETPs listed on BZX.
Technology
The technology powering our matching engine and our smart-order routing service was created in-house, is wholly-owned and maintained by BATSBats and supports trading on all of our markets. As
demonstrated by our rapid entry into European listed cash equities and U.S. listed equity options trading, our technology platform is extremely adaptable to new geographies and asset classes within a short period of time.
book information or hidden or routed orders) but, in doing so, offers a significant reduction in required bandwidth and processing. In addition, we offer a Last Sale Feed, which is a real-time, intra-day feed that disseminates matched trade price, volume and execution time on our book, and our Historical Data, which allows customers to access our historical PITCH, TOP and Last Sale Data feeds through our website or on a drive that we provide. In June 2015, we began offering the BATSBats One market data feed in the United States, which provides a consolidated view of aggregate quoting activity and transactions on all four of our U.S. listed equity exchanges. BATS Chi-XBats Europe provides clients access to market data either through a network of data vendors or direct from the Exchange. Direct connectivity to BATS Chi-XBats Europe can be via the internet or through physical connection and is fee liable. BATS Chi-XBats Europe market data consists of data from the BXE, CXE lit and dark order books and the Trade Reporting Facility, or TRF. Both on book and OTC trades are published using the standardized Market Model Typology, or MMT, codification. Data provided direct from the Exchange is depth of book with the data in either the Multicast PITCH or TCP PITCH format. Historical Data can be accessed through the website or on a drive that BATS Chi-XBats Europe provides. BATS Chi-XBats Europe introduced market data fees for distribution, display and non-display usage in October 2012.
In the United States, our primary trading and order routing platform operates out of two separate data centers, one as a primary data center in Secaucus, New Jersey and the other as a geographically diverse back-up data center in Chicago, Illinois. Each operates on a separate electrical grid and water supply system and is owned and operated by a different company. We have tested our back-up trading center under live trading conditions and we believe that we would be able to quickly initiate trading out of our back-up data center in the event of an outage at our primary data center. We believe that our recovery time in the event of an outage is comparable to or better than that of our competitors. In fact, on September 26, 2013, we switched BYX to Chicago intraday without issue. We regularly test our data center recovery scripts and periodically carry out weekend tests where we invoke our back-up data center, as well as an annual test with our U.S. trading participants and simulated orders.
In Europe, our primary data center is in Slough, England. Our back-up data center is at Park Royal, London, England, which is over 15 miles away from the primary data center. The back-up data center runs live processes and is continually monitored to ensure availability. We regularly test our data center recovery scripts and periodically carry out weekend tests where we invoke our back-up data center, as well as an annual test with our European trading participants and simulated orders.
To ensure business continuity of operations in the United States, BATSBats has a business continuity office space in Kansas City, Missouri, where key operations personnel report to operate the U.S. markets one day each month. Starting in 2013, on a semiannual basis, the Kansas City headquarters has been taken completely offline for an entire trading day, and all BATSBats associates in Kansas City report to the business continuity office to ensure readiness. We have a similar business continuity office in the London area which we test on a live trading day semiannually as we do in the United States.
Our Customers
Our equities and options customers in the United States include members of BZX, BYX, EDGX and EDGA, which are SEC-registered broker-dealers, and the sponsored access clients of those broker-dealers. Similarly, our equities customers in Europe are FCA-registered brokerage firm participants of BATS Chi-XBats Europe, as well as sponsored access clients of these brokerage firms and certain unregistered direct access participants. Our institutional spot FX customers include banks, broker-dealers, institutions, hedge funds, asset managers, proprietary trading firms, Commodity Trading Advisors and corporates. In the United States as of September 30,December 31, 2015, we had 188180 members of BZX, 140139 members of BYX, 123 members of EDGX and 130 members of EDGA. BATS Chi-XBats Europe has approximately 184 participants from 17 countries. BATSBats Hotspot has 174181 clients from around the world.
As mentioned above, various affiliates of our principal investors are significant customers. For the nine months ended September 30, 2015 and the years ended December 31, 2015, 2014 and 2013, approximately 45.1%, 43.2%, and 2012, approximately 46.7%, 49.0%, 46.6% and 45.7%36.3% of our total transaction fees, respectively, were generated by affiliates of our principal investors. For the nine months ended September 30, 2015 and the years ended December 31, 2015, 2014 and 2013, approximately 52.2%, 51.5% and 2012, approximately 52.4%, 54.8%, 53.4% and 52.8%50.8% of total liquidity payments, respectively, were generated by affiliates of our principal investors. For a description of revenues received and payments made to these affiliates, see "Certain Relationships and Related Transactions." For the nine months ended September 30, 2015 and the years ended December 31, 2015 and 2014, 2013 and 2012, approximatelynone of our principal investors accounted for more than 10%, 9%, 12% and 10%, respectively, of total liquidity payments were paid to an affiliate of one ofrebates paid. For the year ended December 31, 2013, our principal investors.investor accounted for 11% of total liquidity rebates paid. Affiliates of our principal investors also make up a significant portion of the volume traded on our equities trading platform. For example, for the nine monthsyear ended September 30,December 31, 2015, affiliates of all thirteen strategic investors ranked in the top 25 of all members trading on our U.S. equities trading platform (based on volume), with their trades representing 55.7%45.8% of the total volume traded for the quarter ended September 30,December 31, 2015.
For the nine months ended September 30, 2015 and the years ended December 31, 2015, 2014 and 2013, one customer accounted for 10%11%, 12% and 10%, respectively, of our transaction fees. For the year ended December 31, 2012, no customer accounted for more than 10% of our transaction fees.
Intellectual Property
We own, have filed applications for or have licensed from third parties rights to trade names, trademarks, community trademarks, domain names and service marks that we use in conjunction with our operation and services. We have registered, or have filed applications pending registration for, many of our most important trademarks in the United States and in the United Kingdom, including, for example, "BATS,"Bats," "BATS"Bats Global Markets," "Making Markets Better," "BATS"Bats Trading, Inc." "BYX," "BZX," "EDGA," "EDGX," and "Hotspot FX".
We own patents covering our proprietary business processes related to the BATSBats 1000 Index and our proprietary business processes related to our now defunct European market-on-close product, and we have filed patent applications covering our NBBO Setter and Joiner pricing, our auction processes
associated with our primary listings business, the business process related to operating an exchange based on the net asset value of an ETP, our CLP Program and our RPI Program. See "Risk Factors—Risks Relating to Our Business—Our inability to protect our intellectual property rights and claims by others that we infringe their intellectual property rights could adversely affect our business" for a discussion of the risk factors associated with our intellectual property.
Competition
The market for execution services is intensely competitive in the asset classes and geographies in which we operate. See "Risk Factors—Risks Relating to Our Business—We face intense competition and compete with a broad range of market participants globally. Further consolidation and alliances among our securities trading competitors could impair our competitive position."
Securities market participants now have multiple venues for the execution of orders. In addition to national securities exchanges, in the United States, these venues include numerous ATSs, many of which operate as "dark pools" owned by our principal investors and broker-dealers who internalize orders for execution. In Europe, these alternate venues include MTFs that operate "lit" books and/or "dark pools," broker crossing networks and other broker-dealers who internalize orders for execution.
We compete in the U.S. listed cash equity securities market against Intercontinental Exchange's NYSE, NASDAQ, other regional exchanges and several ATSs. In Europe, our major competitors include LSE, Turquoise, Euronext, Deutsche Börse, NASDAQ OMX, SIX Swiss Exchange and BME. We compete in the United States in listed equity options against CBOE, NYSE, NASDAQ, ISE, MIAX and BOX. We compete in the institutional spot FX market against EBS, Reuters Matching, FXall, FX Connect, CME Group, Currenex, 360T, Bloomberg, FastMatch and Gain GTX, among others.
We face competition based on technology, customer experience and price. We also face competition based on products and services offered, such as order types and risk management tools. We believe that we compete favorably with respect to these factors. However, many of our current and potential competitors are more established and substantially larger than we are, and have a substantially greater market presence, as well as greater financial, technical, marketing and other resources. In addition, many of our competitors have broader name recognition, offer a wider range of services and products and have a larger customer base than we do. Some of them may be able to respond more quickly to new or evolving opportunities, technologies and customer requirements than we can and may be able to undertake more extensive promotional activities.
Corporate Culture and Employees
We pride ourselves on fostering a corporate culture that encourages our employees to work together to meet our corporate goals and to be active participants in the community. As a result, we actively encourage teamwork in part through our compensation structure, which entitles all employees to quarterly bonuses if we meet certain corporate goals, and in part through less formal practices, such as our weekly all-staff meetings during which our employees are kept informed of recent business and regulatory developments and priorities. Moreover, we believe that people are attracted to organizations that focus on more than just financial incentives. As a result, we fully support our employees' pursuit of community and charitable causes, including through paid leave for community service, a corporate charity matching program and a wellness program. In addition, we are a strong believer in the importance of good corporate citizenship and support a variety of charitable causes.
As of September 30,December 31, 2015, we employed 284286 employees 212globally, 211 of whom are based in the United States, 7073 of whom are located in London, and two of whom are located in Singapore. None of
our employees is subject to a collective bargaining agreement. Overall, we consider our relations with our employees to be good.
Facilities
Our principal office is located at 8050 Marshall Drive, Lenexa, Kansas, where we lease approximately 39,000 square feet of space. The lease on this space expires in February 2025 and contains two five-year renewal options, as well as a one-time option to terminate in November 2019 if certain contingencies under the lease are met. We have an office located at 17 State Street, New York, New York, where we lease approximately 21,000 square feet of space, which expires in April 2024. We have an office at 200 S. Wacker Drive, Chicago, Illinois, where we lease approximately 200 square feet of space, which expires in June 2016. We have an office located at 16 Collyer Quay, Singapore, where we lease approximately 200 square feet of space, which expires July 2016. In addition, following our acquisition of ETF.com, we now have an office located at 222 Sutter Street, Suit 700, San Francisco, California where we lease approximately 2,500 square feet of space, which expires June 30, 2016. The disaster recovery sites in the United States are located in Kansas City, Missouri and Secaucus, New Jersey. In addition, we have agreements with a primary data center in Secaucus, New Jersey and a secondary data center in Chicago, Illinois. Our principal offices in the United Kingdom are at 10 Lower Thames Street, London, where we lease approximately 9,100 square feet of office space, which expires in December 2017. Our work area recovery space is available on invocation with a specialist provider. In Europe, our primary data center is in Slough, England. The secondary data center for BATS Chi-XBats Europe is in Park Royal, London. We operate a back-up location for our London operations in the United Kingdom.
We believe that our properties are in good operating condition and adequately serve our current business operations. We also anticipate that suitable additional or alternative space will be available at commercially reasonable terms for future expansion to the extent necessary.
Legal Proceedings
On April 18, 2014, the City of Providence, Rhode Island filed a securities class action lawsuit in the Southern District of New York against BATSBats and Direct Edge, as well as 14 other securities exchanges. The action purports to be brought on behalf of all public investors who purchased and/or sold shares of stock in the United States between April 18, 2009 and the present on a registered public stock exchange (Exchange Defendants) or a U.S.-based alternate trading venue and were injured as a result of the misconduct detailed in the complaint, which includes allegations that the defendants committed fraud through a variety of business practices associated with, among other things, what is commonly referred to as high frequency trading. On May 2, 2014 and May 20, 2014, American European Insurance Company and Harel Insurance Co., Ltd. each filed substantially similar class action lawsuits against the Exchange Defendants which were ultimately consolidated with the City of Providence, Rhode Island securities class action lawsuit. On June 18, 2015, Judge Jesse Furman of the Southern District of New York held oral argument on the pending Motion to Dismiss and thereafter, on August 26, 2015, the Court issued an Opinion and Order granting Defendant's Motion to Dismiss, dismissing the Complaint in full. Plaintiff filed a Notice of Appeal of the dismissal on September 24, 2015 and its appeal brief on January 7, 2016. Respondent's brief will be due on or before April 7, 2016.
On May 23, 2014 and May 30, 2014, Harold R. Lanier filed three class action lawsuits in the Southern District of New York against BATSBats and other securities exchanges. The complaints were identical in all substantive respects, but each related to the dissemination of market data under a different market system: (i) the NASDAQ UTP Plan Market System; (ii) the OPRA Market System; and (iii) the CQS and the CTS. Each of the actions purported to be brought on behalf of all subscribers who entered into contracts with the exchanges for the receipt of market data and were injured as a result of the misconduct detailed in the complaints, which includes allegations that the
defendants did not provide market data services in a non-discriminatory manner or provide subscribers with "valid" data (i.e., data that is accurate and not stale). On January 16, 2015, Judge Katherine Forrest of the Southern District of New York held oral argument on the pending Motion to Dismiss and thereafter, on April 28, 2015, the Court filed an Opinion and Order granting the exchange defendants' Motion to Dismiss, terminating all three class action lawsuits with prejudice. On May 20, 2015, Plaintiff filed a Notice of Appeal of the dismissal and on September 1, 2015, Appellant filed its
appeal brief. Respondent's brief was filed on November 24, 2015 and Appellant's reply brief was filed on December 8, 2015. Oral argument has been scheduled forarguments were held on March 3, 2016.
From time to time we are also involved in various legal proceedings arising in the ordinary course of our business. We do not believe that the outcome of any of these reviews, inspections or other legal proceedings will have a material impact on our consolidated financial position, results of operations or cash flows; however, litigation is subject to many uncertainties, and the outcome of individual litigated matters is not predictable with assurance.
As a self-regulatory organization under the jurisdiction of the SEC, we are subject to reviews and inspections by the SEC, and BATSBats Trading is subject to reviews and inspections by FINRA. We have from time to time received inquiries and investigative requests from the SEC's Office of Compliance Inspections and Examinations as well as the Division of Enforcement seeking information about our compliance with the federal securities laws as well as our members' compliance with the federal securities laws. In addition, while BATSBats Trading Limited and Chi-X Europe Limited have not been the subject of any material litigation or regulatory investigation in the past, there is always the possibility of such action in the future. As both companies are domiciled in the United Kingdom, it is likely that any action would be taken in the U.K. courts in relation to litigation or by the FCA in relation to any regulatory enforcement action.
United States
Overview of SRO Regulation and BZX's, BYX's, EDGX's and EDGA's SRO Status
Effective regulatory oversight is important to our reputation. U.S. stock exchanges and European MTFs must run fair, well-regulated marketplaces, and broker-dealers seek to trade on markets that are fair and orderly. Our trading platforms are designed to facilitate fair and orderly markets, and we deploy cutting-edge regulatory surveillance technology in the United States and Europe to monitor our customers' trading. We are committed to maintaining strong and effective regulation, and we are active participants in ongoing dialogue regarding regulatory and market structure issues in both the United States and Europe. Each of our national securities exchanges, BZX, BYX, EDGX and EDGA, has its own board of directors. A majority of directors of each exchange's board are non-industry directors in accordance with each exchange's bylaws. These boards of directors are primarily responsible for overseeing our national securities exchanges' discharging of their regulatory responsibilities.
U.S. federal securities laws have established a two-tiered system for the regulation of securities markets and market participants. The first tier consists of the SEC, which has primary responsibility for enforcing federal securities laws and regulations. The second tier consists of SROs, which include national securities exchanges, such as BZX, BYX, EDGX and EDGA. To the extent common rules and common members exist between SROs, these supervisory duties can be delegated by SEC-approved plans among SROs. An SRO can also contractually outsource these supervisory duties to another SRO through an RSA; however, in such cases, the SRO outsourcing the duties remains ultimately responsible and liable for the performance of the supervisory duties. BZX, BYX, EDGX and EDGA are SROs and are registered with and subject to oversight by the SEC.
Exchanges are an essential component of the regulatory scheme of the Exchange Act for providing fair and orderly markets and protecting investors. To be registered as a national securities exchange, an exchange must successfully undergo a rigorous application and review process with the SEC before beginning operations. Among other things, the SEC must determine that the exchange has the capacity to carry out the purposes of the Exchange Act. A national securities exchange must comply with the Exchange Act and have the ability to enforce compliance by its members and persons associated with its members with the provisions of the Exchange Act, the rules and regulations thereunder and the rules of the exchange.
Virtually all facets of our exchange operations are subject to SEC oversight. The Exchange Act and the rules thereunder impose on us many regulatory and operational responsibilities, including the day-to-day responsibilities for market and broker-dealer oversight, such as evaluating and authorizing broker-dealer applicants for exchange membership, conducting automated surveillance of trading occurring on BZX, BYX, EDGX and EDGA, performing on-site examinations of members, conducting investigations when potential misconduct is identified, bringing disciplinary actions against members when warranted and providing a forum for investors and members to arbitrate disputes in connection with securities transactions. In connection with these responsibilities and obligations, we are potentially subject to regulatory and/or legal action by the SEC or other interested parties. The SEC also has broad enforcement powers to censure, fine, issue cease-and-desist orders, prohibit us from engaging in some of our businesses, suspend or revoke BZX's, BYX's, EDGX's or EDGA's designation as a registered securities exchange or remove or censure any of our officers or directors who violate applicable laws or regulations.
We are also subject to the record-keeping requirements of Section 17 of the Exchange Act, including the requirement pursuant to Section 17(b) of the Exchange Act to make records available to the SEC for examination. In addition, BZX, BYX, EDGX, EDGA and BATSBats Trading are each subject to periodic inspection by staff of the SEC and, in the case of BATSBats Trading, FINRA, and will continue to
to be subject to such inspection in the future. To the extent such reviews and inspections result in adverse findings, we may be required to modify the manner in which we conduct our business, which may adversely affect our competitive position.
Under Section 19 of the Exchange Act and the terms of our organizational documents, BZX, BYX, EDGX and EDGA must submit to the SEC proposed changes to any of their respective rules, policies and practices, including certain revisions of the certificates of incorporation or bylaws of each of BZX, BYX, EDGX and EDGA, BATSBats Global Market, Inc., and each intermediate holding company.
The SEC will typically publish the proposal for public comment, after which the SEC may approve or disapprove the proposed rule change. The SEC's review is designed to ensure that each national securities exchange's rules, policies and practices are consistent with the Exchange Act and the rules and regulations thereunder. Certain changes can be designated as effective upon filing with the SEC, but the SEC retains the ability to suspend or reject such filings within a prescribed period of time.
BZX, BYX, EDGX and EDGA are parties to RSAs with FINRA, pursuant to which FINRA performs certain regulatory functions on their behalf, including for our U.S. listed equity options markets. BZX, BYX, EDGX and EDGA retain ultimate responsibility for the regulatory activities performed under these agreements. BZX, BYX, EDGX and EDGA remain responsible for surveillance and enforcement with respect to trading activities or practices involving their markets. We operate a cutting-edge, real-time surveillance system that conducts all aspects of the daily surveillance of trading and market activities, including monitoring trading on BZX, BYX, EDGX and EDGA. Our automated system produces alerts established by pre-defined criteria and ad hoc reports, which our Chief Regulatory Officer and our Chief Regulatory Officer's regulatory team analyze and review. We refer investigations into potential violations of BZX, BYX, EDGX or EDGA rules and federal securities laws to FINRA. We also refer investigations to FINRA based on customer complaints.
To avoid conflicts of interest that can arise from "self-listing," upon initial listing and throughout our continued listing, BZX will file a quarterly report with the SEC detailing our trading and BZX's monitoring of our compliance with BZX's listings requirements. This report will include a summary of any related surveillance alerts, complaints, regulatory referrals, trades cancelled or adjusted, investigations, examinations, formal and informal disciplinary actions, exception reports and trading data of our publicly listed security. In addition, on an annual basis, BZX will engage an independent accounting firm to review and prepare a report on our publicly listed security to ensure that we are in compliance with the BZX listings requirements, and BZX will provide the SEC with a copy of such report.
Section 6 of the Exchange Act requires national securities exchanges to provide fair representation to their members. To comply with this requirement, BZX, BYX, EDGX and EDGA have adopted structural and governance standards, including that their bylaws require a certain number of directors to be representatives of their members.
In addition to its other SRO responsibilities, BZX, as an ETP listing market, also is responsible for overseeing each listed company's compliance with BZX's listing standards. Our listings department evaluates applications submitted by issuers interested in listing their securities on BZX to determine whether the quantitative and qualitative listing standards have been satisfied. Once securities are listed, our listings department monitors each issuer's ongoing compliance with BZX's continued listing standards.
While the global institutional spot FX market is largely unregulated, the enactment of the Dodd-Frank and its related regulations in the United States and the ongoing implementation of MiFID II in Europe have impacted the regulatory landscape for currency derivative products. For example, certain standardized currency derivative products are expected to be required to trade on a
regulated trading venue such as a SEF or DCM in the United States, or on an MTF or OTF in
Europe. Expansion into such derivative FX products and the operation of regulated trading venues would potentially require registration with and supervision by the CFTC and/or the FCA, as the case may be.
Rule 17d-2 Agreements Among SROs
Section 17(d) of the Exchange Act and the related Exchange Act rules permit SROs to allocate among themselves certain regulatory responsibilities to avoid duplicative oversight and regulation. Under Exchange Act Rule 17d-1, the SEC designates one SRO to be the Designated Examining Authority, or DEA, for each broker-dealer that is a member of more than one SRO. The DEA is responsible for the regulatory oversight of the financial aspects of that broker-dealer. None of BZX, BYX, EDGX or EDGA is a DEA for any of its members.
Exchange Act Rule 17d-2 permits SROs to enter into agreements which are approved by the SEC and concern the enforcement of laws and rules applicable to all of those SROs and relating to members those SROs have in common. In September 2008, the SEC approved a Rule 17d-2 agreement for the surveillance, investigation and enforcement of common insider trading rules among all equity marketplaces for all NYSE MKT-, NYSE Arca-, NYSE- and NASDAQ-listed stocks and Chicago Stock Exchange solely-listed stocks. The agreement has been amended from time to time, including in December 2011 to also cover all stocks listed on BZX. In addition, the participants entered into associated RSAs, the Insider Trading RSAs, with FINRA to provide for investigations and enforcement against certain broker-dealers and their associated persons. BZX, BYX, EDGX and EDGA are participants in these agreements solely in relation to their respective activities.
In addition, we have entered into Rule 17d-2 agreements with FINRA under which FINRA has examination and enforcement responsibility relating to compliance by BZX, BYX, EDGX or EDGA members that are also FINRA members with the rules of the exchanges that are substantially similar to the applicable rules of FINRA, as well as certain provisions of the federal securities laws and the rules and regulations thereunder.
All of the options exchanges and FINRA are party to an Options Sales Practices Agreement, originally approved in September 1983, as amended from time to time, which we refer to as the Options Sales Practice 17d-2 Agreement and which is a Rule 17d-2 agreement. Under the Options Sales Practice 17d-2 Agreement, FINRA is the only SRO responsible for enforcing rules related to options sales practices for any options exchange member that is a member of FINRA. Under the Options Sales Practice 17d-2 Agreement, BZX and EDGX are relieved of regulatory responsibility for their members with respect to options sales practices covered by the Options Sales Practice 17d-2 Agreement.
In December 2007, the SEC approved a different Rule 17d-2 agreement, the Options Surveillance 17d-2 Agreement, entered into by all of the options exchanges and FINRA, which allocated responsibility to each of the participants for ensuring that their allocated common members complied with the rules governing the submission of expiring exercise declarations. The Options Surveillance 17d-2 Agreement has been amended from time to time, for example, to cover rules governing options position limits, large options position reporting and position adjustments.
In December 2010, the SEC approved a Rule 17d-2 agreement, the Regulation NMS 17d-2 Agreement, that allocates certain responsibilities under Regulation NMS to FINRA or, in some cases, to an SRO member's DEA, subject to conditions. In October 2015, the SEC approved an amendment to the Regulation NMS 17d-2 Agreement, which added Regulation NMS Rules 606, 607 and 611(c) and (d) to the scope of the Regulation NMS 17d-2 Agreement. BZX, BYX, EDGX and EDGA are all party to the Regulation NMS 17d-2 Agreement.
Broker-Dealer Regulation
In addition to the regulations described above, one of our subsidiaries, BATSBats Trading, is a registered broker-dealer regulated by the SEC, FINRA, other SROs of which it is a member and various state securities regulators.
BATSBats Trading currently operates as our routing broker-dealer for sending orders from BZX, BYX, EDGX and EDGA to other venues for execution, which we refer to as outbound routing, including routing orders among BZX, BYX, EDGX and EDGA, which we refer to as inbound routing. BATSBats Trading is considered a "facility" of BZX, BYX, EDGX and EDGA as that term is defined in the Exchange Act. As such, in one sense its activities are legally considered activities of our twofour national securities exchanges. The consequence of this is that BATSBats Trading's permissible conduct is defined by the rules of our exchanges and any expansion or contraction of that conduct, or changes to fees charged for its services, require SEC approval of rule filings submitted to the SEC by BZX, BYX, EDGX and EDGA.EDGA to submit rule filings with the SEC and, in many cases, obtain approval of such filings.
The inbound routing function of BATSBats Trading is subject to specific BZX, BYX, EDGX and EDGA rules designed to ensure that BATSBats Trading is not given preferential treatment as a routing broker-dealer over other members of BZX, BYX, EDGX and EDGA offering competing services. While BZX, BYX, EDGX and EDGA are responsible for enforcing BATSBats Trading's compliance with these specific rules, those rules also require us to enter into a RSA with a non-affiliated SRO and further require BZX, BYX, EDGX and EDGA to provide that non-affiliated SRO with any automated surveillance information indicating that BATSBats Trading may have violated the rules of the exchanges or the federal securities laws. BZX, BYX, EDGX and EDGA have entered into an RSA with FINRA in connection with fulfilling this obligation.
The SEC, FINRA and other SROs of which BATSBats Trading is a member adopt rules and examine broker-dealers and require strict compliance with their rules and regulations. The SEC, SROs and state securities commissions may conduct administrative proceedings which can result in censures, fines, the issuance of cease and desist orders or the suspension or expulsion of a broker-dealer, its officers or employees. The SEC and state securities regulators may also institute proceedings against broker-dealers seeking an injunction or other sanction. The SEC and SRO rules cover many aspects of a broker-dealer's business, including capital structure and withdrawals, sales methods, trade practices among broker-dealers, use and safekeeping of customers' funds and securities, recordkeeping, the financing of customers' purchases, broker-dealer and employee registration and the conduct of directors, officers and employees. All broker-dealers have an SRO that is assigned by the SEC as the broker-dealer's DEA. The DEA is responsible for examining a broker-dealer for compliance with the SEC's financial responsibility rules. FINRA is the current DEA for BATSBats Trading.
As a registered broker-dealer, BATSBats Trading is subject to regulations concerning all aspects of its business, including trading practices, order handling, best execution, anti-money laundering, handling of material non-public information, safeguarding data, reporting, record retention, market access and the conduct of its officers, employees and other associated persons. In addition, BATSBats Trading is subject to regulatory requirements intended to ensure its general financial soundness and liquidity, which require that it comply with certain minimum capital requirements. The SEC and FINRA impose rules that require notification when a broker-dealer's net capital falls below certain predefined criteria, dictate the ratio of debt to equity in the regulatory capital composition of a broker-dealer and constrain the ability of a broker-dealer to expand its business under certain circumstances. Additionally, the SEC's uniform net capital rule and FINRA rules impose certain requirements that may have the effect of prohibiting a broker-dealer from distributing or withdrawing capital and requiring prior notice to the SEC and FINRA for certain withdrawals of capital. As of September 30,December 31, 2015, BATSBats Trading was in compliance with all of the applicable capital requirements.
Options Regulatory Surveillance Authority
On June 5, 2006, the SEC approved a national market system plan named the Options Regulatory Surveillance Authority, or ORSA, Plan. The purpose of the ORSA Plan is to permit the U.S. securities options exchanges to act jointly in the administration, operation and maintenance of a regulatory system for the surveillance, investigation and detection of the unlawful use of undisclosed, material information in trading in one or more of their markets. Through the sharing of the costs of these regulatory activities and the sharing of the regulatory information generated under the ORSA Plan, the ORSA Plan is intended to enhance the effectiveness and efficiency with which the exchanges regulate their respective markets and the national market system for options and to avoid duplication of certain regulatory efforts. The ORSA policy committee had previously delegated the operation of the surveillance and investigative facility contemplated by the ORSA Plan to CBOE. The exchanges also entered into an RSA with CBOE, as service provider, pursuant to which CBOE performed certain regulatory and surveillance functions under the ORSA Plan and used its automated insider trading surveillance system to perform these functions on behalf of the exchanges. Effective January 1, 2015, however, the ORSA policy committee delegated the operation of the ORSA Plan facility to FINRA, and FINRA became the service provider under the RSA.
CTA Plan, CQS Plan, UTP Plan and OPRA Plan
BZX, BYX, EDGX and EDGA participate in the CTA Plan, the CQS Plan and the UTP Plan, which disseminate certain core trading information, such as last sale reports and quotations for the U.S. equities markets. NYSE Technologies, formerly the Securities Industry Automation Corporation, acts as the "processor" for CTA and the CQS Plan. Intercontinental Exchange owns NYSE Technologies. NASDAQ acts as the processor for the UTP Plan. We are also a member of OPRA, the designated securities information processor for market information that is generated through the trading of exchange-listed securities options in the United States. OPRA disseminates certain core trading information, such as last sale reports and quotations. The OPRA agreement, which has been approved by the SEC, sets forth a system for reporting options information that is administered by the member exchanges through OPRA, a limited liability company consisting of representatives of the member exchanges. NYSE Technologies acts as the processor for OPRA.
Options Intermarket Linkage Plan
The options markets were linked pursuant to an agreement of the exchanges in the Options Intermarket Linkage Plan, which we refer to as the Linkage Plan, approved by the SEC in 2000. The Linkage Plan facilitated the routing of orders between exchanges in furtherance of a national market system. One of the principal purposes of a national market system is to assure that brokers may execute investors' orders at the best market price. The Linkage Plan generally was designed to preclude options exchanges and their members from executing a trade at a price inferior to the best price displayed by any of the options exchanges, referred to as a trade-through, by providing exchange market makers with electronic access to the automatic execution systems of the other options exchanges.
The options exchanges, through the Intermarket Linkage Committee, have developed a new linkage plan, which was approved by the SEC on July 30, 2009 and launched on August 31, 2009 and which replaced the original Linkage Plan. The new linkage plan replaced a centralized inter-exchange order routing hub with private order routing linkages established through broker-dealers and introduced new requirements to maintain policies and procedures reasonably designed to assure orders are executed at the best market price.
Options Listing Procedures Plan and Symbology Plan
We are a party to the Options Listing Procedures Plan, which sets forth the procedures that the options exchanges must follow to list new options, and a party to the National Market System Plan for the selection and reservation of securities symbols.
Europe
The current United Kingdom regulatory system was created by the Financial Services Act 2012, or FSA12, which amended the Financial Services and Markets Act 2000, or FSMA. The legislation replaced the previous financial services regulator, the Financial Services Authority, with three new bodies: The Financial Policy Committee, or FPC, The Prudential Regulation Authority, or PRA and the FCA. The FPC is a committee of the Bank of England and sets policy for financial regulation. It is made up of the Governor and other senior figures within the Bank, along with the chief executives of the PRA and FCA and senior industry figures. The PRA is responsible for the prudential regulation of banks, insurance companies and other systemically important institutions. Financial conduct of markets, including activity on, and the operation of, is regulated by the FCA, which is an independent non-governmental body, given statutory powers by the FSA12. The FCA has three statutory objectives: to secure an appropriate degree of protection for consumers; to protect and enhance the integrity of the U.K. financial system; and to promote effective competition in the interests of consumers in the markets for financial services. The FCA is accountable to Her Majesty's Treasury Ministers and, through them, to Parliament.
FSMA, as amended by FSA12, governs the regulation of financial services and markets in the U.K. Under Section 19 of FSMA, any person who carries on a regulated activity in the U.K. must be authorized by the appropriate authority or exempt. Recognised Bodies, which include exchanges and clearing houses, are exempt. Breach of Section 19 may be a criminal offence and punishable on indictment by a maximum term of two years imprisonment and/or a fine. The FSMA (Regulated Activities) Order 2001 which is secondary legislation under FSMA, details regulated activities and specified investments.
Once a firm is authorized or recognized by the FCA, it is required to meet the standards set out in its Handbook of Rules and Guidance and to supply the FCA with information so that the FCA can monitor the firm's business. The FCA supervises the firm according to the risks that it poses to the FCA's statutory objectives.
Much of the U.K. financial services regulation originates in the European Union. On November 1, 2007, MiFID, which replaced the Investment Services Directive came into force, and was implemented by EEA member states. MiFID aims to harmonize European financial services businesses by setting out provisions governing organizational and conduct of business requirements that apply to firms and the requirements applicable to RMs (for example, stock exchanges) and MTFs. MiFID also aims to facilitate cross-border business by extending the concept of "passporting," which allows firms authorized to carry on business in one EEA member state to carry on business in other EEA member states.
As an RIE that operates both an RM and an MTF, BATSBats Trading Limited (trading as BATS Chi-XBats Europe) is required to comply with the relevant U.K. requirements as set out in the FCA Handbook, including where applicable relevant European Directives and Regulations, as implemented, or which apply directly in the U.K. These requirements include organizational requirements, capital resources requirements and the specific requirements for RMs and MTFs. MiFID sets out requirements for RMs and MTFs with respect to the establishment of transparent and non-discretionary rules and procedures governing access and for fair and orderly trading and the efficient execution of orders, as well as to facilitate the efficient settlement of transactions conducted on RMs and MTFs and monitoring compliance with the rules. The regulatory functions required of BATS Chi-XBats Europe by MiFID are performed by in-house staff. BATS Chi-XBats Europe utilizes the same state-of-the-art, real-time surveillance
state-of-the-art, real-time surveillance system that we use to monitor trading and market activities on BZX, BYX, EDGA, EDGX, BZX Options and EDGX Options.
The onward routing service offered by BATS Chi-XBats Europe is performed by Chi-X Europe Limited, a wholly owned subsidiary of BATS Chi-XBats Europe that is authorized as an investment firm with agency broker permissions.
MiFID is currently in the process of being updated and the new legislation, known as MiFID II and MiFIR is currently scheduled to apply from January 3, 2017, although there is a potentialproposal for a delay until January 2018. MiFID II and MiFIR will generally tighten the requirements placed on both exchanges and investment firms. In particular, use of certain waivers from pre-trade transparency will be capped as a percentage of total market volume and a general trading obligation will require almost all equity trades to be conducted on a duly registered trading venue. Furthermore, MiFID II will extend mandatory transparency requirements to non-equity markets, such as fixed income.
Recent Developments
Policy makers, including legislators and regulatory agencies in both the United States and Europe, are responsible for enacting laws and regulations that govern the manner in which we operate our businesses and the market structure under which we operate. Policy reviews of these laws and regulations and market structures are on-going and we cannot predict the final outcome of these reviews or their impact on our businesses. Since the financial crisis of 2008, the focus on many of these laws and regulations as well as overall market structure has intensified, resulting in several new policy proposals and initiatives. Although we are an active participant in communicating our views on these issues to the relevant policy makers, we cannot predict the final outcome of any pending initiatives, including the rule proposals discussed below, or fully assess the potential impact on our businesses of any future rules. However, it is possible that the costs and other effects of the proposals discussed below could negatively impact trading volumes, which could, in turn, have a negative impact on our business. Some recent regulatory developments in the United States and Europe include:
United States
each FINRA member's off-exchange trading of equity securities other than on an ATS. In November 2015, the SEC proposed amendments to Regulation ATS and related rules under the Exchange Act to impose new operational transparency and SEC oversight requirements on ATSs that facilitate transactions in Regulation NMS stocks. If adopted, a broker-dealer operating an ATS that facilitates transactions in NMS stocks would be required, among other things, to file a public registration form containing extensive disclosures regarding the design and operations of the ATS as well as potential conflicts of interest arising from the broker-dealer operator and its affiliates' other activities. If adopted, these ATSs would also not be permitted to engage in operations unless the SEC ordered this registration form effective.
would be continuously recalculated throughout the trading day. The Plan was initially approved for a one-year pilot period, which began on April 8, 2013. The pilot period has since been extended through April 22, 2016 to provide additional time for the public, the participants in the Plan and the SEC to assess the operation of the Plan. The participants in the Plan have also recommended that the Plan be adopted permanently with certain modifications.
national best bid or offer for the most actively traded securities and certain ETFs. The SEC has not yet proposed additional rule-making associated with market maker activity.
disaster recovery facilities that are geographically diverse from the exchange's systems and that facilitate the ability to resume trading within specified timeframes when critical and non-critical SCI systems are rendered inoperable. It also requires timely and substantial notification to be made to the SEC in the event an exchange experiences any system interruption or interference. The SEC has also established various working groups of exchanges to focus on improving market resiliency, including regarding regulatory halts, trade nullification and additional market protections. Reg SCI and the other SEC mandated working group initiatives are very complex, and, as such, compliance with the rules have required significant resources.
Europe
purpose of the guidelines is to ensure common, uniform and consistent application of MiFID and the Market Abuse Directive as they apply to the systems and controls required of: (i) trading platforms and investment firms in an automated trading environment; and (ii) trading platforms and investment firms in relation to the provision of direct market access and sponsored access. These requirements will be further enhanced by MiFID II and the new Market Abuse Regulation, or MAR. MAR extends the scope of the market abuse framework to new markets, new behaviors and new platforms. It willis scheduled to become effective at the beginning of July 2016.
reporting obligation for OTC derivatives, a clearing obligation for eligible OTC derivatives, measures to reduce counterparty credit and operational risk for bilateral OTC derivatives, common rules for central counterparties, which we refer to as CCPs, and for trade repositories, and rules on the establishment of interoperability between CCPs. The Regulation became effective August 2012, with the first obligations effective beginning March 2013. In addition, a new Regulation governing the authorization and supervision of Central Securities Depositories was approved in September 2014, with the adoption of "Level 2" Regulatory Technical Standards still pending and possible delays to implementation; and a recovery and resolution framework is being developed for CCPs.
Global FX
While the global institutional spot FX market remains largely unregulated, the enactment of Dodd-Frank and its related regulations in the U.S. and the ongoing implementation of MiFID II and MiFIR in Europe have impacted the regulatory landscape for currency derivative products. For example, certain standardized currency derivative products are expected to be required to trade on an organized trading venue such as a SEF or DCM in the U.S. or on an MTF or OTF in Europe. This transformation has also been enabled by technological developments that facilitate the electronic trading of institutional spot FX and currency derivatives. Moreover, this movement is highlighted by the recent publication of the Fair and Effective Markets Review Final Report and the March 2015 Global Preamble: Codes of Best Market Practice and Shared Global Principles, which may lead to additional oversight and regulation in the global FX market.
Executive Officers and Directors
The following table sets forth information regarding our executive officers and directors, upon consummation of the initial public offering:
Name of Executive Officer | Age | Position | |||
|---|---|---|---|---|---|
| |||||
Chris Concannon | 48 | President, Chief Executive Officer and Director | |||
Tony Barchetto | 42 | Executive Vice President, Head of Corporate Development | |||
Bryan Harkins | 39 | Executive Vice President, Head of U.S. Markets | |||
Mark Hemsley | 53 | Executive Vice President, CEO of | |||
Chris Isaacson | 37 | Executive Vice President, Global Chief Information Officer | |||
Tami Schademann | 39 | Executive Vice President, Chief Regulatory Officer | |||
Brian N. Schell | 50 | Executive Vice President, Chief Financial Officer, Treasurer | |||
Eric Swanson | 48 | Executive Vice President, General Counsel and Secretary | |||
Name of Director | Age | Position | |||
|---|---|---|---|---|---|
| |||||
| |||||
| 48 | President, Chief Executive Officer and Director | |||
| 51 | Director | |||
Robert W. Jones | 65 | Director | |||
John McCarthy | 52 | Director | |||
Chris Mitchell | 44 | Director | |||
Jamil Nazarali | 48 | Director | |||
Frank Reardon | 27 | Director | |||
Michael Richter | 68 | Director | |||
Messrs. �� will be independent directors for purposes of BZX's listing standards.
Joe Ratterman, one of our founders in 2005, has served as Chairman since March 2015. Mr. Ratterman also served as Chairman from June 2007 until July 2012, as President from June 2007 until November 2014 and as Chief Executive Officer from June 2007 until March 2015. Mr. Ratterman initially served as our Executive Vice President and Chief Operating Officer from 2005 until June 2007. Prior to joining us, from July 2004 to December 2005, Mr. Ratterman was vice president of business development at Tradebot Systems, Inc., an electronic market maker. Mr. Ratterman is a member of the SEC's Equity Market Structure Advisory Committee. Mr. Ratterman holds a bachelor's degree in mathematics and computer science from Central Missouri State University, as well as Series 7, 24, 27, 55 and 66 licenses.Officers
Chris Concannon is a director and serves as our President and Chief Executive Officer, as well as President and Chief Executive Officer of BZX, BYX, EDGX and EDGA, Chairman of the board of directors of BZX, BYX, EDGX and EDGA, President of BATSBats Hotspot and a director of BATSBats Trading. Mr. Concannon joined the company as President in December 2014 and immediately made an impact by playing a lead role in the acquisition of the BATSBats Hotspot FX market. Appointed CEO on March 31, 2015, he has more than 20 years of experience as an exchange executive, trading participant and regulator. Prior to joining us, Mr. Concannon was most recently a president and chief operating officer at Virtu Financial, a global electronic market maker, from 2009 to 2014. Mr. Concannon holds a bachelor's degree from Catholic University, an MBA from St. John's University and a JD from Catholic University's Columbus School of Law. He also holds Series 7 and 24 licenses.
Tony Barchetto serves as our Executive Vice President, Head of Corporate Development. Immediately prior to his current role, Mr. Barchetto served as Senior Vice President, Business Development after joining Bats via the Direct Edge Acquisition in January 2014. Prior to joining us, Mr. Barchetto was the Head of Corporate Strategy at Direct Edge, from 2011 to 2014. Mr. Barchetto has over 17 years of experience in electronic trading and product development, with senior roles in corporate strategy, product management, sales, and operations. He holds a bachelor's degree in international economics from Georgetown University. Mr. Barchetto also holds Series 7, 24, 55 and 63 licenses and is a Chartered Financial Analyst.
Bryan Harkins serves as our Executive Vice President, Head of U.S. Markets. Prior to the acquisition of Direct Edge Acquisition in January 2014 when Mr. Harkins first joined us, Mr. Harkins served as Chief Operating Officer of Direct Edge, where he worked since 2007. Mr. Harkins holds a B.A. from the
University of Notre Dame, and an MBA from New York University's Stern School of Business. Mr. Harkins also holds Series 7, 24, 55 and 63 licenses.
Mark Hemsley serves as our Executive Vice President, Chief Executive Officer of BATS Chi-X Europe,Bats, a position he has held since November 2011. He initially joined us in April 2008 as Chief Executive Officer and Chairman of BATSBats Europe. Prior to joining us, Mr. Hemsley founded Belvedere Hill Limited, a corporate advisory firm, where he worked from 2005 to 2008, and is currently a non-shareholder director. Mr. Hemsley holds a master of business administration from City University Business School.
Chris Isaacson is a founding employee and serves as our Executive Vice President and Global Chief Information Officer, overseeing all technology and market operations for the company globally, as well as Executive Vice President and Global Chief Information Officer of BZX, BYX, EDGX and EDGA and a director of BZX, BYX, EDGX, EDGA and BATSBats Trading. Previously, Mr. Isaacson served as our Senior Vice President and Chief Operating Officer from 2007 until February 2014. He was instrumental in the architecture and implementation of the BATSBats trading platform, and was our Treasurer from June 2007 to February 2012 and served as the Vice President of Operations of BATSBats Trading from 2005 until 2007. Mr. Isaacson was a software developer at Tradebot Systems, Inc. from 2003 to 2005. Mr. Isaacson began his career as a software engineer at Cerner Corp., a publicly traded, Kansas City-based healthcare information systems supplier. Mr. Isaacson holds a bachelor's degree in information systems with a minor in math from Nebraska Wesleyan University and a master of business administration from the University of Nebraska-Lincoln, as well as Series 4, 7, 24, 27, 55, 63 and 65 licenses.
Tami Schademann is a founding employee and has led our regulatory and compliance department since we began operations and currently serves as our Executive Vice President and Chief Compliance Officer, as well as the Executive Vice President and Chief Regulatory Officer of BZX, BYX, EDGX and EDGA and director of BATSBats Trading. Ms. Schademann served as Senior Vice President from May 2011 until February 2014. Prior to joining us, Ms. Schademann was chief compliance officer at Tradebot Systems, Inc. from 2001 to 2005. Previously, she was also a manager at Security Investment Company of Kansas City from March 2001 to October 2001 as well as in the trust divisions of Firstar Bank (now U.S. Bank), Commerce Bank and Security Bank of Kansas City from 1994 to 2001. Ms. Schademann holds Series 7, 24 and 63 licenses.
�� Brian N. Schell has been our Executive Vice President and Chief Financial Officer since February 2014 and 2011, respectively, and Treasurer since 2012. Mr. Schell also serves as the Executive Vice President, Chief Financial Officer and Treasurer of BZX, BYX, EDGX, and EDGA, Directordirector of BATSBats Trading and Treasurer of BATSBats Hotspot. Immediately prior to his current role, Mr. Schell was our Senior Vice President from March 2011 to February 2014. Mr. Schell is a 20-year veteran of the financial industry. He spent 16 years at H&R Block Inc. from 1994 to 2010 where he held various senior leadership positions, concluding his tenure as senior vice president, operations, support and development for the firm's Tax Services division. Mr. Schell also served separately as chief financial officer of the Tax Services and H&R Block Financial Advisors units from 2002 to 2010, holding the former position for seven years. From 1997 to 2002, he was vice president and corporate treasurer and director of investor relations. Mr. Schell holds a bachelor's degree in business administration with an emphasis in finance from the University of Notre Dame and a master of business administration from The George Washington University, as well as a Series 27 license.
Eric Swanson serves as our Executive Vice President, General Counsel and Secretary, as well as the Executive Vice President, General Counsel and Secretary of BZX, BYX, EDGX and EDGA and the Secretary of BATSBats Hotspot. Immediately prior to Mr. Swanson's current position, he served as our Senior Vice President, General Counsel and Secretary from February 2010 until February 2014 and has served as the General Counsel for BZX and BYX since their inception in 2008. From 2006 to 2008, Mr. Swanson served as chief counsel and vice president of regulatory strategy at Ameriprise Financial.
From 1996 to 2006, Mr. Swanson served at the SEC, including as an assistant director in the Office of Compliance, Inspections and Examinations' market oversight unit in Washington, D.C. His duties
included supervising the SEC's inspection program responsible for regulatory oversight of trading on securities exchanges and ECNs. He holds a bachelor's degree in economics from the University of Minnesota and earned his law degree at Hamline University School of Law.
Directors
Messrs. Freudenstein, Jones, McCarthy, Mitchell, Reardon and Richter will be independent directors for purposes of BZX's listing standards.
Frank ReardonJoe Ratterman, one of our founders in 2005, has served as a directorChairman since SeptemberMarch 2015. Mr. ReardonRatterman also served as Chairman from June 2007 until July 2012, as President from June 2007 until November 2014 and as Chief Executive Officer from June 2007 until March 2015. Mr. Ratterman initially served as our Executive Vice President and Chief Operating Officer from 2005 until June 2007. Prior to joining us, from July 2004 to December 2005, Mr. Ratterman was vice president of business development at Tradebot Systems, Inc., an electronic market maker. Mr. Ratterman is currently an investment analyst for Tradebot. In this capacity, he helps manage the investment portfolio and analyzes prospective investments. He is a certified public accountant as well as a member of the AICPA and Missouri Society of CPAs. Prior to his current role,SEC's Equity Market Structure Advisory Committee. Mr. Reardon was a senior audit associate with CBIZ Mayer Hoffman McCann P.C. where he specialized in running attest engagements for the construction and manufacturing/distribution industries. Mr. ReardonRatterman holds a bachelor's and master's degree in accountancymathematics and computer science from the Trulaske College of Business at theCentral Missouri State University, of Missouri-Columbia.as well as Series 7, 24, 27, 55 and 66 licenses.
Alan H. Freudenstein has served as a director since 2010. Mr. Freudenstein is a managing director of Credit Suisse in the Asset Management business and Managing Partner of Credit Suisse NEXT Investors, LLC, based in New York. He sits on the board of Actiance, Ensyn, US Health Group and VITEOS. Prior to his current role, Alan led the bank's Principal Investment Group within the Investment Banking division. Alan joined Credit Suisse in 2000 from Bankers Trust Company where he was a Managing Director responsible for incubation and venture investments within the New World Ventures Group. Previously, he was a management consultant at Booz Allen & Hamilton and an equity research analyst at Salomon Brothers. Alan holds a bachelor's in economics from Johns Hopkins University and an M.B.A. from the University of Chicago.
John McCarthy has served as a director since 2010. Since 2006, Mr. McCarthy has been the general counsel at GETCO Holding Company, LLC (now KCG Holdings). KCG is one of our strategic investors. Previously, Mr. McCarthy served as an associate director at the SEC and as head of the Market Oversight Unit at the Office of Compliance Inspections and Examinations from 2000 to 2006, where he was responsible for regulatory oversight inspections of trading on stock and options exchanges. Mr. McCarthy holds a bachelor of science degree in engineering and a bachelor of arts degree in economics from the University of Michigan, a master's degree in finance from the London School of Economics and a law degree from the University of Maryland.
Robert W. Jones has served as a director since 2013. Mr. Jones is currently the sole owner of Turtle Rock Group, LLC, a financial advisory consulting firm founded in 2009. From 1974 until 2009, Mr. Jones held various management positions including managing director and vice chairman—investment banking at Morgan Stanley, a global provider of financial services to companies, governments and investors. Mr. Jones has also acted as a senior advisor to Morgan Stanley since 2009. Previously, Mr. Jones served on the board of directors of Progress Energy from 2007 until its merger with Duke Energy in 2012 and currently is a member of the board of directors of the Electric Power Research Institute. Mr. Jones holds a bachelor's degree from Colgate University and a master of business administration from Harvard Business School.
John McCarthy has served as a director since 2010. Since 2006, Mr. McCarthy has been the general counsel at GETCO Holding Company, LLC (now KCG Holdings). KCG is one of our strategic investors. Previously, Mr. McCarthy served as an associate director at the SEC and as head of the Market Oversight Unit at the Office of Compliance Inspections and Examinations from 2000 to 2006, where he was responsible for regulatory oversight inspections of trading on stock and options exchanges. Mr. McCarthy holds a bachelor of science degree in engineering and a bachelor of arts degree in economics from the University of Michigan, a master's degree in finance from the London School of Economics and a law degree from the University of Maryland.
Chris Mitchell has served as a director since 2013. Mr. Mitchell is a Managing Director of Spectrum Equity, a growth equity investment firm that provides capital and strategic support to innovative companies in the information economy. He serves or has served on the board of directors of a number of public and private financial technology companies, including Business Monitor, EagleView,
Ethoca, RiskMetrics, Seisint, Trintech, Verafin and World-Check. Prior to joining Spectrum Equity in 2001, Mr. Mitchell worked at TA Associates, Monitor Clipper and SG Warburg. He holds a bachelor's degree from Princeton University.
Jamil Nazarali has served as a director since 2014. Mr. Nazarali is Senior Managing Director and Head of Citadel Execution Services (CES). Mr. Nazarali oversees Citadel Securities' client market making offerings in Equities, Options and FX. Prior to joining Citadel Securities in 2011, Mr. Nazarali was Global Head of Electronic Trading at Knight Capital Group. Previously, he was a management consultant at both Ernst and Young and Bain and Company. He is also a member of the SEC Equity
Market Structure Advisory Committee and the Nasdaq Quality of Markets Committee. Mr. Nazarali holds a bachelor's degree from the University of Western Ontario and a master of business administration from the University of Chicago.
Frank Reardon has served as a director since September 2015. Mr. Reardon is currently an investment analyst for Tradebot. In this capacity, he helps manage the investment portfolio and analyzes prospective investments. He is a certified public accountant as well as a member of the AICPA and Missouri Society of CPAs. Prior to his current role, Mr. Reardon was a senior audit associate with CBIZ Mayer Hoffman McCann P.C. where he specialized in running attest engagements for the construction and manufacturing/distribution industries. Mr. Reardon holds a bachelor's and master's degree in accountancy from the Trulaske College of Business at the University of Missouri-Columbia.
Michael Richter has been a director since 2009. Mr. Richter has had an extensive managerial career in international banking and brokerage firms. He was co-founder in 2000 of Lime Brokerage Holdings LLC and currently serves as its chief financial officer. Prior to joining Lime Brokerage Holdings LLC, Mr. Richter was president of Citicorp Securities Services. Mr. Richter is qualified as a Certified Public Accountant and holds a bachelor of science degree in engineering from Rensselaer Polytechnic Institute and a master's degree from MIT Sloan School of Management.
Board Composition
Upon consummation of this offering, our amended and restated certificate of incorporation will provide that our board of directors will be divided into three classes of directors as follows:
Of the nine members of our board of directors, seven were elected in compliance with the provisions of the Investor Rights Agreement. Effective upon the completion of this offering, pursuant to the terms of the Investor Rights Agreement, the provisions therein relating to the election of directors will automatically terminate.
A classified board of directors may have the effect of deterring or delaying any attempt by any person or group to obtain control of us by a proxy contest since such third-party would be required to have its nominees elected at two separate annual meetings of our board of directors in order to elect a majority of the members of our board of directors. See "Risk Factors—Risks Relating to an Investment in Our Common Stock—Provisions in our amended and restated certificate of incorporation and bylaws, Delaware law and FINRA rules might discourage, delay or prevent a change of control of our company or changes in our management and, therefore, depress the trading price of our common stock."
At each annual meeting of stockholders, the successors to the directors whose terms will then expire will be elected to serve from the time of election and qualification until the third annual meeting following such election and until their successors are duly elected and qualified or until his or her earlier death, resignation or removal. Any vacancies in our classified board of directors will be filled by the remaining directors, and the elected person will serve the remainder of the term of the class to which he or she is appointed.
Board Committees
Audit Committee
The Audit Committee consists of Messrs. Freudenstein, Jones and will be composed entirelyRichter, all of whom are independent directors. Mr. Richter will serve as the chair of the Audit Committee. The Audit Committee will consist exclusively of directors who are financially literate, and Mr. Richter will be considered an audit committee financial expert as defined by the SEC. The Audit Committee is governed by a charter that complies with the rules of BZX. The Audit Committee's primary responsibilities are (i) to assist the board of directors in its oversight of the integrity of our financial statements and internal controls, the qualifications,
independence and performance of our independent auditor, the compliance of our internal audit function and our compliance with legal and regulatory requirements, and our management of other risks and internal controls (ii) to prepare the Audit Committee report that SEC rules require to be included in our annual proxy statement.statement and (iii) to oversee the Enterprise Risk Management, or ERM, program, including risk governance structure, risk metrics, risk assessment and strategy as it relates to key risks. In order to fulfill these responsibilities, the Audit Committee will:
Compensation Committee
The Compensation Committee consists of Messrs. Jones, Mitchell and will be composed entirelyReardon, all of whom are independent directors. Mr. Jones will serve as the chair of the Compensation Committee. The Compensation Committee is governed by a charter that complies with the rules of BZX. The Compensation Committee's responsibilities will include:
Nominating and Corporate Governance Committee
The Nominating and Corporate Governance Committee consists of Messrs. Freudenstein, McCarthy and will be composed entirelyRichter, all of whom are independent directors. Mr. McCarthy will serve as the chair of the Nominating and Corporate Governance Committee. The Nominating and Corporate Governance Committee is governed by a charter that complies with the rules of BZX, and its responsibilities will include:
and reassessing the adequacy of such Corporate Governance Guidelines, Related Person Transaction Policy and Code of Business Conduct and Ethics and recommending any proposed changes to the board;
Code of Business Conduct and Ethics
Our board of directors has adopted a code of business conduct and ethics that applies to all of our directors, officers and other employees, including our principal executive officer, principal financial officer and principal accounting officer. Any waiver of the code for directors or executive officers may be made only by our board of directors, or a committee thereof, and will be promptly disclosed to our stockholders. Amendments to the code must be approved by our board of directors and will be promptly disclosed (other than technical, administrative or non-substantive changes). A copy of our code of business conduct and ethics will be posted on our website, www.bats.com.
Corporate Governance Guidelines
Our board of directors plans to adopt corporate governance guidelines that will serve as a flexible framework within which our board of directors and its committees operate. These guidelines will cover a number of areas including the size and composition of the board, board membership criteria and director qualifications, director responsibilities, board agenda, roles of the Chairman of the Board, Chief Executive Officer and presiding director, meetings of independent directors, committee responsibilities and assignments, board member access to management and independent advisors, director communications with third parties, director compensation, director orientation and continuing education, evaluation of senior management and management succession planning. Additionally, our board of directors will adopt independence standards as part of our corporate governance guidelines. A copy of our corporate governance guidelines will be posted on our website, www.bats.com.
Compensation Discussion and Analysis
This Compensation Discussion and Analysis section of this prospectus explains how our executive compensation programs are designed and operate with respect to our named executive officers, who we refer to as the NEOs, who for 2015 were:
Introduction
Our compensation discussion and analysis discusses the compensation program for our NEOs in 2015 and describes our overall compensation philosophy, objectives and practices. Our compensation philosophy and objectives generally apply to all of our employees and the majority of our employees are eligible to participate in the main components of our compensation program consisting of:
Our senior leaders, which include our NEOs and most officers of our subsidiaries, are eligible to participate in our equity award program. In addition, in 2015, our senior leaders and certain employees providing services to BATSBats Hotspot were eligible to receive an annual bonus, which in the case of our senior leaders is payable in cash and equity. The relative value of each of these components for individual employees varies based on job role and responsibility.
In addition, we provide our NEOs with benefits that are generally available to our employees in the country in which the NEO is employed, including retirement savings and health and welfare benefits.
Compensation Philosophy and Objectives
Our compensation philosophy is to offer our executive officers, including our NEOs, compensation and benefits that are competitive and meet our goals of attracting, retaining and motivating highly skilled management who share our desire to achieve our financial and strategic objectives and create long-term value for our stockholders. Accordingly, our executive officer compensation program is designed to link annual cash incentives and long-term stock incentives to the achievement of company and individual performance goals and to align the interests of executive officers with the creation of stockholder value.
We believe compensation should be determined within a framework that is intended to reward individual contribution and the achievement of company objectives. Within this overall philosophy, our objectives are to:
Role of Directors and Executive Officers in Setting Compensation
Our CEO has discretion to recommend both the contractual and discretionary compensation of the NEOs (other than himself), which he considers in consultation with our Compensation Committee. Our Compensation Committee has overall responsibility for overseeing our executive compensation policies, and the compensation committees of the boards of directors of our subsidiary registered securities exchange companies have ultimate responsibility for setting the compensation of our CEO, which responsibility they fulfill in consultation with our Compensation Committee. Our Compensation Committee further has overall responsibility for overseeing our compensation plans and programs, reviewing our achievements as a company and the achievements of our executive officers and providing input and guidance to our CEO in the determination of the specific type and level of compensation of our NEOs. Effective January 1, 2016, the compensation structure and target expectations for each of the NEOs will beis set forth in his respective employment agreement.
We believe the levels of compensation we provide should be competitive, reasonable and appropriate for our business needs and circumstances. In addition to the information provided by our compensation consultant, Meridian Compensation Partners, LLC, referred to as Meridian, with respect to executive officer and director compensation matters (discussed below), we have informally considered the competitive market for corresponding positions within comparable geographic areas and companies of similar size and stage of development. Our CEO, in consultation with the Compensation Committee, has applied subjective discretion to make compensation decisions rather than using a specific formula or matrix to set total compensation in relation to compensation paid by other companies. Our historical approach has been to consider competitive compensation practices and other factors, such as how much compensation was necessary to recruit and retain an executive officer, as well as individual performance. As we gain experience as a public company, we expect that the specific direction, emphasis and components of our executive compensation program will continue to evolve. For example, over time, we may reduce our reliance upon subjective determinations in favor of a more empirically based approach that could involve, among other practices, benchmarking the compensation paid to our NEOs against peer companies. In addition, following completion of the offering, the Compensation Committee will administer our executive compensation program in accordance with its charter.
For the NEOs (other than our CEO), our CEO has historically considered such NEO's responsibilities, performance and historical compensation in determining their compensation. Our CEO then consults with the Compensation Committee on his recommendations to the Committee regarding base salary increases, discretionary bonus amounts and equity award amounts, and advises the Compensation Committee regarding the compensation program's ability to attract, retain and motivate executive talent. These recommendations reflect compensation levels that our CEO believes are commensurate with such NEO's individual qualifications, experience, responsibility level, functional role, knowledge, skills, and individual performance, as well as our company's performance and competitive offerings. Through consultation with the Compensation Committee, our CEO may adjust up or down specific compensation for all the NEOs (other than himself). The amount of prior year annual bonus awards and equity awards generally is a factor in our CEO's decisions with respect to the NEOs. In determining our CEO's compensation, the boards of directors of our subsidiary registered securities exchange companies, in consultation with our Compensation Committee, take into
consideration our performance, our CEO's contribution to that performance and the desire to retain and motivate our CEO.
Our CEO and certain of our other NEOs may attend Compensation Committee meetings, as requested by the Compensation Committee.
Role of Compensation Consultant
In August 2015, the Compensation Committee engaged Meridian to render advisory services to the Compensation Committee relating to executive officer and director compensation matters. Specifically, Meridian has conducted a comprehensive review of our executive compensation program which included:
For 2015, the peer group of publicly traded companies selected by Meridian included the 17 companies listed below:
• BGC Partners Inc. • CBOE Holdings Inc. • CME Group Inc. • Deutsche Börse AG • DST Systems Inc. •
| • Interactive Brokers Group, Inc. • Intercontinental Exchange, Inc. • Investment Technology Group, Inc. • KCG Holdings Inc. • London Stock Exchange Group plc | • MarketAxess Holdings Inc. • MSCI Inc. • Nasdaq OMX Group Inc. • TD Ameritrade Holding Corp. • TMX Group Ltd. |
In 2015, the Compensation Committee reviewed peer-group data but did not benchmark against it. In 2016, we expect that the use of peer-group data will play a more significant role in establishing compensation levels.
Meridian does not currently provide us with any additional services other than the services it provides to the Compensation Committee relating to executive and director compensation and related governance. The Compensation Committee did not direct Meridian to perform its work in any particular manner or under any particular method. The Compensation Committee has the sole authority to retain and terminate Meridian or any other consultant. In connection with Meridian's retention, our Compensation Committee is conductingconducted an assessment of potential conflicts of interest of Meridian.
Elements of Our Executive Compensation Program
The principal elements of our executive compensation program to date have been base salary, performance-based quarterly cash bonus, discretionary cash bonus and long-term equity compensation. Each of these compensation elements satisfies one or more of our compensation objectives. We combine the compensation elements for each NEO in a manner we believe is consistent with the NEO's contributions to our company and our overall goals with respect to executive compensation.
Base Salary
We believe that a competitive base salary is an important component of compensation as it provides a degree of financial stability for our NEOs and is critical to recruiting and retaining our NEOs. Base salary is also designed to recognize the scope of responsibilities placed on each NEO and reward each executive for his unique leadership skills, management experience and contributions, which are described below under "2015"—2015 Named Executive Officer Compensation Decisions". We make a subjective determination of base salary after considering such factors collectively.
The base salaries paid to our NEOs for 2015 are set forth below in the summary compensation table. See "—Summary Compensation Table."
Cash Bonuses
We believe that a meaningful portion of annual cash compensation should be contingent upon successful company performance. Therefore, subject to satisfaction of certain eligibility requirements, during 2015 our non-sales employees, including each of our NEOs, participated in the BATSBats Milestone Bonus Plan, or the Milestone Bonus Plan. We operate the Milestone Bonus Plan in the United States and Europe in a nearly identical manner. The Milestone Bonus Plan is designed to reward achievement of meaningful company milestone goals that support our objectives of company growth, enhancement of stockholder value and motivation of executive officers to achieve superior performance in their areas of responsibility. Our sales employees supporting the U.S. Equities and U.S. Options markets and European Equities markets participate in the SaleSales Milestone Bonus Plan, which is a unique plan designed to reward market share growth and sales-related performance. The sales employees providing services to BATSBats Hotspot participate in unique plans designed to reward transaction revenue and volume growth.
The Milestone Bonus Plan assigns to each milestone goal a number of milestone points that are earned upon achievement of such milestone goal. Although some of the milestone goals are assigned a fixed number of milestone points, the number of milestone points that may be earned with respect to certain milestone goals (for example, monthly global normalized EBITDA) is uncapped. "Normalized EBITDA" is defined as EBITDA before acquisition-related costs, IPO costs, loss of extinguishment of debt, debt restructuring costs, intangible asset impairment charges, gain on extinguishment of revolving credit facility and other significant one-time items not expectedan unusually large regulatory assessment charged to be recurring.a member in 2013. At the beginning of the plan year, each Milestone Bonus Plan participant is assigned a number of bonus plan units determined by us based on the participant's position, expected contributions and seniority.
Payouts under the Milestone Bonus Plan are made following each quarter, based on the milestones achieved (and therefore, the milestone points earned) for such quarter. Payout amounts are determined by multiplying the number of milestone points earned for the quarter by the value per milestone point (which for 2015 was determined to be $10 per milestone point in the United States and £10 per milestone point in the United Kingdom), with such product multiplied by the number of bonus plan units assigned to each plan participant. For the majority of 2015, the NEOs were assigned the following number of bonus plan points, which points are determined by dividing each NEO's base salary by 10,000:
The milestone goals were established after considering our historical financial performance and internal strategic objectives. The milestone goals and the points awarded for achievement of goals are similar for our United States and United Kingdom employees. Additionally, an employee's milestone goals include both company-wide goals that apply to all company employees (either in the United States or United Kingdom) and specific department milestone goals that apply to only those employees in that employee's respective department. For 2015, all employees are eligible for the Milestone Bonus Plan, except for those employees who primarily provide services to BATSBats Hotspot; however, we anticipate the participation of such employees in the Milestone Bonus Plan in 2016.
The company-wide milestone goals relate to monthly profitability, market share, operational up-time sustained for the month and completion of certain revenue producing projects:
Monthly profitability
Market share
Operational up-time
Completion of revenue producing projects
Departmental goals for 40 points in total
Department goals, organized by functional group, represent the completion of other significant projects that contribute to our success, such as the Direct Edge Integration, the migration to the Equinix NY5 datacenter, the BATSBats Hotspot Acquisition, the launch of EDGX Options and incremental profitability.
In addition to quarterly cash bonuses payable under the Milestone Bonus Plan, each of our NEOs is also eligible to earn a discretionary performance bonus, payable as a combination of compensatory equity awards and cash, based on the achievement of company goals and individual performance, and a spot bonus (generally ranging from $1,000 to $25,000) based on individual performance that can be paid anytime during the year. The discretionary bonuses for the NEOs are determined by the Compensation Committee in consultation with the CEO, and, in the case of the CEO, determined by the compensation committees of the boards of directors of our subsidiary registered securities exchange companies in consultation with the Compensation Committee, with a target amount of the combined bonus value to equal a specific percentage of the executive's base salary. In general, the annual performance bonus is intended to be consistent with the company's applicable bonus programs, which are based on the achievement of individual initiatives as well as company performance for the year to which they relate. In 2015, the annual performance bonus as a percentage of the base salary for each NEO was:
Name | Annual Performance Bonus as Percentage of Base Salary | |||
|---|---|---|---|---|
Chris Concannon | 220 | % | ||
Joe Ratterman | 200 | % | ||
Brian N. Schell | 132 | % | ||
Mark Hemsley | 162 | % | ||
Chris Isaacson | 135 | % | ||
Bryan Harkins | 149 | % | ||
Beginning in 2016, we are considering establishing a targeted short-term incentive for the CEO and each NEO based on the achievement of corporate, department and individual goals established at the beginning of the year, which will be approved by the Compensation Committee and the board of directors and paid in January of the following year.
Long-Term Equity Compensation
Our equity awards provide long-term incentives to our NEOs. We believe that equity grants align the interests of our NEOs with our stockholders, provide our NEOs with incentives linked to long-term performance and create an ownership culture. Our equity incentives have been granted in the form of non-statutory stock options and restricted stock. The vesting features of our stock option and restricted stock grants support our retention goals, as time-vesting provides an incentive to our NEOs to remain in our employ and grow the value of the company during the vesting period. In 2015, restricted stock awards were granted to the NEOs.
Restricted stock and stock options granted to the NEOs under the 2009 Plan and the 2012 Plan (as described below) vest in equal annual installments over four years. Furthermore, stock options granted under the 2009 Plan are currently fully vested and stock options granted the 2012 Plan fully vest upon the occurrence of a change in control (as defined in the 2012 plan).
In 2015, we did not establish criteria for granting equity awards to the NEOs, either with respect to timing or amount, in keeping with our historical practice. Rather, in determining the amount of restricted stock to be granted to the NEOs in 2015, our board of directors took into account the following factors:
We are in the process of reviewing the structure of annual long-term incentives for each NEO in 2016. The Compensation Committee will consider a number of factors when it grants the 2016 awards, which may include the company's performance, individual performance, market conditions, earnings, market share, the launch of this offering, and market conditions.new products and system launches.
Following this offering, we anticipate that we will continue to use equity awards as part of our executive compensation program.
Other Benefits
Our NEOs are eligible to participate in the same benefit programs, perquisites and other fringe benefits that are broadly available to other senior executives in the country where they are employed, and under the same terms and conditions and at the same levels as other employees, subject to any limitations required by the benefit plans themselves such as compensation limits imposed by the Internal Revenue Service, or IRS.
Retirement Savings Opportunity
All employees in the United States are eligible to participate in a 401(k) plan, which we refer to as the U.S. Retirement Plan. Under the U.S. Retirement Plan, we match employee contributions dollar for dollar up to 5% of eligible compensation (not to exceed the IRS deferral contribution limit). Participants are 100% vested in all plan contributions. All employees of BATS Chi-XBats Europe are eligible to participate in a stakeholder or self-invested personal pension arrangement, which we refer to as the BATS Chi-XBats Europe Retirement Plans. Under the BATS Chi-XBats Europe Retirement Plans, we match contributions up to 5% of annual salary and plan participants are 100% vested in all plan contributions. The U.S. Retirement Plan and the BATS Chi-XBats Europe Retirement Plans are defined contribution pension plans.
Health and Welfare Benefits
All full-time employees, including our NEOs, may participate in our health and welfare benefit programs including gym memberships. In addition, we provide, and pay the premiums for, life insurance, accidental death and dismemberment and long-term disability coverage.
Perquisites
As a general matter, we do not offer perquisites to any executive officer, including the NEOs, with an aggregate value in excess of $10,000 annually because we believe we can provide better incentives for desired performance with compensation in the forms described above. We recognize that, from time to time, it may be appropriate to provide some perquisites or other benefits in order to attract, motivate and retain our executive officers, and may do so in the future.
2015 Named Executive Officer Compensation Decisions
Consistent with the processes described above, the discretionary cash bonus component of the total 2015 compensation for our NEOs (other than the CEO and Chairman) was subjectively determined by the CEO in consultation with the Compensation Committee based on the achievement of individual initiatives as well as our performance for the year to which they relate. In the case of the CEO, this compensation element was subjectively determined by the compensation committees of the boards of directors of our subsidiary registered securities exchange companies in consultation with the
Compensation Committee, and based on the achievement of individual initiatives as well as company performance for the year to which they relate. These payouts were not based on a specific formula or individual performance targets. The Compensation Committee and the CEO considered each individual's performance and contributions to our performance, as described below. In the case of the Chairman, this compensation element was subjectively determined by the Compensation Committee based on the overall results of the company and the successful transition of the new CEO.
Joe Ratterman served as Chairman from June 2007 until July 2012, as President from June 2007 until November 2014 and as Chief Executive Officer from June 2007 until March 2015. He currently serves as non-executive Chairman, which became effective March 2015. Mr. Ratterman's talents and leadership have been, and continue to be, critical to our success. Under his leadership, we acquired BATS Chi-XBats Europe in 2011, which when combined with our existing European operations became the largest pan-European equities trading venue, and Direct Edge in 2014, which when combined with our existing U.S. operations became the second largest U.S. listed cash equities trading venue. He developed a CEO succession plan in 2014 and oversaw its seamless implementation in 2015. Mr. Ratterman's compensation reflects his 2015 role in these efforts. Mr. Ratterman's leadership was instrumental in enabling our revenues less cost of revenues and Normalized EBITDA to increase 210% and 297%, respectively, from 2010 to 2014. See "Management's Discussion and Analysis of Financial Condition and Results of Operations" for additional information and a reconciliation of net income to Normalized EBITDA.
Chris Concannon joined us in 2014 as President and became CEO in March 2015. He also serves as a director on our board. Mr. Concannon was the principal architect of the BATSBats Hotspot Acquisition and helped guide the company to record high revenues less costs of revenues, as well as Normalized EBITDA. See "Management's Discussion and Analysis of Financial Condition and Results of Operations" for additional information and a reconciliation of net income to Normalized EBITDA.
Brian N. Schell joined us as Chief Financial Officer, or CFO, in March 2011. Mr. Schell is responsible for our overall financial management and human resources and administrative support activities. He also oversees the marketing and communications activities, as well as other administrative functions, including our office space lease negotiations. During 2015, Mr. Schell negotiated key aspects of the BATSBats Hotspot Acquisition, as well as arranging the financing to complete the transaction. He also led our readiness to become Sarbanes-Oxley Act compliant and directed the improved quality and timing of our financial information and reporting.
Mark Hemsley joined us in April 2008 as Chief Executive Officer and Chairman of BATSBats Europe. Mr. Hemsley played a critical role in the acquisition and subsequent integration of BATS Chi-XBats Europe, which when combined with our existing European operations became the largest pan-European market venue. As the Chief Executive Officer of BATS Chi-XBats Europe since November 2011, Mr. Hemsley also maintained BATS Chi-XBats Europe's ranking as the largest exchange operator in Europe by market share as well as introduced a number of new products, including BXTR, Europe's largest OTC trading reporting facility. He was also responsible for the acquisition of 25% of EuroCCP and a key contributor to the launch of the BATSBats Hotspot London matching engine.
Chris Isaacson is a founding employee and served as our Chief Operating Officer, or COO, from June 2007 to February 2014 and has served as Global Chief Information Officer, or CIO, from February 2014. As CIO he oversees all technology and market operations for the company globally, including technology strategy, software engineering and quality, as well as IT infrastructure and security. During 2015, he led the flawless launch or migration of eight of BATS'Bats' ten markets with no material operational downtime. This included the Direct Edge equities exchanges to the BATSBats technology platform, migrating the U.S. equities and option exchanges to a new data center, the launch of a new U.S. options exchange, which included new matching engine technology, a new FX matching engine in London and migrating the existing FX platform in the U.S. to a new data center.
Mr. Isaacson was also instrumental in the achieving the cost synergy targets associated with the Chi-X Europe acquisition, Direct Edge Acquisition and BATSBats Hotspot Acquisition.
Bryan Harkins was a founding employee of Direct Edge and served as its COO from 2011 until the Direct Edge Acquisition. In February 2014 he joined BATSBats and was named Head of U.S. Markets, overseeing sales, product development, new listings and competitive strategy for BATS'Bats' U.S. equities and options exchanges. He also led the expansion of the company's U.S. suite of market data and access services as well as our push to be the number one ETP marketplace. In addition, he led the development and implementation of strategic pricing initiatives in our U.S. Equities and U.S. Options segments, which resulted in record market share levels in each of those markets—21.7% in the U.S. Equities segment and 10.9% in the U.S. Options segment during the third quarter of 2015. These operating segments also reached record levels of profitability as a direct result of these pricing changes and market share gains. See "Management's Discussion and Analysis of Financial Condition and Results of Operations" for additional information.
Each of these achievements and goals was taken into account when establishing each NEO's compensation (e.g., base salary and equity grants) in 2015.
Allocation Between Current and Long-Term Compensation
Historically, we have not adopted any policies with respect to current compensation versus long-term compensation, but believed that both elements are necessary for achieving our compensation objectives. Current compensation consists of base salary and quarterly and annual cash bonuses. Long-term compensation has been provided with grants of equity in the form of stock options and restricted stock. Base salary provides financial stability for each of our NEOs and increases in base salary, as determined by our CEO in consultation with the Compensation Committee, provide a reward for short-term company and individual performance. Annual cash bonuses likewise provide a reward for short-term company and individual performance. Long-term equity compensation rewards achievement of strategic long-term objectives and contributes toward overall stockholder value.
Beginning in 2016, we willWe plan to establish ranges for the ratio of long-term compensation to total compensation, which will be approved by the Compensation Committee and the board of directors. The ranges will be based upon level of current and potential job responsibility and market data.
Allocation Between Cash and Non-Cash Compensation
Historically, we have not adopted any policies with respect to cash versus non-cash compensation (or among different forms of non-cash compensation). We have determined that it is important to encourage or provide for a meaningful amount of equity ownership by our NEOs to help align their interests with those of stockholders, one of our compensation objectives. The allocation between cash and non-cash compensation has been based on a number of factors, including each NEO's performance objectives and our retention objectives and may vary from year to year. In 2015, the allocation was 65% non-cash compensation for Mr. Concannon and ranged from 30% to 40% for the NEOs other than Mr. Concannon.
Beginning in 2016, we are establishingWe plan to establish ranges for the ratio of long-term compensation to total compensation, which will be approved by the Compensation Committee and the board of directors. The ranges will be based upon level of current and potential job responsibility and market data.
Employment Agreements
Each of the NEOs in the United States is a party to an employment agreement. The employment agreement forThrough December 31, 2015, each of the NEOs in the United States except for Mr. Harkins, provide that the NEOs are "at will" employees and that thewas a party to an employment relationship between us and our NEOs may be terminated at any timeagreement, each of which was replaced by either party with or without cause or advance notice. Thesea new employment agreement effective January 1, 2016. The prior employment agreements, alsoto the extent that they provide that during the employment period, the NEOs will not, anywhere within the United Statesseverance benefits, are described below under "Potential Payments Upon Termination or Canada, engageChange in competitive activities or solicit our customers or customerControl."
prospects. During the employment period and for the two (2) years following termination of employment, the NEOs will not directly or indirectly solicit our employees. Additionally, the employment agreements assign ownership of inventions and work product to us and requires the NEO to protect our confidential information. The NEOs are not entitled to compensation of any kind under their respective employment agreements.
Mr. Harkins is a party of an employment agreement dated as of August 23, 2013 which provides for a three (3) year term with automatic one-year annual extensions, provided neither party gives the requisite advance notice to the other party. Under this agreement, he is entitled to a specified base salary, as well as an annual performance bonus target of 100% of his base salary, payable as a combination of restricted stock and cash. Mr. Harkins' employment agreement provides that during the employment and for twenty-four (24) months following termination of employment, Mr. Harkins will not directly or indirectly solicit our employees, customers or customer prospects. Additionally, during the employment and for twelve (12) months following termination of employment, Mr. Harkins will not begin employment with or provide any material assistance to: (i) any company primarily engaged in the business of operating an exchange, facility, ECN, ATS or MTF (as such terms are defined under the applicable agreement), for the trading of equity and/or options securities; or (ii) any full service broker dealer to the extent that Mr. Harkins' primary area of responsibility will be the support of said broker-dealer's ECN or ATS business lines.
Each BATS Chi-X Europe employee located in the United Kingdom, including Mr. Hemsley, is a party to a service agreement with BATS Chi-X Europe, which we refer to as the Service Agreement. Under the Service Agreement, Mr. Hemsley is provided a basic salary (subject to annual review by our board of directors) and is eligible to participate in the Milestone Bonus Plan and any share scheme in operation for employees of comparable status. He is entitled to an annual contribution to a personal pension scheme up to a maximum of the lesser of £10,000 and 5% of his basic salary. Employment continues until terminated on 90 days' written notice by either party (unless an immediate termination is warranted under the terms of the Service Agreement or termination is due to ill health or injury). During the period after either party has given notice to terminate the employment relationship, the Garden Leave Period, Mr. Hemsley is entitled to his basic salary and contractual benefits. Alternatively, we may choose to pay Mr. Hemsley his basic salary and contractual benefits in lieu of all or part of any period of notice. Mr. Hemsley may not compete directly or indirectly with us or any of our affiliates for a period of 12 months following termination, less any Garden Leave Period. For a period of six months following termination, less any Garden Leave Period, he may not be involved, directly or indirectly, in any facility whose primary line of business is the supply of certain restricted services. Additionally, Mr. Hemsley may not solicit any key employee of ours or any of our affiliates for a period of 12 months following termination, less any Garden Leave Period. Under the Service Agreement, Mr. Hemsley has assigned to us ownership of inventions and creative works.
Each of the NEOs, except for Mr. Ratterman, is anticipated to be a party to a newan employment agreement effective January 1, 2016.2016, which we refer to collectively as the Employment Agreements. The duration of each employment agreement will beEmployment Agreement is three (3) years, with automatic one-yearone year annual extensions, provided neither party gives the requisite advance notice to the other party. Notwithstanding the foregoing, the employment agreementEmployment Agreement and the corresponding employment relationship between us and our NEOs may be terminated at any time by either party with or without cause or advance notice.
The employment agreements willEmployment Agreements provide that during the employment period and for the twelve (12) months following termination of employment, the NEO will not engage in competitive activities or solicit our employees, customers or customer prospects. Additionally, the employment agreements willEmployment Agreements assign ownership of inventions and work product to us and requires the NEO to protect our confidential information.
Severance and Change of Control Arrangements
Our employees and executive officers may be eligible to receive certain severance benefits upon the involuntary termination of their employment without cause. Following the execution of the employment agreements effective January 1, 2016, ourOur NEOs, except for Mr. Ratterman, willare generally be entitled to certain contractual severance benefits as set forth in their respective employment agreements.Employment Agreements.
Our United States-based employees are eligible for severance pay and benefits under an adopted severance policy once they have been employed for a period not less than one year. The terms of the severance pay and benefits shall be derived by the respective employee's years of service and include severance payments ranging from three to six months' base salary plus COBRA benefits during the applicable coverage period. Our United Kingdom-based employees are generally entitled to basic salary and contractual benefits during any Garden Leave Period (or payment in lieu thereof). Payment of severance is conditioned on the execution of a release of claims in favor of the company.
Our employees and executive officers are eligible for certain accelerated vesting of their equity awards in connection with certain terminations of employment and a Change of Control event pursuant to the terms of the applicable equity plan. Such protections are provided to minimize uncertainty for our executive officers and employees. Further terms of these agreements are described below under "Potential Payments Upon Termination or Change ofin Control."
Additional information on the severance policy and treatment of equity awards is provided under the section "Potential Payments Upon Termination or Change ofin Control."
Stock Ownership Guidelines
Historically, our NEOs have not been subject to mandated stock ownership or stock retention guidelines. However, we believe it is important for our NEOs to be owners in the company to ensure the alignment of goals with the best interests of our stockholders. We expectIn connection with this offering, we have established guidelines of equity ownership for the CEO equivalent to adoptfive times his base salary and for Executive Vice Presidents equivalent to three times their respective base salaries. Each has a formal stocktransition period of five years to achieve the guidelines. Until the guidelines are achieved, the CEO and the NEOs will not be permitted to reduce their respective equity ownership policyunless approved by the board of directors in connection with this offering.Compensation Committee.
Tax Deductibility of Executive Compensation
Section 280G of the Internal Revenue Code of 1986, as amended to the date hereof, or the Code, provides that executive officers, certain stockholders and certain other service providers could be subject to significant additional taxes if they receive payments or benefits in connection with a change in control of our company that exceed certain limits. Section 409A of the Code also imposes additional
significant taxes on the individual for deferred compensation that does not meet the requirements of Section 409A. We do not provide any NEO with a gross-up or other reimbursement for tax amounts the executive officer might pay pursuant to Section 280G or Section 409A of the Code.
Section 162(m) of the Code imposes a $1 million cap on federal income tax deduction for compensation paid to our CEO and to certain other highly compensated officers during any fiscal year unless the compensation is "qualified performance-based compensation" under Section 162(m). Under a special Section 162(m) exception, subject to certain conditions, compensation paid pursuant to a compensation plan in existence before the effective date of this offering will not be subject to the $1,000,000 limitation until the earliest of: (i) the expiration of the compensation plan, (ii) a material modification of the compensation plan (as determined under Section 162(m)), (iii) the issuance of all the employer stock and other compensation allocated under the compensation plan, or (iv) the first meeting of stockholders at which directors are elected after the close of the third calendar year following the year in which the offering occurs.
While we cannot predict how this deductibility limit may impact our compensation program in future years, we intend to maintain an approach to executive compensation that strongly links pay to
performance. Although deductibility of compensation is preferred, tax deductibility is not a primary objective of our compensation programs. We believe that achieving our compensation objectives set forth above is more important than the benefit of tax deductibility, and we reserve the right to maintain flexibility in how we compensate our NEOs, which may result in limited deductibility of amounts of compensation from time to time.
The following table sets forth information concerning the annual and long-term compensation for services to the company earned by our NEOs in 2015.
Name and Principal Position | Year | Salary ($) | Bonus(1) ($) | Restricted Stock Awards(2) ($) | Non-Equity Incentive Plan Compensation(3) ($) | All Other Compensation(4) ($) | Total ($) | Year | Salary ($) | Bonus(1) ($) | Restricted Stock Awards(2) ($) | Non-Equity Incentive Plan Compensation(3) ($) | All Other Compensation(4) ($) | Total ($) | ||||||||||||||||||||||||||||||
|---|---|---|---|---|---|---|---|---|---|---|---|---|---|---|---|---|---|---|---|---|---|---|---|---|---|---|---|---|---|---|---|---|---|---|---|---|---|---|---|---|---|---|---|---|
Chris Concannon | 2015 | $ | 1,200,000 | $ | — | $ | 2,639,965 | $ | 225,600 | $ | 14,299 | $ | 4,079,864 | 2015 | $ | 1,200,000 | $ | — | $ | 2,639,965 | $ | 225,600 | $ | 14,299 | $ | 4,079,864 | ||||||||||||||||||
Joe Ratterman | 2015 | 900,000 | 1,500,000 | 299,969 | 169,200 | 14,509 | 2,883,678 | 2015 | 900,000 | 1,500,000 | 299,969 | 169,200 | 14,509 | 2,883,678 | ||||||||||||||||||||||||||||||
Brian N. Schell | 2015 | 454,167 | 264,750 | 335,243 | 85,650 | 14,551 | 1,154,361 | 2015 | 454,167 | 264,750 | 335,243 | 85,650 | 14,551 | 1,154,361 | ||||||||||||||||||||||||||||||
Mark Hemsley | 2015 | 716,254 | 343,868 | 817,232 | 120,784 | 13,508 | 2,011,646 | |||||||||||||||||||||||||||||||||||||
Mark Hemsley | 2015 | 716,254 | 343,868 | 817,232 | 120,784 | 13,508 | 2,011,646 | |||||||||||||||||||||||||||||||||||||
Chris Isaacson | 2015 | 500,000 | 337,500 | 337,494 | 119,000 | (7) | 27,006 | 1,321,000 | 2015 | 500,000 | 337,500 | 337,494 | 119,000 | (7) | 27,006 | 1,321,000 | ||||||||||||||||||||||||||||
Bryan Harkins | 2015 | 454,167 | 198,000 | 476,983 | 78,750 | 15,257 | 1,223,157 | 2015 | 454,167 | 198,000 | 476,983 | 78,750 | 15,257 | 1,223,157 | ||||||||||||||||||||||||||||||
Name | Retirement Plan Match(8) ($) | Life Insurance Premiums ($) | Gym Membership ($) | Payout for Earned Vacation ($)(9) | Gifts/Awards ($) | Total ($) | |||||||||||||
|---|---|---|---|---|---|---|---|---|---|---|---|---|---|---|---|---|---|---|---|
Chris Concannon | $ | 13,250 | $ | 945 | $ | — | $ | — | $ | 104 | $ | 14,299 | |||||||
Joe Ratterman | 13,250 | 1,155 | — | — | 104 | 14,509 | |||||||||||||
Brian N. Schell | 13,250 | 1,197 | — | — | 104 | 14,551 | |||||||||||||
Mark Hemsley(6) | 6,962 | 5,658 | 888 | — | — | 13,508 | |||||||||||||
Chris Isaacson | 13,250 | 756 | — | 12,896 | 104 | 27,006 | |||||||||||||
Bryan Harkins | 13,250 | 1,103 | 800 | — | 104 | 15,257 | |||||||||||||
The aggregate amount of perquisites and other personal benefits did not exceed $10,000 for any of the NEOs.
salary and bonus reflect his role as Chief Executive Officer through March 2015 and as an employee assisting with Mr. Concannon's transition during the remainder of 2015.
Grants of Plan-Based Awards
The following table sets forth information concerning grants of plan-based awards made to the executive officers named in the Summary Compensation Table during our fiscal year ended December 31, 2015.
| | | | Estimated Possible Payouts Under Non-Equity Incentive Plan Awards | All Other Stock Awards: Number of Shares of Stock or Units(#) | Grant Date Fair Value of Stock and Option Awards | |||||||||||||||||
|---|---|---|---|---|---|---|---|---|---|---|---|---|---|---|---|---|---|---|---|---|---|---|
Name | Grant Date | Date of Board Action | Threshold(1) ($) | Target(2) ($) | Maximum(1) ($) | |||||||||||||||||
Chris Concannon | 12/1/2015 | 11/11/2015 | N/A | $ | 180,000 | N/A | 57,478 | $ | 2,639,965 | |||||||||||||
Joe Ratterman | 12/1/2015 | 11/11/2015 | N/A | 135,000 | N/A | 6,531 | 299,969 | |||||||||||||||
Brian N. Schell | 12/1/2015 | 11/11/2015 | N/A | 68,125 | N/A | 7,299 | 335,243 | |||||||||||||||
Mark Hemsley(3) | 12/1/2015 | 11/11/2015 | N/A | 107,438 | N/A | 17,793 | 817,232 | |||||||||||||||
Chris Isaacson | 12/1/2015 | 11/11/2015 | N/A | 75,000 | N/A | 7,348 | 337,494 | |||||||||||||||
Bryan Harkins | 12/1/2015 | 11/11/2015 | N/A | 68,125 | N/A | 10,385 | 476,983 | |||||||||||||||
Description of Equity Incentive Plans
Effective April 3, 2009, we adopted the BATSBats Global Markets, Inc. 2009 Stock Option Plan, or 2009 Plan. The following description sets forth the material terms of the 2009 Plan, which is incorporated herein by reference.
Outstanding stock options currently provide the option holder the right to purchase our common stock following satisfaction of vesting conditions. Following the closing of the offering, each outstanding stock option will provide the option holder the right to purchase one share of common stock. The outstanding stock option awards do not reflect the reclassification and stock split described in this prospectus.
Purpose
The purpose of the 2009 Plan is to promote the long-term growth and profitability of the company and its affiliates by providing individuals who are and will be involved in the company's and its
affiliates' growth with an opportunity to acquire an ownership interest in the company. We expect that we will benefit from the added interest that such officers, directors, and employees will have in our welfare as a result of their proprietary interest in our success.
Shares Available Under the 2009 Plan
As of September 30,December 31, 2015, we had 543,603 stock options outstanding under the 2009 Plan. As a result, we have no shares of our common stock remaining that may be subject to option awards under the 2009 Plan, subject to adjustment in the event of any merger, consolidation, reorganization, recapitalization, reincorporation, stock dividend, dividend in property other than cash, stock split, liquidating dividend, combination of shares, exchange of shares, change in corporate structure or other transaction not involving the receipt of consideration by us. Shares issued under the 2009 Plan must be previously unissued or reacquired shares. If any award expires or terminates without having been exercised in full, the shares that are not acquired may again be issued under the 2009 Plan. No new awards may be made under the 2009 Plan after the effective date of the registration statement of which this prospectus is a part. The outstanding stock option awards do not reflect the reclassification and stock split described in this prospectus.
Eligibility
All of our employees, officers and directors, and all of the employees, officers and directors of any of our affiliates, who are designated as eligible by our CEO, board of directors or Compensation Committee may receive awards under the 2009 Plan. As of September 30,December 31, 2015, 50 employees hold outstanding awards under the 2009 Plan.
Administration
The 2009 Plan is administered by our CEO. Our CEO has the authority to interpret the 2009 Plan and the awards granted under it, to establish, amend and revoke the rules and procedures for its administration and to make any other determination and take any other action necessary or desirable for the administration of the 2009 Plan. Our CEO has discretion to select the participants and determine the form, amount and timing of each award, the exercise price and term associated with the award, the conditions and methods of exercise, settlement, cancellation, forfeiture or suspension of the award and all other terms and conditions of the award. However, only the board of directors may select and grant awards to our officers and directors or to any eligible participant if such award would allow the participant to purchase 100,000 or more shares of common stock (either alone or in conjunction
with prior stock option awards). The board of directors may delegate the authority to administer all aspects of the 2009 Plan to the Compensation Committee.
Amendment and Termination
In general, our board of directors may amend, alter or suspend the 2009 Plan. However, any such action that adversely affects the rights of an option holder in any outstanding options requires such holder's consent. In addition, except for certain adjustments for changes in stock, any material increase in the total number of shares available for options under the 2009 Plan and any material increase of benefits accruing under the 2009 Plan require stockholder approval. Stockholder approval is also required to the extent any proposed amendment would require stockholder approval under applicable laws, regulations or exchange rules or to the extent that the amendment increases the number of shares authorized under the 2009 Plan. The board of directors has the authority to amend the terms of any award agreement provided that such action does not adversely affect the rights of the option holder.
Form of Awards
Awards under the 2009 Plan are in the form of options not intended to qualify as "incentive stock options" under Section 422 of the Code, with the following terms:
If an option holder exercises an option after termination of service, we have a right to make a cash payment in lieu of delivering shares. We may also elect to redeem all or a portion of shares received by such holder within 90 days following termination of service for any reason.
We intend to file with the SEC a registration statement on Form S-8 covering the shares of our common stock issuable under the 2009 Plan.
Third Amended and Restated 2012 Equity Incentive Plan
Effective May 30, 2012, we adopted the BATSBats Global Markets, Inc. 2012 Equity Incentive Plan, or 2012 Plan. We amended and restated the 2012 Plan effective February 11, 2015. The following description sets forth the material terms of the 2012 Plan, which is incorporated herein by reference.
Purpose
The purpose of the 2012 Plan is to promote the long-term growth and profitability of the company and its affiliates by providing individuals who are and will be involved in the company's and its affiliates' growth with an opportunity to acquire an ownership interest in the company, and to
strengthen the mutuality of interests between such individuals and our stockholders. We expect that we will benefit from the added interest that such officers, directors, and employees will have in our welfare as a result of their proprietary interest in our success.
Eligibility
All of our employees, officers, directors and consultants and all of the employees, officers, directors and consultants of any of our affiliates, who are designated as eligible by our board of directors or Compensation Committee may receive awards under the 2012 Plan. As of September 30,December 31, 2015, 28one director and 34 employees hold outstanding awards under the 2012 Plan.
Administration
The 2012 Plan is administered by our Compensation Committee, or such other committee as may be designated by our board from time to time. If the board of directors does not designate a committee, the 2012 Plan will be administered by our board. The Compensation Committee may delegate one or more
officers of the company the authority to grant awards under the 2012 Plan. The Compensation Committee has the authority to interpret the 2012 Plan and the awards granted under it, to establish, amend and revoke the rules and procedures for its administration and to make any other determination and take any other action necessary or desirable for the administration of the 2012 Plan. The Compensation Committee will have discretion to select the participants and determine the form, amount and timing of each award, the terms and conditions associated with the award, the conditions and methods of exercise, settlement, cancellation, forfeiture or suspension of the award and all other terms and conditions of the award. However, only the board of directors may select and grant awards to our Section 16 officers and directors.
Shares Available Under the 2012 Plan
The maximum shares available for issuance under the 2012 Plan is 1,275,000. As of September 30,December 31, 2015, we had 125,151 stock options outstanding and 400,077305,095 shares of restricted stock issuedunvested under the 2012 Plan. As a result, net of shares forfeited, we had a remaining total of 811,655700,259 shares of our common stock that may be subject to awards under the 2012 Plan, subject to adjustment in the event of any merger, consolidation, reorganization, recapitalization, reincorporation, stock dividend, dividend in property other than cash, stock split, liquidating dividend, combination of shares, exchange of shares, change in corporate structure or other transaction not involving the receipt of consideration by us. Shares issued under the 2012 Plan must be previously unissued or reacquired shares. If any award expires or terminates without having been exercised in full, the shares that are not acquired may again be issued under the 2012 Plan. No new awards may be made under the 2012 Plan after the effective date of the registration statement of which this prospectus is a part. The outstanding stock option awards do not reflect the stock split described in this prospectus.
Options. The Compensation Committee may grant nonqualified stock options under the 2012 Plan, with terms and conditions determined by the Compensation Committee that are not inconsistent with the 2012 Plan; provided that all stock options granted under the 2012 Plan are required to have a per share exercise price that is not less than 100% of the fair market value of the our common stock underlying such stock options on the date such stock options are granted. The maximum term for stock options granted under the 2012 Plan will be ten years from the initial date of grant. The purchase price for the common stock shares as to which a stock option is exercised may be paid to us, to the extent permitted by law, (i) in cash or its equivalent at the time the stock option is exercised; (ii) in common stock shares having a fair market value equal to the aggregate exercise price of the stock option being exercised (provided that such shares are not subject to any pledge or other security interest); (iii) if there is a public market for the common stock shares at such time, through the delivery of irrevocable instructions to a broker to sell the common stock shares being acquired upon the exercise of the stock
option and to deliver to us the amount of the proceeds of such sale equal to the aggregate exercise price of the stock option being exercised; (iv) through a "net exercise" procedure effected by withholding the minimum number of common stock shares needed to pay the exercise price and any applicable required withholding taxes; or (v) by any combination of the foregoing. Any fractional shares of common stock will be settled in cash. Generally, our stock award agreements provide for vesting in equal annual increments over four years from the date they are granted. Stock options expire upon the earlier of ten years after the date of grant or 90 days after termination of service for any reason other than cause (other than termination of service due to death or disability, in which case the options may be exercised within six months thereafter). Upon a participant's termination for cause, any stock options held by such participant are immediately cancelled and may not be exercised even if vested at the time of termination. If an option holder exercises an option after termination of service, we have a right to make a cash payment in lieu of delivering shares. We may also elect to redeem all or a portion of shares received by such holder within six months following termination of service for any reason.
Restricted Stock and Restricted Stock Units. The Compensation Committee may grant restricted shares of our stock or restricted stock units, or RSUs, representing the right to receive, upon vesting
and the expiration of any applicable restricted period, one share of common stock for each RSU. As to restricted shares of our common stock, subject to the other provisions of the 2012 Plan, the holder will generally have the rights and privileges of a stockholder as to such restricted shares of common stock, including, without limitation, the right to vote such restricted shares of common stock. To the extent provided in the applicable award agreement, the holder of outstanding RSUs will be entitled to be credited with dividend equivalent payments (upon the payment by us of dividends on shares of common stock) either in cash or, at the sole discretion of the Compensation Committee, in shares of common stock having a value equal to the amount of such dividends, which will be payable at the same time as the underlying RSUs are settled following the release of the restrictions on such RSUs. A participant will have no rights or privileges as a stockholder as to RSUs. Unless otherwise provided in the applicable award agreement, any restricted stock award or RSUs shall be forfeited in the event of a termination of service prior to the end of the applicable restriction period. We may also elect to redeem all or a portion of shares received by such holder within six months days following termination of service for any reason.
Effect of a Change of Control on Awards. In the event of a change of control of the company, unless otherwise provided in the applicable award agreement, the Compensation Committee may provide for (i) continuation or assumption of outstanding awards under the 2012 Plan by the company or the surviving corporation; (ii) substitution by the surviving corporation of awards with substantially the same terms and value for the outstanding awards; (iii) acceleration of the vesting and lapse of any restrictions or right to exercise outstanding awards as of the change of control, and the expiration of outstanding awards to the extent not timely exercised by the date of the change of control; or (iv) in the case of stock options, cancellation in consideration of a payment in cash or other consideration to the participant who holds the stock options in an amount equal to the value of the stock options. If an award is continued or assumed by the company or the surviving corporation or substituted by the surviving corporation, and unless otherwise provided in the applicable award agreement, in the event of a termination of service other than for cause during the 12-month period following a change of control, any stock options awarded under the 2012 Plan but not previously exercisable and vested will become fully exercisable and vested, and the restrictions applicable to any award of restricted stock or RSUs will lapse and the awards will be deemed fully vested and, in the case of RSUs, settled.
Amendment and Termination
In general, our board of directors may amend, alter, suspend or terminate the 2012 Plan. However, any such action that adversely affects the rights of a participant under any outstanding award requires such participant's consent. Stockholder approval is also required to the extent any proposed amendment would require stockholder approval under applicable laws, regulations or exchange rules. The board of directors has the authority to amend the terms of any award agreement provided that such action does not adversely affect the rights of the participant.
No new awards may be made under the 2012 Plan after the effective date of the registration statement of which this prospectus is a part. We have adopted the Bats Global Markets, Inc. 2016 Omnibus Incentive Plan for use after the effective date of the registration statement, the material terms of which are described below.
We intend to file with the SEC a registration statement on Form S-8 covering the shares of our common stock issuable under the 2012 Plan.
In connection with this offering, we plan to adopt a new long-term incentive plan, pursuant to which we will be permitted to grant a variety of equity-based and cash-based incentive awards. A description of this plan will be provided once it has been adopted.
Outstanding Equity Awards at Fiscal Year End
The following table sets forth information concerning unexercised options, stock that has not vested and equity incentive plan awards for the executive officers named in the Summary Compensation Table as of the end of our fiscal year ended December 31, 2015.
Outstanding Equity Awards at Fiscal Year-End
| | Option Awards | Stock Awards | |||||||||||||||||
|---|---|---|---|---|---|---|---|---|---|---|---|---|---|---|---|---|---|---|---|
Name | Number of Securities Underlying Unexercised Options (#) Exercisable(1) | Number of Securities Underlying Unexercised Options (#) Unexercisable(1) | Option Exercise Price ($) | Option Expiration Date | Number of shares that have not vested | Market value of shares that have not vested | |||||||||||||
Chris Concannon | 54,884 | 164,654 | $ | 36.44 | 11/28/2024 | 98,641 | $ | 4,530,581 | |||||||||||
Joe Ratterman | — | — | N/A | N/A | 6,531 | 299,969 | |||||||||||||
Brian N. Schell | — | — | N/A | N/A | 23,782 | 1,092,307 | |||||||||||||
Mark Hemsley | 10,837 | — | 28.63 | 1/30/2020 | 48,250 | 2,216,123 | |||||||||||||
Chris Isaacson | 10,837 | — | 16.38 | 4/29/2019 | 15,626 | 717,702 | |||||||||||||
| 43,349 | — | 28.63 | 1/30/2020 | N/A | N/A | ||||||||||||||
Bryan Harkins | — | — | N/A | N/A | 25,687 | 1,179,804 | |||||||||||||
The outstanding awards set forth in the table do not reflect the reclassification and stock split described in this prospectus.
None of our NEOs held stock awards (other than stock options and restricted stock) during the fiscal year ended December 31, 2015.
Option Exercises
There were no options exercised by any NEO during the fiscal year ended December 31, 2015.
Pension Plans
Other than our U.S. Retirement Plan and the BATS Chi-XBats Europe Retirement Plans, which are defined contribution plans, we do not have any plan that provides for payments or other benefits at, following, or in connection with, retirement.
Nonqualified Deferred Compensation Table
We do not have any plan that provides for the deferral of compensation on a basis that is not tax qualified.
Potential Payments Upon Termination or Change in Control
As of December 31, 2015, none of the NEOs, except for Mr. Harkins and Mr. Hemsley, is covered by an employment agreement that addresses payment upon a termination or change in control.
Under Mr. Harkins' employment agreement, upon a termination of Mr. Harkins' employment by us involuntarily without cause or by Mr. Harkins for good reason, he is entitled to: (i) 100% of his annual base salary, (ii) an amount equal to 100% of his average annual incentive (as defined in his employment agreement), (iii) the cost of COBRA premiums payable over twelve (12) months, and
(iv) his pro rata bonus as of the date of termination. Mr. Harkins is also entitled to certain severance compensation and benefits upon a change in control. Under his employment agreement, if, within the eighteen (18) month period occurring immediately after a change in control, Mr. Harkins is involuntarily terminated by us without cause or Mr. Harkins voluntarily terminates his employment for good reason, he is entitled to: (i) 150% of his annual base salary, (ii) an amount equal to 150% of his target bonus, (iii) the cost of twelve (12) months of COBRA premiums payable in a lump sum and (iv) his pro rata bonus as of the date of termination.
Under Mr. Hemsley's Service Agreement, a U.K. governed document, other than termination due to ill health or injury or events where an immediate termination is permitted under the agreement, we must provide him with 90 days' written notice of termination of employment. In the event he is unable to work due to ill health or injury for an aggregate period of 130 working days in a 12-month period, his employment may be terminated with notice of the statutory minimum plus one week. During the period following provision of notice of termination, the Garden Leave Period, Mr. Hemsley is entitled to his basic salary and contractual benefits. In our discretion, we may pay Mr. Hemsley basic salary and other contractual benefits in lieu of all or part of any notice period.
Effective as of January 1, 2016, each of the NEOs, except for Mr. Ratterman, is expected to be a party to a new employment agreementan Employment Agreement providing for severance and other termination benefits. Upon a termination of an NEO's employment by us involuntarily without cause (in the case of Mr. Hemsley, following our provision of 90 days' written notice) or by the NEO for good reason, he will beis entitled to: (i) 100% of his annual base salary, (ii) an amount equal to 100% of his target bonus, (iii) the cost of COBRA premiums (or, in case of Mr. Hemsley, reimbursement for insurance premiums) payable over twelve (12) months, and (iv) his pro rata bonus as of the date of termination based on actual performance. Upon a voluntary termination of an NEO's employment without Good Reason, he will beis entitled to 100% of his annual base salary during such time that the company elects to enforce the NEO's covenant not to compete. For a fuller description of this and other restrictive covenants see "Employment"—Employment Agreements" above. Each of the NEOs will also beis entitled to certain severance compensation and benefits upon a change in control. The employment agreements willEmployment Agreements provide that if, within the twenty-four (24) month period occurring immediately after a change in control, an NEO is involuntarily terminated by us
without cause or the NEO voluntarily terminates his employment for good reason, he is entitled to: (i) 200% of his annual base salary, (ii) an amount equal to 200% of his target bonus, (iii) the cost of twelve (12) months of COBRA premiums (on, in the case of Mr. Hemsley, reimbursement for insurance premiums) payable in a lump sum, (iv) his pro rata bonus as of the date of termination based on target performance, and (v) the accelerated vesting of all outstanding equity awards held by the NEO.
If among other reasons, an NEO resigns voluntarily without good reason, retires, dies or becomes disabled, or an NEO's employment is terminated for cause, the NEO typically will not receive any cash severance benefits.benefits (except for the payment of the NEO's pro rata bonus based on actual performance as of the date of termination due to the NEO's death or disability). The NEOs may choose to continue medical and dental benefits through COBRA or their respective insurance at their own cost.
Pursuant to the terms of the Milestone Bonus Plan, employees who terminate employment with us for any reason are entitled to receive payment for milestone points earned during their period of employment for which no payment had been made prior to termination.
Under the 2009 Plan, all unvested stock options fully vest upon a Change of Control event. Under the 2012 Plan, restricted stock and stock options are not subject to accelerated vesting upon termination of employment absent any Change of Control event. Restricted stock and stock options granted under the 2012 Plan and held by the NEOs are subject to accelerated vesting upon the death or disability of the NEO or upon termination of the NEO's employment by the company without cause within twelve (12) months following a Change of Control event.
Quantification of Payments
The table below reflects the amount of compensation payable to our NEOs as of December 31, 2015 in the event of a termination of employment on the terms described in the footnotes. We have assumed that all expenses for which the NEO might be entitled to reimbursement have already been repaid as of December 31, 2015, and that no mitigating circumstances exist that would allow us to decrease the payments. Amounts that have been paid or are payable in all events, such as the amounts earned with respect to fiscal year 2015 under the Milestone Bonus Plan and disclosed in the Non-Equity Incentive Plan Compensation column of the Summary Compensation Table above, are not included.
Name | Base Salary | Annual Bonus | Annual Incentive(1) | Contractual Benefits | Total | Base Salary | Annual Bonus | Annual Incentive(1) | Contractual Benefits | Total | ||||||||||||||||||||||
|---|---|---|---|---|---|---|---|---|---|---|---|---|---|---|---|---|---|---|---|---|---|---|---|---|---|---|---|---|---|---|---|---|
Chris Concannon | — | — | — | — | — | — | — | — | — | — | ||||||||||||||||||||||
Joe Ratterman | — | — | — | — | — | — | — | — | — | — | ||||||||||||||||||||||
Brian N. Schell | — | — | — | — | — | — | — | — | — | — | ||||||||||||||||||||||
Mark Hemsley(2) | $ | 176,610 | — | — | $ | 4,513 | $ | 181,123 | $ | 176,610 | — | — | $ | 4,513 | $ | 181,123 | ||||||||||||||||
Chris Isaacson | — | — | — | — | — | — | — | — | — | — | ||||||||||||||||||||||
Bryan Harkins | 500,000 | $ | 500,000 | $ | 450,000 | — | 1,450,000 | 500,000 | $ | 500,000 | $ | 450,000 | — | 1,450,000 | ||||||||||||||||||
The table below reflects the amount of compensation payable to our NEOs as of December 31, 2015 in the event of change of control. We have assumed that all expenses for which the NEO might be entitled to reimbursement have already been repaid as of December 31, 2015, and that no mitigating circumstances exist that would allow us to decrease the payments. Amounts that have been paid or are payable in all events, such as the amounts earned with respect to fiscal year 2015 under the Milestone Bonus Plan and disclosed in the Non-Equity Incentive Plan Compensation column of the Summary Compensation Table above, are not included.
Name | Base Salary | Unvested Equity Compensation(1) | Annual Bonus | Total | |||||||||
|---|---|---|---|---|---|---|---|---|---|---|---|---|---|
Chris Concannon | — | $ | 6,093,193 | — | $ | 6,093,193 | |||||||
Joe Ratterman | — | 299,969 | — | 299,969 | |||||||||
Brian N. Schell | — | 1,092,307 | — | 1,092,307 | |||||||||
Mark Hemsley | — | 2,216,123 | — | 2,216,123 | |||||||||
Chris Isaacson | — | 717,702 | — | 717,702 | |||||||||
Bryan Harkins | — | 1,179,804 | — | 1,179,804 | |||||||||
underlying common stock on December 31, 2015 less the strike price times the number of shares accelerated.
The table below reflects the amount of compensation payable to our NEOs as of December 31, 2015 in the event of a termination in connection with change of control. We have assumed that all expenses for which the NEO might be entitled to reimbursement have already been repaid as of December 31, 2015, and that no mitigating circumstances exist that would allow us to decrease the payments. Amounts that have been paid or are payable in all events, such as the amounts earned with respect to fiscal year 2015 under the Milestone Bonus Plan and disclosed in the Non-Equity Incentive Plan Compensation column of the Summary Compensation Table above, are not included.
Name | Base Salary | Unvested Equity Compensation(1) | Annual Bonus | Total | |||||||||
|---|---|---|---|---|---|---|---|---|---|---|---|---|---|
Chris Concannon | — | $ | 6,093,193 | — | $ | 6,093,193 | |||||||
Joe Ratterman | — | 299,969 | — | 299,969 | |||||||||
Brian N. Schell | — | 1,092,307 | — | 1,092,307 | |||||||||
Mark Hemsley | — | 2,216,123 | — | 2,216,123 | |||||||||
Chris Isaacson | — | 717,702 | — | 717,702 | |||||||||
Bryan Harkins | $ | 750,000 | (2) | 1,179,804 | $ | 500,000 | 2,429,804 | ||||||
Bats Global Markets, Inc. Employee Stock Purchase Plan
We have previously adopted the BATSBats Global Markets, Inc. Employee Stock Purchase Plan, which we refer to as the ESPP, the purpose of which is to provide our employees with an opportunity to purchase our stock at a discount and thus encourage broad-based employee ownership of our stock. The ESPP incorporates a tax-advantage element for eligible UK employees, known as the BATSBats UK Share Incentive Plan, which we refer to as the SIP.Plan.
Shares Available Under the ESPP
The aggregate number of shares authorized for sale under the ESPP may not exceed 100,000 shares.
Administration
The Committee administers the ESPP and has the authority to interpret, construe, apply and make final determinations regarding the ESPP, including authority to determine eligibility under the ESPP and the terms and conditions of any purchase right under the ESPP.
Offering Period
The ESPP permits consecutive bi-annual offering periods, with a new offering period commencing approximately every six months, as determined by the Committee.
Eligibility
Any of our active employees who have completed at least six (6) months of employment as a full-time employee of the company is eligible to participate in the ESPP.
Purchase Right
On the first day of each offering period, each eligible employee will be granted a right to purchase on the purchase date a number of shares that shall not exceed in one year a maximum of $25,000 of Discounted Shares (as defined in the ESPP as shares sold by the company at a discount of up to 10% of fair market value) and $25,000 of Non-Discounted Shares (as defined in the ESPP). Eligible U.K. employees may purchase up to £1,800 (or, if lower, 10% of salary) of non-discounted Shares under the SIPBats UK Share Incentive Plan element and up to £30,000 of non-discounted Shares outside of the SIPBats UK Share Incentive Plan element.
Termination of Employment
Unless otherwise determined by us, upon a participant's employment termination for any reason, he or she will be deemed to have elected to withdraw from the ESPP and the payroll deductions credited to his or her account but not yet used to purchase shares under the ESPP will be returned to him or her.
AfterWe have adopted the Bats Global Markets, Inc. 2016 Employee Stock Purchase Plan for use after the effective date of the registration statement, we anticipate adopting a new employee stock purchase plan,the material terms of which will be intended to qualify as an "employee stock purchase plan" for purposes of Section 423 of the Code and will include a similar SIP element to the current ESPP and which will replace the current ESPP. A description of this plan, including the SIP element, will be provided once it has been adopted.are described below.
BATSBats Global Markets, Inc. Share Repurchase Plan
We have previously adopted the BATSBats Global Markets, Inc. Employee Share Repurchase Plan, providing for the repurchase of shares by the company during 2015. We do not anticipate adopting a similar share repurchase program in 2016. The plan iswas open to all employees and covers all shares owned by such employees (including vested restricted stock, but excluding unvested restricted stock and vested or unvested stock options). During the first open window
of the year, the company offered to repurchase shares of all former employees, which was the only opportunity for former employees to participate in the plan, unless the Boardboard of directors determines otherwise. During the year, an employee may request the repurchase of up to the lesser of 5,000 shares or 25% of the eligible shares owned by such employee as of January 1, 2015, unless the aggregate value of stock submitted for repurchase exceeds the annual limits established by the Board.board of directors. If the aggregate value of shares submitted for repurchase exceeds the threshold established for the applicable repurchase window, the company will repurchase shares on a pro rata basis. All share repurchases must be approved by the CEO and the Executive Vice President, General Counsel and Secretary. The company is under no obligation to repurchase shares at any time and no repurchase window will be available during any period in which the company's management team is in possession of material non-public information regarding the company.
Director Compensation
None of our employee directors receive compensation for their board service. Following this offering,Effective January 1, 2016, we have adopted the Bats Global Markets, Inc. Non-Employee Directors Compensation Policy, which we refer to as the Directors Compensation Policy, which establishes compensation to be paid to each of our non-employee directors are expected to receive compensation that is commensurate with arrangements offered to directors of newly public companies. We have not nor do we expect to compensate our employee directors for their service on ourdirectors. Our board of directors. We also expectdirectors may amend, revise, suspend, discontinue or terminate the Director Compensation Policy at any time. The following is a summary of the material terms of the Directors Compensation Policy, which is qualified in its entirety by reference to reimbursethe Directors Plan attached as Exhibit 10.14 to this registration statement.
Under the Director Compensation Policy, all non-employee directors will receive the following annual retainers:
Board Service | Retainer (Annualized) ($) | |||
|---|---|---|---|---|
Board Retainer | 180,000 | |||
Chairman Retainer (inclusive of Board Retainer) | 360,000 | |||
Audit Committee Chair Fee | 40,000 | |||
Audit Committee Member Fee | 20,000 | |||
Compensation Committee Chair Fee | 20,000 | |||
Compensation Committee Member Fee | 10,000 | |||
Nominating and Corporate Governance Committee Chair Fee | 15,000 | |||
Nominating and Corporate Governance Committee Member Fee | 7,500 | |||
The retainers are payable in the form of a combination of cash and restricted stock, ranging from 50% to 100% restricted stock, at the non-employee director's election. The cash component of retainers and committee fees are payable quarterly in arrears, and the restricted stock component of retainer and committee fees is granted on the date of our annual general meeting of stockholders. The number of shares underlying such grants of restricted stock will be determined by dividing the portion of the annual retainer that the non-employee director elects to take in the form of restricted stock by the fair market value of a share of our common stock on the grant date. The restricted stock will vest 100% on the first anniversary of the grant date, subject to the terms and conditions of the Directors Compensation Plan (see "—Bats Global Markets, Inc. 2016 Non-Employee Directors Compensation Plan" below for reasonable out-of-pocket expenses that they incurmore information). If any non-employee director fails to make such an election prior to the initial cash payment date of each year, such non-employee director will receive 50% of his or her retainer in connectionthe form of restricted stock, with their service as directors,all remaining compensation payable in accordance with our general expense reimbursement policies. Our independentcash.
The committee fees are payable in the form of a combination of cash and restricted stock, ranging from 0% to 100% restricted stock, at the non-employee director's election. The number of shares underlying such grants of restricted stock will be determined by dividing the portion of the committee
directors may also be eligiblefees that the non-employee director elects to receivetake in the form of restricted stock options and other equity-based awards when, as and if determined by the Compensation Committee,fair market value of a share of our common stock on the grant date. The restricted stock will vest 100% on the first anniversary of the grant date, subject to applicable director-specific limits.the terms and conditions of the Directors Compensation Plan.
Any non-employee director who commences service on our board of directors on a date other than the date of our annual general meeting of stockholders will receive retainers and committee fees pro-rated as of such start date and payable only in cash.
If any non-employee director ceases to be a member of our board of directors before the expiration of his or her term, all unvested restricted stock will be forfeited and he or she will be paid a pro-rata portion of his or her retainer and committee fees.
Risk Analysis of Compensation Program
We do not believe that our compensation programs encourage excessive or unnecessary risk taking. Our base salaries are fixed in amount; therefore we do not view them as encouraging risk taking. All employees are eligible to participate in the Milestone Bonus Plan. Quarterly cash bonuses are awarded under the Milestone Bonus Plan and represent a small portion of each employee's total compensation. These awards are tied to both company and department performance. We believe our Milestone Bonus Plan is designed to focus on achieving meaningful milestones that help us grow and appropriately balance risk with goals that promote the overall success of our company. Each NEO is also eligible for an annual discretionary bonus that is tied to his or her short-term and long-term performance and achievements. Because the bonuses are designed to focus eligible employees on our corporate success, we believe the bonus programs do not encourage excessive or unnecessary risk taking.
We also at times provide stock option awards, subject to multi-year vesting schedules, that help further align the interests of our employees with the interests of our stockholders.
Our Compensation Committee, which will be composed entirely of independent directors, reviews our compensation plans and policies periodically to ensure proper alignment with overall company goals and objectives. The Compensation Committee also reviews the risks arising from our compensation policies and practices and assesses whether any such risks are reasonably likely to have a material adverse effect on us. Our Compensation Committee has concluded that our compensation programs do not encourage excessive or unnecessary risk taking.
BATSBats Global Markets, Inc. Cash Incentive Plan
We may adopthave adopted the BATSBats Global Markets, Inc. Cash Incentive Plan, which we refer to as the Incentive Plan, providing for the payment of cash incentive awards to our employees, including our NEOs. The following summary of the NEOs. If adopted, ourIncentive Plan is qualified in its entirety by reference to the Incentive Plan as attached as Exhibit 10.6 to this registration statement. Our Compensation Committee, in consultation, as applicable, with the compensation committee or regulatory oversight committee of the board of directors of BZX, BYX, EDGX and EDGA, or such other committee as may be designated by the board of directors from time to time, will establish the terms and provisions of any awards under the Incentive Plan, including employees eligible to participate, the period to which the incentive awards relate, applicable "clawback" or recoupment provisions and other features as it may determine in its discretion. Incentive awards may be discretionary or earned based on factors, criteria or objectives determined by the Compensation Committee which may include our performance or the performance of our affiliates or divisions, the personal goals of the individual participant or any other criteria established by the Compensation Committee. Incentive awards under this plan are paid in cash following the completion of each bonus period. The Incentive Plan will be unfunded and may be modified or terminated at any time in the discretion of our board of directors.
Bats Global Markets, Inc. 2016 Omnibus Incentive Plan
We have adopted the Bats Global Markets, Inc. 2016 Omnibus Incentive Plan, which we refer to as the Omnibus Plan, which will become effective upon the completion of this offering. The Omnibus Plan permits us to grant an array of equity-based and cash incentive awards to our NEOs and other employees and service providers. The following is a summary of the material terms of the Omnibus Plan and is qualified in its entirety by reference to the Omnibus Plan attached as Exhibit 10.11 to this registration statement.
Plan Term
The Omnibus Plan expires after ten years, unless prior to that date the maximum number of shares of our common stock available for issuance under the plan has been issued or our board of directors terminates the plan.
Authorized Shares
Subject to adjustment as described below, 4,074,000 shares of our common stock (giving effect to the consummation of the stock split to be effected prior to the completion of this offering) are available for awards to be granted under the Omnibus Plan (representing 4.2% of our issued and outstanding shares at the consummation of this offering). No participant may receive under the Omnibus Plan in any calendar year options and stock appreciation rights that relate to more than 873,000 shares (giving effect to the consummation of the stock split to be effected prior to the completion of this offering), restricted stock and restricted stock unit awards that relate to more than 363,750 shares (giving effect to the consummation of the stock split to be effected prior to the completion of this offering), or share-based performance awards and other share-based awards that relate to more than 363,750 shares (giving effect to the consummation of the stock split to be effected prior to the completion of this offering), in each case subject to adjustment. No participant may receive under the Omnibus Plan in any calendar year cash-based performance awards or other cash-based awards that relate to more than $10,000,000. If an award (other than a replacement award) expires or is cancelled, forfeited, otherwise terminates or is settled in cash, in whole or in part, without the delivery of such shares, then the shares covered by such award will again be available for issuance under the Omnibus Plan. Shares tendered or withheld in payment of an exercise price or for withholding taxes also will be available for issuance under the Omnibus Plan. Shares underlying replacement awards will not reduce the number of shares available for issuance under the Omnibus Plan.
Administration
Unless otherwise determined by our board of directors, our Compensation Committee, in consultation, as applicable, with the compensation committee or regulatory oversight committee of the board of directors of BZX, BYX, EDGX and EDGA, or such other committee as may be designated by the board of directors from time to time, administers the Omnibus Plan and will have authority to: designate participants; determine the types of awards (including replacement awards) to be granted to each participant; determine the number of shares to be covered by awards (or with respect to which payments, rights or other matters are to be calculated in connection with awards); determine the terms and conditions of awards; determine whether, to what extent and under what circumstances awards may be settled or exercised in cash, shares, other awards, other property or net settlement; determine the circumstances under which awards may be canceled, forfeited, suspended, or subject to accelerated vesting; determine whether, and to what extent and under what circumstances cash, shares of our common stock and other awards may be deferred automatically or at the election of the holder or our Compensation Committee; amend the terms or conditions of outstanding awards, including to accelerate the time or times at which an award becomes vested, unrestricted or may be exercised; correct any defect, supply any omission and reconcile any inconsistency in the Omnibus Plan or any
award to carry the Omnibus Plan into effect; interpret and administer the Omnibus Plan and any instrument or agreement relating to, or award made under, the Omnibus Plan; establish, amend, suspend or waive rules and regulations and appoint agents and other individuals for the proper administration of the Omnibus Plan; and make any other determination and take any other action that it deems necessary or desirable to administer the Omnibus Plan.
Types of Awards
The Omnibus Plan provides for grants of stock options, stock appreciation rights, restricted stock, restricted stock units, performance awards, other share-based awards or other cash-based awards.
Eligibility
Our employees, officers, non-employee directors and consultants will be eligible to receive awards under the Omnibus Plan.
Adjustments
If our Compensation Committee determines that an adjustment is appropriate to prevent the enlargement or dilution of benefits, it will, subject to compliance with Section 409A of the Internal Revenue Code adjust equitably the terms of any outstanding awards and the number of shares of our common stock issuable under the Omnibus Plan to reflect any change in the shares of our common stock resulting from a dividend or other distribution, recapitalization, stock split, reverse stock split, reorganization, merger, consolidation, separation, rights offering, split-up, spin-off, combination, repurchase or exchange of our common stock or other securities, issuance of warrants or other rights to purchase our common stock or other securities, issuance of our common stock pursuant to the anti-dilution provisions of our securities, or any other similar corporate transaction or event affecting our common stock, or changes in applicable laws, regulations or accounting principles.
Termination of Service
Our Compensation Committee will determine the effect of a termination of employment or service on outstanding awards, including whether the awards will vest, become exercisable, settle or be forfeited. The Omnibus Plan provides the following, although the Compensation Committee may specify the effect of termination of employment or service in the applicable award agreement:
Change of Control
The Compensation Committee may set forth in the applicable award agreement or employment agreement the treatment of an award upon a change of control. The Omnibus Plan permits the Committee to implement the following choices for treatment:
The Omnibus Plan generally defines a "change of control" to mean:
A change of control event will not be deemed to have occurred unless such event qualifies as a change of control under Section 409A of the Internal Revenue Code.
Amendment and Termination
Our board of directors may amend, alter, suspend, discontinue or terminate the Omnibus Plan, subject to approval of our stockholders if required by applicable law or the rules of the stock exchange on which our shares are principally traded. Our Compensation Committee may amend, alter, suspend, discontinue or terminate, or waive any conditions or rights under, any outstanding award. However, no such board of directors or Compensation Committee action that would materially adversely affect the rights of a holder of an outstanding award may be taken without the holder's consent, except to the extent that such action is taken to cause the Omnibus Plan to comply with applicable law, stock market
or exchange rules and regulations, or accounting or tax rules and regulations, or to impose any "clawback" or recoupment provisions on any awards in accordance with the Omnibus Plan.
In addition, our Compensation Committee may amend the Omnibus Plan or create sub-plans in such manner as may be necessary to enable the plan to achieve its stated purposes in any jurisdiction in a tax-efficient manner and in compliance with local rules and regulations.
Cancellation or "Clawback" of Awards
Our board of directors may, to the extent permitted by applicable law and stock exchange rules or by any of our policies, cancel or require reimbursement of any awards granted, shares issued or cash received upon vesting, exercise or settlement of any awards granted under the Omnibus Plan or the sale of shares underlying such awards.
Prohibition on Repricing
Subject to the adjustment provision summarized above, our Compensation Committee may not directly or indirectly, through cancellation or regrant or any other method, reduce, or have the effect of reducing, the exercise or hurdle price of any award established at the time of grant without approval of our stockholders.
We intend to file with the SEC a registration statement on Form S-8 covering the shares of our common stock issuable under the Omnibus Plan.
Bats Global Markets, Inc. 2016 Non-Employee Directors Compensation Plan
We have adopted the Bats Global Markets, Inc. 2016 Non-Employee Directors Compensation Plan, which we refer to as the Directors Plan, which allows us to grant cash retainers, stock options, restricted stock, RSUs, performance awards (shares or cash), other share-based awards and other cash-based awards. The following is a summary of the material terms of the Directors Plan, which is qualified in its entirety by reference to the Directors Plan attached as Exhibit 10.12 to this registration statement.
Purpose
The purpose of the Directors Plan is to attract and retain the services of experienced non-employee directors.
Plan Term
The Directors Plan will expire after ten years following the effective date of this offering. However, the plan will expire sooner if, prior to that date, the maximum number of shares of our common stock available for issuance under the Directors Plan has been issued or our board of directors terminates the plan.
Authorized Shares
Subject to adjustment (as described below), 291,000 shares of our common stock (giving effect to the consummation of the stock split to be effected prior to the completion of this offering) are available for awards to be granted under the Directors Plan (other than replacement awards) (representing 0.3% of our issued and outstanding shares at the consummation of this offering). No participant may receive under the Directors Plan in a calendar year awards that relate to more than 72,750 shares (giving effect to the consummation of the stock split to be effected prior to the completion of this offering). If an award (other than a replacement award) expires, is forfeited, is canceled, otherwise terminates or is settled for cash, in whole or in part, without the delivery of shares,
the shares covered by such award will again be available for issuance under the Directors Plan. Shares tendered or withheld in payment of an exercise price or in respect of taxes will also be available for issuance under the Directors Plan.
Administration
Our board of directors will administer the Directors Plan and will have authority to: designate participants; determine the types of awards (including replacement awards) to be granted to each participant; determine the number of shares to be covered by awards (or with respect to which payments, rights or other matters are to be calculated in connection with awards); determine the terms and conditions of awards; determine whether, to what extent and under what circumstances awards may be settled or exercised in cash, shares, other awards, other property or net settlement; determine the circumstances under which awards may be canceled, forfeited, suspended, or subject to accelerated vesting; determine whether, and to what extent and under what circumstances cash, shares of our common stock and other awards may be deferred automatically or at the election of the holder or our board of directors; amend the terms or conditions of outstanding awards, including to accelerate the time or times at which an award becomes vested, unrestricted or may be exercised; correct any defect, supply any omission and reconcile any inconsistency in the Directors Plan or any award to carry the Directors Plan into effect; interpret and administer the Directors Plan and any instrument or agreement relating to, or award made under, the Directors Plan; establish, amend, suspend or waive rules and regulations and appoint agents and other individuals for the proper administration of the Directors Plan; and make any other determination and take any other action that it deems necessary or desirable to administer the Directors Plan.
Eligibility
Each regular, active member or prospective director of the company or any of our affiliates (that is, entities that we directly or indirectly control or in which we have a significant equity interest, in each case determined by our board of directors, or any other entity which our board of directors determines should be treated as our affiliate), who is not our employee or an employee of any of our affiliates will be eligible to receive an award under the Directors Plan.
Adjustments
In the event that our board of directors determines that, as result of any dividend or other distribution, recapitalization, stock split, reverse stock split, reorganization, merger, consolidation, separation, rights offering, split-up, spin-off, combination, repurchase or exchange of our shares or other securities, issuance of warrants or other rights to purchase our shares or other securities, issuance of our shares pursuant to the anti-dilution provisions of our securities, or other similar corporate transaction or event affecting our shares, or of changes in applicable laws, regulations or accounting principles, an adjustment is appropriate to prevent dilution or enlargement of the benefits or potential benefits intended to be made available under the Directors Plan, our board of directors will, subject to compliance with Section 409A of the Code, adjust equitably any or all of:
In addition, our board of directors is authorized to adjust the terms and conditions of, and the criteria included in, outstanding awards in recognition of events (including those events described
above) affecting Bats or the financial statements of Bats, or changes in applicable laws, regulations or accounting principles, whenever our board of directors determines that such adjustments are appropriate in order to prevent dilution or enlargement of the benefits or potential benefits intended to be made available under the Directors Plan.
Types of Awards
Our board of directors is authorized to grant stock options, restricted stock, RSUs, performance awards (shares or cash), other share-based awards, other cash-based awards and retainers (see "—Director Compensation" above for more details) to our non-employee directors.
Retainers
Our board of directors is authorized, subject to limitations under applicable law, to grant annual cash retainers to non-employee directors for service as a member of the board of directors or a committee of the board or as chair or lead director of the board or any such committee. These retainers may be received in shares of our common stock at the election of the directors. Shares issued to participants pursuant to such an election will not count against the aggregate share limit (as described above).
Automatic Grants
Our board of directors or a committee of the board may institute, by resolution, automatic award grants to new and to continuing members of our board of directors, and determine the number and type of such awards, the terms and conditions of such awards and the criteria for the grant of such awards.
Separation from Service and Change of Control
Our board of directors will determine the effect of a separation from service from the board of directors on outstanding awards, including whether the awards will vest, become exercisable, settle or be forfeited. In the event of a "change of control" (as defined under the Omnibus Plan and summarized above), except as otherwise provided in the applicable award agreement, our board of directors may provide for:
Amendment and Termination
Our board of directors may amend, alter, suspend, discontinue or terminate the Directors Plan, subject to approval of our stockholders if required by applicable law or the rules of the stock exchange
on which our shares are principally traded. Our board of directors may also amend, alter, suspend, discontinue or terminate, or waive any conditions or rights under, any outstanding award. However, subject to the adjustment provision and change of control provision (each summarized above), any such action by our board of directors that would materially adversely affect the rights of a holder of an outstanding award may not be taken without the holder's consent, except (i) to the extent that such action is taken to cause the Directors Plan to comply with applicable law, stock market or exchange rules and regulations or accounting or tax rules and regulations or (ii) to impose any "clawback" or recoupment provisions on any awards in accordance with the Directors Plan.
In addition, our board of directors may amend the Directors Plan or create sub-plans in such manner as may be necessary to enable the plan to achieve its stated purposes in any jurisdiction in a tax-efficient manner and in compliance with local rules and regulations. In the event of our dissolution or liquidation, each award will terminate immediately prior to the consummation of such action, unless otherwise determined by our board of directors.
Cancellation or "Clawback" of Awards
Any award which is subject to recovery under any law, government regulation or stock exchange listing requirement will be subject to such deductions and clawbacks as may be required to be made pursuant to such law, government regulation or stock exchange listing requirement (or any policy adopted by Bats pursuant to any such law, government regulation or stock exchange listing requirement).
Prohibition on Repricing
Subject to the adjustment provision summarized above, our board of directors may not directly or indirectly, through cancellation or regrant or any other method, reduce, or have the effect of reducing, the exercise or hurdle price of any award established at the time of grant without approval of our shareholders.
We intend to file with the SEC a registration statement on Form S-8 covering the shares of our common stock issuable under the Directors Plan.
2016 Employee Stock Purchase Plan
We have adopted the Bats Global Markets, Inc. 2016 Employee Stock Purchase Plan, which we refer to as the 2016 ESPP, which permits our employees to contribute up to 15% of base salary and commissions to purchase our shares at a discount, as described below under "—Purchases." The 2016 ESPP incorporates a tax-advantage element for eligible UK employees, known as the Bats UK Share Incentive Plan. The following is a summary of the material terms of the 2016 ESPP and is qualified in its entirety by reference to the 2016 ESPP attached as Exhibit 10.13 to this registration statement.
Purpose
The purpose of the 2016 ESPP is to facilitate our employees' participation in the ownership and economic progress of Bats by providing our employees with an opportunity to purchase shares of our common stock. The 2016 ESPP and the options to purchase shares of our common stock granted to participants under the 2016 ESPP are intended to qualify under the provisions of Sections 421 and 423 of the Internal Revenue Code.
Plan Term
The 2016 ESPP is scheduled to expire ten-years following the effective date of this offering. The term will expire sooner if, prior to the end of the ten-year term, the maximum number of shares
available for issuance under the 2016 ESPP has been issued, our stockholders do not approve the 2016 ESPP within 12 months after the date the 2016 ESPP is adopted by our board of directors or our board of directors terminates the 2016 ESPP.
Authorized Shares and Share Limits
Subject to adjustment (as described below), 582,000 shares of our common stock (giving effect to the consummation of the stock split to be effected prior to the completion of this offering) are available for sale under the 2016 ESPP (representing 0.6% of our issued and outstanding shares at the consummation of this offering). A participant may not purchase more than a maximum of 4,365 shares of our common stock (giving effect to the consummation of the stock split to be effected prior to the completion of this offering) during any single offering period. The Compensation Committee, may, for future offering periods, increase or decrease, in its absolute discretion, the maximum number of shares of common stock that an eligible employee may purchase during each purchase period of an offering period.
Authorized and unissued shares of our common stock or shares reacquired by us may be made subject to purchase under the 2016 ESPP, as determined in the discretion of our Compensation Committee or our board of directors. If any purchase of shares of our common stock pursuant to an option under the 2016 ESPP is not consummated for any reason, the shares subject to such option may be again made available for sale under the 2016 ESPP.
Administration
Our Compensation Committee will administer the 2016 ESPP and will have authority to: designate participants (subject to Section 423 of the Internal Revenue Code); determine all questions with regards to rights of employees, including but not limited to, eligibility to participate in the 2016 ESPP and the range of permissible percentages of payroll deductions and the maximum amount; adopt rules of procedure and regulations necessary for the administration of the 2016 ESPP (provided that such rules are not inconsistent with the terms of the plan) and enforce the terms of the 2016 ESPP and regulations adopted; direct the administration of the 2016 ESPP; direct or cause the distribution of shares of our common stock purchased under the 2016 ESPP; furnish or cause to be furnished to us information required for tax or other purposes; engage the service of counsel and agents whom it may deem advisable to assist it with the performance of its duties; prescribe procedures to be followed by eligible employees to participate in the 2016 ESPP; receive from us, our subsidiaries and each eligible employee information necessary for the proper administration of the 2016 ESPP; maintain separate accounts in the name of each participant; interpret and construe the 2016 ESPP in its sole discretion, correct any defect, supply any omission or reconcile any inconsistency in the 2016 ESPP to carry the 2016 ESPP into effect; and make any changes or modifications necessary to administer and implement the provisions of the 2016 ESPP in any foreign country to the fullest extent possible.
Eligibility
Our employees (including employees of our designated subsidiaries) whose customary employment is for more than five months per year and at least 20 hours per week, and who have completed 90 days of service with us on the first day of any offering period (as summarized below), may participate in the 2016 ESPP, except that no employee will be eligible to participate in the 2016 ESPP if, immediately after the grant of an option to purchase shares under the 2016 ESPP, that employee would own 5% of the total combined voting power or value of all classes of our common stock. In addition, employees who are citizens or residents of a foreign jurisdiction will be prohibited from participating in the 2016 ESPP if the grant of an option to such employees would be prohibited under the laws of such foreign jurisdiction or if compliance with the laws of such foreign jurisdiction would cause the 2016 ESPP to violate the requirements of Section 423 of the Internal Revenue Code.
Participation
In order to participate in the 2016 ESPP, an employee who is eligible at the beginning of an offering period will authorize payroll deductions of up to 15% of base salary and commissions on an after-tax basis for each pay date during the offering period. A participant may not make any separate cash payment into his or her account or alter the amount of his or her payroll deductions during an offering period, but may withdraw from participation (as summarized below).
The Compensation Committee may adopt and amend stock purchase sub-plans with respect to employees of non-U.S. Designated Subsidiaries with such provisions as the Compensation Committee may deem appropriate to conform with local laws, practices and procedures. All such sub-plans shall be subject to the limitations on the number of shares that may be issued under the 2016 ESPP and shall be subject to all of the provisions of the 2016 ESPP but shall be considered separate offerings.
No participant may accrue options to purchase shares of our common stock at a rate that exceeds $25,000 in fair market value of our stock (determined at the time such options are granted) for each calendar year in which such rights are outstanding at any time. Eligible U.K. employees also may purchase up to £1,800 (or, if lower, 10% of salary) of non-discounted shares under the Bats UK Share Incentive Plan element of the 2016 ESPP.
Offering Periods
The 2016 ESPP provides for offering periods every six months, with purchases being made on the last day of each offering period. The initial offering period under the 2016 ESPP will commence on the first subscription date following the effective date of this offering and will terminate on the earlier of the last day of the calendar quarter or the calendar year in which the effective date of this offering occurs.
Purchases
On the last day of an offering period, also referred to as the exercise date, a participant's accumulated payroll deductions are used to purchase shares of our common stock. The exercise price per share offered in a given offering period shall be the lesser of (i) 90% of the fair market value of a share on the offering date for the applicable offering period or (ii) 90% of the fair market value of a share on the applicable exercise date.
Participants are not entitled to any dividends or voting rights with respect to options to purchase shares of our common stock under the 2016 ESPP. Shares received upon exercise of an option shall be entitled to receive dividends on the same basis as other outstanding shares of our common stock.
Withdrawal and Termination of Employment
A participant can withdraw all, but not less than all, of the payroll deductions credited to his or her account for the applicable offering period by delivery of notice up to a certain number of days prior to the exercise date to be specified by the Compensation Committee or to be provided for in the applicable subscription agreement. If a participant's employment is terminated on or before the exercise date (including due to retirement or death), the participant will be deemed to have elected to withdraw from the 2016 ESPP, and the accumulated payroll deductions held in the participant's account will be returned to the participant or his or her beneficiary (in the event of the participant's death).
Adjustments Upon Changes in Capitalization and Certain Transactions
In the event of a merger, reorganization, consolidation, recapitalization, dividend or distribution, stock split, reverse stock split, spin-off or other similar transaction or other change in corporate structure affecting shares of our common stock or their value, or any unusual or reoccurring
transactions or events affecting us or any changes in applicable laws, regulations or accounting principles, our Compensation Committee, in its sole discretion, is authorized to take action to:
Amendment and Termination
Our board of directors may amend, alter, suspend, discontinue or terminate the 2016 ESPP or any portion thereof at any time and for any reason, except that our board of directors may not, without stockholder approval, increase the maximum number of shares of common stock that may be issued under the 2016 ESPP (except pursuant to or in connection with a change in capitalization or other transaction summarized above). Except as required to comply with Section 423 of the Internal Revenue Code, as required to obtain a favorable tax ruling from the Internal Revenue Service, or as specifically provided in the 2016 ESPP, no such amendment, alteration, suspension, discontinuation or termination of the 2016 ESPP may be made to an outstanding option which adversely affects the rights of any participant without the consent of such participant.
We intend to file with the SEC a registration statement on Form S-8 covering the shares of our common stock issuable under the 2016 ESPP.
CERTAIN RELATIONSHIPS AND RELATED TRANSACTIONS
Certain of our principal investors were, immediately prior to this offering, the beneficial owners of more than 5% of our capital stock, and certain affiliates of these principal investors are also our customers. Our principal investors include ISE, BGM Holding, L.P. and its affiliates and affiliates of Bank of America Merrill Lynch, Citadel, Citigroup, Credit Suisse, Deutsche Bank Securities, Goldman Sachs, Instinet, J.P. Morgan, Knight Capital, Lime, Morgan Stanley, Tradebot Ventures and WEDBUSH. For ownership interests of certain of these related parties in our company immediately prior to the initial public offering, see "Principal and Selling Stockholders."
Trading Activity
As a result of equity trading activity by these parties, we receive transaction fees related to trades that removed liquidity from BZX and EDGX or added liquidity to BYX and EDGA and for routing fees. Since November 2008, these fees have been assessed by BZX and BYX, and since March 2009, these fees have been assessed by EDGA and EDGX, pursuant to standardized fee schedules that are published and effective upon filing with the SEC under Section 19 of the Exchange Act and Rule 19b-4 thereunder. In addition, we pass along Section 31 fees, which are calculated based on a rate set by the SEC, to BZX, BYX, EDGA and EDGX customers, and recognize an equivalent amount as regulatory transaction fee revenue. Finally, we receive other fees from our BZX, BYX, EDGA and EDGX customers, including port fees for access to our platform and market data products revenues.
We also pay, as a result of such equity trading activity, liquidity payments for trades that added liquidity to BZX and EDGX or removed liquidity from BYX and EDGA and routing and clearing payments for routing to other markets and clearing services. Since November 2008, these payments have been made by BZX and BYX, and since March 2009, these fees have been made by EDGA and EDGX, pursuant to standardized fee schedules that are published and effective upon filing with the SEC under Section 19 of the Exchange Act and Rule 19b-4 thereunder.
We receive transaction fees and pay liquidity payments related to trading in Europe. BTL charges transaction fees and pays liquidity payments based on a published fee schedule. We also receive other fees in Europe from our customers, including port fees and market data products.
As a result of currency trading activities by these related parties, we receive transaction fees related to trades that execute on our Hotspot foreign currency market.
The transaction fees and regulatory transaction fees that we received from related parties and the liquidity payments and routing and clearing payments that we made to related parties are summarized in the charts below. These numbers include fees from and payments to entities that have merged with or were acquired by affiliates of our principal investors. These numbers also include Direct Edge and Hotspot activity from the date of their respective acquisitions, January 31, 2014 and March 13, 2015, respectively. Such fees and payments have at all times been on terms no more favorable than those given to customers who are not related parties.
| | Nine Months Ended September 30, 2015 | Year Ended December 31, | Year Ended December 31, | | ||||||||||||||||||||||
|---|---|---|---|---|---|---|---|---|---|---|---|---|---|---|---|---|---|---|---|---|---|---|---|---|---|---|
Fees Received from Related Parties | 2014 | 2013 | 2012 | 2015 | 2014 | 2013 | | |||||||||||||||||||
| | (in millions) | (in millions) | | |||||||||||||||||||||||
Transaction fees | $ | 453.0 | $ | 494.6 | $ | 293.9 | $ | 303.9 | $ | 582.4 | $ | 436.4 | $ | 222.3 | ||||||||||||
As a percentage of total transaction fees | 46.7 | % | 49.0 | % | 48.0 | % | 47.1 | % | 45.1 | % | 43.2 | % | 36.3 | % | ||||||||||||
Regulatory transaction fees | $ | 90.6 | $ | 191.5 | $ | 81.4 | $ | 94.3 | $ | 129.8 | $ | 158.5 | $ | 63.4 | ||||||||||||
As a percentage of total regulatory transaction fees | 43.8 | % | 70.4 | % | 63.4 | % | 63.7 | % | 47.1 | % | 58.3 | % | 49.8 | % | ||||||||||||
| | Nine Months Ended September 30, 2015 | Year Ended December 31, | Year Ended December 31, | | ||||||||||||||||||||||
|---|---|---|---|---|---|---|---|---|---|---|---|---|---|---|---|---|---|---|---|---|---|---|---|---|---|---|
Payments to Related Parties | 2014 | 2013 | 2012 | 2015 | 2014 | 2013 | | |||||||||||||||||||
| | (in millions) | (in millions) | | |||||||||||||||||||||||
Liquidity payments | $ | 422.6 | $ | 456.0 | $ | 252.8 | $ | 268.4 | $ | 558.5 | $ | 427.9 | $ | 241.0 | ||||||||||||
As a percentage of total liquidity payments | 52.4 | % | 54.8 | % | 53.3 | % | 52.8 | % | 52.2 | % | 51.5 | % | 50.8 | % | ||||||||||||
Routing and clearing | $ | 28.8 | $ | 26.1 | $ | 42.5 | $ | 26.8 | $ | 43.6 | $ | 25.8 | $ | 30.3 | ||||||||||||
As a percentage of total routing and clearing | 79.2 | % | 55.4 | % | 75.3 | % | 52.2 | % | 91.9 | % | 54.5 | % | 71.1 | % | ||||||||||||
We also maintain brokerage accounts with affiliates of certain of our principal investors, including Bank of America Merrill Lynch, J.P. Morgan, Morgan Stanley and WEDBUSH. As of September 30,the years ended December 31, 2015 and December 31, 2014, approximately $6.4$51.3 million and $101.5 million, respectively, in cash and cash equivalents and financial instruments were held in such accounts.
Investor Rights Agreement
The Investor Rights Agreement dated as of January 31, 2014, among us and our stockholders, among other things:
Under the terms of the Investor Rights Agreement, certain founding stockholders, together with their respective affiliates, owning at least 3% of our common stock (on a fully diluted basis) and certain stockholders, together with their respective affiliates, owning at least 10%, for so long as such stockholder together with its affiliates continues to own at least 7% of our common stock (on a fully diluted basis), are entitled to designate one individual to serve on our board of directors and to have one representative present during all meetings of our board of directors and any committee of the board of directors.
The Investor Rights Agreement also provides for certain registration rights, including demand registration rights. Effective upon the completion of this offering, pursuant to the terms of the Investor Rights Agreement, all of the rights and obligations described above, except for the registration rights, will automatically terminate. For a more detailed description of these registration rights, see "Description of Capital Stock—Registration Rights."
Procedures for Related Person Transactions
In conjunction with this offering, our board of directors intends to adopt a written related person transaction policy for our company. The policy was not in effect when we entered into the transactions discussed above. Under the policy, an independent committee of our board of directors, which initially
will be the Nominating and Corporate Governance Committee, must approve or ratify any transaction
involving us in which any of our executive officers, directors, director nominees, beneficial owners of more than 5% of our voting securities or the immediate family members of such persons has a direct or indirect material interest. We refer to such persons as related persons and to such transactions as related person transactions. In addition, each director, director nominee and executive officer must promptly report any transactions involving us and a related person to our secretary, as provided in the policy.
The secretary will present any new related person transactions and proposed transactions involving related persons to the Nominating and Corporate Governance Committee, which shall determine whether the related person involved has a direct or indirect material interest in the transaction. If the Nominating and Corporate Governance Committee determines that a transaction is a related person transaction, it will review the transaction, considering all of the relevant facts and circumstances, including the commercial reasonableness of the terms, the benefit and perceived benefit, or lack thereof, to us, opportunity costs of alternate transactions, the materiality and character of the related person's direct or indirect interest and the actual or apparent conflict of interest of the related person. In addition, the Nominating and Corporate Governance Committee will periodically review previously approved related person transactions. The Nominating and Corporate Governance Committee will not approve or ratify a related person transaction unless it has determined that, upon consideration of all relevant information, the transaction is in, or not inconsistent with, the best interest of our company and our stockholders.
There are certain types of transactions, set forth below, that will not be deemed to create or involve a material interest on the part of the related person and will not be reviewed or require approval or ratification under the policy:
Underwriters (Conflicts of Interest)
Certain affiliates of the underwriters of this offering are participating as selling stockholders in this offering. There may be a conflict of interest between their interests as selling stockholders (i.e., to maximize the value of their investment) and their respective interests as underwriters (i.e., in negotiating the initial public offering price) as well as your interest as a purchaser. As affiliates of participants in this offering that are seeking to realize the value of their investment in us, these underwriters could have interests beyond customary underwriting discounts and commissions.
One of our directors is an employee of Credit Suisse, and another director is a senior advisor to Morgan Stanley, each an underwriter participating in this offering, or their affiliates. In addition, certain underwriters and their affiliates are our customers. The underwriters or their affiliates have also performed commercial banking, investment banking and advisory services for us from time to time for which they have received customary fees and reimbursement of expenses. The underwriters or their affiliates may, from time to time, engage in transactions with and perform services for us in the ordinary course of their business for which they may receive customary fees and reimbursement of expenses. See "Underwriters (Conflicts of Interest)."
PRINCIPAL AND SELLING STOCKHOLDERS
The following table sets forth information regarding beneficial ownership of our common stock and non-voting common stock immediately prior to the initial public offering, giving effect to the reclassification and -for-1-for-2.91 stock split to be consummated in conjunction withimmediately prior to the completion of this offering, as described under "Prospectus Summary—Reclassification and Stock Split," for:
In accordance with the rules of the SEC, beneficial ownership includes voting or investment power with respect to securities and includes the shares issuable pursuant to stock options that are exercisable within 60 days of DecemberApril 1, 2015.2016. Shares issuable pursuant to stock options are deemed outstanding for computing the percentage of the person holding such options but are not outstanding for computing the percentage of any other person. The number of shares of common stock and non-voting common stock outstanding after this offering includes shares of common stock being offered for sale by the selling stockholders. The percentage of beneficial ownership for the following table is based on 84,210,853 shares of common stock and 12,152,158 shares of non-voting common stock immediately prior to the initial public offering, giving effect to our reclassification and -for-1-for-2.91 stock split to be consummated in conjunction withimmediately prior to the completion of this offering, as described under "Prospectus Summary—Reclassification and Stock Split.Split," and 1,565,653 shares of unvested restricted stock as of April 1, 2016. Unless otherwise indicated, the address for each listed stockholder is: c/o BATSBats Global Markets, Inc., 8050 Marshall Drive, Suite 120, Lenexa, KS 66214. To our knowledge, except as indicated in the footnotes to this table and pursuant to applicable community property laws, the persons named in the
persons named in the table have sole voting and investment power with respect to all shares of common stock and non-voting common stock, as applicable.
agreements or understandings, directly or indirectly, with any person to distribute such shares at the time of their purchase. See "Certain Relationships and Related Transactions" for a discussion of our relationship with Citigroup. If the underwriters exercise their option to purchase additional shares, the maximum number of additional common shares that would be sold by Citigroup Financial Products, Inc. would be 127,032, and Citigroup Financial Products, Inc. would beneficially own 3,644,796 shares of common stock following this offering.
shares that would be sold by The Goldman Sachs Group, Inc. would be 116,968, and The Goldman Sachs Group, Inc. would beneficially own 3,422,916 shares of common stock following this offering.
General The following is a description of the rights of our capital stock and related provisions of our amended and restated certificate of incorporation and amended and restated bylaws, as they will be in effect immediately prior to the completion of this offering, and is qualified by reference to the forms of our amended and restated certificate of incorporation and the form of our amended and restated bylaws, each of which we expect to be in effect immediately prior to the closing of this offering, and the Investor Rights Agreement, all of which are filed as exhibits to the registration statement of which this prospectus is a part. Our amended and restated certificate of incorporation will provide that, immediately prior to the closing of the offering, common stock and non-voting common stock will be authorized. In conjunction with this offering, we intend to reclassify each share of our existing capital stock designated as Class A non-voting common stock as one share of common stock. We also intend to reclassify each share of our existing capital stock designated as Class B non-voting common stock as one share of non-voting common stock. The rights of the holders of our common stock and non-voting common stock will be identical, except with respect to voting rights and conversion provisions. With respect to voting, each share of common stock will be entitled to one vote per share. Non-voting common stock will not be entitled to vote, except as required by applicable law. Immediately following the closing of this offering, our authorized capital stock will consist of
Immediately prior to the offering, we will have outstanding 83,527,269 shares of common stock, held of record by 172 stockholders and 12,152,158 shares of non-voting common stock, held of record by 10 stockholders. These amounts give effect to our reclassification and In addition, as of Common Stock and Non-Voting Common Stock Voting Rights The holders of our common stock are entitled to one vote per share. Non-voting common stock will not be entitled to vote, except as required by applicable law. Delaware law would require our non-voting common stock to vote separately as a single class in the following circumstances:
affects holders of such class of stock adversely, then holders of non-voting common stock would be required to vote separately to approve such proposed amendment. Our amended and restated certificate of incorporation and amended and restated bylaws that will be in effect immediately prior to the completion of this offering will provide for a classified board of directors consisting of three classes of approximately equal size, each serving staggered three-year terms. Only one class of directors will be elected at each annual meeting of our stockholders, with the other classes continuing for the remainder of their respective three-year terms. The Delaware General Corporation Law provides that stockholders are not entitled to the right to cumulate votes in the election of directors unless our amended and restated certificate of incorporation provides otherwise. Our amended and restated certificate of incorporation prohibits cumulative voting. Dividend Rights Subject to preferences that may apply to shares of preferred stock outstanding at the time, the holders of outstanding shares of our common stock and non-voting common stock are entitled to receive dividends out of funds legally available if our board of directors, in its discretion, determines to issue dividends and only then at the times and in the amounts that our board of directors may determine. Under Delaware law, we can only pay dividends either out of "surplus" or out of the current or the immediately preceding year's net profits. Surplus is defined as the excess, if any, at any given time, of the total assets of a corporation over its total liabilities and statutory capital. The value of a corporation's assets can be measured in a number of ways and may not necessarily equal their book value. See "Dividend Policy" for more information. No Preemptive or Similar Rights Our common stock and non-voting common stock are not entitled to preemptive rights and are not subject to conversion, redemption or sinking fund provisions, except for the conversion rights applicable to our non-voting common stock described under "—Conversion" below. Right to Receive Liquidation Distributions Upon our dissolution, liquidation or winding-up, the assets legally available for distribution to our stockholders are distributable ratably among the holders of our common stock and non-voting common stock, subject to prior satisfaction of all outstanding debt and liabilities and the preferential rights and payment of liquidation preferences, if any, on any outstanding shares of preferred stock. Conversion Each share of non-voting common stock is convertible into one share of common stock following a "qualified transfer," where a holder of such transferred shares of non-voting common stock may surrender to the company the certificate(s) representing the non-voting common stock, evidence of the "qualified transfer" that the company may reasonably request and a written notice stating that such holder desires to convert the shares of non-voting common stock into an equal number of shares of common stock. A "qualified transfer" means a sale or other transfer of non-voting common stock by a holder of such shares (i) in a public offering, (ii) in certain private offerings, (iii) to a transferee that owns or controls more than 50% of common stock of the company or (iv) to the company. Ownership and Voting Limits on Our Common Stock and Non-Voting Common Stock Our amended and restated certificate of incorporation will place certain ownership and voting limits on the holders of our common stock and non-voting common stock. As long as we control, directly or indirectly,
The limitations in clauses (a) and (c) above shall not apply in the case of non-voting common stock. The term "related persons" means, with respect to any person:
If any stockholder attempts to sell, pledge or otherwise transfer to any person, other than us, any shares of our capital stock that would violate the ownership limitations described above, we will record on our books the transfer of only the number of shares of our capital stock that would not violate the above limitations and will treat the remaining shares as owned for all purposes by the stockholder attempting to effect such transfer. If any stockholder attempts to vote any shares of our capital stock, or grant a proxy or enter into a voting agreement or any other arrangement with respect to such shares that would violate the voting limitations described above, we will not honor such vote, proxy, agreement or arrangement to the extent that the voting limitations described above would be violated. If any stockholder attempts to sell, pledge or otherwise transfer to any person any shares of our capital stock that would violate the ownership limitations described above, we have the right to, and will promptly do so if we exercise such right, to the extent funds are legally available, redeem the shares sold, pledged or otherwise transferred in violation of these limitations at a price equal to the fair market value of such shares. We will send notice to the holder of record of such redeemable shares specifying the date of redemption, which shall be not less than 10 days and no more than 30 days from the date of the notice. Any shares of our capital stock that have been called for redemption will not be deemed outstanding for purposes of voting or determining the total number of shares entitled to vote if we have set aside a sum sufficient to satisfy the redemption price of such redeemable shares. We will also notify our stockholders of any such redemption of shares within 10 days of any such redemption. Our board of directors may waive the provisions regarding ownership and voting limits (except with respect to exchange members or their related persons) by a resolution expressly permitting such waiver (which resolution must be filed with and approved by the SEC prior to being effective), subject to a determination of the board that:
Notwithstanding any of the above, (i) any exchange member (either alone or together with its related persons) that proposes to own, directly or indirectly, of record or beneficially, shares constituting more than 20% of the outstanding shares of any class of our capital stock and (ii) any person (either alone or together with its related persons) that proposes to own, directly or indirectly, of record or beneficially, shares constituting more than 40% of the outstanding shares of any class of our capital stock or to exercise voting rights or grants any proxy or consent with respect to shares constituting 20% of the voting power of our then issued and outstanding capital stock shall send written notice of its intention to do so to our board of directors at least 45 days before the proposed ownership of such shares or proposed exercise of such voting rights. In making these determinations, our board of directors may impose conditions and restrictions on the relevant stockholder or its related persons that it deems necessary, appropriate or desirable in furtherance of the objectives of the Exchange Act and the governance of our company. Our amended and restated certificate of incorporation will also provide that our board of directors has the right to require any person and its related persons that our board of directors reasonably believes to be subject to the voting or ownership restrictions summarized above to provide to us complete information as to all shares of our capital stock that such stockholder beneficially owns, as well as any other information relating to the applicability to such stockholder of the voting and ownership requirements outlined above as may reasonably be requested. Further, any stockholder (either alone or together with its related persons) that owns, directly or indirectly (whether by acquisition or by a change in the number of shares outstanding), of record or beneficially, 5% or more of our then outstanding shares of capital stock (excluding shares of any class of stock that does not have the right by its terms to vote) shall, immediately upon acquiring knowledge of its 5% ownership, give written notice to our board of directors indicating such person's legal name, title or status, approximate ownership interest in us and whether such person has the power to direct the management or policies of us whether through its ownership of securities, by contract or otherwise. Our stockholders who provide such notice must also provide updates with respect to changes in ownership as further described in our amended and restated certificate of incorporation. Preferred Stock Our board of directors has the authority to issue preferred stock in one or more series and to fix the rights, preferences, privileges and restrictions thereof, including dividend rights, dividend rates, conversion rights, voting rights, terms of redemption, redemption prices, liquidation preferences and the number of shares constituting any series or the designation of such series, without further vote or action by the stockholders. The issuance of undesignated preferred stock may have the effect of delaying, deferring or preventing a change in control of us without further action by the stockholders and may adversely affect the voting and other rights of the holders of our common stock. At present, we have no plans to issue any of the preferred stock. Registration Rights After this offering, holders of approximately 77,435,801 shares of common stock and non-voting common stock will have the right to require us to register the sales of their shares under the Securities Act, pursuant to the terms of the Investor Rights Agreement between us and the holders of these securities. Subject to limitations specified in such agreement, these registration rights include: Demand registration rights. At any time following six months after completion of this offering, certain holders of our common stock and non-voting common stock who are a party to the Investor Rights Agreement can request us to file with the SEC and cause to be declared effective a registration statement covering the resale of all or any portion of the shares of registrable securities that it holds, as long as the anticipated gross proceeds of such offering and registration will be at least $10 million. We are only obligated to register the registrable securities on two occasions and not more than once in any 12-month period. Furthermore, at any time, the holders of at least 20% of the registrable securities held by parties to the Investor Rights Agreement can require us to file with the SEC and cause to be declared effective (if we are eligible) a short-form registration statement on Form S-3 covering the resale of all or any portion of shares of registrable securities held by such persons. The anticipated aggregate price of any shares covered by the demand must exceed $5 million. Piggyback registration rights. If we register any of our securities under the Securities Act for sale to the public (other than with respect to our initial public offering), either for our own account or for the account of other security holders or both, the holders of shares of registrable securities party to the Investor Rights Agreement are entitled to notice of the intended registration and to include any or all of their registrable securities in the registration. Limitations and expenses. With specified exceptions, a stockholder's right to include shares in an underwritten registered offering is subject to the right of the underwriters to limit the number of shares included in such offering. We are generally required to pay all expenses of registration, including the fees and expenses of legal counsel for us and for the selling stockholders, but excluding underwriters' discounts and commissions. All registration rights under the Investor Rights Agreement terminate on the earlier of the fourth anniversary of this offering, or the date when all registrable securities can be resold pursuant to Rule 144 of the Securities Act by a person that is not an "affiliate" (as that term is defined in Rule 144 under the Securities Act) of the company where no conditions of Rule 144 are then applicable. Furthermore, as a result of the transfer restrictions described under "Shares Eligible for Future Certain Provisions of Our Amended and Restated Certificate of Incorporation and Bylaws Our amended and restated certificate of incorporation and our amended and restated bylaws that will be in effect upon the closing of this offering contain certain provisions that could have the effect of delaying, deferring or discouraging another party from acquiring control of us. These provisions, which are summarized below, are expected to discourage others from attempting hostile takeovers and, as a consequence, they may also inhibit temporary fluctuations in the market price of our common stock that often result from actual or rumored hostile takeover attempts. These provisions are also designed to encourage persons seeking to acquire control of us to first negotiate with our board of directors. These provisions may have the effect of preventing changes in our management. It is possible that these provisions could make it more difficult to accomplish transactions that stockholders may otherwise deem to be in their best interests. We believe, however, that the benefits of increased protection of our potential ability to negotiate with an unfriendly or unsolicited acquirer outweigh the disadvantages of discouraging a proposal to acquire us because negotiation of these proposals could result in an improvement of their terms. Voting and Ownership Limitations Our amended and restated certificate of incorporation prohibits any person who is a holder of common stock from owning greater than 40% of any class of our capital stock, prohibits exchange members who hold common stock and/or non-voting common stock from owning greater than 20% of any class of our capital stock and prohibits all persons holding common stock from exercising a greater than 20% voting power of our issued and outstanding capital stock, in each case subject to certain conditions and exceptions. Requirements for Advance Notification of Stockholder Nominations and Proposals Our amended and restated bylaws that will be in effect upon the closing of this offering will establish advance notice procedures with respect to stockholder proposals and the nomination of candidates for election as directors, other than nominations made by or at the direction of the board of directors or a committee of the board of directors. The amended and restated bylaws will not give the board of directors the power to approve or disapprove stockholder nominations of candidates or proposals regarding business to be conducted at a special or annual meeting of the stockholders. However, our amended and restated bylaws may have the effect of precluding the conduct of certain business at a meeting if the proper procedures are not followed. These provisions may also discourage or deter a potential acquirer from conducting a solicitation of proxies to elect the acquirer's own slate of directors or otherwise attempting to obtain control of our company. Limits on Special Meetings Special meetings of the stockholders may be called only by our board of directors acting pursuant to a resolution adopted by a majority of the board of directors. Notwithstanding the foregoing, whenever holders of one or more classes or series of preferred stock shall have the right, voting separately as a class or series, to elect directors, such holders may call, pursuant to the terms of the resolution or resolutions adopted by the board of directors pursuant to our amended and restated certificate of incorporation, special meetings of holders of such preferred stock. Classified Board Our amended and restated certificate of incorporation and amended and restated bylaws will provide that our board of directors will be classified into three classes of directors, each of whom will hold office for a three-year term. In addition, directors may only be removed from our board of directors for cause and only by the approval of holders controlling not less than a majority of the total voting power of our then outstanding securities generally entitled to vote in the election of directors, voting together as a single class. The existence of a classified board could delay a successful tender offeror from obtaining majority control of our board of directors, and the prospect of that delay might deter a potential offeror. Undesignated Preferred Stock The ability to authorize undesignated preferred stock without stockholder approval makes it possible for our board of directors to issue preferred stock with voting or other rights or preferences that could impede the success of any attempt to acquire us. These and other provisions may have the effect of deferring hostile takeovers or delaying changes in control or management of our company. Limits on Ability of Stockholders to Act by Written Consent Our amended and restated bylaws that will be in effect upon the closing of this offering will provide that stockholders will not be able to take action by written consent, and will only be able to take action at annual or special meetings of our stockholders. Amendment of Certificate of Incorporation and Bylaws Our amended and restated bylaws that will be in effect upon the closing of this offering will require a supermajority vote to amend some provisions in our amended and restated certificate of incorporation and bylaws. In addition, our board of directors is expressly authorized to amend or repeal any provision of our amended and restated bylaws. Section 203 of the Delaware General Corporation Law Upon the completion of this offering, we will be governed by the provisions of Section 203 of the Delaware General Corporation Law regulating corporate takeovers. This section prevents some Delaware corporations from engaging, under some circumstances, in a business combination. A business combination includes a merger or sale of at least 10% of the corporation's assets with any interested stockholder, meaning a stockholder who, together with affiliates and associates, owns or, within three years prior to the determination of interested stockholder status, did own 15% or more of the corporation's outstanding voting stock, unless:
meeting of stockholders by at least two-thirds of the outstanding voting stock which is not owned by the interested stockholder. A Delaware corporation may "opt out" of these provisions with an express provision in its original certificate of incorporation or an express provision in its certificate of incorporation or amended and restated bylaws resulting from a stockholders' amendment approved by a majority of the outstanding voting shares. We have not opted out of these provisions. As a result, mergers or other takeover or change in control attempts of us may be discouraged or prevented. Choice of Forum Upon the completion of this offering, our amended and restated certificate of incorporation will provide that the Court of Chancery of the State of Delaware will be the exclusive forum for any derivative action or proceeding brought on our behalf; any action asserting a breach of fiduciary duty; any action asserting a claim against us arising pursuant to the Delaware General Corporation Law, our amended and restated certificate of incorporation or our amended and restated bylaws; or any action asserting a claim against us that is governed by the internal affairs doctrine. The enforceability of similar choice of forum provisions in other companies' certificates of incorporation has been challenged in legal proceedings, and it is possible that a court could find these types of provisions to be inapplicable or unenforceable. Listing We Transfer Agent and Registrar The Transfer Agent and Registrar for the common stock is Computershare Trust Company, N.A.
The following is a discussion of the material U.S. federal income and estate tax consequences of the ownership and disposition of our common stock acquired in this offering by a "Non-U.S. Holder" that does not own, and has not owned, actually or constructively, more than 5% of our common stock. You are a Non-U.S. Holder if for U.S. federal income tax purposes you are a beneficial owner of our common stock that is:
You are not a Non-U.S. Holder if you are a nonresident alien individual present in the United States for 183 days or more in the taxable year of disposition, or if you are a former citizen or former resident of the United States for U.S. federal income tax purposes. If you are such a person, you should consult your tax adviser regarding the U.S. federal income tax consequences of the ownership and disposition of our common stock. If you are a partnership or other pass-through entity (including an entity or arrangement treated as a partnership or other type of pass-through entity for U.S. federal income tax purposes) that owns our common stock, the U.S. federal income tax treatment of a partner or beneficial owner will generally depend on the status of the partner or beneficial owner and your activities. Partnerships, partners and beneficial owners in partnerships or other pass-through entities that own our common stock should consult their tax advisers as to the particular U.S. federal income tax consequences of the ownership and disposition of our common stock. This discussion is based on the Code, administrative pronouncements, judicial decisions and final, temporary and proposed Treasury regulations, changes to any of which subsequent to the date of this prospectus may affect the tax consequences described herein, possibly with retroactive effect. This discussion does not describe all aspects of U.S. federal income and estate taxation that may be relevant to you in light of your particular circumstances, does not discuss alternative minimum tax and Medicare contribution tax consequences and does not address any aspect of state, local or non-U.S. taxation. You should consult your tax adviser with regard to the application of the U.S. federal tax laws to your particular situation, as well as any tax consequences arising under the laws of any state, local or non-U.S. taxing jurisdiction. Dividends Distributions of cash or other property (other than certain distributions of stock) will constitute dividends for U.S. federal income tax purposes to the extent paid from our current or accumulated earnings and profits, as determined under U.S. federal income tax principles. To the extent those distributions exceed our current and accumulated earnings and profits, they will constitute a return of capital, which will first reduce your basis in our common stock, but not below zero, and then will be treated as gain from the sale of our common stock, as described below under "—Gain on Disposition of Our Common Stock." Dividends paid to you generally will be subject to withholding tax at a 30% rate or a reduced rate specified by an applicable income tax treaty. In order to obtain a reduced rate of withholding, you will be required to provide us or our paying agent with a properly executed applicable IRS Form W-8BEN or IRS Form W-8BEN-E, as applicable, certifying your entitlement to benefits under a treaty. A Non-U.S. Holder eligible for a reduced rate of U.S. withholding tax pursuant to an income tax treaty who fails to timely provide a W-8BEN or W-8BEN-E may obtain a refund of any excess amounts withheld by timely filing an appropriate claim with the IRS. If dividends paid to you are effectively connected with your conduct of a trade or business in the United States (and, if required by an applicable income tax treaty, are attributable to a permanent establishment or fixed base maintained by you in the United States), you will generally be taxed on the dividends in the same manner as a U.S. person. In this case, you will be exempt from the withholding tax discussed in the preceding paragraph, although you will be required to provide a properly executed IRS Form W-8ECI in order to claim an exemption from withholding. You should consult your tax adviser with respect to other U.S. tax consequences of the ownership and disposition of our common stock, including the possible imposition of a branch profits tax at a rate of 30% (or a lower treaty rate) if you are a corporation. Gain on Disposition of Our Common Stock Subject to the discussions below under "—Information Reporting and Backup Withholding" and "—FATCA," you generally will not be subject to U.S. federal income or withholding tax on gain realized on a sale or other taxable disposition of our common stock unless:
If you recognize gain on a sale or other disposition of our common stock that is effectively connected with your conduct of a trade or business in the United States (and if required by an applicable income tax treaty, is attributable to a permanent establishment or fixed base maintained by you in the United States), you will generally be taxed on such gain in the same manner as a U.S. person. You should consult your tax adviser with respect to other U.S. tax consequences of the ownership and disposition of our common stock, including the possible imposition of a branch profits tax at a rate of 30% (or a lower treaty rate) if you are a corporation. Information Reporting and Backup Withholding Information returns will be filed with the IRS in connection with payments of dividends on our common stock. Unless you comply with certification procedures to establish that you are not a U.S. person, information returns may also be filed with the IRS in connection with the proceeds from a sale or other disposition of our common stock. You may be subject to backup withholding on payments on our common stock or on the proceeds from a sale or other disposition of our common stock unless you comply with certification procedures to establish that you are not a U.S. person or otherwise establish an exemption. Compliance with the certification procedures required to claim a reduced rate of withholding under a treaty will satisfy the certification requirements necessary to avoid backup withholding as well. Amounts withheld under the backup withholding rules are not additional taxes and may be refunded or credited against your U.S. federal income tax liability, provided the required information is timely furnished to the IRS. FATCA Provisions of the Code commonly referred to as "FATCA" require withholding of 30% on payments of dividends on our common stock, as well as payments of gross proceeds of dispositions occurring after December 31, 2018 of our common stock, to "foreign financial institutions" (which is broadly defined for this purpose and in general includes investment vehicles) and certain other non-U.S. entities unless various U.S. information reporting and due diligence requirements (generally relating to ownership by U.S. persons of interests in or accounts with those entities) have been satisfied, or an exemption applies. An intergovernmental agreement between the United States and an applicable foreign country may modify these requirements. If FATCA withholding is imposed, a beneficial owner that is not a foreign financial institution generally may obtain a refund of any amounts withheld by filing a U.S. federal income tax return (which may entail significant administrative burden). You should consult your tax adviser regarding the effects of FATCA on your investment in our common stock. Federal Estate Tax Individual Non-U.S. Holders and entities the property of which is potentially includible in such an individual's gross estate for U.S. federal estate tax purposes (for example, a trust funded by such an individual and with respect to which the individual has retained certain interests or powers), should note that, absent an applicable treaty exemption, our common stock will be treated as U.S.-situs property subject to U.S. federal estate tax.
Prior to this offering, there has been no market for our common stock. Future sales of substantial amounts of our common stock in the public market could adversely affect market prices prevailing from time to time. As described below, only a limited number of shares will be available for sale shortly after this offering due to contractual and legal restrictions on resale. Nevertheless, sales of our common stock in the public market after such restrictions lapse, or the perception that those sales may occur, may adversely affect the prevailing market price of our common stock and our ability to raise equity capital in the future. Upon completion of this offering, we will have 87,699,410 shares of common stock and 7,980,017 shares of non-voting common stock outstanding, after giving effect to our reclassification and The remaining shares of common stock that are not sold in this offering will be "restricted securities," as that term is defined in Rule 144 under the Securities Act. These restricted securities are eligible for public sale only if they are registered under the Securities Act or if they qualify for an exemption from registration under Rule 144 or Rule 701 under the Securities Act, which are summarized below. In addition, all of our executive officers and directors and the holders of substantially all of our capital stock are subject to lock-up agreements with the underwriters of this offering that restrict the stockholders' ability to transfer shares, subject to specific exceptions, of
Rule 144 In general, under Rule 144 as currently in effect, once we have been a reporting company subject to the reporting requirements of Section 13 or Section 15(d) of the Exchange Act for 90 days, an affiliate who has beneficially owned restricted shares of our common stock for at least six months would be entitled to sell within any three-month period a number of shares that does not exceed the greater of either of the following:
However, the six-month holding period increases to one year in the event that we have not been a reporting company for at least 90 days. In addition, any sales by affiliates under Rule 144 are also limited by manner of sale provisions and notice requirements and the availability of current public information about us. The volume limitation, manner of sale and notice provisions described above will not apply to sales by non-affiliates. For purposes of Rule 144, a non-affiliate is any person or entity who is not our affiliate at the time of sale and has not been our affiliate during the preceding three months. Once we have been a reporting company for 90 days, a non-affiliate who has beneficially owned restricted shares of our common stock for six months may rely on Rule 144 provided that certain public information regarding us is available. The six-month holding period increases to one year in the event that we have not been a reporting company for at least 90 days. However, a non-affiliate who has beneficially owned the restricted shares proposed to be sold for at least one year will not be subject to any restrictions under Rule 144 regardless of how long we have been a reporting company. We are unable to estimate the number of shares of our common stock that will be sold under Rule 144 since this will depend on the market price for our common stock, the circumstances of the stockholders and other factors. Rule 701 In general, any of our employees, directors, officers, consultants or advisors who purchases shares of common stock from us under Rule 701 pursuant to a compensatory stock or option plan or other written agreement before the effective date of this offering is entitled to resell such shares 90 days after the effective date of this offering in reliance on Rule 144, without having to comply with the holding period requirements or other restrictions contained in Rule 701. The SEC has indicated that Rule 701 will apply to typical stock options granted by an issuer before it becomes subject to the reporting requirements of the Exchange Act, along with the shares acquired upon exercise of such options, including exercises after the date of this prospectus. Securities issued in reliance on Rule 701 are restricted securities and beginning 90 days after the date of this prospectus, may be sold by persons other than "affiliates," as defined in Rule 144, subject only to the manner of sale provisions of Rule 144 and by "affiliates" under Rule 144 without compliance with its one-year minimum holding period requirement. Registration Rights After this offering, holders of approximately 77,435,801 shares of common stock and non-voting common stock will have the right to require us to register the sales of their shares under the Securities Act, under the terms of the Investor Rights Agreement between us and the holders of these securities. These registration rights are described in "Description of Capital Stock—Registration Rights." Stock Options As of Upon completion of this offering, we intend to file a registration statement under the Securities Act covering all shares of 1,946,038 common stock subject to outstanding options or issuable pursuant to our stock option plans. Shares registered under such registration statement will be available for sale in the open market, subject to vesting restrictions and/or exercise and the restrictions described below. Lock Up We, our executive officers and directors, the selling stockholders and holders of substantially all of our
Under the terms and subject to the conditions in an underwriting agreement dated the date of this prospectus, the underwriters named below, for whom Morgan Stanley & Co. LLC and Citigroup Global Markets Inc. are acting as representatives, have severally agreed to purchase, and
The underwriters and the representatives are collectively referred to as the "underwriters" and the "representatives," respectively. The underwriters are offering the shares of common stock subject to their acceptance of the shares from The underwriters initially propose to offer part of the shares of common stock directly to the public at the offering price listed on the cover page of this prospectus and part to certain dealers. After the initial offering of the shares of common stock, the offering price and other selling terms may from time to time be varied by the representatives. Certain of the underwriters may sell shares of common stock to the public through one or more of their affiliates as selling agents. The following table shows the per share and total public offering price, underwriting discounts and commissions and proceeds before expenses to
The estimated offering expenses payable by us The underwriters have informed us that they do not intend sales to discretionary accounts to exceed 5% of the total number of shares of common stock offered by them. We We, our executive officers and directors, the selling stockholders and holders of substantially all of our
whether any such transaction described above is to be settled by delivery of our common stock or such other securities, in cash or otherwise. In addition, we and each such person agrees that, without the prior written consent of the representatives on behalf of the underwriters, we or such other person will not, during the restricted period, make any demand for, or exercise any right with respect to, the registration of any shares of our common stock or any security convertible into or exercisable or exchangeable for our common stock. The restrictions described in the immediately preceding paragraph to do not apply to:
equity incentive plans in existence prior to the date of this prospectus and described herein,provided such awards shall not become exercisable during the restricted period;
plan, such announcement or filing shall include a statement to the effect that no transfer of common stock may be made under such plan during the restricted In order to facilitate the offering of the common stock, the underwriters may engage in transactions that stabilize, maintain or otherwise affect the price of the common stock. Specifically, the underwriters may sell more shares than they are obligated to purchase under the underwriting agreement, creating a short position. A short sale is covered if the short position is no greater than the number of shares available for purchase by the underwriters under the option to purchase additional shares. The underwriters can close out a covered short sale by exercising the option to purchase additional shares or purchasing shares in the open market. In determining the source of shares to close out a covered short sale, the underwriters will consider, among other things, the open market price of shares compared to the price available under the option to purchase additional shares. The underwriters may also sell shares in excess of the option to purchase additional shares, creating a naked short position. The underwriters must close out any naked short position by purchasing shares in the open market. A naked short position is more likely to be created if the underwriters are concerned that there may be downward pressure on the price of the common stock in the open market after pricing that could adversely affect investors who purchase in this offering. As an additional means of facilitating this offering, the underwriters may bid for, and purchase, shares of common stock in the open market to stabilize the price of the common stock. These activities may raise or maintain the market price of the common stock above independent market levels or prevent or retard a decline in the market price of the common stock. The underwriters are not required to engage in these activities and may end any of these activities at any time. We, the selling stockholders and the underwriters have agreed to indemnify each other against certain liabilities, including liabilities under the Securities Act. A prospectus in electronic format may be made available on websites maintained by one or more underwriters, or selling group members, if any, participating in this offering. The representatives may agree to allocate a number of shares of common stock to underwriters for sale to their online brokerage account holders. Internet distributions will be allocated by the representatives to underwriters that may make Internet distributions on the same basis as other allocations. Pricing of the Offering Prior to this offering, there has been no public market for our common stock. The initial public offering price was determined by negotiations between us, the selling stockholders and the representatives. Among the factors considered in determining the initial public offering price were our future prospects and those of our industry in general, our sales, earnings and certain other financial and operating information in recent periods and the price-earnings ratios, price-sales ratios, market prices of securities and certain financial and operating information of companies engaged in activities similar to ours. Conflicts of Interest Merrill Lynch, Pierce, Fenner & Smith Incorporated, Citigroup, Goldman, Sachs & Co., Jefferies LLC and Nomura Securities International, Inc., underwriters of this offering, or their affiliates (as defined in FINRA Rule 5121), will each receive more than 5% of net offering proceeds and will have a "conflict of interest" pursuant to FINRA Rule 5121(f)(5)(C)(ii). Accordingly, this offering will be made in compliance with the applicable provisions of FINRA Rule 5121. As such, any underwriter that has a conflict of interest pursuant to FINRA Rule 5121 will not confirm sales to accounts in which it exercises discretionary authority without the prior written consent of the customer. Pursuant to FINRA Rule 5121, a "qualified independent underwriter" (as defined in FINRA Rule 5121) must participate in the preparation of the prospectus and perform its usual standard of due diligence with respect to the prospectus. Sandler O'Neill & Partners, L.P. has agreed to act as qualified independent underwriter for the offering and to perform a due diligence investigation and review and participate in the preparation of the prospectus. Certain affiliates of the underwriters of this offering are participating as selling stockholders in this offering. There may be a conflict of interest between their interests as selling stockholders (i.e., to maximize the value of their investment) and their respective interests as underwriters (i.e., in negotiating the initial public offering price) as well as your interest as a purchaser. As affiliates of participants in this offering that are seeking to realize the value of their investment in us, these underwriters could have interests beyond customary underwriting discounts and commissions. One of our directors is an employee of Credit Suisse, and another director is a senior advisor to Morgan Stanley, each an underwriter participating in this offering, or their affiliates. In addition, certain underwriters and their affiliates are our customers. The underwriters or their affiliates have also performed commercial banking, investment banking and advisory services for us from time to time for which they have received customary fees and reimbursement of expenses. The underwriters or their affiliates may, from time to time, engage in transactions with and perform services for us in the ordinary course of their business for which they may receive customary fees and reimbursement of expenses. Directed Share Program At our request, the underwriters have reserved up to of the 5% of the shares European Economic Area In relation to each member state of the EEA, no offer of our common stock which is the subject of the offering has been, or will be made to the public in that Member State, other than under the following exemptions under the Prospectus Directive:
provided that no such offer of our common stock referred to in (a) to (c) above shall result in a requirement for the company or any representative to publish a prospectus pursuant to Article 3 of the Prospectus Directive, or supplement a prospectus pursuant to Article 16 of the Prospectus Directive. Each person located in a Member State to whom any offer of our common stock is made or who receives any communication in respect of an offer of our common stock, or who initially acquires any common stock will be deemed to have represented, warranted, acknowledged and agreed to and with each representative and the company that (1) it is a "qualified investor" within the meaning of the law in that Member State implementing Article 2(1)(e) of the Prospectus Directive; and (2) in the case of any common stock acquired by it as a financial intermediary as that term is used in Article 3(2) of the Prospectus Directive, the common stock acquired by it in the offer has not been acquired on behalf of, nor has it been acquired with a view to its offer or resale to, persons in any Member State other than qualified investors, as that term is defined in the Prospectus Directive, or in circumstances in which the prior consent of the representatives has been given to the offer or resale; or where our common stock has been acquired by it on behalf of persons in any Member State other than qualified investors, the offer of such common stock to it is not treated under the Prospectus Directive as having been made to such persons. The company, the representatives and their respective affiliates will rely upon the truth and accuracy of the foregoing representations, acknowledgments and agreements. This prospectus has been prepared on the basis that any offer of our common stock in any Member State will be made pursuant to an exemption under the Prospectus Directive from the requirement to publish a prospectus for offers of our common stock. Accordingly any person making or intending to make an offer in that Member State of our common stock which is the subject of the offering contemplated in this prospectus may only do so in circumstances in which no obligation arises for the company or any of the representatives to publish a prospectus pursuant to Article 3 of the Prospectus Directive in relation to such offer. Neither the company nor the representatives have authorized, nor do they authorize, the making of any offer of our common stock in circumstances in which an obligation arises for the company or the representatives to publish a prospectus for such offer. For the purposes of this provision, the expression an "offer of common stock to the public" in relation to any common stock in any Member State means the communication in any form and by any means of sufficient information on the terms of the offer and the common stock to be offered so as to enable an investor to decide to purchase or subscribe the common stock, as the same may be varied in that Member State by any measure implementing the Prospectus Directive in that Member State, the expression "Prospectus Directive" means Directive 2003/71/EC (as amended) and includes any relevant implementing measure in each Member State. The above selling restriction is in addition to any other selling restrictions set out below. Notice to Prospective Investors in the United Kingdom In addition, in the United Kingdom, this document is being distributed only to, and is directed only at, and any offer subsequently made may only be directed at persons who are "qualified investors" (as defined in the Prospectus Directive) (i) who have professional experience in matters relating to investments falling within Article 19(5) of the Financial Services and Markets Act 2000 (Financial Promotion) Order 2005, as amended, or the Order, and/or (ii) who are high net worth companies (or persons to whom it may otherwise be lawfully communicated) falling within Article 49(2)(a) to (d) of the Order (all such persons together being referred to as "relevant persons"). This document must not be acted on or relied on in the United Kingdom by persons who are not relevant persons. In the United Kingdom, any investment or investment activity to which this document relates is only available to, and will be engaged in with, relevant persons. Notice to Prospective Investors in Switzerland The common stock may not be publicly offered in Switzerland and will not be listed on the SIX Swiss Exchange ("SIX") or on any other stock exchange or regulated trading facility in Switzerland. This document has been prepared without regard to the disclosure standards for issuance prospectuses under art. 652a or art.1156 of the Swiss Code of Obligations or the disclosure standards for listing prospectuses under art. 27 ff. of the SIX Listing Rules or the listing rules of any other stock exchange or regulated trading facility in Switzerland. Neither this document nor any other offering or marketing material relating to the common stock or the offering may be publicly distributed or otherwise made publicly available in Switzerland. Neither this document nor any other offering or marketing material relating to the offering, the company, the common stock has been or will be filed with or approved by any Swiss regulatory authority. In particular, this document will not be filed with, and the offer of common stock will not be supervised by, the Swiss Financial Market Supervisory Authority FINMA (FINMA), and the offer of common stock has not been and will not be authorized under the Swiss Federal Act on Collective Investment Schemes ("CISA"). The investor protection afforded to acquirers of interests in collective investment schemes under the CISA does not extend to acquirers of our common stock. Notice to Prospective Investors in the Dubai International Financial Centre This prospectus relates to an Exempt Offer in accordance with the Offered Securities Rules of the Dubai Financial Services Authority ("DFSA"). This prospectus is intended for distribution only to persons of a type specified in the Offered Securities Rules of the DFSA. It must not be delivered to, or relied on by, any other person. The DFSA has no responsibility for reviewing or verifying any documents in connection with Exempt Offers. The DFSA has not approved this prospectus nor taken steps to verify the information set forth herein and has no responsibility for the prospectus. The common stock to which this prospectus relates may be illiquid and/or subject to restrictions on their resale. Prospective purchasers of the common stock offered should conduct their own due diligence on the common stock. If you do not understand the contents of this prospectus you should consult an authorized financial advisor. Notice to Prospective Investors in Australia No placement document, prospectus, product disclosure statement or other disclosure document has been lodged with the Australian Securities and Investments Commission ("ASIC"), in relation to the offering. This prospectus does not constitute a prospectus, product disclosure statement or other disclosure document under the Corporations Act 2001 (the "Corporations Act"), and does not purport to include the information required for a prospectus, product disclosure statement or other disclosure document under the Corporations Act. Any offer in Australia of the common stock may only be made to persons (the "Exempt Investors") who are "sophisticated investors" (within the meaning of section 708(8) of the Corporations Act), "professional investors" (within the meaning of section 708(11) of the Corporations Act) or otherwise pursuant to one or more exemptions contained in section 708 of the Corporations Act so that it is lawful to offer the common stock without disclosure to investors under Chapter 6D of the Corporations Act. The common stock applied for by Exempt Investors in Australia must not be offered for sale in Australia in the period of 12 months after the date of allotment under the offering, except in circumstances where disclosure to investors under Chapter 6D of the Corporations Act would not be required pursuant to an exemption under section 708 of the Corporations Act or otherwise or where the offer is pursuant to a disclosure document which complies with Chapter 6D of the Corporations Act. Any person acquiring the common stock must observe such Australian on-sale restrictions. This prospectus contains general information only and does not take account of the investment objectives, financial situation or particular needs of any particular person. It does not contain any securities recommendations or financial product advice. Before making an investment decision, investors need to consider whether the information in this prospectus is appropriate to their needs, objectives and circumstances, and, if necessary, seek expert advice on those matters. Notice to Prospective Investors in Hong Kong The common stock has not been offered or sold and will not be offered or sold in Hong Kong, by means of any document, other than (a) to "professional investors" as defined in the Securities and Futures Ordinance (Cap. 571) of Hong Kong and any rules made under that Ordinance; or (b) in other circumstances which do not result in the document being a "prospectus" as defined in the Companies Ordinance (Cap. 32) of Hong Kong or which do not constitute an offer to the public within the meaning of that Ordinance. No advertisement, invitation or document relating to the common stock has been or may be issued or has been or may be in the possession of any person for the purposes of issue, whether in Hong Kong or elsewhere, which is directed at, or the contents of which are likely to be accessed or read by, the public of Hong Kong (except if permitted to do so under the securities laws of Hong Kong) other than with respect to the common stock which is or is intended to be disposed of only to persons outside Hong Kong or only to "professional investors" as defined in the Securities and Futures Ordinance and any rules made under that Ordinance. Notice to Prospective Investors in Japan The common stock has not been and will not be registered under the Financial Instruments and Exchange Law of Japan (Law No. 25 of 1948, as amended) and, accordingly, will not be offered or sold, directly or indirectly, in Japan, or for the benefit of any Japanese Person or to others for re-offering or resale, directly or indirectly, in Japan or to any Japanese Person, except in compliance with all applicable laws, regulations and ministerial guidelines promulgated by relevant Japanese governmental or regulatory authorities in effect at the relevant time. For the purposes of this paragraph, "Japanese Person" shall mean any person resident in Japan, including any corporation or other entity organized under the laws of Japan. Notice to Prospective Investors in Singapore This prospectus has not been registered as a prospectus with the Monetary Authority of Singapore. Accordingly, this prospectus and any other document or material in connection with the offer or sale, or invitation for subscription or purchase, of the common stock may not be circulated or distributed, nor may the common stock be offered or sold, or be made the subject of an invitation for subscription or purchase, whether directly or indirectly, to persons in Singapore other than (i) to an institutional investor under Section 274 of the Securities and Futures Act, Chapter 289 of Singapore (the "SFA"), (ii) to a relevant person pursuant to Section 275(1), or any person pursuant to Section 275(1A), and in accordance with the conditions specified in Section 275, of the SFA, or (iii) otherwise pursuant to, and in accordance with the conditions of, any other applicable provision of the SFA. Where the common stock is subscribed or purchased under Section 275 of the SFA by a relevant person which is: (a) a corporation (which is not an accredited investor (as defined in Section 4A of the SFA)) the sole business of which is to hold investments and the entire share capital of which is owned by one or more individuals, each of whom is an accredited investor; or (b) a trust (where the trustee is not an accredited investor) whose sole purpose is to hold investments and each beneficiary of the trust is an individual who is an accredited investor, securities (as defined in Section 239(1) of the SFA) of that corporation or the beneficiaries' rights and interest (howsoever described) in that trust shall not be transferred within six months after that corporation or that trust has acquired the common stock pursuant to an offer made under Section 275 of the SFA except: (a) to an institutional investor or to a relevant person defined in Section 275(2) of the SFA, or to any person arising from an offer referred to in Section 275(1A) or Section 276(4)(i)(B) of the SFA; (b) where no consideration is or will be given for the transfer; (c) where the transfer is by operation of law; (d) as specified in Section 276(7) of the SFA; or (e) as specified in Regulation 32 of the Securities and Futures (Offers of Investments) (Shares and Debentures) Regulations 2005 of Singapore. Notice to Prospective Investors in Canada The common stock may be sold only to purchasers purchasing, or deemed to be purchasing, as principal that are accredited investors, as defined in National Instrument 45-106 Prospectus Exemptions or subsection 73.3(1) of the Securities Act (Ontario), and are permitted clients, as defined in National Instrument 31-103 Registration Requirements, Exemptions and Ongoing Registrant Obligations. Any resale of the common stock must be made in accordance with an exemption from, or in a transaction not subject to, the prospectus requirements of applicable securities laws. Securities legislation in certain provinces or territories of Canada may provide a purchaser with remedies for rescission or damages if this prospectus (including any amendment thereto) contains a misrepresentation, provided that the remedies for rescission or damages are exercised by the purchaser within the time limit prescribed by the securities legislation of the purchaser's province or territory. The purchaser should refer to any applicable provisions of the securities legislation of the purchaser's province or territory for particulars of these rights or consult with a legal advisor. Pursuant to section 3A.3 (or, in the case of securities issued or guaranteed by the government of a non-Canadian jurisdiction, section 3A.4) of National Instrument 33-105 Underwriting Conflicts (NI 33-105), the underwriters are not required to comply with the disclosure requirements of NI 33-105 regarding underwriter conflicts of interest in connection with this offering. The validity of the shares of common stock offered by The consolidated financial statements of The consolidated financial statements of Direct Edge Holdings LLC and subsidiaries as of December 31, 2013 and for the year then ended, have been included herein and in the registration statement in reliance upon the report of KPMG LLP, independent auditors, appearing elsewhere herein, and upon the authority of said firm as experts in accounting and auditing. The combined financial statements of KCG Hotspot FX as of December 31, 2014 and 2013, and for each of the years in the
We have filed with the SEC, Washington, D.C. 20549, a registration statement on Form S-1 under the Securities Act with respect to the common stock offered hereby. This prospectus does not contain all of the information set forth in the registration statement and the exhibits and schedules thereto. For further information with respect to us and our common stock, reference is made to the registration statement and the exhibits and any schedules filed therewith. Statements contained in this prospectus as to the contents of any contract or other document referred to are not necessarily complete and in each instance, if such contract or document is filed as an exhibit, reference is made to the copy of such contract or other document filed as an exhibit to the registration statement, each statement being qualified in all respects by such reference. A copy of the registration statement, including the exhibits and schedules thereto, may be read and copied at the SEC's Public Reference Room at 100 F Street, N.E., Washington, D.C. 20549. Information on the operation of the Public Reference Room may be obtained by calling the SEC at 1-800-SEC-0330. In addition, the SEC maintains an Internet website that contains reports, proxy statements and other information about issuers, like us, that file electronically with the SEC. The address of that website is www.sec.gov. The registration statement, including the exhibits and schedules thereto, are also available for reading and copying at the offices of As a result of the offering, we will become subject to the full informational requirements of the Exchange Act. We will fulfill our obligations with respect to such requirements by filing periodic reports and other information with the SEC. We intend to furnish our stockholders with annual reports containing consolidated financial statements certified by an independent public accounting firm. We also maintain a website at www.bats.com. Our website and the information contained therein or connected thereto shall not be deemed to be incorporated into this prospectus or the registration statement of which it forms a part. In this prospectus, unless otherwise specified or if the context so requires: "ADNV" refers to average daily notional value. "ADV" refers to average daily volume. "ATS" refers to alternative trading system. ATSs are SEC-approved trading venues that are exempted from registering as a national securities exchange. "BYX" refers to "BZX" refers to "Chi-X Europe" refers to our broker-dealer in Europe, which is authorized by the FCA. "co-location services" refers to the practice of allowing customers to place their computer servers in close physical proximity to a trading venue's servers to minimize latency. "CQS" refers to the Consolidated Quotation System, an electronic service, regulated by the SEC, which provides quotation information for securities listed on various national and regional securities exchanges. "CTA" refers to the Consolidated Tape Association, which oversees the dissemination of real-time trade and quotation information pursuant to two plans, the CQS Plan and the Consolidated Tape Plan. "customers" refer to the members of our national securities exchanges, the sponsored access users of our national securities exchanges, our market data vendors and the participants in our European markets, collectively. "dark pools" refer to ATSs and MTFs that do not publicly display quotations. "DE Route" refers to Direct Edge ECN LLC, our subsidiary that was previously registered as a broker-dealer but which is no longer in operation. "derivatives" refer to financial contracts whose value is derived from some other underlying asset or reference value, which may include individual stocks, stock indices, debt instruments, interest rates, currencies, commodities and various benchmarks related to trading and investment strategies. "Direct Edge" refers to Direct Edge Holdings "Direct Edge Integration" refers to the migration of the EDGX and EDGA exchange operations onto the "ECN" or "electronic communication network" refers to any electronic system that widely disseminates to third parties orders entered into it by a national securities exchange market maker or OTC market maker and permits such orders to be executed in whole or in part. "EDGA" refers to Bats EDGA Exchange, Inc., a national securities exchange. "EDGX" refers to Bats EDGX Exchange, Inc., a national securities exchange. "EuroCCP" refers to one of the clearing houses used by "FINRA Trade Reporting Facilities" refers to the automated trade reporting and reconciliation services which provide all FINRA members a way to report price and volume of off-exchange trades in U.S. listed equity securities. "FCA" refers to the Financial Conduct Authority. Financial services businesses in the United Kingdom are regulated by the FCA, which is an independent non-governmental body, given statutory powers by the Financial Services Act of 2012. "high frequency trading" refers generally to trading by professional traders acting in a proprietary capacity that engage in strategies that generate a large number of trades on a daily basis. These traders could be organized in a variety of ways, including as a proprietary trading firm (which may or may not be a registered broker-dealer and member of FINRA), as the proprietary trading desk of a multi-service broker-dealer or as a hedge fund. Other characteristics often attributed to such firms engaged in high frequency trading are: (i) the use of extraordinarily high-speed and sophisticated computer programs for generating, routing, and executing orders; (ii) use of co-location services and individual data feeds offered by exchanges and others to minimize network and other types of latencies; (iii) very short time-frames for establishing and liquidating positions; (iv) the submission of numerous orders that are cancelled shortly after submission; and (v) ending the trading day in as close to a flat position as possible (that is, not carrying significant, unhedged positions over-night). "last sale data feed" refers to a real-time intraday feed that disseminates matched trade price, volume and execution time on our book, but excludes quotations. "latency" refers to the time it takes to accept, process and acknowledge or deliver an order. "liquidity maker" refers to a customer posting an order on an order book. "liquidity taker" refers to a customer executing against an order resting on an order book. "lit" trading refers to trading on a securities exchange, ATS or MTF that publicly displays quotations. "maker-taker" pricing refers to a pricing model whereby a liquidity maker is paid a rebate in connection with an execution on our book, and a liquidity taker is charged a fee in connection with an execution against an order on our book. "market share," "share of the market" or "share of trading" with respect to: (i) the U.S. equity market or specific securities in such market, such as NASDAQ- or NYSE-listed securities, during any period, means the number of shares of such U.S. listed cash equity securities and ETPs that were matched on BZX, BYX, EDGX and EDGA during such period divided by the total number of shares of such U.S. listed cash equity securities and ETPs that all national securities exchanges and the FINRA Trade Reporting Facilities reported as having been matched during such period; (ii) the U.S. equity options market during any period, means the number of U.S. listed equity option contracts that were matched on BZX and EDGX during such period divided by the total number of U.S. listed equity option contracts that all national securities exchanges reported as having been matched during such period; or (iii) European trading in the securities traded on value of all trades in the securities and ETPs available for trading on trading or an auction phase that the major European national securities exchanges and major MTFs reported as having been matched during such period. The total notional value of all such trades does not include the notional value of OTC trades. The total notional value of all trades in the securities and ETPs available for trading on "member" refers to a member of BZX, BYX, EDGX or EDGA. "MiFID" refers to the Market in Financial Instruments Directive. "MiFID II" refers to the Market in Financial Instruments Directive II. "MTF" refers to multilateral trading facility, an electronic venue authorized by the FCA to offer trading in cash equity securities throughout Europe. "NBBO" refers to the national best bid or best offer. "NBBO setter pricing" refers to a pricing model by which customers set the NBBO for listed equity options, listed cash equity securities and ETPs, such as ETFs. NBBO setter pricing provides customers who execute a specified minimum volume with higher liquidity rebates for orders posted on our market that improve the then current NBBO. This in turn provides better execution prices for other customers. "net "net capture per one hundred touched shares" refers to annual transaction fees less liquidity payments and routing and clearing costs divided by "net capture per "net capture per
"NSCC" refers to the National Securities Clearing Corporation. The NSCC provides centralized clearing, information and settlement services to the financial industry. "OCC" refers to The Options Clearing Corporation. The OCC is an equity derivatives clearing organization, providing centralized clearing, information and settlements services to the financial industry. "OPRA" refers to the Options Price Reporting Authority, LLC. OPRA is the designated securities information processor for market information that is generated through the trading of exchange-listed securities options in the United States. OPRA disseminates certain core trading information, such as last sale reports and quotations. "options" refer to contracts giving the buyer the right, but not the obligation, to buy or sell a specified quantity of an underlying security or index at a specific price for a specific period of time. "order messages" refer to order, acceptance, execution, modification and cancellation messages. "OTF" refers to an organized trading facility. "participant" refers to a participant of "principal investors" refer to thirteen affiliates of our customers, Bank of America Merrill Lynch, Citadel, Citigroup, Credit Suisse, Deutsche Bank Securities, Goldman Sachs, Instinet, J.P. Morgan, Knight Capital, Lime, Morgan Stanley, Tradebot Ventures and WEDBUSH, as well as ISE and BGM Holding, L.P. and its affiliates. "RIE" refers to Recognised Investment Exchange. "RSA" refers to regulatory services agreement. "smart-order routing" refers to a product offered by us and others that enables the onward routing of unfilled orders to other market centers using a variety of pre-designed algorithmic strategies that are designed to obtain the best prices available on an order-by-order basis. "sponsored access" refers to the practice of allowing customers who are not members or participants of a market to send orders directly to the market by using the name and connectivity of a sponsoring member or participant. The sponsoring member or participant is responsible for all orders entered on or through the market by a sponsored access client. "taker-maker" pricing refers to a pricing model whereby a liquidity maker is charged a fee in connection with an execution on an order book, and a liquidity taker is paid a rebate in connection with an execution against an order on an order book. "touched contracts" refers to the sum of all option contracts matched or routed on BZX or EDGX. "touched shares" refers to the sum of all shares matched or routed on BZX, BYX, EDGX or EDGA. "UTP" refers to unlisted trading privileges, which are governed by the UTP Act of 1994. "VIX volatility index" represents the CBOE Volatility Index®, a measure of market expectations of near-term volatility conveyed by S&P 500 stock index options prices.
The Board of Directors and Stockholders We have audited the accompanying consolidated statements of financial condition of Bats Global Markets, Inc. (formerly known as BATS Global Markets, Inc.) and its subsidiaries (the Company) as of December 31, We conducted our audits in accordance with the standards of the Public Company Accounting Oversight Board (United States). Those standards require that we plan and perform the audit to obtain reasonable assurance about whether the financial statements are free of material misstatement. An audit includes examining, on a test basis, evidence supporting the amounts and disclosures in the financial statements. An audit also includes assessing the accounting principles used and significant estimates made by management, as well as evaluating the overall financial statement presentation. We believe that our audits provide a reasonable basis for our opinion. In our opinion, the consolidated financial statements referred to above present fairly, in all material respects, the financial position of
Kansas City, Missouri
See accompanying notes to consolidated financial statements.
See accompanying notes to consolidated financial statements.
See accompanying notes to consolidated financial statements. Bats Global Markets, Inc. (formerly known as BATS Global Markets, Inc.) and Subsidiaries Consolidated Statements of Changes in Stockholders' Equity Years ended December 31, 2015, 2014 and 2013 (In millions, except share data)
See accompanying notes to consolidated financial statements.
See accompanying notes to consolidated financial statements.
(1) Nature of Operations Bats Global Markets, Inc. (formerly known as BATS Global Markets, Inc.) and its consolidated subsidiaries (the Company or In the United States, the Company operates four national securities exchanges, Bats BZX Exchange, Inc. (formerly known as BATS Exchange, Inc.) (BZX), Bats BYX Exchange, Inc. (formerly known as BATS Y-Exchange, Inc.) (BYX), Bats EDGX Exchange, Inc. (formerly known as EDGX Exchange, Inc.) (EDGX) and Bats EDGA Exchange, Inc. (formerly known as EDGA Exchange, Inc.) (EDGA). All trade listed cash equity securities and exchange-traded products (ETPs), such as exchange-traded funds (ETFs), but each target different market segments by offering different pricing alternatives. BZX and EDGX also In Europe, the Company's Recognised Investment Exchange (RIE), Globally, the Company serves the FX market, the world's largest asset class, with its Hotspot platform. Hotspot provides institutional spot FX services through electronic marketplaces in New York and London where buyers and sellers worldwide can trade directly and anonymously with each other. (2) Summary of Significant Accounting Policies (a) Principles of Accounting The Company follows accounting standards established by the Financial Accounting Standards Board (FASB) to report its financial condition, results of operations and cash flows. References to accounting principles generally accepted in the (b) Basis of Presentation The accompanying financial statements are presented on a consolidated basis to include the accounts and transactions of
Notes to Consolidated Financial Statements (Continued) December 31, 2015, 2014, and 2013 (2) Summary of Significant Accounting Policies (Continued) (c) Use of Estimates The preparation of consolidated financial statements in conformity with GAAP requires management to make estimates and assumptions that affect the reported amounts of assets and liabilities as well as disclosure of the amounts of contingent assets and liabilities at the date of the consolidated financial statements and the reported amounts of revenues and expenses during the reporting period. Actual results could differ materially from those estimates. Material estimates that are particularly susceptible to significant change in the near term include the receivable for market data fees, the valuation of goodwill and unrecognized tax benefits.
(d) Cash and Cash Equivalents The Company's cash and cash equivalents are exposed to concentrations of credit risk. The Company maintains cash at various financial institutions and brokerage firms which, at times, may be in excess of the federal depository insurance limit. The Company's management regularly monitors these institutions and believes that the potential for future loss is remote. The Company considers all liquid investments with original or acquired maturities of three months or less to be cash equivalents. (e) Restricted Cash The Company classifies cash not available for immediate use due to regulatory and other requirements as restricted cash, and presents it separately on the consolidated statements of financial condition. (f) Financial Investments Financial investments are classified as trading or available-for-sale. Trading financial investments represent financial investments held by the broker-dealer subsidiaries that retain the industry-specific accounting classification required for broker-dealers. These investments are recorded at fair value with unrealized gains and losses reflected within interest Available-for-sale financial investments are comprised of the financial investments not held by the broker-dealer subsidiaries. Unrealized gains and losses, net of income taxes, are included as a component of accumulated other comprehensive (loss) income in the accompanying consolidated statements of financial condition. Interest on financial investments, including amortization of premiums and accretion of discounts, is recognized as income when earned. Realized gains and losses on financial investments are calculated using the specific identification method and are included in interest A decline in the market value of any available-for-sale investment below carrying amount that is deemed to be other-than-temporary results in an impairment to reduce the carrying amount to realizable value. To determine whether an impairment is other-than-temporary, the Company considers all available information relevant to the collectability of the investment, including past events, current conditions, and reasonable and supportable forecasts when developing estimate of cash flows expected
Notes to Consolidated Financial Statements (Continued) December 31, 2015, 2014, and 2013 (2) Summary of Significant Accounting Policies (Continued) to be collected. Evidence considered in this assessment includes the reasons for the impairment, the severity and duration of the impairment, changes in value subsequent to year-end, forecasted performance of the investee, and the general market condition in the geographic area or industry in which the investee operates. (g) Accounts Receivable, Net Accounts receivable are concentrated with the Company's member firms and market data distributors and are carried at cost. On a periodic basis, management evaluates the Company's receivables and determines an appropriate allowance for uncollectible accounts receivable based on
anticipated collections. In circumstances where a specific customer's inability to meet its financial obligations is probable, the Company records a specific provision for uncollectible accounts against amounts due to reduce the receivable to the amount the Company estimates will be collected. Once the Company determines an allowance for an uncollectible account is necessary, interest on the receivable ceases to be accrued. See note (h) Property and Equipment, Net Property and equipment, net is stated at cost less accumulated depreciation. Depreciation is computed using the straight-line method over the estimated lives of the assets, generally ranging from three to seven years. Expenditures for repairs and maintenance are charged to expense as incurred. Depreciation of leasehold improvements is calculated using the straight-line method over the shorter of the related lease term or the estimated useful life of the assets. Long-lived assets to be held and used are reviewed to determine whether any events or changes in circumstances indicate that the carrying amounts of the assets may not be recoverable. The Company bases this evaluation on such impairment indicators as the nature of the assets, the future economic benefit of the assets, any historical or future profitability measurements, as well as other external market conditions or factors that may be present. If such impairment indicators are present that would indicate that the carrying amount of any asset may not be recoverable, the Company determines whether an impairment has occurred through the use of an undiscounted cash flow analysis of the asset at the lowest level for which identifiable cash flows exist. In the event of impairment, the Company recognizes a loss for the difference between the carrying amount and the estimated value of the asset as measured using quoted market prices or, in the absence of quoted market prices, a discounted cash flow analysis. The Company accounts for software development costs under ASC Topic 350,Intangibles—Goodwill and Other. The Company expenses software development costs as incurred during the preliminary project stage, while capitalizing costs incurred during the application development stage, which includes design, coding, installation and testing activities. (i) Goodwill and Intangible Assets, Net Goodwill represents the excess of purchase price over the value assigned to the net tangible and identifiable intangible assets of a business acquired. Goodwill is allocated to the Company's reporting units based on the assignment of the fair values of each reporting unit of the acquired company. The
Notes to Consolidated Financial Statements (Continued) December 31, 2015, 2014, and 2013 (2) Summary of Significant Accounting Policies (Continued) Company tests goodwill for impairment at the reporting unit level annually, or in interim periods if certain events occur indicating that the carrying value may be impaired. The impairment test is performed during the fourth quarter using December 1st carrying values, and if the fair value of the reporting unit is found to be less than the carrying value, an impairment loss is recorded. The Company completed its annual goodwill impairment test in the fourth quarter of Intangible assets, net, primarily include acquired trademarks and trade names, customer relationships, strategic alliance agreements, licenses and registrations and non-compete agreements.
Intangible assets with finite lives are amortized based on the discounted cash flow method applied over the estimated useful lives of the intangible assets. Intangible assets deemed to have indefinite useful lives are not amortized, but instead are tested for impairment at least annually, usually concurrently with goodwill. Impairment exists if the fair value of the asset is less than the carrying amount, and in that case, an impairment loss is recorded. The Company has performed the required intangible assets impairment tests and the determined that the strategic alliance intangible asset (j) Foreign Currency The financial statements of foreign subsidiaries where the functional currency is not the U.S. dollar are translated into U.S. dollars using the exchange rate in effect as of each statement of financial condition date. Statements of income and cash flow amounts are translated using the average exchange rate during the period. The cumulative effects of translating the statement of financial condition accounts from the functional currency into the U.S. dollar at the applicable exchange rates are included in accumulated other comprehensive (loss) income, net in the statements of financial condition. Foreign currency gains and losses are recorded as other income (expense), net in the consolidated statements of income. The Company's operations in the United Kingdom and Singapore are recorded in Pounds sterling and Singapore dollars, respectively. (k) Income Taxes Deferred taxes are recorded on a liability method whereby deferred tax assets are recognized for deductible temporary differences and operating loss and tax credit carryforwards, and deferred tax liabilities are recognized for taxable temporary differences. Temporary differences are the differences between the reported amounts of assets and liabilities and their tax bases. Deferred tax assets are reduced by a valuation allowance when, in the opinion of management, it is more likely than not that some portion or all of the deferred tax assets will not be realized. Deferred tax assets and liabilities are adjusted for the effects of changes in tax laws and rates on the date of enactment. The Company recognizes the tax benefit from an uncertain tax position only if it is more likely than not that the tax position will be sustained on examination by the taxing authorities, based upon the technical merits of the position. The tax benefit recognized in the consolidated financial statements from such a position is measured based on the largest benefit that has a greater than 50% likelihood of being realized upon ultimate settlement. Also, interest and penalties expense is recognized on the full
Notes to Consolidated Financial Statements (Continued) December 31, 2015, 2014, and 2013 (2) Summary of Significant Accounting Policies (Continued) amount of deferred benefits for uncertain tax positions. The Company's policy is to include interest and penalties related to unrecognized tax benefits in the income tax provision within the consolidated statements of income. (l) Revenue Recognition Transaction Fees and Liquidity Payments Under the Company's "maker-taker" pricing model on BZX, EDGX and the Company's RIE, a member posting an order (the liquidity maker) is paid a rebate (recorded in liquidity payments) for an execution occurring against that order, and a member executing against an order resting on the
Company's book (the liquidity taker) is charged a fee (recorded in transaction fees). As a result, transaction fees consist of "taker" fees and routing fee revenues charged on securities that are routed to another market center. Transaction fees and liquidity payments are considered earned and incurred upon execution of a trade and are recognized on a trade-date basis and recorded on a gross basis in revenues and cost of revenues. Under the Company's "taker-maker" pricing model on BYX and EDGA, a liquidity taker is paid a rebate (recorded in liquidity payments) for an execution occurring against that order and a liquidity maker is charged a fee (recorded in transaction fees) for posting such an order. Transaction fees and liquidity payments are considered earned and incurred upon execution of a trade and are recognized on a trade-date basis and recorded on a gross basis in revenues and cost of revenues. On the Company's FX platform, the customer is charged a transaction fee regardless of whether it is adding or removing liquidity from the market. Market Data Fees Market data fees are earned from U.S. tape plans, including the Unlisted Trading Privileges Plan (UTP), the Consolidated Tape Association Plan (CTA), and the Options Price Reporting Authority, LLC (OPRA), and also proprietary market data products. Fees collected from tape plan subscribers, net of plan costs, from UTP and CTA are allocated and distributed to plan participants according to their share of tape fees based on a formula required by Securities and Exchange Commission (SEC) Regulation NMS that takes into account both trading and quoting activity. Fees from the CTA and UTP are estimated and recognized on a monthly basis and received approximately 45 days after quarter end. Market data fees from OPRA are allocated based upon the share of total options transactions cleared for each of the OPRA members. Fees from OPRA are estimated and recognized on a monthly basis and received approximately 30 days after quarter end. The Company also charges data subscribers directly for proprietary market data in its U.S. Equities and European Equities segments. The proprietary market data fees are recognized Regulatory Transaction and Section 31 Fees BZX, BYX, EDGX and EDGA, as U.S. exchanges, are assessed Section 31 fees pursuant to the Securities Exchange Act of 1934 (Exchange Act). Section 31 fees are assessed on the notional value traded and are designed to recover the costs to the government of supervision and regulation of
Notes to Consolidated Financial Statements (Continued) December 31, 2015, 2014, and 2013 (2) Summary of Significant Accounting Policies (Continued) securities markets and securities professionals. These fees are paid directly to the SEC by the four exchanges. The exchanges, in turn, collect regulatory transaction fees that are designed to equal to the Section 31 fees from their members. The Company acts as the principal versus an agent on these transactions, and therefore these transactions are reported gross in the consolidated statements of income. BZX, BYX, EDGX and EDGA collect the regulatory transaction fees as a pass-through charge from members executing eligible trades and recognize these amounts in revenues, and the related Section 31 fees in cost of revenues as incurred on a settlement-date basis. Regulatory transaction fees received are included in cash and cash equivalents and financial investments in the consolidated statements of financial condition at the time of receipt. As required by law, the amount due to the SEC is remitted semiannually and recorded as Section 31 fees payable in the consolidated statements of financial condition until paid. Because the Company holds the funds received until payment is remitted to the SEC, the Company earns interest on the related balances.
Port Fees Port fees are generated primarily from connectivity services related to each of the electronic markets. Port fees are recognized on a monthly basis. Concentrations of Revenue and Liquidity Payments For the years ended December 31, 2015, 2014 and 2013, one member accounted for 11%, 12% and 10%, respectively, of the Company's transaction fees. For the No member is contractually or otherwise obligated to continue to use the Company's services. The loss of, or a significant reduction of, participation by these members may have a material adverse effect on the Company's business, financial position, results of operations and cash flows. (m) Earnings Per Share The Company presents both basic and diluted earnings per share. Basic earnings per share is computed by dividing net income by the weighted average number of common shares outstanding during the period. Diluted earnings per share is computed by dividing net income by the sum of the weighted average number of common shares and dilutive common share equivalents outstanding. (n) Stock-Based Compensation The Company grants stock-based compensation to its employees through awards of stock options and restricted stock. The Company records stock-based compensation expense for all stock-based compensation granted based on the grant-date fair value. The Company recognizes compensation expense related to stock-based compensation awards with graded vesting that have a service condition on a straight-line basis over the requisite service period of the entire award.
Notes to Consolidated Financial Statements (Continued) December 31, 2015, 2014, and 2013 (2) Summary of Significant Accounting Policies (Continued) The amount of stock-based compensation expense related to awards of restricted stock is based on the fair value of The amount of future stock-based compensation expense related to awards of stock options is based on the Black-Scholes valuation model. Assumptions used to estimate the grant-date fair value of stock options are determined as follows:
minimum of two years if comparable public company historical market prices are not available for the entire expected term; (o) Business Combinations The Company accounts for business combinations in accordance with ASC Topic 805,Business Combinations, which requires identifiable assets, liabilities and goodwill acquired in a business combination to be recorded at fair value at the acquisition date. Additionally, ASC Topic 805 requires transaction-related costs to be expensed in the period incurred. (p) Debt Issuance Costs The Company accounts for debt issuance cost in accordance with ASC Topic 470,Debt, which requires that all costs incurred to issue debt be capitalized and amortized over the life of the loan using the interest method. (q) Equity Method Investment In general, the equity method of accounting is used when the Company owns 20% to 50% of the outstanding voting stock of a company and when it is able to exercise significant influence over the operating and financial policies of a company. The Company has an investment where it has significant influence and as such accounts for the investments under the equity method of accounting. The
Notes to Consolidated Financial Statements (Continued) December 31, 2015, 2014, and 2013 (2) Summary of Significant Accounting Policies (Continued) Company records the pro-rata share of earnings or losses each period and records any dividends received as a reduction in the investment balance. The equity method investment is evaluated for other-than-temporary declines in value by considering a variety of factors such as the earnings capacity of the investment and the fair value of the investment compared to its carrying amount. If the estimated fair value of the investment is less than the carrying amount and the decline in value is considered to be other than temporary, the excess of the carrying amount over the estimated fair value is recognized in the financial statements as an impairment. (3) Recent Accounting Pronouncements In May 2014, the FASB issued Accounting Standards Update, or ASU, 2014-09,Revenue from Contracts with Customers (Topic 606), which supersedes the revenue recognition guidance in ASC 605,Revenue Recognition. The new revenue recognition standard sets forth a five-step revenue recognition model to determine when and how revenue is recognized. The core principle of the guidance is that an entity should recognize revenue to depict the transfer of promised goods or services to customers in an amount that reflects the consideration it expects to receive in exchange for those goods or services. The standard also requires more detailed disclosures. The standard provides alternative methods of initial adoption and is effective for the Company on January 1, 2017. Early adoption is not permitted. In August 2015, the FASB issued ASU 2015-14, which deferred the effective date of ASU 2014-09 to January 1, 2018. The Company is currently assessing the impact that this standard will have on the consolidated financial statements. In February 2015, the FASB issued ASU 2015-02,Consolidation (Topic 810). The ASU modifies the way a reporting entity evaluates whether or not it must consolidate certain legal entities into its consolidated financial statements. The standard is effective for the Company on January 1, 2016. Early adoption is permitted, however the Company will implement with the consolidated financial statements for the year ended December 31, 2016 The ASU will have no impact to the consolidated financial statements. In April 2015, the FASB issued ASU 2015-03,Interest—Imputation of Interest (Subtopic 835-30). The ASU simplifies the presentation of debt issuance cost on the consolidated statement of financial condition by requiring that the debt issuance cost related to a recognized debt liability be presented as a direct deduction from the carrying amount of that debt liability, instead of as an asset. The recognition and measurement guidance for debt issuance costs are not affected by this ASU. The ASU is effective for the Company on January 1, 2016 and does not have a material impact to the consolidated financial statements. In September 2015, the FASB issued ASU 2015-16,Business Combinations (Topic 805). This standard simplifies the accounting for adjustments made to provisional amounts recognized in a business combination. First, it requires that the acquirer recognize adjustments to provisional amounts that are identified during the measurement period in the reporting period in which the adjustment amount is determined. The acquirer also should record, in the same period's financial statements, the effect on earnings of changes in depreciation, amortization, or other income effects, if any, as a result of the change to the provisional amounts, calculated as if the accounting had been completed at the acquisition date. The amendments should be applied prospectively to adjustments to provisional amounts that are identified after December 15, 2015 and that are within the measurement period.
Notes to Consolidated Financial Statements (Continued) December 31, 2015, 2014, and 2013 (3) Recent Accounting Pronouncements (Continued) Upon transition, an entity would be required to disclose the nature of, and reason for, the change in accounting principle. An entity would provide that disclosure in the first annual period of adoption and in the interim periods within the first annual period. This ASU will have no impact on the consolidated financial statements. In November 2015, the FASB issued ASU 2015-17,Income Taxes—Balance Sheet Classification of Deferred Taxes (Topic 740). This standard affects only entities that present a classified statement of financial position. Deferred tax liabilities and assets will be classified as noncurrent in a classified statement of financial condition and the current requirement that deferred tax liabilities and assets of a tax-paying component of an entity be offset and presented as a single amount remains the same. The Company will adopt this ASU retrospectively in the first quarter of 2016. Adoption will not have a material effect on the consolidated financial statements. In January 2016, the FASB issued ASU 2016-01,Financial Instruments—Overall (Subtopic 825-10). This standard primarily affects the accounting for equity investments, financial liabilities under the fair value option, and the presentation and disclosure requirements for financial instruments. In addition, the FASB clarified guidance related to the valuation allowance assessment when recognizing deferred tax assets resulting from unrealized losses on available-for-sale debt securities. Under this ASU, unrecognized gains and losses from available-for-sale securities will be recognized through net income. This ASU is effective for the Company on January 1, 2018. Adoption will not have a material effect on the consolidated financial statements. In February 2016, the FASB issued ASU 2016-02,Leases, (Topic 842). The ASU will require organizations that lease assets—referred to as "lessees"—to recognize on the consolidated statement of financial condition the assets and liabilities for the rights and obligations created by those leases. The ASU is effective for the Company beginning on January 1, 2019. The Company is still evaluating the effect of this ASU on the consolidated financial statements. (4) Acquisitions and Recapitalization Direct Edge On January 31, 2014 (the Direct Edge Acquisition Date), the Company acquired 100% of the outstanding common stock of Direct Edge Holdings LLC (Direct Edge) (the
legacy The results of Direct Edge's operations have been included in the consolidated financial statements since the Direct Edge Acquisition Date.
Notes to Consolidated Financial Statements (Continued) December 31, 2015, 2014, and 2013 (4) Acquisitions and Recapitalization (Continued) The acquisition-date fair value of the consideration transferred totaled $386.2 million, which consisted of the following (in millions):
The Company issued 9.8 million shares of common stock valued at $35.14 per share. The fair value was based on a third-party valuation that used a discounted cash flow model and valuation multiples observed of publicly traded companies in a similar industry. The following table summarizes the estimated fair values of the assets acquired and liabilities assumed at the Direct Edge Acquisition Date (in millions):
Of the identifiable intangible assets recognized, $71.9 million was assigned to licenses and registrations and has an indefinite useful life. Therefore, this intangible asset will not be amortized, but its impairment will be evaluated at least annually. The remaining intangible assets will be amortized over the following useful lives:
The goodwill acquired was assigned to the
Notes to Consolidated Financial Statements (Continued) December 31, 2015, 2014, and 2013 (4) Acquisitions and Recapitalization (Continued) The fair value of accounts receivable acquired was $27.5 million. The gross amount of accounts receivable was $27.6 million, of which $0.1 million was deemed to be uncollectable. The Company recognized The amounts of revenue and operating income of Direct Edge are included in the Company's consolidated statements of income from the Direct Edge Acquisition Date to the period ending December 31, 2014 are as follows (in millions):
The following unaudited pro forma financial information presents the combined results of the Company and Direct Edge had the acquisition date been January 1, 2013 (in millions):
The supplemental 2014 and 2013 pro forma amounts have been calculated after applying the Company's accounting policies and adjusting the results to reflect the additional depreciation and amortization that would have been charged assuming the adjusted fair values of property and equipment and acquired intangible assets had been applied on January 1, 2013. The supplemental 2014 and 2013 pro forma financial information includes pro forma adjustments of $44.3 million and $4.4 million, respectively, for acquisition related costs, such as fees to investment bankers, attorneys, accountants and other professional advisors and severance to employees. Hotspot On March 13, 2015 (the Hotspot Acquisition Date), the Company completed the acquisition of Hotspot FX Holdings LLC (Hotspot) (the Hotspot Transaction) from a related party for $365 million in cash and a contingent consideration liability estimated at $62.6 million. This acquisition represents further expansion into non-equity trading businesses for the Company. The results of Hotspot's operations have been included in the consolidated financial statements since the Hotspot Acquisition Date and were included in the Global FX segment. The Company
Notes to Consolidated Financial Statements (Continued) December 31, 2015, 2014, and 2013 (4) Acquisitions and Recapitalization (Continued) elected to push down the purchase accounting of Hotspot to the lowest operating entity within that segment. The acquisition-date fair value of the consideration transferred totaled $430.1 million, which consisted of the following (in millions):
The contingent consideration liability represents a tax sharing arrangement with the seller for payment of 70% of the tax benefit from the amortization resulting from the Hotspot Transaction for the first three years after the Hotspot Acquisition Date and 50% of the tax benefit for the remaining twelve years. For a 30 day period after the third anniversary of the Hotspot Acquisition Date, the Company and the seller have the option to settle the remaining liability for $50.0 million. If neither the Company nor the former owner exercises such option, the payments will continue through 2030. The payments are contingent on the Company generating sufficient taxable net income to pay such tax benefits to the former owner. The estimated undiscounted outcomes of all future payments are in the range of $70.0 million to $91.9 million. The fair value of the contingent consideration liability at the Hotspot Acquisition Date was estimated using a probability-weighted discounted cash flow method, represents a Level 3 measurement as defined in ASC Topic 820, and changes in fair value are recorded in operating expenses in the statements of income. The following table summarizes the estimated fair values of the assets acquired and liabilities assumed at the Hotspot Acquisition Date (in millions):
Of the identifiable intangible assets recognized, $15.3 million was assigned to trademark/trade name and has an indefinite useful life. Therefore, this intangible asset will not be amortized, but its
Notes to Consolidated Financial Statements (Continued) December 31, 2015, 2014, and 2013 (4) Acquisitions and Recapitalization (Continued) impairment will be evaluated at least annually. The remaining intangible assets will be amortized over the following useful lives:
The goodwill acquired was assigned to the Global FX segment, as further described in note 9. The goodwill recognized is attributable primarily to expected synergies of the combined workforce and technologies of Bats and Hotspot. Goodwill deductible for tax purposes is $247.9 million. The fair value of accounts receivable acquired was $5.2 million. The gross amount of accounts receivable was $5.3 million, of which $0.1 million was deemed to be uncollectable. The Company recognized $7.4 million of Hotspot acquisition-related costs expensed during the year ended December 31, 2015. These costs are included in compensation and benefits, professional and contract services, and change in fair value of contingent consideration liability to related party in the consolidated statements of income. The amounts of revenue and operating income of Hotspot are included in the Company's consolidated statements of income from the Hotspot Acquisition Date to the year ended December 31, 2015 are as follows (in millions):
The following unaudited pro forma financial information presents the combined results including Hotspot had the acquisition date been January 1, 2014 (in millions, except earnings per share):
The supplemental 2015 and 2014 pro forma amounts have been calculated after applying the Company's accounting policies and adjusting the results to reflect the additional depreciation and amortization that would have been charged assuming the adjusted fair values of property and equipment and acquired intangible assets had been applied on January 1, 2014. The supplemental 2015
Notes to Consolidated Financial Statements (Continued) December 31, 2015, 2014, and 2013 (4) Acquisitions and Recapitalization (Continued) pro forma financial information includes pro forma adjustments of $0.8 million for Hotspot acquisition-related costs, such as fees to investment bankers, attorneys, accountants and other professional advisors and severance to employees. (5) Severance Subsequent to the
The following is a summary of the employee termination benefits recognized within compensation and benefits in the consolidated statements of income (in millions):
Financial Investments The Company's financial investments with original or acquired maturities longer than three months, but that mature in less than one year from the statement of financial condition date are classified as current assets and are summarized as follows (in millions):
Notes to Consolidated Financial Statements (Continued) December 31, 2015, 2014, and 2013 (6) Investments (Continued) Equity Method Investment In 2013, the Company acquired a 25% ownership interest in the European Multilateral Clearing Facility, N.V. (EMCF) for $10.3 million. In January 2014, EMCF changed its name to European Central Counterparty N.V. (EuroCCP). This investment is recorded as an equity method investment in the European Equities segment, as the Company shares in the proportionate results of the entity and has significant influence over the entity, but does not control the entity. This investment is recorded at
Allowance for doubtful accounts consisted of the following for the years ended December 31, 2015, 2014
Property and equipment consisted of the following as of December 31,
Depreciation expense was $13.9 million, $18.1 million
Notes to Consolidated Financial Statements (Continued) December 31, 2015, 2014, and 2013 (9) Goodwill and Intangible Assets, Net The following table presents the details of goodwill by segment (in millions):
The following table presents the details of the intangible assets (in millions):
For the years ended December 31, 2015, 2014
Notes to Consolidated Financial Statements (Continued) December 31, 2015, 2014, and 2013 (9) Goodwill and Intangible Assets, Net (Continued) The following table presents the categories of intangible assets at December 31,
The trading registrations and licenses of $82.2 million in U.S. Equities and European Equities segments, the Trademark intangible asset of $15.3 million in the Global FX segment and the domain name intangible asset of $0.2 million in the Corporate and Other segment and are not subject to amortization. In the fourth quarter 2013, the Company recorded an intangible asset impairment charge totaling $3.5 million related to the strategic alliance agreements acquired through the 2011 acquisition of Chi-X Europe. The Company has determined the carrying amount of the intangible is not recoverable and exceeded its fair value. The fair value of the strategic alliance was determined using the estimated cash flows from the strategic alliance. This charge was recorded in impairment of assets in the consolidated statements of income and attributed to the European Equities segment.
Accounts payable and accrued liabilities consisted of the following as of December 31,
Notes to Consolidated Financial Statements (Continued) December 31, 2015, 2014, and 2013 (11) Debt On December 19, 2012, the Company entered into (i) a term loan agreement in the amount of $300 million and (ii) revolving loans not to exceed $50 million (the '2012 Loan'). The proceeds received from the term loan were used by the Company to pay a $298.9 million dividend, or $13.20 per share, to all shareholders of Upon consummation of the acquisition of Direct Edge on January 31, 2014, the Company entered into (i) a term loan agreement in the amount of $470 million and (ii) revolving loans not to exceed $100 million (the 2014 Loan). The proceeds received from the 2014 Loan were used by the Company to extinguish the 2012 Loan, pay a dividend to the shareholders and for other corporate purposes. The 2012 Loan, related debt issuance costs and debt discount were extinguished resulting in a loss of $13.6 million that was recorded in non-operating expense on the consolidated statement of income. The term of the 2014 Loan is six years ending on January 31, 2020 with variable interest rate based on 1-month LIBOR (with floor of 100 basis points) plus a spread of 400 basis points (375 if leverage ratio falls below 2.25). The original issue discount was $1.2 million, or approximately 0.25%. The revolving loans have an interest rate of LIBOR plus 350 basis points and a three-year term, ending on January 31, 2017. The fee on the undrawn portion of the revolver is 0.5%. Principal payments on outstanding balances are made on a quarterly basis. The Company incurred $8.3 million of debt issuance costs, which was capitalized and is being amortized over the term of the loans. Upon consummation of the Hotspot Acquisition, the Company amended its 2014 loan (the Amended 2014 Loan). The Amended 2014 Loan increased the spread on the variable interest rate from 400 basis points to 475 basis points and required a 25 basis point amendment fee. The required annual amortization also increased from 5.0% per annum to 7.5% per annum. The impact of the amended terms on the present value of cash flows was less than 10%; therefore the amendment was accounted for as a modification. In addition, the Company entered into a new $150 million 3-year term loan (the 2015 Term Loan B-1) and a new $228 million 5-year term loan (the 2015 Term Loan B-2), both of which were funded immediately prior to the Hotspot transaction. The 2015 Term Loan B-1 has an interest rate based on 1-month LIBOR plus a spread of 375 basis points and a 100 basis point original issue discount, or $1.5 million. The 2015 Term Loan B-2 has an interest rate based on 1-month LIBOR (with floor of 100 basis points) plus a spread of 475 basis points and a 100 basis point original issue discount, or $2.3 million. In addition, the Company entered into a new $100 million revolving credit facility with an interest rate based on 1-month LIBOR plus a spread of 350 basis points and an undrawn fee of 50 basis points, replacing the revolving credit facility under the 2014 Loan. Debt issuance costs related to the new and restructured debt were $16.5 million, of which $0.2 million was expensed immediately and $6.6 million and $9.7 million were capitalized as debt issuance costs and additional debt discount, respectively, and are being amortized over the term of the loans.
Notes to Consolidated Financial Statements (Continued) December 31, 2015, 2014,
As of December 31,
The credit The Company and certain subsidiaries have guaranteed the repayment of obligations under the credit agreement and have granted pledges of the shares of certain subsidiaries along with a security interest in certain other assets of the Company and certain subsidiaries as collateral. As of December 31,
Notes to Consolidated Financial Statements (Continued) December 31, 2015, 2014, and 2013 (11) Debt (Continued) Interest expense recognized on the term loans and revolving loans is included in interest expense, net in the Corporate and
The following represents the changes in accumulated other comprehensive income (loss) by component, before tax (in millions):
Fair value is defined as the price that would be received to sell an asset or paid to transfer a liability in an orderly transaction between market participants at the measurement date and sets out a fair value hierarchy. The fair value hierarchy gives the highest priority to quoted prices in active markets for identical assets or liabilities (Level 1) and the lowest priority to unobservable inputs (Level 3). Inputs are broadly defined as assumptions market participants would use in pricing an asset or liability. The three levels of the fair value hierarchy are described below: Level 1: Unadjusted quoted prices in active markets for identical assets or liabilities that the reporting entity has the ability to access at the measurement date. The types of investments included in Level 1 include listed equities and listed derivatives. Level 2: Inputs other than quoted prices within Level 1 that are observable for the asset or liability, either directly or indirectly, and fair value is determined through the use of models or other valuation methodologies. Investments that are generally included in this category include
Notes to Consolidated Financial Statements (Continued) December 31, 2015, 2014, and 2013 (13) Fair Value Measurement (Continued) corporate bonds and loans, less liquid and restricted equity securities and certain over-the-counter derivatives. A significant adjustment to a Level 2 input could result in the Level 2 measurement becoming a Level 3 measurement. Level 3: Inputs are unobservable for the asset or liability and include situations where there is little, if any, market activity for the asset or liability. The inputs into the determination of fair value are based upon the circumstances and the best information available at the time and may require significant management judgment or estimation. Investments that are included in this category generally include equity and debt positions in private companies.
Instruments Measured at Fair Value on a Recurring Basis The following table presents the Company's fair value hierarchy for those assets measured at fair value on a recurring basis as of December 31,
Notes to Consolidated Financial Statements (Continued) December 31, 2015, 2014, and 2013 (13) Fair Value Measurement (Continued) The following is a description of the Company's valuation methodologies used for instruments measured at fair value on a recurring basis:
Financial investments classified as trading and available-for-sale consist of Contingent Consideration Liability The Company entered into a contingent consideration arrangement with the purchase of Hotspot from a related party on March 13, 2015. The fair value of this liability at December 31, 2015 is $65.4 million. That value is based on estimates of discounted future cash payments under the tax sharing agreement, a significant unobservable input, and is considered a Level 3 measurement. Instruments Measured at Fair Value on a Nonrecurring Basis
Notes to Consolidated Financial Statements (Continued) December 31, 2015, 2014,
Fair Value of Financial Instruments The following table presents the Company's fair value hierarchy for those financial instruments held by the Company as of December 31,
Notes to Consolidated Financial Statements (Continued) December 31, 2015, 2014, and 2013 (13) Fair Value Measurement (Continued) The carrying amounts of cash and cash equivalents, restricted cash, accounts receivable, other receivables, accounts payable and Section 31 fees payable approximate fair value due to their liquid or short-term nature.
Equity method investment The fair value of the EuroCCP investment at December 31, Long-term debt The carrying amount of long-term debt approximates its fair value based on traded quotes at December 31, 2015 and quoted LIBOR at
The following table sets forth a summary of changes in the fair value of the Company's level 3 financial liabilities during the year ended December 31, 2015, including a summary of unrealized (gains) losses during the period on the Company's Level 3 financial liabilities still held as of December 31, 2015.
(14) Segment Reporting The Company operates under
Notes to Consolidated Financial Statements (Continued) December 31, 2015, 2014, and 2013 (14) Segment Reporting (Continued)
cash equities and exchange-traded products routed transaction services that occur on Trading and DE Route. It also includes the listings business where
Notes to Consolidated Financial Statements (Continued) December 31, 2015, 2014,
Summarized financial data of the Company's reportable segments was as follows (in millions):
Notes to Consolidated Financial Statements (Continued) December 31, 2015, 2014,
The Instruments Measured at Fair Value on a Nonrecurring Basis Certain assets, such as goodwill and intangible assets, are measured at fair value on a non-recurring basis. For goodwill, the process involves using a discounted cash flow method to determine the fair value of each reporting unit on a stand-alone basis. That fair value is compared to the carrying amount of the
Notes to Consolidated Financial Statements (Continued) December 31, 2015, 2014,
The following table presents the
Notes to Consolidated Financial Statements (Continued) December 31, 2015, 2014,
The carrying amounts of cash and cash equivalents, restricted cash, accounts receivable, other receivables, accounts payable and Section 31 fees payable approximate fair value due to their liquid or short-term nature. Equity method investment The fair value of the EuroCCP investment at December 31, 2015 is $11.9 million. That value is based on estimates of free cash flows from the EuroCCP entity, a significant unobservable input, and is also considered a Level 3 measurement. At December 31, 2014, the carrying amount approximated fair value of $10.9 million. The primary input to the fair value measurement is a risk premium of 6.4%. Should that rate fluctuate by one percentage point, the valuation would change by approximately $2.0 million. Long-term debt The carrying amount of long-term debt approximates its fair value based on traded quotes at December 31, 2015 and quoted LIBOR at December 31, 2014 and is considered a Level 2 measurement. Information on Level 3 Financial Liabilities The following table sets forth a summary of changes in the fair value of the Company's level 3 financial liabilities during the year ended December 31, 2015, including a summary of unrealized (gains) losses during the period on the Company's Level 3 financial liabilities still held as of December 31, 2015.
(14) Segment Reporting The Company evaluates segment performance primarily based on operating income (loss). The Company has
Notes to Consolidated Financial Statements (Continued) December 31, 2015, 2014,
cash equities and exchange-traded products routed transaction services that occur on Trading and DE Route. It also includes the listings business where ETPs are listed on BZX. The Company
Notes to Consolidated Financial Statements (Continued) December 31, 2015, 2014,
Notes to Consolidated Financial Statements (Continued) December 31,
Contingent Consideration Liability The Company entered into a contingent consideration arrangement with the purchase of Hotspot from a related party on March 13, 2015. The fair value of this liability at Instruments Measured at Fair Value on a Nonrecurring Basis Certain assets, such as goodwill and intangible assets, are measured at fair value on a non-recurring basis. For goodwill, the process involves using a discounted cash flow method to determine the fair value of each reporting unit on a stand-alone basis. That fair value is compared to the carrying amount of the reporting unit, including its recorded goodwill. Impairment is considered to have occurred if the fair value of the reporting unit is lower than the carrying amount of the reporting unit. For the intangible assets, the process also involves using a discounted cash flow method to determine the fair value of each intangible asset. Impairment is considered to have occurred if the fair value of the intangible asset is lower than the carrying amount. These measurements are considered Level 3 and these assets are recognized at fair value if they are deemed to be impaired. As of December 31, 2015 and 2014, none of these assets were required to be recorded at fair value since no impairment indicators were present.
Notes to
(13) Fair Value Fair Value of Financial Instruments The following table presents the Company's fair value hierarchy for those financial instruments held by the Company as of
Notes to Consolidated Financial Statements (Continued) December 31, 2015, 2014, and 2013 (13) Fair Value Measurement (Continued) The carrying amounts of cash and cash equivalents, restricted cash, accounts receivable, other receivables, accounts payable and Section 31 fees payable approximate fair value due to their liquid or short-term nature.
Equity method investment The fair value of the EuroCCP investment at Long-term debt The carrying amount of long-term debt approximates its fair value based on traded quotes at December 31, 2015 and quoted LIBOR at Information on Level 3 Financial
The following table sets forth a summary of changes in the fair value of the Company's level 3 financial
The Company operates under four reportable segments: U.S. Equities, European Equities, U.S. Options and Global FX.
Notes to Consolidated Financial Statements (Continued) December 31, 2015, 2014, and 2013 (14) Segment Reporting (Continued)
cash equities and exchange-traded products routed transaction services that occur on
Notes to
(14) Segment Reporting (Continued) Summarized financial data of the Company's reportable segments was as follows (in millions):
Notes to Consolidated Financial Statements (Continued) December 31, 2015, 2014, and 2013 (14) Segment Reporting (Continued) Geographic Data The following table presents revenues and long-lived assets, net by geographic area for 2015, 2014 and 2013 (in millions). Revenues are classified based upon the location of the trading venue. Long-lived assets information is based on the physical location of the assets.
In 2014, the Company began offering a 401(k) retirement plan eligible to all U.S. employees not eligible for the Direct Edge 401(k) plan. The Company matches participating employee contributions dollar for dollar of up to five percent of salary. In 2014, the Company also administered the legacy Direct Edge 401(k) retirement plan eligible to all Direct Edge employees. The Company matched employee contributions to this plan dollar for dollar of up to six percent, capped at $9,000. Prior to 2014, the Company offered a SIMPLE Individual Retirement Account for the benefit of all U.S. employees. The Company matched participating employee contributions of up to three percent of salary. All U.S. employees were eligible to participate. The Company's contribution amounted to $0.5 million for the year ended December 31, 2013. This expense is included in compensation and benefits in the consolidated statements of income. BTL operates a stakeholder contribution plan and contributes to employee-selected stakeholder contribution plans. The Company matched participating employee contributions of up to five percent of salary. All employees of BTL were eligible to participate. The Company's contribution amounted to
Notes to Consolidated Financial Statements (Continued) December 31, 2015, 2014, and 2013 (16) Related Party Transactions Certain affiliates of stockholders of
In March 2015, the Company entered into a Transaction Services Agreement (TSA) with a certain stockholder, the seller of Hotspot. In connection with this TSA, the following expenses were recorded in the
As broker-dealers registered with the As of As of December 31, 2014, DE Route was As entities regulated by the Financial Conduct Authority (FCA), BTL and Chi-X Europe are both subject to the Capital Resources Requirement (CRR). As a RIE, BTL computes its CRR in accordance with its Financial Risk Assessment, as agreed by the FCA. This CRR was
Notes to Consolidated Financial Statements (Continued) December 31, 2015, 2014, and 2013 (17) Regulatory Capital (Continued) As a Banks, Investment firms, PRUdential (BIPRU) 50k firm as defined by the Markets in Financial Instruments Directive of the FCA, Chi-X Europe computes its CRR as the greater of the base requirement of $0.1 million at
The following table summarized the cash distributions declared by class of stock during the year ended December 31, 2014 (in millions):
The Company utilizes equity award programs for offering long-term incentives to its employees. The equity incentives have been granted in the form of nonstatutory stock options and restricted stock. In conjunction with these programs, the Company recognized stock-based compensation expense of
Notes to Consolidated Financial Statements (Continued) December 31, 2015, 2014, and 2013 (18) Equity (Continued) Stock Options In connection with the Company's failed attempt of an initial public offering (IPO) during 2012, the Company's registration statement on Form S-1 was declared effective by the SEC. As a result of the registration statement being declared effective and pursuant to the 2008 Plan and 2009 Plan, all remaining outstanding unvested stock options became fully vested one year after the effectiveness of the Company's registration statement. The Company recorded $0.4 million in stock-based compensation expense for the year ended December 31, 2013 as a result of the vesting acceleration of outstanding unvested stock options. During 2014, in connection with the acquisition of Direct Edge, the Company modified the quantity and the exercise prices of outstanding stock options pursuant to the anti-dilutive provisions of the 2009 Plan. The quantity was increased by approximately 8% and the exercise prices were reduced by 15-20% depending on the exercise prices. Summary stock option activity is presented below:
Notes to Consolidated Financial Statements (Continued) December 31, 2015, 2014, and 2013 (18) Equity (Continued) Summary of the status of nonvested options is presented below:
Cash proceeds received from 2,501 and 1,250 options exercised for the
Restricted Stock Summary restricted stock activity is presented below:
The total unrecognized compensation expense related to nonvested restricted stock is approximately
Notes to
(18) Equity (Continued) During 2015, 2014 and 2013, the Company purchased 50,381, 9,827 and 6,689 treasury shares respectively for $2.3 million, $0.3 million and $0.2 million, respectively, as the result of 139,745, 46,586 shares and During Share Repurchase Program During 2012, the Company approved a Share Repurchase Program (the SRP) as a way for employees to liquidate shares acquired through exercise of stock options or vesting of restricted stock. The SRP was effective for the periods ending on
The deferred tax
Notes to Consolidated Financial Statements (Continued) December 31, 2015, 2014, and 2013 (19) Income Taxes (Continued) The provision for income taxes for the years ended December 31, 2015, 2014 and 2013 consists of the following (in millions):
For the years ended December 31, 2015, 2014 and 2013, income from continuing operations before taxes consists of the following:
Income tax expense (benefit) attributable to income from continuing operations consists of:
Notes to Consolidated Financial Statements (Continued) December 31, 2015, 2014, and 2013 (19) Income Taxes (Continued) The following table shows the tax effects to additional paid-in capital and other comprehensive (loss) income (in millions):
The Company has elected to treat BTL and Chi-X Europe as flow-through entities for U.S. federal income tax purposes. As a result, the activities for BTL and Chi-X Europe are treated as branches of the Company, and taxable income or loss reported by BTL and Chi-X Europe are included in the U.S. federal income tax return of the Company. The Company assessed the realizability of its U.K. deferred tax assets and released its valuation allowance in 2013. The Company recorded a corresponding U.S. deferred tax liability for the U.K. deferred tax assets. It is anticipated that a portion of the U.K. tax liability will be offset by U.S. foreign tax credits subject to the limitations of Internal Revenue Code Section 901(m). Pursuant to U.K. tax law, net operating losses do not expire as long as the trade or business that generated the losses remains in existence. The income tax provision differs from the amount of income tax determined by applying the U.S. federal income tax rate to income before income tax provision for the years ended December 31, 2015, 2014 and 2013 due to the following (in millions):
The effective tax rate for 2015 was 40.7% compared to 38.7% in 2014 and 38.1% in 2013. The effective tax rate increased from 2013 to 2014 due a reduction in Section 199 benefits and an increase of unrecognized tax benefits. The effective tax rate increased from 2014 to 2015 due to higher non-deductible expenses. The Company provides a valuation allowance against net deferred tax assets if, based on management's assessment of historical and projected future operating results and other available evidence, it is more likely than not that some or all of the
Notes to Consolidated Financial Statements (Continued) December 31, 2015, 2014, and 2013 (19) Income Taxes (Continued) In 2013, the Company released its valuation allowance associated with its U.K. net deferred tax assets. A reconciliation of the U.K. valuation allowance for the year ended December 31, 2013 is as follows (in millions):
A reconciliation of the unrecognized tax benefits for the years ended December 31, 2015, 2014 and 2013 is as follows (in millions):
It is reasonably possible that the total amount of unrecognized tax benefits may decrease by approximately $4.2 million and 0.5 million within the next twelve months At December 31, 2015 The Company files a U.S. federal income tax return and tax returns in various jurisdictions, including a U.K. income tax return for its U.K. operations. The Company's open tax years are 2012 through 2015. The Company is currently under a U.S. federal income tax examination for tax year 2011, 2012 and 2013 and in certain states for certain subsidiaries. The Company believes the
Notes to Consolidated Financial Statements (Continued) December 31, 2015, 2014, and 2013 (20) Earnings Per Share The following table sets forth the computation of basic and diluted earnings per share (in millions, except per share data):
Stock options to purchase and restricted stock
Operating Leases The Company In November 2012, the Company entered into In October 2012 and amended in November 2013, the Company entered into a ten year lease agreement for office space In November 2013, the Company extended its lease at the U.S. disaster recovery In In February 2014, the Company extended its lease at its U.S. headquarters for ten years. In October 2015, the Company extended its lease at its London office through December 2017.
Notes to December 31, 2015, 2014, and (21) Commitments, Contingencies and Guarantees (Continued) Future annual minimum
Rent expense was $3.1 million, $4.2 million and $1.9 million, for the years ended December 31, 2015, 2014 and 2013, respectively, which is recorded in occupancy expense in the accompanying consolidated statements of income. Other operating lease expense included $1.7 million, $2.5 million and $1.3 million recorded in systems and data communication for the years ended December 31, 2015, 2014 and 2013, respectively, and $6.0 million and $5.6 million recorded in general and administrative for the years ended December 31, 2015 and 2014, respectively. Legal Proceedings From time to time the Company is involved in various legal proceedings arising in the ordinary course of business. The Company does not believe that the outcome of any of the reviews, inspections or other legal proceedings will have a material impact on the consolidated financial position, results of operations or cash flows; however, litigation is subject to many uncertainties, and the outcome of individual litigated matters is not predictable with assurance. On April 18, 2014, the City of Providence, Rhode Island filed a securities class action lawsuit in the Southern District of New York against On May 23, 2014 and May 30, 2014, Harold R. Lanier filed three class action lawsuits in the Southern District of New York against
Notes to Consolidated Financial Statements (Continued) December 31, 2015, 2014, and 2013 (21) Commitments, Contingencies and Guarantees (Continued) identical in all substantive respects, but each related to the dissemination of market data under a different market system—(i) the NASDAQ UTP Plan Market System; (ii) the OPRA Market System; and (iii) the Consolidated Quotation System and the Consolidated Tape System. Each of the actions purported to be brought on behalf of all subscribers who entered into contracts with the exchanges for the receipt of market data and were injured as a result of the misconduct detailed in the complaints, which includes allegations that the defendants did not provide market data services in a non-discriminatory manner or provide subscribers with "valid" data (i.e., data that is accurate and not stale). On January 16, 2015, Judge Katherine Forrest of the Southern District of New York held oral argument on the pending Motion to Dismiss and thereafter, on April 28, 2015, the Court filed an
Opinion and Order granting the exchange defendants' Motion to Dismiss, terminating all three class action lawsuits with prejudice. On May 20, 2015, Plaintiff filed a Notice of Appeal of the dismissal and on September 1, 2015, Appellant filed its appeal brief. Respondent's brief was filed on November 24, 2015 and Appellant's reply brief was filed on December 8, 2015. Oral argument has been scheduled for March 3, 2016. Securities Industry and Financial Markets Association ("SIFMA") has filed a number of denial of access applications with the SEC to set aside proposed rule changes to establish or modify fees for In addition, as a self-regulatory organization under the jurisdiction of the SEC, the Company is subject to routine reviews and inspections by the SEC, and Guarantees The Company uses Wedbush Securities, Morgan Stanley and Merrill Lynch (collectively, affiliates of stockholders of the Company) to clear its routed cash equities transactions. Wedbush Securities, Morgan Stanley and Merrill Lynch guarantee the trade until one day after the trade date, after which time the National Securities Clearing Corporation (NSCC) provides a guarantee. In the case of a failure to perform on the part on one of its clearing firms of routed cash equities transactions, Wedbush Securities or Morgan Stanley, the Company provides the guarantee to the counterparty to the trade. The Options Clearing Corporation (OCC) acts as a central counterparty on all transactions in listed equity options, and as such, guarantees clearance and settlement of all of the Company's options transactions. The Company believes that any potential requirement for the Company to make payments under these guarantees is remote and accordingly, has not recorded any liability in the consolidated financial statements for these guarantees.
Notes to Consolidated Financial Statements (Continued) December 31, 2015, 2014, and 2013 (22) Subsequent Events On April 1, 2016, the Company's board of directors approved a stock split at a ratio of 1 for 2.91 of each class of the Company's outstanding common stock, after giving effect to the reclassification of each share of Class A non-voting common stock to voting common stock and Class B non-voting common stock to non-voting common stock. As approved, the reclassification and stock split is contingent upon and shall become effective immediately after the filing of an amended and restated certificate of incorporation, and which will become effective immediately prior to the completion of the Company's IPO. The consolidated financial statements do not reflect the effects of the contingent reclassification and stock split. On March 28, 2016, the Company signed a definitive agreement to acquire ETF.com, a provider of ETF data, news and analysis, with approximately $3.0 million in annual revenue. The transaction closed on April 1, 2016. There have been no subsequent events that have occurred during such period that would require disclosure in, or adjustment to, the consolidated financial statements as of and for the year ended December 31, 2015. To the Managing Members of We have audited the accompanying consolidated financial statements of Direct Edge Holdings LLC and its subsidiaries (the Company), which comprise the consolidated statement of financial condition as of December 31, 2013, and the related consolidated statements of income, changes in members' equity, and cash flows for the year then ended, and the related notes to the consolidated financial statements. Management's Responsibility for the Financial Statements Management is responsible for the preparation and fair presentation of these consolidated financial statements in accordance with U.S. generally accepted accounting principles; this includes the design, implementation, and maintenance of internal control relevant to the preparation and fair presentation of consolidated financial statements that are free from material misstatement, whether due to fraud or error. Auditors' Responsibility Our responsibility is to express an opinion on these consolidated financial statements based on our audit. We conducted our audit in accordance with auditing standards generally accepted in the United States of America. Those standards require that we plan and perform the audit to obtain reasonable assurance about whether the consolidated financial statements are free from material misstatement. An audit involves performing procedures to obtain audit evidence about the amounts and disclosures in the consolidated financial statements. The procedures selected depend on the auditors' judgment, including the assessment of the risks of material misstatement of the consolidated financial statements, whether due to fraud or error. In making those risk assessments, the auditor considers internal control relevant to the entity's preparation and fair presentation of the consolidated financial statements in order to design audit procedures that are appropriate in the circumstances, but not for the purpose of expressing an opinion on the effectiveness of the entity's internal control. Accordingly, we express no such opinion. An audit also includes evaluating the appropriateness of accounting policies used and the reasonableness of significant accounting estimates made by management, as well as evaluating the overall presentation of the consolidated financial statements. We believe that the audit evidence we have obtained is sufficient and appropriate to provide a basis for our audit opinion. Opinion In our opinion, the consolidated financial statements referred to above present fairly, in all material respects, the financial position of the Company as of December 31, 2013, and the results of its operations and its cash flows for the year then ended in accordance with U.S. generally accepted accounting principles. /s/ KPMG LLP September 28, 2015
See accompanying notes to consolidated financial statements.
See accompanying notes to consolidated financial statements.
See accompanying notes to consolidated financial statements.
See accompanying notes to consolidated financial statements.
(1) Nature of Operations Direct Edge Holdings LLC and subsidiaries (the Company) is a financial technology company that develops and operates electronic markets for the trading of listed cash equity securities in the United States (U.S.) The Company is headquartered in Jersey City, New Jersey and only has operations in the U.S. The Company operates two national securities exchanges, EDGX Exchange, Inc. (EDGX) and EDGA Exchange, Inc. (EDGA). The Company also operates a routing broker-dealer, Direct Edge ECN LLC (DE Route) that provides routed transaction services for listed cash equity securities on EDGX and EDGA. The Company has one member class with no limitation on any members' liability. (2) Summary of Significant Accounting Policies (a) Principles of Accounting The Company follows accounting standards established by the Financial Accounting Standards Board (FASB) to report its financial condition, results of operations and cash flows. References to accounting principles generally accepted in the U.S. (GAAP) in these footnotes are to the FASB Accounting Standards Codification (ASC or Codification). (b) Basis of Presentation The accompanying financial statements are presented on a consolidated basis to include the accounts and transactions of the Company. All significant intercompany accounts and transactions have been eliminated. (c) Use of Estimates The preparation of consolidated financial statements in conformity with GAAP requires management to make estimates and assumptions that affect the reported amounts of assets and liabilities as well as disclosure of the amounts of contingent assets and liabilities at the date of the consolidated financial statements and the reported amounts of revenues and expenses during the reporting period. Actual results could differ materially from those estimates. (d) Cash and Cash Equivalents The Company's cash and cash equivalents are exposed to concentrations of credit risk. The Company maintains cash at various financial institutions and brokerage firms which, at times, may be in excess of the federal depository insurance limit. The Company's management regularly monitors these institutions and believes that the potential for future loss is remote. The Company considers all liquid investments with original or acquired maturities of three months or less to be cash equivalents. (e) Accounts Receivable, Net Accounts receivable are concentrated with the Company's member firms and market data distributors and are carried at cost. On a periodic basis, management evaluates the Company's receivables and determines an appropriate allowance for uncollectible accounts receivable based on
Notes to Consolidated Financial Statements (Continued) December 31, 2013 (2) Summary of Significant Accounting Policies (Continued) anticipated collections. In circumstances where a specific customer's inability to meet its financial obligations is probable, the Company records a specific provision for uncollectible accounts against amounts due to reduce the receivable to the amount the Company estimates will be collected. Once the Company determines an allowance for an uncollectible account is necessary, interest on the receivable ceases to be accrued. See note 3 for allowance for doubtful accounts activity. (f) Property and Equipment, Net Property and equipment, net is stated at cost less accumulated depreciation. Depreciation is computed using the straight-line method over the estimated lives of the assets. Expenditures for repairs and maintenance are charged to expense as incurred. Depreciation of leasehold improvements is calculated using the straight-line method over the shorter of the related lease term or the estimated useful life of the assets. Long-lived assets to be held and used are reviewed to determine whether any events or changes in circumstances indicate that the carrying amounts of the assets may not be recoverable. The Company bases this evaluation on such impairment indicators as the nature of the assets, the future economic benefit of the assets, any historical or future profitability measurements, as well as other external market conditions or factors that may be present. If such impairment indicators are present that would indicate that the carrying amount of any asset may not be recoverable, the Company determines whether an impairment has occurred through the use of an undiscounted cash flow analysis of the asset at the lowest level for which identifiable cash flows exist. In the event of impairment, the Company recognizes a loss for the difference between the carrying amount and the estimated value of the asset as measured using quoted market prices or, in the absence of quoted market prices, a discounted cash flow analysis. The Company accounts for software development costs under ASC Topic 350,Intangibles—Goodwill and Other. The Company expenses software development costs as incurred during the preliminary project stage, while capitalizing costs incurred during the application development stage, which includes design, coding, installation and testing activities. (g) Goodwill and Intangible Assets, Net Goodwill represents the excess of purchase price over the value assigned to the net tangible and identifiable intangible assets of a business acquired. Goodwill is allocated to the Company's reporting units based on the assignment of the fair values of each reporting unit of the acquired company. The Company tests goodwill for impairment at the reporting unit level annually, or in interim periods if certain events occur indicating that the carrying value may be impaired. The impairment test is performed using carrying values as of August 31 of each respective fiscal year, and if the fair value of the reporting unit is found to be less than the carrying value, an impairment loss is recorded. The Company completed its annual goodwill impairment test and determined that no impairment existed. Intangible assets, net, primarily include memberships to the U.S. tape plans. Intangible assets with finite lives are amortized based on the discounted cash flow method applied over the estimated useful lives of the intangible assets.
Notes to Consolidated Financial Statements (Continued) December 31, 2013 (2) Summary of Significant Accounting Policies (Continued) (h) Income Taxes The Company is a limited liability company, and as such, does not file consolidated federal income tax returns. The Company pays state income taxes in select states where business activities require such payments. Wholly owned subsidiaries of the Company are established as corporations and file consolidated federal income tax returns. For state and local income tax returns, the subsidiaries follow state guidelines, filing either consolidated returns, or filing separate returns for each of its subsidiaries. Deferred taxes are recorded on a liability method whereby deferred tax assets are recognized for deductible temporary differences, and deferred tax liabilities are recognized for taxable temporary differences. Temporary differences are the differences between the reported amounts of assets and liabilities and their tax bases. Deferred tax assets are reduced by a valuation allowance when, in the opinion of management, it is more likely than not that some portion or all of the deferred tax assets will not be realized. Deferred tax assets and liabilities are adjusted for the effects of changes in tax laws and rates on the date of enactment. The Company recognizes the tax benefit from an uncertain tax position only if it is more likely than not that the tax position will be sustained on examination by the taxing authorities, based upon the technical merits of the position. The tax benefit recognized in the consolidated financial statements from such a position is measured based on the largest benefit that has a greater than 50% likelihood of being realized upon ultimate settlement. Also, interest and penalties expense is recognized on the full amount of unrecognized benefits for uncertain tax positions. The Company's policy is to include interest and penalties related to unrecognized tax benefits in the income tax provision within the consolidated statement of income. (i) Revenue Recognition Transaction Fees and Liquidity Payments Under the Company's "maker-taker" pricing model on EDGX, a member posting an order (the liquidity maker) is paid a rebate (recorded in liquidity payments) for an execution occurring against that order, and a member executing against an order resting on the Company's book (the liquidity taker) is charged a fee (recorded in transaction fees). As a result, transaction fees consist of "taker" fees and routing fee revenues earned for orders that are routed to another market center. Under the Company's "taker-maker" pricing model on EDGA, a liquidity taker is paid a rebate (recorded in liquidity payments) for an execution occurring against that order and a liquidity maker is charged a fee (recorded in transaction fees) for posting such an order. Transaction fees and liquidity payments are considered earned and incurred upon execution of a trade and are recognized on a trade-date basis and recorded on a gross basis in revenues and cost of revenues.
Notes to Consolidated Financial Statements (Continued) December 31, 2013 (2) Summary of Significant Accounting Policies (Continued) Market Data Fees Market data fees are earned from U.S. tape plans, including the Unlisted Trading Privileges Plan (UTP) and the Consolidated Tape Association Plan (CTA), and also proprietary market data products. Fees collected from tape plan subscribers, net of plan costs, from UTP and CTA are allocated and distributed to plan participants according to their share of tape fees based on a formula required by Securities and Exchange Commission (SEC) Regulation NMS that takes into account both trading and quoting activity. Fees from the CTA and UTP are estimated and recognized on a monthly basis and received approximately 45 days after quarter end. The Company also charges data subscribers directly for proprietary market data. The proprietary market data fees are earned on a monthly basis. Regulatory Transaction and Section 31 Fees EDGX and EDGA, as U.S. exchanges, are assessed Section 31 fees pursuant to the Securities Exchange Act of 1934 (Exchange Act). Section 31 fees are assessed on the notional value traded and are designed to recover the costs to the government of supervision and regulation of securities markets and securities professionals. These fees are paid directly to the SEC by the exchanges. The exchanges, in turn, collect regulatory transaction fees that are designed to equal to the Section 31 fees from their members. The Company acts as the principal versus an agent on these transactions, and therefore these transactions are reported gross in the consolidated statement of income. EDGX and EDGA collect the regulatory transaction fees as a pass-through charge from members executing eligible trades and recognize these amounts in revenues, and the related Section 31 fees in cost of revenues as incurred on a settlement-date basis. Regulatory transaction fees received are included in cash and cash equivalents in the consolidated statement of financial condition at the time of receipt. As required by law, the amount due to the SEC is remitted semiannually and recorded as Section 31 fees payable in the consolidated statement of financial condition until paid. Because the Company holds the funds received until payment is remitted to the SEC, the Company earns interest on the related balances. Port Fees Port fees are generated primarily from connectivity services related to each of the electronic markets. Port fees are recognized on a monthly basis. Concentrations of Revenue and Liquidity Payments For the year ended December 31, 2013 one customer accounted for 12%, of the Company's transaction fees. Approximately 11% of liquidity payments related to one customer. No other customer accounted for more than 10% of the Company's transaction fees or liquidity payments during the year ended December 31, 2013. No member is contractually or otherwise obligated to continue to use the Company's services. The loss of, or a significant reduction of, participation by these members may have a material adverse effect on the Company's business, financial position, results of operations and cash flows.
Notes to Consolidated Financial Statements (Continued) December 31, 2013 (2) Summary of Significant Accounting Policies (Continued) (j) Equity Compensation The Company grants equity compensation to its employees through awards of equity options, phantom equity units and restricted cash awards. The terms of the phantom equity units and restricted cash awards are such that payment for units granted occurs upon a change of control, as defined by the phantom share unit plan and restricted cash award agreement, respectively. As such, expense for the phantom shares and restricted cash awards will only be recorded upon a change in control, and has not been recorded for the year ended December 31, 2013. The Company records equity compensation expense related to equity options based on the grant-date fair value. The Company recognizes compensation expense related to equity options with graded vesting that have a service condition on a straight-line basis over the requisite service period of the entire award. The amount of equity compensation expense related to awards of equity options is based on the Black-Scholes valuation model results at the grant date. No equity options were granted during the twelve months ended December 31, 2013. (k) Accounting for Legal Costs The Company accounts for legal costs as incurred and records them in professional and contract services in the accompanying statement of income. (l) Recently Issued Accounting Pronouncements In May 2014, the FASB issued Accounting Standards Update, or ASU, 2014-09, "Revenue from Contracts with Customers (Topic 606)," which supersedes the revenue recognition guidance in ASC 605, "Revenue Recognition." The new revenue recognition standard sets forth a five-step revenue recognition model to determine when and how revenue is recognized. The core principle of the guidance is that an entity should recognize revenue to depict the transfer of promised goods or services to customers in an amount that reflects the consideration it expects to receive in exchange for those goods or services. The standard also requires more detailed disclosures. The standard provides alternative methods of initial adoption and is effective for the Company on January 1, 2018. Early adoption is not permitted. The Company is currently assessing the impact that this standard will have on the consolidated financial statements.
Notes to Consolidated Financial Statements (Continued) December 31, 2013 (3) Allowance for Doubtful Accounts Allowance for doubtful accounts consisted of the following for the year ended December 31, 2013 (in thousands):
(4) Property and Equipment, Net Property and equipment consisted of the following as of December 31, 2013 (in thousands):
Depreciation expense was $6,763,000 for the year ended December 31, 2013. (5) Goodwill and Intangible Assets, Net Intangible assets resulted from the purchase of memberships to the CTA and the UTP plan (in thousands):
The following table presents the balance of intangible assets as of December 31, 2013 (in thousands):
The estimated future amortization expense is $98,000 for 2014, 2015, 2016, 2017 and 2018.
Notes to Consolidated Financial Statements (Continued) December 31, 2013 (6) Accounts Payable and Accrued Liabilities Accounts payable and accrued liabilities consisted of the following as of December 31, 2013 (in thousands):
(7) Debt In December 2012, the Company entered into a credit agreement with the Bank of Montreal to pay a distribution to its members and for other corporate purposes. The agreement provides a revolving credit line of up to $50 million until December 7, 2015, the date of termination. Terms include the ability for the Company to choose amongst interest rate options, which each have a varying repayment and other terms. In addition to the interest assessed on the borrowed amount, a quarterly additional fee will be assessed on the unused portion of the $50 million revolving credit line. Mandatory payments must be made in the event the Company issues additional debt or, if no additional debt is issued, payment must be made at the termination date. As of December 31, 2013, the Company had $6 million outstanding under the credit agreement. The credit agreement contains customary affirmative and negative covenants, events of default and a financial covenant to not exceed a maximum leverage ratio measured annually through the date of termination. As of December 31, 2013, the Company was in compliance with all covenants of the credit agreement. The Company and certain subsidiaries have guaranteed the repayment of obligations under the credit agreement. Interest expense recognized revolving loans is included in interest expense, net on the consolidated statement of income, and for the year ended December 31, 2013 was $355,000. (8) Fair Value Measurement Fair value is defined as the price that would be received to sell an asset or paid to transfer a liability in an orderly transaction between market participants at the measurement date and sets out a fair value hierarchy. The fair value hierarchy gives the highest priority to quoted prices in active markets for identical assets or liabilities (Level 1) and the lowest priority to unobservable inputs (Level 3). Inputs are broadly defined as assumptions market participants would use in pricing an asset or liability. The three levels of the fair value hierarchy are described below: Level 1: Unadjusted quoted prices in active markets for identical assets or liabilities that the reporting entity has the ability to access at the measurement date. The types of investments included in Level 1 include listed equities and listed derivatives.
Notes to Consolidated Financial Statements (Continued) December 31, 2013 (8) Fair Value Measurement (Continued) Level 2: Inputs other than quoted prices within Level 1 that are observable for the asset or liability, either directly or indirectly, and fair value is determined through the use of models or other valuation methodologies. Investments that are generally included in this category include corporate bonds and over-the-counter derivatives. A significant adjustment to a Level 2 input could result in the Level 2 measurement becoming a Level 3 measurement. Level 3: Inputs are unobservable for the asset or liability and include situations where there is little, if any, market activity for the asset or liability. The inputs into the determination of fair value are based upon the circumstances and the best information available at the time and may require significant management judgment or estimation. Investments that are included in this category generally include equity and debt positions in private companies. Nonrecurring Fair Value Measurements Goodwill Valuation of goodwill to determine impairment is performed annually, or more frequently if there is an event or circumstance that would indicate impairment may have occurred. The process involves calculations to determine the fair value of each reporting unit on a stand-alone basis. Acquisition multiples for similar entities are used to estimate the fair value of the reporting unit. That fair value is compared to the carrying amount of the reporting unit, including its recorded goodwill. Impairment is considered to have occurred if the fair value of the reporting unit is lower than the carrying amount of the reporting unit. These measurements are classified as Level 3. Fair Value of Financial Instruments The following table presents the Company's fair value hierarchy for those financial instruments held by the Company as of December 31, 2013 (in thousands):
The carrying amounts of cash and cash equivalents, accounts receivable, accounts payable, Section 31 fees payable and the revolving credit facility approximate fair value due to their liquid or short-term nature.
Notes to Consolidated Financial Statements (Continued) December 31, 2013 (9) Employee Benefit Plan In 2013, the Company also administered the Direct Edge 401(k) retirement plan eligible to all employees. The Company matched employee contributions to this plan dollar for dollar of up to six percent, capped at $9,000. The Company's contribution amounted to $752,000 for the year ended December 31, 2013. This expense is included in compensation and benefits in the consolidated statement of income. (10) Related Party Transactions Certain affiliates of members of the Company conduct trading activity through the EDGX and EDGA. The extent of such activity is presented in the accompanying consolidated statements of financial condition, income and cash flows. The Company has a Mutual Services Agreement (MSA) with a related party under which the Company and the related party charge each other for mutually provided technological services. During 2013, expense related to the MSA was $1,667,000. The Company charged the related party $650,000 in relation to the MSA. These were recorded net in systems and data communication in the consolidated statement of income. Similar results may not be achievable on an arm's length basis. The Company also has a Transition Services Agreement (TSA) with a related party. Under the terms of this TSA the related party would provide certain technological and administrative services in addition to facility overhead. For the year ended December 31, 2013, the amount expensed related to the TSA was $204,000 and recorded in systems and data communication in the accompanying consolidated statement of income. In addition to the TSA, the Company holds an office space lease with the same related party. The rent expenses related to this lease was $1,334,000 for the year ended December 31, 2013 and recorded in occupancy expense in the accompanying consolidated statement of income. (11) Regulatory Capital As an SEC registered broker-dealer, DE Route is subject to the SEC's Uniform Net Capital rule (Rule 15c3-1), which requires the maintenance of minimum net capital, as defined. The SEC's requirement also provides that equity capital may not be withdrawn or a cash dividend paid if certain minimum net capital requirements are not met. DE Route computes the net capital requirements under the basic method provided for in Rule 15c3-1. As of December 31, 2013, DE Route is required to maintain net capital equal to the greater of 6.67% of aggregate indebtedness items, as defined, or $100,000. At December 31, 2013, DE Route had net capital of $2,741,000 which was $2,531,000 in excess of its required net capital of $210,000. (12) Equity Compensation The Company utilizes equity award programs for offering long-term incentives to its employees. The equity incentives have been granted in the form of equity options under the Direct Edge Holdings LLC 2010 Equity Incentive Plan (the Equity Plan), phantom share units under the Amended and Restated 2007 Phantom Share Unit Plan (the PSUP) and restricted cash awards under a Restricted Cash Award Agreement. In conjunction with the Equity Plan, the Company recognized equity compensation expense of $1,508,000 for the year ended December 31, 2013. This expense is included in compensation and benefits in the consolidated statement of income.
Notes to Consolidated Financial Statements (Continued) December 31, 2013 (12) Equity Compensation (Continued) Equity Options Equity options granted under Equity Plan generally vest over three years or upon a change in control, are exercisable after five years and have a ten year contractual term. As of December 31, 2013, no equity options are exercisable. Summary equity option activity is presented below:
Summary of the status of nonvested options is presented below:
Phantom Shares Phantom shares were granted under the PSUP to certain employees. The program was created to provide long-term incentives to employees who started with the Company in its early stages. There are 443,770 units outstanding as of December 31, 2013. No units have been granted or forfeited in the year ended December 31, 2013. Terms of the PSUP dictate that payment for units granted will occur only upon a change in control, and as such, no expense has been recorded for these units for the year ended December 31, 2013. Restricted Cash Awards In 2011, the Company established restricted cash awards under the terms of the Restricted Cash Award Agreement. These awards entitle certain employees to a cash payment upon a change in control. Similar to the PSUP, no expense has been recorded for these awards for the year ended December 31, 2013.
Notes to Consolidated Financial Statements (Continued) December 31, 2013 (13) Income Taxes Net deferred tax assets consist of the following components as of December 31, 2013 (in thousands):
The Company provides a valuation allowance against net deferred tax assets if, based on management's assessment of historical and projected future operating results and other available evidence, it is more likely than not that some or all of the deferred tax assets will not be realized. Management believes it is more likely than not that the deferred tax assets will be realized based upon expectations of future taxable income. The provision for income taxes for the year ended December 31, 2013 consists of the following (in thousands):
The income tax provision differs from the amount of income tax determined by applying the U.S. federal income tax rate to income before income tax provision for the year ending December 31, 2013 due to the following (in thousands):
Notes to Consolidated Financial Statements (Continued) December 31, 2013 (13) Income Taxes (Continued) At December 31, 2013, the Company had no unrecognized tax benefits. The Company files a U.S. federal income tax return and tax returns in various state jurisdictions. The Company's open tax years are 2010 through 2013. The Company believes the aggregate amount of any additional liabilities that may result from their examination, if any, will not have a material adverse effect on the financial position, results of operations, or cash flows of the Company. (14) Commitments, Contingencies and Guarantees Operating Leases The Company leases office and data center space under operating leases with third parties. Some leases contain renewal options and escalation clauses based on increases in property taxes and building operating costs. The Company also leases certain hardware used in its exchange operations. Future annual minimum lease commitments under these operating leases as of December 31, 2013, are as follows (in thousands):
Rent expense was $1,334,000 for the year ended December 31, 2013, and recorded as occupancy expense in the accompanying consolidated statement of income. Other operating lease expense of $6,463,000 is recorded in systems and data communication for the year ended December 31, 2013. Legal Proceedings From time to time the Company is involved in various reviews, inspections or other legal proceedings arising in the ordinary course of business. The Company does not believe that the outcome of any of the reviews, inspections or other legal proceedings will have a material impact on the consolidated financial position, results of operations or cash flows; however, litigation is subject to many uncertainties, and the outcome of individual litigated matters is not predictable with assurance. In a complaint filed on June 14, 2013 in the U.S. District Court for the District of Delaware, Relay IP, Inc. (Relay IP) claimed that the Company infringed a Relay IP patent through the Company's distribution of data using a multicast routing method known as the Protocol Independent Multicast-Sparse Mode standard, also known as the PIM-SM standard. On July 21, 2014, an Order of Dismissal with Prejudice was filed for the Company with the Court. As such, there was no impact to the consolidated financial statements as of December 31, 2013.
Notes to Consolidated Financial Statements (Continued) December 31, 2013 (14) Commitments, Contingencies and Guarantees (Continued) The Company's exchanges are self-regulatory organizations under the jurisdiction of the SEC and are subject to routine reviews and inspections by the SEC, and DE Route is subject to reviews and inspections by the Financial Industry Regulatory Authority (FINRA). In February 2012, the Company received a written request from the SEC's Division of Enforcement seeking documents and information related to the development, modification and use of order types, and the Company's communications with certain market participants (including certain exchange members affiliated with certain of the Company's stockholders and directors) regarding the development, modification and use of order types; the Company's information technology systems; and trading strategies. On January 12, 2015, the SEC's Division of Enforcement announced an Order Instituting Administrative Cease-and-Desist Proceedings and Imposing Remedial Sanctions against the Company in which the Company entered into a settlement agreement with the SEC, without admitting or denying the allegations. An accrual of $14,000,000 was recorded in the Enforcement action line items of both the consolidated statement of financial condition and the consolidated statement of income. Guarantees The Company uses Merrill Lynch, a related party, to clear its routed listed cash equity securities. Merrill Lynch guarantees the trade until one day after the trade date, after which time the National Securities Clearing Corporation (NSCC) provides a guarantee. In the case of a failure to perform on the part on its clearing firm, the Company provides the guarantee to the counterparty to the trade. The Company believes that any potential requirement for the Company to make payments under these guarantees is remote and accordingly, has not recorded any liability in the consolidated financial statements for these guarantees. (15) Subsequent Events The Company has performed an evaluation of events that have occurred subsequent to December 31, 2013 through September 28, 2015 the date the consolidated financial statements were issued. On January 31, 2014, the Company completed a merger with BATS Global Markets, Inc. (BATS). BATS acquired 100% of the outstanding common stock of the Company for a consideration valued at $386.2 million (BATS Acquisition). As a result of the acquisition, all outstanding options under the Equity Plan and all units granted under the PSUP were fully vested and exercised and the restricted cash payments were made. The credit agreement with Bank of Montreal was terminated upon the BATS Acquisition. Also, because of the BATS Acquisition, in January 2014 BATS indemnified the Company against the full amount of the SEC enforcement action. Subsequent to the BATS Acquisition, certain employees were terminated in 2014 and the first quarter of 2015. As of January 12, 2015, the EDGX and EDGA exchange operations were migrated to a new technology platform. In conjunction with this migration, the Company began routing all trades through
Notes to Consolidated Financial Statements (Continued) December 31, 2013 (15) Subsequent Events (Continued) the BATS affiliated broker-dealer, BATS Trading. The Company will no longer route trades through DE Route. Beginning in 2015, the legacy Direct Edge 401(k) plan was closed and all U.S. employees were eligible for the BATS 401(k) retirement plan. In June 2015, the Company negotiated an early termination of the lease for the data center space for $4.1 million. There have been no other subsequent events that have occurred during such period that would require disclosure in, or adjustment to, the consolidated financial statements as of and for the year ended December 31, 2013. The Board of Directors We have audited the accompanying combined financial statements of KCG Hotspot FX, which comprise the combined statements of financial condition as of December 31, 2014 and 2013, and the related combined statements of income, changes in net investment, and cash flows for the years then ended, and the related notes to the combined financial statements. Management's Responsibility for the Financial Statements Management is responsible for the preparation and fair presentation of these combined financial statements in accordance with U.S. generally accepted accounting principles; this includes the design, implementation, and maintenance of internal control relevant to the preparation and fair presentation of combined financial statements that are free from material misstatement, whether due to fraud or error. Auditors' Responsibility Our responsibility is to express an opinion on these combined financial statements based on our audits. We conducted our audits in accordance with auditing standards generally accepted in the United States of America. Those standards require that we plan and perform the audit to obtain reasonable assurance about whether the combined financial statements are free from material misstatement. An audit involves performing procedures to obtain audit evidence about the amounts and disclosures in the combined financial statements. The procedures selected depend on the auditors' judgment, including the assessment of the risks of material misstatement of the combined financial statements, whether due to fraud or error. In making those risk assessments, the auditor considers internal control relevant to the entity's preparation and fair presentation of the combined financial statements in order to design audit procedures that are appropriate in the circumstances, but not for the purpose of expressing an opinion on the effectiveness of the entity's internal control. Accordingly, we express no such opinion. An audit also includes evaluating the appropriateness of accounting policies used and the reasonableness of significant accounting estimates made by management, as well as evaluating the overall presentation of the combined financial statements. We believe that the audit evidence we have obtained is sufficient and appropriate to provide a basis for our audit opinion. Opinion In our opinion, the combined financial statements referred to above present fairly, in all material respects, the financial position of KCG Hotspot FX as of December 31, 2014 and 2013, and the results of its operations and its cash flows for the years then ended in accordance with U.S. generally accepted accounting principles. Emphasis of Matter As more fully described in note 1, the accompanying combined financial statements have been presented on a combined basis as the entities described in note 2 are all under common ownership and management. /s/ KPMG LLP December 3, 2015
See accompanying notes to combined financial statements.
See accompanying notes to combined financial statements.
See accompanying notes to combined financial statements.
See accompanying notes to combined financial statements.
(1) Nature of Operations On March 13, 2015, BATS Global Markets, Inc. acquired the foreign exchange electronic communications network (ECN) from Knight Capital Group, Inc. (Knight) a wholly owned subsidiary of KCG Holdings, Inc. (KCG or Parent). This ECN business includes the operations of Hotspot FX Holdings, Inc. and subsidiaries along with direct and allocated costs included in other subsidiaries of KCG (collectively the Company). These allocated costs represent support functions of KCG such as technology, legal, accounting and human resources. These costs are based on methodologies determined by KCG, such as headcount, estimates of actual time spent and square footage, and do not necessarily represent the cost of running the business on a stand-alone basis. The Company also includes revenues and costs directly attributable to the business, transacted out of its London sales office and included within the operating results of another KCG subsidiary. The Company provides electronic foreign exchange trading solutions to buy-side firms through its foreign exchange ECN that provides clients with access to live, executable prices for over 60 currency pairs as well as spot gold and silver streamed by market maker banks and other clients. The Company offers clients several access options including direct high-speed connectivity and a traditional front-end application. The Company was based in Jersey City, New Jersey with offices in London and Singapore. (2) Summary of Significant Accounting Policies (a) Principles of Accounting The Company follows accounting standards established by the Financial Accounting Standards Board (FASB) to report its financial condition, results of operations and cash flows. References to accounting principles generally accepted in the U.S. (GAAP) in these footnotes are to the FASB Accounting Standards Codification (ASC or Codification). (b) Basis of Presentation The accompanying combined financial statements are presented on a combined basis to include the accounts and transactions of portions of KCG Asia Pte. Ltd., Global Colocation Services LLC, KCG Holdings, Inc., KCG Americas LLC, KCG Europe Limited, KCG Hotspot FX LLC, Hotspot FXr, LLC, and GHC Allocations and all significant intercompany accounts and transactions have been eliminated. (c) Use of Estimates The preparation of combined financial statements in conformity with GAAP requires management to make estimates and assumptions that affect the reported amounts of assets and liabilities as well as disclosure of the amounts of contingent assets and liabilities at the date of the combined financial statements and the reported amounts of revenues and expenses during the reporting period. Actual results could differ materially from those estimates. (d) Cash and Cash Equivalents The Company's cash and cash equivalents are exposed to concentrations of credit risk. The Company maintains cash at various financial institutions and brokerage firms which, at times, may be in excess of the federal depository insurance limit. The Company's management regularly monitors these
Notes to Combined Financial Statements (Continued) December 31, 2014 and 2013 (2) Summary of Significant Accounting Policies (Continued) institutions and believes that the potential for future loss is remote. The Company considers all liquid investments with original or acquired maturities of three months or less to be cash equivalents. (e) Accounts Receivable, Net Accounts receivable are concentrated with the Company's clients and market data distributors and are carried at cost. On a periodic basis, management evaluates the Company's receivables and determines an appropriate allowance for uncollectible accounts receivable based on anticipated collections. In circumstances where a specific customer's inability to meet its financial obligations is probable, the Company records a specific provision for uncollectible accounts against amounts due to reduce the receivable to the amount the Company estimates will be collected. See note 3 for allowance for doubtful accounts activity. (f) Property and Equipment, Net Property and equipment, net is stated at cost less accumulated depreciation. Depreciation is computed using the straight-line method over the estimated lives of the assets, generally ranging from three to seven years. Expenditures for repairs and maintenance are charged to expense as incurred. Depreciation of leasehold improvements is calculated using the straight-line method over the shorter of the related lease term or the estimated useful life of the assets. Long-lived assets to be held and used are reviewed to determine whether any events or changes in circumstances indicate that the carrying amounts of the assets may not be recoverable. The Company bases this evaluation on such impairment indicators as the nature of the assets, the future economic benefit of the assets, any historical or future profitability measurements, as well as other external market conditions or factors that may be present. If such impairment indicators are present that would indicate that the carrying amount of any asset may not be recoverable, the Company determines whether an impairment has occurred through the use of an undiscounted cash flow analysis of the asset at the lowest level for which identifiable cash flows exist. In the event of impairment, the Company recognizes a loss for the difference between the carrying amount and the estimated value of the asset as measured using quoted market prices or, in the absence of quoted market prices, a discounted cash flow analysis. The Company expenses software development costs as incurred during the preliminary project stage, while capitalizing costs incurred during the application development stage, which includes design, coding, installation and testing activities. (g) Income Taxes Deferred taxes are recorded on a liability method whereby deferred tax assets are recognized for deductible temporary differences and operating loss and tax credit carryforwards, and deferred tax liabilities are recognized for taxable temporary differences. Temporary differences are the differences between the reported amounts of assets and liabilities and their tax bases. Deferred tax assets are reduced by a valuation allowance when, in the opinion of management, it is more likely than not that some portion or all of the deferred tax assets will not be realized. Deferred tax assets and liabilities are adjusted for the effects of changes in tax laws and rates on the date of enactment. The results of the
Notes to Combined Financial Statements (Continued) December 31, 2014 and 2013 (2) Summary of Significant Accounting Policies (Continued) Company's operations are included in the Parent's income tax returns. Income taxes are allocated to the Company using the pro-rata method. Tax accounts are settled periodically in accordance with the tax sharing agreement in place with the Parent. The Company recognizes the tax benefit from an uncertain tax position only if it is more likely than not that the tax position will be sustained on examination by the taxing authorities, based upon the technical merits of the position. The tax benefit recognized in the combined financial statements from such a position is measured based on the largest benefit that has a greater than 50% likelihood of being realized upon ultimate settlement. Also, interest and penalties expense is recognized on the full amount of deferred benefits for uncertain tax positions and recorded as a component of income tax expense on the combined statements of income. (h) ��Revenue Recognition Transaction Fees Under the Company's fee schedule, a customer is charged a fee for posting an order and executing against an existing order. Transaction fees are considered earned and incurred upon execution of a trade and are recognized on a trade-date basis and recorded on a gross basis in revenues. All customer transactions are executed in the U.S., and the Company maintains sales offices in London and Singapore. (i) Accounting for legal costs The Company accounts for legal costs as incurred and records them in professional and contract services in the accompanying combined statements of income. (j) Stock-Based Compensation The Company grants stock-based compensation to its employees through awards of restricted stock units. The Company records stock-based compensation expense for all stock-based compensation granted based on the grant-date fair value. The Company recognizes compensation expense related to stock-based compensation awards with graded vesting that have a service condition on a straight-line basis over the requisite service period of the entire award. The amount of stock-based compensation expense related to awards of restricted stock is based on the fair value of the Parent's common stock at the date of grant. (k) Recently Issued Accounting Pronouncements In May 2014, the FASB issued Accounting Standards Update, or ASU, 2014-09, "Revenue from Contracts with Customers (Topic 606)," which supersedes the revenue recognition guidance in ASC 605, "Revenue Recognition." The new revenue recognition standard sets forth a five-step revenue recognition model to determine when and how revenue is recognized. The core principle of the guidance is that an entity should recognize revenue to depict the transfer of promised goods or services to customers in an amount that reflects the consideration it expects to receive in exchange for those goods or services. The standard also requires more detailed disclosures. The standard provides
Notes to Combined Financial Statements (Continued) December 31, 2014 and 2013 (2) Summary of Significant Accounting Policies (Continued) alternative methods of initial adoption and is effective for the Company on January 1, 2019. The Company is currently assessing the impact that this standard will have on the combined financial statements. (3) Allowance for Doubtful Accounts Allowance for doubtful accounts consisted of the following for the years ended December 31, 2014 and 2013 (in thousands):
(4) Property and Equipment, Net Property and equipment consisted of the following as of December 31, 2014 and 2013 (in thousands):
Depreciation expense was $2,359,000 and $2,009,000 for the years ended December 31, 2014 and 2013, respectively. (5) Accounts Payable and Accrued Liabilities Accounts payable and accrued liabilities consisted of the following as of December 31, 2014 and 2013 (in thousands):
Notes to Combined Financial Statements (Continued) December 31, 2014 and 2013 (6) Fair Value Measurement Fair value is defined as the price that would be received to sell an asset or paid to transfer a liability in an orderly transaction between market participants at the measurement date and sets out a fair value hierarchy. The fair value hierarchy gives the highest priority to quoted prices in active markets for identical assets or liabilities (Level 1) and the lowest priority to unobservable inputs (Level 3). Inputs are broadly defined as assumptions market participants would use in pricing an asset or liability. The three levels of the fair value hierarchy are described below: Level 1: Unadjusted quoted prices in active markets for identical assets or liabilities that the reporting entity has the ability to access at the measurement date. The types of investments included in Level 1 include cash and cash equivalents. Level 2: Inputs other than quoted prices within Level 1 that are observable for the asset or liability, either directly or indirectly, and fair value is determined through the use of models or other valuation methodologies. Investments that are generally included in this category include corporate bonds and loans, less liquid and restricted equity securities and certain over-the-counter derivatives. A significant adjustment to a Level 2 input could result in the Level 2 measurement becoming a Level 3 measurement. Level 3: Inputs are unobservable for the asset or liability and include situations where there is little, if any, market activity for the asset or liability. The inputs into the determination of fair value are based upon the circumstances and the best information available at the time and may require significant management judgment or estimation. Investments that are included in this category generally include equity and debt positions in private companies. Fair Value of Financial Instruments The following table presents the Company's fair value hierarchy for those financial instruments held by the Company as of December 31, 2014 and 2013 (in thousands):
Notes to Combined Financial Statements (Continued) December 31, 2014 and 2013 (6) Fair Value Measurement (Continued)
The carrying amounts of cash and cash equivalents, accounts receivable, affiliate receivables, and other receivables approximate fair value due to their liquid or short-term nature. (7) Stock Based Compensation Certain employees of the Company participated in KCG's stock plans. The purpose of the stock plans is to provide incentive compensation, in the form of KCG stock-related awards, to employees of the Company. Eligible employees may receive KCG's restricted stock units (RSUs) as a portion of their total compensation. The majority of RSUs vest ratably over three years and are subject to accelerated vesting, or continued vesting, under certain termination circumstances in accordance with the applicable award documents and employment agreements between the Company or KCG and the participant. KCG has the right to fully vest employees in their RSUs upon retirement and in certain other circumstances. The Company measures compensation cost related to RSUs based on the market value of KCG's common stock at the date of grant. The Company recorded compensation expense relating to RSUs of the Company's direct employees of $348,000 and $2.6 million for the years ended December 31, 2014 and 2013, respectively. These amounts are included within Compensation and benefits on the Combined Statements of Income.
Notes to Combined Financial Statements (Continued) December 31, 2014 and 2013 (7) Stock Based Compensation (Continued) The following tables summarize the RSU activity for the Company's direct employees during 2013 and 2014 (in thousands, except per unit information):
(8) Related Parties The Company records expenses allocated from KCG for various operating expenses. Similar results may not be achievable on an arm's length basis. The following table presents the Company's allocation of expenses from KCG for the years ended December 31, 2014 and 2013:
Notes to Combined Financial Statements (Continued) December 31, 2014 and 2013 (8) Related Parties (Continued) The affiliate receivables balances presented on the combined statements of financial condition consist of receivables from other KCG entities. (9) Income Taxes Net deferred tax assets consist of the following components as of December 31, 2014 and 2013 (in thousands):
The Company provides a valuation allowance against deferred tax assets if, based on management's assessment of historical and projected future operating results and other available evidence, it is more likely than not that some or all of the deferred tax assets will not be realized. Management believes it is more likely than not that the deferred tax assets will be realized based upon expectations of future taxable income; therefore no valuation allowance related to deferred tax assets was established as of or during the years ended December 31, 2014 or 2013. The provision for income taxes for the years ended December 31, 2014 and 2013 consists of the following (in thousands):
Notes to Combined Financial Statements (Continued) December 31, 2014 and 2013 (9) Income Taxes (Continued) The income tax provision differs from the amount of income tax determined by applying the U.S. federal income tax rate to income before income tax provision for the years ended December 31, 2014 and 2013 due to the following (in thousands):
The effective tax rate for 2014 was 38.8% compared to 38.5% in 2013. The effective tax rate increased from 2013 to 2014 due to higher non-deductible expenses. At December 31, 2014 and 2013, the Company had no unrecognized tax benefits associated with uncertain tax positions. As of December 31, 2014, the Company is subject to U.S. Federal income tax examinations for the tax years 2009 through 2013. In addition, the Company is subject to state and local income tax examinations in various jurisdictions for the tax years 2011 through 2014. The final outcome of these examinations is not yet determinable, however, the Company does not anticipate that any adjustments would result in a material change to its results of operations or financial condition. (10) Contingencies, Commitments and Guarantees From time to time the Company is involved in various legal proceedings arising in the ordinary course of business. The Company does not believe that the outcome of any of the legal proceedings will have a material impact on the combined financial position, results of operations or cash flows; however, litigation is subject to many uncertainties, and the outcome of individual litigated matters is not predictable with assurance. On July 1, 2013, KCG, as borrower, entered into a first lien senior secured credit agreement (the "Credit Agreement") with Jefferies Finance LLC and Goldman Sachs Bank USA. The Credit Agreement was in the amount of $535 million (the "First Lien Credit Facility"). The First Lien Credit Facility had a carrying amount of $0 and $235 million for the years ended December 31, 2014 and 2013, respectively. The Lenders under the credit agreement have a security interest in all property of KCG, the Company, and other subsidiary guarantors including a guarantee and collateral agreement. On July 1, 2013, the Company, as a wholly-owned subsidiary guarantor of KCG, under the First Lien Credit Facility, as defined above, also entered into a Second Supplemental Indenture, whereby Senior Secured Notes of KCG, with a carrying amount of $305 million, and the obligations under the Senior Secured Notes Indenture will be fully and unconditionally guaranteed on a joint and several basis by KCG, the Company, and the other subsidiary guarantors and are secured by second-priority pledges and second-priority security interests in, and mortgages on, the collateral securing the First Lien Credit Facility, subject to certain exceptions.
Notes to Combined Financial Statements (Continued) December 31, 2014 and 2013 (11) Subsequent Events The Company has performed an evaluation of events that have occurred subsequent to December 31, 2014 through December 3, 2015 the date the combined financial statements were issued. On January 28, 2015, the Company entered into a definitive agreement to be acquired by BATS Global Markets, Inc., in a cash transaction valued at $365 million. The deal closed on March 13, 2015. As a result of the acquisition, all outstanding RSU's granted were fully vested and exercised. Also as a result of the acquisition, the Company was absolved of its subsidiary guarantor status under KCG's Credit Agreement. There have been no other subsequent events that have occurred during such period that would require disclosure in, or adjustment to, the combined financial statements as of and for the year ended December 31, 2014. 11,200,000 Shares
COMMON STOCK PROSPECTUS Morgan Stanley Citigroup BofA Merrill Lynch Credit Suisse Goldman, Sachs & Co. J.P. Morgan Jefferies Barclays Deutsche Bank Securities Nomura Rosenblatt Securities Sandler O'Neill + Partners, L.P. Dealer Prospectus Delivery Obligation Through and including , 2016 (the 25th day after the date of this prospectus), all dealers effecting transactions in these securities, whether or not participating in this offering, may be required to deliver a prospectus. This is in addition to the dealers' obligation to deliver a prospectus when acting as underwriters and with respect to their unsold allotments or subscriptions. , 2016
Item 13. Other Expenses of Issuance and Distribution.
Each of the amounts set forth above, other than the SEC registration fee and the FINRA filing fee, is an estimate. Item 14. Indemnification of Directors and Officers. Section 145 of the Delaware General Corporation Law, or DGCL, provides that a corporation may indemnify directors and officers as well as other employees and individuals against expenses (including attorneys' fees), judgments, fines and amounts paid in settlement actually and reasonably incurred by such person in connection with any threatened, pending or completed actions, suits or proceedings in which such person is made a party by reason of such person being or having been a director, officer, employee or agent to the Registrant. The DGCL provides that Section 145 is not exclusive of other rights to which those seeking indemnification may be entitled under any bylaw, agreement, vote of stockholders or disinterested directors or otherwise. On completion of this offering, the Registrant's amended and restated certificate of incorporation will contain provisions that eliminate, to the maximum extent permitted by the DGCL, the personal liability of the Registrant's directors for monetary damages for breach of their fiduciary duties as directors. The Registrant's amended and restated certificate of incorporation will provide that the Registrant must indemnify its directors and officers as well as directors or officers of another corporation, partnership, joint venture, trust or other enterprise serving at the request of the Registrant, and may indemnify its employees and other agents, in each case to the fullest extent permitted by the DGCL. Section 102(b)(7) of the DGCL permits a corporation to provide in its certificate of incorporation that a director of the corporation shall not be personally liable to the corporation or its stockholders for monetary damages for breach of fiduciary duty as a director, except for liability (i) for any breach of the director's duty of loyalty to the corporation or its stockholders, (ii) for acts or omissions not in good faith or which involve intentional misconduct or a knowing violation of law, (iii) for unlawful payments of dividends or unlawful stock repurchases, redemptions or other distributions or (iv) for any transaction from which the director derived an improper personal benefit. The Registrant's amended and restated certificate of incorporation will provide for such limitation of liability. The Registrant maintains standard policies of insurance under which coverage is provided (a) to its directors and officers against loss arising from claims made by reason of breach of duty or other wrongful act and (b) to the Registrant with respect to payments which may be made by the Registrant
to such officers and directors pursuant to the above indemnification provision or otherwise as a matter of law. II-1 The proposed form of underwriting agreement to be filed as Exhibit 1.1 to this Registration Statement provides for indemnification of directors and officers of the Registrant by the underwriters against certain liabilities. Item 15. Recent Sales of Unregistered Securities. Set forth below is information regarding securities sold by us within the past three years that were not registered under the Securities Act of 1933, as amended, or the Securities Act. Also, included is the consideration, if any, received by us for such securities and information relating to the section of the Securities Act, or rule of the SEC, under which exemption from registration was claimed (without taking into account the reclassification and 1. Since January 1, 2. Since January 1, 3. Since January 1, 4. On January 31, 2014, the Registrant issued 9,803,748 shares of common stock to certain members of Direct Edge for an aggregate value of $344.5 million as part consideration for the acquisition of 100% of the outstanding stock of Direct Edge. 5. Since January 1, None of these transactions involved any underwriters, underwriting discounts or commissions or any public offering. The securities referenced above in items (1) and (2) were issued in reliance on the exemption from registration provided by Section 4(a)(2) of the Securities Act and Rule 701 promulgated thereunder. These securities were issued pursuant to written compensatory benefit plans (or written contracts or arrangements relating to compensation) established for our employees and officers. The securities referenced above in item (3) were issued in reliance on the exemption from registration provided by Section 4(a)(2) of the Securities Act. Item 16. Exhibits and Financial Statement Schedules. (a) The following exhibits are filed as part of this Registration Statement:
II-2
II-3
(b) The following financial statement schedule is filed as part of this Registration Statement: None. The undersigned Registrant hereby undertakes to provide to the underwriters at the closing specified in the underwriting agreement certificates in such denominations and registered in such names as required by the underwriters to permit prompt delivery to each purchaser. Insofar as indemnification for liabilities arising under the Securities Act of 1933 may be permitted to directors, officers and controlling persons of the Registrant pursuant to the provisions referenced in Item 14 of this Registration Statement, or otherwise, the registrant has been advised that in the opinion of the Securities and Exchange Commission such indemnification is against public policy as expressed in the Securities Act and is, therefore, unenforceable. In the event that a claim for indemnification against such liabilities (other than the payment by the registrant of expenses incurred or paid by a director, officer, or controlling person of the registrant in the successful defense of any action, suit or proceeding) is asserted by such director, officer or controlling person in connection with the securities being registered hereunder, the registrant will, unless in the opinion of its counsel the matter has been settled by controlling precedent, submit to a court of appropriate jurisdiction the question of whether such indemnification by it is against public policy as expressed in the Securities Act and will be governed by the final adjudication of such issue. The undersigned registrant hereby undertakes that: (1) For purposes of determining any liability under the Securities Act, the information omitted from the form of prospectus filed as part of this Registration Statement in reliance upon Rule 430A and contained in a form of prospectus filed by the Registrant pursuant to Rule 424(b)(1) or (4) or 497(h) under the Securities Act shall be deemed to be part of this Registration Statement as of the time it was declared effective. (2) For the purpose of determining any liability under the Securities Act, each post-effective amendment that contains a form of prospectus shall be deemed to be a new Registration Statement relating to the securities offered therein, and the offering of such securities at that time shall be deemed to be the initial bona fide offering thereof. (3) In a primary offering of securities of the undersigned registrant pursuant to this registration statement, regardless of the underwriting method used to sell the securities to the purchaser, if the securities are offered or sold to such purchaser by means of any of the following II-4 communications, the undersigned registrant will be a seller to the purchaser and will be considered to offer or sell such securities to such purchaser: (i) Any preliminary prospectus or prospectus of the undersigned registrant relating to the offering required to be filed pursuant to Rule 424; (ii) Any free writing prospectus relating to the offering prepared by or on behalf of the undersigned registrant or used or referred to by the undersigned registrant; (iii) The portion of any other free writing prospectus relating to the offering containing material information about the undersigned registrant or its securities provided by or on behalf of the undersigned registrant; and (iv) Any other communication that is an offer in the offering made by the undersigned registrant to the purchaser.
Pursuant to the requirements of the Securities Act of 1933, the Registrant has duly caused this Registration Statement to be signed on its behalf by the undersigned, thereunto duly authorized, in the City of New York, State of New York, on the
Pursuant to the requirements of the Securities Act of 1933, as amended, this registration statement has been signed by the following persons in the capacities and on the dates indicated.
| |||||||||||||||||||||||||||||||||||||||||||||||||||||||||||||||||||||||||||||||||||||||||||||||||||||||||||||||||||||||||||||||||||||||||||||||||||||||||||||||||||||||||||||||||||||||||||||||||||||||||||||||||||||||||||||||||||||||||||||||||||||||||||||||||||||||||||||||||||||||||||||||||||||||||||||||||||||||||||||||||||||||||||||||||||||||||||||||||||||||||||||||||||||||||||||||||||||||||||||||||||||||||||||||||||||||||||||||||||||||||||||||||||||||||||||||||||||||||||||||||||||||||||||||||||||||||||||||||||||||||||||||||||||||||||||||||||||||||||||||||||||||||||||||||||||||||||||||||||||||||||||||||||||||||||||||||||||||||||||||||||||||||||||||||||||||||||||||||||||||||||||||||||||||||||||||||||||||||||||||||||||||||||||||||||||||||||||||||||||||||||||||||||||||||||||||||||||||||||||||||||||||||||||||||||||||||||||||||||||||||||||||||||||||||||||||||||||||||||||||||||||||||||||||||||||||||||||||||||||||||||||||||||||||||||||||||||||||||||||||||||||||||||||||||||||||||||||||||||||||
|---|---|---|---|---|---|---|---|---|---|---|---|---|---|---|---|---|---|---|---|---|---|---|---|---|---|---|---|---|---|---|---|---|---|---|---|---|---|---|---|---|---|---|---|---|---|---|---|---|---|---|---|---|---|---|---|---|---|---|---|---|---|---|---|---|---|---|---|---|---|---|---|---|---|---|---|---|---|---|---|---|---|---|---|---|---|---|---|---|---|---|---|---|---|---|---|---|---|---|---|---|---|---|---|---|---|---|---|---|---|---|---|---|---|---|---|---|---|---|---|---|---|---|---|---|---|---|---|---|---|---|---|---|---|---|---|---|---|---|---|---|---|---|---|---|---|---|---|---|---|---|---|---|---|---|---|---|---|---|---|---|---|---|---|---|---|---|---|---|---|---|---|---|---|---|---|---|---|---|---|---|---|---|---|---|---|---|---|---|---|---|---|---|---|---|---|---|---|---|---|---|---|---|---|---|---|---|---|---|---|---|---|---|---|---|---|---|---|---|---|---|---|---|---|---|---|---|---|---|---|---|---|---|---|---|---|---|---|---|---|---|---|---|---|---|---|---|---|---|---|---|---|---|---|---|---|---|---|---|---|---|---|---|---|---|---|---|---|---|---|---|---|---|---|---|---|---|---|---|---|---|---|---|---|---|---|---|---|---|---|---|---|---|---|---|---|---|---|---|---|---|---|---|---|---|---|---|---|---|---|---|---|---|---|---|---|---|---|---|---|---|---|---|---|---|---|---|---|---|---|---|---|---|---|---|---|---|---|---|---|---|---|---|---|---|---|---|---|---|---|---|---|---|---|---|---|---|---|---|---|---|---|---|---|---|---|---|---|---|---|---|---|---|---|---|---|---|---|---|---|---|---|---|---|---|---|---|---|---|---|---|---|---|---|---|---|---|---|---|---|---|---|---|---|---|---|---|---|---|---|---|---|---|---|---|---|---|---|---|---|---|---|---|---|---|---|---|---|---|---|---|---|---|---|---|---|---|---|---|---|---|---|---|---|---|---|---|---|---|---|---|---|---|---|---|---|---|---|---|---|---|---|---|---|---|---|---|---|---|---|---|---|---|---|---|---|---|---|---|---|---|---|---|---|---|---|---|---|---|---|---|---|---|---|---|---|---|---|---|---|---|---|---|---|---|---|---|---|---|---|---|---|---|---|---|---|---|---|---|---|---|---|---|---|---|---|---|---|---|---|---|---|---|---|---|---|---|---|---|---|---|---|---|---|---|---|---|---|---|---|---|---|---|---|---|---|---|---|---|---|---|---|---|---|---|---|---|---|---|---|---|---|---|---|---|---|---|---|---|---|---|---|---|---|---|---|---|---|---|---|---|---|---|---|---|---|---|---|---|---|---|---|---|---|---|---|---|---|---|---|---|---|---|---|---|---|---|---|---|---|---|---|---|---|---|---|---|---|---|---|---|---|---|---|---|---|---|---|---|---|---|---|---|---|---|---|---|---|---|---|---|---|---|---|---|---|---|---|---|---|---|---|---|---|---|---|---|---|---|---|---|---|---|---|---|---|---|---|---|---|---|---|---|---|---|---|---|---|---|---|---|---|---|---|---|---|---|---|---|---|---|---|---|---|---|---|---|---|---|---|---|---|---|---|---|---|---|---|---|---|---|---|---|---|---|---|---|---|---|---|---|---|---|---|---|---|---|---|---|---|---|---|---|---|---|---|---|---|---|---|---|---|---|---|---|---|---|---|---|---|---|---|---|---|---|---|---|---|---|---|---|---|---|---|---|---|---|---|---|---|---|---|---|---|---|---|---|---|---|---|---|---|---|---|---|---|---|---|---|---|---|---|---|---|---|---|---|---|---|---|---|---|---|---|---|---|---|---|---|---|---|---|---|---|---|---|---|---|---|---|---|---|---|---|---|---|---|---|---|---|---|---|---|---|---|---|---|---|---|---|---|---|---|---|---|---|---|---|---|---|---|---|---|---|---|---|---|---|---|---|---|---|---|---|---|---|---|---|---|---|---|---|---|---|---|---|---|---|---|---|---|---|---|---|---|---|---|---|---|---|---|---|---|---|---|---|---|---|---|---|---|---|---|---|---|---|---|---|---|---|---|---|---|---|---|---|---|---|---|---|---|---|---|---|---|---|---|---|---|---|---|---|---|---|---|---|---|---|---|---|---|---|---|---|---|---|---|---|---|---|---|---|---|---|---|---|---|---|---|---|---|---|---|---|---|---|---|---|---|---|---|---|---|---|---|---|---|---|---|---|---|---|---|---|---|---|---|---|---|---|