As filed with the Securities and Exchange Commission on September 23, 2013February 27, 2015
Registration No. 333-187604333-_________
UNITED STATES
SECURITIES AND EXCHANGE COMMISSION
Washington, D.C. 20549
PRE-EFFECTIVE AMENDMENT NO. 1 TO
FORM S-1
REGISTRATION STATEMENT UNDER THE SECURITIES ACT OF 1933
SINO AGRO FOOD, INC.
(Exact Name of Registrant as Specified in its Charter)
| Nevada | 2020 | 33-1219070 | ||
(State or other jurisdiction of incorporation or organization) | (Primary Standard Industrial Classification Code Number) | (IRS Employer Identification Number) |
Sino Agro Food, Inc.
Room 3801, Block A, China Shine Plaza
No. 9 Lin He Xi Road
Tianhe District, Guangzhou City, P.R.C. 510610
(860) 20 22057860
(Address, including zip code, and telephone number, including area code, of registrant’s principal executive offices)
Solomon Lee
Chief Executive Officer
Sino Agro Food, Inc.
Room 3801, Block A, China Shine Plaza
No. 9 Lin He Xi Road
Tianhe District, Guangzhou City, P.R.C. 510610
(860) 20 22057860
(Name, address, including zip code, and telephone number, including area code, of agent for service)
Copies to:
Marc Ross, Esq.
Henry Nisser, Esq.
Sichenzia Ross Friedman Ference, LLP
61 Broadway, 32nd Floor
New York, New York 10006
Telephone: (212) 930-9700
Approximate date of commencement of proposed sale to the public: As soon as practicable after this registration statement becomes effective.
If any of the securities being registered on the Form are to be offered on a delayed or continuous basis pursuant to Rule 415 under the Securities Act of 1933, check the following box: x
If this Form is filed to register additional securities for an offering pursuant to Rule 462(b) under the Securities Act, please check the following box and list the Securities Act registration statement number of the earlier effective registration statement for the same offering: ¨
If this Form is a post-effective amendment filed pursuant to Rule 462 (c) under the Securities Act, please check the following box and list the Securities Act registration statement number of the earlier registration statement for the same offering: ¨
If this Form is a post-effective amendment filed pursuant to Rule 462(d) under the Securities Act, check the following box and list the Securities Act registration statement number of the earlier registration statement for the same offering: ¨
Indicate by check mark whether the registrant is a large accelerated filer, an accelerated filer, a non-accelerated filer, or a smaller reporting company. See definitions of “large accelerated filer,” “accelerated filer,” and “smaller reporting company” in Rule 12b-2 of the Exchange Act:
| Large accelerated filer¨ | Accelerated filer ¨ |
| Non-accelerated filer ¨ | Smaller reporting companyx |
CALCULATION OF REGISTRATION FEE
| Title of Each Class of Securities to Be Registered | Amount to Be Registered (1) | Proposed Maximum Offering Price Per Share | Proposed Maximum Aggregate Offering Price | Amount Of Registration Fee | ||||||||||||
| Common stock, par value $0.001 per share (2) | 26,250,000 | $ | 1.00 | (3) | $ | 26,250,000.00 | $ | 3,580.50 | ||||||||
| Total | 26,250,000 | $ | 1.00 | $ | 26,250,000.00 | $ | 3,580.50 | (4) | ||||||||
| Title of Each Class of Securities to Be Registered | Amount to Be Registered (1) | Proposed Maximum Aggregate Offering Price (1) | Amount Of Registration Fee | |||
| 10.5% Convertible Note due February 28, 2020 | $15,516,667 | $15,516,667 | $1,803.04 | |||
| Common Stock, $0.001 par value | NA (2) | 0(3) | 0 |
(1) In the event of a stock split, stock dividend, or similar transaction involving the common stock, the number of shares registered shall automatically be increased to cover the additional shares of common stock issuable pursuant to Rule 416.
(2) Represents shares of the Registrant’s common stock being offered pursuant to the Registrant’s public offering.
(3) Estimated solely for the purpose of calculating the amount of the registration fee pursuant to Rule 457(a) of the Securities Act of 1933, as amended.
(4) Previously paid.
| (1) | Equals the aggregate principal amount of the note being registered under this Registration Statement. Estimated solely for the purpose of calculating the amount of the registration fee pursuant to Rule 457(o) under the Securities Act of 1933. |
| (2) | There is being registered hereunder an indeterminate number of shares of common stock issuable upon conversion of the note. The convertible note is convertible at any time at an initial conversion price of $9.90 per shares of our common stock, subject to adjustments for certain events. Pursuant to Rule 416 under the Securities Act of 1933, as amended, such number of shares of common stock registered hereby shall also include an indeterminate number of shares of common stock that may be issued in connection with a stock split, stock dividend, recapitalization or similar event or adjustment in the number of shares of common stock issuable as provided in the note. |
| (3) | Pursuant to Rule 457(i) under the Securities Act of 1933, no separate registration fee is required for the common stock issuable upon conversion of the note because no additional consideration will be received in connection with the exercise of any such conversion right. |
THE REGISTRANT HEREBY AMENDS THIS REGISTRATION STATEMENT ON SUCH DATE OR DATES AS MAY BE NECESSARY TO DELAY ITS EFFECTIVE DATE UNTIL THE REGISTRANT SHALL FILE A FURTHER AMENDMENT WHICH SPECIFICALLY STATES THAT THIS REGISTRATION STATEMENT SHALL THEREAFTER BECOME EFFECTIVE IN ACCORDANCE WITH SECTION 8(a) OF THE SECURITIES ACT OF 1933 OR UNTIL THIS REGISTRATION STATEMENT SHALL BECOME EFFECTIVE ON SUCH DATE AS THE SECURITIES AND EXCHANGE COMMISSION, ACTING PURSUANT TO SAID SECTION 8(a), MAY DETERMINE.
The information in this prospectus is not complete and may be changed. WeThe selling security holder may not sell these securities until the registration statement filed with the Securities and Exchange Commission is effective. This prospectus is not an offer to sell these securities and it is not soliciting an offer to buy these securities in any state where the offer or sale is not permitted.
| PRELIMINARY PROSPECTUS | SUBJECT TO COMPLETION, DATEDFEBRUARY 27, 2015 |
PRELIMINARY PROSPECTUS
SUBJECT TO COMPLETION, DATED SEPTEMBER 23, 2013
SINO AGRO FOOD, INC.
Up to 26,250,000$15,516,667
10.5% Convertible Note due February 28, 2020 and Shares of Common Stock Issuable Upon Conversion of the Note
This prospectus related to a direct public offering by Sino Agro Food, Inc.On August 29, 2014, we completed the closing of a maximumprivate placement financing transaction with Euro China Capital AB, an accredited investor, which purchased a 10.5% Convertible Note in the aggregate principal amount of 26,250,000up to $33,300,000. The note carries an original issue discount of 25% over its term and matures on February 28, 2020.The investor agreed to make advances to us, in its sole discretion, based on the following schedule: up to (i) $5,000,000 on August 12, 2014, (ii) $5,000,000 on August 31, 2014, (iii) $5,000,000 on November, 2014, and (iv) $18,300,000 on February 28, 2015. We received the initial advance of $5,000,000 less the 25% discount on August 12, 2014. Since then, we have received additional advances of $10,516,667, less the 25% discount.
Interest on the note shall accrue on the outstanding principal balance of the note from August 29, 2014. Interest is payable quarterly on the last day of each of March, June, September and December commencing September 30, 2014; provided, however, that the investor may elect to require us to issue to it a promissory note (valued at 100% of the principal amount thereof) in lieu of cash in satisfaction of any interest due and payable at such time (which we refer to herein as an interest payment note). Any interest payment note shall be subject to the same terms as the note (except as set forth in the note).
The note is convertible, at the discretion of the investor, into shares of our common stock (i) at a priceany time following an Event of $1.00 per share for maximum aggregate gross proceeds of $26,250,000. The shares offered by us will be offered at a fixed price of $1.00 per shareDefault (as defined in the note), or (ii) for a period of thirty (30) calendar days following October 1, 2015 and each anniversary thereof, at an initial conversion price per share of $9.90, subject to adjustment for stock splits, reverse stock splits, stock dividends and other similar transactions and subject to certain further adjustments as set forth in the note.
As long as the note is outstanding, the investor shall have a right of first refusal, exercisable for thirty (30) calendar days after notice to the investor, to purchase securities proposed to be offered and sold by us. The note is an unsecured obligation and ranks, in right of payment, the same as all of our existing and future unsecured indebtedness. The note is effectively subordinated to any secured indebtedness. Our obligations under the note are not guaranteed by any person.
This prospectus relates to exceed 180 days from the date of this prospectus. This price represents approximately 250%resales of the note and shares of our common stock issuable upon conversion of the note. The note (including portions thereof) and shares of common stock issuable upon conversion of the note may be sold from time to time under this prospectus by and for the account of the selling securityholder. The selling securityholder may sell all or a portion of the note and any shares of common stock issuable upon conversion of the note from time to time in market transactions, in negotiated transactions or otherwise, and at prices and on terms which will be determined by the then prevailing market price offor the shares of our common stock or at negotiated prices directly or through a broker, who may act as agent or as principal, or by a combination of September 20, 2013. There is no minimum numbersuch methods. See “Plan of shares that must be sold in the offering nor do we intend to establish an escrow or similar account.Distribution.” We will retainnot receive any of the proceeds from the sale of the note and any shares of common stock issued upon conversion of the note offered shares, and fundsby the selling securityholders. The selling securityholders will not be returned to investors. As a result, it is possible that noreceive all proceeds will be received by us or that if any proceeds are received, that such proceeds will not be sufficient to cover the costs of the offering. The shares are offered directly through our officers and directors. No commission or other compensation related to the sale of the shares will be paid to our officers and directors. Our officers and directors will not register as a broker-dealer with the Securities and Exchange Commission in reliance on Rule 3a4-1 of the Securities Exchange Act of 1934, as amended. The intended methods of communication include, without limitation, telephone and personal contact. For more information, see the section titled “Plan of Distribution” herein. Our officers, directors, control persons and affiliates of same do not intend to purchase any shares in this offering.
The direct public offering will terminate on the earlier of (i) the date when the sale of all 26,250,000 shares is completed or (ii) 180 days from the date of this prospectus. In addition, if we abandon the offering for any reason prior to 180 days from the date of this prospectus, we will terminate the offering.
Our common stock is eligible for quotation on the Over-the-Counter Bulletin Board under the symbol “SIAF.” On September 20, 2013, the last reported price of our common stock was $0.405 per share.
these sales. No underwriter or person has been engaged to facilitate the sale of shares of our common stock in this offering. There are no underwriting commissions involved in this offering. We have agreed to pay all the costs of this offering other than customary brokerage and sales commissions.
Our common stock is eligible for quotation on the OTC QB under the symbol “SIAF.” On February 20, 2015, the last reported price of our common stock was $8.50 per share.
Investing in our securities involves a high degree of risk. You should carefully consider the risks and uncertainties described under the heading “Risk Factors” beginning on page 4 of this prospectus before making a decision to purchase our common stock.
Neither the Securities and Exchange Commission nor any state securities commission has approved or disapproved of these securities or determined if this prospectus is truthful or complete. Any representation to the contrary is a criminal offense.
The date of this prospectus is _____, 20132015
TABLE OF CONTENTS
Before making your investment decision, you should read this entire prospectus carefully. This prospectus is part of a registration statement that we have filed with the Securities and Exchange Commission, or the SEC, using a “shelf” registration process. Under this shelf registration process, the selling securityholders may from time to time offer and sell portions of the note and the shares of common stock issuable upon conversion of the note described in this prospectus in the general manner described in “Plan of Distribution.”
You should read this prospectus together with additional information described under the heading “Where You Can Find More Information.”
You should rely only on the information contained in this prospectus. We have not authorized anyone to provide you with information different from that contained in this prospectus. You should assume that the information appearing in this prospectus is accurate only as of the date on the front cover of this prospectus. Our business, financial condition, results of operations and prospects may have changed since that date.
Unless otherwise expressly provided herein, all share and per share numbers set forth herein relating to our common stock reflect a 1 for 9.9 reverse stock split of our common stock, which became effective on December 16, 2014.
The following summary highlights information contained elsewhere in this prospectus. It may not contain all the information that may be important to you. You should read this entire prospectus carefully, including the sections entitled “Risk Factors” and “Management’s Discussion and Analysis or Plan of Operations,” and our historical financial statements and related notes included elsewhere in this prospectus.
In this prospectus, unless the context requires otherwise, references to the “Company,” “Sino Agro” “we,” “our company,” “our” and “us,” refer to Sino Agro Food, Inc., a Nevada corporation together with its subsidiaries.
Business Overview
We are a consulting, engineering and technology based company operating in the agriculture and aquaculture sectors with a vertically integrated business model as a developer, producer and distributor of organic agriculture and aquaculture produce and products through our operating subsidiaries in China.
Activities in 2011 concentrated on the building out of primary production activities in our feedstock, fertilizer fishery and cattle farm businesses leading into the initiation of basic infrastructure developed for our pre-wholesale and wholesale operations.
2012 was characterized by a marked expansion and continuation of our primary production activities and the development of wholesale operations, many delivering product sales, and by the build-out of the distribution network including import-export, as well as the start of retail operations.
We divide our operations into five standalone business divisions or units but in this section we will cover it as four divisions as follows: (1) fishery, (2) beef cattle, (3) fertilizer, enzymes and livestock feed, (4) Dragon Fruit (“HU”) flower plantation and (5) Corporate. The commonality between the divisions is that each operates in a comparatively slow growth consolidating market; our strategy is targeting niches of these markets with our products.
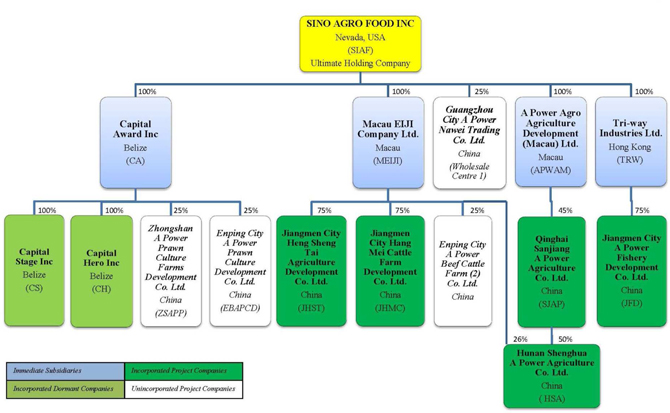
Corporate Structure
The table below shows our corporate structure:
Company History
Our company, which was formerly known as Volcanic Gold, Inc. and A Power Agro Agriculture Development, Inc., was incorporated on October 1, 1974 in the State of Nevada. We were engaged in the mining and exploration business but ceased our mining and exploring business on October 14, 2005. On August 24, 2007, we entered into a Merger and Acquisition Agreement with Capital Award Inc., a Belize corporation and its subsidiaries Capital Stage Inc. and Capital Hero Inc. Effective the same date, Capital Award completed a reverse merger transaction with us. We acquired all the outstanding common stock of Capital Award from Capital Adventure, a shareholder of Capital Award, for 32,000,0003,232,323 shares of our common stock.
On August 24, 2007 we changed our name from Volcanic Gold, Inc. to A Power Agro Agriculture Development, Inc. On December 8, 2007, we changed our name to Sino Agro Food, Inc. Our principal executive office is located at Room 3801, 38th Floor, Block A, China Shine Plaza, No. 9 Lin He Xi Road, Tianhe District, Guangzhou City, Guangdong Province, PRC, 510610.
| - 1 - |
Cross-Listing on First North
We have taken steps to have our shares of common stock quoted (no new shares will be issued) on NASDAQ OMX First North in Stockholm, Sweden (“First North”). First North is an alternative market, operated by the different exchanges within NASDAQ OMX (the “Exchange”). It does not have the legal status as an EU-regulated market. Companies trading on First North are subject to the rules of First North and not the legal requirements for admission to trading on a regulated market. The risk in such an investment may be higher than on the main market.
Before trading in our shares of common stock can commence, an application must be submitted to the Exchange for approval. We have engaged Erik Penser BankaktiebolagMangold Fondkommission AB (“EPB”MFAB”) to act as our financial adviseradvisor in connection with our efforts to have our shares of common stock quoted on First North. EPB, a privately held independent bankMFAB, based in Stockholm, is assisting us in the application process. Trading on First North is subject to a number of conditions including affiliation of our shares to Euroclear Sweden, sufficient shareholder distribution in Sweden and the approval of NASDAQ OMX. Our shares are currently eligible for quotation on the OTC BBQB in the United States and we expect them to continue to be traded on the OTC BB.QB. There can be no assurance that our shares of common stock will trade on First North.
Emerging Growth Company
We are an “emerging growth company,” as defined in the Jumpstart Our Business Startups Act of 2012. We will remain an emerging growth company until the earlier of (1) the last day of the fiscal year (a) following the fifth anniversary of the completions of this offering, (b) in which we have total annual gross revenue of at least $1.0 billion, or (c) in which we are deemed to be a large accelerated filer, which means the market value of our common stock that is held by non-affiliates exceeded $700.0 million as of the prior June 30th, and (2) the date on which we have issued more than $1.0 billion in non-convertible debt during the prior three-year period. We refer to the Jumpstart Our Business Startups Act of 2012 herein as the “JOBS Act” and references herein to “emerging growth company” shall have the meaning associated with it in the JOBS Act.
As an emerging growth company, we may take advantage of specified reduced disclosure and other requirements that are otherwise applicable generally to public companies. These provisions include:
We have taken advantage of some of these reduced burdens, and thus the information we provide stockholders may be different from what you might receive from other public companies in which you hold shares.
In addition, Section 107 of the JOBS Act also provides that an emerging growth company can take advantage of the extended transition period provided in Section 7(a)(2)(B) of the Securities Act for complying with new or revised accounting standards. In other words, an emerging growth company can delay the adoption of certain accounting standards until those standards would otherwise apply to private companies. However, we are choosing to “opt out” of such extended transition period, and as a result, we will comply with new or revised accounting standards on the relevant dates on which adoption of such standards is required for non-emerging growth companies. Section 107 of the JOBS Act provides that our decision to opt out of the extended transition period for complying with new or revised accounting standards is irrevocable.
Reverse Split
On November 10, 2014, the board of directors of Sino Agro Food, Inc. approved an amendment to our Articles of Incorporation to effectuate a reverse stock split (the “Reverse Split”) of our common stock, par value $.001 per share, affecting both the authorized and issued and outstanding number of such shares by a ratio of 9.9 for 1. The Reverse Split became effective in the State of Nevada on December 16, 2014. The Market Effective Date of the Reverse Split was December 16, 2014, having been approved by the Financial Industry Regulatory Authority, Inc. (“FINRA”) on December 15, 2014. As a result of the Reverse Split, each 9.9 shares of common stock authorized as well as each such share issued and outstanding prior to the Reverse Split has been converted into 1 share of common stock, and all options, warrants, and any other similar instruments convertible into, or exchangeable or exercisable for, shares of common stock have been proportionally adjusted. All references to common stock have been retroactively restated.
| - 2 - |
| Securities | ||
| Shares outstanding before the offering | 17,162,716 as of the date of this prospectus. | |
| Ranking | The note is an unsecured obligation and ranks, in right of | |
| Use of proceeds | We will not receive any of the | |
| Trading | The note sold under this prospectus will not be eligible for trading on any market. Our common stock is | |
| Risk | An investment in |
* We will retain the proceeds from the sale of any of the offered shares, and funds will not be returned to investors. It is possible that no proceeds will be received by the Company or that if any proceeds are received, that such proceeds will not be sufficient to cover the costs of the offering. See “Use of Proceeds” below for further information.
| - 3 - |
** There is no minimum number of shares that must be sold in the offering and the issue is not underwritten. Assumes no shares are issued between the date of this prospectus and the consummation of the offering.
Investing in ourthe note or the shares of common stock issuable upon conversion of the note involves a high degree of risk. Potential investors should consider carefully the risks and uncertainties described below together with all other information contained in this prospectus before making investment decisions with respect to ourthe note or the shares of common stock.stock issuable upon conversion of the note. If any of the following risks actually occur, our business, financial condition, results of operations and our future growth prospects would be materially and adversely affected. Under these circumstances, the trading price and value of our common stock could decline resulting in a loss of all or part of your investment. The risks and uncertainties described in this prospectus are the only material risks and uncertainties that we presently know to be facing our company.
This prospectus contains forward-looking statements. Forward-looking statements relate to future events or our future financial performance. We generally identify forward-looking statements by terminology such as “may,” “will,” “should,” “expects,” “plans,” “anticipates,” “could,” “intends,” “target,” “projects,” “contemplates,” “believes,” “estimates,” “predicts,” “potential” or “continue” or the negative of these terms or other similar words. These statements are only predictions. The outcome of the events described in these forward-looking statements is subject to known and unknown risks, uncertainties and other factors that may cause our customers’ or our industry’s actual results, levels of activity, performance or achievements expressed or implied by these forward-looking statements, to differ. ”Risk Factors,” “Management’s Discussion and Analysis of Financial Condition and Results of Operations” and “Business,” as well as other sections in this prospectus, discuss the important factors that could contribute to these differences.
The forward-looking statements made in this prospectus relate only to events as of the date on which the statements are made. We undertake no obligation to update any forward-looking statement to reflect events or circumstances after the date on which the statement is made or to reflect the occurrence of unanticipated events.
This prospectus also contains market data related to our business and industry. This market data includes projections that are based on a number of assumptions. If these assumptions turn out to be incorrect, actual results may differ from the projections based on these assumptions. As a result, our markets may not grow at the rates projected by these data, or at all. The failure of these markets to grow at these projected rates may have a material adverse effect on our business, results of operations, financial condition and the market price of our common stock.
Our current business operations are conducted in the PRC. Because China’s economy and its laws, regulations and policies are different from those typically found in the West and are continually changing, we face certain risks, which are summarized below.
Risks Related to Our Company
The current global economic and credit environment could have an adverse effect on demand for certainconcentration of our products and services, which would in turn have a negative impact oncurrent major customers could adversely affect our resultsbusiness if we were to lose one or more of operations, our cash flows, our financial condition, our ability to borrow and our stock price.them.
Since 2008, global market and economic conditions have been disrupted and volatile. Concerns over increased energy costs, geopolitical issues, the availability and cost of credit, the U.S. mortgage market sub-prime collapse and a declining residential real estate market in the U.S. have contributed to this increased volatility and diminished expectationsFour major customers for the economy andCorporate division accounted for 51.49% of consolidated revenues during the markets going forward. These factors, combined with volatile oil prices, declining business and consumer confidence and increased unemployment, have precipitated a global recession. It isfiscal year ended December 31, 2013. Two of those customers accounted for 33.11% of consolidated revenues, approximately evenly split. If one of our major customers were to go bankrupt, our associated accounts receivable would become difficult to predict how longcollect or a loss.
Our largest customer represents a group of thirty separate live seafood wholesalers at the current economic conditions will persist, whether they will deteriorate further,Guangzhou wholesale markets. Our second largest customer is Wholesale Center 1, or WSC 1, which is owned and whichoperated by Guangzhou City A Power NaWei Trading Co. Ltd., or APNW. Capital Award was the consulting engineer responsible for the construction of WSC 1 and development of its business operation via a Consulting and Service Contract granted by APNW. APNW is now one of our products, if not all of them, will be adversely affected. These conditions, if they continue, could cause a material decrease inmain wholesalers to whom we bill our sales net income and an increaseof seafood. APNW then distributes the seafood to other wholesalers in the prices we pay for raw materials usedvarious cities in producing our primary produce and products and our development cost and, thus, materially affect our operating results and financial condition.China.
We may be unable to maintain an effective system of internal control over financial reporting, and as a result we may be unable to accurately report our financial resultsresults..
Our reporting obligations as a public company place a significant strain on our management, operational and financial resources and systems. If we fail to maintain an effective system of internal control over financial reporting, we could experience delays or inaccuracies in our reporting ofour financial information, or non-compliance with the SEC reporting and other regulatory requirements. This could subject us to regulatory scrutiny and result in a loss of public confidence in our management, which could, among other things, cause our stock price to drop.
Because we will require additional financing to expand our vertically integrated operation in accordance withoperations according to our business plan and growinggrowth strategy, our failure to obtain necessary financing will impair our growth strategy; in addition, the riskrisks of vertical integration isare significant.
As of JuneSeptember 30, 2013,2014, we had net working capital of $145,332,475,$221,737,270, including cash and cash equivalents of $9,391,449.$4,691,157. Our capital requirements in connection withto accomplish our planned vertically integrated development and growth plan of our business are significant.
In most of the developed countries, risks of agriculture operations are shared to a certain degree by different sectors in the industry, for example the following:industry. For example:
| - 4 - |
| · | Research and development are often initiated and supported by government departments; | |
| · | Primary producers are mainly concerned with the growing risks of the produce; | |
| · | Marketing companies assume the risks of marketing the produce; | |
| · | Trading houses sell the produce and assume the credit risks of the sales; and | |
| · | Logistics companies assume the risks of transporting the produce. |
However, as a vertically integrated operator, we shall have to covermust assume all the mentionedabove-mentioned risks. China is a developing country and currentlycountry; compared to other developed nations, its agriculture industry hasis not been fully developed similarly to other developed nations. As a result,modern. Thus, management believes that it is essentially importantessential for us to be able to develop our business operation in a vertically integrated manner in order to be able toso that we can achieve reasonable profit margins for our products. Although we alsoWe believe that the multiple layers of profits generated through the multiple operationsvertical integration may compensate to some degree for the variety of risks that we face through the multiple operations, nevertheless,operations; however, the overall risks are much greater. At the same time, the full module of our five year plan for vertically integrated developments hasis not beenfully completed, and these vertically integratedthe remaining developments may require significant capital expenditures and management resources. Failure to implement these vertically integrated developments could hurt our ability to manage our growth and our financial position.
The estimated costs for this and other projects that are part of our growth strategy in the future will cost us an estimated $500 million in the aggregate and will be undertaken in phases of our 5 year-plan that was initiated in March of 2010, depending on the funds available to us including internal capital and external capital. We intend to use a significant part of the net proceeds from this offering to fund part of the estimated costs of its final phase. However, we will need approximately $118 million in 2013 to accomplish our longer term objectives, including but not limited to the approximately $26 million in gross proceeds intended to be raised from this offering. See “Use of Proceeds” on page 21 for more information.
As of June 30, 2013, the Company believed itself to be approximately $16.5 million short of its requirements, assuming the full $26 million in net proceeds of this offering is raised. As a result, it has commenced a bond offering in order to make up the shortfall in which it hopes to raise an additional amount of approximately $16.9 million; however, there can be no assurance that this amount, or any amount, will be raised in the bond offering. The Company has expended $79.5 million of the $118 million and has cash on hand of approximately $9 million as well as working capital as of June 30, 2013 of approximately $145 million.
We may at a certain point in time determine to use some or even all of remaining net proceeds of this offering, which we presently expect to allocate to working capital, to begin implementing these longer term objectives. However, even if we did so we would only have available a small portion of what we would need.
To accomplish the objectives discussed above and to execute our business strategy, we need access to capital on appropriate terms. We currently have no commitments with any third party to obtain such additional financing and we cannot assure you that we will be able to obtain the requisite additional financing on any terms and, if we are able to raise additional funds, it may be necessary for us to sell our securities at a price which is at a significant discount from the market price and on other terms which may be disadvantageous to us. In connection with any such financing, we may be required to provide registration rights to the investors and pay damages to the investors in the event that the registration statement is not filed or declared effective by specified dates. The price and terms of any financing which would be available to us could result in both the issuance of a significant number of shares and significant downward pressure on our stock price. We cannot assure you that our business objectives, particularly over the longer term, will be met on a timely basis, if at all. Consequently, we may be unable to meet fixed obligations and expenses that will be generated in the operation of our business, whether as presently in existence or as proposed. Any failure to obtain requisite financing on acceptable terms could have material and adverse effect on our business, financial condition and future prospects.
No assurance of successful expansion of operations.
Our significant increase in the scope and the scale of our product launch,operations, including the hiring of additional personnel, has resulted in significantly higher operating expenses. As a result, weWe anticipate that our operating expenses will continue to increase. Expansion of our operations may also cause amake significant demanddemands on our management, finances and other resources. Our ability to manage the anticipated future growth, should it occur, will depend upon a significant expansion of our accounting and other internal management systems and the implementation and subsequent improvement of a variety of systems, procedures and controls. There can be no assuranceWe cannot assure that significant problems in these areas will not occur. Any failureFailure to expand these areas and implement and improve such systems, procedures and controls in an efficient manner at a pace consistent with our business could have a material adverse effect on our business, financial condition and results of operations. There can be no assuranceWe cannot assure that our attempts to expand our marketing, sales, manufacturing and customer support efforts will be successfulsucceed or will result ingenerate additional sales or profitabilityprofits in any future period. As a result of the expansion of our operations and the anticipated increase in our operating expenses, as well asalong with the difficulty in forecasting revenue levels, we expect to continue to experience significant fluctuations in its results of operations.
We may be unable to successfully expand our production capacity, which could result in material delays, quality issues, increased costs and loss of business opportunities, which may negatively impact our product margins and profitability.profitability.
Part of our future growth strategy is to increase our production capacity to meet increasing demand for our existing goods. Assuming we obtain sufficient funding to increase our production capacity, any projects that we undertake to increase such capacity may not be constructed on the anticipated timetable or within budget. We may also experience quality control issues as we implement theseany production upgrades. Any material delay in completing these projects, or any substantial increase in costscost increases or quality issues in connection with these projects could materially delay our ability to bring our products to market and adversely affect our business, reduce our revenue, income and available cash, all of which could result in harmingharm our financial condition.
Our business and operations are experiencing rapid growth.growing rapidly. If we fail to effectively manage our growth, our business and operating results could be harmed.harmed.
We have experienced, and may continue to experience, rapid growth in our operations, whichoperations. This has placed, and may continue to place, significant demands on our management, operational and financial infrastructure. If we do not effectively manage our growth effectively, the quality of our products and services could suffer, which could negatively affect our operating results. To effectively manage thisour growth, we will need tomust continue to improve our operational, financial and management controls and our reporting systems and procedures. These systems enhancements and improvements may require significant capital expenditures and management resources. Failure to implement these improvements could hurt our ability to manage our growth and our financial position.
| - 5 - |
If the Chinese government were to change its presently favorable policy toward the agriculture industry, we would no longer enjoy our present tax-related privileges, which would materially and adversely impact our sales performance, margins, and net profit and our costs structure.
As producers active in the agriculture industry, our subsidiaries are presently exempt from income tax and enjoy various incentive grants and subsidies given by the China Government.Chinese government. If the Chinese government were to change its presently favorable policy toward the agriculture industry, we would no longer enjoy our present tax-related privileges, which would materially and adversely impact our sales performance, margins, and net profit and our costs structure. We have experienced, and may continue to experience, quick changes of policies by the Chinese government. If we do not effectively and efficiently manage our growth on time due to lack of capital, we could suffer adversely from the consequences of any such policy changes.
Our intellectual property rights are valuable, and any inability to adequately protect, or uncertainty regarding validity, enforceability or scope of them could undermine our competitive position and reduce the value of our products, services and brand, and litigation to protect our intellectual property rights may be costly.
We attempt to strengthen and differentiate our product portfolio by developing new and innovative products and product improvements. As a result, our patents, trademarks, trade secrets, copyrights and other intellectual property rights are important assets to us. Various events outside of our control pose a threat to our intellectual property rights as well as to our products and services. For example, effective intellectual property protection may not be available in China and other countries in which our products are sold. Also, although we have registered our trademark in China, theour efforts we have taken to protect our proprietary rights may not be sufficient or effective. Any significant impairment of our intellectual property rights could harm our business or our ability to compete and adversely affecthurt our results of operation. Also, protecting our intellectual property rights is costly and time consuming. Policing the unauthorized use of our proprietary technology can be difficult and expensive. Litigation might be necessary to protect our intellectual property rights. But due to the relative unpredictability of the Chinese legal system and potential difficulties of enforcingto enforce a court’s judgment in China, there is no guarantee that litigation would result in an outcomea favorable to us.outcome. Furthermore, any such litigation may be costly and may divert our management’s attention away from our core business. An adverse determination in any lawsuit involving our intellectual property is likely to jeopardize our business prospects and reputation. Although currently we are not aware of any of such litigation, we have no insurance coverage against the litigation costs so we would be forced to bear all litigation costs if we cannot recover them from other parties in the future.parties. All of the foregoing factors could harm our business, financial condition, and results of operations. Any increase in the unauthorized use of our intellectual property in the future could make it more expensive for us to do business and harm our operating results.
We may be exposed to infringement or misappropriation claims by third parties, which, if determined adversely against us, could adversely affect our business and subject us to significant liability to third parties.
Our success mainly depends on our ability to use and develop our technology and product designs without infringing upon the intellectual property rights of third parties. We may be subject to litigation involving claims of patent infringement or violations of other intellectual property rights of third parties. The holdersHolders of patents and other intellectual property rights potentially relevant to our product offerings may be unknown to us, which may make it difficult for us to acquire a license on commercially acceptable terms. There may also be technologies licensed to us and that we rely upon that are subject to infringement or other corresponding allegations or claims by third parties which may damage our ability to rely on such technologies. In addition, although we endeavor to ensure that companies that work with us possess appropriate intellectual property rights or licenses, we cannot fully avoid the risks of intellectual property rights infringement created by suppliers of components used in our products or by companies we work with in cooperative research and development activities. Our current or potential competitors may have obtained or may obtain patents that will prevent, limit or interfere with our ability to make, use or sell our products. The defense of intellectual property claims, including patent infringement suits, and related legal and administrative proceedings can be both costly and time consuming, and may significantly divert the efforts and resources of our technical personnel and management. These factors could effectively prevent us from pursuing some or all of our business operations and result in our customers or potential customers deferring, canceling or limiting their purchase or use of our products, which may have a material adverse effect on our business, financial condition and results of operations.
We rely on highly skilled personnel and the continuing efforts of our executive officers and, if we are unable to retain, motivate or hire qualified personnel, our business may be severely disrupted.
Our performance largely depends on the talents, knowledge, skills, and know-how and efforts of highly skilled individuals and in particular, the expertise held by our chief executive officer, Solomon Lee. His absence, were it to occur, could impact the development and implementation of theour projects and businesses. Our future success depends on our continuing ability to identify, hire, develop, motivate and retain highly skilled personnel for all areas of our organization. Our continued ability to compete effectively depends on our ability to attract new technology developers and to retain and motivate our existing contractors. If one or more of our executive officers are unable or unwilling to continue in their present positions, we may not be able to replace them readily, if at all. Therefore, our business may be severely disrupted, and we may incur additional expenses to recruit and retain new officers. In addition, if any of our executives joins a competitor or forms a competing company, we may lose some of our customers.
| - 6 - |
Our financial and operating performance may be adversely affected by epidemics, adverse weather conditions, natural disasters and other catastrophes.
Our financial and operating performance may be affected adversely affected by epidemics, adversebad weather conditions, natural disasters and other catastrophes. For example, in early 2003, several economies in Asia, including China, were affected by the outbreak of severe acute respiratory syndrome, or SARS. During May and June ofIn May-June 2003, many businesses in China were closed by the PRC government, to prevent transmission of SARS. Our business could be materially and adversely affected by the effects of H1N1 flu (swine flu), avian flu, severe acute respiratory syndromeSARS, or other epidemics or outbreaks. In April 2009, an outbreak of H1N1 flu first occurred in Mexico and quickly spread to other countries, including the U.S. and China. In the last decade, China has suffered health epidemics related to the outbreak of avian influenza and severe acute respiratory syndrome.such outbreaks. Any prolonged occurrence or recurrence of H1N1 flu (swine flu), avian flu, SARS or other adverse public health developments in China may have a material adverse effect on our business and operations. These health epidemics could result in severe travel restrictions and closures that would restrict our ability to ship our products. Potential outbreaks could also lead to temporary closure of our manufacturing facilities, our suppliers’ facilities and/or our end-user customers’ facilities, leading to reduced production, delayed or cancelled orders, and decrease in demand for our products. Any future health epidemic or outbreaks that could disrupt our operations and/or restrict our shipping abilities may have a material adverse effect on our business and results of operations.
Insofar as weWe do not expect to encounter any epidemicepidemics in our aquaculture fishery farms in districts of the Guangdong Province or cattle farms in Huangyuan District of the Qinghai Province, howeverProvince. However in the event of epidemics, we expect that our marine animals and our cattle will be quarantined until such time as a sanitary certificate for clean bill of health will beis obtained, before any of our products will be sold. Alternatively, inIn an extreme situation where our products would fail to obtain the sanitary certificate, they will be destroyed subject to the direction of the Inspection Authorities of the Agriculture Department of China. There is compensation granted by the Chinese Governmentgovernment for the destruction of our products but only for a fraction of our cost of production; as such the Company will bear virtually all losses under such circumstances.
Furthermore, the 2008 Sichuan earthquake also had a negative impact on many businesses in thethat region. Losses caused by epidemics, adverse weather conditions, natural disasters and other catastrophes, including SARS, avian flu, swine flu, earthquakes or typhoons, will adversely affect our operations.
If we make any acquisitions, they may disrupt or have a negative impact on our business.
Although we have no present plans for any specific acquisitions, in the event that we make acquisitions, we could have difficulty integrating the acquired companies’ personnel and operations with our own. In addition, the key personnel of the acquired business may not be willing to work for us. We cannot predict the effect expansion may have on our core business. Regardless of whether we are successful in making an acquisition, the negotiations could disrupt our ongoing business, distract our management and employees and increase our expenses. In addition to the risks described above, acquisitions are accompanied by a number of inherent risks, including, without limitation, the following:
| · | difficulty of integrating acquired products, services or operations; | |
| · | potential disruption of the ongoing businesses and distraction of our management and the management of acquired companies; | |
| · | difficulty of incorporating acquired rights or products into our existing business; | |
| · | difficulties in disposing of the excess or idle facilities of an acquired company or business and expenses in maintaining such facilities; | |
| · | difficulties in maintaining uniform standards, controls, procedures and policies; | |
| · | potential impairment of relationships with employees and customers as a result of any integration of new management personnel; | |
| · | potential inability or failure to achieve additional sales and enhance our customer base through cross-marketing of the products to new and existing customers; | |
| · | effect of any government regulations which relate to the business acquired; | |
| · | potential unknown liabilities associated with acquired businesses or product lines, or the need to spend significant amounts to retool, reposition or modify the marketing and sales of acquired products or the defense of any litigation, whether or not successful, resulting from actions of the acquired company prior to our acquisition. |
Our business could be severely impaired if and to the extent that we are unable to succeed in addressing any of these risks or other problems encountered in connection with these acquisitions, many of which cannot be presently identified, these risks and problems could disrupt our ongoing business, distract our management and employees, increase our expenses and adversely affect our results of operations.
We face significant competition, including changes in pricing.
The markets for our products are both competitive and price sensitive. Many of our competitors have significant financial, operations, sales and marketing resources, andplus experience in research and development, and compete with us by offering lower prices. Competitors could develop new technologies that compete with our products on achievingto achieve a lower unit price. If a competitor develops lower cost superior technology or cost-effective alternatives to our products and services, our business could be seriously harmed as they may achieve a lower price for the same quality.harmed.
The markets for some of our products are also subject to specific competitive risks because these markets are highly price competitive. Our competitors have competed in the past by lowering prices on certain products. If they do so again, we may be forced to respond by lowering our prices. This would reduce sales revenues and increase losses. Failure to anticipate and respond to price competition may also impact sales and aggravate losses.
| - 7 - |
Many of our competitors are larger and have greater financial and other resources than we do.
Our products compete and will compete with similar if not identical products produced by our competitors. These competitive products could be marketed by well-established, successful companies that possess greater financial, marketing, distributional,distribution personnel, and other resources than we possess.do. Using thesesaid resources, these companies can implement extensive advertising and promotional campaigns, both generally and in response to specific marketing efforts by competitors, and enter intocompetitors. They can introduce new products to new markets more rapidly to introduce new products.rapidly. In certain instances, competitors with greater financial resources also may be able to enter a market in direct competition with us, offering attractive marketing tools to encourage the sale of products that compete with our products or present cost features that consumers may find attractive.
Risks Related to our Industry
Our agricultural assets are situated in three provinces in China and crop disease, severe weather, natural disasters and other conditions affecting the environment, including the effects of climate change, could result in substantial losses and weaken our financial conditioncondition..
Our agricultural operations are situated in Qinghai Province, Hunan and Guangdong Province. Qinghai Province in particular is subject to occasional periods of drought. Crops require water in different quantities at different times during the growth cycle. The limited water resource at any given point can adversely impact production. In Qinghai our cropping and pasture land presently comprises over 5,000 acres, an area too big and too costly to afford drip irrigation systems for our crops. In Hunan, the district of Linli where we have over 300 acres of crop and pasture land may from time to time be subject to flooding that could affect our agriculture production. In Enping, Guangdong, our HU Plants are very susceptible to dry and wet seasonal variation that could also affect our agriculture production.
Crop disease, severe weather conditions, such as floods, droughts, windstorms and hurricanes, and natural disasters, may adversely affect our supply of one or more products, reduce our sales volumes, increase our unit production costs or prevent or impair our ability to ship products as planned. Since a significant portion of our costs are fixed and contracted in advance of each operating year, volume declines due to production interruptions or other factors could result in increases in unit production costs, which could result in substantial losses and weaken our financial condition. We may experience crop disease, insect infestation, severe weather and other adverse environmental conditions from time to time.
Severe weather conditions may occur with higher frequency or may be less predictable in the future due to the effects of climate change.
An occurrence of such an event might result in material disruptions to our operations, to the operations of our customers or suppliers, resulting in a decline in the agriculture industry. There can be no assurance that our facilities or products will not be affected by any such occurrence in the future, which occurrence may lead to adverse conditions to our operations and financial results.
Prices of agricultural products are subject to supply and demand, a market condition of which is not predictablepredictable..
Because our agricultural products are commodities, we are not able to predict with certainty what price we will receive for our products. Additionally, the growth cycle of such products in many instances dictates when such products must be marketed to achieve the maximum profitability. Excessive supplies tend to cause severe price competition and lower prices throughout the industry affected. Conversely, shortages may drive the prices higher. Shortages often result from adverse growing conditions which can reduce the availability of the agricultural products affected. Since multiple variables can affect supply and demand, we cannot accurately predict or control from year to year what prices, either favorable or unfavorable, it will receive from the market.
In addition, general public perceptions regarding the quality, safety or health risks associated with particular food products could reduce demand and prices for some of our products. To the extent that consumer preferences evolve away from products that we produce for health or other reasons, and we are unable to modify our products or to develop products that satisfy new consumer preferences, there will be a decreased demand for our products. However, even if market prices are unfavorable, some of our agricultural products which are ready to be, or have been, harvested must be brought to market promptly. A decrease in the selling price received for our products due to the factors described above could have a material adverse effect on our business, results of operations and financial condition.
We could realize losses and suffer liquidity problems due to declines in sales prices for our agriculture productsproducts..
Sales prices for agricultural products are difficult to predict. It is possible that sales prices for our products will decline in the future, and sales prices for other agricultural products may also decline. In recent years, there has been increasing consolidation among food retailers, wholesalers and distributors. A significant portion of our costs is fixed, so that fluctuations in the sales prices have an immediate impact on our profitability. Our profitability is also affected by our production costs, which may increase due to factors beyond our control.
| - 8 - |
We are subject to the risk of product contamination and product liability claimsclaims..
The sales of our products may involve the risk of injury to consumers. Such injuries may result from tampering by unauthorized personnel, product contamination or spoilage, including the presence of foreign objects, substances, chemicals, or residues introduced during the growing, packing, storage, handling or transportation phases. While we are subject to governmental inspection and regulations and believe our facilities comply in all material respects with all applicable laws and regulations, including internal product safety policies, we cannot be sure that consumption of our products will not cause a health-related illness in the future or that we will not be subject to claims or lawsuits relating to such matters. Even if a product liability claim is unsuccessful, the negative publicity surrounding any assertion that our products caused illness or injury could adversely affect our reputation with existing and potential customers and our brand image. We do not maintain product liability insurance.
We may not be successful in the implementation of our new technologies and new products, and our new products may not be not widely acceptedaccepted..
Our new technologies such as our drip irrigation system for precision agriculture or the introduction, testing and promotion of new agricultural varieties, must be able to adapt to local conditions. The term “drip irrigation” refers to a system whereby the exact amount of water is supplied to the plants’ roots at the correct moment. On the one hand, there exists the failure risk due to not being suitable for the local environment and market conditions; on the other hand, there are risks of loss of competitive advantages due to the rising of producing similar products enterprises and other enterprises that follow to produce the similar products.
We are a holding company whose subsidiaries are given certain degree of independency and our failure to integrate our subsidiaries may adversely affect our financial condition.condition.
According to the specific characteristics of agricultural production in China, we have given our subsidiary companies and their farms a certain degree of independency in decision-making. On one hand, this independency increases the sense of ownership at all levels, on the other hand it has also increased the difficulty of the integration of operation and management, which has resulted in increased difficulty of management integration. In the event we are not able to successfully manage our subsidiaries this will result in operating difficulties and have a negative impact on our business.
One or more of our distributors could engage in activities that are harmful toharm our brand and to our business.
Our products are sold primarily through distributors, and those distributorswho are responsible for ensuring that our products have the appropriate licenses to be sold to farmers in their provinces, and be keptare stored at the rightcorrect temperature to be freshensure freshness and meet shelf life terms. If those distributors do not obtain the appropriate licenses, their sales of our products in those provinces may be illegal, and we may be subject to government sanctions, including confiscation of illegal revenues and a fine of between two and three times the amount of such illegal revenues. Unlicensed sales in a province may also cause a delay for our other distributors in receiving a license from the authorities for their provinces, which could further adversely impact our sales. In addition, distributors may sell our products under another brand licensed in a particular province if our product is not licensed there. If our products are sold under another brand, the purchasers will not be aware of our brand name, and we will be unable to cross-market other seed varieties or other products as effectively to these purchasers. Moreover, our ability to provide appropriate customer service to these purchasers will be negatively affected, and we may be unable to develop our local knowledge of the needs of these purchasers and their environment. Furthermore, if any of our distributors sell inferior seeds produced by other companies under our brand name, our brand and reputation could be harmed, which could make marketing of our branded seeds more difficult. As of the date of this prospectus,Annual Report, we are not aware of the occurrence of any of the potential violations by our distributors described above.
The PRC agricultural market is highly competitive and our growth and results of operations may be adversely affected if we are unable to compete effectively.
The agricultural market in China is highly fragmented, largely regional and highly competitive, and we expect competition to increase and intensify within the sector. We face significant competition in our lines of business. Many of our competitors have greater financial, research and development and other resources than we have. Competition may also develop from consolidation within our industry in China or the privatization of producers that are currently operated by local governments in China. Our competitors may be better positioned to take advantage of industry consolidation and acquisition opportunities than we are. The reform and restructuring of state-owned equity in enterprises involved primarily in producing sectors will likely lead to the reallocation of market share in the agriculture industry, and our competitors may increase their market share by participating in the restructuring of state-owned agriculture companies. Such privatization would likely result in increased numbers of market participants with more efficient and commercially viable business models. As competition intensifies, our margins may be compressed by more competitive pricing and we may lose our market share and experience a reduction in our revenues and profit.
We may not possess all of the licenses required to operate our business, or we may fail to maintain the licenses we currently hold. This could subject us to fines and other penalties, which could materially adversely affect our results of operations.operations.
We are required to hold a variety of permits and licenses to conduct business in China. We may not possess all of the permits and licenses required for each of our business segments. In addition, the approvals, permits or licenses required by governmental agencies may change without substantial advance notice, and we could fail to obtain the approvals, permits or licenses required to expand our business. If we fail to obtain or to maintain such permits or licenses, or if renewals are granted with onerous conditions, we could be subject to fines and other penalties and be limited in the number or the quality of the products that we could offer. As a result, our business, results of operations and financial condition could be materially and adversely affected.
| - 9 - |
Risks Related to Doing Business in China
Under PRC law, we are required to obtain and retain permits and business licenses, and our failure to do so would adversely impact our ability to conduct business in China.
We hold various permits, business licenses, and approvals authorizing our operations and activities, which are subject to periodic review and reassessment by the Chinese authorities. Standards of compliance necessary to pass such reviews change from time to time and differ from jurisdiction to jurisdiction, leading to a degree of uncertainty. If renewals, or new permits, business licenses or approvals required in connection with existing or new facilities or activities, are not granted or are delayed, or if existing permits, business licenses or approvals are revoked or substantially modified, we may not be able to continue to operate our facilities which would have a material adverse effect on our operations. If new standards are applied to renewals or new applications, it could prove costly for us to meet these new standards.
The PRC economic cycle may negatively impact our operating results.
We believe that the rapid growth of the PRC economy before 2008 generally led to higher levels of inflation. We believe that the PRC economy has more recently experienced a decrease in its growth rate. We believe that a number of factors have contributed to this deceleration, including appreciation of the RMB, the currency of China, which has adversely affected China’s exports. In addition, we believe the deceleration has been exacerbated by the recent global crisis in the financial services and credit markets, which has resulted in significant volatility and dislocation in the global capital markets. It is uncertain how long the global crisis in the financial services and credit markets will continue and the significance of the adverse impact it may have on the global economy in general or the Chinese economy in particular. Slowing economic growth in China could result in weakening growth and demand for our products, which could reduce our revenues and income. In the event of a recovery in the PRC, renewed high growth levels may again lead to inflation. The government’s attempts to control inflation may adversely affect the business climate and growth of private enterprise. In addition, our profitability may be adversely affected if prices for our products rise at a rate that is insufficient to compensate for the rise in inflation.
Currency fluctuations and restrictions on currency exchange may adversely affect our business, including limiting our ability to convert Chinese Renminbi or RMB,(RMB) into foreign currencies and, if the RMB were to decline in value, reducing our revenue in U.S. dollar termsterms..
The exchange rate of the RMB is currently managed by the Chinese government. On July 21, 2005, the People'sPeople’s Bank of China, or the People's Bank, with the authorization of the State Council of the PRC, announced that the RMB exchange rate would no longer be pegged to the U.S. Dollar and would float based on market supply and demand with reference to a basket of currencies. According to public reports, the governor of the People'sPeople’s Bank has stated that the basket is composed mainly of the U.S. Dollar, the European Union Euro, the Japanese Yen and the South Korean Won. Also considered, but playing smaller roles, are the currencies of Singapore, the United Kingdom, Malaysia, Russia, Australia, Canada and Thailand. The weight of each currency within the basket has not been announced.
The initial adjustment of the RMB exchange rate was an approximate 2% revaluation from an exchange rate of 8.28 RMB per U.S. Dollar to 8.11 RMB per U.S. Dollar. The People'sPeople’s Bank also announced that the daily trading price of the U.S. Dollar against the RMB in the inter-bank foreign exchange market would be allowed to float within a band of 0.3% around the central parity published by the People'sPeople’s Bank, while the trading prices of the non-U.S. Dollar currencies against the RMB would be allowed to move within a certain band announced by the People'sPeople’s Bank. The People'sPeople’s Bank has stated that it will make adjustments of the RMB exchange rate band when necessary according to market developments as well as the economic and financial situation. In a later announcement published on May 18, 2007, the band was extended to 0.5%. Since July 2008, the RMB has traded at 6.83 RMB per U.S. Dollar. Recent reports indicate an upward revaluation in the value of the RMB against the U.S. Dollar may be allowed. The People'sPeople’s Bank announced on June 19, 2010 its intention to allow the RMB to move more freely against the basket of currencies, which increases the possibility of sharp fluctuations in the value of the RMB in the near future and thus the unpredictability associated with the RMB exchange rate.
Despite this change in its exchange rate regime, the Chinese government continues to manage the valuation of the RMB. The value of our common stock will be indirectly affected by the foreign exchange rate between the U.S. dollar and the RMB. Appreciation or depreciation in the value of the RMB relative to the U.S. dollar would affect our financial results reported in U.S. dollar terms without giving effect to any underlying change in our business or results of operations. Fluctuations in the exchange rate will also affect the relative value of any dividend we issue that will be exchanged into U.S. dollars, as well as earnings from, and the value of, any U.S. dollar-denominated investments we make in the future.
The income statements of our operations are translated into U.S. dollars at the average exchange rates in each applicable period. To the extent the U.S. dollar strengthens against foreign currencies, the translation of these foreign currencies denominated transactions results in reduced revenue, operating expenses and net income for our international operations. Similarly, to the extent the U.S. dollar weakens against foreign currencies, the translation of these foreign currency denominated transactions results in increased revenue, operating expenses and net income for our international operations. We are also exposed to foreign exchange rate fluctuations as we convert the financial statements of our foreign subsidiaries into U.S. dollars in consolidation. If there is a change in foreign currency exchange rates, the conversion of the foreign subsidiaries’ financial statements into U.S. dollars will lead to a translation gain or loss, which is recorded as a component of other comprehensive income. In addition, we have certain assets and liabilities that are denominated in currencies other than the relevant entity’s functional currency. Changes in the functional currency value of these assets and liabilities create fluctuations that will lead to a transaction gain or loss.
| - 10 - |
Very limited hedging transactions are available in China to reduce our exposure to exchange rate fluctuations. To date, we have not entered into any hedging transactions. While we may enter into hedging transactions in the future, the availability and effectiveness of these transactions may be limited, and we may not be able to successfully hedge our exposure at all.exposure. In addition, our foreign currency exchange losses may be magnified by PRC exchange control regulations that restrict our ability to convert RMB into foreign currencies.
Uncertainties with respect to the PRC legal system could adversely affect us and we may have limited legal recourse under PRC law if disputes arise under our contracts with third parties.parties.
Since 1979, we believe PRC legislation and regulations have significantly enhanced the protections afforded to various forms of foreign investments in China. However, China has not developed a fully integrated legal system and recently enacted laws and regulations may not sufficiently cover all aspects of economic activities in China. In particular, because these laws and regulations are relatively new, the interpretation and enforcement of these laws and regulations involve uncertainties. In addition, the PRC legal system is based in part on government policies and internal rules (some of which are not published on a timely basis or at all) that may have a retroactive effect. As a result, sometimes we may not be aware of our violation of these policies and rules until sometime after violation.
The Chinese government has enacted some laws and regulations dealing with matters such as corporate organization and governance, foreign investment, commerce, taxation and trade. However, their experience in implementing, interpreting and enforcing these laws and regulations is limited, and our ability to enforce commercial claims or to resolve commercial disputes is unpredictable. The resolution of these matters may be subject to the exercise of considerable discretion by agencies of the Chinese government, and forces unrelated to the legal merits of a particular matter or dispute may influence their determination. Any rights we may have to specific performance, or to seek an injunction under PRC law, in either of these cases, are severely limited, and without a means of recourse by virtue of the Chinese legal system, we may be unable to prevent these situations from occurring. The occurrence of any such events could have a material adverse effect on our business, financial condition and results of operations.
Under the PRC EIT Law, we may be classified as a “resident enterprise” of the PRC. Such classification could result in tax consequences to us andthe Company or our non-PRC resident shareholders.
On March 16, 2007, the National People’s Congress approved and promulgated a new tax law, the PRC Enterprise Income Tax Law, or “EIT Law,” which took effect on January 1, 2008. Under the EIT Law, enterprises are classified as resident enterprises and non-resident enterprises. An enterprise established outside of China with “de facto management bodies” within China is considered a “resident enterprise,” meaning that it can be treated in a manner similar to a Chinese enterprise for enterprise income tax purposes. The implementing rules of the EIT Law define “de facto management bodies” as a managing body that in practice exercises “substantial and overall management and control over the production and operations, personnel, accounting, and properties” of the enterprise; however, it remains unclear whether the PRC tax authorities would deem our managing body as being located within China. Due to the short history of the EIT Law and lack of applicable legal precedents, the PRC tax authorities determine the PRC tax resident treatment of a foreign company on a case-by-case basis.
If the PRC tax authorities determine that we are a “resident enterprise” for PRC enterprise income tax purposes, a number of PRC tax consequences could follow. First, we could be subject to the enterprise income tax at a rate of 25 percent on our worldwide taxable income, as well as PRC enterprise income tax reporting obligations. Second, under the EIT Law and its implementing rules, dividends paid between “qualified resident enterprises” are exempt from enterprise income tax. As a result, if we are treated as a PRC “qualified resident enterprise,” all dividends paid from our Chinese subsidiaries to us would be exempt from PRC tax.
Finally, the new “resident enterprise” classification could result in a situation in which a 10% PRC tax is imposed on dividends we pay to our non-PRC stockholders that are not PRC tax “resident enterprises” and gains derived by hem from transferring our common stock, if such income is considered PRC-sourced income by the relevant PRC authorities. In such event, we may be required to withhold a 10% PRC tax on any dividends paid to non-PRC resident stockholders. Our non-PRC resident stockholders also may be responsible for paying PRC tax at a rate of 10% on any gain realized from the sale or transfer of our common stock in certain circumstances. We would not, however, have an obligation to withhold PRC tax with respect to such gain.
Moreover, the State Administration of Taxation (“SAT”)(SAT) released Circular Guoshuihan No. 698 (“Circular 698”) on December 15, 2009 that reinforces the taxation of non-listed equity transfers by non-resident enterprises through overseas holding vehicles. Circular 698 addresses indirect share transfers as well as other issues. Circular 698 is retroactively effective from January 1, 2008. According to Circular 698, where a foreigner (non-PRC resident) who indirectly holds shares in a PRC resident enterprise through a non-PRC offshore holding company indirectly transfers equity interests in a PRC resident enterprise by selling the shares of the offshore holding company, and the latter is located in a country or jurisdiction where the effective tax burden is less than 12.5 percent or where the offshore income of his, her, or its residents is not taxable, the foreign investor is required to provide the PRC tax authority in charge of that PRC resident enterprise with certain relevant information within 30 days of the transfer. The tax authorities in charge will evaluate the offshore transaction for tax purposes. In the event that the tax authorities determine that such transfer is abusing forms of business organization and a reasonable commercial purpose for the offshore holding company other than the avoidance of PRC income tax liability is lacking, the PRC tax authorities will have the powerbe able to re-assess the nature of the equity transfer under the doctrine of substance over form. A reasonable commercial purpose may be established when the overall international (including U.S.) offshore structure is set up to comply with the requirements of supervising authorities of international (including U.S.) capital markets. If the SAT’s challenge of a transfer is successful, it may deny the existence of the offshore holding company that is used for tax planning purposes and subject the seller to PRC tax on the capital gain from such transfer. Since Circular 698 has a relatively short history, there is uncertainty as to its application. We (or a foreign investor) may become at risk of being taxed under Circular 698 and may be required to expend valuable resources to comply with Circular 698 or to establish that we (or such foreign investor) should not be taxed under Circular 698, which could have a material adverse effect on our financial condition and results of operations (or such foreign investor’s investment in us).
| - 11 - |
If any such PRC taxes apply, a non-PRC resident stockholder may be entitled to a reduced rate of PRC taxes under an applicable income tax treaty and/or a foreign tax credit against such stockholder’s domestic income tax liability (subject to applicable conditions and limitations). Prospective investors are encouraged to consult with their own tax advisors regarding the applicability of any such taxes, the effects of any applicable income tax treaties, and any available foreign tax credits.
Failure to comply with PRC regulations relating to the establishment of offshore special purpose companies by PRC residents may materially adversely affect us.
In October 2005, the PRC State Administration of Foreign Exchange, or SAFE, issued the Notice on Relevant Issues in the Foreign Exchange Control over Financing and Return Investment Through Special Purpose Companies by Residents inside China, generally referred to as Circular 75. The policy announced in this notice required PRC residents to register with the relevant SAFE branch before establishing or acquiring control over an offshore special purpose company, or SPV, for the purpose of engaging in an equity financing outside of China on the strength of domestic PRC assets originally held by those residents. Failure to comply with the requirements of Circular 75 and any of its internal implementing guidelines as applied by SAFE in accordance with Notice 106 may result in fines and other penalties under PRC laws for evasion of applicable foreign exchange restrictions. Any such failure could also result in the SPV’s affiliates being impeded or prevented from distributing their profits and the proceeds from any reduction in capital, share transfer or liquidation to the SPV, or from engaging in other transfers of funds into or out of China.
We have requested our shareholders who are PRC residents to make the necessary applications, filings and amendments as required under Circular 75 and other related rules. We attempt to comply, and attempt to ensure that our shareholders who are subject to these rules comply, with the relevant requirements. However, we cannot provide any assurances that our shareholders who are PRC residents will comply with our request to make any applicable registrations, and nor can we provide any assurances that our shareholders who are PRC residents will be able to obtain such applicable registration or comply with other requirements required by Circular 75 or other related rules or that, if challenged by government agencies, the structure of our organization fully complies with all applicable registrations or approvals required by Circular 75. Moreover, because of uncertainty over how Circular 75 will be interpreted and implemented, and how or whether SAFE will apply it to us, we cannot predict how it will affect our business operations or future strategies. A failureFailure by such PRC resident shareholders or future PRC resident shareholders to comply with Circular 75 or other related rules, if SAFE requires it, could subject these PRC resident shareholders to fines or legal sanctions, restrict our overseas or cross-border investment activities, limit our subsidiaries’ ability to make distributions or pay dividends, or affect our ownership structure, which could adversely affect our business and prospects.
Adverse changes in political and economic policies of the Chinese government could have a material adverse effect on the overall economic growth of China, which could reduce the demand for our products and materially and adversely affect our competitive position.
Our business, financial condition, results of operations and prospects are affected significantly by economic, political and legal developments in China. The Chinese economy differs from the economies of most developed countries in many respects, including:
| · | the amount of government involvement; | |
| · | the level of development; | |
| · | the growth rate; | |
| · | the control of foreign exchange; and | |
| · | the allocation of resources. |
While the Chinese economy has grown significantly in the past 20 years, we believe the growth has been uneven, both geographically and among various sectors of the economy. The Chinese government has implemented various measures to encourage economic growth and guide the allocation of resources. We believe some of these measures benefit the overall Chinese economy, but may also have a negative effect on us. For example, our financial condition and results of operations may be adversely affected by government control over capital investments or changes in tax regulations that are applicable to us.
The Chinese economy has been transitioning from a planned economy to a more market-oriented economy. Although in recent years the Chinese government has implemented measures emphasizing the utilization of market forces for economic reform, the reduction of state ownership of productive assets and the establishment of sound corporate governance in business enterprises, a substantial portion of the productive assets in China is still owned by the Chinese government. The Chinese government also exercises significant control over Chinese economic growth through the allocation of resources, controlling payment of foreign currency-denominated obligations, setting monetary policy and providing preferential treatment to particular industries or companies.
| - 12 - |
Contract drafting, interpretation and enforcement in China involve significant uncertainty.
We have entered into numerous contracts governed by PRC law, many of which are material to our business. As compared with contracts in the United States, contracts governed by PRC law tend to contain less detail and to not be as comprehensive in defining contracting parties’ rights and obligations. As a result, contracts in China are more vulnerable to disputes and legal challenges. In addition, contract interpretation and enforcement in China is not as developed as in the United States, and the result of any contract dispute is subject to significant uncertainties. Therefore, we cannot assure you that we will not be subject to disputes under our material contracts, and if such disputes arise, we cannot assure you that we will prevail.
The application of PRC regulations relating to the overseas listing of PRC domestic companies is uncertain, and we may be subject to penalties for failing to request approval of the PRC authorities prior to listing our shares in the U.S.
On August 8, 2006, six PRC government agencies namely, the(the Ministry of Commerce (“MOFCOM”), the State Administration for Industry and Commerce (“SAIC”), the China Securities Regulatory Commission (“CSRC”), SAFE, the State-Owned Assets Supervision and Administration Commission, (“SASAC”), and the State Administration for Taxation (“SAT”), jointly issued the Regulations on Mergers and Acquisitions of Domestic Enterprises by Foreign Investors (the “New M&A Rules”), which became effective on September 8, 2006. The New M&A Rules purport, among other things, to require offshore “special purpose vehicles”, that are (1) formed for the purpose of overseas listing of the equity interests of PRC companies via acquisition and (2) are controlled directly or indirectly by PRC companies and/or PRC individuals, to obtain the approval of the CSRC prior to the listing and trading of their securities on overseas stock exchanges. On September 21, 2006, pursuant to the New M&A Rules and other PRC Laws, the CSRC published on its official website relevant guidance with respect to the listing and trading of PRC domestic enterprises’ securities on overseas stock exchanges (the “Related Clarifications”), including a list of application materials regarding the listing on overseas stock exchanges by special purpose vehicles. We were and are not required to obtain the approval of CSRC under the Newnew M&A Rules in connection with this transaction because we were and are not a special purpose vehicle formed or controlled by PRC individuals.
However, there are substantial uncertainties regarding the interpretation, application and enforcement of these rules, and CSRC has yet to promulgate any written provisions or formally to declare or state whether the overseas listing of a PRC-related company structured similar to ours is subject to the approval of CSRC. Any violation of these rules could result in fines and other penalties on our operations in China, restrictions or limitations on remitting dividends outside of China, and other forms of sanctions that may cause a material and adverse effect to our business, operations and financial conditions.
The New M&A Rules also established additional procedures and requirements that are expected to make merger and acquisition activities by foreign investors more time-consuming and complex, including requirements in some instances that the Ministry of Commerce be notified in advance of any change-of-control transaction in which a foreign investor takes control of a PRC domestic enterprise that owns well-known trademarks or China’s traditional brands. We may grow our business in part by acquiring other businesses. Complying with the requirements of the New M&A Rules in completing this type of transaction could be time-consuming, and any required approval processes, including CSRC approval, may delay or inhibit our ability to complete such transactions, which could affect our ability to expand our business or maintain our market share.
We may face regulatory uncertainties that could restrict our ability to issue equity compensation to our directors and employees and other parties who are PRC citizens or residents under PRC law. The grant of stock options under any incentive plan that we adopt in the future would require registration with SAFE.
On April 6, 2007, SAFE issued the “Operating Procedures for Administration of Domestic Individuals Participating in the Employee Stock Ownership Plan or Stock Option Plan of An Overseas Listed Company,” also known as “Circular 78”. It is not clear whether Circular 78 covers all forms of equity compensation plans or only those that provide for the grant of stock options. For any equity compensation plan which is so covered and is adopted by a non-PRC listed company after April 6, 2007, Circular 78 requires all participants who are PRC citizens to register with, and obtain the approval of, SAFE prior to their participation in any such plan. In addition, Circular 78 also requires PRC citizens to register with SAFE and make the necessary applications and filings if they participate in an overseas listed company’s covered equity compensation plan prior to April 6, 2007. As of the date of this filing, we have not adopted any incentive plans, but may do so in the future. Any such plan may grant equity compensation, including, but not limited to, stock options, to our PRC employees and/or directors. The grant of any equity compensation under such a plan to a PRC citizen, however, may under Circular 78 require the PRC citizen to register with and obtain approval of SAFE. We believe that the registration and approval requirements contemplated in Circular 78 will be burdensome and time consuming. If it is determined that our such a plan, or any equity compensation grant under such a plan, is subject to Circular 78, failure to comply with such provisions of Circular 78 may subject us and any recipients thereof to fines and legal sanctions and prevent us from being able to grant equity compensation to our PRC employees and/or directors. In that case, our ability to compensate our employees and directors through equity compensation would be hindered and/or prevented.
Capital outflow policies in the PRC may hamper our ability to remit income to the United States.
The PRC has adopted currency and capital transfer regulations. These regulations may require that we comply with complex regulations for the movement of capital and as a result we may not be able to remit all income earned and proceeds received in connection with our operations or from the sale of our operating subsidiary to the U.S. or to our stockholders.
| - 13 - |
Our operations and assets in the PRC are subject to significant political and economic uncertainties.
Government policies are subject to rapid change and the government of the PRC may adopt policies whichthat have the effect of hindering private economic activity and greater economic decentralization. There is no assurance that the government of China will not significantly alter its policies from time to time without notice in a manner with reduces or eliminates any benefits from its present policies of economic reform. In addition, a substantial portion of productive assets in China remains government-owned. For instance, all lands are state or rural collective economic organizations owned and leased to business entities or individuals through governmental grants of the land use rights. The grant process is typically based on government policies at the time of the grant, which could be lengthy and complex. This process may adversely affect our business. The government of China also exercises significant control over China’s economic growth through the allocation of resources, controlling payment of foreign currency and providing preferential treatment to particular industries or companies. Uncertainties may arise as a result of changing governmental policies and measures. In addition, changes in laws and regulations, or their interpretation, or the imposition of confiscatory taxation, restrictions on currency conversion, imports and sources of supply, devaluations of currency, the nationalization or other expropriation of private enterprises, as well as adverse changes in the political, economic or social conditions in China, could have a material adverse effect on our business, results of operations and financial condition.
Our use of the allocated land may be subject to challenges in the futurefuture..
All land use rights that we own are land use rights relating to allocated land. The local governmental authorities have granted such land use rights to us for free use or at a discounted levy rate given our contribution to the development of the local economy. However, pursuant to theCatalogue on Allocated Land issued by the Ministry of Land Resources of the PRC (the “Catalogue”), the land use rights for allocated land may only be granted to those specific projects which are in compliance with the Catalogue, subject to the approval of the competent governmental authorities. We, as a privately owned agricultural producer, may not be qualified to be granted such land use rights for allocated land according to the Catalogue. Consequently, our use of such land may be subject to challenge in the future, and the legal consequences could include the confiscation of such land by the governmental authorities or a demand that we pay a market price for purchasing the land use rights for such land and converting the allocated land use right to a granted land use right.
Because Chinese law governs almost all of our material agreements, we may not be able to enforce our legal rights within China or elsewhere, which could result in a significant loss of business, business opportunities, or capital.
Chinese law governs almost all of our material agreements. We cannot assure you that we will be able to enforce any of our material agreements or that remedies will be available outside of China. The system of laws and the enforcement of existing laws in China may not be as certain in implementation and interpretation as in the United States. Our inability to enforce or obtain a remedy under any of our current or future agreements could result in a significant loss of business, business opportunities or capital. It will be extremely difficult to acquire jurisdiction and enforce liabilities against our officers, directors and assets based in China.
Substantially all of our assets will be located in the PRC and all of our officers and our present directors reside outside of the United States. As a result, it may not be possible for United States investors to enforce their legal rights, to effect service of process upon our directors or officers or to enforce judgments of United States courts predicated upon civil liabilities and criminal penalties of our directors and officers under federal securities laws. Moreover, we have been advised that China does not have treaties providing for the reciprocal recognition and enforcement of judgments of courts with the United States. Further, it is unclear if extradition treaties now in effect between the United States and China would permit effective enforcement of criminal penalties of the federal securities laws.
We do not have insurance coverage.
We currently do not purchase property insurance for our properties, including raw materials, semi-manufactured goods, manufactured goods, buildings and machinery equipment, livestock, and we currently do not carry any product liability or other similar insurance, nor do we have business liability or business disruption insurance coverage for our operations in the PR. There is no insurance covering risks incurred through seasonal variation consequences. In this respect, we as an engineering based company have qualified personnel and staffs to manage and to limited the happenings of these relevant risk factors; however there is no guarantee that accidents will not happen, and if they happen, the consequences may have a material adverse effect on our business, financial condition and results of operations.
Because our cash and cash equivalent are held in banks whichthat do not provide capital guarantee insurance, the failure of any bank in which we deposit our funds could affect our ability to continue in business.
Banks and other financial institutions in the PRC do not provide insurance for funds held on deposit. A significant portion of our assets are in the form of cash deposited with banks in the PRC, and in the event of bank failure, we may not have access to, or may lose entirely, our funds on deposit. Depending upon the amount of cash we maintain in a bank that fails, our inability to have access to such cash deposits could impair our operations, and, if we are not able to access funds to pay our suppliers, employees and other creditors, we may be unable to continue in business.
| - 14 - |
Failure to comply with the United States Foreign Corrupt Practices Act could subject us to penalties and other adverse consequences.
We are subject to the United States Foreign Corrupt Practices Act, which generally prohibits United States companies from engaging in bribery or other prohibited payments to foreign officials for the purpose of obtaining or retaining business. Foreign companies, including some that may compete with us, are not subject to these prohibitions. Corruption, extortion, bribery, pay-offs, theft and other fraudulent practices occur from time to time in the PRC. We cannot assure you that our employees or other agents will not engage in such conduct for which we might be held responsible. If our employees or agents are found to have engaged in such practices, we could suffer severe penalties and other consequences that may have a material adverse effect on our business, financial condition and results of operations.
Labor laws in the PRC may adversely affect our results of operations.
On June 29, 2007, the PRC government promulgated a new labor law, namely, the Labor Contract Law of the PRC, or the New Labor Contract Law, which became effective on January 1, 2008. The New Labor Contract Law imposes greater liabilities on employers and significantly affects the cost of an employer’s decision to reduce its workforce. Further, it requires that certain terminations be based upon seniority and not merit. In the event we decide to significantly change or decrease our workforce, the New Labor Contract Law could adversely affect our ability to effect such changes in a manner that is most advantageous to our business or in a timely and cost-effective manner, thus materially and adversely affecting our financial condition and results of operations.
Your ability to bring an action against us or against our directors and officers, or to enforce a judgment against us or them, will be limited because we conduct substantially all of our operations in the PRC and because the majority of our directors and officers reside outside of the United States.
We are a Nevada holding company and substantially all of our assets are located outside of the United States. Substantially all current operations are conducted in the PRC. In addition, all but one of our directors and officers are nationals and residents of countries other than the United States. Substantial portions of the assets of these persons are located outside the United States. Thus, it may be difficult to effect service of process within the United States upon these persons. It may also be difficult to enforce in U.S. courts judgments on the civil liability provisions of the U.S. federal securities laws against us and our officers and directors, none of whom are residents in the United States and the substantial majority of whose assets are located outside of the United States. It is also uncertain whether the courts of the PRC would recognize or enforce judgments of U.S. courts. Our PRC Legal Counsel has advised us that the recognition and enforcement of foreign judgments are provided for under the PRC Civil Procedures Law. Courts in the PRC may recognize and enforce foreign judgments in accordance with the requirements of the PRC Civil Procedures Law based on treaties between the PRC and the country where the judgment is made or on reciprocity between jurisdictions. The PRC does not have any treaties or other arrangements that provide for the reciprocal recognition and enforcement of foreign judgments with the United States. In addition, according to the PRC Civil Procedures Law, courts in the PRC will not enforce a foreign judgment against us or our directors and officers if they decide that the judgment violates basic principles of PRC law or national sovereignty, security or the public interest. It is uncertain whether a PRC court would enforce a judgment rendered by a court in the United States.
Risks Related to Ownership of our Common Stock
Volatility in our common stock price may subject us to securities litigation.
Stock markets, in general, have experienced in recent months, and continue to experience, significant price and volume volatility, and the market price of our common stock may continue to be subject to similar market fluctuations unrelated to our operating performance or prospects. This increased volatility, coupled with depressed economic conditions, could continue to have a depressing effect on the market price of our common stock. The following factors, many of which are beyond our control, may influence our stock price:
| · | the status of our growth strategy including the building of our new production line with any proceeds we may be able to raise in the future; |
| · | announcements of technological or competitive developments; |
| · | regulatory developments in the PRC affecting us, our customers or our competitors; |
| · | announcements regarding patent or other intellectual property litigation or the issuance of patents to us or our competitors or updates with respect to the enforceability of patents or other intellectual property rights generally in the PRC or internationally; |
| · | actual or anticipated fluctuations in our quarterly operating results; |
| · | changes in financial estimates by securities research analysts; |
| · | changes in the economic performance or market valuations of our competitors; |
| · | additions or departures of our executive officers; |
| · | release or expiration of lock-up or other transfer restrictions on our outstanding common stock; and |
| · | sales or perceived sales of additional shares of our common stock. |
In addition, the securities markets have, from time to time, experienced significant price and volume fluctuations that are not related to the operating performance of particular companies. Any of these factors could result in large and sudden changes in the volume and trading price of our common stock and could cause our stockholders to incur substantial losses. In the past, following periods of volatility in the market price of a company’s securities, stockholders have often instituted securities class action litigation against that company. If we were involved in a class action suit or other securities litigation, it would divert the attention of our senior management, require us to incur significant expense and, whether or not adversely determined, have a material adverse effect on our business, financial condition, results of operations and prospects.
Your ability to bring an action against us or against our directors and officer, or to enforce a judgment against us or them, will be limited because we conduct substantially all of our operations in the PRC and because the majority of our directors and officers reside outside of the United States.
We are a Nevada holding company and substantially all of our assets are located outside of the United States. Substantially all of our current operations are conducted in the PRC. In addition, all of our directors and officers are nationals and residents of countries other than the United States. A substantial portion of the assets of these persons are located outside the United States. As a result, it may be difficult for you to effect service of process within the United States upon these persons. It may also be difficult for you to enforce in U.S. courts judgments on the civil liability provisions of the U.S. federal securities laws against us and our officers and directors, none of whom are residents in the United States and the substantial majority of whose assets are located outside of the United States. In addition, there is uncertainty as to whether the courts of the PRC would recognize or enforce judgments of U.S. courts. Our counsel as to PRC law has advised us that the recognition and enforcement of foreign judgments are provided for under thePRC Civil Procedures Law. Courts in the PRC may recognize and enforce foreign judgments in accordance with the requirements of thePRC Civil Procedures Law based on treaties between the PRC and the country where the judgment is made or on reciprocity between jurisdictions. The PRC does not have any treaties or other arrangements that provide for the reciprocal recognition and enforcement of foreign judgments with the United States. In addition, according to thePRC Civil Procedures Law, courts in the PRC will not enforce a foreign judgment against us or our directors and officers if they decide that the judgment violates basic principles of PRC law or national sovereignty, security or the public interest. So it is uncertain whether a PRC court would enforce a judgment rendered by a court in the United States.
We will be a “controlled company” within the meaning of the NASDAQ Marketplace rules and, as a result, will qualify for and will rely on certain exemptions from certain corporate governance requirements.
After the closing of this offering, our chief executive officer will continue to control a majority of the voting power of our outstanding common stock. As a result, we will be a “controlled company” pursuant to Rule 5615(c) of the corporate governance standards of the NASDAQ Stock Market LLC. Under such rules, a company of which more than 50% of the voting power for the election of directors is held by an individual, a group or another company is a “controlled company” and may elect not to comply with certain corporate governance requirements of the NASDAQ Stock Market LLC, including the requirements that:
| - 15 - |
This controlled company exemption does not extend to the audit committee requirements under Rule 5605(c) or the requirement for executive sessions of Independent Directors under Rule 5605(b)(2).
We intend to elect to be treated as a “controlled company” in the event that we should seek to list our shares on the Nasdaq Stock Market LLC. As a result, you may not have the same protections afforded to stockholders of companies that are mandatorily subject to all of the corporate governance requirements of the NASDAQ Stock Market LLC.
One of our directors and officers controls a majority of our common stock and his interests may not align with the interests of our other stockholders.
Solomon Lee, our chairman, chief executive officer and president, controls our company and will both before and after this offering beneficially ownowns in excess of 50.1% of our issued and outstanding common stock. This significant concentration of share ownership may adversely affect the trading price of our common stock because investors often perceive a disadvantage in owning shares in a company with one or several controlling stockholders. Furthermore, our directors and officers, as a group, have the ability to significantly influence or control the outcome of all matters requiring stockholder approval, including the election of directors and approval of significant corporate transactions, such as mergers, consolidations or the sale of substantially all of our assets. This concentration of ownership may have the effect of delaying or preventing a change in control of our company whichthat could deprive our stockholders of an opportunity to receive a premium for their shares as part of a sale of our company and might reduce the price of our common stock. In addition, without the consent of Mr. Lee, we could be prevented from entering into transactions that could be beneficial to us. Mr. Lee may cause us to take actions that are opposed by other stockholders as his interests may differ from those of other stockholders.
Future issuances of capital stock may depress the trading price of our common stock.
Any issuance of shares of our common stock (or common stock equivalents) after this offeringthe date hereof could dilute the interests of our existing stockholders and could substantially decrease the trading price of our common stock. We may issue additional shares of our common stock in the future for a number of reasons, including financing our operations and business strategy (including in connection with acquisitions, strategic collaborations or other transactions).
Sales of a substantial number of shares of our common stock in the public market could depress the market price of our common stock, and impair our ability to raise capital through the sale of additional equity securities. We cannot predict the effect that future sales of our common stock or other equity-related securities would have on the market price of our common stock.
We believe that the market price of our shares in the OTC BBQB markets is adversely affected by the current stigma associated with Chinese companies quoted or listed publicly in the United States.
We believe that the market price of our shares in the OTC BB markets is adversely affected by the current stigma associated with Chinese companies quoted or listed publicly in the United States.
Although we managed to maintain our liquidity to a certain degree, our market prices are suffering (e.g., our shares are presently trading at approximately 25% of our net tangible asset value per share).share price has suffered. Many Chinese companies are sufferingsuffer from this stigma, which tends to affect both market prices and liquidities,liquidity, and our company is no exception. There are reasons ofReasons with varying degrees of legitimacy explainingexplain this stigma, including but not limited to: (i) investors’ experience of losses suffered in the course of investing in other Chinese companies, (ii) the difficulty some Chinese companies have had in preparing auditable financial statements, and (iii) the difficultdifficulty in enforcing US judgments in foreign courts generally, allgenerally. All of whichthese have contributed to a negative perception in the minds ofby some US investors regarding all Chinese companies publicly traded on US markets. Regardless of the reasons for this perception, shouldif it continuecontinues over a sustained period of time our market prices may keep on tradingcontinue to trade below our net tangible asset value per share, whichshare. This would not only increase the risk that our shareholders could lose the funds they have invested in our company, but maycompany. It could also adversely affectimpact our ability to maintain our growth plan on a timely manner and thusschedule, which would adversely affect our business and financial condition as well.
If following the closing of the offering, shares of our common stock remains subject to the U.S. “Penny Stock” Rules, investors who purchase our common stock in the offering may have difficulty re-selling their shares of our common stock as the liquidity of the market for our shares may be adversely affected by the impact of the “Penny Stock” Rules.
Although we anticipate that at some point following this offering, shares of our common stock will trade on the NASDAQ Capital Market, in the event that shares of our common stock do not become listed on the NASDAQ Capital Market or if our shares are in the future delisted from the NASDAQ Capital Market, it may be more difficult for investors in the offering to sell the shares of our common stock. A “penny stock” is generally defined by regulations of the U.S. Securities and Exchange Commission (“SEC”) as an equity security with a market price of less than US$5.00 per share. However, an equity security with a market price under US$5.00 will not be considered a penny stock if it fits within any of the following exceptions:
Although we believe our common stock is not a penny stock based upon the exception (iii) above, we cannot provide any assurance that in the future our common stock will not be classified as Penny Stock.
If an investor buys or sells a penny stock, SEC regulations require that the investor receive, prior to the transaction, a disclosure explaining the penny stock market and associated risks. Furthermore, trading in our common stock is currently subject to Rule 15g-9 of the Exchange Act, which relates to non-NASDAQ and non-exchange listed securities. Under this rule, broker/dealers who recommend our securities to persons other than established customers and accredited investors must make a special written suitability determination for the purchaser and receive the purchaser's written agreement to a transaction prior to sale.
The low price of our common stock has a negative effect on the amount and percentage of transaction costs paid by individual shareholders. The low price of our common stock also limits our ability to raise additional capital by issuing additional shares. There are several reasons for these effects. First, the internal policies of certain institutional investors prohibit the purchase of low-priced stocks. Second, many brokerage houses do not permit low-priced stocks to be used as collateral for margin accounts or to be purchased on margin. Third, some brokerage house policies and practices tend to discourage individual brokers from dealing in low-priced stocks. Finally, broker's commissions on low-priced stocks usually represent a higher percentage of the stock price than commissions on higher priced stocks. As a result, our stockholders may pay transaction costs that are a higher percentage of their total share value than they would if our share price were substantially higher.
As an issuer of “penny stock” the protection provided by the federal securities laws relating to a forward-looking statement does not apply to us and as a result we could be subject to legal action.
Although federal securities laws provide a safe harbor for forward-looking statements made by a public company that files reports under the federal securities laws, this safe harbor is not available to issuers of penny stocks. As a result, if we are a penny stock, we will not have the benefit of this safe harbor protection in the event of any legal action based upon a claim that the material provided by us contained a material misstatement of fact or was misleading in any material respect because of our failure to include any statements necessary to make the statements not misleading. Such an action could hurt our financial condition.
The issuance of any of our equity securities pursuant any equity compensation plan we may adopt may dilute the value of existing stockholders and may affect the market price of our stock.
In the future, we may issue to our officers, directors, employees and/or other persons equity based compensation under any equity compensation plan we may adopt to provide motivation and compensation to our officers, employees and key independent consultants. The award of any such incentives could result in an immediate and potentially substantial dilution to our existing stockholders and could result in a decline in the value of our stock price. The exercise of these options and the sale of the underlying shares of common stock and the sale of stock issued pursuant to stock grants may have an adverse effect upon the price of our stock. In addition, if the holders of outstanding convertible securities convert such securities into common stock, you will suffer further dilution; at present, the only convertible securities issued and outstanding are the 7,000,000 shares of Series B Preferred Stock, which are convertible into common stock on a one-for-one9.9 for 1 basis.
The requirements of being a public company may strain our resources, divert management'smanagement’s attention and affect our ability to attract and retain qualified board membersmembers..
We are a public company and subject to the reporting requirements of the Securities Exchange Act of 1934, as amended, and the Sarbanes-Oxley Act of 2002. The Exchange Act requires, among other things, that we file annual, quarterly and current reports with respect to our business and financial condition. The Sarbanes-Oxley Act requires, among other things, that we maintain effective disclosure controls and procedures and internal controls for financial reporting. For example, Section 404 of the Sarbanes-Oxley Act requires that our management report on the effectiveness of our internal controls structure and procedures for financial reporting. Section 404 compliance may divert internal resources and will take a significant amount of time and effort to complete. If we fail to maintain compliance under Section 404, or if in the future management determines that our internal control over financial reporting are not effective as defined under Section 404, we could be subject to sanctions or investigations by the NASDAQ Stock Market should we in the future be listed on this market, the SEC, or other regulatory authorities. Furthermore, investor perceptions of our company may suffer, and this could cause a decline in the market price of our common stock. Any failure of our internal controls could have a material adverse effect on our stated results of operations and harm our reputation. If we are unable to implement these changes effectively or efficiently, it could harm our operations, financial reporting or financial results and could result in an adverse opinion on internal controls from our independent auditors. We may need to hire a number of additional employees with public accounting and disclosure experience in order to meet our ongoing obligations as a public company, particularly if we become fully subject to Section 404 and its auditor attestation requirements, which will increase costs. Our management team and other personnel will need to devote a substantial amount of time to new compliance initiatives and to meeting the obligations that are associated with being a public company, which may divert attention from other business concerns, which could have a material adverse effect on our business, financial condition and results of operations.
| - 16 - |
Our shares of common stock may be thinly traded, so you may be unable to sell at or near ask prices or at all.
We cannot predict the extent to which an active public market for our common stock will develop or be sustained. Our common stock is currently traded on the OTC Bulletin BoardQB where the shares have historically been thinly traded, meaning that the number of persons interested in purchasing our common stock at or near bid prices at any given time may be relatively small or non-existent.
This situation may be attributable to a number of factors, including the fact that we are a small company that is relatively unknown to stock analysts, stock brokers, institutional investors and others in the investment community who generate or influence sales volume, and that even if we came to the attention of such persons, they tend to be risk averse and would be reluctant to follow an unproven company such as ours or purchase or recommend the purchase of our shares until such time as we have become more seasoned and viable. As a consequence, there may be periods of several days, weeks or months when trading activity in our shares is minimal or non-existent, as compared to a seasoned issuer which has a large and steady volume of trading activity that will generally support continuous sales without an adverse effect on share price. We cannot assure you that a broader or more active public trading market for our common stock will develop or be sustained, or that current trading levels will be sustained or not diminish.
We may become involved in securities class action litigation that could divert management’s attention and harm our business.
The stock market in general, and the shares of early stage companies in particular, have experienced extreme price and volume fluctuations. These fluctuations have often been unrelated or disproportionate to the operating performance of the companies involved. If these fluctuations occur in the future, the market price of our shares could fall regardless of our operating performance. In the past, following periods of volatility in the market price of a particular company’s securities, securities class action litigation has often been brought against that company. If the market price or volume of our shares suffers extreme fluctuations, then we may become involved in this type of litigation, which would be expensive and divert management’s attention and resources from managing our business.
As a public company, we may also from time to time make forward-looking statements about future operating results and provide some financial guidance to the public markets. TheOur management has limited experience as a management team in a public company and as a result projections may not be made timely or set at expected performance levels and could materially affect the price of our shares. Any failure to meet published forward-looking statements that adversely affect the stock price could result in losses to investors, stockholder lawsuits or other litigation, sanctions or restrictions issued by the SEC.
Securities analysts may elect not to report on our common stock or may issue negative reports that adversely affect the stock price.
At this time, to our knowledge no securities analysts provide research coverage of our common stock, and securities analysts may not elect not to provide such coverage in the future. It may remain difficult for our company, with its small market capitalization, to attract independent financial analysts that will cover our common stock. If securities analysts do not cover our common stock, the lack of research coverage may adversely affect the stock’s actual and potential market price. The trading market for our common stock may be affected in part by the research and reports that industry or financial analysts publish about our business. If one or more analysts elect to cover our company and then downgrade the stock, the stock price would likely decline rapidly. If one or more of these analysts cease coverage of our company, we could lose visibility in the market, which, in turn, could cause our stock price to decline. This could have a negative effect on the market price of our common stock.
Risks RelatedRelating to this Offering:the Note
New investorsThe note is unsecured and contains no financial covenants.
The note is not secured by our assets and will rank equal in right of payment with our existing and future unsecured indebtedness. Other than pursuant to the grant of a right of first refusal to the noteholder, the note does not restrict our ability to incur additional debt, including secured debt. The note will be effectively subordinated to any of our existing or future secured indebtedness to the extent of the assets securing such indebtedness. As of September 30, 2014, we and our subsidiaries had $9,115,583 in outstanding indebtedness as well as $27,655,631 in other current liabilities and an additional $2,616,610 in non-current liabilities. In addition, the note offered under this prospectus does not contain any financial covenants, restrict our ability to repurchase our securities, pay dividends or contain covenants or other provisions to afford holders protection in the event of a transaction that substantially increases our level of indebtedness. We could engage in certain types of transactions, such as acquisitions, that could substantially affect our capital structure and the value of the note and our common stock will experience immediatebut would not constitute a fundamental change permitting holders to require us to repurchase their note under the indenture. The incurrence of additional indebtedness and, substantial dilution.in particular, the granting of a security interest to secure the indebtedness, could adversely affect our ability to pay our obligations on the note.
We depend upon dividends from our subsidiaries to meet our debt service obligations.
We are a holding company and conduct all of our operations through our subsidiaries. Our ability to meet our debt service obligations depends upon our receipt of dividends from our subsidiaries. Subject to the restrictions contained in the loan documents entered into with the Agricultural Development Bank of China and the Gan Guo Village Committee, future borrowings by us and our subsidiaries could contain restrictions or prohibitions on the payment of dividends by our subsidiaries to us. In addition, under applicable law, our subsidiaries could be limited in the amounts that they are permitted to pay us as dividends on their capital stock. Further, the note is effectively subordinated to the foregoing indebtedness.
| - 17 - |
Conversion of the note may affect the trading price of our common stock.
The conversion of all or some portion of the note and any sales in the public market of our common stock issued upon such conversion could adversely affect the market price of our common stock. In addition, the existence of the note may encourage short selling by market participants because the conversion of the note could depress our common stock price. In addition, the conversion price of the note could exert a negative impact on the upward price movement of our common stock.
The conversion rate of the note may not be adjusted for all dilutive events that may occur.
The public offeringconversion rate of the note is subject to adjustment for certain events including, but not limited to, the issuance of cash or stock dividends on our common stock, the issuance of certain rights or warrants, subdivisions or combinations of our common stock and certain distributions of assets, debt securities, capital stock or cash to holders of our common stock. The conversion rate will not be adjusted for other events, such as stock issuances for cash, which may adversely affect the trading price of the note.
If you hold a note, you will not be entitled to any rights with respect to our common stock, but you will be subject to all changes made with respect to our common stock.
If you hold a note, you will not be entitled to any rights with respect to our common stock (including, without limitation, voting rights and rights to receive any dividends or other distributions on our common stock), but you will be subject to all changes affecting the common stock. You will only be entitled to rights on the common stock if and when we deliver shares of common stock (if any) to you upon conversion of your note. For example, in the event that an amendment is proposed to our articles of incorporation requiring stockholder approval and the record date for determining the stockholders of record entitled to vote on the amendment occurs prior to delivery of the common stock, you may not be entitled to vote on the amendment, although you may nevertheless be subject to any changes in the powers, preferences or special rights of our common stock.
If an event of default occurs, the noteholder’s remedies are limited and the noteholder may not receive full payment of principal.
If an event of default occurs, the noteholder could accelerate the note and declare the principal and accrued but unpaid interest thereof payable immediately. However, we may not be able to satisfy any such demand. Consequently, the noteholder could lose all or a substantial amount of its investment if the note is accelerated.
Bankruptcy, conservatorship, receivership or insolvency of our company would result in delayed or reduced payments to the noteholder.
Bankruptcy, conservatorship, receivership or insolvency of our company would result in delayed or reduced payments to the noteholder; any such event would constitute an event of default under the note. If we were placed in bankruptcy, conservatorship, receivership or insolvency it would be highly unlikely that we could manage our business or perform our obligations under the note. Certain potential events of default are not within our control. As stated above, if an event of default occurs, the noteholder could accelerate the note and declare the principal and accrued but unpaid interest thereof payable immediately; however, if an event of default is declared and the note is accelerated under the circumstances described in this paragraph, it is likely that the noteholders would suffer a loss of all or a part of its investment in the note.
We cannot assure you that an active trading market will develop or be sustained for the note.
The note has not been registered under the Securities Act or any state securities laws. As a result, it may only be offered or sold if:
There is only one note the resale of which we are attempting to register through the filing of the registration statement of which this prospectus forms a part. There can be no assurance that the registration statement will ever be declared effective or that the note will ever be reissued in multiple denominations, permitting for the possibility of a trading market to develop. We do not presently intend to apply for listing of the note on any national securities exchange or for quotation through any other market. As a result, it is highly unlikely that an active or sustained trading market will develop for the note(s) in the foreseeable future or, if a market develops, that holders will be able to resell the note at a price they deem satisfactory. Future trading prices, if any, for the note will depend on many factors, including, among other things, prevailing interest rates, the market for similar securities, economic conditions, the price of our common stock is substantially higher thanand our net tangible book value per share of common stock. Investors purchasing shares of common stock in this offering will, therefore, incur immediate dilution in net tangible book value per share of common stock. See “Dilution.”financial condition, performance and prospects.
| - 18 - |
Because there is no minimum required for the offering to close, investors in this offering will not receive a refund in the event that we do not sell an amount of shares sufficient to pursue the business goals outlined in this prospectus .
We have not specified a minimum offering amount nor have or will we establish an escrow account in connection with this offering. Because there is no escrow account and no minimum offering amount, investors could be in a position where they have invested in our company, but we are unable to fulfill our objectives or proceed with our operations due to a lack of interest in this offering. If this were to occur, we may be forced to curtail or abandon our operations with a loss to investors who purchase stock under this prospectus. Further, because there is no escrow account in operation and no minimum investment amount, any proceeds from the sale of shares offered by us will be available for our immediate use, despite uncertainty about whether we would be able to use such funds to effectively implement our business plan. Investor funds will not be returned under any circumstances whether during or after the offering.
Our management might not use the proceeds of this offering effectively.
Our management has broad discretion over the use of proceeds of this offering. In addition, our management has not designated a specific use for a substantial portion of the proceeds of this offering. Accordingly, it is possible that our management may allocate the proceeds in ways that do not improve our operating results. In addition, cash proceeds received in the offering may be temporarily used to purchase short-term, low-risk investments, and such investments might not be invested to yield a favorable rate of return.
We are selling the shares of common stock offered in this prospectus without an underwriter and may not be able to sell any of the shares offered herein.
Our officers and directors are offering the shares of common stock being sold on our behalf. There is no broker-dealer retained as an underwriter and no broker-dealer is under any obligation to purchase any common shares. There are no firm commitments to purchase any of the shares in this offering. Consequently, there is no guarantee that we will be capable of selling all, or any, of the shares of common stock being offered hereby.
CAUTIONARY STATEMENT REGARDING FORWARD-LOOKING STATEMENTS
This prospectus contains forward-looking statements. All statements other than statements of historical facts contained in this prospectus, including statements regarding our future results of operations and financial position, business strategy and plans and objectives of management for future operations, are forward-looking statements. These statements involve known and unknown risks, uncertainties and other factors that may cause our actual results, performance or achievements to be materially different from any future results, performance or achievements expressed or implied by the forward-looking statements.
In some cases, you can identify forward-looking statements by terms such as “may,” “will,” “should,” “expects,” “plans,” “anticipates,” “could,” “intends,” “target,” “projects,” “contemplates,” “believes,” “estimates,” “predicts,” “potential” or “continue” or the negative of these terms or other similar words. These statements are only predictions. We have based these forward-looking statements largely on our current expectations and projections about future events and financial trends that we believe may affect our business, financial condition and results of operations. We discuss many of the risks in greater detail under the heading “Risk Factors.” Also, these forward-looking statements represent our estimates and assumptions only as of the date of this prospectus. Except as required by law, we assume no obligation to update any forward-looking statements after the date of this prospectus.
This prospectus also contains estimates and other statistical data made by independent parties and by us relating to market size and growth and other industry data. This data involves a number of assumptions and limitations, and you are cautioned not to give undue weight to such estimates. We have not independently verified the statistical and other industry data generated by independent parties and contained in this prospectus and, accordingly, we cannot guarantee their accuracy or completeness, though we do generally believe the data to be reliable. In addition, projections, assumptions and estimates of our future performance and the future performance of the industries in which we operate are necessarily subject to a high degree of uncertainty and risk due to a variety of factors, including those described in “Risk Factors” and elsewhere in this prospectus. These and other factors could cause results to differ materially from those expressed in the estimates made by the independent parties and by us.
There is no minimum number of shares that must be sold in the offering, weWe will retain thenot receive any proceeds from the sale of any of the offered shares, and funds will not be returned to investors. It is possible that no proceeds will be received bynote or the Company or that if any proceeds are received, that such proceeds will not be sufficient to cover the costs of the offering. The estimated net proceeds to the Company from the sale of the maximum number ofunderlying shares of common stock offered hereby are estimated to be approximately $26,080,000 after deducting estimated offering expenses. We intend to useby the net proceeds ofselling securityholder under this offering to finance our developments capital expenditures, summarized as follows:prospectus.
| 25% of the Maximum Offering | 50% of the Maximum Offering | 75% of the Maximum Offering | 100% of the Maximum Offering | |||||||||||||
| $ | $ | $ | $ | |||||||||||||
| Gross Proceeds | 6,562,500 | 13,125,000 | 19,687,500 | 26,250,000 | ||||||||||||
| Less offering expenses | ||||||||||||||||
| Commissions | - | - | - | - | ||||||||||||
| Consulting, Legal and advertising | 150,000 | 150,000 | 150,000 | 150,000 | ||||||||||||
| Printing and advertising | 20,000 | 20,000 | 20,000 | 20,000 | ||||||||||||
| Net Proceeds | 6,392,500 | 12,955,000 | 19,517,500 | 26,080,000 | ||||||||||||
| Use of Net Proceeds | ||||||||||||||||
| Sales and brokerage fess | 31,963 | 64,775 | 97,588 | 130,400 | ||||||||||||
| Marketing and out of pocket expenses | 63,925 | 129,550 | 195,175 | 260,800 | ||||||||||||
| Legal and professional endorsement fees | 95,888 | 95,888 | 95,888 | 95,888 | ||||||||||||
| Capital Expenditures in: | ||||||||||||||||
| 1 SJAP (Huangyuan Xining)'s developments | 1,860,218 | 3,799,436 | 5,738,655 | 7,677,874 | ||||||||||||
| 2 HSA (Hunan, Linli)'s Developments | 1,860,218 | 3,799,436 | 5,738,655 | 7,677,874 | ||||||||||||
| 3 MEIJI's developments in cattle farms | - | - | - | - | ||||||||||||
| 4 HU Plantation's developments | - | - | - | - | ||||||||||||
| 5 CA's developments in Fishery activities | - | - | - | - | ||||||||||||
| 6 Corporate division | 2,480,290 | 5,065,915 | 7,651,540 | 10,237,165 | ||||||||||||
| Total Use of Net proceeds | 6,392,500 | 12,955,000 | 19,517,500 | 26,080,000 | ||||||||||||
The following terms further clarify certain line itemsWe have agreed to bear the expenses (other than any underwriting discounts or terms usedcommissions or agent’s commissions) in connection with the Useregistration of Net Proceeds set forth above:the note and the underlying common stock being offered hereby by the securityholder.
All general administration and general expenses required for this offering will be absorbed into our daily operation cost.
Sales and brokerage fees is estimated at an average of 0.5% of the net proceeds.
Marketing and out of pocket expenses (including traveling expenses) are based on 1% of the net proceeds.
Advertising, legal and professional expenses are based on a flat rate of US$150,000.
Allocation of the proceeds will be mainly used by SJAP, HSA and the Company’s Corporate division based on the ratio of 30%, 30% and 40% respectively. As for the funding needs for the development of MEIJI, HU Plantation and CA, we believe that these 3 entities may have sufficient internally generated cash-flows to self-finance their respective developments.
If we fail to meet expectations, we may need to adjust the use of proceeds, which we presently expect would affect principally the Company’s Corporate division and delay the development of SJAP and HSA until such time we will be in a financial position to commence financing these activities. If we must curtail or cease these activities, our growth plan will be delayed, which would have a material, adverse effect on our financial condition and business.
DILUTION
Dilution represents the difference between the offering price and the net tangible book value per share immediately after completion of this offering. Net tangible book value is the amount that results from subtracting total liabilities and intangible assets from total assets. As of June 30, 2013, we had $258,495,707 in net tangible book value and $2.15 in net tangible book value per share. Because this is a direct public offering, with no minimum number of shares that must be sold, it is possible that none or some of the maximum number of shares offered will be sold. In our case, the net tangible book value per share is higher than the offering price, so the sale of the shares to you is accretive rather than dilutive.
After giving effect to the sale of 25%, 50%, 75% and 100% of the maximum shares of Common Stock offered by the Company hereby, at an assumed initial public offering price per share of $1.00 and the application of the estimated net proceeds there from (after deducting estimated offering expenses), the net tangible book value of the Company as of June 30, 2013, under the assumptions set forth above and after giving effect to the sale of shares offered hereby, would decrease from $2.15 to $1.97, $1.93, $1.89 and $1.85 per share, respectively. This represents an immediate decrease in the net tangible book value of $0.18, $0.22, $0.26 and $0.30 per share to current shareholders, respectively, and an immediate accretion of $0.97, 0.93, 0.89 and 0.85 per share to new investors.
The following table summarizes the per share dilution based on 25% of the maximum number of shares being sold:
| Public offering price per share | $ | 1.00 | ||
| Net tangible book value per share before this offering | $ | 2.15 | ||
| Decrease per share attributable to new investors | $ | 0.18 | ||
| Adjusted net tangible book value per share after this offering | $ | 1.97 | ||
| Accretion per share to new investors | $ | 0.97 | ||
| Percentage accretion | 97 | % |
50% of the maximum number of shares being sold:
| Public offering price per share | $ | 1.00 | ||
| Net tangible book value per share before this offering | $ | 2.15 | ||
| Decrease per share attributable to new investors | $ | 0.22 | ||
| Adjusted net tangible book value per share after this offering | $ | 1.93 | ||
| Accretion per share to new investors | $ | 0.93 | ||
| Percentage accretion | 93 | % |
The following table summarizes the per share dilution based on 75% of the maximum number of shares being sold:
| Public offering price per share | $ | 1.00 | ||
| Net tangible book value per share before this offering | $ | 2.15 | ||
| Decrease per share attributable to new investors | $ | 0.26 | ||
| Adjusted net tangible book value per share after this offering | $ | 1.89 | ||
| Accretion per share to new investors | $ | 0.89 | ||
| Percentage accretion | 89 | % |
The following table summarizes the per share dilution based on 100% of the maximum number of shares being sold:
| Public offering price per share | $ | 1.00 | ||
| Net tangible book value per share before this offering | $ | 2.15 | ||
| Decrease per share attributable to new investors | $ | 0.30 | ||
| Adjusted net tangible book value per share after this offering | $ | 1.85 | ||
| Accretion per share to new investors | $ | 0.85 | ||
| Percentage accretion | 85 | % |
MARKET FOR OUR COMMON STOCK AND RELATED STOCKHOLDER MATTERS
Since January 5, 2012, our common stock has been quoted on OTC Bulletin Board under the symbol of “SIAF.” Prior thereto, onOn July 24, 2007, our Common Stock began to be quoted on the Pink OTC Markets under the symbol “SIAF.PK.” Commencing January 5, 2012, our common stock has been quoted on the OTC QB under the symbol of “SIAF.” The following table lists the high and low bid price for our Common Stock as quoted by the Pink OTC Markets, then the OTC BBQB during each quarter within the last two completed fiscal years. These quotations reflect inter-dealer prices, without retail mark-up, markdown, or commission and may not represent actual transactions. The figures below reflect the Reverse Split.
| Year 2011 | High | Low | ||||||||||||||
| Year 2013 | High | Low | ||||||||||||||
| First Quarter | $ | 1.58 | $ | 1.21 | $ | 6.63 | $ | 3.76 | ||||||||
| Second Quarter | $ | 1.43 | $ | 0.82 | $ | 5.44 | $ | 3.56 | ||||||||
| Third Quarter | $ | 1.04 | $ | 0.45 | $ | 5.84 | $ | 3.47 | ||||||||
| Fourth Quarter | $ | 0.78 | $ | 0.36 | $ | 5.54 | $ | 4.06 | ||||||||
| Year 2012 | High | Low | ||||||||||||||
| Year 2014 | High | Low | ||||||||||||||
| First Quarter | $ | 0.93 | $ | 0.50 | $ | 5.54 | $ | 4.55 | ||||||||
| Second Quarter | $ | 0.98 | $ | 0.42 | $ | 5.10 | $ | 3.74 | ||||||||
| Third Quarter | $ | 0.67 | $ | 0.34 | $ | 8.90 | $ | 3.86 | ||||||||
| Fourth Quarter | $ | 0.71 | $ | 0.51 | $ | 10.59 | $ | 6.87 | ||||||||
| Year 2013 | High | Low | ||||||
| First Quarter | $ | 0.67 | $ | 0.38 | ||||
| Second Quarter | $ | 0.55 | $ | 0.36 | ||||
| Third Quarter to date | $ | 0.45 | $ | 0.35 | ||||
| Year 2015 | High | Low | ||||||
| First Quarter to date | $ | 9.50 | $ | 7.70 | ||||
The closing price of our common stock on the OTC Bulletin BoardQB on SeptemberFebruary 20, 20132015 was $0.405$8.50 per share.
Holders
| - 19 - |
Holders
As of September 4, 2013,February 18, 2015, an aggregate of 127,713,76617,162,716 shares of our common stock were issued and outstanding and were owned by approximately 5,2113,484 stockholders of record.
Dividends
On October 2, 2011, we declared cash dividends of US $0.01 per share of our common stock with a record date of October 31, 2010, and payment date of November 15, 2011. Subsequently, the dividend was fully paid to shareholders of record on November 15, 2011. On December 6, 2012, we declared cash dividends of US $0.01 per share of our common stock with a record date of December 26, 2012, and payment date of January 15, 2013. Subsequently, the dividend was fully paid to shareholders of record on January 15, 2013.
Equity Compensation Plan Information
The following table sets forth certain information as of December 31, 2012,2014, with respect to compensation plans under which the Company’s equity securities are authorized for issuance:
| (a) | (b) | (c) | ||||||||||
| Number of securities to be issued upon exercise of outstanding options, warrants and rights | The weighted-average exercise price of outstanding options, warrants and rights | Number of securities remaining available for future issuance under equity compensation plans (excluding securities reflected in column (a)) | ||||||||||
| Equity compensation | Plans approved by Security holders | None | - | - | ||||||||
| None | - | - | ||||||||||
| Total |
| - 20 - |
MANAGEMENT’S DISCUSSION AND ANALYSIS OF FINANCIAL CONDITION AND RESULTS OF OPERATIONS
This prospectus contains “forward-looking statements,” within the meaning of the Private Securities Litigation Reform Act of 1995 and Section 21E of the Securities Exchange Act of 1934, as amended (the “Exchange Act”).The Company intends such forward-looking statements to be covered by the safe harbor provisions for forward-looking statements contained in Section 21E of the Exchange Act. Forward-looking statements can be identified by the use of forward-looking terminology, such as “estimates,” “projects,” “plans,” “believes,” “expects,” “anticipates,” “intends,” or the negative thereof or other variations thereon, or by discussions of strategy that involve risks and uncertainties These statements reflect management’s current beliefs and are based on information now available to it. Accordingly, these statements are subject to certain risks, uncertainties and contingencies that could cause the Company’s actual results, performance or achievements in 2014 and beyond to differ materially from those expressed in, or implied by, such statements. Such statements, include, but are not limited to, statements contained in this prospectus relating to the Company’s business, financial performance, business strategy, recently announced transactions and capital outlook. Important factors that could cause actual results to differ materially from those in the forward-looking statements include: a continued decline in general economic conditions nationally and internationally; decreased demand for our products and services; market acceptance of our products; the impact of any litigation or infringement actions brought against us; competition from other providers and products; the inability to raise capital to fund continuing operations; changes in government regulation; the ability to complete customer transactions, and other factors relating to our industry, our operations and results of operations and any businesses that may be acquired by us. Should one or more of these risks or uncertainties materialize, or should the underlying assumptions prove incorrect, actual results may differ significantly from those anticipated, believed, estimated, expected, intended or planned. Readers of this prospectus should not place undue reliance on any forward-looking statements. Except as required by federal securities laws, the Company undertakes no obligation to update or revise these forward-looking statements to reflect new events or uncertainties.
You should read the following discussion and analysis of the financial condition and results of operations of the Company together with the financial statements and the related notes presented herein.
Description and interpretation and clarification of business category on the consolidated results of the operations
The Company’s strategy is to manage and operate its businesses under six (6) business divisions or units on a standalone basis, namely:
1) Fishery Division;
2) Plantation Division;
3) Beef Division;
4) Cattle Farm Division;
5) Organic Fertilizer Division; and
6) Corporate & Others Division
A summary of each business division is described below:
| l | Fishery Division refers to the operations of Capital Award Inc. (sometimes referred to as “CA”) covering its engineering, technology and consulting service management of fishery farms and seafood sales operations and marketing, where; |
Capital Award generates revenue as being the sole marketing, sales and distribution agent of the fishery farms (covering both of the fish, prawns and eel farms) developed by Capital Award in China as follows:
(A). Engineering and Technology Services via Consulting and Service Contracts (“CSC’s”) for the development, construction, and supply of plant and equipment, and management of fishery (and prawn or shrimp) farms and related business operations.
(B). Seafood Sales
Capital Award generates revenue as the sole marketing, sales and distribution agent for the fish and prawn farms developed by Capital Award in China as follows:
| (1) | Sales to Sino Foreign Joint Venture Companies (“SFJVC”) and sales derived from the SFJVC (currently, only the JFD subsidiary is a SFJVC) are being consolidated into Tri-way Industries Ltd. (Hong Kong) (“TRW”) as one entity. |
| (2) | Sales to and sales derived from un-incorporated companies (covering EBAPCD and ZSAPP) are accounted for independently as follows: |
| - 21 - |
CA and EBAPCD: (a) CA purchases prawn fingerling and feed stocks from third party suppliers and resells them to EBAPCD at variable small profit margins and (b) CA purchases matured prawns from EBAPCD and sells them to third parties (wholesale markets)
CA and ZSAPP: (a) CA earns commission from the sale of prawn fingerlings that are sold by ZSAPP to third parties, and in this respect ZSAPP produces its own prawn fingerlings as compared to CA purchasing them for EBAPCD, as described above, and (b) CA purchases matured prawns from ZSAPP and sells to third parties (wholesale markets)
| l | Plantation Division refers to the operations of Jiangmen City Heng Sheng Tai Agriculture Development Co. Ltd. (“JHST”) in the HU Plantation business where dragon fruit flowers (dried and fresh) and immortal vegetables are sold to wholesale and retail markets JHST’s financial statements are consolidated into the financial statements of Macau EIJI Company Ltd. (“MEIJI”) as one entity. |
| l | Cattle Farm Division refers to the operations of Cattle farm (1) under Jiangmen City Hang Mei Cattle Farm Development Co. Ltd (“JHMC”) where Cattle are sold live to third party live-stock wholesalers who are selling them mainly in Guangzhou and Beijing live-stock wholesale markets. The financial statements of JHMC are consolidated into MEIJI as one entity along with MEIJI’s operation in the consulting and service for development of other cattle farms (i.e. Cattle Farm 2) or related projects. |
| l | Organic Fertilizer Division refers to (i) the operation of SJAP in manufacturing and sales of organic fertilizer, bulk livestock feed, concentrated livestock feed, and the sales of live cattle inclusive (a): Cattle that are not being slaughtered in our own slaughterhouse operated by Qinghai Zhong He Meat Products Co., Limited (“QZH”) are sold live to third party live-stock wholesalers and (b): Cattle that are sold to QZH and being slaughtered and de-boned and packed by QZH; and the sales of meats de-boned and packed by QZH that are sold to various meat distributors, wholesalers and super market chains and our own retail butcher stores. (ii) The operation of Hunan Shenghua A Power Agriculture Co. Ltd. (“HSA”) in manufacturing and sales of organic fertilizer. Also QZH is a fully owned subsidiary of SJAP as such financial statements of these three companies (SJAP, QZH and HSA) are being consolidated into APWAM as one entity. |
| l | Corporate &Others Division refers to the business operations of Sino Agro Food, Inc., including import/export business and consulting and service operations provided to projects that are not included in the above categories, and not limited to corporate affairs. |
MD & A OF CONSOLIDATED RESULTS OF OPERATIONS
Part A. Unaudited Income Statements of Consolidated Results of Operations for three months ended September 30, 2014 compared to the three months ended September 30, 2013.
A (1) Income Statements (Unaudited)
| Three months ended | Three months ended | |||||||||||||
| In $ | September 30, 2014 | September 30, 2013 | Difference | Note | ||||||||||
| Revenue | 107,220,059 | 70,707,697 | 36,512,362 | 1 | ||||||||||
| Consulting, services, commission and management fee | 25,048,644 | 9,040,422 | 16,008,222 | 1.1 | ||||||||||
| Sale of goods | 82,171,415 | 61,667,275 | 20,504,140 | 1.2 | ||||||||||
| Cost of goods sold and services | 72,723,395 | 44,584,572 | 28,138,823 | 2 | ||||||||||
| Consulting, services, commission and management fee | 13,601,869 | 3,269,035 | 10,332,834 | 2.1 | ||||||||||
| Sale of goods | 59,121,526 | 41,315,537 | 17,805,989 | 2.2 | ||||||||||
| Gross Profit | 34,496,664 | 26,123,125 | 8,373,539 | 3 | ||||||||||
| Consulting, services, commission and management fee | 11,446,775 | 5,771,387 | 5,675,388 | 3.1 | ||||||||||
| Sale of goods | 23,049,889 | 20,351,738 | 2,698,151 | 3.2 | ||||||||||
| Other income (expenses) | (17,599 | ) | 259,366 | (276,965 | ) | |||||||||
| General and administrative expenses | (3,681,580 | ) | (2,026,989 | ) | (1,654,591 | ) | 4 | |||||||
| Net income | 30,884,556 | 24,355,502 | 6,529,054 | |||||||||||
| EBITDA | 32,347,402 | 25,491,778 | 6,855,624 | |||||||||||
| Depreciation and amortization (D&A) | (1,199,182 | ) | (849,900 | ) | (349,282 | ) | 5 | |||||||
| EBIT | 31,148,220 | 24,641,878 | 6,506,342 | |||||||||||
| Net Interest | (263,664 | ) | (286,376 | ) | 22,712 | |||||||||
| Tax | - | - | - | |||||||||||
| Net Income | 30,884,556 | 24,355,502 | 6,529,054 | |||||||||||
| Non - controlling interest | (6,382,694 | ) | (5,602,728 | ) | (779,966 | ) | 7 | |||||||
| Net income to SIAF and subsidiaries | 24,501,862 | 18,752,774 | 5,749,088 | |||||||||||
| Weighted average number of shares outstanding | ||||||||||||||
| - Basic | 16,469,314 | 12,329,056 | 4,140,257 | |||||||||||
| - Diluted | 17,176,384 | 13,036,126 | 4,140,257 | |||||||||||
| Earnings Per Share (EPS) | 8 | |||||||||||||
| - Basic | 1.49 | 1.52 | -0.03 | |||||||||||
| - Diluted | 1.43 | 1.44 | -0.01 | |||||||||||
| - 22 - |
This Part A discusses and analyzes certain items (marked with notes) that we believe assist stakeholders in obtaining a better understanding on the Company’s results of operations and financial condition:
Notes to Table A.1’s 1, 2 & 3:
(A): Information of Note (1, 2 & 3) Sales, cost of sales and gross profit and analysis:
| The Company’s revenues were generated from (A) Sale of Goods and (B) Consulting and Services provided in project and business developments covering engineering, construction, supervision, training, management and technology. |
Table (A.2). Below shows segmental break-down figures of Sales, Cost of Goods Sold, and Gross Profits for the three months ended September 30, 2014 (Q3 2014) and the three months ended September 30, 2013 (Q3 2013).
| Sales of goods | Cost of Goods sold | Sales of Goods' Gross profit | ||||||||||||||||||||||||
| In US$ | 2014Q3 | 2013Q3 | 2014Q3 | 2013Q3 | 2014Q3 | 2013Q3 | ||||||||||||||||||||
| SJAP | Sales of live cattle | 17,599,116 | 8,164,934 | 12,572,988 | 6,112,264 | 5,026,129 | 2,052,670 | |||||||||||||||||||
| Sales of feedstock | ||||||||||||||||||||||||||
| Bulk Livestock feed | 1,101,471 | 2,835,561 | 528,982 | 1,235,016 | 572,488 | 1,600,545 | ||||||||||||||||||||
| Concentrate livestock feed | 3,095,750 | 3,490,520 | 1,957,093 | 2,195,694 | 1,138,656 | 1,294,826 | ||||||||||||||||||||
| Sales of fertilizer | 440,588 | 2,839,360 | 211,593 | 1,354,353 | 228,995 | 1,485,007 | ||||||||||||||||||||
| SJAP Total | 22,236,925 | 17,330,375 | 15,270,656 | 10,897,327 | 6,966,269 | 6,433,048 | ||||||||||||||||||||
| * QZH’s (Slaughter & Deboning operation) | 341,336 | - | 192,938 | - | 148,398 | - | ||||||||||||||||||||
| ** QZH's (Deboning operation) | ||||||||||||||||||||||||||
| on cattle & Lamb locally supplied | 3,595,291 | - | 2,376,128 | - | 1,219,163 | - | ||||||||||||||||||||
| on imported beef and mutton | 1,732,423 | - | 950,900 | - | 781,523 | - | ||||||||||||||||||||
| QZH Total | 5,669,050 | - | 3,519,966 | - | 2,149,084 | - | ||||||||||||||||||||
| HSA | Sales of Organic fertilizer | 1,095,621 | 2,187,164 | 813,487 | 1,410,019 | 282,134 | 777,145 | |||||||||||||||||||
| Sales of Organic Mixed Fertilizer | 4,698,541 | 917,414 | 3,885,054 | 527,841 | 813,487 | 389,573 | ||||||||||||||||||||
| HSA Total | 5,794,162 | 3,104,578 | 4,698,541 | 1,937,860 | 1,095,621 | 1,166,718 | ||||||||||||||||||||
| SJAP's & HSA/Organic fertilizer total | 33,700,137 | 20,434,953 | 23,489,163 | 12,835,187 | 10,210,974 | 7,599,766 | ||||||||||||||||||||
| JHST | Sales of Fresh HU Flowers | 460,176 | 1,096,411 | 149,494.47 | 387,663 | 310,682 | 708,748 | |||||||||||||||||||
| Sales of Dried HU Flowers | 4,237,312 | 9,278,549 | 1,183,295 | 4,385,131 | 3,054,017 | 4,893,418 | ||||||||||||||||||||
| Sales of Dried Immortal vegetables | 1,116,179 | - | 371,951 | - | 744,227 | - | ||||||||||||||||||||
| Sales of Other Value added products | - | 160,000 | - | 60,000 | - | 100,000 | ||||||||||||||||||||
| JHST/Plantation Total | 5,813,667 | 10,534,960 | 1,704,741 | 4,832,794 | 4,108,926 | 5,702,166 | ||||||||||||||||||||
| CA | Sales of | |||||||||||||||||||||||||
| Fish (Sleepy cods) | 1,533,699 | 10,014,364 | 1,200,856 | 8,467,372 | 332,843 | 1,546,992 | ||||||||||||||||||||
| Eels | 14,406,907 | 8,406,475 | 9,035,340 | 4,581,674 | 5,371,568 | 3,824,801 | ||||||||||||||||||||
| Prawns | 6,790,885 | 1,177,443 | 5,699,673 | 1,159,135 | 1,091,213 | 18,308 | ||||||||||||||||||||
| CA/ Fishery total | 22,731,491 | 19,598,282 | 15,935,868 | 14,208,181 | 6,795,623 | 5,390,101 | ||||||||||||||||||||
| MEIJI | ||||||||||||||||||||||||||
| Sale of Live cattle (Aromatic) | 6,814,990 | 4,639,397 | 6,443,072 | 3,974,942 | 371,918 | 664,455 | ||||||||||||||||||||
| MEIJI / Cattle farm Total | 6,814,990 | 4,639,397 | 6,443,072 | 3,974,942 | 371,918 | 664,455 | ||||||||||||||||||||
| SIAF | ||||||||||||||||||||||||||
| Sales of goods through trading/import/export activities | ||||||||||||||||||||||||||
| on seafood | 11,757,113 | 6,459,683 | 10,632,839 | 5,464,433 | 1,124,274 | 995,250 | ||||||||||||||||||||
| on imported beef and mutton | 1,354,017 | - | 915,843 | - | 438,174 | - | ||||||||||||||||||||
| SIAF/ Others & Corporate total | 13,111,130 | 6,459,683 | 11,548,682 | 5,464,433 | 1,562,448 | 995,250 | ||||||||||||||||||||
| Group Total | 82,171,415 | 61,667,275 | 59,121,526 | 41,315,537 | 23,049,889 | 20,351,738 | ||||||||||||||||||||
Table (A.3) below shows the percentage of gross profit the three months ended September 30, 2014 and the three months ended September 30, 2013.
| - 23 - |
Revenues (sale of goods))
Group’s revenues generated from sale of goods increased by $20,504,140 or 33% from $61,667,275 for Q3 2013 to $82,171,415 for Q3 2014. The increase was primarily due to increase of revenues from fishery, organic fertilizer, cattle farms and corporate sectors collectively.
Fishery: Revenue from fishery increased by $3,133,209 or 16% from $19,598,282 for Q3 2013 to $22,731,491 for Q3 2014. The increase in fishery was primarily due to our increase in productivities and in term increasing the sale of eels and prawns.
Plantation: Revenue from our plantation decreased by $4,721,293 or 45% from $10,534,960 for Q32013 to $5,813,667 for Q3 2014. The decrease was primarily due to this year’s wet season affecting the yields of the regional growers who we collected flowers from in past that we did not buy any fresh flowers from them for drying this quarter thus in term lowering our overall sales of dried flowers.
Organic fertilizer: Revenue from organic fertilizer increased by $13,265,184 or 65% from $20,434,953 for Q3 2013 to $33,700,137 for Q3 2014.The increase was primarily due to the increase of SJAP’s sales of live cattle, HSA’s increase of sales of fertilize and QZH’s increase of sale from slaughter and deboning operation. More details and information are presented in a subsequent section.
Cattle farm: Revenue from cattle farm increased by $2,175,593 or 47% from $4,639,397 for Q3 2013 to $6,814,990 for Q3 2014. The increase was primarily due to the combination of increase of cattle being grown in the farm and increase of number of cattle being fattened by sub-contracted growers. More details and information are presented in a subsequent section.
Corporate: Revenue from the corporate increased by $6,651,447 or 103% from $6,459,683 to $13,111,130 for Q3 2014. The increase was primarily due to more imported seafood being marketed. More details and information are presented in a subsequent section.
Cost of Goods Sold
Cost of goods sold increased by $17,805,989 or 43% from $41,315,537 for Q3 2013 to $59,121,526 for Q3 2014. The increase was primarily due to increase of cost of goods sold from fishery, organic fertilizer, cattle farms and corporate sectors collectively.
Fishery: Cost of goods sold from fishery increased by $1,727,687 or 12% from $14,208,181 for Q3 2013 to $15,935,868 for Q3 2014.The increase in cost of goods from fishery was primarily due to the increase in productivities and in term cost of production of eels and prawns.
Plantation: Cost of goods sold from plantation decreased by $3,128,053 or 65% from $4,832,794 for Q3 2013 to $1,704,741 for Q3 2014. The decrease was primarily due to the fact that there were no dried flowers processed from fresh flowers brought from and supplied by other regional growers due to short supply caused by the wet-season. More details and information are presented in a subsequent section.
Organic fertilizer: Cost of goods sold from organic fertilizer increased by $10,653,976 or 83% from $12,835,187 for Q3 2013 to $23,489,163 for Q3 2014. The corresponding increase was primarily due to the increase of cost of production in SJAP’s increase of productivities of live cattle, HSA’s increased productivities of fertilizer and QZH’s increase of cost of sales from slaughter and deboning operations.
Cattle farm: Cost of goods sold from cattle farm increased by $2,468,130 or 62% from $3,974,942 for Q3 2013 to $6,443,072 for Q3 2014. The increase was primarily due to the increase of sales of fattened cattle from sub-contracted growers (i.e. trading of cattle). More details and information are presented in a subsequent section.
Corporate: Cost of goods sold from corporate increased by $6,084,249 or 111% from $5,464,433 for Q3 2013 to $11,548,682 for Q3 2014. The increase was primarily due the corresponding increase of sales.
Note (3): Gross Profit (sale of goods)
Gross profit generated from goods sold increased by $2,698,151 or 13% from $20,351,738 for Q3 2013 to $23,049,889 for Q3 2014. The increase was primarily due to increase of gross profit from organic fertilizer by $2,611,208. Gross profit from organic fertilizer of $10,210,974 (Q3 2013: $7,599,766 attributed to 44% (Q3 2013: 37%) of total gross profit of $23,049,888 (Q3 2013: $20,351,738.).
Fishery: Gross profit from fishery increased by $1,405,522 or 26% from $5,390,101 for Q3 2013 to $6,795,623 for Q3 2014. Gross profit derived from sale of eels and prawns were $5,371,568 and $1,091,213 respectively in Q3 2014 compared to $3,824,801 and $18,308 respectively in Q3 2013.
| - 24 - |
Plantation: Gross profit from our plantation decreased by $1,593,240 from $5,702,166 for the three months ended Sept. 30,2013 to $4,108,926 for the three months ended September 30, 2014. The decrease was primarily due to this year’s wet season affecting the yields of the regional growers who we collected flowers from in past that we didn’t buy any fresh flowers from them for drying this quarter thus in term lowering our overall sales of dried flowers.
Organic fertilizer: Gross profit from organic fertilizer increased by $2,611,208 or 34% from $7,599,766 for Q3 2013 to $10,210,974 for Q3 2014. The increase was primarily due to the increase of SJAP’s sales of live cattle, HSA’s increase of sales of fertilizer QZH’s increase of gross profit from slaughter and deboning operations.
Cattle farm: Gross profit from cattle decreased by $292,537 from $664,455 for Q3 2013 to $371,918 for Q3 2014. The decrease was primarily due to the increase of trading of cattle from contracted growers at Changchun Village committee were at lower margin compared to the cattle grown by own farms.
Corporate: Gross profit from the corporate increased by $567,198 or 57% from $995,250 for Q3 2013 to $1,562,448 for Q3 2014. The increase was primarily due to the more category of seafood being marketed in Q3 2014 and the overall cost saving on air-flights charges, packaging materials and lower mortality of live seafood upon arrival of sales destinations. More details and information are presented in a subsequent section.
Table A.4.: (below) shows the itemized sales of goods and related cost of sales in quantity and unit price for the three months ended September 30, 2014 (Q3 2014) and the three months ended September 30, 2013 (Q3 2013).
| Description of items | 2014Q3 | 2013Q3 | ||||||||||||||||
| Cattle Operation | Difference | |||||||||||||||||
| Production and Sales of live cattle | Head | 4,777 | 2,600 | 2,177 | A.4.1 | |||||||||||||
| Average Unit sales price | $/head | 3,684 | 3,140 | 544 | ||||||||||||||
| Unit cost price | $/head | 2,632 | 2,351 | 281 | ||||||||||||||
| Production and sales of feedstock | - | |||||||||||||||||
| Bulk Livestock feed | MT | 6,048 | 18,162 | -12,114 | A.4.2 | |||||||||||||
| Average Unit sales price | $/MT | 182 | 156 | 26 | ||||||||||||||
| Unit cost price | $/MT | 87 | 68 | 19 | ||||||||||||||
| Concentrated livestock feed | MT | 7,625 | 8,429 | -804 | A.4.3 | |||||||||||||
| Average Unit sales price | $/MT | 406 | 414 | -8 | ||||||||||||||
| Unit cost price | $/MT | 257 | 260 | -4 | ||||||||||||||
| Production and sales of fertilizer | MT | 2,348 | 16,366 | -14,018 | A.4.4 | |||||||||||||
| Average unit sales price | $/MT | 188 | 173 | 14 | ||||||||||||||
| Unit cost price | $/MT | 90 | 83 | 7 | ||||||||||||||
| * QZH (Slaughter & De-boning operation) | ||||||||||||||||||
| Slaughter operation | ||||||||||||||||||
| Slaughter of cattle | Head | 845 | A.4.5 | |||||||||||||||
| Service fee | $/Head | 8 | ||||||||||||||||
| Sales of associated products | Pieces | 999 | ||||||||||||||||
| Average Unit sales price | $/Piece | 335 | ||||||||||||||||
| Unit cost price | $/Piece | 193 | ||||||||||||||||
| De-boning & Packaging activities | A. 4.6. | |||||||||||||||||
| From Cattle supplied locally | ||||||||||||||||||
| De-boned Meats | MT | 286 | ||||||||||||||||
| Average Unit sales price | $/MT | 12,591 | ||||||||||||||||
| Unit cost price | $/MT | 8,321 | ||||||||||||||||
| From imported beef | MT | 84 | ||||||||||||||||
| Average Unit sales price | $/MT | 8,722 | ||||||||||||||||
| Unit cost price | $/MT | 4,610 | ||||||||||||||||
| From imported lamb | MT | 121 | ||||||||||||||||
| Average of sales price | $/MT | 8,263 | ||||||||||||||||
| Average of cost price | $/MT | 4,659 | ||||||||||||||||
| HSA | Fertilizer and Cattle operation | - | A. 4.7. | |||||||||||||||
| Organic Fertilizer | MT | 4,080 | 6,378 | -2,298 | ||||||||||||||
| Average Unit sales price | $/MT | 264 | 343 | -79 | ||||||||||||||
| Unit cost price | $/MT | 198 | 221 | -23 | ||||||||||||||
| Organic Mixed Fertilizer | MT | 10,383 | 2,200 | 8,183 | A. 4.8. | |||||||||||||
| Average Unit sales price | $/MT | 453 | 417 | 36 | ||||||||||||||
| Unit cost price | $/MT | 374 | 240 | 134 | ||||||||||||||
| Retailing packed fertilizer (for super market sales) | MT | 20 | - | 20 | A. 4.8.a | |||||||||||||
| Average Unit sales price | $/MT | 927 | - | 927 | ||||||||||||||
| Unit cost price | $/MT | 343 | - | 343 | ||||||||||||||
| Description of items | 2014Q3 | 2013Q3 | ||||||||||||||||
| JHST | Plantation of HU Flowers and Immortal vegetables | |||||||||||||||||
| Fresh HU Flowers | Pieces | 3,045,250 | 7,309,407 | -4,264,157 | A.4.9 | |||||||||||||
| Average Unit sales price | $/Pieces | 0.15 | 0.15 | 0.00 | ||||||||||||||
| Unit cost price | $/Pieces | 0.05 | 0.05 | - | ||||||||||||||
| Dried HU Flowers | MT | 307 | 757 | -450 | A.4.10 | |||||||||||||
| Average Unit sales price | $/MT | 13,802 | 12,257 | 1,545 | ||||||||||||||
| Unit cost price | $/MT | 3,854 | 5,793 | -1,938 | ||||||||||||||
| Dried Immortal vegetables | MT | 15 | 15 | A.4.11 | ||||||||||||||
| Average Unit sales price | $/MT | 74,412 | 74,412 | |||||||||||||||
| Unit cost price | $/MT | 24,797 | 24,797 | |||||||||||||||
| Other Value added products | Pieces | - | 20,000.00 | -20,000 | A.4.12 | |||||||||||||
| Average Unit sales price | $/Pieces | - | 8 | -8 | ||||||||||||||
| Unit cost prices | $/Pieces | - | 3 | -3 | ||||||||||||||
| CA | Production and sale (inclusive of contracted farms) of live | |||||||||||||||||
| Fish (Sleepy cods) | MT | 98 | 629 | -531 | A.4.13 | |||||||||||||
| Average Unit sales price | $/MT | 15,650 | 15,921 | -271 | ||||||||||||||
| Unit cost prices | $/MT | 12,254 | 13,462 | -1,208 | ||||||||||||||
| Eels | MT | 577 | 446 | 131 | A.4.14 | |||||||||||||
| Average Unit sales price | $/MT | 24,958 | 18,850 | 6,108 | ||||||||||||||
| Unit cost price | $/MT | 15,652 | 10,274 | 5,379 | ||||||||||||||
| Prawns | MT | 483 | 112 | 371 | A.4.15 | |||||||||||||
| Average Unit sales price | $/MT | 14,060 | 10,513 | 3,547 | ||||||||||||||
| Unit cost price | $/MT | 11,801 | 10,349 | 1,451 | ||||||||||||||
| MEIJI | Production and sale of Live cattle (Aromatic) | Head | 2,846 | 1,500 | 1,346 | A.4.16 | ||||||||||||
| Average Unit sales price | $/head | 2,395 | 3,093 | -698 | ||||||||||||||
| Unit cost prices | $/head | 2,264 | 2,650 | -386 | ||||||||||||||
| SIAF | Seafood trading from imports | |||||||||||||||||
| Mixed seafood | MT | 728 | 450 | 278 | A.4.17 | |||||||||||||
| Average of sales price | $/MT | 16,150 | 14,355 | 1,795 | ||||||||||||||
| Average of cost prices | $/MT | 14,606 | 12,143 | 2,462 | ||||||||||||||
| Beef & Lambs trading from imports | MT | 206 | - | |||||||||||||||
| Average of sales price | $/MT | 6,573 | - | |||||||||||||||
| Average of cost price | $/MT | 4,446 | ||||||||||||||||
Notes to Table A.4.
A.4.1: There were 4,777 head of live cattle at an average weight of 727 Kg / head sold in Q3 2014 compared to 2,600 head at an average weight of 650 Kg / head sold in Q3 2013 representing an increase of 2,177 head as SJAP increases its number of cooperative farms from 2013’s 10 to its present number of 22. Unit sales prices of live cattle as an average has increased marginally from RMB29.5 / Kg (or $4.80 / Kg) in Q3 2013 to RMB31 / Kg (or $5.04 / Kg) in Q3 2014.
A.4.2: The decrease in sales of the Bulk livestock feed by 12,114 MT between Q3 2013’s 18,162 MT and Q3 2014’s 6,048 MT was due primarily to the decrease of external sales of Bulk livestock feed to non-cooperative regional farmers due mainly the good season of the Quarter, most of the non-cooperative farmers have plenty of feed.
A.4.3: The decrease in sales of the concentrated livestock feed by 804 MT between Q3 2013’s 8,429 MT and Q3 2014’s 7,625 MT was due primarily to the decrease of external sales to non-cooperative farmers for the similar reason explained above.
A.4.4: The decrease of sales in SJAP’s fertilizer was by 14,108 MT between Q3 2014’s 2,348 MT and Q3 2013’s 16,366 MT due mainly to the fact that SJAP is no longer needed to supply HSA with fertilizer because HSA has established and been operating its second fertilizer process plant in the Quarter.
| - 25 - |
A.4.5: Qinghai Zhong He Meat Products Co., Limited (QZH) is the fully owned subsidiary of SJAP formed early in the year to operate the Slaughterhouse and De-boning operational division of SJAP.During the quarter, it has slaughtered 845 head of cattle supplied by SJAP’s farm and external non-cooperative farmers collectively, part of which were de-boned, packed and sold (285 MT) of meat at an average price of RMB 77 / Kg (or $12.52 / Kg) with average cost at RMB51 / Kg (or $8.3 / Kg). Relatively, this shows that our locally produced beef are selling and costing at higher prices than the imported beef (see below A.4.6).However, the fact is that the local China domestic markets are willing to pay higher prices for local produced beef. Tesco sales are the evidence of that, as we are selling more SJAP produced beef than imported beef.
A.4.6: Also during the quarter, there were 84 MT of quarter- cut beef imported from Australia that were deboned, packed and sold at an average of RMB54 / Kg (or $8.8 / Kg) with cost at an average of RMB28.65 / Kg (or $4.66 / Kg) excluding import duties, tax and affiliated cost that was averaging 30% of cost, making total cost at RMB 37.25 / Kg (or $6.06 / Kg). At the same time, there were 121 MT of imported Mutton being packed, deboned and sold during the Quarter at an average of RMB50 / Kg (or $ 8.13 / Kg) at CIF cost of RMB28.65 / Kg (or $4.66 / Kg) plus import duties, taxes and associated charges at RMB 8.6 / Kg (or $1.4 / Kg) yielding gross profit margin at 25.5 %, on average. Nevertheless, prices of the imported beef and lamb are more accepted by the catering traders and the wholesalers compared to the domestic retail market’s preference for SJAP’s local produced beef.
A.4.7/8: HSA increased its total sales of fertilizer by 5,885 MT to 14,463 in Q3 2014 compared to the 8,578 MT in Q3 2013.That is a growth of 68.6% having completed and operating its second production and fermentation plants and facilities during the quarter. Sales prices of the Mixed Organic Fertilizer increased marginally by 8.6% whereas related cost of production increased by over 55.8% mainly due to the raw material used to manufacture this fertilizer having been changed mainly to chicken manure that costs much higher than sheep manure, but more effective when the fertilizer is applied in the lakes increasing the growth of microorganisms at each depth level of the water thus providing better growth rates for the fish growing in the lakes.
A.4.9, 10, 11, 12: This season, the Guangdong district experienced a very wet season from April to August with constant rain falling practically every day that affected and delayed the growing of HU Flowers and immortal vegetables. As a result, most of the regional growers could not supply fresh flowers to us during the quarter, and, as such, most of the quarterly sales were from our own farm resulting from our earlier year’s preparation and work to improve the plantation, JHST harvested just under 20 million pieces of flowers and sold over 307 MT of dried HU flowers at an average price of $13,802 / MT. No further harvest is expected during the 4th quarter like in the previous year after having been affected by the wet-season.
JHST dried and sold over 15 MT of Immortal Vegetables during the Quarter harvested from 70 Mu of plantation at prices same as in last quarter. JHST intends to further develop more land to grow more Immortal Vegetable with the coming Quarter to build up total cultivated area to 100 Mu from its existing 70 Mu.
A.4.13, 14, 15: This Quarter we sold many larger eels at an average of over 2.8 Kg / eel to Q2 2014’s average of 1.3 Kg / eel enhancing better sales price averaging at RMB150 / Kg to Q2 2014’s RMB116 / Kg for smaller eels. (In this respect sales of eels were generated collectively from our own FF(1), unincorporated PF(2) & FF(2) and few other sub-contracted growers).
Whereas, total prawn sales were generated from our FF(1), and unincorporated PF(1), PF(2) and other sub-contracted growers collectively. Effective Gross Profit margin in our own farms and unincorporated farms for eel production is at an average of 60% and for prawns production the margin is being kept at above 75% but varies from other sub-contracted growers. (See more details in later sections)
A.4.16: MEIJI’s sales revenue consists of the combination of trading of cattle from sub-contracted growers and the consolidated revenue from CF1. Since the gross profit margin on trading is low, the overall GP% of MEIJI is reduced, and in this respect, CF1and CF2 are achieving an average above 15% on its cattle rearing operation, which is lower than Q2 2014’s 20% due to the growth rate and the number of Southern Yellow cattle grown this Quarter were lower than the Simmental cattle grown in earlier Quarters.
A.4.17: The Corporate sector’s imported Sales increased from more varieties of seafood being imported from Madagascar in coordination with more markets being developed during the quarter. At the same time, sales are being developed for imported beef and lamb from Australia creating additional revenues. Both items are maintaining Gross Profit margins at an average of 11%.
Notes to Table A (1) Note (1.1, 2.1 and 3.1)
Table (A.5) below shows the revenue, cost of services and gross profit generated from Consulting, services, commission and management fee for three months ended September 30,2014 (Q2 2014) and the three months ended September 30, 2013(Q2 2013).
| 2014 Q3 | 2013 Q3 | Difference | Description of work | |||||||||||
| Sales Revenues (Consulting and Services) | ||||||||||||||
| CA | 24,598,641 | 6,939,405 | 17,659,236 | Primarily on the Zhongshan new prawn project | ||||||||||
| SIAF | - | 1,934,460 | -1,934,460 | Restaurant (4,5 & 6) and renovation of Restaurant (1 & 2) | ||||||||||
| Group Total Revenues | 24,598,641 | 8,873,865 | 15,724,776 | |||||||||||
| Cost of sales | - | |||||||||||||
| CA | 13,601,869 | 2,703,461 | 10,898,408 | |||||||||||
| SIAF | 565,574 | -565,574 | ||||||||||||
| Group Total Cost of sales | 13,601,869 | 3,269,035 | 10,332,834 | |||||||||||
| Gross Profit | - | |||||||||||||
| CA | 10,996,772 | 4,235,944 | 6,760,828 | |||||||||||
| SIAF | - | 1,368,886 | -1,368,886 | |||||||||||
| Group Total Gross Profit | 10,996,772 | 5,604,830 | 5,391,942 | |||||||||||
| - 26 - |
Revenues: (consulting, service, commission and management fee)
Revenues increased by $15,724,776 or 177% from $8,873,865 for Q3 2013 to $24,598,641 for Q3 2014. The increase was primarily due to an increase in revenue from the construction and development work done on the New Zhongshan Prawn project of $24,598,641, which contributed 100% of the total increase of revenue of $24,598,641.
CA (Fishery): Revenue from fishery increased by $15,724,776 or 177% from $8,873,865 for Q 32013 to $24,598,641 for Q3 2014.
SIAF (Corporate): Revenue from corporate decreased by $1,934,460 or 100% from $1,934,460 for Q3 2013 to $0 for Q3 2014. The reason for the decrease is because the slow work in progress for the construction of restaurant related work during the quarter.
Cost of services (consulting, service, commission and management fee)
Cost of services for consulting, service, commission and management fee increased by $10,332,834 or 316% from $3,269,035 for Q3 2013 to $13 601,869 for Q3 2014.
CA (Fishery): Cost of services from fishery increased by $10,898,408 or 403% from $2,703,461 for Q3 2013 to $13 601,869 for Q3 2014.
SIAF (Corporate): Cost of services from corporate decreased by $565,574 or 100 % from $565,574 for Q3 2013 to $0 for Q3 2014. The reason for the decrease is because the slow progress for the construction of restaurant related work during the quarter.
Gross profit (consulting, service, commission and management fee)
Gross profit of consulting, service, commission and management fees increased by $5,391,942, or 96%, from $5,604,830 for Q3 2013 to $10,996,772 for Q3 2014.
CA (Fishery): Gross profit from fishery increased by $6,760,828 or 160% from $4,235,944 for Q3 2013 to $10,996,772 for Q3 2014.
SIAF (Corporate): Gross profit from corporate decreased by $1,368,886 or 100% from $1,368,886 for Q3 2013 to $0 for Q3 2014.The reason for the decrease is because the slow progress for the construction of restaurant related work during the quarter.
Tables(A.6) below highlights on general information of ongoing Consulting and Services provided by Capital Award, MEIJI and SIAF respectively as of September 30 2014:
| Name of the developments | Location of development | Designed capacity per year | Land area or Built up area | Current Phase & Stage | Commencement date of development | (Estimated) development's completion date on or before | Contractual amount | % of completion as of 30.09.2014 | Notes | |||||||||
| Fish Farm (1) | Enping City | 1,200 MT | 9,900 m2 | fully operational | July 2010 | June 2011 | $5.3 million | Fully operational | ||||||||||
| Prawn Farm (1) | Enping City | 2013=400MT 2014=800MT 2015=1200 MT | 23,100 m2 | 2 phases and road work | 2 phases and road work and Phase 3 extension of grow-out farm & Phase 4 demonstrated hydroponic farm | Phase 1 on June 2011 Phase (2.1) Phase (2.2) Road work Started Aug. 2012 | Phase (1) on December 2012 Phase (2) completed Q1 2013 | Phase (1) $11.6 million Phase (2) 6.39 million Road work $2.94 million, Phase 3 US$5.2 million & Phase 4 US$1.6 million | Extension work 90% completed | |||||||||
| Fish Farm (2) "The Fish & Eel Farm | Xin Hui District, Jiang Men. | 2014=800 MT 2015= 1600 MT 2016=2000MT | 165,000 m2 | 3 Phases | Phase 1 January 15, 2012 Bridge & Road Oct. 2012 Phase (3) 2013 & (4)2014 | Phase 1 June 2014 Bridge & Road Dec. 2013 Phase (3) & (4) 2015 | Phase (1) $8.73 million Bridge & Road $2.48 Phase (3) $4.38 M Phase (4) $10.63 Million | Phase (1) & Bridge and Road completed Jan. 2013 Phase (3) completed and Phase (4) not started. | Phase 4 work in progress | |||||||||
| Prawn Farm (2) The Hatchery & Nursery & Grow-out prawn farm | San Jiao Town, Zhong San City, | 2013=1.6 Billion Fingerling and 400MT of prawns increasing yearly and by 2015 = 3.2 billion fingerling and 1200 MT of Prawns | 120,000 m2 | 2 phases | Phase (1) and Phase (2) May 2012 Phase (3) 2014 | Phase (1) Dec. 2012 and Phase (2) December 2013.Phase (3) Dec. 2014 | Phase (1) $9.26 m and Phase (2) 8.42 Million Phase (3) 11.5 Million | Phase (1) fully operational and Phase (2) in operation and Phase (3) not started | Phase 3 work in progress | |||||||||
| Cattle Farm (1) | LiangXi Town, Enping City | 165,013 m2 | 1,500 Head | 2 phases | April 2011 | December 2011 | $3.0 million +$1.17 Million | Fully Operational | ||||||||||
| Cattle Farm (2) | LiangXi Town, Enping City | 230,300 m2 | 2,500 head | 2 Phases | February 2012 | March. 2014 | $10.6 million | completed | operating | |||||||||
| Cattle Farm (1) external road work | LiangXi Town, Enping City | 4.5 Km road | One Phase | September 2012 | March. 2013 | $4.32 million | Completed | |||||||||||
| Cattle Farm (2) External Road work. | LiangXi Town, Enping City | 5.5 Km Road | One Phase | September 2012 | March. 2013 | $5.28 Million | Completed | |||||||||||
| WHX Restaurants etc. | Guangzhou City | 5,500 seatings in total | June 2012 | December 2015 | $17.5 million | Work in progress | Restaurant 5 & 6 in operation | |||||||||||
| Guangzhou City | 5,000 m2 | One Phase | July 2012 | March. 2014 | $ 9 million | Completed | Operating | |||||||||||
| Shanghai City | 3,000 m2 | Two Phases | ||||||||||||||||
| December. 2014 | $5 million | Work in progress | Work in progress | |||||||||||||||
| New Zhongshan Prawn Project | Zhongshan City | Phase (1)S(1)= 10,000 MT S(2)= 30,000 MT Phase (2) S(1)=100,000 MT Phase (3) 200,000 MT | 3600 MU land & BU area 3.57 million square meter | Phase (1) Stage (1) | Nov. 2013 | 10 years for 100,000 MT capacity & 20 years for whole integrated project | 10 years for US$2.6 billion | minimal | Phase (1) Stage (1)'s farm construction work in progress |
MANAGEMENT’S DISCUSSION AND ANALYSIS OF FINANCIAL CONDITION AND RESULTS OF OPERATIONS
You should read the following discussion and analysis of financial condition and results of operation together with the financial statements and the related notes appearing beginning on page F-1 of this prospectus. The various sections of this discussion contain a number of forward-looking statements, all of which are based on our current expectations and could be affected by the uncertainties and risk factors described throughout this prospectus. See “Risk Factors” beginning on page 4 of this prospectus. Our actual results may differ materially.
Forward-looking Statements
We and our representatives may from timeNote (4) to time make written or oral statements that are “forward-looking,” including statements contained in this prospectus and other filings with the SEC, reports to our stockholders and news releases. All statements that express expectations, estimates, forecasts or projections are forward-looking statements. In addition, other written or oral statements which constitute forward-looking statements may be made by us or on our behalf. Words such as “expect,” “anticipate,” “intend,” “plan,” “believe,” “seek,” “estimate,” “project,” “forecast,” “may,” “should,” variations of such words and similar expressions are intended to identify such forward-looking statements. These statements are not guarantees of future performance and involve risks, uncertainties and assumptions which are difficult to predict. Therefore, actual outcomes and results may differ materially from what is expressed or forecasted in or suggested by such forward-looking statements. We undertake no obligation to update or revise any of the forward-looking statements after the date of this annual report to conform forward-looking statements to actual results. Important factors on which such statements are based are assumptions concerning uncertainties, including but not limited to, uncertainties associated with the following:
Business Overview
We are a consulting, engineering and technology based company operating in the agriculture and aquaculture sectors with a vertically integrated business model as a developer, producer and distributor of organic agriculture and aquaculture produce and products through our operating subsidiaries in China.
Activities in 2011 concentrated on the building of primary production activities in our feedstock, fertilizer fishery and cattle farm businesses leading to the initiation of basic infrastructure developed for our pre-wholesale and wholesale operations. 2012 was characterized by a marked expansion and continuation of our primary production activities and the development of wholesale operations, many delivering product sales, and by the build-out of the distribution network including import-export, as well as the start of retail operations.
We divide our operations into five standalone business divisions or units as follows: (1) fishery, (2) beef cattle, (3) fertilizer, enzymes and livestock feed, (4) Dragon Fruit (“HU”) flower plantation and (5) Corporate. The commonality between the divisions is that each operates in a comparatively slow growth consolidating market; our strategy is targeting niches within these markets with our products.
Below is a summary of our operational and/or developing stage business activities carried out by our subsidiaries.
Fishery Division
The main revenues of Capital Award, Inc. (“Capital Award”) are generated from the following activities:
1. Engineering and Technology Services . Engineering and technology services earned through providing consulting management and servicing contracts and management services to our group companies and third parties. As of the date of this prospectus, Capital Award has six (6) consulting and servicing contracts consisting of the following:
2. Marketing and sales of live seafood. Consists of marketing and sales of live seafood (e.g., fish, prawns and eels), and the marketing and distribution agent of the fishery farms developed by Capital Award in China. There are two Capital Award fish or prawn farms generating revenues. We have certain subsidiaries that are or will be operated under a Sino Joint Venture Company incorporated in China to carry out fishery operations, consisting of the following:
Beef Cattle Farm DivisionTable A 1 Other Income:
Operation 1. Operation 1 is operated from Huangyuan CountyTable (Note 4.1) below shows the Gain / Loss on extinguishment of Xining City, Qinghai Province by SJAP, a majority owned subsidiary of the Company incorporated in China in 2009. SJAP’S principal activities that are generating revenues comprise: (i) manufacturing anddebts (or Debt Settlement) representing recent sales of organic fertilizer, (ii) manufacturingunregistered securities and sales of livestock feed, and (iii) rearing and sales of beef cattle. On February 28, 2013, SJAP completed its development of the Concentrated Livestock Feed Manufacturing Factory and started the production and sales of Contracted Livestock Feed (“CLSF”) from March 2013. Our strategy includes building and owning our own abattoir and deboning room in 2013 and the value added processing facilities in 2014.
Fertilizer Division
1. Operation 1 . Operation 1 is operated in Linli District, Hunan Province, by Hunan Shenghua A Power Agriculture Co. Ltd. China (“HSA”), a 76% owned subsidiary. HSA conducts the following business activities, both of which are in the development stage: (i) manufacturing and sales of organic and mixed fertilizer, and (ii) cultivation of pastures and crops in preparation for the establishment of beef cattle farm. On March 5, 2013, HSA secured the rights to use a well proven enzyme that, when applied to our organic fertilizer, converts part of the organic raw material into potash and phosphate without having to add chemically formulated potash and phosphate, such that our end fertilizer can be qualified as pure organic fertilizer made with 100% natural organic raw materials. Sales of pure organic fertilizer commenced during the fourth week of March, 2013.
2. Operation 2. Operation 2 has two sub-divisions:
Hylocereus Undatus (“HU”) Plantation Division
Jiang Men City Heng Sheng Tai Agriculture Development Co. Ltd. (“JHST”), an SJVC that is 75% owned by MEIJI, is consolidated as a subsidiary, and is the owner and operator of the Hylocereus Undatus Plantation (“HU Plantation”), which is situated at Enping City, Guangdong Province. JHST has two types of operations: (i) growth and sales of HU flowers; and (ii) drying and value added processing and sales of HU flower products.
SIAF/Corporate
Since the fourth quarter of 2012 the Company has generated income from the following business operations to supplement its shared services operations’ working capital annual budget:
(1) The wholesale and distribution facilities development project including design, construction and project management of its specialist modern beef wholesale and distribution center (“Wholesale Center 2”) for GCAPNT, an unrelated Chinese third party owned company situated at the Guangzhou City, LiWan District, New Wholesale Market.
(2) The Central Kitchen and related facilities development project including design, construction and project management of its business operations for Guangzhou City Wangxiangcheng (“WXC”).
(3) The Restaurants development project including design, construction and project management of its business operations for WXC.
(4) The construction of a trading complex for the import and export trades of the Company itself, at another building adjacent to Wholesale Center 1 and Wholesale Center 2 (collectively, the “Trading Center ”).
(5) The import and export trading operation.
We believe that our 5-year plan envisioning a synergistic melding of pre-wholesale, wholesale, distribution and retail activities are on track.
Consolidated Results of Operations
Part A. Consolidated Results of Operations for the three months ended June 30, 2013 compared to the three months ended June 30, 2012
Revenue
Revenue increased by $29,052,042 (or 114.61%) to $54,400,329 for the three months ended June 30, 2013 from $25,348,287 for the three months ended June 30, 2012. The increase was primarily due to the natural growth of revenue generated from our fishery, plantation, beef, organic fertilizer, cattle farm, beef and corporate and others operations and the maturity of on-going divisional businesses improving their revenues.
The following chart illustrates the changes by category from the three months ended June 30, 2013 compared to the three months ended June 30, 2012.
| Revenue | ||||||||||||
| 2013 | 2012 | |||||||||||
| Category | Q2 | Q2 | Difference | |||||||||
| $ | $ | $ | ||||||||||
| Fishery | 17,904,106 | 15,799,765 | 2,104,341 | |||||||||
| Plantation | 3,554,986 | 2,081,863 | 1,473,123 | |||||||||
| Beef | 7,328,071 | 2,170,154 | 5,157,917 | |||||||||
| Organic fertilizer | 9,618,307 | 1,781,966 | 7,836,341 | |||||||||
| Cattle farm | 6,421,161 | 3,514,539 | 2,906,622 | |||||||||
| Corporate and others | 9,573,698 | - | 9,573,698 | |||||||||
| Total | 54,400,329 | 25,348,287 | 29,052,042 | |||||||||
Fishery : Revenue from fishery increased by $2,104,341 (or 13.32%) to $17,904,106 for the three months ended June 30, 2013 from $15,799,765 for the three months ended June 30, 2012. The increase was primarily due to our increased contract service income from fishery, WSC 1 and prawn development contracts and sale of fish for the three months ended June 30, 2013 versus consulting income and sale of fish for the three months ended June 30, 2012.
Plantation : Revenue from plantation of flowers increased by $1,473,123 (or 70.76%) to $3,554,986 for the three months ended June 30, 2013 from $2,081,863 for the three months ended June 30, 2012. The increase was primarily due to the increase of wholesale prices in both the fresh and dried flowers and the increase of production of flowers this season.
Beef : Revenue from beef increased by $5,157,917 (or 237.68%) to $7,328,071 for the three months ended June 30, 2013 from $2,170,154 for the three months ended June 30, 2012.The increase was primarily due to our increase of cattle grown on the farms.
Organic fertilizer : Revenue from organic fertilizer increased by $7,836,341 (or 439.76%) to $9,618,307 for the three months ended June 30, 2013 from $1,781,966 for the three months ended June 30, 2012. The increase was primarily due to the new production plants at HSA increasing its sales and production of fertilizer.
Cattle farm : Revenue from the cattle farm increased by $2,906,622 (or 82.70%) to $6,421,161 for the three months ended June 30, 2013 from $3,514,539 for the three months ended June 30, 2012. The increase was primarily to the increase of sales due to the increase of cattle being grown in the Cattle Farm 1.
Corporate and others : Revenues from corporate and others for the three months ended June 30, 2013 increased by $9,537,638 from $0 for the three months ended June 30, 2012. The increase is due primarily to the increase of consulting and services being contracted and the increase of sales through trading of the imported frozen and fresh seafood for the three months ended June 30, 2013.
Cost of Goods Sold
Cost of goods sold increased by $23,219,843 (or 196.94%) to $35,009,882 for the three months ended June 30, 2013 from $11,790,039 for the three months ended June 30, 2012. The increase was primarily due to the Company increasing its scale of operations in terms of our fishery, plantation, beef, organic fertilizer, cattle farm, beef and corporate and others for three months ended June 30, 2013 as compared to the three months ended June 30, 2012.
The following chart illustrates the changes by category from the three months ended June 30, 2013 to three months ended June 30, 2012.
| Cost of Goods Sold | ||||||||||||
| 2013 | 2012 | |||||||||||
| Category | Q2 | Q2 | Difference | |||||||||
| $ | $ | $ | ||||||||||
| Fishery | 13,773,395 | 6,592,310 | 7,181,085 | |||||||||
| Plantation | 1,260,957 | 558,348 | 702,609 | |||||||||
| Beef | 5,852,877 | 2,667,740 | 3,185,137 | |||||||||
| Organic Fertilizer | 5,040,172 | 1,063,207 | 3,976,965 | |||||||||
| Cattle farm | 3,315,692 | 908,434 | 2,407,258 | |||||||||
| Corporate and others | 5,766,789 | - | 5,766,789 | |||||||||
| Total | 35,009,882 | 11,790,039 | 23,219,843 | |||||||||
Fishery : Cost of goods sold from fishery increased by $7,181,085 (or 108.93%) to $13,776,395 for the three months ended June 30, 2013 from $6,592,310 for the three months ended June 30, 2012. The increase was primarily due to an increase in the sales relating to the increase in volume of fish production of our fish farms for the three months ended June 30, 2013 compared to the three months ended June 30, 2012.
Plantation : Cost of goods sold from plantation of flowers increased by $702,609 (or 125.84%) to $1,260,957 for the three months ended June 30, 2013 from $558,348 for the three months ended June 30, 2012. The increase was primarily due to cost increases in farm labor, logistics and associated general overhead of operation due to the related increase in sales.
Beef : Cost of goods sold from beef increased by $3,185,137 (or 119.39%) to $5,852,877 for the three months ended June 30, 2013 from $2,667,740 for the three months ended June 30, 2012.The increase was primarily due to the increased sales volume of cattle, which led to a corresponding increase in the cost of sales.
Organic fertilizer : Cost of goods sold from organic fertilizer increased by $3,976,965 (or 374.05%) to $5,040,172 for the three months ended June 30, 2013 from $1,063,207 for the three months ended June 30, 2012. The increase was primarily due to the related increase of sales.
Cattle farm : Cost of goods sold from cattle farm increased by $2,407,258 (or 264.99%) to $3,315,692 for the three months ended June 30, 2013 from $908,434 for the three months ended June 30, 2012. The increase primarily was due to the increase of cattle being grown and sold by the Cattle Farm 1 for the three months ended June 30, 2013.
Corporate and others : Cost of sales for the three months ended June 30, 2013 increased by $5,766,789 from $0 for the three months ended June 30, 2012. The increase is due primarily to the corresponding increase of sales and trades and consulting services for the three months ended June 30, 2013.
Gross Profit
Gross profit increased by $5,832,199 or 43.02% to $19,390,447 for the three months ended June 30, 2013 from $13,558,248 for the three months ended June 30, 2012. The increase was primarily due to the corresponding increases in revenues from our plantation, beef, organic fertilizer, cattle farm and beef and corporate and others operations.
The following chart illustrates the changes by category from the three months ended June 30, 2013 compared to the three months ended June 30, 2012.
| Gross profit | ||||||||||||
| 2013 | 2012 | |||||||||||
| Category | Q2 | Q2 | Difference | |||||||||
| $ | $ | $ | ||||||||||
| Fishery | 4,130,711 | 9,207,455 | (5,076,744 | ) | ||||||||
| Plantation | 2,294,029 | 1,523,515 | 770,514 | |||||||||
| Beef | 1,475,194 | 846,799 | 628,395 | |||||||||
| Organic fertilizer | 4,578,135 | 1,106,947 | 3,471,188 | |||||||||
| Cattle farm | 3,105,469 | 873,532 | 2,231,937 | |||||||||
| Corporate and others | 3,806,909 | - | 3,806,909 | |||||||||
| Total | 19,390,447 | 13,558,248 | 5,832,199 | |||||||||
Fishery : Gross profit of the fishery decreased by $4,130,711 (or 55.13%) to $4,130,711 for the three months ended June 30, 2013 from $9,207,455 for the three months ended June 30, 2012. The decrease was primarily due to (i) part of the sales from fishery segment was reallocated to a new segment marked “Corporate and others” amounting to $3,806,909 and (ii) the decrease of the Gross Profit by $1,269,835 for the three months ended June 30, 2013 was due primarily to the decrease in the sales prices of sleepy cod fish dropping from $27/kg during the three months ended June 30, 2012 to $15.3/Kg during the three months ended June 30, 2013.
Plantation : Gross profit from the plantation increased by $770,514 (or 50.57%) to $2,294,029 for the three months ended June 30, 2013 from $1,523,515 for the three months ended June 30, 2012. The increase was due mainly to the increase of wholesale prices both on dried and fresh flowers and the increase of production of flowers.
Beef : Gross profit from beef increased by $628,395 (or 74.21%) to $1,475,194 or for the three months ended June 30, 2013 from $846,799 for the three months ended June 30, 2012 which was due primarily to the natural growth of operation.
Organic fertilizer : Gross profit from organic fertilizer increased by $3,471,188 (or 313.58%) to $4,578,135 for the three months ended June 30, 2013 from $1,106,947 for the three months ended June 30, 2012. The increase was primarily due to the increase of fertilizer sales by HSA’s new production factory.
Cattle farm : Gross profit from cattle farm development increased by $2,231,937 (or 255.51%) to $3,105,469 for the three months ended June 30, 2013 from $873,532 for the three months ended June 30, 2012. The increase was primarily due to the increase in the number of cattle being grown and sold by Cattle Farm 1 during the three months ended June 30, 2013.
Corporate and others: Gross profit from the corporate and others increased by $3,806,909 for the three months ended June 30, 2013 from $0 for the three months ended June 30, 2012; the increase was due primarily to the fact that part of the Fishery segment’s sales in consulting service and trading of fish sales were reallocated to this segment for the three months ended June 30, 2013.
General and Administrative Expenses and Interest Expenses
General and administrative expenses (including depreciation and amortization) decreased by $1,127,374 to $1,663,262 for the three months ended June 30, 2013 from $2,735,677 for the three months ended June 30, 2012. The decrease was primarily due to the decrease in wages and salaries payments paid as incentive compensation to our staff by the issuance of shares amounting to $666,778 for the three months ended June 30, 2012 compared to $90,600 for the three months ended June 30, 2013 and included in the miscellaneous were payments for overseas professional servicesQ3 of $781,684 for the three months ended June 30,2012 whereas payments for overseas professional services were billed under Office and corporate expenses instead of miscellaneous for the three months ended June 30, 2013.
The following chart illustrates the changes by category from the three months ended June 30, 2013 compared to the three months ended June 30, 2012.2014:
| Category | 2013 Q2 | 2012 Q2 | Difference | |||||||||
| $ | $ | $ | ||||||||||
| Office and corporate expenses | 590,182 | 309,685 | 280,497 | |||||||||
| Wages and salaries | 375,374 | 918,205 | (542,831 | ) | ||||||||
| Traveling and related lodging | 20,513 | 8,119 | 12,394 | |||||||||
| Motor vehicles expenses and local transportation | 44,257 | 16,750 | 27,507 | |||||||||
| Entertainments and meals | 36,832 | 35,519 | 1,313 | |||||||||
| Others and miscellaneous | 77,827 | 897,586 | (819,759 | ) | ||||||||
| Depreciation and amortization | 463,319 | 549,814 | (86,495 | ) | ||||||||
| Sub-total | 1,608,304 | 2,735,677 | (1,127,374 | ) | ||||||||
| Interest expenses | 54,958 | - | 54,958 | |||||||||
| Total | 1,663,262 | 2,735,677 | (1,072,416 | ) | ||||||||
Depreciation and Amortization
Depreciation and Amortization increased by $56,088 (or 6.13%) to $970,023 for the three months ended June 30, 2013 from $913,935 for the three months ended June 30, 2013. The increase was primarily due to the increase of depreciation by $206,066 to $331,596 for the six months ended June 30, 2013 from depreciation of $125,530 for the three months ended June 30, 2012, and the decrease of amortization by $149,978 to $638,427 for three months ended June 30, 2013 from amortization of $788,405 for the three months ended June 30, 2012.
In this respect, total depreciation and amortization amounted to $970,023 for the three months ended June 30, 2013, out of which amount, $463,319 was booked under General and administration expenses and $506,704 was booked under cost of goods sold; whereas total depreciation and amortization was at $913,935 for the three months ended June 30, 2012 and out of which amount, $549,814 was booked under General and Administration expenses and $364,121 was booked under cost of goods sold.
Gain on extinguishment of debts
The Company entered into several agreements with third parties to settle debts by issuance of the Company’s common stock. The shares issued by the Company were valued at the trading price of the stock on the date the shares were issued. For the three months ended September 30 2014, the Company issued an aggregate of 7,930,179 shares of Common Stock for (i) in consideration for extinguishment of debt in the aggregate amount of $2,431,374 for the issuance of 5,930,179 shares, reporting gain as income of $33,693 from the extinguishment of debts and (ii) for settlement of consulting and service fee in aggregate amount of $1,500,000 for the issuance of 2,000,000 shares for the services rendered in successfully procuring the private placement note issued on August 29, 2014.
During the last three years, we have issued unregistered securities to Chinese persons none of them residents of the United States. None of these transactions involved any underwriters, underwriting discounts or commissions, or any public offering. The Companysales of these securities were, except as set forth below, deemed to be exempt from the registration requirements of the Securities Act of 1933 by virtue of Section 4(a)(2) thereof, and/or Rule 506 of Regulation D promulgated there under, as transactions by an issuer not involving a public offering. The recipients of securities in each transaction represented their intention to acquire the securities for investment only and not with a view to or for sale in connection with any distribution thereof and appropriate legends were affixed to the certificates issued in such transactions. All purchasers of our securities were accredited or sophisticated persons and had adequate access, through employment, business or other relationships, to information about us.
| Date | Shares issued/Bought back | Market price when issued ($) | Additional paid in capital | Consideration received | Income from issuance of shares | Note | ||||||||||||||||
| As of July 1, 2014 | 16,181,620 | 101,547,572. | ||||||||||||||||||||
| 7/15/2014 | 220,282 | 3.96 | 870,136 | 894,125. | 21,808 | Debt settlement | ||||||||||||||||
| 8/12/2014 | 120,041. | 3.96 | 474,176 | 487,249. | 11,885. | Debt settlement | ||||||||||||||||
| 8/22/2014 | 258,684. | 4.06 | 1,047,439. | 1,050,000. | - | Debt settlement | ||||||||||||||||
| 9/16/2014 | 202,020 | 7.43 | 1,498,000 | 1,500,0000 | - | Professional Services | ||||||||||||||||
| As of September 30, 2014 | 16,982,648 | 105,437,323 | 3,931,374. | 33,693 | ||||||||||||||||||
We relied upon Regulation S of the Securities Act of 1933, as amended, for the above issuances, none of which was made to US citizens or residents. We believe that Regulation S was available because:
The other income for Q3 2014 amounted to $(17,599) and derived from the combination of (1) Gain on extinguishment of debt $33,693 (Note 4), Government Grant $57,340 and other income $155,032 less interest expenses of $263,664. Whereas the other income for Q3 2013, and derived from the combination of (1) Gain on extinguishment of debt $160,997 (Note 4), Government Grants $343,481 and other income $41,264 less interest expenses of $286,376.
| - 28 - |
Gain (loss) of extinguishment of debts
Any deficit (excess) of the fair value of the shares over the carrying cost of the debt has been reported $498,025 and $562,361 as a gain (loss) on the extinguishment of debtsdebt of $33,693 and $160,997 has been credited (charged) to operations for the three months ended JuneSeptember 30, 20132014 and 2012,2013, respectively.
Part B.Consolidated ResultsNote (5) to Table A 1 General and Administrative Expenses and Interest Expenses:
General and administrative and interest expenses (including depreciation and amortization) increased by $1,544,808 or 67% from $2,313,365 for Q3 2013 to $3,858,173 for Q3 2014. The increase was primarily due to increase in office and corporate expenses of Operations$1,303,949 from $657,741 for Q3 2014 for Q3 2013 to $1,961,690 for Q3 2014, and the increase in others and miscellaneous of $185,139 from $259,626 for Q2 2013 to $444,765 for Q3 2014.
Table (to Note 5)
| Category | 2014Q3 | 2013Q3 | Difference | |||||||||
| $ | $ | $ | ||||||||||
| Office and corporate expenses | 1,961,690 | 657,741 | 1,303,949 | |||||||||
| Wages and salaries | 486,172 | 447,717 | 38,455 | |||||||||
| Traveling and related lodging | 20,647 | 19,332 | 1315 | |||||||||
| Motor vehicles expenses and local transportation | 48,635 | 47,704 | 931 | |||||||||
| Entertainments and meals | 33,030 | 34,384 | (1,354 | ) | ||||||||
| Others and miscellaneous | 444,765 | 259,626 | 185,139 | |||||||||
| Depreciation and amortization | 599,570 | 560,485 | 39,085 | |||||||||
| Sub-total | 3,594,509 | 2,026,989 | 1,567,520 | |||||||||
| Interest expense | 263,664 | 286,376 | (22,712 | ) | ||||||||
| Total | 3,858,173 | 2,313,365 | 1,544,808 | |||||||||
Note (6) to Table A 1 Depreciation and Amortization:
Depreciation and amortization increased by $349,282 or 41% to $1,199,182 for Q3 2014 from $849,900 for Q3 2013.The increase was primarily due to the increase of depreciation by $280,037 to $636,774 for Q3 2014 from depreciation of $356,737 for Q3 2013 whereas the decrease of amortization by $69,245 to $562,408 for Q3 2014 from amortization of $493,163 for Q3 2013.
In this respect, total depreciation and amortization amounted to $1,199,182 for Q3 2014, out of which amount $599,570 was reported under general and administration expenses and $599,612 was reported under cost of goods sold; whereas total depreciation and amortization was at $849,900 for Q3 2013 and out of which amount $560,485 was reported under General and Administration expenses and $289,415 was reported under cost of goods sold.
Note (7) to Table A 1 Non-controlling interests:
Table (F) below shows the derivation of non-controlling interest
| Names of intermediate holding company subsidiaries | Capital Award Inc. (Belize) | Macau EIJI Company Ltd. (Macau) | A Power Agro Agriculture Development (Macau) Ltd. | Tri-way Industries Ltd.(HK) | Total | |||||||||||||||||||||||
| Abbreviated names | CA | (MEIJI) | (APWAM) | (TRW) | ||||||||||||||||||||||||
| % of equity holding on below subsidiaries (in China) | NA | 75 | % | 75 | % | 26 | % | 45 | % | 75 | % | |||||||||||||||||
| Name of China subsidiaries | None | Jiangmen City Heng Sheng Tai Agriculture Development Co. Ltd.(China) | Jiangmen City Hang Mei Cattle Farm Development Co. Ltd.(China) | Qinghai Sanjiang A Power Agriculture Co. Ltd. (China) | Qing Hai Zhong He Meat product Co. Ltd (China) | Jiangmen City A Power Fishery Development Co. Ltd. (China) | ||||||||||||||||||||||
| Abbreviated names | (JHST) | (JHMC) | (HSA) | (SJAP) | (QZH) | (JFD) | ||||||||||||||||||||||
| Hunan Shanghua A Power Agriculture Co. Ltd (China | 50 | % | ||||||||||||||||||||||||||
| Net income of the P.R.C. subsidiaries for the period ended 30. Sept. 2014 in $ | $ | 3,418,943 | $ | 687,832 | $ | 1,759,083 | $ | 6,083,044 | $ | 2,123,246 | $ | 1,681,445 | ||||||||||||||||
| Equity % of non-controlling interest | 25 | % | 25 | % | 24 | % | 55 | % | 55 | % | 25 | % | ||||||||||||||||
| Non-controlling interest's shares of Net incomes in $ | $ | 854,736 | $ | 171,958 | $ | 422,180 | $ | 3,345,674 | $ | 1,167,785 | $ | 420,361 | $ | 6,382,694 | ||||||||||||||
The Net Income attributed to non-controlling interest is $6,382,694 shared by (JHST, JHMC, HSA, SJAP, QZH and JFD collectively) for Q3 2014 as shown in Table (F) above.
| - 29 - |
Note (8) to Table A 1 Earnings per shares (EPS):
Earnings per share decreased by $0.03 (basic) and $0.01(diluted) per share from EPS of $1.49 (basic) and $1.43 (diluted) Q3 2013 to EPS of $1.52 (basic) and $1.44 (diluted) for Q3 2014. The reason for the sixincrease is primarily due to the increase of net income attributable to Sino Agro Food, Inc. and subsidiaries by $5.75 million from $18.75 million for Q3 2013 to $24.50 million for Q3 2014.
Part B. MD & A on Unaudited Consolidated Balance Sheet as of September 30, 2014 compared to December 31, 2013 (fiscal year 2013)
| Consolidated Balance sheets | September 30, 2014 | December 31, 2013 | Changes +- | Note | ||||||||||||
| $ | $ | $ | ||||||||||||||
| ASSETS | ||||||||||||||||
| Current assets | ||||||||||||||||
| Cash and cash equivalents | 4,691,157 | 1,327,274 | 3,363,883 | B | ||||||||||||
| Inventories | 37,439,892 | 8,148,203 | 29,291,689 | 9 | ||||||||||||
| Costs and estimated earnings in excess of billings on uncompleted contracts | 1,224,287 | 663,296 | 560,991 | |||||||||||||
| Deposits and prepaid expenses | 55,610,463 | 51,291,708 | 4,318,755 | 10 | ||||||||||||
| Accounts receivable | 122,773,881 | 82,057,941 | 40,715,940 | 11 | ||||||||||||
| Other receivables | 16,475,508 | 3,782,772 | 12,692,736 | |||||||||||||
| Total current assets | 238,215,188 | 147,271,194 | 90,943,994 | |||||||||||||
| Property and equipment | ||||||||||||||||
| Property and equipment, net of accumulated depreciation | 61,274,162 | 46,487,058 | 14,787,104 | 12 | ||||||||||||
| Construction in progress | 69,088,637 | 59,134,732 | 9,953,905 | 13 | ||||||||||||
| Land use rights, net of accumulated amortization | 58,995,505 | 60,705,829 | -1,710,324 | 14 | ||||||||||||
| Total property and equipment | 189,358,304 | 166,327,619 | 23,030,685 | |||||||||||||
| Other assets | ||||||||||||||||
| Goodwill | 724,940 | 724,940 | - | |||||||||||||
| Proprietary technologies, net of accumulated amortization | 11,587,564 | 12,081,470 | -493,906 | 15 | ||||||||||||
| Temporary deposit paid to entities for investments in future Sino Joint Venture companies | 41,109,708 | 41,109,708 | - | |||||||||||||
| Total other assets | 53,422,212 | 53,916,118 | -493,906 | |||||||||||||
| Total assets | 480,995,704 | 367,514,931 | 113,480,773 | |||||||||||||
| Current liabilities | 16 | |||||||||||||||
| Accounts payable and accrued expenses | 16,477,918 | 11,055,194 | 5,422,724 | |||||||||||||
| Billings in excess of costs and estimated earnings on uncompleted contracts | 3,373,432 | 3,146,956 | 226,476 | |||||||||||||
| Due to a director | 4,244,519 | 1,793,768 | 2,450,751 | |||||||||||||
| Series F shares mandatory redemption payable | 3,146,063 | - | 3,146,063 | |||||||||||||
| Other payables | 11,177,713 | 10,768,786 | 408,927 | |||||||||||||
| Short term bank loan | - | 4,100,377 | -4,100,377 | |||||||||||||
| Bonds payable | 1,725,000 | - | 1,725,000 | |||||||||||||
| Total current liabilities | 40,144,645 | 30,865,081 | 9,279,564 | |||||||||||||
| Non-current liabilities | ||||||||||||||||
| Series F shares mandatory redemption payable | - | 3,146,063 | -3,146,063 | |||||||||||||
| Bonds payable | - | 1,725,000 | -1,725,000 | |||||||||||||
| Long term debts | 2,616,610 | 180,417 | 2,436,193 | |||||||||||||
| Convertible note payable | 6,982,667 | - | 6,982,667 | 16D | ||||||||||||
| Total non-current liabilities | 9,599,277 | 5,051,480 | 4,547,797 | |||||||||||||
| Stockholders’ equity | ||||||||||||||||
| Preferred stock | ||||||||||||||||
| Series A preferred stock | - | - | - | |||||||||||||
| Series B convertible preferred stock | 7,000 | 7,000 | - | |||||||||||||
| Series F Non-convertible preferred stock | - | - | - | 17 | ||||||||||||
| Common stock | 168,128 | 137,602 | 30,526 | |||||||||||||
| Additional paid-in capital | 118,514,375 | 104,913,676 | 13,600,699 | |||||||||||||
| Retained earnings | 249,573,317 | 181,196,498 | 68,376,819 | |||||||||||||
| Accumulated other comprehensive income | 6,244,379 | 6,260,131 | -15,752 | |||||||||||||
| Treasury stock | -1,250,000 | -1,250,000 | - | |||||||||||||
| Total SIAF Inc. and subsidiaries' equity | 373,257,199 | 291,264,907 | 81,992,292 | |||||||||||||
| Non-controlling interest | 57,994,583 | 40,333,463 | 17,661,120 | |||||||||||||
| Total stockholders' equity | 431,251,782 | 331,598,370 | 99,653,412 | |||||||||||||
| Total liabilities and stockholders' equity | 480,995,704 | 367,514,931 | 113,480,773 | |||||||||||||
| - 30 - |
This Part B discusses and analyzes certain items (marked with notes) that we believe would assist stakeholders in obtaining a better understanding on the Company’s results of operations and financial condition:
Note (B) Cash and Cash Equivalents
The change in cash and cash equivalent of $3,363,883 derived from cash and cash equivalent of $4,691,157 and $1,327,274 as of September 30, 2014 and December 31, 2013, respectively. In this respect it is a regular situation for cash & cash equivalent to get back into its normal pattern after the irregular pattern incurred due to seasonal impacts at the end of the year.
Note (9) Break down on Inventories:
| September 30, 2014 | December 31, 2013 | Difference | ||||||||||
| $ | $ | $ | ||||||||||
| Sleepy cods, prawns, eels and marble goble | 4,935,062 | 1,761,111 | 3,173,951 | |||||||||
| Harvested HU plantation | 719,329 | -719,329 | ||||||||||
| Bread grass | 3,337,428 | 580,954 | 2,756,474 | |||||||||
| Beef cattle | 5,850,305 | 1,951,962 | 3,898,343 | |||||||||
| Organic fertilizer | 3,094,379 | 895,670 | 2,198,709 | |||||||||
| Forage for cattle and consumable | 3,591,769 | 684,979 | 2,906,790 | |||||||||
| Raw materials for bread grass and organic fertilizer | 13,411,046 | 855,493 | 12,555,553 | |||||||||
| Beef and mutton | 2,213,890 | - | 2,213,890 | |||||||||
| Immature seeds | 1,003,013 | 698,704 | 304,309 | |||||||||
| 37,436,892 | 8,148,203 | 29,288,689 | ||||||||||
Note (10) Breakdown of Deposits and Prepaid Expenses:
Note (10.1):
| September 30, 2014 | December 31, 2013 | Difference | ||||||||||
| $ | $ | $ | ||||||||||
| Deposits for | ||||||||||||
| - purchases of equipment | 4,372,776 | 4,886,048 | -513,272 | |||||||||
| - acquisition of land use right | 7,826,508 | 7,826,508 | 0 | |||||||||
| - inventory purchases | 7,693,099 | 9,776,383 | 2,083,284 | |||||||||
| - aquaculture contract | 9,404,067 | - | 9,404,067 | |||||||||
| - building materials | 877,598 | 1,281,935 | -404,337 | |||||||||
| - proprietary technology | - | 4,404,210 | 4,404,210 | |||||||||
| - construction in progress | 23,021,316 | 23,021,316 | 0 | |||||||||
| Shares issued for employee compensation and overseas professional fee | 2,415,099 | 100,308 | 2,314,791 | |||||||||
| Temporary deposits paid to entities for investments in future Sino Foreign Joint Venture companies | 41,109,708 | 41,109,708 | 0 | |||||||||
| 96,720,171 | 92,406,416 | 4,313,755 | ||||||||||
| - 31 - |
Note (10.1) Breakdown of Deposit for- acquisition of Land Use Right:
As of September 30, 2014, we have $77,826,508 for a deposit paid for the acquisition of a Land Use Right (“LUR”) derived from the following transactions:
$3,182,180 (or RMB20,000,000) was full payment made on June 6, 2012 for Land Use Right by HSA comprising a block of land measuring 150 Mu (or 25 acres of prime agriculture land) located at Linli District of Hunan Province within 10 Km of HSA’s complex. The process of application to register the said “Land Use Right” is in progress, and, as such, this payment is recorded as Deposit and Prepaid Expenses pending final authority estimated to be granted on or before September 30, 2014, as the new local ordinances on agriculture land delayed the processing of our application. Due to the delay in approving the LUR of the said block of land, HSA has revised and supplemented the contract of said land by a leasing agreement until such time, the said official approval will be granted, and in the interim, the deposit and pre-payment on said land would be treated as a rent-to-own lease arrangement providing pre-payment toward said land once approval is granted.
$190,930 (or RMB1,200,000) was paid by SJAP as deposit for the acquisition of “Land Use Right” on a block of land measuring 15 Mu (or 2.475 acres) located at Huangyuan district next to SJAP’s complex on October 15, 2012. The process of rezoning this piece of land to residential (at present, agriculture) continues, and once completed will be transferred from the Local Government (Huangyuan County) to SJAP to build new staff quarters.
$4,453,398 (or RMB 27,989,606) was the full payment by Capital Award for the purchase of the Land Use Right on a block of prime agriculture land measuring 235 Mu (or 38.5 acres) located at the Cong Hua District Guangzhou City in late October 2010. This block of land is part of a larger block of land (of some 500 acres) which is under a subdivision application. However in 2011, the Land Law changed such that the said sub-division now requires the approval of the Central Government in Beijing, which means approval process is lengthened. Cong Hua District was rezoned as a suburb of the Guangzhou City in 2010 and within close proximity of the Guangzhou City and Management considers it as a valuable piece of land very suitable for the development of one of our agriculture projects. Our agreement with the Vendor requires that they use best efforts to speed up the said subdivision’s approval on or before June 30 2014, failing which they would replace the said land with another block of land to our satisfaction., In lieu of the land swap arrangement just mentioned, the Company has negotiated with the Vendor to be compensated $1 million since the Central Government approval remains pending as of September 30, 2014, which is scheduled to be paid on or before December 31, 2014.
Note (10.2) Information of “Temporary deposit and pre-payments for investments in future assets and in future Sino Foreign Joint Venture companies”:
| Under account of | Estimated total | Estimated time | Current status | Deposit & prepayments made as of September 30, | Land Bank | % equivalent | ||||||||||||||||
| Subsidiary | Segment of | Project name | Asset value | of Acquisition | of Project | 2014 | or Built Up area | to equity paid | ||||||||||||||
| $ | $ | m2 | ||||||||||||||||||||
| SIAF | Corporate | Trade Center | 3.5 million | own development | 30% completed | 4,086,941 | 5,000 | 31 | % | |||||||||||||
| Seafood Center | 1,032,914 | |||||||||||||||||||||
| CA | Fishery | Fish Farm (1) | 26.22 Million | 2016 | 2 out 4 phases completed | 6,000,000 | 23,100 | 23 | % | |||||||||||||
| Prawn Farm (1) | 20.93 Million | 2014 | in operation | 14,554,578 | 165,000 | 56 | % | |||||||||||||||
| Prawn Farm (2) | 29.18 Million | 2014 | Part operational Part work in progress | 9,877,218 | 120,000 developed 96,000 m2 undeveloped | 29 | % | |||||||||||||||
| MEIJI | Cattle | Cattle Farm (2) | 15.88 Million | 2014 | 95% completed | 5,558,057 | 230,300 | 35 | % | |||||||||||||
| 41,109,708 |
During this quarter the Company has not paid further deposit and prepayment for investments in future assets and in future Sino Foreign Joint Venture companies; as such, there is no change in this respect.
| - 32 - |
Note (11): Breakdown of Accounts receivable:
| September 30,2014 | over 120 days and | |||||||||||||||||||
| Accounts receivable | 0-30 days | 31-90 days | 91-120 days | less than 1 year | ||||||||||||||||
| $ | $ | $ | $ | $ | ||||||||||||||||
| Consulting and Service totaling | ||||||||||||||||||||
| CA | 21,779,206 | 21,779,206 | - | - | - | |||||||||||||||
| MEIJI | 4,352,293 | - | - | - | 4,352,293 | |||||||||||||||
| SIAF | 5,653,426 | - | 5,653,426 | - | - | |||||||||||||||
| Sales of Live Fish, eels and prawns (from Farms) (CA) | 14,532,324 | 14,532,324 | - | - | - | |||||||||||||||
| Sales of imported seafood (SIAF) | 7,090,129 | 7,090,129 | - | - | - | |||||||||||||||
| Sales of Cattle and Beef Meats (from Enping Farm) (MEIJI) | 12,472,160 | 5,479,701 | 2,254,887 | 4,737,572 | - | |||||||||||||||
| Sales of HU Flowers (Fresh & Dried) (JHST) | 10,943,896 | 2,427,678 | 3,383,155 | 1,656,844 | 3,476,220 | |||||||||||||||
| Sales Fertilizer, Bulk Stock feed and Cattle by (SJAP) | 31,051,474 | 7,333,436 | 14,455,842 | 7,940,308 | 1,321,888 | |||||||||||||||
| Sales Fertilizer from (HSA) | 9,761,599 | 2,061,234 | 3,730,104 | 1,711,178 | 2,259,084 | |||||||||||||||
| Sales of Live Fish (JFD) | 35,850 | - | - | - | 35,850 | |||||||||||||||
| - | - | - | - | |||||||||||||||||
| Sales of Beef (QZH) | 5,101,524 | 4,210,875 | 890,045 | 604 | - | |||||||||||||||
| Total | 122,773,881 | 64,914,582 | 30,367,458 | 16,046,506 | 11,445,335 | |||||||||||||||
Information on trading terms and provision for diminution in value of accounts receivable:
Our accounts receivable ageing is less than 12 months old. Receivables from revenue derived from consulting and services billed for work completed are within our normal trading terms of 180 days and therefore no diminution in value is required, as the credit quality of receivable is not in doubt.
Fish Sales: Most farmed fish are sold to wholesalers at prevailing daily market prices and ageing is within 90 days trading terms with a small portion at 180 days (for oversized fish, as the sale of oversized fish takes time to sell). We sold $23 million in live fish, eels and prawns (live seafood) to the wholesalers for the three months ended JuneSeptember 30, 2014 and as of September 30, 2013, accounts receivable of $ 0 was over 120 days. These debtors represent credit quality receivables as they are well established wholesalers, profitable and viable businesses with a good track record and therefore provision of diminution in value is not required as collection is not in doubt.
Sales of fertilizer and bulk livestock feed: These comprise sales made to regional farmers contracted by us to grow crops and pastures using and purchasing our fertilizer. We in turn agree to buy their cattle that are fed with our bulk and concentrated cattle feed purchased from us. Under this term of arrangements our accounts receivable are normally carried forward until such time they can be offset against our account payables due to these contracted farmers(that is, the amount owed for the amount of crops and pastures is ultimately offset against the amount of cattle that we have purchased from them, respectively). As these debtors are our contract farmers and operate profitable and viable businesses with us and have a good track record we consider their credit quality to be good and collection from them is not in doubt, thus no diminution in value is required.
Information on Concentration of credit risk of account receivables:
We have 4 major long-term customers (referring to Customer A, B, C and D mentioned in the Financial Statements of this prospectus), who have accounted for 63.01% of our consolidated revenues for Q3 2014 as shown in the table below:
| Three months ended September 30, 2014 | ||||||||||||
| % of total Revenue | $ | Total Revenue | ||||||||||
| Customer A | 24.57 | % | 26,339,173 | |||||||||
| Customer B | 15.78 | % | 16,914,528 | |||||||||
| Customer C | 14.33 | % | 15,361,990 | |||||||||
| Customer D | 8.33 | % | 8,931,618 | |||||||||
| 63.01 | % | 67,547,309 | ||||||||||
| - 33 - |
Customer A is Guangzhou City A Power NaWei Trading Co. Ltd (“APNW”). In respect of the project for WSC1, CA was the consulting engineer responsible for the construction of this project and development of its business operation via a Consulting and Service Contract granted by APNW. APNW is now one of our main wholesalers, and to which we bill our sales of seafood (including live and frozen seafood). APNW distributes the seafood to other wholesalers in various cities in China. WSC 1 is ideally situated at the center of all interprovincial logistic services. At the same time, APNW has obtained all relevant Import Quotas and Permits by September 30, 2013. As such, SIAF relies on APNW’s import permits for its import and export trades to be carried out in China. Sales effected through WSC 1 contributes 24.57% of our total consolidated revenue, which is equivalent to $26,339,173 out of our total revenue of $107,220,059 derived collectively from the following segments of activities:
| Customer A | Three months ended September 30, 2014 | |||||||||||||
| with Name of company | Segments | Operation Division | Abbreviation name | % of total consolidated Revenue | Amount in $ | |||||||||
| CA | Fishery | Sales of fish (from Fish Farm 1) | Wholesale Center (1) | 6.02 | % | 6,457,870 | ||||||||
| Sales of fish / eels from Contract Growers | 6.31 | % | 6,770,173 | |||||||||||
| SIAF | Corporate | Trading sales of seafood, beef & mutton | 12.23 | % | 13,111,130 | |||||||||
| 24.57 | % | 26,339,173 | ||||||||||||
Customer B is one of our main agents, namely Mr. Li Hongzhen who distributes SJAP’s organic fertilizer, bulk livestock feed and concentrated livestock feed to our cooperative farmers and other regional farmers. During Q3 2014, Mr. Li had transacted 15.78% of our total consolidated revenue (equivalent to $16,914,528 out of our total revenue of $107,220,059 derived from the sale of SJAP’s organic fertile, bulk livestock feed and concentrated livestock feed under the segment of Organic Fertilizer and Bread Grass.
Customer C is one of our main agents, namely Mr. Xian Zhiming (Zhongshan new prawn farm) who we agreed to extend trading terms between 120 days to 180 days in the interim until such time as we assist them to procure a project loan of up to $60 million targeting on or before September 30, 2014.
Customer D is Cattle Wholesale represented by Mr. Zhen Runchi who buys our fattened cattle to sell them in the Guangdong and Beijing cattle markets and at the same time supplies to us with young cattle. During Q3 2014, transactions through Mr. Zhen Runchi generated 8.33 % of our total consolidated revenue (equivalent to $8,931,638 out of our total revenue of $107,220,059.
The Company had 4 major customers whose accounts receivable balance individually represented the following percentages of the Company’s total accounts receivable during Q3 2014:
| September 30, 2014 | Total | |||||||||||
| % of total Accounts receivables | amount in $ | Accounts receivables | ||||||||||
| Customer A | 19.22 | % | 23,600,631 | |||||||||
| Customer B | 11.32 | % | 13,901,362 | |||||||||
| Customer C | 6.73 | % | 8,262,682 | |||||||||
| Customer D | 6.30 | % | 7,734,588 | |||||||||
| 43.57 | % | 53,499,263 | ||||||||||
Note (12) Property and equipment, net of accumulation depreciation:
| September 30, 2014 | ||||
| $ | ||||
| Plant and machinery | 5,344,326 | |||
| Structure and lease hold improvements | 49,841,748 | |||
| Mature seeds and herbage cultivation | 9,234,439 | |||
| Furniture and equipment | 393,411 | |||
| Motor vehicles | 765,858 | |||
| 65,579,782 | ||||
| Less: Accumulated depreciation | (4,305,620 | ) | ||
| Net carrying amount | 61,274,162 | |||
| - 34 - |
Note (13) Construction in progress:
| September 30, 2014 | ||||
| $ | ||||
| Construction in progress | ||||
| - Oven room , road for production of dried flowers | 276,288 | |||
| - Office, warehouse and organic fertilizer plant in HSA | 16,867,188 | |||
| - Organic fertilizer and bread grass production plant and office building | 18,009,803 | |||
| - Rangeland for beef cattle and office building | 30,690,295 | |||
| - Fish pond | 1,844,454 | |||
| - Beef and seafood distribution center | 1,400,609 | |||
| 69,088,637 | ||||
Note (14) Land Use Rights, net of accumulated amortization:
| Monthly | ||||||||||||||||||||
| Date | Expiry | amortization | 2014.09.30 | Nature of | ||||||||||||||||
| Item | Owner | Location | Acres | Acquired | Tenure | dates | Cost | $ | Balance $ | ownership | ||||||||||
| Hunan lot1 | HSA | Ouchi Village, Fenghuo Town, Linli County | 31.92 | 2011-4-5 | 43 | 2054-4-4 | 242,703 | 470 | 222,948 | Lease | ||||||||||
| Hunan lot2 | HSA | Ouchi Village, Fenghuo Town, Linli County | 247.05 | 2011-7-1 | 60 | 2071-6-30 | 36,666,141 | 50,925 | 34,680,058 | Management Right | ||||||||||
Hunan lot3 | HSA | Ouchi Village, Fenghuo Town, Linli County | 8.24 | 2011-5-24 | 40 | 2051-5-23 | 378,489 | 789 | 346,160 | Land Use Rights | ||||||||||
Guangdong
lot 1 | JHST | Yane Village, Liangxi Town, Enping City | 8.23 | 2007-8-10 | 60 | 2067-8-9 | 1,064,501 | 1,478 | 937,352 | Management Right | ||||||||||
Guangdong
lot 2 | JHST | Nandu Village of Yane Village, Liangxi Town, Enping City | 27.78 | 2007-3-14 | 60 | 2067-3-13 | 1,037,273 | 1,441 | 906,173 | Management Right | ||||||||||
Guangdong
lot 3 | JHST | Nandu Village of Yane Village, Liangxi Town, Enping City | 60.72 | 2007-3-14 | 60 | 2067-3-13 | 2,267,363 | 3,149 | 1,980,794 | Management Right | ||||||||||
Guangdong
lot 4 | JHST | Nandu Village of Yane Village, Liangxi Town, Enping City | 54.68 | 2007-9-12 | 60 | 2067-9-11 | 2,041,949 | 2,836 | 1,800,886 | Management Right | ||||||||||
Guangdong
lot 5 | JHST | Jishilu Village of Dawan Village, Juntang Town, Enping City | 28.82 | 2007-9-12 | 60 | 2067-9-11 | 960,416 | 1,334 | 847,034 | Management Right | ||||||||||
Guangdong
lot 6 | JHST | Liankai Village of Niujiang Town, Enping | 31.84 | 2008-1-1 | 60 | 2068-12-31 | 821,445 | 1,141 | 729,032 | Management Right | ||||||||||
Guangdong
lot 7 | JHST | Nandu Village of Yane Village, Liangxi Town, Enping City | 41.18 | 2011-1-1 | 26 | 2037-12-31 | 5,716,764 | 18,323 | 4,892,231 | Management Right | ||||||||||
Guangdong
lot 8 | JHST | Shangchong Village of Yane Village, Liangxi Town, Enping City | 11.28 | 2011-1-1 | 26 | 2037-12-31 | 1,566,393 | 5,020 | 1,340,471 | Management Right | ||||||||||
Guangdong
lot 9 | MEIJI | Xiaoban Village of Yane Village, Liangxi Town, Enping City | 41.18 | 2011-4-1 | 20 | 2031-3-31 | 5,082,136 | 21,176 | 4,192,762 | Management Right | ||||||||||
Qinghai
lot 1 | SJAP | No. 498, Bei Da Road, Chengguan Town of Huangyuan County, Xining City, Qinghai Province | 21.09 | 2011-11-1 | 40 | 2051-10-30 | 527,234 | 1,098 | 488,790 | Land Use Right & Building ownership | ||||||||||
Guangdong
lot 10 | JHST | Niu Jiang Town, Liangxi Town, Enping City | 6.27 | 2013-3-4 | 10 | 2023-3-4 | 489,904 | 4,083 | 412,336 | Management Right (lease) | ||||||||||
| JHST | Land improvement cost Incurred | 2013-12-1 | 3,914,275 | 6,155 | 3,852,730 | |||||||||||||||
| Exchange difference | 1,860,972 | 1,365,748 | ||||||||||||||||||
| 620 | 64,637,958 | 119,418 | 58,995,505 |
| - 35 - |
Note (15) Other Receivables
| September 30, 2014 | Note | |||||||
| $ | ||||||||
| Advanced to employees | 277,298 | |||||||
| Advanced to suppliers | 7,552,844 | 15.A | ||||||
| Advanced to sub-contractors and suppliers working on the Zhongshan New Prawn Projects | 8,645,366 | 15.B | ||||||
| 16,475508 | ||||||||
Note 15.A& B: Breakdown of Advances to Suppliers at SJAP’s operations:
At SJAP it is a common practice to make cash advances to our cooperative growers (presently standing at 100 members) who are our suppliers, to carry them through respective growing periods (for cropping or pasturing or cattle growing purposes) before final harvests of produce or sale of their cattle. On average, it works out to less than $2,442 per member, which in our management’s opinion is a normal season to season process deemed fair and equitable. In this respect, as the said average increases it means that the average cooperative farmer is increasing his productivity (whether in the growing of crops or cattle), and in simple terms, it represents good progress indicating that SJAP’s revenue is also increasing.
The sub-contractors and suppliers of the Zhongshan Projects are reputable entities that in management’s opinion are employing their funds in and are working on the Zhongshan Project, such that the project will progress smoothly.
Note (16) Current Liabilities:
| September 30, 2014 | Note | |||||||
| Current liabilities | ||||||||
| Accounts payable and accruals | 16,477,918 | 16.A | ||||||
| Billings in excess of cost and estimated earnings on uncompleted contracts | 3,373,432 | |||||||
| Series F shares mandatory redemption payable | 3,146,063 | 16.B | ||||||
| Due to a director | 4,244,519 | |||||||
| Other payables | 11,177,713 | 16.C | ||||||
| Short term bank loan | - | |||||||
| Bonds payable | 1,725,000 | |||||||
| 40,144,645 | ||||||||
| - 36 - |
Note 16A: Accounts payables and accrued expenses clarification:
Our current trading environment is limited to a number of suppliers who offer prolonged credit terms means that most purchases are paid for in cash or short credit terms (7 to 10 days), and in a way this allows us better bargaining ability to obtain cash discounts resulting in the low trade account payables balance of $16,477,918 about 15% of total sales of $107 million for the reasons stated below:
Our main Account Payables during Q3 2014 were generated from the following activities:
| 1. | We supply the following cost elements: our own staff, engineering and technology that enhanced our profit margins and reduced the overall cost of sales. Consulting and services (“C&S”) since inception is the major contributor of income to date and cost of goods sold averaging 47%,and 62%for CA and SIAF, respectively derived from its respective C&S during the fiscal year 2013. |
| 2. | Implementation, supervision, training and associated management work and most of the building sub-contractors worked at fixed costs; consequently, profit margins are contained providing ample opportunity for expanded credit terms. For contracts related to the construction of farms we use plants, equipment, parts and components that were specially manufactured and made as per our own design and engineering by local manufacturers and suppliers (who carry a high amount of initial development costs and inventories for us based on the understanding that we would pay for the deliveries of goods sold within shorter trading terms such that they could afford to carry such costs). We pay promptly in this respect and believe that, as time has passed, our track record has earned our excellent credibility with all of our suppliers and sub-contractors. |
| 3. | Fish sales started gradually in late 2011, and the cost of sales was averaged at 70% for Q3 2014, respectively (the bulk of the cost came from the supplies of baby fingerlings and the live-bait as the main fish feed), and customary trading terms of Chinese suppliers is on a cash on delivery basis, and suppliers who provide short credit terms presently is limited to no more than a select few. |
| 4. | Cattle sales at SJAP’s own cattle stations and from its cooperative farmers started in 2011 at lower profit margins compared to the sales of fish and the cost of sales was averaged at 75% for Q3 2014; it is also customary in China to pay for the young live cattle by cash on delivery. The Enping cattle farm started to buy young cattle in 2011 and started sales of mature cattle in 2012; cost of sales is averaged at 88% for Q3 2014. Most of the young cattle supplies were from small primary producers (local small farmers) who did not have great financial resources; as such we paid for these supplies of young cattle in cash on delivery or short credit term after delivery. |
| 5. | In SJAP, the bulk of our fertilizers were sold to farmers who are growing pastures and crops for us such that their fertilizer sales were kept as book entries that would be offset with the pastures and crops that we would buy back from them. In the case of HSA, which is a developing stage company in fertilizer manufacturing, prolonged credit term facilities have not been established for its purchase of raw materials. |
| 6. | Bulk livestock feed are produced by regional cooperative growers under contract to us and they use our supply of fertilizer and seeds that represented the main cost components enhancing cost of sales, which average is at 51% for Q3 2014. Again, sale of fertilizer is held on credit against crops and pasture grass purchased from them, as well as bulk livestock feed sold to them for cattle rearing, and reconciled once cattle are purchased from them. |
On August 22, 2012, the Company’s Board of Directors declared that the Company’s stockholders were entitled to receive one share of restricted Series F Non-convertible Preferred Stock for every 100 shares of Common Stock then owned by the stockholders as of September 28, 2012, with lesser or greater amounts being rounded up to the sixnearest 100 shares of Common Stock for purpose of the computing the dividend. The intended holders of record of shares of Series F Non - Convertible Preferred Stock were to be entitled to a coupon payment directly from the Company at the redemption rate of $3.40 per share and be payable on May 30, 2014. During Q1 2013, the transfer agent of the Company recorded 924,180 shares of Series F Non-Convertible preferred stock on the account. But, the Company did not issue physical shares and only issued coupons to notify respective shareholders on that date. The figure 924,180 was based on the number of shares of Common Stock (prior to the Reverse Split) as of September 28, 2012 of 91,931,287 shares, calculated at one share of Series F Non-Convertible preferred stock for every 100 shares of Common Stock with decimal numbers being rounded up to one. The recipients of the coupons were originally entitled to a coupon payment directly from the Company at the redemption rate of $3.40 per share and be payable on May 30, 2014, which date was subsequently postponed to May 30, 2015 (the “Coupon Redemption Date”). Upon the Coupon Redemption Date, holders of the coupon shall be entitled to a lump sum cash payment directly from the Company equal to $3.40 for every coupon then held (the “Redemption”). Upon proper Redemption, the Series F Preferred Stock shall terminate and thereafter cease to exist
| - 37 - |
Note (16C): Analysis of Other Payables:
As of September 30, 2014, other payables totaling $11,177,713 was composed of the following:
During Q3 2014, the Company issued promissory notes amounting to $1,771,418 to unrelated third parties for advances granted by third parties collectively to the Company (and/or to its subsidiaries) that are personally guaranteed by a director, repayable within two (2) years at interest free term. Promissory notes could be repaid either by cash or in shares of the Company or a combination thereof. If shares settled debt amounts, the respective share conversion rates will be determined by both parties at the time of settlement. During Q3 2014 we redeemed $2,431,374 of promissory notes for advances granted by third parties in fiscal year 2012 as well as in early months ended Juneof 2013 by the issuance of shares leaving a balance of $512,751 of promissory notes still due and outstanding as of September 30, 20122014.
A grant of $2,406,143 was received from the Chinese government to SJAP for the development of a certain project; however if SJAP will not be able to complete the project, it will have to repay the grant to the Government. As of September 30 2014, as work is in progress on the said project but it is not yet completed, the grant is recorded as other payables.
Other advances provided by other unrelated third parties collectively to our subsidiaries with no fixed term of repayment at interest free terms that do not have any promissory note or agreement but verbal understandings. These sums amount to $8,258,819 unpaid and outstanding as of September 30, 2014.
Note (16 D): Convertible Note:
On August 29, 2014 the Company executed a Convertible Note with Euro China AB, or ECAB, of Stockholm Sweden, pursuant to which ECAB agreed to lend to the Company up to $25 Million based on the following principal terms and conditions:
| (i) | Issuing Debt amount of $33,000,000 with a 25% discount netting loan proceeds to the Company of up to $25,000,000. | |
| (ii) | Disbursement of loan is based on 4 tranches: each tranche of $5 million on or before August 14, 2014, August 29, 2014, and November 27, 2014 with the last tranche of $18 million on or before February 28, 2015 whereas ECAB can deduct the 25% discount on the principal issuing debt amount upon each tranche of disbursements. | |
| (iii) | Tenure of 5 years | |
| (iv) | Interest Rate is at 10.5% per annum | |
| (v) | Conversion price is at $9.90 per share applicable to both principal loan amount and accrued interest at the option of ECAB. |
The Convertible Note was filed with SEC on September 5, 2014.
As of September 30, 2014, the Company has received net proceeds of $5,237,000 under the Convertible Note payable.
Part C. Nine Months Ended September 30, 2014 Compared to Nine Months Ended September 30, 2013 (presented in summarized Charts below);
RevenuesRevenue:
Revenues increased by $68,179,777 (or 164.97%)$114,964,575 or 63.8 % to $109,508,080$295,180,352 for the sixnine months ended JuneSeptember 30, 2013 from $41,328,303$180,215,777 for the sixnine months ended JuneSeptember 30, 2012.2013. The increase was primarily due to the increase of revenue generated from our fishery, plantation, beef, organic fertilizer, and cattle farm and corporate and others operations and the maturity of ongoingon-going divisional businesses improving their revenues.
| - 38 - |
The following chart illustrates the changes by category from the nine months ended September 30, 2014 to September 30, 2013.
| Revenue | ||||||||||||
| 2014 | 2013 | |||||||||||
| Category | Q1- Q3 | Q1-Q3 | Difference | |||||||||
| $ | $ | $ | ||||||||||
| Fishery | 136,968,336 | 68,826,877 | 68,141,459 | |||||||||
| Plantation | 9,085,607 | 14,089,946 | -5,004,339 | |||||||||
| Beef | 60,053,322 | 22,288,842 | 37,764,480 | |||||||||
| Organic fertilizer | 35,406,530 | 29,970,388 | 5,436,142 | |||||||||
| Cattle farm | 21,483,496 | 19,423,115 | 2,060,381 | |||||||||
| Corporate and others | 32,183,061 | 25,616,609 | 6,566,452 | |||||||||
| Total | 295,180,352 | 180,215,777 | 114,964,575 | |||||||||
Cost of goods sold and service
Cost increased by $103,976,930 or 91.9% to $199,826,657 for the nine months ended September 30, 2014 from $113,179,388 for the nine months ended September 30, 2013. The increase was primarily due to the Company increased our fishery, beef, organic fertilizer, cattle farm and corporate and others operations for nine months ended September 30, 2014 as compared to the nine months ended September 30, 2013.
The following chart illustrates the changes by category from the sixnine months ended JuneSeptember 30, 20132014 to June 30, 2012.
| Revenue | ||||||||||||
| 2013 | 2012 | |||||||||||
| Category | Q1- Q2 | Q1-Q2 | Difference | |||||||||
| $ | $ | $ | ||||||||||
| Fishery | 42,122,633 | 26,894,374 | 15,228,259 | |||||||||
| Plantation | 3,554,986 | 2,081,863 | 1,473,123 | |||||||||
| Beef | 14,123,908 | 7,445,425 | 6,678,483 | |||||||||
| Organic fertilizer | 17,700,369 | 2,183,215 | 15,517,154 | |||||||||
| Cattle farm | 14,783,718 | 2,723,426 | 12,060,292 | |||||||||
| Corporate and others | 17,222,466 | - | 17,222,466 | |||||||||
| Total | 109,508,080 | 41,328,303 | 68,179,777 | |||||||||
Fishery : Revenues from fishery increased by $15,228,259 (or 56.62%) from $26,894,373 for the six months ended June 30, 2012 to $42,122,633 for the six months ended June 30, 2013.The increase in fishery was primarily due to our increased contract service income from fishery and prawn development contract for the six months ended JuneSeptember 30, 2013.
Plantation : Revenues from plantation increased by $1,473,123 (or 70.76%) to $3,554,986 for the six months ended June 30, 2013 from $2,081,863 for the six months ended June 30, 2012. The increase in plantation was primarily due to the increase of sale of products derived from the increase of field production of flowers.
| Cost | ||||||||||||
| 2014 | 2013 | |||||||||||
| Category | Q1- Q3 | Q1-Q3 | Difference | |||||||||
| $ | $ | $ | ||||||||||
| Fishery | 87,742,912 | 45,266,534 | 42,476,378 | |||||||||
| Plantation | 2,423,811 | 6,093,751 | -3,669,940 | |||||||||
| Beef | 43,598,633 | 15,731,438 | 27,867,195 | |||||||||
| Organic fertilizer | 20,005,390 | 15,869,331 | 4,136,059 | |||||||||
| Cattle farm | 20,418,345 | 12,888,673 | 7,529,672 | |||||||||
| Corporate and others | 25,637,566 | 17,329,661 | 25,637,566 | |||||||||
| Total | 199,826,657 | 113,179,388 | 103,976,930 | |||||||||
Beef : Revenues from beef increased by $6,678,483 (or 89.70%) to $14,123,908 for the six months ended June 30, 2013 from $7,445,425 for the six months ended June 30, 2012. The increase in beef sales was primarily due to the increase of cattle being grown in the farms during the six months ended June 30, 2013.
Organic fertilizer : Revenue from organic fertilizer increased by $15,517,154 or (710.75%) to $17,700,369 for the six months ended June 30, 2013 from $2,183,215 for the six months ended June 30, 2012. The increase was due to the increase of production and sales by the new fertilizer factory of HSA.
Cattle farm : Revenues from cattle farm increased by $12,060,292 (or 442.84%) to $14,783,718 for the six months ended June 30, 2013 from $2,723,426 for the six months ended June 30, 2012. The increase in cattle farm was primarily due to the increase of cattle being grown at Cattle Farm 1 during the six months ended June 30, 2013.
Corporate and others: Revenues increased by $17,222,466 for the six months ended June 30, 2013 from $0 for the six months ended June 30, 2012. The increase is due primarily that part of the Fishery segment’s sale deriving from consulting service, and seafood trading were reallocated to the segment of “Corporate and others” during the corresponding period.Gross Profit
Cost of Goods Sold
Cost of goods soldGross profit increased by $48,838,353 (or 247.20%)$28,317,306 or 42.24% to $68,594,816$95,353,694 for the sixnine months ended JuneSeptember 30, 20132014 from $19,756,463$67,036,388 for the sixnine months ended JuneSeptember 30, 2012.2013. The increase was primarily due to the Company increased our fishery, plantation, beef, organic fertilizer, cattle farm and corporate and others operations for six months ended June 30, 2013 as compared for the six months ended June 30, 2012.
The following chart illustrates the changes by category from the six months ended June 30, 2013 to June 30, 2012.
| Cost of goods sold | ||||||||||||
| 2013 | 2012 | |||||||||||
| Category | Q1- Q2 | Q1-Q2 | Difference | |||||||||
| $ | $ | $ | ||||||||||
| Fishery | 28,354,892 | 12,090,750 | 16,264,142 | |||||||||
| Plantation | 1,260,957 | 558,348 | 702,609 | |||||||||
| Beef | 9,633,534 | 4,970,923 | 4,662,611 | |||||||||
| Organic fertilizer | 9,132,048 | 1,075,329 | 8,056,719 | |||||||||
| Cattle farm | 8,913,731 | 1,061,113 | 7,852,618 | |||||||||
| Corporate and others | 11,299,654 | 11,299,654 | ||||||||||
| Total | 68,594,816 | 19,756,463 | 48,838,353 | |||||||||
Fishery : Cost of goods sold from fishery increased by $16,264,142 (or 134.52%) to $28,354,892 for the six months ended June 30, 2013 from $12,090,750 for the six months ended June 30, 2012. The increase of cost of sales of fishery was primarily due to the related increase of fish production during the six months ended June 30, 2012.
Plantation : Cost of goods sold from plantation increased by $702,609 (or 125.84%) to $1,260,957 for the six months ended June 30, 2013 from $558,348 for the six months ended 30 June 2012. The increase in cost of sales of the plantation was primarily due to the increase of corresponding production of flowers.
Beef : Revenues from beef increased by $4,662,611or 93.80%) to $9,633,534 for the six months ended June 30, 2013 from $4,970,923 for the six months ended June 30, 2012. The increase in cost of sales of the beef was primarily due to the increase of the corresponding increase of sale derived from more cattle being grown in the farm during the six months ended June 30, 2013.
Organic fertilizer : Cost of goods sold from organic fertilizer increased by $8,056,719 (or 749.23%) to $9,132,048 for the six months ended June 30, 2013 from $1,075,329 for the six months ended June 30, 2012. The increase was due to the increase of fertilizer production from the new fertilizer factory of HSA during the six months ended June 30, 2013.
Cattle farm : Cost of goods sold from cattle farm increased by $7,852,618 (or 740.04%) to $8,913,731 for the six months ended 30 June 2013from $1,061,113 for the six months ended 30 June 2012. The increase in cattle farm was primarily due to the increase of production having more being grown in Cattle Farm 1 during the six months ended June 30, 2013.
Corporate and others: Cost of goods sold increased by $11,299,654 for the six months ended June 30, 2013 from $0 for the six months ended June 30, 2012. The increase is due primarily to the fact that that part of the Fishery segment’s sales deriving from consulting services, and seafood trading were reallocated to the segment of “Corporate and others” during the six months ended June 30, 2013 as such enhancing corresponding increase in cost of sales accordingly.
Gross Profit
Gross profit increased by $19,341,424 (or 89.66%) to $40,913,264 for the six months ended June 30, 2013 from $21,571,840 for the six months ended June 30, 2012.operation revenues. The increase was primarily due to the corresponding increase in scale of operation of revenues from plantation,fishery, beef and organic fertilizer, cattle farm, Corporate and others.fertilizer.
The following chart illustrates the changes by category from the sixnine months ended JuneSeptember 30, 20132014 to Junethe nine months ended September 30, 2012.2013.
The gross profit by category is as follows:
| Gross profit | ||||||||||||||||||||||||
| 2013 | 2012 | |||||||||||||||||||||||
| Category | Q1- Q2 | Q1- Q2 | Difference | Q1- Q3 | Q1- Q3 | Difference | ||||||||||||||||||
| $ | $ | $ | $ | $ | $ | |||||||||||||||||||
| Fishery | 13,767,741 | 14,803,623 | (1,035,882 | ) | 49,225,424 | 23,560,343 | 25,665,081 | |||||||||||||||||
| Plantation | 2,294,029 | 1,523,515 | 770,514 | 6,661,796 | 7,996,195 | -1,334,399 | ||||||||||||||||||
| Beef | 4,490,374 | 2,474,502 | 2,015,872 | 16,454,689 | 6,557,404 | 9,897,285 | ||||||||||||||||||
| Organic fertilizer | 8,568,321 | 1,107,887 | 7,460,434 | 15,401,139 | 14,101,056 | 1,300,083 | ||||||||||||||||||
| Cattle farm | 5,869,987 | 1,662,313 | 4,207,674 | 1,065,151 | 6,534,442 | -5,469,291 | ||||||||||||||||||
| Corporate and others | 5,922,812 | - | 5,922,812 | 6,545,495 | 8,286,948 | -1,741,453 | ||||||||||||||||||
| Total | 40,913,264 | 21,571,840 | 19,341,424 | 95,353,694 | 67,036,388 | 28,317,306 | ||||||||||||||||||
Fishery : Gross profit from fishery decreased by $1,035,882 (or 7%) from $13,767,741 for the six months ended June 30, 2013from $14,803,623 for the six months ended June 30, 2012. The decrease in fishery was primarily due to the decrease of sales prices of sleepy cod fish falling from the average of $27/Kg for the six months ended June 30, 2012 to its current average of $15.3/Kg for the six months ended June 30, 2013.
Plantation : Gross profit from plantation increased by $770,514 (or 50.57%) to $2,294,029 for the six months ended June 30, 2013 from $1,523,515 for the six months ended June 30, 2012. The increase in plantation was primarily due to the increase of sales due to increase of production of flowers at the farm during the six months ended June 30, 2013.
Beef : Gross profit from beef increased by $2,015,872 (or 81.46%) to $4,490,374 for the six months ended June 30, 2013 from $2,474,502 for the six months ended June 30, 2012. The increase in beef was primarily due to increased sales of cattle.
Organic fertilizer : Gross profit from organic fertilizer increased by $7,460,434 (or 673.39%) to $8,568,321 for the six months ended June 30, 2013 from $1,107,887 for the six months ended June 30, 2012. The increase was due to the increase of sales of fertilizer produced by the new fertilizer of HSA during the six months ended June 30, 2013.
Cattle farm : Gross profit from cattle farm increased by $4,207,674 (or 253.12%) to $5,869,987 for the six months ended June 30, 2013 from $1,662,313 for the six months ended June 30, 2012. The increase of gross profit in cattle farm was primarily due to the increase of sales in cattle and having more cattle being grown in Cattle Farm 1 in the six months ended June 30, 2013.
Corporate and others: Gross profit increased by $5,922,812 for the six months ended June 30, 2013 from $0 for the six months ended June 30, 2012. The reason for the increase is primarily the fact that part of the fishery segment’s sales in consulting services and trading of imported seafood were reallocated to this segment, thereby increasing the gross profit generated.
| - 39 - |
General and Administrative Expenses and Interest Expenses
General and administrative expenses and interest expenses (including depreciation and amortization) decreasedincreased by $1,032,298 (or 23.08%)$3,788,853 or 61% to $3,925,702$10,027,920 for the sixnine months ended JuneSeptember 30, 20132014 from $4,957,999$6,239,067 for the sixnine months ended JuneSeptember 30, 2012.2013. The decreaseincrease was primarily due to decrease(i) increase in wages and salaries payments paid for incentiveincentives compensation to our staff by the issuance of shares amounting to $1,333,556$239,264 for the sixnine months ended June 30,2012 comparesSeptember 30, 2014 as compared to $181,200$271,800 for the sixnine months ended JuneSeptember 30, 2013 and including(ii) increase in the miscellaneous were paymentsoffice and corporate expenses paid for overseas professional services of $781,684$116,076 for the sixnine months ended JuneSeptember 30, 2012 whereas payments for overseas professional services were billed under Office and corporate expenses instead of miscellaneous2014 from $Nil for the sixnine months ended JuneSeptember 30, 2013.
| Category | 2013 Q1-Q2 | 2012 Q1-Q2 | Difference | |||||||||
| $ | $ | $ | ||||||||||
| Office and corporate expenses | 1,328,662 | 1,151,439 | 177,223 | |||||||||
| Wages and salaries | 962,101 | 1,863,290 | (901,189 | ) | ||||||||
| Traveling and related lodging | 34,998 | 20,276 | 14,722 | |||||||||
| Motor vehicles expenses and local transportation | 73,893 | 37,200 | 36,693 | |||||||||
| Entertainments and meals | 64,850 | 52,395 | 12,455 | |||||||||
| Others and miscellaneous | 300,881 | 929,902 | (629,021 | ) | ||||||||
| Depreciation and amortization | 1,048,307 | 903,498 | 144,809 | |||||||||
| Sub-total | 3,813,692 | 4,957,999 | (1,144,308 | ) | ||||||||
| Interest expenses | 112,010 | - | 112,010 | |||||||||
| Total | 3,925,702 | 4,957,999 | (1,032,298 | ) | ||||||||
| Category | 2014 Q1-Q3 | 2013 Q1-Q3 | Difference | |||||||||
| $ | $ | $ | ||||||||||
| Office and corporate expenses | 4,915,961 | 1,986,403 | 2,929,558 | |||||||||
| Wages and salaries | 1,459,702 | 1,409,818 | 49,884 | |||||||||
| Traveling and related lodging | 111,991 | 54,330 | 57,661 | |||||||||
| Motor vehicles expenses and local transportation | 140,986 | 121,597 | 19,389 | |||||||||
| Entertainments and meals | 107,710 | 99,234 | 8,476 | |||||||||
| Others and miscellaneous | 794,347 | 560,507 | 233,840 | |||||||||
| Depreciation and amortization | 2,014,066 | 1,608,792 | 405,274 | |||||||||
| Sub-total | 9,544,763 | 5,840,681 | 3,704,082 | |||||||||
| Interest expenses | 483,157 | 398,386 | 84,771 | |||||||||
| Total | 10,027,920 | 6,239,067 | 3,788,853 | |||||||||
Depreciation and Amortization
Depreciation and amortization increase by $293,635 (or 22.22%)$1,453,403 or 58.96% to $1,614,965$3,387,314 for the sixnine months ended JuneSeptember 30, 20132014 from $1,321,330$2,464,865 for the sixnine months ended JuneSeptember 30, 2012.2013. The decreaseincrease was primarily due to the increase of depreciation by $455,517$772,639 to $638,671 for$1,768,047for the sixnine months ended JuneSeptember 30, 20132014 from depreciation of $183,154$995,408 for the sixnine months ended JuneSeptember 30, 2012,2013, and the decreaseincrease of amortization by $161,882$149,810 to $976,294$1,619,267 for sixnine months ended JuneSeptember 30, 20132014 from amortization of $1,138,176$1,469,457 for the sixnine months ended JuneSeptember 30, 2012.2013.
In this respect, total depreciation and amortization amounted to $1,614,965$3,387,314 for the sixnine months ended JuneSeptember 30, 2013,2014, out of which amount $1,048,307$2,014,066 was booked under general and administration expenses and $566,658$1,373,248 was booked under cost of goods sold; whereas total depreciation and amortization was at $1,321,330$2,464,865 for the sixnine months ended JuneSeptember 30, 20122013 and out of which amount, $903,498$1,608,792 was booked under generalGeneral and administrationAdministration expenses and $417,832$856,073 was booked under cost of goods sold.
Part D. Income Statements of Consolidated Results of Operations for the Fiscal year 2013 compared to the Fiscal year 2012
A (1) Income Statements
| In $ | Audited | Audited | ||||||||||||||
| 2013 | 2012 | Difference | Note | |||||||||||||
| Revenue | 261,425,813 | 138,613,639 | 122,812,174 | 1 | ||||||||||||
| Consulting, services, commission and management fee | 52,811,772 | 50,541,312 | 2,270,460 | |||||||||||||
| Sale of goods | 208,614,041 | 88,072,327 | 120,541,714 | |||||||||||||
| Cost of goods sold and services | 159,894,663 | 68,807,471 | 91,087,192 | 2 | ||||||||||||
| Consulting, services, commission and management fee | 20,548,608 | 18,248,957 | 2,299,651 | |||||||||||||
| Sale of goods | 139,346,055 | 50,558,514 | 88,787,541 | |||||||||||||
| Gross Profit | 101,531,150 | 69,806,168 | 31,724,982 | 3 | ||||||||||||
| Consulting, services, commission and management fee | 32,263,164 | 32,292,355 | (29,191 | ) | ||||||||||||
| Sale of goods | 69,267,986 | 37,513,813 | 31,754,173 | |||||||||||||
| Other income (expenses) | 1,769,873 | 1,832,234 | (62,361 | ) | 4 | |||||||||||
| General and administrative expenses | (8,859,777 | ) | (8,385,862 | ) | (473,915 | ) | 5 | |||||||||
| Net income | 94,441,246 | 63,252,540 | 31,188,706 | |||||||||||||
| EBITDA | 98,337,535 | 65,922,130 | 34,081,789 | |||||||||||||
| Depreciation and amortization (D&A) | (3,502,697 | ) | (2,387,270 | ) | (1,115,427 | ) | 6 | |||||||||
| EBIT | 94,834,838 | 63,534,860 | 31,299,976 | |||||||||||||
| Net Interest | (393,592 | ) | (282,320 | ) | (111,272 | ) | ||||||||||
| Tax | - | - | - | |||||||||||||
| Net Income | 94,441,246 | 63,252,540 | 31,188,704 | |||||||||||||
| Non - controlling interest | (20,234,717 | ) | (5,706,708 | ) | (14,528,009 | 7 | ||||||||||
| Net income to SIAF Inc. and subsidiaries | 74,206,529 | 57,545,832 | 16,660,695 | |||||||||||||
| Weighted average number of shares outstanding | ||||||||||||||||
| - Basic | 12,093,973 | 8,284,536 | 3,809,437 | |||||||||||||
| - Diluted | 12,872,443 | 9,294,637 | 3,577,806 | |||||||||||||
| Earnings Per Share (EPS) | 8 | |||||||||||||||
| - Basic | 6.14 | 6.95 | (0.81 | ) | ||||||||||||
| - Diluted | 5.76 | 6.19 | (0.43 | ) | ||||||||||||
| - 40 - |
This Part D discusses and analyzes certain items (marked with notes) that we believe would assist our shareholders in obtaining a better understanding on the Company’s results of operations and financial condition:
Note (1, 2 & 3) Sales, cost of sales and gross profit information and Analysis:
| l | The Company’s revenues were generated from (1) Sale of Goods and (2) Consulting and services provided in project and business developments covering engineering, construction, supervision, training, managements and technology etc. |
Table (A.1) below shows the items, quantities, average selling price and average unit cost of goods sold for the fiscal years 2013 and 2012
| Subsidiary | Description of items | 2013 | 2012 | Difference | Percentage of change | |||||||||||||||||||
| SJAP | Cattle Operation | |||||||||||||||||||||||
| Production and Sales of live cattle | Heads | 9,375 | 4,312 | 5,063 | 117 | % | ||||||||||||||||||
| Average selling price | $/head | 3,461 | 3,454 | 7 | 0 | % | ||||||||||||||||||
| Average unit cost | $/head | 2,265 | 2,649 | (384 | ) | (14 | )% | |||||||||||||||||
| Production and sales of feedstock | - | |||||||||||||||||||||||
| Bulk Livestock feed | MT | 38,194 | 10,134 | 28,060 | 277 | % | ||||||||||||||||||
| Average selling price | $/MT | 155 | 132 | 23 | 18 | % | ||||||||||||||||||
| Average unit cost | $/MT | 110 | 77 | 33 | 43 | % | ||||||||||||||||||
| Concentrated livestock feed | MT | 31,717 | - | 31,717 | ||||||||||||||||||||
| Average selling price | $/MT | 418 | - | 418 | ||||||||||||||||||||
| Average unit cost | $/MT | 257 | - | 257 | ||||||||||||||||||||
| Production and sales of fertilizer | MT | 60,509 | 29,169 | 31,340 | 107 | % | ||||||||||||||||||
| Average selling price | $/MT | 175 | 168 | 7 | 4 | % | ||||||||||||||||||
| Average unit cost | $/MT | 80 | 81 | (1 | ) | (2 | )% | |||||||||||||||||
| HSA | Fertilizer and Cattle operation | |||||||||||||||||||||||
| Organic Fertilizer | MT | 19,230 | 5,421 | 13,809 | 255 | % | ||||||||||||||||||
| Average selling price | $/MT | 323 | 210 | 113 | 54 | % | ||||||||||||||||||
| Average unit cost | $/MT | 238 | 176 | 62 | 35 | % | ||||||||||||||||||
| Organic Mixed Fertilizer | MT | 12,775 | 2,780 | 9,995 | 360 | % | ||||||||||||||||||
| Average selling price | $/MT | 413 | 387 | 26 | 7 | % | ||||||||||||||||||
| Average unit cost | $/MT | 193 | 276 | (83 | ) | (30 | )% | |||||||||||||||||
| JHST | Plantation of HU Flowers and Immortal vegetables | |||||||||||||||||||||||
| Fresh HU Flowers | Pieces | 14,383,484 | 7,826,069 | 6,557,415 | 84 | % | ||||||||||||||||||
| Average selling price | $/Pieces | 0.15 | 0.13 | 0.02 | 13 | % | ||||||||||||||||||
| Average unit cost | $/Pieces | 0.05 | 0.03 | 0.01 | 35 | % | ||||||||||||||||||
| Dried HU Flowers | MT | 1,504 | 1,183 | 321 | 27 | % | ||||||||||||||||||
| Average selling price | $/MT | 12,412 | 9,151 | 3,261 | 36 | % | ||||||||||||||||||
| Average unit cost | $/MT | 5,843 | 4,033 | 1,811 | 45 | % | ||||||||||||||||||
| Dried Immortal vegetables | MT | 10 | - | 10 | ||||||||||||||||||||
| Average selling price | $/MT | 152,534 | - | 152,534 | ||||||||||||||||||||
| Average unit cost | $/MT | 48,942 | - | 48,942 | ||||||||||||||||||||
| Other Value added products | Pieces | 60,000.00 | - | 60,000 | ||||||||||||||||||||
| Average selling price | $/Pieces | 8 | - | 8 | ||||||||||||||||||||
| Average unit cost | $/Pieces | 3 | - | 3 | ||||||||||||||||||||
| CA | Production and sale of fish and prawns | |||||||||||||||||||||||
| Fish (Sleepy cods) | MT | 2,616 | 1,765 | 852 | 48 | % | ||||||||||||||||||
| Average selling price | $/MT | 15,170 | 25,608 | (10,438 | ) | (41 | )% | |||||||||||||||||
| Average unit cost | $/MT | 12,450 | 13,324 | (874 | ) | (7 | )% | |||||||||||||||||
| Eels | MT | 1,661 | - | 1,661 | ||||||||||||||||||||
| Average selling price | $/MT | 16,590 | - | 16,590 | ||||||||||||||||||||
| Average unit cost | $/MT | 8,925 | - | 8,925 | ||||||||||||||||||||
| Prawns | MT | 417 | - | 417 | ||||||||||||||||||||
| Average selling price | $/MT | 12,280 | - | 12,280 | ||||||||||||||||||||
| Average unit cost | $/MT | 9,770 | - | 9,770 | ||||||||||||||||||||
| MEIJI | Production and sale of live cattle (Aromatic) | Heads | 5,597 | 1,655 | 3,942 | 238 | % | |||||||||||||||||
| Average selling price | $/head | 3,157 | 3,600 | (443 | ) | (12 | )% | |||||||||||||||||
| Average unit cost | $/head | 2,351 | 2,787 | (436 | ) | (16 | )% | |||||||||||||||||
| SIAF | Seafood trading/import/export | |||||||||||||||||||||||
| Mixed seafood | MT | 1,521 | 322 | 1,198 | 372 | % | ||||||||||||||||||
| Average selling price | $/MT | 14,498 | 5,270 | 9,228 | 175 | % | ||||||||||||||||||
| Average unit cost | $/MT | 12,600 | 3,409 | 9,191 | 270 | % | ||||||||||||||||||
| - 41 - |
Table (A.2)below shows the sale of goods, cost of sales and gross profit for the fiscal years 2012 and 2013
| In $ | Sales of Goods | Costs of goods sold | Gross profit | |||||||||||||||||||||||
| 2013 | 2012 | 2013 | 2012 | 2013 | 2012 | |||||||||||||||||||||
| Fishery | ||||||||||||||||||||||||||
| CA | Sales of fish and prawns | |||||||||||||||||||||||||
| Fish (Sleepy cods) | 39,691,498 | 45,189,788 | 32,574,763 | 23,512,812 | 7,116,735 | 21,676,976 | ||||||||||||||||||||
| Eels | 27,552,690 | - | 14,823,189 | - | 12,729,501 | - | ||||||||||||||||||||
| Prawns | 5,118,792 | - | 4,072,524 | - | 1,046,268 | - | ||||||||||||||||||||
| CA and Fishery Total | 72,362,980 | 45,189,788 | 51,470,476 | 23,512,812 | 20,892,504 | 21,676,976 | ||||||||||||||||||||
| Plantation | ||||||||||||||||||||||||||
| JHST | Sales of Fresh HU Flowers | 2,193,971 | 1,052,844 | 660,550.36 | 265,555 | 1,533,420 | 787,289 | |||||||||||||||||||
| Sales of Dried HU Flowers | 18,668,070 | 10,825,755 | 8,788,077 | 4,770,400 | 9,879,993 | 6,055,355 | ||||||||||||||||||||
| Sales of Dried Immortal vegetables | 1,464,327 | - | 469,844 | - | 994,483 | - | ||||||||||||||||||||
| Sales of Other Value added products | 488,109 | - | 183,041 | - | 305,068 | - | ||||||||||||||||||||
| JHST and Plantation Total | 22,814,476 | 11,878,599 | 10,101,512 | 5,035,955 | 12,712,964 | 6,842,644 | ||||||||||||||||||||
| Beef | ||||||||||||||||||||||||||
| SJAP | Sales of live cattle | 32,448,531 | 14,892,310 | 21,234,097 | 11,421,676 | 11,214,435 | 3,470,634 | |||||||||||||||||||
| Beef Total | 32,448,531 | 14,892,310 | 21,234,097 | 11,421,676 | 11,214,435 | 3,470,634 | ||||||||||||||||||||
| Organic fertilizer | ||||||||||||||||||||||||||
| SJAP | Sales of feedstock | |||||||||||||||||||||||||
| Bulk Livestock feed | 5,930,401 | 1,337,709 | 4,208,387 | 780,951 | 1,722,013 | 556,758 | ||||||||||||||||||||
| Concentrate livestock feed | 13,269,506 | - | 8,140,417 | - | 5,129,089 | - | ||||||||||||||||||||
| Sales of fertilizer | 10,579,242 | 4,904,507 | 4,828,517 | 2,372,145 | 5,750,725 | 2,532,362 | ||||||||||||||||||||
| SJAP Total | 62,227,680 | 21,134,526 | 38,411,418 | 14,574,772 | 23,816,262 | 6,559,754 | ||||||||||||||||||||
| HSA | Sales of Organic fertilizer | 6,213,256 | 1,138,134 | 4,573,209 | 955,994 | 1,640,047 | 182,140 | |||||||||||||||||||
| Sales of Organic Mixed Fertilizer | 5,277,139 | 1,074,904 | 2,467,261 | 767,037 | 2,809,878 | 307,867 | ||||||||||||||||||||
| HSA Total | 11,490,395 | 2,213,038 | 7,040,470 | 1,723,031 | 4,449,925 | 490,007 | ||||||||||||||||||||
| Organic fertilizer Total | 41,269,544 | 8,455,254 | 24,217,791 | 4,876,127 | 17,051,752 | 3,579,127 | ||||||||||||||||||||
| Cattle farm | ||||||||||||||||||||||||||
| MEIJI | ||||||||||||||||||||||||||
| Sale of Live cattle (Aromatic) | 17,671,418 | 5,957,870 | 13,161,262 | 4,613,074 | 4,510,156 | 1,344,796 | ||||||||||||||||||||
| MEIJI and cattle farm Total | 17,671,418 | 5,957,870 | 13,161,262 | 4,613,074 | 4,510,156 | 1,344,796 | ||||||||||||||||||||
| Corporate | ||||||||||||||||||||||||||
| SIAF | ||||||||||||||||||||||||||
| Sales of Seafood trading/import/export | 22,047,092 | 1,698,506 | 19,160,917 | 1,098,870 | 2,886,175 | 599,636 | ||||||||||||||||||||
| SIAF and Corporate total | 22,047,092 | 1,698,506 | 19,160,917 | 1,098,870 | 2,886,175 | 599,636 | ||||||||||||||||||||
| Group Total | 208,614,041 | 88,072,327 | 139,346,055 | 50,558,514 | 69,267,986 | 37,513,813 | ||||||||||||||||||||
| - 42 - |
Table (A.3) below shows the percentage of gross profit for the fiscal year 2012 and 2013
| Gross Profit in % of sale of goods | 2013 | 2012 | Difference | |||||||||
| Fishery | ||||||||||||
| CA | ||||||||||||
| Fish (Sleepy cods) | 18 | % | 48 | % | (30 | )% | ||||||
| Eels | 46 | % | - | - | ||||||||
| Prawns | 20 | % | - | - | ||||||||
| CA and Fishery Gross Profit | 29 | % | 48 | % | (19 | )% | ||||||
| Plantation | ||||||||||||
| JHST | ||||||||||||
| Fresh HU Flowers | 70 | % | 75 | % | (5 | )% | ||||||
| Dried HU Flowers | 53 | % | 56 | % | (3 | )% | ||||||
| Dried Immortal vegetables | 68 | % | - | - | ||||||||
| Other Value added products | 63 | % | - | - | ||||||||
| JHST and Plantation Gross Profit | 56 | % | 58 | % | (2 | )% | ||||||
| Beef | ||||||||||||
| SJAP | ||||||||||||
| Live cattle | 35 | % | 23 | % | 12 | % | ||||||
| Beef Gross Profit | 35 | % | 23 | % | 12 | % | ||||||
| Organic fertilizer | ||||||||||||
| SJAP | ||||||||||||
| Feedstock | ||||||||||||
| Bulk livestock feed | 29 | % | 42 | % | (13 | )% | ||||||
| Concentrated livestock feed | 39 | % | - | - | ||||||||
| Fertilizer | 54 | % | 52 | % | 2 | % | ||||||
| SJAP Gross Profit | 38 | % | 31 | % | 7 | % | ||||||
| HSA | ||||||||||||
| Fertilizer | 26 | % | 16 | % | 10 | % | ||||||
| Organic mixed fertilizer | 53 | % | 29 | % | 24 | % | ||||||
| HSA Gross Profit | 39 | % | 25 | % | 14 | % | ||||||
| Organic fertilizer Gross Profit | 41 | % | 42 | % | (1 | )% | ||||||
| Cattle farm | ||||||||||||
| MEIJI | ||||||||||||
| Sale of live cattle (Aromatic) | 26 | % | - | - | ||||||||
| MEIJI and Cattle farm Gross Profit | 26 | % | - | - | ||||||||
| Corporate | ||||||||||||
| SIAF | 33 | % | 43 | % | (9 | )% | ||||||
| Seafood trading/import/export | 33 | % | 43 | % | (10 | )% | ||||||
| Corporate and SIAF Gross Profit | ||||||||||||
| Group Total Gross Profit on sale of goods (excluding C, S, C &C) | 33 | % | 43 | % | (10 | )% | ||||||
Revenues (sale of goods)
Revenues generated from sale of goods increased by $120,541,714 (or 137% from $88,072,327 for the year ended December 31, 2012 to $ 208,614,041 for the year ended December 31, 2013). The increase was primarily due to increase of revenue from organic fertilizer by $32,814,290 and was attributable to 27% of total increase of $120,541,714. Revenue from organic fertilizer of $41,269,544 (2012: $8,455,254) was attribute 20% (2012: 101%) to total of revenue generated from sale of goods of $208,614,041 (2012: $88,072,327).
Fishery: Revenue from fishery increased by $ 27,173,192 (or 60%) from $45,189,788 for the year ended December 31, 2012 to $72,362,980 for the year ended December 31, 2013. The increase in fishery was primarily due to our increase in revenue from the sale of eels and prawns. Sale of eels and prawns of $32,671,482 (2012: $Nil) attribute to 45% (2012: Nil %) of total revenue of fishery of $72,362,980 (2012: $45,189,788).
Plantation: Revenue from our plantation increased by $10,935,877 (or 92%) from $11,878,599 for the year ended December 31, 2012 to $ 22,814,476 for the year ended December 31, 2013. The increase was primarily due to the increase of selling price of dried HU Flowers of $1,504 per MT (2012: $1,183 per MT) by 27%.
| - 43 - |
Beef: Revenue from beef increased by $17,556,221 (or 118%) from $14,892,310 for the year ended December 31, 2012 to $32,448,531 for the year ended December 31, 2013. The increase was primarily due to shortening the fattening period of the cattle by stocking older cattle and increasing faster turnaround of sales (i.e. fattening 16 months and older cattle at the farm for 3 months in 2013 instead of fattening 14 - 15 months old cattle for 5 to 6 months).
Organic fertilizer: Revenue from organic fertilizer increased by $32,814,290 from $8,445,254 for the year ended December 31, 2012 to $41,269,544 for the year ended December 31, 2013. The increase was primarily due to the increase of both volume of production 130,740 MT (2012: 47,504MT) by 175% and the selling price of bulk live feed of $155/MT (2012: $132/MT) by 17%, organic fertilizer of $323/MT (2012: $210/MT) by 54% and organic mixed fertilizer of $413/MT (2012: $387/MT) by 7%.
Cattle farm: Revenue from cattle farm increased by $11,713,548 (or 197%) from $5,957,870 for the year ended December 31, 2012 to $17,671,418 for the year ended December 31, 2013. The increase was primarily due to the increase of the quantities of cattle being grown in the farm of 5,597 head (2012: 1,655 head) by 238% even though the selling price decreased to $3,157 per head (2012: $3,600 per head) by 12%.
Corporate: Revenue from the corporate increased by $20,348,586 (or 1,198%) from $1,698,506 (restated) for the year ended December 31, 2012 to $22,047,092 for the year ended December 31, 2013. The increase was primarily due to more category of sea food being marketed in 2013.
Cost of Goods Sold (sale of goods)
Cost of goods sold increased by $88,787,541 (or 176%) from $50,558,514 for the year ended December 31, 2012 to $139,346,055 for the year ended December 31, 2013. The increase was primarily due to increase of sales of goods from fishery by $27,957,664 and cost of goods sold from fishery of $51,470,476 (2012: $23,512,812 (restated) attribute 37% (2012: 47%) of total cost of goods sold $139,346,055 (2012: $50,558,514).
Fishery: Cost of goods sold from fishery increased by $ 27,957,664 (or 119%) from $23,512,812 (restated) for the year ended December 31, 2012 to $51,470,476 for the year ended December 31, 2013. The increase in cost of goods from fishery was primarily due to our increase in quantity of goods sold of sleepy of 2,616 MT (2012: 1,765MT), Eels of 1,661MT (2012: Nil MT) and prawns of 417MT (2012: Nil MT) even though average unit cost of sleepy cods of $12,450/MT (2012: $13,324/MT) dropped slightly by 7%.
Plantation: Cost of goods sold from plantation increased by $5,065,557 (or 101%) from $5,035,955 for the year ended December 31, 2012 to $10,101,512 for the year ended December 31, 2013. The increase was primarily due to the increase of quantity of production of dried HU Flowers of 1,504 MT (2012: 1,183 MT) by 27.14% after implementation of soil revitalization program implemented earlier in the season.
Beef: Cost of goods sold from beef increased by $9,812,421 (or 86%) from $11,421,676 for the year ended December 31, 2012 to $21,234,097 for the year ended December 31, 2013. The increase was primarily due to the increase of quantity of cattle of sold 9,375 heads (2012: 4,312 heads) increased by 117% shortening the fattening period of the cattle by stocking older cattle and increasing faster turnaround of sales (i.e. fattening 16 months and older cattle at the farm for 3 months in 2013 instead of fattening 14 - 15 months old cattle for 5 to 6 months) even though the unit cost of cattle decreased slightly to $2,265/head (2012: $2,649/head) by 14%.
Organic fertilizer: Cost of goods sold from organic fertilizer increased by $19,341,664 from $4,876,127 for the year ended December 31, 2012 to $24,217,791 for the year ended December 31, 2013. The increase was primarily due to the increase of both volume of production 130,740MT (2012: 47,504MT) by 175% and the increase of unit cost of bulk live feed of $110/MT (2012: $77/MT) by 43%, organic fertilizer of $238/MT (2012: $176/MT) by 35%.
Cattle farm: Cost of goods sold from cattle farm increased by $8,548,188 (or 185%) from $4,613,074 for the year ended December 31, 2012 to $13,161,262 for the year ended December 31, 2013. The increase was primarily due to the increase of the quantities of cattle being grown in the farm of 5,597 head (2012: 1,655 head) by 238% even though the unit cost decreased to $2,351 per head (2012: $2,787 per head) by 16%.
Corporate: Cost of goods sold from corporate increased by $18,062,047 (or 381%) from $1,098,870 (restated) for the year ended December 31, 2012 to $19,160,917 for the year ended December 31, 2013. The increase was primarily due to the more category and quantities of sea food being marketed in 2013.
Gross Profit (sale of goods)
Gross profit generated from goods sold increased by $31,754,173 (or 85%) from $37,513,813 for the year ended December 31, 2012 to $69,267,986 for the year ended December 31, 2013. The increase was primarily due to the corresponding increases in gross profit from our plantation, beef, organic fertilizer, cattle farm and corporate operations. Gross profit from fishery of $20,892,504 (2012: $21,676,976 (restated) are still attributable to 30% (2012: 58%) of total gross profit generated from sale of goods of $69,267,986 (2012: $37,513,813).
| - 44 - |
Fishery: Gross profit from fishery decreased by $784,472 (or 4%) from $21,676,976 for the year ended December 31, 2012 to $20,892,504 for the year ended December 31, 2013. The decrease in fishery was primarily due to market price of sleepy cods dropped from $25,608 per MT to $15,170 per MT.
Plantation: Gross profit from plantation increased by $5,870,320 (or 92%) from $6,842,644 for the year ended December 31, 2012 to $12,712,964 for the year ended December 31, 2013. The increase was primarily due to the increase of selling price of dried HU Flowers of $12,412 per MT (2012: $9,151 per MT) by 36%.
Beef: Gross profit from beef increased by $7,743,801 (or 223%) from $3,470,634 for the year ended December 31, 2012 to $11,214,435 for the year ended December 31, 2013. The increase was primarily due to increase in the quantities of production of beef of 9,375 heads (2012: 4,312 heads) by 117% and the decrease of unit cost of production of $2,265 per head (2012: $2,649 per head).
Organic fertilizer: Gross profit from organic fertilizer increased by $13,472,625 (or 376%) from $3,579,127 for the year ended December 31, 2012 to $17,051,752 for the year ended December 31, 2013. The increase was primarily due to the increase of both volume of production 130,740MT (2012: 47,504MT) by 175% and the selling price of bulk live feed of $155/MT (2012: $132/MT) by 17% organic fertilizer of $323/MT (2012: $210/MT) by 54% and organic mixed fertilizer of $413/MT (2012: $387/MT) by 7%.
Cattle farm: Gross profit from cattle increased by $3,165,360 (or 235%) from $1,344,796 for the year ended December 31, 2012 to $4,510,156 for the year ended December 31, 2013. The increase was primarily due to the increase of the quantities of cattle being grown in the farm of 5,597 heads (2012: 1,655 heads) by 238% even though the selling price decreased to $3,157 per head (2012: $3,600 per head) by 12%.
Corporate: Gross profit from the corporate division increased by $2,286,539 from $599,636 (restated) for the year ended December 31, 2012 to $2,886,175 for the year ended December 31, 2013. The increase was primarily due to the more category of sea food being marketed in 2013 even though gross profit margin decreased from (2012: 35%) to (2013: 13%).
Table (A.4) below shows the revenue, cost of services and gross profit generated from Consulting, services, commission and management fee for the fiscal year 2012 and 2013
| In $ | 2013 | 2012 | Difference | Description of work | Notes | |||||||||||||||||
| Sales Revenues (Consulting, services, commission and management fee) | ||||||||||||||||||||||
| Fishery | CA | 36,696,125 | 36,193,780 | 502,345 | Working in progress of PF(1), FF(2), PF(2) and Zhongshen New Prawn Project | D1 & D3 | ||||||||||||||||
| Cattle farm | MEIJI | 7,120,596 | 11,080,131 | (3,959,535 | ) | Work in progress of CF(2) and Road work CF(1) & CF(2) | D2 | |||||||||||||||
| Corporate | SIAF | 8,995,051 | 3,267,401 | 5,727,650 | Work in progress of WHX and NaWei | D 4 & 5 | ||||||||||||||||
| Group Total Revenues | 52,811,772 | 50,541,312 | 2,270,460 | D6 | ||||||||||||||||||
| Cost of sales | ||||||||||||||||||||||
| Fishery | CA | 13,197,048 | 14,340,937 | (1,143,889 | ) | |||||||||||||||||
| Cattle farm | MEIJI | 4,733,262 | 2,998,343 | 1,734,919 | ||||||||||||||||||
| Corporate | SIAF | 2,618,298 | 909,677 | 1,708,621 | ||||||||||||||||||
| Group Total Cost of services | 20,548,608 | 18,248,957 | 2,299,651 | |||||||||||||||||||
| Gross Profit | ||||||||||||||||||||||
| Fishery | CA | 23,499,077 | 21,852,843 | 1,646,234 | ||||||||||||||||||
| Cattle farm | MEIJI | 2,387,334 | 8,081,788 | (5,694,454 | ) | |||||||||||||||||
| Corporate | SIAF | 6,376,753 | 2,357,724 | 4,019,029 | ||||||||||||||||||
| Group Total Gross Profit | 32,263,164 | 32,292,355 | (29,191 | ) | ||||||||||||||||||
Note:
| D1. | PF (1) is Prawn Farm (1) development at Enping City, FF(2) is the Fish Farm (2) development at Xin Hui City and PF(2) is Prawn Farm (2) development at Zhongshen City (San Jiao town). | |
| D2. | CF(1) and CF(2) are Cattle Farm (1) and Cattle Farm (2) development in Enping City, respectively. | |
| D3. | Zhongshen New Prawn Project ids the development of an agriculture, hydroponic cum industrial complex at Cui Ken Cun District of the Zhongshen City situated approximately 10 Km from PF(2). | |
| D4. | WHX is the construction and business development of central kitchen, bakery and restaurants and food outlets for Guangzhou City Wang Xiangcheng Enterprise management consulting Co., Ltd. | |
| D5. | NaWei is the construction and business development of wholesale centers,(covering live and frozen seafood and beef), cold and dried storages, offices and staff quarters etc. for Guangzhou City A Power Na Wei Trading Co., Ltd. | |
| D6. | During the Fiscal year 2012 and 2013, total Consulting and service work of $261 million was contracted (inclusive contracts obtained prior to December 2013 for $102 million (old contracts) and contracts obtained from December 2013 for $159 million (New Contracts)). As of December 31, 2013, there are $101 million of work has been done on the Old contracts (inclusive $9million of work being carried over from fiscal year 2011, such that on the Old contracts there are $10 million of work to be carried over to fiscal year 2014; and there are $156 million of work remaining on the new contracts that will be carried over to the fiscal year 2014 having done $3 million of work from the new contracts in the fiscal year 2013. |
| - 45 - |
Revenues: (consulting, service, commission and management fee)
Revenues generated from consulting and service is continued operations increased slightly by $2,270,460 (or 5 %) from $50,541,312 for the year ended December 31, 2012 to $52,811,772 for the year ended December 31, 2013. The increase was primarily due to increase of revenue from Corporate by $5727,650 but revenue from corporate of $8,995,051 (2012: $3,267,401) was attributable to 17% (2012: 7%) of total revenue generated from consulting, service, commission and management fee of 52,811,772 (2012: $50,541,312).
Fishery: Revenue from fishery increased by $502,345 (or 1%) from $36,193,780 for the year ended December 31, 2012 to $36,696,125 for the year ended December 31, 2013. The increase was slightly and reasonable.
Cattle farm: Revenue from cattle farm decreased by $3,809,535 (or 35%) from $11,080,131 for the year ended December 31, 2012 to $7,120,596 for the year ended December 31, 2013. The reason for the decrease was due to work in progress on cattle farm (2) was near to completion bearing less revenue.
Corporate: Revenue from corporate increased by $5,727,651 (or 175%) from $3,267,401 for the year ended December 31, 2012 to $8,995,051 for the year ended December 31, 2013. The reason for the increase is due to the increase of construction and development works.
Cost of services (consulting, service, commission and management fee)
Cost of services of consulting, service, commission and management fee increased slightly by $2,299,651 (or 3 %) from $18,248,957 for the year ended December 31, 2012 to $20,548,608 for the year ended December 31, 2013. The increase was primarily due to the increase of cost of services from cattle farm by $1,734,919 but cost of services from cattle farm of $4,733,262 (2012: $2,998,343) are attributable to 23% (2012: 16%) of total cost of services of consulting, service, commission and management fee of $20,548,608 (2012: $18,248,957).
Fishery: Cost of services from fishery decreased by $1,143,889 (or 9%) from $14,340,937 for the year ended December 31, 2012 to $13,197,048 for the year ended December 31, 2013. The decrease was due to lesser revenue generated and lesser cost incurred.
Cattle farm: Cost of services from cattle farm increased by $1,734,919 (or 58%) from $2,998,343 for the year ended December 31, 2012 to $4,733,262 for the year ended December 31, 2013. The increase is due mainly to the billing habit of sub-contractors and suppliers who always try to catch up before the end of the year with most of their outstanding bills that hadn’t been billed during the year.
Corporate: Cost of services from corporate increased by $1,708,621 (or 188%) from $909,677 for the year ended December 31, 2012 to $2,618,298 for the year ended December 31, 2013; the increase was due to the corresponding increase in revenues.
Gross profit (consulting, service, commission and management fee)
Gross profit of consulting, service, commission and management fee decreased by $29,191 (or 1%) from $32,292,355 for the year ended December 31, 2012 to $32,363,164 for the year ended December 31, 2013. The reason for decrease is the same as explained in revenue.
Fishery: Gross profit from fishery increased by $1,646,234 (or 8%) from $21,852,843 for the year ended December 31, 2012 to $23,499,077 for the year ended December 31, 2013. The reason for increase is the same as explained in revenue.
Cattle farm: Gross profit from cattle farm decreased by $5,694,454 (or 70%) from $8,081,788 for the year ended December 31, 2012 to $2,387,334 for the year ended December 31, 2013. The reason for the decrease is due to the increase of cost of services and the decrease in revenue.
Corporate: Gross profit from corporate increased by $4,019,030 (or 170%) from $2,357,724 for the year ended December 31, 2012 to $6,376,754 for the year ended December 31, 2013. The reason for the increase is due to the increase of revenue.
| - 46 - |
| Name of the developments | Location of development | Designed capacity per year | Land area or built up area | Current Phase & Stage | Commencement date of development | (Estimated) development’s completion date on or before | Contractual amount | % of completion as of 12.31.2013 | ||||||||
| Fish Farm (1) | Enping City | 1,200 MT | 9,900 m2 | fully operational | July 2010 | June 2011 | $5.3 million | Fully operational | ||||||||
| Prawn Farm (1) | Enping City | 2013=400MT 2014=800MT 2015=1200 MT | 23,100 m2 | 2 phases and road work | Phase 1 on June 2011 Phase (2.1) Phase (2.2) Road work Started Aug. 2012 | Phase (1) on December 2012 Phase (2) completed Q1 2013 | Phase (1) $11.6 million Phase (2) 6.39 million Road work $2.94 million | In operation | ||||||||
| Fish Farm (2) “The Fish & Eel Farm” | Xin Hui District, Jiang Men. | 2014=800 MT 2015= 1600 MT 2016=2000MT | 165,000 m2 | 3 Phases | Phase 1 January 15, 2012 Bridge & Road Oct. 2012 Phase (3) 2013 & (4)2014 | Phase 1 June 2014 Bridge & Road Dec. 2013 Phase (3) & (4) 2015 | Phase (1) $8.73 million Bridge & Road $2.48 Phase (3) $4.38 M Phase (4) $10.63 Million | Phase (1) & Bridge and Road completed Jan. 2013 Phase (3) 43% and Phase (4) not started. | ||||||||
| Prawn Farm (2) The Hatchery & Nursery & Grow-out prawn farm | San Jiao Town, Zhong San City, | 2013=1.6 Billion Fingerling and 400MT of prawns increasing yearly and by 2015 = 3.2 billion fingerling and 1200 MT of Prawns | 120,000 m2 | 2 phases | Phase (1) and Phase (2) May 2012 Phase (3) 2014 | Phase (1) Dec. 2012 and Phase (2) December 2013.Phase (3) Dec. 2014 | Phase (1) $9.26 m and Phase (2) 8.42 Million Phase (3) 11.5 Million | Phase (1) fully operational and Phase (2) in operation and Phase (3) not started | ||||||||
| Cattle Farm (1) | LiangXi Town, Enping City | 165,013 m2 | 1,500 Heads | 2 phases | April 2011 | December 2011 | $3.0 million +$1.17 Million | Fully operational | ||||||||
| Cattle Farm (2) | LiangXi Town, Enping City | 230,300 m2 | 2,500 heads | 2 Phases | February 2012 | March. 2014 | $10.6 million | 80% | ||||||||
| Cattle Farm (1) external road work | LiangXi Town, Enping City | 4.5 Km road | One Phase | September 2012 | March. 2013 | $4.32 million | Completed | |||||||||
| Cattle Farm (2) External Road work. | LiangXi Town, Enping City | 5.5 Km Road | One Phase | September 2012 | March. 2013 | $5.28 Million | Completed | |||||||||
| WHX Restaurants etc. | Guangzhou City | 5,500 seatings in total | Phase (1) Stage (1) | June 2012 | December 2015 | $17.5 million | Work in progress | |||||||||
| NaWei wholesale Center | Guangzhou City | 5,000 m2 | One Phase | July 2012 | March. 2014 | $ 9 million | Completed |
| - 47 - |
Note (4) Other Income
Table (Note 4.1) below shows the Gain / loss on extinguish of debts (or Debt Settlement) representing recent sales of unregistered securitiesandthe issuance of shares for the fiscal years 2013, 2012 and 2011
2013
| Date | Shares issued/Bought back | Market price when issued ($) | Par value | Additional paid in capital | Consideration received | Income from issuance of shares | Note | |||||||||||||||||||
| As of 1.1.2013 | 10,101,500 | 91,216,429 | ||||||||||||||||||||||||
| 1/3/2013 | 93,533 | 5.24 | 926 | 487,064 | 490,768 | 2,778 | Debt settlement | |||||||||||||||||||
| 1/3/2013 | 84,354 | 5.24 | 835 | 439,266 | 442,606 | 2,505 | Debt settlement | |||||||||||||||||||
| 1/15/2013 | 142,939 | 4.75 | 1,415 | 677,830 | 750,000 | 70,755 | Debt settlement | |||||||||||||||||||
| 1/15/2013 | 142,939 | 4.75 | 1,415 | 677,830 | 750,000 | 70,755 | Debt settlement | |||||||||||||||||||
| 2/20/2013 | 144,716 | 4.75 | 1,433 | 686,259 | 745,000 | 57,308 | Debt settlement | |||||||||||||||||||
| 2/20/2013 | 97,125 | 4.75 | 962 | 460,577 | 500,000 | 38,462 | Debt settlement | |||||||||||||||||||
| 3/15/2013 | 119,375 | 4.85 | 1182 | 577,909 | 650,000 | 70,909 | Debt settlement | |||||||||||||||||||
| 3/28/2013 | 65,168 | 5.04 | 645 | 328,387 | 400,000 | 70,968 | Debt settlement | |||||||||||||||||||
| 3/28/2013 | 154,774 | 5.04 | 1532 | 779,919 | 950,000 | 168,548 | Debt settlement | |||||||||||||||||||
| 4/18/2013 | 226,402 | 4.85 | 2,241 | 1,084,827 | 1,300,000 | 212,931 | Debt settlement | |||||||||||||||||||
| 4/18/2013 | 95,785 | 4.85 | 948 | 458,966 | 550,000 | 90,086 | Debt settlement | |||||||||||||||||||
| 5/10/2013 | 107,766 | 4.35 | 1,067 | 468,363 | 490,768 | 21,338 | Debt settlement | |||||||||||||||||||
| 5/10/2013 | 16,163 | 4.35 | 160 | 70,245 | 73,606 | 3,201 | Debt settlement | |||||||||||||||||||
| 5/10/2013 | 294,450 | 4.35 | 2,915 | 1,279,709 | 1,340,925 | 58,301 | Debt settlement | |||||||||||||||||||
| 6/25/2013 | 67,006 | 3.66 | 663 | 241,464 | 271,978 | 29,851 | Debt settlement | |||||||||||||||||||
| 6/25/2013 | 184,775 | 3.66 | 1,829 | 665,854 | 750,000 | 82,317 | Debt settlement | |||||||||||||||||||
| 7/2/2013 | 30,021 | 4.45 | 297 | 133,447 | 133,744 | - | Employee entitlements | |||||||||||||||||||
| 7/5/2013 | 188,414 | 3.56 | 1,865 | 665,911 | 850,000 | 182,224 | Debt settlement | |||||||||||||||||||
| 7/15/2013 | 133,659 | 4.15 | 1,323 | 554,430 | 600,000 | 44,246 | Debt settlement | |||||||||||||||||||
| 8/2/2013 | 186,162 | 3.76 | 1,843 | 702,183 | 680,000 | (24,026 | ) | Debt settlement | ||||||||||||||||||
| 8/12/2013 | 160,354 | 4.45 | 1,588 | 704,850 | 635,000 | (71,438 | ) | Debt settlement | ||||||||||||||||||
| 9/5/2013 | 148,860 | 3.56 | 1,474 | 530,536 | 562,000 | 29,991 | Debt settlement | |||||||||||||||||||
| 10/23/2013 | 87,422 | 5.04 | 865 | 440,528 | 450,000 | 8,607 | Debt settlement | |||||||||||||||||||
| 11/6/2013 | 141,414 | 5.04 | 1,400 | 712,600 | 672,617 | (41,383 | ) | Debt settlement | ||||||||||||||||||
| 11/19/2013 | 139,394 | 4.05 | 1,380 | 564,420 | 663,009 | 97,209 | Debt settlement | |||||||||||||||||||
| 11/20/2013 | 140,909 | 4.35 | 1,395 | 612,405 | 600,000 | (13,800 | ) | Debt settlement | ||||||||||||||||||
| 12/5/2013 | 133,838 | 4.15 | 1,325 | 555,175 | 564,788 | 8,288 | Debt settlement | |||||||||||||||||||
| 12/12/2013 | 128,838 | 4.05 | 1,276 | 521,680 | 619,218 | 96,263 | Debt settlement | |||||||||||||||||||
| 12/24/2013 | 141,141 | 5.14 | 1,397 | 725,199 | 678,349 | (48,247 | ) | Debt settlement | ||||||||||||||||||
| As of 12.31.2013 | 13,899,196 | 37,597 | 108,024,261 | 18,164,376 | 1,318,947 | |||||||||||||||||||||
The Company entered into several agreements with third parties to settle debts by issuance of the Company’s common stock. The shares issued by the Company were valued at the trading price of the stock on the date the shares were issued. During the year ended December 31, 2013, the Company issued an aggregate of 3,797,696 shares of Common Stock in consideration for extinguishment of debt in the aggregate amount of $18,164,376. The Company reported a gain in income of $1,318,947 from the extinguishment of debts. Of these shares, (i) 3,767,675 shares of Common Stock were issued in consideration for extinguishment of other payables in the aggregate amount of $18,030,632 and (ii) an aggregate of 30,021 shares of Common Stock were issued to 26 persons on settlements of workers entitlements under Rule 144 for consideration of $133,744.
| 2013 | 2012 | |||||||
| Total amounts of debts to be settled | $ | 18,030,632 | $ | 19,529,803 | ||||
| Less: Aggregate market fair value of 3,797,696 (2012: 3,238,847) shares of common stock in exchange of the above debts for debts extinguishment | (16,711,685 | ) | (17,863,417 | ) | ||||
| Gain on extinguishment of debts | $ | 1,318,947 | $ | 1,666,386 | ||||
2012
| Date | Shares issued/Bought back | Market price when issued ($) | Par value | Additional paid in capital | Consideration received | Income from issuance of shares | Note | |||||||||||||||||||
| As at 31.12.2011 | 6,771,138 | 66,025,493 | ||||||||||||||||||||||||
| 1/16/2012 | 87,586 | 5.64 | 493,379.90 | 563,615.00 | 69,368.00 | debt settlement | ||||||||||||||||||||
| 2/14/2012 | 152,420 | 5.19 | 790,694.52 | 905,375.00 | 113,171.53 | debt settlement | ||||||||||||||||||||
| 3/7/2012 | 72,952 | 6.18 | 450,668.40 | 455,002.00 | 3,611.37 | debt settlement | ||||||||||||||||||||
| 3/23/2012 | 60,606 | 6.33 | 380,400.00 | 450,000.00 | 69,000.00 | debt settlement | ||||||||||||||||||||
| 4/20/2012 | 80,976 | 6.13 | 496,231.25 | 568,118.00 | 71,085.08 | debt settlement | ||||||||||||||||||||
| 4/20/2012 | 44,179 | 6.13 | 270,732.03 | 310,000.00 | 38,830.60 | debt settlement | ||||||||||||||||||||
| 4/20/2012 | 46,316 | 6.13 | 283,826.36 | 325,015.00 | 40,730.12 | debt settlement | ||||||||||||||||||||
| 5/25/2012 | 129,301 | 5.64 | 730,926.25 | 793,650.00 | 61,443.67 | debt settlement | ||||||||||||||||||||
| 5/25/2012 | 215,516 | 5.64 | 1,218,289.03 | 1,315,475.00 | 95,052.37 | debt settlement | ||||||||||||||||||||
| 6/8/2012 | 56,418 | 5.24 | 296,583.68 | 365,000.00 | 67,857.78 | debt settlement | ||||||||||||||||||||
| 6/8/2012 | 90,267 | 5.24 | 474,522.31 | 585,000.00 | 109,584.05 | debt settlement | ||||||||||||||||||||
| 6/15/2012 | 47,871 | 4.85 | 231,748.35 | 310,000.00 | 77,777.73 | debt settlement | ||||||||||||||||||||
| 7/5/2012 | 217,298 | 5.04 | 1,094,984.72 | 1,161,825.00 | 64,689.03 | debt settlement | ||||||||||||||||||||
| 7/19/2012 | 181,344 | 4.25 | 768,391.40 | 931,825.00 | 161,638.30 | debt settlement | ||||||||||||||||||||
| 2012-8.-8 | 77,273 | 6.13 | 473,535.00 | 400,000.00 | -74,300.00 | debt settlement | ||||||||||||||||||||
| 8/16/2012 | 91,515 | 3.96 | 361,494.00 | 362,400.00 | - | Employee entitlements | ||||||||||||||||||||
| 8/18/2012 | 169,495 | 5.14 | 870,882.00 | 859,825.00 | -12,735.00 | debt settlement | ||||||||||||||||||||
| 8/22/2012 | 150,859 | 4.95 | 737,789.00 | 773,325.00 | 34,042.50 | debt settlement | ||||||||||||||||||||
| 9/17/2012 | 293,228 | 5.54 | 1,622,754.64 | 1,862,439.00 | 236,781.40 | debt settlement | ||||||||||||||||||||
| 9/20/2012 | 128,579 | 6.03 | 775,214.37 | 850,000.00 | 73,512.70 | debt settlement | ||||||||||||||||||||
| 9/24/2012 | 120,854 | 6.13 | 740,602.55 | 900,000.00 | 158,201.00 | debt settlement | ||||||||||||||||||||
| 10/10/2012 | 92,831 | 7.02 | 651,592.98 | 651,071.00 | -1,441.01 | debt settlement | ||||||||||||||||||||
| 10/25/2012 | 149,404 | 6.13 | 915,562.90 | 915,621.00 | -1,421.00 | debt settlement | ||||||||||||||||||||
| 11/15/2012 | 80,941 | 5.94 | 479,985.89 | 514,550.00 | 33,762.80 | debt settlement | ||||||||||||||||||||
| 11/19/2012 | 129,620 | 5.94 | 768,660.76 | 822,848.00 | 52,904.00 | debt settlement | ||||||||||||||||||||
| 12/21/2012 | 362,715 | 5.04 | 1,813,394.40 | 1,940,224.00 | 123,238.72 | debt settlement | ||||||||||||||||||||
| As at 31.12.2012 | 10,101,500 | 18,192,846.67 | 85,917,696.00 | 1,666,385.74 | ||||||||||||||||||||||
| - 48 - |
2011
| Date | Shares issued/Bought back | Market Price when issuance | Par value | Additional paid in capital | Consideration received | Income from issuance of shares | Note | |||||||||||||||||||||
| As at 31.12.2010 | 5,603,448 | 66,025,493 | ||||||||||||||||||||||||||
| 1/3/2011 | 37,374 | 14.45 | 539,830.00 | 562,500.00 | 22,300.00 | debt settlement | ||||||||||||||||||||||
| 1/13/2011 | 49,596 | 14.35 | 711,459.00 | 736,500.00 | 24,550.00 | debt settlement | ||||||||||||||||||||||
| 2/10/2011 | 42,929 | 13.86 | 594,575.00 | 637,500.00 | 42,500.00 | debt settlement | ||||||||||||||||||||||
| 2/10/2011 | 3,535 | 13.86 | 48,965.00 | 52,500.00 | 3,500.00 | debt settlement | ||||||||||||||||||||||
| 4/16/2011 | 53,535 | 12.87 | 688,470.00 | 795,000.00 | 106,000.00 | debt settlement | ||||||||||||||||||||||
| 4/22/2011 | 40,404 | 9.7 | 391,600.00 | 600,000.00 | 208,000.00 | debt settlement | ||||||||||||||||||||||
| 5/8/2011 | 35,455 | 9.9 | 350,649.00 | 526,500.00 | 175,500.00 | debt settlement | ||||||||||||||||||||||
| 7/1/2011 | 172,386 | 9.99 | 1,721,979.58 | 1,723,686.20 | - | For overseas professional service and employee entitlements | ||||||||||||||||||||||
| 7/11/2011 | 106,476 | 8.91 | 942,373.45 | 943,427.56 | - | For overseas professional service and employees entitlements | ||||||||||||||||||||||
| 7/11/2011 | 181,818 | 8.91 | 1,618,200.00 | 1,620,000.00 | - | For overseas professional service and employees entitlements | ||||||||||||||||||||||
| 7/6/2011 | -50,505 | 7.72 | -389,500.00 | -390,000.00 | - | shares bought back | ||||||||||||||||||||||
| 7/19/2011 | -50,505 | 7.72 | -389,500.00 | -390,000.00 | - | shares bought back | ||||||||||||||||||||||
| 7/21/2011 | 30,796 | 8.51 | 260,365.81 | 250,000.00 | -10,670.69 | debt settlement | ||||||||||||||||||||||
| 7/27/2011 | 30,796 | 10.09 | 310,670.68 | 250,000.00 | -60,975.56 | debt settlement | ||||||||||||||||||||||
| 8/16/2011 | 38,179 | 7.82 | 298,223.06 | 309,940.32 | 11,339.28 | debt settlement | ||||||||||||||||||||||
| 9/2/2011 | 1,239 | 8.31 | 10,292.85 | 10,059.76 | -245.36 | debt settlement | ||||||||||||||||||||||
| 9/2/2011 | 35,711 | 8.31 | 296,621.74 | 296,975.28 | - | debt settlement | ||||||||||||||||||||||
| 9/26/2011 | 43,110 | 6.83 | 293,202.67 | 293,629.46 | - | debt settlement | ||||||||||||||||||||||
| 10/8/2011 | 148,544 | 6.93 | 1,027,941.01 | 1,250,000.00 | 220,588.40 | debt settlement | ||||||||||||||||||||||
| 10/14/2011 | -60,606 | 6.43 | -389,400.00 | -390,000.00 | - | Shares brought back | ||||||||||||||||||||||
| 10/19/2011 | -62,626 | 6.43 | -402,380.00 | -403,000.00 | - | Shares brought back | ||||||||||||||||||||||
| 10/23/2011 | -646,465 | 0 | - | -6,400.00 | - | Shares returned to treasury | ||||||||||||||||||||||
| 10/14/2011 | 60,606 | 7.22 | 437,400.00 | 480,000.00 | 42,000.00 | debt settlement | ||||||||||||||||||||||
| 11/28/2011 | 161,261 | 5.44 | 873,670.72 | 1,450,000.00 | 574,732.80 | debt settlement | ||||||||||||||||||||||
| 11/14/2011 | 62,626 | 6.13 | 383,780.00 | 496,000.00 | 111,600.00 | debt settlement | ||||||||||||||||||||||
| 11/15/2011 | 646,465 | 5.84 | 3,737,600.00 | 3,225,600.00 | -518,400.00 | debt settlement | ||||||||||||||||||||||
| 12/15/2011 | 55,556 | 4.35 | 241,450.00 | 277,200.00 | 35,200.00 | debt settlement | ||||||||||||||||||||||
| As at 31.12.2011 | 6,771,138 | 14,208,539.58 | 15,207,618.58 | 987,518.87 | ||||||||||||||||||||||||
| - 49 - |
The shares returned to treasury were shares returned by one of our directors at par value.
During the last three years, we have issued unregistered securities to Chinese persons none of them residents of the United States. None of these transactions involved any underwriters, underwriting discounts or commissions, or any public offering. The sales of these securities were, except as set forth below, deemed to be exempt from the registration requirements of the Securities Act of 1933 by virtue of Section 4(a)(2) thereof, and/or Rule 506 of Regulation D promulgated thereunder, as transactions by an issuer not involving a public offering. The recipients of securities in each transaction represented their intention to acquire the securities for investment only and not with a view to or for sale in connection with any distribution thereof and appropriate legends were affixed to the certificates issued in such transactions. All purchasers of our securities were accredited or sophisticated persons and had adequate access, through employment, business or other relationships, to information about us.
We relied upon Regulation S of the Securities Act of 1933, as amended, for the above issuances, none of which was made to US citizens or residents. We believe that Regulation S was available because:
Reasons for using equity financing:
The Company has not entered into a long-term loan arrangement; SJAP has an arrangement with the Agriculture Development Bank of China for a short-term bank loan (one year), and has applied to the same bank to refinance part of the short term loan into a long-term arrangement, which is pending approval. Beginning in July 2013, the Company has approached several lending institutions situated in the USA, Hong Kong and Sweden seeking long-term funding that is still in progress. At the same time, the Company is seeking to arrange with a financial institution in Stockholm, Sweden as the project manager to offer corporate bonds to various European investors with a view to eventually listing them on a regulated European exchange. The Company is completing all relevant legal documentation, and regulatory filings with the appropriate authorities in anticipation of issuing the bond sometime in the near future.
Our Cash Asset ratio excluding marketable securities (i.e. cash/current liabilities) under current conditions is around 0.04. Ideally, our cash ratio (including marketable securities) should be at 1.0 or higher. Thus, common stock is utilized to help offset cash available to cover immediate expenses.
In this respect, all third parties are un-related parties who have made advances to the Company (“Third Party Lenders”) over the years and have become faithful shareholders of and investors in the Company. The Company’s five-year business plan started from 2010 to complete its vertical integration development of business activities by the end of year 2014 requiring substantial development capital as well as working capital and, as such, said third party advances helped to bridge the short fall of cash flow required to carry out our development. Also, over the years we have built good rapport with all of our trade suppliers (creditors) having paid our obligations promptly from sufficient cash flow generated from our operations, and with the Third Party Lenders having met our obligations to them constantly and promptly partly from our cash flow generated from our operations and partly from the issuance of shares.
Apart from the reasons given above, the other reasons of why the Company has been using equity (issuance of shares) to finance part of its development expenditures have been:
| - 50 - |
The other income amounted to $1,769,873 is a combination of (1) Gain on extinguishment of debt $1,318,947 (Table 6.1), Government Grant $613,678 and other income $230,840 less interest expenses of $393,592 as of December 31, 2013 whereas as of December 31, 2012 the Other Income amounted to $1,832,234 derived from the combination of (1) Gain on extinguishment of debt $1,666,386, Government Grants $139,836 and other incomes $308,332 less interest expenses of $282,320.
Gain (loss) of extinguishment of debts
Any deficit (excess) of the fair value of the shares over the carrying cost of the debt has been reported as a gain (loss) on the extinguishment of debtsdebt of $1,051,013$1,318,947 and $817,513$1,666,386 has been credited (charged) to operations for the six monthsyears ended June 30,December 31, 2013 and 2012, respectively.
Part C. More detailed segment information
| Ratios | 2013 | 2012 | Notes | |||||||||
| Revenue growth | 89 | % | 167 | % | ||||||||
| Gross margin | 39 | % | 50 | % | ||||||||
| General and administrative expenses/Revenue | 3 | % | 6 | % | ||||||||
| EBITDA margin | 38 | % | 46 | % | ||||||||
| EBIT margin | 36 | % | 33 | % | ||||||||
| Effective Tax Rate | 0 | % | 0 | % | ||||||||
| Capex/Revenue | 27 | % | 23 | % | ||||||||
| Increase in WC/Revenue | 16 | % | 39 | % | ||||||||
| (Capex & Increase in WC)/Revenue | 43 | % | 62 | % | ||||||||
| (Depreciation and amortization)/Revenue | 2 | % | 2 | % | ||||||||
| Increase in WC/Increase in Revenue | 35 | % | 39 | % | ||||||||
| Operating CF | 2013 | 2012 | ||||||||||
| EBITDA | $ | 98 | m | $ | 64 | m | ||||||
| Capex | $ | (71 | )m | $ | (32 | )m | FCF(2 | ) | ||||
| Increase In WC | $ | (43 | )m | $ | (54 | )m | FCF(1 | ) | ||||
| Tax | - | - | ||||||||||
| Note: | ||||||||||||
| Part of the Short fall of FCF has been financed by: | ||||||||||||
| Advances granted by unrelated third parties (arranged under Promissory notes as stated in Note 6 above) (Debts) | $ | 18 | m | $ | 15 | m | ||||||
| Settlement of Debts (or advances) by the Issuance of shares | $ | 37 | m | $ | 33 | m | ||||||
Notes:
FCF (1): Formula is: (Current Asset – Current Liability) of 2013 - (Current Asset – Current Liability) of 2012
FCF (2): Formula is: (Total property and equipment + Total other assets) of 2013 - (Total property and equipment + Total other assets) of 2012+ (Depreciation and amortization) of 2013 - (Depreciation and amortization) of 2012.
Notes:
| l | In Q2 and Q3 2013, The Company indicated short fall of $17m and $13 m in FCF respectively based on the forecasted Capex & WC totaling at $118m for fiscal year 2013 enhancing a net FCF of -$2m for the year as of December 31, 2013 after taken into consideration of the equity financing of $18 m raised in fiscal year 2013. Coupling this with the short fall in FCF of -$7m at end of fiscal year 2012 making total short fall in FCF of -$9m as at December 31, 2013 explaining the reason of why net cash balance as at December 31, 2013 fell to $2m as shown in the Cash Flow Statement. |
| - 51 - |
Note (5) General and Administrative Expenses and Interest Expenses
General and administrative and interest expenses (including depreciation and amortization) increased by $585,187 (or 15.79%) from $8,668,182 for the six monthsyear ended June 30,December 31, 2012 to $9,253,369 for the year ended December 31, 2013. The increase was primarily due to increase on the depreciation and amortization amounting to $492,713 for the year ended December 31, 2013 from $1,764,288 for the year ended December 31, 2012 to $2,257,001 for the year ended December 31, 2013, and the increase in office and corporate expense of $480,453 for year ended December 31, 2013 from $1,619,888 for the year ended December 31, 2012 to $2,100,341 for the year ended December 31, 2013.
Table (to Note 5)
| Category | 2013 | 2012 | Difference | |||||||||
| Office and corporate expenses | $ | 2,100,341 | $ | 1,619,888 | $ | 480,453 | ||||||
| Wages and Salaries | $ | 1,912,616 | $ | 2,555,681 | $ | (643,065 | ||||||
| Traveling and related lodging | $ | 90,654 | $ | 77,730 | $ | 12,924 | ||||||
| Motor vehicles expenses and local transportation | $ | 148,254 | $ | 112,448 | $ | 35,806 | ||||||
| Entertainments and meals | $ | 139,452 | $ | 103,222 | $ | 36,230 | ||||||
| Others and miscellaneous | $ | 2,211,459 | $ | 2,152,605 | $ | 58,854 | ||||||
| Depreciation and amortization | $ | 2,257,001 | $ | 1,764,288 | $ | 492,713 | ||||||
| Sub-total | $ | 8,859,777 | $ | 8,385,862 | $ | 473,915 | ||||||
| Interest expenses | $ | 393,592 | $ | 282,320 | $ | 111,272 | ||||||
Note (6) Depreciation and Amortization
Depreciation and amortization increased by $1,124,427 or 47.3% to $3,502,697 for the Fiscal year ended December 31, 2013 from $2,378,270 for the fiscal year ended December 31, 2012. The increase was primarily due to the increase of depreciation by $1,053,190 to $1,496,551 for the fiscal year ended December 31, 2013 from depreciation of $443,361 for the Fiscal year ended December 31, 2012 whereas the increase of amortization by $71,237 to $2,006,146 for the fiscal year ended December 31, 2013 from amortization of $1,934,909 for the fiscal year ended December 31, 2012.
In this respect, total depreciation and amortization amounted to $3,502,697 for the year ended December 31, 2013, out of which amount, $2,257,001 was reported under general and administration expenses and $1,245,696 was reported under cost of goods sold; whereas total depreciation and amortization was at $2,378,270 for the year ended December 31, 2012 and out of which amount $1,764,288 was reported under General and Administration expenses and $613,982 was reported under cost of goods sold.
Note (7) Non-controlling interests
The table below shows the derivation of non-controlling interest:
| Names of intermediate holding subsidiaries | Macau EIJI Company Ltd. | A Power Agro Agriculture Development (Macau) Ltd. | Tri-Way Industries Ltd.(HK) | Total | ||||||||||||||||||||
| Abbreviated names | (MEIJI) | (APWAM) | (TRW) | |||||||||||||||||||||
| % of equity holding on below subsidiaries (in China) | 75 | % | 75 | % | 26 | % | 45 | % | 75 | % | ||||||||||||||
| Name of China subsidiaries | Jiangmen City Heng Sheng Tai Agriculture Development Co. Ltd.(China) | Jiangmen City Hang Mei Cattle Farm Development Co. Ltd.(China) | Qinghai Sanjiang A Power Agriculture Co. Ltd. (China) | Jiangmen City A Power Fishery Development Co. Ltd. (China) | ||||||||||||||||||||
| Abbreviated names | (JHST) | (JHMC) | (HSA) | (SJAP) | (JFD) | |||||||||||||||||||
| Bitmap Hunan Shanghua A Power Agriculture Co. Ltd. (China) | 50 | % | ||||||||||||||||||||||
| Equity % of non-controlling interest | 25 | % | 25 | % | 51.5 | % | 55 | % | 25 | % | ||||||||||||||
| Net income of the P.R.C. subsidiaries for fiscal year 2013 in $ | $ | 11,618,135 | $ | 2,000,942 | $ | 2,989,161 | $ | 26,587,699 | $ | 5,957,259 | $ | 49,153,196 | ||||||||||||
| Non-controlling interest’s shares of Net income in $ | $ | 2,904,534 | $ | 500,236 | $ | 717,398 | $ | 14,623,235 | $ | 1,489,314 | $ | 20,234,717 | ||||||||||||
| - 52 - |
The Net Income attributed to non-controlling interest is totaling to $20,234,717 shared by (JHST, JHMC, HSA, SJAP and JFD collectively) in the Fiscal year 2013 as shown in the table above.
Note (8) Earnings per share (EPS)
Earnings per share reduced by $0.81 (basic) and $0.43 (diluted) per share from EPS of $6.95 (basic) and $6.19 (diluted) in the Fiscal Year 2012 to EPS of $6.14 (basic) and $5.76 (diluted) in the Fiscal Year 2013. The reason for the reduction is primarily due to the increment of issuance of approximately 3,838,384 shares from its weighted average number of shares outstanding of approximately 8,284,536 as of December 31, 2012 to approximately 12,093,973 as of December 31, 2013.
Part E. MD & A on Balance Sheet of Consolidated Results of Continued Operations for the Fiscal year 2013 compared to the Fiscal year 2012
| Consolidated Balance sheets | 2013 | 2012 | Difference | Note | ||||||||||||
| (Restated) | ||||||||||||||||
| $ | $ | $ | ||||||||||||||
| ASSETS | ||||||||||||||||
| Current assets | ||||||||||||||||
| Cash and cash equivalents | 1,327,274 | 8,424,265 | (7,096,991 | ) | ||||||||||||
| Inventories | 8,148,203 | 17,114,755 | (8,966,552 | ) | 9 | |||||||||||
| Costs and estimated earnings in excess of billings on uncompleted contracts | 663,296 | 2,336,880 | (1,673,584 | ) | ||||||||||||
| Deposits and prepaid expenses | 56,609,576 | 41,278,072 | 15,331,504 | 10 | ||||||||||||
| Accounts receivable | 82,057,942 | 52,948,350 | 29,109,592 | 11 | ||||||||||||
| Other receivables | 3,782,771 | 5,954,248 | (2,171,477 | ) | ||||||||||||
| Total current assets | 152,589,062 | 128,056,570 | 24,532,492 | |||||||||||||
| Property and equipment | ||||||||||||||||
| Property and equipment, net of accumulated depreciation | 46,487,058 | 19,946,302 | 26,540,756 | 12 | ||||||||||||
| Construction in progress | 59,134,732 | 24,492,510 | 34,642,222 | 13 | ||||||||||||
| Land use rights, net of accumulated amortization | 60,705,829 | 55,733,246 | 4,972,583 | 14 | ||||||||||||
| Total property and equipment | 166,327,619 | 100,172,058 | 66,155,561 | |||||||||||||
| Other non-current assets | ||||||||||||||||
| Goodwill | 724,940 | 724,940 | - | |||||||||||||
| Proprietary technologies, net of accumulated amortization | 12,081,470 | 8,114,624 | 3,966,846 | 15 | ||||||||||||
| Temporary deposits paid to entities for investments in Sino joint venture companies | 35,791,840 | 6,030,785 | 29,761,055 | 10 20 | ||||||||||||
| License rights | - | 1 | (1 | ) | ||||||||||||
| Total other non-current assets | 48,598,250 | 14,870,350 | 33,727,900 | |||||||||||||
| Total assets | 367,514,931 | 243,098,978 | 124,415,953 | |||||||||||||
| Current liabilities | 16 | |||||||||||||||
| Accounts payable and accrued expenses | 11,055,194 | 5,762,643 | 5,292,551 | |||||||||||||
| Billings in excess of costs and estimated earnings on uncompleted contracts | 3,146,956 | 2,790,084 | 356,872 | |||||||||||||
| Due to a director | 1,793,768 | 3,345,803 | (1,552,035 | ) | ||||||||||||
| Dividends payable | - | 951,308 | 2,195,679 | |||||||||||||
| Series F Non-convertible preferred stock redemption payable | 3,146,063 | - | 3,146,063 | |||||||||||||
| Other payables | 10,768,786 | 6,654,478 | 4,114,308 | |||||||||||||
| Short term bank loan | 4,100,377 | 3,181,927 | 918,450 | |||||||||||||
| Total current liabilities | 34,011,144 | 22,686,243 | 11,325,825 | |||||||||||||
| Non-current liabilities | ||||||||||||||||
| Series F Non-convertible preferred stock redemption payable | - | 3,146,063 | (3,146,063 | ) | ||||||||||||
| Bonds payable | 1,725,000 | - | 1,725,000 | |||||||||||||
| Long term debts | 180,417 | 175,006 | (94,589 | ) | ||||||||||||
| Total non-current liabilities | 1,905,417 | 3,321,069 | (1,415,652 | ) | ||||||||||||
| Stockholders’ equity | ||||||||||||||||
| Preferred stock | ||||||||||||||||
| Series A preferred stock | - | - | - | |||||||||||||
| Series B convertible preferred stock | 7,000 | 10,000 | (3,000 | ) | ||||||||||||
| Series F Non-convertible preferred stock | - | - | - | 16 B | ||||||||||||
| Common stock | 137,602 | 100,005 | 37,597 | |||||||||||||
| Additional paid-in capital | 104,913,676 | 88,091,691 | 16,821,985 | |||||||||||||
| Retained earnings | 181,196,498 | 106,989,969 | 74,206,529 | |||||||||||||
| Accumulated other comprehensive income | 6,260,131 | 3,868,274 | 2,391,857 | |||||||||||||
| Treasury stock | (1,250,000 | ) | (1,250,000 | ) | - | |||||||||||
| Total SIAF Inc. and subsidiaries’ equity | 291,264,907 | 197,809,939 | 93,454,968 | |||||||||||||
| Non-controlling interest | 40,333,463 | 19,281,727 | 21,051,736 | |||||||||||||
| Total stockholders’ equity | 331,598,370 | 217,091,666 | 114,506,704 | |||||||||||||
| Total liabilities and stockholders’ equity | 367,514,931 | 243,098,978 | 124,415,953 | |||||||||||||
| - 53 - |
This Part CE discusses and analyzes certain items (marked with notes) that we believe would assist our shareholders in obtaining a better understanding on the Company’s results of operations and financial condition:
(A) BreakdownNote (9) Break down of Balance Sheet items (1) on total current assets:inventories
| As of June 30, 2013 | Note | |||||||
| $ | ||||||||
| Cash and cash equivalents | 9,391,449 | |||||||
| Inventories | 18,887,433 | 1 | ||||||
| Cost and estimated earnings in excess of billings on uncompleted contracts | 1,286,775 | |||||||
| Deposits and prepaid expenses | 52,091,997 | 2 | ||||||
| Accounts receivable, net of allowance for doubtful debts | 82,373,870 | 3 | ||||||
| Other receivables | 6,374,272 | 4 | ||||||
| 170,405,796 | ||||||||
| 2013 | 2012 | Difference | ||||||||||
| $ | $ | $ | ||||||||||
| Sleepy cods, prawns, eels and marble goble | 1,761,111 | 4,612,090 | (2,850,979 | ) | ||||||||
| Harvested HU plantation | 719,329 | - | 719,329 | |||||||||
| Bread grass | 580,954 | 1,473,653 | (892,699 | ) | ||||||||
| Beef cattle | 1,951,962 | 2,569,659 | (617,697 | ) | ||||||||
| Organic fertilizer | 895,670 | 737,166 | 158,504 | |||||||||
| Forage for cattle and consumable | 684,979 | 278,900 | 406,079 | |||||||||
| Raw materials for bread grass and organic fertilizer | 855,493 | 6,765,536 | (5,910,043 | ) | ||||||||
| Immature seeds | 698,704 | 677,751 | 20,953 | |||||||||
| 8,148,203 | 17,114,755 | (8,966,552 | ) | |||||||||
Note (1): Breakdown of Inventories
Note (2)(10) Breakdown of Deposits and Prepaid Expenses
| 2013 | 2012 | Difference | Note | |||||||||||||
| $ | $ | $ | ||||||||||||||
| Deposits for | ||||||||||||||||
| - purchases of equipment | 4,886,048 | 318,192 | 4,567,856 | |||||||||||||
| - acquisition of land use right | 7,826,508 | 7,826,508 | 0 | 10.1 | ||||||||||||
| - inventory purchases | 9,771,383 | 2,228,854 | 7,542,529 | |||||||||||||
| - aquaculture contract | - | 7,062,600 | (7,062,600 | ) | ||||||||||||
| - building materials | 1,281,935 | 2,000,000 | (718,065 | ) | ||||||||||||
| - proprietary technology | 4,404,210 | 2,254,839 | 2,149,371 | |||||||||||||
| - construction in progress | 23,021,316 | 14,423,021 | 8,598,295 | |||||||||||||
| Shares issued for employee compensation and oversea professional fee | 100,308 | 271,800 | (171,492 | ) | ||||||||||||
| Miscellaneous | - | 4,892,258 | (4,892,258 | ) | ||||||||||||
| 51,291,708 | 41,278,072 | 10,013,636 | ||||||||||||||
Note (2A)(10.1) Breakdown of Deposit for- acquisition of Land Use Right:
As of June 30,December 31, 2013, we have $7,826,508 for a deposit paid for the acquisition of a Land Use Right derived from the following transactions:
| - 54 - |
Note (3)(10.2) Information of “Temporary deposits paid to entities for investments in future Sino Foreign Joint Venture companies”:
| Under account of Subsidiary | Segment of | Project name | Estimated total Asset value | Estimated time of Acquisition | Current status of Project | Deposit & prepayment made as of 12.31.2013 | Land Bank or Built Up area | % equivalent to equity paid | ||||||||||||||||
| $ | $ | m2 | ||||||||||||||||||||||
| SIAF | Corporate | Trade Center | 3.5 million | own development | 30% completed | 4,086,941 | 5,000 | 31 | % | |||||||||||||||
| Seafood Center | 1,032,914 | |||||||||||||||||||||||
| CA | Fishery | Fish Farm (2) | 26.22 Million | 2016 | 2 out 4 phases completed | 6,000,000 | 23,100 | 23 | % | |||||||||||||||
| Prawn Farm (1) | 20.93 Million | 2016 | in operation | 14,554,578 | 165,000 | 56 | % | |||||||||||||||||
| Prawn Farm (2) | 29.18 Million | 2014 | Part operational Part work in progress | 9,877,218 | 120,000 developed 96,000 m2 undeveloped | 29 | % | |||||||||||||||||
| MEIJI | Cattle | Cattle Farm (2) | 15.88 Million | 2014 | 95% completed | 5,558,057 | 230,300 | 35 | % | |||||||||||||||
| 41,109,708 | ||||||||||||||||||||||||
Note (11) Breakdown of Accounts Receivable:receivable:
| As of June 30, 2013 | ||||||||||||||||||||
| Accounts receivable | 0-30 days past due | 31-90 days past due | 91-120 days past due | over 120 days and less than 1 year past due | ||||||||||||||||
| $ | $ | $ | $ | $ | ||||||||||||||||
| Consulting and Service (from 6 contracts) totaling | 49,195,415 | 12,564,089 | 27,954,719 | 8,003,832 | 672,775 | |||||||||||||||
| Sales of Fish (from Farms and from imports) | 10,962,674 | 4,363,031 | 3,399,821 | 3,199,821 | - | |||||||||||||||
| Sales of Cattle and Beef Meats (from Enping Farm) | 1,558,096 | 16,390 | 1,541,706 | - | - | |||||||||||||||
| Sales of HU Flowers (Dried) | 3,364,099 | 2,912,015 | 452,084 | - | - | |||||||||||||||
| Sales Fertilizer, Bulk Stock feed and Cattle by SJYL | 14,180,446 | 4,861,406 | 5,759,543 | 3,542,171 | 17,326 | |||||||||||||||
| Sales Fertilizer from H.S.A.. | 3,113,140 | 847,118 | 1,745,787 | 505,689 | 14,547 | |||||||||||||||
| Total Accounts Receivable | 82,373,870 | 25,564,049 | 40,853,660 | 15,251,513 | 704,648 | |||||||||||||||
| Percentage of total population | 100 | % | 31 | % | 50 | % | 19 | % | 1 | % | ||||||||||
| 2013 | ||||||||||||||||||||
| Accounts receivable | 0-30 days | 31-90 days | 91-120 days | over 120 days and less than 1 year | ||||||||||||||||
| $ | $ | $ | $ | $ | ||||||||||||||||
| Consulting and Service totaling | ||||||||||||||||||||
| CA | 6,227,490 | 3,810,000 | - | - | 2,417,490 | |||||||||||||||
| MEIJI | 4,357,344 | - | - | 4,100,787 | 256,557 | |||||||||||||||
| SIAF | 6,781,796 | - | 1,018,186 | 1,227,746 | 4,535,864 | |||||||||||||||
| Sales of Live Fish, eels and prawns (from Farms) (CA) | 31,150,612 | 7,390,105 | 8,858,837 | 14,619,416 | 282,254 | |||||||||||||||
| Sales of imported seafood (SIAF) | 1,248,143 | 1,248,143 | - | - | - | |||||||||||||||
| Sales of Cattle and Beef Meats (from Enping Farm) (MEIJI) | 4,452,086 | 1,174,262 | 1,342,205 | 1,935,619 | - | |||||||||||||||
| Sales of HU Flowers (Fresh & Dried) (JHST) | 9,568,198 | - | 8,316,445 | 1,251,753 | - | |||||||||||||||
| Sales Fertilizer, Bulk Stock feed and Cattle by (SJAP) | 13,505,551 | 5,957,772 | 7,289,257 | 249,388 | 9,134 | |||||||||||||||
| Sales Fertilizer from (HSA) | 4,334,788 | 1,284,122 | 2,135,652 | 556,585 | 358,429 | |||||||||||||||
| Sales of Live Fish, eels and prawns (JFD) | 431,934 | - | - | - | 431,934 | |||||||||||||||
| Total | 82,057,942 | 20,864,404 | 28,960,582 | 23,941,294 | 8,291,662 | |||||||||||||||
Information on trading terms and provision for diminution in value of accounts receivable:
None of our accounts receivable is more than 12 months old. Receivables from revenue derived from consulting and services billed for work completed are within our normal trading terms capped within 180 days with our principal investor and therefore no diminution in value is required, as the quality of the receivable is not in doubt.
| - 55 - |
Fish Sales: Most farmed fish are sold to wholesalers at prevailing daily market prices capped within 90 days trading terms with a small portion at 180 days (for oversized fish, as the sale of oversized fish takes time to sell). We sold over US$10.939 million in live fish, eels and prawns (Live seafood) to the wholesalers during the second quarterfiscal year 2013, and as of June 30,December 31, 2013, accounts receivable of $0$8,291,662 was over 180120 days. These debtors are wholesalers who are profitable and viable businesses with a good track record and therefore provision of diminution in value is not required as collection is not in doubt.
Sales of dried HU flowers: The dried flowers were sold to wholesalers in line with our longer trading terms (e.g., up to 180 days) so as to offset their holding cost so that they could sell the dried flowers through the winter months (from December 2013 to June 2014 when the new season starts). We agreed with the wholesalers that they would buy our dried flowers as soon as we produce them. Therefore, we consider the receivables from the sales of dried HU flowers to be from wholesalers with a good track record and therefore provision for diminution in value is not required as collection is not in doubt. As shown in the table above, $3,364,099$9,568,198 sales revenues are derived from new season sales whereas all 2012 season’s sale was paid and collected.
Sales of fertilizer and bulk Livestock Feed: These were sales made to regional farmers who are contracting to grow crops and pastures for us using and purchasing our fertilizer and we in turn are to buy their cattle that are fed with bulk cattle feed purchased from us, such that we are ultimately to repurchase the cattle. Under this term of arrangements our accounts receivable are normally carried forward until such time they can be offset against our account payables (that is, the amount owed for the amount of crops and pastures is offset against the amount of cattle that we have broughtbought from them, respectively). Therefore there is no need to provide any diminution in value as these debtors are on-going and profitable and viable businesses with a good track record with us and collection from them is not in doubt.
Information on Concentration of credit risk of account receivables:
We had 4 major customers (referring to Customer A, B, C and D mentioned in the Financial Statement of this report under Note 2.26)Note), only who have accounted for ten percent or more of our consolidated revenues during the sixtwelve months ended June 30,December 31, 2013 shown in the table below:
| Six months ended June 30 2013 | Year ended December 31, 2013 | |||||||||||||||||||
| % of total Revenue | $ | Total Revenue | % of total Revenue | Total Revenue | ||||||||||||||||
| Customer A | 18.57 | % | 20,338,677 | 18.09 | % | $ | 47,284,512 | |||||||||||||
| Customer B | 16.71 | % | 19,293,639 | 15.02 | % | 39,275,564 | ||||||||||||||
| Customer C | 12.32 | % | 13,494,997 | 9.24 | % | 24,161,701 | ||||||||||||||
| Customer D | 10.09 | % | 11,051,367 | 9.14 | % | 23,905,568 | ||||||||||||||
| 57.69 | % | 64,178,680 | 109,508,080 | 51.49 | % | $ | 134,627,345 | |||||||||||||
Customer A is WSC 1, which is owned and operated by Guangzhou City A Power NaWei Trading Co. Ltd (“APNW”). CA.CA was the consulting engineer responsible for the construction of WSC 1 and1and development of its business operation via a Consulting and Service Contract granted by APNW. APNW is now one of our main wholesalers, which we bill our sales of seafood to (including live and frozen seafood). to. APNW then distributes the seafood to other wholesalers in various cities in China. WSC 1 is ideally situated ideally at the center of all interprovincial logistic services. At the same time, APNW has obtained all relevant import quotasImport Quotas and permitsPermits during the six monthsfiscal year ended June 30,December 31, 2013. As such, SIAF uses APNW’s permits for its import and export trades to be carried out in China. Transactions through WSC 1 had 18.57%generated 18.09 % of our total consolidated revenue (equivalent to $20,338,677$47,284,512 out of our total revenue of $109,508,080)$261,425,813) derived collectively from the following segments of activities:
| Six months ended June 30, 2013 | ||||||||||||||||||||||||||||||
| Customer B with | Customer B with | Year ended December 31, 2013 | ||||||||||||||||||||||||||||
| Name of company | Segments | Operation Division | Abbreviation name | % of total consolidated Revenue | Amount in $ | Segments | Operation Division | Abbreviation name | % of total consolidated revenue | Amount in $ | ||||||||||||||||||||
| CA | Fishery | Consulting and Services | Wholesale Center (1) | 1.61 | % | 1,760,135 | Fishery | Consulting and Services | Wholesale Center (1) | 0.67 | % | 1,760,135 | ||||||||||||||||||
| Sales of fish (from Fish Farm 1) | 2.79 | % | 3,058,089 | Sales of fish (from Fish Farm 1) | 3.07 | % | 8,032,931 | |||||||||||||||||||||||
| Sales of fish / eels from Contract Growers | 2.89 | % | 3,166,528 | Sales of fish/eels from Contract Growers | 5.07 | % | 13,252,305 | |||||||||||||||||||||||
| SIAF | Corporate | Trading sales of seafood | 11.28 | % | 12,353,925 | Corporate | Trading sales of seafood | 9.27 | % | 24,239,141 | ||||||||||||||||||||
| 18.57 | % | 20,338,677 | 18.09 | % | 47,284,512 | |||||||||||||||||||||||||
| - 56 - |
Customer B is Guangzhou Wholesale market (Store 8) represented by Mr. Han Zhiqiang who distributes our live fish (or other live aquatic animals, e.g., prawns and eels) to other wholesalers at the Guangzhou Wholesale Fish Markets. While there are over 300 live seafood wholesalers at the Guangzhou wholesale markets, there are only about 30 of them are in Mr. Han’s group of wholesalers handling the sales of our aquatic seafood. Furthermore, although we billed our live aquatic seafood sales to one wholesaler (Mr. Han) that did not mean that our live aquatic seafood was sold by one wholesaler. During the sixtwelve months period ended June 30,December 31, 2013, Transactions through Mr. Han had 16.71%generated15.02 % of our total consolidated revenue (equivalent to $18,293,639$39,275,564 out of our total revenue of $109,508,080)$261,425,813) derived from the sales of CA’s live aquatic seafood under the segment of Fishery.
Customer C is one of our main agents, namely Mr. Li Changfa,Hongzhen who distributes SJAP’s organic fertilizer, bulk livestock feed and concentrated livestock feed to our corporativecooperative farmers and other regional farmers. During the sixtwelve months period ended June 30,December 31, 2013, Mr. Li had 12.32%transacted 9.24% of our total consolidated revenue (equivalent to $13,494,997$24,161,701 out of our total revenue of $109,508,080)$261,425,813) derived from the salessale of SJAP’s organic fertile, bulk livestock feed and concentrated livestock feed under the segment of Organic Fertilizer and Bread Grass.
Customer D is one of our main agents, namely Mr. Liu Guang is the Chinese legal representative of the group of businessmen with whomcattle wholesaler selling matured Cattle for CA contracts under a Consulting and Service Contractalso selling young Cattle to construct and develop Prawn Farm 2 and to develop its related business operation. During the six months period ended June 30, 2013, Mr. Liu had 10.09% of our total consolidated revenue (equivalent to $11,051,367 out of our total revenue of $109,508,080) derived from CA’s Consulting and Service Contract under the segment of Fishery.MEIJI.
The Company had 4 major customers whose accounts receivable balance individually represented the following percentages of the Company’s total accounts receivable during the six months ended June 30,as of December 31, 2013:
| As of June 30, 2013 | Total | 2013 | ||||||||||||||||||
| % of total Accounts receivables | amount in $ | Accounts receivables | % of total Accounts receivables | Total Accounts receivables | ||||||||||||||||
| Customer A | 15.21 | % | 12,593,302 | 12.86 | % | $ | 10,546,705 | |||||||||||||
| Customer B | 15.01 | % | 12,427,710 | 10.23 | % | 8,387,732 | ||||||||||||||
| Customer C | 12.03 | % | 9,960,383 | 8.69 | % | 7,130,399 | ||||||||||||||
| Customer D | 11.69 | % | 9,678,876 | 8.36 | % | 6,857,426 | ||||||||||||||
| 53.94 | % | 44,660,271 | 82,796,201 | 40.14 | % | $ | 32,922,262 | |||||||||||||
Note4 BreakdownNote (12) Property and equipment, net of Other Receivables:accumulation depreciation
| $ | ||||||||
| Plant and machinery | 5,263,933 | |||||||
| Structure and leasehold improvements | 36,308,860 | |||||||
| Mature seeds and herbage cultivation | 6,294,372 | |||||||
| Furniture and equipment | 391,608 | |||||||
| Motor vehicles | 765,858 | |||||||
| 49,024,631 | ||||||||
| ) | ||||||||
| Net carrying amount | 46,487,058 | |||||||
Note (13) Construction in progress
| 2013 | |||||||||
| Construction in progress | |||||||||
| - Office, warehouse and organic fertilizer plant in HAS | |||||||||
| - Organic fertilizer and bread grass production plant and office building | 8,600,187 | ||||||||
| - Rangeland for beef cattle and office building | 26,054,582 | ||||||||
| - Fish pond | 1,718,799 | ||||||||
| 59,134,732 | |||||||||
| - 57 - |
Note 4A:(14) Land Use Rights, net of accumulated amortization:
| Item | Owner | Location | Acres | Date Acquired | Tenure | Expiry dates | Cost $ | Amortization $ | 2013.12.31 Balance $ | Nature of ownership | Nature of project | |||||||||||||||||
| Hunan lot1 | HSA | Ouchi Village, Fenghuo Town, Linli County | 31.92 | 4/5/2011 | 43 | 4/4/2054 | 242,703 | 470 | 227,181 | Lease | Fertilizer production | |||||||||||||||||
| Hunan lot2 | HSA | Ouchi Village, Fenghuo Town, Linli County | 247.05 | 7/1/2011 | 60 | 6/30/2071 | 36,666,141 | 50,925 | 35,138,385 | Management Right | Pasture growing | |||||||||||||||||
| Hunan lot3 | HSA | Ouchi Village, Fenghuo Town, Linli County | 8.24 | 5/24/2011 | 40 | 5/23/2051 | 378,489 | 789 | 353,257 | Land Use Rights | Fertilizer production | |||||||||||||||||
| Guangdong lot 1 | JHST | Yane Village, Liangxi Town, Enping City | 8.23 | 8/10/2007 | 60 | 8/9/2067 | 1,064,501 | 1,478 | 950,658 | Management Right | HU Plantation | |||||||||||||||||
| Guangdong lot 2 | JHST | Nandu Village of Yane Village, Liangxi Town, Enping City | 27.78 | 3/14/2007 | 60 | 3/13/2067 | 1,037,273 | 1,441 | 919,139 | Management Right | HU Plantation | |||||||||||||||||
| Guangdong lot 3 | JHST | Nandu Village of Yane Village, Liangxi Town, Enping City | 60.72 | 3/14/2007 | 60 | 3/13/2067 | 2,267,363 | 3,149 | 2,009,136 | Management Right | HU Plantation | |||||||||||||||||
| Guangdong lot 4 | JHST | Nandu Village of Yane Village, Liangxi Town, Enping City | 54.68 | 9/12/2007 | 60 | 9/11/2067 | 2,041,949 | 2,836 | 1,826,410 | Management Right | HU Plantation | |||||||||||||||||
| Guangdong lot 5 | JHST | Jishilu Village of Dawan Village, Juntang Town, Enping City | 28.82 | 9/12/2007 | 60 | 9/11/2067 | 960,416 | 1,334 | 859,039 | Management Right | HU Plantation | |||||||||||||||||
| Guangdong lot 6 | JHST | Liankai Village of Niujiang Town, Enping City | 31.84 | 1/1/2008 | 60 | 12/31/2068 | 821,445 | 1,141 | 739,300 | Management Right | Fish Farm | |||||||||||||||||
| Guangdong lot 7 | JHST | Nandu Village of Yane Village, Liangxi Town, Enping City | 41.18 | 1/1/2011 | 26 | 12/31/2037 | 5,716,764 | 18,323 | 5,057,137 | Management Right | HU Plantation | |||||||||||||||||
| Guangdong lot 8 | JHST | Shangchong Village of Yane Village, Liangxi Town, Enping City | 11.28 | 1/1/2011 | 26 | 12/31/2037 | 1,566,393 | 5,020 | 1,385,656 | Management Right | HU Plantation | |||||||||||||||||
| Guangdong lot 9 | MEIJI | Xiaoban Village of Yane Village, Liangxi Town, Enping City | 41.18 | 4/1/2011 | 20 | 3/31/2031 | 5,082,136 | 21,176 | 4,383,342 | Management Right | Cattle Farm | |||||||||||||||||
| Qinghai lot 1 | SJAP | No. 498, Bei Da Road, Chengguan Town of Huangyuan County, Xining City, Qinghai Province | 21.09 | 11/1/2011 | 40 | 10/30/2051 | 527,234 | 1,098 | 498,676 | Land Use Right & Building ownership | Cattle farm, fertilizer and livestock feed production | |||||||||||||||||
| Guangdong lot 10 | JHST | Niu Jiang Town, Liangxi Town, Enping City | 6.27 | 3/4/2013 | 10 | 3/4/2023 | 489,904 | 4,083 | 449,079 | Management Right (lease) | Processing factory | |||||||||||||||||
| JHST | Land improvement cost incurred | 3,914,275 | 6,155 | 3,908,120 | ||||||||||||||||||||||||
| Exchange difference | 2,415,628 | 2,001,313 | ||||||||||||||||||||||||||
| 620.28 | 65,192,615 | 119,418 | 60,705,829 | |||||||||||||||||||||||||
Note (15) Other Receivables
| 2013 | Note | |||||||
| $ | ||||||||
| Advanced to employees | 109,278 | |||||||
| Advanced to suppliers | 3,673,493 | 15. | A | |||||
| 3,782,771 | ||||||||
| - 58 - |
Note 15.A: Breakdown of Advances to Suppliers at SJAP’s operations:
At SJAP it is a common practice to make cash advances to our corporativecooperative growers (presently standing at 100 members) who are our suppliers, to carry them through respective growing periods (for cropping or pasturing or cattle growing purposes) before final harvests of producesproduce or salessale of their cattle. On average, it works out at less than US$63,742$2,700 per member whichthat in the management’s opinion is a normal ongoing seasonalseason to season process deemed fair and equitable. In this respect, as the said average increases it means that the average corporativecooperative farmer is increasing his productivity (whether in the growing of crops or cattle), and in simple terms, it represents good progress indicating that SJAP’s revenue is also increasing.
(B). Breakdown of Balance Sheet Item (2) onNote (16) Current Liabilities:
| As at June 30, 2013 | Note | As at December 31, 2013 | Note | |||||||||||||
| Current liabilities | ||||||||||||||||
| Accounts payable and accruals | 8,368,834 | 7 | 11,055,194 | 16. | A | |||||||||||
| Billings in excess of cost and estimated earnings on uncompleted contracts | 922,375 | 3,146,956 | ||||||||||||||
| Dividend Payables | - | 16 | B | |||||||||||||
| Series F Non-convertible preferred stock redemption payable | 3,146,063 | |||||||||||||||
| Due to a director | 3,257,085 | 1,793,768 | ||||||||||||||
| Other payables | 10,259,178 | 8 | 10,768,786 | 16. | C | |||||||||||
| Short term bank loan | 2,265,849 | 4,100,377 | ||||||||||||||
| Total current liabilities | 25,073,321 | |||||||||||||||
| 34,011,144 | ||||||||||||||||
Note 7.16A: Accounts payables and accrued expenses clarification:
Our current trading environment is limited to limiteda number of suppliers who will offer prolonged credit terms means that most purchases are paid for in cash or short credit terms (7 to 10 days), and in a way this allows us better bargaining ability to obtain cash discounts resulting in the low trade account payables balance of $8,368,834$11,055,194 representing about 7.65%4.2 % of total sales of $109.5$261 million for the reasons stated below:
Our main Account Payables during the six monthsyear ended June 30,December 31, 2013 were generated from the following activities:
| 1. | We supply the following cost elements: our own staff, engineering and technology that enhanced our profit margins and reduced the overall cost of sales. Consulting and |
| 2. | Implementation, supervision, training and associated management work and most of the building sub-contractors worked |
| 3. | Fish sales started gradually in late 2011, and the cost of sales was averaged |
| 4. | Cattle sales at SJAP’s own cattle stations and from its |
| - 59 - |
| 5. | In SJAP, the bulk of our fertilizers were sold to farmers who are growing pastures and crops for us such that their fertilizer sales were kept as book entries that would be offset with the pastures and crops that we would buy back from them. In the case of |
| 6. | Bulk livestock feed are produced by regional |
Note 8.Analysis(16.B): Series F Non-convertible preferred stock
On August 22, 2012, the Company’s Board of Directors declared that the Company’s stockholders were entitled to receive one share of restricted Series F Non-convertible Preferred Stock for every 100 shares of Common Stock then owned by the stockholders as of September 28, 2012, with lesser or greater amounts being rounded up to the nearest 100 shares of Common Stock for purpose of the computing the dividend. The intended holders of record of shares of Series F Non - Convertible Preferred Stock were to be entitled to a coupon payment directly from the Company at the redemption rate of $3.40 per share and be payable on May 30, 2014. During Q1 2013, the transfer agent of the Company recorded 924,180 shares of Series F Non-Convertible preferred stock on the account. But, the Company did not issue physical shares and only issued coupons to notify respective shareholders on that date. The figure 924,180 was based on the number of shares of Common Stock (prior to the Reverse Split) as of September 28, 2012 of 91,931,287 shares, calculated at one share of Series F Non-Convertible preferred stock for every 100 shares of Common Stock with decimal numbers being rounded up to one. The recipients of the coupons were originally entitled to a coupon payment directly from the Company at the redemption rate of $3.40 per share and be payable on May 30, 2014, which date was subsequently postponed to May 30, 2015 (the “Coupon Redemption Date”). Upon the Coupon Redemption Date, holders of the coupon shall be entitled to a lump sum cash payment directly from the Company equal to $3.40 for every coupon then held (the “Redemption”). Upon Redemption, the Series F Preferred Stock shall terminate and thereafter cease to exist
Note (16C): Analysis of Other Payables:
As of June 30,December 31 2013, we have other payables totaling $10,259,178,$10,768,786, composed of the following:
PromissoryFor the fiscal year ended December 31 2013, we issued promissory notes amounting to $4,477,414 were issued$18,303,238 to unrelated third parties for advances granted by third parties collectively to the Company (and/or to its subsidiaries) that are personally guaranteed by a director, repayable within two years at interest free term. Promissory notes could be repaid either by cash or in shares of the Company or a combination thereof. If shares settled debt amounts, are settled by shares, theirthe respective share conversion rates will be determined by both parties at the time of settlement. During fiscal year 2013 we redeemed $18,030,632 of promissory notes for advances granted by third parties in fiscal year 2012 as well as in early months of 2013 by the issuance of shares leaving a balance of $3,625,000 of promissory notes still due and outstanding as of December 31, 2013.
A grant of $2,192,825 paid by$2,428,243 was received from the Chinese Governmentgovernment to SJAP for the development of a certain project,project; however it is the law of China such that if SJAP will notproves to be ableunable to complete the said project, SJAPit will have to repay the said grant to the Government. As of June 30,December 31 2013, althoughas work is in progress on the said project but it is not yet completed, the grant is recorded as other payables.
OtherAlso in fiscal year 2013, there were other advances that were given by other unrelated third parties collectively to our subsidiaries with no fixed term of repayment at interest free terms that do not have any promissory note or agreement but verbal understanding amountingunderstandings. These advances amount to $3,593,095.$4,715,543 unpaid and outstanding as at December 31, 2013.
(C). BreakdownIncome Taxes
The Company was incorporated in the State of Income Statements (1) Segment Item – Revenue, CostNevada, in the United States of SalesAmerica. The Company has no trading operations in United States of America and Gross Profit (forno US corporate tax has been provided for in the three months ended June 30, 2013):
| Sales Revenue | % of total | Cost of sales | % of sales | Gross Profit | % of sales | |||||||||||||||||||||||
| Segments | Q22013 | Revenue | Q22013 | Revenue | Q22013 | Revenue | Note | |||||||||||||||||||||
| $ | $ | $ | ||||||||||||||||||||||||||
| Fishery Sector | ||||||||||||||||||||||||||||
| CA | ||||||||||||||||||||||||||||
| Consulting and Service | 6,338,929 | 12 | % | 3,286,211 | 52 | % | 3,052,718 | 38 | % | a | ||||||||||||||||||
| Others in sales of Fish, Prawns and commissions etc. | 11,565,177 | 21 | % | 9,371,504 | 81 | % | 2,193,673 | 19 | % | b | ||||||||||||||||||
| Cattle Farm Sector | ||||||||||||||||||||||||||||
| MEIJI | ||||||||||||||||||||||||||||
| Consulting and Service | 2,480,443 | 5 | % | 1,652,711 | 67 | % | 827,732 | 10 | % | d | ||||||||||||||||||
| Others in sales of cattle, meat and commission etc. | 3,940,718 | 7 | % | 2,755,886 | 70 | % | 1,184,832 | 30 | % | e | ||||||||||||||||||
| Beef,Organic fertilizer Sector | ||||||||||||||||||||||||||||
| Qinghai Sanjiang A Power, HuangYuan, Xining (45% subsidiary) | ||||||||||||||||||||||||||||
| Fertilizer | 2,118,342 | 4 | % | 920,411 | 43 | % | 1,197,931 | 57 | % | f | ||||||||||||||||||
| Bulk Live Stock Feed | 2,193,056 | 4 | % | 886,014 | 40 | % | 1,307,042 | 60 | % | g | ||||||||||||||||||
| Concentrated Live-stock Feed and related products | 2,700,277 | 5 | % | 1,640,523 | 61 | % | 1,059,754 | 39 | % | h | ||||||||||||||||||
| Cattle | 7,359,619 | 14 | % | 5,878,075 | 80 | % | 1,481,544 | 20 | % | i | ||||||||||||||||||
| Hunan Shanghua A Power (75% Subsidiary) | ||||||||||||||||||||||||||||
| Organic Fertilizer (ex-stocks supplied by SJAP) | 550,054 | 1 | % | 441,821 | 80 | % | 108,233 | 20 | % | j | ||||||||||||||||||
| 100% pure organic mixed fertilizer | 2,025,030 | 4 | % | 1,148,980 | 57 | % | 876,050 | 44 | % | k | ||||||||||||||||||
| HU Plant Sector | ||||||||||||||||||||||||||||
| Jiang Men HST (75% subsidiary) | 3,554,986 | 7 | % | 1,260,957 | 35 | % | 2,294,029 | 65 | % | l | ||||||||||||||||||
| Corporate Sector (SIAF) | ||||||||||||||||||||||||||||
| SIAF | - | |||||||||||||||||||||||||||
| Consulting and Service | 4,272,119 | 8 | % | 1,322,097 | 31 | % | 2,950,022 | 69 | % | m | ||||||||||||||||||
| Import and export sales others | 5,301,579 | 10 | % | 4,444,692 | 84 | % | 856,886 | 16 | % | n | ||||||||||||||||||
| o | ||||||||||||||||||||||||||||
| Total | 54,400,329 | 100 | % | 35,009,882 | 64 | % | 19,390,447 | 36 | % | |||||||||||||||||||
consolidated financial statements of the Company
Note (a), (d) and (m) Consulting and ServiceUndistributed Earnings of Foreign Subsidiaries
The table below highlights on general informationCompany intends to use the remaining accumulated and future earnings of ongoing Consultingforeign subsidiaries to expand operations outside the United States and Servicesaccordingly, undistributed earnings of foreign subsidiaries are considered to be indefinitely reinvested outside the quarterUnited States and no provision for U.S. Federal and State income tax or applicable dividend distribution tax has been provided by Capital Award, MEIJI and SIAF respectively:
Whereas CA’s revenues (Note a) generated from its Consulting and Service Contracts (“C&S”) are normal resulting Gross Profit (“GP”) margin around its general standard of (38 to 45%), MEIJI’s GP margin (Note b) (at only 10%) is much lower than its general standard (of about 30 to 35%) due primarily to its work done during the quarter mainly consisting of the finishing work of the external roads that involved many sub-contractors who are registered in the panels of the Government that did not allow MEIJI to gain higher margins and at the same time, the heavy rainy weather of the quarter interrupted many working schedules arranged for the development of Cattle Farm 2 that involved extra costs and SIAF’s work (Note m) performed during the quarter on the development and construction of restaurants and wholesale centers involved much work that was carried out by our own departments resulting in much higher GP margins (69%) for the quarter than our normal standard (recorded at average of 45 to 55%), as such we are expecting that the GP margins will be adjusted and vary from quarter to quarter as the work progresses.thereon.
Note (b)The Company failed to file US tax returns for the years ended December 31, 2007 through December 31, 2012 in compliance with US Treasury Internal Revenue Service Code. The Company has reviewed its tax position with the assistance of US tax professional and (d): Analysisbelieves that there will be no taxes and no penalties assessed by the Internal Revenue Service in the United States of Fish sales of Capital AwardAmerica. The Company has appointed US tax professional to assist in filing these income tax returns.
During the three month period ended June 30, 2013, Capital Award’s fish sales were derived from following divisional activities:
As such, Capital Award’s overall GP margin averaged 27% during this quarter derived from the sales of its live aquatic seafood.
Note (e) and (i): referring to Analysis of Cattle sales of MEIJI and SJAP
Note (e) referring to MEIJI’s cattle sales during the three month period ended June30, 2013:
However, among MEIJI’s sales, there were 350 heads sold to the “Beijing Cattle Farm” joint venture (described above) that will be distributed by and in the “small wholesale shop” to the regional distributors and public of Beijing, a portion of the additional profits generated from which sales will be shared by MEIJI. Taking into consideration that MEIJI’s cattle production is increasing gradually and slowly in comparison to SJAP, it is possible that our Joint Ventured Beijing Cattle Farm will sell all what MEIJI will produce within the next few years and increase MEIJI’s cattle sales GP margins by an additional 10% or more starting from the third quarter of 2013.
Note (i) referring to the sales of cattle at SJAP during the three month period ended June 30, 2013:
| - |
Note (f, g, h, i and k) referring to Analysis of Fertilizer and Livestock feed of SJAP and HSA:
During the second quarter of 2013;
HSA sold 2,273 MT of organic fertilizer from inventory that was supplied by SJAP in 2012 at the average of US$242/MT and at a cost of US$182.4/MT, and also sold 4,895 MT of 100% Pure Organic mixed fertilizer (“POMF”) from production of its own fertilizer factory at average prices of US$420/MT that cost US$216/MT.
SJAP sold 12,015 MT, 14,315 MT and 6,440 MT of organic fertilizer, bulk livestock feed and concentrated livestock feed for US$176.3/MT, US$153.2 and US$419.3 and at cost of sales of US$74.2/MT, US$60.50/MT and US$252.25/MT respectively.
Note (m and n) referring to Analysis of SIAF’s import and export seafood sales:
During the quarter, we imported seafood and sold to WSC 1 under and using its import quotas and licenses deriving revenues based on 16% marked up (inclusive servicing fees of 3.5%) detailed as follows:
6 x 40’ (Sea-containers) of frozen cuttlefish and squid from Malaysia, 3 x 40” (sea-containers) of frozen Salmons from Russia, 74 MT of king sized Live Prawns (or shrimp) from Thailand via its local agent, 37.2 MT of Live Mud Crabs and 35.34 MT of Live Flower Pattern eels for total sales of $5,301,579 with GP margin at 16%.
Income Taxes
There was no income tax payable in six months ended June 30, 2013 or 2012.
Consolidated Results of Operations Fiscal Year 2012 Compared to Fiscal Year 2011
Part A .
Revenues
Revenues including continued and discontinued operations increased by $86,733,736 (or 167.18% from $51,879,903 for the year ended December 31, 2011to $138,613,639 for the year ended December 31, 2012. The increase was primarily due to maturity of all business sectors of the Company except for beef (i.e., fishery, plantation, organic fertilizer and cattle farm) as they gradually move into operational stages instead of developing stages.
The following chart illustrates the changes of revenues by category from the year ended December 31, 2012 to December 31, 2011.
| 2012 | 2011 | Difference | ||||||||||
| $ | $ | $ | ||||||||||
| Fishery | 86,346,475 | 26,422,125 | 59,924,350 | |||||||||
| Plantation | 11,878,599 | 6,113,155 | 5,765,444 | |||||||||
| Beef | 14,224,324 | 15,182,222 | -957,898 | |||||||||
| Organic Fertilizer | 9,126,240 | 2,480 | 9,123,760 | |||||||||
| Cattle Farm | 17,038,001 | 4,159,921 | 12,878,080 | |||||||||
| Total | 138,613,639 | 51,879,903 | 86,733,736 | |||||||||
Fishery : Revenue from fishery increased by $59,924,350 (or 226.80%) from $26,422,125 for the year ended December 31, 2011 to $86,346,475 for the year ended December 31, 2012. The increase in fishery was primarily due to our increase in revenue from the sale of fish and prawn and development contracting services for the year ended December 31, 2012 compared to the sale of fingerlings and consulting income for the year ended December 31, 2011.
Plantation : Revenue from our plantation increased by $5,765,444 (or 94.31%) from $6,113,155 for the year ended December 31, 2011 to $11,878,599 for the year ended December 31, 2012. The increase was primarily due to the increase of wholesale prices in fresh and dried flowers for the year ended December 31, 2012.
Beef : Revenue from beef decreased by $957,898 (or 6.31%) from $15,182,222 for the year ended December 31, 2011 to $14,224,324 for the year ended December 31, 2012. The decrease was primarily due to the fact that calves grew and become salable beef cattle.
Organic fertilizer : Revenue from organic fertilizer increased by $9,123,760 from $2,480 for the year ended December 31, 2011 to $9,126,240 for the year ended December 31, 2012. The increase was primarily due to the startup of the new business of organic fertilizer during the year ended December 31, 2012.
Cattle farm : Revenue from cattle farm development increased by $12,878,080 (or 309.57%) from $4,159,921 for the year ended December 31, 2011 to $17,038,001 for the year ended December 31, 2012. The increase was primarily due to increased development contract service of cattle farms for the year ended December 31, 2011.
Cost of Goods Sold
Cost of goods sold increased by $41,855,597 (or 155.30%) from $26,951,874 for the year ended December 31, 2011 to $68,807,471 for the year ended December 31, 2012. The increase was primarily due to the Company increasing its scale of operations from continuing operations in terms of its fishery, plantation, cattle farm and beef operations.
The following chart illustrates the changes of cost of goods sold by category from the year ended December 31, 2012 to December 31, 2011.
| Category | 2012 | 2011 | Difference | |||||||||
| $ | $ | $ | ||||||||||
| Fishery | 39,862,296 | 15,392,278 | 24,470,018 | |||||||||
| Plantation | 5,035,955 | 2,070,835 | 2,965,120 | |||||||||
| Beef | 11,031,756 | 6,974,847 | 4,056,908 | |||||||||
| Organic fertilizer | 5,266,047 | 2,406 | 5,263,640 | |||||||||
| Cattle farm | 7,611,417 | 2,511,508 | 5,099,909 | |||||||||
| 68,807,471 | 26,951,874 | 41,855,597 | ||||||||||
Fishery : Cost of goods sold from fishery increased by $24,470,018 (or 158.98%) from $15,392,278 for the year ended December 31, 2011 to $39,862,296 for the year ended December 31, 2012. The increase was primarily due to an increase in the sales volume relating to fish and the expansion of contracted services for the year ended December 31, 2012 compared to for the year ended December 31, 2011.
Plantation : Cost of goods sold from our plantation increased by $2,965,120 (or 143.18%) from $2,070,835 for the year ended December 31, 2011 to $5,035,955 for the year ended December 31, 2012 due to good harvest in 2012. The increase was primarily due to cost increases in farm labor, logistic and associated general overhead of operations.
Beef : Cost of goods sold from beef increased by $4,056,908 (or 58.16%) from $6,974,847 for the year ended December 31, 2011 to $11,031,756 for the year ended December 31, 2012. The increase was primarily due to fact that cattle are in growing stage and therefore cost of sales increase even though revenue from beef decreases.
Organic fertilizer : Cost of goods sold from organic fertilizer increased by $5,263,640 (or 2,187.71%) from $2,406 for the year ended December 31, 2011 to $5,266,047 for the year ended December 31, 2012. The increase was primarily due to the startup of the new business of organic fertilizer for the year ended December 31, 2012.
Cattle farm : Cost of goods sold from cattle farm development increased by $5,099,909 (or 203.03%) from $2,511,508 for the year ended December 31, 2011 to $7,611,417 for the year ended December 31, 2012. The increase in cattle farm was primarily due to the commencement of our contracting services in the cattle farming industry for the year ended December 31, 2012.
Gross Profit
Gross profit increased by $44,878,139 (or 180.03%) from $24,928,029 for the year ended December 31, 2011 to $69,806,168 for the year ended December 31, 2012. The increase was primarily due to the corresponding increases in revenues from our fishery, plantation, cattle farm and organic fertilizer operations.
The following chart illustrates the changes of gross profit by category from the year ended December 31, 2012 to December 31, 2011.
| Category | 2012 | 2011 | Difference | |||||||||
| $ | $ | $ | ||||||||||
| Fishery | 46,484,179 | 11,029,847 | 35,454,332 | |||||||||
| Plantation | 6,842,644 | 4,042,320 | 2,800,324 | |||||||||
| Beef | 3,192,568 | 8,207,375 | (5,014,805 | ) | ||||||||
| Organic fertilizer | 3,860,193 | 74 | 3,860,119 | |||||||||
| Cattle farm | 9,426,584 | 1,648,413 | 7,778,169 | |||||||||
| Total | 69,806,168 | 24,928,029 | 44,878,139 | |||||||||
Fishery : Gross profit from fishery increased by $35,454,332 from $11,029,847 for the year ended December 31, 2011 to $46,484,179 for the year ended December 31, 2012. The increase was primarily due to our increased contract service income from fishery and prawn development contracts and sale of fish for the year ended December 31, 2012 versus consulting income and sale of fish for the year ended December 31, 2011.
Plantation : Gross profit from our plantation increased by $2,800,324 (or 69.28%) from $4,042,320 for the year ended December 31, 2011 to $6,842,644 for the year ended December 31, 2012. The increase was due mainly to the increase of wholesale prices both on dried and fresh flowers for the year ended December 31, 2012.
Beef : Gross profit from beef decreased by $5,014,805 (or 61.1%) from $8,207,373 for the year ended December 31, 2011 to $3,192,568 for the year ended December 31, 2012. The decrease was primarily due to the decrease of revenue and the increase of cost of sales.
Organic fertilizer : Organic fertilizer increased by $3,860,119 from $74 for the year ended December 31, 2011 to $3,860,193 during the year ended December 31, 2012. The increase was primarily due to the start-up of our new business of organic fertilizer for the year ended December 31, 2012.
Cattle farm : Gross profit from cattle farm development increased by $7,778,171 (or 471.86%) from $1,648,415 for the year ended December 31, 2011 to $9,426,584 for the year ended December 31, 2012. The increase in cattle farm was primarily due to the commencement of our contracting services in the cattle farming industry for the year ended December 31, 2012.
General and Administrative Expenses and Interest Expenses
General and administrative and interest expenses from continuing and discontinued operation (including depreciation and amortization) increased by $3,046,994 (or 57.21%) from $5,302,736 for the year ended December 31, 2011 to $8,349,729 for the year ended December 31, 2012. The increase was primarily due to increase on the depreciation and amortization amounting to $1,764,288 for the year ended December 31, 2012 from $936,509 for the year ended December 31, 2011, and the increase in others and miscellaneous of $2,152,605 for year ended December 31, 2012 from $280,728for the year ended December 31, 2011.
| Category | 2012 | 2011 | Difference | |||||||||
| $ | $ | $ | ||||||||||
| Office and corporate expenses | 1,619,888 | 1,718,389 | -98,501 | |||||||||
| Wages and salaries | 2,555,681 | 2,122,975 | 432,706 | |||||||||
| Traveling and related lodging | 77,730 | 94,728 | -16,998 | |||||||||
| Motor vehicles expenses and local transportation | 112,448 | 54,462 | 57,986 | |||||||||
| Entertainments and meals | 103,222 | 94,945 | 8,277 | |||||||||
| Others and miscellaneous | 2,152,605 | 280,728 | 1,871,877 | |||||||||
| Depreciation and amortization | 1,764,288 | 936,509 | 827,779 | |||||||||
| Sub-total | 8,385,862 | 5,302,736 | 3,083,126 | |||||||||
| Interest expenses | 282,320 | - | 282,320 | |||||||||
| Total | 8,668,182 | 5,302,736 | 3,365,446 | |||||||||
In this respect, total depreciation and amortization amounted to $2,378,270 for the year ended December 31, 2012, out of which amount, $1,764,288 was reported under general and administration expenses and $613,982 was reported under cost of goods sold; whereas total depreciation and amortization was at $1,475,450 for the year ended December 31, 2011 and out of which amount $936,509 was reported under General and Administration expenses and $538,941 was reported under cost of goods sold.
Part B. Discussion and analysis on the results of operations 2012: This Part B discusses and analyzes certain items that we believe may require further clarification and explanation; and other items of comparison 2012 to 2011 are not discussed in this Part B but in Part A above).
Balance Sheet items (1) on total current assets:
Accounts Receivable:
At December 31, 2012
| Accounts receivable | Current | 0-30 days | 31-90 days | 91-120 days | over 120 days and less than 1 year | |||||||||||||||||||
| Consulting and Service (from 6 contracts) totaling | 32,769,312 | 6,524,405 | 18,420,793 | 1,811,533 | 6,012,581 | |||||||||||||||||||
| Sales of Fish (from Farms and from imports) | 5,216,923 | 1,612,905 | 1,726,826 | 1,877,192 | - | |||||||||||||||||||
| Sales of Cattle and Beef Meats (from Enping Farm) | 610,880 | 335,984 | 274,896 | - | - | |||||||||||||||||||
| Sales of HU Flowers (Dried) | 5,549,439 | - | 2,538,175 | 2,749,650 | 261,614 | |||||||||||||||||||
| Sales Fertilizer, Bulk Stock feed and Cattle by SJYL | 6,795,524 | 1,950,575 | 3,634,487 | 10,982 | 1,199,480 | |||||||||||||||||||
| Sales Fertilizer from HAS | 2,006,272 | 390,112 | 1,189,607 | 417,485 | 9,068 | |||||||||||||||||||
| Total Accounts Receivable | 52,948,350 | 10,813,981 | 27,784,784 | 6,866,842 | 7,482,743 | |||||||||||||||||||
| Percentage of total | 100 | % | 21 | % | 52 | % | 13 | % | 14 | % | ||||||||||||||
Provision for diminution in value of accounts receivable:
Receivables from revenue derived from consulting and services billed for work completed are within our normal trading terms with our principal investor and therefore no diminution in value is required.
Fish Sales: Most farmed fish are sold to wholesalers at prevailing daily market prices capped within 90 days trading terms with a small portion at 180 days as the sale of oversized fish takes time to sell.
We sold over US$43 million of fish to the wholesalers in year 2012, and as of December 31, 2012, accounts receivable of $1,877,192 was over 180 days past due representing less than 2% of the total sales. These debtors are wholesalers who are profitable and viable businesses with a good track record and therefore provision of diminution in value is not required.
Sales of dried HU flowers: The dried flowers have been sold to wholesalers with longer trading terms (e.g., up to 180 days) so as to offset with their holding cost so that they could sell the dried flowers through the winter months (from December 2013 to June 2014 when the new season starts) whereby we agreed with the wholesalers that they would buy our dried flowers as soon as we produce them. Therefore, we consider the receivables from the sales of dried HU flowers to be from wholesalers with a good track record and therefore provision for diminution in value is not required.
Sales of fertilizer and bulk livestock feed: Sales are made to regional farmers who agree to grow crops and pasture by purchasing and using our fertilizer. The farmers raise cattle on these pastures and we have agreed to purchase the cattle from these farmers at a later date. Under this arrangement the accounts receivable that are owed to us by the farmers can be offset by the amount that we owe to the farmers for the purchase of the cattle. Therefore there is no need to provide any diminution in value to the account receivable.
Deposits and Prepayments (Break-down)
Balance Sheet Item (2) on Current Liabilities:
Account payables and Accruals:
Our current trading environment does not include many suppliers who will offer credit terms which means that most purchases are paid for in cash and this results in a low trade account payables balance of $8,762,643 representing about 8.4% of total sales of $68.8 million for the reasons stated below: (Note: For % cost of sales of the segment, please also refer to the table immediately following this section).
Trading environment of the following activities:
Other Payables: As of December 31, 2012, we have other payables totaling $6,422,478. Promissory notes amounting to $3,352,394 were issued to third parties and personally guaranteed by a director, repayable within two year with no interest being accrued Promissory notes could be repaid either as cash or shares of the Company or a combination of both. Debt amounts and the conversion rates applicable to the shares are determined by both parties as they agree to settle the debt by the Company’s issuance of shares.
Income Statements (1) Segment break-down on Revenue (to third parties):
| Segments | Sales Revenue | % of total | Cost of sales | % of total cost | Gross Profit | % of total | ||||||||||||||||||
| 2012 | Revenue | 2012 | of sales | 2012 | gross | |||||||||||||||||||
| $ | $ | $ | profit | |||||||||||||||||||||
| Fishery Sector | ||||||||||||||||||||||||
| Capital Award | ||||||||||||||||||||||||
| Consulting and Service | 36,193,780 | 26 | % | 14,340,937 | 21 | % | 21,852,843 | 31 | % | |||||||||||||||
| Others in sales of Fish, Prawns and commissions and management services | 44,798,779 | 32 | % | 23,329,038 | 34 | % | 21,469,741 | 31 | % | |||||||||||||||
| Fish Farm 1 | ||||||||||||||||||||||||
| Sales of Fish | 391,009 | 0.28 | % | 183,774 | 0 | % | 207,235 | 0 | % | |||||||||||||||
| Cattle Farm Sector | ||||||||||||||||||||||||
| MEIJI | ||||||||||||||||||||||||
| Consulting and Service | 11,080,131 | 8 | % | 2,998,343 | 4 | % | 8,081,788 | 12 | % | |||||||||||||||
| Others in sales of cattle, meat and commission etc. | 5,688,904 | 4 | % | 4,419,418 | 6 | % | 1,269,486 | 2 | % | |||||||||||||||
| Cattle Farm 1 | 268,966 | 0.19 | % | 193,656 | 0 | % | 75,310 | 0 | % | |||||||||||||||
| Beef Organic fertilizer Sector | ||||||||||||||||||||||||
| SJAP | ||||||||||||||||||||||||
| Fertilizer | 3,825,194 | 3 | % | 2,136,239 | 3 | % | 1,688,955 | 2 | % | |||||||||||||||
| Bulk Live Stock Feed | 2,863,637 | 2 | % | 1,382,827 | 2 | % | 1,480,810 | 2 | % | |||||||||||||||
| Cattle | 14,445,695 | 10 | % | 11,079,144 | 16 | % | 3,366,551 | 5 | % | |||||||||||||||
| HSA | ||||||||||||||||||||||||
| Fertilizer | 2,213,038 | 2 | % | 1,699,593 | 2 | % | 513,445 | 1 | % | |||||||||||||||
| HU Plant Sector | ||||||||||||||||||||||||
| JHST | 11,878,599 | 9 | % | 5,035,955 | 7 | % | 6,842,644 | 10 | % | |||||||||||||||
| Corporate Sector | ||||||||||||||||||||||||
| SIAF | ||||||||||||||||||||||||
| Consulting and Service | 3,267,401 | 2 | % | 909,677 | 1 | % | 2,357,724 | 3 | % | |||||||||||||||
| Others | 1,698,506 | 1 | % | 1,098,870 | 2 | % | 599,636 | 1 | % | |||||||||||||||
| Total | 138,613,639 | 100 | % | 68,807,471 | 100 | % | 69,806,168 | 100 | % | |||||||||||||||
Segment of Revenue analysis and explanation:
1. In 2012, revenue of the consulting and management service by segments aggregated 36% (or $50.5 million) of the total revenue ($138.6 million) of the Company derived collectively from Capital Award (26% or $36.2 million), MEIJI (8% or $11 million) and SIAF (2% or $3.3 million).
The revenue from consulting and management service by segments has been reduced by 4% from 40% in 2011 to 36% in 2012 as shown in the table below. The reason for such decrease is primarily due to the increase of sales revenue of other segments (e.g., sales of fish, cattle and other goods), and this trend is expected to continue as more farms are anticipated to be developed and as the productivity of the existing developed farms increases. However, as we are an agriculture engineering based company, we intend to continue to build farms and other wholesaling and retailing facilities with the objective of maintaining the revenue from consulting and management service within 25% to 30% of the Company's total consolidated revenue year to year.
| Financial information 2010 to 2012 of the segments | ||||||||||||||||||||||||||||||||||||
| Segments | Revenue | Cost of Sales | Gross Profit | |||||||||||||||||||||||||||||||||
| 2010 | 2011 | 2012 | 2010 | 2011 | 2012 | 2010 | 2011 | 2012 | ||||||||||||||||||||||||||||
| $ | $ | $ | $ | $ | $ | $ | $ | $ | ||||||||||||||||||||||||||||
| Fishery Sector | ||||||||||||||||||||||||||||||||||||
| Capital Award | ||||||||||||||||||||||||||||||||||||
| Consulting and Service | 4,163,833 | 16,488,192 | 36,193,780 | 1,006,209 | 7,561,874 | 14,340,937 | 3,157,624 | 8,926,318 | 21,852,843 | |||||||||||||||||||||||||||
| Beef Sector | ||||||||||||||||||||||||||||||||||||
| MEIJI | ||||||||||||||||||||||||||||||||||||
| Consulting and Service | - | 4,159,921 | 11,080,131 | - | 2,511,508 | 2,998,343 | - | 1,648,413 | 8,081,788 | |||||||||||||||||||||||||||
| Corporate Sector | ||||||||||||||||||||||||||||||||||||
| SIAF | ||||||||||||||||||||||||||||||||||||
| Consulting and Service | 3,267,401 | - | - | 909,677 | - | - | 2,357,724 | |||||||||||||||||||||||||||||
| Total sales revenue of the segments | 4,163,833 | 20,648,113 | 50,541,312 | 1,006,209 | 10,073,382 | 18,248,957 | 3,157,624 | 10,574,731 | 32,292,355 | |||||||||||||||||||||||||||
| Segment % of the group consolidated total | 38 | % | 40 | % | 36 | % | ||||||||||||||||||||||||||||||
| Consolidated total of continuing operations | 10,918,766 | 51,879,903 | 138,613,639 | 3,731,204 | 26,951,874 | 68,807,471 | 7,187,562 | 24,928,029 | 69,806,168 | |||||||||||||||||||||||||||
2. In 2012, the revenue from other segments (e.g., sales of fish, fertilizer, bulk livestock feed, cattle, etc.) increased by 4% from 60% in 2011 to 64%. This increase is due primarily to additional farms being built in 2012, contributing to the increase in production as shown in the table below.
| Financial information 2010 to 2012 of the segments | ||||||||||||||||||||||||||||||||||||
| Segments | Revenue | Cost of Sales | Gross Profit | |||||||||||||||||||||||||||||||||
| 2010 | 2011 | 2012 | 2010 | 2011 | 2012 | 2010 | 2011 | 2012 | ||||||||||||||||||||||||||||
| $ | $ | $ | $ | $ | $ | $ | $ | $ | ||||||||||||||||||||||||||||
| Fishery Sector | ||||||||||||||||||||||||||||||||||||
| Capital Award | ||||||||||||||||||||||||||||||||||||
| Others in sales of Fish, Prawns and commissions etc. | 9,933,933 | 44,798,779 | 7,830,404 | 23,329,038 | - | 2,103,529 | 21,469,741 | |||||||||||||||||||||||||||||
| Fish Farm 1 | - | - | - | |||||||||||||||||||||||||||||||||
| Sales of Fish | - | - | 391,009 | - | - | 183,774 | - | - | 207,235 | |||||||||||||||||||||||||||
| Cattle Farm Sector | - | - | - | |||||||||||||||||||||||||||||||||
| MEIJI | - | - | - | |||||||||||||||||||||||||||||||||
| Others in sales of cattle, meat and commission etc. | - | - | 5,688,904 | - | - | 4,419,418 | - | - | 1,269,486 | |||||||||||||||||||||||||||
| Cattle Farm 1 | - | - | 268,966 | - | - | 193,656 | - | - | 75,310 | |||||||||||||||||||||||||||
| Beef Organic fertilizer Sector | - | - | - | |||||||||||||||||||||||||||||||||
| SJAP | - | - | - | |||||||||||||||||||||||||||||||||
| Fertilizer | 1,400,712 | 11,814,921 | 3,825,194 | 525,646 | 4,975,462 | 2,136,239 | 875,066 | 6,839,459 | 1,688,955 | |||||||||||||||||||||||||||
| Bulk Live Stock Feed | 579,367 | 2,514,617 | 2,863,637 | 371,024 | 1,205,763 | 1,382,827 | 208,343 | 1,308,854 | 1,480,810 | |||||||||||||||||||||||||||
| Cattle | - | 852,751 | 14,445,695 | 793,649 | 11,079,144 | - | 59,102 | 3,366,551 | ||||||||||||||||||||||||||||
| Concentrated Live Stock Feed (Only for 2013) | - | - | - | |||||||||||||||||||||||||||||||||
| HSA | - | - | - | |||||||||||||||||||||||||||||||||
| Fertilizer | - | 2,453 | 2,213,038 | - | 2,381 | 1,699,593 | - | 72 | 513,445 | |||||||||||||||||||||||||||
| Cattle (Only for 2013) | - | - | - | |||||||||||||||||||||||||||||||||
| HU Plant Sector | - | - | - | |||||||||||||||||||||||||||||||||
| JHST | 4,774,854 | 6,113,115 | 11,878,599 | 1,828,325 | 2,070,833 | 5,035,955 | 2,946,529 | 4,042,282 | 6,842,644 | |||||||||||||||||||||||||||
| Corporate Sector | - | - | - | |||||||||||||||||||||||||||||||||
| SIAF | - | - | - | |||||||||||||||||||||||||||||||||
| Others | 1,698,506 | - | - | 1,098,870 | - | - | 599,636 | |||||||||||||||||||||||||||||
| - | - | - | ||||||||||||||||||||||||||||||||||
| Segments' Total | 6,754,933 | 31,231,790 | 88,072,327 | 2,724,995 | 16,878,492 | 50,558,514 | 4,029,938 | 14,353,298 | 37,513,813 | |||||||||||||||||||||||||||
| Segment % of the consolidated total | 62 | % | 60 | % | 64 | % | ||||||||||||||||||||||||||||||
| Consolidated total of | 10,918,766 | 51,879,903 | 138,613,639 | 3,731,204 | 26,951,874 | 68,807,471 | 7,187,562 | 24,928,029 | 69,806,168 | |||||||||||||||||||||||||||
Income Taxes
No EIT has been provided in the financial statements of CA, ZX, JHST, JHMC, JFD, HSA and SJAP since they are exempt from EIT for the years ended December 31, 20122013 and 20112012 as they are within the agriculture, dairy and fishery sectors. However as ofprior to the year ended December 31, 2012 JFD has been levied with an EIT of 25%, which JFD is appealingappealed to the Taxation Department for a waiver of this tax. The Company expectsJFD’s appeal to prevail in its appeal, therefore there is no EIT being providedthe Taxation Department for JFD during the years endeda waiver of this tax was successful by December 31, 2012 and 2011.2012.
No EIT has been provided in the financial statements of HSA for the income earned for the years December 31, 2013 or 2012 as they are within the agriculture, dairy and fishery sectors. EIT has been provided in the financial statements of HSA at 25% for the income for the years ended December 31, 2011 as it iswas not approved at that time to be within the agriculture, dairy and fishery sectors.
However, as of December 31, 2012, Taxation Department agreed that HSA is exempt from EIT for the years ended December 31, 2012 and 2011. No EIT has been provided in the financial statements of HSA for the income earned for the years December 31, 2012 as they are within the agriculture, dairy and fishery sectors. EIT has been provided in the financial statements of HSA at 25% for the income for the years ended December 31, 2011 as part of its revenue was generated from other source of supply other than SJAP that was not exempted from EIT.
However, as of December 31, 2012, Taxation Department agreed that JFD isCA, CS and CH are international business companies incorporated in Belize, and are exempt from EITcorporate tax in Belize.
No Hong Kong profits tax has been provided in the consolidated financial statements of TRW, since these entities did not earn any assessable profits arising in Hong Kong for the years ended December 31, 2013 and 2012.
No Macau Corporate income tax has been provided in the consolidated financial statements of APWAM and MEIJI since these entities did not earn any assessable profits for the years ended December 31, 2013 and 2012.
No Swedish Corporate income tax has been provided in the consolidated financial statements of SIAFS since SIAFS incurred a tax loss for the period from November 12, 2013 (date of registration) to December 31, 2013.
No deferred tax assets and liabilities are of December 31, 2013 and 2012 since there was no difference between the financial statements carrying amounts and 2011. the tax bases of assets and liabilities using enacted tax rates in effect in the period in which the differences are expected to reverse.
| - 61 - |
Part F. MD&A on records of historical performances reflecting the Company’s “Free Cash Flow “derivation: (Inclusive of SIAF and subsidiaries in segments containing Non-GAAP derivation)
| 2011 | 2012 | 2013 | 2014Q1-Q3 | Total 4 years | ||||||||||||||||
| In rounded figures of $ million | ||||||||||||||||||||
| Sale of goods | 31 | 88 | 209 | 243 | 571 | |||||||||||||||
| Consulting income | 21 | 51 | 52 | 52 | 176 | |||||||||||||||
| Cost of goods sold | 17 | 51 | 139 | 173 | 380 | |||||||||||||||
| Cost of service | 10 | 18 | 21 | 27 | 76 | |||||||||||||||
| EBITDA | 22 | 66 | 98 | 90 | 275 | |||||||||||||||
| Depreciation & amortization | 1 | 2 | 3 | 3 | 8 | |||||||||||||||
| Non - controlling interest | 5 | 6 | 20 | 18 | 49 | |||||||||||||||
| Net income attributable to SIAF & subsidiaries | 16 | 57 | 74 | 68 | 216 | |||||||||||||||
| Total assets | 153 | 242 | 368 | 480 | ||||||||||||||||
| Total liabilities | 16 | 26 | 36 | 50 | ||||||||||||||||
| Total stockholders’ equity | 137 | 216 | 332 | 430 | ||||||||||||||||
| Total Capex | 14 | 34 | 71 | 25 | 144 | |||||||||||||||
| 1. property and equipment | - | 18 | 22 | 9 | 49 | |||||||||||||||
| 2. construction in progress | 2 | 13 | 41 | 16 | 72 | |||||||||||||||
| 3. land use right | 12 | 3 | 4 | - | 19 | |||||||||||||||
| 4. proprietary technologies | - | - | 4 | - | 4 | |||||||||||||||
| Total increase of working capital | 18 | 47 | 43 | 85 | 193 | |||||||||||||||
| 1. increase in inventories | 3 | 17 | -6 | 29 | 43 | |||||||||||||||
| 2. increase in receivable or decrease in payable etc. | 15 | 30 | 49 | 56 | 150 | |||||||||||||||
| Total capex and increase of working capital | 32 | 81 | 114 | 110 | 337 | |||||||||||||||
| Free Cash Flow (FCF) | -10 | -15 | -16 | -20 | -62 | |||||||||||||||
| Net Debt | -1 | -2 | -7 | -14 | ||||||||||||||||
| In round figure of million shares | ||||||||||||||||||||
| Total authorized common stock | 100 | 130 | 170 | 170 | ||||||||||||||||
| Weighted average of total issue outstanding common stocks | ||||||||||||||||||||
| Basic | 6 | 8 | 12 | 15 | ||||||||||||||||
| Diluted | 7 | 9 | 13 | 16 | ||||||||||||||||
| In $/ share | ||||||||||||||||||||
| Earnings per share (or EPS) | ||||||||||||||||||||
| Basic | 2.57 | 6.95 | 6.14 | 4.23 | ||||||||||||||||
| Diluted | 2.28 | 6.19 | 5.76 | 3.96 | ||||||||||||||||
| NTA / share | ||||||||||||||||||||
| Basic | 23 | 26 | 28 | 28 | ||||||||||||||||
| Diluted | 20 | 23 | 26 | 27 | ||||||||||||||||
| - 62 - |
E.2 on APWAM (holding company of SJAP).
| 2011 | 2012 | 2013 | 2014Q1-Q3 | Total 4 years | ||||||||||||||||
| In rounded figures of $ million | ||||||||||||||||||||
| Sale of goods | 15 | 21 | 62 | 80 | 178 | |||||||||||||||
| Cost of goods sold | 7 | 15 | 38 | 53 | 113 | |||||||||||||||
| EBITDA | 8 | 7 | 27 | 25 | 67 | |||||||||||||||
| Depreciation & amortization | - | - | - | 1 | 1 | |||||||||||||||
| Non - controlling interest | 4 | 4 | 15 | 13 | 36 | |||||||||||||||
| Net income attributable to SIAF & subsidiaries | 4 | 3 | 12 | 11 | 30 | |||||||||||||||
| Total assets | 17 | 43 | 88 | 125 | ||||||||||||||||
| Total liabilities | 2 | 11 | 15 | 17 | ||||||||||||||||
| Total stockholders’ equity | 15 | 32 | 73 | 108 | ||||||||||||||||
| Total Capex | 2 | 14 | 38 | 11 | 65 | |||||||||||||||
| 1. property and equipment | �� | - | 9 | 12 | 1 | 22 | ||||||||||||||
| 2. construction in progress | 2 | 4 | 24 | 10 | 40 | |||||||||||||||
| 3. land use right | - | 1 | - | - | 1 | |||||||||||||||
| 4. proprietary technologies | - | - | 2 | - | 2 | |||||||||||||||
| Total increase of working capital | 7 | -6 | -12 | 47 | 36 | |||||||||||||||
| 1. increase in inventories | 3 | 11 | -6 | 13 | 21 | |||||||||||||||
| 2. increase in receivable or decrease in payable etc. | 4 | -17 | -6 | 34 | 15 | |||||||||||||||
| Total capex and increase of working capital | 9 | 8 | 26 | 58 | 101 | |||||||||||||||
| Free Cash Flow (FCF) | -1 | -1 | 1 | -33 | -34 | |||||||||||||||
| Net Debt | -1 | -2 | -5 | -2 | ||||||||||||||||
| - 63 - |
E.3.SIAF’s Corporate Operational division
| 2011 | 2012 | 2013 | 2014Q1-Q3 | Total 4 years | ||||||||||||||||
| In rounded figures of $ million | ||||||||||||||||||||
| Sale of goods | - | 2 | 22 | 36 | 60 | |||||||||||||||
| Consulting income | - | 3 | 9 | 2 | 14 | |||||||||||||||
| Cost of goods sold | - | 1 | 19 | 32 | 52 | |||||||||||||||
| Cost of service | - | 1 | 3 | 1.5 | 6 | |||||||||||||||
| EBITDA | - | 2 | 6 | 5 | 13 | |||||||||||||||
| Depreciation & amortization | - | - | - | - | - | |||||||||||||||
| Non - controlling interest | - | - | - | - | - | |||||||||||||||
| Net income attributable to SIAF & subsidiaries | - | 2 | 6 | 5 | 13 | |||||||||||||||
| Total assets | 3 | 10 | 19 | 35 | ||||||||||||||||
| Total liabilities | 1 | 7 | 8 | 19 | ||||||||||||||||
| Total stockholders’ equity | 2 | 3 | 11 | 16 | ||||||||||||||||
| Total Capex | - | - | 2 | 1 | 3 | |||||||||||||||
| 1. property and equipment | - | - | - | - | - | |||||||||||||||
| 2. construction in progress | - | - | - | 1 | 1 | |||||||||||||||
| 3. land use right | - | - | - | - | - | |||||||||||||||
| 4. proprietary technologies | - | - | 2 | - | 2 | |||||||||||||||
| Total increase of working capital | 45 | 18 | 25 | 5 | 93 | |||||||||||||||
| 1. increase in inventories | - | 0 | - | - | ||||||||||||||||
| 2. increase in receivable or decrease in payable etc. | 45 | 18 | 25 | 5 | 93 | |||||||||||||||
| Total capex and increase of working capital | 45 | 18 | 27 | 6 | 96 | |||||||||||||||
| Free Cash Flow (FCF) | -45 | -16 | -21 | -1 | -83 | |||||||||||||||
| Net Debt | - | - | -2 | -9 | ||||||||||||||||
E.4. CA (Fishery Development Division)
| 2011 | 2012 | 2013 | 2014Q1-Q3 | Total 4 years | ||||||||||||||||
| In rounded figures of $ million | ||||||||||||||||||||
| Sale of goods | 10 | 28 | 47 | 44 | 129 | |||||||||||||||
| Consulting income | 17 | 37 | 36 | 50 | 140 | |||||||||||||||
| - | ||||||||||||||||||||
| Cost of goods sold | 8 | 14 | 33 | 26 | 81 | |||||||||||||||
| Cost of service | 8 | 14 | 13 | 25 | 60 | |||||||||||||||
| EBITDA | 8 | 35 | 37 | 39 | 120 | |||||||||||||||
| Depreciation & amortization | - | - | - | - | - | |||||||||||||||
| Non - controlling interest | - | - | - | - | - | |||||||||||||||
| Net income attributable to SIAF & subsidiaries | 8 | 35 | 37 | 39 | 119 | |||||||||||||||
| Total assets | 40 | 60 | 81 | 115 | ||||||||||||||||
| Total liabilities | 4 | 4 | 7 | 2 | ||||||||||||||||
| Total stockholders’ equity | 36 | 56 | 74 | 113 | ||||||||||||||||
| Total Capex | - | - | 3 | - | 3 | |||||||||||||||
| 1. property and equipment | - | - | - | - | - | |||||||||||||||
| 2. construction in progress | - | - | 3 | - | 3 | |||||||||||||||
| 3. land use right | - | - | - | - | - | |||||||||||||||
| 4. proprietary technologies | - | - | - | - | - | |||||||||||||||
| Total increase of working capital | 12 | 37 | 25 | 13 | 87 | |||||||||||||||
| 1. increase in inventories | ||||||||||||||||||||
| 2. increase in receivable or decrease in payable etc. | 12 | 37 | 25 | 13 | 87 | |||||||||||||||
| Total capex and increase of working capital | 12 | 37 | 28 | 13 | 90 | |||||||||||||||
| Free Cash Flow (FCF) | -4 | -2 | 9 | 26 | # | 30 | ||||||||||||||
| Net Debt | - | - | - | - | ||||||||||||||||
| - 64 - |
E.5. Tri-way (the holding company of Fish Farm (1))
| 2011 | 2012 | 2013 | 2014Q1-Q3 | Total 4 years | ||||||||||||||||
| In rounded figures of $ million | ||||||||||||||||||||
| Sale of goods | - | 16 | 25 | 37 | 78 | |||||||||||||||
| Cost of sale | - | 10 | 19 | 29 | 58 | |||||||||||||||
| EBITDA | - | 5 | 6 | 8 | 19 | |||||||||||||||
| Depreciation & amortization | - | 0 | 0 | 0 | 1 | |||||||||||||||
| Non - controlling interest | 1 | 1 | 2 | 4 | ||||||||||||||||
| Net incomes attributable to SIAF & subsidiaries | - | 4 | 5 | 6 | 15 | |||||||||||||||
| Total assets | 8 | 12 | 19 | 27 | ||||||||||||||||
| Total liabilities | - | - | - | - | ||||||||||||||||
| Total stockholders’ equity | 8 | 12 | 19 | 27 | ||||||||||||||||
| Total Capex | - | 6 | 2 | 1 | 9 | |||||||||||||||
| 1. property and equipment | - | 6 | - | 1 | 7 | |||||||||||||||
| 2. construction in progress | - | - | 2 | - | 2 | |||||||||||||||
| 3. land use right | - | - | - | - | - | |||||||||||||||
| 4. proprietary technologies | ||||||||||||||||||||
| Total increase of working capital | - | 6 | 5 | 6 | 17 | |||||||||||||||
| 1. increase in inventories | - | 5 | - | 3 | 8 | |||||||||||||||
| 2. increase in receivable or decrease in payable etc. | - | 1 | 5 | 3 | 9 | |||||||||||||||
| Total capex and increase of working capital | - | 12 | 7 | 7 | 26 | |||||||||||||||
| Free Cash Flow (FCF) | - | -7 | -1 | 1 | -7 | |||||||||||||||
| Net Debt | - | - | - | - | ||||||||||||||||
| - 65 - |
E.6. MEIJI (Cattle Farm Development and holding company of CF (1))
| 2011 | 2012 | 2013 | 2014Q1-Q3 | Total 4 years | ||||||||||||||||
| In rounded figures of $ million | ||||||||||||||||||||
| Sale of goods | - | 6 | 18 | 21 | 45 | |||||||||||||||
| Consulting income | 4 | 11 | 7 | - | 22 | |||||||||||||||
| Cost of goods sold | - | 4 | 13 | 20 | 37 | |||||||||||||||
| Cost of service | 2 | 3 | 5 | - | 10 | |||||||||||||||
| EBITDA | 1 | 9 | 5 | 1 | 17 | |||||||||||||||
| Depreciation & amortization | - | 0 | 0 | 0 | 1 | |||||||||||||||
| Non - controlling interest | - | - | - | - | - | |||||||||||||||
| Net income attributable to SIAF & subsidiaries | 1 | 9 | 5 | 1 | 16 | |||||||||||||||
| Total assets | 7 | 20 | 33 | 40 | - | |||||||||||||||
| Total liabilities | - | - | 2 | 8 | - | |||||||||||||||
| Total stockholders’ equity | 7 | 20 | 31 | 32 | - | |||||||||||||||
| Total Capex | 5 | 2 | - | - | 7 | |||||||||||||||
| 1. property and equipment | - | - | - | - | - | |||||||||||||||
| 2. construction in progress | - | - | - | - | - | |||||||||||||||
| 3. land use right | 5 | 2 | - | - | 7 | |||||||||||||||
| 4. proprietary technologies | ||||||||||||||||||||
| Total increase of working capital | -3 | 1 | 5 | 1 | 4 | |||||||||||||||
| 1. increase in inventories | - | 1 | - | 1 | 2 | |||||||||||||||
| 2. increase in receivable or decrease in payable etc. | -3 | - | 5 | - | 2 | |||||||||||||||
| Total capex and increase of working capital | 2 | 3 | 5 | 1 | 11 | |||||||||||||||
| Free Cash Flow (FCF) | -1 | 6 | - | 0 | 6 | |||||||||||||||
| Net Debt | - | - | - | - | - | |||||||||||||||
| - 66 - |
E.7. MEIJI and JHST plantation division
| 2011 | 2012 | 2013 | 2014Q1-Q3 | Total 4 years | ||||||||||||||||
| In rounded figures of $ million | ||||||||||||||||||||
| Sale of goods | 6 | 12 | 23 | 9 | 50 | |||||||||||||||
| Cost of goods sold | 2 | 5 | 10 | 2 | 19 | |||||||||||||||
| EBITDA | 4 | 6 | 11 | 5 | 27 | |||||||||||||||
| Depreciation & amortization | 0 | - | 1 | 1 | 2 | |||||||||||||||
| Non - controlling interest | 1 | 1 | 3 | 1 | 6 | |||||||||||||||
| Net income attributable to SIAF & subsidiaries | 3 | 5 | 7 | 3 | 18 | |||||||||||||||
| Total assets | 28 | 37 | 49 | 53 | - | |||||||||||||||
| Total liabilities | - | - | - | - | - | |||||||||||||||
| Total stockholders’ equity | 28 | 37 | 49 | 53 | - | |||||||||||||||
| Total Capex | - | 3 | 10 | - | 13 | |||||||||||||||
| 1. property and equipment | - | 3 | 6 | - | 9 | |||||||||||||||
| 2. construction in progress | - | - | - | - | - | |||||||||||||||
| 3. land use right | - | - | 4 | - | 4 | |||||||||||||||
| 4. proprietary technologies | - | - | - | - | - | |||||||||||||||
| Total increase of working capital | -3 | 1 | 6 | 1 | 5 | |||||||||||||||
| 1. increase in inventories | - | - | - | - | - | |||||||||||||||
| 2. increase in receivable or decrease in payable etc. | -3 | 1 | 6 | 1 | 5 | |||||||||||||||
| Total capex and increase of working capital | -3 | 4 | 16 | 1 | 18 | |||||||||||||||
| Free Cash Flow (FCF) | 7 | 2 | -5 | 4 | 9 | |||||||||||||||
| Net Debt | - | - | - | - | - | |||||||||||||||
| - 67 - |
E.8. HSA (the Hunan fertilizer Operation)
| 2011 | 2012 | 2013 | 2014Q1-Q3 | Total 4 years | ||||||||||||||||
| In rounded figures of $ million | ||||||||||||||||||||
| Sale of goods | - | 3 | 12 | 16 | 31 | |||||||||||||||
| Cost of goods sold | - | 2 | 7 | 10 | 19 | |||||||||||||||
| EBITDA | - | 0 | 4 | 7 | 12 | |||||||||||||||
| Depreciation & amortization | 0.40 | 1 | 1 | 1 | 3 | |||||||||||||||
| Non - controlling interest | 1 | 2 | 2 | |||||||||||||||||
| Net income attributable to SIAF & subsidiaries | - | -1 | 2 | 4 | 5 | |||||||||||||||
| Total assets | 50 | 60 | 79 | 85 | ||||||||||||||||
| Total liabilities | 9 | 4 | 4 | 4 | ||||||||||||||||
| Total stockholders’ equity | 41 | 56 | 75 | 81 | ||||||||||||||||
| Total Capex | 7 | 9 | 16 | 12 | 44 | |||||||||||||||
| 1. property and equipment | - | - | 4 | 7 | 11 | |||||||||||||||
| 2. construction in progress | - | 9 | 12 | 5 | 26 | |||||||||||||||
| 3. land use right | 7 | - | - | - | 7 | |||||||||||||||
| 4. proprietary technologies | - | - | - | - | - | |||||||||||||||
| Total increase of working capital | -40 | -10 | -11 | 12 | -49 | |||||||||||||||
| 1. increase in inventories | - | - | - | 12 | 12 | |||||||||||||||
| 2. increase in receivable or decrease in payable etc. | -40 | -10 | -11 | - | -61 | |||||||||||||||
| Total capex and increase of working capital | -33 | -1 | 5 | 24 | -5 | |||||||||||||||
| Free Cash Flow (FCF) | 33 | 1 | -1 | -17 | 17 | |||||||||||||||
| Net Debt | - | - | - | - | - | |||||||||||||||
Income Taxes
The Company was incorporated in the State of Nevada, in the United States of America. The Company has no trading operations in United States of America and no US corporate tax has been provided for in the consolidated financial statements of the Company.
Undistributed Earnings of Foreign Subsidiaries
The Company intends to use the remaining accumulated and future earnings of foreign subsidiaries to expand operations outside the United States of America and, accordingly, undistributed earnings of foreign subsidiaries are considered to be indefinitely reinvested outside the United States and no provision for U.S. Federal and State income tax or applicable dividend distribution tax has been provided thereon.
The Company appointed US tax professionals to assist in filing income tax returns for the years ended December 31, 2007 through December 31, 2012 in compliance with US Treasury Internal Revenue Code and we filed our Tax returns with the Internal Revenue Service (“IRS”) on June 2014.
At the same time, The Company reviewed its tax position with the assistance US tax professionals and believed that there would be no taxes and no penalties assessed by the IRS in the United States of America.
No EIT has been provided in the financial statements of SIAF, CA, JHST, JHMC, JFD, HSA, QZH and SJAP since they are exempt from EIT for the income earned for the years December 31, 2012nine months ended September 30, 2014 and 2013 as they are within the agriculture, dairy and fishery sectors. JFD had
CA, CS and CH are international business companies incorporated in Belize, and are exempt from corporate tax in Belize.
No Hong Kong profits tax has been levied with an EIT of 25%provided in 2011, but JFD’s appeal to the Taxation Departmentconsolidated financial statements, since TRW did not earn any assessable profits arising in Hong Kong for the nine months ended September 30, 2014 and 2013.
No Macau corporate income tax has been provided in the consolidated financial statements, since APWAM and MEIJI did not earn any assessable profits in Macau for the nine months ended September 30, 2014 and 2013.
No Swedish corporate income tax has been provided in the consolidated financial statements, since SAFS incurred a waiver of this tax was successful by December 31, 2012.loss for the nine months ended September 30, 2014.
| - |
No deferred tax assets and liabilities are payable as of September 30, 2014 and December 31, 2013 since there was no difference between the financial statements carrying amounts and the tax basis of assets and liabilities using enacted tax rates in effect for the period in which the differences are expected to reverse.
Off Balance Sheet Arrangements:
None.
Other Significant Factors That May Affect Cash/Liquidity:Liquidity and Capital Resources
Inflation factors affecting operations:
On the surface the Government’s anti-inflationary measures seemed to be working during the six months ended June 30, 2013. However, management remains concerned since most of the building materials, cost of labor and essential consumer goods are still rising at a higher rate than GDP. Its impact on consumer spending has not seemed to materialize, though, with growth in spending maintaining an upward trajectory.
As of JuneSeptember 30 2013, the Company had no other significant transactions that may affect our cash/liquidity other than those mentioned in this prospectus.
The Company considers all highly liquid securities with original maturities of three months or less when acquired to be cash equivalents. Cash and cash equivalents kept with financial institutions in People’s Republic of China (“PRC”) are not insured or otherwise protected. Should any of those institutions holding the Company’s cash become insolvent, or the Company is unable to withdraw funds for any reason, the Company could lose the cash on deposit at that institution.
Liquidity and Capital Resources
As of June 30, 2013, we had2014, unrestricted cash and cash equivalents of $9,391,449,amounted to $4,691,157 (see notes to the consolidated account)financial statements), and our working capital as of JuneSeptember 30, 20132014 was $145,332,475.$198,070,543.
| Contractual Obligations | Less than 1 year | 1-3years | 3-5 years | More than 5 years | Total | |||||||||||||||
| Short Term Bank Loan | - | |||||||||||||||||||
| Bonds payable | 1,725,000 | |||||||||||||||||||
| Convertible note payable | 6,982,667 | |||||||||||||||||||
| Long Term Debts | 2,616,610 | |||||||||||||||||||
| Promissory Notes | 512,751 |
As of JuneSeptember 30 2013,2014, our total long termlong-term debts are as follows:
| Contractual Obligations | Less than 1 year ($) | 1-3 years ($) | 3-5 years ($) | More than 5 years ($) | Total ($) | |||||||||||||||
| Short Term Bank Loan | 2,265,849 | |||||||||||||||||||
| Long Term Debts | 0 | 0 | 178,031 | 0 | 0 | |||||||||||||||
| Promissory Notes Issued to third parties | 5,915,423 | |||||||||||||||||||
Cash provided by operating activities totaled $16,120,653amounted to $26,261,673 for the sixnine months ended JuneSeptember 30, 2013.2014. This comparescompared with cash provided by operating activities $9,887,541totaled $38,065,409 for the sixnine months ended JuneSeptember 30, 2012.2013. The increasedecrease in cash flows from operations primarily resulted from net cash provided by net incomethe decrease of deposits and prepayments of $(583,670) for the period after adjustments of non- cash items.nine months ended September 30, 2014 from $(37,090,703) for the nine months ended September 30, 2013.
Cash used in investing activities totaled $14,086,955$(25,646,646) for the sixnine months ended JuneSeptember 30, 2013.2014. This compares with cash used in investing activities totaled $11,722,784totaling $(36,172,595) for the sixnine months ended JuneSeptember 30, 2012.2013. The increase in cash flows used in investing activities primarily resulted from payment for construction payments of $12,596,632$(22,227,905) for the sixnine months ended JuneSeptember 30, 2013 as compared to construction payments of $6,626,6882014 from $(31,494,031) for the sixnine months ended JuneSeptember 30, 2012.2013.
Cash provided by financing activities totaled $3,572,916 for the nine months September 30, 2014. This compares with cash used in financing activities totaled $951,308totaling $1,353,533 for the sixnine months September 30, 2013. The increase in cash provided by financing activities due to net proceeds from convertible note of $5,237,000 for the nine months ended JuneSeptember 30, 2013. This compares with cash2014 from financing activities totaled $1,672,033$0 for the sixnine months ended JuneSeptember 30, 2012.2013.
Acquisition of SFJVC’s and further acquisition plan:
An SFJVC agreement typically contains an option clause for further investment. Initially, the China Developer of project companies invites us to invest in their venture. If management feels compelled it carries out an in-depth study of the target company including legal due diligence, business plan, budget and projected financial information. The decreasefinal decision is made through the resolution of the Company’s Board of Directors. If the decision is made to proceed with an investment, there is first formed an SFJVC, within which in turn the Company acquires further equity interest. The acquisition price of such interest is determined in accordance with the book value of the SFJVC as of the acquisition date. Consideration generally consists in part of cash flows providedand in part of contract against trade debts owed by investing activities primarily resulted from non-controlling interests contribution of $1,806,644the China Developer due to Consulting & Services fees charged to the China Developer by the Company in accordance with the Consulting & Services agreement. Project companies’ record development cost as construction in progress and treat the amount due to us as partial investment in new SFJVC.
The Company’s expenditures as the consulting and service provider providing turnkey services to the China Developer for the six months ended June 30, 2012development of the project include (i) administrative and operational expenses provided for and incurred in the project (charged and recorded under general and administrative operation expenses), billable to the China Developer, (ii) other development expenditures (inclusive of subcontractors’ and sub-suppliers’ cost plus mark-up) billable to the Developer, as compared with no non-controlling interests forwell. Consulting & Services fees are exclusively billed to the six months ended June 30, 2013.3rd party China Developer, and not to the future SFJVC companies.
| - |
The following table showsWe plan to acquire further SFJVC’s at the debt we have exchanged for equity duringtime they will be formed officially after their approval by relevant China Authorities with details shown in the periods indicated:Table below:
| Issuance | Consideration | Investors | ||||||||||||||||||||
| Date | Events | of shares | Price / share | received | Non-USA | USA | ||||||||||||||||
| # of shares | US$ | US$ | # of persons | |||||||||||||||||||
| As at | ||||||||||||||||||||||
| 31.12.2010 | Quoted in 10K and Form 10 | 55,474,136 | 50,884,475 | 136 | 5,123 | |||||||||||||||||
| 03.01.2011 | Debt settlements | 370,000 | 1.50 | 562,500 | 1 | |||||||||||||||||
| 13.01.2011 | Debt settlements | 491,000 | 1.50 | 736,500 | 1 | |||||||||||||||||
| 10.02.2011 | Debt Settlements | 425,000 | 1.50 | 637,500 | 1 | |||||||||||||||||
| 10.02.2011 | Debt settlements | 35,000 | 1.50 | 52,500 | 1 | |||||||||||||||||
| 16.04.2011 | Debt settlements | 530,000 | 1.50 | 795,000 | 1 | |||||||||||||||||
| 22.04.2011 | Debt settlements | 400,000 | 1.50 | 600,000 | 1 | |||||||||||||||||
| 08.05.2011 | Debt settlements | 351,000 | 1.50 | 526,500 | 1 | |||||||||||||||||
| 2,602,000 | 3,910,500 | |||||||||||||||||||||
| 06.07.2011 | Brought from third parties for resale | -500,000 | 0.78 | -390,000 | -1 | |||||||||||||||||
| 19.07.2011 | Brought from third parties for resale | -500,000 | 0.78 | -390,000 | -1 | |||||||||||||||||
| 27.06.2011 | Debt Settlements | 304,878 | 0.82 | 250,000 | - | |||||||||||||||||
| 21.07.2011 | Debt Settlements | 304,878 | 0.82 | 250,000 | - | |||||||||||||||||
| 16.08.2011 | Debt Settlements | 377,976 | 0.82 | 309,940 | 1 | |||||||||||||||||
| 02.09.2011 | Debt Settlements | 12,268 | 0.82 | 10,060 | ||||||||||||||||||
| 02.09.2011 | Debt settlements | 353,542 | 0.84 | 296,975 | 1 | |||||||||||||||||
| 02.09.2011 | Debt settlements | 426,787 | 0.69 | 293,629 | 2 | |||||||||||||||||
| 01.07.2011 | Worker compensation & adjustments | 1,706,620 | 1.01 | 1,723,686 | 79 | |||||||||||||||||
| 11.7.2011 | Worker compensation & adjustments | 1,054,109 | 0.90 | 943,428 | ||||||||||||||||||
| 11.07.2011 | Professional services paid in shares and adjustments | 1,800,000 | 0.90 | 1,611,000 | 4 | |||||||||||||||||
| As at | ||||||||||||||||||||||
| 30.09.2011 | Total Common shares issued | 63,417,194 | 59,703,693 | 215 | 5,136 | |||||||||||||||||
| Equity Changes | ||||||||||||||||||||||
| Issurance of | Consideration | Investors | ||||||||||||||||||||
| Date | Events | shares | Price / share | received | Non-USA | USA | ||||||||||||||||
| # of shares | US$ | US$ | # of persons | |||||||||||||||||||
| As at | ||||||||||||||||||||||
| 30.09.2011 | Total common shares issued | 63,417,194.00 | 59,703,693.00 | 215.00 | 5,136.00 | |||||||||||||||||
| 08.10.2011 | Share issued for debt settlement | 1,470,588.00 | 0.85 | 1,250,000.00 | 1.00 | |||||||||||||||||
| 14.10.2011 | Shares brought = (A) | -600,000.00 | 0.65 | -390,000.00 | -1.00 | |||||||||||||||||
| 19.10.2011 | Shares brought = (B) | -620,000.00 | 0.65 | -403,000.00 | -1.00 | |||||||||||||||||
| 23.10.2011 | Shares brought = ( C ) | -2,000,000.00 | 0.01 | -20,000.00 | - | |||||||||||||||||
| 23.10.2011 | Shares brought = (D) | -2,000,000.00 | 0.01 | -20,000.00 | - | |||||||||||||||||
| 23.10.2011 | Shares brought = (E) | -2,400,000.00 | 0.01 | -24,000.00 | - | |||||||||||||||||
| 14.10.2011 | Debt Settlement | 600,000.00 | 0.80 | 480,000.00 | 1.00 | |||||||||||||||||
| 14.11.2011 | Debt Settlements | 620,000.00 | 0.80 | 496,000.00 | 1.00 | |||||||||||||||||
| 14.11.2011 | Debt settlement | 1,596,480.00 | 0.91 | 1,450,000.00 | 3.00 | |||||||||||||||||
| 15.11.2011 | Debt settlement | 6,400,000.00 | 0.504 | 3,225,600.00 | 1.00 | |||||||||||||||||
| 15.12.2011 | Debt settlement | 550,000.00 | 0.504 | 277,200.00 | - | |||||||||||||||||
| as at 31.12 2011 | 67,034,262.00 | 66,025,493.00 | 221.00 | 5,135.00 | ||||||||||||||||||
| Acquisition by which subsidiary | Estimated time of SFJVC being formed | Estimated time of completion of acquisition | Estimated Total consideration | Deposit paid up to date | Deposit paid is equivalent to % of equity | Estimated time of progress payments | ||||||||||||||||||||||
| Equity Changes | ||||||||||||||||||||||
| Issurance of | Consideration | Investors | ||||||||||||||||||||
| Date | Events | shares | Price / share | received | Non-USA | USA | ||||||||||||||||
| # of shares | US$ | US$ | # of persons | |||||||||||||||||||
| as at 31.12 2011 | 67,034,262 | 66,025,493 | 221 | 5,135 | ||||||||||||||||||
| 16.01.2012 | Debt Settlement | 867,100 | 0.65 | 563,615 | 1 | |||||||||||||||||
| 14.02.2012 | Debt Settlement | 1,508,959 | 0.60 | 905,375 | 1 | |||||||||||||||||
| 07.03.2012 | Debt Settlement | 722,225 | 0.63 | 455,002 | 1 | |||||||||||||||||
| 23.03.2012 | Debt Settlements | 600,000 | 0.75 | 450,000 | 1 | |||||||||||||||||
| As at 31.03.2012 | 70,732,546 | 3 | 68,399,485 | 225 | 5,135 | |||||||||||||||||
| 20.04.2012 | Debt Settlement | 801,666 | 0.71 | 568,118 | 1 | |||||||||||||||||
| 20.04.2012 | Debt Settlement | 437,370 | 0.71 | 310,000 | 1 | |||||||||||||||||
| 20.04.2012 | Debt Settlement | 458,524 | 0.71 | 325,015 | 1 | |||||||||||||||||
| 25.05.2012 | Debt Settlement | 1,280,081 | 0.62 | 793,650 | 1 | |||||||||||||||||
| 25.05.2012 | Debt Settlement | 2,133,606 | 0.62 | 1,315,475 | 1 | |||||||||||||||||
| 08.06.2012 | Debt Settlement | 558,538 | 0.65 | 365,000 | 1 | |||||||||||||||||
| 08.06.2012 | Debt Settlement | 893,639 | 0.65 | 585,000 | 1 | |||||||||||||||||
| 15.06.2012 | Debt Settlement | 473,923 | 0.65 | 310,000 | - | |||||||||||||||||
| As at 30.06.2012 | 77,769,893 | 8 | 72,971,743 | 232 | 5,135 | |||||||||||||||||
| 05.07.2012 | Debt Settlement | 2,151,247 | 0.54 | 1,161,825 | ||||||||||||||||||
| 19.07.2012 | Debt Settlement | 1,795,307 | 0.52 | 931,825 | ||||||||||||||||||
| 08.08.2012 | Debt Settlement | 765,000 | 0.52 | 400,000 | ||||||||||||||||||
| 16.08.2012 | Worker Compensation | 906,000 | 0.395 | 362,400 | 2 | 2 | ||||||||||||||||
| 18.08.2012 | Debt Settlement | 1,678,000 | 0.51 | 859,825 | 1 | |||||||||||||||||
| 22.08.2012 | Debt Settlement | 1,493,500 | 0.52 | 773,325 | 1 | |||||||||||||||||
| 17.09.2012 | Debt Settlement | 2,902,960 | 0.64 | 1,862,439 | ||||||||||||||||||
| 20.09.2012 | Debt Settlement | 390,625 | 0.65 | 250,000 | - | - | ||||||||||||||||
| 24.09.2012 | Debt Settlement | 527,803 | 0.71 | 400,000 | - | - | ||||||||||||||||
| 668,647 | 0.71 | 500,000 | - | - | ||||||||||||||||||
| As at 30.09.2012 | 91,048,982 | 80,473,382 | 235 | 5,138 | ||||||||||||||||||
| 12.10.2012 | Debt Settlement | 371,429 | 0.70 | 260,000 | - | - | ||||||||||||||||
| 24.10.2012 | Debt Settlement | 1,062,357 | 0.70 | 743,650 | - | - | ||||||||||||||||
| 01.10.2012 | Debt Settlement | 804,346 | 0.70 | 563,042 | - | - | ||||||||||||||||
| 9.11.2012 | Debt Settlement | 1,209,187 | 0.615 | 743,650 | - | - | ||||||||||||||||
| 9.11.2012 | Debt Settlement | 491,080 | 0.615 | 302,014 | - | - | ||||||||||||||||
| 23.11.2012 | Debt Settlement | 474,364 | 0.615 | 291,734 | - | - | ||||||||||||||||
| 03.12.2012 | Debt Settlement | 392,955 | 0.53 | 208,266 | - | - | ||||||||||||||||
| 03.12.2012 | Debt Settlement | 660,377 | 0.53 | 350,000 | - | - | ||||||||||||||||
| 17.12.2012 | Debt Settlement | 69,732 | 0.53 | 36,958 | - | - | ||||||||||||||||
| 21.12.2012 | Debt Settlement | 188,679 | 0.53 | 100,000 | - | - | ||||||||||||||||
| 21.12.2012 | Debt Settlement | 1,037,736 | 0.53 | 550,000 | - | - | ||||||||||||||||
| 21.12.2012 | Debt Settlement | 1,311,321 | 0.53 | 695,000 | - | - | ||||||||||||||||
| As at 31.12.2012 | 99,122,545 | 7.13 | 85,317,696 | 235 | 5,138 | |||||||||||||||||
| CA | June 2014 | August 2014 | $ | 20.94m | $14.45 m | 56 | % | Q1 to Q2 2014 |
| Zhongshan Prawn PF2 | CA | Phase 3 Work still in progress, targeting completion Q3 2014 | August 2015 | $26.20 m | $9.88 m | 33 | % | Q4 2013 & all year round 2014 | ||||||||||||||||||||
| Fish & eel Farm 2 | CA | Phase 3 & 4 work are in progress targeting completion Q4 2015 | August. 2016 | $26.22 m | $6.0 m | 23 | % | Q4 2013 & all year round 2014 & 2015 | ||||||||||||||||||||
| Cattle Farm 2 | MEIJI | Final work is still in progress | August 2014 | $15.88 m | $5.58 m | 35 | % | On or before June 30 2014 | ||||||||||||||||||||
| WXC businesses | SIAF | Work is in progress until end 2015 | Not yet determined | Not fully determined | $4.08 m | 31 | % | Partially in 2014. | ||||||||||||||||||||
| NaWei wholesale centers | SIAF | Work is in progress until end 2015 | Phase (1) March 2014, new Phases are pending | Not fully determined | $1.03 m | 31 | % | Partially in 2014. |
| Equity Changes Q1 2013 | ||||||||||||||||||||||||||
| Issurance of | Consideration | Investors | ||||||||||||||||||||||||
| Date | Events | shares | Price / share | received | Number of Persons / Entities | |||||||||||||||||||||
| # of shares | US$ | US$ | Non-USA | USA | ||||||||||||||||||||||
| As at 31.12.2012 Opening Balance | 100,004,850 | 85,917,696 | 235 | 5,138 | ||||||||||||||||||||||
| 03.01.2013 | Debt Settlement | 925,977 | 0.53 | 490,768 | 1 | |||||||||||||||||||||
| 03.01.2013 | Debt Settlement | 835,106 | 0.53 | 442,606 | 1 | |||||||||||||||||||||
| 15.01.2013 | Debt Settlement | 1,415,094 | 0.53 | 750,000 | - | |||||||||||||||||||||
| 15.01.2013 | Debt Settlement | 1,415,094 | 0.53 | 750,000 | - | |||||||||||||||||||||
| 20.02.2013 | Debt Settlement | 1,432,692 | 0.52 | 745,000 | 1 | |||||||||||||||||||||
| 25.02.2013 | Debt Settlement | 961,538 | 0.52 | 500,000 | 1 | |||||||||||||||||||||
| 15.03.2013 | Debt Settlement | 1,181,818 | 0.550 | 650,000 | - | |||||||||||||||||||||
| 28.03.2013 | Debt Settlement | 645,161 | 0.620 | 400,000 | - | |||||||||||||||||||||
| 28.03.2013 | Debt Settlement | 1,532,258 | 0.620 | 950,000 | - | |||||||||||||||||||||
| As at 31.03.2013 (or Q1 2013) | 110,349,588 | 91,596,070 | 239 | 5,138 | ||||||||||||||||||||||
| 18.04.2013 | Debt Settlement | 2,241,379 | 0.58 | 1,300,000 | - | |||||||||||||||||||||
| 18.04.2013 | Debt Settlement | 932,822 | 0.58 | 541,037 | - | |||||||||||||||||||||
| 10.05.2013 | Debt Settlement | 2,915,055 | 0.46 | 1,340,925 | 1 | |||||||||||||||||||||
| 10.05.2013 | Debt Settlement | 2,084,703 | 0.46 | 958,963 | - | |||||||||||||||||||||
| 25.06.2013 | Debt Settlement | 663,362 | 0.41 | 271,978 | ||||||||||||||||||||||
| 25.06.2013 | Debt Settlement | 986,919 | 0.41 | 404,637 | 1 | |||||||||||||||||||||
| As at 30.06.2013 (or Q2 2013) | Total | 120,173,828 | 96,413,610 | 241 | 5,138 | |||||||||||||||||||||
In accordance with our contract, prior to the official formation of the SFJVC’s the Company will pay an initial deposit and additional deposits as pre-payments to the developer (or owner) of the project as consideration toward future acquisition of the SFJVC upon its official formation.
The total consideration for each purchase of SFJVC is based on its book value at that time of official formation having injected all of the related project’s development assets and liabilities into the SFJVC.
As such the required acquisition cost is funded partly by cash and partly by the set-off receivable due on the consulting and service fee.
CRITICAL ACCOUNTING POLICIES
BASIS OF PRESENTATION
The unaudited consolidated financial statements for the nine months ended September 30, 2014 are prepared in accordance with generally accepted accounting principles in the United States of America (“US GAAP”GAAP”). All material inter-company transactions and balances have been eliminated in consolidation.
The Renminbi ofunaudited quarterly financials for the People’s Republic of China (RMB) has been determined tonine months ended September 30, 2014 results are for the months and do not necessarily indicate the results for a full year. The information included in this interim report should be read in conjunction with the information included in the Company’s functional currency. The balance sheets were translated atannual report on Form 10-K for the fiscal year end exchange rates. Expenses were translated at moving average exchange rates in effect during the years. The effects of rate changes on assets and liabilities are recorded as accumulated other comprehensive income.ended December 31, 2013.
BASIS OF CONSOLIDATION
The consolidated financial statements include the financial statements of SIAF, its subsidiaries Capital Award, CS, CH, TRW, MEIJI, HJST,JHST, JFD, JHMC, HSA, and APWAM, SAFS and its variable interest entity SJAP.entities SJAP and QZH. All material inter-company transactions and balances have been eliminated in consolidation. The results of companies acquired or disposed of during the year are included in the consolidated Financial Statements from the effective date of acquisition.
| - |
BUSINESS COMBINATIONS
The Company adopted the accounting pronouncements relating to business combinations (primarily contained in ASC Topic 805 “Business Combinations”), including assets acquired and liabilities assumed arising from contingencies. These pronouncements established principles and requirements for how the acquirer of a business recognizes and measures in its financial statements the identifiable assets acquired, the liabilities assumed, and any non-controlling interest in the acquire as well as provides guidance for recognizing and measuring the goodwill acquired in the business combination and determines what information to disclose to enable users of the financial statements to evaluate the nature and financial effects of the business combination. In addition, these pronouncements eliminate the distinction between contractual and non-contractual contingencies, including the initial recognition and measurement criteria and require an acquirer to develop a systematic and rational basis for subsequently measuring and accounting for acquired contingencies depending on their nature. Our adoption of these pronouncements will have an impact on the manner in which we account for any future acquisitions.
NON - CONTROLLING INTEREST IN CONSOLIDATED FINANCIAL STATEMENTS
The Company adopted the accounting pronouncement on non-controlling interests in consolidated financial statements, which establishes accounting and reporting standards for the non-controlling interest in a subsidiary and for the deconsolidation of a subsidiary. This guidance is primarily contained in ASC Topic “Consolidation”. It clarifies that a non-controlling interest in a subsidiary is an ownership interest in the consolidated financial statements. The adoption of this standard has not had material impact on our consolidated financial statements.
USE OF ESTIMATES
The preparation of consolidated financial statements in conformity with accounting principles generally accepted in the United States requires management to make assumptions and estimates that affect the reported amounts of assets and liabilities and disclosure of contingent assets and liabilities at the dates of the consolidated financial statements and the reported amounts of revenues and expenses during the reporting periods covered thereby. Actual results could differ from these estimates. Judgments and estimates of uncertainties are required in applying the Company’s accounting policies in certain areas. The following are some of the areas requiring significant judgments and estimates: determinations of the useful lives of assets, estimates of allowances for doubtful accounts, cash flow and valuation assumptions in performing asset impairment tests of long-lived assets, estimates of the reliability of deferred tax assets and inventory reserves.
REVENUE RECOGNITION
The Company’s revenue recognition policies are in compliance with ASC 605. Sales revenue is recognized when all of the following have occurred: (i) persuasive evidence of an arrangement exists, (ii) delivery has occurred or services have been rendered, (iii) the price is fixed or determinable, and (iv) the ability to collect is reasonably assured. These criteria are generally satisfied at the time of shipment when risk of loss and title passes to the customer. Service revenue is recognized when services have been rendered to a buyer by reference to the stage of completion. License fee income is recognized on the accrual basis in accordance with the underlying agreements.
Government grants are recognized upon (i) the Company has substantially accomplished what we must be done pursuant to the terms of the policies and terms of the grant that are established by the local government; and (ii) the Company receives notification from the local government that the Company has satisfied all of the requirements to receive the government grants; and or (iii) the amounts are received.
Multiple-Element Arrangements
To qualify as a separate unit of accounting under ASC 605-25“Multiple Element Arrangements”, the delivered item must have value to the customer on a standalone basis. The significant deliverables under the Company’s multiple-element arrangements are consulting and service under development contract, commission and management service.
Revenues from the Company's fishery development services contract are performed under fixed-price contracts. Revenues under long-term contracts are accounted for under the percentage-of-completion method of accounting in accordance with the Financial Accounting Standards Board (“FASB”) Accounting Standards Codification (“ASC”) Topic 605,Revenue Recognition (“ASC 605”). Under the percentage-of-completion method, the Company estimates profit as the difference between total estimated revenue and total estimated cost of a contract and recognized that profit over the contract term. The percentage of costs incurred determines the amount of revenue to be recognized. Payment terms are generally defined by the installation contract and as a result may not match the timing of the costs incurred by the Company and the related recognition of revenue. Such differences are recorded as either costs or estimated earnings in excess of billings on uncompleted contracts or billings in excess of costs and estimated earnings on uncompleted contracts.
The Company determines a customer’s credit worthiness at the time an order is accepted. Sudden and unexpected changes in a customer’s financial condition could put recoverability at risk.
The percentage of completion method requires the ability to estimate several factors, including the ability of the customer to meet its obligations under the contract, including the payment of amounts when due. If the Company determines that collectability is not assured, we will defer revenue recognition and use methods of accounting for the contract such as the completed contract method until such time as the Company determines that collectability is reasonably assured or through the completion of the project.
| - 71 - |
For fixed-price contracts, the Company uses the ratio of costs incurred to date on the contract (excluding uninstalled direct materials) to management's estimate of the contract's total costs, to determine the percentage of completion on each contract. This method is used as management considers expended costs to be the best available measure of progression of these contracts. Contract costs included all direct material, subcontract and labor costs and those indirect costs related to contract performance, such as supplies, tool repairs and depreciation. The Company accounts for maintenance and repair services under the guidance of ASC 605 as the services provided relate to construction work. Contract costs incurred to date and expected total contract costs are continuously monitored during the term of the contract. Changes in job performance, job conditions, and estimated profitability arising from contract penalty, change orders and final contract settlements may result in revisions to the estimated profitability during the contract. These changes, which include contracts with estimated costs in excess of estimated revenues, are recognized as contract costs in the period in which the revisions are determined. Profit incentives are included in revenues when their realization is reasonably assured. At the point the Company anticipates a loss on a contract, the Company estimates the ultimate loss through completion and recognizes that loss in the period in which the possible loss was identified.
The Company does not provide warranties to customers on a basis customary to the industry; however, the customers can claim warranty directly from product manufacturers for defects in equipment or products. Historically, the Company has experienced no warranty claims.
The Company’s fishery development consultancy services revenues are recognized when the relevant services are rendered, and are subject to a Chinese business tax at a rate of 0% of the gross fishery development contract service income approved by the Chinese local government.
COST OF GOODS SOLD AND SERVICES
Cost of goods sold consists primarily of direct purchase cost of merchandise goods, and related levies. Cost of services consists primarily of direct cost and indirect cost incurred to date for development contracts and provision for anticipated losses on development contracts.
SHIPPING AND HANDLING
Shipping and handling costs related to cost of goods sold are included in general and administrative expenses, which totaled $84,297$1,673, $6,158, $13,490 and $58,392$18,640 for the yearsthree months and for the nine months ended December 31, 2012September 30, 2014 and December 31, 2011,2013, respectively.
ADVERTISING
Advertising costs are included in general and administrative expenses, which totaled $1,973$708,049, $195, $1,661,103 and $99,526$1,200 for the yearsthree months ended December 31, 2012 and December 31, 2011,the nine months ended September 30, 2014 and 2013, respectively.
CASH AND CASH EQUIVALENTS
The Company considers all highly liquid securities with original maturities of three months or less when acquired to be cash equivalents. Cash and cash equivalents kept with financial institutions in People’s Republic of China (“PRC”P.R.C”) are not insured or otherwise protected. Should any of those institutions holding the Company’s cash become insolvent, or the Company is unable to withdraw funds for any reason, the Company could lose the cash on deposit on that institution.
ACCOUNTS RECEIVABLE
The Company maintains reserves for potential credit losses on accounts receivable. Management reviews the composition of accounts receivable and analyzes historical bad debts, customer concentrations, customer credit worthiness, current economic trends and changes in customer payment patterns to evaluate the adequacy of these reserves. Terms of the sales vary. Reserves are recorded primarily on a specific identification basis.
The standard credit period of the Company’s most of customers is three months. Any amount that has an extended settlement date of over one year is classified as a long term receivable. Management evaluates the collectability of the receivables at least quarterly. Provision for doubtful accounts as of December 31, 2012 and December 31, 2011 are $0. There were no bad debts written off for the yearsnine months ended December 31, 2012September 30, 2014 or December 31, 2011.September 30, 2013.
INVENTORIES
Inventories are valued at the lower of cost (determined on a weighted average basis) and net realizable value. Costs incurred in bringing each product to its location and conditions are accounted for as follows:
| - 72 - |
| • | raw materials - purchase cost on a weighted average basis; | |
| • | manufactured finished goods and work-in-progress - cost of direct materials and labor and a proportion of manufacturing overhead based on normal operation capacity but excluding borrowing costs; and | |
| • | retail and wholesale merchandise finished goods - purchase cost on a weighted average basis |
Net realizable value is the estimated selling price in the ordinary course of business, less estimated costs of completion and the estimated costs necessary to make the sale.
PROPERTY AND EQUIPMENT
Property and equipment are stated at cost less accumulated depreciation and any accumulated impairment losses. Such costs include the cost of replacing parts that are eligible for capitalization when the cost of replacing the parts is incurred. The assets’ residual values, useful lives and depreciation methods are reviewed, and adjusted if appropriate, at the end of each year.
Depreciation is calculated on a straight-line basis over the estimated useful life of the assets.
| Milk cows | 10 years | |
| Plant and machinery | 5 - 10 years | |
| Structure and leasehold improvements | 10 -20 years | |
| Mature seed and herbage cultivation | 20 years | |
| Furniture, fixtures and equipment | 2.5 - 10 years | |
| Motor vehicles | 5 -10 years |
An item of property and equipment is removed from the accounts upon disposal or when no future economic benefits are expected to arise from the continued use of the asset. Any gain or loss arising on disposal of the asset (calculated as the difference between the net disposal proceeds and the carrying amount of the item) is included in the consolidated statements of income in the period the item is disposed.
GOODWILL
Goodwill is an asset representing the fair economic benefits arising from other assets acquired in a business combination that are not individually identified and separately recognized. Goodwill is tested for impairment on an annual basis at the end of the company’s fiscal year, or when impairment indicators arise. The Company uses a fair-value-based approach to test for impairment at the level of each reporting unit. The Company directly acquired MEIJI which is engaged in Hu Plantation. As a result of this acquisition, the Company recorded goodwill in the amount of $724,940. This goodwill represents the fair value of the assets acquired in these acquisitions over the cost of the assets acquired.
PROPRIETARY TECHNOLOGIES
The Company has determined that technological feasibility is established at the time a working model of products is completed. Master license of stock feed manufacturing technology was acquired and the costs of acquisition were capitalized as proprietary technologies when technological feasibility had been established. Proprietary technologies are intangible assets of finite lives. Proprietary technologies are amortized using the straight line method over their estimated lives of 25 years.
An aromatic cattle-feeding formula was acquired and the costs of acquisition are capitalized as proprietary technologies when technological feasibility has been established. Cost of acquisition on aromatic cattle-feeding formula is amortized using the straight-line method over its estimated life of 25 years.
The cost of sleepy cod breeding technology license is capitalized as proprietary technologies when technological feasibility has been established. Cost of granting sleepy cod breeding technology license is amortized using the straight-line method over its entitled life of 25 years.
Bacterial cellulose technology license and related trademark are capitalized as proprietary technologies when technological feasibility has been established. Cost of license and related trademark is amortized using the straight-line method over its estimated life of 20 years.
Management evaluates the recoverability of proprietary technologies on an annual basis of the end of the company’s fiscal year, or when impairment indicators arise. As required by ASC Topic 350 “Intangible –- Goodwill and Other”, the Company uses a fair-value-based approach to test for impairment.
| - 73 - |
CONSTRUCTION IN PROGRESS
Construction in progress represents direct costs of construction as well as acquisition and design fees incurred. Capitalization of these costs ceases and the construction in progress is transferred to property and equipment when substantially all the activities necessary to prepare the assets for their intended use are completed. No depreciation is provided until construction is completed and the asset is ready for its intended use..use.
LAND USE RIGHTS
Land use rights represent acquisition of land use right rights of agriculture land from farmers and are amortized on the straight line basis over the respective lease periods. The lease period of agriculture land is in the range from 3010 years to 60 years. Land use rights purchase prices were determined in accordance with the 2007 PRCP.R.C Government’s minimum lease payments of agriculture land and mutually agreed between the company and the vendors. No independent professional appraiser performed a valuation of land use rights at the balance sheet dates.
CORPORATE JOINT VENTURE
A corporation formed, owned, and operated by two or more businesses (ventures) as a separate and discrete business or project (venture) for their mutual benefit is considered to be a corporate joint venture. Investee entities, in which the company can exercise significant influence, but not control, are accounted for under the equity method of accounting. Under the equity method of accounting, the company’s share of the earnings or losses of these companies is included in net income.
A loss in value of an investment that is other than a temporary decline is recognized as a charge to operations. Evidence of a loss in value might include, but would not necessarily be limited to absence of an ability to recover the carrying amount of the investment or inability of the investee to sustain an earnings capacity that would justify the carrying amount of the investment.
VARIABLE INTEREST ENTITY
An entity (investee) in which the investor has obtained less than a majority-owned interest, according to the Financial Accounting Standards Board (FASB). A variable interest entity (VIE) is subject to consolidation if a VIE is an entity meeting one of the following three criteria as elaborated in ASC Topic 810-10,Consolidation.
(a) the equity-at-risk is not sufficient to support the entity's activities
(b) as a group, the equity-at-risk holders cannot control the entity; or
(c) the economics do not coincide with the voting interests.
If a firm is the primary beneficiary of a VIE, the holdings must be disclosed on the balance sheet. The primary beneficiary is defined as the person or company with the majority of variable interests
TREASURY STOCK
Treasury stock consists of a Company’s own stock which has been issued, but is subsequently reacquired by the Company. Treasury stock does not reduce the number of shares issued but does reduce the number of shares outstanding. These shares are not eligible to receive cash dividends. Accounting for excesses and deficiencies on treasury stock transactions is governed by ASC 505-30-30.
State laws and federal agencies closely regulate transactions involving a company’s own capital stock, so the purchase of outstanding shares and converting them into treasury shares must have a legitimate purpose. Some of the most common reasons for purchasing outstanding shares are as follows:
(i) to meet additional stock needs for various reasons, including newly implemented stock option plans, the issuance stock for convertible bonds or convertible preferred stock, or a stock dividend;
(ii) to eliminate the ownerships interests of a stockholder;
(iii) to increase the market price of the stock that returns capital to shareholders; and
(iv) to potentially increase earnings per share of the stock by decreasing the shares outstanding on the same earnings.
The cost method of accounting for treasury stock shares has been adopted by the Company. The purchase of outstanding shares is treated as a temporary reduction in shareholders’ equity in view of the expectation to reissue the shares instead of retiring them. When the Company reissues the treasury shares, the temporary account is eliminated. The cost of treasury stock shares reacquired is charged to a contra account, in this case a contra equity account that reduces the stockholder equity balance.
| - 74 - |
INCOME TAXES
The Company accounts for income taxes under the provisions of ASC 740 “Accounting for Income Taxes”. Under ASC 740, deferred tax assets and liabilities are determined based on the difference between the financial statement carrying amounts and the tax bases of assets and liabilities using enacted tax rates in effect in the years in which the differences are expected to reverse.
The provision for income tax is based on the results for the year as adjusted for items, which are non-assessable or disallowed. It is calculated using tax rates that have been enacted or substantively enacted at the balance sheet date. Deferred taxes area accounted for using the balance sheet liability method in respect of temporary differences arising from differences between the carrying amount of assets and liabilities in the financial statements and the corresponding tax basis used in the computation of assessable tax profit. In principle, deferred tax liabilities are recognized for all taxable temporary differences, and deferred tax assets are recognized to the extent that it is probable that taxable profit will be available against which deductible temporary differences can be utilized.
Deferred income taxes are calculated at the tax rates that are expected to apply to the period when the asset is realized or the liability is settled. Deferred tax is charged or credited in the income statement, except when it relates to items credited or charged directly to equity, in which case the deferred tax is also adjusted in the equity accounts. Deferred tax assets and liabilities are offset when they relate to income taxes levied by the same taxation authority and the Company intends to settle its current tax assets and liabilities on a net basis. ASC 740 also prescribes a more-likely-than-not threshold for financial statement recognition and measurement of a tax position taken, or expected to be taken, in a tax return. ASC 740 also provides guidance related to, among other things, classification, accounting for interest and penalties associated with tax positions, and disclosure requirements. Any interest and penalties accrued related to unrecognized tax benefits will be recorded in tax expense.
POLITICAL AND BUSINESS RISK
The Company's operations are carried out in the PRC.P.R.C. Accordingly, the Company's business, financial condition and results of operations may be influenced by the political, economic and legal environment in the PRC,P.R.C., and by the general state of the PRC'sP.R.C.'s economy. The Company's operations in the PRCP.R.C. are subject to specific considerations and significant risks not typically associated with companies in North America and Western Europe. The Company's results may be adversely affected by changes in governmental policies with respect to laws and regulations, anti-inflationary measures, currency conversion and remittance abroad, and rates and methods of taxation, among other things.
IMPAIRMENT OF LONG-LIVED ASSETS AND INTANGIBLE ASSETS
In accordance with ASC 360, “Property, Plant and Equipment”, long-lived assets to be held and used are analyzed for impairment whenever events or changes in circumstances indicate that the related carrying amounts may not be recoverable. The Company reviews the carrying amount of its long-lived assets, including intangibles, for impairment, at the end of each fiscal year. An asset is considered impaired when estimated future cash flows are less than the carrying amount of the asset. In the event the carrying amount of such asset is considered not recoverable, the asset is adjusted to its fair value. Fair value is generally determined based on discounted future cash flow. As of December 31, 2011September 30, 2014 and December 31, 2010,2013, the Company determined no impairment chargeslosses were necessary.
EARNINGS PER SHARE
As prescribed in ASC Topic 260 “Earning per Share,”, Basic Earnings per Share (“EPS”) is computed by dividing net income available to common stockholders by the weighted average number of common stock shares outstanding during the year. Diluted EPS is computed by dividing net income available to common stockholders by the weighted-average number of common stock shares outstanding during the year plus potential dilutive instruments such as stock options and warrants. The effect of stock options on diluted EPS is determined through the application of the treasury stock method, whereby proceeds received by the Company based on assumed exercises are hypothetically used to repurchase the Company’s common stock at the average market price during the period.
For the years ended December 31, 2012 and 2011, basic earnings (loss) per share from continuing operations attributable to the Company’s common stockholders amounted to $0.70 and $0.21, respectively. For the years ended December 31, 2012 and 2011, diluted earnings (loss) per share from continuing operations attributable to the Company’s common stockholders amounted to $0.63 and $0.23, respectively.
For the years ended December 31, 2012 and 2011, basic earnings per share from continuing and discontinued operations attributable to the Company’s common stockholders amounted to $0.70 and $0.43, respectively. For the years ended December 31, 2012 and 2011, diluted earnings (loss) per share from continuing and discontinued operations attributable to the Company’s common stockholders amounted to $0.63 and $0.39, respectively.
For the sixthree months ended JuneSeptember 30, 20132014 and 2012,2013, basic earnings per share attributable to Sino Agro Food, Inc. and subsidiaries common stockholders amount to $0.28$1.49 and $0.22,$1.52, respectively. For the sixnine months ended JuneSeptember 30, 2014 and 2013, basic earnings per share attributable to Sino Agro Food, Inc. and 2012,subsidiaries common stockholders amount to $4.42 and $4.24, respectively. For the three months ended September 30, 2014 and 2013, diluted earnings per share attributable to Sino Agro Food, Inc. and its subsidiaries’ common stockholders amounted to $0.27$1.43 and $0.20,$1.44, respectively. For the nine months ended September 30, 2014 and 2013, diluted earnings per share attributable to Sino Agro Food, Inc. and its subsidiaries’ common stockholders amounted to $4.23 and $3.96, respectively.
| - 75 - |
FOREIGN CURRENCY TRANSLATION
The reporting currency of the Company is the U.S. dollar.dollars. The functional currency of the Company is the Chinese Renminbi (RMB). For those entities whose functional currency is other than the U.S. dollars, all assets and liabilities are translated into U.S. dollars at the exchange rate on the balance sheet date; shareholder equity is translated at historical rates and items in the statements of income and of cash flows are translated at the average rate for the period.
Because cash flows are translated based on the weighted average translation rate, amounts related to assets and liabilities reported in the statements of cash flows will not necessarily agree with changes in the corresponding balances in the balance sheets. Translation adjustments resulting from this process are included in accumulated other comprehensive income in the consolidated statements of equity.
For the fiscal yearnine months ended December 31, 2012September 30, 2013
Translation gains and losses that arise from exchange rate fluctuations on transactions denominated in a currency other than the functional currency are included in the statements of income and comprehensive income as incurred. The balance sheet amounts with the exception of equity as of September 30, 2013 and December 31, 2012 and December 31, 2011 were translated at RMB6.2855RMB6.15 to $1.00 and RMB6.30RMB6.29 to $1.00, respectively.
The average translation rates applied to the consolidated statements of income and comprehensive income and of cash flows for the yearsnine months ended December 31, 2012September 30, 2014 and December 31, 2011September 30, 2013 were RMB6.31RMB6.21 to $1.00 and RMB6.33 to $1.00, respectively.
For the fiscal quarternine months ended JuneSeptember 30, 20132014
Translation gains and losses that arise from exchange rate fluctuations on transactions denominated in a currency other than the functional currency are included in the statements of income and comprehensive income as incurred. The balance sheet amounts with the exception of equity as of JuneSeptember 30 20132014 and December 31, 20122013 were translated at RMB6.18RMB 6.15 to $1.00 and RMB6.29RMB6.15 to $1.00, respectively.
The average translation rates applied to the consolidated statements of income and comprehensive income and of cash flows for the sixnine months ended JuneSeptember 30, 2014 and September 30, 2013 and June 30, 2012 were RMB6.24RMB6.15 to $1.00 and RMB6.31 toRMB6.2 1to $1.00, respectively.
NON-GAAP FINANCIAL MEASURES
Non-GAAP financial measures can represent our actual U.S. dollars reported earnings per share including foreign exchange gain of net assets denominated in RMB as the underlying trend shows Chinese Renminbi appreciates steadily against United States dollars. As such, we measure diluted earnings per share growth rate using comprehensive income divided by the weighted average number of shares outstanding, and provide guidance on the comprehensive income per share.
Below is a reconciliation of reported EPS to non-GAAP EPS for the three months ended June 30 2013 and 2012:
| Consolidated results | First half, 2013 | First half 1, 2012 | ||||||
| Diluted net earnings per share (EPS) | $ | 0.12 | $ | 0.13 | ||||
| Translational impact (a) | $ | 0.00 | $ | 0.00 | ||||
| Non - GAAP measure EPS | $ | 0.13 | $ | 0.13 | ||||
| Non - GAAP measure EPS growth rate (b) | 0 | % | ||||||
Below is a reconciliation of reported EPS to non - GAAP measure EPS for the six months ended June 30, 2013 and 2012:
| Consolidated results | First half, 2013 | First half 1, 2012 | ||||||
| Diluted net earnings per share (EPS) | $ | 0.27 | $ | 0.20 | ||||
| Translational impact (a) | $ | 0.00 | $ | 0.01 | ||||
| Non - GAAP measure EPS | $ | 0.27 | $ | 0.21 | ||||
| Non - GAAP measure EPS growth rate (b) | 28.57 | % | ||||||
ACCUMULATED OTHER COMPREHENSIVE INCOME
ASC Topic 220 “Comprehensive Income” establishes standards for reporting and displaying comprehensive income and its components in financial statements. Comprehensive income is defined as the change in stockholders’ equity of a business enterprise during a period from transactions and other events and circumstances from non-owner sources. The comprehensive income for all periods presented includes both the reported net income and net change in cumulative translation adjustments.
RETIREMENT BENEFIT COSTS
PRC
P.R.C. state managed retirement benefit programs are defined contribution plans and the payments to the plans are charged as expenses when employees have rendered service entitling them to the contribution.
STOCK-BASED COMPENSATION
The Company adopts both ASC Topic 718, “Compensation - Stock Compensation” and ASC Topic 505-50,”Equity-Based Payments to Non-Employees” using the fair value method in which an entity issues its equity instruments to acquire goods and services from employees and non-employees. Stock compensation for stock granted to non-employees has been determined in accordance with this accounting standard and the accounting standard regarding accounting for equity instruments that are issued to other than employees for acquiring, or in conjunction with selling goods or services, as the fair value of the consideration received or the fair value of equity instruments issued, whichever is more reliably measured. This accounting standard allows the “simplified” method to determine the term of employee options when other information is not available. Under ASC Topic 718 and ASC Topic 505-50, stock compensation expenses is measured at the grant date on the value of the option or restricted stock and is recognized as expenses, less expected forfeitures, over the requisite service period, which is generally the vesting period.
FAIR VALUE OF FINANCIAL INSTRUMENTS
The Company follows paragraph 825-10-50-10 of the FASB Accounting Standards Codification for disclosures about fair value of its financial instruments and paragraph 820-10-35-37 of the FASB Accounting Standards Codification (“Paragraph 820-10-35-37”) to measure the fair value of its financial instruments. Paragraph 820-10-35-37 establishes a framework for measuring fair value in accounting principles generally accepted in the United States of America (U.S. GAAP), and expands disclosures about fair value measurements. To increase consistency and comparability in fair value measurements and related disclosures, Paragraph 820-10-35-37 establishes a fair value hierarchy which prioritizes the inputs to valuation techniques used to measure fair value into three (3) broad levels. The fair value hierarchy gives the highest priority to quoted prices (unadjusted) in active markets for identical assets or liabilities and the lowest priority to unobservable inputs. The three (3) levels of fair value hierarchy defined by Paragraph 820-10-35-37 are described below:
| - 76 - |
Level 1 Quoted market prices available in active markets for identical assets or liabilities as of the reporting date.
Level 2 Pricing inputs other than quoted prices in active markets included in Level 1, which are either directly or indirectly observable as of the reporting date.
Level 3 Pricing inputs that are generally observable inputs and not corroborated by market data.
The carrying amounts of the Company’s financial assets and liabilities, such as cash and accrued expenses, approximate their fair values because of the short maturity of these instruments.
The carrying amounts of the Company’s financial assets and liabilities, such as cash and accrued expenses, approximate their fair values because of the short maturity of these instruments. The Company does not have any assets or liabilities measured at fair value on a recurring or a non-recurring basis, consequently, the Company did not have any fair value adjustments for assets and liabilities measured at fair value as of JuneSeptember 30, 20132014 or December 31, 2012,2013, nor gains or losses are reported in the statements of income and comprehensive income that are attributable to the change in unrealized gains or losses relating to those assets and liabilities still held at the reporting date for the fiscal periodnine months ended JuneSeptember 30, 20132014 or June 31, 2012.2013.
NEW ACCOUNTING PRONOUNCEMENTS
The Company does not expect any recent accounting pronouncements to have a material effect on the Company’s financial position, results of operations, or cash flows.
In January 2011,February 2013, the FASB issued an Accounting Standard Update (ASU”guidance on disclosure requirements for items reclassified out of Accumulated Other Comprehensive Income (“AOCI”) No, 2011-01, Receivables Topic 310):Disclosures about.This new guidance requires entities to present (either on the Credit Quality of Financing Receivables and the Allowance for Credit Losses, to be concurrent with the effective dateface of the guidance for determining what constitutes a troubled debt restructuring, as presentedincome statements or in proposed Accounting Standards Update, Receivables (Topic 310): Clarifications to Accounting for Troubled Debt Restructurings by Creditors. The amendments in this Update apply to all public-entity creditors that modify financing receivables within the scopenotes) the effects on the line items of the disclosure requirements about troubled debt restructurings in Update 2010-20. Under the existing effective date in Update 2010-20, public-entity creditors would have provided disclosures about troubled debt restructuringsincome statement for periods beginning on or after December 15, 2010.amounts reclassified out of AOCI. The amendments in this Update temporarily defer that effective date, enabling public-entity creditors to provide those disclosures after the Board clarifies thenew guidance for determining what constitutes a troubled debt restructuring. The deferral in this Update will result in more consistent disclosures about troubled debt restructurings. This amendment does not defer the effective date of the other disclosure requirements in Update2010-20. In the proposed Update for determining what constitutes a troubled debt restructuring, the Board proposed that the clarifications would be effective for interim and annual periods ending after June 15, 2011. Forus beginning July 1, 2013. Other than requiring additional disclosures, there is no material impact on the consolidated financial statements upon adoption.
In March 2013, the FASB issued guidance on a parent’s accounting for the cumulative translation adjustment upon de-recognition of a subsidiary or group of assets within a foreign entity. This new disclosures about troubled debt restructuringsguidance requires that the parent releases any related cumulative translation adjustment into net income only if the sale or transfer results in Update 2010-20, those clarifications would be applied retrospectively to the beginningcomplete or substantially complete liquidation of the fiscal yearforeign entity in which the proposalsubsidiary or group of assets had resided. The new guidance was effective for us beginning July 1, 2014. There is adopted. The Company does not expect the adoption of ASU 2011-01 to have a significantno material impact on itsthe consolidated financial statements.statements upon adoption.
In April 2011,July 2013, the FASB issued ASU No. 2011-03,Transfers and Servicing (Topic 860): Reconsideration2013-11, “Presentation of Effective Controlan Unrecognized Tax Benefit When a Net Operating Loss Carry forward, a Similar Tax Loss, or a Tax Credit Carry forward Exists”. These amendments provide that an unrecognized tax benefit, or a portion thereof, should be presented in the financial statements as a reduction to a deferred tax asset for Repurchase Agreements (ASU 2011-03), intendeda net operating loss carryforward, a similar tax loss, or a tax credit carry forward, except to improve financialthe extent that a net operating loss carry forward, a similar tax loss, or a tax credit carry forward is not available at the reporting date to settle any additional income taxes that would result from disallowance of repurchase agreements and refocusa tax position, or the assessment of effective control on a transferor’s contractual rights and obligations rather than practical ability to perform those rights and obligations. The guidance in ASU 2011-03 is effective for the first interim or annual period beginning on or after December 15, 2011.The Companytax law does not expectrequire the adoption of ASU 2011-03entity to have a significant impact on its consolidated financial statements.
In May 2011, the FASB issued ASU No. 2011-04,Amendments to Achieve Common Fair Value Measurement and Disclosure Requirements in U.S. GAAP and IFRSs (ASU 2011-04). ASU 2011-04 represents the converged guidance of the FASBuse, and the International Accounting Standards Board (IASB) on fair value measurement. A variety of measures are included in the update intended to either clarify existing fair value measurement requirements, change particular principles requirements for measuring fair value or for disclosing information about fair value measurements. For many of these requirements, the FASBentity does not intend to changeuse, the application of existing requirements under Accounting Standards Codification (ASC) Topic 820, Fair Value Measurements. ASU2011-04 is effectivedeferred tax asset for interim and annual periods beginning after December 15, 2011 and early application is not permitted. The Company does not expectsuch purpose, then the adoption of ASU 2011-04 to have a significant impact on its consolidated financial statements.
In June 2011, the FASB issued ASU No. 2011-05,Presentation of Comprehensive Income (ASU 2011-05), intended to increase the prominence of items reported in other comprehensive income and to facilitate convergence of accounting guidance in this area with that of the IASB. The amendments require that all non-owner changes in stockholders’ equityunrecognized tax benefit should be presented inas a single continuous statement of comprehensive income or in two separate but consecutive statements. Amendments under ASU 2011-05 forliability. For public entities, should be applied retrospectivelythe amendments are effective for fiscal years, and interim periods within those years, beginning after December 15, 2011.2013. The Company does not expect the adoption of ASU 2011-05 to2013-11 does not have a significantmaterial impact on itsthe Company’s consolidated financial statements.
In July 2011,April 2014, the FASB issued accountingASU 2014-08, “Reporting Discontinued Operations and Disclosures of Disposals of Components of an Entity,” which provides a narrower definition of discontinued operations than under existing U.S. GAAP. ASU 2014-08 requires that only a disposal of a component of an entity, or a group of components of an entity, that represents a strategic shift that has, or will have, a major effect on the reporting entity’s operations and financial results should be reported in the consolidated financial statements as discontinued operations. ASU 2014-08 also provides guidance on the consolidated financial statement presentations and disclosures about the credit quality of financing receivables and the allowance for credit losses.discontinued operations. The new guidance expands disclosuresis effective prospectively for the allowanceCompany to all new disposals of components and new classification as held for credit losses and financing receivables by requiring entities to disclose information at disaggregated levels. It also requires disclosure of credit quality indicators, past due information and modifications of financing receivables.sale beginning April 1, 2015. The Company does not expectis evaluating the effects, if any, of the adoption of this guidance towill have a significant impact on itsthe consolidated financial statements.position, results of operations or cash flows.
In September 2011,May 2014, the FASBFinancial Accounting Standards Board issued Intangibles – Goodwillguidance related to revenue from contracts with customers. Under this guidance, revenue is recognized when promised goods or services are transferred to customers in an amount that reflects the consideration that is expected to be received for those goods or services. The updated standard will replace most existing revenue recognition guidance under GAAP when it becomes effective and Other (Topic 350) – Testing Goodwillpermits the use of either the retrospective or cumulative effect transition method. Early adoption is not permitted. The updated standard will be effective for Impairment (ASU No. 2011-08), which amends ASC 350 tous in the first assess qualitative factors before performingquarter of 2017. We have not yet selected a transition method and we are currently evaluating the quantitative goodwill impairment testing. The ASU provides the option to first assess qualitative factors to determine whether the existence of events or circumstances leads to a determination that it is more likely than noteffect that the fair value of a reporting unit is less than its carrying amount. If the results of the qualitative analysis indicate it is not more likely than not that the fair value of a reporting unit is less than its carrying amount, the quantitative two-step impairment test, which is required under current U.S. GAAP, would not be necessary. The ASU is effective for annual and interim goodwill impairment tests performed for fiscal years beginning after December 15, 2011. The Company does not expect the adoption of ASU 2011-08 toupdated standard will have a significant impact on itsour consolidated financial statements.statements and related disclosures.
| - |
In July 2012,August 2014, the FASB issued Accounting Standards Update ASU 2012-02, the amendmentsNo. 2014-15, “Disclosure of Uncertainties about an Entity’s Ability to ASC 350, Intangibles—Goodwill and Other: Testing Indefinite-Lived Intangible Assets for Impairment (“Continue as a Going Concern.” ASU 2012-02”). The amendments apply to all entities, both public and nonpublic, that have indefinite-lived intangible assets, other than goodwill, reported in their financial statements. In accordance with the amendments an entity has the option first2014-15 will explicitly require management to assess qualitative factorsan entity’s ability to determine whether the existence of eventscontinue as a going concern, and circumstances indicates that itto provide related footnote disclosure in certain circumstances. This pronouncement is more likely than not that the indefinite-lived intangible asset is impaired. If, after assessing the totality of events and circumstances, an entity concludes that it is not more likely than not that the indefinite-lived intangible asset is impaired, then the entity is not required to take further action. However, if an entity concludes otherwise, then it is required to determine the fair value of the indefinite-lived intangible asset and perform the quantitative impairment test by comparing the fair value with the carrying amount in accordance with Subtopic 350-30. An entity also has the option to bypass the qualitative assessment for any indefinite-lived intangible asset in any period and proceed directly to performing the quantitative impairment test. An entity will be able to resume performing the qualitative assessment in any subsequent period. The amendments are effective for annual and interim impairment tests performed for fiscal years, and interim periods within those years, beginning after SeptemberDecember 15, 2012,2016, and early adoption is permitted. The Company will apply these amendments for reporting periods beginning after December 31, 2012. The Company doesManagement is currently evaluating the impact of this pronouncement on our consolidated financial statements.
Other accounting standards that have been issued or proposed by FASB that do not expect therequire adoption of the amendmentsuntil a future date are not expected to have a material impact on the consolidated financial statements.statements upon adoption.
PROGRESS REPORTS AND SUBSEQUENT EVENTS
Table (PS 1) below shows the progress reports and subsequent events on operational affairs of each subsidiary as at Q3 2014:
| Name of | ||||
| subsidiaries | Operation divisions | Description | ||
| SJAP | ||||
| Cattle farming & fattening | During this quarter, we sold 1,250 and 3,525 head of cattle from our own farm and the cooperative growers, respectively, totaling 4,775 head of fattened cattle at an average live weight of 727 kg / head with average sales of RMB 30 / kg of live weight or at RMB21,810 / head. At this rate, we are expecting that the cooperative growers generated 19.2% of gross profit from each fattening period of 90 days. | |||
| Fertilizer | This quarter sales of fertilizer decreased to just over 2,100 MT due mainly to (i) there were no intercompany sales to our Hunan operation because Hunan HSA has established its second production plant that is now self-sufficient and (ii) months in this quarter are not the months to apply fertilizer heavily, but rather mainly supplying minor sales to local vegetable and produce growers. | |||
| Bulk livestock feed | The averaged consumption of Bulk Feed is at about 0.5 MT / head / month which is equivalent to 1.5 MT / head / 90 days representing cost of RMB1,540 / head of fattened cattle / 90 days based on our current sales price of RMB1,027 / MT. This quarter there were over 8,200 MT of Bulk Feed being used and sold. | |||
| Concentrated stock feed | Average consumption of "Concentrate Feed" during the fattening period is at 0.7 Kg / head / day representing around 3,500 MT and 4,125 MT were being used by our fattening operation and sold to regional non co-op buyers, respectively. | |||
| Slaughterhouse | There were 845 head of cattle being slaughtered during the quarter, out of which 506 head having been de-boned grossing 285 MT of meat product and just over 28 MT of bones representing a recovery rate of 62%. | |||
| Deboning & processing | Apart from the said 506 head of cattle being deboned, there was an additional 88 MT of imported quarter-cut beef and 126 MT of imported 6-cut mutton from Australia being deboned during the quarter. Collectively, they generated just over $ 5.79 Million in revenue for SJAP from its slaughtering and de-boning activities. | |||
| Others | All grounds surrounding the slaughterhouse compound have been finished as at the end of Q3 2014, however, external access road work is still in progress pending the local Government's work schedule to allow its completion. All other Phase (2) work (i.e. the live cattle yards, cold and dry storages, staff quarters, etc.) are in progress. | |||
| At the end of Q3 2014 there were two concession stores in operation in Tesco stores and at the end of October 2014 there are 3 additional stores opened for business making a total of 5 concession stores at Tesco. All store location addresses are posted on our web-site. | ||||
| * Please refer to the pictures below for some of SJAP's development in progress. | ||||
| - 78 - |
| HSA |
| Fertilizer | HSA completed its expanded fermentation facility during Quarter 3 of 2014, and has produced over 10,000 MT of fertilizer and sold over 13,000 MT of various types of fertilizers for the lake fishermen, grapes and other produce growers and general distributors. At the same time, it produced over 20 MT of specially designed and packaged fertilizer for the domestic markets aiming at distribution into supermarket chains of the City Centers to capitalize on the growing trend of indoor farming by the rising urban middle class. | |||
| Cattle farming | During this Quarter, the Government Authority has approved HSA's application to develop a cattle station at its complex, and as such, anticipates construction of the cattle houses starting sometime in December 2014. | |||
| Crop plantation | The season was good during the Quarter providing HSA a good harvest of over 8,000 MT of yellow grasses, and since HSA's cattle farm development work has been delayed, it is expected that these yellow grasses will be sold to regional cattle farmers during the next few months of the fast approaching winter. | |||
| Others | * Please refer to the pictures below for some of HSA's development in progress. |
SJAP: This season’s harvest and baling of the Bulk livestock feed and the latest look of the Slaughterhouse &Deboning facility site.
| - 79 - |


A mockup of our first meat counters at Tesco

HSA: Commissioning of second newly established fertilizer production plant at Hunan HSA.

Table (PS 2) below shows the progress reports and subsequent events on operational affairs of each subsidiary (continued)
| Subsidiary | Operation division | Description | ||
| JHST (HU Plantation) | Immortal Vegetables | During this Quarter, there were 152.5 MT of fresh Immortal vegetables harvested from about 70 Mu of plantation from which about 15 MT of dried plants were processed, packed, and sold to distributors at an average price of RMB450 / Kg enhancing revenue over $1.11 million for JHST. | ||
| HU Flowers | This Quarter, the harvest of just over 18.8 million pieces is likely the end of this year's growing season. During October 2014, there were very little flowers being harvested resulting in a very short season compared to other normal years. In this respect, the Company is seeking the help of agriculture experts aimed at improving the plantation's yield even under extremely wet conditions as experienced this year. | |||
| Drying & Processing | The application to Government authorities to convert 50 Mu of agriculture land into industrial land is pending approval to allow construction of additional drying and production facilities. At this time, there is no further indication as to when the application will be approved. | |||
| Others | JHST has completed its construction of its new storage and office during this Quarter. |
| - 80 - |
| * Please refer to pictures below showing the HU and Immortal Vegetable plantation this season and the new staff quarters. | ||||
| * Please visit our website (www.sinoagrofood.com) to see our latest video showing the sale of Immortal Vegetables. |
The HU Plantation
The Immortal Vegetable Plantation

Matured Immortal Vegetable plants with flowers

Table (PS 4) below shows the progress reports and subsequent events on operational affairs of each subsidiary: (Continued)
| Subsidiary | Operation division | Description | ||
| CA (Fishery) | (Existing Projects) | |||
| Fish Farm (1) or (JFD) | By the end of September 2014, FF(1) has increased its prawn growing tanks to 10 along with 4 tanks for eels and 2 tanks for sleepy cods. Most of the prawns are Big Giant Prawn species along with two tanks of Grass Prawns and one tank of Mexican White for further trials and experiments. These two species of prawn require up to a 5% salinity level requiring the use of ocean salt for the mix, but have yet to reach optimal grow-out results. Our interest is to maintain these trials since the growth rate of these two species is far superior to that of the Big Giant Prawn. We are confident that, given more time, we will discover the solution. | |||
| Fish Farm (2) | FF(2) has proven thus far that after its dams had been converted into RAS systems, although in an outdoor environment, it has the ability to grow-out eels, and therefore we are using this farm to grow eels from the fingerling stage to adult eels anywhere up to 1.5 to 1.8 Kg / eel then sending them to FF(1) for further fattening up to 3 Kg / eel. So far, this process is proving successful. | |||
| Prawn Farm (1) | During the Quarter, PF(1) completed its construction of the additional APM tanks and is now working on installation of all filters and equipment, targeting to start production operation within the last quarter of 2014. It will have more than 12 APM tanks and an onset of fingerling prawn tanks improving its growing capacity from its original 4 tanks. If all goes well, the construction of an adjacent Hydroponic farm will be started during Q4 2014, and upon its completion, we shall have the first demonstrated model of commercial Aquaculture cum Hydroponic farm in China, if not the world. |
| - 81 - |
| Prawn Farm (2) | During the Quarter, PF(2) completed 6 semi-enclosed dams and is operating 12 other semi-RAS and outdoor grow-out dams producing prawns, eels and fish having harvested over 30 MT of Mexican white and grass prawns that seem to grow well under such conditions, especially since PF(2) has sources of salt water nearby. | |||
| R & D station | Some of newly developed species of fish by our R&D Station have been grown in open dams at the New Zhongshan project, which has several existing dams that will be employed over the next few years as development allows. | |||
| * Please refer to the pictures below showing the current status of FF(1), PF(1) and PF(2) |


| - 82 - |
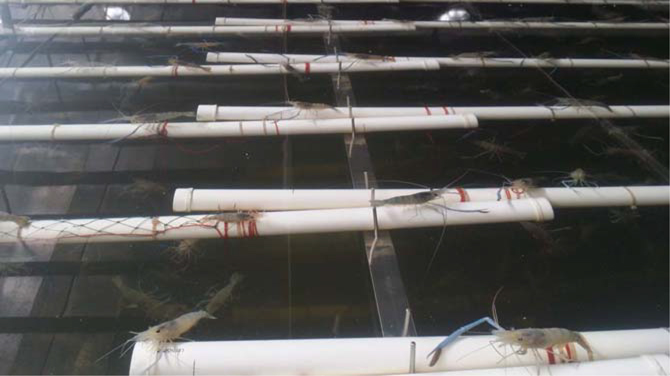

Visitors from UK at FF (1)
Prawn Farm (1): lettuce are doing well using the recycled waste from FF (1)
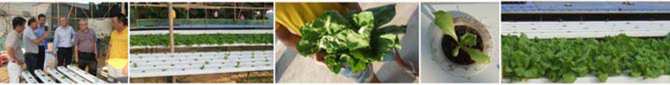
Prawn Farm (1): Pictures showing PF(1) at Enping, the constructed additional showroom, storage andstaff quarters
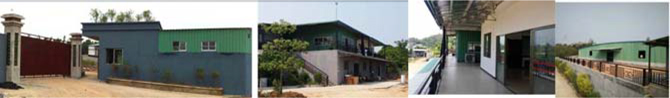
Prawn Farm (1): Finishing work on the Construction on the extension of APM tanks at PF(1)
| - 83 - |
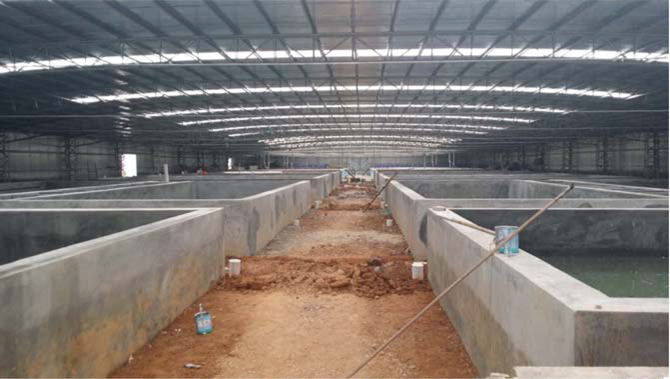
Prawn Farm (2): Construction of the semi-opened RAS Dams and the harvesting of fish

The big grass prawns (16 weeks old) above (and their 7 days old fingerling below). Both are in high demand.
| - 84 - |


Table (PS 5) below shows the progress reports and subsequent events on operational affairs of each subsidiary: (Continued)
| Subsidiary | Operation division | Description | ||
| CA (Fishery) | Zhongshan New Prawn Project (ZSNP) | During the Quarter, ZSNP has completed the construction and building of the complex consisting of offices, staff quarters, conference room, storage, staff canteen and parking areas, as well as landscaping encompassing a total built-up area of over 2,000 m2 at the front entrance of the property to house over 20 personnel and provide working and office space required in Phase (1) of the development. | ||
| Work is now in progress for the construction of Stage (1) of the APM farms that will have the capacity to produce 10,000 MT / year. As all APM tanks are modular such that it is expecting, by the end of March 2015, its first lot of modules to produce 2,000 MT / year collectively will be in operation. | ||||
| * Please refer to the pictures below showing the latest developments of the new ZSNP |
| - 85 - |
Zhongshan New Prawn Farm Project: Finishing the construction of the office, staff quarters, canteen, etc.

Construction of the workers quarter for the construction workers and the first lots of APM farms.

Table (PS 6) below shows the progress reports and subsequent events on operational affairs of each subsidiary: (Continued)
| Subsidiary | Operation division | Description | ||
| SIAF (Corporate & Trading) | Consulting & Services | The following work was carried out during Q3 2014: | ||
| Works are in progress on the expansion of the Restaurant (4) at Zhongshan City. | ||||
| After the renovation and alternation of Restaurant (1) turning it into a Steak House proves to be a success catering in an average over 500 customers per day and each week-end there are always a long line of waiting clients. | ||||
| In so far, we have established 5 restaurants with three of them are making profit and two are still losing, and we are aiming to improve their financial performances as soon as possible now that we have established three viable concepts that are receptive by the middle classes. | ||||
| The small meat and seafood (semi-wholesale and mainly retail shop) is in operation during the quarter, and its current activities we are expecting it to be self-sustained even in its early days of operation and targeting that it will be profitable within 3 months of operation. | ||||
| A wholesale and distribution center is being developed and constructed in the Shanghai City. The center is having over 3000 m2 of built-up areas situated in an industrial zoned complex not far from the PoTung District and it will act as a central hub to service the Shanghai wholesale markets, Tesco Chain stores, regional distributors as well as other super market chains in Shanghai with seafood and meats. It is expecting this center will be in operation within December 2014, and is targeting to generate sales up to 12,000 MT of meat and 5,000 MT of seafood per year within the next one to two years through this center. |
| - 86 - |
| Imported goods | In Madagascar, the Company is organizing with a number local businessmen to supply us with processed seafood (i.e., cooked and peeled frozen crayfish and crab meats, frozen groupers and snappers etc.) targeting to complete all arrangements including export permits within the fourth quarter of 2014 to start shipments early next year. | |||
| Others | * Please visit our website for access to videos showing our new Madagascar packaging facility, as well as the collection of crabs and crayfish from that region. |

The new steakhouse with customers waiting outside of the restaurant each week-end
| - 87 - |
The new wholesale and distribution center cum office at PoTung District Shanghai City.
Establishing a corporate office in Stockholm, Sweden
The Company has many Swedish shareholders. As a result, the Company is planning to establish a corporate office that will have professional staffs (inclusive of additional directors) in Stockholm, Sweden to provide proficient and more updated IR, PR and financial information of the Company to our shareholders in Sweden as well as elsewhere and to explore other business and corporate opportunities that may be available to the Company in the Nordic region (e.g., SAFS’ current involvement in a joint venture to develop a fishery operation in Norway).
In this prospectus, unless the context requires otherwise, references to the “Company,” “Sino Agro” “we,” “our company,” “our” and “us,” refer to Sino Agro Food, Inc., a Nevada corporation together with its subsidiaries.
Sino Agro Food, Inc.
SIAF is an agriculture technology and natural food holding company with principal operations in the People’s Republic of China. The Company Historyacquires and maintains equity stakes in a cohesive portfolio of companies that SIAF forms according to its core mission to produce, distribute, market and sell natural, sustainable protein food and produce, primarily seafood and cattle, to the rapidly growing middle class in China. SIAF provides financial oversight and strategic direction for each company, and for the interoperation between companies, stressing vertical integration between the levels of the Company’s subsidiary food chain. The Company owns or licenses patents, proprietary methods, and other intellectual properties in its areas of expertise. SIAF provides consulting and services to joint venture partners to construct and operate food businesses, primarily producing wholesale fish and cattle. Further joint ventures market and distribute the wholesale products as part of an overall “farm to plate” concept and business strategy.
Revenues by division were as follows (in millions of U.S. dollars):
| Division | 2012 | 2013 | ||||||
| Fisheries | $ | 86.3 | $ | 107.6 | ||||
| Beef | 14.2 | 32.4 | ||||||
| Cattle | 17.0 | 67.7 | ||||||
| Plantation | 11.9 | 22.8 | ||||||
| Corporate, Marketing & Trading | 30.9 | |||||||
| Total | $ | 138.6 | $ | 261.4 | ||||
| - 88 - |
History
Our company, which was formerly known as Volcanic Gold, Inc. and A Power Agro Agriculture Development, Inc., was incorporated on October 1, 1974 in the State of Nevada. We were engaged in the mining and exploration business but ceased our mining and exploring business on October 14, 2005. On August 24, 2007, we entered into a Merger and Acquisition Agreement with Capital Award Inc., a Belize corporation and its subsidiaries Capital Stage Inc. and Capital Hero Inc. Effective the same date, Capital Award completed a reverse merger transaction with us. We acquired all the outstanding common stock of Capital Award from Capital Adventure, a shareholder of Capital Award, for 32,000,000 shares of our common stock.
On August 24, 2007 we changed our name from Volcanic Gold, Inc. to A Power Agro Agriculture Development, Inc. On December 8, 2007, we changed our name to Sino Agro Food, Inc. Our principal executive office is located at Room 3801, 38th Floor, Block A, China Shine Plaza, No. 9 Lin He Xi Road, Tianhe District, Guangzhou City, Guangdong Province, PRC, 510610.
For two years, the Company operated in the dairy segment. We used to operate asold our dairy segment but sold itbusiness in December of 2009. We made the determination to do so because we believeddetermined that the dairy industry had poor fundamentals in that it was manipulated and controlled by a few value-added manufacturers who obtained a majority of their raw milk supplies from various regional dairy farmers of the country who received very little value yet were expected to deliver high quality milk. As a result, the small dairy farmers were essentially forced to use chemicals in their milk to bring up the milk’s protein level that eventually caused the down-fall of the industry.level. In our opinion, this state of affairs led to the downfall and collapse of the Chinese dairy industry in 2010. After the sale of our former dairy business, we decidedinstituted and began to implement our growthfive year plan to develop the vertically integrated business operations inconsisting of (i) cattle fattening and producingproduction of beef products and (ii) fishery for the cultivation of fish and prawn and related products, as is further described elsewhere in this prospectus.products.
Corporate Acquisitions
On September 5, 2007, we acquired two existing businesses in the People’s Republic of China or the PRC:(“PRC”):
(a) Tri-Way Industries Ltd., Hong Kong (“TRW”) (formerly known as “Tri-wayTri-way Industries Limited”)Limited), a company incorporated in Hong Kong; and
(b) Macau EIJI Co. Ltd., Macau (“MEIJI”) (formerly known as Macau Eiji Company Limited”)Limited), a company incorporated in Macau, and the owner of 75% equity interest in Enping City Juntang Town Hang Sing Tai Agriculture Co. Ltd. (“HST”), a PRC corporate Sino-ForeignSino Foreign joint venture. HST was dissolved in 2010.
On November 27, 2007, MEIJI and HST established a corporate Sino - Foreign joint venture, Jiangmen City Heng Sheng Tai Agriculture Development Co. Ltd, China (“JHST”) (formerly known as Jiang Men City Heng Sheng Tai Agriculture Development Co. Ltd.), a company incorporated in the PRC with MEIJI owning a 75% interest and HST owning a 25% interest. HST was dissolved in 2010.
In September 2009, we formed a 100% owned subsidiary in Macau, A Power Agriculture Development (Macau) Ltd., China (“APWAM”) (formerly known as “AA Power Agro Agriculture Development (Macau) Limited”)Limited). APWAM presently owns 45% of a corporate Sino-ForeignSino Foreign joint venture, Qinghai Sanjiang A Power Agriculture Co. Ltd. (“SJAP”). SJAP is engaged in the business of manufacturing bio-organic fertilizer, livestock feed and development of other agriculture projects in the County of Huangyuan, in the vicinity of the Xining City, Qinghai Province, PRC.
On February 28, 2011, TRW applied to form a corporate joint venture, Enping City A Power Prawn Culture Development Co. Ltd., China (“EBAPCD”) (formerly known as “EnpingEnping City Bi Tao A Power Fishery Development Co., Limited”)Limited), which is incorporated in the PRC. TRW initially owned a 25% equity interest in EBAPFD. On November 17, 2011, TRW formed Jiangmen City A Power Fishery Development Co. Ltd, China (“JFD”) (formerly known as “JiangJiang Men City A Power Fishery Development Co., Limited”)Limited) in which it acquired a 25% equity interest, while withdrawing its 25% equity interest in EBAPFD. As of December 31, 2011, we had invested $1,258,607 in JFD. JFD operates an indoor fish farm. On January 1, 2012, we acquired an additional 25% equity interest in JFD for total cash consideration of $1,662,365. On April 1, 2012, we acquired an additional 25% equity interest in JFD for the amount of $1,702,580. We presently own a 75% equity interest in JFD and control its board of directors. As of September 30, 2012, we had consolidated the assets and operations of JFD.
On April 15, 2011, MEIJI applied to form Enping City A Power Beef Cattle Farm (2)2 Co. Ltd., China (“EAPBCF2”EAPBCF”) (formerly known as “EnpingEnping City A Power Cattle Farm Co., Limited”)Limited), all of which we would indirectly own a 25% equity interest in as of November 17, 2011. On September 13, 2012 MEIJI formed Jiangmen City Hang Mei Cattle Farm Development Co. Ltd., Chinaa company incorporated in the PRC (“JHMC”) (formerly known as “JiangJiang Men City Hang Mei Cattle Farm Development Co., Limited”)Limited) in which it owns 75% equity interest with an investment of $3,636,326, while withdrawing its 25% equity interest in ECF. As of September 30, 2012, we had consolidated the assets and operations of JHMC.
TablesOur Business Model
The Company works together with joint venture partners to form operating companies, in which we acquire equity interest. After a certain period of information: The tables below show:
TABLE 1: CORPORATE STRUCTURE
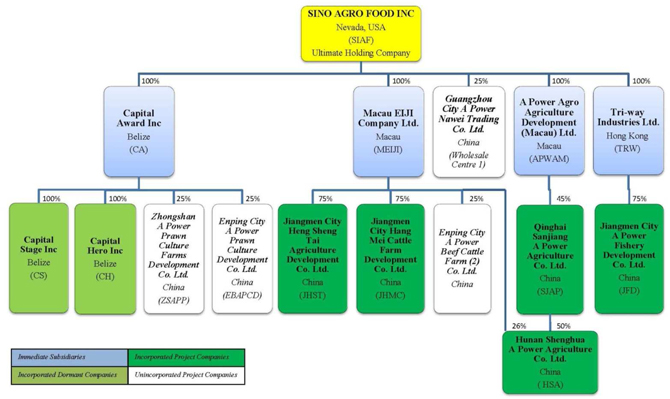
| - |
TABLE 2: ABBREVIATION OF THE NAMES OF THE COMPANIESIncorporated companies are joint ventures managed at a local operations level by joint venture partners, and overseen by SIAF.
| Abbreviation | Names of entities | Date of formation | |||||
| Incorporated Companies | |||||||
| 1 | SIAF | Sino Agro Food, Inc. | 1974 | ||||
| 2 | CA | Capital Award Inc. | 2003 | ||||
| 3 | MEIJI | Macau EIJI Company Ltd. | 2005 | ||||
| 4 | APWAM | A Power Agro Agriculture Development (Macau) Ltd. | 2007 | ||||
| 5 | TRW | Tri-way Industries Ltd. (Hong Kong) | 2009 | ||||
| 6 | CS | Capital Stage Inc. | 2003 | ||||
| 7 | CH | Capital Hero Inc. | 2003 | ||||
| 8 | JHST or HU Plantation | Jiangmen City Heng Sheng Tai Agriculture Development Co. Ltd. | 2009 | ||||
| 9 | JHMC or Cattle Farm 1 | Jiangman City Hang Mei Cattle Farm Development Co. Ltd. | 2012 | ||||
| 10 | SJAP | Qinghai Sanjiang A Power Agriculture Co. Ltd. | 2009 | ||||
| 11 | JFD or Fish Farm 1 | Jiangmen City A Power Fishery Development Co. Ltd. | 2011 | ||||
| 12 | HSA | Hunan Shenghua A Power Agriculture Co. Ltd. | 2011 | ||||
| Unincorporated Project Companies | |||||||
| 13 | Wholesale Center 1 or APNW | Guangzhou City A Power Nawei Trading Co. Ltd. China | 2012 | ||||
| 14 | ZSAPP or Prawn Farm 2 | Zhongshan A Power Prawn Culture Farms Development Co. Ltd. China | 2012 | ||||
| 15 | EBAPCD or Prawn Farm 1 | Enping City A Power Prawn Culture Development Co. Ltd. China | 2011 | ||||
| 16 | Cattle Farm 2 | Enping City A Power Beef Cattle Farm 2 Co. Ltd. China | 2011 |
The Company embarked upon a five-year phased growth plan in January, 2010. This plan targeted accruing net assets of approximately $500 million by the end of February, 2015. As of December 31, 2013, our net tangible book value stood at $318,790,976. Nearly all of these assets have come from, and are anticipated to come from, internally generated income and grants.
We believe that income from operations will fulfill our targeted net assets. Expansion of existing joint venture operations, as well as increases in equity stakes in SJVC’s that will be incorporated progressively through the end of 2014, are expected to add to net assets. As has been our history, the quarterly increase in net assets is itself expected to grow each quarter in 2014; however, there is no guarantee that this will be achieved.
Background
After successfully developing many aquaculture fishery farms, cattle farms and related business operations (along with sales and marketing of produce and products) in Australia and Malaysia since 1998, SIAF’s management team introduced our business activities in China in 2006. We are an engineering and consulting company that specializes in building and operating agriculture and aquaculture farms.
To accomplish this, we use our expertise and know how in specific agriculture and aquaculture technologies. Our “A Power Re-circulating Aquaculture System,” sometimes referred to herein as APRAS, is a patented and proven technology for indoor fish farming. We have developed modern techniques and technologies to grow, feed and house both fish and cattle. These are engineered into the designs of, and the management systems for, indoor and outdoor fishery and cattle farms. Our experience managing crops, and employing technologies, including hydroponic, to work within climate and growing conditions optimizes production of organic, green and natural agricultural produce.
In all of our developments we have acted as the master engineer, pioneering the construction and building of farms, from raw land into fully operational facilities. We complete the construction and building of infrastructure including staff quarters, offices, processing facilities, storage, and all related production facilities. Our management teams are responsible for developing all business activities into effective and efficient operations.
In just a few years, SIAF has matured into a company dedicated to the agriculture and aquaculture industry in China. We currently maintain operation of our HU Plantation as well as our services in engineering consulting, specializing in the development of two major products, namely meat derived from the rearing of beef cattle and seafood derived from the growth of fish, prawns, eel and other marine species.
Revenues are generated from activities that we divide into five stand-alone business divisions or units: (1) Fishery, (2) Cattle & Beef, (3) Organic Fertilizer, (4) HU Plantation, and (5) Marketing and Trading. This fifth and newest division, “Marketing and Trading” represents our strongest push to vertically integrate the Company’s operations, furthering the Company’s overall “farm to plate” concept.
Four major customers for the Marketing and Trading unit accounted for 51.49% of consolidated revenues during the fiscal year ended December 31, 2013. Two of those customers accounted for 33.11% of consolidated revenues, approximately evenly split.
Our largest customer represents a group of thirty separate live seafood wholesalers at the Guangzhou wholesale markets. Our second largest customer is WSC1, which is owned and operated by Guangzhou City A Power NaWei Trading Co. Ltd. (“APNW”). Capital Award was the consulting engineer responsible for the construction of WSC1 and development of its business operation via a Consulting and Service Contract granted by APNW. APNW is now one of our main wholesalers to whom we bill our sales of seafood. APNW then distributes the seafood to other wholesalers in various cities in China.
The Company holds patents and licenses for fertilizer formulas and for indoor fish farm techniques. We hold a “master license” in China for “A Power Technology” (“APT”), a modular on-land fish growing system and technology based on a re-circulating aquaculture system (“RAS”).
The Company’s SIAF Division (also called “Corporate and Other” or “Marketing and Trading”), plus our wholly owned subsidiaries Capital Award Inc. (“CA”), Macau EIJI Company Ltd. (“MEIJI”), and Tri-way Industries Ltd. (“TRW”) generate revenues from two main activities: “Engineering and Consulting Services” and “Marketing and Sales of Food Products.” Engineering and Technology Services are awarded via Consulting and Service Contracts (“CSC’s”) for the development, construction, supply of plants and equipment, and management of farms and related business operations (including fish, prawn, cattle, and plantation).
| - 90 - |
General standard principal terms and conditions for Farm Development Consulting and Service Contracts are outlined below:
| · | The Contracting parties: SIAF subsidiary is the consulting and service provider (turnkey contractor). The China businessmen and investor group is the Developer of the Project. | |
| · | Development schedules for the project. | |
| · | Responsibilities and obligations of the parties: SIAF subsidiary is to build the project (including development of its business operation) using our technology, systems, know-how, and management expertise and systems for and on behalf of the Developer such that the Developer is responsible to pay SIAF subsidiary for its work (including sub-contractors and suppliers appointed by SIAF) in a timely manner (normally a 60 days term). | |
| · | Provisions allow SIAF subsidiary to select and appoint sub-contractors and suppliers. | |
| · | Extra work and additional work and extra cost provisions. | |
| · | Warranty and limitation of liabilities. | |
| · | Scope of work and lists of supplies (including all plant and equipment). | |
| · | Installation, training and commissioning of the developments and business operation. | |
| · | Granting to SIAF subsidiary the right of management of operation, and marketing and sales of the produce and products from the farm’s operation. |
These SIAF subsidiaries generally have exclusive marketing, sales and distribution rights to each subsidiary’s respective proprietary technologies, patents, licenses, and intellectual property relating to their subject matter expertise (e.g., cattle, aquaculture, plantation farming). For example, CA purchases all marketable fish and prawns from the farms and in turn sells them to wholesale markets. CA also supplies the farms with fingerling, baby or adult fish or prawns and stock feed. MEIJI operates similarly with the cattle that are grown by JHMC.
Land Ownership in China
In China, nearly all land is owned by the Central Government or local Village Collectives, which grant “usufructuary” rights (i.e., the right to use and enjoy the derived benefits for a period of time) in the form of Land Use Rights (LUR). This is akin to “leasehold” land rights in the United States. Corporate entities and individuals may own the property (buildings) erected on Government land.
Land Use Rights may be transferred, but they are based on agricultural contracts, and cannot be changed arbitrarily to non-agricultural purposes.
OTC BB: SIAF
Sino Agro Food, Inc. became a fully reporting company in 2011, with the effectiveness of its Form 10, which led directly to its current Over the Counter Bulletin Board (OTC BB) quotation.
Business Overview and Introduction
We introduced our business activities in China in 2006 as an engineering consulting company that specializes in building agriculture and aquaculture farms and the development of related business operations. We use our expertise and know-how in specific agriculture and aquaculture technologies, including:
| · | Our A Power Re-circulating Aquaculture System and related technology | |
| · | Our cattle growing, feeding and caring technology | |
| · | Design engineering, construction, project management, business operations and information systems for indoor and outdoor fishery and cattle farms and hydroponic vegetable farms, adaptable to various climate and growing conditions | |
| · | Producing organic, green and natural agriculture produce | |
| · | Ongoing operational management, including sales and marketing, for aquaculture fishery farms, cattle farms, produce farms, and products. We performed all these business functions successfully in Australia and Malaysia since 1998. |
In all of our developments, we were and continue to be the master engineer pioneering the construction and building of farms from raw land into fully operational facilities. This covers the construction and building of infrastructure including:
| · | staff quarters | |
| · | Offices | |
| · | processing facilities | |
| · | all production facilities | |
| · | Storage | |
| · | infrastructure, including roads |
In each development, we provide the related management teams responsible for leading all business activities into effective and efficient operations.
| - 91 - |
In the past few years, our company has matured into a company dedicated to the agriculture and aquaculture industry. We have made early inroads to all levels of business in our supply chain. Our revenues are mainly derived from seafood and beef, along with fertilizer, livestock, the HU Plantation, and our services in engineering consulting. We divide our business activities into five standalone business divisions or units: (1) Fishery, (2) Cattle & Beef, (3) Organic Fertilizer, (4) HU Plantation and (5) Marketing and Trading.
| - 92 - |
Our LawZi Prawns

CHARTS AND TABLES
The following exhibits provide overview information about our Company:
(1) Exhibit 1 contains two organization charts. Chart 1(a) reflects our Group Corporate Structure as at December 31, 2013. Chart 1(b) indicates the prospective structure of our “Unincorporated Project Companies.” These are future SJVC’s that are not yet officially formed, but are operational. The Company paid deposits (for a percentage of equity) as consideration toward their respective acquisitions pending formation of corresponding SJVC’s. Official formations are scheduled in 2014 and 2015.
(2) Exhibit 2 is a table that indicates the abbreviations of the names of our companies.
(3) Exhibit 3 is a map that shows the location of the Company’s businesses in China.
(4) Exhibit 4 is a table that defines the activities of the Company’s business units.
| - 93 - |
Exhibit 1, Chart 1(a) represents our group organization structure:

| - 94 - |
Exhibit 1, Chart 1(b) shows how our unincorporated companies fit into our corporate structure:

| Notes: | 1. The “Unincorporated Project Companies” are private companies formed in China with Chinese citizens acting as their legal representative as required by Chinese law. These companies’ names will be changed in accordance with the names granted by relevant authorities once their corresponding Sino Foreign Joint Venture companies (SJVC) have officially been formed. |
| 2. The % shown above represents the payments toward their respective purchases in equivalent to the equity % of the respective SJVCs pending the official approval for the formation thereof. |
Exhibit 2: Abbreviated Names of the Entities
Incorporated Companies
| # | Abbreviation | Names of Entity | Date Formed | ||
| 1 | SIAF | Sino Agro Food, Inc. | 1974 | ||
| 2 | CA | Capital Award Inc. | 2003 | ||
| 3 | MEIJI | Macau EIJI Company Ltd. | 2005 | ||
| 4 | APWAM | A Power Agro Agriculture Development (Macau) Ltd. | 2007 | ||
| 5 | TRW | Tri-way Industries Ltd. (Hong Kong) | 2009 | ||
| 6 | CS | Capital Stage Inc. | 2003 |
| - 95 - |
| 7 | CH | Capital Hero Inc. | 2003 | ||
| 8 | JHST or HU Plantation | Jiangmen City Heng Sheng Tai Agriculture Development Co. Ltd. | 2009 | ||
| 9 | JHMC or Cattle Farm 1 | Jiangmen City Hang Mei Cattle Farm Development Co. Ltd. | 2012 | ||
| 10 | SJAP | Qinghai Sanjiang A Power Agriculture Co. Ltd. | 2009 | ||
| 11 | JFD or Fish Farm 1 | Jiangmen City A Power Fishery Development Co. Ltd. | 2011 | ||
| 12 | HSA | Hunan Shenghua A Power Agriculture Co. Ltd. | 2011 | ||
| 13 | SIAFS | Sino Agro Food Sweden Aktiebolag | 2013 |
Unincorporated Project Companies
| # | Abbreviation | Names of Entity | Date Formed | ||
| 14 | APNW or Wholesale Center 1 | Guangzhou City A Power NaWei Trading Co. Ltd. China | 2012 | ||
| 15 | ZSAPP or Prawn Farm 2 | Zhongshan A Power Prawn Culture Farms Development Co. Ltd. China | 2012 | ||
| 16 | EBAPCD or Prawn Farm 1 | Enping City A Power Prawn Culture Development Co. Ltd. China | 2011 | ||
| 17 | EAPBCF or Cattle Farm 2 | Enping City A Power Beef Cattle Farm 2 Co. Ltd. China | 2011 | ||
| 18 | Fish & Eel Farm 2 | XinHui City Gao A Power Aquaculture Fishery Development Co. Ltd. | 2011 |
All “Unincorporated Project Companies” are private companies formed in China with Chinese citizens acting as their legal representatives as required by company law of China.Chinese law. These companies’ names will be changed in accordance with the names granted by the relevant authorities once their corresponding Sino Foreign Joint Venture company willSJVC have officially have been formed.
TABLE 3: LOCATION MAP OF GROUP’S BUSINESS
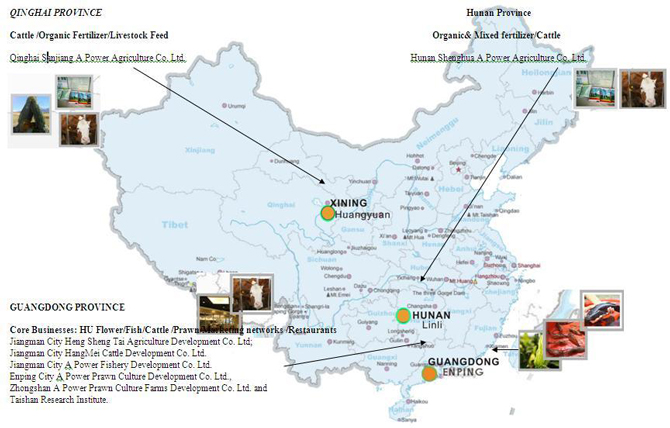
| - |
TABLE
Exhibit 3: Map of the Company’s Entities in China

Exhibit 4: BUSINESS ACTIVITIES OF THE GROUP’S COMPANIES
Business Activities of the Company’s Entities
| Business | ||
| SIAF | Engineering consulting (in general types of developments), business management, trading, sales and marketing | |
| CA | Engineering consulting (mainly in development of fishery), management of fishery | |
| MEIJI | Engineering consulting (mainly in cattle farming and vegetable farming), management service and marketing and sales of cattle and related products. | |
| APWAM | Holding Company | |
| TRW | Holding Company and | |
| CS | Dormant | |
| CH | Dormant |
| JHST or | ||
| JHMC or Cattle Farm 1 | A demonstration farm for growing cattle in a |
| - 97 - |
| SJAP | Existing activities: Manufacturing of organic fertilizer, bulk and concentrated livestock feed, and rearing of cattle and
Slaughter and Expected added activities by 2014: Manufacturing of Enzyme Electricity generation via | |
| JFD or | Growing of fish (sleepy cod species), eels (Flower Pattern species) and | |
| HSA | Existing Activities Manufacturing of organic fertilizer, 100% pure organic mixed fertilizer and lake fish farming organic fertilizer. Expected 2014: Cattle farming | |
| SIAFS | Various support and service to parent company, asset management, finance, consulting and provision of services in agriculture and aquaculture, marketing and sale of agricultural products, consultancy for business development in China, and related business. |
Business Activities of the Unincorporated Project Companies
| Abbreviation | Business Activities | |
| Wholesale Center 1 or WC1 | Marketing, sales and distribution of seafood and meats and related products. | |
| ZSAPP or | Hatchery and Nursery operation of prawns, Growing of prawns | |
| EBAPCD or | ||
| EAPBCF or Cattle Farm | By year | |
| Fish & Eel Farm 2 | Growing fish, eels and prawns. Production to start in 2014, although construction is on-going. |
Notes:
“Unincorporated Project Companies” are private companies formed in China with Chinese citizens acting as their legal representatives as required by Chinese law. These companies’ names will be changed in accordance with the names granted by relevant authorities once their corresponding SJVC’s are formed officially. As of the date of this prospectus, we do not own any equity stake in any of these Unincorporated Project Companies. However, it means that we have paid certain pre-payments as deposits toward part of the consideration required for the purchase of respective future SJVC, and the corresponding payments made are equal to the % of equity stakes being paid for in the future SJVC.
Our operations and assets in the PRC may be subject to significant political and economic uncertainties. Government policies are subject to rapid change; the government of the PRC may adopt policies that have the effect of hindering private economic activity and greater economic decentralization. All of the Company’s land use rights are related to allocated land. The local government authorities have granted such land use rights to us for free, or at a discounted levy rate given our contribution to the development of the local economy. Discounted rates could change. Because Chinese law governs almost all of our material agreements, we cannot assure you that we will be able to enforce our legal rights within China or elsewhere. Chinese law governs almost all of our material agreements. We cannot assure you that we will be able to enforce any of our material agreements or that remedies will be available outside of China. The system of laws and the enforcement of existing laws in China may not be as certain in implementation and interpretation as in the United States. It could be difficult to acquire jurisdiction and enforce liabilities against our officers, directors and assets based in China. Substantially all of our assets will be located in the PRC and all of our officers and all but one of our directors reside outside of the United States. As a result, it may not be possible for United States investors to enforce their legal rights.
Note on Our Usage of “Prawns” and “Prawn Fingerlings”
Prawns: In this prospectus, we use “prawns” to represent any prawns or shrimp of all species and sizes.
Prawn Fingerlings (or prawn fries ): In this prospectus, we refer to “prawn fingerlings” of all species including our Mexican White Shrimp (baby shrimp that are 7 to 10 days old after hatching) and our LawZi River Prawns (baby prawns that are 21 to 28 days old after hatching).
| - |
TABLE 5: SUMMARY OF BUSINESS AND OPERATION MODELS AND TECHNOLOGIESDates
Our fiscal quarters are aligned to the calendar year, so that in this prospectus we often refer to dates in a quarterly format (i.e., Q1, Q2, Q3 and Q4) along with the year. Q1 represents January through March, Q2 means April through June, Q3 refers to July through September, and Q4 means October through December.
Summary of Our Sino Foreign Joint Venture Companies (SJVC)(“SJVC’s”)
There are two methods that we use to obtain our SJVC’s in China;
Examples: SJAP, JHST and HAS.HSA
| The |
Examples: JHMC and JFD.
This method is typically used in connection with projects that we built and developed for our Chinese investors such that thethese Joint Venture Agreements bear standard terms and conditions in other words wherewhich the investors agree:
Our Employeesagree to certain terms which are described in greater detail under the heading “Our Sino Foreign Joint Venture Companies” below.
The followingOUR EMPLOYEES
This table describeslists the number of our employees by job classification and for which divisions they workbusiness division, as of August 31, 2013:the date of this prospectus:
| Abbreviation | Management | Skilled | Non-skilled | Casual | Total | |||||||||||||||||||||||||||||||||||
| SIAF, including CA, MEIJI, APWAM, TRW, CS and CH | 12 | 15 | 3 | 0 | 30 | |||||||||||||||||||||||||||||||||||
| Abbreviations of Business Divisions | Managers | Skilled | Unskilled | Casual | Total | |||||||||||||||||||||||||||||||||||
| SIAF, including CA, MEIJI, APWAM, TRW, CS, CH | 12 | 15 | 3 | 0 | 30 | |||||||||||||||||||||||||||||||||||
| JHST | 5 | 18 | 43 | 128 | 194 | 5 | 18 | 83 | 100 | 206 | ||||||||||||||||||||||||||||||
| JHMC | 2 | 2 | 13 | 16 | 33 | 2 | 2 | 12 | 16 | 32 | ||||||||||||||||||||||||||||||
| SJAP | 16 | 26 | 65 | 150 | 257 | 16 | 26 | 60 | 150 | 252 | ||||||||||||||||||||||||||||||
| JFD | 2 | 6 | 6 | 0 | 14 | 2 | 6 | 6 | 0 | 14 | ||||||||||||||||||||||||||||||
| HSA | 5 | 5 | 12 | 0 | 22 | 5 | 5 | 12 | 6 | 28 | ||||||||||||||||||||||||||||||
| Total | 42 | 72 | 142 | 294 | 550 | 42 | 72 | 176 | 266 | 556 | ||||||||||||||||||||||||||||||
Cooperative Farming ModelCOOPERATIVE FARMERS
Our Cooperative Farming Model provides us with an intermediary supply pipeline so we can ramp up our production at lower marginal cost to our operations, albeit on favorable trade terms from us.
Our strategy is to identify agriculture projects with strong growth potential linked to sales demand where small farmers lack commercial scale and expertise, and where they benefit with our strategic alliance approach so that we haveapproach. This provides a win-winmutually beneficial outcome for local small farmers who cooperate with us as an intermediary to produce the goods to supply our farms. We believe that this model ensures that we have a supply pipeline so we can ramp up production at lower margin cost to our operations albeit on favorable trade terms from us. We thenalso work with the local governmentgovernments, and with their help we introduce and initiate Farmers Cooperatives, such as in Huangyuan County, Xining City. This concept of strategic alliance with smallholdersmall hold farmers under a Cooperative Farming Model was originatedis based on the following key characteristics and value enhancers:
1. Once we have completed our assessment of the ability of the regional farmers to grow crops and pastures for us as our nominated contractors using our land that was leased to us free of rent by the local government or using the farmer’s own land, and using our plants and equipment for their planting and harvesting, we provide the farmers with supervision and associated services, seeds and organic fertilizer on credit terms offset by the crops and pastures that we purchase from them.
2. We also use this regional farmers’ concept when we are growing cattle as these farmers are our contractors using our bulk livestock feed on credit terms that will be offset by the amount of mature cattle that we buy from them.
| - |
3. The ultimate aim of this arrangement is to obtain cattle that will be qualified as “organically reared cattle” such that we shall be able to produce “Organic beef products” on a commercial scale basis.
| 1. | Once we have completed our assessment of the ability of the regional farmers to grow crops and pastures for us as our nominated contractors using our land that was leased to us free of rent by the local government or using the farmer’s own land, and using our plants and equipment for their planting and harvesting, we provide the farmers with supervision and associated services, seeds and organic fertilizer on credit terms offset by the crops and pastures that we purchase from them. | |
| 2. | We also use this regional farmers’ concept when we are growing cattle as these farmers are our contractors using our bulk livestock feed on credit terms that will be offset by the amount of mature cattle that we buy from them. | |
| 3. | The ultimate aim of this arrangement is to obtain cattle that will be qualified as “organically reared cattle” such that we shall be able to produce “organic beef products” on a commercial scale basis. |
The Organic Chain: (Organic Beef Product and Supply Chain)
| · | SIAF’s agricultural waste is prepared by SIAF into bio-organic fertilizer. Also the livestock feed is prepared into bio-organic livestock feed. | ||
| · | The bio-organic fertilizer and the bio-organic livestock feed are sold to farmers that work on SIAF’s land-use rights (which are owned by the government) at a discounted price. The fertilizer and the livestock feed are also prepared based on our enzyme technologies. The use of the enzyme is synergistic as the production of fertilizer and livestock feed is permissible during 12 months of the year, providing competitive advantage. | ||
| · | The farmers use the bio-organic fertilizer on the soil where they plant grain, and feed the grain to the cows together with the livestock feed. Tests made by the government that owns the land shows the following results from use of the bio-organic fertilizer: | ||
| · | Additional average weight gain per head of fattening cattle; | ||
| · | Additional fresh milk produced; | ||
| · | All feeds are much easier to digest resulting in a much cleaner environment in the cattle yards and houses; | ||
| · | No sickness during the period was recorded through the cause of consumption of our feeds; and | ||
| · | All cattle preferred to eat our feed and were reluctant to revert back to the consumption of their old feed after they had consumed our feed during the period. | ||
| · | SIAF acquires the young cattle from the regional farmers when they are about 6 months old. Due to the discounted price of the bio-organic fertilizer, SIAF acquires the young cattle to a discounted price from the farmers for a win-win outcome. The young cattle are fed with SIAF’s organic livestock feed (our “Stock Feed Manufacturing Technology”). | ||
Recent Case studies :
Studies
Our records show that farmers’ averagedaverage annual incomes increased from RMB 480/480 per Mu (about 660 square meters)/per year to RMB 2,100/Mu/2,100 per Mu per year by planting crops and pasture for us applying our fertilizer with harvesting being done by our teams of harvesting workers using our machineriesmachinery and equipment.equipment (1 Mu is about 660 square meters).
Farmers who grow cattle using our livestock feed, and then sold their cattle to us hashave quadrupled their annual incomes increased by 4 times becauseincomes. Previously, it used to taketook them 4four years to grow and fatten a head of cattle to about 600 kg of body weight, but now it takes them less than 12 months to fatten a head of cattle to a body weight of no less than 700 Kg. There is no guarantee that local farmers using our products, methods and services will experience similar gains in the future.
Our TechnologiesOUR TECHNOLOGIES
A Power Re-circulating Aquaculture System and Technology
(APRAS)
We built our fishery (both for growing ofbuild fish or shrimp) farms (where we raise fish, prawns, and eels) using our A Power Re-circulating Aquaculture System and Technology, (“APRAS”),or APRAS, now in its 10th version, to operate our sizeable commercial farming facilities. The A Power Technology and SystemAPRAS is “an engineered, self-contained water treatment and re-circulating aquaculture system, (“RAS”)or RAS, for the growth ofgrowing aquatic animals on a commercial scale”, whereas in thescale.” In a given farm all fish grow-out tanks are in modules that can be custom built in various sizes to adapt tosupport the farm’s growing capacity of the farm. Thiscapacity. RAS technology ishas been proven having been used in Europe and Australia for over 30thirty years. The Company attributes the following benefits to the system: improved productivity, lower labor requirements, mortality rates of less than 8% and feed-to-fish conversion ratios of 1:1 for pallet feed and 2:1 for non-pallet feed.
| · | Improved productivity | |
| · | Lower labor requirements | |
| · | Mortality rates of less than 8%, and | |
| · | Feed-to-fish conversion ratios of 1:1 for pellet feed and 2:1 for non-pellet feed |
The indoor system is fully controlled, tank water treated through micro-bio bacterial compartments to digest soluble wastes, solid waste separators remove the insoluble wastes, controlled:
| · | Tank water is treated through micro-bio bacterial compartments to digest soluble wastes | |
| · | Solid waste separators remove the insoluble wastes | |
| · | UV and O3 chambers clean | |
| · | Optimal oxygen levels are maintained by in-built aerators |
| - 100 - |
Water temperature is maintained by in-built aerators with water temperature controlled by heat exchangers, which is then recycledrecycle water at thea rate between 60 times to 120 times per hour adjustableadjusted according to the motion requirement of the growing species of fish with waterfish. Water temperature beingis maintained atwithin suitable ranges to suit theeach species of fish. Importantly, thisour system does not require chemicals or antibiotics, and is pollution free. All tanks in the farm are built with concrete and all buildings are made of steel with concrete walls that we anticipate will last for tens of years. Also all plant and equipment and components are replaceable, after their life expectancy of 25 years. Given the high incidence of pollution in aquaculture and the existing outdated open dam aquaculture methods used in China, we believe that our technology gives us distinct advantages both in the sales of fishesprawns, fish, and prawnseels, and for our consulting and service business to develop more farms in China.
At the same time we believe that land prices are rising rapidly in China and our RAS has the ability to maximizeChina. Our APRAS maximizes the utilization of land, because our technology can produceproduces a greater quantity of aquatic species per surface area compared to theChina’s existing, aging open-dam or caging aquaculture systems and technologies (which are rather old systems) used in China; fortechnologies. For instance, a standard APAPRAS Modular tank has a surface area of 100 m2 and the capacity to produce over 40 MT of prawns (or shrimp) per year, whereas the old systems’systems produce an average of production is at 6 Mt/Mt per 660 m2 (or Mu) per year; inyear. In other word,words, we can produce annually 1,600 MT of prawns (or shrimp) per acre of land, whereas the old systems are producingproduce 36 MT of prawns (or shrimp) per acre per year whichyear. This gives us a considerable advantage. Now that we have established a few commercial APRAS farms in China and proven their commercial viability, we believe that in theory and conceptually the Company has the potential to venture into developing aquaculture projects with annual productivity over hundreds of thousandthousands of metric tons in the foreseeable future. However, there can be no assurance that our annual productivity will not be too far away.in fact reach hundreds of thousands of metric tons.
Our Aromatic Feed formulaFormula and Feeding Systems
We feed our cattle with a portion of our aromatic feed (which is a feed mix consisting of various Chinese herbs to improve the health of the cattle) at a ratio in accordance with their needs during each growing stages of the cattle while they are being grown in the farm. The end results are that our cattle have better growth rate and are healthy animals with tender meats that have an aromatic favor.
Our Enzyme Technologies (“
(Bacterial and Bio-organic Manufacturing Technology).
We haveown two Enzyme Technologies,Technologies. The one thatknown as T2 was invented by SJAP and is being used for the manufacture of organic fertilizer and bulk livestock feed by SJAP at Qinghai, Xining’s operation (T2) and another one that we broughtoperation. We bought the other, known as T1, from a third party, that is being usedand use it in our Cattle Farm 1’s operation to produce livestock feed (T1)T1, and at HSA to produce 100% pure organic mixed fertilizer. We have the exclusive rights to both Enzyme Technologies. T2 has not been patented, but T1 is a patented intellectual property (see Exhibit 10.1 for further information).
There are fundamental differences between T1 and T2 as shown in Tablethe table below:
| Fundamentals | T1 (Page 65) | T2 (Page 40) | T1 | T2 | ||||
| Required temperature for fermentation | 15 degree C | 4 degree C | 15 degrees C | 4 degrees C | ||||
| Days required to complete fermentation processes | 21 days | 7 days | ||||||
| Time required to complete fermentation processes | 21 days | 7 days | ||||||
| Temperature variation for storages | Up to -10 degree C | Up to -30 degree C | Up to -10 degrees C | Up to -30 degrees C | ||||
| Shelve-life | One year | Two years or more | ||||||
| Shelf Life | One year | Two years or more | ||||||
| Protein % increases after fermentation | 3% | 6% | 3% | 6% | ||||
T2 is more practical and suitable to apply atin colder climate regions, such as at SJAP’s operation at Qinghai, Xining, which typically has 6 months of winterwith six month winters at average temperature of -20 degreedegrees C and below whereasbelow. T1 is more suitablebetter suited to regions where the climate iswith milder climates, such as at JHMC (Cattle Farm 1) and HSA where therewarm to hot weather is typical for ten months each year, and winters are typically 10 months of warm and hot climate with mild winters.mild.
An example showing the manufacturing processComposition of Bulk Livestock Feed:
Feed
Raw materials consisting of crop wastes, as well as locally grown and available wild wheat plus wild wheat sterns,stems, wild peas with sternsstems and leaves, and selective grown pastures grown, will be cut and rolled into bales with thebales. The T1 or T2 enzyme beingis added during the cutting and rolling process, then the bales are packed and sealed in airtight and weather proof packaging for storage in the open. The materials will go through a number of aging and fermentation processes generated by the enzyme such that the feed will be ready for consumption, as and when the farmers will require themit to feed their cattle or sheep.
Our Formulas used for the manufacture of Concentrated livestock feed:
Livestock Feed
We have 6apply six different formulas that we apply in our concentrated livestock feed manufacturing process, and these are formulas invented by ourprocess. Our joint venture partners, who wereformer professors at the University of Xining before they joined our operation at SJAP.SJAP, invented these formulas. All cattle’s daily dietary needsdiets include the consumption of both of the bulk and concentrated livestock feed that are tailor made to suit each stage of their growing cycles (e.g., milkingin order that optimal growth efficiency is achieved. For example, milk cows require a higher protein diet, while weaning calves need more calcium to grow body frames, and fattening cattle need higher energycalorie input to gain body weight) in order that optimal growth efficiency be achieved. The bulkweight. Bulk livestock feed provides the carbohydrates while theour concentrated livestock feed provides the protein, vitamins, trace elements and other necessary supplements that will be required by cattle at various stages of their growing cycles. Our formulas will enhance feed with specific concentrated raw materials (i.e., soya bean, corns, and seeds, etc.), such that no excessive raw materials will be wasted, and consumed thus producingall beneficial ingredients will be consumed. Thus, we produce healthy cattle with maximal efficiency. At the same time, thisour formulas will reduce excessive body fat of growing cattle.
| - 101 - |
In this respect
SJAP has doneconducted many tests to show that on average the fattened cattle hasaverage around 15 Kg of fat/fat per body weight ofper 800 Kg if they were not fed with our concentratedConcentrated Livestock feed, and theFeed. The fattened cattle fed with our concentrated livestock feed onConcentrated Livestock Feed average has only 6 Kg of fat/body weight offat per 800 kg, which means that saleablesalable net weight gain per cattle is 9 kg, because fats are not saleable.
Intellectual Property
As discussed in this section, the T1 Enzyme Technology (T1) is our patented intellectual property. Our other proprietary technologies and techniques, such as “A Power Re-circulating Aquaculture System and Technology,” our T2 Enzyme Technology, and six Concentrated Livestock Feed formulas are our trade secrets, but not patented intellectual properties.
COST AND EFFECTS OF COMPLIANCE WITH ENVIRONMENTAL LAWS
We believe that our environmental impact treatments are commercially cost effective based on recycling of waste described as follows:
| · | Using our APRAS systems, water is continually re-circulated in the grow-out tanks while being treated internally in the filtration chambers. Insoluble wastes are centrally collected and reapplied to our cropping fields as organic fertilizer, and all soluble wastes are consumed in our bacterial chambers to allow the recycling of cleared water. In this respect the Company is planning on building commercial hydroponic farms (growing vegetables and fruit in door using the fish farms’ organic fertilizer), adjacent to all of our APRAS farms. We believe this will yield economic efficiency. In this respect, our first hydroponic farm is built in conjunction with Prawn Farm 1’s expansion work, which is expected to add 6 more APM tanks to its existing operation and the hydroponic farm next to the said expansion. As of the date of this prospectus, this work has begun. |
| · | SJAP plans to continue building a marsh gas station during 2015 to generate electricity based on the source of energy generated from the fermentation processes of the cattle waste collected from its cattle farms and after the fermentation processes, the residue will be recycled as raw materials for the manufacturing of its organic fertilizer. For this project, the government has agreed to award SJAP a development grant of US$2 million to help initiate the marsh gas station. | |
| · | We believe the most cost effective way to take care of any environment impact associated with our businesses is to create commercial viabilities through recycling the waste. |
Thus far, our recycling programs built into the development designs of the each project are revenues that offset all related costs in environment treatments as operational cost (e.g., cattle wastes are recycling into raw material for our organic fertilizer manufacturing or channeled into our cropping field to grow pastures to feed back to our cattle, and all solid wastes from our fishery operations are being collected and applied as liquid fertilizer to grow our plants and in future to grow our hydroponic plants) and we don’t use harmful chemical in our fishery or cattle fattening production as such we do not believe that we have any material and adverse environmental impacts. Accordingly, to date we have clean bill of cost as far as environmental issues are concerned and they were not treated as cost of environmental impacts but as operational costs.
VERTICAL INTEGRATION
Food quality and safety is a paramount concern in China, among consumers and by the government. Our vertically integrated operations ensure that we control and deliver products with consistent quality, value, and healthful attributes throughout our supply chain. Vertical Integrationintegration also allows us to streamline our processes while we optimize costs.
Our five year business plan, which started in January 2010 and runs through December 2014, aims to complete the development of all the integrated activities listed below with a view to achieving our marketing plan concept of “From Farms to Plates.”
Vertical integration for our fishery developments : developments:
We intend to havedevelop the following activities developed to support one another:mutually supportive business activities:
l Research and development in the fishery technologies, growing techniques, management systems, species of aquatic animals that will be grown that will have commercial market niches, breeding stocks that will have the ability to produce and sustain supplies of fingerling (or baby stocks) in commercial scales, feed analysis and formulation, marketing and sales, logistics and transportation of live aquatic animals and other related general information of the industry (e.g., we have established relationships with a number of local professional sub-contractors and entities to carry out the referred duties for the Company).
| · | Research and development in the fishery technologies, growing techniques, management systems, species of aquatic animals that will be grown that will have commercial market niches, breeding stocks that will have the ability to produce and sustain supplies of fingerling (or baby stocks) in commercial scales, feed analysis and formulation, marketing and sales, logistics and transportation of live aquatic animals and other related general information of the industry (e.g., we have established relationships with a number of local professional sub-contractors and entities to carry out the referred duties for the Company). | |
| · | Hatchery and nursery farm. For example, we established Prawn Farm 2 to serve such purpose. | |
| · | Grow-out farms. For example, we established Fish Farm 1 and Prawn Farm 1 for the growth of aquatic animals. |
| - |
l Hatchery and nursery farm. For example, we established ZSAPP (or Prawn Farm 2) to service such purpose.
| · | Marketing and distribution networks: We have established Wholesale Center 1 and are developing a chain of restaurants as part of our ultimate distribution channels to sell our seafood. We envision a distribution network that consist of sales channels via secondary wholesalers, restaurant and hotel distributors, supermarket chain distributors, and commissioned sales agents. Some of these will compete directly with health shops and supermarket chains, establishments similar to Wholesale Center 1 and the chains of restaurants that we intend to develop for and on behalf of our Chinese joint venture investors. |
l Grown-out farms. For example, we established Fish FarmSome of the companies listed above (i.e., Prawn Farms 1 and Prawn Farm 1 for the growth of aquatic animals.
l Marketing and distribution networks, e.g., we2, Wholesale, Restaurants) are developing Wholesale Center 1 and chains of restaurants with the intention that they will eventually be used as part of our ultimate distribution channels to sell our aquatic seafood. Our vision of our distribution channels consists of sales channels via secondary wholesalers, restaurant and hotel distributors, super market chain distributors and commissioned sales agents. Some of these will be in direct competition to health shops and super market chains, establishments similar to Wholesale Center 1 and the chains of restaurantsunincorporated project companies that we do not currently own, but intend to develop for and on behalf ofacquire according to our Chinese joint venture investors.
Vertical integration for our organic beef and cattle business developments at SJAP : We intend to have following activities developed to support one another:
l Research and Development in the enzyme and feed technologies, growing techniques, management systems, breeding stocks, analysis and formulation, marketing and sales, logistic and transporting, and many aspect information of the industry(we have established this activity in house at SJAP).typical SJVC formula:
Normally and prior to the official formation of the SJVC’s we take an equity position in the company that is the developer of the project to secure our future acquisition of the SJVC’s. | ||
| · | The total consideration of the future purchase of any SJVC is based on its book value at the time of official formation having injected all of the related project’s development assets and liabilities into the SJVC. | |
| · | As such the required acquisition cost is generally funded partly by cash and partly by a receivable owing on the consulting and service fee. |
Vertical Integration in our Organic Beef and Cattle Business at SJAP
Currently, SJAP is developing the following mutually supportive activities:
| · | In-house Research and Development in enzyme and feed technologies, growing techniques, management systems, breeding stocks, analysis and formulation, marketing and sales, logistics and transport, and other aspect of SJAP’s industry. “Continuous Improvement” activities in all parts of the business. | |
| · | Manufacturing of organic fertilizer |
| Manufacturing of Bulk Livestock Feed |
| Manufacturing of Concentrated Livestock Feed |
| Cattle |
| Farming |
| Slaughtering, deboning and value added | ||
| ¨ | Marketing, sales and | |
| ¨ | Construction of |
| Development of |
Information on Marketing, salesSales and distribution, producesDistribution, Produce and products:Products
The Fishery Sector
The Chinese markets prefer, and pay premium prices for, Live Aquatic animals, and therelive aquatic animals. There are many live seafood wholesale markets with hundreds of wholesalers selling live seafood in many Provinces of China, supported by well-developed logistics services in road and air transports.transport. As such, we currently are sellingsell our aquatic seafood mainly to wholesalers that operate in the dominant wholesale markets at Shanghai City, the Southern Coastal Cities, and the Guangzhou City which are the more dominant markets.City.
Some of the fish farms that we report on in this section, notably Prawn Farms 1 and 2 and Fish Farm 2, are unincorporated project companies that we do not currently own, but intend to acquire, as outlined under theVertical Integration section, and elsewhere in this prospectus. Prawn Farms 1 and 2 and Fish Farm 2 are contracted to Capital Award for its construction and operational management.
| - |
TheFish Farm 1:
Fish Farm 1 produces eel, prawns, and fish. Initially, we grew a high value fish known as Sleepy Cod, a tropical species growing mainly in the Southern regions of Guangdong Province. Sleepy Cod, similar to the much-prized marble or sand goby, is an attractive breed for aquaculture purposes as it is a relatively small fish that grows well in our APRAS and provides white pieces of fillets with flaky flesh that we believe most Asians prefer. It is easy to ship, as it lies motionless in shipping bags, and stacks well in the live fish tanks used in Asian restaurants. Our APRAS system provides suitable environments to grow Sleepy Cod that allow the fish to grow in separated compartments inserted in the tanks to avoid harm to their skin, resulting in a more valuable unblemished appearance.
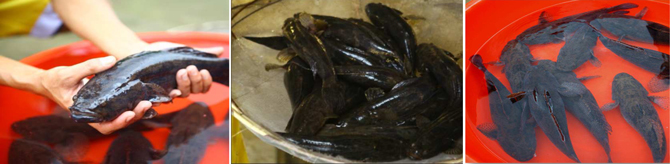
EelsPrawn Farm 1:
Stocking of prawn fingerling (baby prawns of 7 to 21 days old) began during Q1 2013 for growing into marketable sized prawns from count sizes of 90-100 pieces per Kg and larger. Larger prawns always demand higher premium prices. Prawn Farm 1 grows two varieties: the Mexican White Prawn, which is an imported breed grown in water containing approximately 0.5% of salinity and that has a rather sweet flavor and crispy texture that is liked by Chinese consumers; and a locally bred species that we call the “LawZi Prawn” (its direct English translation is “Big Giant Prawn”) which originated in Thailand but is now well developed in China. The LawZi Prawns are grown in fresh water and are in high demand in many gourmet kitchens, especially when they weigh over 50 grams per piece.
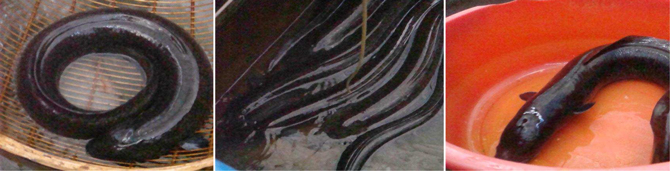
Originally Prawn Farm 2 was developed as a hatchery and nursery to produce prawn fingerlings for sale to regional prawn farmers. Through Q2 2013, the Company produced and sold mainly Mexican White Prawn fingerlings. During Q1 2013, we successfully bred our second generation of LawZi brood stock prawns crossed between the wild species and domestic species, and began to sell LawZi Prawn fingerlings in Q3 2013. At present, we are conducting trials to adapt our indoor growing environment for eels.
The Mexican White Prawns (or Shrimp)Cattle Sector
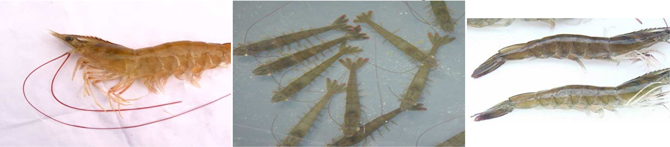
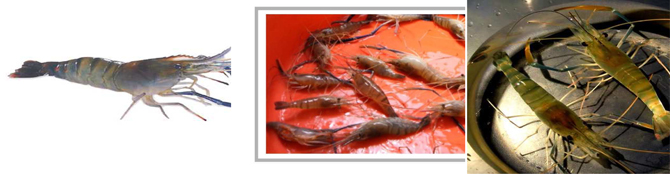 |
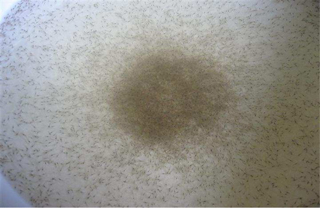 | 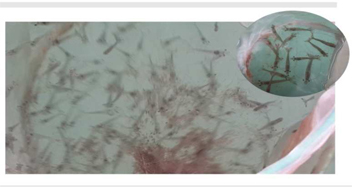 |
The Organic Fertilizer, Livestock Feed and Cattle growingFarming at SJAP:SJAP

Organic Fertilizer
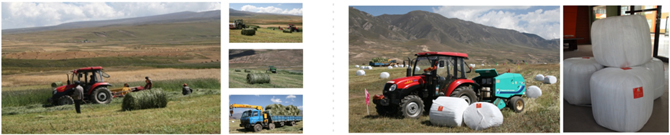
Bulk Livestock Feed
The Organic Fertilizers are sold mainly to our corporativecooperative farmers, who plant crops and pastures for us that we repurchase to process into Bulk Livestock Feed. Part of this Bulk Livestock feed will be used to grow cattle in our own cattle stationfarm and part will be sold to our corporativecooperative growers for growing cattle, with the remaining part being sold to other regional farmers.
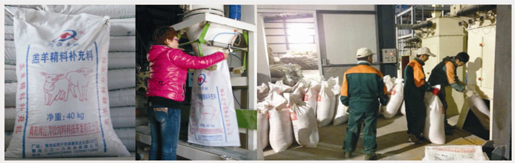
Concentrated Livestock Feed
The Concentrated Livestock Feed (“CLSF”) complements SJAP’s bulk livestock feed to provide the local cattle and sheep farming industry with a unique and completedcomplete feed formula that can catercaters to the growingnutritional requirements of cattle and sheep at various growinggrowth cycles (e.g., specially formulated mixes with efficient nutrients for dairy cows and sheep, weaning, fattening and mature cattle and sheep). The advantage of theour formulated feed combination is that the cattle and sheep growers will realize cost savings in production knowing precisely the amount of concentrated feed that will be needed by their livestock, thus avoiding excess concentrated feed being wasted on over feeding, resultingwhich results in worthless excess fat in mature animals. In this respect, theThe Chinese central government has placed an order with SJAP to reserve annually up to 5000 MT of CLSF as part of the country’s annual reservedreserve emergency livestock feed inventory. FromSince March 2013, onward, SJAP generateshas generated additional revenue generated from the sales of CLSF.
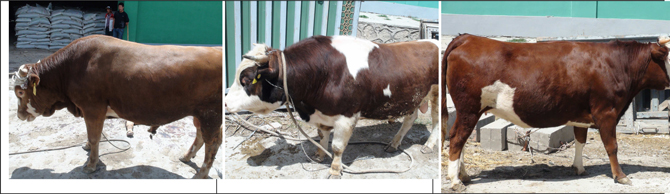
Simmental Cattle
The cattle we grow are primarily Simmental (a common breed introduced to China in the early 20th20th century), Charolais, and some Angus cattle. In general, we buy 6six to 8eight months old cattle when they have established their body frames, then they will be fattened either by us in our indoor cattle stations or by our corporativecooperative farmers at their own farms for a further 6 to 10 months until they will reach a body weight averaging 700/800 Kg/700-800 Kg per head and sell them as live cattle to the wholesale cattle buyers. It is because our cattle are well fed and healthy with better meat recovery rates such that we normally get premium prices that are calculated to about 10% above the daily market averages. We also earn between 10 to 12% from buying the cattle back from the corporativecooperative farmers and resold to the cattle wholesalers. Since January 2014, we slaughter our own cattle, and process the meat in our deboning and packaging facility.
| - |
SJAP is constructing a slaughter house, a de-boning factory and a value added processing factory that are targeted to be completed and in operation by early 2014. Until such time, there will be no processed or frozen meats marketed and sold. However SJAP is planning on developing its marketing and sales network beginning in the fourth quarter of 2013 based on following marketing plans:


Competitors
Sino Agro Food, Inc. is a primary producer. In China, millions of primary producers generate many billion metric tons of primary agricultural products each year using various methods and technology systems. Our production of a few thousand tons per year represents a tiny fraction of the supply chains competing internally among primary producers in a rather stable market circumstance, because China needs food. All primary producers are subject to market conditions, such as seasonal supply and demand, with higher quality products earning higher prices. We believe that our modern agriculture technologies and systems provide us opportunities and advantages to compete favorably against established farming methods and outdated technologies and systems used by the majority of primary producers in China.
Business Overview, Businesses and Progress reportsActivities of Existing or Newly Formed Subsidiaries
We introduced our business activity in China in 2006 as an engineering consulting company specializing in building agriculture and aquaculture farms and the developments of related business operation using our expertise and knowhow knowledge in specific agriculture and aquaculture technologies (i.e. our A Power Re-circulating aquaculture system and technology and our cattle growing feeding and caring technology), engineering designs of, and management systems for, indoor and on-land fishery and cattle farms and vegetable farms (based on hydroponic technologies) adaptable to various climate and growing conditions, production of organic, green and natural agriculture produces after having developed many aquaculture fishery farms and cattle farms and related business developments including sales and marketing of produces and products in Australia and Malaysia since 1998.
In 2007 we acquired our first Sino Foreign Joint Venture company in China operating a dairy farm that was sold to our joint venture partner in 2010 followed by the acquisition of JHST (or the HU Plantation) in 2009, the establishment of SJAP (our major cattle growing operation) in 2009 and started the building of our first fishery farm (JFD or Fish Farm 1) in 2010 and continuing until today when we conduct all the activities shown in Table 2 above.
In all these developments we were the master engineers and pioneered the construction and building of farms from bare land into fully operational facilities covering the construction and building of infrastructures, staff quarters, offices, processing facilities, storages, and all related production facilities and their related managements responsible in developing all business activities into effective and efficient operation including all training of personnel.
Our Company is now maturing into a company dedicated to the agriculture and aquaculture industry. We are currently operating the HU Plantation, maintaining our services in engineering consulting, and specializing in the developments of two major products, namely meat derived from the growing of beef cattle and seafood derived from the growing of fish, prawns (or shrimp) and other marine species having niche markets with revenues generating from activities that we divide into five standalone business divisions or units: (1) fishery, (2) cattle, (3) beef organic fertilizer, (4) HU Plantation and (5) Marketing and Trading.
We started our first 5 year business plan in 2010 aiming to develop the concept of “From Farm to Plate” that would be supported with the vertical integration and services defined above.
Below is a summary of our operational and/or developing stage business activities carried out by our existing or newly formed subsidiaries.
| 1. Fishery Division operated by Capital Award Inc. Our wholly owned subsidiary Capital Award, Inc. (“CA”) |
CA generates revenues from two main activities: “Engineering and Consulting Services” and “Marketing and Sales of Aquatic seafood” described below:
Seafood.” Engineering and Technology Services are awarded to CA via Consulting and Service Contracts (“CSC’s”) for the development, construction, suppliessupply of plants and equipment, and management of fishery (and prawn or shrimp)(including prawn) farms and related business operation.operations.
CA’s standard principal terms and conditions for Fishery Development Consulting and Service Contracts are outlined below:
| · | The Contracting parties: CA is the consulting and service provider (as the turnkey contractor), and the Chinese businessmen and investor group is the Developer of the Project. | |
| · | Development schedules for the project. | |
| · | Responsibilities and obligations of the parties: CA is to build the fishery project (including development of its business operation) using our APRAS technology, systems, know-how, and management expertise and systems for and on behalf of the Developer such that the Developer is responsible to pay CA for its work (inclusive all sub-contractors and suppliers appointed by CA) in a timely manner (normally a 60 days term). | |
| · | Provision clauses allow CA to appoint and to select sub-contractors and suppliers. | |
| · | Extra work and additional work and extra cost provisions. | |
| · | Warranty and limitation of liabilities. |
| - |
| · | Scope of work and lists of supplies (including all plant and equipment). |
| · | Installation, training and commissioning of the developments and business operation. | |
| · | Granting to CA of right of management of operation, and marketing and sales of the produce and products from the farm’s operation. |
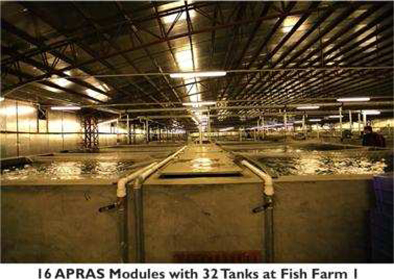
CA has entered into numerous CSC’s; theirseveral CSC’s. Their information and status are shown in the table below:
Notes to the developments in progress:
| Name of the | The Fish & | |||||||||||||
| Abbreviation of Company Name | ||||||||||||||
| Location | ||||||||||||||
| Enping City | Jiang Men | |||||||||||||
| Annual Capacity (as designed) | 1,200 MT | |||||||||||||
2015= 1600 MT 2016=2000MT | By 2015:3.2 billion Fingerlings and 1200 MT Prawns | |||||||||||||
| Land Area or Built Up Area | 9,900 m2 | 23,100 m2 | 165,000 m2 | 120,000 m2 | ||||||||||
| 2 phases and road work |
| Date Development Commenced | July 2010 | Phase 1: June 2011 Phase 2.1 + 2.2 Road Work: Aug 2012 | Phase 1: January 2012 Bridge & Road Oct. 2012 Phase 3: 2013 Phase 4: 2014 | Phases 1 and 2: May 2012 Phase 3 2014 | ||||
| (Estimated) Completion Date | June 2011 | Phase 1: Dec. 2012 Phase 2: Q1 2013 | Phase 1 June 2014 Bridge & Road Dec. 2013 Phase 3 & 4: 2015 | Phase 1 Dec. 2012 Phase 2 December 2013 Phase 3 Dec. 2014 | ||||
| Contractual Amount (in Millions of U.S. Dollars) | $5.3M | Phase 1: $11.6M Phase 2: $6.39M Road Work: $2.94M | Phase 1: $8.73M Bridge & Road $2.48M Phase 3 $4.38M Phase 4 $10.63M | Phase 1 $9.26M Phase 2 $8.42 M Phase 3 $11.5M | ||||
| % complete as at December 31, 2013 | Fully Operational | In operation Phase 2 is the expansion work begun in Q4 of 2013 | Phase 1 completed Bridge & Road completed Phase 3 43% and Phase 4 not started | Phase 1 fully operational Phase 2 in operation Phase 3 work started during Q4 of 2013 | ||||
Pictures showing Fish Farm 1
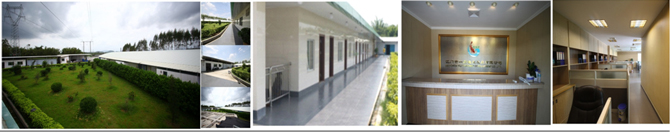
Views of the Fish Farm 1 complex situated on 9,900 m2 of land in district of Enping City. It is a fully self-contained complex showing as one of typical development models being developed in China.
| - |
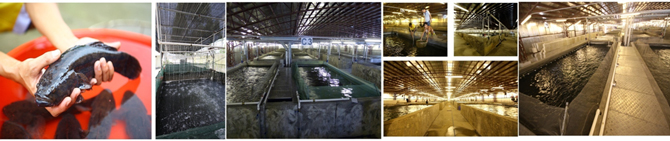
(a) The proposed company name for Prawn Farm 2, our future SJVC, is Zhongshan A Power Prawn Culture Development Co. Ltd. (“ZSAPP”). Prawn Farm 2 has generated income since May 2012. Phase 2 production of prawns began in August 2013. Production begins after construction phases complete. The work that was completed during Q2 2013 included the development of: (i) an additional indoor prawn nurturing apartment, (ii) three brood stock open dams with all under-ground in built filtration systems that capable of holding up to 3,000 mother prawns at a time, (iii) all external fences of the farm, and (iv) two open dams with all in built filtration systems that has 16 grow-out APM tanks growingthe capacity to grow out up to 12 MT of fish in-doorper year and onall associated infrastructure. There are 30 Mu (equivalent to 5 acres) of land that has been reserved for the construction of an indoor APRAS farm designed with the capacity to grow-out over 1,000grow up to 1,200 MT of fish/prawns per year at the complex. Its construction work was planned to start during Q1 2014 when most of the existing open dams’ work was to have been completed. However as of the date of this prospectus, works in the open dams are still in progress, such that the said APRAS indoor farm work will be delayed. The Company has prepaid $5,558,057 toward the consideration of its future SJVC toward the assets of the fully developed farm, equivalent to just under a 45% equity interest in ZSAPP, the future SJVC that we target to formalize during 2014.
Pictures showing(b) The development work on the fish and eel farm, Fish Farm 2, with an unrelated entity, Gao A Power Fishery Development Co. Ltd., is still in progress. The project is delayed because the property is situated on an inlet and drainage is extremely difficult to resolve and costly to fix. We have engineered a solution resolving this problem by constructing semi-enclosed growing dams that will be built with light building materials on land to be filled by soil collected from the extra water holding dams constructed at the same complex, outfitted with re-circulated filtration systems built externally adjacent to the water holding dams and the grow-out dams to suit the growing of prawns, fishes and/or eels in this farm. We are dividing workflow into phases and stages to yield the optimal financial efficiency and benefits. As of December 31, 2013, Phase 3 infrastructure construction work is in progress with Phase 1’s construction work’s open dams being completed during Q1 2014.
(c) Not shown on the chart, and on hold, is our development work on Prawn Farm 13 at Huangyuan County, Xining City, for an unrelated third party Chinese investor, Wu Aquaculture A Power Development Co. Ltd. (a proposed name for this future SJVC). Originally, Prawn Farm 3 was planned to be on SJAP property. All engineering design and related pre-development work has been completed, with original plans to begin construction and infrastructure work in May 2013. However, management decided in February 2013 to relocate Prawn Farm 3 to another block of land adjacent to SJAP’s existing property consisting of a much bigger area to accommodate future expansion whenever necessary. As a result of the relocation, the block of land where Prawn Farm 3 will be situated on a 45Mu area requiring rezoning from agriculture to industrial status. Any rezoning on parcels greater than 40Mu requires central government approval versus from local authorities, unfortunately requiring more time and causing delays in completing the process.
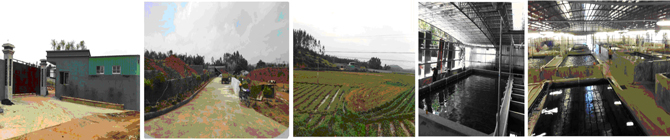

Fish Farm 1 (JFD)
A large complex situated on 9,900 m2 of land in the Enping City District, Fish Farm 1 is fully self-contained, and provides our prototype model for fish farms in China.
| - 107 - |
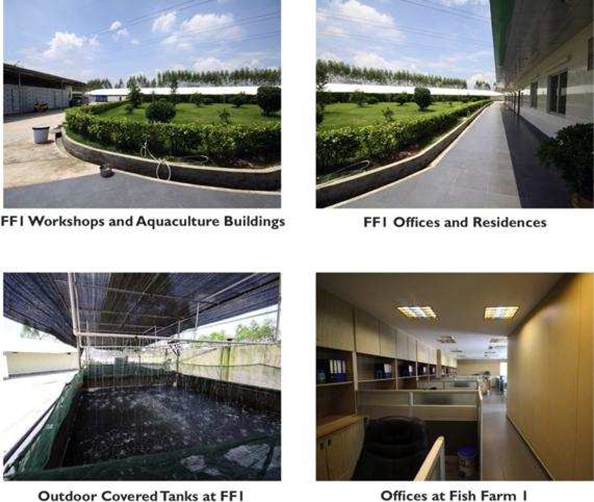
Fish Farm 1, with 16 grow-out APRAS module tanks that grow fish indoors on land, has capacity to grow over 1,200 MT of fish per year. In Q4 2012, market prices for Sleepy Cod fell sharply from US$27 per kg to the current $15 per kg. We were able to respond to changing market conditions rapidly, and remodeled tanks to grow eels (in four tanks since Q2 2013) and prawns (in eight tanks since Q3 2013). We continue to grow Sleepy Cod in four tanks.
Prawn Farm 1 (EBAPCD)
Situated in the district of Enping City district on 26,100 m2 of land, is our Prawn Farm 1 is designed to grow up to 1,200 MT per year by 2015, with acurrent capacity to grow-out 250/250 to 300 MT of prawns/year and againprawns. Prawn Farm 1 is contained in a fully self-serviced complex with office, staff quarters, laboratory, drieddry and cold storages,storage, stand-by generators’generator room, heating rooms, water storage and tanks, landscaping gardens, etc.
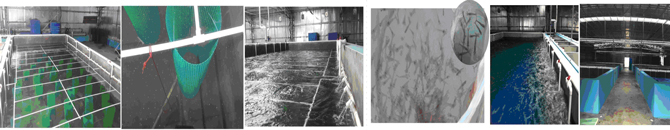
The plastic netting rolls are designed to provide shelter for the prawns and thus to increase the grow out capacity of the tanks.etc.
| - |
Pictures showing 
Each grow-out tank in Prawn Farm 1 measures 12m x 10m x 2.5m deep and holds up to 240,000 liters of water. Between 500,000 to 600,000 LawZi Prawn fingerlings (supplied by our own hatchery and nursery at Prawn Farm 2 when they reach 21 to 28 days old) are stocked in each tank.
| - 109 - |
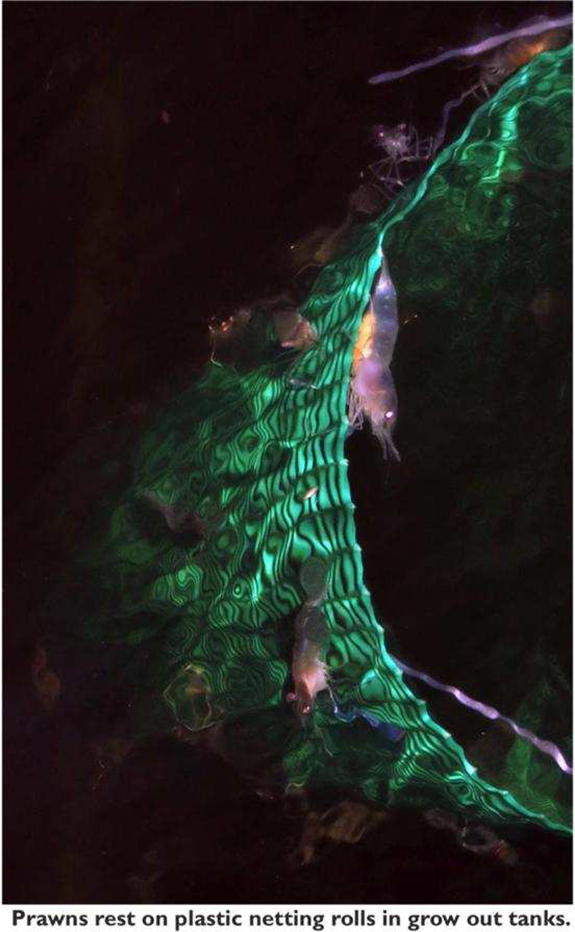
We grow prawns for up to twelve weeks to reach marketable sizes from counts of 75 pieces per Kg and larger.
| - 110 - |
During their growing period at Prawn Farm 1, prawns are frequently graded to optimize grow-out efficiency. In this way, faster growing prawns may reach marketable size after eight weeks, while slower growing prawns may need twelve weeks.
Our first and second batch of grow-out records show that the average of marketable prawn being harvested per tank is just under 8 MT per tank per growing cycle. As such, productivity per tank per year can be conservatively estimated at 40 MT per tank per year.
When we compare productivity to existing open dam prawn farming, which requires 26,000m2 (surface area of an open dam) to produce the 40 MT of marketable prawns per year, we obtain the same harvest in one 120m2 grow-out tank, drastically reducing the surface area required to produce the same measurable results.
Prawn Farm 1 is operated by Capital Award for a private company formed in China with Chinese citizens acting as its legal representative as required by Chinese law. Prawn Farm 1 will become a SIAF subsidiary when its SJVC is officially formed. This is expected to occur in 2014; however, no guarantee can be made that the SJVC will be formed. SIAF’s payments deposited toward future equity equates to an equity position of 45%.
Prawn Farm 2 (ZSAPP)
Prawn Farm 2 has a much bigger land bank of 120,000 m2 because apart fromm2. In addition to its core function of being theas our hatchery and nursery operation to supply quality prawn fingerling, the farmfingerlings, Prawn Farm 2 is now developing open grow-out dams that haveuse built-in RAS filtration systems to save onreduce water consumption, as well as toand provide cleaner water aimed at reducingto reduce the impact of pollution.pollution. Some open-dams produced prawns during Q3 2013. An additional 30,000 m2 is reserved to construct an indoor APRAS grow-out farm that aims to produce up to 1,200 MT of prawns per year. Construction began in Q1 of 2014.
| - 111 - |

The tanks in the picturePictured at right are nursery tanks. Each tank has the capacity toof these tanks can nurture up to 10 million prawns every 5five days per 30 cubic liters (or 30 MT) of water. Like our other farms, Prawn Farm 2 is also built as a fully self-contained complex with all associated facilities.required facilities, including a classroom where local prawn farmers who buy our fries and fingerlings are trained by us to optimize growing out the prawns successfully.
| - 112 - |

Prawn Farm 2 is operated by Capital Award for a private company formed in China with Chinese citizens as its legal representatives as required by Chinese law. Prawn Farm 2 will become a SIAF subsidiary when its SJVC is officially formed. This is expected to occur in 2014; however, no guarantee can be made that the SJVC will be formed. Our deposits against our future ownership represent an equity position of 51%.

Marketing and Sales of aquatic seafood:Seafood
CACapital Award is the sole marketing, sales and distribution agent of the Re-circulating Aquaculture System (“RAS”)our APRAS fishery and prawn (or shrimp) farms, such that itand purchases all marketable sized fish and prawns (or shrimp) from the farms, and in turn sells them to the wholesale markets and at the same timemarkets. CA also supplies the farms with fingerling,fingerlings, baby or adult fish or prawns, and stock feed.
Our Presently, our RAS farms do not produce enough fish or prawns to warrant the establishmentestablishing and sales ofselling value added processing products or facilities, given that the Chinese markets pay the best prices for live fish and prawns. Therefore, currentlyThus, CA sells only live fish and prawns.
In this respect, CA generates revenuesrevenue from the salessale of seafood broughtbought from farms that are either a subsidiary of the Company subsidiaries, or an incorporatedare unincorporated project companycompanies, and also from contracted growers in the manner described below:below.
Fish Farm 1:1
The Company owns a 75% equity interest in JFD, is the owner and operator of Fish Farm 1; the Company presently owns a 75% equity interest in JFD.
The1. Fish Farm 1 complex represents our typical model of developments and is builtdevelopment model. Built on a block of land measuring 9,900 m2 containing9,900m2, Fish Farm 1 contains staff quarters providingthat provide accommodation for up to 15 workers, a self-contained office, a laboratory, external live bait holding tanks, all season red wormworms nurturing tanks, dry and cold storages,storage, workshops, processing facilities, a heating room, 500 MT of water holding tanks, landscape gardens, standby generator and rooms, all related underground and on landabove ground infrastructure, and a 4,000m2 fish grow-out farm. This farm of 4,000 m2 that has all associated facilities to supportsupports 16 RAS tanks, with each tank measuring 10 meter (m)10m x 10 m10m x 3 m3m in depth and holding up to 240,000 liters (or 240 Metric Tons (MT) of water andwater. Each tank has the production capacity to grow up to 80 MT of aquatic animals per year depending on its stocking cycles (or frequency(frequency of stocking of fish), and the initial size of the fish being stocked atin each cycle. In other words, if the initial stocked fingerling is around 30/4030-40 mm per fish, then it will take over 12 months to grow the fish into a marketable fish (averaging over 500 gram/gram per fish) such that its annual production is only up to 30/35 MT/30-35 MT per tank; however if the initial fish being stocked are at an average of 200 to 300 grams each then its stocking and harvesting cycle is 4four times per year, enhancing annual production capacity atto up to 80 MT/MT per tank.
| - 113 - |
Initially, Fish Farm 1 was designed to grow sleepy cod, which had a nicheparticular market with mostvery attractive prices in Chinese markets.
However,markets; however, sleepy cod does not have a large market share in China compared to the carp species. Our market research of the sleepy cod market size in 2012 shows that total annual local domestic production is about 25,000/28,00025,000-28,000 MT distributed to more than 100 wholesale markets throughout many provinces, with the markets at Guangzhou City, the Southern Coastal towns of Guangdong and markets in Shanghai City comprising the dominant markets. From the time we started stocking sleepy cod in 2011 until the end of year 2012, live sleepy cod constituted a niche market in China and sold at wholesale for an average price of US$27/Kg until the27 per Kg. In January 2013, cheaper imports from other Asian countries were permitted to be imported toenter China at a low tariff starting in January 2013,import tax, such that the wholesale prices fell sharply to an average of US$15/15 per Kg. We mainly had fed live bait fish to our baby sleepy cod (250 to 300 gram each) that we bought from our contracted suppliers at aroundcosting us approximately US$5/fish5 per sleepy cod grown at an average feed to weight gain conversion rate of 2.5 Kg of live bait to 1 kg of weight gained. As such, when we purchased our supplies of live bait at an average of US$1.65/1.65 per Kg, and low mortality rate at the average below 8% coupled with our recorded 3.5 stocking and harvesting cycles per year, Fish Farm 1consistently1 consistently achieved good sales revenues with gross profit margin of 50/5550-55 % in 2011 and 2012. However, its gross profit margin fell in 2013 to between 35/4035-40 % while the cost of supplies of baby sleepy cod and live bait fell correspondingly by an average of only 10%.
In this respect and in mitigating such situation,an attempt to mitigate the adverse circumstances, during the first quarter ofQ1 2013 we stepped up the modification of our RAS tanks to adapt to the growthgrowing of eels with 4using four tanks and prawns (or shrimp) with 8 tanks and the expansionin eight tanks. We expanded our program in the Research and Development Station to accommodate the nurturing of Flower Pattern Eels’ fingerlings to grow into adult eels (of 500 gram/grams per eel and upward) that would be supplied to Fish Farm 1 to grow the adult eels into marketable sized eels (around 1.5 kg/kg per eel and larger) which at present are selling at high prices between US$27/2827-28 per Kg. Fish Farm 1 is now stocked with and growing Flower Pattern eels, prawns and sleepy cod.
Prawn Farm 1 (or EBAPCD):
EBAPCD is the(the proposed name of theour future SJVC, (subjectsubject to approval by relevant Chinese authorities under our application for SJVC status), was established to own and operate Prawn Farm 1. EBAPCD will generategenerated revenue starting during the third quarter ofQ3 2013. Capital Award will recognizerecognized income from purchases(booked in the Fishery Division’s sales of goods) by purchasing prawns from Prawn Farm 1 and selling them to the wholesale markets.
On April 22, 2013, we placed our first 500,000 (Mexican White)Mexican White prawn fingerlingfingerlings in Prawn Farm 1, and as of the date of this prospectus management reportedhave noted that prawns are meeting growth benchmarks with low mortality, and reaching around 15 cm/cm per prawn in size. Our Mexican White shrimp are known in the west as “Western White Shrimp,” or by their genus species “Penaeus Vannamei.”
The Company believes that its Prawn Farm 1 represents the first indoor RAS prawn farm in Asia. Going forward, Prawn Farm 1 will carry out its rotational stocking and harvesting program, targeting to produce between 250/250 to 300 MT of live prawns in 2013. During fiscal year 2013, Prawn Farm 1 harvested just over 200 MT of marketable sized prawns.
We have seensaw a rapid increase in live prawn prices in the first quarter of this yearQ1 2013 (averaging 100% increases in prices compared to the corresponding period last year)Q1 2012) with current wholesale price averaging US$15/15 per Kg for size of 80s (equivalent to 80 to 90 pieces of prawn/prawn per Kg), and prices going up proportionately to sizes of Mexican White prawns, and at a premium rate for popular, but rarer species (e.g., our big giantLawZi prawns, Green Prawn,Prawns, Banana Prawns and Tiger Prawns). TheFrom recent growing records of the farm, the average time required to grow prawns (offrom 7-days old Mexican White Species or Big Giant Prawns) from 14-dayfingerlings and 21-days old LawZi Prawn fingerlings to marketable sizes in commercial scale at the Prawn Farm 1 under our RAS system is estimated conservatively between 60/70 days, 90/100 days and 120/13060-70 days for marketable Mexican White prawns for sizes of 80s, 60sweighing at 80 pieces per Kg, and 40s, respectively.80-90 days for marketable LawZi Prawns for sizes weighing at 75 pieces per Kg. We believe, but cannot assure you,intend to add more grading tanks to grade out the bigger prawns from the smaller prawns thus to grow them in separated tanks in the farm that we shouldwill be able to reduce this estimatedthe grow-out period under our RAS system sinceof the said grow-out period was calculated from and based on information of open-dam prawn farms asprawns because we do not have any conclusive commercial grow-out statistic being recorded at Prawn Farm 1 yet. However, we are confident that we shallwill be able to experiencegrade them more frequently such that some of the faster growing prawns will be able to reach marketable sizes much faster because the graded prawns can be fed and cared for more appropriately and directly in their own graded tanks. The records also show a much lowervery low mortality rate, between 10/20 %, comparedrecording less than 5%, which we believe is far superior to the 50/60% at the open-dam farms.existing open dam prawn farms’ average of 50%.
Prawn Farm 2 (or ZSAPP):
ZSAPP is also an intended name of the future SJVC (subject to approval by relevant Chinese authorities under our application for SJVC status), established to own and operate Prawn Farm 2. ZSAPP has been generatinggenerated revenues since May 2012. However, ZSAPP’s financial statements will not be consolidated with ours until approval of this SJVC is formalized,obtained, and one of our subsidiaries acquires a majority equity interest therein. However,During the interim period, prior to the said official formation of the SJVC, Capital Award acts as Prawn Farm 2’s sole marketing agent and recognizes income from commissions earnedthe following: (i) Management fees and commission fees charged to Prawn Farm 2 based on RMB20 per 10,000 pieces of Mexican White prawn fingerlings and RMB40 per 10,000 pieces of LawZi Prawn fingerlings being sold by Prawn Farm 1 that were booked in the Fishery Division’s Consulting and Service Revenues and (ii) the purchases of prawns from ZSAPP’sPrawn Farm 2 and sale to the wholesale markets that were booked in the Fishery Division’s sales of prawn fingerling to regional growers who constitute its sole marketing and sales agent.goods.
| - 114 - |
ZSAPP has been successful during the first two quarters of
During Q1 2013, producingPrawn Farm 2 successfully produced LawZi Prawn (or the Big Giant Prawns) fingerlingfingerlings from the 5,000 pieces of breeding stock that werewe imported from South-EastSoutheast Asian countries. Literally translated as “Big Giant Prawns,” the full English name for our LawZi Prawns is “Giant Freshwater Prawns,” the genus species is “Macrobrachium Rosenbergii,” and they are also called “Green Prawns.” By the second quarter ofQ2 2013, the reproduction of the Big Giant Prawns fingerlingLawZi Prawn fingerlings had become consistent; consequently, we intend to market the Big Giant Prawn flies beginning during the third quarter offiscal year 2013, together with theZSAPP sold 800 million Mexican White fingerling which constituted our main sales in 2012.fingerlings at an average of RMB165 per 10,000 fingerlings and over 200 million of LawZi Prawn fingerlings at an average of RMB460 per 10,000 fingerlings. During the past two years, our research confirmed that the demand and prices of the Big Giantfor LawZi Prawns in the local domestic markets were high (at between RMB450 to 550/550 per 10,000 fliesfries in 2012) because supplies of quality Big GiantLawZi Prawn fingerlingfingerlings is fairlycompetitively low compared to Mexican White (atfingerlings (price averaged price between RMB150 to 170/170 per 10,000 fliesfries in 2012), due to problems of inbreeding. As such, we expect high demand for our Big GiantLawZi Prawn fliesfries by the regional prawn growers, as they will be theare offspring fromof our 2ndsecond generation breeding stock, and free from inbreeding problems. In the last week of September 2013, we imported an additional 5,000 breeding-stock prawns from Southeast Asian countries in an effort to continue improving our offspring culture. As of the date of this prospectus, our third generation LawZi are being produced and we expect to be ready to introduce the sales of fingerling from our third generation mother prawns by mid-May 2014.
Fish sales generated from purchases with other open-dam growers contracted by Capital Award. Capital Award has been contracting with local aquaculture farms to grow sleepy cod since 2012 to present based on a fixed production cost, with recently added eel growing contracts commencing in the first quarter ofQ1 2013. There are existing contracts that will provide up to 800,000 pieces of sleepy cod and 600,000 pieces of eels to be sold by Capital Award between 2013 through the early part of 2014. However, Capital Award is exploring similar new contracts consistent with local reliable growers who meet our quality standards targeting to increase its fish sales revenue whenever the opportunity presents itself.During fiscal year 2013, more than 250,000 pieces of Sleepy cod and 66,000 pieces of eels were sold from these contracts.
2. The Beef Cattle business of MEIJI
Similarly to CA, MEIJI has two sources of revenues, its Engineering and Services revenues and its marketing and sales of cattle;cattle.
2.1. Engineering and services revenues . These revenues
Revenues are generated from the Constructionconstruction and development of Cattle Farm 1 and Cattle Farm 2.
The MEIJI This table below showslists the latest status of theirMEIJI’s developments:
| Name of the Developments | |||||||||||||||
| LiangXi Town, Enping City | |||||||||||||||
| LiangXi Town, Enping City | |||||||||||||||
| Estimated Annual Capacity | 1,500 Head | 2,500 head | No production | No production | |||||||||||
| Land Area or Built Up Area | 165,013 m2 | ||||||||||||||
| 4.5 Km road | |||||||||||||||
| One Phase | |||||||||||||||
| Date Development Commenced | April 2011 | February 2012 | September 2012 | ||||||||||||
| Completion Date | December 2011 | 2014 (estimated) | March 2013 | ||||||||||||
| Contract Amount (Millions of US Dollars) | $3M + $1.17M | $10.6M | $4.32M | $5.28M | |||||||||||
| % complete as at December 31, 2013 | Fully Operational | 90% | Completed | Completed |
Enping is situated in the Southern part of China with a semi-tropical climate, and the cattle farm is operated based on our semi-free rangedsemi-free-range growing and management system that allows the cattle to roam around and feed in our pasture fields during the mornings and be kept and fed with our formulated aromatic feed in our semi-opened cattle houses during the hot days and nights. This is an entirely different agricultural environment than that of SJAP in(in Huangyuan, Xining, which hasXining) where the long winters are bitterly cold, and long winter seasons and where all cattle are being grown in fully insulated cattle houses.
The 2012 experience of the JHMC farm showed that the growth rate of the cattle grow faster in this environment is faster than atin SJAP (averaging 1.78 Kg/day/Kg per day per head in weight gain comparescompared to SJAP’s 1.5 kg/day/kg per day per head). However, Cattle Farm 1JHMC showed higher mortality rates than SJAP (recording 5% in Cattle Farm 1JHMC compared to 0.25% in SJAP). The reason for the higher mortality is due mainly to the change of climate, as Cattle Farm 1 has to buybuys young cattle from farms situated in the coldcolder Northern part of China, where they havethere is an ample supply of young cattle at lesser costs, but whichcosts. However, these cattle require over 3three days of transportation, such thatduring which some of the weaker young cattle could notcannot adapt to the hot climate of Enping, and thus could not recover from the journey. To avoid the repetition of this high mortality rate, Cattle Farm 1 is buildingJHMC built additional semi-open cattle houses that are equipped with cooling systems as temporary depots to receive the young cattle and to nurture them back to health before they are grown in our normal cattle houses. The other differential aspect
| - 115 - |
Another difference between Cattle Farm 1JHMC and SJAP is in the management of environmental impact;impact. SJAP is goingwill continue to build a mashmarsh gas station (estimated by the year end of 2013)during 2015 to manage all ofconvert its cattle waste into electricity with its residue recycled aselectricity. Residue becomes raw material used in its manufacturing offor organic fertilizer whereas in Cattle Farm 1, themanufacturing. At JHMC, cattle waste is being kept in septic wells that isare treated with our enzyme under a fermentation process, and then is channeled to fertilize our pasture fields at the farm. JHMC’s waste treatment program is sufficient for the time beingat present, as it hasthere is enough pasture fields to absorb the waste yielded from the limited number of cattle (up to 500 head) being grown on the farm, howeverfarm. However, as the number of cattle number increases to a point where it could exceedbeyond the fields’ fertilizer absorption capacity, an alternative environment treatment plan must be implemented in order that this JHMC farm can grow more cattle.
Cattle Farm 2 will be complementaryEarlier in the year, JHMC bought young cattle of age six to eight months and fattened them on the farm for six to ten months more. However from Q2 2013 onward, JHMC bought slightly older cattle (15 to 16 months old) and fattened them at the farm for a further three to six months, then sold them to the wholesale markets and/or to the Beijing cattle farm and wholesale shop that we have invested in. We expect faster and higher turnover of sales due to faster turn-around cycles of growth of cattle at the farm. During fiscal year 2013, Cattle Farm 1 havingsold over 1,700 heads of cattle averaging 22 months old.
EAPBCF complements JHMC with an additional 76 acres of land suitable for growing our type of pasture (a cross between Elephant and Yellow grass) that has a very high yield rate of over 35 MT/1/6 acre/MT per 0.167 acres per year, and containscontaining an average of over 9% protein that is very suitable for consumption by cattle. Between the twoAt capacity, both farms under normal seasons, they have a capacity towill produce up to 30,000 MT of pasture/pasture per year collectively that is capable tounder normal weather conditions. This amount will feed up to 5,000 head of cattle/cattle per year based on theat an average consumption rate of average of 6 MT/head/MT per head per year if the environmental issue mentioned above is resolved properly.resolved.
By the end of February 2013, the Company hadwe completed the external road worksroadwork of about 10 Km leading from the outer-boundary access road to and surrounding the two farms. The development cost of this road was shared at the ratio of 2/3 by Cattle Farm 1JHMC and 1/3 by Cattle Farm 2.EAPBCF. This all seasonall-season road was constructed at the request of the district village committee of Enping City, enhancing corporate social responsibility in our development of the two cattle farms. Development work on Cattle Farm 2 was nearly complete at the end of September 2013, with pasture being planted and stocking of cattle expected to commence early in 2014. Cattle Farm 2 is operated by a private company formed in China with Chinese citizens acting as its legal representative as required by Chinese law. EAPBCF will become a SIAF subsidiary when its SJVC is officially formed. This is expected to occur 2015; however, no guarantee can be made that the SJVC will be formed. SIAF’s payments deposited toward future equity currently equates to an equity position of 35%.
Pictures showing Cattle Farm 1
This is our Cattle Farm 1 which was built as a demonstration farm to show that cattle can be raised in a semi-tropical climate using our Semi-grazingsemi-grazing and housing method that we call “Semi-freemethod. Using our “semi-free growing” management system” wheresystem, the cattle are allowed to graze in the field during the early morning and kept indoors and hence away fromout of the hot sun during the hot summer afternoon. So far thisdays. This method has been proven applicablereliable, with the growth rate of the cattle measuredmeasuring slightly betterhigher than the cattle at SJAP (i.e., averaging some 0.28 kg/day/kg per day per cattle better)more).
| - 116 - |
2.2. 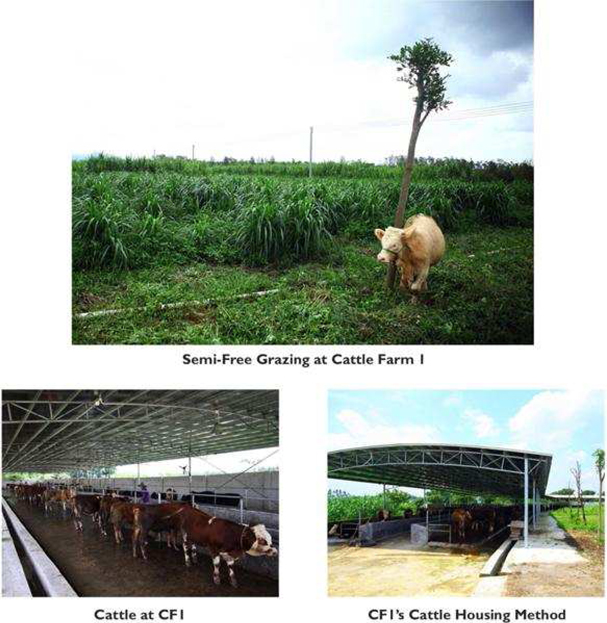
Marketing and salesSale of liveLive Cattle by MEIJI:MEIJI
Similar to CA in its business model, of operation, MEIJI purchases fully grownfully-grown cattle from Cattle Farm 1 and sells them to the cattle wholesalers and bringswholesalers. MEIJI also buys young cattle from other farmers and sells themthe young stock to Cattle Farm 1.
All cattle farms developed by MEIJI will be usingutilize its “Semi-free“semi-free growing” management systemssystem and aromatic-feed programs and systems to raise beef cattle.
Up to now, we have not experienced any material disagreement between the above parties. Any disagreement between the parties is usually reconciled and resolved on the spot within our operational guidelines, which clearly define each party’s responsibilities and duties before the transaction can be completed. If not reconciled and resolved, the transaction will not be completed.
Beef is traditionally a nichehigh-end market in China, as it is mainly sold mainly byto expensive restaurants of upmarketor upscale hotels rather than in the homes of China’sto Chinese consumers. This situation is rapidly changing, though, owing to urbanization and rising incomes, the rising demand for a high protein diet, and the rise in restaurant dining due to work demands.
Our free rangefree-range cattle grown in the Enping farms are fed with natural pastures, concentrated livestock feedCLF and our Aromatic Feed that contains Chinese herbal plants specially designedbelieved to improve animal health such thathealth. As a result, these Enping farms produce healthy cattle and in turn quality meat. Although we cannot yet have them certified as pure organic meat, yet because we cannot get certification from suppliers of the raw materials used to make our concentrated feed purely organic, we believe that we are not far away from being qualified to obtain 100% pure organic meat certification.
| - 117 - |
The
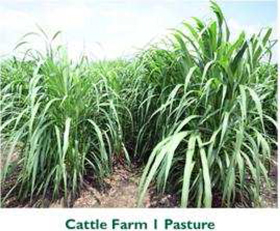
Our Enping cattle farms are situatedoperate in Guangdong Province, which is not a traditional cattle growing country due to its tropical climate. This provides advantages for our cattle sales within the region. Most cattle and beef supplies are imported from the Western and Northern Provinces at higher costs, entailing higher wholesale and retail prices in Guangzhou City and in its urban cities, which provides marketing advantages for our cattle sales within the region.cities.
Moreover, our 2012 sampled meat trials, carried out with a number of reputable restaurants and hotels in Beijing City, were well received with constantfrequent requests for us to supply them on a long-term basis. Our strategy is to ensure we can supply the quantity to maintain consistently sustainable supplies as required by our customers. At Enping cattle farms we will growgrew at least 1,000 headheads of mature cattle in 2013, which is the minimum number required to sustain the supplies to just a couple of restaurant chains.
According to the China Federal Agriculture Quarterly Report of 2011 the consumption of beef was over 6.48 million MT, 10% of which were premium cuts. Our planned 1,000 head of mature cattle in 2013 will yield approximately 375 MT of meat, which is a tiny fraction of the total market share indicating significant potential for growth in the future.
Cattle Farm 1 is doing well and on target, having sold during first half of this year, over 6301,700 heads of mature cattle during fiscal year of 2013. These were grown collectively from the stocked six monthsmonth old calves and the 12 monthstwelve month yearling cattle broughtbought in January and May of 2012 respectively.and from July 2013 onward Cattle Farm 1 started to fatten cattle from 16 months and older. Out of the total sales of cattle during the first six months of this year,2013, on April 22, 2013, 180 heads of matured beef cattle had beenwere transported to Beijing City to beand sold to one of the wholesalers specializing in supplyingwholesaler that supplies quality beef meat to top hotelhotels and restaurant chains.restaurants. Starting in Q3 2013, JHMC began to stock older cattle (of 16 months and older), and fatten the cattle on the farm for shorter period of 3 to 3.5 months instead of the 5 to 6 months in earlier months of the year. This change resulted in JHMC selling over 1,700 heads of cattle (at less than 2 year old), creating a much faster turn-around of sales of cattle at the farm.
UnderThe Consulting Services agreement between MEIJI and a group of Chinese parties represented by a privately owned Chinese company named “Enping Bi Tao A Power Cattle Farm Co. Ltd” (the “China Party”) for the development of Cattle Farm 1, dated April 15, 2011, is outlined below. Principal terms and conditions include:
| · | The China Party is the developer of Cattle Farm 1. MEIJI is an engineering and management consultant providing development of cattle farms and related business operations with the expertise to provide those related services. | |
| · | Cattle Farm 1 is developed on a 250 Mu (about 42 acres) situated at Yane Xiabban Village in the town of Liangxi, Enping City, Guangdong Province. | |
| · | The scope of work for MEIJI includes project engineering management, installation and commissioning, farm management, construction and buildings and supply of plants and equipment for consideration of US$3 million, covering the development of a basic cattle farm to house 500 heads of cattle at a given time. | |
| · | Further or additional work, if and when necessary to be carried out, will be mutually agreed and determined by both parties. | |
| · | The China Party must finance the development, paying MEIJI for its respective work. | |
| · | Subject to project completion and its performance, the parties agree to form an SJVC. MEIJI retains the right to acquire up to 75% equity in the SJVC based on its book value at the time of acquisition to be paid to the China Party. |
| - 118 - |

Beijing Cattle Farm
In February 2013, we entered a joint venture with a group of businessmen (the “Joint Venture”“Chinese Party”), we. We started the setting up of a Cattle Station and related facilities (the “Beijing Cattle Farm”) on a block of leased land measuring about 130,000 m2130,000m2 within the Central Cattle Market and Facility of Beijing City (that we call “The Beijing Cattle Farm”) to act as an intermediate house aiming to house andhousing to grow our Aromatic beefBeef cattle and to sell together with our Aromatic Cattle from Cattle Farm 1JHMC through regional distributors, and in turn to some of the top hotels and restaurants chains in Beijing City, and also through wholesale shops that the Joint Venture intends to develop. In this respect, thedevelop (“Operation of Sales”). The development of wholesale shops fits in well as part of our interstate wholesale and distribution development plan that we mapped for some of the big cities in China, and thisChina. This one in Beijing City will seeis the beginning of such a plan being put into motion.
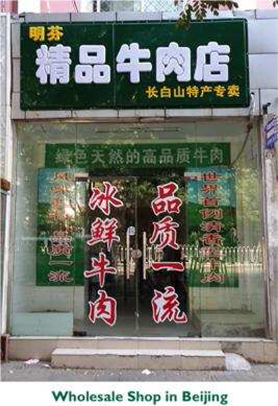
By July 31, 2013, the Joint Venture established one small wholesale shop within close proximity to the Beijing Cattle Farm and started sales of our beef meats regionally. This Beijing cattle station housed 450 head of cattle every 6 months, and its wholesale shop sold an average of 3 head of cattle per day. We are satisfied with its sales performance and realize that potentially there is good commercial viability to support expansion of similar shops developed within Tier 1 and Tier 2 cities in China. As of the date of this prospectus, the Beijing operation has three additional small retailed shops selling an average of 120 Kg of meat per day per shop.
| - 119 - |

The Joint Venture Agreement has not been finalized; consequently, the Joint Venture is currently based on a verbal understanding only.
Pictures Taken in July 2013 showing the Beijing Cattle Farmonly with following principal terms and the Small Wholesale Shop.
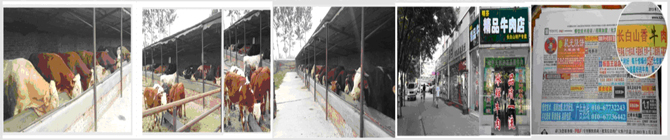
| · | Our company is responsible is to supply the aromatic beef cattle to the Beijing Cattle Farm that will be billed to the Chinese Party at maximum trading term no longer than 120 days initially for the first 12 months of operation and gradually reducing to within 60 days within year 2 of operation. | |
| · | Capital expenditure including working capital is limited at US$2.5 million for year one of the development and operation, and will be contributed 65% and 35% by the Company and the Chinese Party respectively. Subsequent capital requirement will be reviewed by both parties on or before February 28, 2014 pending its year one progress. | |
| · | After satisfactory progressive performance of its business operation in |
We are waiting on respective lawyers to finalize all terms and condition of this joint venture for execution. Meanwhile, we do not expect to generate additional revenue from this operation, except from the sales of cattle from Cattle Farm 1. As of March 31, 2014, performance of its operation hasn’t met our expectations; as such we extended the verbal understanding for a further period until June 30, 2015 to evaluate its performance before entering into an agreement. As of December 2014, we were still not satisfied with the Chinese Party’s performance to finalize the Joint Venture.
3. SJAP and HSA Division in Fertilizer, Livestock Feed and Cattle
We have two operations in this division spread over two provinces in China, consisting of the following:SJAP in Qinghai Province and HSA in Hunan Province.
3.1 Operation 1.1. Operation 1 is operated from Huangyuan County of Xining City in Qinghai Province by SJAP, a majority owned subsidiary of the Company incorporated in China in 2009. As of the date of this prospectus, SJAP’S principal activities that arerevenue generating revenuesactivities comprise: (i) manufacturing and salessale of organic fertilizer, (ii) manufacturing and salessale of livestock feed and (iii) rearing and salessale of beef cattle. On February 28, 2013, SJAP completed its development of the Concentrated Livestock Feed Manufacturing FactoryCLF manufacturing factory, and started the production and sales of Concentrated Livestock Feed (“CLF”).ThisCLF. This CLF complements SJAP’s bulk livestock feed to provide the local cattle and sheep farming industry with a unique and completed feed formula that can cater to the rearing of cattle and sheep at various growing cycles (e.g., specially formulated mixes with efficient nutrients for dairy cows and sheep, weaning, fattening and mature cattle and sheep). The advantage of the formulated feed combination is that the cattle and sheep growers will realize cost savings in production knowing precisely the amount of concentrated feed that will be needed by their livestock, thus avoiding wasted excess concentrated feed being wasted ondue to over feeding, resultingwhich results in worthless excess fat in mature animals. In this respect, the Chinese central government has placed an order with SJAP to reserve annually up to 50005,000 MT of CLF annually as part of the country’s annual reserve emergency livestock feed inventory. Thus, fromsince March 2013 onward, SJAP expects to havehas had additional revenue generated from the sales of CLF.
The fertilizer, bulk livestock feed and cattle divisions under SJAP contributed 3%, 2% and 10% of the Company’s total revenue and 3%, 2% and 5% of the Company’s total consolidated gross profit, respectively, in 2012 derived from the production of about 4,500 head of mature cattle (between 15 months to 18 months old) from its own cattle houses and the co-operative growers, collectively, 25,000 MT of organic fertilizer, and 22,000 MT of bulk stock feed.
| - 120 - |
Our strategy is to increase the number of co-operativecooperative growers and obtain more internal cattle houses and thus toin an attempt to double the volume of production of mature cattle during 2013,2014, which would in turn would increase the demand for the production of fertilizer and bulk stock feed to grow in tandem. As of the date of this prospectus, SJAP has established 22 Farmers Co-operatives that have the capacity to fatten up to 18,000 heads of cattle per year based on a 3-month turn around program. The cost of rearing cattle is expected to be lower as a result of concentrating efforts on manufacturing and/or selling livestock feed. The regional farmers are contracted to grow crops and pasture for us using our land that has been provided lease-free by the local Government or by using their own land, use our equipment operated by our workers for their planting and harvesting, are providedand our supervision and associated services, from us, as well as seedsseed and organic fertilizer. These items are provided to them on credit, which are then charged against their account when the Company purchases the crops and pasture grass from them in return. Regional farmers also raise cattle for us using our bulk livestock feed under the same credit terms and conditions described above. That is, when the Company purchases the mature cattle from them, their accounts are charged for the feed against the amount paid.
TheAs mentioned earlier, the cattle we grow are primarily Simmental, (a common breed introduced to China in the early 20thcentury), Charolais, and some Angus cattle.Angus. In general, sixlocal farmers buy 12 to 15 month old cattle are sold to local farmers,from our cattle agents, and we commit to repurchasing the cattle when they are between 1521 months to 1824 months old.
We alsoSJAP now has twelve cattle houses, with our smaller buildings housing a minimum of 200 head and larger cattle houses accommodating up to 350 head. Additional cattle houses are under construction. Sometime in 2014, we intend to rent part of our cattle housing to our cooperative farmers andupon full development of all our cattle houses. Early in 2015, we will provide slaughter and deboning services to them oncefarmers at our abattoir and deboning facilities. SJAP received a business permit from the Chinese authorities on April 17, 2013, and construction commenced on April 21, 2013 on the abattoir, deboning factory, and related packaging facility. Since it is rare and difficult to obtain a permit for an abattoir facility in China, having this facility is expected to become a very valuable asset. Trial runs of the slaughter facilities are completedcommenced in 2014.December 2013. Phase 1 is operational.
BeefBefore our abattoir and related facilities were operational, we sold mostly live cattle to or through various cattle wholesalers to existing wholesale and distribution markets that did not require much marketing efforts and networking. In 2014, however, we will require organized marketing networks and efforts to sell our beef (meats) and beef products efficiently in order to achieve better profit margins for our quality meat and establish our own brands and labels.
In China, beef is customarily distributed through various tiers of established wholesalers and through our own or developed restaurants as described elsewhere in this prospectus. SJAP intends to add sheep farming during 2013 and value added product processing (including abattoirdistributors that source their beef from various slaughter and deboning facilitieshouses located across many districts in 2013China. Most of these wholesalers sell multiple types of frozen or freshly chilled meats (including pork and a value added processing facility in 2014)poultry, etc.), and aimssome slaughterhouses specialize in and solely supply beef. These wholesalers and distributors supply beef to but cannot assure you thatregional supermarket chain stores, retailing wet and frozen food markets, the catering industry, etc. Therefore, after having established its own slaughterhouse and deboning factory, SJAP is expected to automatically become the primary supplier of beef. As such, many existing wholesalers and distributors will source their beef supplies directly from us. With the current ever increasing demands of quality beef meats due to the increase of middle class consumers, the Government’s enforcement of food safety regulation, and of anti-smuggling and illegal imports of beef, the right opportunity exists for SJAP to market its high-quality beef product. Therefore, the Company is confident it will expandsuccessfully sell its steakhouse restaurant “BULL” intobeef meats in domestic markets. Also, a franchisee style chain of 50 outlets over time, whereas currentlyportion will be exported to South Asian countries (i.e., Malaysia, Singapore, Hong Kong, Middle East countries and Thailand etc.) in 2014, as the one and only “Bull restaurant isLocal Government encourages us to act as SJAP’s first demonstration model converted from one of our old cattle houses situated next to our newly renovated cattle houses at SJAP’s complex. This one Bull has over 130 seating capacity and since its commencement of business operations it is now becoming a popular diningdo.
The following table shows the current average mark-up margin for most of the locals, having achievedsellers and operators in the beef trade in China:
| Type of wholesalers, distributors or retailers | Mark-up Margin in Localities (Low / High) | |||||
| Tier 1 Cities | Tier 2 and Tier 3 Cities | Tier 4, Tier 5 & Lower Cities | ||||
| Slaughter cum deboning houses | 30% / 35% | 33% / 38% | 39% / 42% | |||
| 1st tier wholesalers and distributors | 10% / 12% | 12% / 15% | 15% / 20% | |||
| 2nd and 3rd tier wholesalers and distributors | 15% / 20% | 18% / 25% | 20% / 30% | |||
| 1st tier retailers (i.e. supermarket chains) | 22% to 35% | 22% / 35% | 22% / 35% | |||
Our marketing strategy to sell our beef meats and beef products targets the middle class consumers through the following developments:
| Development Items and Marketing Channels | Estimated Annual Beef Production in Metric Tons (MT) | Share of Sales | ||||||||||||||||||||||
| 2014 | 2015 | 2016 | 2014 | 2015 | 2016 | |||||||||||||||||||
| 6,000 | 9,000 | 18,000 | ||||||||||||||||||||||
| Develop up to five sales and distribution outlets in Guangzhou, Beijing, Tianjin, Chongqing and Shanghai City | ||||||||||||||||||||||||
| (A) Existing localized 1st, 2nd and 3rd tier wholesalers and distributors in these cities | 60 | % | 45 | % | 35 | % | ||||||||||||||||||
| (B) Own sales and distribution outlets* | 40 | % | 30 | % | 30 | % | ||||||||||||||||||
| Develop up to five sales and distribution outlets in Fuzhou, Changsha, Suzhou, Shenzhen and Xiamen City | ||||||||||||||||||||||||
| (A) Existing localized 1st, 2nd and 3rd tier wholesalers and distributors in these cities | 15 | % | 20 | % | ||||||||||||||||||||
| (B) Own sales and distribution outlets * | 10 | % | 15 | % | ||||||||||||||||||||
*Our own sales distribution outlets will include the development and operation of just over $420,000 in year 2012 with net profit of just over $50,000 (or netting about 12%) which is a very small contribution to the Company’s consolidated revenues and profits. However as SJAP’s first demonstration model it has served the purpose.following:
| - |
| · | 1st and 2nd Tier Wholesale and Distribution Network directly competing with, and supplying to, existing local wholesalers. | |
| · | Distribution and service networking into supermarket chains, restaurant chains and domestic distributors. | |
| · | Franchising of “Bull” Restaurants that will sell our own beef and beef products | |
| · | Franchising of retail butcher shops similar to the Beijing shop. |
Currently our “Bull” restaurant serves as our demonstration model. Converted from an old cattle house, and situated next to our renovated cattle houses at SJAP’s complex, Bull seats over 130 and is a popular local dining facility. In fiscal year 2013, Bull sales reached over $590,000 with net profit of over $70,000 (netting about 12%), and used one head of cattle every three days.
We can reasonably assume that in big cities, compared to the small community of Huangyuan where the demonstration restaurant is located, a similar restaurant must have the capacity to use up to at least two head of cattle per day, equal to 730 head per year. Therefore, if and when we develop fifty Bull restaurants, we anticipate realizing sales of up to 36,500 head of cattle in a year, which is more than SJAP targets to slaughter in 2016 (i.e., 30,000 head).
This table lists some of the biggest wholesale frozen food (including beef) markets in Tier 1 cities (i.e., Beijing, Shanghai and Guangzhou City) from which there are many established logistic services to channel frozen goods to other Tier 2 and Tier 3 cities, where many existing localized wholesalers and distributors are situated and operating:
| City | Name of Wholesale (cold storage) Markets | Address | ||
| Beijing | XinFa Di Wholesale Market of Agricultural Produce | XinFa Di Bridge, Jingkai Highway, Fengtai District, Beijing | ||
| Jing Hua Jin Niu Qing Zhen Wholesale Market of Meat and Aquatic Produce | No.6 Nanding Road, Fengtai District, Beijing | |||
| YueGeZhuang wholesale Market | No.34 Fengtai Road, Beijing | |||
| Jin Xiu Da Di Wholesale Market of Meat | No.69 Fushi Road, Haidian District, Beijing | |||
| Shanghai | Shanghai City Beef and Mutton Wholesale Trade Market | No.178 Nanda Road, Baoshan District, Shanghai | ||
| Cao An Hu Tai Agricultural Wholesale Market | Mei Ling North Road, Putuo District, Shanghai | |||
| Shanghai Agricultural Produce Wholesale Market Centre | Hunan Road, Pudong District, Shanghai | |||
| Shanghai Qi Bao Agricultural and Sideline Products Integrated Trading Market | Laiting North Road, Minxing District, Shanghai | |||
| Shanghai Jiang Yang Agricultural Produce Wholesale Market | Jiang Yang North, Baoshan District, Shanghai | |||
| Guangzhou | HuiFeng Frozen Produce Market | No. 5 Shui Chang Road, Huang Shi Xi Road, Guangzhou | ||
| Zi You Ma Frozen Produce Wholesale Market | No.1 Huang Shi Xi Road, Guangzhou | |||
| Da Luo Tang International Frozen Produce Centre | Qiao Xing Avenue, Panyu District, Guangzhou |
Note: We intend to acquire an existing wholesale establishment in each of these Tier 1, Tier 2, and Tier 3 Cities to be our main sales and distribution outlets, and as our main regional sales administration centers.
With the slaughterhouse, deboning and value added processing activities since Q1 2014, we expect rapid growth of year on year revenue and profits for SJAP thereafter. The table below lists examples of SJAP’s revenue that we expect to be generated from one head of cattle.
Assumptions: Cattle is purchased at 15 to 16 months old and fattened for a period of five to six months, then slaughtered and de-boned. 10% of the beef meat will be used for value added processed beef products. Revenue generated from marketing division is excluded.
| - 122 - |
PER HEAD OF CATTLE
| Revenue Components | Quantity | Average Unit Price in RMB | Revenues | Average Yielding Information & Statistics | ||||||||||
| (Ex-factory) | At cost | Sales value | ||||||||||||
| Organic Fertilizer | 1 MT | 650 / MT | 1200 / MT | 1,200 | Fertilizer /Mu / year | 0.65 MT | 1 Mu = 660 m2 | |||||||
| Bulk Livestock Feed | 3 MT | 705 / MT | 1250 / MT | 3,750 | Bulk livestock feed | 6 MT / year | Consumption | |||||||
| Concentrated Feed | 600 Kg | 1500 / MT | 2600 / MT | 1,560 | Concentrated feed | 4 Kg / Day | Consumption | |||||||
| Live Cattle | Live-weight | 27 / Kg | 29 / Kg | 22,330 | Harvest of pasture | 3.5 MT / Mu | yield / Mu/year | |||||||
| Slaughterhouse | Service fee | 2200 / head | 5000 / head | 5,000 | Average weight /cattle | 500 kg / head | 15 to 16 months old | |||||||
| Meats | 423 Kg | 65 / Kg | 78 / Kg | 32,995 | Average weight /cattle | 770 Kg / head | 20 to 22 months old | |||||||
| Bones | 116 Kg | Nil | 60 / Kg | 6,960 | Average weight gain | 1.5 Kg / day | Fattening period | |||||||
| Value added Beef products | 42 Kg | 78 / Kg | 156 / Kg | 6,552
| Meat recovery rate | 55% | 423 Kg / head | |||||||
| Government Subsidy | 1 head | 1,000 | Bone weight | 25% | 116 Kg / head | |||||||||
| Total Revenue | 81,347 | Value added product | 10% | 42 Kg / head | ||||||||||
| As primary producer, SJAP’s revenue generated from one head of cattle | = RMB 29,940. |
| As a value added processor, SJAP’s added revenue generated from one head of cattle | = RMB 51,507. |
| Total Revenue Generated from one head of cattle | = RMB 81,347. |
Overall, SJAP expects that revenues from operations will multiply and increase rapidly as a result of the addition of further herds, and of comprehensive value added processing and marketing facilities. SJAP sells its organic fertilizer and bulk livestock feed mainly to its corporativecooperative and regional farmers in addition to using it to rear its own grown cattle, but because its geographic location is so far away from other major provinces there are high costs associated with selling its fertilizer, bulk livestock feed and live cattle other than to local purchasers; conversely,purchasers. Conversely, equivalent imports from other provinces must be madepurchased at a higher cost, which providesproviding SJAP with a competitive edge. Further,Furthermore, Qinghai Province is a region rearing a million headmillions of cattle and sheep per year, providing an ample market for SJAP’s fertilizer and livestock feed.
Our strategy includes building and owning our own abattoir and boning room in 2013 and the value added processing facilities in 2014, meaning that the distribution of our value added beef products to other provinces and main cities will become feasible as we improve our economies of scale to mitigate cost of transportation being charged on net meat weight instead of live cattle weight, and also exploit the lower production cost and leverage of our fully integrated operation and benefit from high sale prices due to its higher meat quality.
SJAP is making progress with the required merit credentials in China to become a certified China Dragon Head Business, which is a prestigious certification granted by the Government to businesses demonstrating corporate social responsibility (“CSR”) by 2014, frequently leading to additional governmental grants and other forms of assistance. Qinghai Province has bigger numbers of ethnic minorities receiving proportionately higher grants, incentives, assistances and subsidies from the Government, and SJAP has been well supported by the Government due to our CSR. In line with the focus on food security and managing the imbalance between rural (i.e., agrarian) and urban communities, this development will only enhance SIAF’s niche market position.
In the longer term, we believe that wholesale prices of SJAP’s fertilizer and bulk livestock feed will maintain a steady growth rate of 5% to 10% per annum influenced mainly by rising labor cost of the country. Further,Furthermore, we expect a trend of continuous increases in beef and cattle prices given the increase in demand for quality beef and beef products (including value-added products) in tandem with the rise of living standards in China, the short supply of quality breeding stock that will be required to produce enough cattle to satisfy the increased demand, and the Government’s stringent restrictions placed on imported cattle and beef meat from many developed nations due to disease and quarantine control measures, all of which will influence the price rise in cattle and beef meats in China.
In 2012, we have seen the wholesale prices ramp up from an average of RMB 16/Kg for live cattle and RMB 36/Kg for beef meat in January 2012 to an average of RMB 32/Kg of live cattle and RMB 55/Kg of beef meat at the end of February 2013, representing a rise of 100% in live cattle and 53% in beef meat prices. We do not expect prices to rise continuously at such a rate, but it is reasonable to assume rate increases to be between 10% to 15% per year for the next three years.The table below shows SJAP’s targeted production:
Progress reports:
Additional revenues are being generated from our newly built Concentrated Livestock Feed (“CLF”) factory. This factory is designed with an annual production capacity up to 60,000 MT, and it had produced and sold over 10,000 MT of CLF at an average price of RMB 2,600/MT (or US$419/MT) for the period of six months ended June 30,2013.
| Revenue Component | 2014 | 2015 | ||
| Organic Fertilizer | 30,000 MT | 20,000 MT | ||
| Bulk Livestock Feed | 60,000 MT | 75,000 MT | ||
| Concentrated Feed | 30,000 MT | 40,000 MT | ||
| Live cattle | ||||
| • from our farms | 6,000 heads | 9,000 heads | ||
| • cooperative growers | 6,000 heads | 9,000 heads | ||
| Slaughterhouse | ||||
| • Cattle | 10,000 heads | 3,000 heads | ||
| • Sheep | 200 heads | 10,000 heads | ||
| Deboning meats (our farms) | 500 MT | 1,500 MT | ||
| Deboning meats (imported) | 500 MT | 2,500 MT | ||
| Deboning Bones | 800 MT | 2,250 MT | ||
| Meat Products | None | 500 MT |
Work on the construction of all 29 cattle housesNote: Sheep are raised by our cooperative growers and related facilities is progressing and targeted for completion during 2013 (from our present 12 cattle houses) that will have the capacity to house up to 2,500/3,000 heads of cattle at any one time. Collectively, these cattle houses will be able to rear up to 6,000 heads of marketable sized cattle annually (estimated at average weight of about 750/800 Kg per head) based on a six months rotational stocking and sales program growing from cattle averaged at 350/400 Kg per head. SJAP’s intention is to lease part of the cattle houses to the corporative growers to grow their own cattle, with SJAP supplying them with feed and associated services in veterinary, management and marketing of their grown cattle. Apart from this cattle house operation, SJAP will continue to promote its concept of the corporative growers in tandem with the increase of productivity of its livestock feed.
We cultivate an additional 1,500 acres of land, for a total over 6,500 acres of land that will be harvested in 2013. All of this land was granted rent-free to SJAP by the local government.
We saw an increase in demand for our organic fertilizer this year resulting in doubling shift work at SJAP’s fertilizer factory since mid-February to meet the sales of 30,000 MT for 2013.
SJAP received a business permit from the Chinese authorities on April 17, 2013, and construction commenced on April 21, 2013 on the abattoir, de-boning factory, and related packaging facility. Since it is rare and difficult to obtain a permit for an abattoir facility in China, having this facility is expected to become a very valuable asset.regional farmers.
The constructionaverage of our enzyme factorycattle prices in fiscal year 2013, live cattle wholesale prices are RMB29 per Kg live weight for 2 to 3 years old beef cattle, representing a steady increase of 5 to 8% over fiscal year 2012. However, prices increased sharply for beef cattle below one year old (priced between RMB32 to RMB34 per Kg live weight) representing a strong increase of over 12% between year 2012 to 2013. This indicates that there is targeted to start during the third quarter of 2013 and the construction of a Mash Gas station is targeted to start during the fourth quarter of 2013.These are essential supporting activities to recycle ourgreater demand for young cattle wastes to be appliedreared into mature cattle as raw materialsthe mature cattle market is becoming more stable and profitable. Current beef meat (in general, grade equivalent to meats de-boned from 2 to 3 year old beef cattle) sells at wholesale between RMB80 to RMB92 per Kg, depending on quality specifications, for the manufacturing of our organic fertilizerlocally produced meats that have been food safety certified and to further extend our Corporate Social Responsibility to provide free electricity to the regional district within close proximity to our existing complex. In this respect, the Government agreed to provide a grant of up to US$2 million to cover part of the development cost of the Mash Gas Station.processed by food safety regulated slaughterhouses and deboning facilities.
| - |
Pictures showingPhotos of SJAP’s operationOperation and complexComplex:
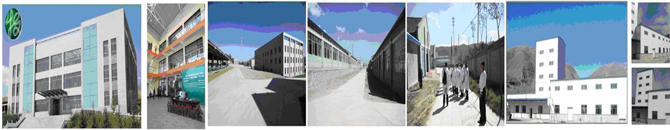

| - 124 - |

| - 125 - |
On October 28, 2013, SJAP’s nomination to apply merit credentials as a certified Dragon Head Business in China was approved by Government Authorities. “Dragon Head Enterprise” is a prestigious certification granted by the Government to businesses that demonstrate corporate social responsibility (“CSR”), pioneering and leadership in business using high standards of quality and services. Dragon Head status frequently leads to additional governmental grants and other assistance. Qinghai Province has larger numbers of ethnic minorities who receive proportionately higher grants, incentives, assistance and subsidies from the Government. SJAP has been well supported by the Government due to our CSR, and we expect to receive even greater Government support since approval of our Dragon Head Enterprise status.
The Corporate office building, the Cattle Station and the concentrated livestock feed manufacturing factory 
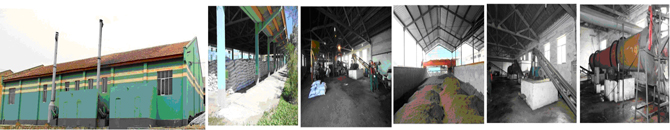
The organic fertilizer factory
| - 126 - |
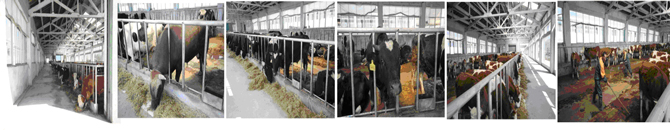

The cattle houses -we now have over 12 cattle houses with each to house over 150 heads with more cattle houses being built
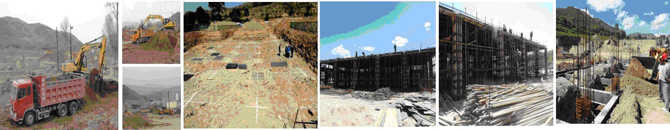
Construction site and construction in progress of the slaughter house and deboning factory as at July30, 2013
The “Bull” restaurant next to our Cattle Station.
3.2 Operation 2. Operation 2, is operated in Linli District, Hunan Province, is run by Hunan Shenghua A Power Agriculture Co. Ltd. China (“HSA”), a 76%owned subsidiary. As of the date of this prospectus, HSA conducts the following business activities, both of which are in the development stage: (i) manufacturing and sales of organic and mixed fertilizer, and (ii) cultivation of pastures and crops in preparation for the establishment of beef cattle farm.
| · | manufacturing and sales of organic and mixed fertilizer, and | |
| · | cultivation of pastures and crops in preparation for the establishment of beef cattle farms. |
By January 2013, its first organic fertilizer production plant was established and started its production of organic fertilizer. On March 5, 2013, HSA secured the rights to use an enzyme developed by a Hong Kong company some twenty years ago that has been utilized by global manufacturers of organic fertilizer. Earlier in this document we describe the enzyme, which we call T1. The advantage of this particular enzyme is that when it is applied to our organic fertilizer it has the ability to convert part of the organic raw materials into potash and phosphate without having to add in chemically formulated potash and phosphate, such that our end fertilizer can be qualified as pure organic fertilizer made with 100% natural organic raw materials. With this pure organic fertilizer, HSA is in a position to fully explore the potential market for fish in farm lakes and thereby to attempt to align itself with the Government’sgovernment’s policy of encouraging lake fishLake Fish Farmers to use pure organic fertilizer instead of chemical fertilizers. In addition, cost savings from avoiding the use of chemical potash and phosphate will, in management’s belief, result in a better profit margin for the Company. Sales of pure organic fertilizer commenced duringat the fourth weekend of March,Q1 2013.
Currently, chemical fertilizers in the region are sold at wholesale between RMB 3,000 to 3,600/3,600 per MT depending upon their chemical composition, and our oldcompared to organic fertilizer from SJAP was soldselling at an average of RMB1,200RMB 1,200 to RMB1,300/RMB 1,300 per MT. Our new 100% pure organic fertilizer with up to 8% potash is currently being marketed between RMB 2,000 to RMB 2,200/2,200 per MT targeting to reach an average up to RMB2,600/RMB2,600 per MT such that its prices will be at the mid-range ofbetween organic and chemical fertilizer.
| - 127 - |
HSA is targetingtargeted to produce up to 30,000 MT of 100% pure organic fertilizer in 2013 under its newly completed production plant and facilities, aimingand aims to increase its capacity to about 90,000 MT/MT per year in stages by 2015, subject to its sales performance within the period. The main hardship related to selling fertilizer is the requirement to provide longer credit terms (sometimes up to 180 days) to our end buyers because these end users normally can afford to pay for them only after they sell their products; howeverproducts. Therefore, we assess creditworthiness of our prospective customers, and only consider the farmers who are assessed aswhom we deem creditworthy, by us and who plantfollow our requirements for planting their fields and follow our requirement to harvestharvesting crops each year are considered.year.
Development of HSA in Linli District, Hunan Province, follows SJAP’s business model. HSA is modeled like SJAP but it hassituated in a much better growing environment, being situated in a farming rich province that is next to the Guangdong Province andProvince. Thus, HSA benefits from cheaper logisticallogistics costs, being closerclose proximity to large markets, and having a more favorable climate (milder winters and longer summers compared toversus SJAP’s long and bitterly cold winters and short summers). However, financial support from the Government is more difficult to obtain due to there beingbecause more entities sharingshare the Government’s support provisions.
HSA had to endureendures both higher development costs and longer time to construct its facilities when compared to SJAP, whose property had 40 older (yet salvageable) buildings, which it has renovated to meet its needs.
Hunan Province is one of the biggest primary producing provinces of China with over 4four million primary producers producingthat grow rice, tea, tobacco, grapes, citrus, cotton, seedlings, sunflowers, herb plants and many varieties of cash crops and itcrops. Hunan also has a long standing history in lake aquaculture producing millions of tons of fish and other seafood annually (e.g., total primary production is over RMB450RMB 450 Billion, or about US$75 Billion)Billion, recorded in 2011 (asas announced by Hunan Province Agriculture Department).
Progress report :
At our newly built fertilizer factory, the 100% pure organic mixed fertilizer (“POMF”) is generating stable income and revenues aiming to reach its 2013 target of 30,000 MT. By the end of JuneSeptember 2013, HSA produced and sold more than 9,00012,000 MT of POMF at an average price above RMB 2,500/2,500 per MT (or US$403/403 per MT) collectively during the first sixnine months of 2013.
Work on the construction and development of aConstruction work to develop HSA’s cattle station commencedbegan in March 2012 with preparation work in progress being carried out on its general layout, cultivation and planting of crops and pasture onlayout. We cultivated 75 acres of our land, situated below the hill of the fertilizer factory, and we planted crops and pastures. The hill levelingbehind and cutting within the hill next toabove the fertilizer factory wheremust be leveled before the cattle houses willcan be built, which workbuilt. Leveling is presently in progress.underway.
Pictures showing HSA’s complex and operation
JHST, an SJVC that is 75%owned by MEIJI, is consolidated as a subsidiary, and is the owner and operator of theour Hylocereus Undatus Plantation (the “HU Plantation”)HU Plantation), which is situated at Enping City in Guangdong Province. Hylocereus Undatus is a cacti commonly referred to as Dragon Fruit. In 2012,2013, JHST contributed 9% and 10%9.2% of the Company’s revenue and 17% of our gross profit, respectively. The plantation was developedprofits. Developed in 2008, with revenues beingthe HU Plantation has generated revenue since year 2009. As of the date of this prospectus, JHST hasconducts two types of operations;operations: (i) growth and sales of flowers, and (ii) drying and value added processing and sales of HU flower products. Hylocereus Undatus is commonly referred to as Dragon Fruit plants.
The HU Plantation has been suffering from plant disease over the past two years, which resulted in a reduced yield of HU flowers. The Company tried to overcome this problem with various preventive trials in 2012 (such as green housing, replanting, change of fertilization program and anti-disease spraying from Malaysia, etc.) with few positive results. Although the overall harvest of 2012 was better than in 2011, it was still far below the harvest of 2010. In fact, the HU Plantation’s 2012 revenue and earnings were mainly supported by the sales of additional dried HU flowers processed from fresh HU flowers that were bought from regional growers. Since October 2012 after the harvesting a season of HU flowers, the Company has dedicated its effort to finding a viable solution to this disease problem, and by the end of February 2013, the Company believed that a solution was found. We started to implement the developments from March 2013 on the HU Plantation with the aim of rectifying the situation before the start of the new harvest season beginning in June 2013.
JHST cultivates 187 acres of Hylocereus Undatus or Dragon Fruit (cacti) flowers in Guangdong Province. Dragon Fruit flowerHU blooms for a very short period, sometimes only one night, and flowers must be 20 to 25 cm long when picked before they turn from green to white 20 to 25 cm long flowers, so they are by definitionwhite. HU is a fairly delicate crop. The harvestingHarvest season isruns from July through October.
Dragon FruitHU cacti take three years to reach maturity, though they will flower a little even in their first year, and can produce for as long as twenty years. JHST began planting in late 2007, and by 20132014 all of the plants are maturedmature plants (averaging over 4 years old)four years). To date, theThe product has beenis sold in the form of dried flowers which are used(used in health-related soups and teas,teas), and as fresh flowers that are consumed as vegetables in China.
Currently, freshFresh flowers are sold to regional wholesale and retail markets due to their short shelf life, whereaslife. Some are dried and packed; these flowers are sold after they are dried and packed to a few major wholesalers, who in turn distribute them to other wholesale and retail markets and export traders right through the winter and spring months (from October to June each year)June) in Guangdong Province. In this respect, itHU is a distinctly seasonal revenue product, asproduct: more than half of the division’sJHST’s revenues are recognized in the third quarter, and noquarter. No sales are made in the first quarter.
It wasWe originally forecastedforecast that by 2014, dried and pickled flowers would make up 96% of the division’s flower income as produce is diverted away from delicate fresh flowers. However, the planting ofIn 2013, we planted a special selenium-rich Chinese herb (called XueYingZi, and commonly referred to asor “Immortal Vegetable” in China), which is richChina, and Snowsakurako in selenium,Japan) among the HU Plants is expected to helphoping to prolong the shelf life of the fresh flowers from 2-3 days up to 12-14 days which will increaseand increasing the sales of fresh flowers that are delicious to eat as fresh vegetables and commonly accepted as quality gourmet vegetables.
We expect this improvement of shelf life of the HU flowers to gradually even out our sales of dried flowers and fresh flowers through the harvest season starting in late June to October of each year and leave our drying and processing facilities extra time to process more flowersflowers. This did not occur, so that we intendprocessed up to buy from other regional growers so as to increase our overall revenue from 2013 onwards. Beginning in June 2013, JHST will also add the sales of the Immortal Vegetables planted now, which we expect to harvest within two and half months followed by the replanting of two more crops in 2013 and thereafter 4 crops/year in subsequent years.
Given this progress of improvements, JHST is attempting to eliminate the factor of seasonality in revenue. The overall market situation for HU flowers is that demand is greater than supply due to the following reasons; (i) in Guangdong Province, HU Plants can only be grown commercially along certain districts where there were over 40,000 acres80% of HU Plantation back in 2005, but due to the growth of industrialization and modernization acreage is now less than 4,000 acres, and (ii) farm laborers are getting harder to find, coupled with the increase of cost of wages and salaries, the rapid rise of the land cost and the increase cost of farm developments, making it extremely difficult to start a large HU plantation. For these reasons we are anticipating prices ofas dried HU flowers to enjoy a steady rise at an average rate of 8 to 12% per year, which has been the trend since 2009.
Progress report
We expect a much improved performance in 2013.
Our organic Immortal Vegetable plants have properties that some believe induce good health. We have processed these into small gift packs - selling them as organic vegetables with leaves for tea and stems for soup. Laboratory test results show that each Kg of fresh Immortal Vegetables from our Q3 2013 harvest contains 0.58 gram of selenium, which adds value to their sales. Immortal Vegetables grown as trials over the 30 Mu field revitalization program has been carried out onproduced over 200 MT of crops (including roots) during this quarter, averaging about 6.7 MT per Mu from a density of about 1,700 plants per Mu —within our Q2 2013 estimates. In December 2013, we started trials to plant other cash crops in between the HU plantation since early March 2013Plants with certain work still in progress; on April 22, 2013, management reported seeing marked improvement in the field with healthy green everywhere as compared to last year’s concentrationaim of yellow colors.improving revenues covering all seasons.
| - |
Coupling this improvement to the HU plants and the extra revenues that will be generated from the “Immortal vegetables” being planted now, we are optimistic and targeting an increase of at least 25% in revenue on the plantation itself in 2013 (excluding flowers that will be brought from regional growers for drying and sales of dried flowers).
Construction of the expansion of the drying and packaging factory of the HU Plant division commence over the summer months after we had completed the field revitalization work. As of the date of this prospectus, we had built and started to use three new driers and basic infrastructural works around the site of the packaging factory are in progress expecting completion by the end of 2013.
Pictures showing the HU Plantation and Immortal vegetable farmThe Corporate (or SIAF) Division
By the fourth week of July, 2013, Immortal Vegetables (the Japanese name for Immortal Vegetables is “Snowsakurako”) are almost 1.6 meter tall and look good. We are now trying to pack these into small gift packs – selling them as organic vegetables. Latest laboratory test results showing each Kg of fresh Immortal Vegetables contains 0.58 gram of selenium should also add value to their sales. Upon close inspection, one can see there are Immortal Vegetables grown in between the HU Plants acting as a protector for the HU plants because the Immortal Vegetables have the ability to repel the diseases that live in the HU Plants. As such, the HU Plants are healthy looking and flowering nicely despite the fact that the region experienced more rain this year than last year, yet the HU Plants are still holding up well.
From the last quarter ofQ4 2012, the Company decided to generate the following business income to fund its shared services operations’ working capital annual budget:budget, as described in this section.
TheWe developed the Wholesale and Distribution Facilities development project including design, construction and project management of its business operation of a specialistspecialized modern beef wholesale and distribution center (Wholesale(“Wholesale Center 2)2”) for Guangzhou City NaWei tradingTrading Co. Ltd (“NWT”), an unrelated Chinese third party owned company situated at the Guangzhou City, LiWan District, New Wholesale Market. Work started in November 2012, and as of the date of this prospectus, weWe have completed a freezing room facility that has the capacity to store up to 150 MT of frozen food at -25 degrees Celsius with renovation and alteration work progressing onCelsius. We renovated other facilities (e.g., wholesale shop, packaging and processing facility, office, dry good storage and function room), with alterations on-going. Wholesale Center 2 is in operation.
We developed the Central Kitchen and related facilities project including design, construction, project management, and managing business operations for Guangzhou City Wangxiangcheng (“WXC”), an unrelated Chinese company, of a Central Kitchen, a Central Bakery, a fast food restaurant and three mobile food stores (“Central Facility 1”) situated adjacent to Wholesale Center 2. The construction work of the Central Kitchen is completed and the Central Facility 1 is in operation.
Restaurant development projects encompass design, construction, project management, and managing business operations for WXC. Six restaurants in and around Guangzhou are in varying stages of development, as follows:
Restaurant 1, at River South District, has operated since Q1 2012. In Q1 2014, we began alterations and renovations at Restaurant 1, to improve service efficiency and to add a steak house section. Restaurant (1) and the Steak House started operation from Q3 2014 and both are performing within target showing profits.
Restaurant 2, at the UU Park Complex in Tianhe District, has operated since Q3 2012.
Restaurant 3, at the Sporting Complex in Tianhe District, opened at the end of Q1 2013. The Company stopped operating Restaurant 3 in November 2013, due to our landlord’s failure to provide us a Fire Safety Permit. Lack of this permit prevents us from completing our business registration, and obtaining our own Fire Safety Permit. Operating without both permits is subject to heavy penalties in China. We are currently suing the Shopping Complex for contractual breach.
Restaurant 4, at Harbor City Shopping Center, has operated since October 31, 2013.
Construction and renovation work onRestaurant 5, at the center of Zhungzhen City (approximately a 35 minute drive from Guangzhou), is virtually complete. Operations of Restaurant 5 started on March 28, 2014.
Restaurant 6, at the Li Wan District and next to Wholesale Center 1, started renovation work in September 2013. We await approval of various permits, particularly the one for change of purpose (from wholesale market to food premise). Restaurant 6 in Zhongshan started operation late in December 2014.
When fully operational, these six restaurants will occupy a total gross area of 5,800 m2 (about 63,800 ft2) with seating capacity for 1,370 persons. In Q4 of 2013, we initiated the planning process to establish three additional smaller shops that will sell and cater specialized gourmet foods. We had hoped to begin operating the gourmet food shops in December 2014, but the permit issues described for Restaurant 6 delayed construction until Q2 2014. Restaurant 6 is the first of such shops starting operation late in December 2014.
| - |
Pictures belowThe following photos show the restaurants that we developedhave developed:

Restaurant (1) Restaurant (2) Restaurant (3) Restaurant (4)
In 2013, we also constructed a trading complex (the “Trading Center”) for the Import and Export trades of the Company at another building adjacent to Wholesale Centers 1 and 2. The Trading Center has imported frozen and fresh chilled and live seafood (i.e., cuttlefish, squid, prawns, salmon, crabs and eels) from Malaysia, Thailand, Russia and Madagascar and other local coastal fishing towns. The seafood was sold to Wholesale Center 1, which distributed and sold it into various reputable food chain outlets, wholesale market stores and supermarket chains in the Guangzhou City, Shanghai City as well as in the southern coastal towns of the Guangdong Province.
We expect to be appointed the turnkey solution provider given our current success on existing projects with our Chinese investor who owns the WXC’s development planGuangzhou City WangXiangCheng Enterprise Management Consulting Co. Ltd., or WXC. WXC intends to develop over 50 gourmet restaurants and fast food outlets collectively within 2three years (2013(2015 to 2014) and (via NWT) is planning on2017). We also expect to continue as the development ofturnkey solution provider for NWT to develop a number of modern health food department chains in the Guangzhou City during 2014 and 2015with2015. SIAF will act as its engineering consultant, management service provider, and marketer. As such, we expect SIAF’s business and engineering development division to be kept busy for the next 3three years. At the same time we are aimingaim to further develop our import and export trades, and the seafood value added trades in harmony with WXC’s and NWT’s developments to maintain our growth rates in the sales of fish, seafood and beef products toproducts. In this way, we gain momentum in materializing our business vision of vertically integrated operations.
Progress reports:The Consulting Services Agreement between WXC and the Company is outlined below.
The importPrincipal terms and export trading of SIAF:
During the first half year of 2013, we made good progress in the marketing and distribution channels having sold collectively over 50 x 40 ft. sea containers (approximately 1,000 MT) of imported frozen seafood including prawns (or shrimp), squids, octopus, and varieties of fish from Malaysia, Thailand, Norway and Vietnam and from local brokers and agents that were sold to Wholesale Center 1 for it to sell and distribute to various reputable clients in super market chains, central kitchen of restaurant chains and multiple number of seafood wholesale markets at someconditions of the populated centers.agreement:
We also discovered, during the first quarter of 2013, the potential of sourcing and importing good quality frozen seafood (mainly in fish) as well as in live seafood (including live Flower Pattern eels, mud-crabs and lobsters) from Madagascar that would provide good profit margins. We had tried a number of sample shipments (by air cargoes) with good success rates; as such we have sent personnel over to Madagascar to liaise with local suppliers and to investigate the situation a number of times already with the intention to send a permanent team of workers over there to set up packaging and related facilities to explore its potential fully.
| · | WXC is a restaurant owner and operator in China. SIAF is an engineering and management consultant with the know-how to develop business operations of catering and food services and the expertise to provide related services. | |
| · | The project development involves: | |
| · | the construction and business development of a Central Kitchen, a Central Bakery, a fast food restaurant, a Central Storage, a Central Reception Centre and associated facilities at a location in LiWan District, Guangzhou City; and | |
| · | 15 signature restaurants, 20 medium sized catering food shops, 30 small Mobile Food Stores, with associated services and training, at suitable locations in Guangzhou city. | |
| · | The project development will be carried out under various phases and sub-stages starting from October 1, 2012 and scheduled to be completed on or before September 30, 2015, at a total cost estimated at US$ 11.66 million. |
| - |
| · | WXC, as the developer, will be responsible to finance and pay for the project development. WXC will pay SIAF or SIAF’s designated agents for work done and provided by SIAF in accordance with the agreement. | |
| · | SIAF will be responsible to carry out and provide the services to the Developer, in accordance with scope of work of the agreement. |
As
Upon completion of the dateproject development and subject to the performance of this prospectus, wethe developed businesses, the parties agree to form an SJVC to acquire and to operate the project businesses based on its book value and upon the official formation of the SJVC SIAF will have established 4 collection centersthe right to acquire up to 75% equity in 3 major coastal villages (North, West and south coast) and at the city center of Madagascar and managedSJVC thus to import over 37 MT each of live crabs and Flower Pattern eels from Madagascarreimburse WXC for the quarter ended June 30, 2013.amount paid by WXC on the project development up to the time of the SJVC is formed officially.
The EngineeringImport and Consulting servicesExport Trading of SIAF:
We have imported and sold over twelve 40-foot sea containers of seafood from various countries (i.e., Russia, Malaysia, Thailand, Vietnam, Chile, etc.), Imports from Madagascar are impressive; we have imported over 500 MT of live seafood (including Mud crabs, flower pattern eels, and other variety of fish).
Summary of the major work carried out during fiscal year 2013:
As at the date of this prospectus, weWe believe that all development work carried out within the first halfduring fiscal year of 2013 demonstrated good progress including our own Trading Center (which is now operating although part of its finishing work is still in progress), Leonie Chain’s Central Kitchen (as reported above, 80% has been completed) and the central bakery has been in operation since May 2013, and we have 4 restaurants being completed with work in progress on 2 others. SJAP has completed more than 50% of its construction work on its slaughter house and deboning facilities, HST has completed its revitalization program of its HU Plantation (i.e., new irrigation systems with automatic sprinkle, replacing with organic soil, planting with Immortal Vegetables in between each roll of the HU plants, extension of staff quarters such that it has accommodation now for more than 40 workers at one time), planned 13 acres of Immortal Vegetable and built associated nursery, commencement of production from Prawn Farm 1, started operation of the Beijing Cattle Farm and wholesale shop, Prawn Farm 2 completed 3 prawn grow-out open dams with RAS systems and the successful breeding of fingerling of Big Giant Prawns from our 2nd generation breed stocks, the establishment of facilities in Madagascar and the successful production of the lake fish organic fertilizer. We viewincluding:
| • | Our own Trading Center is now operating (although finish work is on-going) |
| • | Leonie Chain’s Central Kitchen is 100% completed |
| • | The Central Bakery has operated since May 2013 |
| • | Four restaurants are completed, with renovation and alternation work in progress on Restaurant (1) and Restaurant (5) started business on March 28th 2014. |
| • | SJAP has completed all essential construction work on its slaughterhouse and deboning facilities and had a trial run of slaughtered and deboned 100 heads of cattle in November 2013 and the production of Marbled beef in March 2014. |
| • | JHST has completed the revitalization program of its HU Plantation (i.e., new irrigation systems with automatic sprinklers, replacing with organic soil, planting with immortal vegetables in between each row of the HU plants, extension of staff quarters with accommodation now for more than 40 workers at one time), planting 13 acres of Immortal Vegetables, and building associated nursery |
| • | Prawn Farm 1 commenced operation |
| • | The Beijing Cattle Farm and wholesale shop began operating |
| • | Prawn Farm 2 completed three prawn grow-out open dams with RAS systems and successfully bred fingerling of LawZi Prawns from our second and third generation brood stocks |
| • | We established facilities in Madagascar and in turn importing from Madagascar |
| • | HSA successfully produced the Lake Fish organic fertilizer. |
The Company views the foregoing developmentsaccomplishments as a giant step forwardmilestones toward building strong fundamentals for the Company’s future growth.
Consequently, we are seeing thesee our 5-year plan play out as envisioned. Particularly at the wholesale level in the fishery and beef divisions, economies of scale are being realized. And theThe benefits of vertical integration are being achieved gradually, most in evidence between the wholesale and distribution levels. These are enhancingenhance the Company'sCompany’s competitive position. We are beginning to see a multiplier effect generating core sustainable value and adding a layer of corporate maturity and operational reliability, reinforced by all financial metrics continuing to move positively.
Summary of Our Land AssetsINDUSTRY OVERVIEW
| Item | Owner | Location | Project | Area (acre) | Nature of Ownership | Tenure | Date Acquired | Expiry Date | ||||||||
| Hunan Lot 1 | Hunan Shenghua A Power Agriculture Co. Ltd. | Ouchi Village, Fenghuo Town, Linli County | Fertilizer production | 31.92 | Lease | 43 | 4-5-11 | 4-4-54 | ||||||||
| Hunan Lot 2 | Hunan Shenghua A Power Agriculture Co. Ltd. | Ouchi Village, Fenghuo Town, Linli County | Pasture growing | 247.05 | Management Rights | 60 | 7-18-11 | — | ||||||||
| Hunan Lot 3 | Hunan Shenghua A Power Agriculture Co. Ltd. | Ouchi Village, Fenghuo Town, Linli County | Fertilizer production | 8.24 | Land Usage Rights | 40 | 5-24-11 | 5-23-51 | ||||||||
| Guangdong Lot 1 | Jiangmen City Heng Sheng Tai Agriculture Development Co. Ltd. | Yane Village, Liangxi Town, Enping City | HU Plantation | 8.23 | Management Rights | 60 | 8-10-07 | — | ||||||||
| Guangdong Lot 2 | Jiangmen City Heng Sheng Tai Agriculture Development Co. Ltd. | Nandu Village of Yane Village, Liangxi Town, Enping City | HU Plantation | 27.78 | Management Rights | 60 | 3-14-07 | 3-13-67 | ||||||||
| Guangdong Lot 3 | Jiangmen City Heng Sheng Tai Agriculture Development Co. Ltd. | Nandu Village of Yane Village, Liangxi Town, Enping City | HU Plantation | 60.72 | Management Rights | 60 | 4-18-07 | — | ||||||||
| Guangdong Lot 4 | Jiangmen City Heng Sheng Tai Agriculture Development Co. Ltd. | Nandu Village of Yane Village, Liangxi Town, Enping City | HU Plantation | 54.68 | Management Rights | 60 | 9-1207 | — | ||||||||
| Guangdong Lot 5 | Jiangmen City Heng Sheng Tai Agriculture Development Co. Ltd. | Jishilu Village of Dawan Village, Juntang Town, Enping City | HU Plantation | 28.82 | Management Rights | 60 | 9-12-07 | — |
Economic Outlook for China
Over the course of the past four decades, China has displayed vigorous growth. In 2011, the Chinese economy, as measured by its gross domestic product (GDP), was almost 20 times larger in volume terms than it was in 1980. The agricultural sector, as measured by FAO’s net agricultural output index grew by 4.5 times over the same period. The rapid growth in both national income and agricultural output has contributed to substantially higher national food availability and much improved access to food. The details surrounding such success has many dimensions, including a changing policy environment, increased national investments, and improved factor productivity, all amid a rapidly changing rural, demographic and economic landscape, regional differences but also critically rising land and water constraints.1
The OECD projects strong GDP growth to gradually slow over the next ten years from the current 8% range toward 6%.5 This still means that per capita income in China will more than double over the next decade, with an impact on domestic demand for food, particularly for those foods with higher income sensitivity. While China’s Engel coefficient has declined as income has risen, and will decline much further in the next decade, it indicates a considerable impact for food demand, especially if income growth is passed down to the lower income population.
1OECD-FAO Agricultural Outlook 2013 [Chapter 2 Feeding China: Prospects and Challenges in the Next Decade, page 52]
| - |
| Guangdong Lot 6 | Jiangmen City Heng Sheng Tai Agriculture Development Co. Ltd. | Liankai Village of Niujiang Town, Enping City | Fish Farm, HU Plantation | 31.84 | Management Rights | 60 | 1-1-08 | 12-31-68 | ||||||||
| Guangdong Lot 7 | Jiangmen City Heng Sheng Tai Agriculture Development Co. Ltd. | Nandu Village of Yane Village, Liangxi Town, Enping City | HU Plantation | 41.18 | Management Rights | 26 | 1-1-11 | 12-31-37 | ||||||||
| Guangdong Lot 8 | Jiangmen City Heng Sheng Tai Agriculture Development Co. Ltd. | Shangchong Village of Yane Village, Liangxi Town, Enping City | HU Plantation | 11.28 | Management Rights | 26 | 1-1-11 | 12-31-37 | ||||||||
| Guangdong Lot 9 | Jiangmen City Hang Mei Cattle Farm Development Co. Ltd. | Xiaoban Village of Yane Village, Liangxi Town, Enping City | Cattle Farm | 41.18 | Management Rights | 20 | 4-1-11 | 12-31-31 | ||||||||
| Qinghai Lot 1 | Qinghai Sanjiang A Power Agriculture Co. Ltd. | No. 498, Bei Da Road, Chengguan Town of Huangyuan County, Xining City, Qinghai Province | Cattle farm, fertilizer & livestock feed production | 21.09 | Land Usage Rights & Building ownership | 40 | 11-1-11 | 10-30-51 | ||||||||
Guangdong Lot 10
| Jiangmen City Heng Sheng Tai Agriculture Development Co. Ltd. | Niu Jiang Town Enping City, | HU Plantation Processing factory | 6.27 | Management Right Lease | 10 | 4-1-13 | 4-1-23 | ||||||||
| Total | 620.28 | |||||||||||||||
As far as “ownership”On the demand side, population growth will continue, albeit at a slower rate of land is concerned,0.3% p.a. compared to 0.5% p.a. in general all land is owned by the Government. Whereaspast decade. The rapid increase in urban areas,population will continue to impact on food demand patterns. While the landUN projects a total population increase of some 38 million people (to 1.392 billion by 2022), urban population may increase by 138 million over this period. In 2011, the average net income of urban dwellers was almost three times that of rural dwellers. Not only does food consumption appear higher in urban contexts, which are associated with higher incomes, consumption of meat and dairy and fish products are also much higher. These demographic trends will support changes in diet structure, implying growth in the demand for feed grain and protein meal. They also place higher demand for modern and efficient food marketing chains that establish quality and safety regimes that must be met by supply chains reaching down to the primary sector. Nevertheless, as measured by current data on apparent consumption, consumption of both meat and fish in China on a per capita basis is owned directly bysimilar to many OECD countries and an appropriate issue is how much the central Government in rural and suburban areas,composition of protein intake will change over the land (agricultural land) is owned by the local village collectives, usually through the villagers’ collective economic organization or the village committees. Uncultivated land in mountain and other remote areas is also Government-owned. Corporate entities and individuals may own the property (building) erected on Government land.coming decade.2
As such, any transferrable rights to the land are in the form of usufructuary rights (i.e., the right to use and enjoy the benefits derived therefrom for a period of time).
There are several types of usufructuary rights. These include the right to land contractual management (granted by local village collectives for agriculture land), the right to use of construction land (state land in urban areas), etc. The right to land contractual management allows a party the right to possess, utilize, and obtain profits from agricultural land. This right is transferrable, but this land use right is based on agricultural household contracts and cannot be changed arbitrarily to non-agricultural purposes.
A usufructuary right properly granted in accordance with the laws may be transferred, leased, or mortgaged in accordance with the laws and the terms of the land-grant contract.
1. A lease confers on the recipient the same right to use and enjoy the benefits except for the right to own the building erected by the recipient and the right to transfer. In case of government acquisition of the land, the compensation paid by the government for the building will go to the lessor, unless the lease agreement states otherwise.
The Agreement for the 109.79MU land of HSA is stated to be a lease agreement but the terms therein seem to suggest that HSA is being granted a Management Right.
2 & 3. Land Use Rights and Management Rights confer the same right to use and enjoy the benefits. “Land Use Right” is one granted by the State and usually used in the context of urban land, whereas “Management Right” is granted by local village collectives and the term is usually used in respect of rural land.
4. The term Land Use Right relates to the right to use the land and enjoy the benefits derived there from, whereas Building Ownership Right relates to the right to ownership of the building erected on the land concerned.
SJAP was granted a Land Use Right by the State for the land (state-owned land), and a Building Ownership Right for the buildings erected thereon.
SIAF's Group of Companies - Rented Premises Profiles
INDUSTRY OVERVIEW
Economic outlook China
China’s economy is at present second only to that of the United States (third, if the European Union is counted as one economy), having overtaken Japan’s role as number two in 2010.1 The OECD expects that China’s real GDP will grow by 8.5% in 2013 and by 8.9% in 2014.2 The IMF expects that China will be the worlds’ largest economy in 2017 with 18.3% of the world economy. The USA’s sharegrowth is expected to fallmoderate to 17.9%around 7.7% in 2014-18 (compared to 10.5% during 2000 and 2007), as the country rebalances its growth model towards growth driven by 2017.domestic consumption. Implementation of structural reforms will also be a critical factor in driving the Chinese economy towards sustainable development and growing beyond the middle-income trap.3
The strongGDP growth for 2013 continued at more moderate growth levels as the economy is shifting its growth model. Key indicators for 2013 show overall stable macroeconomic conditions and an anticipated slight slowdown in growth for most of the indicators. In sum, economic growth in China has delivered major improvements2013 stabilized at similar levels to 2012. As a sign of China’s economic transformation, 2013 marked the first year that the tertiary sector accounted for the largest share of GDP. Following the government’s announcement of bold reform plans, 2014 will indicate how the government aims to implement its new economic policies. Strengthening the role of markets will take time to implement with significant results unlikely to be noticeable in living standardsthe short-term. Reforming the Chinese economy and poverty has been reduced dramatically.4 Based onshifting the World Bank’s classification, China recently graduated from lower to upper middle-income status. A growing emphasis on improving access to healthtoward quality and education as well as highefficiency will be accompanied by a structural slowdown with policy experimentation taking place in areas including investment, in infrastructure have helped spread the benefits of growth nationally including in rural areas, where incomes have enjoyed consistently strong gains. Recent OECD simulations suggest that China could maintain high, though gradually easing, growth during the current decade, averaging 8% in per capita terms.international trade, land rights, and pricing mechanisms.
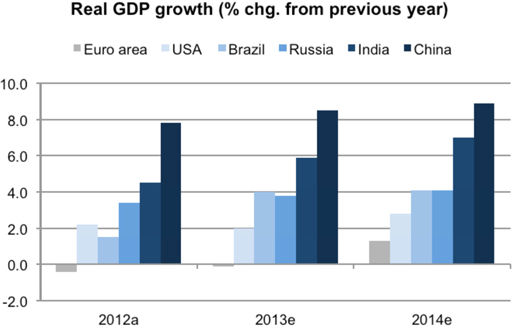
Source: OECD Economic Outlook No. 92 (database)/OECD economic surveys: China 2013
| Time Period | Low and middle income countries | China | High-income countries | United States | ||||||||||||
| 1990-2000 | 3.3 | 10.4 | 2.7 | 3.4 | ||||||||||||
| 2000-2010 | 5.9 | 10.5 | 1.6 | 1.7 | ||||||||||||
| 2010-2020 a | 5.6-7.4 | 7.4-10.1 | 2.0-3.1 | 2.3-3.5 | ||||||||||||
| 2020-2030 a | 4.2-6.6 | 4.2-7.8 | 1.3-2.7 | 1.5-3.0 | ||||||||||||
Average annual per capita GDP growth Source: OECD Economic Outlook No. 92 (database)/OECD economic surveys: China 2013 | ||||||||||||||||
| 1990-2000 | 1.6 | 9.3 | 2.0 | 2.3 | ||||||||||||
| 2000-2010 | 4.6 | 9.8 | 1.0 | 0.7 | ||||||||||||
| 2010-2020 a | 4.4-6.1 | 6.8-9.5 | 1.6-2.6 | 1.5-2.7 | ||||||||||||
| 2020-2030 a | 3.4 | 3.9-7.6 | 1.1-2.4 | 0.9-2.4 | ||||||||||||
Source: World Bank calculations using Envisage Model.
a. The lower and upper bounds reflect average growth rates in the low-growth and high-growth scenarios.
1 The World Bank; China 2030, Building a Modern, Harmonious, and Creative Society [pages 3, 376-377], 2013
2 OECD Economic Outlook No. 92 (database)/OECD economic surveys: China 2013
3 IMF, October 2012
4 The World Bank; China 2030, Building a Modern, Harmonious, and Creative Society, 2013 [pages 3, 376-377]
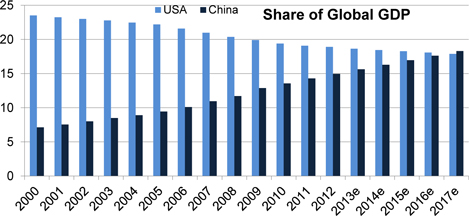
Source: IMF, October 2012
The share of the population aged 20 to 64 in the total population is expected to peak soon, according to the OECD, and the elderly dependency ratio will continue to rise, exerting downward pressure on saving rates. Agricultural employment has been falling for a decade at an average rate of 3.5% annually, with massive migration from the countryside to cities. Continuing migration of workers out of agriculture is expected to help boost farming profitability, leading to further gains from more mechanization. In addition, some consolidation of farms into bigger units may occur provided that the laws governing the ownership of rural land-use rights are changed to allow the sale of use-rights and favor the rental market for agricultural land, according to the OECD.5
Agriculture in China
China is the world’s largest agricultural economy. It is the leading producer of many agricultural commodities such as pork, horticultural products, rice, and cotton andcotton. It is also the largest consumer of many agricultural products, such as pork, rice and soybeans. While China generally has been successful in meeting its rapidly rising demand for food and fiber by increasing domestic production, it has emerged as a leading global importer of several agricultural commodities, including cotton, soybeans, vegetable oils, and animal hides. As its domestic agricultural production has grown, China has also become the largest exporter in global markets for several horticultural products, including mandarin oranges, apples, apple juice, and garlic, and other vegetables.
China’s increasingly important position in global agricultural markets followed decades of gradual growth in domestic food production and consumption. After the introduction of market-based reforms in 1978 that included the elimination of the collective production system and relaxation of government direction over certain farming production and marketing decisions, Chinese agricultural output grew significantly. Between 1978 and 2008, China almost doubled its production of grains (rice, wheat, and corn) and quadrupled its production of meats; production of fruit and milk was about 30 times greater in 2008 than in 1978. During these three decades, population growth of about 1% annually, coupled with annual per capita income growth of 8%, fueled a large increase in demand for more and higher-value agricultural products, especially by China’s large and growing middle class. China’s rapid growth in food consumption was largely met by domestic production growth, enabling it to remain self-sufficient in most major commodities. About 40% of China’s population of 1.3 billion is employed in the agricultural sector, and agriculture contributes about 11% to China’s GDP.65
According to OECD, China’s contribution of scientific and technological progress in 2012 to growth in agriculture has reached 54.5%, doubling from 27% in the beginning of rural reform. Accordingly, OECD projects China should maintain its leading role in global fisheries as its aquaculture as production continues to increase, albeit at half the rate of the previous decade. China is expected to account for 63% of global aquaculture production in 2022 and remain one of the world’s leading fish exporters.
China’s supportSupport for agricultureAgriculture
Traditionally, China’s government support for agriculture iswas low compared to that of developed countries, such as the United States and the member states of the European Union, but in line with that of other rapidly growing economies, according to the United States International Trade Administration, or the USITC. As measured by the OECD’s PSE,76 the amount of support provided to Chinese farmers was low (and sometimes negative) during the 1990’s, but gradually rose to 9% in 2007. Compared with other countries at a similar level of development, including Brazil, Mexico, Russia, and South Africa, China’s support for farmers falls in the middle of the range. China’s PSE reflects changes in the central government’s policy priorities from grain self-sufficiency and low consumer prices toward a stronger focus on raising farm household incomes, according to the USITC.
2 OECD-FAO Agricultural Outlook 2013 [Chapter 2 Feeding China: Prospects and Challenges in the Next Decade, page 52]
3 OECD Economic Outlook for Southeast Asia, China and India 2014 Pocket Edition [page 3]
4ChinaEconomic Outlook 2014, German Chamber of Commerce in China [pages 1-2]
5 OECD Economic Surveys China, March 2013 [Pages 20-21]
6 USITC: China’s Agricultural Trade: Competitive Conditions and Effects on U.S. Exports, March 2011 [pages 1-1 and1-8]
76OECD: PSE is defined as the estimated monetary value of transfers from consumers and taxpayers to farmers, expressed as a percentage of gross farm receipts (defined as the value of total farm production at farm gate prices), plus budgetary supportsupport.
| - |
GovernmentHowever, more recently, government support to China’s agricultural sector indicates that Chinese policymakers are placing a renewed emphasis on the rural economy. Indirect support, in the form of general services, is very high relative to similar support programs in other countries, due largely to investments in agricultural infrastructure. General services include modern research and extension services, food safety agencies, and agricultural price information services, most of which provide benefits to producers and consumers throughout the economy. Compared with direct payments to farmers, general services support is less production-distorting to the sector.
China’s medium term policy priorities are enunciated in its12th Five-Year Plan for National Economic and Social Development of the People’s Republic of China (2011-2015) and supplemented by itsNational Modern Agriculture Development Plan.
The Plan (2011-2015) strives to solve the “Sannong” issues: agriculture, rural community, and farmers. These priorities focus on the following areas:
| · | Safeguard national grain security, transform agricultural development, and improve agricultural production capacity. | |
| · | Increase farmers’ income and living standards, narrowing the gap of living standards between urban and rural areas. | |
| · | Ensure food quality and safety. | |
| · | Protect agricultural resources and promote environmental sustainability. | |
| · | The Plan strives for general self-sufficiency in food production: | |
| · | Per capita annual net income of rural residents will grow more than 7% and the impoverished population will be significantly reduced. | |
| · | Improve resource utilization and land productivity, strengthen risk prevention and emergency management capacity development. | |
| · | The main measures taken by the government will focus on the following: | |
| · | Strengthen agricultural development and institutional reform. | |
| · | Enhance policy support and protection for agriculture. | |
| · | Promote the opening-up of agricultural markets. | |
| · | Improve and develop the legal system supporting the agriculture and food |
Agricultural consumptionConsumption
China is a major global consumer of agricultural products. It consumes one-third of the world’s rice, one-fourth of all corn, and one-half of all pork and cotton, and it is the largest consumer of oilseeds and most edible oils. The traditional Chinese diet centers around staple foods (mainly grains and starches), which account for nearly one-half of the daily caloric intake. Average Chinese per capita consumption recently stabilized at approximately 3,000 calories per day, one of the highest levels among Asian countries.
Chinese food consumption is influenced by factors such as population size and demographics, income, food prices, and general preferences. Per capita income growth and urbanization are the two factors most responsible for altering recent consumption patterns in China. Rising income translates into higher per capita food consumption, while increasing urbanization is driving diversification of food choices because of greater availability and choice offered through increasingly diverse sales outlets.
The UN projects China’s urban population to increase by 138 million by 2022.
Chinese consumers generally fall into one of three categories: rural consumers; urban low-income consumers; or urban high-income consumers. Although urban high-income consumers can afford to buy more and better-quality food, the ubiquity of food outlets in cities means that nearly every urban resident, regardless of income, has availablesees an increasingly diverse food selection. Compared to rural diets, urban diets contain less grain and more non staplenon-staple items, including processed and convenience foods. Rural migrants to cities tend to adopt the urban diet.
ExpenditureAccording to OECD, livestock, both the meat and dairy sectors, will continue to expand, with increasing feed requirements which will result in higher imports of coarse grains, likely beyond the current tariff quota levels. China is expected to become the world’s leading consumer of pig meat (pork) on fooda per capita basis, surpassing the European Union by 2022.
Food Expenditures
Food is the largest class of household expenditure for all Chinese income groups; even housing takes a smaller share of average household income, according to the USITC. As income rises, the absolute amount of food expenditure increases, although the share of income spent on food falls. Urban residents spend substantially more on food than their rural counterparts, according to the USITC. Higher incomes lead to an increase in both the quantity and quality of food demanded.
| - 133 - |
However, while demand for higher quantities of food appears to level off in the top income households, demand for higher-quality foods continues to rise with income spending on food consumed outside the home being on the rise. In 2003, about 18% of urban household food expenditures and over 11% of rural household food expenditures were made outside the home. In 2008, the average per capita annual expenditure on dining out was $127 among urban residents, up 26% from a year earlier. Per capita expenditures on food consumed away from home vary among regions, with Shanghai spending the most ($300) and Tibet the least ($84). Most such expenditures are made in restaurants, both independent establishments and fast-food chains. Although consumption away from the household is increasing, most foods are still eaten at home. The exception is meat, with about half of all meat consumed outside the home.
Food preferencesPreferences
Along with more varied consumption, higher incomes are leadinglead to changing food preferences, including demand for better quality and safer foods. Food preferences determine where urban Chinese purchase their food, whether it be at local “wet markets,” urban supermarkets, or restaurants. Chinese value the diversity in food products that different shopping outlets offer. In the future, analysts predict that further income growth and urbanization will continue to increase demand for a variety of higher quality foods, according to the USITC.
Like that ofAs in other developing countries, at similar stages of development, the traditional Chinese diet in China comprises mostly grains and other starches. Consumption of non-staple, higher-value foods such as pork meat, (especially pork), dairy, fruits, vegetables, and processed food has grown significantly in the past three decades; 30% of the food currently consumed in China has been processed in some way, according to the USITC.
China’s per capita expenditures for animal proteins forin 2008 averaged $184, up from $137 in the previous year.2007. The Chinese consume about four times as much pork as poultry, the second most popular animal protein. Pork consumption has been encouraged by improved cold storage distribution asthat transports the product can be transportedmeat greater distances to reach more customers. Pork consumption levels are also is high due to government support programs, including purchasing pork for reserves and occasionally subsidizing pork purchases for low-income consumers.
Food quality and food safety are important factors affecting Chinese food preferences. High-incomeHigh income urban groups that focus their expenditurespending on high-quality products also seek assurance that their food is safe. Safety concerns can determine where certain foods are bought: fresh produce is usually purchased at a wet market becauseas fresher produce is perceived to be safer, while meats are increasingly bought at a supermarket because of the availability of cold storage.7
Aquaculture
A new World Bank report estimates that in 2030, 62% of the seafood we eat will be farmed, to meet growing demand from regions such as Asia, where roughly 70% of fish will be consumed. China will produce 37% of the world’s fish, while consuming 38% of world’s food fish.
As the global population approaches nine billion by 2050, there will be a need for more food and jobs. A growing aquaculture industry can meet these needs, as it operates responsibly. Risks and environmental impacts of some aquaculture practices have made headlines of late. Disease outbreaks in shrimp aquaculture in China, Thailand and Vietnam, and in salmon farming in Chile illustrate some of the industry’s challenges. Aquaculture presents countries with an opportunity to improve sustainable and environmentally responsible fish farming.
“We continue to see excessive and irresponsible harvesting in capture fisheries, and in aquaculture, disease outbreaks, among other things, have heavily impacted production,” says Juergen Voegele, Director of Agriculture and Environmental Services at the World Bank. “There is a major opportunity for developing countries that are prepared to invest in better fisheries management and environmentally sustainable aquaculture.”
“Aquaculture will be an essential part of the solution to global food security. We expect the aquaculture industry to improve its practices in line with expectations from the market for sustainable and responsibly produced seafood,” says Jim Anderson,8 Bank Advisor on Fisheries, Aquaculture and Oceans and co-author of the report.
The marketMarket for aquatic and aquacultureSeafood in China
The information in this section, regarding aquatic and aquaculture, including graphs, is taken from the USDA’s GAIN Report Number:Number CH12073 per 12/28/of December 28, 2012 unless otherwise stated.9
Total Aquatic Products Production
China has the world’s largest aquatic production andproduction. By 2010, its market share hashad risen to 35% from 7% in 1961 to 35% by 2010.1961.10Total 2012 aquatic production in China is estimated to increase four percent over last year to reach 58 million tons, compared to the 56 million tons in 2011 and 53.7 million tons in 2010, according to the USDA. Fish production accounts for 59% of the total aquatic production, followed by shellfish and crustaceans at 22.6% and 10%, respectively. Fish production is, according to the USDA, expected to continue its upward growth trend to reach 34.5 million tons in 2012, up from 33 million tons in 2011 and 31.3 million tons in 2010.
7USITC: China’s Agricultural Trade: Competitive Conditions and Effects on U.S. Exports, March 2011.
8 Fish to 2030: Prospects for Fisheries and Aquaculture. World Bank Report No. 83177-GLB, December 1, 2013
9 Definition of terms: China’s definition of aquatic products includes both cultured (farm-raised) and wild caught products; aquatic products include fish, shrimp/prawn/crab, shellfish, algae, and other. Aquatic catch production is total volume of both fresh and seawater wild caught aquatic products; Aquaculture production is the total volume of both fresh and seawater cultured (farmed) aquatic products. This report uses Chinese terminology to maintain consistency between Chinese statistics and product categories. Total aquatic trade statistics below do not include fishmeal.
10 The State of World Fisheries and Aquaculture 2012, FAO
| - 134 - |
In 2011, Shandong, Guangdong, Fujian and Zhejiang provinces profited from favorable coastal locations and abundant freshwater resources/facilities to rank as the top four aquatic production areas. In terms of freshwater cultured production, Hubei, Guangdong, and Jiangsu provinces are the largest producers. These rankings are expected to remain unchanged in 2012, according to the USDA.
China has a long history of aquaculture but large-scale production only began after the founding of the People's Republic of China in 1949. More recently, after China opened up to the outside world in the 1980's, the sector has been growing dramatically, becoming one of the fastest growing sectors among the agriculture industries in China.11
China remains the world largest aquaculture producer with total cultured aquatic production accounting for about 70% of the world total, in recent years, based on industry sources. Total aquaculture water area reached 7.83 million hectares (MHa) in 2011 from 7.65 MHa in the previous year,2010, with the majority (164,000 Ha) expansion in freshwater facilities. While the majority of cultured facilities are fresh water due to available natural resources, growth in seawater facilities has outpaced that of freshwater facilities over the past four years, rising 33% between 2008 and 2011, compared to 15% for freshwater. Aquaculture area growth slowinghas slowed overall, investment in facility expansion is slowing, with 2011’s 2.5% expansion cooling significantly from 2009’s 14% expansion. Government officials relate that environmental concerns and the rapid industrialization/urbanization of China’s coastal region are hampering further aquaculture expansion.
AquacultureAccording to the USDA, aquaculture fish production dominates the sector with a total production of 22.8 million tons, accounting for 69% of total fish production in 2011. Carp remains the most popular cultured freshwater fish with total production of 15.6 million tons in 2011 (up from 15.1 million tons in 2010), accounting for 72% of total freshwater cultured fish production, according to the USDA.fish.
Cultured freshwater and seawater shrimp and prawn are produced primarily in Guangdong, Jiangsu, Hubei, Zhejiang and Guangxi provinces. In 2011, Guangdong led shrimp production with total cultured production of 609,207 tons, compared to 554,000 tons in 2010. Eel production is concentrated in Fujian, Guangdong, and Jiangxi provinces, and much of the production is destined for the Japanese market.
Aquatic consumptionConsumption
As China’s processing and distribution systems become more developed and consumers rising affluence increases their interest in a more diversified and nutritious diet, seafood consumption is on the increase. According to the National Statistics Bureau, the per capita consumption of aquatic products was 14.62 Kg per urban dweller and 5.36 Kg per rural inhabitant in 2011. Per capita consumption is expected to increase steadily, with strong growth potential in the rural sector. The per capita consumption of aquatic products is highest in coastal regions, for example in Shanghai and Guangdong, (where aquatic products have been a traditional source of protein) and locations with relatively high disposable income.
According to Ministry of Agriculture (MOA) survey results (among 80 major aquatic product wholesale markets), the average wholesale price for aquatic products increased by 8.5% in the first eight months of 2012 from the previous year. The price increased by 9.7% for sea water products, and 6.9% for fresh water products. Prices for aquatic products are expected to grow in 2013, reflecting increases in the price of feed and other inputs.
8USITC: China’s Agricultural Trade: Competitive Conditions and Effects on U.S. Exports, March 2011
9Definition of terms: China’s definition of aquatic products includes both cultured (farm-raised) and wild caught products; aquatic products include fish, shrimp/prawn/crab, shellfish, algae, and other. Aquatic catch production is total volume of both fresh and seawater wild caught aquatic products; Aquaculture production is the total volume of both fresh and seawater cultured (farmed) aquatic products. This report will use Chinese terminology to maintain consistency between Chinese statistics and product categories. Total aquatic trade statistics below do not include fishmeal.
10 The State of World Fisheries and Aquaculture 2012, FAO
11FAO – National Aquaculture Sector Overview China
Trade
Total aquatic trade value in 2012 is estimated at $27 billion, up four percent over $25.8 billion in 2011, according to the USDA. Total trade volume is expected to fall by two percent. According to MOA statistics, in the first three quarters of 2012, total aquatic trade volume stood at 5.86 million tons, down 2.4%, while trade value was $19.4 billion, up 6% over the previous year. Total aquatic import volume was 3.1 million tons, down 0.9% over the previous year; total aquatic trade surplus reached $7.5 billion, up $912 million over the same period from the previous year. Industry sources expect the 2012 total trade value will hit $27 billion. China’s aquatic export trade destinations (with export values over $100 million) rose from 17 countries/regions in 2009 to 25 in 2011 and will likely increase in 2012. Japan continues to be the largest export destination, followed by the United States and South Korea.
Exports and importsImports
Export value is expected to rise to $18.5 billion, up four percent over 2011. This growth is mainly due to increased prices as volume is expected to fall from the previous year. Most Chinese industry insiders believe that a stable recovery of global economies support higher aquatic exports in the near future.
Import value is estimated at $5.7 billion in 2012, almost unchanged from the previous year; however, total import volume is likely to be 2.6 million tons, down four percent over the previous year. Russia is expected to remain China’s largest supplier of aquatic products in 2012, followed distantly by the United States and Japan. Qingdao and Dalian continue to be the two largest arrival ports for aquatic products, accounting for 80% of the total import volume in first ten months of 2012. Well-established facilities, including processing factories in Qingdao and Dalian, solidify their status as the largest seafood import hubs in China.
China’s fishery production policyFishery Production Policy
China’s fishery production policy remains generally unchanged. In the 12th12th Five Year Fishery Development Plan, the MOA plans to continue to promote a more sustainable development model with resource utilization, environmental protection, production of safe products, and increases in farmer income as major priorities. In November 2012, MOA published a notice promoting a sustainable and healthy development of marine fishing in other territorial seas. The notice stressed the need to upgrade fishing facilities to maintain a stable catch volume which reached 1.15 million tons in 2011.
| - 135 - |
Implementation of aquaculture licensing system continues
The MOA will continue to implement a nationwide aquaculture licensing system during the 12th12th Five Year Fishery Development Plan period. Licensing thousands of small-scale aquaculture facilities, however, has proven to be a challenge for the government. As of the end of 2011, 79% of aquaculture facilities had obtained production licenses.
The policy on aquatic processing trade remains unchanged
China’s government reportedly positive view of the aquatic processing trade may be due to its role in generating new employment and producing rendered feed ingredients that are in demand by the growing feed industry. If imports are exported as processed products, they will not be subject to a tariff or value-added tax (VAT). Imports sold in China are subject to tariff and VAT.
According to MOA, the share of processing trade has declined, accounting for 28.6% of aquatic export value in 2012 (compared to 33% in 2010). Nevertheless, both Chinese industry and official sources claim that China is becoming the world’s processing center for mackerel, salmon, cod, and herring. Industry sources note that the number of enterprises involved in the “Processing Trade” is on the rise, especially in Shandong and Liaoning.
Aquatic exports for domestic consumption
High import costs, which include a duty plus value-added tax approaching 25%, make imports for domestic consumption expensive. Some industry experts are calling for reduced import duties and VAT for seafood species that are not produced in China to encourage more imports for domestic consumption.
Import certificate for live edible aquatic products
Through bilateral consultation, a NOAA amended version of the Health Certificate for live edible aquatic products was approved by the Administration for Quality Supervision, Inspection and Quarantine of China, or AQSIQ. Obtaining the certificate for live edible aquatic product may remain an issue for exporters.
New hygiene certificate for US imported fishmeal
In late July 2011, the Department of Commerce, NOAA, the Seafood Inspection Program and AQSIQ reached agreement on a new health certificate for fish meal and fish oil exports to China, which took effect on July 1, 2012. In addition, AQSIQ approved registration of 26 US fish meal and fish oil exporters.
New health certificate for fish and fishery products
On April 10, 2012, AQSIQ requested an amendment to the US Health Certificate for Fish and Fishery Products destined to China, effective Jan 1, 2013. In late December, the Department of Commerce, NOAA, the Seafood Inspection Program and AQSIQ agreed on a new certificate whichthat will be implemented January 1, 2013. The current certificate will be accepted for entry into China for fish and fishery products exported prior to January 1, 2013. AnyAfter January 1, 2013, any fish and fishery products exported from the US after January 1, 2013 to China must be accompanied by the new health certificate.
Marketing
Due to market development efforts, domestic demand has increased for imported frozen aquatic products. Salmon, snow crab legs, and cod are all products commonly available in supermarkets. Product identification, such as brand names, logo and country of origin are important tools to attract consumer interest.
Scallops, salmon, Alaskan snow crab legs, king crabs, black cod, and oysters are popular items in many upscale hotels whichthat commonly feature these products in buffets. With the proper display, high-value imported items can be promoted to customers.
Importers claim high value U.S. seafood products are easy to sell in both first and second tier cities, even in coastal cities such as Qingdao. Major obstacles include inconsistent availability due to insufficient supply and counterfeit products.
The marketMarket for meatMeat in China
China is by far the world’s largest producer and consumer of meat, which includes pork, poultry and beef.beef, by far. Historically, this situation did not have a large impact on the rest of the world, as China, for the most part, maintained self-sufficiency in meat. However, since 2007 the situation has changed dramatically. China has gradually turned into a net importer of meats.
World meat production was around 297.1 million tons in 2011 and forecast to grow by less than 2% to 302 million tons in 2012.1112China’s meat production reached 79.57 million tons in 2011, including 50.53 million tons of pork, yet the overall production was slightly less than the consumption; meanwhile, the net imports of meat climbed 33.59% year on year to 1.57 million tons. According to the “12th12th Five-Year Plan”Plan of the meat industry, it is expected that by the end of 2015, China’s total meat output will have reached 85 million tons, consisting of about 63% pork.
11Food Outlook Global Market Analysis, published by the Trade and Market Division of FAO under Global Information and Early Warning System (GIEWS), November 2012
| - 136 - |
World meat production was around 297.1 million tons in 2011 and forecast to grow by less than 2% to 302 million tons in 2012.[1] China’s meat production reached 79.57 million tons in 2011, including 50.53 million tons of pork, yet the overall production was slightly less than the consumption; meanwhile, the net imports of meat climbed 33.59% year on year to 1.57 million tons. According to the12th Five-Year Plan of the meat industry, it is expected that by the end of 2015, China’s total meat output will have reached 85 million tons, consisting of about 63% pork.
With strong economic growth, China’s urbanization has been occurring at a faster pace than commonly expected. By the end of 2011, the urban population for the first time exceeded the rural population, reaching 51.3% of the total population. If rural migrants working in urban areas are included, the population working and living in urban areas accounted for about 70% of the total population.
Urbanization and rising purchasing power has led to a dietary pattern change switching from the consumption of traditional food grain products to an increase in consumption of meat.1213 The change in consumer preferences, meaning higher priced red meat representing a major part of Chinese consumers main protein source, partly derives from the perception that consumption of red meat is equal to higher status than consumption of poultry or pork.1314
There are several other specific market drivers which underpin the increase in demand for red meat. One driver is the improved living standard in China which stimulates the growth of beef markets, since beef often sells at a much higher price and traditionally goes beyond a majority of people'speople’s affordable level. Another is the fact that Chinese people'speople’s dietary structure is becoming more diversified and reasonable, bringing larger amount of beef consumption since beef has nutritional benefits. Lastly, further regulation of China'sChina’s beef industry is likely to ensure sufficient supply of cattle and promote the development of the beef industry, which would result in safer and healthier beef products.1514
The strong rise in feed grain prices in the past five years is now moving substantially through the market chain and is being reflected in higher meat prices with the exception of poultry where adjustments have been made. On the contrary, world meat consumption continues to grow at one of the highest rates among major agricultural commodities. Thus, developing countries can expect an increase in meat imports despite strong meat prices, driven by population, and income growth and high income elasticity of demand. Equally so, strong prices will result in sustained export earnings, which will encourage large meat exporting countries to invest in international meat markets. When breaking the expected increase of demand down by region it is evident that the Asia and Pacific region is projected to stand for the largest increase in demand by far.1615
The supporting policies from Chinese government is expected to ensure adequate supply of cattle sources from the upstream area and improve the quality and taste of beef products. Therefore, consumers are likely to get safer and healthier beef products and beef consumption is expected to move to a higher development level in the near future.1716
12Food Outlook GlobalThe Market Analysis, published by the Trade and Market Division of FAO under Global Information and Early Warning System (GIEWS), November 2012
13China’s growing appetite for meats: Implications for World meat trade. A Multi-Client Study, April 2012
14China and Hong Kong: Food Opportunities for Maine, Maine International Trade Center, March 2012
15Frost & Sullivan: China’s beef market has great growth potential
16Meat - OECD-FAO Agricultural Outlook 2012-2021
17Frost & Sullivan: China’s beef market has great growth potential
The market for fertilizerFertilizer in China
Demand for fertilizer in China is forecast to increase 3.3% per annum through 2015 to 262 million metric tons. SalesWe expect sales of fertilizers are expected to be supported by healthy expansion of agricultural activities as the amount of sown areas continues to grow and rural income levels rise. Farmers will continue to register steadily increasing incomes, the result of growing crop prices and government subsidies designed to supplement their revenues and reduce their material costs. Subsidies aimed directly at cutting the cost of fertilizers is expected to encourage additional use. In addition, rising crop prices have encouraged farmers to invest in fertilizers to further boost crop yields. Advances will also be driven by increases in the hectares of sown land dedicated to growing cash crops. However, increasing demand for organic food and improved understanding of the correct application of fertilizers is expected to prevent demand from rising at a faster pace.
In value terms, fertilizer demand is expected to grow 6.0% per year to 548 billion yuan,Yuan, outpacing gains in volume terms. Faster value growth will be driven by strong demand for higher value multi-nutrient fertilizers. In addition, advances will be supported by continued growth in fertilizer prices as the cost of natural gas, oil, coal, and other raw materials continues to increase.rise.
Demand for fertilizer nutrients in China is projected to grow 4.4%annually through 2015 to 98.1 million metric tons. Nutrient demand will be stimulated by increasing use of higher nutrient level products as income levels grow in rural areas in China. In addition, government efforts to promote multi-nutrient fertilizers will also support gains in fertilizer nutrient demand. Accounting for more than three-fourths of total fertilizer demand in 2010, single-nutrient fertilizers will remain the larger product type through 2015, despite a relatively low growth rate of 2.1% per year. Sales of single nutrient fertilizers will continue to be supported by their relatively low prices. Multi-nutrient fertilizer demand will post a strong annual growth rate of 7.3% through 2015, fortified by government efforts to promote their utilization.
12 China’s growing appetite for meats: Implications for World meat trade. A Multi-Client Study, April 2012
13 China and Hong Kong: Food Opportunities for Maine, Maine International Trade Center, March 2012
14 Frost & Sullivan: China’s beef market has great growth potential.
15 Meat - OECD-FAO Agricultural Outlook 2012-2021
16 Frost & Sullivan: China’s beef market has great growth potential
| - 137 - |
The size, growth and composition of fertilizer demand in the six regions that make up China vary considerably. The Central-South and Central-East will remain the two largest regional fertilizer markets. Due to the comparatively high income levels in the Central-South and Central-East —- which enable residents to afford more expensive food items –- demand for cash crops such as fruits and vegetables will rise in these regions, which in turn will fuel demand for fertilizer. Sales in the Northeast and Northwest regions will outpace the average through 2015, benefiting from the Great Western Development Strategy, the Northeast Revitalization Policy, and increasing income levels for farmers.1817
GOVERNMENT REGULATION
Regulation of M&A and Overseas Listings
On August 8, 2006, six PRC regulatory agencies, including the Ministry of Commerce (the “MOC”), the State Assets Supervision and Administration Commission, the State Administration of Taxation (“SAT”), the State Administration of Industry and Commerce (the “SAIC”), the China Securities Regulatory Commission (“CSRC”), and the State Administration of Foreign Exchange (the “SAFE”), jointly issued the Regulations on Mergers and Acquisitions of Domestic Enterprises by Foreign Investors (“M&A Rule”), which became effective on September 8, 2006 and was amended on June 22, 2009. The M&A Rule includes provisions that purport to require that an offshore special purpose vehicle formed for purposes of the overseas listing of equity interests in PRC companies and controlled directly or indirectly by PRC companies or individuals obtain the approval of the CSRC prior to the listing and trading of such special purpose vehicle’s securities on an overseas stock exchange.
On September 21, 2006, the CSRC published on its official Website procedures regarding its approval of overseas listings by special purpose vehicles. The CSRC approval procedures require the filing of a number of documents with the CSRC. The application of this new PRC regulation remains unclear, with no consensus currently existing among leading PRC law firms regarding the scope of the applicability of the CSRC approval requirement.
The M&A Rules also establish procedures and requirements that could make some acquisitions of Chinese companies by foreign investors more time-consuming and complex, including requirements in some instances that the MOFCOM be notified in advance of any change-of-control transaction in which a foreign investor takes control of a Chinese domestic enterprise.
In 2006,February 2011, the central government startedGeneral Office of the State Council promulgated a program intendedNotice on Establishing the Security Review System for Mergers and Acquisitions of Domestic Enterprises by Foreign Investors (“Circular 6”), which established a security review system for mergers and acquisitions of domestic enterprises by foreign investors. Under Circular 6, a security review is required for mergers and acquisitions by foreign investors having “national defense and security” concerns and mergers and acquisitions by which foreign investors may acquire “de facto control” of domestic enterprises with “national security” concerns. In August 2011, the MOFCOM promulgated the Rules on Implementation of Security Review System (“MOFCOM Security Review Rules”), to partially compensate farmersreplace the Interim Provisions of the Ministry of Commerce on Matters Relating to the Implementation of the Security Review System for price increasesMergers and Acquisitions of Domestic Enterprises by Foreign Investors promulgated by the MOFCOM in fuel, fertilizerMarch 2011. The MOFCOM Security Review Rules, which came into effect on September 1, 2011, provide that the MOFCOM will look into the substance and other agricultural inputs. Inactual impact of a transaction and prohibit foreign investors from bypassing the case of fertilizers, government support is part of several separate programs targeting fertilizer producers, with cost reductions being passed along to farmers purchasing the input. By 2009, fuel and fertilizer subsidies totaled $10.5 billion.19security review requirement by structuring transactions through proxies, trusts, indirect investments, leases, loans, control through contractual arrangements or offshore transactions.
Regulation of Foreign Currency Exchange and Dividend Distribution
The principal regulations governing foreign currency exchange in China are the Foreign Exchange Administration Regulations (“FX Regulations”), which were last amended in August 2008. Under the FX Regulations, the RMB is freely convertible for current account items, including the distribution of dividends, interest payments, trade and service-related foreign exchange transactions, but not for capital account items, such as direct investments, loans, repatriation of investments and investments in securities outside of China, unless the prior approval of the SAFE is obtained and prior registration with the SAFE is made. On August 29, 2008, the SAFE issued a notice, Circular 142, regulating the conversion by a foreign-invested company of foreign currency into RMB by restricting how the converted RMB may be used. Circular 142 requires that the registered capital of a foreign-invested company settled in RMB converted from foreign currencies may only be used for purposes within the business scope approved by the applicable governmental authority and may not be used for equity investments within the PRC. In addition, the SAFE increased its oversight of the flow and use of the registered capital of a foreign-invested company settled in RMB converted from foreign currencies. The use of such RMB capital may not be changed without the SAFE’s approval, and may not in any case be used to repay RMB loans if the proceeds of such loans have not been used. Violations of Circular 142 will result in severe penalties, such as heavy fines. As a result, Circular 142 may significantly limit our ability to transfer cash or other assets from Sino Agro Food, Inc. and/or our other non-PRC subsidiaries into our subsidiaries in the PRC, which may adversely affect our business expansion and we may not be able to convert the net proceeds into RMB to invest in or acquire any other PRC companies, or establish other VIEs in the PRC.
Dividends paid by a PRC subsidiary to its overseas shareholder are deemed income of the shareholder and are taxable in the PRC. Pursuant to the Administration Rules of the Settlement, Sale and Payment of Foreign Exchange (1996), foreign-invested enterprises in the PRC may purchase or remit foreign currency, subject to a cap approved by the SAFE, for settlement of current account transactions without the approval of the SAFE. Foreign currency transactions under the capital account are still subject to limitations and require approvals from, or registration with, the SAFE and other relevant PRC governmental authorities.
17Fertilizers in China, Industry Study with Forecasts for 2015 & 2020, Freedonia Group; June 2012.
| - 138 - |
In October 2005, the SAFE promulgated the Relevant Issues Concerning Foreign Exchange Control on Domestic Residents’ Corporate Financing and Roundtrip Investment through Offshore Special Purpose Vehicles (“Circular 75”). Under Circular 75, which was issued by SAFE effective November 1, 2005, prior registration with the local SAFE branch is required for PRC residents to establish or to control an offshore company for the purposes of financing that offshore company with assets or equity interests in an onshore enterprise located in the PRC. An amendment to the registration or filing with the local SAFE branch by such PRC resident is also required for the injection of equity interests or assets of an onshore enterprise in the offshore company or overseas funds raised by such offshore company, or any other material change involving a change in the capital of the offshore company. Moreover, Circular 75 applies retroactively. As a result, PRC residents who, prior to November 1, 2005, had established or acquired control of offshore companies that had made onshore investments in the PRC prior to were required to complete the relevant registration procedures with the local SAFE branch by March 31, 2006.
Since May 2007, the SAFE has issued a series of guidance to its local branches with respect to the operational process for the SAFE registration under Circular 75. The guidance provides more specific and stringent supervision of the registration required by Circular 75. For example, the guidance imposes obligations on onshore subsidiaries of an offshore entity to make true and accurate statements to the local SAFE authorities regarding any shareholder or beneficial owner of the offshore entity who is a PRC citizen or resident. Untrue statements by the onshore subsidiaries will lead to potential liability for the subsidiaries and, in some instances, for their legal representatives and other related individuals.
Under the relevant rules, failure to comply with the registration procedures set forth in Circular 75 may result in restrictions being imposed on the foreign exchange activities of the relevant onshore company, including increases in its registered capital, payment of dividends and other distributions to its offshore parent or affiliate and capital inflows from the offshore entity, and may also subject relevant PRC residents to penalties under PRC foreign exchange administration regulations. PRC residents who control our company from time to time are required to register with the SAFE in connection with their investments in us.
On December 25, 2006, the People’s Bank of China (the “PBOC”) issued the Administration Measures on Individual Foreign Exchange Control and related Implementation Rules were issued by the SAFE on January 5, 2007. Both became effective on February 1, 2007. Under these regulations, all foreign exchange transactions involving an employee share incentive plan, share option plan, or similar plan participated in by onshore individuals may be conducted only with approval from the SAFE or its authorized branch. Under the Notice of Issues Related to the Foreign Exchange Administration for Domestic Individuals Participating in Stock Incentive Plan of Overseas Listed Company (“Offshore Share Incentives Rules”), which was issued by the SAFE on February 15, 2012, PRC citizens who are granted share options, restricted share units or restricted shares by an overseas publicly listed company are required to register with the SAFE or its authorized branch and to comply with a series of other requirements. If we, or the PRC employees of ours who hold options, restricted share units or restricted shares fail to comply with these registration or other procedural requirements, we, and/or such employees may be subject to fines and other legal sanctions.
The principal regulations governing distribution of dividends of foreign holding companies include the Foreign Investment Enterprise Law (1986), which was amended in October 2000, and the Administrative Rules under the Foreign Investment Enterprise Law (2001). Under these regulations, foreign investment enterprises in China may pay dividends only out of their accumulated profits, if any, determined in accordance with PRC accounting standards and regulations. In addition, foreign investment enterprises in China are required to allocate at least 10% of their accumulated profits each year, if any, to fund certain reserve funds unless these reserves have reached 50% of the registered capital of the enterprises. These reserves are not distributable as cash dividends.
Laws and Regulations Related to Employment and Labor Protection
On June 29, 2007, the National People’s Congress promulgated the Employment Contract Law of PRC (“Employment Contract Law”), which became effective as of January 1, 2008 and was amended on December 28, 2012. The Employment Contract Law requires employers to provide written contracts to their employees, restricts the use of temporary workers and aims to give employees long-term job security.
Pursuant to the Employment Contract Law, employment contracts lawfully concluded prior to the implementation of the Employment Contract Law and continuing as of the date of its implementation shall continue to be performed. Where an employment relationship was established prior to the implementation of the Employment Contract Law but no written employment contract was concluded, a contract must be concluded within one month after its implementation.
On September 18, 2008, the State Council promulgated the Implementing Regulations for the PRC Employment Contract Law which came into effect immediately. These regulations interpret and supplement the provisions of the Employment Contract Law.
We have entered into written employment contracts with three of our employees.
| - 139 - |
Income Tax
On March 16, 2007, the National People’s Congress approved and promulgated the Enterprise Income Tax Law (the “EIT Law”). On December 6, 2007, the State Council approved the Implementing Rules. Both the EIT Law and its Implementing Rules became effective on January 1, 2008. Under the EIT Law and the Implementing Rules, which superseded the previous Income Tax Law, the enterprise income tax rate for both domestic companies and foreign invested enterprises is unified at 25%. On December 26, 2007, the State Council promulgated the Circular on Implementation of Enterprise Tax Transition Preferential Policy, or the Preferential Policy Circular. The EIT Law, its Implementing Rules and the Preferential Policy Circular provide a five-year transitional period for certain entities that had enjoyed a favorable income tax rate of less than 25% under the previous Income Tax Law and were established before March 16, 2007, during which period the applicable enterprises income tax rate shall gradually increase to 25%.
On April 14, 2008, the Administration Measures for Recognition of High and New Technology Enterprises, or the Recognition Measures, were jointly promulgated by the Ministry of Science and Technology, the Ministry of Finance, and the SAT, which sets out the standards and process for granting the high and new technology enterprises status. According to the EIT Law and its Implementing Rules as well as the Recognition Measures, enterprises which have been granted the high and new technology enterprises status shall enjoy a favorable income tax rate of 15%. The new EIT Law and its Implementation Rules also provide that “software enterprises” enjoy a two-year income tax exemption starting from the first profit making year, followed by a reduced tax rate of 12.5% for the subsequent three years.
The EIT Law also provides that an enterprise established under the laws of a foreign country or region but whose “de facto management body” is located in the PRC be treated as a resident enterprise for PRC tax purposes and consequently be subject to the PRC income tax at the rate of 25% for its global income. The Implementing Rules merely defines the location of the “de facto management body” as “the place where the exercising, in substance, of the overall management and control of the production and business operation, personnel, accounting, properties, etc., of a non-PRC company is located.” The SAT issued the Circular regarding the Determination of Chinese-Controlled Offshore Incorporated Enterprises as PRC Tax Resident Enterprises on the Basis of De Facto Management Bodies, or Circular 82, on April 22, 2009. Circular 82 provides certain specific criteria for determining whether the “de facto management body” of a Chinese-controlled offshore-incorporated enterprise is located in China. The SAT issued the Bulletin regarding the Administrative Measures on the Income Tax of Chinese-Controlled Offshore Incorporated Resident Enterprises (Interim) on July 27, 2011, which became effective on September 1, 2011, providing more guidance on the implementation of Circular 82. This bulletin clarifies matters including resident status determination, post-determination administration and competent tax authorities. Although both Circular 82 and the bulletin only apply to offshore enterprises controlled by PRC enterprises, not companies like us, the determining criteria set forth in Circular 82 and the bulletin may reflect the SAT’s general position on how the “de facto management body” test should be applied in determining the tax resident status of offshore enterprises, regardless of whether they are controlled by PRC enterprises or individuals. Based on a review of surrounding facts and circumstances, the Company does not believe that it is likely that its operations outside of the PRC should be considered a resident enterprise for PRC tax purposes. However, due to limited guidance and implementation history of the EIT Law, should the Company be treated as a resident enterprise for PRC tax purposes, the Company will be subject to PRC tax on worldwide income at a uniform tax rate of 25% retroactive to January 1, 2008.
The EIT Law also imposes a withholding income tax of 10% on dividends distributed by a Foreign Invested Enterprise (a “FIE”) to its immediate holding company outside of China if such immediate holding company is considered a non-resident enterprise without any establishment or place within China or if the received dividends have no connection with the establishment or place of such immediate holding company within China, unless such immediate holding company’s jurisdiction of incorporation has a tax treaty with China that provides for a different withholding arrangement. Such withholding income tax was exempted under the Previous IT Law. The State of Nevada, where the Company is incorporated, does not have such tax treaty with China. The State Administration of Taxation (the “SAT”) further promulgated a circular, or Circular 601, on October 27, 2009, which provides that the tax treaty benefits will be denied to “conduit” or shell companies without business substance and that a beneficial ownership analysis will be used based on a “substance-over-form” principle to determine whether or not to grant the tax treaty benefits. A majority of our subsidiaries in China are directly held by our non-Chinese subsidiaries. If we are regarded as a non-resident enterprise and our non-Chinese subsidiaries are regarded as resident enterprises, then our non-Chinese subsidiaries may be required to pay a 10% withholding tax on any dividends payable to us. If our non-Chinese subsidiaries are regarded as non-resident enterprises, then our PRC subsidiaries may be required to pay a 5% withholding tax for any dividends payable to our non-Chinese subsidiaries, however, it is still unclear at this stage whether Circular 601 applies to dividends from our PRC subsidiaries paid to our non-Chinese subsidiaries, and if our non-Chinese subsidiaries were not considered as “beneficial owners” of any dividends from their PRC subsidiaries, whether the dividends payable to our non-Chinese subsidiaries would be subject to withholding tax at a rate of 10%.
The EIT Law and its Implementation Rules have made an effort to scrutinize transactions between related parties. Pursuant to the EIT Law and its Implementation Rules, the tax authorities may impose mandatory adjustment on tax due to the extent a related party transaction is not in line with arm’s-length principle or was entered into with a purpose to reduce, avoid or delay the payment of tax. On January 8, 2009, the SAT issued the Implementation Measures for Special Tax Adjustments (Trial), which clarifies the definition of “related party” and sets forth the tax-filing disclosure and documentation requirements, the selection and application of transfer pricing methods, and transfer pricing investigation and assessment procedures.
| - 140 - |
On December 10, 2009, the SAT issued a circular on Strengthening the Administration of Enterprise Income Tax Collection on Income Derived from Equity Transfer by Non-resident Enterprise, or Circular 698. Pursuant to Circular 698, non-resident enterprises should declare any direct transfer of equity interest of PRC resident enterprises and pay taxes in accordance with the EIT Law and relevant laws and regulations. For an indirect transfer, if the effective tax rate for the transferor (a non-PRC-resident enterprise) is lower than 12.5% under the law of the jurisdiction of the direct transferred target, the transferor is required to submit relevant transaction materials to PRC tax authorities for review. If such indirect transfer is determined by PRC tax authorities to be a transaction without any reasonable business purpose other than for the purpose of tax avoidance, the gains derived from such transfer will be subject to PRC income tax.
In addition to the above, after the EIT Law and its Implementing Rules were promulgated, the SAT released several regulations to stipulate more details for carrying out the EIT Law and its Implementing Rules. These regulations include:
DIRECTORS AND EXECUTIVE OFFICERS, PROMOTERS AND CONTROL PERSONS
The Board of Directors elects our executive officers annually. A majority vote of the directors who are in office is required to fill vacancies. Each director shall be elected for the term of one year and until his successor is elected and qualified or until his earlier resignation or removal. Our directors and executive officers are as follows:
| Name | Age | Position | ||
| Lee Yip Kun Solomon | CEO and Director | |||
| Tan Poay Teik | Chief Marketing Officer and Director | |||
| Chen Bor Hann | Secretary and Director | |||
| Yap Koi Ming (George) | Independent Director | |||
| Nils Erik Sandberg | 73 | Independent Director | ||
| Daniel Ritchey | 45 | Independent Director | ||
| Lim Chang Soh (Anthony) | 50 | Independent Director | ||
| Olivia Lai | 55 | Chief Financial Officer |
Lee Yip Kun Solomon.Solomon. Mr. Lee has been a Director and our Chief Executive Officer since August 2007. From March 2004 to date he has been Group Managing Director of Capital Award Inc. Since May, 1993, he has been the CEO of Irama Edaran Sdn. Bhd. (Malaysia), a modern fishery developer. There was no formal relationship between Sino Agro Food and Irama Edaran. He received a B.A. Major in Accounting and Economics from Monash University, Australia in July 1972. As a member of the board, Mr. Solomon contributes his knowledge of our company and a deep understanding of all aspects of our business, products and markets, as well substantial experience developing corporate strategy, assessing emerging industry trends, and business operations.
| - 141 - |
Tan Paoy Teik.Teik. Mr. Tan has been a Director and our Chief Marketing Officer since August 2007. Since July, 2005, he has been Group Managing Director of Milux Corporation Bhd. (Malaysia), a manufacturer of home and gas appliances. He received an MBA from South Pacific University in 2005. Mr. Tan is currently the Managing Director of Milux Corporation Bhd; as such, he spends half of his working time with Milux and half with our company. As a member of the board, Mr. Tan contributes his knowledge of the company and a deep understanding of all aspects of our business, products and markets, as well substantial experience developing corporate strategy, assessing emerging industry trends, and business operations.
18Fertilizers in China, Industry Study with Forecasts for 2015 & 2020, Freedonia Group; June 2012
19USITC: China’s Agricultural Trade: Competitive Conditions and Effects on U.S. Exports, March 2011
Chen Bor Hann.Hann. Mr. Chen has been a Director and Secretary since August 2007. Since March, 2004, he has been Director and Business Development Manager of Capital Award Inc. From September 1995 to March 2004, he was Fishery Supervisor of Irama Edaran Sdn. Bhd. (Malaysia). As a member of the board, Mr. Chen contributes his knowledge of the company and a deep understanding of all aspects of our business, products and markets, as well substantial experience developing corporate strategy, assessing emerging industry trends, and business operations.
Nils-Erik Sandberg.Sandberg. Mr. Sandberg has been an Independent Director of the Company since January 1, 2013. He brings international investment experience and skills in corporate governance, investor relations, and corporate finance with local knowledge of NASDAQ OMX Stockholm and Swedish Stock Exchange that will benefit the Company. He was appointed the Chairman of the Compensation Committee of the Company as of February 1, 2013. He is President of the Jordan Fund, a Swedish investment group network since 1990. Mr. Sandberg also currently holds a position as an adviser for Gustavia Energy and Commodities Fund, formerly known as the Stockpicker JF Commodity Energy Fund, since 2008. Mr. Sandberg was the founder and served as the CEO of Hydrocarbon International HCI AB, a publicly traded Swedish oil Company, from 1986 to 1993. Mr. Sandberg was the founder and served as the CEO of Grauten Oil AB, a publicly traded Swedish oil company, from 1986 to 1993. Mr. Sandberg iswas a director of International Petroleum Corporation, predecessor of Lundin Oil, later Lundin Petroleum, which trades on both the NASDAQ-OMX and TSX exchanges.
Koi Ming Yap (George). Mr. Yap has been an Independent Director of the Company since January 1, 2013. He brings international investment banking, corporate finance, financial reporting, investment strategies, and international auditing experience and skills in corporate governance, investor relations, and corporate finance with knowledge of NASDAQ OMX Stockholm and the Swedish Stock Exchange that will benefit the Company. He was appointed the Chairman of the Audit Committee of the Company as of February 1, 2013. He is a practicing international chartered accountant with over 30 years standing and is a practicing member of The Institute of Chartered Accountants in England and Wales since 1984. His international experience has covered Australia-NZ, United Kingdom-, Europe, Malaysia, the ASEAN, China and Hong Kong. Mr. Yap has been the managing principal of K M Yap & Company, a sole proprietary firm of Chartered Accountancy in NSW, Sydney, since 1990. He has been managing director of Brenna Investments Pty Ltd. since 1998 and has held the position of Public Interest Director (non-executive) for the Federation of Investment Managers Malaysia, in Malaysia since 2010 (a position sanctioned by the Securities Commission of Malaysia). Mr. Yap specializes in strategic corporate finance solutions, business plans, registering listings on stock exchanges, international banking, financial management, risk management, financial reporting, auditing, financial management, investment management, and providing corporate finance solutions in terms of sourcing finance, as well as cornerstone investors in IPOs, reverse mergers, and takeovers, that are expected to benefit the Company.
Daniel Ritchey. Mr. Ritchey has been an Independent Director of the Company since February 1, 2014. Having worked in both the public and private sectors, Mr. Ritchey has deployed his years of experience into developing partnerships and venture capital relationships throughout the agriculture and natural resource industries. Coupled with an undergraduate degree from Muskingum College (1989) and an MBA from Ohio State University (1994), Mr. Ritchey has as President of The Business Advocate, Inc. developed 3 successful partnerships, namely DC Capital LLC; 3-D Ranch LLC; and 3-D Oil and Gas LLC, whose business operations are mainly concentrated in Ohio, and whose commercial property development also extends into the Washington DC area. Mr. Ritchey continues to serve as a lobbyist on both the State and Federal level, with focus on issues and industries related to natural resources and the environment.
Lim Chang Soh (Anthony). Mr. Soh was appointed as an Independent Director of the Company on February 5, 2014. He brings investment experience and skills in corporate governance, corporate finance, new business development and investment strategies with considerable knowledge in agriculture industry that will benefit the Company. Mr. Soh is a practicing lawyer with 20 years standing and a partner in the law firm, Edwin Lim Suren & Soh, in Kuala Lumpur, Malaysia. He served as Deputy Managing Director of Pontian United Plantations Berhad (“Pontian”), a Malaysian plantation company in the business of cultivating oil palm on 39,000 acres of land on a group basis, and operating an oil mill, from the Year 2009 until October 31, 2013. Prior to his appointment as the Deputy Managing Director, Mr. Soh was appointed Director in Pontian in 2005, and subsequently promoted to the post of Executive Director from 2007. He holds an LL.B (Hons) degree from University of Hull, England. In his professional career, Mr. Soh specializes in mergers and takeovers and corporate re-structuring that are expected to benefit the Company.
| - 142 - |
Olivia Lai. Ms. Lai has over 20 years accounting and finance experience and held senior positions in many multi-national and public accounting and consulting firms; including Cisco Systems, Ernst & Young and PricewaterhouseCoopers. She is a U.S. and Hong Kong Certified Accountant with memberships in the American Institute of Certified Public Accountants, Charted Global Management Accountants, Hong Kong Institute of Certified Public Accountants, and the Taxation Institute of Hong Kong. Ms. Lai holds a BSC in Accounting with the highest distinction from the University of Illinois, which she received in 1992 and an EMBA from the Kellogg School of Management, Northwestern University and University of Illinois — University of Science and Technology, Hong Kong, which she received in 2005. An American and Hong Kong Chinese, she is fluent in English, Cantonese, and Mandarin.
Family Relationships
There are no family relationships among our officers or directors.
Involvement in Certain Legal Proceedings
None of the director(s) or executive officers of the Company: (i) has been involved as a general partner or executive officer of any business which has filed a bankruptcy petition; (ii) has been convicted in any criminal proceeding nor is subject to any pending criminal proceeding; (iii) has been subjected to any order, judgment or decree of any court permanently or temporarily enjoining, barring, suspending or otherwise limiting his involvement in any type of business, securities or banking activities; and (iv) has been found by a court, the United States Securities and Exchange Commission or the Commodities Futures Trading Commission to have violated a federal or state securities or commodities law.
Board Committees:Committees:
Audit Committee
Our Audit Committee currently consists of twothree directors: Messrs. Yap (chairman), Sandberg and Sandberg.Ritchey. The Board has determined that:
The designation of Mr. Yap as an “audit committee financial expert” will not impose on him any duties, obligations or liability that are greater than those that are generally imposed on him as a member of our Audit Committee and our Board, and his designation as an “audit committee financial expert” will not affect the duties, obligations or liability of any other member of our Audit Committee or Board.
Compensation Committee
Our Compensation Committee currently consists of twothree directors: Messrs. Sandberg (chairman), Yap and Yap.Soh. The Board has determined that:
Compensation Committee Interlocks and Insider Participation
None of the members of our Compensation Committee is an officer or employee of our company. None of our executive officers currently serves, or in the past year has served, as a member of the board of directors or compensation committee of any entity that has one of more executive officers serving on our Board or Compensation Committee.
Code of Conduct
The Board has established a corporate Code of Conduct which qualifies as a “code of ethics” as defined by Item 406 of Regulation S-K of the Exchange Act. Among other matters, the Code of Conduct is designed to deter wrongdoing and to promote:
| - 143 - |
Waivers to the Code of Conduct may be granted only by the Board. In the event that the Board grants any waivers of the elements listed above to any of our officers, we expect to announce the waiver within four business days on a Current Report on Form 8-K.
The Code of Conduct applies to all of the Company’s employees, including our principal executive officer, the principal financial and accounting officer, and all employees who perform these functions. If we amend our Code of Conduct as it applies to the principal executive officer, principal financial officer, principal accounting officer or controller (or persons performing similar functions), we shall disclose such amendment through the filing of a Current Report on Form 8-K.
EXECUTIVE COMPENSATION
Summary Compensation Table
The table below summarizes all compensation awarded to, earned by, or paid to our Principal Executive Officer, our two most highly compensated executive officers other than our CEO who occupied such position at the end of our latest fiscal year and up to two additional executive officers who would have been included in the table below except for the fact that they were not executive officers at the end of our latest fiscal year, by us, or by any third party where the purpose of a transaction was to furnish compensation, for all services rendered in all capacities to us or our subsidiary for the latest fiscal yearsyear ended December 31, 2011 and December 31, 2012.2014.
| Name and Principal Position | Year | Salary($) | Bonus ($) | Option Awards ($) | Nonequity incentive plan compensation | Nonqualified deferred compensation earnings ($) | All other compensation ($) | Total ($) | ||||||||||||||||||||||||
| Lee Yip Kun Solomon | 2012 | 336,000 | 0 | 0 | 0 | 0 | 0 | 336,000 | ||||||||||||||||||||||||
| Chief Executive Officer | 2011 | 336,000 | 0 | 0 | 0 | 0 | 0 | 336,000 | ||||||||||||||||||||||||
| Tan Paoy Teik | 2012 | 174,000 | 0 | 0 | 0 | 0 | 0 | 174,000 | ||||||||||||||||||||||||
| Chief Marketing Officer | 2011 | 174,000 | 0 | 0 | 0 | 0 | 0 | 174,000 | ||||||||||||||||||||||||
| Chen Bor Hann | 2012 | 60,000 | 0 | 0 | 0 | 0 | 0 | 60,000 | ||||||||||||||||||||||||
| Secretary | 2011 | 60,000 | 0 | 0 | 0 | 0 | 0 | 60,000 | ||||||||||||||||||||||||
| Name and Principal Position | Year | Salary($) | Bonus ($) | Option Awards ($) | Non-equity incentive plan compensation | Nonqualified deferred compensation earnings ($) | All other compensation ($) | Total ($) | ||||||||||||||||||||||||
| Lee Yip Kun Solomon | 2014 | 336,000 | 0 | 0 | 0 | 0 | 0 | 336,000 | ||||||||||||||||||||||||
| Chief Executive Officer | 2013 | 336,000 | 0 | 0 | 0 | 0 | 0 | 336,000 | ||||||||||||||||||||||||
| Tan Paoy Teik | 2014 | 174,000 | 0 | 0 | 0 | 0 | 0 | 174,000 | ||||||||||||||||||||||||
| Chief Marketing Officer | 2013 | 174,000 | 0 | 0 | 0 | 0 | 0 | 174,000 | ||||||||||||||||||||||||
| Chen Bor Hann | 2014 | 60,000 | 0 | 0 | 0 | 0 | 0 | 60,000 | ||||||||||||||||||||||||
| Secretary | 2013 | 60,000 | 0 | 0 | 0 | 0 | 0 | 60,000 | ||||||||||||||||||||||||
Summary Equity Awards
There has been no equity incentive award made to any of our executive officers as of our fiscal year ended December 31, 2012.2014.
Employment Agreements
Lee Yip Kun Solomon. On June 14, 2011,December 29, 2014, we entered into arenewed the three-year employment agreement effective and continuing as of January 1, 20112015 with Lee Yip Kun Solomon, our Chief Executive Officer and President (the “Lee Agreement”“Lee Agreement”). Pursuant to the Lee Agreement, Mr. Lee is entitled to an annual base salary of $336,000 and to receive 336,00033,939 shares of our common stock. Such shares have not been issued to Mr. Lee. Mr. Lee shall also be eligible for discretionary performance bonus payments; no such bonus has been paid. The Lee Agreement provides for Mr. Lee to be eligible to participate in any incentive compensation established by the Company; no such plan has been established. The Lee Agreement also includes confidentiality obligations to which Mr. Lee must adhere.
Tan Paoy Teik. On June 14, 2011,December 29, 2014, we entered into arenewed the three-year employment agreement effective and continuing as of January 1, 20112015 with Tan Paoy Teik, our Chief Marketing Officer (the “Tan Agreement”“Tan Agreement”). Pursuant to the Tan Agreement, Mr. Tan is entitled to an annual base salary of $174,000 and to receive 174,00017,575 shares of our common stock. Such shares have not been issued to Mr. Tan. Mr. Tan shall also be eligible for discretionary performance bonus payments; no such bonus has been paid. The Tan Agreement provides for Mr. Tan to be eligible to participate in any incentive compensation established by the Company; no such plan has been established. The Tan Agreement also includes confidentiality obligations to which Mr. Tan must adhere.
Chen Bor Hann. On June 14, 2011,December 29, 2014, we entered into arenewed the three-year employment agreement effective and continuing as of January 1, 20112015 with Chen Bor Hann, our Secretary (the “Hann Agreement”“Hann Agreement”). Pursuant to the Hann Agreement, Mr. Hann is entitled to an annual base salary of $174,000$60,000 and to receive 174,0006,060 shares of our common stock. Such shares have not been issued to Mr. Hann. Mr. Hann shallshal1 also be eligible for discretionary performance bonus payments; no such bonus has been paid. The Hann Agreement provides for Mr. Hann to be eligible to participate in any incentive compensation established by the Company; no such plan has been established. The Hann Agreement also includes confidentiality obligations to which Mr. Hann must adhere.
| - 144 - |
General
At no time during the last fiscal year with respect to any person listed in the table above was there:
| any outstanding option or other equity-based award re-priced or otherwise materially modified (such as by extension of exercise periods, the change of vesting or forfeiture conditions, the change or elimination of applicable performance criteria, or the change of the bases upon which returns are determined; | ||
| any waiver or modification of any specified performance target, goal or condition to payout with respect to any amount included in non-stock incentive plan compensation or payouts; | ||
| any option or equity grant; | ||
| any non-equity incentive plan award made to a named executive officer | ||
| any nonqualified deferred compensation plans including nonqualified defined contribution plans; or | ||
| any payment for any item that should be included as All Other Compensation in a Summary Compensation Table. |
We have no compensation arrangements (such as fees for retainer, committee service, service as chairman of the board or a committee, and meeting attendance) with directors. Directors did not receive any compensation except for that received as executive officers as set forth above.
CERTAIN RELATIONSHIPS AND RELATED PARTY TRANSACTIONS
During fiscal year 2010,On December 31, 2011 we borrowed an aggregate of $926,196 from Mr. Lee, our chairman and chief executive officer. During fiscal year 2011, Mr. Lee paid $8,969,078 for and on behalf of the Company and we repaid Mr. Lee $9,605,510 of the foregoing amount, leaving uswere indebted to Mr. Lee in the amount of $289,764 on December 31, 2011.$289,764. During fiscal year 2012, we borrowed an aggregate of $3,056,039 from Mr. Lee, leaving us indebted to Mr. Lee in the amount of $3,345,803 on December 31, 2012. During fiscal year 2013 we repaid Mr. Lee an aggregate of $1,552,035, leaving us indebted to Mr. Lee an amount of $1,793,768 on December 31, 2013. The amounts are unsecured, interest free and have no fixed term of repayment.
During the year ended December 31, 2011, we repurchased 7,000,000 shares of our common stock from Capital Adventure for $396,400. Capital Adventure is owned by Messrs. Solomon Lee, Tan and Chen, our three executive directors.
The Company does not presently have a policy that addresses related-party matters but is considering implementing such a policy.
SECURITY OWNERSHIP OF CERTAIN BENEFICIAL OWNERS AND MANAGEMENT
Prior to the Offering
The following table sets forth certain information concerning the number of shares of our Common Stockcommon stock owned beneficially owned based on 127,713,76617,162,716 issued and outstanding shares of Common Stockcommon stock as of September 4, 2013the date of this prospectus by: (i) each of our directors; (ii) each of our named executive officers; and (iii) each person or group known by us to beneficially own more than 5% of our outstanding shares of Common Stock.common stock.
Beneficial ownership is determined in accordance with SEC rules and generally includes voting or investment power with respect to securities. Other than as described in the notes to the table, we believe that all persons named in the table have sole voting and investment power with respect to shares beneficially owned by them. All share ownership figures include shares issuable upon exercise of options or warrants exercisable within 60 days of the date of this prospectus, which are deemed outstanding and beneficially owned by such person for purposes of computing his or her percentage ownership, but not for purposes of computing the percentage ownership of any other person. Unless otherwise indicated below, beneficial ownership is calculated based on the 127,713,76617,162,716 shares of Common Stockcommon stock issued and outstanding as of the date of this prospectus.
| Shares of | Percent of | Shares of Series A | Percent of Series A | |||||||||||||||||||||||||||||||||||||
| Name and address | Shares of Common Stock | Percent of Common Stock | Shares of Series A Preferred Stock | Percent of Series A Preferred Stock | Percent of Capital Stock (1) | Common Stock | Common Stock | Preferred Stock | Preferred Stock | Percent of Capital Stock (1) | ||||||||||||||||||||||||||||||
| Directors and Officers (2): | ||||||||||||||||||||||||||||||||||||||||
| Lee Yip Kun Solomon | 12,500,000 | 9.8 | % | 75 | 75 | % | 62 | % | 1,262,626 | 7.4 | % | 75 | 75 | % | 61.5 | % | ||||||||||||||||||||||||
| Tan Poay Teik | 0 | 0 | 20 | 20 | % | 16 | % | — | 0 | 20 | 20 | % | 16 | % | ||||||||||||||||||||||||||
| Chen Bor Hann | 0 | 0 | 5 | 5 | % | 4 | % | — | 0 | 5 | 5 | % | 4 | % | ||||||||||||||||||||||||||
| George Yap | 0 | 0 | 0 | 0 | 0 | 5,051 | * | — | 0 | * | ||||||||||||||||||||||||||||||
| Nils Erik Sandberg (3) | 4,123,210 | 3.2 | % | 0 | 0 | * | 416,485 | 2.4 | % | — | 0 | * | ||||||||||||||||||||||||||||
| Daniel Ritchey | 146,464 | * | — | 0 | * | |||||||||||||||||||||||||||||||||||
| Anthony Soh | — | 0 | — | 0 | 0 | |||||||||||||||||||||||||||||||||||
| All Officers and Directors as a Group (5 persons) | 16,623,210 | 13 | % | 100 | 100 | % | 82.6 | % | ||||||||||||||||||||||||||||||||
| All Officers and Directors as a Group (7 persons) | 1,830,626 | 10.7 | % | 100 | 100 | % | 82.1 | % | ||||||||||||||||||||||||||||||||
| 5% or Greater Beneficial Owners | ||||||||||||||||||||||||||||||||||||||||
| Nordnet Pensionsfoersaekring AB | 15,744,591 | 12.3 | % | — | 0 | 2.5 | % | 2,050,304 | 11.9 | % | — | 0 | 2.4 | % | ||||||||||||||||||||||||||
| Forsakringsaktiebolaget Avanza Pension | 14,895,771 | 11.7 | % |
— | 0 | 2.3 | % | 2,795,554 | 16.3 | % | — | 0 | 3.3 | % | ||||||||||||||||||||||||||
* Less than one percent.percent
| - 145 - |
(1) Includes the voting power of the 100 shares of Series A Preferred Stock issued and outstanding, which in the aggregate carry the voting power of eighty percent (80%) of all votes entitled to be voted at any annual or special meeting of shareholders of our company or action by written consent of our shareholders. Each outstanding share of the Series A Preferred Stock shall represent its proportionate share of the 80%, which is allocated to the outstanding shares of Series A Preferred Stock.
(2) The address for each of the officers and directors is c/o Sino Agro Food, Inc., Room 3801, Block A, China Shine Plaza, No. 9 Lin He Xi Road, Tianhe District, Guangzhou City, (510610), P.R.C.
(3) Includes 910,30091,949 shares of Common Stockcommon stock owned of record by Mr. Sandberg’s spouse and 850,00085,858 shares of common stock owned of record by Ängby Sportklubb, a not-for-profit organization of which Mr. Sandberg is the chairman of the board of directors. Mr. Sandberg disclaims any beneficial ownership of the shares of common stock held by Ängby Sportklubb.
SubsequentPLAN OF DISTRIBUTION
ECAB, the selling securityholder identified in this prospectus under “Selling Securityholders,” may offer and sell from time to time the Offering
The following table sets forth certain information concerningnote and the number of shares of our Common Stock beneficially owned based on the 127,713,766 issued and outstanding shares of Common Stock as of September 4, 2013 as well as the additional 26,250,000 such shares that would be issued and outstanding assuming completion of the sale of all shares of common stock offered inissuable upon conversion of the note covered by this prospectus. We will not receive any of the proceeds from the offering of the note or the shares of common stock issuable upon conversion of the note by ECAB. In connection with the initial offering of the note, we agreed to register the note and the underlying shares of common stock at the request of ECAB.
We are registering the note and shares of common stock covered by this prospectus by: (i) eachto permit holders to conduct public secondary trading of our directors; (ii) each of our named executive officers; and (iii) each person or group known by usthese securities from time to beneficially own more than 5% of our outstanding shares of Common Stock.
Beneficial ownership is determined in accordance with SEC rules and generally includes voting or investment power with respect to securities. Other than as described in the notes to the table, we believe that all persons named in the table have sole voting and investment power with respect to shares beneficially owned by them. All share ownership figures include shares issuable upon exercise of options or warrants exercisable within 60 days oftime after the date of this prospectus, which are deemed outstandingprospectus. We have agreed, among other things, to bear all expenses, other than underwriting discounts and beneficially owned by such person for purposesselling commissions, in connection with the registration and sale of computing his or her percentage ownership, but not for purposes of computing the percentage ownership of any other person. Unless otherwise indicated below, beneficial ownership is calculated based onnote and the 153,963,766 shares of common stock issuedcovered by this prospectus.
The selling securityholders may sell all or a portion of the note and outstanding assumingshares of common stock beneficially owned by them and offered hereby from time to time:
• directly; or
• through underwriters, broker-dealers or agents, who may receive compensation in the form of discounts, commissions or concessions from the selling securityholders and/or from the purchasers of the note and shares of common stock for whom they may act as agent.
The note and the shares of common stock may be sold from time to time in one or more transactions at:
• fixed prices, which may be changed;
• prevailing market prices at the time of sale;
• varying prices determined at the time of sale; or
• negotiated prices.
These prices will be determined by the holders of the securities or by agreement between these holders and underwriters or dealers who may receive fees or commissions in connection with the sale. The aggregate proceeds to the selling securityholders from the sale of allthe note or shares of common stock offered by this prospectus.
| Name and address | Shares of Common Stock | Percent of Common Stock | Shares of Series A Preferred Stock | Percent of Series A Preferred Stock | Percent of Capital Stock (1) | |||||||||||||||
| Directors and Officers (2): | ||||||||||||||||||||
| Lee Yip Kun Solomon | 12,500,000 | 8.1 | % | 75 | 75 | % | 61.6 | % | ||||||||||||
| Tan Poay Teik | 0 | 0 | 20 | 20 | % | 16 | % | |||||||||||||
| Chen Bor Hann | 0 | 0 | 5 | 5 | % | 4 | % | |||||||||||||
| George Yap | 0 | 0 | 0 | 0 | 0 | |||||||||||||||
| Nils Erik Sandberg (3) | 4,123,210 | 2.7 | % | 0 | 0 | * | ||||||||||||||
| All Officers and Directors as a Group (5 persons) | 16,623,210 | 10.8 | % | 100 | 100 | % | 82.2 | % | ||||||||||||
| 5% or Greater Beneficial Owners | ||||||||||||||||||||
| Nordnet Pensionsfoersaekring AB | 15,744,591 | 10.2 | % | — | 0 | 2 | % | |||||||||||||
| Forsakringsaktiebolaget Avanza Pension | 14,895,771 | 9.7 | % | — | 0 | 1.9 | % | |||||||||||||
* Less than one percent.
(1) Includesthem hereby will be the voting powerpurchase price of the 100 shares of Series A Preferred Stock issued and outstanding, which in the aggregate carry the voting power of eighty percent (80%) of all votes entitled to be voted at any annualnote or special meeting of shareholders of our company or action by written consent of our shareholders. Each outstanding share of the Series A Preferred Stock shall represent its proportionate share of the 80%, which is allocated to the outstanding shares of Series A Preferred Stock.
(2) The address for each of the officers and directors is c/o Sino Agro Food, Inc., Room 3801, Block A, China Shine Plaza, No. 9 Lin He Xi Road, Tianhe District, Guangzhou City (510610), P.R.C.
(3) Includes 910,300 shares of Common Stock owned of record by Mr. Sandberg’s spouse and 850,000 shares of common stock owned of record by Ängby Sportklubb, a not-for-profit organization ofless discounts and commissions, if any.
The sales described in the preceding paragraph may be effected in transactions:
• on any national securities exchange or quotation service on which Mr. Sandberg is the chairman of the board of directors. Mr. Sandberg disclaims any beneficial ownership of thenote or shares of common stock held by Ängby Sportklubb.may be listed or quoted at the time of sale;
PLAN OF DISTRIBUTION• in the over-the-counter market;
This is a self-underwritten offering. This prospectus is part of a registration statement that permits our officers and directors to sell• otherwise than on such exchanges or services or in the shares directly to the public, with no commissionover-the-counter market; or other remuneration payable to any of them for any shares that are sold by them. We may also engage registered broker-dealers to offer and sell the shares. We may pay any such registered persons who make such sales a commission of up to __% of the sale price of shares sold, and provide the registered persons a non-accountable expense allowance of up to 3% of the sale price of shares sold. However, we have not entered into any underwriting agreement, arrangement or understanding for the sale of the shares being offered. In the event we retain a broker who may be deemed an underwriter, we will file a post-effective amendment to this registration statement with the Securities and Exchange Commission. This offering is intended to be made solely by the delivery of this prospectus and the accompanying subscription agreement to prospective investors. We may terminate this offering prior to the expiration date. Our officers and directors will sell the shares and intend to offer them to friends, family members and business acquaintances. In offering the securities on our behalf, our directors and officers will rely on the safe harbor from broker dealer registration set out in Rule 3a4-1 under the Securities Exchange Act of 1934.
Rule 3a4-1 sets forth those conditions under which a person associated with an issuer may participate in the offering of the issuer’s securities and not be deemed to be a broker-dealer. Those conditions are as follows:
| - |
• through the writing of options.
These transactions may include block transactions or crosses. Crosses are transactions in which the same broker acts as an agent on both sides of the trade.
In connection with sales of the note and shares of common stock under this prospectus, the selling securityholders may enter into hedging transactions with broker-dealers. These broker-dealers may in turn engage in short sales of the note and shares of common stock, short and deliver the note and shares of common stock to close out such short positions, or loan or pledge the note and shares of common stock to broker-dealers that may in turn sell such securities. The selling securityholders may pledge or grant a security interest in all or a portion of the note and shares of common stock that it owns and, if it defaults in the performance of its secured obligations, the pledgees or secured parties may offer and sell the note (or portion thereof) and shares of common stock from time to time pursuant to this prospectus. The selling securityholders may also transfer and donate note and shares of common stock in other circumstances, in which case the transferees, donees, pledgees or other successors in interest will be selling securityholders for the purposes of this prospectus.
The selling securityholders and any underwriters, broker-dealers or agents that participate in the sale of the note or shares of common stock issuable upon conversion of the note may be deemed to be “underwriters” within the meaning of the Securities Act. Any commissions they receive and any profits on any resale of the note and shares of common stock issuable upon the conversion of the note may be deemed to be underwriting discounts and commissions under the Securities Act. Neither we nor any selling securityholder can presently estimate the amount of any such compensation. Selling securityholders who are “underwriters” within the meaning of Section 2(11) of the Securities Act will be subject to the prospectus delivery requirements of the Securities Act.
Our officers, directors, control persons and affiliates of sameoutstanding common stock is listed for trading on the OTC QB under the symbol “SIAF.” We do not intend to purchaselist the note for trading on any sharesnational securities exchange or in this offering.the over-the-counter market. We cannot guarantee that any trading market will develop for the note. Even if a market does develop for the note, the market may not be maintained.
TERMS OF THE OFFERING
This is a direct public offering by Sino Agro Food, Inc. of a maximum of 26,250,000 shares of our common stock at $1.00 per share. The shares will be sold at a fixed price of $1.00 per share until the earlier of (i) the date when the sale of all 26,250,000 shares is completed or (ii) 180 days from the date ofsecurities offered under this prospectus. There is no minimum amount of aggregate subscriptions and there is no minimum amount of subscription required per investor. Subscriptions, once received, are irrevocable. Accordingly, there is no minimum number of shares that mustprospectus may be sold in the offering, we will retain the proceeds from the sale of any of the offered shares, and funds will not be returned to investors. It is possible that no proceeds will be received by ussome states only through registered or that if any proceeds are received, that such proceeds will not be sufficient to cover the costs of the offering. There is no commitment on the part of any person to purchase and pay for any shares.
There can be no assurance that all,licensed brokers or any, of the shares will be sold.dealers. In order to comply with the applicable securities laws of certainaddition, in some states the securities may not be offered or sold unless they have been registered or qualified for sale in such states or an exemption from such registration or qualification requirement is available and with which we have complied. The purchasers in this offering and in any subsequent trading market must be residents of such states where the shares have been registered or qualified for sale or an exemption from such registration or qualification requirementrequirements is available. Asavailable and is complied with.
To our knowledge, there are currently no plans, arrangements or understandings between any selling securityholders and any underwriter, broker-dealer or agent regarding the sale of the note and the shares of common stock by the selling securityholders. Selling securityholders may choose not to sell any, or less than all, of the note and the shares of common stock offered pursuant to this prospectus. In addition, we cannot assure you that a selling securityholder will not transfer, devise or gift the note and the shares of common stock by means other than as described in this prospectus. In addition, any securities covered by this prospectus which qualify for sale pursuant to Rule 144 under Rule 144A of the Securities Act may be sold under Rule 144 or Rule 144A rather than pursuant to this prospectus. The selling securityholders may agree to indemnify any agent, dealer or broker-dealer that participates in transactions involving sales of the note or shares of common stock against certain liabilities, including liabilities arising under the Securities Act.
Upon notification to us by a selling securityholder that any material arrangement has been entered into with a broker-dealer for the sale of securities through a block trade, special offering, exchange distribution or secondary distribution or a purchase by a broker-dealer, a supplement to this prospectus will be filed, if required, pursuant to Rule 424(b) under the Securities Act, disclosing (i) the name of each such selling securityholder and of the participating brokers-dealer(s), (ii) the amount of securities involved, (iii) the price at which such securities were sold, (iv) the commissions paid or discounts or concessions allowed to such brokers-dealer(s), where applicable, (v) that such brokers-dealer(s) did not conduct any investigation to verify the information set out or incorporated by reference in this prospectus and (vi) other facts material to the transaction.
The note was issued and sold on August 29, 2014 in a transaction exempt from the registration requirements of the Securities Act pursuant to Regulation S promulgated under the Securities Act.
The selling securityholder and any other person participating in such distribution will be subject to the Exchange Act. The Exchange Act rules include, without limitation, Regulation M, which may limit the timing of purchases and sales of the note and the underlying shares of common stock by the selling securityholders and any such other person. In addition, Regulation M of the Exchange Act may restrict the ability of any person engaged in the distribution of the note and the underlying shares of common stock to engage in market-making activities with respect to the note and the underlying shares of common stock being distributed for a period of up to five business days prior to the commencement of distribution. This may affect the marketability of the note and the underlying shares of common stock and the ability of any person or entity to engage in market-making activities with respect to the note and the underlying shares of common stock.
We will pay all expenses of the shelf registration statement. Each holder will be required to bear the expenses of any broker’s commission, agency fee or underwriter’s discount or commission.
| - 147 - |
When we refer to “selling securityholders” in this prospectus, we mean the person listed in the table below, as well as the permitted pledgees, donees, assignees, transferees, successors and others who may later hold any of the selling securityholder’s interests identified below.
We originally issued the note to ECAB as the initial purchaser, in a private offering exempt from the registration requirements of the Securities Act.
The table below sets forth certain information regarding the selling securityholder, the note and the shares of common stock issuable upon conversion of the note that may from time to time be offered under this prospectus by the selling securityholders. Unless set forth below, to our knowledge, none of the selling securityholders within the past three years has had any material relationships with us or any of our affiliates.
We have prepared the table based on information given to us by or on behalf of the selling securityholders on or prior to the date of this prospectus. The selling securityholders, including their transferees, pledgees or donees or their successors, may from time to time offer and sell under this prospectus any portion or all of the note and any shares of common stock issued upon conversion of the note. Because the selling securityholder may offer all or some portion of the note or shares of common stock issued upon conversion of the note, we have not identifiedcannot provide an estimate as to the specific states whereprincipal amount of the offeringnote or the number of shares of the common stock issuable upon conversion of the note that will be sold. We will file a pre-effective amendment indicatingheld by the selling securityholders upon termination of any sales. In addition, the selling securityholder identified below may have sold, transferred or otherwise disposed of all or some portion of its note since the date on which state(s)it provided the securities are to be sold pursuant to thisinformation regarding its note in transactions exempt from the registration statement.requirements of the Securities Act.
PROCEDURES FOR AND REQUIREMENTS FOR SUBSCRIBINGInformation regarding the selling securityholders may change from time to time and any changed information will be set forth in supplements to the prospectus if and when necessary.
This is a direct public offering and, as
| Selling Securityholder | Principal Amount of Note Owned Before the Offering and Offered for Sale(1) | Percentage of Note Outstanding Before the Offering and Offered for Sale | Principal Amount of Note Owned After the Offering(2) | Number of Shares of Common Stock Owned Prior to Conversion Before the Offering | Number of Shares of Common Stock Offered Upon Conversion of the Note(1)(3) | Number of Shares of Common Stock Owned After the Offering(4) | ||||||||||||||||||
| Euro China Capital AB | $ | 15,516,667 | 100 | % | 0 | 0 | 1,567,340 | 0 | ||||||||||||||||
(1) Our registration of these securities does not necessarily mean that the selling securityholders will sell any or all of such payment forsecurities.
(2) Assumes the saleentirety of the sharesnote is sold in this offering will be payableoffering.
(3) The note is convertible at an initial conversion price of $9.90, subject to adjustments for certain events. See “Description of the Note.”
(4) Assumes all shares of common stock issuable upon conversion of the note are sold in this offering.
DESCRIPTION OF THE NOTES AND THE INDENTURE
We have summarized selected provisions of the note and the indenture below. We have issued the note under an indenture between us and __________________________, as trustee. The terms of the note include those stated in the indenture and those made part of the indenture by reference to the Trust Indenture Act of 1939, as amended (the “Trust Indenture Act”). We urge you to read the indenture because it, and not this description, defines your rights as a noteholder. Copies of the indenture are available as set forth elsewhere in this prospectus under the caption “Where You Can Find More Information.”
| - 148 - |
As used in this “Description of Notes and the Indenture” section, references to “Sino Agro,” the “Company,” “we,” “our Company,” “our” or “us” refer solely to Sino Agro Food, Inc. and its subsidiaries. As used in this “Description of Notes and the Indenture” section, references to the “Notes” shall mean, individually and collectively, the note issued to ECAB and any future notes issued under the indenture in connection with a sale of all or a portion of the note. In addition, we have used in this description capitalized and other terms that we have defined below under “— Definitions” and in other parts of this description.
General
The note will mature on February 28, 2020 and will bear interest at 10.5% per year, payable quarterly in arrears in cash on December 31, March 31, June 30 and September 30 of each year, beginning September 30, 2014. We will pay interest to the person in whose name the Notes are registered at the close of business on the December 15, March 15, June 15 or September 15 preceding the applicable interest payment date. We will make payments at the offices of the trustee and any Paying Agent and we may make payments by wire transfer for any Notes held in book-entry form or by check mailed to the address of the person entitled to the payment as it appears in the note register.
Ranking
The Notes are an unsecured obligation and will rank equally in right of payment with our existing and future unsecured debt from time to time outstanding. The Notes are effectively subordinated to any secured debt from time to time outstanding to the extent of the value of the assets securing that debt.
Conversion Rights
In accordance with the terms of the Notes and the Indenture, the Notes are convertible, at the discretion of the holders of the Notes, into shares of our common stock (i) at any time following an Event of Default (as defined in the Notes and the Indenture), or (ii) for a period of thirty (30) calendar days following October 1, 2015 and each anniversary thereof, at an initial conversion price per share of $9.90, subject to adjustment for stock splits, reverse stock splits, stock dividends and other similar transactions and subject to certain further adjustments as set forth in the Notes and the Indenture.
Covenants
Notices
We will promptly give written notice to the holders of the Notes of:
| · | Any litigation commenced or, to our knowledge, threatened in writing against us involving claims in excess of $100,000 individually or $500,000 in the aggregate or involving any injunctive, declaratory or other equitable relief that could reasonably be expected to be material to us, such notice to include, if requested by ECAB or, if ECAB does not hold any of the Notes, by the holders of a majority in aggregate principal amount of the Notes, copies of all papers filed in such litigation and to be given monthly with respect to any such papers that have been filed since the last notice was given; | |
| · | Any dispute or disputes that may exist between us and any governmental authority and which involve (a) claims against us that exceed $100,000 individually or $500,000 in the aggregate, (b) injunctive or declaratory relief that could reasonably be expected to be material to us (c) revocation, modification, failure to renew or the like of any permit or imposition of additional material conditions with respect thereto, or (d) any liens for taxes due but not paid that could reasonably be expected to be material to us. | |
| · | Any Event of Default (as defined below); | |
| · | Such other information regarding the operations, business affairs and financial condition of us as a holder of the Notes may reasonably request. |
Director Nominee
Pursuant to that certain letter agreement to be entered into by and between the Company and ECAB (the “ECAB Letter Agreement”), following the satisfaction of the Payee Conditions (as defined below), within ten (10) calendar days following the receipt of notice from ECAB, we will take, or cause to be taken, all actions that are necessary to cause one (1) person designated by ECAB to be nominated to the Board. For so long as ECAB is a holder of any of the Notes that remain outstanding, ECAB will continue to have the right (but not the obligation) to nominate to the Board of Directors, one (1) director, and we will include, and will use our best efforts to cause the Board, whether acting through the Nominating and Corporate Governance Committee of the Board or otherwise, to include, in the slate of nominees recommended to our stockholders for election as a director at any annual or special meeting of our stockholders (or, if permitted, by any action by written consent of the stockholders) at or by which directors of the Company are to be elected, the individual identified in advance by ECAB. So long as ECAB is a holder of any of the Notes that remain outstanding, we will notify ECAB in writing of the date on which proxy materials are expected to be mailed by the Company in connection with an election of directors at an annual or special meeting of the Company’s stockholders (and we will deliver such notice at least 60 days (or such shorter period to which ECAB consents) prior to such expected mailing date or such earlier date as may be specified by the Company reasonably in advance of such earlier delivery date on the basis that such earlier delivery is necessary so as to ensure that such nominee may be included in such proxy materials at the time such proxy materials are mailed). We will provide ECAB with a reasonable opportunity to review and provide comments on any portion of the proxy materials relating to ECAB’s nominee or the rights and obligations provided under the Notes and to discuss any such comments with us. We will notify ECAB of any opposition to ECAB’s nominee sufficiently in advance of the date on which such proxy materials are to be mailed by the Company in connection with such election of directors so as to enable ECAB to propose a replacement nominee, if necessary, in accordance with the terms of the Notes, and ECAB will have ten (10) business days to designate another nominee. So long as ECAB is a holder of the Notes that remain outstanding, subject to applicable legal requirements, the Articles of Incorporation or Bylaws of the Company will accommodate and be subject to and not in any respect conflict with the rights and obligations set forth in the Notes and the indenture.
| - 149 - |
Chief Financial Officer
Pursuant to the ECAB Letter Agreement, following the satisfaction of the Payee Conditions, we will not hire a new Chief Financial Officer (or any person that performs the functions typically performed by a Chief Financial Officer) without the prior written consent of ECAB.
Right of First Refusal
Pursuant to the ECAB Letter Agreement, so long as ECAB is a holder of any of the Notes that remain outstanding, in the event we propose to enter into any loan or other arrangement for borrowed money with, or offer any debt or equity securities to, any person, ECAB will have the right, but not the obligation, to make all or a portion of such loan or to purchase all or a portion of such debt or equity securities on the same terms and conditions as with such other person. We will promptly give written notice of such proposed transaction with such other person to ECAB. We will also promptly provide to ECAB such additional information as is reasonably requested by ECAB. ECAB will have 30 days from the receipt of notice from us to decide whether or not they want to exercise the rights set forth in the Notes. If ECAB does elect to exercise such rights, then we will take all actions reasonably necessary, including but not limited to entering into all agreements and instruments as are reasonably necessary, to complete such transaction with 30 days from the receipt of the notice from us. If ECAB does not elect to exercise such rights, then we will have immediate accessa period of 30 days to these funds. Investors can purchase common stockconsummate said transaction on the exact same terms and conditions as those offered to ECAB.
Issuances of Equity to Vendors or Lenders
Other than issuances of equity to certain vendors or lenders for an aggregate amount of $5,500,000 of indebtedness and other payables owed to such vendors on August 12, 2014 or lenders that we agreed prior to August 12, 2014 to repay by issuing equity securities in this offering by completing a subscription agreement, a copythe Company (which issuances, including the number of which is filed as an exhibitequity securities to be issued, were disclosed to the holders of the Notes in writing on August 12, 2014), we will not under any circumstances enter into any arrangement (other than as contemplated in the Notes and any Interest Payment Notes (as defined below)) with any vendor or lender that involves the issuance of any equity securities as payment for any amounts owed to such vendor or lender or actually issue any such equity securities to such vendor or lender as payment for any such amounts from and after the date hereof.
Listing and Trading
Pursuant to the ECAB Letter Agreement, upon request from ECAB, we will use our best efforts to promptly have the Notes and any Interest Payment Notes listed through Euroclear on any exchange which such holders may request, maintain such listing of the Notes and any Interest Payment Notes and register the Notes and any Interest Payment Notes with the US Securities and Exchange Commission. In connection with any listing or registration, statement of which this prospectus is a part of. All payments arewe will procure and there will at all times be timely furnished to any such exchange such documents and information as such exchange may require to be furnished in accordance with its normal requirements or in accordance with any arrangements made with such exchange and keep effective any such registration statement. We will satisfy all conditions that such exchange may impose on the listing of the Notes and the Interest Payment Notes and will prepare or enter into any agreements, registration statements documents, indentures and agency agreement and take any other actions as may be reasonably requested by ECAB to Sino Agro Food, Inc.effect or maintain any such listing or registration. We will be responsible for all costs incurred in connection with procuring and maintaining any such listing or registration.
Events of Default
An “Event of Default” on the Notes occurs upon the occurrence of any one or more of the following events:
(1) the failure or refusal of the Company to pay all or any part of the principal of or accrued interest on the Notes as and when the same becomes due and payable in accordance with the terms of the Notes;
(2) the occurrence of a breach or violation of any of the terms of the Notes or the indenture (as it relates thereto);
(3) we (i) become insolvent within the meaning of the Bankruptcy Code of the United States, as amended, (ii) admit in writing our inability to pay or otherwise fail to pay our debts generally as they become due, (iii) voluntarily seek, consent to, or acquiesce in the benefit or benefits of any Debtor Relief Law, or (iv) are requiredmade the subject of any proceeding provided for by any Debtor Relief Law that could suspend or otherwise affect any of the rights of the holders of the Notes;
| - 150 - |
(4) the nonpayment when due of any other material indebtedness owed by the Company, or the occurrence of any event under any document or instrument evidencing, securing, or executed in connection with any such indebtedness which could give the holder thereof the right to declare such indebtedness or any part thereof due prior to its scheduled maturity;
(5) the discovery by any holder of the Notes that any statement, representation, or warranty made by the Company in any writing, document, or instrument ever delivered to such holder in connection with the Noteswas at the time made false, misleading, or erroneous in any material respect; or
(6) a final judgment is entered against the Company for the payment of money in excess of $25,000 in the aggregate and remains unsatisfied for thirty (30) days after entry, or any property of the Company is attached, garnished or otherwise made such to legal process.
Without notice or demand, the entire unpaid principal balance of and all accrued interest on the Notes will immediately become due and payable at the option of ECAB or, if ECAB does not hold any of the Notes, at the option of the holders of a majority in aggregate principal amount of the Notes upon the occurrence of any one or more of the Events of Default. Upon the occurrence of an Event of Default, the holders of the Notes may (a) offset against the Notes any sum or sums owed by holders to the Company or (b) proceed to protect and enforce their rights either by suit in equity and/or by action at law, or by other appropriate proceedings, whether for the specific performance of any covenant or agreement contained in the Notes or any document or instrument executed and delivered by the Company in connection with the Notes or in aid of the exercise of any power or right granted by the Notes or any document or instrument executed and delivered by the Company in connection with the Notes or to enforce any other legal or equitable right of the holder of the Notes.
ECAB or, if ECAB does not hold any of the Notes, the holders of not less than a majority in aggregate principal amount of the Notes by notice to the trustee may on behalf of the holders of the Notes waive any existing Default or Event of Default and its consequences hereunder, except a continuing Default or Event of Default in the payment of the principal of, premium, if any, or interest on, the Notes (provided,however, that ECAB or, if ECAB does not hold any of the Notes, the holders of a majority in aggregate principal amount of the Notes may rescind an acceleration and its consequences, including any related payment Default that resulted from such acceleration, with respect to the Notes). Upon any such waiver, such Default will cease to exist, and any Event of Default arising therefrom will be deemed to have been cured for every purpose of the indenture; but no such waiver will extend to any subsequent or other Default or impair any right consequent thereon.
Modification and Waiver
We and the trustee may supplement or amend the indenture with respect to the Notes with the consent of ECAB or, if ECAB does not hold any of the Notes, of the holders of at least a majority in principal amount of the outstanding Notes. Without the consent of the holder of each of the Notes affected, however, no modification may:
| · | reduce the principal amount of the Notes whose holders must consent to an amendment, supplement or waiver; |
| · | reduce the rate of or change the time for payment of interest on the Notes; |
| · | waive a Default or Event of Default in the payment of principal of, or interest or premium, if any, on the Notes (except a rescission of acceleration of the Notes by ECAB or, if ECAB does not hold any of the Notes, by the holders of at least a majority in aggregate principal amount of the then outstanding Notes and a waiver of the payment Default that resulted from such acceleration); |
| · | make any Notes payable in money other than that stated in the Notes; |
| · | make any change in the provisions of the indenture relating to waivers of past Defaults or the rights of holders of Notes to receive payments of principal of, or interest or premium, if any, on the Notes; or |
| · | make any change in the foregoing amendment and waiver provisions. |
We and the trustee may supplement or amend the indenture or waive any provision of that indenture without the consent of any holders of the Notes in certain circumstances, including:
| · | to cure any ambiguity, defect or inconsistency; |
| · | to provide for uncertificated Notes in addition to or in place of certificated Notes; |
| - 151 - |
| · | to make any change that would provide any additional rights or benefits to the holders of the Notes or that does not adversely affect the legal rights under the indenture of any such holder in any material respect or to surrender any right or power conferred upon us; |
| · | to comply with requirements of the SEC in order to effect or maintain the qualification of the indenture under the Trust Indenture Act; or | |
| · | to evidence and provide the acceptance of the appointment of a successor trustee pursuant to the terms thereof. |
ECAB or, if ECAB does not hold any of the Notes, the holders of a majority in principal amount of the Notes may waive any existing or past Default or Event of Default with respect to the Notes. Those holders may not, however, waive any Default or Event of Default in any payment on any of the Notes or compliance with a provision that cannot be amended or supplemented without the consent of each holder affected.
Paying Agents and Transfer Agents
The trustee will be appointed as Paying Agent and transfer agent for the Notes. Payments on the Notes will be made in U.S. dollars at the office of the trustee and any Paying Agent. At our option, however, payments may be made by wire transfer any Notes held in book-entry form or by check mailed to the address of the Person entitled to the payment as it appears in the security register.
Book-Entry Delivery and Settlement
Global Notes
We will issue the Notes in the form of United States currency either by personal check, bank draft,one or by cashier’s check. All subscription agreements and checks are irrevocable and should be delivered to Sino Agro Food, Inc., Room 3801, Block A, China Shine Plaza, No. 9 Lin He Xi Road, Tianhe District, Guangzhou City 510610, P.R.C., Attn: Solomon Lee, CEO. We reserve the right to either accept or reject any subscription. Any subscription rejected by usmore permanent global notes in definitive, fully registered, book-entry form. The global notes will be returned todeposited with or on behalf of The Depository Trust Company (“DTC”) and registered in the subscriber within five business daysname of Cede & Co., as nominee of DTC, or will remain in the custody of the rejection date. Once a subscription agreement is accepted, it will be executed without reconfirmation to or from the subscriber. Once we accept a subscription, the subscriber cannot withdraw it.trustee.
IfDTC, Clearstream and Euroclear
Beneficial interests in the global notes will be represented through book-entry accounts of financial institutions acting on behalf of beneficial owners as direct and indirect participants in DTC. Investors may hold interests in the global notes through either DTC (in the United States), Clearstream Banking, société anonyme, Luxembourg (“Clearstream”), or Euroclear Bank S.A./N.V. (the “Euroclear Operator”), as operator of the Euroclear System (in Europe) (“Euroclear”), either directly if they are participants of such systems or indirectly through organizations that are participants in such systems. Clearstream and Euroclear will hold interests on behalf of their participants through customers’ securities accounts in Clearstream’s and Euroclear’s names on the books of their U.S. depositaries, which in turn will hold such interests in customers’ securities accounts in the U.S. depositaries’ names on the books of DTC.
DTC has advised us as follows:
| · | DTC is a limited-purpose trust company organized under the New York Banking Law, a “banking organization” within the meaning of the New York Banking Law, a member of the Federal Reserve System, a “clearing corporation” within the meaning of the New York Uniform Commercial Code and a “clearing agency” registered under Section 17A of the Securities Exchange Act of 1934. |
| · | DTC holds securities that its participants deposit with DTC and facilitates the settlement among participants of securities transactions, such as transfers and pledges, in deposited securities through electronic computerized book-entry changes in participants’ accounts, thereby eliminating the need for physical movement of securities certificates. |
| · | Direct participants include securities brokers and dealers, banks, trust companies, clearing corporations and other organizations. |
| · | DTC is a wholly owned subsidiary of The Depository Trust & Clearing Corporation (“DTCC”). DTCC is the holding company for DTC, National Securities Clearing Corporation and Fixed Income Clearing Corporation, all of which are registered clearing agencies. DTCC is owned by the users of its regulated subsidiaries. |
| · | Access to the DTC system is also available to others such as securities brokers and dealers, banks and trust companies that clear through or maintain a custodial relationship with a direct participant, either directly or indirectly. |
| · | The rules applicable to DTC and its direct and indirect participants are on file with the SEC. |
| - 152 - |
We have provided the descriptions of the operations and procedures of DTC, Clearstream and Euroclear in this prospectus supplement solely as a matter of convenience. These operations and procedures are solely within the control of those organizations and are subject to change by them from time to time. None of us, the underwriters nor the trustee takes any responsibility for these operations or procedures, and you decideare urged to subscribecontact DTC, Clearstream and Euroclear or their participants directly to discuss these matters.
We expect that under procedures established by DTC:
| · | upon deposit of the global notes with DTC or its custodian, DTC will credit on its internal system the accounts of direct participants designated by the underwriters with portions of the principal amounts of the global notes; and |
| · | ownership of the Notes will be shown on, and the transfer of ownership thereof will be effected only through, records maintained by DTC or its nominee, with respect to interests of direct participants, and the records of direct and indirect participants, with respect to interests of persons other than participants. |
The laws of some jurisdictions may require that purchasers of securities take physical delivery of those securities in definitive form. Accordingly, the ability to transfer interests in the Notes represented by a global note to those persons may be limited. In addition, because DTC can act only on behalf of its participants, who in turn act on behalf of persons who hold interests through participants, the ability of a person having an interest in Notes represented by a global note to pledge or transfer those interests to persons or entities that do not participate in DTC’s system, or otherwise to take actions in respect of such interest, may be affected by the lack of a physical definitive security in respect of such interest.
So long as DTC or its nominee is the registered owner of a global note, DTC or that nominee will be considered the sole owner or holder of the Notes represented by that global note for all purposes under the indenture and under the Notes. Except as provided below, owners of beneficial interests in a global note will not be entitled to have Notes represented by that global note registered in their names, will not receive or be entitled to receive physical delivery of certificated notes and will not be considered the owners or holders thereof under the indenture or under the Notes for any sharespurpose, including with respect to the giving of any direction, instruction or approval to the trustee. Accordingly, each holder owning a beneficial interest in this offering, youa global note must rely on the procedures of DTC and, if that holder is not a direct or indirect participant, on the procedures of the participant through which that holder owns its interest, to exercise any rights of a holder of Notes under the indenture or the global note.
Neither we nor the trustee will have any responsibility or liability for any aspect of the records relating to or payments made on account of Notes by DTC, Clearstream or Euroclear, or for maintaining, supervising or reviewing any records of those organizations relating to the Notes.
Payments on the Notes represented by the global notes will be requiredmade to executeDTC or its nominee, as the case may be, as the registered owner thereof. We expect that DTC or its nominee, upon receipt of any payment on the Notes represented by a Subscription Agreementglobal note, will credit participants’ accounts with payments in amounts proportionate to their respective beneficial interests in the global note as shown in the records of DTC or its nominee. We also expect that payments by participants to owners of beneficial interests in the global note held through such participants will be governed by standing instructions and tender it, togethercustomary practice as is now the case with securities held for the accounts of customers registered in the names of nominees for such customers. The participants will be responsible for those payments.
Distributions on the Notes held beneficially through Clearstream will be credited to cash accounts of its customers in accordance with its rules and procedures, to the extent received by the U.S. depositary for Clearstream.
Securities clearance accounts and cash accounts with the Euroclear Operator are governed by the Terms and Conditions Governing Use of Euroclear and the related Operating Procedures of the Euroclear System, and applicable Belgian law (collectively, the “Terms and Conditions”). The Terms and Conditions govern transfers of securities and cash within Euroclear, withdrawals of securities and cash from Euroclear, and receipts of payments with respect to securities in Euroclear. All securities in Euroclear are held on a fungible basis without attribution of specific certificates to specific securities clearance accounts. The Euroclear Operator acts under the Terms and Conditions only on behalf of Euroclear participants and has no record of or relationship with persons holding through Euroclear participants.
Distributions on the Notes held beneficially through Euroclear will be credited to the cash accounts of its participants in accordance with the Terms and Conditions, to the extent received by the U.S. depositary for Euroclear.
Clearance and Settlement Procedures
Initial settlement for the Notes will be made in immediately available funds. Secondary market trading between DTC participants will occur in the ordinary way in accordance with DTC rules and will be settled in immediately available funds. Secondary market trading between Clearstream customers and/or Euroclear participants will occur in the ordinary way in accordance with the applicable rules and operating procedures of Clearstream and Euroclear and will be settled using the procedures applicable to conventional eurobonds in immediately available funds.
| - 153 - |
Cross-market transfers between persons holding directly or indirectly through DTC, on the one hand, and directly or indirectly through Clearstream customers or Euroclear participants, on the other, will be effected in DTC in accordance with DTC rules on behalf of the relevant European international clearing system by the U.S. depositary; however, such cross-market transactions will require delivery of instructions to the relevant European international clearing system by the counterparty in such system in accordance with its rules and procedures and within its established deadlines (European time). The relevant European international clearing system will, if the transaction meets its settlement requirements, deliver instructions to the U.S. depositary to take action to effect final settlement on its behalf by delivering or receiving the Notes in DTC, and making or receiving payment in accordance with normal procedures for same-day funds settlement applicable to DTC.
Clearstream customers and Euroclear participants may not deliver instructions directly to their U.S. depositaries.
Because of time-zone differences, credits of the Notes received in Clearstream or Euroclear as a result of a transaction with a checkDTC participant will be made during subsequent securities settlement processing and dated the business day following the DTC settlement date. Such credits or certified fundsany transactions in the Notes settled during such processing will be reported to us. Subscriptions, oncethe relevant Clearstream customers or Euroclear participants on such business day. Cash received in Clearstream or Euroclear as a result of sales of the Notes by or through a Clearstream customer or a Euroclear participant to a DTC participant will be received with value on the DTC settlement date but will be available in the relevant Clearstream or Euroclear cash account only as of the business day following settlement in DTC.
Although DTC, Clearstream and Euroclear have agreed to the foregoing procedures to facilitate transfers of the Notes among participants of DTC, Clearstream and Euroclear, they are under no obligation to perform or continue to perform such procedures and such procedures may be changed or discontinued at any time.
Certificated Notes
We will issue certificated notes to each person that DTC identifies as the beneficial owner of the Notes represented by the global notes upon surrender by DTC of the global notes if:
| · | DTC notifies us that it is no longer willing or able to act as a depositary for the global notes, and we have not appointed a successor depositary within 90 days of that notice; | |
| · | an Event of Default has occurred and is continuing, and DTC requests the issuance of certificated notes; or | |
| · | we determine not to have the Notes represented by a global note. |
Neither we nor the trustee will be liable for any delay by DTC, its nominee or any direct or indirect participant in identifying the beneficial owners of the related Notes. We and the trustee may conclusively rely on, and will be protected in relying on, instructions from DTC or its nominee for all purposes, including with respect to the registration and delivery, and the respective principal amounts, of the Notes to be issued.
Definitions
“Board of Directors” means our Board of Directors or comparable governing body or any committee thereof duly authorized, with respect to any particular matter, to act by or on behalf of the Board of Directors or comparable governing body.
“Debtor Relief Law” means the Bankruptcy Code of the United States, as amended, and all other applicable liquidation, conservatorship, bankruptcy, moratorium, rearrangement, receivership, insolvency, reorganization, or similar debtor relief laws from time to time in effect affecting the rights of creditors generally.
“Default” means any event, act or condition that is, or after notice or the passage of time or both would be, an Event of Default.
“Entity” means a corporation, limited liability company or business trust (or functional equivalent of the foregoing under applicable foreign law).
“Interest Payment Notes” means a promissory note that any holder of the Notes may elect, at its option, by delivery of notice to the Company on or before the applicable interest payment date, issued to such holder in lieu of cash in satisfaction of any interest due and payable at such time.
“Officers” means our Chairman of the Board, President, Vice President, Treasurer, Controller, Secretary, Assistant Treasurer, Assistant Controller or Assistant Secretary.
| - 154 - |
“Payee Conditions” means such time as both of the following will have occurred (i) the holders of the Notes will have advanced during the term of the Notes a total principal amount of at least $33,300,000 and (ii) the holders of the Notes will have delivered to the Company a notification notifying the Company that holders of the Notes have formed a bondholders committee consisting of two to four persons.
“Paying Agent” means any Person, which may include us, authorized by us are irrevocable. All checks for subscriptions should be made payable to Sino Agro Food, Inc.pay the principal of (and premium, if any) or interest on any one or more of the Notes on our behalf.
After the registration statement“Person” means any individual, corporation, partnership, limited liability company, joint venture, incorporated or unincorporated association, joint stock company, trust, unincorporated organization or government or other agency or political subdivision thereof or other entity of which this prospectus forms a part has been declared effective, we will provide each investor with a copy of the final prospectus relating to this offering.any kind.
General
The authorized capital stock of our company consists of 140,000,00032,727,273 shares of capital stock, consisting of 130,000,00022,727,273 shares of Common Stock and 10,000,000 shares of preferred stock, 100 of which have been designated Series A Preferred Stock, 7,000,000 of which have been designated as Series B Preferred Stock and 1,000,000 of which have been designated as Series F Preferred Stock. As of the date of this prospectus, there were 110,308,36517,162,716 shares of Common Stock, 100 shares of Series A Preferred Stock issued and outstanding, 7,000,000 shares of Series B Preferred Stock issued and outstanding and no shares of Series F Preferred Stock issued and outstanding.
Series A Preferred Stock
The Series A Preferred Stock ranks (i) senior to any of the shares of Common Stock, and any other class or series of stock of our company which by its terms shall rank junior to the Series A Preferred Stock, and (ii) junior to any other series or class of preferred stock of our company and any other class or series of stock of our company which by its term shall rank senior to the Series A Preferred Stock. The Series A Preferred Stock pays no dividend. The Series A Preferred Stock is not convertible. In general, the outstanding shares of Series A Preferred Stock shall vote together with the shares of Common Stock as a single class and, regardless of the number of shares of Series A Preferred Stock outstanding and as long as at least one of such shares of Series A Preferred Stock is outstanding, shall represent eighty percent (80%) of all votes entitled to be voted at any annual or special meeting of shareholders of our company or action by written consent of our shareholders. Each outstanding share of the Series A Preferred Stock shall represent its proportionate share of the 80% which is allocated to the outstanding shares of Series A Preferred Stock.
Series B Preferred Stock
The Series B Preferred Stock ranks senior to any of the shares of Common Stock and any other class or series of stock of our company which by its terms shall rank junior to the Series B Preferred Stock. The Series B Preferred Stock pays no dividend. Each holder of Series B Preferred Stock shall have the right, at such holder’s option, at any time or from time to time, to convert each share9.9 shares of Series B Stock into one (1)1 share of Common Stock. The Series B Preferred Stock shall carry no voting power, subject to certain limited exceptions and as provided by the Nevada Revised Statutes.
Series F Preferred Stock
TheOn August 1, 2012, the Company designated 1,000,000 shares of Series F Non-Convertible Preferred Stock ranks junior to anywith a par value per share of $0.001.
As originally filed, the sharescertificate of Common Stock, and any other class or series of stock of our company. Except for the coupon payment described herein, the Series F Preferred Stock pays no dividend. The Series F Preferred Stock carries with it a cash coupon, which shall be redeemed on May 30, 2014 (the “Coupon Redemption Date”) and thereafter until Redemption (as defined below) occurs. Upon the Coupon Redemption Date, holdersdesignation of the Series F Non-Convertible Preferred Stock stated that:
| (i) | it is not redeemable; | |
| (ii) | except for (iv), with respect to dividend rights, rights on liquidation, winding up and dissolution, it shall rank junior and subordinate to (a) all classes of Common Stock, (b) all other classes of Preferred Stock and (c) any class or series of capital securities of the Company. | |
| (iii) | except for (iv), it shall not entitled to receive any dividend; and | |
| (iv) | on May 30, 2014, the holders of record of shares of Series F Non-Convertible Preferred Stock shall be entitled to a coupon payment directly from the Company at the redemption rate of $3.40 per share for every 100 shares of Common Stock. Upon redemption, the Record Holder shall no longer own any shares of Series F that have been redeemed, and all such redeemed shares shall disappear and no longer exist on the books and records of the Company; redeemed shares of Series F which no longer exist upon redemption shall thereafter be counted toward the authorized but unissued “blank check” preferred stock of the Company. |
| - 155 - |
On June 10, 2014, the Company amended and restated the Certificate to (i) postpone the payment date of the dividend thereunder to May 30, 2015, (ii) to delete a lump sumreference to the redemption or declaration of any cash payment directly from our company (or onedividend or more of our authorized agents) equaldistribution on any Junior Securities, and (iii) make certain minor corrections to $3.40 for every one (1)the Certificate. No share of Series F Non-Convertible Preferred Stock then held (the “Redemption”). Upon proper Redemption,was ever issued. The Company believes it to be in the Series F Preferred Stock shall terminate and thereafter ceasebest interests of its shareholders to exist. The Series F Preferred Stock is not convertible. The Series F Preferred Stock shall carry no voting power, subjectdelay the cash payment until such time as its financial position would enable it to certain limited exceptions and as provided bymake the Nevada Revised Statutes.payment without harming its ability to develop its business in accordance with management’s plans.
Common Stock
Holders of Common Stock are entitled to one vote for each share on all matters submitted to a shareholder vote. Holders of Common Stock do not have cumulative voting rights. Therefore, holders of a majority of the shares of Common Stock voting for the election of directors can elect all of the directors. Holders of Common Stock representing a majority of the voting power of our capital stock issued and outstanding and entitled to vote, represented in person or by proxy, are necessary to constitute a quorum at any meeting of our shareholders. A vote by the holders of a majority of the outstanding shares is required to effectuate certain fundamental corporate changes, such as liquidation, merger or an amendment to the articles of incorporation. Holders of Common Stock are entitled to share in all dividends that the board of directors, in its discretion, declares from legally available funds. In the event of liquidation, dissolution or winding up, each outstanding share entitles its holder to participate pro rata in all assets that remain after payment of liabilities and after providing for each class of stock, if any, having preference over the Common Stock. Holders of the Common Stock have no pre-emptive rights, no conversion rights and there are no redemption provisions applicable to the Common Stock.
Transfer Agent
Our transfer agent is Broadridge Corporate Issuer Solutions, Inc., 1717 Arch Street, Suite 1300, Philadelphia, PA 19103.
Indemnification of Directors and Officers
Pursuant to our Articles of Incorporation and By-Laws, we may indemnify an officer or director who is made a party to any proceeding, including a lawsuit, because of his position, if he acted in good faith and in a manner he reasonably believed to be in our best interest. In certain cases, we may advance expenses incurred in defending any such proceeding. To the extent that the officer or director is successful on the merits in any such proceeding as to which such person is to be indemnified, we must indemnify him against all expenses incurred, including attorney’s fees. With respect to a derivative action, indemnity may be made only for expenses actually and reasonably incurred in defending the proceeding, and if the officer or director is judged liable, only by a court order. The indemnification is intended to be to the fullest extent permitted by the laws of the State of Nevada.
In the event that a claim for indemnification against such liabilities, other than the payment by us of expenses incurred or paid by one of our directors, officers, or controlling persons in the successful defense of any action, suit or proceeding, is asserted by one of our directors, officers, or controlling person in connection with the securities being registered, we will, unless in the opinion of our counsel the matter has been settled by controlling precedent, submit to a court of appropriate jurisdiction the question whether such indemnification is against public policy as expressed in the Securities Act, and we will be governed by the final adjudication of such issue.
Insofar as indemnification for liabilities arising under the Securities Act of 1933, as amended, may be permitted to our directors, officers and persons controlling us, we have been advised that it is the Securities and Exchange Commission’s opinion that such indemnification is against public policy as expressed in the Securities Act of 1933, as amended, and is, therefore, unenforceable.
U.S. FEDERAL TAX CONSIDERATIONS
The following discussion describes certain U.S. federal tax consequences of the ownership and disposition of the note and of our common stock into which the note may be converted. This discussion assumes that the note and common stock received upon the conversion of the note cannot be integrated with any other financial instrument.
This summary is based on the Internal Revenue Code of 1986, as amended (the “Code”), administrative pronouncements, judicial decisions and final, temporary and proposed Treasury regulations, changes to any of which subsequent to the date of this prospectus may affect the tax consequences described herein, possibly with retroactive effect.
This discussion applies only to ECAB (the “Holder”) and assumes that the Holder (i) is a corporation; (ii) is not created or organized in or under the laws of the United States or of any political subdivision thereof ; (iii) holds the note (and, upon conversion, will hold our common stock) as capital assets within the meaning of Section 1221 of the Code (that is, for investment purposes); (iv) is not engaged in a trade or business within the United States; and (v) is not a bank (within the meaning of the Code) receiving interest on the note as a result of an extension of credit made pursuant to a loan agreement entered into in the ordinary course of its trade or business.
| - |
We believe, based on the advice of counsel, that the note is properly characterized as indebtedness for U.S. federal income tax purposes and we will treat the note as indebtedness for U.S. federal income tax purposes. This determination is binding on the Holder unless the Holder explicitly discloses in the manner required by applicable Treasury Regulations that its determination is different from ours. Our determination is not, however, binding on the Internal Revenue Service (“IRS”), which may make a different determination. The discussion which follows assumes that the note is properly characterized as indebtedness for U.S. federal income tax purposes.
This discussion does not describe all of the tax consequences that may be relevant to the Holder in light of its particular circumstances, including tax consequences that may apply if the Holder holds our note or our common stock as part of a straddle, hedge, constructive sale or similar or comparable transaction.
THIS DISCUSSION IS PROVIDED FOR GENERAL INFORMATION ONLY AND DOES NOT CONSTITUTE LEGAL ADVICE TO THE HOLDER. THE HOLDER IS URGED TO CONSULT ITS TAX ADVISERS WITH REGARD TO THE APPLICATION OF THE U.S. FEDERAL INCOME TAX LAWS TO ITS PARTICULAR SITUATION AS WELL AS ANY TAX CONSEQUENCES ARISING UNDER THE LAWS OF ANY STATE, LOCAL OR FOREIGN TAXING JURISDICTION OR UNDER TAX TREATIES, AND OF ANY CHANGES (PROPOSED OR OTHERWISE) IN APPLICABLE LAWS.
Tax Consequences to the Holder
Payments on the Note
Subject to the discussion below regarding backup withholding, principal and interest income (including original issue discount, if any) paid by us or any paying agent to the Holder will be exempt from U.S. federal income and withholding tax, provided that, in the case of interest, the certification requirement described in the next sentence has been fulfilled. The certification requirement will be fulfilled if the Holder certifies on IRS Form W-8BEN (or an appropriate substitute form), under penalties of perjury, that it is not a U.S. person and provides its name and address.
Interest income on the note that for any reason is not exempt from U.S. federal income and withholding tax generally will be subject to U.S. withholding tax at a 30% rate, subject to reduction by an applicable treaty.
Sale, Exchange or Other Disposition of the Note or Common Stock
Subject to the discussion below regarding backup withholding, the Holder generally will not be subject to U.S. federal income and withholding tax on gain realized on a sale, exchange or other disposition of the note or of our common stock, unless we are or have been, at any time within the shorter of (x) the five-year period preceding such sale or other disposition or (y) the period the Holder has held the note or common stock, a U.S. real property holding corporation for U.S. federal income tax purposes. (However, as long as our common stock is regularly traded on an established securities market, the Holder would be subject to taxation under the foregoing exception only if it had held (or had been deemed to hold) more than 5% of our common stock at any time during such five-year or shorter period or only if the Holder acquired the note which, on the date acquisition, had a fair market value greater than 5% of the fair market value of our common stock.) We do not believe that we are currently or have ever been a U.S. real property holding corporation or that we will become one in the future, although there can be no assurance that we will not become such a corporation.
Any gain realized on a sale, exchange or other disposition of the note that is taxed as interest income will be subject to the rules described above regarding taxation of interest (see “Payment on the Note,” above).
Conversion of Note into Common Stock
The Holder generally will not be subject to U.S. federal income and withholding tax on the conversion of the note into shares of our common stock. However, any gain recognized by the Holder due to the receipt of cash (including cash received in lieu of a fractional share) on the conversion of the note into our common stock will be subject to the rules described above regarding the sale, exchange or other disposition of the note.
Distributions on Note and Common Stock
Dividends actually paid to the Holder on our common stock generally will be subject to U.S. withholding tax at a 30% rate, subject to reduction under an applicable treaty. In order to obtain a reduced rate of withholding, the Holder will be required to provide a properly executed IRS Form W-8BEN (or an appropriate substitute form) certifying its entitlement to benefits under a treaty. If the Holder is subject to withholding tax under such circumstances it should consult his own tax adviser as to whether it can obtain a refund of all or a portion of the withholding tax.
If the Holder, in its capacity as a note-holder, were deemed to receive a constructive dividend, it will be subject to U.S. withholding tax at a 30% rate, subject to reduction by an applicable treaty, on the taxable amount of the dividend. A “constructive dividend” could arise if at any time we decrease the conversion price, either at our discretion or pursuant to the anti-dilution provisions of the note, since the decrease could be deemed to be the payment of a taxable stock dividend (even though the Holder would not receive cash or other property). However, as a general rule a reasonable decrease in the conversion price in the event of stock dividends (or distributions of rights to our stockholders to subscribe for our common stock) will not be a taxable dividend. In certain circumstances, the failure to adjust the conversion price could result in a deemed distribution to the holders of our common stock (including the Holder if it had at that time converted a portion of the note to common stock).
| - 157 - |
Backup Withholding and Information Reporting
Information returns generally will be filed with the IRS in connection with payments on the note and the common stock and may be filed in connection with the proceeds from a sale or other disposition of the note or the common stock. The Holder may be subject to United States backup withholding tax on these payments unless it complies with certification procedures to establish that it is not a U.S. person. The amount of any backup withholding from a payment will be allowed as a credit against the Holder’s U.S. federal income tax liability and may entitle the Holder to a refund, provided that the required information is timely furnished to the IRS.
The consolidated financial statements for the fiscal year ended December 31, 2013 and December 31, 2012 included in this prospectus have been audited by MadsenAnthony Kam & Associates CPA’s, Inc.Limited, CPA., an independent registered public accounting firm, given on the authority of that firm as experts in accounting and auditing to the extent and for the periods indicated in their report appearing elsewhere herein.
Sichenzia Ross Friedman Ference LLP, 61 Broadway, 32nd Floor, New York, New York 10006 has passed upon the validity of the note and the underlying shares of common stock to be sold in this offering.
WHERE YOU CAN FIND MORE INFORMATION
We have filed with the Securities and Exchange Commission a registration statement on Form S-1, together with any amendments and related exhibits, under the Securities Act, with respect to ourthe resale of the note and the shares of common stock offered by this prospectus.issuable upon conversion of the note. The registration statement contains additional information about us and our shares of common stock that we are offering in this prospectus.
We file annual, quarterly and current reports and other information with the Securities and Exchange Commission under the Securities Exchange Act of 1934, as amended. Our Securities and Exchange Commission filings are available to the public over the Internet at the Securities and Exchange Commission’s website athttp://www.sec.gov. You may also read and copy any document we file at the Securities and Exchange Commission’s public reference room located at 100 F Street, N.E., Washington, D.C. 20549. Please call the Securities and Exchange Commission at 1-800-SEC-0330 for further information on the public reference rooms and their copy charges. Access to those electronic filings is available as soon as practicable after filing with the Securities and Exchange Commission. You may also request a copy of those filings, excluding exhibits, from us at no cost. Any such request should be addressed to us at: Room 3801, Block A, China Shine Plaza, No. 9 Lin He Xi Road, Tianhe District, Guangzhou City, P.R.C., Attn: Solomon Lee, CEO.
SINO AGRO FOOD, INC. AND SUBSIDIARIES
CONSOLIDATED FINANCIAL STATEMENTS
FOR THE YEAR ENDED DECEMBER 31, 2012 AND 2011
SINO AGRO FOOD, INC. AND SUBSIDIARIES
INDEX TO CONSOLIDATED FINANCIAL STATEMENTS
REPORT OF INDEPENDENT REGISTERED PUBLIC ACCOUNTING FIRM
To the Board of Directors and Stockholders of
Sino Agro Food, Inc.
(Incorporated in the State of Nevada, United States of America)
We have audited the accompanying consolidated balance sheets of Sino Agro Food, Inc. and subsidiaries as of December 31, 2012 and December 31, 2011, and the consolidated statements of income and other comprehensive income, the consolidated statements of stockholders’ equity, and the consolidated statements of cash flows for the years ended December 31, 2012 and December 31, 2011. These consolidated financial statements are the responsibility of the Company’s management. Our responsibility is to express an opinion on these consolidated financial statements based on our audits.
We conducted our audits in accordance with the standards of the Public Company Accounting Oversight Board (“PCAOB”).Those standards require that we plan and perform the audit to obtain reasonable assurance about whether the financial statements are free of material misstatement. The Company is not required to have, nor have we been engaged to perform, an audit of its internal control over financial reporting. Our audit included consideration of internal control over financial reporting as a basis for designing audit procedures that are appropriate in the circumstances, but not for the purpose of expressing an opinion on the effectiveness of the Company’s internal control over financial reporting. Accordingly, we express no such opinion. An audit also includes examining, on a test basis, evidence supporting the amounts and disclosures in the financial statements, assessing the accounting principles used and significant estimates made by management, as well as evaluating the overall financial statements presentation. We believe that our audits provide a reasonable basis for our opinion.
The Company has restated its statement of cash flows to correct an error related to the reporting of cash flows from the sale of a subsidiary during 2011. The effects of this restatement are explained in note 34 to the consolidated financial statements.
In our opinion, these consolidated financial statements referred to above present fairly, in all material respects, the consolidated financial position of Sino Agro Food, Inc. and subsidiaries as of December 31, 2012, and December 31, 2011, and the consolidated results of its operations and its cash flows for each of the years ended December 31, 2012 and December 31, 2011, in conformity with accounting principles generally accepted in the United States of America.
April 15, 2013, except for note 34 to the financial statements which is dated April 23, 2013
SINO AGRO FOOD, INC.
CONSOLIDATED BALANCE SHEETS
AS AT DECEMBER 31, 2012 AND 2011
| 2012 | 2011 | |||||||
| $ | $ | |||||||
| ASSETS | ||||||||
| Current assets | ||||||||
| Cash and cash equivalents | $ | 8,424,265 | $ | 1,387,908 | ||||
| Inventories | 17,114,755 | 4,435,445 | ||||||
| Cost and estimated earnings in excess of billings on uncompleted contracts | 2,336,880 | 456,104 | ||||||
| Deposits and prepaid expenses | 47,308,857 | 14,868,838 | ||||||
| Accounts receivable, net of allowance for doubtful accounts | 52,948,350 | 27,531,915 | ||||||
| Due from related parties | - | 15,820,752 | ||||||
| Other receivables | 5,954,248 | 9,688,871 | ||||||
| Total current assets | 134,087,355 | 74,189,833 | ||||||
| Property and equipment | ||||||||
| Property and equipment, net of accumulated depreciation | 19,946,302 | 2,667,765 | ||||||
| Construction in progress | 24,492,510 | 3,577,869 | ||||||
| Land use rights, net of accumulated amortization | 55,733,246 | 56,507,470 | ||||||
| Total property and equipment | 100,172,058 | 62,753,104 | ||||||
| Other assets | ||||||||
| Goodwill | 724,940 | 724,940 | ||||||
| Proprietary technologies, net of accumulated amortization | 8,114,624 | 6,977,675 | ||||||
| Long term accounts receivable | - | 5,936,718 | ||||||
| License rights | 1 | 1 | ||||||
| Unconsolidated equity investee | - | 1,258,607 | ||||||
| Total other assets | 8,839,565 | 14,897,941 | ||||||
| Total assets | $ | 243,098,978 | $ | 151,840,878 | ||||
| LIABILITIES AND STOCKHOLDERS' EQUITY | ||||||||
| Current liabilities | ||||||||
| Accounts payable and accrued expenses | $ | 5,762,643 | $ | 1,202,104 | ||||
| Billings in excess of costs and estimated earnings on uncompleted contracts | 2,790,084 | 1,962,119 | ||||||
| Due to a director | 3,345,803 | 289,764 | ||||||
| Dividends payable | 951,308 | 155,957 | ||||||
| Other payables | 6,654,478 | 11,968,148 | ||||||
| Due to related parties | - | 867,413 | ||||||
| Short term bank loan | 3,181,927 | - | ||||||
| 22,686,243 | 16,445,505 | |||||||
| Non-current liabilities | ||||||||
| Deferred dividends payable | 3,146,987 | - | ||||||
| Long term debts | 175,006 | - | ||||||
| 3,321,993 | - | |||||||
| Commitments and contingencies | - | - | ||||||
| Stockholders' equity | ||||||||
| Preferred stock: $0.001 par value | ||||||||
| (10,000,000 shares authorized, 10,000,100 and 7,000,100 shares issued and outstanding as of December 31, 2012 and December 31, 2011, respectively) | - | - | ||||||
| Series A preferred stock: $0.001 par value | ||||||||
| (100 shares designated, 100 shares issued and outstanding as of December 31, 2012 and December 31, 2011, respectively) | - | - | ||||||
| Series B convertible preferred stock: $0.001 par value | ||||||||
| (10,000,000 shares designated, 10,000,000 and 7,000,000 shares issued and outstanding as of December 31,2012 and December 31, 2011, respectively) | 10,000 | 7,000 | ||||||
| Series F Non-convertible preferred stock: $0.001 par value | ||||||||
| (1,000,000 shares designated, 0 shares issued and outstanding as of December 31, 2012 and December 31, 2011, respectively) | - | - | ||||||
| Common stock: $0.001 par value | ||||||||
| (130,000,000 shares authorized, 100,004,850 and 67,034,262 shares issued and oustanding as of December 31, 2012 and December 31, 2011, respectively) | 100,005 | 67,034 | ||||||
| Additional paid - in capital | 91,216,428 | 72,794,902 | ||||||
| Retained earnings | 103,864,308 | 50,395,444 | ||||||
| Accumulated other comprehensive income | 3,868,274 | 3,446,838 | ||||||
| Treasury stock | (1,250,000 | ) | (1,250,000 | ) | ||||
| Total Sino Agro Food, Inc. and subsidiaries stockholders' equity | 197,809,015 | 125,461,218 | ||||||
| Non - controlling interest | 19,281,727 | 9,934,155 | ||||||
| Total stockholders' equity | 217,090,742 | 135,395,373 | ||||||
| Total liabilities and stockholders' equity | $ | 243,098,978 | $ | 151,840,878 | ||||
The accompanying notes are an integral part of these consolidated financial statements.
SINO AGRO FOOD, INC.
CONSOLIDATED STATEMENTS OF INCOME AND OTHER COMPREHENSIVE INCOME
FOR THE YEARS ENDED DECEMBER 31, 2012 AND 2011
| 2012 | 2011 | |||||||
| $ | $ | |||||||
| Continuing operations | ||||||||
| Revenue | 138,613,639 | 51,879,903 | ||||||
| Cost of goods sold | 68,807,471 | 26,951,874 | ||||||
| Gross profit | 69,806,168 | 24,928,029 | ||||||
| General and administrative expenses | (8,385,862 | ) | (5,302,736 | ) | ||||
| Net income from operations | 61,420,306 | 19,625,293 | ||||||
| Other income (expenses) | ||||||||
| Government grant | 139,836 | - | ||||||
| Other income | 308,332 | 449,498 | ||||||
| Gain of extinguishment of debts | 1,666,386 | 987,518 | ||||||
| Interest expenses | (282,320 | ) | - | |||||
| Net other income (expenses) | 1,832,234 | 1,437,016 | ||||||
| Net income before income taxes | 63,252,540 | 21,062,309 | ||||||
| Provision for income taxes | - | (31 | ) | |||||
| Net income from continuing operations | 63,252,540 | 21,062,278 | ||||||
| Less: Net (income) attributable to the non - controlling interest | (5,706,708 | ) | (5,371,246 | ) | ||||
| Net income from continuing operations attributable to the Sino Agro Food, Inc. and subsidiaries | 57,545,832 | 15,691,032 | ||||||
| Discontinued operations | ||||||||
| Net income from discontinued operations | - | 10,203,951 | ||||||
| Less: Net income attributable to the non - controlling interest | - | - | ||||||
| Net income from discontinued operations attributable to the Sino Agro Food, Inc. and subsidiaries | - | 10,203,951 | ||||||
| Net income attributable to the Sino Agro Food, Inc. and subsidiaries | 57,545,832 | 25,894,983 | ||||||
| Other comprehensive income | ||||||||
| Foreign currency translation gain | 448,984 | 3,815,775 | ||||||
| Comprehensive income | 57,994,816 | 29,710,758 | ||||||
| Less: other comprehensive (income) loss attributable to the non - controlling interest | (27,548 | ) | (721,880 | ) | ||||
| Comprehensive income attributable to the Sino Agro Food, Inc. and subsidiaries | 57,967,268 | 28,988,878 | ||||||
| Earnings per share attributable to Sino Agro Food, Inc. and subsidiaries common stockholders: | ||||||||
| From continuing and discontinued operations | ||||||||
| Basic | $ | 0.70 | $ | 0.43 | ||||
| Diluted | $ | 0.63 | $ | 0.39 | ||||
| Earnings per share attributable to Sino Agro Food, Inc. and subsidiaries common stockholders: | ||||||||
| From continuing operations | ||||||||
| Basic | $ | 0.70 | $ | 0.26 | ||||
| Diluted | $ | 0.63 | $ | 0.23 | ||||
| Weighted average number of shares outstanding: | ||||||||
| Basic | 82,016,910 | 60,158,210 | ||||||
| Diluted | 92,016,910 | 67,158,210 | ||||||
The accompanying notes are an integral part of these consolidated financial statements.
SINO AGRO FOOD, INC.
CONSOLIDATED STATEMENTS OF SHAREHOLDERS’ EQUITY
FOR THE YEARS ENDED DECEMBER 31, 2012 AND 2011
| Series A | Series B Convertible | Series F Non convertible | ||||||||||||||||||||||||||||||
| Common stock | Preferred stock | Preferred stock | preferred stock | |||||||||||||||||||||||||||||
| Par value $0.001 | Par value $0.001 | Par value $0.001 | Par value $0.001 | |||||||||||||||||||||||||||||
| Number | Number | Number | Number | |||||||||||||||||||||||||||||
| of shares | Amount | of shares | Amount | of shares | Amount | of shares | Amount | |||||||||||||||||||||||||
| $ | $ | $ | $ | |||||||||||||||||||||||||||||
| Balance as of January 1, 2011 | 55,474,136 | 55,474 | 100 | - | 7,000,000 | 7,000 | - | - | ||||||||||||||||||||||||
| Issue of common stock | ||||||||||||||||||||||||||||||||
| - For settlement of debts | 15,619,397 | 15,619 | - | - | - | - | - | - | ||||||||||||||||||||||||
| - Services rendered | 1,800,000 | 1,800 | - | - | - | - | - | - | ||||||||||||||||||||||||
| - Employees' compensation | 2,760,729 | 2,761 | - | - | - | - | - | - | ||||||||||||||||||||||||
| Common stock redeemed at stated value for cancellation | (8,620,000 | ) | (8,620 | ) | - | - | - | - | - | - | ||||||||||||||||||||||
| Purchases of treasury stock | - | - | - | - | - | - | - | - | ||||||||||||||||||||||||
| Disposal of HYT group | - | - | - | - | - | - | - | - | ||||||||||||||||||||||||
| Net income for the year | ||||||||||||||||||||||||||||||||
| - Continuing operation | - | - | - | - | - | - | - | - | ||||||||||||||||||||||||
| - Discontinued operation | - | - | ||||||||||||||||||||||||||||||
| Dividends | - | - | - | - | - | - | - | - | ||||||||||||||||||||||||
| Foreign currency translation gain | - | - | - | - | - | - | - | - | ||||||||||||||||||||||||
| Balance as of December 31, 2011 | 67,034,262 | 67,034 | 100 | - | 7,000,000 | 7,000 | - | - | ||||||||||||||||||||||||
| Issue of Series B convertible preferred stock | - | - | - | - | 3,000,000 | 3,000 | - | - | ||||||||||||||||||||||||
| Issue of common stock | ||||||||||||||||||||||||||||||||
| - settlement of debts | 32,064,588 | 32,065 | - | - | - | - | - | - | ||||||||||||||||||||||||
| - Employees' compensation | 906,000 | 906 | ||||||||||||||||||||||||||||||
| Amortize discount- Convertible notes | ||||||||||||||||||||||||||||||||
| Net income for the year | ||||||||||||||||||||||||||||||||
| - Continuing operation | - | - | - | - | - | - | - | - | ||||||||||||||||||||||||
| Business combination of subsidiaries | ||||||||||||||||||||||||||||||||
| Dividends | - | - | - | - | - | - | - | - | ||||||||||||||||||||||||
| Foreign currency translation gain | - | - | - | - | - | - | - | - | ||||||||||||||||||||||||
| Balance as of December 31, 2012 | 100,004,850 | 100,005 | 100 | - | 10,000,000 | 10,000 | - | - | ||||||||||||||||||||||||
The accompanying notes are an integral part of these consolidated financial statements.
SINO AGRO FOOD, INC.
CONSOLIDATED STATEMENTS OF SHAREHOLDERS’ EQUITY
FOR THE YEARS ENDED DECEMBER 31, 2012 AND 2011
| Accumulated | ||||||||||||||||||||||||||||
| Treasury stock | Additional | other | Non - | |||||||||||||||||||||||||
| Number | paid - in | Retained | comprehensive | controlling | ||||||||||||||||||||||||
| of shares | Amount | capital | earnings | income | interest | Total | ||||||||||||||||||||||
| $ | $ | $ | $ | $ | $ | |||||||||||||||||||||||
| Balance as of January 1, 2011 | - | - | 58,586,362 | 25,019,971 | 3,804,116 | 13,578,958 | 101,051,881 | |||||||||||||||||||||
| Issue of common stock | ||||||||||||||||||||||||||||
| - settlement of debts | - | - | 11,496,767 | - | - | - | 11,512,386 | |||||||||||||||||||||
| - services rendered | - | - | 1,618,200 | - | - | - | 1,620,000 | |||||||||||||||||||||
| - employees' compensation | - | - | 2,664,353 | - | - | - | 2,667,114 | |||||||||||||||||||||
| Common stock redeemed at stated value for cancellation | - | - | (1,570,780 | ) | - | - | - | (1,579,400 | ) | |||||||||||||||||||
| Purchases of treasury stock | (1,000,000 | ) | (1,250,000 | ) | - | - | - | - | (1,250,000 | ) | ||||||||||||||||||
| Disposal of HYT group | - | - | - | - | (3,451,173 | ) | (9,737,929 | ) | (13,189,102 | ) | ||||||||||||||||||
| Net income for the year | ||||||||||||||||||||||||||||
| - Continuing operation | - | - | - | 15,691,032 | - | 5,371,246 | 21,062,278 | |||||||||||||||||||||
| - Discontinued operation | - | - | - | 10,203,951 | - | - | 10,203,951 | |||||||||||||||||||||
| Dividends | - | - | - | (519,510 | ) | - | - | (519,510 | ) | |||||||||||||||||||
| Foreign currency translation gain | - | - | - | - | 3,093,895 | 721,880 | 3,815,775 | |||||||||||||||||||||
| Balance as of December 31, 2011 | (1,000,000 | ) | (1,250,000 | ) | 72,794,902 | 50,395,444 | 3,446,838 | 9,934,155 | 135,395,373 | |||||||||||||||||||
| . | ||||||||||||||||||||||||||||
| Issue of Series B convertible preferred stock | - | - | - | - | - | - | 3,000 | |||||||||||||||||||||
| Issue of common stock | ||||||||||||||||||||||||||||
| - settlement of debts | - | - | 17,831,352 | - | - | - | 17,863,417 | |||||||||||||||||||||
| - employees' compensation | - | - | 361,494 | - | - | - | 362,400 | |||||||||||||||||||||
| Amortize discount - Convertible notes | 228,680 | 228,680 | ||||||||||||||||||||||||||
| Net income for the year | ||||||||||||||||||||||||||||
| - Continuing operation | - | - | - | 57,545,832 | - | 5,706,708 | 63,252,540 | |||||||||||||||||||||
| Business combination of subsidiaries | - | - | - | - | - | 3,613,31 6 | 3,613,31 6 | |||||||||||||||||||||
| Dividends | - | - | - | (4,076,968 | ) | - | - | (4,076,968 | ) | |||||||||||||||||||
| Foreign currency translation gain | - | - | - | - | 421,436 | 27,548 | 448,984 | |||||||||||||||||||||
| Balance as of December 31, 2012 | (1,000,000 | ) | (1,250,000 | ) | 91,216,428 | 103,864,308 | 3,868,274 | 19,281,727 | 217,090,742 | |||||||||||||||||||
The accompanying notes are an integral part of these consolidated financial statements.
SINO AGRO FOOD, INC.
CONSOLIDATED STATEMENT OF CASH FLOWS
FOR THE YEARS ENDED DECEMBER 31, 2012 AND 2011
| 2012 | 2011 | |||||||
| Cash flows from operating activities | ||||||||
| Net income from continuing operations | $ | 63,252,540 | $ | 21,062,278 | ||||
| Adjustments to reconcile net income from continuing operations to net cash from operations: | ||||||||
| Depreciation | 443,361 | 220,810 | ||||||
| Amortization | 1,934,909 | 1,043,181 | ||||||
| (Gain) on extinguishment of debts | (1,666,386 | ) | (987,518 | ) | ||||
| Common stock issued for services and employee's compensation | 2,229,657 | 2,139,057 | ||||||
| Changes in operating assets and liabilities: | ||||||||
| Increase in inventories | (10,037,494 | ) | (3,018,112 | ) | ||||
| Increase in deposits and prepaid expenses | (34,307,276 | ) | (7,374,355 | ) | ||||
| Increase (decrease) in due to a director | 12,239,470 | (6,313,966 | ) | |||||
| Increase in accounts payable and accrued expenses | 3,330,443 | 833,667 | ||||||
| (Decrease) increase in other payables | 1,482,417 | 16,748,043 | ||||||
| Increase in accounts receivable | (18,142,198 | ) | (18,250,484 | ) | ||||
| Increase in cost and estimated earnings in excess of billings on uncompleted contracts | (1,880,776 | ) | (456,104 | ) | ||||
| Increase in billings on uncompleted contracts in excess of costs and estimated earnings | 827,965 | 1,962,119 | ||||||
| (Decrease) Increase in due to related parties | (867,413 | ) | 643,529 | |||||
| Decrease (Increase) in due from related parties | 15,820,752 | - | ||||||
| Decrease (increase) in other receivables | 3,734,623 | (3,651,677 | ) | |||||
| Net cash provided by operating activities | 38,394,594 | 4,600,468 | ||||||
| Cash flows from investing activities | ||||||||
| Acquisition of proprietary technologies | (1,500,000 | ) | - | |||||
| Purchases of property and equipment | (10,756,744 | ) | (252,346 | ) | ||||
| Proceeds of disposal of subsidiaries | - | 557,700 | ||||||
| Investment in unconsolidated equity investees | - | (1,258,607 | ) | |||||
| Net cash outflow from business combination of subsidiaries less cash acquired | (6,893,349 | ) | - | |||||
| Payment for construction in progress | (19,185,878 | ) | (1,346,394 | ) | ||||
| Net cash used in investing activities | (38,335,971 | ) | (2,299,647 | ) | ||||
| Cash flows from financing activities | ||||||||
| Proceeds From Long term debt | 175,006 | - | ||||||
| Non-controlling interest contribution | 3,634,064 | - | ||||||
| Proceeds from Short term debt | 3,181,927 | - | ||||||
| Dividends paid | (134,631 | ) | (573,814 | ) | ||||
| Net cash provided by (used in) financing activities | 6,856,366 | (573,814 | ) | |||||
| Net cash provided by continuing operations | 6,914,989 | 1,727,007 | ||||||
| Cash flows from discontinued operations | ||||||||
| Net cash provided by operating activities | - | - | ||||||
| Net cash used in investing activities | - | (3,137,885 | ) | |||||
| Net cash used in financing activities | - | - | ||||||
| Net cash used in discontinued operations | - | (3,137,885 | ) | |||||
| Effects on exchange rate changes on cash | 121,368 | (1,091,240 | ) | |||||
| Increase in cash and cash equivalents | 7,036,357 | (2,502,118 | ) | |||||
| Cash and cash equivalents, beginning of year | 1,387,908 | 3,890,026 | ||||||
| 8,424,265 | 1,387,908 | |||||||
| Less: cash and cash equivalents at the end of the year - discontinued operation | - | - | ||||||
| Cash and cash equivalents at the end of the year - continuing operations | $ | 8,424,265 | $ | 1,387,908 | ||||
| Supplementary disclosures of cash flow information: | ||||||||
| Cash paid for interest | $ | 282,320 | - | |||||
| Cash paid for income taxes | - | $ | 31 | |||||
| Non - cash transactions: | ||||||||
| Common stock issued for settlement of debts | $ | 17,863,417 | $ | 11,512,386 | ||||
| Series B convertible preferred stock | $ | 3,000 | - | |||||
| Common stock issued for service and employee compensation | $ | 362,400 | $ | 4,278,114 | ||||
| Common stock acquired for cancellation | - | $ | (1,579,400 | ) | ||||
| Transfer to property and equipment from construction in progress | $ | 6,419,170 | - | |||||
| Transfer to land use rights from construction in progress | $ | 528,451 | - | |||||
| Settlement of land use rights payable in contra of disposal proceeds receivable | - | $ | 38,056,750 | |||||
| Disposal proceeds receivable from sale of subsidiaries, HYT and ZX | - | $ | 5,386,233 | |||||
| Purchases of treasury stock | - | $ | (1,250,000 | ) | ||||
Note: Certain comparative figures have been reclassified to conform to current year presentation.
The accompanying notes are an integral part of these consolidated financial statements.
SINO AGRO FOOD, INC. AND SUBSIDIARIES
NOTES TO CONSOLIDATED FINANCIAL STATEMENTS
Sino Agro Food, Inc. (the “Company” or “SIAF”) (formerly known as Volcanic Gold, Inc. and A Power Agro Agriculture Development, Inc.) was incorporated on October 1, 1974 in the State of Nevada.
The Company was engaged in the mining and exploration business but ceased its mining and exploring business on October 14, 2005. On August 24, 2007, the Company entered into a Merger and Acquisition Agreement with Capital Award Inc., a Belize corporation (“CA”) and its subsidiaries Capital Stage Inc. (“CS”) and Capital Hero Inc. (“CH”). Effective the same date, CA completed a reverse merger transaction with SIAF. SIAF acquired all the outstanding common stock of CA from Capital Adventure, a shareholder of CA, for 32,000,000 shares of the Company’s common stock.
On August 24, 2007 the Company changed its name from Volcanic Gold, Inc. to A Power Agro Agriculture Development, Inc. On December 8, 2007, the Company changed its name to Sino Agro Food, Inc.
On September 5, 2007, the Company acquired three existing businesses in the People’s Republic of China (the “PRC”):
On November 27, 2007, MEIJI and HST established a corporate Sino - Foreign joint venture, Jiang Men City Heng Sheng Tai Agriculture Development Co. Ltd. (“JHST”), a company incorporated in the PRC with MEIJI owning a 75% interest and HST owning a 25% interest.
On November 26, 2008, SIAF established Pretty Mountain Holdings Limited (“PMH”), a company incorporated in Hong Kong with an 80% equity interest. On May 25, 2009, PMH formed a corporate Sino-Foreign joint venture, Qinghai Sanjiang A Power Agriculture Co. Ltd. (“SJAP”), incorporated in the PRC, of which PMH owned a 45% equity interest. At the time, the remaining 55% equity interest in SJAP was owned by the following entities:
SJAP is engaged in the business of manufacturing bio-organic fertilizer, livestock feed and development of other agriculture projects in the County of Huangyuan, in the vicinity of the Xining City, Qinghai Province, PRC.
In September 2009, the Company carried out an internal reorganization of its corporate structure and business, and formed a 100% owned subsidiary, A Power Agro Agriculture Development (Macau) Limited (“APWAM”), which was formed in Macau. APWAM then acquired PMH’s 45% equity interest in SJAP. By virtue of the acquisition, APWAM assumed all obligations and liabilities of PMH under the Sino Foreign Joint Venture Agreement. On May 7, 2010, Qinghai Sanjiang sold and transferred its equity interest in SJAP to Garwor. The State Administration for Industry and Commerce of Xining City Government of the PRC approved the sale and transfer. As a result, APWAM owned 45% of SJAP and Garwor owned the remaining 55%. This remains the case as of the date of this annual report (the “Report”).
On September 9, 2010, an application was submitted by the Company to the Companies Registry of Hong Kong for deregistration of PMH under Section 291AA of the Hong Kong Companies Ordinance. On January 28, 2011, PMH was dissolved.
On February 15, 2011 and on March 29, 2011, the Company entered into an agreement and a memorandum of understanding (a “MOU”), respectively, to sell 100% equity interest in HYT group (including HYT and ZX) to Mr. Xin Ming Sun, a director of ZhongXingNong Nu Co., Ltd for $45,000,000, with an effective date of January 1, 2011.
SINO AGRO FOOD, INC. AND SUBSIDIARIES
NOTES TO CONSOLIDATED FINANCIAL STATEMENTS
The Company applied to form Enping City Bi Tao A Power Prawn Culture Development Co. Limited (“EBAPCD”), in which the Company would indirectly own a 25% equity interest on February 28, 2011.
On February 28, 2011, TRW applied to form a corporate joint venture, Enping City Bi Tao A Power Fishery Development Co., Limited (“EBAPFD”), incorporated in the PRC. TRW owned a 25% equity interest in EBAPFD. On November 17, 2011, TRW formed Jiang Men City A Power Fishery Development Co., Limited (“JFD”) in which it acquired a 25% equity interest, while withdrawing its 25% equity interest in EBAPFD. As of December 31, 2011, the Company had invested $1,258,607 in JFD. JFD operates an indoor fish farm. On January 1, 2012, the Company acquired an additional 25% equity interest in JFD for total cash consideration of $1,662,365. On April 1, 2012, the Company acquired an additional 25% equity interest in JFD for the amount of $1,702,580. The Company presently owns a 75% equity interest in JFD, representing majority of votes and controls its board of directors. As of December 31, 2012, the Company had consolidated the assets and operations of JFD.
On April 15, 2011, MEIJI applied to form Enping City A Power Cattle Farm Co., Limited (“ECF”), all of which the Company would indirectly own a 25% equity interest in on November 17, 2011. On January 1, 2012, the Company had invested $1,076,489 in ECF. On September 17, 2012 MEIJI formed Jiang Men City Hang Mei Cattle Farm Development Co., Limited (“JHMC”) and acquired additional 50% equity interest for $2,944,176 on September 30, 2012 while withdrawing its 25% equity interest in ECF. The Company presently owns 75% equity interest in JHMC, representing majority of votes and controls its board of directors. As of December 31, 2012, the Company had consolidated the assets and operations of JHMC.
On July 18, 2011, the Company formed Hunan Shenghua A Power Agriculture Co., Limited (“HSA”), in which the Company owns a 26% equity interest, and SJAP owns a 50% equity interest with the Chinese partner owning the remaining 24%. As of December 31, 2012, MEIJI and SJAP invested $130,000 and $425,000 in HSA, respectively.
The Company’s principal executive office is located at Room 3801, Block A, China Shine Plaza, No. 9 Lin He Xi Road, Tianhe District, Guangzhou City, Guangdong Province, PRC, 510610.
The nature of the operations and principal activities of the Company and its subsidiaries are described in Note 2.2.
The Company has adopted December 31 as its fiscal year end.
The accompanying consolidated financial statements include the following entities:
| ||||||
SINO AGRO FOOD, INC. AND SUBSIDIARIES
NOTES TO CONSOLIDATED FINANCIAL STATEMENTS
The consolidated financial statements are prepared in accordance with generally accepted accounting principles in the United States of America (“US GAAP”). Interim results are not necessarily indicative of results for a full year. The information included in this interim report should be read in conjunction with the information included in the Company’s annual report on Form 10-K/A for the fiscal year ended December 31, 2012.
The consolidated financial statements include the financial statements of the Company, its subsidiaries CA, CS, CH, TRW, MEIJI, HYT, ZX, HJST, JFD, JHMC, HSA and APWAM and its variable interest entity SJAP. All material inter-company transactions and balances have been eliminated in consolidation. HYT and ZX were no longer recognized as subsidiaries as of January 1, 2011 and PMH was dissolved on January 28, 2011.
SIAF, CA, CS, CH, TRW, MEIJI, JHST, JFD, JHMC, HSA, APWAM and SJAP are hereafter referred to as (the “Company”).
The Company adopted the accounting pronouncements relating to business combination (primarily contained in ASC Topic 805 “Business Combinations”), including assets acquired and liabilities assumed on arising from contingencies. These pronouncements established principles and requirement for how the acquirer of a business recognizes and measures in its financial statements he identifiable assets acquired, the liabilities assumed, and any non-controlling interest in the acquisition as well as provides guidance for recognizing and measuring the goodwill acquired in the business combination and determines what information to disclose to enable users of the financial statements to evaluate the nature and financial effects of the business combination. In addition, these pronouncements eliminate the distinction between contractual and non-contractual contingencies, including the initial recognition and measurement criteria and require an acquirer to develop a systematic and rational basis for subsequently measuring and accounting for acquired contingencies depending on their nature. The Company’s adoption of these pronouncements will have an impact on the manner in which it accounts for any future acquisitions.
The Company adopted the accounting pronouncement on non-controlling interests in consolidated financial statements, which establishes accounting and reporting standards for the non-controlling interest in a subsidiary and for the deconsolidation of a subsidiary. This guidance is primarily contained in ASC Topic “Consolidation.” It clarifies that a non-controlling interest in a subsidiary is an ownership interest in the consolidated financial statements. The adoption of this standard has not had material impact on the Company’s consolidated financial statements.
The preparation of consolidated financial statements in conformity with US GAAP requires management to make assumptions and estimates that affect the reported amounts of assets and liabilities and disclosure of contingent assets and liabilities at the dates of the consolidated financial statements and the reported amounts of revenues and expenses during the reporting periods covered thereby. Actual results could differ from these estimates. Judgments and estimates of uncertainties are required in applying the Company’s accounting policies in certain areas. The following are some of the areas requiring significant judgments and estimates: determinations of the useful lives of assets, estimates of allowances for doubtful accounts, cash flow and valuation assumptions in performing asset impairment tests of long-lived assets, estimates of the realization of deferred tax assets and inventory reserves.
SINO AGRO FOOD, INC. AND SUBSIDIARIES
NOTES TO CONSOLIDATED FINANCIAL STATEMENTS
The Company’s revenue recognition policies are in compliance with ASC 605. Sales revenue is recognized when all of the following have occurred: (i) persuasive evidence of an arrangement exists, (ii) delivery has occurred or services have been rendered, (iii) the price is fixed or determinable, and (iv) the ability to collect is reasonably assured. These criteria are generally satisfied at the time of shipment when risk of loss and title passes to the customer.
License fee income is recognized on the accrual basis in accordance with the agreements.
Government grants are recognized when (i) the Company has substantially accomplished what must be done pursuant to the terms of the grant that are established by the local government; and (ii) the Company receives notification from the local government that the Company has satisfied all of the requirements to receive the government grants; and (iii) the amounts are received.
Revenues from the Company's fishery development services contracts are performed under fixed-price contracts. Revenues under long-term contracts are accounted for under the percentage-of-completion method of accounting in accordance with the Financial Accounting Standards Board (“FASB”) Accounting Standards Codification (“ASC”) Topic 605,Revenue Recognition (“ASC 605”). Under the percentage-of-completion method, the Company estimates profit as the difference between total estimated revenue and total estimated cost of a contract and recognizes that profit over the contract term. The percentage of costs incurred determines the amount of revenue to be recognized. Payment terms are generally defined by the installation contract and as a result may not match the timing of the costs incurred by the Company and the related recognition of revenue. Such differences are recorded as either costs or estimated earnings in excess of billings on uncompleted contracts or billings in excess of costs and estimated earnings on uncompleted contracts. The Company determines a customer’s credit worthiness at the time an order is accepted. Sudden and unexpected changes in a customer’s financial condition could put recoverability at risk.
The percentage of completion method requires the ability to estimate several factors, including the ability of the customer to meet its obligations under the contract, including the payment of amounts when due. If the Company determines that collectability is not assured, the Company will defer revenue recognition and use methods of accounting for the contract such as the completed contract method until such time as the Company determines that collectability is reasonably assured or through the completion of the project.
For fixed-price contracts, the Company uses the ratio of costs incurred to date on the contract to management's estimate of the contract's total costs, to determine the percentage of completion on each contract. This method is used as management considers expended costs to be the best available measure of progression of these contracts. Contract costs include all direct material, subcontract and labor costs and those indirect costs related to contract performance, such as supplies, tool repairs and depreciation. The Company accounts for maintenance and repair services under the guidance of ASC 605 as the services provided relate to construction work. Contract costs incurred to date and expected total contract costs are continuously monitored during the term of the contract. Changes in job performance, job conditions, and estimated profitability arising from contract penalty, change orders and final contract settlements may result in revisions to the estimated profit ability during the contract. These changes, which include contracts with estimated costs in excess of estimated revenues, are recognized as contract costs in the period in which the revisions are determined. Profit incentives are included in revenues when their realization is reasonably assured. At the point the Company anticipates a loss on a contract, the Company estimates the ultimate loss through completion and recognizes that loss in the period in which the loss was identified.
The Company’s fishery development consultancy services revenues are recognized when the relevant services are rendered to a buyer.
The Company does not provide warranties to customers on a basis customary to the industry, however, customers can claim warranty directly from product manufacturers for defects in equipment or products. Historically, the Company has experienced no warranty claims
Cost of goods sold consists primarily of direct purchase cost of merchandise goods, and related levies.
Shipping and handling costs related to cost of goods sold are included in general and administrative expenses which totaled $84,298 and $58,096 for the years ended December 31, 2012 and 2011, respectively.
SINO AGRO FOOD, INC. AND SUBSIDIARIES
NOTES TO CONSOLIDATED FINANCIAL STATEMENTS
Advertising costs are included in general and administrative expenses, which totaled $1,973 and $99,526 for the years ended December 31, 2012 and 2011, respectively.
The reporting currency of the Company is the U.S. dollar. The functional currency of the Company is the Chinese Renminbi (RMB).
For those entities whose functional currency is other than the U.S. dollar, all assets and liabilities are translated into U.S. dollars at the exchange rate on the balance sheet date; shareholders’ equity is translated at historical rates and items in the statements of income and of cash flows are translated at the average rate for the period. Because cash flows are translated based on the average translation rate, amounts related to assets and liabilities reported in the statements of cash flows will not necessarily agree with changes in the corresponding balances in the balance sheets. Translation adjustments resulting from this process are included in accumulated other comprehensive income in the statements of shareholders’ equity. Transaction gains and losses that arise from exchange rate fluctuations on transactions denominated in a currency other than the functional currency are included in the statements of income and comprehensive income, as incurred.
Accumulated other comprehensive income in the consolidated statement of shareholders’ equity amounted to $3,875,101 as of December 31, 2012 and $ 3,446,838 as of December 31, 2011. The balance sheet amounts with the exception of equity as of December 31, 2012 and December 31, 2011 were translated using an exchange rate of RMB 6.29 to $1.00 and RMB 6.30 to $1.00, respectively. The average translation rates applied to the statements of income and other comprehensive income and of cash flows for the years ended December 31, 2012 and 2011 were RMB 6.31 to $1.00 and RMB 6.33 to $1.00, respectively.
The Company considers all highly liquid securities with original maturities of three months or less when acquired to be cash equivalents. Cash and cash equivalents kept with financial institutions in the PRC are not insured or otherwise protected. Should any of those institutions holding the Company’s cash become insolvent, or should the Company become unable to withdraw funds for any reason, the Company could lose the cash on deposit with that institution.
The Company maintains reserves for potential credit losses on accounts receivable. Management reviews the composition of accounts receivable and analyzes historical bad debts, customer concentrations, customer credit worthiness, current economic trends and changes in customer payment patterns to evaluate the adequacy of these reserves. Reserves are recorded primarily on a specific identification basis.
The standard credit period for most of the Company’s clients is three months. The collection period over 1 year is classified as long-term accounts receivable. Management evaluates the collectability of the receivables at least quarterly. Provision for doubtful accounts as of December 31, 2012 and 2011 are $0.
Inventories are valued at the lower of cost (determined on a weighted average basis) and net realizable value.
Costs incurred in bringing each product to its location and conditions are accounted for as follows:
Net realizable value is the estimated selling price in the ordinary course of business, less estimated costs for completion and the estimated costs necessary to make the sale.
Property and equipment are stated at cost less accumulated depreciation and any accumulated impairment losses. Such costs include the cost of replacing parts that are eligible for capitalization when the cost of replacing the parts is incurred. Similarly, when each major inspection is performed, its cost is recognized in the carrying amount of the property and equipment as a replacement only if it is eligible for capitalization. The assets’ residual values, useful lives and depreciation methods are reviewed, and adjusted if appropriate, at each financial year end.
SINO AGRO FOOD, INC. AND SUBSIDIARIES
NOTES TO CONSOLIDATED FINANCIAL STATEMENTS
Depreciation is calculated on a straight-line basis over the estimated useful lives of the assets.
An item of property and equipment is removed from the accounts upon disposal or when no future economic benefits are expected to arise from the continued use of the asset. Any gain or loss arising on disposal of the asset (calculated as the difference between the net disposal proceeds and the carrying amount of the item) is included in the consolidated statements of income in the period the item is disposed.
Goodwill is an asset representing the fair economic benefits arising from other assets acquired in a business combination that are not individually identified or separately recognized. Goodwill is tested for impairment on an annual basis at the end of the Company’s fiscal year, or when impairment indicators arise. The Company uses a fair-value-based approach to test for impairment at the level of each reporting unit. The Company directly acquired MEIJI, which is the holding company of JHST that operates the Hu Plantation. As a result of this acquisition, the Company recorded goodwill in the amount of $724,940. This goodwill represents the fair value of the assets acquired in these acquisitions over the cost of the assets acquired.
A master license of stock feed manufacturing technology was acquired and the costs of acquisition are capitalized as proprietary technologies when technological feasibility has been established. Stock feed manufacturing technology is amortized using the straight-line method over its estimated life of 20 years.
An aromatic cattle-feeding formula was acquired and the costs of acquisition are capitalized as proprietary technologies when technological feasibility has been established. Stock feed manufacturing technology is amortized using the straight-line method over its estimated life of 25 years.
The Company has determined that technological feasibility is established at the time a working model of products is completed. Proprietary technologies are intangible assets of finite lives. Management evaluates the recoverability of proprietary technologies on an annual basis at the end of the Company’s fiscal year, or when impairment indicators arise. As required by ASC Topic 350 “Intangible – Goodwill and Other”, the Company uses a fair-value-based approach to test for impairment.
Construction in progress represents direct costs of construction as well as acquisition and design fees incurred. Capitalization of these costs ceases and the construction in progress is transferred to property and equipment when substantially all the activities necessary to prepare the assets for their intended use are completed. No depreciation is provided until construction is completed and the asset is ready for its intended use.
Land use rights represent acquisition of rights to agricultural land from farmers and are amortized on the straight-line basis over their respective lease periods. The lease period of agricultural land is in the range from 30 to 60 years. Land use rights purchase prices were determined in accordance with the 2007 PRC Government’s minimum lease payments on agricultural land and mutually agreed to terms between the Company and the vendors.
A corporation formed, owned, and operated by two or more businesses as a separate and discrete business or project (venture) for their mutual benefit is considered to be a corporate joint venture. Investee entities, in which the Company can exercise significant influence, but not control, are accounted for under the equity method of accounting. Under the equity method of accounting, the Company’s share of the earnings or losses of these companies is included in net income.
SINO AGRO FOOD, INC. AND SUBSIDIARIES
NOTES TO CONSOLIDATED FINANCIAL STATEMENTS
A loss in value of an investment that is other than a temporary decline is recognized as a charge to operations. Evidence of a loss in value might include, but would not necessarily be limited to, the absence of an ability to recover the carrying amount of the investment or inability of the investee to sustain an earnings capacity that would justify the carrying amount of the investment.
A variable interest entity (“VIE”) is an entity (investee) in which the investor has obtained less than a majority interest, according to the Financial Accounting Standards Board (FASB). A VIE is subject to consolidation if a VIE meets one of the following three criteria as elaborated in ASC Topic 810-10, Consolidation:
If a firm is the primary beneficiary of a VIE, the holdings must be disclosed on the balance sheet. The primary beneficiary is defined as the person or company with the majority of variable interests. A corporation formed, owned, and operated by two or more businesses (ventures) as a separate and discrete business or project (venture) for their mutual benefit is defined as a joint venture.
Treasury stock means shares of a corporation’s own stock that have been issued and subsequently reacquired by the corporation. Converting outstanding shares to treasury shares does not reduce the number of shares issued but does reduce the number of shares outstanding. These shares are not eligible to receive dividends. Accounting for excesses and deficiencies on treasury stock transactions is governed by ASC 505-30-30.
State laws and federal agencies closely regulate transactions involving a company’s own capital stock, so the purchase of outstanding shares must have a legitimate purpose. Some of the most common reasons for purchasing outstanding shares are as follows:
The cost method of accounting for treasury shares has been adopted by the Company. The purchase of outstanding shares and thus converting them into treasury shares is treated as a temporary reduction in shareholders’ equity in view of the expectation to reissue the shares instead of retiring them. When the Company reissues the treasury shares, the temporary account is eliminated. The cost of acquiring outstanding shares for converting into treasury shares is charged to a contra account, in this case a contra equity account that reduces the stockholder equity balance.
The Company accounts for income taxes under the provisions of ASC Topic 740 “Accounting for Income Taxes.” Under ASC Topic 740, deferred tax assets and liabilities are determined based on the difference between the financial statement carrying amounts and the tax bases of assets and liabilities using enacted tax rates in effect in the years in which the differences are expected to reverse.
The provision for income tax is based on the results for the year as adjusted for items, which are non-assessable or disallowed. It is calculated using tax rates that have been enacted or substantively enacted at the balance sheet date. Deferred tax is accounted for using the balance sheet liability method in respect of temporary differences arising from differences between the carrying amount of assets and liabilities in the financial statements and the corresponding tax basis used in the computation of assessable tax profit. In principle, deferred tax liabilities are recognized for all taxable temporary differences, and deferred tax assets are recognized to the extent that it is probable that taxable profit will be available against which deductible temporary differences can be utilized.
Deferred income taxes are calculated at the tax rates that are expected to apply to the period when the asset is realized or the liability is settled. Deferred tax is charged or credited in the income statement, except when it related to items credited or charged directly to equity, in which case the deferred tax is also dealt with in equity. Deferred tax assets and liabilities are offset when they relate to income taxes levied by the same taxation authority and the Company intends to settle its current tax assets and liabilities on a net basis.
SINO AGRO FOOD, INC. AND SUBSIDIARIES
NOTES TO CONSOLIDATED FINANCIAL STATEMENTS
ASC Topic 740 also prescribes a more-likely-than-not threshold for financial statement recognition and measurement of a tax position taken, or for one expected to be taken, in a tax return. ASC Topic 740 also provides guidance related to, among other things, classification, accounting for interest and penalties associated with tax positions, and disclosure requirements. Any interest and penalties accrued related to unrecognized tax benefits will be recorded as tax expense.
The Company's operations are carried out in the PRC. Accordingly, the political, economic and legal environment in the PRC may influence the Company’s business, financial condition and results of operations by the general state of the PRC's economy. The Company's operations in the PRC are subject to specific considerations and significant risks not typically associated with companies in North America and Western Europe. The Company's results may be adversely affected by changes in governmental policies with respect to laws and regulations, anti-inflationary measures, currency conversion and remittance abroad, and rates and methods of taxation, among other things.
Cash includes cash at banks and demand deposits in accounts maintained with banks within the PRC. Total cash in these banks as of December 31, 2012 and 2011 amounted to $8,403,458 and $1,379,837, respectively, none of which is covered by insurance. The Company has not experienced any losses in such accounts and believes it is not exposed to any risks to its cash in bank accounts.
Accounts receivable are derived from revenue earned from customers located primarily in the PRC. The Company performs ongoing credit evaluations of customers and has not experienced any material losses to date.
The Company had 5 major customers (A, B, C, D & E) whose business individually represented the following percentages of the Company’s total revenue for the periods indicated:
| 2012 | 2011 | |||||||
| Customer A | 32.44 | % | - | |||||
| Customer B | 10.27 | % | - | |||||
| Customer C | 9.69 | % | - | |||||
| Customer D | 6.34 | % | - | |||||
| Customer E | 6.01 | % | - | |||||
| Customer F | 29.03 | % | ||||||
| Customer G | - | 13.96 | % | |||||
| Customer H | - | 13.87 | % | |||||
| Customer I | - | 8.24 | % | |||||
| Customer J | - | 6.68 | % | |||||
| 64.75 | % | 71.78 | % | |||||
| Segment | Amount | |||||
| Customer A | Fishery Development Division | $ | 44,966,265 | |||
| Customer B | Fishery Development Division | $ | 17,206,190 | |||
The Company’s same 5 major customers (A, B, C, D & E) whose accounts receivable balance individually represented the following percentages of the Company’s total accounts receivable for the periods indicated:
| 2012 | 2011 | |||||||
| Customer A | 18.18 | % | 15.31 | % | ||||
| Customer B | 14.32 | % | - | |||||
| Customer C | 11.14 | % | - | |||||
| Customer D | 9.94 | % | - | |||||
| Customer E | 8.23 | % | - | |||||
| Customer F | 9.14 | % | ||||||
| Customer G | - | 8.60 | % | |||||
| Customer H | - | 8.39 | % | |||||
| Customer I | - | 8.22 | % | |||||
| 61.81 | % | 49.66 | % | |||||
SINO AGRO FOOD, INC. AND SUBSIDIARIES
NOTES TO CONSOLIDATED FINANCIAL STATEMENTS
As of December 31, 2012, amounts due from customers A, B, and C are $9,628,321, $7,584,293 and $5,898,681respectively. The Company has not experienced any significant difficulty in collecting its accounts receivable in the past and is not aware ofany financial difficulties of its major customers.
In accordance with ASC Topic 360, “Property, Plant and Equipment,” long-lived assets to be held and used are analyzed for impairment whenever events or changes in circumstances indicate that the related carrying amounts may not be recoverable. The Company reviews the carrying amount of its long-lived assets, including intangibles, for impairment, each reporting period. An asset is considered impaired when estimated future cash flows are less than the carrying amount of the asset. In the event the carrying amount of such asset is considered not recoverable, the asset is adjusted to its fair value. Fair value is generally determined based on discounted future cash flow. As of December 31, 2012 and 2011, the Company determined no impairment charges were necessary.
As prescribed in ASC Topic 260 “Earnings per Share,” Basic Earnings per Share (“EPS”) is computed by dividing net income available to common stockholders by the weighted average number of common stock shares outstanding during the year. Diluted EPS is computed by dividing net income available to common stockholders by the weighted-average number of common stock shares outstanding during the year plus potential dilutive instruments such as stock options and warrants. The effect of stock options on diluted EPS is determined through the application of the treasury stock method, whereby proceeds received by the Company based on assumed exercises are hypothetically used to repurchase the Company’s common stock at the average market price during the period.
For the years ended December 31, 2012 and 2011, basic earnings per share from continuing and discontinued operations attributable to Sino Agro Food, Inc. and subsidiaries common stockholders amount to $0.70 and $0.43, respectively. For the years ended December 31, 2012 and 2011, diluted earnings per share from continuing and discontinued operations attributable to Sino Agro Food, Inc. and its subsidiaries’ common stockholders amounted to $0.63 and $0.39, respectively.
For the years ended December 31, 2012 and 2011, basic earnings per share from continuing operations attributable to Sino Agro Food, Inc. and subsidiaries common stockholders amount to $0.70 and $0.26, respectively. For the years ended December 31, 2012 and 2011, diluted earnings per share from continuing operations attributable to Sino Agro Food, Inc. and its subsidiaries’ common stockholders amounted to $0.63 and $0.23, respectively.
ASC Topic 220 “Comprehensive Income” establishes standards for reporting and displaying comprehensive income and its components in financial statements. Comprehensive income is defined as the change in stockholders’ equity of a business enterprise during a period from transactions and other events and circumstances from non-owner sources. The comprehensive income for all periods presented includes both the reported net income and net change in cumulative translation adjustments.
PRC state managed retirement benefit programs are defined contribution plans and the payments to the plans are charged as expenses when employees have rendered service entitling them to the contribution made by the employer.
The Company has adopted both ASC Topic 718, “Compensation - Stock Compensation” and ASC Topic 505-50, “Equity-Based Payments to Non- Employees” using the fair value method in which an entity issues its equity instruments to acquire goods and services from employees and non-employees. Stock compensation for stock granted to non-employees has been determined in accordance with this accounting standard and the accounting standard regarding accounting for equity instruments that are issued to other than employees for acquiring, or in conjunction with selling goods or services, as the fair value of the consideration received or the fair value of equity instruments issued, whichever is more reliably measured. This accounting standard allows the “simplified” method to determine the term of employee options when other information is not available. Under ASC Topic 718 and ASC Topic 505-50, stock compensation expenses is measured at the grant date on the value of the option or restricted stock and is recognized as expenses, less expected forfeitures, over the requisite service period, which is generally the vesting period.
SINO AGRO FOOD, INC. AND SUBSIDIARIES
NOTES TO CONSOLIDATED FINANCIAL STATEMENTS
The Company follows paragraph 825-10-50-10 of the FASB Accounting Standards Codification for disclosures about fair value of its financial instruments and paragraph 820-10-35-37 of the FASB Accounting Standards Codification (“Paragraph 820-10-35-37”) to measure the fair value of its financial instruments. Paragraph 820-10-35-37 establishes a framework for measuring fair value under U.S. GAAP, and expands disclosures about fair value measurements. To increase consistency and comparability in fair value measurements and related disclosures, Paragraph 820-10-35-37 establishes a fair value hierarchy, which prioritizes the inputs to valuation techniques used to measure fair value into three (3) broad levels. The fair value hierarchy gives the highest priority to quoted prices (unadjusted) in active markets for identical assets or liabilities and the lowest priority to unobservable inputs. The three (3) levels of fair value hierarchy defined by Paragraph 820-10-35-37 are described below:
The carrying amounts of the Company’s financial assets and liabilities, such as cash and accrued expenses, approximate their fair values because of the short maturity of these instruments. The Company does not have any assets or liabilities measured at fair value on a recurring or a non-recurring basis, consequently, the Company did not have any fair value adjustments for assets and liabilities measured at fair value at December 31, 2012 or December 31, 2011, nor gains or losses are reported in the statements of income and comprehensive income that are attributable to the change in unrealized gains or losses relating to those assets and liabilities still held at the reporting date for the fiscal year ended December 31, 2012 or December 31, 2011.
The Company does not expect any recent accounting pronouncements to have a material effect on the Company’s financial position, results of operations, or cash flows.
In May 2011, the FASB issued amendments to authoritative guidance related to fair value measurement and disclosure requirements. The new guidance changes some fair value measurement principles and enhances disclosure requirements related to activities in Level 3 of the fair value hierarchy. The amendments are effective for interim and annual periods beginning after December 15, 2011. The adoption of this guidance did not have a material effect on our consolidated financial statements.
In June 2011, the FASB issued authoritative guidance on the presentation of comprehensive income. This guidance specifies that an entity has the option to present the total of comprehensive income, the components of net income, and the components of other comprehensive income either in a single continuous statement of comprehensive income or in two separate but consecutive statements. In both choices, an entity is required to present each component of net income along with total net income, each component of other comprehensive income along with a total for other comprehensive income, and a total amount for comprehensive income. This guidance does not change the items that must be reported in other comprehensive income or when an item of other comprehensive income must be reclassified to net income. It also does not change the presentation of related tax effects, before related tax effects, or the portrayal or calculation of earnings per share. This guidance is to be applied retrospectively and is effective for fiscal years, and interim periods within those years, beginning after December 15, 2011. The adoption of this guidance did not have a material effect on our consolidated financial statements as it amended only the presentation of comprehensive income.
In July 2012, the FASB issued Accounting Standards Update ASU 2012-02, the amendments to ASC 350, Intangibles—Goodwill and Other: Testing Indefinite-Lived Intangible Assets for Impairment (“ASU 2012-02”). The amendments apply to all entities, both public and nonpublic, that have indefinite-lived intangible assets, other than goodwill, reported in their financial statements. In accordance with the amendments an entity has the option first to assess qualitative factors to determine whether the existence of events and circumstances indicates that it is more likely than not that the indefinite-lived intangible asset is impaired. If, after assessing the totality of events and circumstances, an entity concludes that it is not more likely than not that the indefinite-lived intangible asset is impaired, then the entity is not required to take further action. However, if an entity concludes otherwise, then it is required to determine the fair value of the indefinite-lived intangible asset and perform the quantitative impairment test by comparing the fair value with the carrying amount in accordance with Subtopic 350-30. An entity also has the option to bypass the qualitative assessment for any indefinite-lived intangible asset in any period and proceed directly to performing the quantitative impairment test. An entity will be able to resume performing the qualitative assessment in any subsequent period. The amendments are effective for annual and interim impairment tests performed for fiscal years beginning after September 15, 2012, and early adoption is permitted. The Company will apply these amendments for reporting periods beginning after December 31, 2012. The Company does not expect the adoption of the amendments to have a material impact on the consolidated financial statements.
SINO AGRO FOOD, INC. AND SUBSIDIARIES
NOTES TO CONSOLIDATED FINANCIAL STATEMENTS
The Company establishes standards for reporting information about operating segments on a basis consistent with the Company’s internal organization structure as well as business segments and major customers in consolidated financial statements. The Company operated in four principal reportable segments: Fishery Development Division, and HU Plantation Division and Organic Fertilizer and Bread Grass Division, Cattle Development Division and discontinued Dairy Production Division since January 1, 2011 and added a new segment in that it refers to as “Corporate and others” in January 2012. No geographic information is required as all revenue and assets are located in PRC.
| 2012 | Discontinued | |||||||||||||||||||||||||||
| Continuing operations | operations | |||||||||||||||||||||||||||
| Organic | ||||||||||||||||||||||||||||
| Fishery | Fertilizer and | Cattle Farm | Corporate | Dairy | ||||||||||||||||||||||||
| Development | HU Plantation | Bread Grass | Development | and | Production | |||||||||||||||||||||||
| Division (1) | Division (2) | Division (3) | Division (4) | others (5) | Division (6) | Total | ||||||||||||||||||||||
| Revenue | $ | 86,346,475 | $ | 11,878,599 | $ | 23,350,564 | $ | 17,038,001 | $ | - | $ | - | $ | 138,613,639 | ||||||||||||||
| Net income (loss) | $ | 39,150,568 | $ | 6,245,281 | $ | 3,875,609 | $ | 9,058,822 | $ | (784,448 | ) | $ | - | $ | 57,545,832 | |||||||||||||
| Total assets | $ | 79,222,788 | $ | 36,792,718 | $ | 96,282,055 | $ | 28,265,035 | $ | 2,536,382 | $ | - | $ | 243,098,978 | ||||||||||||||
| 2011 | Discontinued | |||||||||||||||||||||||||||
| Continuing operations | operations | |||||||||||||||||||||||||||
| Fishery Development Division (1) | HU Plantation Division (2) | Organic Fertilizer and Bread Grass Division (3) | Cattle Farm Development Division (4) | Corporate and others (5) | Dairy Production Division (6) | Total | ||||||||||||||||||||||
| Revenue | $ | 26,422,125 | $ | 6,113,155 | $ | 15,184,702 | $ | 4,159,921 | $ | - | $ | - | $ | 51,879,903 | ||||||||||||||
| Net income (loss) | $ | 10,876,752 | 2,950,339 | $ | 3,262,178 | $ | 1,466,290 | $ | (2,864,527 | ) | $ | 10,203,951 | $ | 25,894,983 | ||||||||||||||
| Total assets | $ | 37,030,261 | $ | 27,672,083 | $ | 54,353,901 | $ | 7,152,129 | $ | 25,632,504 | $ | - | $ | 151,840,878 | ||||||||||||||
Notes
United States of America
The Company was incorporated in the State of Nevada, in the United States of America. The Company has no trading operations in United States of America and no US corporate tax has been provided for in the consolidated financial statements of the Company.
SINO AGRO FOOD, INC. AND SUBSIDIARIES
NOTES TO CONSOLIDATED FINANCIAL STATEMENTS
Undistributed Earnings of Foreign Subsidiaries
The Company intends to use the remaining accumulated and future earnings of foreign subsidiaries to expand operations outside the United States and accordingly, undistributed earnings of foreign subsidiaries are considered to be indefinitely reinvested outside the United States and no provision for U.S. Federal and State income tax or applicable dividend distribution tax has been provided thereon.
China
Beginning January 1, 2008, the new Enterprise Income Tax (“EIT”) law replaced the existing laws for Domestic Enterprises (“DE’s”) and Foreign Invested Enterprises (“FIE’s”). The new standard EIT rate of 25% replaced the 33% rate currently applicable to both DE’s and FIE’s. The Company is currently evaluating the impact that the new EIT will have on its financial condition. Beginning January 1, 2008, China unified the corporate income tax rule on foreign invested enterprises and domestic enterprises. The unified corporate income tax rate is 25%.
Under new tax legislation in China beginning in January 2008, the agriculture, dairy and fishery sectors are exempt from enterprise income taxes.
No EIT has been provided in the financial statements of CA, ZX, JHST, JHMC, JFD, HSA and SJAP since they are exempt from EIT for the years ended December 31, 2012 and 2011 as they are within the agriculture, dairy and fishery sectors.
However, as of December 31, 2012, Taxation Department agreed that HSA is exempt from EIT for the years ended December 31, 2012 and 2011. No EIT has been provided in the financial statements of HSA for the income earned for the years December 31, 2012 as they are within the agriculture, dairy and fishery sectors. EIT has been provided in the financial statements of HSA at 25% for the income for the years ended December 31, 2011 as part of its revenue was generated from other source of supply other than SJAP that was not exempted from EIT.
However, as of December 31, 2012, Taxation Department agreed that JFD is exempt from EIT for the years ended December 31, 2012 and 2011. No EIT has been provided in the financial statements of JFD for the income earned for the years December 31, 2012 as they are within the agriculture, dairy and fishery sectors. JFD had been levied with an EIT of 25% in 2011, but JFD’s appeal to the Taxation Department for a waiver of this tax was successful by December 31, 2012.
Belize and Malaysia
CA, CS and CH are international business companies incorporated in Belize, and are exempt from corporate tax in Belize.
All sales invoices of CA were issued by its representative office in Malaysia and its trading and service activities are conducted in China. As the Malaysia tax law is imposed on a territorial basis and not on a worldwide basis, CA’s income is not subject to Malaysian corporate tax.
As a result, neither Belize nor Malaysia corporate tax is provided for in the consolidated financial statements of CA for the years ended December 31, 2012 and 2011.
Hong Kong
No Hong Kong profits tax has been provided in the consolidated financial statements of PMH and TRW, since these entities did not earn any assessable profits for the years ended December 31, 2012 and 2011.
Macau
No Macau Corporation tax has been provided in the consolidated financial statements of HYT, APWAM and MEIJI since these entities did not earn any assessable profits for the December 31, 2012 and 2011.
Provision for income taxes is as follows:
No deferred tax assets and liabilities are of June 30, 2013 and December 31, 2012 since there was no difference between the financial statements carrying amounts and the tax bases of assets and liabilities using enacted tax rates in effect in the period in which the differences are expected to reverse.
SINO AGRO FOOD, INC. AND SUBSIDIARIES
NOTES TO CONSOLIDATED FINANCIAL STATEMENTS
| 2012 | 2011 | |||||||
| SIAF | $ | - | $ | - | ||||
| CA, CS and CH | - | - | ||||||
| TRW | - | - | ||||||
| MEIJI and APWAM | - | - | ||||||
| JHST, JFD, JHMC and SJAP | - | - | ||||||
| HSA | - | 31 | ||||||
| $ | - | $ | 31 | |||||
On February 15, 2011 and on March 29, 2011, the Company entered into an agreement and memorandum of understanding, respectively, to sell 100% equity interest in HYT group (including HYT and ZX) to Mr. Xin Ming Sun, a director of ZhongXingNong Nu Co., Ltd for $45,000,000, with an effective date of January 1, 2011.HYT group contributed revenue and net income for the Dairy Production Division. Prior to sale of HYT group, the Dairy Production Division represented a separate business segment; the disposal group has been treated as a discontinued operation in this quarterly financial report. The post-tax result of the Dairy Production Division has been disclosed as a discontinued operation in the consolidated statement of income and comprehensive income.
| Note | 2012 | 2011 | ||||||||
| (Unaudited) | (Unaudited) | |||||||||
| Revenue | $ | - | $ | - | ||||||
| Cost of goods sold | - | - | ||||||||
| Gross profit | - | - | ||||||||
| General and administrative expenses | - | - | ||||||||
| Net income from operations | - | - | ||||||||
| Interest expense | - | - | ||||||||
| Net income before income taxes | - | - | ||||||||
| Net income from sale of subsidiaries | - | 10,203,951 | ||||||||
| Net income before income taxes | - | 10,203,951 | ||||||||
| Provision for income taxes | - | - | ||||||||
| Net income from discontinued operations | - | 10,203,951 | ||||||||
| Less: Net income attributable to the non - controlling interest | - | - | ||||||||
| Net income from discontinued operations attributable to the Sino Agro Food, Inc. and subsidiaries | $ | - | $ | 10,203,951 | ||||||
| 2011 | ||||
| Consideration received in cash and cash equivalents | $ | 704,388 | ||
| Disposal proceeds receivable of sale of subsidiaries | 44,295,612 | |||
| Total consideration proceeds | $ | 45,000,000 | ||
SINO AGRO FOOD, INC. AND SUBSIDIARIES
NOTES TO CONSOLIDATED FINANCIAL STATEMENTS
| 2011 | ||||
| Cash and cash equivalents balance disposed of | $ | (3,137,885 | ) | |
| Net cash outflow on sale of subsidiaries, HYT and ZX | $ | (3,137,885 | ) | |
| Note | 2012 | 2011 | ||||||||
| Cash flows from operating activities | ||||||||||
| Net income for the period | $ | - | $ | 10,203,951 | ||||||
| Adjustments to reconcile net income to net cash from operations: | ||||||||||
| Depreciation | - | - | ||||||||
| Amortization | - | - | ||||||||
| Net gain of sale of subsidiaries, HYT and ZX | - | (10,203,951 | ) | |||||||
| Changes in operating assets and liabilities: | ||||||||||
| Increase in inventories | - | - | ||||||||
| Increase in deposits and prepaid expenses | - | - | ||||||||
| Increase in other payables | - | - | ||||||||
| Decrease in accounts receivable | - | - | ||||||||
| Decrease in other receivables | - | - | ||||||||
| Net cash provided by operating activities | - | - | ||||||||
| Cash flows from investing activities | ||||||||||
| Net cash outflow on sale of subsidiaries, HYT and ZX | 5(c) | - | (3,137,885 | ) | ||||||
| Payment for acquisition of land use rights | - | - | ||||||||
| Payment for construction in progress | - | - | ||||||||
| Net cash used in investing activities | - | (3,137,885 | ) | |||||||
| Cash flows from financing activities | ||||||||||
| Net cash provided by financing activities | - | - | ||||||||
| Effects on exchange rate changes on cash | - | - | ||||||||
| (Decrease) increase in cash and cash equivalents | - | (3,137,885 | ) | |||||||
| Cash and cash equivalents, beginning of year | - | 3,137,885 | ||||||||
| Cash and cash equivalents, at end of year | $ | - | $ | - | ||||||
| Supplementary disclosures of cash flow information: | ||||||||||
| Cash paid for interest | $ | - | $ | - | ||||||
| Cash paid for income taxes | $ | - | $ | - | ||||||
| Non - cash transactions | ||||||||||
| Disposal proceeds receivable of sale of subsidiaries, HYT and ZX | $ | - | $ | 44,295,612 | ||||||
On October 10, 2011, the Company declared a cash dividend of $0.01 share, to be paid on November 15, 2011 to the stockholders as of the close of business on October 30, 2011.
SINO AGRO FOOD, INC. AND SUBSIDIARIES
NOTES TO CONSOLIDATED FINANCIAL STATEMENTS
On August 22, 2012, the Company’s Board of Directors declared that the Company’s stockholders were entitled to receive one share of restricted Series F Non-convertible Preferred Stock for every 100 shares of Common Stock owned by the stockholders as of September 28, 2012, with lesser or greater amounts being rounded up to the nearest 100 shares of common stock for purpose of the computing the dividend. The holders of record of shares of Series F Non – Convertible Preferred Stock shall be entitled to a coupon payment directly from the Company at the redemption rate of $3.40 per share and be payable on May 30, 2014.
On December 6, 2012, the Company's Board of Directors has declared cash dividend on its Common Stock, payable in the amount of $0.01 for every one share issued and outstanding as of December 26, 2012, with a distribution date of January 15, 2013.
| 2012 | 2011 | |||||||
| Cash dividend | ||||||||
| 95,130,730 (2011: 51,950,974) outstanding shares of $0.01 | $ | 951,307 | $ | 519,509 | ||||
| Deferred dividend | ||||||||
| 91,931,287 outstanding shares of $0.01 (2011: 0) | 3,125,661 | - | ||||||
| $ | 4,076,968 | $ | 519,509 | |||||
| 2012 | 2011 | |||||||
| Cash and bank balances | $ | 8,424,265 | $ | 1,387,908 | ||||
As of December 31, 2012, inventories are as follows:
| 2012 | 2011 | |||||||
| Sleepy cod and eels | $ | 4,612,090 | $ | - | ||||
| Bread grass | 1,473,653 | 449,984 | ||||||
| Beef cattle | 2,569,659 | 825,853 | ||||||
| Organic fertilizer | 737,166 | 807,689 | ||||||
| Forage for cattle and consumable | 278,900 | - | ||||||
| Raw materials for bread grass and organic fertilizer | 6,765,536 | 1,398,965 | ||||||
| Raw materials for HU plantation | - | 11,111 | ||||||
| Immature seeds | 677,751 | 842,313 | ||||||
| Unharvested HU plantation | - | 99,530 | ||||||
| $ | 17,114,755 | $ | 4,435,445 | |||||
| 2012 | 2011 | |||||||
| $ | $ | |||||||
| Deposits for Prepayments for purchases of equipment | 318,192 | |||||||
| Miscellaneous | 4,892,258 | |||||||
| Deposits for- acquisition of land use right | 7,826,508 | 4,453,665 | ||||||
| Deposits for- inventory purchases | 2,228,854 | 5,190,952 | ||||||
| Deposits for- aquaculture contract | 7,062,600 | 3,085,164 | ||||||
| Deposits for- building materials | 2,000,000 | - | ||||||
| Deposits for- proprietary technology | 2,254,839 | - | ||||||
| Prepayments for construction in progress | 14,423,021 | - | ||||||
| Shares issued for employee compensation and oversea professional fee | 271,800 | 2,139,057 | ||||||
| Temporary deposits payment for acquiring equity investments | 6,030,785 | - | ||||||
| 47,308,557 | 14,868,838 | |||||||
The Company made temporary deposit payments for equity investments in the future development of a prawn farm hatchery and a prawn farm nursery. Miscellaneous represents the value of the shares of the Company held by the custodian for convertible notes, rental and utility deposits, for sundries purchases and sundries prepaid expenses.
SINO AGRO FOOD, INC. AND SUBSIDIARIES
NOTES TO CONSOLIDATED FINANCIAL STATEMENTS
The Company has performed an analysis on all of its accounts receivable and determined that all amounts are collectible by the Company. As such, all accounts receivable are reflected as a current asset and no allowance for bad debt has been recorded as of December 31, 2012 and December 31, 2011. Bad debts written off for the years ended December 31, 2012 and 2011 are $0.
Aging analysis of accounts receivable is as follows:
| 2012 | 2011 | |||||||
| 0 - 30 days | $ | 10,813,981 | $ | 20,061,598 | ||||
| 31 - 90 days | 27,784,784 | 1,828,058 | ||||||
| 91 - 120 days | 6,866,842 | 2,457,259 | ||||||
| over 120 days and less than 1 year | 7,482,743 | 3,185,000 | ||||||
| over 1 year | - | 5,936,718 | ||||||
| 52,948,350 | 33,468,633 | |||||||
| Less: amounts reclassified as long term accounts receivable | - | (5,936,718 | ) | |||||
| $ | 52,948,350 | $ | 27,531,915 | |||||
| 2012 | 2011 | |||||||
| Temporary payments | $ | - | $ | 656,092 | ||||
| Due from employees | - | 130,191 | ||||||
| Due from third parties | 5,954,248 | 8,902,588 | ||||||
| $ | 5,954,248 | $ | 9,688,871 | |||||
Payments due from employees and third parties are unsecured, interest free and without fixed term of repayment. Payments due from employees are the amounts advanced for handling business transactions on behalf of the Company, and are reconciled once the business transactions have been completed.
| 2012 | 2011 | |||||||
| Due from proceeds receivable | $ | - | $ | 5,386,233 | ||||
| Due from HYT | - | 10,434,519 | ||||||
| $ | - | $ | 15,820,752 | |||||
The Company sold its 100% equity interest in the HYT Group (This group consisted of HYT and ZX) for the sum of $45,000,000. The purchaser of this equity interest was Mr. Xi Ming Sun, who is a director of ZX and owned an equity interest in the HYT Group prior to this purchase. Mr. Sun paid the Company $10,526,095 in cash (of which $8,969,078 was subsequently refunded by the Company to Mr. Sun) and the Company received land use rights valued at $38,056,750 as partial payment for the purchase of this equity interest. At December 31, 2011, Mr. Sun still owed the Company the sum of $5,386,233 and such amount was repaid to the Company during the fourth quarter of 2012. As of December 31, 2012 and 2011, the outstanding amount due from Mr. Xi Ming Sun is $0 and $5,386,233, respectively.
Due from HYT is an advance, which is unsecured, interest free and to be repaid within one year from December 31, 2011. By December 31, 2012, this sum had been repaid.
SINO AGRO FOOD, INC. AND SUBSIDIARIES
NOTES TO CONSOLIDATED FINANCIAL STATEMENTS
| 2012 | 2011 | |||||||
| Plant and machinery | $ | 3,681,644 | $ | 1,855,068 | ||||
| Structure and leasehold improvements | 15,446,062 | 27,211 | ||||||
| Mature seeds | 1,369,626 | 503,663 | ||||||
| Furniture and equipment | 212,479 | 773,185 | ||||||
| Motor vehicles | 277,513 | 106,298 | ||||||
| 20,987,324 | 3,265,425 | |||||||
| Less: Accumulated depreciation | (1,041,022 | ) | (597,660 | ) | ||||
| Net carrying amount | 19,946,302 | 2,667,765 | ||||||
Depreciation expense was $443,361 and $220,810 for the years ended December 31, 2012 and 2011, respectively.
| 2012 | 2011 | |||||||
| Construction in progress | ||||||||
| - Oven room for production of dried flowers | $ | 828,905 | $ | 826,359 | ||||
| - Office, warehouse and organic fertilizer plant in HSA | 10,450,518 | 26,646 | ||||||
| - Organic fertilizer and bread grass production plant and office building | 7,921,105 | 2,724,864 | ||||||
| - rangeland for beef cattle and office building | 5,291,982 | - | ||||||
| $ | 24,492,510 | $ | 3,577,869 | |||||
Private ownership of agricultural land is not permitted in the PRC. Instead, the Company has leased five lots of land. The cost of the first lot of land use rights acquired in 2007 was $6,194,505, which consists of 1,985.06 acres in the Hebei Province with leaseholds expiring in 2036, 2051, 2067 and 2077. The cost of the second lot of land use rights acquired in 2007 in the Guangdong Province was $6,408,289 and consists of 180.23 acres with the lease expiring in 2067. The cost of the third lot of land use rights acquired in 2008 in the Guangdong Province was $764,128, which consists of 31.84 acres with the lease expiring in 2068. The cost of the fourth lot of land use rights acquired in 2010 in the Hebei Province was $3,223,411, which consists of 825 acres with the lease expiring in 2066.The first lot of land use rights with the original cost of $6,194,505 and the fourth lot of land use rights with the original cost of $3,223,411 were disposed of with the sale of a subsidiary of ZX. The cost of the fifth lot of land use rights acquired in 2011 was $12,040,571, which consists of 93.64 acres in the Guangdong Province, with the lease expiring in 2031 and 2037. The cost of the sixth lot of land use rights acquired in 2011 was $35,405,750 which consisted of 287.21 acres in the Hunan Province, PRC and the leases expire in 2061. The cost of the seventh lot of land use rights acquired in 2012 was $528,240 which consisted of 21.09 acres in the Xining City, Qinghai Province, PRC and the leases expire in 2051.
| 2012 | 2011 | |||||||
| Cost (Note) | $ | 58,630,950 | $ | 57,845,574 | ||||
| Less: Accumulated amortization | (2,897,704 | ) | (1,338,104 | ) | ||||
| Net carrying amount | $ | 55,733,246 | $ | 56,507,470 | ||||
Note
SINO AGRO FOOD, INC. AND SUBSIDIARIES
NOTES TO CONSOLIDATED FINANCIAL STATEMENTS
| Fiscal year | Expiry date | Location | Cost | |||||
| Balance at 1.1.2011 | $ | 18,776,139 | ||||||
| 2011 | 2037 | Enping City, Guangdong Province, PRC | 12,365,293 | |||||
| 2011 | 2051, 2054 and 2071 | Linli County, Hunan Province, PRC. | 35,405,750 | |||||
| Less: disposal upon sale of a subsidiary,ZX | ||||||||
| Acquired in 2007 | Huebi Province, PRC | (6,194,505 | ) | |||||
| Acquired in 2010 | Huebi Province, PRC | (3,223,411 | ) | |||||
| Exchange adjustment | 716,307 | |||||||
| Balance at 12.31.2011 | 57,845,573 | |||||||
| 2012 | 2051 | Xining city, Qinghai Province, PRC | 528,240 | |||||
| Exchange adjustment | 257,137 | |||||||
| Balance at 12.31.2012 | $ | 58,630,950 | ||||||
Land use rights are amortized on the straight-line basis over their respective lease periods. The lease period of agriculture land is 30 to 60 years.
Amortization of land use rights was $1,599,600 and $732,946 for the years ended December 31, 2012 and 2011, respectively.
By an agreement dated November 12, 2008, TRW acquired an enzyme technology master license, registered under a Chinese patent, for the manufacturing of livestock feed and bioorganic fertilizer and its related labels for $8,000,000. On March 6, 2012 MEIJI acquired an aromatic-feed formula technology for the production of aromatic cattle for $1,500,000.
| 2012 | 2011 | |||||||
| Proprietary technologies | $ | 9,512,258 | $ | 8,000,000 | ||||
| Less: Accumulated amortization | (1,397,634 | ) | (1,022,325 | ) | ||||
| Net carrying amount | $ | 8,114,624 | $ | 6,977,675 | ||||
Amortization of proprietary technologies was $375,309 and $310,235 for the years ended December 31, 2012 and 2011, respectively. No impairments of proprietary technologies have been identified during the years ended December 31, 2012 and 2011.
Goodwill represents the fair value of the assets acquired the acquisitions over the cost of the assets acquired. It is stated at cost less accumulated impairment losses. Management tests goodwill for impairment on an annual basis or when impairment indicators arise. In these instances, the Company recognizes an impairment loss when it is probable that the estimated cash flows are less than the carrying value of the assets. To date, no such impairment loss has been recorded.
| 2012 | 2011 | |||||||
| Goodwill from acquisition | $ | 724,940 | $ | 724,940 | ||||
| Less: Accumulated impairment losses | - | - | ||||||
| Net carrying amount | $ | 724,940 | $ | 724,940 | ||||
On February 11, 2011, CA applied to form a corporate joint venture, Enping City Bi Tao A Power Prawn Culture Development Co. Limited (“EBAPCD”), incorporated in the People’s Republic of China. CA has the right to acquire up to a 75% equity interest in EBAPCD. EBAPCD has not commenced its business of prawn cultivation.
SINO AGRO FOOD, INC. AND SUBSIDIARIES
NOTES TO CONSOLIDATED FINANCIAL STATEMENTS
On February 28, 2011, TRW applied to form a corporate joint venture, Enping City Bi Tao A Power Fishery Development Co., Limited (“EBAPFD”), incorporated in the PRC. TRW owned a 25% equity interest in EBAPFD. On November 17, 2011, TRW formed Jiang Men City A Power Fishery Development Co., Limited (“JFD”) in which it acquired a 25% equity interest, while it withdrew its 25% equity interest in EBAPFD. As of December 31, 2011, the Company invested $1,258,607 in JFD. On January 1, 2012, the Company acquired an additional 25% equity interest in JFD for the amount of $1,662,365. On April 1, 2012, the Company acquired an additional 25% equity interest in JFD for the amount of $1,702,580. The Company presently owns a 75% equity interest in JFD and controls majority of votes and its board of directors. As result, the Company has consolidated the assets and operations of JFD.
On April 15, 2011, MEIJI applied to form Enping City A Power Cattle Farm Co., Limited (“ECF”), incorporated in the People’s Republic of China. MEIJI had 25% equity interest in ECF. The PRC Government granted the official name of Jiang Men City Hang Meiji Cattle Farm Development Co., Limited (“JHMC”) to ECF on June 3, 2012. On April 1, 2012, the Company acquired an additional 25% equity interest in JFD for the amount of $1,702,580. The Company presently owns a 75% equity interest in ECF and controls majority of votes and its board of directors. As result, the Company has consolidated the assets and operations of JFD.
| 2012 | 2011 | |||||||
| Investment in unconsolidated joint venture | $ | - | $ | 1,258,607 | ||||
On September 28, 2009, APWAM acquired the PMH’s 45% equity interest in the Sino-Foreign joint venture company, Qinghai Sanjiang A Power Agriculture Co. Limited (“SJAP”), which was incorporated in the People’s Republic of China. As of December 31, 2012, the Company has invested $2,251,359 in this joint venture. SJAP is engaged in its business of the manufacturing of organic fertilizer, livestock feed, and beef cattle and plantation of crops and pastures.
Continuous assessment of the VIE relationship with SJAP
The Company may also have a controlling financial interest in an entity through an arrangement that does not involve voting interests, such as a VIE. The Company evaluates entities deemed to be VIE’s using a risk and reward model to determine whether to consolidate. A VIE is an entity (1) that has total equity at risk that is not sufficient to finance its activities without additional subordinated financial support from other entities, (2) where the group of equity holders does not have the power to direct the activities of the entity that most significantly impact the entity’s economic performance, or the obligation to absorb the entity’s expected losses or the right to receive the entity’s expected residual returns, or both, or (3) where the voting rights of some investors are not proportional to their obligations to absorb the expected losses of the entity, their rights to receive the expected residual returns of the entity, or both, and substantially all of the entity’s activities either involve or are conducted on behalf of an investor that has disproportionately few voting rights.
The Company also quantitatively and qualitatively examined if SJAP is considered a VIE. Qualitative analyses considered the extent to which the nature of its variable interest exposed the Company to losses. For quantitative analyses, the Company also used internal cash flow models to determine if SJAP was a VIE and, if so, whether the Company was the primary beneficiary. The projection of these cash flows and probabilities thereof requires significant managerial judgment because of the inherent limitations that relate to the use of historical data for the projection of future events. On December 31, 2012, the Company evaluated the above VIE testing results and concluded that the Company is the primary beneficiary of SJAP’s expected losses or residual returns and that SJAP qualifies as a VIE of the Company. As result, the Company has consolidated SJAP as a VIE.
The reasons for the changes are as follows:
• Originally, the board of directors of SJAP consisted of 7 members; 3 appointees from Qinghai Sanjiang (one stockholder), 1 from Garwor (one stockholder), and 3 from the Company, such that the Company did not have majority interest represented on the board of directors of SJAP.
• On May 7, 2010, Qinghai Sanjiang sold and transferred its equity interest in SJAP to Garwor. The State Administration for Industry and Commerce of Xining City Government of the People’s Republic of China approved the sale and transfer.
SINO AGRO FOOD, INC. AND SUBSIDIARIES
NOTES TO CONSOLIDATED FINANCIAL STATEMENTS
Consequently Garwor and the Company agreed that the new board of directors of SJAP would consist of 3 members; 1 appointee from Garwor and 2 appointees from the Company, such that the Company now had a majority interest in the board of directors of SJAP. Also, and in accordance with the Company’s Sino Joint Venture Agreement, the Company’s management appointed the chief financial officer of SJAP.
As result, the financial statements of SJAP were included in the consolidated financial statements of the Company.
Pursuant to an agreement dated August 1, 2006 between Infinity Environmental Group Limited (“Infinity”) and the Company, the Company was granted an A Power Technology License with the condition that the Company was required to pay the license fee covering 500 units of APM as performance payment to Infinity on or before July 31, 2008. This license allows the Company to develop service, manage and supply A Power Technology Farms in the PRC using the A Power Technology, but subject to a condition that the Company is required to pay a license fee to Infinity once the Company has sold the license to its customer. Under the said license, the Company has the right to authorize developers and/or joint venture partners to develop A Power Technology Farms in the PRC. Infinity is a company incorporated in Australia.
| 2012 | 2011 | |||||||
| Due to third parties | $ | 877,259 | $ | 10,794,449 | ||||
| Promissory notes issued to third parties | 3,352,394 | - | ||||||
| Convertible notes payable | 232,000 | - | ||||||
| Due to local government | 2,192,825 | - | ||||||
| Due to employees and others | - | 1,114,848 | ||||||
| Land use rights payable | - | 58,851 | ||||||
| $ | 6,654,478 | $ | 11,968,148 | |||||
Due to third parties, employees and others are unsecured, interest free and have no fixed terms of repayment.
| 2012 | 2011 | |||||||
| Due to third parties | $ | - | $ | 867,413 | ||||
Due to third parties represents short term advances to various companies and individuals that in the opinion of management are for the benefit of the Company. These advances are unsecured, interest fee, have no fixed terms of repayment and are due upon demand by the Company.
| 2012 | 2011 | |||||||
| Billings | $ | 9,810,427 | $ | 19,066,400 | ||||
| Less: Costs | (1,886,705 | ) | (8,249,145 | ) | ||||
| Estimated earnings | (5,133,638 | ) | (8,855,136 | ) | ||||
| Billing in excess of costs and estimated earnings on uncompleted contract | $ | 2,790,084 | $ | 1,962,119 | ||||
SINO AGRO FOOD, INC. AND SUBSIDIARIES
NOTES TO CONSOLIDATED FINANCIAL STATEMENTS
| 2012 | 2011 | |||||||
| Costs | $ | 3,755,046 | $ | 887,540 | ||||
| Estimated earnings | 8,307,452 | 1,974,204 | ||||||
| Less: Billings | (9,725,618 | ) | (2,405,640 | ) | ||||
| Costs and estimated earnings in excess of billings on uncompleted contract | $ | 2,336,880 | $ | 456,104 | ||||
| 2012 | 2011 | |||||||
| Billings | $ | 19,536,045 | $ | 21,472,040 | ||||
| Less: Costs | (5,641,751 | ) | (9,136,685 | ) | ||||
| Estimated earnings | (13,441,090 | ) | (10,829,340 | ) | ||||
| Billing in excess of costs and estimated earnings on uncompleted contract | $ | 453,204 | $ | 1,506,015 | ||||
There are no provisions in the Company’s bank borrowings and long term debts that would accelerate repayment of debt as a result of a change in credit ratings or a material adverse change in the Company’s business. Under certain agreements, the Company has the option to retire debt prior to maturity, either at par or at a premium over par.
Short term bank loan
| Name of bank | Interest rate | Term | 2012 | 2011 | ||||||||||
| Agricultural Bank of China | 6 | % | August 8, 2012 - August 29, 2013 | |||||||||||
| Huangyuan County Branch, Xining City, Qinghai Province, | ||||||||||||||
| P.R.C. | $ | 3,181,927 | ^* | $ | - | |||||||||
Long term debts
| Name of lender | Interest rate | Term | 2012 | 2011 | ||||||||||
| Gan Guo Village Committee | 12.22 | % | June 2012 - June 2017 | |||||||||||
| Bo Huang Town | ||||||||||||||
| Huangyuan County, Xining City | ||||||||||||||
| Qinghai Province, P.R.C. | $ | 175,006 | $ | - | ||||||||||
The Group’s share capital as at December 31, 2012 and December 31, 2011shown on the consolidated balance sheet represents the aggregate nominal value of the share capital of the Company as at that date.
On March 22, 2010, the Company designated 100 shares of Series A preferred stock at a par value per share of $0.001. As of the same date, 100 shares of Series A preferred stock were issued at $1 per share for cash in the amount of $100.
The Series A Preferred Stock:
SINO AGRO FOOD, INC. AND SUBSIDIARIES
NOTES TO CONSOLIDATED FINANCIAL STATEMENTS
The Company has designated 100 shares of Series A preferred stock with 100 shares issued and outstanding as of December 31, 2012 and 2011, respectively.
The Series B Convertible Preferred Stock:
On March 22, 2010, the Company designated 7,000,000 shares of Series B convertible preferred stock at a par value per share of $0.001. The Series B convertible preferred stock is redeemable, the stockholders are not entitled to receive any dividend and voting rights but rank senior over common stockholders on liquidation, and can convert to common stock on a one for one basis at any time. On June 26, 2010, 7,000,000 shares of common stock were surrendered for cancellation and the Company issued 7,000,000 shares of Series B convertible preferred stock at $1.00 per share. Pursuant to share exchange agreement made as of December 22, 2012, between the Company and a stockholder, Capital Adventure Inc., a holder of 3,000,000 shares of common shares, with the consent of Board of Directors, to exchange for 3,000,000 shares of Series B convertible preferred stock on one-for-one basis. As of December 23, 2012, 3,000,000 shares of Series B convertible preferred stock were issued to Capital Adventure Inc., for the exchange of its holding of 3,000,000 shares of common stocks. As of December 31, 2012, 3,000,000 shares of common stocks were still not returned to the Company.
There were 10,000,000 shares and 7,000,000 shares of Series B convertible preferred stock issued and outstanding as of December 31, 2012 and December 31, 2011, respectively.
The Series F Non-Convertible Preferred Stock:
On August 13, 2012, the Company designated 1,000,000 shares of preferred stock with a par value per share of $0.001 as Series F Non-Convertible Preferred Stock with a face value of $1.00 per share with 0 shares issued and outstanding as of December 31, 2012.
The Series F Non-Convertible Preferred Stock:
Common Stock:
During the year ended December 31, 2011: (i) the Company reacquired 1,000,000 shares of its common stock which became treasury shares, for $1,250,000 at a price of $1.25 per share; (ii) the Company issued 15,619,397 shares of common stock for $12,499,902 at values ranging from$0.50 to $1.50 per share to settle debts due to third parties; (iii) the Company purchased 8,620,000 shares for $1,579,400 at prices ranging from $0.01 to $0.78 for cancellation; (iv) the Company issued employees a total of 2,760,729 shares of common stock valued at fair value of range from $0.895 per share to $1.01 per share for $2,667,114; and (v) the Company issued 1,800,000 shares of common stock to a certain company that provided consulting services for the benefit of the Company at $0.895 per share for $1,620,000.
SINO AGRO FOOD, INC. AND SUBSIDIARIES
NOTES TO CONSOLIDATED FINANCIAL STATEMENTS
The Company executed several agreements with third parties to settle debts by issuance of the Company’s common stock. The shares issued by the Company were valued at the trading price of the stock on the date the shares were issued. Any excess of the fair value of the shares over the carrying cost of the debt has been reported as a gain on the extinguishment of debts of $987,518 has been credited to operations under Other income/(expenses) for the year ended December 31, 2011. As these activities were not part of our ordinary activities, we classified them as other income/(expenses).
On December 5, 2012, the Company obtained stockholder consent for the approval of an amendment to our articles of incorporation to increase our authorized shares of common stock, no par value (the “Common Stock”), from 100,000,000 to 130,000,000. The board of directors believes that the increase in our authorized Common Stock will provide is with greater flexibility with respect to our capital structure for purposes including additional equity financings and stock based acquisitions.
During the year ended December 31, 2012, the Company issued (i) 32,064,588 shares of common stock for 18,193,714 at values ranging from $0.40 to $0.71 per share to settle debts due to third parties; and (ii) 906,000 shares of common stock valued to employees at fair value of $0.40 per share for $362,400 for employee compensation. The fair value of the common stock issued was determined by using the trading price of the Company’s common stock on the date the Shares were issued.
The Company executed several agreements with third parties to settle debts by issuance of the Company’s common stock. The shares issued by the Company were valued at the trading price of the stock on the date the shares were issued. Any excess of the fair value of the shares over the carrying cost of the debt has been reported as a gain on the extinguishment of debts of $1,666,386 has been credited to operations under Other income/(expenses) for the year ended December 31, 2012. As these activities were not part of our ordinary activities, we classified them as other income/(expenses).
The Company had common stock 100,004,850 and 67,034,262 issued and outstanding as of December 31, 2012 and 2011, respectively.
In December of 2011, the Board of Directors passed a resolution authorizing the Company to enter into an agreement to borrow funds from a third party to assist in providing a method for certain Chinese shareholders to sell their shares in the Company. The Company entered into a series of convertible promissory notes along with common stock purchase warrants whereby this third party could exercise the conversion option and settle the amount due by receiving shares of stock from these certain Chinese shareholders. The monies borrowed from this third party were deposited into a custodial account that was not controlled by the Company. The Chinese shareholders also deposited their shares with this custodian. The shares transferred to the custodian were at all times, in the opinion of management, sufficient to satisfy the obligations of the convertible promissory notes and the outstanding common stock purchase warrants. All amounts owed this financing arrangement were to be repaid through the conversion options exercised by the third party and by the deliverance of the common shares of these certain Chinese investors.
During 2012, the Company borrowed a total of $ 460,000 from this third party under five separate promissory notes. Each note carried an interest rate of 12% per annum with a maturity date of six months from the date of issuance. Under the terms of the notes, the holder of the note has the option to convert the note to common shares at a discount of 15% from the average market price of the lowest three trading prices for the common stock during the ten trading days prior to the conversion date. The Company also issued a total of 842,500 common stock purchase warrants with an exercise price of $0.50 per share with an expiration date six months from the date of issuance.
The Company calculated the fair value of the warrants and the beneficial conversion feature utilizing the Black Scholes model at the date of the issuance of each promissory note. The relative fair values were allocated to the warrants and the debt. Accordingly, a discount was created on the debt and this discount will be amortized to interest expense of the life of the debt. Debt discount amortization as of December 31, 2012 was $ 178,867.
At December 31, 2012, there was $ 232,000 principal outstanding and accrued interest in the amount of $ 9,764 that was owed under the terms of the promissory notes. The Company has recorded these amounts as payable by the Company with a corresponding asset represented by the value of the shares of the Company held by the custodian at December 31, 2012.
As indicated in the convertible promissory note footnote, during 2012, the Company borrowed a total of $ 460,000 from a third party under five separate promissory notes secured by personal guarantee of a director. Each note carried an interest rate of 12% per annum with a maturity date of six months from the date of issuance. Under the terms of the notes, the holder of the note has the option to convert the note to common shares at a discount of 15% from the average market price of the lowest three trading prices for the common stock during the ten trading days prior to the conversion date. The Company also issued a total of 842,500 common stock purchase warrants with an exercise price of $0.50 per share with an expiration date six months from the date of issuance. The Company valued the warrants on the date of issuances and recorded amounts based on their relative fair values to the debt and to the warrants. The fair value of the warrants was determined using the Black-Scholes pricing model and included the following assumptions
SINO AGRO FOOD, INC. AND SUBSIDIARIES
NOTES TO CONSOLIDATED FINANCIAL STATEMENTS
| Expected annual dividend rate | 0.00 | % | ||
| Weighted average exercise price | $ | 0.50 | ||
| Risk-free interest rate | 2.00 | % | ||
| Average expected life | 6 months | |||
| Expected volatility of common stock | 80.00 | % | ||
| Forfeiture rate | 0.00 | % |
The warrants have an exercise price of $0.5 and have a contractual life of 6 months from the date of issuance. The value of the discounts created by the warrants and beneficial conversion feature were $36,113 and $52,118, respectively. The discount related to the beneficial conversion feature will be amortized to interest expense over the life of the debt and the discount for the warrants will be amortized to interest expense over the contractual life of the warrants. The relative fair values were allocated to the warrants and the debt. Accordingly, a discount was created on the debt and this discount will be amortized to interest expense of the life of the debt.
As of December 31, 2012, the following share purchase warrants were outstanding and exercisable:
| Expiry date | Exercise date | December 31, 2012 | ||||||
| January 8, 2013 | $ | 0.50 | 150,000 | |||||
| February 15, 2013 | $ | 0.50 | 78,500 | |||||
| April 9, 2013 | $ | 0.50 | 157,000 | |||||
| 385,500 | ||||||||
Share purchase warrant transactions and the number of share purchase warrants outstanding and exercisable are summarized as follows:
| 2012 | Exercise price | |||||||
| Number of warrants outstanding at January 1, 2012 | - | - | ||||||
| Issued | 842,000 | $ | 0.50 | |||||
| Exercised | - | - | ||||||
| Expired | (457,000 | ) | - | |||||
| Number of warrants outstanding at December 31, 2012 | 385,000 | |||||||
The Company leases (i) 2,178 square feet of agriculture space used for offices for a monthly rent of $512 in Enping City, Guangdong Province, PRC, its lease expiring on March 31, 2014;(ii) 2,300 square feet of office space in Guangzhou City, Guangdong Province, PRC for a monthly rent of $4,238, its lease expiring on October 15, 2012; (iii)5,081 square feet of office space in Guangzhou City, Guangdong Province, PRC for a monthly rent of $11,838, its lease expiring on July 8, 2014; and (iv) 1,555 square feet each for two staff quarter in Linli District, Hunan Province, PRC for a monthly rent of $159, its lease expiring on January 23, 2013 and May 1, 2014.
Lease expense was $155,119 and $64,256 for the years ended December 31, 2012 and 2011, respectively.
The future minimum lease payments as of December 31, 2012, are as follows:
| 2012 | ||||
| Year ended December 31, 2013 | $ | 156,401 | ||
| Year ended December 31, 2014 | 87,843 | |||
| Thereafter | - | |||
| $ | 244,244 | |||
SINO AGRO FOOD, INC. AND SUBSIDIARIES
NOTES TO CONSOLIDATED FINANCIAL STATEMENTS
Business combination of JFD
On February 28, 2011, TRW applied to form a corporate joint venture, Enping City Bi Tao A Power Fishery Development Co., Limited (“EBAPFD”), incorporated in the PRC. TRW owned a 25% equity interest in EBAPFD. On November 17, 2011, TRW formed Jiang Men City A Power Fishery Development Co., Limited (“JFD”) in which it acquired a 25% equity interest, while withdrawing its 25% equity interest in EBAPFD. As of December 31, 2011, the Company had invested $1,258,607 in JFD. JFD is engaged as an operator of an indoor fish farm. Prior to December 31, 2011, JFD has not commenced its principal business activity. The Company owned a 50% Interest in JFD at January 1, 2012 and at the time consolidated the Assets and operation with the Company. The Company controlled the board of directors and Voting Rights at that time. On January 1, 2012, the Company acquired an additional 25% equity interest in JFD for total cash consideration of $1,662,365. On April 1, 2012, the Company acquired an additional 25% equity interest in JFD for the amount of $1,702,580.The Company presently owns a 75% equity interest in JFD and controls its majority of votes board of directors. As result, the Company had consolidated the assets and operations of JFD.
Second acquisition on January 1, 2012 – 25% additional equity interest in JFD.
The Company allocated the purchase price on the fair value of the assets acquired as of January 1, 2012.
| Net assets at fair value acquired: | ||||
| Property, plant and equipment | $ | 34,919 | ||
| Construction in progress | 4495306 | |||
| Inventory | 1838337 | |||
| 6368562 | ||||
| Less: Other payables | (92,603 | ) | ||
| Non-controlling interest | (3,324,729 | ) | ||
| 25% held by the Company | (1,662,365 | ) | ||
| $ | 1,288,865 | |||
| Satisfied by | ||||
| Purchase consideration | $ | 1,662,365 | ||
| Less: Cash acquired | (373,500 | ) | ||
| $ | 1,288,865 |
Third acquisition on April 1, 2012 – 25% additional equity interest in JFD.
The Company allocated the purchase price based on the fair value of the assets acquired as of April 1, 2012.
| Net assets at fair value acquired: | ||||
| Property, plant and equipment | $ | 33,535 | ||
| Construction in progress | 4,499,376 | |||
| Inventory | 1,970,387 | |||
| Accounts receivable | 1,337,519 | |||
| 7,840,817 | ||||
| Less: Other payables | (292,663 | ) | ||
| Accounts payable | (1,230,096 | ) | ||
| Non-controlling interest | (1,702,580 | ) | ||
| 50% held by the Company | (3,405,159 | ) | ||
| $ | 1,210,319 | |||
| Satisfied by | ||||
| Purchase consideration | $ | 1,702,580 | ||
| Less: Cash acquired | (492,261 | ) | ||
| $ | 1,210,319 |
SINO AGRO FOOD, INC. AND SUBSIDIARIES
NOTES TO CONSOLIDATED FINANCIAL STATEMENTS
Business combination of JHMC
Second acquisition on September 30, 2012 - 50% additional equity interest in JHMC
On April 15, 2011, MEIJI applied to form Enping City A Power Cattle Farm Co., Limited (“ECF”), all of which the Company would indirectly own a 25% equity interest in on November 17, 2011. On January 1, 2012, the Company had invested $1,076,489 in ECF. On September 17, 2012 MEIJI formed Jiang Men City Hang Mei Cattle Farm Development Co., Limited (“JHMC”) and acquired an additional 50% equity interest for $2,944,176 on September 30, 2012 while withdrawing its 25% equity interest in ECF. The Company presently owns a 75% equity interest in JHMC, representing majority of votes and controls its board of directors. As result, the Company has consolidated the assets and operations of JHMC.
The Company allocated the purchase price based on the fair value of the assets acquired as of September 30, 2012.
| Net assets at fair value acquired: | ||||
| Property, plant and equipment | $ | 512,450 | ||
| Construction in progress | 4,177,007 | |||
| Inventory | 671,429 | |||
| 5,360,886 | ||||
| Less: Non - controlling interest | (1,340,221 | ) | ||
| $ | 4,020,665 | |||
| Satisfied by | ||||
| Purchase consideration | $ | 4,020,665 |
The following table summarizes our unaudited consolidated results of operations for the years ended December 31, 2012 and 2011, as well as unaudited consolidated results of operations as though the JFD and JHMC acquisitions had occurred on January 1, 2011.
| 2012 | 2011 | |||||||||||||||
| As reported | Pro Forma | As reported | Pro Forma | |||||||||||||
| Revenue | $ | 138,612,639 | $ | 128,725,067 | $ | 51,879,903 | $ | 47,718,758 | ||||||||
| Net income from continuing operations | $ | 57,545,832 | $ | 50,655,603 | $ | 15,691,032 | $ | 14,041,347 | ||||||||
| Net income from discontinued operations | $ | - | $ | - | $ | 10,203,951 | $ | 10,203,951 | ||||||||
| Total net income from continuing and discontinued operations | $ | 57,545,832 | $ | 50,655,603 | $ | 25,894,983 | $ | 24,245,298 | ||||||||
| From continuing and discontinued operations Earning per share | ||||||||||||||||
| Basic | $ | 0.70 | $ | 0.68 | $ | 0.43 | $ | 0.40 | ||||||||
| Diluted | $ | 0.63 | $ | 0.55 | $ | 0.39 | $ | 0.36 | ||||||||
| From continuing operations Earning per share | ||||||||||||||||
| Basic | $ | 0.70 | $ | 0.68 | $ | 0.26 | $ | 0.23 | ||||||||
| Diluted | $ | 0.63 | $ | 0.55 | $ | 0.23 | $ | 0.21 | ||||||||
The unaudited pro forma information set forth above is for informational purpose only and include adjustments related to elimination of revenue from JFD and JHMC before acquisition of equity interests. The pro forma information should not be considered indicative of actual results that would have been achieved if JFD and JHMC have been acquired at the beginning of 2011 or results that may be obtained in any future period.
On July 1, 2011 and July 11, 2011, the Company issued employees a total of 2,760,729 shares of common stock valued at fair value of range from $0.895 per share to $1.00 per share for services rendered to the Company. On July 11, 2011, the Company issued 1,800,000 shares of common stock to a company to provide consulting services for the benefit of the Company. The fair value of the common stock issued was determined by using the trading price of the Company’s common stock on the date of issuance of $0.895 per share.
SINO AGRO FOOD, INC. AND SUBSIDIARIES
NOTES TO CONSOLIDATED FINANCIAL STATEMENTS
The Company calculated stock based compensation of $4,278,114 and recognized $2,139,057 for the year ended December 31, 2011. As of December 31, 2011, the deferred compensation balance was $2,139,057, and the deferred compensation balance of $2,139,057 was to be amortized over 6 months beginning on January 1, 2012.
On August 16, 2012, the Company issued employees a total of 100,000 shares of common stock valued at fair value of range from $0.40 per share for services rendered to the Company. On the same date, the Company issued 906,000 shares of common stock to a company to provide consulting services for the benefit of the Company. The fair value of the common stock issued was determined by using the trading price of the Company’s common stock on the date of issuance of $0.40 per share.
The Company calculated stock based compensation of $2.501,457 and recognized $2,229,657 for the year ended December 31, 2012. As of December 31, 2012, the deferred compensation balance was $271,800 and this balance of $271,800 was to be amortized over 9 months beginning on January 1, 2013.
As of December 31, 2012 and 2011, the Company did not have any pending claims, charges, or litigation that it expects would have a material adverse effect on its consolidated balance sheets, consolidated statements of incomes and other comprehensive income or cash flows.
The Company executed several agreements with third parties to settle debts by issuance of the Company’s common stock. The shares issued by the Company were valued at the trading price of the stock on the date the shares were issued. Any excess of the fair value of the shares over the carrying cost of the debt has been reported as a gain on the extinguishment of debts of $1,666,386 and $987,518 has been credited to operations under Other income/(expenses) for the years ended December 31, 2012 and 2011, respectively. As these activities were not part of our ordinary activities, we classified them as other income/(expenses).
In addition to the transactions and balances as disclosed elsewhere in these consolidated financial statements, during the years ended December 31, 2012 and 2011, the Company had the following significant related party transactions:
SINO AGRO FOOD, INC. AND SUBSIDIARIES
NOTES TO CONSOLIDATED FINANCIAL STATEMENTS
Basic earnings per share is computed by dividing net income attributable to common shareholders by the weighted average number of common shares outstanding during the period. Diluted earnings per share reflects the potential dilution of securities by including other potential common stock, including convertible preferred stock, stock options and warrants, in the weighted average number of common shares outstanding for the period, if dilutive. The numerators and denominators used in the computations of basic and dilutive earnings per share are presented in the following table:
| 2012 | 2011 | |||||||
| BASIC | ||||||||
| Numerator for basic earnings per share attributable to the Company’s common stockholders: | ||||||||
| Net income of continued operation used in computing basic earnings per share | $ | 57,545,832 | $ | 15,691,0322 | ||||
| Basic earnings per share | $ | 0.70 | $ | 0.23 | ||||
| Basic weighted average shares outstanding | 82,016,910 | 60,158,210 | ||||||
SINO AGRO FOOD, INC. AND SUBSIDIARIES
NOTES TO CONSOLIDATED FINANCIAL STATEMENTS
| 2012 | 2011 | |||||||
| DILUTED | ||||||||
| Numerator for basic earnings per share attributable to the Company’s common stockholders: | ||||||||
| Net income of continued operation used in computing basic earnings per share | $ | 57,545,832 | $ | 15,691,032 | ||||
| Basic earnings per share | $ | 0.63 | $ | 0.13 | ||||
| Basic weighted average shares outstanding | 82,016,910 | 60,158,210 | ||||||
| Add: weight average Series B Convertible preferred shares outstanding | 7,000,000 | 7,000,000 | ||||||
| Diluted weighted average shares outstanding | 89,016,910 | 67,158,210 | ||||||
| 2012 | 2011 | |||||||
| BASIC | ||||||||
| Numerator for basic earnings per share attributable to the Company’s common stockholders: | ||||||||
| Net income of continued and discontinued operation used in computing basic earnings per share | $ | 57,545,832 | $ | 25,894,983 | ||||
| Basic earnings per share | $ | 0.70 | $ | 0.43 | ||||
| Basic weighted average shares outstanding | 82,016,910 | 60,158,210 | ||||||
| 2012 | 2011 | |||||||
| DILUTED | ||||||||
| Numerator for basic earnings per share attributable to the Company’s common stockholders: | ||||||||
| Net income of continued and discontinued operation used in computing basic earnings per share | $ | 57,545,832 | $ | 25,894,983 | ||||
| Basic earnings per share | $ | 0.63 | $ | 0.39 | ||||
| Basic weighted average shares outstanding | 82,016,910 | 60,158,210 | ||||||
| Add: weight average Series B Convertible preferred shares outstanding | 7,000,000 | 7,000,000 | ||||||
| Diluted weighted average shares outstanding | 89,016,910 | 67,158,210 | ||||||
SINO AGRO FOOD, INC. AND SUBSIDIARIES
NOTES TO CONSOLIDATED FINANCIAL STATEMENTS
| 2011 | 2011 | |||||||||||
| As reported | Adjustments | Restated | ||||||||||
| Cash flows from operating activities | ||||||||||||
| Net income from continuing operations | $ | 21,062,278 | $ | 21,062,278 | ||||||||
| Adjustments to reconcile net income from continuing operations to net cash from operations: | ||||||||||||
| Depreciation | 220,810 | 220,810 | ||||||||||
| Amortization | 1,043,181 | 1,043,181 | ||||||||||
| (Gain) on extinguishment of debts | (987,518 | ) | (987,518 | ) | ||||||||
| Common stock issued for services and employee's compensation | 2,139,057 | 2,139,057 | ||||||||||
| Changes in operating assets and liabilities: | ||||||||||||
| Increase in inventories | (4,477,682 | ) | 1,459,570 | (1) | (3,018,112 | ) | ||||||
| Increase in deposits and prepaid expenses | 1,499,930 | (8,874,285 | ) | (2) | (7,374,355 | ) | ||||||
| Decrease (increase) in due to a director | (6,313,946 | ) | (6,313,966 | ) | ||||||||
| Increase in accounts payable and accrued expenses | 811,258 | 22,409 | (3) | 833,667 | ||||||||
| Increase in other payables | 11,798,629 | 4,949,414 | (4) | 16,748,043 | ||||||||
| Increase in accounts receivable | (9,567,456 | ) | (8,683,028 | ) | (5) | (18,250,484 | ) | |||||
| Increase in cost and estimated earnings in excess of billings on uncompleted contracts | (456,104 | ) | (456,104 | ) | ||||||||
| Increase in billings on uncompleted contracts in excess of costs and estimated earnings | 1,962,119 | 1,962,119 | ||||||||||
| Increase in due from related parties | (10,434,519 | ) | 10,434,519 | (6) | - | |||||||
| Decrease (increase) in due to related parties | 643,529 | 643,529 | ||||||||||
| Decrease (increase) in other receivables | (5,721,191 | ) | 2,069,514 | (7) | (3,651,677 | ) | ||||||
| Net cash provided by operating activities | 3,222,375 | 4,600,468 | ||||||||||
| Cash flows from investing activities | ||||||||||||
| Purchases of property and equipment | (252,346 | ) | (252,346 | ) | ||||||||
| Proceeds of disposal of subsidiaries | 557,700 | 557,700 | ||||||||||
| Investment in unconsolidated equity investees | (1,258,607 | ) | (1,258,607 | ) | ||||||||
| Payment for construction in progress | (1,346,394 | ) | (1,346,394 | ) | ||||||||
| Net cash used in investing activities | (2,299,647 | ) | (2,299,647 | ) | ||||||||
| Cash flows from financing activities | ||||||||||||
| Dividends paid | (573,814 | ) | (573,814 | ) | ||||||||
| Net cash provided by (used in) financing activities | (573,814 | ) | (573,814 | ) | ||||||||
| Net cash provided by continuing operations | 348,914 | 1,727,007 | ||||||||||
| Cash flows from discontinued operations | ||||||||||||
| Net cash provided by operating activities | - | - | ||||||||||
| Net cash used in investing activities | (3,137,885 | ) | (3,137,885 | ) | ||||||||
| Net cash used in financing activities | - | - | ||||||||||
| Net cash used in discontinued operations | (3,137,885 | ) | (3,137,885 | ) | ||||||||
| Effects on exchange rate changes on cash | 286,853 | (1,378,093 | ) | (8) | (1,091,240 | ) | ||||||
| Increase in cash and cash equivalents | (2,502,118 | ) | (2,502,118 | ) | ||||||||
| Cash and cash equivalents, beginning of year | 3,890,026 | 3,890,026 | ||||||||||
| 1,387,908 | 1,387,908 | |||||||||||
| Less: cash and cash equivalents at the end of the year - discontinued operations | - | - | ||||||||||
| Cash and cash equivalents at the end of the year - continuing operations | $ | 1,387,908 | $ | 1,387,908 | ||||||||
The statement of cash flows has been restated to correct an error related to the reporting of cash flows from sale of subsidiaries during the year ended December 31, 2011. The effects of this restatement are outlined below:
SINO AGRO FOOD, INC. AND SUBSIDIARIES
NOTES TO CONSOLIDATED FINANCIAL STATEMENTS
| June 30, 2013 | December 31, 2012 | ||||||
| (Unaudited) | (Audited) | ||||||
| ASSETS | |||||||
| Current assets | |||||||
| Cash and cash equivalents | $ | 9,391,449 | $ | 8,424,265 | |||
| Inventories | 18,887,433 | 17,114,755 | |||||
| Cost and estimated earnings in excess of billings on uncompleted contracts | 1,286,775 | 2,336,880 | |||||
| Deposits and prepaid expenses | 52,091,997 | 47,308,857 | |||||
| Accounts receivable, net of allowance for doubtful accounts | 82,373,870 | 52,948,350 | |||||
| Other receivables | 6,374,272 | 5,954,248 | |||||
| Total current assets | 170,405,796 | 134,087,355 | |||||
| Property and equipment | |||||||
| Property and equipment, net of accumulated depreciation | 21,019,253 | 19,946,302 | |||||
| Construction in progress | 38,089,142 | 24,492,510 | |||||
| Land use rights, net of accumulated amortization | 56,379,855 | 55,733,246 | |||||
| Total property and equipment | 115,488,250 | 100,172,058 | |||||
| Other assets | |||||||
| Goodwill | 724,940 | 724,940 | |||||
| Proprietary technologies, net of accumulated amortization | 7,906,667 | 8,114,624 | |||||
| License rights | 1 | 1 | |||||
| Total other assets | 8,631,608 | 8,839,565 | |||||
| Total assets | $ | 294,525,654 | $ | 243,098,978 | |||
| LIABILITIES AND STOCKHOLDERS' EQUITY | |||||||
| Current liabilities | |||||||
| Accounts payable and accrued expenses | $ | 8,368,834 | $ | 5,762,643 | |||
| Billings in excess of costs and estimated earnings on uncompleted contracts | 922,375 | 2,790,084 | |||||
| Due to a director | 3,257,085 | 3,345,803 | |||||
| Dividends payable | - | 951,308 | |||||
| Other payables | 10,259,178 | 6,654,478 | |||||
| Short term bank loan | 2,265,849 | 3,181,927 | |||||
| 25,073,321 | 22,686,243 | ||||||
| Non-current liabilities | |||||||
| Deferred dividends payable | 3,146,987 | 3,146,987 | |||||
| Long term debts | 178,031 | 175,006 | |||||
| 3,325,018 | 3,321,993 | ||||||
| Commitments and contingencies | - | - | |||||
| Stockholders' equity | |||||||
| Preferred stock: $0.001 par value | |||||||
| (10,000,000 shares authorized, 0 share issued and outstanding as of June 30, 2013 and December 31, 2012, respectively) | |||||||
| Series A preferred stock: $0.001 par value | - | - | |||||
| (100 shares designated, 100 shares issued and outstanding as of June 30, 2013 and December 31, 2012, respectively) | |||||||
| Series B convertible preferred stock: $0.001 par value) | 7,000 | 10,000 | |||||
| (10,000,000 shares designated, 7,000,000 and 10,000,000 shares issued and outstanding) as of June 30, 2013 and December 31, 2012, respectively) | |||||||
| Series F Non-convertible preferred stock: $0.001 par value) | |||||||
| (1,000,000 shares designated, 0 shares issued and outstanding) as of June 30, 2013 and December 31, 2012, respectively) | |||||||
| Common stock: $0.001 par value | 120,174 | 100,005 | |||||
| (130,000,000 shares authorized, 120,173,827 and 100,004,850 shares issued and oustanding as of June 30, 2013 and December 31, 2012, respectively) | |||||||
| Additional paid - in capital | 100,615,051 | 91,216,428 | |||||
| Retained earnings | 134,574,019 | 103,864,308 | |||||
| Accumulated other comprehensive income | 5,139,044 | 3,868,274 | |||||
| Treasury stock | (1,250,000) | (1,250,000) | |||||
| Total Sino Agro Food, Inc. and subsidiaries stockholders' equity | 239,205,288 | 197,809,015 | |||||
| Non - controlling interest | 26,922,027 | 19,281,727 | |||||
| Total stockholders' equity | 266,127,315 | 217,090,742 | |||||
| Total liabilities and stockholders' equity | $ | 294,525,654 | $ | 243,098,978 | |||
| Three | Three | Six | Six | ||||||||||
| months ended | months ended | months ended | months ended | ||||||||||
| June 30, 2013 | June 30, 2012 | June 30, 2013 | June 30, 2012 | ||||||||||
| (Unaudited) | (Unaudited) | (Unaudited) | (Unaudited) | ||||||||||
| Revenue | $ | 54,400,329 | $ | 25,348,287 | $ | 109,508,080 | $ | 41,328,303 | |||||
| Cost of goods sold | 35,009,882 | 11,790,039 | 68,594,816 | 19,756,463 | |||||||||
| Gross profit | 19,390,447 | 13,558,248 | 40,913,264 | 21,571,840 | |||||||||
| General and administrative expenses | (1,608,304) | (2,735,677) | (3,813,692) | (4,957,999) | |||||||||
| Net income from operations | 17,782,143 | 10,822,571 | 37,099,572 | 16,613,841 | |||||||||
| Other income | |||||||||||||
| Government grant | - | - | 79,759 | 79,401 | |||||||||
| Other income | 47,718 | 20,797 | 65,907 | 436,649 | |||||||||
| Gain on extinguishment of debts | 498,025 | 562,361 | 1,051,013 | 817,513 | |||||||||
| Interest expense | (54,958) | - | (112,010) | - | |||||||||
| Net income | 490,785 | 583,158 | 1,084,669 | 1,333,563 | |||||||||
| Net income before income taxes | 18,272,928 | 11,405,729 | 38,184,241 | 17,947,404 | |||||||||
| Provision for income taxes | - | - | - | - | |||||||||
| Net income | 18,272,928 | 11,405,729 | 38,184,241 | 17,947,404 | |||||||||
| Less: Net (income) loss attributable to the non - controlling interest | (3,941,988) | (1,115,707) | (7,474,529) | (1,985,920) | |||||||||
| Net income from continuing operations attributable to Sino Agro Food, Inc. and subsidiaries | 14,330,940 | 10,290,022 | 30,709,712 | 15,961,484 | |||||||||
| Other comprehensive income | |||||||||||||
| Foreign currency translation gain | 1,728,409 | (73,645) | 1,436,541 | 546,712 | |||||||||
| Comprehensive income | 16,059,349 | 10,216,377 | 32,146,253 | 16,508,196 | |||||||||
| Less: other comprehensive (income) loss attributable to the non - controlling interest | (217,553) | 23,878 | (165,771) | (131,211) | |||||||||
| Comprehensive income attributable to | |||||||||||||
| Sino Agro Food, Inc. and subsidiaries | $ | 15,841,796 | $ | 10,240,255 | $ | 31,980,482 | $ | 16,376,985 | |||||
| Earnings per share attributable to Sino Agro Food, Inc. | |||||||||||||
| and subsidiaries common stockholders: | |||||||||||||
| Basic | $ | 0.13 | $ | 0.14 | $ | 0.28 | $ | 0.22 | |||||
| Diluted | $ | 0.12 | $ | 0.13 | $ | 0.27 | $ | 0.20 | |||||
| Weighted average number of shares outstanding: | |||||||||||||
| Basic | 115,366,595 | 73,836,392 | 110,403,819 | 71,312,129 | |||||||||
| Diluted | 122,366,595 | 80,836,392 | 117,403,819 | 78,312,129 | |||||||||
| Six months ended | Six months ended | ||||||
| June 30, 2013 | June 30, 2012 | ||||||
| (Unaudited) | (Unaudited) | ||||||
| (Restated) | |||||||
| Cash flows from operating activities | |||||||
| Net income | $ | 38,184,241 | $ | 17,947,404 | |||
| Adjustments to reconcile net income to net cash from operations: | |||||||
| Depreciation | 638,671 | 183,154 | |||||
| Amortization | 976,294 | 1,138,176 | |||||
| Common stock issued for services | 181,200 | 2,139,057 | |||||
| Gain on extinguishment of debts | (1,051,013) | (817,513) | |||||
| Changes in operating assets and liabilities: | |||||||
| Increase in inventories | (1,842,406) | (4,618,431) | |||||
| (Increase) decrease in cost and estimated earnings in excess of billings on uncompleted contacts | 1,050,105 | (1,966,711) | |||||
| Increase in deposits and prepaid expenses | (4,783,140) | (10,893,566) | |||||
| Increase in due to a director | 8,264,907 | 346,076 | |||||
| Increase (decrease) in accounts payable and accrued expenses | 2,606,191 | (509,997) | |||||
| (Decrease) increase in other payables | 3,608,856 | 9,426,533 | |||||
| (Increase) decrease in accounts receivable | (29,425,520) | (5,173,526) | |||||
| (Decrease) increase in billings in excess of costs and estimated earnings on uncompleted contracts | (1,867,709) | 578,889 | |||||
| Decrease in amount due to related parties | - | (52,321) | |||||
| Increase in other receivables | (420,024) | (839,683) | |||||
| Net cash provided by operating activities | 16,120,653 | 9,887,541 | |||||
| Cash flows from investing activities | |||||||
| Purchases of property and equipment | (490,323) | (20,423) | |||||
| Acquisition of proprietary technologies | - | (1,500,000) | |||||
| Acquisition of land use rights | (490,323) | - | |||||
| Investment in unconsolidated equity investee | - | (1,076,489) | |||||
| Business combination of a subsidiary | (2,499,184) | ||||||
| Payment for construction in progress | (13,596,632) | (6,626,688) | |||||
| Net cash used in investing activities | (14,086,955) | (11,722,784) | |||||
| Cash flows from financing activities | |||||||
| Non - controlling interest contribution | - | 1,806,664 | |||||
| Dividends paid | (951,308) | (134,631) | |||||
| Net cash (used in) provided by financing activities | (951,308) | 1,672,033 | |||||
| Effects on exchange rate changes on cash | (115,206) | 1,467,667 | |||||
| Increase in cash and cash equivalents | 967,184 | 1,304,457 | |||||
| Cash and cash equivalents, beginning of period | 8,424,265 | 1,387,908 | |||||
| Cash and cash equivalents, end of period | $ | 9,391,449 | $ | 2,692,365 | |||
| Supplementary disclosures of cash flow information: | |||||||
| Cash paid for interest | $ | 112,010 | - | ||||
| Cash paid for income taxes | - | - | |||||
| Non - cash transactions | |||||||
| Common stock issued for settlement of debts | $ | 9,404,638 | $ | 2,373,992 | |||
| Series B Convertible preferred shares cancelled | $ | (3,000) | $ | - | |||
| Three months | Three months | Six months | Six months | ||||||||||
| ended | ended | ended | ended | ||||||||||
| June 30, | June 30, | June 30, | June 30, | ||||||||||
| 2013 | 2012 | 2013 | 2012 | ||||||||||
| Customer A | 26.94 | % | 12.76 | % | 18.57 | % | 7.82 | % | |||||
| Customer B | - | 25.65 | % | 16.71 | % | 21.85 | % | ||||||
| Customer C | 12.51 | % | 14.44 | % | 12.32 | % | 12.21 | % | |||||
| Customer D | 8.90 | % | - | 10.09 | % | 11.87 | % | ||||||
| Customer E | - | - | 8.20 | % | - | ||||||||
| Customer F | - | 18.99 | % | - | 20.63 | % | |||||||
| Customer G | - | 8.21 | % | - | - | ||||||||
| Customer H | 7.98 | % | |||||||||||
| Customer I | 7.86 | % | |||||||||||
| 64.19 | % | 80.05 | % | 65.89 | % | 74.38 | % |
| Segment | Amount | ||||||
| Customer A | Fishery Development Division | $ | 20,338,677 | ||||
| Customer B | Fishery Development Division | $ | 18,293,639 | ||||
| Customer C | Organic Fertilizer and Bread Grass Division | $ | 13,494,997 | ||||
| Customer D | Fishery Development Division | $ | 11,051,367 | ||||
| June 30, 2013 | December 31, 2012 | |||||
| Customer A | 15.21 | % | 11.14 | % | ||
| Customer B | 15.01 | % | 14.32 | % | ||
| Customer C | 12.03 | % | 9.94 | % | ||
| Customer D | 11.69 | % | 18.18 | % | ||
| Customer E | 8.26 | % | 8.23 | % | ||
| 62.20 | % | 61.81 | % |
| For the three months ended June 30, 2013 | |||||||||||||||||||
| Fishery Development Division (1) | HU Plantation Division (2) | Organic Fertilizer and Bread Grass Division (3) | Cattle Farm Development Division (4) | Corporate and others (5) | Total | ||||||||||||||
| Revenue | $ | 17,904,106 | $ | 3,554,986 | $ | 16,946,378 | $ | 6,421,161 | 9,573,698 | $ | 54,400,329 | ||||||||
| Net income (loss) | $ | 2,898,600 | $ | 2,452,706 | $ | 5,679,317 | $ | 929,277 | $ | 2,371,040 | $ | 14,330,940 | |||||||
| Total assets | $ | 67,526,143 | $ | 38,726,053 | $ | 120,479,483 | $ | 41,542,654 | $ | 26,251,321 | $ | 294,525,654 | |||||||
| For the three months ended June 30, 2012 | |||||||||||||||||||
| Fishery Development Division (1) | HU Plantation Division (2) | Organic Fertilizer and Bread Grass Division (3) | Cattle Farm Development Division (4) | Corporate and others (5) | Total | ||||||||||||||
| Revenue | $ | 15,799,765 | $ | 2,081,863 | $ | 3,684,693 | $ | 1,781,966 | $ | - | $ | 25,348,287 | |||||||
| Net income (loss) | $ | 8,321,886 | $ | 1,117,450 | $ | 469,629 | $ | 461,438 | $ | (80,381) | $ | 10,290,022 | |||||||
| Total assets | $ | 59,793,491 | $ | 27,151,644 | $ | 71,872,466 | $ | 9,791,026 | $ | 14,721,073 | $ | 183,329,700 | |||||||
| Fishery Development Division (1) | HU Plantation Division (2) | Organic Fertilizer and Bread Grass Division (3) | Cattle Farm Development Division (4) | Corporate and others (5) | Total | ||||||||||||||
| Revenue | $ | 42,122,633 | $ | 3,554,986 | $ | 31,824,277 | $ | 14,783,718 | 17,222,466 | $ | 109,508,080 | ||||||||
| Net income (loss) | $ | 11,053,353 | $ | 2,211,567 | $ | 9,342,579 | $ | 3,369,881 | $ | 4,732,332 | $ | 30,709,712 | |||||||
| Total assets | $ | 67,526,143 | $ | 38,726,053 | $ | 120,479,483 | $ | 41,542,654 | $ | 26,251,321 | $ | 294,525,654 | |||||||
| Fishery Development Division (1) | HU Plantation Division (2) | Organic Fertilizer and Bread Grass Division (3) | Cattle Farm Development Division (4) | Corporate and others (5) | Total | ||||||||||||||
| Revenue | $ | 26,894,373 | $ | 2,081,863 | $ | 9,628,641 | $ | 2,723,426 | $ | - | $ | 41,328,303 | |||||||
| Net income (loss) | $ | 13,592,472 | $ | 1,090,577 | $ | 1,035,018 | $ | 1,186,596 | $ | (943,177) | $ | 15,961,484 | |||||||
| Total assets | $ | 59,793,491 | $ | 27,151,644 | $ | 71,872,466 | $ | 9,791,026 | $ | 14,721,073 | $ | 183,329,700 | |||||||
| June 30, 2013 | December 31, 2012 | ||||||
| Cash and bank balances | $ | 9,391,449 | $ | 8,424,265 | |||
| June 30, 2013 | December 31, 2012 | ||||||
| Sleepy cods and eels | $ | 5,432,990 | $ | 4,612,090 | |||
| Bread grass | 709,366 | 1,473,653 | |||||
| Beef cattle | 2,985,965 | 2,569,659 | |||||
| Organic fertilizer | 702,836 | 737,166 | |||||
| Forage for cattle and consumable | 3,144,896 | 278,900 | |||||
| Raw materials for bread grass and organic fertilizer | 5,237,102 | 6,765,536 | |||||
| Unharvested HU plantation | 674,278 | - | |||||
| Immature seeds | - | 677,751 | |||||
| $ | 18,887,433 | $ | 17,114,755 | ||||
| June 30, 2013 | December 31, 2012 | ||||||
| Deposits for | |||||||
| - purchases of equipment | $ | 2,059,776 | $ | 318,192 | |||
| - acquisition of land use rights | 7,826,508 | 7,826,508 | |||||
| - inventories purchases | 4,940,767 | 2,228,854 | |||||
| - aquaculture contract | 6,022,708 | 7,062,600 | |||||
| - building materials | 1,281,935 | 2,000,000 | |||||
| - proprietary technologies | 2,254,839 | 2,254,839 | |||||
| - construction in progress | 19,658,537 | 14,423,021 | |||||
| Miscellaneous | 251,657 | 4,892,258 | |||||
| Shares issued for employee compensation and overseas professional | 90,600 | 271,800 | |||||
| Temporary deposits paid to entities for investments in future Sino Foreign Joint Venture companies | 7,704,670 | 6,030,785 | |||||
| 52,091,997 | 47,308,857 | ||||||
| June 30, 2013 | December 31, 2012 | ||||||
| 0 - 30 days past due | $ | 25,564,050 | $ | 10,813,981 | |||
| 31 - 90 days past due | 40,853,659 | 27,784,784 | |||||
| 91 - 120 days past due | 15,251,513 | 6,866,842 | |||||
| over 120 days and less than 1 year past due | 704,648 | 7,482,743 | |||||
| over 1 year past due | - | - | |||||
| 82,373,870 | 52,948,350 | ||||||
| June 30,2013 | December 31, 2012 | ||||||
| Cash advances paid as consideration to acquire investments. | $ | 4,657,728 | $ | 4,657,728 | |||
| Advanced to employees | 206,046 | 166,722 | |||||
| Advanced to suppliers | 573,001 | 205,088 | |||||
| Miscellaneous | 937,497 | 924,710 | |||||
| $ | 6,374,272 | $ | 5,954,248 | ||||
| June 30, 2013 | December 31, 2012 | ||||||
| Plant and machinery | $ | 3,681,644 | $ | 3,681,644 | |||
| Structure and leasehold improvements | 15,446,062 | 15,446,062 | |||||
| Mature seeds | 2,660,357 | 1,369,626 | |||||
| Furniture and equipment | 633,370 | 212,479 | |||||
| Motor vehicles | 277,513 | 277,513 | |||||
| 22,698,946 | 20,987,324 | ||||||
| Less: Accumulated depreciation | (1,679,693) | (1,041,022) | |||||
| Net booking value | 21,019,253 | 19,946,302 | |||||
| June 30, 2013 | December 31, 2012 | ||||||
| Construction in progress | |||||||
| - Oven room for production of dried flowers | $ | 828,905 | $ | 828,905 | |||
| - Office, warehouse and organic fertilizer plant in H S A | 10,450,518 | 10,450,518 | |||||
| - Organic fertilizer and bread grass production plant and office buildingin SJAP | 13,228,105 | 7,921,105 | |||||
| - Rangeland for beef cattle and office building in Enping | 5,291,982 | 5,291,982 | |||||
| - Cattle houses, office building and staff quarter in SJAP | 8,289,632 | - | |||||
| $ | 38,089,142 | $ | 24,492,510 | ||||
| June 30, 2013 | December 31,2012 | ||||||
| Cost | $ | 60,045,896 | $ | 58,630,950 | |||
| Less: Accumulated amortisation | (3,666,041) | (2,897,704) | |||||
| Net carrying amount | $ | 56,379,855 | $ | 55,733,246 | |||
| June 30, 2013 | December 31, 2012 | ||||||
| $ | $ | ||||||
| Cost | 9,512,258 | 9,512,258 | |||||
| Less: Accumulated amortization | (1,605,591) | (1,397,634) | |||||
| Net carrying amount | 7,906,667 | 8,114,624 | |||||
| June 30, 2013 | December 31, 2012 | ||||||
| Goodwill from acquisition | $ | 724,940 | $ | 724,940 | |||
| Less: Accumulated impairment losses | - | - | |||||
| Net carrying amount | $ | 724,940 | $ | 724,940 | |||
| June 30, 2013 | December 31, 2012 | ||||||
| Due to third parties | $ | 664,865 | $ | 877,259 | |||
| Promissory notes issued to third parties | 4,477,414 | 3,352,394 | |||||
| Convertible notes payable | - | 232,000 | |||||
| Due to local government | 2,192,825 | 2,192,825 | |||||
| Miscellaneous | 2,924,074 | - | |||||
| $ | 10,259,178 | $ | 6,654,478 | ||||
| June 30, 2013 | December 31, 2012 | ||||||
| Cost | $ | 2,505,402 | $ | 3,755,046 | |||
| Estimated earnings | 4,746,626 | 8,307,452 | |||||
| Less: Billings | (5,965,253) | (9,725,618) | |||||
| Costs and estimated earnings in excess of billings on uncompleted contract | $ | 1,286,775 | $ | 2,336,880 | |||
| June 30, 2013 | December 31, 2012 | ||||||
| Billings | $ | 14,916,618 | $ | 9,810,427 | |||
| Less: Cost | (4,302,086) | (1,886,705) | |||||
| Estimated earnings | (9,692,157) | (5,133,638) | |||||
| Billing in excess of costs and estimated earnings on uncompleted contract | $ | 922,375 | $ | 2,790,084 | |||
| June 30, 2013 | December 31, 2012 | ||||||
| Cost | $ | 6,807,488 | $ | 5,641,751 | |||
| Estimated earnings | 14,438,783 | 13,441,090 | |||||
| Less: Billings | (20,881,871) | (19,536,045) | |||||
| Cost and estimated earnings in excess of billings on uncompleted contract/(Billing in excess of Costs and estimated earnings on uncompleted contract) | $ | 364,400 | $ | (453,204) | |||
| Name of bank | Interest rate | Term | June 30, 2013 | December 31, 2012 | |||||||||
| Agricultural Bank of China | 6 | % | August 8, 2012 - August 29, 2013 | ||||||||||
| Huangyuan County Branch, | |||||||||||||
| Xining , Qinghai Province, | |||||||||||||
| P.R.C. | $ | 2,265,849 | ^* | $ | 3,181,927 | ||||||||
| Name of lender | Interest rate | Term | June 30, 2013 | December 31, 2012 | ||||||||
| Gan Guo Village Committee | 12.22 | % | June 2012 - June 2017 | |||||||||
| Bo Huang Town | ||||||||||||
| Huangyuan County, | ||||||||||||
| Xining City, | ||||||||||||
| Qinghai Province, P.R.C. | $ | 178,031 | $ | 175,006 | ||||||||
| Expected annual dividend rate | 0.00 | % | |||
| Weighted average exercise price | $ | 0.50 | |||
| Risk-free interest rate | 2.00 | % | |||
| Average expected life | 6 months | ||||
| Expected volatility of common stock | 80.00 | % | |||
| Forfeiture rate | 0.00 | % |
| Expiry date | Exercise date | June 30, 2013 | |||||
| April 9, 2013 | $ | 0.50 | 0 | ||||
| June 30, 2013 | Exercise price | ||||||
| Number of warrants outstanding as of January 1, 2013 | - | - | |||||
| Issued | 385,000 | $ | 0.50 | ||||
| Exercised | - | - | |||||
| Expired | (385,000) | - | |||||
| Number of warrants outstanding as of June 30, 2013 | - | ||||||
| June 30, 2013 | ||||
| Year ended December 31,2013 | $ | 76,004 | ||
| Year ended December 31,2014 | 85,038 | |||
| Thereafter | - | |||
| $ | 161,042 | |||
| Net assets at fair value acquired: | ||||
| Property, plant and equipment | $ | 34,919 | ||
| Construction in progress | 4,495,306 | |||
| Inventory | 1,838,337 | |||
| 6,368,562 | ||||
| Less: Other payables | (92,603) | |||
| Non-controlling interest | (3,324,729) | |||
| 25% held by the Company | (1,662,365) | |||
| $ | 1,288,865 | |||
| Satisfied by | ||||
| Purchase consideration | $ | 1,662,365 | ||
| Less: Cash acquired | (373,500) | |||
| $ | 1,288,865 |
| Net assets at fair value acquired: | ||||
| Property, plant and equipment | $ | 33,535 | ||
| Construction in progress | 4,499,376 | |||
| Inventory | 1,970,387 | |||
| Accounts receivable | 1,337,519 | |||
| 7,840,817 | ||||
| Less: Other payables | (292,663) | |||
| Accounts payable | (1,230,096) | |||
| Non-controlling interest | (1,702,580) | |||
| 50% held by the Company | (3,405,159) | |||
| $ | 1,210,319 | |||
| Satisfied by | ||||
| Purchase consideration | $ | 1,702,580 | ||
| Less: Cash acquired | (492,261) | |||
| $ | 1,210,319 |
| Net assets at fair value acquired: | ||||
| Property, plant and equipment | $ | 512,450 | ||
| Construction in progress | 4,177,007 | |||
| Inventory | 671,429 | |||
| 5,360,886 | ||||
| Less: Non - controlling interest | (1,340,221) | |||
| $ | 4,020,665 | |||
| Satisfied by | ||||
| Purchase consideration | $ | 4,020,665 |
| Three months ended | Three months ended | ||||||
| June 30, 2013 | June 30, 2012 | ||||||
| BASIC | |||||||
| Numerator for basic earnings per share attributable to the Company’s common stockholders: | |||||||
| Net income used in computing basic earnings per share | $ | 14,330,940 | $ | 10,290,022 | |||
| Basic earnings per share | $ | 0.12 | $ | 0.14 | |||
| Basic weighted average shares outstanding | 115,366,595 | 73,836,392 | |||||
| Three months ended June 30, 2013 | Three months ended June 30, 2012 | ||||||
| DILUTED | |||||||
| Numerator for basic earnings per share attributable to the Company’s common stockholders: | |||||||
| Net income used in computing basic earnings per share | $ | 14,330,940 | $ | 10,290,022 | |||
| Basic earnings per share | $ | 0.12 | $ | 0.13 | |||
| Basic weighted average shares outstanding | 115,366,595 | 73,836,392 | |||||
| Add: weight average Series B Convertible preferred shares outstanding | 7,000,000 | 7,000,000 | |||||
| Diluted weighted average shares outstanding | 122,366,595 | 80,836,392 | |||||
| Six months ended | Six months ended | ||||||
| June 30, 2013 | June 30, 2012 | ||||||
| BASIC | |||||||
| Numerator for basic earnings per share attributable to the Company’s common stockholders: | |||||||
| Net income used in computing basic earnings per share | $ | 30,709,712 | $ | 15,961,484 | |||
| Basic earnings per share | $ | 0.28 | $ | 0.22 | |||
| Basic weighted average shares outstanding | 110,403,819 | 71,312,129 | |||||
| Six months ended June 30, 2013 | Six months ended June 30, 2012 | ||||||
| DILUTED | |||||||
| Numerator for basic earnings per share attributable to the Company’s common stockholders: | |||||||
| Net income used in computing basic earnings per share | $ | 30,709,712 | $ | 15,961,484 | |||
| Basic earnings per share | $ | 0.26 | $ | 0.20 | |||
| Basic weighted average shares outstanding | 110,403,819 | 71,312,129 | |||||
| Add: weight average Series B Convertible preferred shares outstanding | 8,607,734 | 7,000,000 | |||||
| Diluted weighted average shares outstanding | 119,011,553 | 78,312,129 | |||||
PART II
INFORMATION NOT REQUIRED IN PROSPECTUS
Item 13. Other Expenses of Issuance and Distribution
The following table sets forth the costs and expenses, other than underwriting discounts and commissions, if any, payable by us relating to the sale of common stock being registered. All amounts are estimates except the SEC registration fee.
| SEC registration fee | $ | 3,580.50 | $ | 1,803.04 | ||||
| Legal fees and expenses | $ | 90,000 | * | $ | 80,000 | * | ||
| Accounting fees and expenses | $ | 10,000 | * | $ | 15,000 | * | ||
| Miscellaneous, including clerical, administrative, printing, edgarizing, general and internal expenses | $ | 70,000 | * | $ | 130,000 | * | ||
| Total | $ | 173,580.50 | * | $ | 226,803.04 | * |
* Estimates
| - 158 - |
Item 14. Indemnification of Directors and Officers
Pursuant to the Articles of Incorporation and By-Laws of the Company, we may indemnify an officer or director who is made a party to any proceeding, including a lawsuit, because of his position, if he acted in good faith and in a manner he reasonably believed to be in our best interest. In certain cases, we may advance expenses incurred in defending any such proceeding. To the extent that the officer or director is successful on the merits in any such proceeding as to which such person is to be indemnified, we must indemnify him against all expenses incurred, including attorney’s fees. With respect to a derivative action, indemnity may be made only for expenses actually and reasonably incurred in defending the proceeding, and if the officer or director is judged liable, only by a court order. The indemnification is intended to be to the fullest extent permitted by the laws of the State of Nevada.
In the event that a claim for indemnification against such liabilities, other than the payment by us of expenses incurred or paid by one of our directors, officers, or controlling persons in the successful defense of any action, suit or proceeding, is asserted by one of our directors, officers, or controlling person in connection with the securities being registered, we will, unless in the opinion of our counsel the matter has been settled by controlling precedent, submit to a court of appropriate jurisdiction the question whether such indemnification is against public policy as expressed in the Securities Act, and we will be governed by the final adjudication of such issue.
Insofar as indemnification for liabilities arising under the Securities Act of 1933, as amended, may be permitted to our directors, officers and persons controlling us, we have been advised that it is the Securities and Exchange Commission’s opinion that such indemnification is against public policy as expressed in the Securities Act of 1933, as amended, and is, therefore, unenforceable.
Item 15. Recent Sales of Unregistered Securities
During the last three years, we have issued unregistered securities to the persons, as described below. None of these transactions involved any underwriters, underwriting discounts or commissions, or any public offering. The sales of these securities were, except as set forth below, deemed to be exempt from the registration requirements of the Securities Act of 1933 by virtue of Section 4(2) thereof, and/or Rule 506 of Regulation D promulgated thereunder, as transactions by an issuer not involving a public offering. The recipients of securities in each such transaction represented their intention to acquire the securities for investment only and not with a view to or for sale in connection with any distribution thereof and appropriate legends were affixed to the certificates issued in such transactions. All purchasers of our securities were accredited or sophisticated persons and had adequate access, through employment, business or other relationships, to information about us.
20102012
First quarter
During the period beginning January 1, 20102012 and ending March 31, 2010,2012, we issued an aggregate of 4,747,000373,564 shares of Common Stock to elevenfour persons, none of whom was a resident of the United States. All these shares of Common Stock were issued in consideration for extinguishment of debtother payables in the aggregate amount of $5,723,830. In addition, we issued 100 shares of Series A Preferred Stock to three individuals, none of whom was a resident of the United States, for $1.00 per share.
Second quarter
During the period beginning April 1, 2010 and ending June 30, 2010, we issued an aggregate of 3,702,059 shares of Common Stock to 39 persons, none of whom was a resident of the United States. All these shares of Common Stock were issued in consideration for extinguishment of debt in the aggregate amount of $2,741,309. In addition, we issued 7,000,000 shares of Series B Preferred Stock to three individuals, none of whom was a resident of the United States, in consideration for the cancellation by such persons of 7,000,000 shares of Common Stock.
Third quarter
During the period beginning July 1, 2010 and ending September 30, 2010, we issued an aggregate of 3,980,000 shares of Common Stock to Mr. Shan De Zhang, who was not a resident of the United States. All these shares of Common Stock were issued in consideration for extinguishment of debt in the aggregate amount of $2,911,050. The shares were issued to Mr. Shan De Zhang as payment for the “Stock Feed Manufacturing Technology” that the Company acquired from this individual.
Fourth quarter
During the period beginning October 1, 2010 and ending December 31, 2010, we issued an aggregate of 2,551,500 shares of Common Stock to three persons, none of whom was a resident of the United States. Of these shares, (i) 2,529,000 shares of Common Stock were issued in consideration for extinguishment of debt in the aggregate amount of $3,481,390 and (ii) an aggregate of 22,500 shares of Common Stock were issued to 3 persons on workers compensation under Rule 144 for consideration of $33,750.
We relied upon Regulation S of the Securities Act of 1933, as amended, for the above issuances, none of which was made to US citizens or residents. We believe that Regulation S was available because:
2011
First quarter
During the period beginning January 1, 2011 and ending March 31, 2011, we issued an aggregate of 1,321,000 shares of Common Stock to 4 persons, all of whom were residents of the United States. All these shares of Common Stock were issued in consideration for extinguishment of debt in the aggregate amount of $1,989,000.
Second quarter
During the period beginning April 1, 2011 and ending June 30, 2011, we issued an aggregate of 1,281,000 shares of Common Stock to three persons, all of whom were residents of the United States. All these shares of Common Stock were issued in consideration for extinguishment of debt in the aggregate amount of $1,921,500.
Third quarter
During the period beginning July 1, 2011 and ending September 30, 2011, we issued an aggregate of 5,353,326 shares of Common Stock to 86 persons, six of whom were residents of the United States. All these shares of Common Stock were issued in consideration for extinguishment of debt in the aggregate amount of $4,887,778.
Fourth quarter
During the period beginning October 1, 2011 and ending December 31, 2011, we issued an aggregate of 3,617,068 shares of Common Stock to six persons, none of whom was a resident of the United States. All these shares of Common Stock were issued in consideration for extinguishment of debt in the aggregate amount of $2,977,200.
We relied upon Section 4(2) of the Securities Act of 1933, as amended for the above issuances to US citizens or residents. We believe that Section 4(2) of the Securities Act of 1933 was available because:
We relied upon Regulation S of the Securities Act of 1933, as amended, for the above issuances made to persons who were not US citizens or residents. We believe that Regulation S was available because:
2012
First quarter
During the period beginning January 1, 2012 and ending March 31, 2012, we issued an aggregate of 3,698,284 shares of Common Stock to four persons, none of whom was a resident of the United States.$2,373,377.
Second quarter
During the period beginning April 1, 2012 and ending June 30, 2012, we issued an aggregate of 7,037,348 shares710,843shares of Common Stock to eight persons, three of whom were residents of the United States. All these shares of Common Stock were issued in consideration for extinguishment of debtother payables in the aggregate amount of $4,572,258.
Third quarter
During the period beginning July 1, 2012 and ending September 30, 2012, we issued an aggregate of 14,161,3931,430,443 shares of Common Stock to 17 persons, one of whom was a resident of the United States. Of these shares, (i) 13,255,3931,338,928 shares of Common Stock were issued in consideration for extinguishment of debtother payables in the aggregate amount of $7,739,239 and (ii) an aggregate of 906,00091,515 shares of Common Stock were issued to 28 persons as compensationsettlements for services performedrendered on behalf of the Company and were valued at an aggregate of $362,400. These shares were subject to the resale restrictions imposed by Rule 144 of the Securities Act.
Fourth quarter
During the period beginning October 1, 2012 and ending December 31, 2012, we issued an aggregate of 8,073,563815,511 shares of Common Stock to 5 persons, none of whom was a resident of the United States. All these shares of Common Stock were issued in consideration for extinguishment of debtother payables in the aggregate amount of $4,844,314.
2013
First quarter
During the period beginning January 1, 2013 and ending March 31, 2013, we issued an aggregate of 10,344,7381,044,923 shares of our common stock to 4 Chinese persons. The shares were issued in consideration for extinguishment of debtother payables in the aggregate amount of $5,678,374 based on a price of the common stock of an average of approximately $0.55$5.45 per share.
| - 159 - |
Second quarter
During the period beginning April 1, 2013 and ending June 30, 2013, we issued an aggregate of 9,824,239992,347 shares of our common stock. The shares were issued in consideration for extinguishment of debt in the aggregate amount of $4,777,277 based on a price of the common stock at values ranging from $0.37$3.66 to $0.49$4.85 per share.
Third quarter
During the period beginning July 1, 2013 and ending September 30, 2013, we issued an aggregate of 847,468 shares of our common stock. Of these shares, 817,447 were issued in consideration for extinguishment of debt in the aggregate amount of $4,327,000 based on a price of the common stock at values ranging from $3.66 to $4.55 per share. In addition, we sold 13,509 shares to 21 of our employees for aggregate consideration of $133,744. None of the recipients of the shares issued during this quarter was a US person.
Fourth quarter
During the period beginning October 1, 2013 and ending December 31, 2013, we issued an aggregate of 912,957 shares of our common stock to 8 Chinese persons. The shares were issued pursuant to the exemption from registration under the Securities Act provided by its Section 4(a)(2). The shares were issued in consideration for extinguishment of debt in the aggregate amount of $4,247,982.
2014
First quarter
During the period beginning January 1, 2014 and ending March 31, 2014, we issued an aggregate of 1,203,030 shares of our common stock to Chinese persons. The shares were issued pursuant to the exemption from registration under the Securities Act provided by its Section 4(a)(2). The shares were issued in consideration for extinguishment of debt in the aggregate amount of $6,019,125.
Second quarter
During the period beginning April 1, 2014 and ending June 30, 2014, we issued an aggregate of 1,079,394 shares of our common stock to 24 Chinese persons. The shares were issued pursuant to the exemption from registration under the Securities Act provided by its Section 4(a)(2). The shares were issued in consideration for extinguishment of debt in the aggregate amount of $3,555,875, payments for workers entitlement of $646,310 and payments for professional service consultants for $487,521.
Third quarter
During the period beginning July 31, 2014 and ending September 30, 2014, we issued an aggregate of 801,028 shares of our common stock to 3 Chinese persons and 1 entity in Stockholm Sweden. The shares were issued pursuant to the exemption from registration under the Securities Act provided by its Section 4(a)(2). The shares were issued in consideration for extinguishment of debt in the aggregate amount of $2,431,374, payments for workers entitlement of $0 and payments for professional service consultants for $1,500,000.
Fourth quarter
During the period beginning October 1, 2014 and ending December 31, 2014, we issued an aggregate of 181,748 shares of our common stock to 3 Chinese persons and 2 European persons. The shares were issued pursuant to the exemption from registration under the Securities Act provided by its Section 4(a)(2). The shares were issued in consideration for extinguishment of debt in the aggregate amount of $1,000,000 and payments for professional service consultants for $799,312. In addition, there were a total of 16,642 fractional shares cancelled making total issued and outstanding shares of 169,910,893 shares as at December 31, 2014 before the reverse split took effect; after effectiveness of the reverse split, the number of our issued and outstanding shares is 17,162,716.
We relied upon Section 4(2)4(a)(2) of the Securities Act of 1933, as amended for the above issuances to US citizens or residents. We believe that Section 4(2)4(a)(2) of the Securities Act of 1933 was available because:
We relied upon Regulation S of the Securities Act of 1933, as amended, for the above issuances made to persons who were not US citizens or residents. We believe that Regulation S was available because:
| - 160 - |
In connection with the above transactions, although some of the investors may have also been accredited, we provided the following to all investors:
Prospective investors were invited to review at our offices at any reasonable hour, after reasonable advance notice, any materials available to us concerning our business. Prospective investors were also invited to visit our offices.
Item 16. Exhibits and Financial Statement Schedules
(A) Financial Statements
See index to Financial Statements on Page F-1
(B) Exhibits.
| Exhibit No. | Exhibit Description | |
| 2.1 | Stock Purchase Agreement and Share Exchange | |
| 2.2 | Acquisition Agreement - Hang Yu Tai Investment Limited. Incorporated herein by reference to the Registration Statement on Form 10 filed on November 19, 2010 as Exhibit 2.2 thereto. | |
| 2.3 | Acquisition Agreement - Macau Eiji Company Limited. Incorporated herein by reference to the Registration Statement on Form 10 filed on November 19, 2010 as Exhibit 2.3 thereto. | |
| 2.4 | Acquisition Agreement - | |
| 2.5 | Disposition Agreement | |
| 2.6 | Acquisition Agreement - A Power Agro Agriculture Development (Macau) Limited acquired the Pretty Mountains’ 45% equity interest in Sanjiang A Power. Incorporated herein by reference to the Registration Statement on Form 10 filed on November 19, 2010 as Exhibit 2.6 thereto. | |
| 3.1 | Articles of Incorporation of Volcanic Gold, Inc. Incorporated herein by reference to the Registration Statement on Form 10 filed on November 19, 2010 as Exhibit 3.1 thereto. | |
| 3.2 | Amendment to Articles of Incorporation | |
| 3.3 | Certificate of Correction. Incorporated herein by reference to the Registration Statement on Form 10 filed on November 19, 2010 as Exhibit 3.3 thereto. |
| - 161 - |
| 3.4 | Amendment to Articles of Incorporation | |
| 3.5 | Bylaws of Volcanic Gold, Inc. Incorporated herein by reference to the Registration Statement on Form 10 filed on November 19, 2010 as Exhibit 3.5 thereto. | |
| 3.6 | Organizational Documents: Capital Award, Inc. Incorporated herein by reference to the Registration Statement on Form 10 filed on November 19, 2010 as Exhibit 3.6 thereto. |
| 3.7 | Organizational Documents: Hang Yu Tai Investment Limited. Incorporated herein by reference to the Registration Statement on Form 10 filed on November 19, 2010 as Exhibit 3.7 thereto. | |
| 3.8 | Organizational Documents: ZhongXingNongMu Co. Ltd. Incorporated herein by reference to the Registration Statement on Form 10 filed on November 19, 2010 as Exhibit 3.8 thereto. | |
| 3.9 | Organizational Documents: Macau Eiji Company Limited. Incorporated herein by reference to the Registration Statement on Form 10 filed on November 19, 2010 as Exhibit 3.9 thereto. | |
| 3.10 | Organizational Documents: Jiang Men City Heng Sheng Tai Agriculture Development Co. Ltd. Incorporated herein by reference to the Registration Statement on Form 10 filed on November 19, 2010 as Exhibit 3.10 thereto. | |
| 3.11 | Organizational Documents: Tri-way Industries Limited. Incorporated herein by reference to the Registration Statement on Form 10 filed on November 19, 2010 as Exhibit 3.11 thereto. | |
| 3.12 | Organizational Documents: A Power Agro Agriculture Development (Macau) Limited. Incorporated herein by reference to the Registration Statement on Form 10 filed on November 19, 2010 as Exhibit 3.12 thereto. | |
| 3.13 | Bylaws. Incorporated herein by reference to the Current Report on Form 8-K filed on November 28, 2012 as Exhibit 3.1 thereto. | |
| 3.14 | Certificate of Amendment to Articles of Incorporation. Incorporated herein by reference to the Current Report on Form 8-K filed on January 30, 2013 as Exhibit | |
| 3.15 | Certificate of Amendment to Articles of Incorporation. Incorporated herein by reference to the Current Report on Form 8-K filed on November 1, 2013 as Exhibit 3.1 thereto. | |
| 4.1 | Form of common stock Certificate of Sino Agro | |
| 4.2 | Form of Certificate of Series A Preferred. Incorporated herein by reference to the Registration Statement on Form 10 filed on November 19, 2010 as Exhibit 4.2 thereto. | |
| 4.3 | Form of Certificate of Series B Preferred. Incorporated herein by reference to the Registration Statement on Form 10 filed on November 19, 2010 as Exhibit 4.3 thereto. | |
| 4.4 | Certificate of Rights and Preferences | |
| 4.5 | Certificate of Rights and Preferences | |
| 4.6 | Amended and Restated Certificate of Designation of the Series F Non-Convertible Preferred Stock. Incorporated herein by reference to the Current Report on Form 8-K filed on | |
| 4.7 | Promissory Note dated August 29, 2014. Incorporated herein by reference to the Current Report on Form 8-K filed on September 5, 2014 as Exhibit 4.1 thereto. | |
| 5.1 | Opinion of Sichenzia Ross Friedman Ference LLP* |
| - 162 - |
| 10.1 | Patented “Intellectual Property” namely “Zhi Wu Jei Gan Si Liao Chan Ye Hua Chan Pin Ji Qi Zhi Bei Fang Fa” registered under the Patent Number “ZL2005 10063039.9” and Certificate number “329722” of China. Incorporated herein by reference to the Registration Statement on Form 10 filed on November 19, 2010 as Exhibit 10.1 thereto. | ||
| 10.2 | Sino Foreign Joint Venture Agreement: Jiang Men City Heng Sheng Tai Agriculture Development Co. Ltd. Incorporated herein by reference to the Registration Statement on Form 10 filed on November 19, 2010 as Exhibit 10.2 thereto. | ||
| 10.3 | Sino Foreign Joint Venture Agreement: Qinghai Sanjiang A Power Agriculture Co. Ltd. Incorporated herein by reference to the Registration Statement on Form 10 filed on November 19, 2010 as Exhibit 10.3 thereto. | ||
| 10.4 | Deed of Trust - A Power Agro Agriculture Development (Macau) Limited. Incorporated herein by reference to the Registration Statement on Form 10 filed on November 19, 2010 as Exhibit 10.4 thereto. | ||
| 10.5 | Deed of Trust - Macau Eiji Company Limited. Incorporated herein by reference to the Registration Statement on Form 10 filed on November 19, 2010 as Exhibit 10.5 thereto. | ||
| 10.6 | Deed of Trust - Hang Yu Tai Investment Limited. Incorporated herein by reference to the Registration Statement on Form 10 filed on November 19, 2010 as Exhibit 10.6 thereto. | ||
| 10.7 | Master License from Infinity Environmental Group, a Belize corporation. Incorporated herein by reference to the Registration Statement on Form 10 filed on November 19, 2010 as Exhibit 10.7 thereto. | ||
| 10.8 | Capital Award Consulting Service Agreement. Incorporated herein by reference to the Registration Statement on Form 10 filed on January 19, 2011 as Exhibit 10.8 thereto. | ||
| 10.9 | Tri-Way Joint Venture Agreement. Incorporated herein by reference to the Registration Statement on Form 10 filed on January 19, 2011 as Exhibit 10.9 thereto. | ||
| 10.10.a | Share Sale Agreement of Zhongxingnongmu Co. Ltd. | ||
| 10.10.b | MOU SIAF and Mr. Sun Sales and Purchase of shares Hang Yu Tai. Incorporated herein by reference to the Registration Statement on Form 10 filed on July 6, 2011 as Exhibit 10.10(b) thereto. | ||
| 10.11 | Joint Venture Agreement for Enping City Bi Tao A Power Prawn Culture Development Co., Ltd. Incorporated herein by reference to the Registration Statement on Form 10 filed on April 25, 2011 as Exhibit 10.11 thereto. | ||
| 10.12 | AP Technology Consulting Services Agreement between Capital Award and a Group of China Parties. Incorporated herein by reference to the Registration Statement on Form 10 filed on April 25, 2011 as Exhibit 10.12 thereto. | ||
| 10.13 | Organic Premium Beef Cattle (Fragrant Beef) Breeding and Feed Production Technology Cooperation Agreement. Incorporated herein by reference to the Registration Statement on Form 10 filed on April 25, 2011 as Exhibit 10.13 thereto. | ||
| 10.14 | Organic Premium Beef Cattle (Fragrant Beef) Breeding and Feed Production Technology Sale and Transfer Agreement. Incorporated herein by reference to the Registration Statement on Form 10 filed on April 25, 2011 as Exhibit 10.14 thereto. | ||
| 10.15 | Employment Agreement | ||
| 10.16 | Employment Agreement | ||
| 10.17 | Employment Agreement | ||
| 10.18 | SJVC Enping Cattle and Sheep Farm Joint Venture Agreement. Incorporated herein by reference to the Registration Statement on Form 10 filed on July 6, 2011 as Exhibit 10.18 thereto. | ||
| - 163 - |
| 10.19 | Bait Fish Contract between Enping A Power Fishery Development Co. Ltd. and Guangzhou Jinyang Aquaculture Co. Ltd. Incorporated herein by reference to the Current Report on Form 8-K filed on December 19, 2011 as Exhibit 10.1 thereto. | |
| 10.20 | Sleepy Cod Contract between Enping A Power Fishery Development Co. Ltd. and Guangzhou Jinyang Aquaculture Co. Ltd. Incorporated herein by reference to the Current Report on Form 8-K filed on December 19, 2011 as Exhibit 10.2 thereto. | |
| 10.21 | Agreement between Capital Award, Inc. and Liu Gang, et al. Incorporated herein by reference to the Current Report on Form 8-K filed on February 29, 2012 as Exhibit 10.1 thereto. | |
| 10.22 | Agreement between Macau Eiji Company Limited and Mr. Jin Xuesong. Incorporated herein by reference to the Current Report on Form 8-K filed on March 28, 2012 as Exhibit 10.1 thereto. | |
| 10.23 | Addendum to Consulting and Services Agreement. Incorporated herein by reference to the Quarterly Report on Form 10-Q filed on August 14, 2012 as Exhibit 10.1 thereto. | |
| 10.24 | SJVC Agreement between MEIJI and Mr. He Yue Xiong. Incorporated herein by reference to the Quarterly Report on Form 10-Q filed on August 14, 2012 as Exhibit 10.2 thereto. |
| 10.25 | Consulting and Services Agreement MEIJI and Mr. He Yue Xiong, et al. Incorporated herein by reference to the Quarterly Report on Form 10-Q filed on August 14, 2012 as Exhibit 10.3 thereto. | |
| 10.26 | Agreement to Purchase Young Beef between MEIJI and Yang Zi Shao Town Cattle Farm. Incorporated herein by reference to the Quarterly Report on Form 10-Q filed on August 14, 2012 as Exhibit 10.4 thereto. | |
| 10.27 | WSPS SJVC between the Company and Zhou Jianfeng. Incorporated herein by reference to the Quarterly Report on Form 10-Q filed on August 14, 2012 as Exhibit 10.5 thereto. | |
| 10.28 | WSPS Consulting and Services Agreement between Capital Award and Zhou Jianfeng, et al. Incorporated herein by reference to the Quarterly Report on Form 10-Q filed on August 14, 2012 as Exhibit 10.6 thereto. | |
| 10.29 | Memorandum of Understanding between the Company and Wu Xiaofeng. Incorporated herein by reference to the Quarterly Report on Form 10-Q filed on August 14, 2012 as Exhibit 10.7 thereto. | |
| 10.30 | ||
| 10.31 | Consulting and Service Agreement (Wholesale 2) between the Company and Guangzhou YiLi Na Wei Trading Co. Ltd. Incorporated herein by reference to the Quarterly Report on Form 10-Q filed on November 15, 2012 as Exhibit 10.9 thereto. | |
| 10.32 | JFD Lease agreement. | |
| 10.33 | JHMC Lease Agreement. | |
| 10.34 | JHST Lease Agreement. | |
| 10.35 | Sino Agro Food, Inc. Lease Agreement. | |
| 10.36 | Capital Award Consulting Service Agreement related to Fish Farm 2. | |
| 10.37 | WXC Consulting Agreement. | |
| 10.38 | Consulting and Service Agreement between MEIJI and Wei Da Xing, et al. |
| - 164 - |
| 10.39 | License Agreement between Capital Award Inc. and Glory Ocean Development Ltd. Incorporated herein by reference to the Current Report on Form 8-K filed on March 5, 2014 as Exhibit 10.1 thereto. | |
| 10.40 | SJVC Agreement between group of business investors in Zhongshan City, Guangdong Province, PRC and Glory Ocean Development Ltd. Incorporated herein by reference to the Annual Report on Form 10-K filed on April 11, 2014 as Exhibit 10.40 thereto. | |
| 14 | Code of Ethics. Incorporated herein by reference to the Registration Statement on Form S-1 filed on March 28, 2013 as Exhibit 14 thereto. | |
| 21 | List of subsidiaries. | |
| 23.1 | Consent of | |
| 23.2 | Consent of Sichenzia Ross Friedman Ference LLP (included in Exhibit 5.1)* | |
| 99.1 | Opinion of | |
| 99.2 | Decree of the State Council of the People’s Republic of China. Incorporated herein by reference to the Annual Report on Form 10-K/A filed on July 1, 2014 as Exhibit 99.2 thereto. | |
| 99.3 | Description of the Law of the People’s Republic of China on Sino-Foreign Contractual Joint Ventures. Incorporated herein by reference to the Annual Report on Form 10-K/A filed on July 1, 2014 as Exhibit 99.3 thereto. |
* To be filed by amendment
** Filed herewith
Item 17. Undertakings
(a) The undersigned registrant hereby undertakes:
(1) To file, during any period in which offers or sales are being made, a post-effective amendment to this registration statement:
(i) To include any prospectus required by section 10(a)(3) of the Securities Act of 1933;
(ii) To reflect in the prospectus any facts or events arising after the effective date of the registration statement (or the most recent post-effective amendment thereof) which, individually or in the aggregate, represent a fundamental change in the information set forth in the registration statement. Notwithstanding the foregoing, any increase or decrease in volume of securities offered (if the total dollar value of securities offered would not exceed that which was registered) and any deviation from the low or high end of the estimated maximum offering range may be reflected in the form of prospectus filed with the Commission pursuant to Rule 424(b) of this chapter) if, in the aggregate, the changes in volume and price represent no more than a 20% change in the maximum aggregate offering price set forth in the “Calculation of Registration Fee” table in the effective registration statement; and
(iii) To include any material information with respect to the plan of distribution not previously disclosed in the registration statement or any material change to such information in the registration statement.
(2) That, for the purposes of determining any liability under the Securities Act of 1933, each such post-effective amendment shall be deemed to be a new registration statement relating to the securities offered therein, and the offering of the securities at that time shall be deemed to be the initial bona fide offering thereof.
(3) To remove from registration by means of a post-effective amendment any of the securities being registered which remain unsold at the termination of the offering.
| - 165 - |
(5)
(4) That, for the purpose of determining liability under the Securities Act of 1933 to any purchaser, each prospectus filed pursuant to Rule 424(b) as part of a registration statement relating to an offering, other than registration statements relying on Rule 430B or other than prospectuses filed in reliance on Rule 430A, shall be deemed to be part of and included in the registration statement as of the date it is first used after effectiveness. Provided, however, that no statement made in a registration statement or prospectus that is part of the registration statement or made in a document incorporated or deemed incorporated by reference into the registration statement or prospectus that is part of the registration statement will, as to a purchaser with a time of contract of sale prior to such first use, supersede or modify any statement that was made in the registration statement or prospectus that was part of the registration statement or made in any such document immediately prior to such date of first use.
(6)(5) For the purpose of determining liability of the registrant under the Securities Act of 1933 to any purchaser in the initial distribution of the securities in a primary offering of securities of the undersigned registrant pursuant to this registration statement, regardless of the underwriting method used to sell the securities to the purchaser, if the securities are offered or sold to such purchaser by means of any of the following communications, the undersigned registrant will be a seller to the purchaser and will be considered to offer or sell such securities to such purchaser:
(i) Any preliminary prospectus or prospectus of the undersigned registrant relating to the offering required to be filed pursuant to Rule 424;
(ii) Any free writing prospectus relating to the offering prepared by or on behalf of the undersigned registrant or used or referred to by the undersigned registrant;
(iii) The portion of any other free writing prospectus relating to the offering containing material information about the undersigned registrant or its securities provided by or on behalf of the undersigned registrant; and
(iv) Any other communication that is an offer in the offering made by the undersigned registrant to the purchaser.
(h)(b) Insofar as indemnification for liabilities arising under the Securities Act of 1933 (the “Act”) may be permitted to directors, officers and controlling persons of the registrant pursuant to the foregoing provisions, or otherwise, the registrant has been advised that in the opinion of the Securities and Exchange Commission such indemnification is against public policy as expressed in the Act and is, therefore, unenforceable. In the event that a claim for indemnification against such liabilities, other than the payment by the registrant of expenses incurred and paid by a director, officer or controlling person of the registrant in the successful defense of any action, suit or proceeding, is asserted by such director, officer or controlling person in connection with the securities being registered hereby, the registrant will, unless in the opinion of its counsel the matter has been settled by controlling precedent, submit to a court of appropriate jurisdiction the question whether such indemnification by it is against public policy as expressed in the Securities Act of 1933 and will be governed by the final adjudication of such issue.
(i)(c) The undersigned Registrant hereby undertakes that it will:
(1) for determining any liability under the Securities Act, treat the information omitted from the form of prospectus filed as part of this registration statement in reliance upon Rule 430A and contained in a form of prospectus filed by the registrant under Rule 424(b)(1), or (4) or 497(h) under the Securities Act as part of this registration statement as of the time the Commission declared it effective.
(2) for determining any liability under the Securities Act, treat each post-effective amendment that contains a form of prospectus as a new registration statement for the securities offered in the registration statement, and that offering of the securities at that time as the initial bona fide offering of those securities.
SIGNATURES
Pursuant to the requirements of the Securities Act of 1933, as amended, the registrant certifies that it has reasonable grounds to believe that the registrant meets all of the requirements for filing on Form S-1 and has duly caused this Registration Statement to be signed on its behalf by the undersigned, thereunto duly authorized, in the City of Guangzhou, in the PRC, on this 2327rdthday of September, 2013.February, 2015.
| SINO AGRO FOOD, INC. | ||
| By: | /s/ LEE YIP KUN SOLOMON | |
Lee Yip Kun Solomon | ||
| Chief Executive Officer | ||
| (Principal Executive Officer) |
| February 27, 2015 | By: | /s/ OLIVIA LAI |
| Olivia Lai | ||
| Chief Financial Officer | ||
| (Principal Financial
|
In accordance with the requirements of the Securities Act of 1933, this Registration Statement has been signed below by the following persons in the capacities and on the dates indicated.
| By: | /s/ LEE YIP KUN SOLOMON | |
Lee Yip Kun Solomon | ||
| Chief Executive Officer, Director | ||
| (Principal Executive
|
| By: | /s/ TAN POAY TEIK | |
Tan Poay Teik | ||
| Chief Marketing Officer and Director |
| By: | /s/ CHEN BORHANN | |
Chen Bor Hann | ||
| Corporate Secretary and Director |
| By: | /s/ YAP KOI MING | |
Yap Koi Ming | ||
| Director |
| By: | /s/ | |
| ||
| Director |
| February 27, 2015 | By: | /s/ DANIEL RITCHEY |
| Daniel Ritchey | ||
| Director |
| February 27, 2015 | By: | /s/ SOH LIM CHANG |
| Soh Lim Chang | ||
| Director |
PART I - FINANCIAL INFORMATION
ITEM 1. FINANCIAL STATEMENTS
SINO AGRO FOOD, INC. AND SUBSIDIARIES
QUARTERLY FINANCIAL STATEMENTS
FOR THE NINE MONTHS ENDED SEPTEMBER 30, 2014
(Unaudited)
SINO AGRO FOOD, INC. AND SUBSIDIARIES
INDEX TO QUARTERLY FINANCIAL STATEMENTS
FOR THE NINE MONTHS ENDED SEPTEMBER 30, 2014
(Unaudited)
CONSOLIDATED BALANCE SHEETS
| Note | September 30, 2014 | December 31, 2013 | ||||||||||
| (Unaudited) | (Audited) | |||||||||||
| ASSETS | ||||||||||||
| Current assets | ||||||||||||
| Cash and cash equivalents | 5 | $ | 4,691,157 | $ | 1,327,274 | |||||||
| Inventories | 6 | 37,439,892 | 8,148,203 | |||||||||
| Cost and estimated earnings in excess of billings on uncompleted contracts | 19 | 1,224,287 | 663,296 | |||||||||
| Deposits and prepaid expenses | 7 | 55,610,463 | 51,291,708 | |||||||||
| Accounts receivable, net of allowance for doubtful accounts | 8 | 122,773,881 | 82,057,942 | |||||||||
| Other receivables | 9 | 16,475,508 | 3,782,771 | |||||||||
| Total current assets | 238,215,188 | 147,271,194 | ||||||||||
| Property and equipment | ||||||||||||
| Property and equipment, net of accumulated depreciation | 10 | 61,274,162 | 46,487,058 | |||||||||
| Construction in progress | 11 | 69,088,637 | 59,134,732 | |||||||||
| Land use rights, net of accumulated amortization | 12 | 58,995,505 | 60,705,829 | |||||||||
| Total property and equipment | 189,358,304 | 166,327,619 | ||||||||||
| Other non-current assets | ||||||||||||
| Goodwill | 13 | 724,940 | 724,940 | |||||||||
| Proprietary technologies, net of accumulated amortization | 14 | 11,587,564 | 12,081,470 | |||||||||
| Temporary deposits paid to entities for investments in future Sino Joint Venture companies | 15 | 41,109,708 | 41,109,708 | |||||||||
| License rights | 17 | - | - | |||||||||
| Total other non- current assets | 53,422,212 | 53,916,118 | ||||||||||
| Total assets | $ | 480,995,704 | $ | 367,514,931 | ||||||||
| LIABILITIES AND STOCKHOLDERS' EQUITY | ||||||||||||
| Current liabilities | ||||||||||||
| Accounts payable and accrued expenses | $ | 16,477,918 | $ | 11,055,194 | ||||||||
| Other payables | 18 | 11,177,713 | 10,768,786 | |||||||||
| Billings in excess of costs and estimated earnings on uncompleted contracts | 19 | 3,373,432 | 3,146,956 | |||||||||
| Due to a director | 4,244,519 | 1,793,768 | ||||||||||
| Series F shares mandatory redemption payable | 20 | 3,146,063 | - | |||||||||
| Bonds payable | 22 | 1,725,000 | - | |||||||||
| Short term bank loan | 21 | - | 4,100,377 | |||||||||
| 40,144,645 | 30,865,081 | |||||||||||
| Non-current liabilities | ||||||||||||
| Series F shares mandatory redemption payable | 20 | - | 3,146,063 | |||||||||
| Long term debts | 21 | 2,616,610 | 180,417 | |||||||||
| Bonds payable | 22 | - | 1,725,000 | |||||||||
| Convertible note payable | 23 | 6,982,667 | - | |||||||||
| 9,599,277 | 5,051,480 | |||||||||||
| Commitments and contingencies | - | - | ||||||||||
| Stockholders' equity | ||||||||||||
| Preferred stock: $0.001 par value (10,000,000 shares authorized, 7,000,100 shares issued and outstanding as of September 30, 2014 and December 31, 2013, respectively) | ||||||||||||
| Series A preferred stock: $0.001 par value (100 shares designated, 100 shares issued and outstanding as of September 30, 2014 and December 31, 2013, respectively) | 24 | - | - | |||||||||
| Series B convertible preferred stock: $0.001 par value (10,000,000 shares designated, 7,000,000 shares issued and outstanding as of September 30, 2014 and December 31, 2013, respectively) | 24 | 7,000 | 7,000 | |||||||||
| Series F Non-convertible preferred stock: $0.001 par value (1,000,000 shares designated, 0 shares issued and outstanding as of September 30, 2014 and December 31, 2013, respectively) | 24 | - | - | |||||||||
| Common stock: $0.001 par value 17,171,717 shares authorized, 16,881,638 and 13,899,196 issued and outstanding as of September 30, 2014 and December 31, 2013, respectively) | 24 | 16,882 | 13,899 | |||||||||
| Additional paid - in capital | 118,665,621 | 105,037,379 | ||||||||||
| Retained earnings | 249,573,317 | 181,196,498 | ||||||||||
| Accumulated other comprehensive income | 6,244,379 | 6,260,131 | ||||||||||
| Treasury stock | 24 | (1,250,000 | ) | (1,250,000 | ) | |||||||
| Total Sino Agro Food, Inc. and subsidiaries stockholders' equity | 373,257,199 | 291,264,907 | ||||||||||
| Non - controlling interest | 57,994,583 | 40,333,463 | ||||||||||
| Total stockholders' equity | 431,251,782 | 331,598,370 | ||||||||||
| Total liabilities and stockholders' equity | $ | 480,995,704 | $ | 367,514,931 | ||||||||
The accompanying notes are an integral part of these consolidated financial statements.
| F - 1 |
CONSOLIDATED STATEMENTS OF INCOME AND OTHER COMPREHENSIVE INCOME
| Three months ended | Three months ended | Nine months ended | Nine months ended | |||||||||||||||||
| Note | September 30, 2014 | September 30, 2013 | September 30, 2014 | September 30, 2013 | ||||||||||||||||
| (Unaudited) | (Unaudited) | (Unaudited) | (Unaudited) | |||||||||||||||||
| Revenue | ||||||||||||||||||||
| - Sale of goods | $ | 82,171,415 | $ | 61,667,275 | $ | 242,800,784 | $ | 140,368,479 | ||||||||||||
| - Consulting and service income from development contracts | 24,598,641 | 8,873,865 | 51,188,141 | 39,070,677 | ||||||||||||||||
| - Commission income | 450,003 | 166,557 | 1,191,427 | 776,621 | ||||||||||||||||
| 107,220,059 | 70,707,697 | 295,180,352 | 180,215,777 | |||||||||||||||||
| Cost of goods sold | (59,121,526 | ) | (41,315,537 | ) | (173,035,915 | ) | (93,418,818 | ) | ||||||||||||
| Cost of services | (13,601,869 | ) | (3,269,035 | ) | (26,790,742 | ) | (19,760,570 | ) | ||||||||||||
| Gross profit | 34,496,664 | 26,123,125 | 95,353,695 | 67,036,389 | ||||||||||||||||
| General and administrative expenses | (3,594,509 | ) | (2,026,989 | ) | (9,544,763 | ) | (5,840,681 | ) | ||||||||||||
| Net income from operations | 30,902,155 | 24,096,136 | 85,808,932 | 61,195,708 | ||||||||||||||||
| Other income (expenses) | ||||||||||||||||||||
| Government grant | 57,340 | 343,481 | 295,012 | 423,240 | ||||||||||||||||
| Other income | 155,032 | 41,264 | 159,555 | 107,171 | ||||||||||||||||
| Gain of extinguishment of debts | 28 | 33,693 | 160,997 | 275,086 | 1,212,010 | |||||||||||||||
| Interest expense | (263,664 | ) | (286,376 | ) | (483,157 | ) | (398,386 | ) | ||||||||||||
| Net income (expenses) | (17,599 | ) | 259,366 | 246,496 | 1,344,035 | |||||||||||||||
| Net income before income taxes | 30,884,556 | 24,355,502 | 86,055,428 | 62,539,743 | ||||||||||||||||
| Provision for income taxes | 4 | - | - | - | - | |||||||||||||||
| Net income | 30,884,556 | 24,355,502 | 86,055,428 | 62,539,743 | ||||||||||||||||
| Less: Net (income) loss attributable to non - controlling interest | (6,382,694 | ) | (5,602,728 | ) | (17,678,609 | ) | (13,077,257 | ) | ||||||||||||
| Net income from continuing operations attributable to Sino Agro Food, Inc. and subsidiaries | 24,501,862 | 18,752,774 | 68,376,819 | 49,462,486 | ||||||||||||||||
| Other comprehensive (loss) income | ||||||||||||||||||||
| - Foreign currency translation (loss) income | 869,931 | 822,349 | (33,241 | ) | 2,258,890 | |||||||||||||||
| Comprehensive income | 25,371,793 | 19,575,123 | 68,343,578 | 51,721,376 | ||||||||||||||||
| Less: other comprehensive loss (income) attributable to non - controlling interest | (139,032 | ) | (165,987 | ) | 17,489 | (331,758 | ) | |||||||||||||
| Comprehensive income attributable to Sino Agro Food, Inc. and subsidiaries | $ | 25,232,761 | $ | 19,409,136 | $ | 68,361,067 | $ | 51,389,618 | ||||||||||||
| Earnings per share attributable to Sino Agro Food, Inc. and subsidiaries common stockholders: | ||||||||||||||||||||
| Basic | 30 | $ | 1.48 | $ | 1.52 | $ | 4.42 | $ | 4.23 | |||||||||||
| Diluted | 30 | $ | 1.43 | $ | 1.44 | $ | 4.23 | $ | 3.96 | |||||||||||
| Weighted average number of shares outstanding: | ||||||||||||||||||||
| Basic | 30 | 16,570,324 | 12,329,056 | 15,465,641 | 11,674,757 | |||||||||||||||
| Diluted | 30 | 17,176,384 | 13,036,126 | 16,172,711 | 12,477,288 | |||||||||||||||
The accompanying notes are an integral part of these consolidated financial statements.
| F - 2 |
CONSOLIDATED STATEMENTS OF CASH FLOWS
| Nine months ended | Nine months ended | |||||||
| September 30, 2014 | September 30, 2013 | |||||||
| (Unaudited) | (Unaudited) | |||||||
| Cash flows from operating activities | ||||||||
| Net income for the period | $ | 86,055,428 | $ | 62,539,743 | ||||
| Adjustments to reconcile net income for the period to net cash from operations: | ||||||||
| Depreciation | 1,768,047 | 995,408 | ||||||
| Amortization | 1,619,267 | 1,469,457 | ||||||
| Common stock issued for services | 255,033 | 271,800 | ||||||
| Gain on extinguishment of debts | (275,086 | ) | (1,212,010 | ) | ||||
| Other amortized cost | 229,857 | 14,152 | ||||||
| Changes in operating assets and liabilities: | ||||||||
| Increase in inventories | (29,291,689 | ) | (818,748 | ) | ||||
| (Increase) decrease in cost and estimated earnings in excess of billings on uncompleted contacts | (560,991 | ) | 577,059 | |||||
| Increase in deposits and prepaid expenses | (583,670 | ) | (37,090,703 | ) | ||||
| Increase in due to a director | 2,450,751 | 1,640,331 | ||||||
| Increase in accounts payable and accrued expenses | 5,361,625 | 2,468,434 | ||||||
| Increase in other payables | 12,415,301 | 17,952,791 | ||||||
| Increase in accounts receivable | (40,715,939 | ) | (6,742,274 | ) | ||||
| Increase (decrease) in billings in excess of costs and estimated earnings on uncompleted contracts | 226,476 | (376,629 | ) | |||||
| Increase in other receivables | (12,692,737 | ) | (3,623,402 | ) | ||||
| Net cash provided by operating activities | 26,261,673 | 38,065,409 | ||||||
| Cash flows from investing activities | ||||||||
| Purchases of property and equipment | (3,418,741 | ) | (4,188,660 | ) | ||||
| Payment for construction in progress | (22,227,905 | ) | (31,494,031 | ) | ||||
| Acquisition of land use rights | - | (489,904 | ) | |||||
| Net cash used in investing activities | (25,646,646 | ) | (36,172,595 | ) | ||||
| Cash flows from financing activities | ||||||||
| Net proceeds from convertible note payable | 5,237,000 | - | ||||||
| Proceeds from long term debts | 2,436,193 | - | ||||||
| Short term bank loan repaid | (4,100,377 | ) | (742,109 | ) | ||||
| Net proceeds of bonds payable | - | 339,884 | ||||||
| Dividends paid | - | (951,308 | ) | |||||
| Net cash provided by (used in) financing activities | 3,572,816 | (1,353,533 | ) | |||||
| Effects on exchange rate changes on cash | (823,960 | ) | 624,869 | |||||
| Increase in cash and cash equivalents | 3,363,883 | 1,164,150 | ||||||
| Cash and cash equivalents, beginning of period | 1,327,274 | 8,424,265 | ||||||
| Cash and cash equivalents, end of period | $ | 4,691,157 | $ | 9,588,415 | ||||
| Supplementary disclosures of cash flow information: | ||||||||
| Cash paid for interest | $ | 422,058 | $ | 398,386 | ||||
| Cash paid for income taxes | $ | - | $ | - | ||||
| Non - cash transactions | ||||||||
| Common stock issued for settlement of debts | $ | 12,006,374 | $ | 13,782,651 | ||||
| Common stock issued for services and compensation | $ | 2,519,232 | $ | 133,744 | ||||
| Series B convertible preferred stock cancelled | $ | - | $ | (3,000 | ) | |||
| Transfer construction in progress to property and equipment | $ | 13,136,410 | 14,406,643 | |||||
| Transfer deposits and prepaid expenses to property and equipment | $ | 513,272 | $ | - | ||||
The accompanying notes are an integral part of these consolidated financial statements.
| F - 3 |
NOTES TO CONSOLIDATED FINANCIAL STATEMENTS
| 1. | CORPORATE INFORMATION |
Sino Agro Food, Inc. (the “Company” or “SIAF”) (formerly known as Volcanic Gold, Inc. and A Power Agro Agriculture Development, Inc.) was incorporated on October 1, 1974 in the State of Nevada.
The Company was engaged in the mining and exploration business but ceased its mining and exploring business on October 14, 2005. On August 24, 2007, the Company entered into a Merger and Acquisition Agreement with Capital Award Inc., a Belize corporation (“CA”) and its subsidiaries Capital Stage Inc. (“CS”) and Capital Hero Inc. (“CH”). Effective the same date, CA completed a reverse merger transaction with SIAF. SIAF acquired all the outstanding common stock of CA from Capital Adventure, a shareholder of CA, for 32,000,000 shares of the Company’s common stock.
On August 24, 2007 the Company changed its name from Volcanic Gold, Inc. to A Power Agro Agriculture Development, Inc. On December 8, 2007, the Company changed its name to Sino Agro Food, Inc.
On September 5, 2007, the Company acquired three existing businesses in the People’s Republic of China (the“P.R.C.”):
| (a) | Hang Yu Tai Investment Limited (“HYT”), a company incorporated in Macau, the owner of a 78% equity interest in ZhongXingNongMu Ltd (“ZX”), a company incorporated in the PRC; |
| (b) | Tri-way Industries Limited (“TRW”), a company incorporated in Hong Kong; |
| (c) | Macau Eiji Company Limited (“MEIJI”), a company incorporated in Macau, the owner of 75% equity interest in Enping City Juntang Town Hang Sing Tai Agriculture Co. Ltd. (“HST”), a P.R.C. corporate Sino-Foreign joint venture. HST was dissolved in 2010. |
On November 27, 2007, MEIJI and HST established a corporate Sino - Foreign joint venture, Jiang Men City Heng Sheng Tai Agriculture Development Co. Ltd. (“JHST”), a company incorporated in the P.R.C. with MEIJI owning a 75% interest and HST owning a 25% interest and MEIJI withdrew its 25% equity interest in HST.
On November 26, 2008, SIAF established Pretty Mountain Holdings Limited (“PMH”), a company incorporated in Hong Kong with an 80% equity interest. On May 25, 2009, PMH formed a corporate Sino-Foreign joint venture, Qinghai Sanjiang A Power Agriculture Co. Ltd. (“SJAP”), incorporated in the PRC, of which PMH owns a 45% equity interest. At the time, the remaining 55% equity interest in SJAP was owned by the following entities:
SJAP is engaged in the business of manufacturing bio-organic fertilizer, livestock feed and development of other agriculture projects in the County of Huangyuan, in the vicinity of the Xining City, Qinghai Province, P.R.C.
In September 2009, the Company carried out an internal reorganization of its corporate structure and business, and formed a 100% owned subsidiary, A Power Agro Agriculture Development (Macau) Limited (“APWAM”), which was formed in Macau. APWAM then acquired PMH’s 45% equity interest in SJAP. By virtue of the acquisition, APWAM assumed all obligations and liabilities of PMH under the Sino Foreign Joint Venture Agreement. On May 7, 2010, Qinghai Sanjiang sold and transferred its equity interest in SJAP to Garwor. The State Administration for Industry and Commerce of Xining City Government of the P.R.C. approved the sale and transfer. As a result, APWAM owned 45% of SJAP and Garwor owned the remaining 55%. This remains the case as of the date of this report (the “Report”).
On September 9, 2010, an application was submitted by the Company to the Companies Registry of Hong Kong for deregistration of PMH under Section 291AA of the Hong Kong Companies Ordinance. On January 28, 2011, PMH was dissolved.
On February 15, 2011 and March 29, 2011, the Company entered into an agreement and a memorandum of understanding (an " MOU"), respectively, to sell 100% equity interest in HYT group (including HYT and ZX) to Mr. Xin Ming Sun, a director of ZhongXingNong Nu Co., Ltd for $45,000,000, with effective date of January 1, 2011.
| F - 4 |
SINO AGRO FOOD, INC.
NOTES TO CONSOLIDATED FINANCIAL STATEMENTS
| 1. | CORPORATE INFORMATION (CONTINUED) |
The Company applied to form Enping City Bi Tao A Power Prawn Culture Development Co. Limited (“EBAPCD”), in which the Company would indirectly own a 25% equity interest on February 28, 2011.
On February 28, 2011, TRW applied to form a corporate joint venture, Enping City Bi Tao A Power Fishery Development Co., Limited (“EBAPFD”), incorporated in the PRC. TRW owned a 25% equity interest in EBAPFD. On November 17, 2011, TRW formed Jiang Men City A Power Fishery Development Co., Limited (“JFD”) in which it acquired a 25% equity interest, while withdrawing its 25% equity interest in EBAPFD. As of December 31, 2011, the Company had invested for total cash consideration of $1,258,607 in JFD. JFD operates an indoor fish farm. On January 1, 2012, the Company acquired an additional 25% equity interest in JFD for total cash consideration of $1,662,365. As of January 1, 2012, the Company had consolidated the assets and operations of JFD. On April 1, 2012, the Company acquired an additional 25% equity interest in JFD for the total cash consideration of $1,702,580. These acquisitions were at our option according the terms of the original development agreement. The Company presently owns a 75% equity interest in JFD, representing majority of voting rights and controls its board of directors.
On April 15, 2011, MEIJI applied to form Enping City A Power Cattle Farm Co., Limited (“ECF”), all of which the Company would indirectly own a 25% equity interest in on November 17, 2011. On January 1, 2012, the Company had invested $1,076,489 in ECF and the amount was settled in contra against accounts receivable due from ECF. On September 17, 2012 MEIJI formed Jiang Men City Hang Mei Cattle Farm Development Co., Limited (“JHMC”) and acquired additional 50% equity interest for the total cash consideration of $2,944,176 on September 30, 2012 while withdrawing its 25% equity interest in ECF. This acquisition was at our option according to the terms of the original development agreement. The Company presently owns 75% equity interest in JHMC, representing majority of voting right and controls its board of directors. As of September 30, 2012, the Company had consolidated the assets and operations of JHMC. Up to September 30, 2014, MEIJI further invested in JHMC of $400,000 in JHMC.
On July 18, 2011, the Company formed Hunan Shenghua A Power Agriculture Co., Limited (“HSA”), in which the Company owns a 26% equity interest, and SJAP owns a 50% equity interest with the Chinese partner owning the remaining 24%. Up to September 30, 2014, MEIJI and SJAP total investment in HSA were $857,808 and 629,344, respectively.
On November 12, 2013, the Company acquired a shell company, Goldcup9203 AB, incorporated in Sweden, in which the Company owns a 100% equity interest. Goldcup 9203 AB changed its name to Sino Agro Food Sweden AB (publ) (“SAFS”). Up to September 30, 2014, the Company’s total investment in SAFS was $77,664.
SJAP formed Qinghai Zhong He Meat Products Co., Limited (“QZH”), with SJAP would owning 100% equity interest. Up to September 30, 2014, the SJAP’s total investment in QZH was $487,805.
The Company’s principal executive office is located at Room 3801, Block A, China Shine Plaza, No. 9 Lin He Xi Road, Tianhe District, Guangzhou City, Guangdong Province, P.R.C., 510610.
The nature of the operations and principal activities of the Company and its subsidiaries are described in Note 2.2.
| 2. | SUMMARY OF SIGNIFICANT ACCOUNTING POLICIES |
| 2.1 | FISCAL YEAR |
The Company has adopted December 31 as its fiscal year end.
| F - 5 |
SINO AGRO FOOD, INC.
NOTES TO CONSOLIDATED FINANCIAL STATEMENTS
| 2. | SUMMARY OF SIGNIFICANT ACCOUNTING POLICIES (CONTINUED) |
| 2.2 | REPORTING ENTITIES |
| Name of subsidiaries | Place of incorporation | Percentage of interest | Principal activities | |||
| Capital Award Inc. ("CA") | Belize | 100% (12.31.2013: 100%) directly | Fishery development and holder of A-Power Technology master license. | |||
| Capital Stage Inc. ("CS") | Belize | 100% (12.31.2013: 100%) indirectly | Dormant | |||
| Capital Hero Inc. ("CH") | Belize | 100% (12.31.2013: 100%) indirectly | Dormant | |||
| Sino Agro Food Sweden ("SAFS") | Sweden | 100% (12.31.2013: 100%) directly | Dormant | |||
| Tri-way Industries Limited ("TRW") | Hong Kong, P.R.C. | 100% (12.31.2013: 100%) directly | Investment holding, holder of enzyme technology master license for manufacturing of livestock feed and bio-organic fertilizer and has not commenced its planned business of fish farm operations. | |||
| Macau Meiji Limited ("MEIJI") | Macau, P.R.C. | 100% (12.31.2013: 100%) directly | Investment holding, cattle farm development, beef cattle and beef trading | |||
| A Power Agro Agriculture Development (Macau) Limited ("APWAM") | Macau, P.R.C. | 100% (12.31.2013: 100%) directly | Investment holding | |||
| Jiang Men City Heng Sheng Tai Agriculture Development Co. Ltd ("JHST") | P.R.C. | 75% (12.31.2013: 75%) indirectly | Hylocereus Undatus Plantation ("HU Plantation"). | |||
| Jiang Men City A Power Fishery Development Co., Limited ("JFD") | P.R.C. | 75% (12.31.2013: 75%) indirectly | Fish cultivation | |||
| Jiang Men City Hang Mei Cattle Farm Development Co., Limited ("JHMC") | P.R.C. | 75% (12.31.2013: 75%) indirectly | Beef cattle cultivation | |||
| Hunan Shenghua A Power Agriculture Co., Limited ("HSA") | P.R.C. | 26% directly and 50% indirectly (12.31.2013: 26% directly and 50% indirectly) | Manufacturing of organic fertilizer, livestock feed, and beef cattle and sheep cultivation, and plantation of crops and pastures | |||
| Name of variable interest entities | Place of incorporation | Percentage of interest | Principal activities | |||
| Qinghai Sanjiang A Power Agriculture Co., Ltd ("SJAP") | P.R.C. | 45% (12.31.2013: 45%) indirectly | Manufacturing of organic fertilizer, livestock feed, and beef cattle and plantation of crops and pastures | |||
| Qinghai Zhong He Meat Products Co., Limited (QZH) | P.R.C. | 100% (12.31.2013: 100%) indirectly | Slaughter of cattle |
| F - 6 |
SINO AGRO FOOD, INC.
NOTES TO CONSOLIDATED FINANCIAL STATEMENTS
| 2. | SUMMARY OF SIGNIFICANT ACCOUNTING POLICIES (CONTINUED) |
| 2.3 | BASIS OF PRESENTATION |
The unaudited consolidated financial statements for the nine months ended September 30, 2014 are prepared in accordance with generally accepted accounting principles in the United States of America (“US GAAP”).
The unaudited quarterly financials for the nine months ended September 30, 2014 results are for the nine months and do not necessarily indicate the results for a full year. The information included in this interim report should be read in conjunction with the information included in the Company’s annual report on Form 10-K for the fiscal year ended December 31, 2013.
Reverse stock split and new conversion rate of Series B preferred stock to share of common stock
On December 16, 2014, the Company implemented a 9.9-for-1 reverse stock split. On December 17, 2014, the Company implemented new conversion rate of 9.9 for 1 share of common stock. All share information contained within this report, including consolidated balance sheets, consolidated statements of income and other comprehensive income, and footnotes have been retroactively adjusted for the effects of the reverse stock split and new conversion rate of Series B preferred stock to share of common stock.
| 2.4 | BASIS OF CONSOLIDATION |
The consolidated financial statements include the financial statements of the Company, its subsidiaries CA, CS, CH, TRW, MEIJI, JHST, JFD, JHMC, HSA, APWAM, and SAFS and its variable interest entities SJAP and QZH. All material inter-company transactions and balances have been eliminated in consolidation.
SIAF, CA, CS, CH, TRW, MEIJI, JHST, JFD, JHMC, HSA, APWAM, QZH, SAFS and SJAP are hereafter referred to as (“the Company”).
| 2.5 | BUSINESS COMBINATION |
The Company adopted the accounting pronouncements relating to business combination (primarily contained in ASC Topic 805 “Business Combinations”), including assets acquired and liabilities assumed on arising from contingencies. These pronouncements established principles and requirement for how the acquirer of a business recognizes and measures in its financial statements he identifiable assets acquired, the liabilities assumed, and any non-controlling interest in the acquisition as well as provides guidance for recognizing and measuring the goodwill acquired in the business combination and determines what information to disclose to enable users of the financial statements to evaluate the nature and financial effects of the business combination. In addition, these pronouncements eliminate the distinction between contractual and non-contractual contingencies, including the initial recognition and measurement criteria and require an acquirer to develop a systematic and rational basis for subsequently measuring and accounting for acquired contingencies depending on their nature. The Company’s adoption of these pronouncements will have an impact on the manner in which it accounts for any future acquisitions.
| 2.6 | NON - CONTROLLING INTEREST IN CONSOLIDATED FINANCIAL STATEMENTS |
The Company adopted the accounting pronouncement on non-controlling interests in consolidated financial statements, which establishes accounting and reporting standards for the non-controlling interest in a subsidiary and for the deconsolidation of a subsidiary. This guidance is primarily contained in ASC Topic “Consolidation.” It clarifies that a non-controlling interest in a subsidiary is an ownership interest in the consolidated financial statements. The adoption of this standard has not had material impact on the Company’s consolidated financial statements.
| 2.7 | USE OF ESTIMATES |
The preparation of consolidated financial statements in conformity with US GAAP requires management to make assumptions and estimates that affect the reported amounts of assets and liabilities and disclosure of contingent assets and liabilities at the dates of the consolidated financial statements and the reported amounts of revenues and expenses during the reporting periods covered thereby. Actual results could differ from these estimates. Judgments and estimates of uncertainties are required in applying the Company’s accounting policies in certain areas. The following are some of the areas requiring significant judgments and estimates: determinations of the useful lives of assets, estimates of allowances for doubtful accounts, cash flow and valuation assumptions in performing asset impairment tests of long-lived assets, estimates of the realization of deferred tax assets and inventory reserves.
| F - 7 |
SINO AGRO FOOD, INC.
NOTES TO CONSOLIDATED FINANCIAL STATEMENTS
| 2. | SUMMARY OF SIGNIFICANT ACCOUNTING POLICIES (CONTINUED) |
| 2.8 | REVENUE RECOGNITION |
The Company’s revenue recognition policies are in compliance with ASC 605. Sales revenue is recognized when all of the following have occurred: (i) persuasive evidence of an arrangement exists, (ii) delivery has occurred or services have been rendered, (iii) the price is fixed or determinable, and (iv) the ability to collect is reasonably assured. These criteria are generally satisfied at the time of shipment when risk of loss and title passes to the customer.
Government grants are recognized when (i) the Company has substantially accomplished what must be done pursuant to the terms of the grant that are established by the local government; and (ii) the Company receives notification from the local government that the Company has satisfied all of the requirements to receive the government grants; and (iii) the amounts are received.
Multiple-Element Arrangements
To qualify as a separate unit of accounting under ASC 605-25 “Multiple Element Arrangements”, the delivered item must have value to the customer on a standalone basis. The significant deliverables under the Company’s multiple-element arrangements are consulting and service under development contract, commission and management service.
Revenues from the Company's consulting and services under development contracts are performed under fixed-price contracts. Revenues under long-term contracts are accounted for under the percentage-of-completion method of accounting in accordance with the Financial Accounting Standards Board (“FASB”) Accounting Standards Codification (“ASC”) Topic 605, Revenue Recognition(“ASC 605”). Under the percentage-of-completion method, the Company estimates profit as the difference between total estimated revenue and total estimated cost of a contract and recognizes that profit over the contract term. The percentage of costs incurred determines the amount of revenue to be recognized. Payment terms are generally defined by the installation contract and as a result may not match the timing of the costs incurred by the Company and the related recognition of revenue. Such differences are recorded as either costs or estimated earnings in excess of billings on uncompleted contracts or billings in excess of costs and estimated earnings on uncompleted contracts. The Company determines a customer’s credit worthiness at the time an order is accepted. Sudden and unexpected changes in a customer’s financial condition could put recoverability at risk.
The percentage of completion method requires the ability to estimate several factors, including the ability of the customer to meet its obligations under the contract, including the payment of amounts when due. If the Company determines that collectability is not assured, the Company will defer revenue recognition and use methods of accounting for the contract such as the completed contract method until such time as the Company determines that collectability is reasonably assured or through the completion of the project.
For fixed-price contracts, the Company uses the ratio of costs incurred to date on the contract to management's estimate of the contract's total costs, to determine the percentage of completion on each contract. This method is used as management considers expended costs to be the best available measure of progression of these contracts. Contract costs include all direct material, subcontract and labor costs and those indirect costs related to contract performance, such as supplies, tool repairs and depreciation. The Company accounts for maintenance and repair services under the guidance of ASC 605 as the services provided relate to construction work. Contract costs incurred to date and expected total contract costs are continuously monitored during the term of the contract. Changes in job performance, job conditions, and estimated profitability arising from contract penalty, change orders and final contract settlements may result in revisions to the estimated profit ability during the contract. These changes, which include contracts with estimated costs in excess of estimated revenues, are recognized as contract costs in the period in which the revisions are determined. Profit incentives are included in revenues when their realization is reasonably assured. At the point the Company anticipates a loss on a contract, the Company estimates the ultimate loss through completion and recognizes that loss in the period in which the loss was identified.
| F - 8 |
SINO AGRO FOOD, INC.
NOTES TO CONSOLIDATED FINANCIAL STATEMENTS
| 2. | SUMMARY OF SIGNIFICANT ACCOUNTING POLICIES (CONTINUED) |
| 2.8 | REVENUE RECOGNITION (CONTINUED) |
The Company does not provide warranties to customers on a basis customary to the industry, however, customers can claim warranty directly from product manufacturers for defects in equipment or products. Historically, the Company has experienced no warranty claims.
The Company provides various management services to its customers in the P.R.C. based on a negotiated fixed-price contract. The clients usually pay the fees when the services contract is signed and services are rendered. The Company recognizes these services-based revenues from contracts when (i) management services are rendered; (ii) clients recognize the completion of services; and (iii) collectability is reasonably assured. Fees received in advance are recorded as deferred revenue under current liabilities.
| 2.9 | COST OF GOODS SOLD AND COST OF SERVICES |
Cost of goods sold consists primarily of direct purchase cost of merchandise goods, and related levies. Cost of services consists primarily direct cost and indirect cost incurred to date for development contracts and provision for anticipated losses for development contracts.
| 2.10 | SHIPPING AND HANDLING |
Shipping and handling costs related to cost of goods sold are included in general and administrative expenses, which totaled $1,673, $6,158, $13,490 and $18,640 for the three months and for the nine months ended September 30, 2014 and 2013, respectively.
| 2.11 | ADVERTISING |
Advertising costs are included in general and administrative expenses, which totaled $708,049, $195, $1,661,103 and $1,200 for the three months ended and the nine months ended September 30, 2014 and 2013, respectively.
| 2.12 | FOREIGN CURRENCY TRANSLATION AND OTHER COMPREHENSIVE INCOME |
The reporting currency of the Company is the U.S. dollars. The functional currency of the Company is the Chinese Renminbi (RMB).
For those entities whose functional currency is other than the U.S. dollars, all assets and liabilities are translated into U.S. dollars at the exchange rate on the balance sheet date; shareholders’ equity is translated at historical rates and items in the statements of income and of cash flows are translated at the average rate for the period. Because cash flows are translated based on the average translation rate, amounts related to assets and liabilities reported in the statements of cash flows will not necessarily agree with changes in the corresponding balances in the balance sheets. Translation adjustments resulting from this process are included in accumulated other comprehensive income in the statements of shareholders’ equity. Transaction gains and losses that arise from exchange rate fluctuations on transactions denominated in a currency other than the functional currency are included in the statements of income and other comprehensive income, as incurred.
Accumulated other comprehensive income in the consolidated statement of shareholders’ equity amounted to $6,244,379 as of September 30, 2014 and $6,260,131 as of December 31, 2013. The balance sheet amounts with the exception of equity as of September 30, 2014 and December 31, 2013 were translated using an exchange rate of RMB 6.15 to $1.00 and RMB 6.10 to $1.00, respectively. The average translation rates applied to the statements of income and other comprehensive income and of cash flows for the nine months ended September 30, 2014 and 2013 were RMB 6.15 to $1.00 and RMB 6.21 to $1.00, respectively.
| F - 9 |
SINO AGRO FOOD, INC.
NOTES TO CONSOLIDATED FINANCIAL STATEMENTS
| 2. | SUMMARY OF SIGNIFICANT ACCOUNTING POLICIES (CONTINUED) |
| 2.13 | CASH AND CASH EQUIVALENTS |
The Company considers all highly liquid securities with original maturities of three months or less when acquired to be cash equivalents. Cash and cash equivalents kept with financial institutions in the P.R.C. are not insured or otherwise protected. Should any of those institutions holding the Company’s cash become insolvent, or should the Company become unable to withdraw funds for any reason, the Company could lose the cash on deposit with that institution.
| 2.14 | ACCOUNTS RECEIVABLE |
The Company maintains reserves for potential credit losses on accounts receivable. Management reviews the composition of accounts receivable and analyzes historical bad debts, customer concentrations, customer credit worthiness, current economic trends and changes in customer payment patterns to evaluate the adequacy of these reserves. Reserves are recorded primarily on a specific identification basis.
The standard credit period for most of the Company’s clients is three months. The collection period over 1 year is classified as long-term accounts receivable. Management evaluates the collectability of the receivables at least quarterly. Provision for doubtful accounts as of September 30, 2014 and December 31, 2013 are $0.
| 2.15 | INVENTORIES |
Inventories are valued at the lower of cost (determined on a weighted average basis) and net realizable value.
Costs incurred in bringing each product to its location and conditions are accounted for as follows:
| (a) | raw materials – purchase cost on a weighted average basis; |
| (b) | manufactured finished goods and work-in-progress – cost of direct materials and labor and a proportion of manufacturing overhead based on normal operation capacity but excluding borrowing costs; and |
| (c) | retail and wholesale merchandise finished goods – purchase cost on a weighted average basis. |
Net realizable value is the estimated selling price in the ordinary course of business, less estimated costs for completion and the estimated costs necessary to make the sale.
| 2.16 | PROPERTY AND EQUIPMENT |
Property and equipment are stated at cost less accumulated depreciation and any accumulated impairment losses. Such costs include the cost of replacing parts that are eligible for capitalization when the cost of replacing the parts is incurred. Similarly, when each major inspection is performed, its cost is recognized in the carrying amount of the property and equipment as a replacement only if it is eligible for capitalization. The assets’ residual values, useful lives and depreciation methods are reviewed, and adjusted if appropriate, at each financial year end.
Depreciation is calculated on a straight-line basis over the estimated useful lives of the assets.
| Plant and machinery | 5 - 10 years |
| Structure and leasehold improvements | 10 - 20 years |
| Mature seeds and herbage cultivation | 20 years |
| Furniture and equipment | 2.5 - 10 years |
| Motor vehicles | 5 -10 years |
An item of property and equipment is removed from the accounts upon disposal or when no future economic benefits are expected to arise from the continued use of the asset. Any gain or loss arising on disposal of the asset (calculated as the difference between the net disposal proceeds and the carrying amount of the item) is included in the consolidated statements of income in the period the item is disposed.
| 2.17 | GOODWILL |
Goodwill is an asset representing the fair economic benefits arising from other assets acquired in a business combination that are not individually identified or separately recognized. Goodwill is tested for impairment on an annual basis at the end of the Company’s fiscal year, or when impairment indicators arise. The Company uses a fair-value-based approach to test for impairment at the level of each reporting unit. The Company directly acquired MEIJI, which is the holding company of JHST that operates the Hu Plantation. As a result of this acquisition, the Company recorded goodwill in the amount of $724,940. This goodwill represents the fair value of the assets acquired in these acquisitions over the cost of the assets acquired.
| F - 10 |
SINO AGRO FOOD, INC.
NOTES TO CONSOLIDATED FINANCIAL STATEMENTS
| 2. | SUMMARY OF SIGNIFICANT ACCOUNTING POLICIES (CONTINUED) |
| 2.18 | PROPRIETARY TECHNOLOGIES |
A master license of stock feed manufacturing technology was acquired and the costs of acquisition are capitalized as proprietary technologies when technological feasibility has been established. Cost of acquisition of stock feed manufacturing technology master license is amortized using the straight-line method over its estimated life of 20 years.
An aromatic cattle-feeding formula was acquired and the costs of acquisition are capitalized as proprietary technologies when technological feasibility has been established. Cost of acquisition on aromatic cattle-feeding formula is amortized using the straight-line method over its estimated life of 25 years.
The cost of sleepy cod breeding technology license is capitalized as proprietary technologies when technological feasibility has been established. Cost of granting sleepy cod breeding technology license is amortized using the straight-line method over its estimated life of 25 years.
Bacterial cellulose technology license and related trade mark are capitalized as proprietary technologies when technological feasibility has been established. Cost of license and related trade mark is amortized using the straight-line method over its estimated life of 20 years.
The Company has determined that technological feasibility is established at the time a working model of products is completed. Proprietary technologies are intangible assets of finite lives. Management evaluates the recoverability of proprietary technologies on an annual basis at the end of the Company’s fiscal year, or when impairment indicators arise. As required by ASC Topic 350 “Intangible – Goodwill and Other”, the Company uses a fair-value-based approach to test for impairment.
| 2.19 | CONSTRUCTION IN PROGRESS |
Construction in progress represents direct costs of construction as well as acquisition and design fees incurred. Capitalization of these costs ceases and the construction in progress is transferred to property and equipment when substantially all the activities necessary to prepare the assets for their intended use are completed. No depreciation is provided until construction is completed and the asset is ready for its intended use.
| 2.20 | LAND USE RIGHTS |
Land use rights represent acquisition of rights to agricultural land from farmers and are amortized on the straight-line basis over their respective lease periods. The lease period of agricultural land is in the range from 10 to 60 years. Land use rights purchase prices were determined in accordance with the P.R.C. Government’s minimum lease payments on agricultural land and mutually agreed to terms between the Company and the vendors.
| 2.21 | CORPORATE JOINT VENTURE |
A corporation formed, owned, and operated by two or more businesses as a separate and discrete business or project (venture) for their mutual benefit is considered to be a corporate joint venture. Investee entities, in which the Company can exercise significant influence, but not control, are accounted for under the equity method of accounting. Under the equity method of accounting, the Company’s share of the earnings or losses of these companies is included in net income.
A loss in value of an investment that is other than a temporary decline is recognized as a charge to operations. Evidence of a loss in value might include, but would not necessarily be limited to, the absence of an ability to recover the carrying amount of the investment or inability of the investee to sustain an earnings capacity that would justify the carrying amount of the investment.
| F - 11 |
SINO AGRO FOOD, INC.
NOTES TO CONSOLIDATED FINANCIAL STATEMENTS
| 2. | SUMMARY OF SIGNIFICANT ACCOUNTING POLICIES (CONTINUED) |
| 2.22 | VARIABLE INTEREST ENTITY |
A variable interest entity (“VIE”) is an entity (investee) in which the investor has obtained less than a majority interest, according to the Financial Accounting Standards Board (FASB). A VIE is subject to consolidation if a VIE meets one of the following three criteria as elaborated in ASC Topic 810-10, Consolidation:
| (a) | equity-at-risk is not sufficient to support the entity's activities; |
| (b) | as a group, the equity-at-risk holders cannot control the entity; or |
| (c) | the economics do not coincide with the voting interest. |
If a firm is the primary beneficiary of a VIE, the holdings must be disclosed on the balance sheet. The primary beneficiary is defined as the person or company with the majority of variable interests. A corporation formed, owned, and operated by two or more businesses (ventures) as a separate and discrete business or project (venture) for their mutual benefit is defined as a joint venture.
| 2.23 | TREASURY STOCK |
Treasury stock means shares of a corporation’s own stock that have been issued and subsequently reacquired by the corporation. Converting outstanding shares to treasury shares does not reduce the number of shares issued but does reduce the number of shares outstanding. These shares are not eligible to receive dividends. Accounting for excesses and deficiencies on treasury stock transactions is governed by ASC 505-30-30.
State laws and federal agencies closely regulate transactions involving a company’s own capital stock, so the purchase of outstanding shares must have a legitimate purpose. Some of the most common reasons for purchasing outstanding shares are as follows:
| (a) | to meet additional stock needs for various reasons, including newly implemented stock option plans, stock for convertible bonds or convertible preferred stock, or a stock dividend. |
| (b) | to make more shares available for acquisitions of other entities. |
The cost method of accounting for treasury shares has been adopted by the Company. The purchase of outstanding shares and thus converting them into treasury shares is treated as a temporary reduction in shareholders’ equity in view of the expectation to reissue the shares instead of retiring them. When the Company reissues the treasury shares, the temporary account is eliminated. The cost of acquiring outstanding shares for converting into treasury shares is charged to a contra account, in this case a contra equity account that reduces the stockholder equity balance.
| 2.24 | INCOME TAXES |
The Company accounts for income taxes under the provisions of ASC Topic 740 “Accounting for Income Taxes.” Under ASC Topic 740, deferred tax assets and liabilities are determined based on the difference between the financial statement carrying amounts and the tax bases of assets and liabilities using enacted tax rates in effect in the years in which the differences are expected to reverse.
The provision for income tax is based on the results for the year as adjusted for items, which are non-assessable or disallowed. It is calculated using tax rates that have been enacted or substantively enacted at the balance sheet date. Deferred tax is accounted for using the balance sheet liability method in respect of temporary differences arising from differences between the carrying amount of assets and liabilities in the financial statements and the corresponding tax basis used in the computation of assessable tax profit. In principle, deferred tax liabilities are recognized for all taxable temporary differences, and deferred tax assets are recognized to the extent that it is probable that taxable profit will be available against which deductible temporary differences can be utilized.
| F - 12 |
SINO AGRO FOOD, INC.
NOTES TO CONSOLIDATED FINANCIAL STATEMENTS
| 2. | SUMMARY OF SIGNIFICANT ACCOUNTING POLICIES (CONTINUED) |
| 2.24 | INCOME TAXES (CONTINUED) |
Deferred income taxes are calculated at the tax rates that are expected to apply to the period when the asset is realized or the liability is settled. Deferred tax is charged or credited in the income statement, except when it related to items credited or charged directly to equity, in which case the deferred tax is also dealt with in equity. Deferred tax assets and liabilities are offset when they relate to income taxes levied by the same taxation authority and the Company intends to settle its current tax assets and liabilities on a net basis.
ASC Topic 740 also prescribes a more-likely-than-not threshold for financial statement recognition and measurement of a tax position taken, or for one expected to be taken, in a tax return. ASC Topic 740 also provides guidance related to, among other things, classification, accounting for interest and penalties associated with tax positions, and disclosure requirements. Any interest and penalties accrued related to unrecognized tax benefits will be recorded as tax expense.
| 2.25 | POLITICAL AND BUSINESS RISK |
The Company's operations are carried out in the P.R.C. Accordingly, the political, economic and legal environment in the P.R.C. may influence the Company’s business, financial condition and results of operations by the general state of the P.R.C.'s economy. The Company's operations in the P.R.C. are subject to specific considerations and significant risks not typically associated with companies in North America and Western Europe. The Company's results may be adversely affected by changes in governmental policies with respect to laws and regulations, anti-inflationary measures, currency conversion and remittance abroad, and rates and methods of taxation, among other things.
| 2.26 | CONCENTRATION OF CREDIT RISK |
Cash includes cash at banks and demand deposits in accounts maintained with banks within the P.R.C. Total cash in these banks as of September 30, 2014 and December 31, 2013 amounted to $4,575,685 and $1,256,440 respectively, none of which is covered by insurance. The Company has not experienced any losses in such accounts and believes it is not exposed to any risks to its cash in bank accounts.
The Company had 5 major customers (A, B, C, D & E) whose business individually represented the following percentages of the Company’s total revenue for the periods indicated:
| Three months | Three months | Nine months | Nine months | |||||||||||||
| ended | ended | ended | ended | |||||||||||||
| September 30, | September 30, | September 30, | September 30, | |||||||||||||
| 2014 | 2013 | 2014 | 2013 | |||||||||||||
| Customer A | 24.57 | % | 13.95 | % | 28.24 | % | 16.76 | % | ||||||||
| Customer B | 15.78 | % | 11.38 | % | 16.70 | % | 8.24 | % | ||||||||
| Customer C | 14.33 | % | - | 11.64 | % | - | ||||||||||
| Customer D | 8.33 | % | 13.12 | % | 7.12 | % | 8.41 | % | ||||||||
| Customer E | 5.77 | % | - | - | 3.80 | % | ||||||||||
| Customer F | - | 17.99 | % | 5.39 | % | 17.21 | % | |||||||||
| Customer G | - | 7.29 | % | - | - | |||||||||||
| 68.78 | % | 63.73 | % | 69.09 | % | 54.42 | % | |||||||||
| F - 13 |
SINO AGRO FOOD, INC.
NOTES TO CONSOLIDATED FINANCIAL STATEMENTS
| 2. | SUMMARY OF SIGNIFICANT ACCOUNTING POLICIES (CONTINUED) |
| 2.26 | CONCENTRATION OF CREDIT RISK (CONTINUED) |
| Percent of | ||||||||||
| Segment | revenue | Amount | ||||||||
| Customer A | Fishery Development and Corporate and others Divisions | 28.24 | % | $ | 83,356,492 | |||||
| Customer B | Organic Fertilizer and Bread Grass Division | 16.70 | % | $ | 49,309,009 | |||||
| Customer C | Fishery Development Division | 11.64 | % | $ | 34,344,729 | |||||
Accounts receivable are derived from revenue earned from customers located primarily in the P.R.C. The Company performs ongoing credit evaluations of customers and has not experienced any material losses to date.
The Company had 5 major customers whose accounts receivable balance individually represented the following percentages of the Company’s total accounts receivable:
| September 30, 2014 | December 31, 2013 | |||||||
| Customer A | 19.22 | % | 8.69 | % | ||||
| Customer B | 11.32 | % | - | |||||
| Customer C | 6.73 | % | 12.86 | % | ||||
| Customer D | 6.30 | % | - | |||||
| Customer E | - | 8.36 | % | |||||
| Customer F | - | 10.23 | % | |||||
| Customer G | 4.89 | % | 8.27 | % | ||||
| 48.46 | % | 48.41 | % | |||||
As of September 30, 2014, amounts due from customers A, B and C are $23,600,631, $13,901,362 and $8,262,682, respectively. The Company has not experienced any significant difficulty in collecting its accounts receivable in the past and is not aware of any financial difficulties of its major customers.
| 2.27 | IMPAIRMENT OF LONG-LIVED ASSETS AND INTANGIBLE ASSETS |
In accordance with ASC Topic 360, “Property, Plant and Equipment,” long-lived assets to be held and used are analyzed for impairment whenever events or changes in circumstances indicate that the related carrying amounts may not be recoverable. The Company reviews the carrying amount of its long-lived assets, including intangibles, for impairment, each reporting period. An asset is considered impaired when estimated future cash flows are less than the carrying amount of the asset. In the event the carrying amount of such asset is considered not recoverable, the asset is adjusted to its fair value. Fair value is generally determined based on discounted future cash flow. As of September 30, 2014 and December 31, 2013, the Company determined no impairment losses were necessary.
| F - 14 |
SINO AGRO FOOD, INC.
NOTES TO CONSOLIDATED FINANCIAL STATEMENTS
| 2. | SUMMARY OF SIGNIFICANT ACCOUNTING POLICIES (CONTINUED) |
| 2.28 | EARNINGS PER SHARE |
As prescribed in ASC Topic 260 “Earnings per Share,” Basic Earnings per Share (“EPS”) is computed by dividing net income available to common stockholders by the weighted average number of common stock shares outstanding during the year. Diluted EPS is computed by dividing net income available to common stockholders by the weighted-average number of common stock shares outstanding during the year plus potential dilutive instruments such as stock options and warrants. The effect of stock options on diluted EPS is determined through the application of the treasury stock method, whereby proceeds received by the Company based on assumed exercises are hypothetically used to repurchase the Company’s common stock at the average market price during the period.
For the three months ended September 30, 2014 and 2013, basic earnings per share attributable to Sino Agro Food, Inc. and subsidiaries common stockholders amount to $1.48 and $1.52, respectively. For the nine months ended September 30, 2014 and 2013, basic earnings per share attributable to Sino Agro Food, Inc. and subsidiaries common stockholders amount to $4.42 and $4.23, respectively. For the three months ended September 30, 2014 and 2013, diluted earnings per share attributable to Sino Agro Food, Inc. and its subsidiaries’ common stockholders amounted to $1.43 and $1.44, respectively. For the nine months ended September 30, 2014 and 2013, diluted earnings per share attributable to Sino Agro Food, Inc. and its subsidiaries’ common stockholders amounted to $4.23 and $3.96, respectively.
| 2.29 | ACCUMULATED OTHER COMPREHENSIVE INCOME |
ASC Topic 220 “Comprehensive Income” establishes standards for reporting and displaying comprehensive income and its components in financial statements. Comprehensive income is defined as the change in stockholders’ equity of a business enterprise during a period from transactions and other events and circumstances from non-owner sources. The comprehensive income for all periods presented includes both the reported net income and net change in cumulative translation adjustments.
| 2.30 | RETIREMENT BENEFIT COSTS |
P.R.C. state managed retirement benefit programs are defined contribution plans and the payments to the plans are charged as expenses when employees have rendered service entitling them to the contribution made by the employer.
| 2.31 | STOCK-BASED COMPENSATION |
The Company has adopted both ASC Topic 718, “Compensation - Stock Compensation” and ASC Topic 505-50, “Equity-Based Payments to Non- Employees” using the fair value method in which an entity issues its equity instruments to acquire goods and services from employees and non-employees. Stock compensation for stock granted to non-employees has been determined in accordance with this accounting standard and the accounting standard regarding accounting for equity instruments that are issued to other than employees for acquiring, or in conjunction with selling goods or services, as the fair value of the consideration received or the fair value of equity instruments issued, whichever is more reliably measured. This accounting standard allows the “simplified” method to determine the term of employee options when other information is not available. Under ASC Topic 718 and ASC Topic 505-50, stock compensation expenses is measured at the grant date on the value of the option or restricted stock and is recognized as expenses, less expected forfeitures, over the requisite service period, which is generally the vesting period.
| F - 15 |
SINO AGRO FOOD, INC.
NOTES TO CONSOLIDATED FINANCIAL STATEMENTS
| 2. | SUMMARY OF SIGNIFICANT ACCOUNTING POLICIES (CONTINUED) |
| 2.32 | FAIRvalue of financial INSTRUMENTS |
The Company follows paragraph 825-10-50-10 of the FASB Accounting Standards Codification for disclosures about fair value of its financial instruments and paragraph 820-10-35-37 of the FASB Accounting Standards Codification (“Paragraph 820-10-35-37”) to measure the fair value of its financial instruments. Paragraph 820-10-35-37 establishes a framework for measuring fair value under U.S. GAAP, and expands disclosures about fair value measurements. To increase consistency and comparability in fair value measurements and related disclosures, Paragraph 820-10-35-37 establishes a fair value hierarchy, which prioritizes the inputs to valuation techniques used to measure fair value into three (3) broad levels. The fair value hierarchy gives the highest priority to quoted prices (unadjusted) in active markets for identical assets or liabilities and the lowest priority to unobservable inputs. The three (3) levels of fair value hierarchy defined by Paragraph 820-10-35-37 are described below:
| Level | 1 Quoted market prices available in active markets for identical assets or liabilities as of the reporting date. |
| Level | 2 Pricing inputs other than quoted prices in active markets included in Level 1, which are either directly or indirectly observable as of the reporting date. |
| Level | 3 Pricing inputs that are generally observable inputs and not corroborated by market data. |
The carrying amounts of the Company’s financial assets and liabilities, such as cash and accrued expenses, approximate their fair values because of the short maturity of these instruments. The Company does not have any assets or liabilities measured at fair value on a recurring or a non-recurring basis, consequently, the Company did not have any fair value adjustments for assets and liabilities measured at fair value as of September 30, 2014 or December 31, 2013, nor gains or losses are reported in the statements of income and comprehensive income that are attributable to the change in unrealized gains or losses relating to those assets and liabilities still held at the reporting date for the nine months ended September 30, 2014 or 2013.
| 2.33 | NEW ACCOUNTING PRONOUNCEMENTS |
The Company does not expect any recent accounting pronouncements to have a material effect on the Company’s financial position, results of operations, or cash flows.
In February 2013, the FASB issued guidance on disclosure requirements for items reclassified out of Accumulated Other Comprehensive Income (“AOCI”). This new guidance requires entities to present (either on the face of the income statements or in the notes) the effects on the line items of the income statement for amounts reclassified out of AOCI. The new guidance will be effective for us beginning July 1, 2013. Other than requiring additional disclosures, we do not anticipate a material impact on the consolidated financial statements upon adoption.
In March 2013, the FASB issued guidance on a parent’s accounting for the cumulative translation adjustment upon derecognition of a subsidiary or group of assets within a foreign entity. This new guidance requires that the parent releases any related cumulative translation adjustment into net income only if the sale or transfer results in the complete or substantially complete liquidation of the foreign entity in which the subsidiary or group of assets had resided. The new guidance will be effective for us beginning July 1, 2014. there is no material impact on the consolidated financial statements upon adoption.
In July 2013, the FASB issued ASU 2013-11, "Presentation of an Unrecognized Tax Benefit When a Net Operating Loss Carry forward, a Similar Tax Loss, or a Tax Credit Carry forward Exists". These amendments provide that an unrecognized tax benefit, or a portion thereof, should be presented in the financial statements as a reduction to a deferred tax asset for a net operating loss carry forward, a similar tax loss, or a tax credit carry forward, except to the extent that a net operating loss carry forward, a similar tax loss, or a tax credit carry forward is not available at the reporting date to settle any additional income taxes that would result from disallowance of a tax position, or the tax law does not require the entity to use, and the entity does not intend to use, the deferred tax asset for such purpose, then the unrecognized tax benefit should be presented as a liability. For public entities, the amendments are effective for fiscal years, and interim periods within those years, beginning after December 15, 2013. The adoption of ASU 2013-11 is not expected to have a material impact on the Company's consolidated financial statements.
| F - 16 |
SINO AGRO FOOD, INC.
NOTES TO CONSOLIDATED FINANCIAL STATEMENTS
| 2. | SUMMARY OF SIGNIFICANT ACCOUNTING POLICIES (CONTINUED) |
| 2.33 | NEW ACCOUNTING PRONOUNCEMENTS (CONTINUED) |
8
In April 2014, the FASB issued ASU 2014-08, “Reporting Discontinued Operations and Disclosures of Disposals of Components of an Entity,” which provides a narrower definition of discontinued operations than under existing U.S. GAAP. ASU 2014-08 requires that only a disposal of a component of an entity, or a group of components of an entity, that represents a strategic shift that has, or will have, a major effect on the reporting entity’s operations and financial results should be reported in the consolidated financial statements as discontinued operations. ASU 2014-08 also provides guidance on the consolidated financial statement presentations and disclosures of discontinued operations. The new guidance is effective prospectively for the Company to all new disposals of components and new classification as held for sale beginning April 1, 2015. The Company is evaluating the effects, if any, of the adoption of this guidance will have on the consolidated financial position, results of operations or cash flows.
In May 2014, the Financial Accounting Standards Board issued guidance related to revenue from contracts with customers. Under this guidance, revenue is recognized when promised goods or services are transferred to customers in an amount that reflects the consideration that is expected to be received for those goods or services. The updated standard will replace most existing revenue recognition guidance under GAAP when it becomes effective and permits the use of either the retrospective or cumulative effect transition method. Early adoption is not permitted. The updated standard will be effective for us in the first quarter of 2017. We have not yet selected a transition method and we are currently evaluating the effect that the updated standard will have on our consolidated financial statements and related disclosures.
In August 2014, the FASB issued ASU No. 2014-15, "Disclosure of Uncertainties about an Entity's Ability to Continue as a Going Concern." ASU 2014-15 will explicitly require management to assess an entity's ability to continue as a going concern, and to provide related footnote disclosure in certain circumstances. This pronouncement is effective for fiscal years, and interim periods within those years, beginning after December 15, 2016, and early adoption is permitted. Management is currently evaluating the impact of this pronouncement on our consolidated financial statements
Other accounting standards that have been issued or proposed by FASB that do not require adoption until a future date are not expected to have a material impact on the consolidated financial statements upon adoption.
| F - 17 |
SINO AGRO FOOD, INC.
NOTES TO CONSOLIDATED FINANCIAL STATEMENTS
| 3. | SEGMENT INFORMATION |
The Company establishes standards for reporting information about operating segments on a basis consistent with the Company’s internal organization structure as well as business segments and major customers in consolidated financial statements. The Company operates in five principal reportable segments: Fishery Development Division, and HU Plantation Division and Organic Fertilizer and Bread Grass Division, Cattle Development Division and Corporate and others. No geographic information is required as all revenue and assets are located in the P.R.C.
| For the three months ended September 30, 2014 | ||||||||||||||||||||||||
| Fishery Development Division (1) | HU Plantation Division (2) | Organic Fertilizer and Bread Grass Division (3) | Cattle Farm Development Division (4) | Corporate and others (5) | Total | |||||||||||||||||||
| Revenue | $ | 47,780,135 | $ | 5,813,667 | $ | 33,700,137 | $ | 6,814,990 | $ | 13,111,130 | $ | 107,220,059 | ||||||||||||
| Net income (loss) | $ | 13,754,241 | $ | 2,567,126 | $ | 6,994,954 | $ | 641,963 | $ | 543,578 | $ | 24,501,862 | ||||||||||||
| Total assets | $ | 131,700,632 | $ | 55,471,908 | $ | 218,710,852 | $ | 39,995,639 | $ | 35,116,673 | $ | 480,995,704 | ||||||||||||
| For the three months ended September 30, 2013 | ||||||||||||||||||||||||
| Fishery Development Division (1) | HU Plantation Division (2) | Organic Fertilizer and Bread Grass Division (3) | Cattle Farm Development Division (4) | Corporate and others (5) | Total | |||||||||||||||||||
| Revenue | $ | 26,704,244 | $ | 10,534,960 | $ | 20,434,953 | $ | 4,639,397 | $ | 8,394,143 | $ | 70,707,697 | ||||||||||||
| Net income (loss) | $ | 9,762,014 | $ | 5,322,211 | $ | 1,443,930 | $ | 575,134 | $ | 1,649,485 | $ | 18,752,774 | ||||||||||||
| Total assets | $ | 79,561,093 | $ | 44,908,550 | $ | 131,498,783 | $ | 44,808,248 | $ | 27,027,247 | $ | 327,803,921 | ||||||||||||
| F - 18 |
SINO AGRO FOOD, INC.
NOTES TO CONSOLIDATED FINANCIAL STATEMENTS
| 3. | SEGMENT INFORMATION (CONTINUED) |
| For the nine months ended September 30, 2014 | ||||||||||||||||||||||||
| Fishery Development Division (1) | HU Plantation Division (2) | Organic Fertilizer and Bread Grass Division (3) | Cattle Farm Development Division (4) | Corporate and others (5) | Total | |||||||||||||||||||
| Revenue | 136,968,336 | $ | 9,085,607 | 95,459,852 | 21,483,496 | 32,183,061 | 295,180,352 | |||||||||||||||||
| Net income (loss) | $ | 32,002,640 | $ | 3,752,283 | 25,914,779 | $ | 1,966,526 | 4,740,591 | $ | 68,376,819 | ||||||||||||||
| Total assets | $ | 131,700,632 | $ | 55,471,908 | $ | 218,710,852 | $ | 39,995,639 | $ | 35,116,673 | $ | 480,995,704 | ||||||||||||
| For the nine months ended September 30, 2013 | ||||||||||||||||||||||||
| Fishery Development Division (1) | HU Plantation Division (2) | Organic Fertilizer and Bread Grass Division (3) | Cattle Farm Development Division (4) | Corporate and others (5) | Total | |||||||||||||||||||
| Revenue | $ | 68,826,877 | $ | 14,089,946 | $ | 52,259,230 | $ | 19,423,115 | $ | 25,616,609 | $ | 180,215,777 | ||||||||||||
| Net income (loss) | $ | 20,815,367 | $ | 7,533,778 | $ | 10,786,509 | $ | 3,945,015 | $ | 6,381,817 | $ | 49,462,486 | ||||||||||||
| Total assets | $ | 79,561,093 | $ | 44,908,550 | $ | 131,498,783 | $ | 44,808,248 | $ | 27,027,247 | $ | 327,803,921 | ||||||||||||
Note
| (1) | Operated by Capital Award, Inc. (“CA”). and Jiangmen City A Power Fishery Development Co., Limited (“JFD”). | |
| (2) | Operated by Jiangmen City Heng Sheng Tai Agriculture Development Co., Limited (“JHST”). | |
| (3) | Operated by Qinghai Sanjiang A Power Agriculture Co., Limited (“SJAP”), A Power Agro Agriculture Development (Macau) Limited (“APWAM”) , Qinghai Zhong He Meat Products Co., Limited (“QZH”), A Power Agro Agriculture Development (Macau) Limited (“APWAM”) and Hunan Shenghua A Power Agriculture Co., Limited (“HSA”). | |
| (4) | Operated by Jiangmen City Hang Mei Cattle Farm Development Co. Limited (“JHMC”) and Macau Meiji Limited (“MEIJI”). | |
| (5) | Operated by Sino Agro Food, Inc. (“SIAF”) and Sino Agro Food Sweden AB (publ) (“SAFS”). |
| F - 19 |
SINO AGRO FOOD, INC.
NOTES TO CONSOLIDATED FINANCIAL STATEMENTS
| 3. | SEGMENT INFORMATION (CONTINUED) |
Further analysis of revenue:-
| Three months ended September 30, 2014 | ||||||||||||||||||||||||
| Name of entity | Fishery Development Division (1) | HU Plantation Division (2) | Organic Fertilizer and Bread Grass Division (3) | Cattle Farm Development Division (4) | Corporate and others (5) | Total | ||||||||||||||||||
| Sale of goods | ||||||||||||||||||||||||
| Capital Award, Inc. ("CA") | $ | 22,731,491 | $ | - | $ | - | $ | - | $ | - | $ | 22,731,491 | ||||||||||||
| Jiang Men City Heng Sheng Tai Agriculture Development Co., Limited ("JHST") | - | 5,813,667 | - | - | - | $ | 5,813,667 | |||||||||||||||||
| Hunan Shenghua A Power Agriculture Co., Limited ("HSA") | - | - | 5,794,162 | - | - | $ | 5,794,162 | |||||||||||||||||
| Qinghai Zhong He Meat Products Co Limited ("QZH") | - | - | 5,669,050 | - | - | 5,669,050 | ||||||||||||||||||
| Qinghai Sanjiang A Power Agriculture Co., Limited ("SJAP") | - | - | 22,236,925 | - | - | $ | 22,236,925 | |||||||||||||||||
| Macau Eiji Company Limited ("MEIJI") | - | - | - | 6,814,990 | - | $ | 6,814,990 | |||||||||||||||||
| Sino Agro Food, Inc. ("SIAF") | - | - | - | - | 13,111,130 | $ | 13,111,130 | |||||||||||||||||
| Consulting and service income for development contracts | ||||||||||||||||||||||||
| Capital Award, Inc. ("CA") | 24,598,641 | - | - | - | - | $ | 24,598,641 | |||||||||||||||||
| Macau Eiji Company Limited ("MEIJI") | - | - | - | - | - | - | ||||||||||||||||||
| Sino Agro Food, Inc. ("SIAF") | - | - | - | - | - | - | ||||||||||||||||||
| Commission and management fee | ||||||||||||||||||||||||
| Capital Award, Inc. ("CA") | 450,003 | - | - | - | - | 450,003 | ||||||||||||||||||
| Sino Agro Food, Inc. ("SIAF") | - | - | - | - | - | - | ||||||||||||||||||
| $ | 47,780,135 | $ | 5,813,667 | $ | 33,700,137 | $ | 6,814,990 | $ | 13,111,130 | $ | 107,220,059 | |||||||||||||
| F - 20 |
SINO AGRO FOOD, INC.
NOTES TO CONSOLIDATED FINANCIAL STATEMENTS
| 3. | SEGMENT INFORMATION (CONTINUED) |
Further analysis of revenue:-
| Three months ended September 30, 2013 | ||||||||||||||||||||||||
| Name of entity | Fishery Development Division (1) | HU Plantation Division (2) | Organic Fertilizer and Bread Grass Division (3) | Cattle Farm Development Division (4) | Corporate and others (5) | Total | ||||||||||||||||||
| Sale of goods | ||||||||||||||||||||||||
| Capital Award, Inc. ("CA") | $ | 19,598,282 | $ | - | $ | - | $ | - | $ | - | $ | 19,598,282 | ||||||||||||
| Jiang Men City Heng Sheng Tai Agriculture Development Co., Limited ("JHST") | - | 10,534,960 | - | - | - | 10,534,960 | ||||||||||||||||||
| Hunan Shenghua A Power Agriculture Co., Limited ("HSA") | - | - | 3,104,578 | - | - | 3,104,578 | ||||||||||||||||||
| Qinghai Zhong He Meat Products Co Limited("QZH") | - | - | - | - | - | - | ||||||||||||||||||
| Qinghai Sanjiang A Power Agriculture Co., Limited ("SJAP") | - | - | 17,330,375 | - | - | 17,330,375 | ||||||||||||||||||
| Macau Eiji Company Limited ("MEIJI") | - | - | - | 4,639,397 | - | 4,639,397 | ||||||||||||||||||
| Sino Agro Food, Inc. ("SIAF") | - | - | - | - | 6,459,683 | 6,459,683 | ||||||||||||||||||
| Consulting and service income for development contracts | ||||||||||||||||||||||||
| Capital Award, Inc. ("CA") | 6,939,405 | - | - | - | - | 6,939,405 | ||||||||||||||||||
| Macau Eiji Company Limited ("MEIJI") | - | - | - | - | 1,934,460 | 1,934,460 | ||||||||||||||||||
| Sino Agro Food, Inc. ("SIAF") | - | - | - | - | - | - | ||||||||||||||||||
| Commission and management fee | - | |||||||||||||||||||||||
| Capital Award, Inc. ("CA") | 166,557 | - | - | - | - | 166,557 | ||||||||||||||||||
| Sino Agro Food, Inc. ("SIAF") | - | - | - | - | - | - | ||||||||||||||||||
| $ | 26,704,244 | $ | 10,534,960 | $ | 20,434,953 | $ | 4,639,397 | $ | 8,394,143 | $ | 70,707,697 | |||||||||||||
| F - 21 |
SINO AGRO FOOD, INC.
NOTES TO CONSOLIDATED FINANCIAL STATEMENTS
| 3. | SEGMENT INFORMATION (CONTINUED) |
Further analysis of revenue:
| Nine months ended September 30, 2014 | ||||||||||||||||||||||||
| Name of entity | Fishery Development Division (1) | HU Plantation Division (2) | Organic Fertilizer and Bread Grass Division (3) | Cattle Farm Development Division (4) | Corporate and others (5) | Total | ||||||||||||||||||
| Sale of goods | ||||||||||||||||||||||||
| Capital Award, Inc. ("CA") | $ | 86,218,455 | $ | - | $ | - | $ | - | $ | - | $ | 86,218,455 | ||||||||||||
| Jiang Men City Heng Sheng Tai Agriculture Development Co., Limited ("JHST") | - | 9,085,607 | - | - | - | $ | 9,085,607 | |||||||||||||||||
| Hunan Shenghua A Power Agriculture Co., Limited ("HSA") | - | - | 15,750,656 | - | - | $ | 15,750,656 | |||||||||||||||||
| Qinghai Zhong He Meat Products Co Limited("QZH") | - | - | 7,467,877 | - | - | 7,467,877 | ||||||||||||||||||
| Qinghai Sanjiang A Power Agriculture Co., Limited ("SJAP") | - | - | 72,241,319 | - | - | $ | 72,241,319 | |||||||||||||||||
| Macau Eiji Company Limited ("MEIJI") | - | - | - | 21,483,496 | - | $ | 21,483,496 | |||||||||||||||||
| Sino Agro Food, Inc. ("SIAF") | - | - | - | - | 30,553,374 | 30,553,374 | ||||||||||||||||||
| Consulting and service income for development contracts | ||||||||||||||||||||||||
| Capital Award, Inc. ("CA") | 49,558,454 | - | - | - | - | $ | 49,558,454 | |||||||||||||||||
| Macau Eiji Company Limited ("MEIJI") | - | - | - | - | 1,629,687 | 1,629,687.00 | ||||||||||||||||||
| Sino Agro Food, Inc. ("SIAF") | - | - | - | - | - | - | ||||||||||||||||||
| Commission and management fee | - | |||||||||||||||||||||||
| Capital Award, Inc. ("CA") | 1,191,427 | - | - | - | - | 1,191,427 | ||||||||||||||||||
| Sino Agro Food, Inc. ("SIAF") | - | - | - | - | - | - | ||||||||||||||||||
| $ | 136,968,337 | $ | 9,085,607 | $ | 95,459,852 | $ | 21,483,496 | $ | 32,183,061 | $ | 295,180,352 | |||||||||||||
| F - 22 |
SINO AGRO FOOD, INC.
NOTES TO CONSOLIDATED FINANCIAL STATEMENTS
| 3. | SEGMENT INFORMATION (CONTINUED) |
Further analysis of revenue:
| Nine months ended September 30, 2013 | ||||||||||||||||||||||||
| Name of entity | Fishery Development Division (1) | HU Plantation Division (2) | Organic Fertilizer and Bread Grass Division (3) | Cattle Farm Development Division (4) | Corporate and others (5) | Total | ||||||||||||||||||
| Sale of goods | ||||||||||||||||||||||||
| Capital Award, Inc. ("CA") | $ | 44,462,877 | $ | - | $ | - | $ | - | $ | - | $ | 44,462,877 | ||||||||||||
| Jiang Men City Heng Sheng Tai Agriculture Development Co., Limited ("JHST") | - | 14,089,946 | - | - | - | $ | 14,089,946 | |||||||||||||||||
| Hunan Shenghua A Power Agriculture Co., Limited ("HSA") | - | - | 7,827,433 | - | - | $ | 7,827,433 | |||||||||||||||||
| Qinghai Zhong He Meat Products Co Limited ("QZH") | - | - | - | - | - | - | ||||||||||||||||||
| Qinghai Sanjiang A Power Agriculture Co., Limited ("SJAP") | - | - | 44,431,797 | - | - | $ | 44,431,797 | |||||||||||||||||
| Macau Eiji Company Limited ("MEIJI") | - | - | - | 12,309,334 | - | 12,309,334 | ||||||||||||||||||
| Sino Agro Food, Inc. ("SIAF") | - | - | - | - | 17,247,092 | $ | 17,247,092 | |||||||||||||||||
| Consulting and service income for development contracts | ||||||||||||||||||||||||
| Capital Award, Inc. ("CA") | 23,728,927 | - | - | - | - | 23,782,927 | ||||||||||||||||||
| Macau Eiji Company Limited ("MEIJI") | - | - | - | 7,113,781 | - | $ | 7,113,781 | |||||||||||||||||
| Sino Agro Food, Inc. ("SIAF") | - | - | - | - | 8,173,969 | 8,173,969 | ||||||||||||||||||
| Commission and management fee | ||||||||||||||||||||||||
| Capital Award, Inc. ("CA") | 581,073 | - | - | - | - | 581,073 | ||||||||||||||||||
| Sino Agro Food, Inc. ("SIAF") | - | - | - | - | 195,548 | 195,548 | ||||||||||||||||||
| $ | 68,826,877 | $ | 14,089,946 | $ | 52,259,230 | $ | 19,423,115 | $ | 25,616,609 | $ | 180,215,777 | |||||||||||||
| F - 23 |
SINO AGRO FOOD, INC.
NOTES TO CONSOLIDATED FINANCIAL STATEMENTS
| 3. | SEGMENT INFORMATION (CONTINUED) |
Further analysis of cost of goods sold and cost of services (Continued):-
| Three months ended September 30, 2014 | ||||||||||||||||||||||||
| COST OF GOODS SOLD Name of entity | Fishery Development Division (1) | HU Plantation Division (2) | Organic Fertilizer and Bread Grass Division (3) | Cattle Farm Development Division (4) | Corporate and others (5) | Total | ||||||||||||||||||
| Sale of goods | ||||||||||||||||||||||||
| Capital Award, Inc. ("CA") | $ | 15,935,868 | $ | - | $ | - | $ | - | $ | - | $ | 15,935,868 | ||||||||||||
| Jiang Men City Heng Sheng Tai Agriculture Development Co., Limited ("JHST") | - | 1,704,741 | - | - | - | 1,704,741 | ||||||||||||||||||
| Hunan Shenghua A Power Agriculture Co., Limited ("HSA") | - | - | 4,698,541 | - | - | 4,698,541 | ||||||||||||||||||
| Qinghai Zhong He Meat Products Co Limited("QZH") | - | - | 3,519,966 | - | - | 3,519,966 | ||||||||||||||||||
| Qinghai Sanjiang A Power Agriculture Co., Limited ("SJAP") | - | - | 15,270,656 | - | 15,270,656 | |||||||||||||||||||
| Macau Eiji Company Limited ("MEIJI") | - | - | - | 6,443,072 | - | 6,443,072 | ||||||||||||||||||
| Sino Agro Food, Inc. ("SIAF") | - | - | - | - | 11,548,682 | 11,548,682 | ||||||||||||||||||
| $ | 15,935,868 | $ | 1,704,741 | $ | 23,489,163 | $ | 6,443,072 | $ | 11,548,682 | $ | 59,121,526 | |||||||||||||
| Three months ended September 30, 2014 | ||||||||||||||||||||||||
| COST OF SERVICES Name of entity | Fishery Development Division (1) | HU Plantation Division (2) | Organic Fertilizer and Bread Grass Division (3) | Cattle Farm Development Division (4) | Corporate and others (5) | Total | ||||||||||||||||||
| Consulting and service income for development contracts | ||||||||||||||||||||||||
| Capital Award, Inc. ("CA") | $ | 13,601,869 | $ | - | $ | - | $ | - | $ | - | $ | 13,601,869 | ||||||||||||
| Macau Eiji Company Limited ("MEIJI") | - | - | - | - | - | - | ||||||||||||||||||
| Sino Agro Food, Inc. ("SIAF") | - | - | - | - | - | - | ||||||||||||||||||
| $ | 13,601,869 | $ | - | $ | - | $ | - | $ | - | $ | 13,601,869 | |||||||||||||
| F - 24 |
SINO AGRO FOOD, INC.
NOTES TO CONSOLIDATED FINANCIAL STATEMENTS
| 3. | SEGMENT INFORMATION (CONTINUED) |
Further analysis of cost of goods sold and cost of services (Continued):-
| Three months ended September 30, 2013 | ||||||||||||||||||||||||
| COST OF GOODS SOLD Name of entity | Fishery Development Division (1) | HU Plantation Division (2) | Organic Fertilizer and Bread Grass Division (3) | Cattle Farm Development Division (4) | Corporate and others (5) | Total | ||||||||||||||||||
| Sale of goods | ||||||||||||||||||||||||
| Capital Award, Inc. ("CA") | $ | 14,208,181 | $ | - | $ | - | $ | - | $ | - | $ | 14,208,181 | ||||||||||||
| Jiang Men City Heng Sheng Tai Agriculture Development Co., Limited ("JHST") | - | 4,832,794 | - | - | - | 4,832,794 | ||||||||||||||||||
| Hunan Shenghua A Power Agriculture Co., Limited ("HSA") | - | - | 1,937,860 | - | - | 1,937,860 | ||||||||||||||||||
| Qinghai Zhong He Meat Products Co Limited ("QZH") | - | - | - | - | - | - | ||||||||||||||||||
| Qinghai Sanjiang A Power Agriculture Co., Limited ("SJAP") | - | - | 10,897,327 | - | - | 10,897,327 | ||||||||||||||||||
| Macau Eiji Company Limited ("MEIJI") | - | - | - | 3,974,942 | - | 3,974,942 | ||||||||||||||||||
| Sino Agro Food, Inc. ("SIAF") | - | - | - | - | 5,464,433 | 5,464,433 | ||||||||||||||||||
| $ | 14,208,181 | $ | 4,832,794 | $ | 12,835,187 | $ | 3,974,942 | $ | 5,464,433 | $ | 41,315,537 | |||||||||||||
| Three months ended September 30, 2013 | ||||||||||||||||||||||||
| COST OF SERVICES Name of entity | Fishery Development Division (1) | HU Plantation Division (2) | Organic Fertilizer and Bread Grass Division (3) | Cattle Farm Development Division (4) | Corporate and others (5) | Total | ||||||||||||||||||
| Consulting and service income for development contracts | ||||||||||||||||||||||||
| Capital Award, Inc. ("CA") | $ | 2,703,461 | $ | - | $ | - | $ | - | $ | - | $ | 2,703,461 | ||||||||||||
| Macau Eiji Company Limited ("MEIJI") | - | - | - | - | - | - | ||||||||||||||||||
| Sino Agro Food, Inc. ("SIAF") | - | - | - | - | 565,574 | 565,574 | ||||||||||||||||||
| $ | 2,703,461 | $ | - | $ | - | $ | 0 | $ | 565,574 | $ | 3,269,035 | |||||||||||||
| F - 25 |
SINO AGRO FOOD, INC.
NOTES TO CONSOLIDATED FINANCIAL STATEMENTS
| 3. | SEGMENT INFORMATION (CONTINUED) |
Further analysis of cost of goods sold and cost of services (Continued):-
| Nine months ended September 30, 2014 | ||||||||||||||||||||||||
| COST OF GOODS SOLD Name of entity | Fishery Development Division (1) | HU Plantation Division (2) | Organic Fertilizer and Bread Grass Division (3) | Cattle Farm Development Division (4) | Corporate and others (5) | Total | ||||||||||||||||||
| Sale of goods | ||||||||||||||||||||||||
| Capital Award, Inc. ("CA") | $ | 54,861,550 | $ | - | $ | - | $ | - | $ | - | $ | 54,861,550 | ||||||||||||
| Jiang Men City Heng Sheng Tai Agriculture Development Co., Limited ("JHST") | - | 2,423,811 | - | - | - | 2,423,811 | ||||||||||||||||||
| Hunan Shenghua A Power Agriculture Co., Limited ("HSA") | - | - | 10,371,555 | - | 10,371,555 | |||||||||||||||||||
| Qinghai Zhong He Meat Products Co Limited ("QZH") | - | - | 4,680,245 | - | - | 4,680,245 | ||||||||||||||||||
| Qinghai Sanjiang A Power | ||||||||||||||||||||||||
| Agriculture Co., Limited ("SJAP") | - | - | 48,552,223 | - | 48,552,223 | |||||||||||||||||||
| Macau Eiji Company Limited ("MEIJI") | - | - | - | 20,418,345 | - | 20,418,345 | ||||||||||||||||||
| Sino Agro Food, Inc. ("SIAF") | - | - | - | - | 31,728,186 | 31,728,186 | ||||||||||||||||||
| $ | 54,861,550 | $ | 2,423,811 | $ | 63,604,023 | $ | 20,418,345 | $ | 31,728,186 | $ | 173,035,915 | |||||||||||||
| Nine months ended September 30, 2014 | ||||||||||||||||||||||||
| COST OF SERVICES Name of entity | Fishery Development Division (1) | HU Plantation Division (2) | Organic Fertilizer and Bread Grass Division (3) | Cattle Farm Development Division (4) | Corporate and others (5) | Total | ||||||||||||||||||
| Consulting and service income for development contracts | ||||||||||||||||||||||||
| Capital Award, Inc. ("CA") | $ | 25,236,498 | $ | - | $ | - | $ | - | $ | - | $ | 25,236,498 | ||||||||||||
| Macau Eiji Company Limited ("MEIJI") | - | - | - | - | - | - | ||||||||||||||||||
| Sino Agro Food, Inc. ("SIAF") | - | - | - | - | 1,554,244 | 1,554,244 | ||||||||||||||||||
| $ | 25,236,498 | $ | - | $ | - | $ | - | $ | 1,554,244 | $ | 26,790,742 | |||||||||||||
| F - 26 |
SINO AGRO FOOD, INC.
NOTES TO CONSOLIDATED FINANCIAL STATEMENTS
| 3. | SEGMENT INFORMATION (CONTINUED) |
Further analysis of cost of goods sold and cost of services (Continued):-
| Nine months ended September 30, 2013 | ||||||||||||||||||||||||
| COST OF GOODS SOLD Name of entity | Fishery Development Division (1) | HU Plantation Division (2) | Organic Fertilizer and Bread Grass Division (3) | Cattle Farm Development Division (4) | Corporate and others (5) | Total | ||||||||||||||||||
| Sale of goods | ||||||||||||||||||||||||
| Capital Award, Inc. ("CA") | $ | 33,460,670 | $ | - | $ | - | $ | - | $ | - | $ | 33,460,670 | ||||||||||||
| Jiang Men City Heng Sheng Tai Agriculture Development Co., Limited ("JHST") | - | 6,093,751 | - | - | - | 6,093,751 | ||||||||||||||||||
| Hunan Shenghua A Power Agriculture Co., Limited ("HSA") | - | - | 4,830,266 | - | - | 4,830,266 | ||||||||||||||||||
| Qinghai Zhong He Meat Products Co Limited("QZH") | - | - | - | - | - | - | ||||||||||||||||||
| Qinghai Sanjiang A Power | ||||||||||||||||||||||||
| Agriculture Co., Limited ("SJAP") | - | - | 26,770,503 | - | - | 26,770,503 | ||||||||||||||||||
| Macau Eiji Company Limited ("MEIJI") | - | - | - | 7,369,379 | - | 7,369,379 | ||||||||||||||||||
| Sino Agro Food, Inc. ("SIAF") | - | - | - | - | 14,894,249 | 14,894,249 | ||||||||||||||||||
| $ | 33,460,670 | $ | 6,093,751 | $ | 31,600,769 | $ | 7,369,379 | $ | 14,894,249 | $ | 93,418,818 | |||||||||||||
| Nine months ended September 30, 2013 | ||||||||||||||||||||||||
| COST OF SERVICES Name of entity | Fishery Development Division (1) | HU Plantation Division (2) | Organic Fertilizer and Bread Grass Division (3) | Cattle Farm Development Division (4) | Corporate and others (5) | Total | ||||||||||||||||||
| Consulting and service income for development contracts | ||||||||||||||||||||||||
| Capital Award, Inc. ("CA") | $ | 11,805,864 | $ | - | $ | - | $ | - | $ | - | $ | 11,805,864 | ||||||||||||
| Macau Eiji Company Limited ("MEIJI") | - | - | - | 5,519,294 | - | 5,519,294 | ||||||||||||||||||
| Sino Agro Food, Inc. ("SIAF") | - | - | - | - | 2,435,412 | 2,435,412 | ||||||||||||||||||
| $ | 11,805,864 | $ | - | $ | - | $ | 5,519,294 | $ | 2,435,412 | $ | 19,760,570 | |||||||||||||
| F - 27 |
SINO AGRO FOOD, INC.
NOTES TO CONSOLIDATED FINANCIAL STATEMENTS
| 4. | INCOME TAXES |
United States of America
The Company was incorporated in the State of Nevada, in the United States of America. The Company has no trading operations in United States of America and no US corporate tax has been provided for in the consolidated financial statements of the Company.
Undistributed Earnings of Foreign Subsidiaries
The Company intends to use the remaining accumulated and future earnings of foreign subsidiaries to expand operations outside the United States and accordingly, undistributed earnings of foreign subsidiaries are considered to be indefinitely reinvested outside the United States and no provision for U.S. Federal and State income tax or applicable dividend distribution tax has been provided thereon.
The Company has appointed US tax professional to assist in filing income tax return for the years ended December 31, 2007 through December 31, 2012 in compliance with US Treasury Internal Revenue Service Code and we filed our Tax returns with the ISR USA Government on June 2014.
At the same time, The Company has reviewed its tax position with the assistance US tax professional and believes that there will be no taxes and no penalties assessed by the Internal Revenue Service in the United States of America.
China
Beginning January 1, 2008, the new Enterprise Income Tax (“EIT”) law replaced the existing laws for Domestic Enterprises (“DE’s”) and Foreign Invested Enterprises (“FIE’s”). The new standard EIT rate of 25% replaced the 33% rate currently applicable to both DE’s and FIE’s. The Company is currently evaluating the impact that the new EIT will have on its financial condition. Beginning January 1, 2008, China unified the corporate income tax rule on foreign invested enterprises and domestic enterprises. The unified corporate income tax rate is 25%.
Under new tax legislation in China beginning in January 2008, the agriculture, dairy and fishery sectors are exempt from enterprise income taxes.
No EIT has been provided in the financial statements since SIAF, CA, JHST, JHMC, JFD, HSA, QZH and SJAP are exempt from EIT for the three months ended September 30, 2014 and 2013 and for the nine months ended September 30, 2014 and 2013 as they are within the agriculture, dairy and fishery sectors.
Belize
CA, CS and CH are international business companies incorporated in Belize, and are exempt from corporate tax in Belize.
Hong Kong
No Hong Kong profits tax has been provided in the consolidated financial statements, since TRW did not earn any assessable profits arising in Hong Kong for the three months ended September 30, 2014 and 2013 and for the nine months ended September 30, 2014 and 2013.
Macau
No Macau Corporate income tax has been provided in the consolidated financial statements since APWAM and MEIJI did not earn any assessable profits for the three months ended September 30, 2014 and 2013 and for the nine months ended September 30, 2014 and 2013.
Sweden
No Sweden Corporate income tax has been provided in the consolidated financial statements since SAFS incurred a tax loss for the three months ended September 30, 2014 and for the nine months ended September 30, 2014 and 2013.
No deferred tax assets and liabilities are of September 30, 2014 and December 31, 2013 since there was no difference between the financial statements carrying amounts and the tax bases of assets and liabilities using enacted tax rates in effect in the period in which the differences are expected to reverse.
| F - 28 |
SINO AGRO FOOD, INC.
NOTES TO CONSOLIDATED FINANCIAL STATEMENTS
| 4. | INCOME TAXES (CONTINUED) |
Provision for income taxes is as follows:
| Three months ended | Three months ended | Nine months ended | Nine months ended | |||||||||||||
| September 30, 2014 | September 30, 2013 | September 30, 2014 | September 30, 2013 | |||||||||||||
| SIAF | $ | - | $ | - | $ | - | $ | - | ||||||||
| SAFS | - | - | - | - | ||||||||||||
| TRW | - | - | - | - | ||||||||||||
| MEIJI and APWAM | - | - | - | - | ||||||||||||
| JHST, JFD, JHMC, SJAP, QZH and HSA | - | - | - | - | ||||||||||||
| $ | - | $ | - | $ | - | $ | - | |||||||||
The Company did not recognize any interest or penalties related to unrecognized tax benefits for the three months and the nine months ended September 30, 2014 and 2013. The Company had no uncertain positions that would necessitate recording of tax related liability. The Company is subject to examination by the respective tax authorities.
| 5. | CASH AND CASH EQUIVALENTS |
| September 30, 2014 | December 31, 2013 | |||||||
| Cash and bank balances | $ | 4,691,157 | $ | 1,327,274 | ||||
| 6. | INVENTORIES |
As of September 30, 2014, inventories are as follows:
| September 30, 2014 | December 31, 2013 | |||||||
| Sleepy cods, prawns, eels and marble goble | $ | 4,935,062 | $ | 1,761,111 | ||||
| Bread grass | 3,337,428 | 580,955 | ||||||
| Beef cattle | 5,850,305 | 1,951,962 | ||||||
| Organic fertilizer | 3,094,379 | 895,670 | ||||||
| Forage for cattle and consumable | 3,591,769 | 684,979 | ||||||
| Raw materials for bread grass and organic fertilizer | 13,411,046 | 855,493 | ||||||
| Beef and mutton | 2,213,890 | - | ||||||
| Immature seeds | 1,006,013 | 698,704 | ||||||
| Harvested HU plantation | - | 719,329 | ||||||
| $ | 37,439,892 | $ | 8,148,203 | |||||
| F - 29 |
SINO AGRO FOOD, INC.
NOTES TO CONSOLIDATED FINANCIAL STATEMENTS
| 7. | DEPOSITS AND PREPAID EXPENSES |
| September 30, 2014 | December 31, 2013 | |||||||
| Deposits for | ||||||||
| - purchases of equipment | $ | 4,372,776 | $ | 4,886,048 | ||||
| - acquisition of land use rights | 7,826,508 | 7,826,508 | ||||||
| - inventories purchases and miscellaneous | 7,693,099 | 9,771,383 | ||||||
| - aquaculture contract | 9,404,067 | - | ||||||
| - building materials | 877,598 | 1,281,935 | ||||||
| - proprietary technologies | - | 4,404,210 | ||||||
| - construction in progress | 23,021,316 | 23,021,316 | ||||||
| Shares issued for employee compensation and overseas professional fee | 2,415,099 | 100,308 | ||||||
| $ | 55,610,463 | $ | 51,291,708 | |||||
# Miscellaneous represents rental and utility deposits, and deposits for sundries purchases and sundries prepaid expenses.
| 8. | ACCOUNTS RECEIVABLE |
The Company has performed an analysis on all of its accounts receivable and determined that all amounts are collectible by the Company. As such, all accounts receivable are reflected as a current asset and no allowance for bad debt has been recorded as of September 30, 2014 and December 31, 2013. Bad debts written off for the three months ended and the nine months ended September 30, 2014 and 2013 are $0.
Aging analysis of accounts receivable is as follows:
| September 30, 2014 | December 31, 2013 | |||||||
| 0 - 30 days | $ | 64,914,582 | $ | 20,864,404 | ||||
| 31 - 90 days | 30,367,458 | 28,960,582 | ||||||
| 91 - 120 days | 16,046,506 | 23,941,294 | ||||||
| over 120 days and less than 1 year | 11,445,335 | 8,291,662 | ||||||
| over 1 year | - | - | ||||||
| $ | 122,773,881 | $ | 82,057,942 | |||||
| 9. | OTHER RECEIVABLES |
| September 30, 2014 | December 31, 2013 | |||||||
| Advanced to employees | $ | 277,298 | $ | 109,278 | ||||
| Advanced to suppliers | 7,552,844 | 3,673,494 | ||||||
| Advanced to subcontractors and suppliers of new prawn project in Zhongshan | 8,645,366 | - | ||||||
| $ | 16,475,508 | $ | 3,782,772 | |||||
Advanced to employees and suppliers are unsecured, interest free and repayable within two years.
| F - 30 |
SINO AGRO FOOD, INC.
NOTES TO CONSOLIDATED FINANCIAL STATEMENTS
| 10. | PLANT AND EQUIPMENT |
| September 30, 2014 | December 31, 2013 | |||||||
| Plant and machinery | $ | 5,344,326 | $ | 5,263,933 | ||||
| Structure and leasehold improvements | 49,841,748 | 36,308,860 | ||||||
| Mature seeds and herbage cultivation | 9,234,439 | 6,294,372 | ||||||
| Furniture and equipment | 393,411 | 391,608 | ||||||
| Motor vehicles | 765,858 | 765,858 | ||||||
| 65,579,782 | 49,024,631 | |||||||
| Less: Accumulated depreciation | (4,305,620 | ) | (2,537,573 | ) | ||||
| Net carrying amount | $ | 61,274,162 | $ | 46,487,058 | ||||
Depreciation expense was $636,774 and $356,737 for the three months ended September 30, 2014 and 2013, respectively. Depreciation expense was $1,768,047 and $995,408 for the nine months ended September 30, 2014 and 2013, respectively.
| 11. | CONSTRUCTION IN PROGRESS |
| September 30, 2014 | December 31, 2013 | |||||||
| Construction in progress | ||||||||
| - Office, warehouse and organic fertilizer plant in HSA | $ | 16,867,188 | $ | 22,761,164 | ||||
| - Organic fertilizer and bread grass production plant | ||||||||
| and office building | 18,009,803 | 8,600,187 | ||||||
| - Oven room, road for production of dried flowers | 276,288 | - | ||||||
| - Rangeland for beef cattle and office building | 30,690,295 | 26,054,582 | ||||||
| - Fish pond | 1,844,454 | 1,718,799 | ||||||
| - Beef and seafood distribution center | 1,400,609 | - | ||||||
| $ | 69,088,637 | $ | 59,134,732 | |||||
| 12. | LAND USE RIGHTS |
Private ownership of agricultural land is not permitted in the PRC. Instead, the Company has leased six lots of land. The cost of the first lot of land use rights acquired in 2007 in Guangdong Province was $6,408,289 and consists of 180.23 acres with the lease expiring in 2067. The cost of the second lot of land use rights acquired in 2008 in Guangdong Province was $764,128, which consists of 31.84 acres with the lease expiring in 2068. The cost of the third lot of land use rights acquired in 2011 was $12,040,571, which consists of 93.64 acres in Guangdong Province, with the lease expiring in 2037. The cost of the fourth lot of land use rights acquired in 2011 was $35,405,750 which consisted of 287.21 acres in the Hunan Province, PRC and the leases expire in 2051, 2054 and 2071. The cost of the fifth lot of land use rights acquired in 2012 was $528,240 which consisted of 21.09 acres in Qinghai Province, PRC and the lease expires in 2051. The cost of the sixth lot of land use rights acquired in 2013 was $489,904 which consisted of 6.27 acres in Guangdong Province, the PRC and the lease expires in 2023.
| F - 31 |
SINO AGRO FOOD, INC.
NOTES TO CONSOLIDATED FINANCIAL STATEMENTS
| 12. | LAND USE RIGHTS (CONTINUED) |
| September 30, 2014 | December 31, 2013 | |||||||
| Cost | $ | 64,637,958 | $ | 65,192,615 | ||||
| Less: Accumulated amortization | (5,642,453 | ) | (4,486,786 | ) | ||||
| Net carrying amount | $ | 58,995,505 | $ | 60,705,829 | ||||
| Expiry date | Location | Amount | ||||||||||
| Balance @1.1.2013 | $ | 58,630,950 | ||||||||||
| Additions: | ||||||||||||
| 2013 | 2023 | Enping city, Guangdong Province, the P.R.C. | 489,904 | |||||||||
| 2013 | Land improvement cost incurred | 3,914,275 | ||||||||||
| Exchange difference | 2,157,486 | |||||||||||
| Balance @12.31.2013 | $ | 65,192,615 | ||||||||||
| Exchange difference | (554,657 | ) | ||||||||||
| Balance @9.30.2014 | $ | 64,637,958 | ||||||||||
Land use rights are amortized on the straight-line basis over their respective lease periods. The lease period of agriculture land is 10 to 60 years. Amortization of land use rights was $395,633 and $405,361 for the three months ended September 30, 2014 and 2013, respectively. Amortization of land use rights was $1,155,667 and $1,173,698 for the nine months ended September 30, 2014 and 2013, respectively.
| 13. | GOODWILL |
Goodwill represents the fair value of the assets acquired the acquisitions over the cost of the assets acquired. It is stated at cost less accumulated impairment losses.Management tests goodwill for impairment on an annual basis or when impairment indicators arise. In these instances, the Company recognizes an impairment loss when it is probable that the estimated cash flows are less than the carrying value of the assets. To date, no such impairment loss has been recorded.
| September 30, 2014 | December 31, 2013 | |||||||
| Goodwill from acquisition | $ | 724,940 | $ | 724,940 | ||||
| Less: Accumulated impairment losses | - | - | ||||||
| Net carrying amount | $ | 724,940 | $ | 724,940 | ||||
| F - 32 |
SINO AGRO FOOD, INC.
NOTES TO CONSOLIDATED FINANCIAL STATEMENTS
| 14. | PROPRIETARY TECHNOLOGIES |
By an agreement dated November 12, 2008, TRW acquired an enzyme technology master license, registered under a Chinese patent, for the manufacturing of livestock feed and bioorganic fertilizer and its related labels for $8,000,000. On March 6, 2012, MEIJI acquired an aromatic-feed formula technology for the production of aromatic cattle for $1,500,000. On October 1, 2013, SIAF was granted a license to exploit sleepy cod breeding technology license for to grow out sleepy cod for $2,270,968 for 50 years. SJAP booked bacterial cellulose technology license and related trademark for $2,119,075 and amortized expenditures for 25 years starting from January 1, 2014.
| September 30, 2014 | December 31, 2013 | |||||||
| Cost | $ | 13,865,862 | $ | 13,896,168 | ||||
| Less: Accumulated amortization | (2,278,298 | ) | (1,814,698 | ) | ||||
| Net carrying amount | $ | 11,587,564 | $ | 12,081,470 | ||||
Amortization of proprietary technologies was $166,775 and $87,802 for the three months ended September 30, 2014 and 2013, respectively. Amortization of proprietary technologies was $463,600 and $295,759 for the nine months ended September 30, 2014 and 2013, respectively.No impairment of proprietary technologies has been identified for the three months ended and for the nine months ended September 30, 2014 and 2013.
| 15. | TEMPORARY DEPOSITS PAID TO ENTITIES FOR EQUITY INVESTMENTS IN FUTURE SINO JOINT VENTURE COMPANIES |
| Intended unincorporated investee | Project engaged | September 30, 2014 | December 31, 2013 | |||||||||||
| A | Trade center | * | $ | 4,086,941 | $ | 4,086,941 | ||||||||
| A | Seafood center | * | 1,032,914 | 1,032,914 | ||||||||||
| B | Fish farm 1 Gao Qiqiang Aquaculture | * | 6,000,000 | 6,000,000 | ||||||||||
| C | Prawn farm 1 | * | 14,554,578 | 14,554,578 | ||||||||||
| D | Prawn farm 2 | * | 9,877,218 | 9,877,218 | ||||||||||
| E | Cattle farm 2 | * | 5,558,057 | 5,558,057 | ||||||||||
| $ | 41,109,708 | $ | 41,109,708 | |||||||||||
The Company made temporary deposits paid to entities for equity investments in future Sino Joint Venture companies ("SJVCs") engaged in projects development of trade and seafood centers, fish, prawns and cattle farms. Such temporary deposits represented as deposits of the respective consideration required for the purchase of equity stakes of respective future SJVCs. The amounts were classified as temporary because legal procedures of formation of SJVCs have not yet been completed. As of September 30, 2014, the percentages of equity stakes of SFJVCs A (trade and seafood centers), B ( fish farm 2 Gao Qiqiang Aquaculture Farm ), C (prawn farm 1), D (pawn farm 2) and E (cattle farm 2) are 31%, 23%, 56%, 29% and 35% respectively.
*The above amounts were subject to conversion to an additional equity investment in the investees upon the completion of legal procedures of formation of SJVCs.
| 16. | VARIABLE INTEREST ENTITY |
On September 28, 2009, APWAM acquired the PMH’s 45% equity interest in the Sino-Foreign joint venture company, Qinghai Sanjiang A Power Agriculture Co. Limited (“SJAP”), which was incorporated in the P.R.C. Up to September 30, 2014, the Company invested $2,251,359 in this joint venture. SJAP is engaged in its business of the manufacturing of organic fertilizer, livestock feed, and beef cattle and plantation of crops and pastures.
Continuous assessment of the VIE relationship with SJAP
The Company may also have a controlling financial interest in an entity through an arrangement that does not involve voting interests, such as a VIE. The Company evaluates entities deemed to be VIE’s using a risk and reward model to determine whether to consolidate. A VIE is an entity (1) that has total equity at risk that is not sufficient to finance its activities without additional subordinated financial support from other entities, (2) where the group of equity holders does not have the power to direct the activities of the entity that most significantly impact the entity’s economic performance, or the obligation to absorb the entity’s expected losses or the right to receive the entity’s expected residual returns, or both, or (3) where the voting rights of some investors are not proportional to their obligations to absorb the expected losses of the entity, their rights to receive the expected residual returns of the entity, or both, and substantially all of the entity’s activities either involve or are conducted on behalf of an investor that has disproportionately fewer voting rights.
| F - 33 |
SINO AGRO FOOD, INC.
NOTES TO CONSOLIDATED FINANCIAL STATEMENTS
| 16. | VARIABLE INTEREST ENTITY (CONTINUED) |
The Company also quantitatively and qualitatively examined if SJAP is considered a VIE. Qualitative analyses considered the extent to which the nature of its variable interest exposed the Company to losses. For quantitative analyses, the Company also used internal cash flow models to determine if SJAP was a VIE and, if so, whether the Company was the primary beneficiary. The projection of these cash flows and probabilities thereof requires significant managerial judgment because of the inherent limitations that relate to the use of historical data for the projection of future events. On September 30, 2014, the Company evaluated the above VIE testing results and concluded that the Company is the primary beneficiary of SJAP’s expected losses or residual returns and that SJAP qualifies as a VIE of the Company. As result, the Company has consolidated SJAP as a VIE.
The reasons for the changes are as follows:
•Originally, the board of directors of SJAP consisted of 7 members; 3 appointees from Qinghai Sanjiang (one stockholder), 1 from Garwor (one stockholder), and 3 from the Company, such that the Company did not have majority interest represented on the board of directors of SJAP.
•On May 7, 2010, Qinghai Sanjiang sold and transferred its equity interest in SJAP to Garwor. The State Administration for Industry and Commerce of Xining City Government of the P.R.C. approved the sale and transfer.
Consequently Garwor and the Company agreed that the new board of directors of SJAP would consist of 3 members; 1 appointee from Garwor and 2 appointees from the Company, such that the Company now had a majority interest in the board of directors of SJAP. Also, and in accordance with the Company’s Sino Joint Venture Agreement, the Company’s management appointed the chief financial officer of SJAP. As a result, the financial statements of SJAP were included in the consolidated financial statements of the Company. SJAP formed Qinghai Zhong He Meat Products Co., Limited (“QZH”) , with SJAP would owning 100% equity interest. Up to September 30, 2014, the SJAP’s total investment in QZH was $487,805. QZH is engaged in its business of the slaughter of cattle.
Continuous assessment of the VIE relationship with QZH
The Company may also have a controlling financial interest in an entity through an arrangement that does not involve voting interests, such as a VIE. The Company evaluates entities deemed to be VIE’s using a risk and reward model to determine whether to consolidate. A VIE is an entity (1) that has total equity at risk that is not sufficient to finance its activities without additional subordinated financial support from other entities, (2) where the group of equity holders does not have the power to direct the activities of the entity that most significantly impact the entity’s economic performance, or the obligation to absorb the entity’s expected losses or the right to receive the entity’s expected residual returns, or both, or (3) where the voting rights of some investors are not proportional to their obligations to absorb the expected losses of the entity, their rights to receive the expected residual returns of the entity, or both, and substantially all of the entity’s activities either involve or are conducted on behalf of an investor that has disproportionately fewer voting rights.
The Company also quantitatively and qualitatively examined if QZH is considered a VIE. Qualitative analyses considered the extent to which the nature of its variable interest exposed the Company to losses. For quantitative analyses, the Company also used internal cash flow models to determine if QZH was a VIE and, if so, whether the Company was the primary beneficiary. The projection of these cash flows and probabilities thereof requires significant managerial judgment because of the inherent limitations that relate to the use of historical data for the projection of future events. On September 30, 2014, the Company evaluated the above VIE testing results and concluded that the Company is the primary beneficiary of QZH’s expected losses or residual returns and that QZH qualifies as a VIE of the Company. As result, the Company has consolidated QZH as a VIE.
SJAP is sole stockholder of QZH and SJAP appointed sole director of QZH. Consequently, the Company indirectly control directorship of QZH, such that the Company now had a majority interest in the directorship of QZH. Also, and in accordance with the Company’s Sino Joint Venture Agreement, the Company’s management appointed the chief financial officer of QZH. As a result, the financial statements of QZH were included in the consolidated financial statements of the Company.
| 17. | LICENSE RIGHTS |
Pursuant to an agreement dated August 1, 2006 between Infinity Environmental Group Limited (“Infinity”) and the Company, the Company was granted an A Power Technology License with the condition that the Company was required to pay the license fee covering 500 units of APM as performance payment to Infinity on or before July 31, 2008. This license allows the Company to develop service, manage and supply A Power Technology Farms in the P.R.C. using the A Power Technology, but subject to a condition that the Company is required to pay a license fee to Infinity once the Company has sold the license to its customer. Under the said license, the Company has the right to authorize developers and/or joint venture partners to develop A Power Technology Farms in the P.R.C. Infinity is a company incorporated in Australia. An impairment loss made for the three months ended and the nine months ended September 30, 2014 and 2013 are $0 and allowance for accumulated impairment losses has been recorded as of September 30, 2014 and December 31, 2013 are $1.
| F - 34 |
SINO AGRO FOOD, INC.
NOTES TO CONSOLIDATED FINANCIAL STATEMENTS
| 18. | OTHER PAYABLES |
| September 30, 2014 | December 31, 2013 | |||||||
| Due to third parties | $ | 8,258,819 | $ | 4,715,543 | ||||
| Promissory notes issued to third parties | 512,751 | 3,625,000 | ||||||
| Due to local government | 2,406,143 | 2,428,243 | ||||||
| $ | 11,177,713 | $ | 10,768,786 | |||||
Due to third parties are unsecured, interest free and have no fixed terms of repayment.
| 19. | CONSTRUCTION CONTRACT |
| (i) | Costs and estimated earnings in excess of billings on uncompleted contracts |
| September 30, 2014 | December 31, 2013 | |||||||
| Costs | $ | 19,505,718 | $ | 3,527,975 | ||||
| Estimated earnings | 18,642,769 | 8,538,930 | ||||||
| Less: Billings | (36,924,200 | ) | (11,403,609 | ) | ||||
| Costs and estimated earnings in excess of billings on uncompleted contract | $ | 1,224,287 | $ | 663,296 | ||||
| (ii) | Billings in excess of costs and estimated earnings on uncompleted contracts |
| September 30, 2014 | December 31, 2013 | |||||||
| Billings | $ | 33,739,935 | $ | 8,406,900 | ||||
| Less: Costs | (12,992,409 | ) | (2,179,410 | ) | ||||
| Estimated earnings | (17,374,094 | ) | (3,080,534 | ) | ||||
| Billing in excess of costs and estimated earnings on uncompleted contract | $ | 3,373,432 | $ | 3,146,956 | ||||
| (iii) | Overall |
| September 30, 2014 | December 31, 2013 | |||||||
| Billings | $ | 70,664,135 | $ | 19,810,509 | ||||
| Less: Costs | (32,498,127 | ) | (5,707,385 | ) | ||||
| Estimated earnings | (36,016,863 | ) | (11,619,464 | ) | ||||
| Billing in excess of costs and estimated earnings on uncompleted contract | $ | 2,149,145 | $ | 2,483,660 | ||||
| F - 35 |
SINO AGRO FOOD, INC.
NOTES TO CONSOLIDATED FINANCIAL STATEMENTS
| 20. | SERIES F SHARES MANDATORY REDEMPTION PAYABLE |
On August 13, 2014, the Company filed a Certificate of the Designations, Powers, Preferences and Rights of the Series F Non-Convertible Preferred Stock (the “Certificate”) to its Articles of Incorporation, with the Secretary of State of the State of Nevada, setting forth the terms of its Preferred Stock. On June 10, 2014, the Company amended and restated the Certificate to (i) postpone the payment date of the dividend thereunder to May 30, 2015, (ii) to delete a reference to the redemption or declaration of any cash dividend or distribution on any Junior Securities, and (iii) make certain minor corrections to the Certificate. No share of Series F Non-Convertible Preferred Stock was ever issued. The Company believes it to be in the best interests of its shareholders to delay the cash payment until such time as its financial position would enable it to make the payment without harming its ability to develop its business in accordance with management’s plans.
| 21. | BORROWINGS |
There are no provisions in the Company’s bank borrowings and long term debts that would accelerate repayment of debt as a result of a change in credit ratings or a material adverse change in the Company’s business. Under certain agreements, the Company has the option to retire debt prior to maturity, either at par or at a premium over par.
Short term bank loan
| Interest rate | Term | September 30, 2014 | December 31, 2013 | ||||||||||||
| Agricultural Development | 6% | August 30, 2013 - August 29, 2014 | |||||||||||||
| Bank of China | (August 30, 2012 - August 29, 2013) | ||||||||||||||
| Huangyuan County Branch, | |||||||||||||||
| Xining , Qinghai Province, the P.R.C. | $ | - | ^* | $ | 4,100,377^* | ||||||||||
Long term debts
| Name of lender | Interest rate | Term | September 30, 2014 | December 31, 2013 | ||||||||||||
| Gan Guo Village Committee | 12.22% | June 2012 - June 2017 | ||||||||||||||
| Bo Huang Town | ||||||||||||||||
| Huangyuan County, | ||||||||||||||||
| Xining City, | ||||||||||||||||
| Qinghai Province, the P.R.C. | $ | 178,774 | $ | 180,417 | ||||||||||||
| Agricultural Development | 6.40% | January 3, 2014 - December 17, 2018 | ||||||||||||||
| Bank of China | ||||||||||||||||
| Huangyuan County Branch, | ||||||||||||||||
| Xining , Qinghai Province, the P.R.C. | $ | 2,437,836 | ^*# | - | ||||||||||||
| $ | 2,616,610 | $ | 180,417 | |||||||||||||
The above note agreements contained regular provisions requiring timely repayment of principals and accrued interests, payment of default interest in the event of default, and without specific financial covenants. Management of the Company believe the Company is in material compliance with the terms of the loan agreements.
^ personal and corporate guaranteed by third parties.
*secured by land use rights with net carrying amount of $500,712 (12.31.2013: $515,026).
#repayable $325,092, $650,184, $650,184 and $812,376 in 2015, 2016, 2017 and 2018, respectively.
| F - 36 |
SINO AGRO FOOD, INC.
NOTES TO CONSOLIDATED FINANCIAL STATEMENTS
| 22. | BONDS PAYABLE |
On July 1, 2013 , the Company offered a maximum of $21,000,000 of units (“Units”) for an aggregate of 840 Units; each Unit consisting of a $25,000 principal amount promissory note made by the Subscription Agreement and Confidential Private Placement Memorandum with maturity date two years from the Initial Closing Date of the Offering September 30, 2013. The interest rate of 5% is paid annually. Commissions, issue cost and discounts are amortized over 2 years from October 1, 2013.
Terms of the bonds are as follows:
| Issue size: | $ | 16,800,000 | ||
| Number of units offered: | 840 units | |||
| Number of units issued: | 69 units | |||
| Principal value per unit: | $ | 25,000 per unit | ||
| Net payable value /bond: | $ | 20,000 per unit | ||
| Discounted value/bond: | $ | 5,000 paid to bond holder | ||
| Maturity date: | 2 years (September 30, 2015) | |||
| Participating interest: | 5% per annum | |||
| Effective yield: | 11.80% per annum |
| September 30, 2014 | December 31, 2013 | |||||||
| Classified as current liabilities | ||||||||
| 5% Participating zero coupon bonds repayable on September 30, 2015 | $ | 1,725,000 | $ | - | ||||
| Classified as non-current liabilities | ||||||||
| 5 % Participating zero coupon bonds repayable on September 30, 2015 | - | 1,725,000 | ||||||
| $ | 1,725,000 | $ | 1,725,000 | |||||
The Company calculated professional service compensation of $400,000 in respect of bond issue, and recognized $50,000 and $50,000 for the three months ended September 30, 2014 and 2013 and $150,000 and $50,000 for the nine months ended September 30, 2014 and 2013. As of September 30, 2014, the deferred compensation balance was $150,000 and the deferred compensation balance of $150,000 was to be amortized over 9 months beginning on October 1, 2014.
| F - 37 |
SINO AGRO FOOD, INC.
NOTES TO CONSOLIDATED FINANCIAL STATEMENTS
| 23. | CONVERTIBLE NOTE PAYABLE |
On August 29, 2014, the Company completed the closing of a private placement financing transaction with an accredited investor, which purchased a 10.5% Convertible Note (the “Note”) in the aggregate principal amount of up to $33,300,000. The Company received the initial advance of $6,982,667. The Company shall offer investor a discount equal to 25% of the amount of the principal advanced by the investor.
Interest on the note shall accrue on the outstanding principal balance of this Note from August 29, 2014. Interest shall be payable quarterly on the last day of each of March, June, September and December commencing September 30, 2014. provided, however, that note holder may elect to require the Company to issue to the note holder a promissory note in lieu of cash in satisfaction of any interest due and payable at such time. Any interest payment note shall be subject to the same terms as the note. The note has a maturity date of February 28, 2020.
The note is convertible, at the discretion of the note holder, into shares of the Company’s common stock (i) at any time following an Event of Default, or (ii) for a period of thirty (30) calendar days following October 31, 2015 and each anniversary thereof, at an initial conversion price per share of $1.00, subject to adjustment for stock splits, reverse stock splits, stock dividends and other similar transactions and subject to the terms of the note. As long as the note is outstanding, the Investor shall have a right of first refusal, exercisable for thirty (30) calendar days after notice to the note holder, to purchase securities proposed to be offered and sold by the Company.
| September 30, 2014 | December 31, 2013 | |||||||
| 10.5% convertible note of maturity date February 20, 2020 | $ | 6,982,667 | $ | - | ||||
The Company calculated the fair value of the convertible note and the beneficial conversion feature utilizing the Discounted Cash Flows model at the date of the issuance of promissory note. The relative fair values were allocated to the liability and equity components of the debt. Accordingly, a discount was created on the debt and this discount will be amortized to interest expense over the life of the debt. Debt discount amortization as of September 30, 2014 was $18,758.
As of December 31, 2013, there was $0 principal outstanding and accrued interest in the amount of $0 that was owed under the terms of the promissory notes.
As of September 30, 2014, there was $6,982,667 principal outstanding and accrued interest in the amount of $61,098 that was owed under the terms of the promissory notes.
The above note agreement contained regular provisions requiring timely repayment of principals and accrued interests, payment of default interest in the event of default, default and optional conversion and without specific financial covenants. Management of the Company believe the Company is in material compliance with the terms of the convertible note agreement.
The Company calculated professional service compensation of $1,500,000 in respect of convertible note issue, and recognized $0, $0, $0 and $0 for the three months ended and the nine month ended September 30, 2014 and 2013. As of September 30, 2014, the deferred compensation balance was $1,500,000 and the deferred compensation balance of $1,500,000 was to be amortized over 12 months beginning on October 1, 2014.
| F - 38 |
SINO AGRO FOOD, INC.
NOTES TO CONSOLIDATED FINANCIAL STATEMENTS
| 24. | SHAREHOLDERS’ EQUITY |
The Group’s share capital as of September 30, 2014 and December 31, 2013 shown on the consolidated balance sheet represents the aggregate nominal value of the share capital of the Company as at that date.
On March 22, 2010, the Company designated 100 shares of Series A preferred stock at a par value per share of $0.001. As of the same date, 100 shares of Series A preferred stock were issued at $1 per share for cash in the amount of $100.
The Series A preferred stock:
| (i) | does not pay a dividend; |
| (ii) | votes together with the shares of Common Stock of the Corporation as a single class and, regardless of the number of shares of Series A Preferred Stock outstanding and as long as at least one of such shares of Series A Preferred Stock is outstanding, shall represent eighty percent (80%) of all votes entitled to be voted at any annual or special meeting of shareholders of the Corporation or action by written consent of shareholders. Each outstanding share of the Series A Preferred Stock shall represent its proportionate share of the 80%, which is allocated to the outstanding shares of Series A Preferred Stock; and |
| (iii) | ranks senior to common stockholders, holders of Series B convertible preferred stockholders and any other stockholders on liquidation. |
The Company has designated 100 shares of Series A preferred stock with 100 shares issued and outstanding as of September 30, 2014 and December 31, 2013, respectively
The Series B convertible preferred stock:
On March 22, 2010, the Company designated 7,000,000 shares of Series B convertible preferred stock at a par value per share of $0.001. The Series B convertible preferred stock is redeemable, the stockholders are not entitled to receive any dividend and voting rights but rank senior over common stockholders on liquidation, and can convert to common stock on a one for one basis at any time. On June 26, 2010, 7,000,000 shares of common stock were surrendered for cancellation and the Company issued 7,000,000 shares of Series B convertible preferred stock at $9.90 per share. Pursuant to share exchange agreement made as of December 22, 2012, between the Company and a stockholder, Capital Adventure Inc., a holder of 3,000,000 shares of common shares, with the consent of Board of Directors, to exchange for 3,000,000 shares of Series B convertible preferred stock on one-for-one basis. As of December 23, 2012, 3,000,000 shares of Series B convertible preferred stock were issued to Capital Adventure Inc., for the exchange of its holding of 3,000,000 shares of common stock. As of December 31, 2012, 3,000,000 shares of common stock were still not returned to the Company. On March 27, 2013, 3,000,000 shares of Series B convertible preferred stock were cancelled.
There were 7,000,000 shares of Series B convertible preferred stock issued and outstanding as of September 30, 2014 and December 31, 2013, respectively.
The Series F Non-Convertible preferred stock:
On August 1, 2012, the Company designated 1,000,000 shares of Series F Non-Convertible Preferred Stock with a par value per share of $0.001.
The Series F Non-Convertible Preferred Stock:
| (i) | is not redeemable; |
| (ii) | except for (iv), with respect to dividend rights, rights on liquidation, winding up and dissolution, rank junior and subordinate to (a) all classes of Common Stock,(b) all other classes of Preferred Stock and (c) any class or series of capital securities of the Company. |
| (iii) | except for (iv), shall not entitled to receive any dividend; and |
| (iv) | on May 30, 2014, the holders of record of shares of Series F Non-Convertible Preferred Stock shall be entitled to a coupon payment directly from the Company at the redemption rate of $3.40 per share for every 100 shares of Common Stock. Upon redemption, the Record Holder shall no longer own any shares of Series F that have been redeemed, and all such redeemed shares shall disappear and no longer exist on the books and records of the Company; redeemed shares of Series F which no longer exist upon redemption shall thereafter be counted toward the authorized but unissued “blank check” preferred stock of the Company. |
| F - 39 |
SINO AGRO FOOD, INC.
NOTES TO CONSOLIDATED FINANCIAL STATEMENTS
| 24. | SHAREHOLDERS’ EQUITY (CONTINUED) |
On August 22, 2012, the Company’s Board of Directors declared that the Company’s stockholders were entitled to receive one share of restricted Series F Non-convertible Preferred Stock for every 100 shares of Common Stock owned by the stockholders as of September 28, 2012, with lesser or greater amounts being rounded up to the nearest 100 shares of Common Stock for purpose of the computing the dividend. The transfer agent of the Company recorded 924,180 shares of Series F Non-Convertible preferred stock on the account. But, the Company did not issue physical shares and only issued coupons to notify respective shareholders on that date. These F series shares of 924,180 shares, were based on numbers of shares of Common Stock as of September 28, 2012 of 91,931,287 shares, calculated at one share of Series F Non-Convertible preferred stock for every 100 shares of Common Stock with decimal number of shares being rounded up to one. The holders of record of shares of Series F Non - Convertible Preferred Stock shall be entitled to a coupon payment directly from the Company at the redemption rate of $3.40 per share and be payable on May 30, 2014 and extended to May 30, 2015 (the “Coupon Redemption Date”). Upon the Coupon Redemption Date, holders of the Coupon shall be entitled to a lump sum cash payment directly from the Company equal to $3.40 for every Coupon then held (the “Redemption”). Upon proper Redemption, the Series F Preferred Stock shall terminate and thereafter cease to exist.
As a result, total issued and outstanding of Series F Non-Convertible Preferred Stock as of September 30, 2014 and December 31, 2013 are 0 shares.
Common Stock:
On December 5, 2012, the Company obtained stockholders consent for the approval of an amendment to our articles of incorporation to increase our authorized shares of common stock, no par value (the “Common Stock”), from 10,101,010 to 13,131,313. The board of directors believes that the increase in our authorized Common Stock will provide us with greater flexibility with respect to our capital structure for purposes including additional equity financial and stock based acquisitions. The certificate of amendment effectuating the vote by the shareholders was filed with the State of Nevada on January 24, 2013.
On March 28, 2013, the Company filed a prospectus related to a public offering of Common Stock of the Company for maximum aggregate gross proceeds of $26,250,000 within a period not to exceed 180 days from the date of this prospectus and no Common stock was offered to the public in respect of this public offering.
On October 4, 2013, the Company obtained stockholder consent for the approval of an amendment to our articles of incorporation to increase our authorized shares of common stock, no par value (the “Common Stock”), from 13,131,313 to 17,171,717. The board of directors believes that the increase in our authorized Common Stock will provide us with greater flexibility with respect to our capital structure for purposes including additional equity financing and stock based acquisitions. The certificate of amendment effectuating the vote by the shareholders was filed with the State of Nevada on November 1, 2013.
During the three months ended September 30, 2013, the Company issued 817,447 shares of common stock for $3,327,000 at values ranging from $3.56 to $4.46 per share to settle debts due to third parties. The Company executed several agreements with third parties to settle debts by issuance of the Company’s common stock. The shares issued by the Company were valued at the trading price of the stock on the date the shares were issued. Any excess of the fair value of the shares over the carrying cost of the debt has been reported as a gain on the extinguishment of debts of $160,997 and $641,831 has been credited to consolidated statements of income as other income for the three months ended September 30, 2013 and 2012, respectively; and (ii) 30,021 shares of common stock valued to employees at fair value of $4.46 per share for $133,744 for employee compensation. The fair value of the common stock issued was determined by using the trading price of the Company’s common stock on the date of issuance of $4.46 per share.
During the nine months ended September 30, 2013, the Company issued 2,854,717 shares of common stock for $13,782,651 at values ranging from $3.56 to $5.22 per share to settle debts due to third parties. The Company executed several agreements with third parties to settle debts by issuance of the Company’s common stock. The shares issued by the Company were valued at the trading price of the stock on the date the shares were issued. Any excess of the fair value of the shares over the carrying cost of the debt has been reported as a gain on the extinguishment of debts of $1,212,010 and $1,459,343 has been credited to consolidated statements of income as other income for the nine months ended September 30, 2013 and 2012, respectively; and (ii) 30,021 shares of common stock valued to employees at fair value of $4.46 per share for $133,744 for employee compensation. The fair value of the common stock issued was determined by using the trading price of the Company’s common stock on the date of issuance of $4.46 per share.
During the three months ended September 30, 2014, the Company issued (i) 599,007 shares of common stock for $2,431,374 at values ranging from $3.96 to $4.06 per share to settle debts due to third parties. The Company executed several agreements with third parties to settle debts by issuance of the Company’s common stock. The shares issued by the Company were valued at the trading price of the stock on the date the shares were issued. Any excess of the fair value of the shares over the carrying cost of the debt has been reported as a gain on the extinguishment of debts of $11,885 and $160,997 has been credited to consolidated statements of income as other income for the three months ended September 30, 2014 and 2013, respectively; and (ii) 202,020 shares of common stock valued to professionals at fair value of $7.43 per share for $1,500,000 for service compensation. The fair value of the common stock issued was determined by using the trading price of the Company’s common stock on the date of issuance ranging from $7.43 per share.
| F - 40 |
SINO AGRO FOOD, INC.
NOTES TO CONSOLIDATED FINANCIAL STATEMENTS
| 24. | SHAREHOLDERS’ EQUITY (CONTINUED) |
During the nine months ended September 30, 2014, the Company issued (i) 2,034,608 shares of common stock for $12,006,374 at values ranging from $3.96 to $5.45 per share to settle debts due to third parties. The Company executed several agreements with third parties to settle debts by issuance of the Company’s common stock. The shares issued by the Company were valued at the trading price of the stock on the date the shares were issued. Any excess of the fair value of the shares over the carrying cost of the debt has been reported as a gain on the extinguishment of debts of $253,278 and $1,212,010 has been credited to consolidated statements of income as other income for the nine months ended September 30, 2014 and 2013, respectively; (ii) 130,568 shares of common stock valued to employees at fair value of $0.43 per share for $555,827 for employee compensation. The fair value of the common stock issued was determined by using the trading price of the Company’s common stock on the date of issuance of $4.26 per share; and (iii) 319,269 shares of common stock valued to professionals at fair value ranging from $3.96 to $7.43 per share for $1,964,306 for service compensation. The fair value of the common stock issued was determined by using the trading price of the Company’s common stock on the date of issuance ranging from $3.96 to $7.43 per share.
The Company has common stock of The Company has common stock of 16,982,649 and 13,899,196 shares issued and outstanding as of September 30, 2014 and December 31, 2013, respectively.
| 25. | OBLIGATION UNDER OPERATING LEASES |
The Company leases (i) 2,178 square feet of agriculture space used for offices for a monthly rent of $634 in Enping City, Guangdong Province, P.R.C., its lease expiring on March 31, 2017; (ii) 5,081 square feet of office space in Guangzhou City, Guangdong Province, P.R.C. for a monthly rent of $12,733, its lease expiring on July 8, 2016; and (iii) 1,555 square feet of staff quarters in Linli District, Hunan Province, PRC for a monthly rent of $163, its lease expiring on May 1, 2016.
Lease expense was $40,591 and $38,002 for the three months ended September 30, 2014 and 2013, respectively. Lease expense was $118,709 and $114,006 for the nine months ended September 30, 2014 and 2013, respectively. The future minimum lease payments as of September 30, 2014, are as follows:
| $ | ||||
| Year ended December 31, 2014 | 40,591 | |||
| Year ended December 31, 2015 | 162,364 | |||
| Thereafter | 86,561 | |||
| 289,516 | ||||
| 26. | STOCK BASED COMPENSATION |
On July 2, 2013, the Company issued employees a total of 30,021 shares of common stock valued at fair value of range from $4.46 per share for services rendered to the Company. The fair value of the common stock issued was determined by using the trading price of the Company’s common stock on the date of issuance of $4.46 per share.
On April 25, 2014, the Company issued employees a total of 130,567 shares of common stock valued at fair value of range from $4.26 per share for services rendered to the Company. The fair values of the common stock issued were determined by using the trading price of the Company’s common stock on the date of issuance of $4.26 per share.
On June 16, 2014, the Company issued professionals a total of 117,248 shares of common stock valued at fair value of range from $4.26 per share for services rendered to the Company. The fair values of the common stock issued were determined by using the trading price of the Company’s common stock on the date of issuance of $3.96 per share.
On September 16, 2014, the Company issued professionals a total of 202,020 shares of common stock valued at fair value of range from $7.43 per share for services rendered to the Company. The fair values of the common stock issued were determined by using the trading price of the Company’s common stock on the date of issuance of $7.43 per share.
The Company calculated stock based compensation of $2,653,876 and $405,544, and recognized $288,469, and $90,600, $355,341 and $271,800 for the three months ended September 30, 2014 and 2013 and for the nine months ended September 30, 2014 and 2013.
As of September 30, 2014, the deferred compensation balance for staff was $765,009 and was to be amortized over 9 months beginning on October 30, 2014 and the deferred compensation balance for professional services was $1,500,000 and was to be amortized over 12 months beginning on October 30, 2014.
| F - 41 |
SINO AGRO FOOD, INC.
NOTES TO CONSOLIDATED FINANCIAL STATEMENTS
| 27. | CONTINGENCIES |
As of September 30, 2014 and December 31, 2013, the Company did not have any pending claims, charges, or litigation that it expects would have a material adverse effect on its consolidated balance sheets, consolidated statements of income and other comprehensive income or cash flows.
| 28. | GAIN ON EXTINGUISHMENT OF DEBTS |
The Company executed several agreements with third parties to settle debts by issuance of the Company’s common stock. The shares issued by the Company were valued at the trading price of the stock on the date the shares were issued. Any excess of the fair value of the shares over the carrying cost of the debt has been reported as a gain on the extinguishment of debts of $33,693 and $160,997 has been credited to consolidated statements of income as other income for the three months ended September 30, 2014 and 2013, respectively. Any excess of the fair value of the shares over the carrying cost of the debt has been reported as a gain on the extinguishment of debts of $275,086 and $1,212,010 has been credited to consolidated statements of income as other income for the nine months ended September 30, 2014 and 2013, respectively.
| Three months ended | Three months ended | |||||||
| September 30, 2014 | September 30, 2013 | |||||||
| Total amounts of debts to be settled | 2,431,374 | 3,327,000 | ||||||
| Less: Aggregate market fair value of 599,007 (2013: 817,447) shares of common stock in exchange of the above debts for debts extinguishment | (2,397,681 | ) | (3,166,003 | ) | ||||
| Gain on extinguishment of debts | 33,693 | 160,997 | ||||||
| Nine months ended | Nine months ended | |||||||
| September 30, 2014 | September 30, 2013 | |||||||
| Total amounts of debts to be settled | 12,006,374 | 13,782,651 | ||||||
| Less: Aggregate market fair value of 2,034,607 (2013: 2,854,717) shares of common stock in exchange of the above debts for debts extinguishment | (11,731,288 | ) | (12,570,641 | ) | ||||
| Gain on extinguishment of debts | 275,086 | 1,212,010 | ||||||
| 29. | RELATED PARTY TRANSACTIONS |
In addition to the transactions and balances as disclosed elsewhere in these consolidated financial statements, during the nine months ended September 30, 2014 and 2013, the Company had the following significant related party transactions:-
| Name of related party | Nature of transactions | |
| Mr. Solomon Yip Kun Lee, Chairman | Included in due to a director, due to Mr. Solomon Yip Kun Lee is $4,244,519 and $1,793,768 as of September 30, 2014 and December 31, 2013, respectively. The amounts are unsecured, interest free and have no fixed term of repayment. |
| F - 42 |
SINO AGRO FOOD, INC.
NOTES TO CONSOLIDATED FINANCIAL STATEMENTS
| 30. | EARNINGS PER SHARE |
Basic earnings per share is computed by dividing net income attributable to common shareholders by the weighted average number of common shares outstanding during the year. Diluted earnings per share reflects the potential dilution of securities by including other potential common stock, including convertible preferred stock, stock options and warrants, in the weighted average number of common shares outstanding for the year, if dilutive. The numerators and denominators used in the computations of basic and dilutive earnings per share are presented in the following table:
| Three months ended September 30, 2014 | Three months ended September 30, 2013 | |||||||
| BASIC | ||||||||
| Numerator for basic earnings per share attributable to the Company’s common stockholders: | ||||||||
| Net income used in computing basic earnings per share | $ | 24,501,862 | $ | 18,752,774 | ||||
| Basic earnings per share | $ | 1.48 | $ | 1.52 | ||||
| Basic weighted average shares outstanding | 16,570,324 | 12,329,056 | ||||||
| Three months ended September 30,2014 | Three months ended September 30, 2013 | |||||||
| DILUTED | ||||||||
| Numerator for basic earnings per share attributable to the Company’s common stockholders: | ||||||||
| Net income used in computing basic earnings per share | $ | 24,501,862 | $ | 18,752,774 | ||||
| Diluted earnings per share | $ | 1.43 | $ | 1.44 | ||||
| Basic weighted average shares outstanding | 16,469,314 | 12,329,056 | ||||||
| Add: weight average of common stock converted from Series B Convertible preferred shares outstanding | 707,070 | 707,070 | ||||||
| Add: weight average Convertible note outstanding | - | - | ||||||
| Diluted weighted average shares outstanding | 17,176,384 | 13,036,126 | ||||||
| Nine months ended September 30, 2014 | Nine months ended September 30, 2013 | |||||||
| BASIC | ||||||||
| Numerator for basic earnings per share attributable to the Company’s common stockholders: | ||||||||
| Net income used in computing basic earnings per share | $ | 68,376,819 | $ | 49,462,486 | ||||
| Basic earnings per share | $ | 4.42 | $ | 4.23 | ||||
| Basic weighted average shares outstanding | 15,465,641 | 11,674,757 | ||||||
| Nine months ended September 30,2014 | Nine months ended September 30,2013 | |||||||
| DILUTED | ||||||||
| Numerator for basic earnings per share attributable to the Company’s common stockholders: | ||||||||
| Net income used in computing basic earnings per share | $ | 68,376,819 | $ | 49,462,486 | ||||
| Diluted earnings per share | $ | 4.23 | $ | 3.96 | ||||
| Basic weighted average shares outstanding | 15,465,641 | 11,674,758 | ||||||
| Add: weight average of common stock converted from Series B Convertible preferred shares outstanding | 707,070 | 802,530 | ||||||
| Add: weight average Convertible note outstanding | - | - | ||||||
| Diluted weighted average shares outstanding | 22,465,641 | 12,477,288 | ||||||
| F - 43 |
SINO AGRO FOOD, INC.
NOTES TO CONSOLIDATED FINANCIAL STATEMENTS
For the nine months ended September 30, 2014 and 2013, full dilution effect of convertible note of $6,982,667 (12.31.2013: $0), was not taken into account for calculation of the diluted earnings per share because convertible note holder is restricted to exercise shares before October 1, 2015 under terms of convertible note agreement.
| 30. | SUBSEQUENT EVENTS |
(i) Subsequent to the balance sheet date, the Board of directors and the holders of a majority of the voting power of our stockholders of the company have approved an amendment to articles of incorporation to increase its authorized shares of Common Stock from 17,171,717 to 22,727,273.
(ii) On November 10, 2014, the Company approved an amendment to the Corporation’s Articles of Incorporation to effectuate a reverse stock split (the “Reverse Split”) of the Corporation’s common stock, par value $0.001 per share (the “Common Stock”) affecting both the authorized and issued and outstanding number of such shares by a ratio of 9.9 for 1. The Reverse Split became effective in the State of Nevada on December 16, 2014. As a result, the Company is presently authorized to issue 22,727,273 shares of common stock, $0.001 per share.
(iii) On December 17, 2014, the Company approved an amendment to certificate designation in respect of Series B preferred stock. Pursuant to the above new amendment, each holder of Series B preferred stock shall have the rights, at any time or from time to time , to convert each 9.9 shares of Series B preferred to one fully paid and non assessable share of common stock of par value $0.001 per share.
| F - 44 |
SINO AGRO FOOD, INC. AND SUBSIDIARIES
CONSOLIDATED FINANCIAL STATEMENTS
FOR THE YEARS ENDED DECEMBER 31, 2013 AND 2012
SINO AGRO FOOD, INC. AND SUBSIDIARIES
INDEX TO CONSOLIDATED FINANCIAL STATEMENTS
REPORT OF INDEPENDENT REGISTERED PUBLIC ACCOUNTING FIRM
To the Board of Directors and Stockholders of
Sino Agro Food, Inc.
(Incorporated in the State of Nevada, United States of America)
We have audited the accompanying consolidated balance sheets of Sino Agro Food, Inc. and subsidiaries as of December 31, 2013 and December 31, 2012, and the consolidated statements of income and other comprehensive income, the consolidated statements of stockholders’ equity, and the consolidated statements of cash flows for the years ended December 31, 2013 and December 31, 2012. These consolidated financial statements are the responsibility of the Company’s management. Our responsibility is to express an opinion on these consolidated financial statements based on our audits.
We conducted our audits in accordance with the standards of the Public Company Accounting Oversight Board (“PCAOB”).Those standards require that we plan and perform the audit to obtain reasonable assurance about whether the financial statements are free of material misstatement. The Company is not required to have, nor have we been engaged to perform, an audit of its internal control over financial reporting. Our audit included consideration of internal control over financial reporting as a basis for designing audit procedures that are appropriate in the circumstances, but not for the purpose of expressing an opinion on the effectiveness of the Company’s internal control over financial reporting. Accordingly, we express no such opinion. An audit also includes examining, on a test basis, evidence supporting the amounts and disclosures in the financial statements, assessing the accounting principles used and significant estimates made by management, as well as evaluating the overall financial statements presentation. We believe that our audits provide a reasonable basis for our opinion.
The Company has restated (i) its statement of cash flows to correct an error related to the reporting of cash flows from the temporary deposits paid to entities for equity investment in future Sino Joint Venture companies during 2012 and the effects of that restatement are explained in note 33 to the consolidated financial statements; (ii) its balance sheets to reclassify (a) deferred dividend as Series F Non-convertible preferred stock redemption; and (b) temporary deposits paid to entities for equity investment in future Sino Joint Venture companies from current assets to other non-current assets and its details are disclosed in note 16 to the consolidated financial statements; (iii) common stock and additional paid in capital have been retroactively adjusted for the effects of reverse stock split.
In our opinion, these consolidated financial statements referred to above present fairly, in all material respects, the consolidated financial position of Sino Agro Food, Inc. and subsidiaries as of December 31, 2013, and December 31, 2012, and the consolidated results of its operations and its cash flows for each of the years ended December 31, 2013 and December 31, 2012, in conformity with accounting principles generally accepted in the United States of America.
/s/Anthony Kam & Associates Limited, CPA.
Anthony Kam & Associates Limited, CPA.
Hong Kong
December 1, 2014
| F- 1 |
CONSOLIDATED BALANCE SHEETS
AS OF DECEMBER 31, 2013 AND 2012
| 2013 | 2012 | |||||||
| (Restated) | (Restated) | |||||||
| ASSETS | ||||||||
| Current assets | ||||||||
| Cash and cash equivalents | $ | 1,327,274 | $ | 8,424,265 | ||||
| Inventories | 8,148,203 | 17,114,755 | ||||||
| Cost and estimated earnings in excess of billings on uncompleted contracts | 663,296 | 2,336,880 | ||||||
| Deposits and prepaid expenses | 51,291,708 | 41,278,072 | ||||||
| Accounts receivable, net of allowance for doubtful accounts | 82,057,942 | 52,948,350 | ||||||
| Other receivables | 3,782,771 | 5,954,248 | ||||||
| Total current assets | 147,271,194 | 128,056,570 | ||||||
| Property and equipment | ||||||||
| Property and equipment, net of accumulated depreciation | 46,487,058 | 19,946,302 | ||||||
| Construction in progress | 59,134,732 | 24,492,510 | ||||||
| Land use rights, net of accumulated amortization | 60,705,829 | 55,733,246 | ||||||
| Total property and equipment | 166,327,619 | 100,172,058 | ||||||
| Other non-current assets | ||||||||
| Goodwill | 724,940 | 724,940 | ||||||
| Proprietary technologies, net of accumulated amortization | 12,081,470 | 8,114,624 | ||||||
| Temporary deposits paid to entities for investments in Sino joint venture companies | 41,109,708 | 6,030,785 | ||||||
| License rights | - | 1 | ||||||
| Total other non-current assets | 53,916,118 | 14,870,350 | ||||||
| Total assets | $ | 367,514,931 | $ | 243,098,978 | ||||
| LIABILITIES AND STOCKHOLDERS’ EQUITY | ||||||||
| Current liabilities | ||||||||
| Accounts payable and accrued expenses | $ | 11,055,194 | $ | 5,762,643 | ||||
| Billings in excess of costs and estimated earnings on uncompleted contracts | 3,146,956 | 2,790,084 | ||||||
| Due to a director | 1,793,768 | 3,345,803 | ||||||
| Dividends payable | - | 951,308 | ||||||
| Series F Non-convertible preferred stock redemption payable | 3,146,063 | - | ||||||
| Other payables | 10,768,786 | 6,654,478 | ||||||
| Short term bank loan | 4,100,377 | 3,181,927 | ||||||
| 34,011,144 | 22,686,243 | |||||||
| Non-current liabilities | ||||||||
| Series F Non-convertible preferred stock redemption payable | - | 3,146,063 | ||||||
| Bonds payable | 1,725,000 | - | ||||||
| Long term debts | 180,417 | 175,006 | ||||||
| 1,905,417 | 3,321,069 | |||||||
| Commitments and contingencies | - | - | ||||||
| Stockholders’ equity | ||||||||
| Preferred stock: $0.001 par value (10,000,000 shares authorized, 7,000,100 and 10,000,000 shares issued and outstanding as of December 31, 2013 and December 31, 2012, respectively) | ||||||||
| Series A preferred stock: $0.001 par value (100 shares designated, 100 shares issued and outstanding as of December 31, 2013 and December 31, 2012, respectively) | - | - | ||||||
| Series B convertible preferred stock: $0.001 par value) (10,000,000 shares designated, 7,000,000 and 10,000,000 shares issued and outstanding) as of December 31, 2013 and December 31, 2012, respectively) | 7,000 | 10,000 | ||||||
| Series F Non-convertible preferred stock: $0.001 par value) (1,000,000 shares designated, 0 shares issued and outstanding) as of December 31, 2013 and December 31, 2012, respectively) | - | - | ||||||
| Common stock: $0.001 par value (17,171,717 shares authorized, 13,899,196 and 10,101,500 shares issued and outstanding as of December 31, 2013 and December 31, 2012, respectively) | 13,899 | 10,102 | ||||||
| Additional paid - in capital | 105,037,379 | 88,181,594 | ||||||
| Retained earnings | 181,196,498 | 106,989,969 | ||||||
| Accumulated other comprehensive income | 6,260,131 | 3,868,274 | ||||||
| Treasury stock | (1,250,000 | ) | (1,250,000 | ) | ||||
| Total Sino Agro Food, Inc. and subsidiaries stockholders’ equity | 291,264,907 | 197,809,939 | ||||||
| Non - controlling interest | 40,333,463 | 19,281,727 | ||||||
| Total stockholders’ equity | 331,598,370 | 217,091,666 | ||||||
| Total liabilities and stockholders’ equity | $ | 367,514,931 | $ | 243,098,978 | ||||
The accompanying notes are an integral part of these consolidated financial statements.
| F- 2 |
CONSOLIDATED STATEMENTS OF INCOME AND OTHER COMPREHENSIVE INCOME
FOR THE YEARS ENDED DECEMBER 31, 2013 AND 2012
| 2013 | 2012 | |||||||
| Revenue | ||||||||
| - Sale of goods | $ | 208,614,041 | $ | 88,072,327 | ||||
| - Consulting and service income from development contracts | 51,179,311 | 50,541,312 | ||||||
| - Commission income | 1,632,461 | - | ||||||
| 261,425,813 | 138,613,639 | |||||||
| Cost of goods sold | (139,346,055 | ) | (50,558,514 | ) | ||||
| Cost of services | (20,548,608 | ) | (18,248,957 | ) | ||||
| Gross profit | 101,531,150 | 69,806,168 | ||||||
| General and administrative expenses | (8,859,777 | ) | (8,385,862 | ) | ||||
| Net income from operations | 92,671,373 | 61,420,306 | ||||||
| Other income (expenses) | ||||||||
| Government grant | 613,678 | 139,836 | ||||||
| Other income | 230,840 | 308,332 | ||||||
| Gain on extinguishment of debts | 1,318,947 | 1,666,386 | ||||||
| Interest expense | (393,592 | ) | (282,320 | ) | ||||
| Net other income (expenses) | 1,769,873 | 1,832,234 | ||||||
| Net income before income taxes | 94,441,246 | 63,252,540 | ||||||
| Provision for income taxes | - | - | ||||||
| Net income | 94,441,246 | 63,252,540 | ||||||
| Less: Net (income) loss attributable to the non - controlling interest | (20,234,717 | ) | (5,706,708 | ) | ||||
| Net income attributable to the Sino Agro Food, Inc. and subsidiaries | 74,206,529 | 57,545,832 | ||||||
| Other comprehensive income | ||||||||
| Foreign currency translation gain | 3,208,876 | 448,984 | ||||||
| Comprehensive income | 77,415,405 | 57,994,816 | ||||||
| Less: other comprehensive (income) loss attributable to the non - controlling interest | (817,019 | ) | (27,548 | ) | ||||
| Comprehensive income attributable to the Sino Agro Food, Inc. and subsidiaries | $ | 76,598,386 | $ | 57,967,268 | ||||
| Earnings per share attributable to Sino Agro Food, Inc. and subsidiaries common stockholders: | ||||||||
| Basic | $ | 6.14 | $ | 6.95 | ||||
| Diluted | $ | 5.76 | $ | 6.19 | ||||
| Weighted average number of shares outstanding: | ||||||||
| Basic | 12,093,973 | 8,284,536 | ||||||
| Diluted | 12,872,442 | 9,294,637 | ||||||
The accompanying notes are an integral part of these consolidated financial statements.
| F- 3 |
CONSOLIDATED STATEMENTS OF SHAREHOLDERS’ EQUITY
FOR THE YEARS ENDED DECEMBER 31, 2013 AND 2012
| Series A | Series B Convertible | Series F Non-Convertible | |||||||||||||||||||||||||||||||
| Common stock | Preferred stock | Preferred stock | Preferred stock | ||||||||||||||||||||||||||||||
| Par value $0.001 | Par value $0.001 | Par value $0.001 | Par value $0.001 | ||||||||||||||||||||||||||||||
| Number | Number | ||||||||||||||||||||||||||||||||
| of shares (Restated) | Amount (Restated) | of shares | Amount | Number of shares | Amount | Number of shares | Amount | ||||||||||||||||||||||||||
| $ | $ | $ | $ | ||||||||||||||||||||||||||||||
| Balance as of January 1, 2012 | 6,771,138 | 6,771 | 100 | - | 7,000,000 | 7,000 | - | - | |||||||||||||||||||||||||
| Issue of Series B convertible preferred stock | - | - | - | - | 3,000,000 | 3,000 | - | - | |||||||||||||||||||||||||
| Issue of common stock | |||||||||||||||||||||||||||||||||
| - For settlement of debts | 3,238,847 | 3,239 | - | - | - | - | - | - | |||||||||||||||||||||||||
| - Employees’ compensation | 91,515 | 92 | - | - | - | - | - | - | |||||||||||||||||||||||||
| - | |||||||||||||||||||||||||||||||||
| Amortize discount - Convertible notes | - | - | - | - | - | - | - | - | |||||||||||||||||||||||||
| Net income for the year | - | - | - | - | - | - | - | - | |||||||||||||||||||||||||
| Business combination of a subsidiary | - | - | - | - | - | - | - | - | |||||||||||||||||||||||||
| Dividends | |||||||||||||||||||||||||||||||||
| - Cash dividends | - | - | - | - | - | - | - | - | |||||||||||||||||||||||||
| Reserve for Series F Non-convertible preferred stock redemption | - | - | - | - | - | - | - | - | |||||||||||||||||||||||||
| Foreign currency translation gain | - | - | - | - | - | - | - | - | |||||||||||||||||||||||||
| Balance as of December 31, 2012 | 10,101,500 | 10,102 | 100 | - | 10,000,000 | 10,000 | 924,180 | 924 | |||||||||||||||||||||||||
| Series B convertible preferred stock cancelled | - | - | - | - | (3,000,000 | ) | (3,000 | ) | - | - | |||||||||||||||||||||||
| Issue of common stock | |||||||||||||||||||||||||||||||||
| - For settlement of debts | 3,767,675 | 3,767 | - | - | - | - | - | - | |||||||||||||||||||||||||
| - Employees’ compensation | 30,021 | 30 | - | - | - | - | - | - | |||||||||||||||||||||||||
| Amortize discount - Convertible notes | - | - | - | - | - | - | - | - | |||||||||||||||||||||||||
| Net income for the year | - | - | - | - | - | - | - | - | |||||||||||||||||||||||||
| Foreign currency translation gain | - | - | - | - | - | - | - | - | |||||||||||||||||||||||||
| Balance as of December 31, 2013 | 13,899,196 | 13,899 | 100 | - | 707,070 | 7,000 | 924,180 | 924 | |||||||||||||||||||||||||
The accompanying notes are an integral part of these consolidated financial statements.
| F- 4 |
| Treasury stock | Additional paid – in | Accumulated other | Non - | |||||||||||||||||||||||||
| Number | Capital | Retained | comprehensive | controlling | ||||||||||||||||||||||||
| of shares | Amount | (Restated) | earnings | income | Interest | Total | ||||||||||||||||||||||
| $ | $ | $ | $ | $ | $ | |||||||||||||||||||||||
| Balance as of January 1, 2012 | (101,010 | ) | (1,250,000 | ) | 72,855,165 | 50,395,444 | 3,446,838 | 9,934,155 | 135,395,373 | |||||||||||||||||||
| . | ||||||||||||||||||||||||||||
| Issue of Series B convertible preferred stock | - | - | - | - | - | - | 3,000 | |||||||||||||||||||||
| Issue of common stock | ||||||||||||||||||||||||||||
| - For settlement of debts | - | - | 17,860,178 | - | - | - | 17,863,417 | |||||||||||||||||||||
| - Employees’ compensation | - | - | 362,308 | - | - | - | 362,400 | |||||||||||||||||||||
| Amortize discount - Convertible notes | - | - | 228,680 | - | - | - | 228,680 | |||||||||||||||||||||
| Net income for the year | - | - | - | 57,545,832 | - | 5,706,708 | 63,252,540 | |||||||||||||||||||||
| Business combination of a subsidiaries | - | - | - | - | - | 3,613,316 | 3,613,316 | |||||||||||||||||||||
| Dividends | ||||||||||||||||||||||||||||
| - Cash dividends | - | - | - | (951,307 | ) | - | - | (951,307 | ) | |||||||||||||||||||
| Reserve for Series F Non-convertible preferred stock redemption | - | - | (3,124,737 | ) | - | - | - | (3,124,737 | ) | |||||||||||||||||||
| Foreign currency translation gain | - | - | - | - | 421,436 | 27,548 | 448,984 | |||||||||||||||||||||
| Balance as of December 31, 2012 | (101,010 | ) | (1,250,000 | ) | 88,181,594 | 106,989,969 | 3,868,274 | 19,281,727 | 217,091,666 | |||||||||||||||||||
| Series B convertible preferred stock cancelled | - | - | - | - | - | - | (3,000 | ) | ||||||||||||||||||||
| Issue of common stock | ||||||||||||||||||||||||||||
| - For settlement of debts | - | - | 16,707,919 | - | - | - | 16,711,686 | |||||||||||||||||||||
| - Employees’ compensation | - | - | 133,714 | - | - | - | 133,744 | |||||||||||||||||||||
| Amortize discount - Convertible notes | - | - | 14,152 | - | - | - | 14,152 | |||||||||||||||||||||
| Net income for the year | - | - | - | 74,206,529 | - | 20,234,717 | 94,441,246 | |||||||||||||||||||||
| Foreign currency translation gain | - | - | - | - | 2,391,857 | 817,019 | 3,208,876 | |||||||||||||||||||||
| Balance as of December 31, 2013 | (101,010 | ) | (1,250,000 | ) | 105,037,379 | 181,196,498 | 6,260,131 | 40,333,463 | 331,598,370 | |||||||||||||||||||
The accompanying notes are an integral part of these consolidated financial statements.
| F- 5 |
CONSOLIDATED STATEMENTS OF CASH FLOWS
FOR THE YEARS ENDED DECEMBER 31, 2013 AND 2012
| 2013 | 2012 | |||||||
| (Restated) | ||||||||
| Cash flows from operating activities | ||||||||
| Net income | $ | 94,441,246 | $ | 63,252,540 | ||||
| Adjustments to reconcile net income to net cash from operations: | ||||||||
| Depreciation | 1,496,551 | 443,361 | ||||||
| Amortization | 2,006,146 | 1,934,909 | ||||||
| Gain on extinguishment of debts | (1,318,947 | ) | (1,666,386 | ) | ||||
| Loss on disposal of property, plant and equipment | 136 | - | ||||||
| Common stock and bond issued for services | 405,236 | 2,229,657 | ||||||
| Other amortized costs | 57,278 | - | ||||||
| Changes in operating assets and liabilities: | ||||||||
| Decrease/(increase) in inventories | 8,966,552 | (10,037,494 | ) | |||||
| Increase in deposits and prepaid expenses | (22,827,646 | ) | (28,276,491 | ) | ||||
| (Decrease)/increase in due to a director | (1,555,036 | ) | 12,239,470 | |||||
| Increase in accounts payable and accrued expenses | 5,292,551 | 3,330,443 | ||||||
| Increase in other payables | 22,144,941 | 1,482,417 | ||||||
| Increase in accounts receivable | (29,069,592 | ) | (18,142,198 | ) | ||||
| Decrease/(increase) in cost and estimated earnings in excess of billings on uncompleted contacts | 1,673,584 | (1,880,776 | ) | |||||
| Increase in billings in excess of costs and estimated earnings on uncompleted contracts | 356,872 | 827,965 | ||||||
| Decrease in amount due to related parties | - | (867,413 | ) | |||||
| Decrease in amount due from related parties | - | 15,820,752 | ||||||
| Decrease in other receivables | 2,171,477 | 3,734,623 | ||||||
| Net cash provided by operating activities | 84,241,349 | 44,425,379 | ||||||
| Cash flows from investing activities | ||||||||
| Purchases of property and equipment | (7,002,878 | ) | (10,756,744 | ) | ||||
| Payment for investment in future Sino Joint Venture companies | (35,078,923 | ) | (6,030,785 | ) | ||||
| Acquisition of proprietary technologies | - | (1,500,000 | ) | |||||
| Net cash outflow from business combination of a subsidiaries less cash acquired | - | (6,893,349 | ) | |||||
| Payment for construction in progress | (51,226,616 | ) | (19,185,878 | ) | ||||
| Net cash used in investing activities | (93,308,417 | ) | (44,366,756 | ) | ||||
| Cash flows from financing activities | ||||||||
| Proceeds from long term debt | - | 175,006 | ||||||
| Proceeds from short term debt | 4,100,377 | 3,181,927 | ||||||
| Repayment of short term debt | (3,181,927 | ) | - | |||||
| Non-controlling interest contribution | - | 3,634,064 | ||||||
| Proceeds from bond payable | 940,000 | - | ||||||
| Dividends paid | (951,308 | ) | (134,631 | ) | ||||
| Net cash provided by financing activities | 907,142 | 6,856,366 | ||||||
| Effects on exchange rate changes on cash | 1,062,935 | 121,368 | ||||||
| (Decrease)/increase in cash and cash equivalents | (7,096,991 | ) | 7,036,357 | |||||
| Cash and cash equivalents, beginning of year | 8,424,265 | 1,387,908 | ||||||
| Cash and cash equivalents, end of year | 1,327,274 | 8,424,265 | ||||||
| Supplementary disclosures of cash flow information: | ||||||||
| Cash paid for interest | $ | 393,592 | $ | 282,320 | ||||
| Cash paid for income taxes | - | - | ||||||
| Non - cash transactions | ||||||||
| Common stock issued for settlement of debts | $ | 16,711,685 | $ | 17,863,417 | ||||
| Series B convertible preferred stock | $ | (3,000 | ) | $ | 3,000 | |||
| Common stock issued for services and employee compensation | $ | 133,744 | $ | 362,400 | ||||
| Transfer to land use rights from construction in progress | $ | 20,726,266 | $ | 528,451 | ||||
| Transfer to land use rights from deposits and prepaid expenses | $ | 4,404,179 | $ | - | ||||
| Transfer to property and equipment from deposits and prepaid expenses | $ | 308,299 | $ | - | ||||
| Transfer to construction in progress from deposits and prepaid expenses | $ | 4,141,872 | $ | - | ||||
| Transfer to proprietary technologies from deposits and prepaid expenses | $ | 4,390,043 | $ | - | ||||
| Transfer to property and equipment from land use rights | $ | - | $ | 6,419,170 | ||||
The accompanying notes are an integral part of these consolidated financial statements.
| F- 6 |
NOTES TO CONSOLIDATED FINANCIAL STATEMENTS
FOR THE YEARS ENDED DECEMBER 31, 2013 AND 2012
1. CORPORATE INFORMATION
Sino Agro Food, Inc. (the “Company” or “SIAF”) (formerly known as Volcanic Gold, Inc. and A Power Agro Agriculture Development, Inc.) was incorporated on October 1, 1974 in the State of Nevada.
The Company was engaged in the mining and exploration business but ceased its mining and exploring business on October 14, 2005. On August 24, 2007, the Company entered into a Merger and Acquisition Agreement with Capital Award Inc., a Belize corporation (“CA”) and its subsidiaries Capital Stage Inc. (“CS”) and Capital Hero Inc. (“CH”). Effective the same date, CA completed a reverse merger transaction with SIAF. SIAF acquired all the outstanding common stock of CA from Capital Adventure, a shareholder of CA, for 32,000,000 shares of the Company’s common stock.
On August 24, 2007 the Company changed its name from Volcanic Gold, Inc. to A Power Agro Agriculture Development, Inc. On December 8, 2007, the Company changed its name to Sino Agro Food, Inc.
On September 5, 2007, the Company acquired three existing businesses in the People’s Republic of China (the“PRC”):
| (a) | Hang Yu Tai Investment Limited (“HYT”), a company incorporated in Macau, the owner of a 78% equity interest in ZhongXingNongMu Ltd (“ZX”), a company incorporated in the PRC; |
| (b) | Tri-way Industries Limited (“TRW”), a company incorporated in Hong Kong; |
| (c) | Macau Eiji Company Limited (“MEIJI”), a company incorporated in Macau, the owner of 75% equity interest in Enping City Juntang Town Hang Sing Tai Agriculture Co. Ltd. (“HST”), a PRC corporate Sino-Foreign joint venture. HST was dissolved in 2010. |
On November 27, 2007, MEIJI and HST established a corporate Sino - Foreign joint venture, Jiang Men City Heng Sheng Tai Agriculture Development Co. Ltd. (“JHST”), a company incorporated in the PRC with MEIJI owning a 75% interest and HST owning a 25% interest.
On November 26, 2008, SIAF established Pretty Mountain Holdings Limited (“PMH”), a company incorporated in Hong Kong with an 80% equity interest. On May 25, 2009, PMH formed a corporate Sino-Foreign joint venture, Qinghai Sanjiang A Power Agriculture Co. Ltd. (“SJAP”), incorporated in the PRC, of which PMH owns a 45% equity interest. At the time, the remaining 55% equity interest in SJAP was owned by the following entities:
SJAP is engaged in the business of manufacturing bio-organic fertilizer, livestock feed and development of other agriculture projects in the County of Huangyuan, in the vicinity of the Xining City, Qinghai Province, PRC.
In September 2009, the Company carried out an internal reorganization of its corporate structure and business, and formed a 100% owned subsidiary, A Power Agro Agriculture Development (Macau) Limited (“APWAM”), which was formed in Macau. APWAM then acquired PMH’s 45% equity interest in SJAP. By virtue of the acquisition, APWAM assumed all obligations and liabilities of PMH under the Sino Foreign Joint Venture Agreement. On May 7, 2010, Qinghai Sanjiang sold and transferred its equity interest in SJAP to Garwor. The State Administration for Industry and Commerce of Xining City Government of the PRC approved the sale and transfer. As a result, APWAM owned 45% of SJAP and Garwor owned the remaining 55%. This remains the case as of the date of this report (the “Report”).
On September 9, 2010, an application was submitted by the Company to the Companies Registry of Hong Kong for deregistration of PMH under Section 291AA of the Hong Kong Companies Ordinance. On January 28, 2011, PMH was dissolved.
| F- 7 |
SINO AGRO FOOD, INC.
NOTES TO CONSOLIDATED FINANCIAL STATEMENTS
FOR THE YEARS ENDED DECEMBER 31, 2013 AND 2012
On February 15, 2011 and March 29, 2011, the Company entered into an agreement and a memorandum of understanding (an “MOU” ), respectively, to sell 100% equity interest in HYT group (including HYT and ZX) to Mr. Xin Ming Sun, a director of ZhongXingNong Nu Co., Ltd for $45,000,000, with effective date of January 1, 2011.
On February 28, 2011, the Company applied to form Enping City Bi Tao A Power Prawn Culture Development Co Limited (“EBAPCD”) , and the Company would indirectly own a 25% equity interest in future Sino Joint Venture Company (pending approval).
On February 28, 2011, TRW applied to form a corporate joint venture, Enping City Bi Tao A Power Fishery Development Co., Limited (“EBAPFD”), incorporated in the PRC. TRW owned a 25% equity interest in EBAPFD. On November 17, 2011, TRW formed Jiang Men City A Power Fishery Development Co., Limited (“JFD”) in which it acquired a 25% equity interest, while withdrawing its 25% equity interest in EBAPFD. As of December 31, 2011, the Company had invested for total cash consideration of $1,258,607 in JFD. JFD operates an indoor fish farm. On January 1, 2012, the Company acquired an additional 25% equity interest in JFD for total cash consideration of $1,662,365. As of January 1, 2012, the Company had consolidated the assets and operations of JFD. On April 1, 2012, the Company acquired an additional 25% equity interest in JFD for the total cash consideration of $1,702,580. These acquisitions were at our option according the terms of the original development agreement. The Company presently owns a 75% equity interest in JFD, representing majority of voting rights and controls its board of directors.
On April 15, 2011, MEIJI applied to form Enping City A Power Cattle Farm Co., Limited (“ECF”), all of which the Company would indirectly own a 25% equity interest in on November 17, 2011. On January 1, 2012, the Company had invested $1,076,489 in ECF and the amount was settled in contra against accounts receivable due from ECF. On September 17, 2012 MEIJI formed Jiang Men City Hang Mei Cattle Farm Development Co., Limited (“JHMC”) and acquired additional 50% equity interest for the total cash consideration of $2,944,176 on September 30, 2012 while withdrawing its 25% equity interest in ECF. This acquisition was at our option according to the terms of the original development agreement. The Company presently owns 75% equity interest in JHMC, representing majority of voting right and controls its board of directors. As of September 30, 2012, the Company had consolidated the assets and operations of JHMC. During the year ended December 31, 2013, MEIJI further invested $400,000 in JHMC.
On July 18, 2011, the Company formed Hunan Shenghua A Power Agriculture Co., Limited (“HSA”), in which the Company owns a 26% equity interest, and SJAP owns a 50% equity interest with the Chinese partner owning the remaining 24%. During the year ended December 31, 2013, MEIJI and SJAP further invested $403,805 and $398,329 in HSA, respectively.
On November 12, 2013, the Company acquired a shell company, Goldcup9203 AB, incorporated in Sweden, in which the Company owns a 100% equity interest. Goldcup 9203 AB changed its name to Sino Agro Food Sweden AB (publ) (“SAFS”) As of December 31, 2013, the Company invested $77,664 in SAFS.
The Company’s principal executive office is located at Room 3801, Block A, China Shine Plaza, No. 9 Lin He Xi Road, Tianhe District, Guangzhou City, Guangdong Province, PRC, 510610.
The nature of the operations and principal activities of the Company and its subsidiaries are described in Note 2.2.
2. SUMMARY OF SIGNIFICANT ACCOUNTING POLICIES
2.1FISCAL YEAR
The Company has adopted December 31 as its fiscal year end.
| F- 8 |
SINO AGRO FOOD, INC.
NOTES TO CONSOLIDATED FINANCIAL STATEMENTS
FOR THE YEARS ENDED DECEMBER 31, 2013 AND 2012
2.2 REPORTING ENTITIES
| Name of subsidiaries | Place of incorporation | Percentage of interest | Principal activities | |||
| Capital Award Inc. (“CA”) | Belize | 100% (2012: 100%) directly | Fishery development and holder of A-Power Technology master license. | |||
| Capital Stage Inc. (“CS”) | Belize | 100% (2012: 100%) indirectly | Dormant | |||
| Capital Hero Inc. (“CH”) | Belize | 100% (2012: 100%) indirectly | Dormant | |||
| Sino Agro Food Sweden AB (“SAFS”) | Sweden | 100% (2012: 0%) directly | Dormant | |||
| Tri-way Industries Limited (“TRW”) | Hong Kong, PRC | 100% (2012: 100%) directly | Investment holding, holder of enzyme technology master license for manufacturing of livestock feed and bio-organic fertilizer and has not commenced its planned business of fish farm operations. | |||
| Macau Meiji Limited (“MEIJI”) | Macau, PRC | 100% (2012: 100%) directly | Investment holding, cattle farm development, beef cattle and beef trading | |||
| A Power Agro Agriculture Development (Macau) Limited (“APWAM”) | Macau, PRC | 100% (2012: 100%) directly | Investment holding | |||
| Jiang Men City Heng Sheng Tai Agriculture Development Co. Ltd (“JHST”) | PRC | 75% (2012: 75%) directly | Hylocereus Undatus Plantation (“HU Plantation”). | |||
| Jiang Men City A Power Fishery Development Co., Limited (“JFD”) | PRC | 75% (2012: 75%) indirectly | Fish cultivation | |||
| Jiang Men City Hang Mei Cattle Farm Development Co., Limited (“JHMC”) | PRC | 75% (2012: 75%) indirectly | Beef cattle cultivation | |||
| Hunan Shenghua A Power Agriculture Co., Limited (“HSA”) | PRC | 76% (2012: 76%) indirectly | Manufacturing of organic fertilizer, livestock feed, and beef cattle and sheep cultivation, and plantation of crops and pastures | |||
| Name of variable interest entity | Place of incorporation | Percentage of interest | Principal activities | |||
| Qinghai Sanjiang A Power Agriculture Co., Ltd (“SJAP”) | PRC | 45% (2012: 45%) indirectly | Manufacturing of organic fertilizer, livestock feed, and beef cattle and plantation of crops and pastures |
| F- 9 |
SINO AGRO FOOD, INC.
NOTES TO CONSOLIDATED FINANCIAL STATEMENTS
FOR THE YEARS ENDED DECEMBER 31, 2013 AND 2012
3. SUMMARY OF SIGNIFICANT ACCOUNTING POLICIES (CONTINUED)
2.3 BASIS OF PRESENTATION
The consolidated financial statements are prepared in accordance with generally accepted accounting principles in the United States of America (“US GAAP”).
Reverse stock split and new conversion rate of Series B preferred stock to share of common stock
On December 16, 2014, the Company implemented a 9.9-for-1 reverse stock split. On December 17, 2014, the Company implemented new conversion rate of 9.9 for 1 share of common stock. All share information contained within this report, including consolidated balance sheets, consolidated statements of income and other comprehensive income, and footnotes have been retroactively adjusted for the effects of reverse stock split and new conversion rate of Series B preferred stock to share of common stock.
2.4 BASIS OF CONSOLIDATION
The consolidated financial statements include the financial statements of the Company, its subsidiaries CA, CS, CH, TRW, MEIJI, JHST, JFD, JHMC, HSA, APWAM, SAFS and its variable interest entity SJAP. All material inter-company transactions and balances have been eliminated in consolidation.
SIAF, CA, CS, CH, TRW, MEIJI, JHST, JFD, JHMC, HSA, APWAM, SAFS and SJAP are hereafter referred to as (the “Company”).
2.5 BUSINESS COMBINATION
The Company adopted the accounting pronouncements relating to business combination (primarily contained in ASC Topic 805 “Business Combinations”), including assets acquired and liabilities assumed on arising from contingencies. These pronouncements established principles and requirement for how the acquirer of a business recognizes and measures in its financial statements he identifiable assets acquired, the liabilities assumed, and any non-controlling interest in the acquisition as well as provides guidance for recognizing and measuring the goodwill acquired in the business combination and determines what information to disclose to enable users of the financial statements to evaluate the nature and financial effects of the business combination. In addition, these pronouncements eliminate the distinction between contractual and non-contractual contingencies, including the initial recognition and measurement criteria and require an acquirer to develop a systematic and rational basis for subsequently measuring and accounting for acquired contingencies depending on their nature. The Company’s adoption of these pronouncements will have an impact on the manner in which it accounts for any future acquisitions.
2.6 NON - CONTROLLING INTEREST IN CONSOLIDATED FINANCIAL STATEMENTS
The Company adopted the accounting pronouncement on non-controlling interests in consolidated financial statements, which establishes accounting and reporting standards for the non-controlling interest in a subsidiary and for the deconsolidation of a subsidiary. This guidance is primarily contained in ASC Topic “Consolidation.” It clarifies that a non-controlling interest in a subsidiary is an ownership interest in the consolidated financial statements. The adoption of this standard has not had material impact on the Company’s consolidated financial statements.
2.7 USE OF ESTIMATES
The preparation of consolidated financial statements in conformity with US GAAP requires management to make assumptions and estimates that affect the reported amounts of assets and liabilities and disclosure of contingent assets and liabilities at the dates of the consolidated financial statements and the reported amounts of revenues and expenses during the reporting periods covered thereby. Actual results could differ from these estimates. Judgments and estimates of uncertainties are required in applying the Company’s accounting policies in certain areas. The following are some of the areas requiring significant judgments and estimates: determinations of the useful lives of assets, estimates of allowances for doubtful accounts, cash flow and valuation assumptions in performing asset impairment tests of long-lived assets, estimates of the realization of deferred tax assets and inventory reserves.
| F- 10 |
SINO AGRO FOOD, INC.
NOTES TO CONSOLIDATED FINANCIAL STATEMENTS
FOR THE YEARS ENDED DECEMBER 31, 2013 AND 2012
2.8 REVENUE RECOGNITION
The Company’s revenue recognition policies are in compliance with ASC 605. Sales revenue is recognized when all of the following have occurred: (i) persuasive evidence of an arrangement exists, (ii) delivery has occurred or services have been rendered, (iii) the price is fixed or determinable, and (iv) the ability to collect is reasonably assured. These criteria are generally satisfied at the time of shipment when risk of loss and title passes to the customer.
Government grants are recognized when (i) the Company has substantially accomplished what must be done pursuant to the terms of the grant that are established by the local government; and (ii) the Company receives notification from the local government that the Company has satisfied all of the requirements to receive the government grants; and (iii) the amounts are received.
Multiple-Element Arrangements
To qualify as a separate unit of accounting under ASC 605-25 “Multiple Element Arrangements”, the delivered item must have value to the customer on a standalone basis. The significant deliverables under the Company’s multiple-element arrangements are consulting and service under development contract, commission and management service.
Revenues from the Company’s consulting and services under development contracts are performed under fixed-price contracts. Revenues under long-term contracts are accounted for under the percentage-of-completion method of accounting in accordance with the Financial Accounting Standards Board (“FASB”) Accounting Standards Codification (“ASC”) Topic 605,Revenue Recognition(“ASC 605”). Under the percentage-of-completion method, the Company estimates profit as the difference between total estimated revenue and total estimated cost of a contract and recognizes that profit over the contract term. The percentage of costs incurred determines the amount of revenue to be recognized. Payment terms are generally defined by the installation contract and as a result may not match the timing of the costs incurred by the Company and the related recognition of revenue. Such differences are recorded as either costs or estimated earnings in excess of billings on uncompleted contracts or billings in excess of costs and estimated earnings on uncompleted contracts. The Company determines a customer’s credit worthiness at the time an order is accepted. Sudden and unexpected changes in a customer’s financial condition could put recoverability at risk.
The percentage of completion method requires the ability to estimate several factors, including the ability of the customer to meet its obligations under the contract, including the payment of amounts when due. If the Company determines that collectability is not assured, the Company will defer revenue recognition and use methods of accounting for the contract such as the completed contract method until such time as the Company determines that collectability is reasonably assured or through the completion of the project.
For fixed-price contracts, the Company uses the ratio of costs incurred to date on the contract to management’s estimate of the contract’s total costs, to determine the percentage of completion on each contract. This method is used as management considers expended costs to be the best available measure of progression of these contracts. Contract costs include all direct material, subcontract and labor costs and those indirect costs related to contract performance, such as supplies, tool repairs and depreciation. The Company accounts for maintenance and repair services under the guidance of ASC 605 as the services provided relate to construction work. Contract costs incurred to date and expected total contract costs are continuously monitored during the term of the contract. Changes in job performance, job conditions, and estimated profitability arising from contract penalty, change orders and final contract settlements may result in revisions to the estimated profit ability during the contract. These changes, which include contracts with estimated costs in excess of estimated revenues, are recognized as contract costs in the period in which the revisions are determined. Profit incentives are included in revenues when their realization is reasonably assured. At the point the Company anticipates a loss on a contract, the Company estimates the ultimate loss through completion and recognizes that loss in the period in which the loss was identified.
The Company does not provide warranties to customers on a basis customary to the industry, however, customers can claim warranty directly from product manufacturers for defects in equipment or products. Historically, the Company has experienced no warranty claims.
The Company provides various management services to its customers in the PRC based on a negotiated fixed-price contract. The clients usually pay the fees when the services contract is signed and services are rendered. The Company recognizes these services-based revenues from contracts when (i) management services are rendered; (ii) clients recognize the completion of services; and (iii) collectability is reasonably assured. Fees received in advance are recorded as deferred revenue under current liabilities.
| F- 11 |
SINO AGRO FOOD, INC.
NOTES TO CONSOLIDATED FINANCIAL STATEMENTS
FOR THE YEARS ENDED DECEMBER 31, 2013 AND 2012
2.9 COST OF GOODS SOLD AND COST OF SERVICES
Cost of goods sold consists primarily of direct purchase cost of merchandise goods, and related levies. Cost of services consist primarily direct cost and indirect cost incurred to date for development contracts and provision for anticipated losses for development contracts.
2.10 SHIPPING AND HANDLING
Shipping and handling costs related to cost of goods sold are included in general and administrative expenses, which totaled $39,549 and $84,298 for the years ended December 31, 2013 and 2012, respectively.
2.11 ADVERTISING
Advertising costs are included in general and administrative expenses, which totaled $2,365 and $1,973 for the years ended December 31, 2013 and 2012, respectively.
2.12 FOREIGN CURRENCY TRANSLATION AND OTHER COMPREHENSIVE INCOME
The reporting currency of the Company is the U.S. dollar. The functional currency of the Company is the Chinese Renminbi (RMB).
For those entities whose functional currency is other than the U.S. dollar, all assets and liabilities are translated into U.S. dollars at the exchange rate on the balance sheet date; shareholders’ equity is translated at historical rates and items in the statements of income and of cash flows are translated at the average rate for the period. Because cash flows are translated based on the average translation rate, amounts related to assets and liabilities reported in the statements of cash flows will not necessarily agree with changes in the corresponding balances in the balance sheets. Translation adjustments resulting from this process are included in accumulated other comprehensive income in the statements of shareholders’ equity. Transaction gains and losses that arise from exchange rate fluctuations on transactions denominated in a currency other than the functional currency are included in the statements of income and comprehensive income, as incurred.
Accumulated other comprehensive income in the consolidated statement of shareholders’ equity amounted to $6,260,131 as of December 31, 2013 and $3,868,274 as of December 31, 2012. The balance sheet amounts with the exception of equity as of December 31, 2013 and 2012 were translated using an exchange rate of RMB 6.10 to $1.00 and RMB 6.29 to $1.00, respectively. The average translation rates applied to the statements of income and other comprehensive income and of cash flows for the years ended December 31, 2013 and 2012 were RMB 6.19 to $1.00 and RMB 6.31 to $1.00, respectively.
2.13 CASH AND CASH EQUIVALENTS
The Company considers all highly liquid securities with original maturities of three months or less when acquired to be cash equivalents. Cash and cash equivalents kept with financial institutions in the PRC are not insured or otherwise protected. Should any of those institutions holding the Company’s cash become insolvent, or should the Company become unable to withdraw funds for any reason, the Company could lose the cash on deposit with that institution.
2.14 ACCOUNTS RECEIVABLE
The Company maintains reserves for potential credit losses on accounts receivable. Management reviews the composition of accounts receivable and analyzes historical bad debts, customer concentrations, customer credit worthiness, current economic trends and changes in customer payment patterns to evaluate the adequacy of these reserves. Reserves are recorded primarily on a specific identification basis.
| F- 12 |
SINO AGRO FOOD, INC.
NOTES TO CONSOLIDATED FINANCIAL STATEMENTS
FOR THE YEARS ENDED DECEMBER 31, 2013 AND 2012
The standard credit period for most of the Company’s clients is three months. The collection period over 1 year is classified as long-term accounts receivable. Management evaluates the collectability of the receivables at least quarterly. Provision for doubtful accounts as of December 31, 2013 and 2012 are $0.
2.15 INVENTORIES
Inventories are valued at the lower of cost (determined on a weighted average basis) and net realizable value.
Costs incurred in bringing each product to its location and conditions are accounted for as follows:
| (a) | raw materials - purchase cost on a weighted average basis; |
| (b) | manufactured finished goods and work-in-progress - cost of direct materials and labor and a proportion of manufacturing overhead based on normal operation capacity but excluding borrowing costs; and |
| (c) | retail and wholesale merchandise finished goods - purchase cost on a weighted average basis. |
Net realizable value is the estimated selling price in the ordinary course of business, less estimated costs for completion and the estimated costs necessary to make the sale.
2.16 PROPERTY AND EQUIPMENT
Property and equipment are stated at cost less accumulated depreciation and any accumulated impairment losses. Such costs include the cost of replacing parts that are eligible for capitalization when the cost of replacing the parts is incurred. Similarly, when each major inspection is performed, its cost is recognized in the carrying amount of the property and equipment as a replacement only if it is eligible for capitalization. The assets’ residual values, useful lives and depreciation methods are reviewed, and adjusted if appropriate, at each financial year end.
Depreciation is calculated on a straight-line basis over the estimated useful lives of the assets.
| Plant and machinery | 5 - 10 years |
| Structure and leasehold improvements | 10 - 20 years |
| Mature seeds and herbage cultivation | 20 years |
| Furniture and equipment | 2.5 - 10 years |
| Motor vehicles | 5 -10 years |
An item of property and equipment is removed from the accounts upon disposal or when no future economic benefits are expected to arise from the continued use of the asset. Any gain or loss arising on disposal of the asset (calculated as the difference between the net disposal proceeds and the carrying amount of the item) is included in the consolidated statements of income in the period the item is disposed.
2.17 GOODWILL
Goodwill is an asset representing the fair economic benefits arising from other assets acquired in a business combination that are not individually identified or separately recognized. Goodwill is tested for impairment on an annual basis at the end of the Company’s fiscal year, or when impairment indicators arise. The Company uses a fair-value-based approach to test for impairment at the level of each reporting unit. The Company directly acquired MEIJI, which is the holding company of JHST that operates the Hu Plantation. As a result of this acquisition, the Company recorded goodwill in the amount of $724,940. This goodwill represents the fair value of the assets acquired in these acquisitions over the cost of the assets acquired.
| F- 13 |
SINO AGRO FOOD, INC.
NOTES TO CONSOLIDATED FINANCIAL STATEMENTS
FOR THE YEARS ENDED DECEMBER 31, 2013 AND 2012
2.18 PROPRIETARY TECHNOLOGIES
A master license of stock feed manufacturing technology was acquired and the costs of acquisition are capitalized as proprietary technologies when technological feasibility has been established. Cost of acquisition of stock feed manufacturing technology master license is amortized using the straight-line method over its estimated life of 20 years.
An aromatic cattle-feeding formula was acquired and the costs of acquisition are capitalized as proprietary technologies when technological feasibility has been established. Cost of acquisition on aromatic cattle-feeding formula is amortized using the straight-line method over its estimated life of 25 years.
The cost of sleepy cods breeding technology license is capitalized as proprietary technologies when technological feasibility has been established. Cost of granting sleepy cods breeding technology license is amortized using the straight-line method over its estimated life of 25 years.
Bacterial cellulose technology license and related trade mark are capitalized as proprietary technologies when technological feasibility has been established. Cost of license and related trade mark is amortized using the straight-line method over its estimated life of 20 years.
The Company has determined that technological feasibility is established at the time a working model of products is completed. Proprietary technologies are intangible assets of finite lives. Management evaluates the recoverability of proprietary technologies on an annual basis at the end of the Company’s fiscal year, or when impairment indicators arise. As required by ASC Topic 350 “Intangible - Goodwill and Other”, the Company uses a fair-value-based approach to test for impairment.
2.19 CONSTRUCTION IN PROGRESS
Construction in progress represents direct costs of construction as well as acquisition and design fees incurred. Capitalization of these costs ceases and the construction in progress is transferred to property and equipment when substantially all the activities necessary to prepare the assets for their intended use are completed. No depreciation is provided until construction is completed and the asset is ready for its intended use.
2.20 LAND USE RIGHTS
Land use rights represent acquisition of rights to agricultural land from farmers and are amortized on the straight-line basis over their respective lease periods. The lease period of agricultural land is in the range from 10 to 60 years. Land use rights purchase prices were determined in accordance with the PRC Government’s minimum lease payments on agricultural land and mutually agreed to terms between the Company and the vendors.
2.21 CORPORATE JOINT VENTURE
A corporation formed, owned, and operated by two or more businesses as a separate and discrete business or project (venture) for their mutual benefit is considered to be a corporate joint venture. Investee entities, in which the Company can exercise significant influence, but not control, are accounted for under the equity method of accounting. Under the equity method of accounting, the Company’s share of the earnings or losses of these companies is included in net income.
A loss in value of an investment that is other than a temporary decline is recognized as a charge to operations. Evidence of a loss in value might include, but would not necessarily be limited to, the absence of an ability to recover the carrying amount of the investment or inability of the investee to sustain an earnings capacity that would justify the carrying amount of the investment.
2.22 VARIABLE INTEREST ENTITY
A variable interest entity (“VIE”) is an entity (investee) in which the investor has obtained less than a majority interest, according to the Financial Accounting Standards Board (FASB). A VIE is subject to consolidation if a VIE meets one of the following three criteria as elaborated in ASC Topic 810-10, Consolidation:
| F- 14 |
SINO AGRO FOOD, INC.
NOTES TO CONSOLIDATED FINANCIAL STATEMENTS
FOR THE YEARS ENDED DECEMBER 31, 2013 AND 2012
| (a)equity-at-risk is not sufficient to support the entity’s activities; |
| (b)as a group, the equity-at-risk holders cannot control the entity; or |
| (c)the economics do not coincide with the voting interest. |
If a firm is the primary beneficiary of a VIE, the holdings must be disclosed on the balance sheet. The primary beneficiary is defined as the person or company with the majority of variable interests. A corporation formed, owned, and operated by two or more businesses (ventures) as a separate and discrete business or project (venture) for their mutual benefit is defined as a joint venture.
2.23 TREASURY STOCK
Treasury stock means shares of a corporation’s own stock that have been issued and subsequently reacquired by the corporation. Converting outstanding shares to treasury shares does not reduce the number of shares issued but does reduce the number of shares outstanding. These shares are not eligible to receive dividends. Accounting for excesses and deficiencies on treasury stock transactions is governed by ASC 505-30-30.
State laws and federal agencies closely regulate transactions involving a company’s own capital stock, so the purchase of outstanding shares must have a legitimate purpose. Some of the most common reasons for purchasing outstanding shares are as follows:
| (a) to meet additional stock needs for various reasons, including newly implemented stock option plans, stock for convertible bonds or convertible preferred stock, or a stock dividend. |
| (b) to make more shares available for acquisitions of other entities. |
The cost method of accounting for treasury shares has been adopted by the Company. The purchase of outstanding shares and thus converting them into treasury shares is treated as a temporary reduction in shareholders’ equity in view of the expectation to reissue the shares instead of retiring them. When the Company reissues the treasury shares, the temporary account is eliminated. The cost of acquiring outstanding shares for converting into treasury shares is charged to a contra account, in this case a contra equity account that reduces the stockholder equity balance.
2.24 INCOME TAXES
The Company accounts for income taxes under the provisions of ASC Topic 740 “Accounting for Income Taxes.” Under ASC Topic 740, deferred tax assets and liabilities are determined based on the difference between the financial statement carrying amounts and the tax bases of assets and liabilities using enacted tax rates in effect in the years in which the differences are expected to reverse.
The provision for income tax is based on the results for the year as adjusted for items, which are non-assessable or disallowed. It is calculated using tax rates that have been enacted or substantively enacted at the balance sheet date. Deferred tax is accounted for using the balance sheet liability method in respect of temporary differences arising from differences between the carrying amount of assets and liabilities in the financial statements and the corresponding tax basis used in the computation of assessable tax profit. In principle, deferred tax liabilities are recognized for all taxable temporary differences, and deferred tax assets are recognized to the extent that it is probable that taxable profit will be available against which deductible temporary differences can be utilized.
Deferred income taxes are calculated at the tax rates that are expected to apply to the period when the asset is realized or the liability is settled. Deferred tax is charged or credited in the income statement, except when it related to items credited or charged directly to equity, in which case the deferred tax is also dealt with in equity. Deferred tax assets and liabilities are offset when they relate to income taxes levied by the same taxation authority and the Company intends to settle its current tax assets and liabilities on a net basis.
ASC Topic 740 also prescribes a more-likely-than-not threshold for financial statement recognition and measurement of a tax position taken, or for one expected to be taken, in a tax return. ASC Topic 740 also provides guidance related to, among other things, classification, accounting for interest and penalties associated with tax positions, and disclosure requirements. Any interest and penalties accrued related to unrecognized tax benefits will be recorded as tax expense.
| F- 15 |
SINO AGRO FOOD, INC.
NOTES TO CONSOLIDATED FINANCIAL STATEMENTS
FOR THE YEARS ENDED DECEMBER 31, 2013 AND 2012
2.25 POLITICAL AND BUSINESS RISK
The Company’s operations are carried out in the PRC. Accordingly, the political, economic and legal environment in the PRC may influence the Company’s business, financial condition and results of operations by the general state of the PRC’s economy. The Company’s operations in the PRC are subject to specific considerations and significant risks not typically associated with companies in North America and Western Europe. The Company’s results may be adversely affected by changes in governmental policies with respect to laws and regulations, anti-inflationary measures, currency conversion and remittance abroad, and rates and methods of taxation, among other things.
2.26 CONCENTRATION OF CREDIT RISK
Cash includes cash at banks and demand deposits in accounts maintained with banks within the PRC. Total cash in these banks as of December 31, 2013 and 2012 amounted to $1,256,440 and $8,403,458 respectively, none of which is covered by insurance. The Company has not experienced any losses in such accounts and believes it is not exposed to any risks to its cash in bank accounts.
The Company had 5 major customers (A, B, C, D & E) whose business individually represented the following percentages of the Company’s total revenue for the periods indicated:
| 2013 | 2012 | |||||||
| Customer A | 18.09 | % | 32.44 | % | ||||
| Customer B | 15.02 | % | 10.27 | % | ||||
| Customer C | 9.24 | % | 9.69 | % | ||||
| Customer D | 9.14 | % | 6.34 | % | ||||
| Customer E | 8.49 | % | 6.01 | % | ||||
| 59.98 | % | 64.75 | % | |||||
| Percentage of revenue | Amount | |||||||||
| Customer A | Fishery development and Corporate and others division | 18.09 | % | $ | 47,284,512 | |||||
| Customer B | Fishery development and Corporate and others division | 15.02 | % | $ | 39,275,564 | |||||
Accounts receivable are derived from revenue earned from customers located primarily in the PRC. The Company performs ongoing credit evaluations of customers and has not experienced any material losses to date.
| F- 16 |
SINO AGRO FOOD, INC.
NOTES TO CONSOLIDATED FINANCIAL STATEMENTS
FOR THE YEARS ENDED DECEMBER 31, 2013 AND 2012
The Company had 5 major customers whose accounts receivable balance individually represented the following percentages of the Company’s total accounts receivable:
| 2013 | 2012 | |||||||
| Customer A | 12.86 | % | 18.18 | % | ||||
| Customer B | 10.23 | % | 14.32 | % | ||||
| Customer C | 8.69 | % | 11.14 | % | ||||
| Customer D | 8.36 | % | 9.94 | % | ||||
| Customer E | 8.27 | % | 8.23 | % | ||||
| 48.41 | % | 61.81 | % | |||||
As of December 31, 2013, amounts due from customers A and B are $10,546,704 and $8,387,732, respectively. The Company has not experienced any significant difficulty in collecting its accounts receivable in the past and is not aware of any financial difficulties of its major customers.
2.27 IMPAIRMENT OF LONG-LIVED ASSETS AND INTANGIBLE ASSETS
In accordance with ASC Topic 360, “Property, Plant and Equipment,” long-lived assets to be held and used are analyzed for impairment whenever events or changes in circumstances indicate that the related carrying amounts may not be recoverable. The Company reviews the carrying amount of its long-lived assets, including intangibles, for impairment, each reporting period. An asset is considered impaired when estimated future cash flows are less than the carrying amount of the asset. In the event the carrying amount of such asset is considered not recoverable, the asset is adjusted to its fair value. Fair value is generally determined based on discounted future cash flow. As of December 31, 2013 and 2012, the Company determined no impairment losses were necessary.
2.28 EARNINGS PER SHARE
As prescribed in ASC Topic 260 “Earnings per Share, ” Basic Earnings per Share (“EPS”) is computed by dividing net income available to common stockholders by the weighted average number of common stock shares outstanding during the year. Diluted EPS is computed by dividing net income available to common stockholders by the weighted-average number of common stock shares outstanding during the year plus potential dilutive instruments such as stock options and warrants. The effect of stock options on diluted EPS is determined through the application of the treasury stock method, whereby proceeds received by the Company based on assumed exercises are hypothetically used to repurchase the Company’s common stock at the average market price during the period.
For the years ended December 31, 2013 and 2012, basic earnings per share attributable to Sino Agro Food, Inc. and subsidiaries common stockholders amount to $6.14 and $6.95 respectively. For the years ended December 31, 2013 and 2012, diluted earnings per share attributable to Sino Agro Food, Inc. and its subsidiaries’ common stockholders amounted to $5.76 and $6.19, respectively
2.29 ACCUMULATED OTHER COMPREHENSIVE INCOME
ASC Topic 220 “Comprehensive Income” establishes standards for reporting and displaying comprehensive income and its components in financial statements. Comprehensive income is defined as the change in stockholders’ equity of a business enterprise during a period from transactions and other events and circumstances from non-owner sources. The comprehensive income for all periods presented includes both the reported net income and net change in cumulative translation adjustments.
2.30 RETIREMENT BENEFIT COSTS
PRC state managed retirement benefit programs are defined contribution plans and the payments to the plans are charged as expenses when employees have rendered service entitling them to the contribution made by the employer.
2.31 STOCK-BASED COMPENSATION
The Company has adopted both ASC Topic 718, “Compensation - Stock Compensation” and ASC Topic 505-50, “Equity-Based Payments to Non- Employees” using the fair value method in which an entity issues its equity instruments to acquire goods and services from employees and non-employees. Stock compensation for stock granted to non-employees has been determined in accordance with this accounting standard and the accounting standard regarding accounting for equity instruments that are issued to other than employees for acquiring, or in conjunction with selling goods or services, as the fair value of the consideration received or the fair value of equity instruments issued, whichever is more reliably measured. This accounting standard allows the “simplified” method to determine the term of employee options when other information is not available. Under ASC Topic 718 and ASC Topic 505-50, stock compensation expenses is measured at the grant date on the value of the option or restricted stock and is recognized as expenses, less expected forfeitures, over the requisite service period, which is generally the vesting period.
| F- 17 |
SINO AGRO FOOD, INC.
NOTES TO CONSOLIDATED FINANCIAL STATEMENTS
FOR THE YEARS ENDED DECEMBER 31, 2013 AND 2012
2.32 FAIR VALUE OF FINANCIAL INSTRUMENTS
The Company follows paragraph 825-10-50-10 of the FASB Accounting Standards Codification for disclosures about fair value of its financial instruments and paragraph 820-10-35-37 of the FASB Accounting Standards Codification (“Paragraph 820-10-35-37”) to measure the fair value of its financial instruments. Paragraph 820-10-35-37 establishes a framework for measuring fair value under U.S. GAAP, and expands disclosures about fair value measurements. To increase consistency and comparability in fair value measurements and related disclosures, Paragraph 820-10-35-37 establishes a fair value hierarchy, which prioritizes the inputs to valuation techniques used to measure fair value into three (3) broad levels. The fair value hierarchy gives the highest priority to quoted prices (unadjusted) in active markets for identical assets or liabilities and the lowest priority to unobservable inputs. The three (3) levels of fair value hierarchy defined by Paragraph 820-10-35-37 are described below:
| Level 1 Quoted market prices available in active markets for identical assets or liabilities as of the reporting date. |
| Level 2 Pricing inputs other than quoted prices in active markets included in Level 1, which are either directly or indirectly observable as of the reporting date. |
| Level 3 Pricing inputs that are generally observable inputs and not corroborated by market data. |
The carrying amounts of the Company’s financial assets and liabilities, such as cash and accrued expenses, approximate their fair values because of the short maturity of these instruments. The Company does not have any assets or liabilities measured at fair value on a recurring or a non-recurring basis, consequently, the Company did not have any fair value adjustments for assets and liabilities measured at fair value as of December 31, 2013 or 2012, nor gains or losses are reported in the statements of income and comprehensive income that are attributable to the change in unrealized gains or losses relating to those assets and liabilities still held at the reporting date for the fiscal year ended December 31, 2013 or 2012.
2.33 NEW ACCOUNTING PRONOUNCEMENTS
The Company does not expect any recent accounting pronouncements to have a material effect on the Company’s financial position, results of operations, or cash flows.
In July 2012, the FASB issued Accounting Standards Update ASU 2012-02, the amendments to ASC 350, Intangibles-Goodwill and Other: Testing Indefinite-Lived Intangible Assets for Impairment (“ASU 2012-02”). The amendments apply to all entities, both public and nonpublic, that have indefinite-lived intangible assets, other than goodwill, reported in their financial statements. In accordance with the amendments an entity has the option first to assess qualitative factors to determine whether the existence of events and circumstances indicates that it is more likely than not that the indefinite-lived intangible asset is impaired. If, after assessing the totality of events and circumstances, an entity concludes that it is not more likely than not that the indefinite-lived intangible asset is impaired, then the entity is not required to take further action. However, if an entity concludes otherwise, then it is required to determine the fair value of the indefinite-lived intangible asset and perform the quantitative impairment test by comparing the fair value with the carrying amount in accordance with Subtopic 350-30. An entity also has the option to bypass the qualitative assessment for any indefinite-lived intangible asset in any period and proceed directly to performing the quantitative impairment test. An entity will be able to resume performing the qualitative assessment in any subsequent period. The amendments are effective for annual and interim impairment tests performed for fiscal years beginning after September 15, 2012, and early adoption is permitted. The Company will apply these amendments for reporting periods beginning after December 31, 2012. The Company does not expect the adoption of the amendments to have a material impact on the consolidated financial statements.
| F- 18 |
SINO AGRO FOOD, INC.
NOTES TO CONSOLIDATED FINANCIAL STATEMENTS
FOR THE YEARS ENDED DECEMBER 31, 2013 AND 2012
In February 2013, the FASB issued guidance on disclosure requirements for items reclassified out of Accumulated Other Comprehensive Income (“AOCI”). This new guidance requires entities to present (either on the face of the income statements or in the notes) the effects on the line items of the income statement for amounts reclassified out of AOCI. The new guidance will be effective for us beginning July 1, 2013. Other than requiring additional disclosures, we do not anticipate a material impact on the consolidated financial statements upon adoption.
In March 2013, the FASB issued guidance on a parent’s accounting for the cumulative translation adjustment upon derecognition of a subsidiary or group of assets within a foreign entity. This new guidance requires that the parent releases any related cumulative translation adjustment into net income only if the sale or transfer results in the complete or substantially complete liquidation of the foreign entity in which the subsidiary or group of assets had resided. The new guidance will be effective for us beginning July 1, 2014. We do not anticipate a material impact on the consolidated financial statements upon adoption.
In July 2013, the FASB issued ASU 2013-11, “Presentation of an Unrecognized Tax Benefit When a Net Operating Loss Carry forward, a Similar Tax Loss, or a Tax Credit Carry forward Exists”. These amendments provide that an unrecognized tax benefit, or a portion thereof, should be presented in the financial statements as a reduction to a deferred tax asset for a net operating loss carryforward, a similar tax loss, or a tax credit carry forward, except to the extent that a net operating loss carry forward, a similar tax loss, or a tax credit carry forward is not available at the reporting date to settle any additional income taxes that would result from disallowance of a tax position, or the tax law does not require the entity to use, and the entity does not intend to use, the deferred tax asset for such purpose, then the unrecognized tax benefit should be presented as a liability. For public entities, the amendments are effective for fiscal years, and interim periods within those years, beginning after December 15, 2013. The adoption of ASU 2013-11 is not expected to have a material impact on the Company’s consolidated financial statements.
Other accounting standards that have been issued or proposed by FASB that do not require adoption until a future date are not expected to have a material impact on the consolidated financial statements upon adoption.
3. SEGMENT INFORMATION
The Company establishes standards for reporting information about operating segments on a basis consistent with the Company’s internal organization structure as well as business segments and major customers in consolidated financial statements. The Company operates in four principal reportable segments: Fishery Development Division, and HU Plantation Division and Organic Fertilizer and Bread Grass Division, and Cattle Development Division. No geographic information is required as all revenue and assets are located in the PRC.
| 2013 | ||||||||||||||||||||||||
| Organic | ||||||||||||||||||||||||
| Fishery | HU | Fertilizer and | Cattle Farm | |||||||||||||||||||||
| Development | Plantation | Bread Grass | Development | Corporate and | ||||||||||||||||||||
| Division (1) | Division (2) | Division (3) | Division (4) | others (5) | Total | |||||||||||||||||||
| Revenue | $ | 109,059,105 | $ | 22,814,476 | $ | 73,718,075 | $ | 24,792,014 | $ | 31,042,143 | $ | 261,425,813 | ||||||||||||
| Net income (loss) | $ | 40,267,690 | 8,894,028 | $ | 14,302,266 | $ | 4,717,736 | $ | 6,024,809 | $ | 74,206,529 | |||||||||||||
| Total assets | $ | 96,033,450 | $ | 49,831,925 | $ | 156,141,447 | $ | 46,428,738 | $ | 19,079,371 | $ | 367,514,931 | ||||||||||||
| F- 19 |
SINO AGRO FOOD, INC.
NOTES TO CONSOLIDATED FINANCIAL STATEMENTS
FOR THE YEARS ENDED DECEMBER 31, 2013 AND 2012
| 2012 | ||||||||||||||||||||||||
| Fishery Development Division (1) | HU Plantation Division (2) | Organic Fertilizer and Bread Grass Division (3) | Cattle Farm Development Division (4) | Corporate and others (5) | Total | |||||||||||||||||||
| (Restated) | (Restated) | (Restated) | ||||||||||||||||||||||
| Revenue | $ | 81,383,568 | $ | 11,878,599 | $ | 23,347,564 | $ | 17,038,001 | $ | 4,965,907 | $ | 138,613,639 | ||||||||||||
| Net income (loss) | $ | 39,150,568 | $ | 6,245,281 | $ | 3,875,609 | $ | 9,058,822 | $ | (784,448 | ) | $ | 57,545,832 | |||||||||||
| Total assets | $ | 79,222,788 | $ | 36,792,718 | $ | 96,282,055 | $ | 28,265,035 | $ | 2,536,382 | $ | 243,098,978 | ||||||||||||
Note
| (1) | Operated by Capital Award, Inc. (“CA”) and Jiangmen City A Power Fishery Development Co., Limited (“JFD”). |
| (2) | Operated by Jiangmen City Heng Sheng Tai Agriculture Development Co., Limited (“JHST”). | |
| (3) | Operated by Qinghai Sanjiang A Power Agriculture Co., Limited (“SJAP”), A Power Agro Agriculture Development (Macau) Limited (“APWAM”) and Hunan Shenghua A Power Agriculture Co., Limited (“HSA”). |
| (4) | Operated by Jiangmen City Hang Mei Cattle Farm Development Co. Limited (“JHMC”) and Macau Meiji Limited (“MEIJI”). |
| (5) | Operated by Sino Agro Food, Inc. (“SIAF”) and Sino Agro Food Sweden AB (publ) (“SAFS”). |
Further analysis of revenue:-
| 2013 | ||||||||||||||||||||||||
| Name of entity | Fishery Development Division (1) | HU Plantation Division (2) | Organic Fertilizer and Bread Grass Division (3) | Cattle Farm Development Division (4) | Corporate and others (6) | Total | ||||||||||||||||||
| Sale of goods | ||||||||||||||||||||||||
| Capital Award, Inc. (“CA”) | $ | 72,362,980 | $ | - | $ | - | $ | - | $ | - | $ | 72,362,980 | ||||||||||||
| Jiang Men City Heng Sheng Tai Agriculture Development Co., Limited (“JHST”) | - | 22,814,476 | - | - | - | $ | 22,814,476 | |||||||||||||||||
| Hunan Shenghua A Power Agriculture Co., Limited (“HSA”) | - | - | 11,490,395 | - | - | 11,490,395 | ||||||||||||||||||
| Qinghai Sanjiang A Power Agriculture Co., Limited (“SJAP”) | - | - | 62,227,680 | - | - | 62,227,680 | ||||||||||||||||||
| Macau Eiji Company Limited (“MEIJI”) | - | - | - | 17,671,418 | - | 17,671,418 | ||||||||||||||||||
| Sino Agro Food, Inc. (“SIAF”) | - | - | - | - | 22,047,092 | 22,047,092 | ||||||||||||||||||
| Consulting and service income for development contracts | ||||||||||||||||||||||||
| Capital Award, Inc. (“CA”) | 35,259,211 | - | - | - | - | 35,259,211 | ||||||||||||||||||
| Macau Eiji Company Limited (“MEIJI”) | - | - | - | 7,120,596 | - | 7,120,596 | ||||||||||||||||||
| Sino Agro Food, Inc. (“SIAF”) | - | - | - | - | 8,799,503 | 8,799,503 | ||||||||||||||||||
| Commission and management fee | ||||||||||||||||||||||||
| Capital Award, Inc. (“CA”) | 1,436,914 | - | - | - | - | 1,436,914 | ||||||||||||||||||
| Macau Eiji Company Limited (“MEIJI”) | - | - | - | - | - | - | ||||||||||||||||||
| Sino Agro Food, Inc. (“SIAF”) | - | - | - | - | 195,548 | 195,548 | ||||||||||||||||||
| $ | 109,059,105 | $ | 22,814,476 | $ | 73,718,075 | $ | 24,792,014 | $ | 31,042,143 | $ | 261,425,813 | |||||||||||||
| F- 20 |
SINO AGRO FOOD, INC.
NOTES TO CONSOLIDATED FINANCIAL STATEMENTS
FOR THE YEARS ENDED DECEMBER 31, 2013 AND 2012
| 2012 (Restated) | ||||||||||||||||||||||||
| Name of entity | Fishery Development Division (1) | HU Plantation Division (2) | Organic Fertilizer and Bread Grass Division (3) | Cattle Farm Development Division (4) | Corporate and others (6) | Total | ||||||||||||||||||
| Sale of goods | ||||||||||||||||||||||||
| Capital Award, Inc. (“CA”) | $ | 45,189,788 | $ | - | $ | - | $ | - | $ | - | $ | 45,189,788 | ||||||||||||
| Jiang Men City Heng Sheng Tai Agriculture Development Co., Limited (“JHST”) | - | 11,878,599 | - | - | - | 11,878,599 | ||||||||||||||||||
| Hunan Shenghua A Power Agriculture Co., Limited (“HSA”) | - | - | 2,213,038 | - | - | 2,213,038 | ||||||||||||||||||
| Qinghai Sanjiang A Power Agriculture Co., Limited (“SJAP”) | - | - | 21,134,526 | - | - | 21,134,526 | ||||||||||||||||||
| Macau Eiji Company Limited (“MEIJI”) | - | - | - | 5,957,870 | - | 5,957,870 | ||||||||||||||||||
| Sino Agro Food, Inc. (“SIAF”) | - | - | - | - | 1,698,506 | 1,698,506 | ||||||||||||||||||
| Consulting and service income for development contracts | ||||||||||||||||||||||||
| Capital Award, Inc. (“CA”) | 35,471,383 | - | - | - | - | 35,471,383 | ||||||||||||||||||
| Macau Eiji Company Limited (“MEIJI”) | - | - | - | 10,930,131 | - | 10,930,131 | ||||||||||||||||||
| Sino Agro Food, Inc. (“SIAF”) | - | - | - | - | 3,267,401 | 3,267,401 | ||||||||||||||||||
| Commission and management fee | ||||||||||||||||||||||||
| Capital Award, Inc. (“CA”) | 722,397 | - | - | - | - | 722,397 | ||||||||||||||||||
| Macau Eiji Company Limited (“MEIJI”) | - | - | - | 150,000 | - | 150,000 | ||||||||||||||||||
| Sino Agro Food, Inc. (“SIAF”) | - | - | - | - | - | - | ||||||||||||||||||
| $ | 81,383,568 | $ | 11,878,599 | $ | 23,347,564 | $ | 17,038,001 | $ | 4,965,907 | $ | 138,613,639 | |||||||||||||
| F- 21 |
SINO AGRO FOOD, INC.
NOTES TO CONSOLIDATED FINANCIAL STATEMENTS
FOR THE YEARS ENDED DECEMBER 31, 2013 AND 2012
Further analysis of cost of goods sold and cost of services:-
COST OF GOODS SOLD
| 2013 | ||||||||||||||||||||||||
| Name of entity | Fishery Development Division (1) | HU Plantation Division (2) | Organic Fertilizer and Bread Grass Division (3) | Cattle Farm Development Division (4) | Corporate and others (5) | Total | ||||||||||||||||||
| Sale of goods | ||||||||||||||||||||||||
| Capital Award, Inc. (“CA”) | $ | 51,470,476 | $ | - | $ | - | $ | - | $ | - | $ | 51,470,476 | ||||||||||||
| Jiang Men City Heng Sheng Tai Agriculture Development Co., Limited (“JHST”) | - | 10,101,512 | - | - | - | 10,101,512 | ||||||||||||||||||
| Hunan Shenghua A Power Agriculture Co., Limited (“HSA”) | - | - | 7,040,470 | - | - | 7,040,470 | ||||||||||||||||||
| Qinghai Sanjiang A Power Agriculture Co., Limited (“SJAP”) | - | - | 38,411,418 | - | - | 38,411,418 | ||||||||||||||||||
| Macau Eiji Company Limited (“MEIJI”) | - | - | - | 13,161,262 | - | 13,161,262 | ||||||||||||||||||
| Sino Agro Food, Inc. (“SIAF”) | - | - | - | - | 19,160,917 | 19,160,917 | ||||||||||||||||||
| $ | 51,470,476 | $ | 10,101,512 | $ | 45,451,888 | $ | 13,161,262 | $ | 19,160,917 | $ | 139,346,055 | |||||||||||||
| F- 22 |
SINO AGRO FOOD, INC.
NOTES TO CONSOLIDATED FINANCIAL STATEMENTS
FOR THE YEARS ENDED DECEMBER 31, 2013 AND 2012
COST OF SERVICES
| 2013 | ||||||||||||||||||||||||
| Name of entity | Fishery Development Division (1) | HU Plantation Division (2) | Organic Fertilizer and Bread Grass Division (3) | Cattle Farm Development Division (4) | Corporate and others (5) | Total | ||||||||||||||||||
| Consulting and service income for development contracts | ||||||||||||||||||||||||
| Capital Award, Inc. (“CA”) | $ | 13,197,048 | $ | - | $ | - | $ | - | $ | - | $ | 13,197,048 | ||||||||||||
| Macau Eiji Company Limited (“MEIJI”) | - | - | - | 4,733,262 | - | 4,733,262 | ||||||||||||||||||
| Sino Agro Food, Inc. (“SIAF”) | - | - | - | - | 2,618,298 | 2,618,298 | ||||||||||||||||||
| $ | 13,197,048 | $ | - | $ | - | $ | 4,733,262 | $ | 2,618,298 | $ | 20,548,608 | |||||||||||||
Further analysis of cost of goods sold and cost of services:-
COST OF GOODS SOLD
| 2012 (Restated) | ||||||||||||||||||||||||
| Name of entity | Fishery Development Division (1) | HU Plantation Division (2) | Organic Fertilizer and Bread Grass Division (3) | Cattle Farm Development Division (4) | Corporate and others (6) | Total | ||||||||||||||||||
| Sale of goods | ||||||||||||||||||||||||
| Capital Award, Inc. (“CA”) | $ | 23,512,812 | $ | - | $ | - | $ | - | $ | - | $ | 23,512,812 | ||||||||||||
| Jiang Men City Heng Sheng Tai Agriculture Development Co., Limited (“JHST”) | - | 5,035,955 | - | - | - | 5,035,955 | ||||||||||||||||||
| Hunan Shenghua A Power Agriculture Co., Limited (“H SA”) | - | - | 1,723,031 | - | - | 1,723,031 | ||||||||||||||||||
| Qinghai Sanjiang A Power Agriculture Co., Limited (“SJAP”) | - | - | 14,574,772 | - | - | 14,574,772 | ||||||||||||||||||
| Macau Eiji Company Limited (“MEIJI”) | - | - | - | 4,613,074 | - | 4,613,074 | ||||||||||||||||||
| Sino Agro Food, Inc. (“SIAF”) | - | - | - | - | 1,098,870 | 1,098,870 | ||||||||||||||||||
| $ | 23,512,812 | $ | 5,035,955 | $ | 16,297,803 | $ | 4,613,074 | $ | 1,098,870 | $ | 50,558,514 | |||||||||||||
| F- 23 |
SINO AGRO FOOD, INC.
NOTES TO CONSOLIDATED FINANCIAL STATEMENTS
FOR THE YEARS ENDED DECEMBER 31, 2013 AND 2012
COST OF SERVICES
| 2012 | ||||||||||||||||||||||||
| Name of entity | Fishery Development Division (1) | HU Plantation Division (2) | Organic Fertilizer and Bread Grass Division (3) | Cattle Farm Development Division (4) | Corporate and others (6) | Total | ||||||||||||||||||
| Consulting and service income for development contracts | ||||||||||||||||||||||||
| Capital Award, Inc. (“CA”) | $ | 14,340,937 | $ | - | $ | - | $ | - | $ | - | $ | 14,340,937 | ||||||||||||
| Macau Eiji Company Limited (“MEIJI”) | - | - | - | 2,998,343 | - | 2,998,343 | ||||||||||||||||||
| Sino Agro Food, Inc. (“SIAF”) | - | - | - | - | 909,677 | 909,677 | ||||||||||||||||||
| $ | 14,340,937 | $ | - | $ | - | $ | 2,998,343 | $ | 909,677 | $ | 18,248,957 | |||||||||||||
4. DIVIDEND
On December 6, 2012, the Company’s Board of Directors has declared cash dividend on its Common Stock, payable in the amount of $0..99 for every one share issued and outstanding as of December 26, 2012, with a distribution date of January 15, 2013.
| 2013 | 2012 | |||||||
| Cash dividend | ||||||||
| Nil (2012: 9,609,165 outstanding shares at $0.099) | $ | - | $ | 951,307 | ||||
5. INCOME TAXES
United States of America
The Company was incorporated in the State of Nevada, in the United States of America. The Company has no trading operations in United States of America and no US corporate tax has been provided for in the consolidated financial statements of the Company.
Undistributed Earnings of Foreign Subsidiaries
The Company intends to use the remaining accumulated and future earnings of foreign subsidiaries to expand operations outside the United States and accordingly, undistributed earnings of foreign subsidiaries are considered to be indefinitely reinvested outside the United States and no provision for U.S. Federal and State income tax or applicable dividend distribution tax has been provided thereon.
The Company fails to file US tax returns for the years ended December 31, 2007 through December 31, 2013 in compliance with US Treasury Internal Revenue Service Code. The Company reviews tax position with the assistance US tax professional and believes that there will be no taxes and no penalties assessed by the Internal Revenue Service in the United States of America. The Company has appointed US tax professional to assist the Company to file these income tax returns.
| F- 24 |
SINO AGRO FOOD, INC.
NOTES TO CONSOLIDATED FINANCIAL STATEMENTS
FOR THE YEARS ENDED DECEMBER 31, 2013 AND 2012
China
Beginning January 1, 2008, the new Enterprise Income Tax (“EIT”) law replaced the existing laws for Domestic Enterprises (“DE’s”) and Foreign Invested Enterprises (“FIE’s”). The new standard EIT rate of 25% replaced the 33% rate currently applicable to both DE’s and FIE’s. The Company is currently evaluating the impact that the new EIT will have on its financial condition. Beginning January 1, 2008, China unified the corporate income tax rule on foreign invested enterprises and domestic enterprises. The unified corporate income tax rate is 25%.
Under new tax legislation in China beginning in January 2008, the agriculture, dairy and fishery sectors are exempt from enterprise income taxes.
No EIT has been provided in the financial statements of SIAF, CA, JHST, JHMC, JFD, HSA and SJAP since they are exempt from EIT for the years ended December 31, 2013 and 2012 as they are within the agriculture, dairy and fishery sectors.
Belize
CA, CS and CH are international business companies incorporated in Belize, and are exempt from corporate tax in Belize.
Hong Kong
No Hong Kong profits tax has been provided in the consolidated financial statements of TRW, since these entities did not earn any assessable profits arising in Hong Kong for the years ended December 31, 2013 and 2012.
Macau
No Macau Corporate income tax has been provided in the consolidated financial statements of APWAM and MEIJI since these entities did not earn any assessable profits for the years ended December 31, 2013 and 2012.
Sweden
No Sweden Corporate income tax has been provided in the consolidated financial statements of SAFS since SAFS incurred a tax loss for the period from November 12, 2013 (date of registration) to December 31, 2013.
No deferred tax assets and liabilities are of December 31, 2013 and 2012 since there was no difference between the financial statements carrying amounts and the tax bases of assets and liabilities using enacted tax rates in effect in the period in which the differences are expected to reverse.
Provision for income taxes is as follows:
| 2013 | 2012 | |||||||
| SIAF | $ | - | $ | - | ||||
| SAFS | - | - | ||||||
| TRW | - | - | ||||||
| MEIJI and APWAM | - | - | ||||||
| JHST, JFD, JHMC, SJAP and HSA | - | - | ||||||
| $ | - | $ | - |
The Company did not recognize any interest or penalties related to unrecognized tax benefits in the years ended December 31, 2013 and 2012. The Company had no uncertain positions that would necessitate recording of tax related liability. The Company is subject to examination by the respective tax authorities.
| F- 25 |
SINO AGRO FOOD, INC.
NOTES TO CONSOLIDATED FINANCIAL STATEMENTS
FOR THE YEARS ENDED DECEMBER 31, 2013 AND 2012
6. CASH AND CASH EQUIVALENTS
| 2013 | 2012 | |||||||
| Cash and bank balances | $ | 1,327,274 | $ | 8,424,265 | ||||
7. INVENTORIES
As of December 31, 2013, inventories are as follows:
| 2013 | 2012 | |||||||
| Sleepy cods, prawns, eels and marble goble | $ | 1,761,111 | 4,612,090 | |||||
| Bread grass | 580,955 | 1,473,653 | ||||||
| Beef cattle | 1,951,962 | 2,569,659 | ||||||
| Organic fertilizer | 895,670 | 737,166 | ||||||
| Forage for cattle and consumable | 684,979 | 278,900 | ||||||
| Raw materials for bread grass and organic fertilizer | 855,493 | 6,765,536 | ||||||
| Immature seeds | 698,704 | 677,751 | ||||||
| Harvested HU plantation | 719,329 | - | ||||||
| 8,148,203 | 17,114,755 | |||||||
8. DEPOSITS AND PREPAID EXPENSES
| 2013 | 2012 | |||||||
| Deposits for | ||||||||
| - purchases of equipment | $ | 4,886,048 | $ | 318,192 | ||||
| - acquisition of land use rights | 7,826,508 | 7,826,508 | ||||||
| - inventories purchases | 9,771,383 | 2,228,854 | ||||||
| - aquaculture contract | - | 7,062,600 | ||||||
| - building materials | 1,281,935 | 2,000,000 | ||||||
| - proprietary technologies | 4,404,210 | 2,254,839 | ||||||
| - construction in progress | 23,021,316 | 14,423,021 | ||||||
| Miscellaneous | - | 4,892,258 | ||||||
| Shares issued for employee compensation and overseas professional fee | 100,308 | 271,800 | ||||||
| $ | 51,291,708 | $ | 41,278,072 | |||||
Miscellaneous represents the value of the shares of the Company held by the custodian for convertible notes, rental and utility deposits, and deposits for sundries purchases and sundries prepaid expenses.
9. ACCOUNTS RECEIVABLE
The Company has performed an analysis on all of its accounts receivable and determined that all amounts are collectible by the Company. As such, all accounts receivable are reflected as a current asset and no allowance for bad debt has been recorded as of December 31, 2013 and 2012. Bad debts written off for the years ended December 31, 2013 and 2012 are $0.
Aging analysis of accounts receivable is as follows:
| 2013 | 2012 | |||||||
| 0 - 30 days | $ | 20,864,404 | $ | 10,813,981 | ||||
| 31 - 90 days | 28,960,582 | 27,784,784 | ||||||
| 91 - 120 days | 23,941,294 | 6,866,842 | ||||||
| over 120 days and less than 1 year | 8,291,662 | 7,482,743 | ||||||
| over 1 year | - | - | ||||||
| $ | 82,057,942 | $ | 52,948,350 | |||||
| F- 26 |
SINO AGRO FOOD, INC.
NOTES TO CONSOLIDATED FINANCIAL STATEMENTS
FOR THE YEARS ENDED DECEMBER 31, 2013 AND 2012
10. OTHER RECEIVABLES
| 2013 | 2012 | |||||||
| Cash advance paid as consideration to acquire investments | $ | - | $ | 4,657,728 | ||||
| Advanced to employees | 109,278 | 166,722 | ||||||
| Advanced to suppliers | 3,673,493 | 205,088 | ||||||
| Miscellaneous | 924,710 | |||||||
| $ | 3,782,771 | $ | 5,954,248 | |||||
Cash advances paid as consideration to acquire investments represent deposits made for potential future investments. These payments are temporary and refundable because the projects development of respective entities have not been fully completed so as to provide full details of information to allow us to complete accurate feasibility analysis. Advanced to employees and suppliers are unsecured, interest free and without fixed term of repayment.
11. PLANT AND EQUIPMENT
| 2013 | 2012 | |||||||
| Plant and machinery | $ | 5,263,933 | $ | 3,681,644 | ||||
| Structure and leasehold improvements | 36,308,860 | 15,446,062 | ||||||
| Mature seeds and herbage cultivation | 6,294,372 | 1,369,626 | ||||||
| Furniture and equipment | 391,608 | 212,479 | ||||||
| Motor vehicles | 765,858 | 277,513 | ||||||
| 49,024,631 | 20,987,324 | |||||||
| Less: Accumulated depreciation | (2,537,573 | ) | (1,041,022 | ) | ||||
| Net carrying amount | $ | 46,487,058 | $ | 19,946,302 | ||||
Depreciation expense was $1,496,551and $443,361 for the years ended December 31, 2013 and 2012, respectively.
12. CONSTRUCTION IN PROGRESS
| 2013 | 2012 | |||||||
| Construction in progress | ||||||||
| - Oven room for production of dried flowers | $ | - | $ | 828,905 | ||||
| - Office, warehouse and organic fertilizer plant in HSA | 22,761,164 | 10,450,518 | ||||||
| - Organic fertilizer and bread grass production plant and office building | 8,600,187 | 7,921,105 | ||||||
| - Rangeland for beef cattle and office building | 26,054,582 | 5,291,982 | ||||||
| - Fish pond | 1,718,799 | - | ||||||
| $ | 59,134,732 | $ | 24,492,510 | |||||
13. LAND USE RIGHTS
Private ownership of agricultural land is not permitted in the PRC. Instead, the Company has leased six lots of land. The cost of the first lot of land use rights acquired in 2007 in Guangdong Province was $6,408,289 and consists of 180.23 acres with the lease expiring in 2067. The cost of the second lot of land use rights acquired in 2008 in Guangdong Province was $764,128, which consists of 31.84 acres with the lease expiring in 2068. The cost of the third lot of land use rights acquired in 2011 was $12,040,571, which consists of 93.64 acres in Guangdong Province, with the lease expires in 2037. The cost of the fourth lot of land use rights acquired in 2011 was $35,405,750 which consisted of 287.21 acres in the Hunan Province, PRC and the leases expire in 2051, 2054 and 2071. The cost of the fifth lot of land use rights acquired in 2012 was $528,240 which consisted of 21.09 acres in Qinghai Province, PRC and the lease expires in 2051. The cost of the sixth lot of land use rights acquired in 2013 was $489,904 which consisted of 6.27 acres in Guangdong Province, the PRC and the lease expires in 2023.
| F- 27 |
SINO AGRO FOOD, INC.
NOTES TO CONSOLIDATED FINANCIAL STATEMENTS
FOR THE YEARS ENDED DECEMBER 31, 2013 AND 2012
| 2013 | 2012 | |||||||
| Cost | $ | 65,192,615 | $ | 58,630,950 | ||||
| Less: Accumulated amortization | (4,486,786 | ) | (2,897,704 | ) | ||||
| Net carrying amount | $ | 60,705,829 | $ | 55,733,246 | ||||
| Expiry date | Location | Amount | ||||||||
| Balance @1.1.2012 | $ | 57,845,573 | ||||||||
| Additions: | ||||||||||
| 2012 | 2051 | Xining city, Qinghai Province, the P.R.C. | 528,240 | |||||||
| Exchange difference | 257,137 | |||||||||
| Balance @12.31.2012 | 58,630,950 | |||||||||
| Additions: | ||||||||||
| 2013 | 2023 | Enping city, Guangdong Province, the P.R.C. | 489,904 | |||||||
| 2013 | Land improvement cost incurred | 3,914,275 | ||||||||
| Exchange difference | 2,157,486 | |||||||||
| Balance @12.31.2013 | $ | 65,192,615 | ||||||||
Land use rights are amortized on the straight-line basis over their respective lease periods. The lease period of agriculture land is 30 to 60 years. Amortization of land use rights was $1,589,082 and $1,599,600 for the years ended December 31, 2013 and 2012, respectively.
14. PROPRIETARY TECHNOLOGIES
By an agreement dated November 12, 2008, TRW acquired an enzyme technology master license, registered under a Chinese patent, for the manufacturing of livestock feed and bioorganic fertilizer and its related labels for $8,000,000. On March 6, 2012, MEIJI acquired an aromatic-feed formula technology for the production of aromatic cattle for $1,500,000. On October 1, 2013, SIAF was granted a license to exploit sleepy cods breeding technology license for to grow out sleepy cods for $2,270,968 for 50 years. SJAP booked bacterial cellulose technology license and related trademark for $2,119,075 and amortized expenditures for 20 years starting from January 1, 2014.
| 2013 | 2012 | |||||||
| Cost | $ | 13,896,168 | $ | 9,512,258 | ||||
| Less: Accumulated amortization | (1,814,698 | ) | (1,397,634 | ) | ||||
| Net carrying amount | $ | 12,081,470 | $ | 8,114,624 | ||||
Amortization of proprietary technologies was $417,064 and $375,309 for the years ended December 31, 2013 and 2012, respectively. No impairments of proprietary technologies have been identified for the years ended December 31, 2013 and 2012.
15. GOODWILL
Goodwill represents the fair value of the assets acquired the acquisitions over the cost of the assets acquired. It is stated at cost less accumulated impairment losses. Management tests goodwill for impairment on an annual basis or when impairment indicators arise. In these instances, the Company recognizes an impairment loss when it is probable that the estimated cash flows are less than the carrying value of the assets. To date, no such impairment loss has been recorded.
| F- 28 |
SINO AGRO FOOD, INC.
NOTES TO CONSOLIDATED FINANCIAL STATEMENTS
FOR THE YEARS ENDED DECEMBER 31, 2013 AND 2012
| 2013 | 2012 | |||||||
| Goodwill from acquisition | $ | 724,940 | $ | 724,940 | ||||
| Less: Accumulated impairment losses | - | - | ||||||
| Net carrying amount | $ | 724,940 | $ | 724,940 | ||||
| 16. | TEMPORARY DEPOSITS PAID TO ENTITIES FOR EQUITY INVESTMENTS IN FUTURE SINO JOINT VENTURE COMPANIES |
| Intended | ||||||||||||
| unincorporated | Projects | |||||||||||
| investee | engaged | 2013 | 2012 | |||||||||
| A | Trade center | * | $ | 4,086,941 | $ | - | ||||||
| A | Seafood center | * | 1,032,914 | - | ||||||||
| B | Fish Farm 2 Gao Qiqiang Aquaculture | * | 6,000,000 | - | ||||||||
| C | Prawn farm 1 | * | 14,554,578 | 2,682,680 | ||||||||
| D | Prawn farm 2 | * | 9,877,218 | 3,348,105 | ||||||||
| E | Cattle farm 2 | * | 5,558,057 | - | ||||||||
| $ | 41,109,708 | $ | 6,030,785 | |||||||||
The Company made temporary deposits paid to entities for equity investments in future Sino Joint Venture companies (“SJVCs”) engaged in projects development of trade and seafood centers, fish, prawns and cattle farms. Such temporary deposits represented as deposits of the respective consideration required for the purchase of equity stakes of respective future SJVCs. The amounts were classified as temporary because legal procedures of formation of SJVCs have not yet been completed. As of December 31 2013, the percentages of equity stakes of SFJVCs A (trade and seafood centers), B ( fish farm 2 Gao Qiqiang Aquaculture Farm ), C (prawn farm 1), D (pawn farm 2) and E (cattle farm 2) are not yet determined, 23%, 23%, 56%, 29% and 35% respectively.
* The above amounts were subject to conversion to an additional equity investment in the investees upon the completion of legal procedures of formation of SJVCs.
17. VARIABLE INTEREST ENTITY
On September 28, 2009, APWAM acquired the PMH’s 45% equity interest in the Sino-Foreign joint venture company, Qinghai Sanjiang A Power Agriculture Co. Limited (“SJAP”), which was incorporated in the PRC. As of December 31, 2013, the Company has invested $2,251,359 in this joint venture. SJAP is engaged in its business of the manufacturing of organic fertilizer, livestock feed, and beef cattle and plantation of crops and pastures.
Continuous assessment of the VIE relationship with SJAP
The Company may also have a controlling financial interest in an entity through an arrangement that does not involve voting interests, such as a VIE. The Company evaluates entities deemed to be VIE’s using a risk and reward model to determine whether to consolidate. A VIE is an entity (1) that has total equity at risk that is not sufficient to finance its activities without additional subordinated financial support from other entities, (2) where the group of equity holders does not have the power to direct the activities of the entity that most significantly impact the entity’s economic performance, or the obligation to absorb the entity’s expected losses or the right to receive the entity’s expected residual returns, or both, or (3) where the voting rights of some investors are not proportional to their obligations to absorb the expected losses of the entity, their rights to receive the expected residual returns of the entity, or both, and substantially all of the entity’s activities either involve or are conducted on behalf of an investor that has disproportionately fewer voting rights.
| F- 29 |
SINO AGRO FOOD, INC.
NOTES TO CONSOLIDATED FINANCIAL STATEMENTS
FOR THE YEARS ENDED DECEMBER 31, 2013 AND 2012
17.VARIABLE INTEREST ENTITY (CONTINUED)
The Company also quantitatively and qualitatively examined if SJAP is considered a VIE. Qualitative analyses considered the extent to which the nature of its variable interest exposed the Company to losses. For quantitative analyses, the Company also used internal cash flow models to determine if SJAP was a VIE and, if so, whether the Company was the primary beneficiary. The projection of these cash flows and probabilities thereof requires significant managerial judgment because of the inherent limitations that relate to the use of historical data for the projection of future events. On December 31, 2013, the Company evaluated the above VIE testing results and concluded that the Company is the primary beneficiary of SJAP’s expected losses or residual returns and that SJAP qualifies as a VIE of the Company. As result, the Company has consolidated SJAP as a VIE.
The reasons for the changes are as follows:
• Originally, the board of directors of SJAP consisted of 7 members; 3 appointees from Qinghai Sanjiang (one stockholder), 1 from Garwor (one stockholder), and 3 from the Company, such that the Company did not have majority interest represented on the board of directors of SJAP.
• On May 7, 2010, Qinghai Sanjiang sold and transferred its equity interest in SJAP to Garwor. The State Administration for Industry and Commerce of Xining City Government of the People’s Republic of China approved the sale and transfer.
Consequently Garwor and the Company agreed that the new board of directors of SJAP would consist of 3 members; 1 appointee from Garwor and 2 appointees from the Company, such that the Company now had a majority interest in the board of directors of SJAP. Also, and in accordance with the Company’s Sino Joint Venture Agreement, the Company’s management appointed the chief financial officer of SJAP. As a result, the financial statements of SJAP were included in the consolidated financial statements of the Company.
18. LICENSE RIGHTS
Pursuant to an agreement dated August 1, 2006 between Infinity Environmental Group Limited (“Infinity”) and the Company, the Company was granted an A Power Technology License with the condition that the Company was required to pay the license fee covering 500 units of APM as performance payment to Infinity on or before July 31, 2008. This license allows the Company to develop service, manage and supply A Power Technology Farms in the PRC using the A Power Technology, but subject to a condition that the Company is required to pay a license fee to Infinity once the Company has sold the license to its customer. Under the said license, the Company has the right to authorize developers and/or joint venture partners to develop A Power Technology Farms in the PRC. Infinity is a company incorporated in Australia. An impairment loss made for the years ended December 31, 2013 and 2012 are $1 and $0, respectively.
| F- 30 |
SINO AGRO FOOD, INC.
NOTES TO CONSOLIDATED FINANCIAL STATEMENTS
FOR THE YEARS ENDED DECEMBER 31, 2013 AND 2012
19. OTHER PAYABLES
| 2013 | 2012 | |||||||
| Due to third parties | $ | 4,715,543 | $ | 877,259 | ||||
| Promissory notes issued to third parties | 3,625,000 | 3,352,394 | ||||||
| Convertible notes payable | - | 232,000 | ||||||
| Due to local government | 2,428,243 | 2,192,825 | ||||||
| $ | 10,768,786 | $ | 6,654,478 | |||||
Due to third parties are unsecured, interest free and have no fixed terms of repayment.
20 . CONSTRUCTION CONTRACT
(i) Costs and estimated earnings in excess of billings on uncompleted contract
| 2013 | 2012 | |||||||
| Costs | $ | 3,527,975 | $ | 3,755,046 | ||||
| Estimated earnings | 8,538,930 | 8,307,452 | ||||||
| Less: Billings | (11,403,609 | ) | (9,725,618 | ) | ||||
| Costs and estimated earnings in excess of billings on uncompleted contract | $ | 663,296 | $ | 2,336,880 | ||||
(ii) Billings in excess of costs and estimated earnings on uncompleted contracts
| 2013 | 2012 | |||||||
| Billings | $ | 8,406,900 | $ | 9,810,427 | ||||
| Less: Costs | (2,179,410 | ) | (1,886,705 | ) | ||||
| Estimated earnings | (3,080,534 | ) | (5,133,638 | ) | ||||
| Billings in excess of costs and estimated earnings on uncompleted contract | $ | 3,146,956 | $ | 2,790,084 | ||||
(iii) Overall
| 2013 | 2012 | |||||||
| Billings | $ | 19,810,509 | $ | 19,536,045 | ||||
| Less: Costs | (5,707,385 | ) | (5,641,751 | ) | ||||
| Estimated earnings | (11,619,464 | ) | (13,441,090 | ) | ||||
| Billings in excess of costs and estimated earnings on uncompleted contract | $ | 2,483,660 | $ | 453,204 | ||||
21. BORROWINGS
There are no provisions in the Company’s bank borrowings and long term debts that would accelerate repayment of debt as a result of a change in credit ratings or a material adverse change in the Company’s business. Under certain agreements, the Company has the option to retire debt prior to maturity, either at par or at a premium over par.
| F- 31 |
SINO AGRO FOOD, INC.
NOTES TO CONSOLIDATED FINANCIAL STATEMENTS
FOR THE YEARS ENDED DECEMBER 31, 2013 AND 2012
Short term bank loan
| Name of bank | Interest rate | Term | 2013 | 2012 | ||||||||||
| Agricultural Development Bank of China | 6 | % | August 30, 2013 - August 29, 2014 | |||||||||||
| Huangyuan County Branch, | (August 30, 2012 - August 29, 2013) | |||||||||||||
| Xining , Qinghai Province, the P.R.C. | $ | 4,100,377 | ^* | $ | 3,181,927 | ^* | ||||||||
^ personal and corporate guaranteed by third parties.
* secured by land use rights with net carrying amount of $515,026 (2012: $528,240).
Long term debts
| Name of lender | Interest rate | Term | 2013 | 2012 | ||||||||||
| Gan Guo Village Committee | 12.22 | % | June 2012 - June 2017 | |||||||||||
| Bo Huang Town | ||||||||||||||
| Huangyuan County, | ||||||||||||||
| Xining City, | ||||||||||||||
| Qinghai Province, the P.R.C. | $ | 180,417 | $ | 175,006 | ||||||||||
22. SHAREHOLDERS’ EQUITY
The Group’s share capital as of December 31, 2013 and 2012 shown on the consolidated balance sheet represents the aggregate nominal value of the share capital of the Company as at that date.
On March 22, 2010, the Company designated 100 shares of Series A preferred stock at a par value per share of $0.001. As of the same date, 100 shares of Series A preferred stock were issued at $1 per share for cash in the amount of $100.
The Series A preferred stock:
| (i) | does not pay a dividend; |
| (ii) | votes together with the shares of Common Stock of the Corporation as a single class and, regardless of the number of shares of Series A Preferred Stock outstanding and as long as at least one of such shares of Series A Preferred Stock is outstanding, shall represent eighty percent (80%) of all votes entitled to be voted at any annual or special meeting of shareholders of the Corporation or action by written consent of shareholders. Each outstanding share of the Series A Preferred Stock shall represent its proportionate share of the 80%, which is allocated to the outstanding shares of Series A Preferred Stock; and |
| (ii) | ranks senior to common stockholders, holders of Series B convertible preferred stockholders and any other stockholders on liquidation. |
The Company has designated 100 shares of Series A preferred stock with 100 shares issued and outstanding as of December 31, 2013 and 2012, respectively.
| F- 32 |
SINO AGRO FOOD, INC.
NOTES TO CONSOLIDATED FINANCIAL STATEMENTS
FOR THE YEARS ENDED DECEMBER 31, 2013 AND 2012
22. SHAREHOLDERS’ EQUITY (CONTINUED)
The Series B convertible preferred stock:
On March 22, 2010, the Company designated 7,000,000 shares of Series B convertible preferred stock at a par value per share of $0.001. The Series B convertible preferred stock is redeemable, the stockholders are not entitled to receive any dividend and voting rights but rank senior over common stockholders on liquidation, and can convert to common stock on a one for one basis at any time. On June 26, 2010, 7,000,000 shares of common stock were surrendered for cancellation and the Company issued 7,000,000 shares of Series B convertible preferred stock at $9.90 per share. Pursuant to share exchange agreement made as of December 22, 2012, between the Company and a stockholder, Capital Adventure Inc., a holder of 3,000,000 shares of common shares, with the consent of Board of Directors, to exchange for 3,000,000 shares of Series B convertible preferred stock on one-for-one basis. As of December 23, 2012, 3,000,000 shares of Series B convertible preferred stock were issued to Capital Adventure Inc., for the exchange of its holding of 3,000,000 shares of common stocks. As of December 31, 2012, 3,000,000 shares of common stocks were still not returned to the Company. On March 27, 2013, 3,000,000 Series B convertible preferred stock were cancelled.
There were 7,000,000 shares and 10,000,000 shares of Series B convertible preferred stock issued and outstanding as of December 31, 2013 and December 31, 2012, respectively.
The Series F Non-Convertible Preferred Stock:
(i) is not redeemable subject to (iv);
(ii) except for (iv), with respect to dividend rights, rights on liquidation, winding up and dissolution, rank junior and subordinate to ( a) all classes of Common Stock,(b) all other classes of Preferred Stock and (c) any class or series of capital securities of the Company.
(iii) shall not entitled to receive any further dividend; and
( iv) on May 30, 2014, the holders of shares of Series F Non-Convertible Preferred Stock with coupon shall be entitled to a coupon payment directly from the Company at the redemption rate of $3.40 per share. Upon redemption, the Holder shall no longer own any shares of Series F with coupon that have been redeemed, and all such redeemed shares shall disappear and no longer exist on the books and records of the Company; redeemed shares of Series F which no longer exist upon redemption shall thereafter be counted toward the authorized but unissued “blank check” preferred stock of the Company.
On August 22, 2012, the Company’s Board of Directors declared that the Company’s stockholders were entitled to receive one share of restricted Series F Non-convertible Preferred Stock for every 100 shares of Common Stock owned by the stockholders as of September 28, 2012, with lesser or greater amounts being rounded up to the nearest 100 shares of Common Stock for purpose of the computing the dividend. The holders of record of shares of Series F Non-Convertible Preferred Stock shall be entitled to a coupon payment directly from the Company at the redemption rate of $3.40 per share and be payable on May 30, 2014. However, the Company was unable to issue the Series F Non-convertible Preferred Stock as originally contemplated. Consequently, The Company’s transfer agent was instructed to note in its record date rather than actual issue the Preferred F shares. On June 14, 2014, the Company announced the delay in payment of the coupon until May 30, 2015 as disclosed in note 34 to the consolidated financial statements. The company reserved the excess over the nominal amount of the Series F Non-convertible Preferred Stock of $3,124,737 as Series F Non-convertible Preferred Stock redemption payable.
As a result, total issued and outstanding of Series F Non-Convertible Preferred Stock as of December 31, 2013 and 2012 are 0 shares and grand total issued and outstanding preferred stock as of December 31, 2013 and 2012 are 7,000,100 shares and 10,000,100, respectively.
Common Stock:
On December 5, 2012, the Company obtained stockholder consent for the approval of an amendment to our articles of incorporation to increase our authorized shares of common stock, no par value (the “Common Stock”), from 10,101,010 to 13,131,313. The board of directors believes that the increase in our authorized Common Stock will provide us with greater flexibility with respect to our capital structure for purposes including additional equity financing and stock based acquisitions. The certificate of amendment effectuating the vote by the shareholders was filed with the State of Nevada on January 24, 2013.
During the year ended December 31, 2012, the Company issued (i) 3,238,847 shares of common stock for 18,193,714 at values ranging from $3.96 to $7.03 per share to settle debts due to third parties. The Company executed several agreements with third parties to settle debts by issuance of the Company’s common stock. The shares issued by the Company were valued at the trading price of the stock on the date the shares were issued. Any excess of the fair value of the shares over the carrying cost of the debt has been reported as a gain on the extinguishment of debts under other income of $55,857 have been credited to consolidated statements of income as other income for the year ended December 31, 2012; and (ii) 91,515 shares of common stock valued to employees at fair value of $3.96 per share for $362,400 for employee compensation. The fair value of the common stock issued was determined by using the trading price of the Company’s common stock on the date of issuance of $3.96 per share.
| F- 33 |
During the year ended December 31, 2013, the Company issued 3,767,675 shares of common stock for $1,821,276 at values ranging from $3.66 to $6.14 per share to settle debts due to third parties. The Company executed several agreements with third parties to settle debts by issuance of the Company’s common stock. The shares issued by the Company were valued at the trading price of the stock on the date the shares were issued. Any excess of the fair value of the shares over the carrying cost of the debt has been reported as a gain on the extinguishment of debts of $1,318,947 and $1,666,386 has been credited to consolidated statements of income as other income for the years ended December 31, 2013 and 2012, respectively; and (ii) 30,021 shares of common stock valued to employees at fair value of $4.46 per share for $133,744 for employee compensation. The fair value of the common stock issued was determined by using the trading price of the Company’s common stock on the date of issuance of $4.46 per share.
On March 28, 2013, the Company filed a prospectus related to a public offering of Common Stock of the Company for maximum aggregate gross proceeds of $26,250,000 within a period not to exceed 180 days from the date of this prospectus.
On October 4, 2013, the Company obtained stockholder consent for the approval of an amendment to our articles of incorporation to increase our authorized shares of common stock, no par value (the “Common Stock”), from 13,131,313 to 17,171,717. The board of directors believes that the increase in our authorized Common Stock will provide us with greater flexibility with respect to our capital structure for purposes including additional equity financing and stock based acquisitions. The certificate of amendment effectuating the vote by the shareholders was filed with the State of Nevada on November 1, 2013.
The Company has 13,899,196 and 10,101,500 shares of common stock issued and outstanding as of December 31, 2013 and 2012, respectively.
23. CONVERTIBLE NOTES PAYABLE
In December of 2011, the Board of Directors passed a resolution authorizing the Company to enter into an agreement to borrow funds from a third party to assist in providing a method for certain Chinese shareholders to sell their shares in the Company. The Company entered into a series of convertible promissory notes along with common stock purchase warrants whereby this third party could exercise the conversion option and settles the amount due by receiving shares of stock from these certain Chinese shareholders. The monies borrowed from this third party were deposited into a custodial account that was not controlled by the Company. The Chinese shareholders also deposited their shares with this custodian. The shares transferred to the custodian were at all times, in the opinion of management, sufficient to satisfy the obligations of the convertible promissory notes and the outstanding common stock purchase warrants. All amounts owed this financing arrangement were to be repaid through the conversion options exercised by the third party and by the deliverance of the common shares of these certain Chinese investors.
During the year 2012, the Company borrowed a total of $ 460,000 from this third party under five separate promissory notes. Each note carried an interest rate of 12% per annum with a maturity date of six months from the date of issuance. Under the terms of the notes, the holder of the note has the option to convert the note to common shares at a discount of 15% from the average market price of the lowest three trading prices for the common stock during the ten trading days prior to the conversion date. The Company also issued a total of 842,500 common stock purchase warrants with an exercise price of $0.50 per share with an expiration date six months from the date of issuance.
The Company calculated the fair value of the warrants and the beneficial conversion feature utilizing the Black Scholes model at the date of the issuance of each promissory note. The relative fair values were allocated to the warrants and the debt. Accordingly, a discount was created on the debt and this discount will be amortized to interest expense of the life of the debt. Debt discount amortization as of December 31, 2012 was $178,867.
| F- 34 |
SINO AGRO FOOD, INC.
NOTES TO CONSOLIDATED FINANCIAL STATEMENTS
FOR THE YEARS ENDED DECEMBER 31, 2013 AND 2012
23. CONVERTIBLE NOTES PAYABLE (CONTINUED)
As of December 31, 2012, there was $ 232,000 principal outstanding and accrued interest in the amount of $ 9,764 that was owed under the terms of the promissory notes. The Company has recorded these amounts as payable by the Company with a corresponding asset represented by the value of the shares of the Company held by the custodian at December 31, 2012.
As of December 31, 2013, there was $0 principal outstanding and accrued interest in the amount of $0 that was owed under the terms of the promissory notes. The Company has recorded these amounts as payable by the Company with a corresponding asset represented by the value of the shares of the Company held by the custodian as of December 31, 2013.
24. WARRANTS
As indicated in the convertible promissory note footnote, during the year 2012, the Company borrowed a total of $460,000 from a third party under five separate promissory notes secured by personal guarantee of a director. Each note carried an interest rate of 12% per annum with a maturity date of six months from the date of issuance. Under the terms of the notes, the holder of the note has the option to convert the note to common shares at a discount of 15% from the average market price of the lowest three trading prices for the common stock during the ten trading days prior to the conversion date. The Company also issued a total of 842,500 common stock purchase warrants with an exercise price of $0.50 per share with an expiration date six months from the date of issuance. The Company fair valued the warrants on the date of issuances and recorded amounts based on their relative fair values to the debt and to the warrants. The fair value of the warrants was determined using the Black-Scholes pricing model and included the following assumptions
| Expected annual dividend rate | 0.00 | % | ||
| Weighted average exercise price | $ | 0.50 | ||
| Risk-free interest rate | 2.00 | % | ||
| Average expected life | 6 months | |||
| Expected volatility of common stock | 80.00 | % | ||
| Forfeiture rate | 0.00 | % |
The warrants have an exercise price of $0.50 and have a contractual life of 6 months from the date of issuance. The value of the discounts created by the warrants and beneficial conversion feature were $36,113 and $52,118, respectively. The discount related to the beneficial conversion feature will be amortized to interest expense over the life of the debt and the discount for the warrants will be amortized to interest expense over the contractual life of the warrants. The relative fair values were allocated to the warrants and the debt. Accordingly, a discount was created on the debt and this discount will be amortized to interest expense of the life of the debt.
As of December 31, 2013, the following share purchase warrants were outstanding and exercisable:
| Expiry date | Exercise price | 2013 | 2012 | |||||||||
| January 8, 2013 | $ | 0.50 | - | 150,000 | ||||||||
| February 15, 2013 | $ | 0.50 | - | 78,500 | ||||||||
| April 9, 2013 | $ | 0.50 | - | 157,000 | ||||||||
| - | 385,500 | |||||||||||
Share purchase warrant transactions and the number of share purchase warrants outstanding and exercisable are summarized as follows:
| F- 35 |
SINO AGRO FOOD, INC.
NOTES TO CONSOLIDATED FINANCIAL STATEMENTS
FOR THE YEARS ENDED DECEMBER 31, 2013 AND 2012
| December 31, 2013 | Exercise price | |||||||
| Number of warrants outstanding as of January 1, 2013 | 385,000 | $ | 0.50 | |||||
| Issued | - | - | ||||||
| Exercised | - | - | ||||||
| Expired | (385,000 | ) | - | |||||
| Number of warrants outstanding as of December 31, 2013 | - | |||||||
25. OBLIGATION UNDER OPERATING LEASES
The Company leases (i) 2,178 square feet of agriculture space used for offices for a monthly rent of $512 in Enping City, Guangdong Province, PRC, its lease expiring on March 31, 2014; (ii) 5,081 square feet of office space in Guangzhou City, Guangdong Province, PRC for a monthly rent of $11,838, its lease expiring on July 8, 2014; and (iii) 1,555 square feet each for two staff quarters in Linli District, Hunan Province, PRC for a monthly rent of $159, their leases expiring on January 23, 2013 and May 1, 2014.
Lease expense was $150,104 and $155,119 for the years ended December 31, 2013 and 2012, respectively.
The future minimum lease payments as of December 31, 2013, are as follows:
| $ | ||||
| Year ended December 31,2014 | 85,038 | |||
| Thereafter | - | |||
| 85,038 | ||||
26. BUSINESS COMBINATION
Business combination of JFD
The following table summarizes our unaudited consolidated results of operations for the years ended December 31, 2012 and 2011, as well as unaudited consolidated results of operations as though the JFD and JHMC acquisitions had occurred on January 1, 2011.
On February 28, 2011, TRW applied to form a corporate joint venture, Enping City Bi Tao A Power Fishery Development Co., Limited (“EBAPFD”), incorporated in the PRC. TRW owned a 25% equity interest in EBAPFD. On November 17, 2011, TRW formed Jiang Men City A Power Fishery Development Co., Limited (“JFD”) in which it acquired a 25% equity interest, while withdrawing its 25% equity interest in EBAPFD. As of December 31, 2011, the Company had invested $1,258,607 in JFD. JFD is engaged as an operator of an indoor fish farm. Prior to December 31, 2011, JFD has not commenced its principal business activity. Management did not retain a specialist or valuation expert to value the purchase of this additional 25% interest. As of January 1, 2012, JFD had not commenced its principal operations and was in the process of finalizing the construction of the indoor fish farm facilities. Management determined that the fair value of the assets approximated the historical cost carried on the books of JFD. On January 1, 2012, the Company acquired an additional 25% equity interest in JFD for total cash consideration of $1,662,365. On April 1, 2012, the Company acquired an additional 25% equity interest in JFD for the amount of $1,702,580.The Company presently owns a 75% equity interest in JFD and controls its board of directors. As of January 1, 2012, the Company had consolidated the assets and operations of JFD.
The following table summarizes our unaudited consolidated results of operations for the years ended December 31, 2012 and 2011, as well as unaudited consolidated results of operations as though the JFD and JHMC acquisitions had occurred on January 1, 2011.
Second acquisition on January 1, 2012 - 25% additional equity interest in JFD.
The Company allocated the purchase price on the fair value of the assets acquired as of January 1, 2012.
| F- 36 |
SINO AGRO FOOD, INC.
NOTES TO CONSOLIDATED FINANCIAL STATEMENTS
FOR THE YEARS ENDED DECEMBER 31, 2013 AND 2012
26. BUSINESS COMBINATION (CONTINUED)
| Net assets at fair value acquired: | ||||
| Property and equipment | $ | 34,919 | ||
| Construction in progress | 4,495,306 | |||
| Inventories | 1,838,337 | |||
| 6,368,562 | ||||
| Less: Other payables | (92,603 | ) | ||
| Non-controlling interest | (3,324,729 | ) | ||
| 25% held by the Company | (1,662,365 | ) | ||
| $ | 1,288,865 | |||
| Satisfied by | ||||
| Purchase consideration | $ | 1,662,365 | ||
| Less: Cash acquired | (373,500 | ) | ||
| $ | 1,288,865 |
The following table summarizes our unaudited consolidated results of operations for the years ended December 31, 2012 and 2011, as well as unaudited consolidated results of operations as though the JFD and JHMC acquisitions had occurred on January 1, 2011.
Third acquisition on April 1, 2012 - 25% additional equity interest in JFD.
The Company allocated the purchase price based on the fair value of the assets acquired as of April 1, 2012.
| Net assets at fair value acquired: | ||||
| Property and equipment | $ | 33,535 | ||
| Construction in progress | 4,499,376 | |||
| Inventory | 1,970,387 | |||
| Accounts receivable | 1,337,519 | |||
| 7,840,817 | ||||
| Less: Other payables | (292,663 | ) | ||
| Accounts payable | (1,230,096 | ) | ||
| Non-controlling interest | (1,702,580 | ) | ||
| 50% held by the Company | (3,405,159 | ) | ||
| $ | 1,210,319 | |||
| Satisfied by | ||||
| Purchase consideration | $ | 1,702,580 | ||
| Less: Cash acquired | (492,261 | ) | ||
| $ | 1,210,319 |
Business combination of JHMC
Second acquisition on September 30, 2012 - 50% additional equity interest in JHMC
On April 15, 2011, MEIJI applied to form Enping City A Power Cattle Farm Co., Limited (“ECF”), all of which the Company would indirectly own a 25% equity interest in on November 17, 2011. On September 17, 2012 MEIJI formed Jiang Men City Hang Mei Cattle Farm Development Co., Limited (“JHMC”) in which it owns 75% equity interest with investment $4,020,665 while withdrawing its 25% equity interest in ECF. As of September 30, 2012, the Company had consolidated the assets and operations of JHMC.
The Company allocated the purchase price based on the fair value of the assets acquired as of September 30, 2012.
| F- 37 |
SINO AGRO FOOD, INC.
NOTES TO CONSOLIDATED FINANCIAL STATEMENTS
FOR THE YEARS ENDED DECEMBER 31, 2013 AND 2012
| Net assets at fair value acquired: | ||||
| Property and equipment | $ | 512,450 | ||
| Construction in progress | 4,177,007 | |||
| Inventories | 671,429 | |||
| 5,360,886 | ||||
| Less: Non - controlling interest | (1,340,221 | ) | ||
| $ | 4,020,665 | |||
| Satisfied by | ||||
| Purchase consideration | $ | 4,020,665 |
The following table summarizes our unaudited consolidated results of operations for the years ended December 31, 2012 and 2011, as well as unaudited consolidated results of operations as though the JFD and JHMC acquisitions had occurred on January 1, 2011.
| 2012 | 2011 | |||||||||||||||
| As reported | Pro Forma | As reported | Pro Forma | |||||||||||||
| Revenue | $ | 138,612,639 | $ | 128,725,067 | $ | 51,879,903 | $ | 47,718,758 | ||||||||
| Net income from continuing operations | $ | 57,545,832 | $ | 50,655,603 | $ | 15,691,032 | $ | 14,041,347 | ||||||||
| Net income from discontinued operations | $ | - | $ | - | $ | 10,203,951 | $ | 10,203,951 | ||||||||
| Total net income from continuing and discontinued operations | $ | 57,545,832 | $ | 50,655,603 | $ | 25,894,983 | $ | 24,245,298 | ||||||||
| From continuing and discontinued operations Earning per share | ||||||||||||||||
| Basic | $ | 6.94 | $ | 6.11 | $ | 4.26 | $ | 3.99 | ||||||||
| Diluted | $ | 6.19 | $ | 5.45 | $ | 3.82 | $ | 3.58 | ||||||||
| From continuing operations Earning per share | ||||||||||||||||
| Basic | $ | 6.24 | $ | 6.11 | $ | 2.58 | $ | 2.31 | ||||||||
| Diluted | $ | 6.19 | $ | 5.45 | $ | 2.31 | $ | 2.07 | ||||||||
| From discontinued operations Earning per share | ||||||||||||||||
| Basic | $ | - | $ | - | $ | 1.68 | $ | 1.68 | ||||||||
| Diluted | $ | - | $ | - | $ | 1.51 | $ | 1.51 | ||||||||
The unaudited pro forma information set forth above is for informational purpose only and include adjustments related to elimination of revenue from JFD and JHMC before acquisition of equity interests. The pro forma information should not be considered indicative of actual results that would have been achieved if JFD and JHMC have been acquired at the beginning of 2011 or results that may be obtained in any future period.
27. BONDS PAYABLE
On July 1, 2013 , the Company offered a maximum of $21,000,000 of units (“Units”) for an aggregate of 840 Units; each Unit consisting of a $25,000 principal amount promissory note made by the Subscription Agreement and Confidential Private Placement Memorandum with maturity date two years from the Initial Closing Date of the Offering September 30, 2013. The interest rate of 5% is paid annually. Commission, issue cost and discounts are amortized over 2 years from October 1, 2013.
Term of the bonds are as follows:
| F- 38 |
SINO AGRO FOOD, INC.
NOTES TO CONSOLIDATED FINANCIAL STATEMENTS
FOR THE YEARS ENDED DECEMBER 31, 2013 AND 2012
| Issue size: | $16,800,000 | |
| Number of units offered: | 840 units | |
| Number of units issued: | 69 units | |
| Principal value per unit: | $25,000 per unit | |
| Net payable value /bond: | $20,000 per unit | |
| Discounted value/bond: | $5,000 paid to bond holder | |
| Maturity date: | 2 years (September 30, 2015) | |
| Participating interest: | 5% per annum | |
| Effective yield: | 11.80% per annum |
| 2013 | 2012 | |||||||
| 5% Participating zero coupon bonds repayable on September 30, 2015 | $ | 1,725,000 | $ | - | ||||
The Company calculated professional service compensation of $400,000 in respect of bond issue, and recognized $100,000 for the year ended December 31, 2013. As of December 31, 2013, the deferred compensation balance was $300,000 and the deferred compensation balance of $300,000 was to be amortized over 18 months beginning on January 1, 2014.
28. STOCK BASED COMPENSATION
On August 16, 2012, the Company issued employees a total of 10,101 shares of common stock valued at fair value of range from $3.96 per share for services rendered to the Company. On the same date, the Company issued 81,414 shares of common stock to a company to provide consulting services for the benefit of the Company. The fair value of the common stock issued was determined by using the trading price of the Company’s common stock on the date of issuance of $3.96 per share.
The Company calculated stock based compensation of $2,501,457 and recognized $2,229,657 for the year ended December 31, 2012. As of December 31, 2012, the deferred compensation balance was $271,800 and this balance of $271,800 was to be amortized over 9 months beginning on January 1, 2013.
On July 2, 2013, the Company issued employees a total of 30,021 shares of common stock valued at fair value of range from $4.46 per share for services rendered to the Company. The fair value of the common stock issued was determined by using the trading price of the Company’s common stock on the date of issuance of $4.46 per share.
The Company calculated stock based compensation of $405,544, and recognized $305,236 for the year ended December 31, 2013. As of December 31, 2013, the deferred compensation balance was $100,308 and the deferred compensation balance of $100,308 was to be amortized over 9 months beginning on January 1, 2014.
29. CONTINGENCIES
As of December 31, 2013 and 2012, the Company did not have any pending claims, charges, or litigation that it expects would have a material adverse effect on its consolidated balance sheets, consolidated statements of income and other comprehensive income or cash flows.
30. GAIN ON EXTINGUISHMENT OF DEBTS
The Company executed several agreements with third parties to settle debts by issuance of the Company’s common stock. The shares issued by the Company were valued at the trading price of the stock on the date the shares were issued. Any excess of the fair value of the shares over the carrying cost of the debt has been reported as a gain on the extinguishment of debts of $1,318,947 and $1,666,386 has been credited to consolidated statements of income as other income for the years ended December 31, 2013 and 2012, respectively.
| 2013 | 2012 | |||||||
| Total amounts of debts to be settled | $ | 18,030,632 | $ | 19,529,803 | ||||
| Less: Aggregate market fair value of 3,7676,675 (2012: 3,238,847) shares of common stock in exchange of the above debts for debts extinguishment | (16,711,685 | ) | (17,863,417 | ) | ||||
| Gain on extinguishment of debts | $ | 1,318,947 | $ | 1,666,386 | ||||
| F- 39 |
SINO AGRO FOOD, INC.
NOTES TO CONSOLIDATED FINANCIAL STATEMENTS
FOR THE YEARS ENDED DECEMBER 31, 2013 AND 2012
31. RELATED PARTY TRANSACTIONS
In addition to the transactions and balances as disclosed elsewhere in these consolidated financial statements, during the years ended December 31, 2013 and 2012, the Company had the following significant related party transactions:-
| Name of related party | Nature of transactions | |
| Mr. Solomon Yip Kun Lee, Chairman | Included in due to a director, due to Mr. Solomon Yip Kun Lee is $1,793,768 and $3,345,803 as of December 31, 2013 and 2012, respectively. The amounts are unsecured, interest free and have no fixed term of repayment. |
32. EARNINGS PER SHARE
Basic earnings per share is computed by dividing net income attributable to common shareholders by the weighted average number of common shares outstanding during the year. Diluted earnings per share reflects the potential dilution of securities by including other potential common stock, including convertible preferred stock, stock options and warrants, in the weighted average number of common shares outstanding for the year, if dilutive. The numerators and denominators used in the computations of basic and dilutive earnings per share are presented in the following table:
| 2013 | 2012 | |||||||
| BASIC | ||||||||
| Numerator for basic earnings per share attributable to the Company’s common stockholders: | ||||||||
| Net income used in computing basic earnings per share | $ | 74,206,529 | $ | 57,545,832 | ||||
| Basic earnings per share | $ | 6.14 | $ | 6.95 | ||||
| Basic weighted average shares outstanding | 12,093,973 | 8,284,536 | ||||||
| 2013 | 2012 | |||||||
| DILUTED | ||||||||
| Numerator for basic earnings per share attributable to the Company’s common stockholders: | ||||||||
| Net income used in computing basic earnings per share | $ | 74,206,529 | $ | 57,545,832 | ||||
| Diluted earnings per share | $ | 5.76 | $ | 6.19 | ||||
| Basic weighted average shares outstanding | 12,093,973 | 8,284,536 | ||||||
| Add: weight average of common stock converted from Series B Convertible preferred shares outstanding | 778,469 | 1,010,101 | ||||||
| Diluted weighted average shares outstanding | 12,872,442 | 9,294,637 | ||||||
For the years ended December 31, 2013 and 2012, 0 and 385,000 warrants, respectively were not included in the diluted earnings per share because shares issued in respect of the share warrants exercised was from Chinese shareholders as mentioned in note 23.
| F- 40 |
SINO AGRO FOOD, INC.
NOTES TO CONSOLIDATED FINANCIAL STATEMENTS
FOR THE YEARS ENDED DECEMBER 31, 2013 AND 2012
33. RESTATEMENT OF CONSOLIDATED STATEMENT OF CASH FLOW
SINO AGRO FOOD, INC.
CONSOLIDATED STATEMENT OF CASH FLOWS
FOR THE YEAR ENDED DECEMBER 31, 2012 (EXTRACT)
| 2012 | Adjustments | 2012 | ||||||||||
| (As reported) | (Restated) | |||||||||||
| Cash flows from operating activities | ||||||||||||
| Net income | $ | 63,252,540 | $ | 63,252,540 | ||||||||
| Adjustments to reconcile net income (loss) from continuing operations to net cash from operations: | ||||||||||||
| Depreciation | 443,361 | 443,361 | ||||||||||
| Amortization | 1,934,909 | 1,934,909 | ||||||||||
| Gain on extinguishment of debts | (1,666,386 | ) | (1,666,386 | ) | ||||||||
| Common stock issued for services | 2,229,657 | 2,229,657 | ||||||||||
| Other amortized costs | - | - | ||||||||||
| Changes in operating assets and liabilities: | ||||||||||||
| Decrease/(increase) in inventories | (10,037,494 | ) | (10,037,494 | ) | ||||||||
| Increase in deposits and prepaid expenses | (34,307,276 | ) | 6,030,785 | * | (28,276,491 | ) | ||||||
| (Decrease)/increase in due to a director | 12,239,470 | 12,239,470 | ||||||||||
| Increase in accounts payable and accrued expenses | 3,330,443 | 3,330,443 | ||||||||||
| Increase in other payables | 1,482,417 | 1,482,417 | ||||||||||
| Increase in accounts receivable | (18,142,198 | ) | (18,142,198 | ) | ||||||||
| Decrease/(increase) in cost and estimated earnings in excess of billings on uncompleted contacts | (1,880,776 | ) | (1,880,776 | ) | ||||||||
| Increase in billings in excess of costs and estimated earnings on uncompleted contracts | 827,965 | 827,965 | ||||||||||
| Decrease in amount due to related parties | (867,413 | ) | (867,413 | ) | ||||||||
| Decrease in amount due from related parties | 15,820,752 | 15,820,752 | ||||||||||
| Decrease in other receivables | 3,734,623 | 3,734,623 | ||||||||||
| Net cash provided by operating activities | 38,394,594 | 44,425,379 | ||||||||||
| Cash flows from investing activities | ||||||||||||
| Purchases of property and equipment | (10,756,744 | ) | (10,756,744 | ) | ||||||||
| Payment for investment in future Sino Joint Venture companies | - | (6,030,785 | )* | (6,030,785 | ) | |||||||
| Acquisition of proprietary technology | (1,500,000 | ) | (1,500,000 | ) | ||||||||
| Net cash outflow from business combination of a subsidiaries less cash acquired | (6,893,349 | ) | (6,893,349 | ) | ||||||||
| Payment for construction in progress | (19,185,878 | ) | (19,185,878 | ) | ||||||||
| Net cash used in investing activities | (38,335,971 | ) | (44,366,756 | ) | ||||||||
| Cash flows from financing activities | ||||||||||||
| Proceeds from long term debt | 175,006 | 175,006 | ||||||||||
| Proceeds from short term debt | 3,181,927 | 3,181,927 | ||||||||||
| Non-controlling interest contribution | 3,634,064 | 3,634,064 | ||||||||||
| Repayment of short term debt | - | - | ||||||||||
| Proceeds from bond payable | - | - | ||||||||||
| Dividends paid | (134,631 | ) | (134,631 | ) | ||||||||
| Net cash provided by financing activities | 6,856,366 | 6,856,366 | ||||||||||
| Effects on exchange rate changes on cash | 121,368 | 121,368 | ||||||||||
| (Decrease)/increase in cash and cash equivalents | 7,036,357 | 7,036,357 | ||||||||||
| Cash and cash equivalents, beginning of year | 1,387,908 | 1,387,908 | ||||||||||
| Cash and cash equivalents, end of year | $ | 8,424,265 | $ | 8,424,265 | ||||||||
* Note: These adjustments are to classify movement of temporary deposits paid to entities for equity investment in future Sino Joint Venture companies included in deposits and prepaid expenses as cash flows used in investing activities.
34. SUBSEQUENT EVENTS
| (i) | On May 5, 2014, the Company requested the Securities and Exchange Commission to issue an order granting the withdrawal of the registration statement related to a public offering of common stock of the Company for maximum aggregate gross proceeds of $26,250,000 filed on March 28, 2013. |
| (ii) | On June 12, 2014, the Company announced the delay in the payment of the coupon until May 30, 2015. |
| (iii) | Subsequent to the balance sheet date, the Board of directors and the holders of a majority of the voting power of our stockholders of the company have approved an amendment to articles of incorporation to increase its authorized shares of Common Stock from 17,171,717 to 22,727,273. |
| (iv) | On November 10, 2014, the Company approved an amendment to the Corporation’s Articles of Incorporation to effectuate a reverse stock split (the “Reverse Split”) of the Corporation’s common stock, par value $0.001 per share (the “Common Stock”) affecting both the authorized and issued and outstanding number of such shares by a ratio of 9.9 for 1. The Reverse Split became effective in the State of Nevada on December 16, 2014. As a result, the Company is presently authorized to issue 22,727,273 shares of common stock, $0.001 per share. |
| (v) | On December 17, 2014, the Company approved an amendment to certificate designation in respect of Series B preferred stock. Pursuant to the above new amendment, each holder of Series B preferred stock shall have the rights, at any time or from time to time, to convert each 9.9 shares of Series B preferred to one fully paid and non assessable share of common stock of par value $0.001 per share. |
| F- 41 |