| (f) | The development work on a prawn farm at Huanyuan County, Xining City (“Prawn Farm 3”) is for an unrelated third party Chinese investor, Wu Aquaculture A Power Development Co. Ltd. (a proposed name for this future SJVC) originally planned to be on the property of Qinghai Sanjiang A Power Agriculture Co. Ltd. (“SJAP”).| | | % of total revenue | | | Customer's Total Revenue | | | Customer A | | | 31.65 | % | | | 44,833,142 | | | Customer B | | | 21.33 | % | | | 30,218,987 | | | Customer C | | | 16.68 | % | | | 23,624,028 | | | Customer D | | | 7.85 | % | | | 11,127,393 | | | | | | 77.51 | % | | | 109,803,550 | |
Customer A is Shanghai Hongchang Yili company (“Vigor”) that sells much of the imported beef and seafood as well as locally produced seafood. During 2018, the Company sold $44,833,142 of goods representing 31.65% of our total revenue of $141,670,563. Customer B is Cattle Wholesale, represented by Mr. Zhen Runchi, who buys our fattened cattle to sell them in the Guangdong and Beijing cattle markets and at the same time supplies to us with young cattle. The fiscal year 2018, transactions through Mr. Zhen Runchi generated 21.33% of our total consolidated revenue (equivalent to $30,218,987 out of our total revenue of $141,670,563. Customer C is GZ Nawei Trading Company who sells much of the imported beef and seafood as well as locally produced seafood. During 2018, the Company sold $23,624,028 of goods representing 16.68% of our total revenue of $141,670,563. Customer D is Tri-way Industries through our divestment when Tri-way (or“TRW”) became our“Investment Associate.” During 2018, transactions through TRW generated 7.85% of our total consolidated revenue equivalent to $11,127,393 out of our total revenue of $141,670,563. Major customer’s account receivables: The three major long-term customers (referred to as Customer A, B, and C above & mentioned in the Financial Statements of this prospectus), constitute accounts receivable in the aggregate amount of $ 33,035,451, which is equivalent to 23.4% of our consolidated revenues of $141,670,563 for the year 2018. Customer D is Tri-way Industries through our divestment when Tri-way (or“TRW) became our“Investment Associate.”During 2018, TRW constituted accounts receivable in the aggregate amount of $60,799,365, which is equivalent to 43 % out of our total revenue of $141,670,563 as shown in the table below: | | | December 31,2018 | | | | | | | | % of total
Accounts
receivables | | | Total
Accounts
receivables | | | Customer A | | | 12.79 | % | | $ | 12,996,579 | | | Customer B | | | 9.67 | % | | | 9,826,856 | | | Customer C | | | 10.05 | % | | | 10,212,016 | | | Customer D | | | 59.81 | % | | | 60,799,365 | | | | | | 92.32 | % | | $ | 93,834,816 | |
Note (12) Property and equipment, (P&E) net of accumulation depreciation: | | | 2018 | | | | | | | | Plant and machinery | | $ | 5,299,631 | | | Structure and leasehold improvements | | | 200,734,812 | | | Mature seeds and herbage cultivation | | | 54,643,255 | | | Furniture and equipment | | | 695,461 | | | Motor vehicles | | | 590,416 | | | | | | 261,963,575 | | | | | | | | | Less: Accumulated depreciation | | | (31,917,916 | ) | | Net carrying amount | | $ | 230,645,659 | |
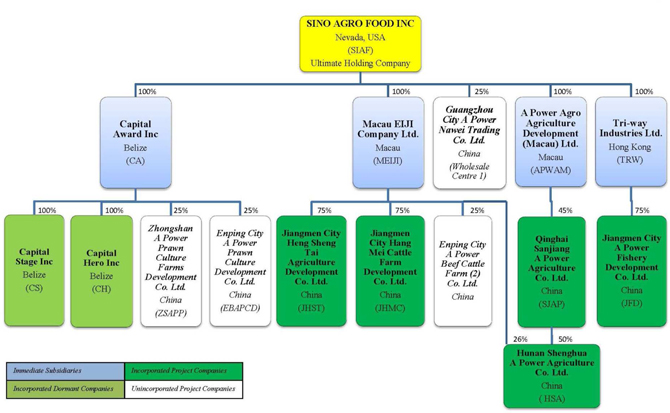
2. Marketing | l | Depreciation expenses were $13,080,991 and sales of live seafood. Consists of marketing and sales of live seafood (e.g., fish, prawns and eels)$8,350,811 for the years ended December 31, 2018, and the marketing and distribution agent of the fishery farms developed by Capital Award in China. There are two Capital Award fish or prawn farms generating revenues. We have certain subsidiaries that are or will be operated under a Sino Joint Venture Company incorporated in China to carry out fishery operations, consisting of the following: | (a) | JFD . JFD is the owner and operator of Fish Farm 1. The Company presently owns a 75% equity interest in JFD. |
| (b) | EBAPCD . EBAPCD is the proposed name of the future SJVC (subject to approval by relevant Chinese authorities under our application for SJVC status), established to own and operate Prawn Farm 1. EBAPCD will generate revenue during the third quarter of 2013. Capital Award will recognize income from the sale and marketing of its prawns as EBAPCD’s marketing and sales agent. |
| (c) | ZSAPP . ZSAPP is also an intended name of the future SJVC (subject to approval by relevant Chinese authorities under our application for SJVC, established to own and operate Prawn Farm 2. Capital Award recognizes income from the sale and marketing of its prawn flies as ZSAPP’s marketing and sales agent. |
| (d) | Capital Award . Capital Award has been sub-contracting with local aquaculture farms to grow sleepy cod based on a fixed production cost since 2012 continuing through 2013. |
Beef Cattle Farm Division
Operation 1. Operation 1 is operated from Huangyuan County of Xining City, Qinghai Province by SJAP, a majority owned subsidiary of the Company incorporated in China in 2009. SJAP’S principal activities that are generating revenues comprise: (i) manufacturing and sales of organic fertilizer, (ii) manufacturing and sales of livestock feed, and (iii) rearing and sales of beef cattle. On February 28, 2013, SJAP completed its development of the Concentrated Livestock Feed Manufacturing Factory and started the production and sales of Contracted Livestock Feed (“CLSF”) from March 2013. Our strategy includes building and owning our own abattoir and deboning room in 2013 and the value added processing facilities in 2014.
Fertilizer Division
1. Operation 1 . Operation 1 is operated in Linli District, Hunan Province, by Hunan Shenghua A Power Agriculture Co. Ltd. China (“HSA”)2017, a 76% owned subsidiary. HSA conducts the following business activities, both of which are in the development stage: (i) manufacturing and sales of organic and mixed fertilizer, and (ii) cultivation of pastures and crops in preparation for the establishment of beef cattle farm. On March 5, 2013, HSA secured the rights to use a well proven enzyme that, when applied to our organic fertilizer, converts part of the organic raw material into potash and phosphate without having to add chemically formulated potash and phosphate, such that our end fertilizer can be qualified as pure organic fertilizer made with 100% natural organic raw materials. Sales of pure organic fertilizer commenced during the fourth week of March, 2013.
2. Operation 2. Operation 2 has two sub-divisions:
| (a) | Operation 3(a) is a beef cattle farm known as Cattle Farm 1 located at Guangdong Province, Enping City, owned and operated by Jiangman Hang Mei Cattle Farm Development Co., Limited (“JHMC”). On September 17, 2012, through our wholly owned subsidiary Macau Eiji Company Limited (“MEIJI”), we acquired a total of 75% equity interest and became the controlling shareholder of JHMC.respectively. |
| (b) | Operation 3(b) is a beef cattle farm known as Cattle Farm 2 located in Guangdong Province, Guangzhou City and is operated by MEIJI. As of the date of this Prospectus, MEIJI generates revenues through engineering and technology services obtained through consulting and servicing contracts and management fees. |
Hylocereus Undatus (“HU”) Plantation Division
Note (13) Construction in progress (CIP): Jiang Men City Heng Sheng Tai Agriculture Development Co. Ltd. (“JHST”), an SJVC that is 75% owned by MEIJI, is consolidated as a subsidiary, and is the owner and operator of the Hylocereus Undatus Plantation (“HU Plantation”), which is situated at Enping City, Guangdong Province. JHST has two types of operations: (i) growth and sales of HU flowers; and (ii) drying and value added processing and sales of HU flower products.
SIAF/Corporate
Since the fourth quarter of 2012 the Company has generated income from the following business operations to supplement its shared services operations’ working capital annual budget:
(1) The wholesale and distribution facilities development project including design, construction and project management of its specialist modern beef wholesale and distribution center (“Wholesale Center 2”) for GCAPNT, an unrelated Chinese third party owned company situated at the Guangzhou City, LiWan District, New Wholesale Market.
(2) The Central Kitchen and related facilities development project including design, construction and project management of its business operations for Guangzhou City Wangxiangcheng (“WXC”).
(3) The Restaurants development project including design, construction and project management of its business operations for WXC.
(4) The construction of a trading complex for the import and export trades of the Company itself, at another building adjacent to Wholesale Center 1 and Wholesale Center 2 (collectively, the “Trading Center ”).
(5) The import and export trading operation.
We believe that our 5-year plan envisioning a synergistic melding of pre-wholesale, wholesale, distribution and retail activities are on track.
Consolidated Results of Operations
Part A. Consolidated Results of Operations for the three months ended June 30, 2013 compared to the three months ended June 30, 2012
Revenue
Revenue increased by $29,052,042 (or 114.61%) to $54,400,329 for the three months ended June 30, 2013 from $25,348,287 for the three months ended June 30, 2012. The increase was primarily due to the natural growth of revenue generated from our fishery, plantation, beef, organic fertilizer, cattle farm, beef and corporate and others operations and the maturity of on-going divisional businesses improving their revenues.
The following chart illustrates the changes by category from the three months ended June 30, 2013 compared to the three months ended June 30, 2012.
| Revenue | | | | | | | | | | | | | 2013 | | | 2012 | | | | | | Category | | Q2 | | | Q2 | | | Difference | | | | | $ | | | $ | | | $ | | | Fishery | | | 17,904,106 | | | | 15,799,765 | | | | 2,104,341 | | | | | | | | | | | | | | | | | Plantation | | | 3,554,986 | | | | 2,081,863 | | | | 1,473,123 | | | | | | | | | | | | | | | | | Beef | | | 7,328,071 | | | | 2,170,154 | | | | 5,157,917 | | | | | | | | | | | | | | | | | Organic fertilizer | | | 9,618,307 | | | | 1,781,966 | | | | 7,836,341 | | | | | | | | | | | | | | | | | Cattle farm | | | 6,421,161 | | | | 3,514,539 | | | | 2,906,622 | | | | | | | | | | | | | | | | | Corporate and others | | | 9,573,698 | | | | - | | | | 9,573,698 | | | | | | | | | | | | | | | | | Total | | | 54,400,329 | | | | 25,348,287 | | | | 29,052,042 | |
Fishery : Revenue from fishery increased by $2,104,341 (or 13.32%) to $17,904,106 for the three months ended June 30, 2013 from $15,799,765 for the three months ended June 30, 2012. The increase was primarily due to our increased contract service income from fishery, WSC 1 and prawn development contracts and sale of fish for the three months ended June 30, 2013 versus consulting income and sale of fish for the three months ended June 30, 2012.
Plantation : Revenue from plantation of flowers increased by $1,473,123 (or 70.76%) to $3,554,986 for the three months ended June 30, 2013 from $2,081,863 for the three months ended June 30, 2012. The increase was primarily due to the increase of wholesale prices in both the fresh and dried flowers and the increase of production of flowers this season.
Beef : Revenue from beef increased by $5,157,917 (or 237.68%) to $7,328,071 for the three months ended June 30, 2013 from $2,170,154 for the three months ended June 30, 2012.The increase was primarily due to our increase of cattle grown on the farms.
Organic fertilizer : Revenue from organic fertilizer increased by $7,836,341 (or 439.76%) to $9,618,307 for the three months ended June 30, 2013 from $1,781,966 for the three months ended June 30, 2012. The increase was primarily due to the new production plants at HSA increasing its sales and production of fertilizer.
Cattle farm : Revenue from the cattle farm increased by $2,906,622 (or 82.70%) to $6,421,161 for the three months ended June 30, 2013 from $3,514,539 for the three months ended June 30, 2012. The increase was primarily to the increase of sales due to the increase of cattle being grown in the Cattle Farm 1.
Corporate and others : Revenues from corporate and others for the three months ended June 30, 2013 increased by $9,537,638 from $0 for the three months ended June 30, 2012. The increase is due primarily to the increase of consulting and services being contracted and the increase of sales through trading of the imported frozen and fresh seafood for the three months ended June 30, 2013.
Cost of Goods Sold
Cost of goods sold increased by $23,219,843 (or 196.94%) to $35,009,882 for the three months ended June 30, 2013 from $11,790,039 for the three months ended June 30, 2012. The increase was primarily due to the Company increasing its scale of operations in terms of our fishery, plantation, beef, organic fertilizer, cattle farm, beef and corporate and others for three months ended June 30, 2013 as compared to the three months ended June 30, 2012.
The following chart illustrates the changes by category from the three months ended June 30, 2013 to three months ended June 30, 2012.
| Cost of Goods Sold | | | | | | | | | | | | | 2013 | | | 2012 | | | | | | Category | | Q2 | | | Q2 | | | Difference | | | | | $ | | | $ | | | $ | | | Fishery | | | 13,773,395 | | | | 6,592,310 | | | | 7,181,085 | | | | | | | | | | | | | | | | | Plantation | | | 1,260,957 | | | | 558,348 | | | | 702,609 | | | | | | | | | | | | | | | | | Beef | | | 5,852,877 | | | | 2,667,740 | | | | 3,185,137 | | | | | | | | | | | | | | | | | Organic Fertilizer | | | 5,040,172 | | | | 1,063,207 | | | | 3,976,965 | | | | | | | | | | | | | | | | | Cattle farm | | | 3,315,692 | | | | 908,434 | | | | 2,407,258 | | | | | | | | | | | | | | | | | Corporate and others | | | 5,766,789 | | | | - | | | | 5,766,789 | | | | | | | | | | | | | | | | | Total | | | 35,009,882 | | | | 11,790,039 | | | | 23,219,843 | |
Fishery : Cost of goods sold from fishery increased by $7,181,085 (or 108.93%) to $13,776,395 for the three months ended June 30, 2013 from $6,592,310 for the three months ended June 30, 2012. The increase was primarily due to an increase in the sales relating to the increase in volume of fish production of our fish farms for the three months ended June 30, 2013 compared to the three months ended June 30, 2012.
Plantation : Cost of goods sold from plantation of flowers increased by $702,609 (or 125.84%) to $1,260,957 for the three months ended June 30, 2013 from $558,348 for the three months ended June 30, 2012. The increase was primarily due to cost increases in farm labor, logistics and associated general overhead of operation due to the related increase in sales.
Beef : Cost of goods sold from beef increased by $3,185,137 (or 119.39%) to $5,852,877 for the three months ended June 30, 2013 from $2,667,740 for the three months ended June 30, 2012.The increase was primarily due to the increased sales volume of cattle, which led to a corresponding increase in the cost of sales.
Organic fertilizer : Cost of goods sold from organic fertilizer increased by $3,976,965 (or 374.05%) to $5,040,172 for the three months ended June 30, 2013 from $1,063,207 for the three months ended June 30, 2012. The increase was primarily due to the related increase of sales.
Cattle farm : Cost of goods sold from cattle farm increased by $2,407,258 (or 264.99%) to $3,315,692 for the three months ended June 30, 2013 from $908,434 for the three months ended June 30, 2012. The increase primarily was due to the increase of cattle being grown and sold by the Cattle Farm 1 for the three months ended June 30, 2013.
Corporate and others : Cost of sales for the three months ended June 30, 2013 increased by $5,766,789 from $0 for the three months ended June 30, 2012. The increase is due primarily to the corresponding increase of sales and trades and consulting services for the three months ended June 30, 2013.
Gross Profit
Gross profit increased by $5,832,199 or 43.02% to $19,390,447 for the three months ended June 30, 2013 from $13,558,248 for the three months ended June 30, 2012. The increase was primarily due to the corresponding increases in revenues from our plantation, beef, organic fertilizer, cattle farm and beef and corporate and others operations.
The following chart illustrates the changes by category from the three months ended June 30, 2013 compared to the three months ended June 30, 2012.
| Gross profit | | | | | | | | | | | | | | | | | | | | | | | | 2013 | | | 2012 | | | | | | Category | | Q2 | | | Q2 | | | Difference | | | | | $ | | | $ | | | $ | | | Fishery | | | 4,130,711 | | | | 9,207,455 | | | | (5,076,744 | ) | | | | | | | | | | | | | | | | Plantation | | | 2,294,029 | | | | 1,523,515 | | | | 770,514 | | | | | | | | | | | | | | | | | Beef | | | 1,475,194 | | | | 846,799 | | | | 628,395 | | | | | | | | | | | | | | | | | Organic fertilizer | | | 4,578,135 | | | | 1,106,947 | | | | 3,471,188 | | | | | | | | | | | | | | | | | Cattle farm | | | 3,105,469 | | | | 873,532 | | | | 2,231,937 | | | | | | | | | | | | | | | | | Corporate and others | | | 3,806,909 | | | | - | | | | 3,806,909 | | | | | | | | | | | | | | | | | Total | | | 19,390,447 | | | | 13,558,248 | | | | 5,832,199 | |
Fishery : Gross profit of the fishery decreased by $4,130,711 (or 55.13%) to $4,130,711 for the three months ended June 30, 2013 from $9,207,455 for the three months ended June 30, 2012. The decrease was primarily due to (i) part of the sales from fishery segment was reallocated to a new segment marked “Corporate and others” amounting to $3,806,909 and (ii) the decrease of the Gross Profit by $1,269,835 for the three months ended June 30, 2013 was due primarily to the decrease in the sales prices of sleepy cod fish dropping from $27/kg during the three months ended June 30, 2012 to $15.3/Kg during the three months ended June 30, 2013.
Plantation : Gross profit from the plantation increased by $770,514 (or 50.57%) to $2,294,029 for the three months ended June 30, 2013 from $1,523,515 for the three months ended June 30, 2012. The increase was due mainly to the increase of wholesale prices both on dried and fresh flowers and the increase of production of flowers.
Beef : Gross profit from beef increased by $628,395 (or 74.21%) to $1,475,194 or for the three months ended June 30, 2013 from $846,799 for the three months ended June 30, 2012 which was due primarily to the natural growth of operation.
Organic fertilizer : Gross profit from organic fertilizer increased by $3,471,188 (or 313.58%) to $4,578,135 for the three months ended June 30, 2013 from $1,106,947 for the three months ended June 30, 2012. The increase was primarily due to the increase of fertilizer sales by HSA’s new production factory.
Cattle farm : Gross profit from cattle farm development increased by $2,231,937 (or 255.51%) to $3,105,469 for the three months ended June 30, 2013 from $873,532 for the three months ended June 30, 2012. The increase was primarily due to the increase in the number of cattle being grown and sold by Cattle Farm 1 during the three months ended June 30, 2013.
Corporate and others: Gross profit from the corporate and others increased by $3,806,909 for the three months ended June 30, 2013 from $0 for the three months ended June 30, 2012; the increase was due primarily to the fact that part of the Fishery segment’s sales in consulting service and trading of fish sales were reallocated to this segment for the three months ended June 30, 2013.
General and Administrative Expenses and Interest Expenses
General and administrative expenses (including depreciation and amortization) decreased by $1,127,374 to $1,663,262 for the three months ended June 30, 2013 from $2,735,677 for the three months ended June 30, 2012. The decrease was primarily due to the decrease in wages and salaries payments paid as incentive compensation to our staff by the issuance of shares amounting to $666,778 for the three months ended June 30, 2012 compared to $90,600 for the three months ended June 30, 2013 and included in the miscellaneous were payments for overseas professional services of $781,684 for the three months ended June 30,2012 whereas payments for overseas professional services were billed under Office and corporate expenses instead of miscellaneous for the three months ended June 30, 2013.
The following chart illustrates the changes by category from the three months ended June 30, 2013 compared to the three months ended June 30, 2012.
| Category | | 2013 Q2 | | | 2012 Q2 | | | Difference | | | | | $ | | | $ | | | $ | | | Office and corporate expenses | | | 590,182 | | | | 309,685 | | | | 280,497 | | | | | | | | | | | | | | | | | Wages and salaries | | | 375,374 | | | | 918,205 | | | | (542,831 | ) | | | | | | | | | | | | | | | | Traveling and related lodging | | | 20,513 | | | | 8,119 | | | | 12,394 | | | | | | | | | | | | | | | | | Motor vehicles expenses and local transportation | | | 44,257 | | | | 16,750 | | | | 27,507 | | | | | | | | | | | | | | | | | Entertainments and meals | | | 36,832 | | | | 35,519 | | | | 1,313 | | | | | | | | | | | | | | | | | Others and miscellaneous | | | 77,827 | | | | 897,586 | | | | (819,759 | ) | | | | | | | | | | | | | | | | Depreciation and amortization | | | 463,319 | | | | 549,814 | | | | (86,495 | ) | | | | | | | | | | | | | | | | Sub-total | | | 1,608,304 | | | | 2,735,677 | | | | (1,127,374 | ) | | | | | | | | | | | | | | | | Interest expenses | | | 54,958 | | | | - | | | | 54,958 | | | | | | | | | | | | | | | | | Total | | | 1,663,262 | | | | 2,735,677 | | | | (1,072,416 | ) |
Depreciation and Amortization
Depreciation and Amortization increased by $56,088 (or 6.13%) to $970,023 for the three months ended June 30, 2013 from $913,935 for the three months ended June 30, 2013. The increase was primarily due to the increase of depreciation by $206,066 to $331,596 for the six months ended June 30, 2013 from depreciation of $125,530 for the three months ended June 30, 2012, and the decrease of amortization by $149,978 to $638,427 for three months ended June 30, 2013 from amortization of $788,405 for the three months ended June 30, 2012.
In this respect, total depreciation and amortization amounted to $970,023 for the three months ended June 30, 2013, out of which amount, $463,319 was booked under General and administration expenses and $506,704 was booked under cost of goods sold; whereas total depreciation and amortization was at $913,935 for the three months ended June 30, 2012 and out of which amount, $549,814 was booked under General and Administration expenses and $364,121 was booked under cost of goods sold.
Gain on extinguishment of debts
The Company entered into several agreements with third parties to settle debts by issuance of the Company’s common stock. The shares issued by the Company were valued at the trading price of the stock on the date the shares were issued. The Company has reported $498,025 and $562,361 as gain on the extinguishment of debts for the three months ended June 30, 2013 and 2012, respectively.
Part B.Consolidated Results of Operations for the six months ended June 30, 2013 compared to the six months ended June 30, 2012
Revenues
Revenues increased by $68,179,777 (or 164.97%) to $109,508,080 for the six months ended June 30, 2013 from $41,328,303 for the six months ended June 30, 2012. The increase was primarily due to the increase of revenue generated from our fishery, plantation, beef, organic fertilizer, cattle farm and corporate and others operations and the maturity of ongoing divisional businesses improving their revenues.
The following chart illustrates the changes by category from the six months ended June 30, 2013 to June 30, 2012.
| Revenue | | | | | | | | | | | | | 2013 | | | 2012 | | | | | | Category | | Q1- Q2 | | | Q1-Q2 | | | Difference | | | | | $ | | | $ | | | $ | | | Fishery | | | 42,122,633 | | | | 26,894,374 | | | | 15,228,259 | | | | | | | | | | | | | | | | | Plantation | | | 3,554,986 | | | | 2,081,863 | | | | 1,473,123 | | | | | | | | | | | | | | | | | Beef | | | 14,123,908 | | | | 7,445,425 | | | | 6,678,483 | | | | | | | | | | | | | | | | | Organic fertilizer | | | 17,700,369 | | | | 2,183,215 | | | | 15,517,154 | | | | | | | | | | | | | | | | | Cattle farm | | | 14,783,718 | | | | 2,723,426 | | | | 12,060,292 | | | | | | | | | | | | | | | | | Corporate and others | | | 17,222,466 | | | | - | | | | 17,222,466 | | | | | | | | | | | | | | | | | Total | | | 109,508,080 | | | | 41,328,303 | | | | 68,179,777 | |
Fishery : Revenues from fishery increased by $15,228,259 (or 56.62%) from $26,894,373 for the six months ended June 30, 2012 to $42,122,633 for the six months ended June 30, 2013.The increase in fishery was primarily due to our increased contract service income from fishery and prawn development contract for the six months ended June 30, 2013.
Plantation : Revenues from plantation increased by $1,473,123 (or 70.76%) to $3,554,986 for the six months ended June 30, 2013 from $2,081,863 for the six months ended June 30, 2012. The increase in plantation was primarily due to the increase of sale of products derived from the increase of field production of flowers.
Beef : Revenues from beef increased by $6,678,483 (or 89.70%) to $14,123,908 for the six months ended June 30, 2013 from $7,445,425 for the six months ended June 30, 2012. The increase in beef sales was primarily due to the increase of cattle being grown in the farms during the six months ended June 30, 2013.
Organic fertilizer : Revenue from organic fertilizer increased by $15,517,154 or (710.75%) to $17,700,369 for the six months ended June 30, 2013 from $2,183,215 for the six months ended June 30, 2012. The increase was due to the increase of production and sales by the new fertilizer factory of HSA.
Cattle farm : Revenues from cattle farm increased by $12,060,292 (or 442.84%) to $14,783,718 for the six months ended June 30, 2013 from $2,723,426 for the six months ended June 30, 2012. The increase in cattle farm was primarily due to the increase of cattle being grown at Cattle Farm 1 during the six months ended June 30, 2013.
Corporate and others: Revenues increased by $17,222,466 for the six months ended June 30, 2013 from $0 for the six months ended June 30, 2012. The increase is due primarily that part of the Fishery segment’s sale deriving from consulting service, and seafood trading were reallocated to the segment of “Corporate and others” during the corresponding period.
Cost of Goods Sold
Cost of goods sold increased by $48,838,353 (or 247.20%) to $68,594,816 for the six months ended June 30, 2013 from $19,756,463 for the six months ended June 30, 2012. The increase was primarily due to the Company increased our fishery, plantation, beef, organic fertilizer, cattle farm and corporate and others operations for six months ended June 30, 2013 as compared for the six months ended June 30, 2012.
The following chart illustrates the changes by category from the six months ended June 30, 2013 to June 30, 2012.
| Cost of goods sold | | | | | | | | | | | | | 2013 | | | 2012 | | | | | | Category | | Q1- Q2 | | | Q1-Q2 | | | Difference | | | | | $ | | | $ | | | $ | | | Fishery | | | 28,354,892 | | | | 12,090,750 | | | | 16,264,142 | | | | | | | | | | | | | | | | | Plantation | | | 1,260,957 | | | | 558,348 | | | | 702,609 | | | | | | | | | | | | | | | | | Beef | | | 9,633,534 | | | | 4,970,923 | | | | 4,662,611 | | | | | | | | | | | | | | | | | Organic fertilizer | | | 9,132,048 | | | | 1,075,329 | | | | 8,056,719 | | | | | | | | | | | | | | | | | Cattle farm | | | 8,913,731 | | | | 1,061,113 | | | | 7,852,618 | | | Corporate and others | | | 11,299,654 | | | | | | | | 11,299,654 | | | | | | | | | | | | | | | | | Total | | | 68,594,816 | | | | 19,756,463 | | | | 48,838,353 | |
Fishery : Cost of goods sold from fishery increased by $16,264,142 (or 134.52%) to $28,354,892 for the six months ended June 30, 2013 from $12,090,750 for the six months ended June 30, 2012. The increase of cost of sales of fishery was primarily due to the related increase of fish production during the six months ended June 30, 2012.
Plantation : Cost of goods sold from plantation increased by $702,609 (or 125.84%) to $1,260,957 for the six months ended June 30, 2013 from $558,348 for the six months ended 30 June 2012. The increase in cost of sales of the plantation was primarily due to the increase of corresponding production of flowers.
Beef : Revenues from beef increased by $4,662,611or 93.80%) to $9,633,534 for the six months ended June 30, 2013 from $4,970,923 for the six months ended June 30, 2012. The increase in cost of sales of the beef was primarily due to the increase of the corresponding increase of sale derived from more cattle being grown in the farm during the six months ended June 30, 2013.
Organic fertilizer : Cost of goods sold from organic fertilizer increased by $8,056,719 (or 749.23%) to $9,132,048 for the six months ended June 30, 2013 from $1,075,329 for the six months ended June 30, 2012. The increase was due to the increase of fertilizer production from the new fertilizer factory of HSA during the six months ended June 30, 2013.
Cattle farm : Cost of goods sold from cattle farm increased by $7,852,618 (or 740.04%) to $8,913,731 for the six months ended 30 June 2013from $1,061,113 for the six months ended 30 June 2012. The increase in cattle farm was primarily due to the increase of production having more being grown in Cattle Farm 1 during the six months ended June 30, 2013.
Corporate and others: Cost of goods sold increased by $11,299,654 for the six months ended June 30, 2013 from $0 for the six months ended June 30, 2012. The increase is due primarily to the fact that that part of the Fishery segment’s sales deriving from consulting services, and seafood trading were reallocated to the segment of “Corporate and others” during the six months ended June 30, 2013 as such enhancing corresponding increase in cost of sales accordingly.
Gross Profit
Gross profit increased by $19,341,424 (or 89.66%) to $40,913,264 for the six months ended June 30, 2013 from $21,571,840 for the six months ended June 30, 2012. The increase was primarily due to the corresponding increase in scale of operation of revenues from plantation, beef, organic fertilizer, cattle farm, Corporate and others.
The following chart illustrates the changes by category from the six months ended June 30, 2013 to June 30, 2012.
The gross profit by category is as follows:
| Gross profit | | | | | | | | | | | | | 2013 | | | 2012 | | | | | | Category | | Q1- Q2 | | | Q1- Q2 | | | Difference | | | | | $ | | | $ | | | $ | | | Fishery | | | 13,767,741 | | | | 14,803,623 | | | | (1,035,882 | ) | | Plantation | | | 2,294,029 | | | | 1,523,515 | | | | 770,514 | | | | | | | | | | | | | | | | | Beef | | | 4,490,374 | | | | 2,474,502 | | | | 2,015,872 | | | | | | | | | | | | | | | | | Organic fertilizer | | | 8,568,321 | | | | 1,107,887 | | | | 7,460,434 | | | | | | | | | | | | | | | | | Cattle farm | | | 5,869,987 | | | | 1,662,313 | | | | 4,207,674 | | | | | | | | | | | | | | | | | Corporate and others | | | 5,922,812 | | | | - | | | | 5,922,812 | | | | | | | | | | | | | | | | | Total | | | 40,913,264 | | | | 21,571,840 | | | | 19,341,424 | |
Fishery : Gross profit from fishery decreased by $1,035,882 (or 7%) from $13,767,741 for the six months ended June 30, 2013from $14,803,623 for the six months ended June 30, 2012. The decrease in fishery was primarily due to the decrease of sales prices of sleepy cod fish falling from the average of $27/Kg for the six months ended June 30, 2012 to its current average of $15.3/Kg for the six months ended June 30, 2013.
Plantation : Gross profit from plantation increased by $770,514 (or 50.57%) to $2,294,029 for the six months ended June 30, 2013 from $1,523,515 for the six months ended June 30, 2012. The increase in plantation was primarily due to the increase of sales due to increase of production of flowers at the farm during the six months ended June 30, 2013.
Beef : Gross profit from beef increased by $2,015,872 (or 81.46%) to $4,490,374 for the six months ended June 30, 2013 from $2,474,502 for the six months ended June 30, 2012. The increase in beef was primarily due to increased sales of cattle.
Organic fertilizer : Gross profit from organic fertilizer increased by $7,460,434 (or 673.39%) to $8,568,321 for the six months ended June 30, 2013 from $1,107,887 for the six months ended June 30, 2012. The increase was due to the increase of sales of fertilizer produced by the new fertilizer of HSA during the six months ended June 30, 2013.
Cattle farm : Gross profit from cattle farm increased by $4,207,674 (or 253.12%) to $5,869,987 for the six months ended June 30, 2013 from $1,662,313 for the six months ended June 30, 2012. The increase of gross profit in cattle farm was primarily due to the increase of sales in cattle and having more cattle being grown in Cattle Farm 1 in the six months ended June 30, 2013.
Corporate and others: Gross profit increased by $5,922,812 for the six months ended June 30, 2013 from $0 for the six months ended June 30, 2012. The reason for the increase is primarily the fact that part of the fishery segment’s sales in consulting services and trading of imported seafood were reallocated to this segment, thereby increasing the gross profit generated.
General and Administrative Expenses and Interest Expenses
General and administrative expenses and interest expenses (including depreciation and amortization) decreased by $1,032,298 (or 23.08%) to $3,925,702 for the six months ended June 30, 2013 from $4,957,999 for the six months ended June 30, 2012. The decrease was primarily due to decrease in wages and salaries payments paid for incentive compensation to our staff by the issuance of shares amounting to $1,333,556 for the six months ended June 30,2012 compares to $181,200 for the six months ended June 30, 2013 and including in the miscellaneous were payments for overseas professional services of $781,684 for the six months ended June 30, 2012 whereas payments for overseas professional services were billed under Office and corporate expenses instead of miscellaneous for the six months ended June 30, 2013.
| Category | | 2013 Q1-Q2 | | | 2012 Q1-Q2 | | | Difference | | | | | $ | | | $ | | | $ | | | Office and corporate expenses | | | 1,328,662 | | | | 1,151,439 | | | | 177,223 | | | Wages and salaries | | | 962,101 | | | | 1,863,290 | | | | (901,189 | ) | | Traveling and related lodging | | | 34,998 | | | | 20,276 | | | | 14,722 | | | Motor vehicles expenses and local transportation | | | 73,893 | | | | 37,200 | | | | 36,693 | | | Entertainments and meals | | | 64,850 | | | | 52,395 | | | | 12,455 | | | Others and miscellaneous | | | 300,881 | | | | 929,902 | | | | (629,021 | ) | | Depreciation and amortization | | | 1,048,307 | | | | 903,498 | | | | 144,809 | | | Sub-total | | | 3,813,692 | | | | 4,957,999 | | | | (1,144,308 | ) | | Interest expenses | | | 112,010 | | | | - | | | | 112,010 | | | | | | | | | | | | | | | | | Total | | | 3,925,702 | | | | 4,957,999 | | | | (1,032,298 | ) |
Depreciation and Amortization
Depreciation and amortization increase by $293,635 (or 22.22%) to $1,614,965 for the six months ended June 30, 2013 from $1,321,330 for the six months ended June 30, 2012. The decrease was primarily due to the increase of depreciation by $455,517 to $638,671 for the six months ended June 30, 2013 from depreciation of $183,154 for the six months ended June 30, 2012, and the decrease of amortization by $161,882 to $976,294 for six months ended June 30, 2013 from amortization of $1,138,176 for the six months ended June 30, 2012.
In this respect, total depreciation and amortization amounted to $1,614,965 for the six months ended June 30, 2013, out of which amount, $1,048,307 was booked under general and administration expenses and $566,658 was booked under cost of goods sold; whereas total depreciation and amortization was at $1,321,330 for the six months ended June 30, 2012 and out of which amount, $903,498 was booked under general and administration expenses and $417,832 was booked under cost of goods sold.
Gain (loss) of extinguishment of debts
Any deficit (excess) of the fair value of the shares over the carrying cost of the debt has been reported as a gain (loss) on the extinguishment of debts of $1,051,013 and $817,513 has been credited (charged) to operations for the six months ended June 30, 2013 and 2012, respectively.
Part C. More detailed segment information and analysis of the financial statements for the six months ended June 30, 2013
This Part C discusses and analyzes certain items that we believe would assist our shareholders in obtaining a better understanding on the Company’s results of operations and financial condition:
(A) Breakdown of Balance Sheet items (1) on total current assets:
| | | As of June 30,
2013 | | | Note | | | | | $ | | | | | | Cash and cash equivalents | | | 9,391,449 | | | | | | | Inventories | | | 18,887,433 | | | | 1 | | | Cost and estimated earnings in excess of billings on uncompleted contracts | | | 1,286,775 | | | | | | | Deposits and prepaid expenses | | | 52,091,997 | | | | 2 | | | Accounts receivable, net of allowance for doubtful debts | | | 82,373,870 | | | | 3 | | | Other receivables | | | 6,374,272 | | | | 4 | | | | | | 170,405,796 | | | | | |
Note (1): Breakdown of Inventories
| | As of June 30, 2013| | | 2018 | | | | | | | | Construction in progress | | | | | | - Office, warehouse and organic fertilizer plant in HSA | | $ | 7,285- | | | - Oven room, road for production of dried flowers | | | - | | | - Organic fertilizer and bread grass production plant and office building | | | - | | | - Rangeland for beef cattle and office building | | | 12,508,242 | | | - Fish pond and breeding factory | | | - | | | | | $ | 12,515,527 | |
Note (14): Land Use Rights, net of accumulated amortization: | Item | | Owner | | Location | | Acres | | | Date Acquired | | Tenure | | Expiry
dates | | Cost $ | | | Monthly
amortization $ | | | 2018.12.31
Balance $ | | | Nature of
ownership | | Nature of
project | | Hunan lot1 | | HSA | | Ouchi Village, Fenghuo Town, Linli County | | | 31.92 | | | 4/5/2011 | | 43 | | 4/4/2054 | | | 242,703 | | | | 470 | | | | 198,960 | | | Lease | | Fertilizer production | | Hunan lot2 | | HSA | | Ouchi Village, Fenghuo Town, Linli County | | | 247.05 | | | 7/1/2011 | | 60 | | 6/30/2071 | | | 36,666,141 | | | | 50,925 | | | | 32,082,873 | | | Management Right | | Pasture growing | | Hunan lot3 | | HSA | | Ouchi Village, Fenghuo Town, Linli County | | | 8.24 | | | 5/24/2011 | | 40 | | 5/23/2051 | | | 378,489 | | | | 789 | | | | 305,945 | | | Land Use Rights | | Fertilizer production | | Hunan lot4 | | HS.A | | Ouchi Village, Fenghuo Town, Linli County | | | 24.71 | | | 6/1/2018 | | 50 | | 5/31/2068 | | | 3,021,148 | | | | 5,035 | | | | 2,985,901 | | | Lease | | Cattle fattening | | Guangdong lot 1 | | JHST | | Yane Village, Liangxi Town, Enping City | | | 8.23 | | | 8/10/2007 | | 60 | | 8/9/2067 | | | 1,064,501 | | | | 1,478 | | | | 861,950 | | | Management Right | | HU Plantation | | Guangdong lot 2 | | JHST | | Nandu Village of Yane Village, Liangxi Town, Enping City | | | 27.78 | | | 3/14/2007 | | 60 | | 3/13/2067 | | | 1,037,273 | | | | 1,441 | | | | 832,700 | | | Management Right | | HU Plantation | | Guangdong lot 3 | | JHST | | Nandu Village of Yane Village, Liangxi Town, Enping City | | | 60.72 | | | 3/14/2007 | | 60 | | 3/13/2067 | | | 2,267,363 | | | | 3,149 | | | | 1,820,189 | | | Management Right | | HU Plantation | | Guangdong lot 4 | | JHST | | Nandu Village of Yane Village, Liangxi Town, Enping City | | | 54.68 | | | 9/12/2007 | | 60 | | 9/11/2067 | | | 2,041,949 | | | | 2,836 | | | | 1,656,248 | | | Management Right | | HU Plantation | | Guangdong lot 5 | | JHST | | Jishilu Village of Dawan Village,Juntang Town, Enping City | | | 28.82 | | | 9/12/2007 | | 60 | | 9/11/2067 | | | 960,416 | | | | 1,334 | | | | 779,004 | | | Management Right | | HU Plantation | | Guangdong lot 6 | | JHST | | Liankai Village of Niujiang Town, Enping City | | | 31.84 | | | 1/1/2008 | | 60 | | 12/31/2068 | | | 821,445 | | | | 1,141 | | | | 670,846 | | | Management Right | | Fish Farm | | Guangdong lot 7 | | JHST | | Nandu Village of Yane Village, Liangxi Town, Enping City | | | 41.18 | | | 1/1/2011 | | 26 | | 12/31/2037 | | | 5,716,764 | | | | 18,323 | | | | 3,957,760 | | | Management Right | | HU Plantation | | Guangdong lot 8 | | JHST | | Shangchong Village of Yane Village, Liangxi Town, Enping City | | | 11.28 | | | 1/1/2011 | | 26 | | 12/31/2037 | | | 1,566,393 | | | | 5,020 | | | | 1,084,426 | | | Management Right | | HU Plantation | | Guangdong lot 9 | | MEIJI | | Xiaoban Village of Yane Village, Liangxi Town, Enping City | | | 41.18 | | | 4/1/2011 | | 20 | | 3/31/2031 | | | 5,082,136 | | | | 21,176 | | | | 3,112,808 | | | Management Right | | Cattle Farm | | Qinghai lot 1 | | SJAP | | No. 498, Bei Da Road, Chengguan Town of Huangyuan County,Xining City, Qinghai Province | | | 21.09 | | | 11/1/2011 | | 40 | | 10/30/2051 | | | 527,234 | | | | 1,098 | | | | 397,269 | | | Land Use Right & Building ownership | | Cattle farm, fertilizer and livestock feed production | | Guangdong lot 10 | | JHST | | Niu Jiang Town, Liangxi Town, Enping City | | | 6.27 | | | 3/4/2013 | | 10 | | 3/3/2023 | | | 489,904 | | | | 4,083 | | | | 204,127 | | | Management Right | | Processing factory | | Guangdong lot 11 | | CA | | Da San Dui Wei ,You Nan Village, Conghua District of Guangzhou City | | | 33.28 | | | 10/28/2014 | | 30 | | 10/27/2044 | | | 4,453,665 | | | | 12,371 | | | | 3,822,729 | | | Management Right | | Agriculture | | | | JHST | | Land improvement cost incurred | | | | | | 12/1/2013 | | | | | | | 3,914,275 | | | | 6,155 | | | | 3,538,849 | | | Management Right | | HU Plantation | | Exchange difference | | | | | | | | | | | | | | | | | (4,472,623 | ) | | | | | | | (4,498,303 | ) | | | | | | | | | | | | | 654 | | | | | | | | | | 65,779,178 | | | | 136,824 | | | | 53,814,281 | | | | | |
| - 46 - | | | | $ | | Sleepy cod and eels | | | 5,432,990 | | Bread grass | | | 709,366 | | Beef cattle | | | 2,985,965 | | Organic fertilizer | | | 702,836 | | Forage for cattle and consumable | | | 3,144,896 | | Raw materials for bread grass and organic fertilizer | | | 5,237,102 | | Unharvested HU plantation | | | 674,278 | | | | | 18,887,433 | |
Note (2) Breakdown of Deposits and Prepaid Expenses
|
Note (15) Other Receivables | | | 2018 | | | Note | | | | | | | | | Advanced to employees | | $ | 561,330 | | | | | Advanced to suppliers | | | 3,831,926 | | | 15A | | Advanced to customers | | | 14,114,249 | | | 15B | | Advanced to developers | | | 453,155 | | | 15C | | Others | | | 9,346,866 | | | 15D | | | | $ | 28,307,526 | | | |
15A. A portion of this consists of molds, parts and components necessary to manufacture and fit-out various types of filters in the APM systems requiring suppliers (manufacturers) to carry additional inventory. This inventory is billed to the Company at such times when the components are called to manufacture the APM filtration systems. Until then, the Company provides advances to the supplier to manufacture the components and hold in inventory on the Company’s behalf until the components are called and billed to the Company, i.e., offsetting the amount invoiced with the proceeds received in advance. 15B. Advanced to customers refers to our distribution agents (i.e., the Shanghai distribution center, the Guangzhou distribution centers, etc.) that CA was their turnkey contractor built and developed said centers for and on behalf of their respective owners with part of their respective capital expenditure in development costs are still outstanding as of December 31, 2018. These are similar arrangement as in the Fishery Farms developments that CA has the option to acquire up to 75% of stakes on the assets and operation of said distribution agents: however as of December 31, 2018 CA has yet to exercise any of said options as such these sum are recorded as other receivables. 15C. The Developers, referring to ‘Advance to developers” in the table, above are mostly owners and investors of other development projects (i.e. Cattle farms, restaurants and trade centers etc.) that were developed by SIAF and MEIJI as their respective “turkey contractor” during the past several years. The Company has the option to convert/effectuate these advances in these Project companies as an SFJVC investee, similar to CA’s fishery development project. 15D. Others is referring to mainly other receivables under SJAP’s account comprising various debts due from 56 third parties (that are clients and associates of SJAP) over the years with QZH (the variable interest of SJAP) owing the majority portion amounting $5.63 million as at date of this report. Whereas under the disposal sales agreement of QZH dated December 30, 2017, QZH is to repay said $5.63 million gradually from sale proceeds of its capital assets that QZH sells from time to time. Note (16) Current Liabilities: | | | 2018 | | | Note | | Current liabilities | | As of June 30, 2013 | | | | Note | | | | $ | | | | | | Deposits for | | | | | | | | | Deposits for Prepayments for purchases of equipment | | | 2,059,776 | | | | | | Deposits for- acquisition of land use right | | | 7,826,508 | | | | 2A | | Deposits for- inventory purchases | | | 4,940,767 | | | | | | Deposits for- aquaculture contract | | | 1,303,607 | | | | | | Deposits for- building materials | | | 1,281,935 | | | | | | Deposits for- proprietary technology | | | 2,254,839 | | | | | | Prepayments for construction in progress | | | 19,658,537 | | | | | | Shares issued for employee compensation and overseas professional fees | | | 90,600 | | | | | | Temporary deposits paid to entities for investments in future Sino Foreign Joint Venture companies | | | 7,704,670 | | | | | | Miscellaneous | | | 4,970,758 | | | | | | | | | 52,091,997 | | | | | | | Accounts payable and accrued expenses | | | 8,280,358 | | | | | Billings in excess of costs and estimated earnings on uncompleted contracts | | | 5,348,293 | | | | | Due to a director | | | 2,046,499 | | | | | Other payables | | | 42,523,811 | | | 16A | | Borrowings - Short term bank loans | | | 4,589,828 | | | | | | | | | | | | Derivative liability | | | 2,100 | | | | | Convertible note payable | | | 3,894,978 | | | 16B | | Income tax payable | | | - | | | | | | | 66,685,867 | | | |
Note (16A): Analysis of other payables (current liabilities): As of December 31, 2018, we have other payables totaling $42,523,811, comprised of the following: (1). Straight note payable of $27,178,000 represents a 10.5% Convertible Note in the aggregate principal amount of up to $33,300,000 issued on August 29, 2014. On July 18, 2017, the Company and the note holder entered into a restructuring agreement regarding the settlement of the Note as follows: | (i) | 50% in cash settlement of $15,589,000 to be paid in monthly installments. |
Note (2A) Breakdown | (ii) | The other 50% balance of Deposit for- acquisition$15,589,000 to be settled by the issuance of Land Use Right:As5,196,333 common shares of June 30, 2013, we have $7,826,508 for a deposit paid for the acquisitionCompany and 400,000 shares of a Land Use Right derived from the following transactions:Tri-way Industries Limited.
|
As of the date of December 31, 2018, the Company has paid $4 million with $11,589,000 remaining owed on the $15,589,000 balance. Subsequently on February 3, 2019 the said repayment of $4 million was readjusted to $3.69 million. l We filed an 8-K on December 12, 2018 that disclosed that we received a notice of default (the “Notice”) from Euro China Capital AB, or ECAB, on December 12, 2018, which contended that a new Note was in default because (i) SIAF had not made repayments on the new Note in the manner prescribed by its terms, and (ii) of certain other unspecified events of default. While ECAB stated in the Notice that it has not elected to accelerate the right to repayment of the entire principal amount, including accrued but unpaid interest on the ECAB Note, it reserves the right to do so. Prior to receipt of the Notice from ECAB, the Company was attempting to reach a negotiated settlement with ECAB. Notwithstanding receipt of the Notice, the Company hopes to continue to work with ECAB to settle its obligations under the ECAB Note. The Company intends to vigorously defend its position should a mutually amicable resolution prove unattainable. (2). As of the date of December 31, 2018 we have other payables due to various third parties totaling $15,345,811, comprising the following: (i). A loan was granted by a friendly third party on October 12, 2017 for $6 million that was recorded at later date by a loan agreement executed on February 18, 2019 for $6,301,480 (inclusive of an additional loan of $301,480 granted by the same third party on February 2, 2019. This loan is to be re-paid in 3 tranches inclusive of accrued interest calculated to time of repayments comprising Tranche (1) for $2,300,000, Tranche (2) for $2,350,000 and Tranche (3) for $2,746,702 on August 31, 2019, October 30, 2019 and December 31, 2019, respectively, for total repayment amount of $7,346,702. (ii). A number of friendly third parties granted various advances and extended debts to the Company during the past years, and as at the date of December 31, 2018 the total loan and debts recorded under other payables of the Company’s account amounting to $9,345,811 collectively that in general do not have fixed terms of repayments and interest. Note (16B): Analysis of Convertible Note (“CB Notes”) Payable) in Other payables (current liabilities): As of the date of this prospectus there are various CB Notes amounting to $3,894,978 collectively. Subsequently as of March 31, 2019 there is $3,303,000 in CB Notes remaining outstanding collectively and out of which $2,130,000 is secured by 2,666,735 shares due for redemption and the return of collateralized shares on September 23, 2019; the balance of $1,173,000 are CB Notes due to 5 holders that will be settled either by cash or shares at prevailing market prices or a combination thereof during 2019. Part B. MD & A on Unaudited Consolidated Balance Sheet of Continued Operations for the three months ended March 31, 2019 (Q1 2019) compared to the 12 months ended December 31, 2018.
| Consolidated Balance sheets | | March 31, 2019 | | | December 31, 2018 | | | Changes | | | Note | | | | | | | | | | | | | | | | | ASSETS | | | | | | | | | | | | | | | | | | Current assets | | | | | | | | | | | | | | | | | | Cash and cash equivalents | | | 305,721 | | | | 4,950,799 | | | | (4,645,078 | ) | | | 8 | | | Inventories | | | 56,402,108 | | | | 54,582,241 | | | | 1,819,867 | | | | 9 | | | Costs and estimated earnings in excess of billings on uncompleted contracts | | | 250,828 | | | | 250,828 | | | | - | | | | | | | Deposits and prepaid expenses | | | 53,290,057 | | | | 52,241,190 | | | | 1,048,867 | | | | 10.1 | | | Accounts receivable | | | 100,938,113 | | | | 101,652,131 | | | | (714,018 | ) | | | 11 | | | Other receivables | | | 31,103,922 | | | | 28,307,526 | | | | 2,796,396 | | | | 15 | | | Total current assets | | | 242,290,749 | | | | 241,984,715 | | | | 306,034 | | | | | | | Property and equipment | | | | | | | | | | | | | | | | | | Property and equipment, net of accumulated depreciation | | | 235,473,231 | | | | 230,645,659 | | | | 4,827,572 | | | | 12 | | | Construction in progress | | | 13,166,423 | | | | 12,515,527 | | | | 650,896 | | | | 13 | | | Land use rights, net of accumulated amortization | | | 54,289,629 | | | | 53,814,281 | | | | 475,348 | | | | 14 | | | Total property and equipment | | | 302,929,283 | | | | 296,975,467 | | | | 5,953,816 | | | | | | | Other assets | | | | | | | | | | | | | | | | | | Goodwill | | | 724,940 | | | | 724,940 | | | | - | | | | | | | Proprietary technologies, net of accumulated amortization | | | 8,816,670 | | | | 8,937,071 | | | | (120,401 | ) | | | | | | Investment in unconsolidated equity investee | | | 209,435,455 | | | | 207,074,626 | | | | 2,360,829 | | | | | | | Temporary deposit paid to entities for investments in future Sino Joint Venture companies | | | 34,894,047 | | | | 34,905,960 | | | | (11,913 | ) | | | 10.2 | | | Total other assets | | | 253,871,112 | | | | 251,642,597 | | | | 2,228,515 | | | | | | | Total assets | | | 799,091,144 | | | | 790,602,779 | | | | 8,488,365 | | | | | | | Current liabilities | | | | | | | | | | | | | | | | | | Accounts payable and accrued expenses | | | 10,425,270 | | | | 8,280,358 | | | | 2,144,912 | | | | 16 | A | | Billings in excess of costs and estimated earnings on uncompleted contracts | | | 5,407,136 | | | | 5,348,293 | | | | 58,843 | | | | | | | Due to a director | | | 259,193 | | | | 2,046,499 | | | | (1,787,306 | ) | | | | | | Other payables | | | 47,016,748 | | | | 42,523,811 | | | | 4,492,937 | | | | 16 | B | | Borrowings-Short term bank loan | | | 4,677,755 | | | | 4,589,828 | | | | 87,927 | | | | | | | Derivative liability | | | - | | | | 2,100 | | | | (2,100 | ) | | | | | | Convertible note payable | | | - | | | | 3,894,978 | | | | (3,894,978 | ) | | | | | | Income tax payable | | | - | | | | - | | | | | | | | | | | Total current liabilities | | | 67,786,102 | | | | 66,685,867 | | | | 1,100,235 | | | | 16 | | | Non-current liabilities | | | | | | | | | | | | | | | 17 | | | Other payables | | | 7,759,801 | | | | 7,792,774 | | | | (32,973 | ) | | | | | | Borrowing-Long term debt | | | 5,643,006 | | | | 5,536,938 | | | | 106,068 | | | | | | | Convertible note payable | | | | | | | | | | | | | | | | | | Total non-current liabilities | | | 13,402,807 | | | | 13,329,712 | | | | 73,095 | | | | | | | Stockholders’ equity | | | | | | | | | | | | | | | | | | Common stock | | | 49,976 | | | | 49,866 | | | | 110 | | | | | | | Additional paid-in capital | | | 181,533,919 | | | | 181,501,056 | | | | 32,863 | | | | | | | Retained earnings | | | 459,424,518 | | | | 458,811,844 | | | | 612,674 | | | | | | | Accumulated other comprehensive income | | | -5,316,005 | | | | -8,443,123 | | | | 3,127,118 | | | | | | | Treasury stock | | | -1,250,000 | | | | -1,250,000 | | | | - | | | | | | | Total SIAF Inc. and subsidiaries' equity | | | 634,442,408 | | | | 630,669,643 | | | | 3,772,765 | | | | | | | Non-controlling interest | | | 83,459,827 | | | | 81,890,220 | | | | 1,569,607 | | | | | | | Total stockholders' equity | | | 717,902,235 | | | | 712,559,863 | | | | 5,342,372 | | | | | | | Total liabilities and stockholders' equity | | | 799,091,144 | | | | 793,552,597 | | | | 5,538,547 | | | | | |
This Part B discusses and analyzes certain items that we believe would assist stakeholders in obtaining a better understanding of the Company’s results of operations and financial condition:
Note (B) Cash and Cash Equivalents The change in cash and cash equivalents amounted to $(4,645,078) derived from cash and cash equivalents of $305,721 and $4,950,799 as of March 31, 2019 and December 31, 2018, respectively. The difference in cash and cash equivalents between these two dates is primarily due to the decrease of sales revenues and profits while recovering from the impact caused by the heavy financial losses in 2017., however, the other corresponding factor is funding said losses that weakened the cash and cash equivalents. Note (9) Break down of inventories | | | March 31, 2019 | | | December 31, 2018 | | | Difference | | | | | $ | | | $ | | | $ | | | Bread grass | | | 666,989 | | | | 744,378 | | | | (77,389 | ) | | Beef cattle | | | 14,186,719 | | | | 11,561,117 | | | | 2,625,602 | | | Organic fertilizer | | | 14,616,370 | | | | 14,266,923 | | | | 349,447 | | | Forage for cattle and consumables | | | 7,605,777 | | | | 7,252,280 | | | | 353,497 | | | Raw materials for bread grass and organic fertilizer | | | 17,951,320 | | | | 18,885,258 | | | | (933,938 | ) | | Immature seeds | | | 1,374,933 | | | | 1,872,285 | | | | (497,352 | ) | | | | | | | | | | | | | | | | | | | 56,402,108 | | | | 54,582,241 | | | | 1,819,867 | |
The main increase in inventories came from changes in beef cattle (up $2.6m), which was primarily due to lower sales of cattle caused by low market prices in turn increased the inventory in cattle during the period. Note (10) Breakdown of Deposits and Prepaid Expenses The actual deposit and prepaid expenses increased by $1,048,867 from Q4 2018’s $752,241,190 to Q1 2019’s 53,290,057 $3,182,180 (or RMB20,000,000)| | | March 31, 2019 | | | December 31, 2018 | | | Difference | | | Note | | | | | $ | | | $ | | | $ | | | | | | Deposits for | | | | | | | | | | | | | | | | | - purchases of equipment | | | 2,196,214 | | | | 2,158,867 | | | | 37,347 | | | | | | - acquisition of land use rights | | | 178,200 | | | | 174,851 | | | | 3,349 | | | | | | - inventories purchases | | | 17,181,605 | | | | 16,921,188 | | | | 260,417 | | | | | | - construction in progress | | | 5,354,959 | | | | 4,789,035 | | | | 565,924 | | | | | | - issue of shares as collateral | | | 25,528,325 | | | | 24,928,324 | | | | 600,001 | | | | | | Shares issued for employee compensation and overseas professional and bond interest | | | 231,574 | | | | 643,457 | | | | (411,883 | ) | | | | | Others | | | 2,619,380 | | | | 2,625,468 | | | | (6,088 | ) | | | | | | | | 53,290,257 | | | | 52,241,190 | | | | 1,049,067 | | | | |
Note (11) Breakdown of Accounts receivable: | | | 2019Q1 | | | | | Accounts | | | | | | | | | | | | over 120 days and | | | | | | | | receivable | | | 0-30 days | | | 31-90 days | | | 91-120 days | | | less than 1 year | | | Over 1 year | | | | | $ | | | | | | | | | | | | | | | | | | Engineering consulting service (CA) | | | 61,849,210 | | | | 1,049,845 | | | | - | | | | 1,088,759 | | | | 16,421,061 | | | | 43,289,545 | | | Sales of imported seafood (SIAF) | | | 22,630,491 | | | | 5,738,444 | | | | 7,058,616 | | | | 9,833,432 | | | | - | | | | - | | | Sales of Cattle and Beef Meats (MEIJI) | | | 8,478,466 | | | | - | | | | 8,171,443 | | | | 307,023 | | | | - | | | | - | | | Sales of HU Flowers (Fresh & Dried) (JHST) | | | 852,098 | | | | 330,383 | | | | 517,751 | | | | - | | | | 3,964 | | | | - | | | Sales Fertilizer, Bulk Stock feed and Cattle by (SJAP) | | | 4,107,635 | | | | 795,851 | | | | 2,169,408 | | | | 664,614 | | | | 477,763 | | | | - | | | Sales Fertilizer from (HSA) | | | 3,020,213 | | | | 834,675 | | | | 1,637,249 | | | | - | | | | 548,289 | | | | - | | | | | | | | | | | | | | | | | | | | | | | | | | | | | Total | | | 100,938,113 | | | | 8,749,198 | | | | 19,554,466 | | | | 11,893,827 | | | | 17,451,077 | | | | 43,289,545 | |
Information on trading terms and provision for diminution in value of accounts receivable: The account receivable of CA’s C&S services totals US$61,849,210, wherein $1,049,845 lies within an aging period of 31 - 90 days, $1,088,759 within an aging period of 90-120 days, $16,421,061 within 120 days to one year, and $43,289,545 of over one year. | · | The $43,289,545 in outstanding receivables was forsettled by Tri-way through the full payment on June 6, 2012 forissuance of shares to CA representing 12.71% of the Land Use Right by HSAissued and outstanding shares of a blockTri-way. Further information of land measuring 150 Mu (approximately 25 acres of prime agriculture land) located at Linli District of Hunan Province within 10 Km of HSA’s complex. The process of application to register the said “Land Use Right” is in progress and is expected tothis exchange can be finalized officially on or before the end of year 2013 as such andfound in the interim priorCompany’s Annual Report on Form 10-K for its fiscal year ended December 31, 2018. |
| · | CA remains as the turnkey contractor appointed by Tri-way (that is the Master APM License Holder of China granted by CA for 50 years) to carryout development and construction work for APM and ODRAS fish farms (inclusive the Land Use RightMega farm APM project and other ODRAS farm projects) being officially registered, this payment is recorded as Deposit and Prepaid Expenses.developed for Tri-way. |
$190,930 (or RMB1,200,000) was paid by | · | The other account receivables are spread among 5 main subsidiaries and their respective subsidiaries within their own organization (i.e. SJAP as deposithas 5 and JHST has 2 subsidiaries, for the acquisitionexample), each of “Land Use Right” onthem carrying a block of land measuring 15 Mu (or 2.475 acres) located at Huangyuan district next to SJAP’s complex on October 15, 2012. This piece of land will be rezoned into Residential from its present status of agriculture and transferred from the Local Government (Huangyuan County) to SJAP to build new staff quarters; as such SJAP is waiting on the completion of such processes to finalize the said purchase of Land Use Right.$4,453,398 (or RMB 27,989,606) was the full payment Capital Award made for the purchase of the Land Use Right on a block of prime agriculture land measuring 235 Mu (approximately 38.5 acres) located at the Cong Hua District Guangzhou City in late October 2010. This block of land is part of a larger block of land (of some 500 acres) that was applying to become a subdivision; however in 2011 the Land Law was changed such that the said subdivision would require the approval of the central government instead of the approval by the local government alone prior to 2011, entailing a much longer approval process. Cong Hua District was rezoned as a suburb of the Guangzhou City in 2010 and is within close proximity of the Guangzhou City; as such management evaluates it as a valuable piece of land very suitable for the development of one of our agriculture projects.
The new block of land namely “Guangdong Lot 10 (referred to in our “Summary of Land Assets” of this report) is land zoned as “Industrial Land” that will be used by HST to expand its processing operation of the HU Plants and Immortal Vegetables and it has a tenurereceivable aging period of 10 years secured under a Management Right at the cost of RMB3,040,000 (equivalent to $490,322) that was paid fully; as such as at the period ended June 30, 2013 no additional deposit and prepayment was recorded.
Note (3) Breakdown of Accounts Receivable:
| | | As of June 30, 2013 | | | | | Accounts receivable | | | 0-30 days past due | | | 31-90 days past due | | | 91-120 days past due | | | over 120 days
and less than 1
year past due | | | | | $ | | | $ | | | $ | | | $ | | | $ | | | Consulting and Service (from 6 contracts) totaling | | | 49,195,415 | | | | 12,564,089 | | | | 27,954,719 | | | | 8,003,832 | | | | 672,775 | | | | | | | | | | | | | | | | | | | | | | | | | Sales of Fish (from Farms and from imports) | | | 10,962,674 | | | | 4,363,031 | | | | 3,399,821 | | | | 3,199,821 | | | | - | | | | | | | | | | | | | | | | | | | | | | | | | Sales of Cattle and Beef Meats (from Enping Farm) | | | 1,558,096 | | | | 16,390 | | | | 1,541,706 | | | | - | | | | - | | | | | | | | | | | | | | | | | | | | | | | | | Sales of HU Flowers (Dried) | | | 3,364,099 | | | | 2,912,015 | | | | 452,084 | | | | - | | | | - | | | | | | | | | | | | | | | | | | | | | | | | | Sales Fertilizer, Bulk Stock feed and Cattle by SJYL | | | 14,180,446 | | | | 4,861,406 | | | | 5,759,543 | | | | 3,542,171 | | | | 17,326 | | | | | | | | | | | | | | | | | | | | | | | | | Sales Fertilizer from H.S.A.. | | | 3,113,140 | | | | 847,118 | | | | 1,745,787 | | | | 505,689 | | | | 14,547 | | | | | | | | | | | | | | | | | | | | | | | | | Total Accounts Receivable | | | 82,373,870 | | | | 25,564,049 | | | | 40,853,660 | | | | 15,251,513 | | | | 704,648 | | | | | | | | | | | | | | | | | | | | | | | | | Percentage of total population | | | 100 | % | | | 31 | % | | | 50 | % | | | 19 | % | | | 1 | % |
Information on trading terms and provision for diminution in value of accounts receivable:
None of our accounts receivable is moreless than 12 months old. Receivables from revenue derived from consulting and services billed for work completed are within our normal trading terms capped within 180 days with our principal investor and thereforeterms. Thus, no diminution in value is required, as the credit quality of the receivable isreceivables are not in doubt.
|
Information on concentration of credit risk of revenue: We have 4 major long-term customers, referred to as referring to as Customer A, B, C and D in the financial statements who have accounted for 77.29% of our consolidated revenues for Q1 2019 as shown in the table below: | | | Three months ended March 31, 2019 | | | | | % of total Revenue | | | $ | | Customer’s Total Revenue | | | Customer A | | | 30.79 | % | | | | | 9,010,021 | | | Customer B | | | 12.94 | % | | | | | 3,787,039 | | | Customer C | | | 27.93 | % | | | | | 8,171,443 | | | Customer D | | | 5.63 | % | | | | | 1,647,468 | | | | | | | | | | | | | | | | | | 77.29 | % | | | | | 22,615,971 | |
Customer A is Shanghai Vigour Trading Co. Ltd., which is one of our main distributors selling most of our imported goods (inclusive of Beef and Seafood). During Q1 2019, we sold $9.0 million of goods to Shanghai Vigour representing 30.79% of our total revenue of $29.26 million derived mainly from Corporate and Others Division segment. Customer B is APNW through our divestment when Tri-way became an Associate Investee. The amount of $3.79 million shown above will be fully paid when Tri-way issues shares to offset this amount. Customer C is Mr. Zhen Runchi, who buys our fattened cattle to sell them in the Guangdong and Beijing cattle markets, and at the same time supplies us young cattle for rearing. During Q1 2019, we sold $5.0 million of goods to Mr. Zhen Runchi, representing 27.93% of the Company’s total revenue of $29.26 million Customer D is Linyi County Xingnong Agricultural Resources Co., Ltd. Wangcheng Branch. During Q1 2019, we sold $1.65 million of goods representing 5.63% of our total sales of goods revenue of $29.26million. Information on concentration of credit risk of account receivable: The Company had 4 major customers whose accounts receivable balance individually represented the following percentages of the Company’s total accounts receivable:
| | | March 31,2019 | | | Total accounts receivables | | | | | | | | | | | Customer A | | | 11.89 | % | | | 11,997,693 | | | Customer B | | | 8.4 | % | | | 8,478,466 | | | Customer C | | | 10.53 | % | | | 10,632,798 | | | Customer D | | | 61.27 | % | | | 61,849,210 | | | | | | | | | | | | | | | | 92.09 | % | | | 92,958,167 | |
The Company has not experienced any significant difficulty in collecting its accounts receivable in the past, and is not aware of any financial difficulties of its major customers.
Note (12) Property and equipment, net of accumulated depreciation | | | March 31,2019 | | | | | | | | Plant and machinery | | $ | 5,394,528 | | | Structure and leasehold improvements | | | 204,314,391 | | | Mature seeds and herbage cultivation | | | 58,898,928 | | | Furniture and equipment | | | 697,403 | | | Motor vehicles | | | 599,689 | | | | | | 269,904,939 | | | | | | | | | Less: Accumulated depreciation | | | (34,431,708 | ) | | Net carrying amount | | $ | 235,473,231 | |
Note (13) Construction in progress Fish Sales: Most farmed fish are sold to wholesalers at prevailing daily market prices capped within 90 days trading terms with a small portion at 180 days (for oversized fish, as the sale of oversized fish takes time to sell). We sold over US$10.9 million
| | March 31,2019 | | | | | | Construction in fish to the wholesalers during the second quarter 2013,progress | | | | | -Office, warehouse and as of June 30, 2013, accounts receivable of $0 was over 180 days. These debtors are wholesalers who are profitable and viable businesses with a good track record and therefore provision of diminutionorganic fertilizer plant in value is not required as collection is not in doubt.Sales of dried HU flowers: The dried flowers were sold to wholesalers in line with our longer trading terms (e.g., up to 180 days) so as to offset their holding cost so that they could sell the dried flowers through the winter months (from December 2013 to June 2014 when the new season starts). We agreed with the wholesalers that they would buy our dried flowers as soon as we produce them. Therefore, we consider the receivables from the sales of dried HU flowers to be from wholesalers with a good track record and therefore provision for diminution in value is not required as collection is not in doubt. As shown in the table above, $3,364,099 sales revenues are derived from new season sales whereas all 2012 season’s sale was paid and collected.
Sales ofHSA
| | | 7,425 | | - Organic fertilizer and bulk Livestock Feed: These were sales made to regional farmers who are contracting to grow cropsbread grass production plant and pasturesoffice building | | | 6,989,159 | | - Rangeland for us usingbeef cattle and purchasing our fertilizer and we in turn are to buy their cattle that are fed with bulk cattle feed purchased from us, such that we are ultimately to repurchase the cattle. Under this term of arrangements our accounts receivable are normally carried forward until such time they can be offset against our account payables (that is, the amount owed for the amount of crops and pastures is offset against the amount of cattle that we have brought from them respectively). Therefore there is no need to provide any diminution in value as these debtors are on-going and profitable and viable businesses with a good track record with us and collection from them is not in doubt.Information on Concentration of credit risk of account receivables:
We had 4 major customers (referring to Customer A, B, C and D mentioned in the Financial Statement of this report under Note 2.26)who accounted for ten percent or more of our consolidated revenues during the six months ended June 30, 2013 shown in table below:
| | | Six months ended June 30 2013 | | | | | % of total Revenue | | | $ | | | Total Revenue | | | Customer A | | | 18.57 | % | | | 20,338,677 | | | | | | | Customer B | | | 16.71 | % | | | 19,293,639 | | | | | | | Customer C | | | 12.32 | % | | | 13,494,997 | | | | | | | Customer D | | | 10.09 | % | | | 11,051,367 | | | | | | | | | | | | | | | | | | | | | | | | 57.69 | % | | | 64,178,680 | | | | 109,508,080 | |
Customer A is WSC 1, which is owned and operated by Guangzhou City A Power NaWei Trading Co. Ltd (“APNW”). CA was the consulting engineer responsible for the construction of WSC 1 and development of its business operation via a Consulting and Service Contract granted by APNW. APNW is now one of our main wholesalers which we bill our sales of seafood to (including live and frozen seafood). APNW then distributes the seafood to other wholesalers in various cities in China. WSC 1 is situated ideally at the center of all interprovincial logistic services. At the same time, APNW has obtained all relevant import quotas and permits during the six months ended June 30, 2013. As such, SIAF uses APNW’s permits for its import and export trades to be carried out in China. WSC 1 had 18.57% of our total consolidated revenue (equivalent to $20,338,677 out of our total revenue of $109,508,080) derived collectively from the following segments of activities:
| | | | | | | | | Six months ended June 30, 2013 | | | Name of company | | Segments | | Operation Division | | Abbreviation name | | % of total consolidated
Revenue | | | Amount in
$ | | | | | | | | | | | | | | | | | CA | | Fishery | | Consulting and Services | | Wholesale Center (1) | | | 1.61 | % | | | 1,760,135 | | | | | | | Sales of fish (from Fish Farm 1) | | | | | 2.79 | % | | | 3,058,089 | | | | | | | Sales of fish / eels from Contract Growers | | | | | 2.89 | % | | | 3,166,528 | | | | | | | | | | | | | | | | | | | SIAF | | Corporate | | Trading sales of seafood | | | | | 11.28 | % | | | 12,353,925 | | | | | | | | | | | | 18.57 | % | | | 20,338,677 | |
Customer B is Guangzhou Wholesale market (Store 8) represented by Mr. Han Zhiqiang who distributes our live fish (or other live aquatic animals, e.g., prawns and eels) to other wholesalers at the Guangzhou Wholesale Fish Markets. While there are over 300 live seafood wholesalers at the Guangzhou wholesale markets, there are only about 30 of them are in Mr. Han’s group of wholesalers handling the sales of our aquatic seafood. Furthermore, although we billed our live aquatic seafood sales to one wholesaler (Mr. Han) that did not mean that our live aquatic seafood was sold by one wholesaler. During the six months period ended June 30, 2013, Mr. Han had 16.71%of our total consolidated revenue (equivalent to $18,293,639 out of our total revenue of $109,508,080) derived from the sales of CA’s live aquatic seafood under the segment of Fishery.
Customer C is one of our main agents, Mr. Li Changfa, who distributes SJAP’s organic fertilizer, bulk livestock feed and concentrated livestock feed to our corporative farmers and other regional farmers. During the six months period ended June 30, 2013, Mr. Li had 12.32% of our total consolidated revenue (equivalent to $13,494,997 out of our total revenue of $109,508,080) derived from the sales of SJAP’s organic fertile, bulk livestock feed and concentrated livestock feed under the segment of Organic Fertilizer and Bread Grass.
Customer D is Mr. Liu Guang, the Chinese legal representative of the group of businessmen with whom CA contracts under a Consulting and Service Contract to construct and develop Prawn Farm 2 and to develop its related business operation. During the six months period ended June 30, 2013, Mr. Liu had 10.09% of our total consolidated revenue (equivalent to $11,051,367 out of our total revenue of $109,508,080) derived from CA’s Consulting and Service Contract under the segment of Fishery.
The Company had 4 major customers whose accounts receivable balance individually represented the following percentages of the Company’s total accounts receivable during the six months ended June 30, 2013:
| | | As of June 30, 2013 | | | Total | | | | | % of total Accounts receivables | | | amount in $ | | | Accounts receivables | | | Customer A | | | 15.21 | % | | | 12,593,302 | | | | | | | Customer B | | | 15.01 | % | | | 12,427,710 | | | | | | | Customer C | | | 12.03 | % | | | 9,960,383 | | | | | | | Customer D | | | 11.69 | % | | | 9,678,876 | | | | | | | | | | 53.94 | % | | | 44,660,271 | | | | 82,796,201 | |
Note4 Breakdown of Other Receivables:
| | As of June
30, 2013 | | | | Noteoffice building | | | 6,169,839 | | | | $ | | | | | | | | | | | | Cash advances paid as consideration to secure investments | | | 4,657,728 | | | | | | Miscellaneous | | | 937,497 | | | | | | Advances to employees | | | 206,046 | | | | | | Advances to Suppliers (at SJAP's operations) | | | 573,001 | | | | 4A | | | | | | | | | | | | | | 6,374,272 | | | | | |
Note 4A: Breakdown of Advances to Suppliers at SJAP’s operations: | | | 13,166,423 | |
|
Note (14) Land Use Rights, net of accumulated amortization: | Item | | Owner | | Location | | Acres | | | Date
Acquired | | Tenure | | Expiry dates | | Cost $ | | | Monthly
amortization
$ | | | 2019.03.31
Balance $ | | | Nature of
ownership | | Nature of
project | Hunan
lot1 | | HS.A | | Ouchi Village, Fenghuo Town, Linli County | | | 31.92 | | | 4/5/2011 | | 43 | | 4/4/2054 | | | 242,703 | | | | 470 | | | | 197,549 | | | Lease | | Fertilizer production | Hunan
lot2 | | HS.A | | Ouchi Village, Fenghuo Town, Linli County | | | 247.05 | | | 7/1/2011 | | 60 | | 6/30/2071 | | | 36,666,141 | | | | 50,925 | | | | 31,930,098 | | | Management
Right | | Pasture growing | Hunan
lot3 | | HS.A | | Ouchi Village, Fenghuo Town, Linli County | | | 8.24 | | | 5/24/2011 | | 40 | | 5/23/2051 | | | 378,489 | | | | 789 | | | | 303,580 | | | Land Use
Rights | | Fertilizer production | Hunan
lot4 | | HS.A | | Ouchi Village, Fenghuo Town, Linli County | | | 24.71 | | | 6/1/2018 | | 50 | | 5/31/2068 | | | 3,021,148 | | | | 5,035 | | | | 2,970,796 | | | Lease | | Pasture growing | Guangdong
lot 1 | | JHST | | Yane Village, Liangxi Town, Enping City | | | 8.23 | | | 8/10/2007 | | 60 | | 8/9/2067 | | | 1,064,501 | | | | 1,478 | | | | 857,515 | | | Management
Right | | HU Plantation | Guangdong
lot 2 | | JHST | | Nandu Village of Yane Village, Liangxi Town, Enping City | | | 27.78 | | | 3/14/2007 | | 60 | | 3/13/2067 | | | 1,037,273 | | | | 1,441 | | | | 828,378 | | | Management
Right | | HU Plantation | Guangdong
lot 3 | | JHST | | Nandu Village of Yane Village, Liangxi Town, Enping City | | | 60.72 | | | 3/14/2007 | | 60 | | 3/13/2067 | | | 2,267,363 | | | | 3,149 | | | | 1,810,741 | | | Management
Right | | HU Plantation | Guangdong
lot 4 | | JHST | | Nandu Village of Yane Village, Liangxi Town, Enping City | | | 54.68 | | | 9/12/2007 | | 60 | | 9/11/2067 | | | 2,041,949 | | | | 2,836 | | | | 1,647,740 | | | Management
Right | | HU Plantation | Guangdong
lot 5 | | JHST | | Jishilu Village of Dawan Village,Juntang Town, Enping City | | | 28.82 | | | 9/12/2007 | | 60 | | 9/11/2067 | | | 960,416 | | | | 1,334 | | | | 775,003 | | | Management
Right | | HU Plantation | Guangdong
lot 6 | | JHST | | Liankai Village of Niujiang Town, Enping City | | | 31.84 | | | 1/1/2008 | | 60 | | 12/31/2068 | | | 821,445 | | | | 1,141 | | | | 667,424 | | | Management
Right | | Fish Farm | Guangdong
lot 7 | | JHST | | Nandu Village of Yane Village, Liangxi Town, Enping City | | | 41.18 | | | 1/1/2011 | | 26 | | 12/31/2037 | | | 5,716,764 | | | | 18,323 | | | | 3,902,791 | | | Management
Right | | HU Plantation | Guangdong
lot 8 | | JHST | | Shangchong Village of Yane Village, Liangxi Town, Enping City | | | 11.28 | | | 1/1/2011 | | 26 | | 12/31/2037 | | | 1,566,393 | | | | 5,020 | | | | 1,069,365 | | | Management
Right | | HU Plantation | Guangdong
lot 9 | | MEIJI | | Xiaoban Village of Yane Village, Liangxi Town, Enping City | | | 41.18 | | | 4/1/2011 | | 20 | | 3/31/2031 | | | 5,082,136 | | | | 21,176 | | | | 3,049,282 | | | Management
Right | | Cattle Farm | Qinghai
lot 1 | | SJAP | | No. 498, Bei Da Road, Chengguan Town of Huangyuan County,Xining City, Qinghai Province | | | 21.09 | | | 11/1/2011 | | 40 | | 10/30/2051 | | | 527,234 | | | | 1,098 | | | | 429,476 | | | Land Use
Right &
Building
ownership | | Cattle farm, fertilizer and livestock feed production | Guangdong
lot 10 | | JHST | | Niu Jiang Town, Liangxi Town, Enping City | | | 6.27 | | | 3/4/2013 | | 10 | | 3/3/2023 | | | 489,904 | | | | 4,083 | | | | 191,879 | | | Management
Right | | Processing factory | Guangdong
lot 11 | | CA | | Da San Dui Wei ,You Nan Village, Conghua District of Guangzhou City | | | 33.28 | | | 10/28/2014 | | 30 | | 10/27/2044 | | | 4,453,665 | | | | 12,371 | | | | 3,785,615 | | | Management
Right | | Agriculture | | | | JHST | | Land improvement cost incurred | | | | | | 12/1/2013 | | | | | | | 3,914,275 | | | | 6,155 | | | | 3,520,386 | | | Management
Right | | HU Plantation | | Exchange difference | | | | | | | | | | | | | | | | | -3,400,645 | | | | | | | | -3,647,987 | | | | | | | | | | | | | | 678 | | | | | | | | | | 66,851,156 | | | | 136,824 | | | | 54,289,629 | | | | | |
Note (15) Other Receivables | | | March 31,2019 | | | Note | | | | | | | | | | | Advanced to employees | | $ | 567,653 | | | | | | | Advanced to suppliers | | | 3,905,832 | | | | 15 | A | | Advanced to customers | | | 14,114,204 | | | | 15 | B | | Advanced to developers | | | 461,835 | | | | 15 | C | | Others | | | 12,054,398 | | | | 15 | D | | | | $ | 31,103,922 | | | | | |
15A. A portion of this consists of molds, parts and components necessary to manufacture and fit-out various types of filters in the APM systems requiring suppliers (manufacturers) to carry additional inventory. This inventory is billed to the Company at such times when the components are called to manufacture the APM filtration systems. Until then, the Company provides advances to the supplier to manufacture the components and hold in inventory on the Company’s behalf until the components are called and billed to the Company, i.e., offsetting the amount invoiced with the proceeds received in advance. 15B. Advanced to customers refers to our distribution agents (i.e., the Shanghai distribution center, the Guangzhou distribution centers, etc.) that CA was their turnkey contractor built and developed said centers for and on behalf of their respective owners with part of their respective capital expenditure in development costs are still outstanding as of March 31, 2019. These are similar arrangement as in the Fishery Farms developments that CA has the option to acquire up to 75% of stakes on the assets and operation of said distribution agents: however as of date of March 31, 2019 CA has yet to exercise any of said options as such these sum are recorded as other receivables. 15C. The Developers, referring to ‘Advance to developers” in the table, above are mostly owners and investors of other development projects (i.e. Cattle farms, restaurants and trade centers etc.) that were developed by SIAF and MEIJI as their respective “turkey contractor” during the past several years. The Company has the option to convert/effectuate these advances in these Project companies as an SFJVC investee, similar to CA’s fishery development project. 15D. Others of $12,054,398 consist of the following: (i) 56 third party clients and associates of SJAP collectively owe SJAP $6.42 million, and (ii) QZH owes SJAP $5.63 million, whereas under the SJAP disposal (of QZH) agreement dated December 30, 2018 with the third party buyer, it stated that QZH is to repay SJAP said $5.63 million gradually from sale proceeds of its capital assets that QZH sells from time to time. Note (16) Current Liabilities: | | | As at March 31, 2019 | | | Note | | | | | $ | | | | | | Current liabilities | | | | | | | | | | Accounts payable and accrued expenses | | | 10,425,270 | | | | 16. | A | | Billings in excess of costs and estimated earnings on uncompleted contracts | | | 5,407,136 | | | | | | | Due to a director | | | 259,193 | | | | | | | Other payables | | | 47,016,748 | | | | 16 | B | | Borrowings - Short term bank loan | | | 4,677,755 | | | | | | | | | | 67,786,102 | | | | | |
Note 16A: Accounts payable and accrued expenses clarification: Our current trading environment is limited to a number of suppliers who offer prolonged credit terms meaning that most purchases are paid for in cash or short-term credit (7 to 10 days), which in a way allows us bargaining capacity to obtain cash discounts resulting in the low trade account payables and accruals balance of $10.43 million, about 36% of total sales of $29.26 million for the reasons stated below: Our main Account Payables during Q1 2019 were generated from the following activities: At SJAP it is a common practice to make cash advances to our corporative growers (presently standing at 100 members) who are our suppliers, to carry them through respective growing periods (for cropping or pasturing or cattle growing purposes) before final harvests of produces or sales of their cattle. On average, it works out at less than US$63,742 per member which in management’s opinion is a normal ongoing seasonal process deemed fair and equitable. In this respect, as the said average increases it means that the average corporative farmer is increasing his productivity (whether in the growing of crops or cattle), and in simple terms, it represents good progress indicating that SJAP’s revenue is also increasing.
(B). Breakdown of Balance Sheet Item (2) on Current Liabilities:
| | | As at June 30, 2013 | | | Note | | | Current liabilities | | | | | | | | | | Accounts payable and accruals | | | 8,368,834 | | | | 7 | | | Billings in excess of cost and estimated earnings on uncompleted contracts | | | 922,375 | | | | | | | Due to a director | | | 3,257,085 | | | | | | | Other payables | | | 10,259,178 | | | | 8 | | | Short term bank loan | | | 2,265,849 | | | | | | | Total current liabilities | | | 25,073,321 | | | | | |
Note 7. Accounts payables and accrued expenses clarification:
Our current trading environment to limited number of suppliers who will offer prolonged credit terms means that most purchases are paid for in cash or short credit terms (7 to 10 days), and in a way this allows us better bargaining ability to obtain cash discounts resulting in the low trade account payables balance of $8,368,834 representing about 7.65% of total sales of $109.5 million for the reasons stated below:
Our main Account Payables during the six months ended June 30, 2013 were generated from
| 1. | We supply the following activities: | 1. | We supply the following cost elements: our own staff, engineering and technology that enhanced our profit margins and reduced the overall cost of sales. Consulting and services(“C&S”) since inception account is the major contributor of income to date and cost of sales averaging52% and 31% for CA and SIAF, respectively derived from its respective C&S during the quarter.cost elements: our own staff, engineering and technology that enhanced our profit margins and reduced the overall cost of sales. Consulting and services (“C&S”) since inception is the major contributor of income to date and cost of revenue averaging 95% for CA. |
| 2. | Implementation, supervision, training and associated management work and most of the building sub-contractors worked on sub-contract at cost fixed by us; consequently, no big profit margin is accepted that did not provide room for prolonged credit term. For contracts related to the construction of farms we use plants, equipment, parts and components that were specially manufactured and made as per our own designs | | | | 2. | Implementation, supervision, training and associated management work and most of the building sub-contractors worked at fixed costs; consequently, profit margins are contained providing ample opportunity for expanded credit terms. For contracts related to the construction of farms we use plants, equipment, parts and components that were specially manufactured and made as per our own design and engineering by local manufacturers and suppliers (who carry a high amount of initial development costs and inventories for us based on the understanding that we would pay for the deliveries of goods sold within shorter trading terms such that they could afford to carry such costs). We pay promptly in this respect and believe that, as time has passed, our track record has earned us excellent credibility with all of our suppliers and sub-contractors. | | | | 3. | In SJAP, the bulk of our fertilizers were sold to farmers who are growing pastures and crops for us such that their fertilizer sales were kept as book entries that would be offset with the pastures and crops that we would buy back from them. In the case of HSA, it is essential to provide longer credit terms (up to 360 days) to their customers (that are farmers) whereas respective payments for cost of sales (i.e., raw materials and processed materials etc.) and cost of production (i.e. wages and salaries, fuel and associated cost of production etc.) are at much shorter payment terms (i.e. 30 / 60 days). |
Note (17) Non-current liabilities Other payables of $7,759,801: During Q1 2019, the Company issued promissory notes amounting to $0 to unrelated third parties for advances granted by third parties collectively to the Company (and/or to its subsidiaries). During Q1 2019 we redeemed $ 32,973 of Promissory Notes for advances granted by third parties in past fiscal years to be settled by the issuance of shares and / or cash leaving a balance of $7,759,801 of promissory notes still due and outstanding as of March 31, 2019. Income Taxes | 3. | Fish sales started gradually in late 2011, and the cost of sales averaged 47% and 63% in the three months ended March 31 and June 30 of 2013, respectively (the bulk of the cost came from the supplies of baby fingerlings and the live-bait as the main fish feed), and customary trading terms of Chinese suppliers is on a cash on delivery basis, and suppliers who provide short credit terms presently is limited to no more than a select few. |
Income Taxes | 4. | Cattle sales at SJAP’s own cattle stations and from its corporative farmers started in 2011 at lower profit margins compared to the sales of fish and the cost of sales was averaging 77% and 80% for the three months ended March 31 and June 30 of 2013, respectively; it is also customary in China to pay for the young live cattle by cash on deliveries. The Enping cattle farm started to buy young cattle in 2011 and started sales of mature cattle in 2012; cost of sales is averaging 72%and 90% in the three months ended March 31 and June 30 of 2013, respectively. Most of the young cattle supplies were from small primary producers (local small farmers) who did not have great financial resources; as such we paid for these supplies of young cattle in cash on delivery or short credit term after delivery. |
| 5. | In SJAP, the bulk of our fertilizers were sold to farmers who are growing pastures and crops for us such that their fertilizer sales were kept as book entries that would be offset with the pastures and crops that we would buy back from them. In the case of JHMC which is a very early stage company especially so in the manufacturing of fertilizer such that prolonged credit term facilities have not been established for its purchases of raw materials. |
| 6. | Bulk livestock feed are produced by regional corporative growers under contract to us and they use our supply of fertilizer and seeds that represented the main cost components enhancing cost of sales, which average 48% and 40% in the three months ended March 31 and June 30,of 2013. Again, sale of fertilizer is held on credit against crops and pasture grass purchased from them, as well as bulk livestock feed sold to them for cattle rearing, and reconciled once cattle are purchased from them. |
Note 8.Analysis of Other Payables:
As of June 30, 2013, we have other payables totaling $10,259,178, composed of the following:
Promissory notes amounting to $4,477,414 were issued to third parties for advances granted by third parties collectively to the Company (and/or to its subsidiaries) that are personally guaranteed by a director, repayable within two years at interest free term. Promissory notes could be repaid either by cash or shares of the Company or a combination thereof. If debt amounts are settled by shares, their respective share conversion rates will be determined by both parties at the time of settlement.
A grant of $2,192,825 paid by the Chinese Government to SJAP for the development of a certain project, however it is the law of China such that if SJAP will not be able to complete the said project, SJAP will have to repay the said grant to the Government. As of June 30, 2013, although work is in progress on the said project but it is not yet completed, the grant is recorded as other payables.
Other advances that were given by third parties collectively to our subsidiaries with no fixed term of repayment at interest free terms that do not have any promissory note or agreement but verbal understanding amounting to $3,593,095.
(C). Breakdown of Income Statements (1) Segment Item – Revenue, Cost of Sales and Gross Profit (for the three months ended June 30, 2013):
| | | Sales Revenue | | | % of total | | | Cost of sales | | | % of sales | | | Gross Profit | | | % of sales | | | | | | Segments | | Q22013 | | | Revenue | | | Q22013 | | | Revenue | | | Q22013 | | | Revenue | | | | Note | | | | | $ | | | | | | $ | | | | | | $ | | | | | | | | | Fishery Sector | | | | | | | | | | | | | | | | | | | | | | | | | | | | | | CA | | | | | | | | | | | | | | | | | | | | | | | | | | | | | | Consulting and Service | | | 6,338,929 | | | | 12 | % | | | 3,286,211 | | | | 52 | % | | | 3,052,718 | | | | 38 | % | | | a | | | Others in sales of Fish, Prawns and commissions etc. | | | 11,565,177 | | | | 21 | % | | | 9,371,504 | | | | 81 | % | | | 2,193,673 | | | | 19 | % | | | b | | | | | | | | | | | | | | | | | | | | | | | | | | | | | | | | | Cattle Farm Sector | | | | | | | | | | | | | | | | | | | | | | | | | | | | | | MEIJI | | | | | | | | | | | | | | | | | | | | | | | | | | | | | | Consulting and Service | | | 2,480,443 | | | | 5 | % | | | 1,652,711 | | | | 67 | % | | | 827,732 | | | | 10 | % | | | d | | | Others in sales of cattle, meat and commission etc. | | | 3,940,718 | | | | 7 | % | | | 2,755,886 | | | | 70 | % | | | 1,184,832 | | | | 30 | % | | | e | | | | | | | | | | | | | | | | | | | | | | | | | | | | | | | | | Beef,Organic fertilizer Sector | | | | | | | | | | | | | | | | | | | | | | | | | | | | | | Qinghai Sanjiang A Power, HuangYuan, Xining (45% subsidiary) | | | | | | | | | | | | | | | | | | | | | | | | | | | | | | Fertilizer | | | 2,118,342 | | | | 4 | % | | | 920,411 | | | | 43 | % | | | 1,197,931 | | | | 57 | % | | | f | | | Bulk Live Stock Feed | | | 2,193,056 | | | | 4 | % | | | 886,014 | | | | 40 | % | | | 1,307,042 | | | | 60 | % | | | g | | | Concentrated Live-stock Feed and related products | | | 2,700,277 | | | | 5 | % | | | 1,640,523 | | | | 61 | % | | | 1,059,754 | | | | 39 | % | | | h | | | Cattle | | | 7,359,619 | | | | 14 | % | | | 5,878,075 | | | | 80 | % | | | 1,481,544 | | | | 20 | % | | | i | | | Hunan Shanghua A Power (75% Subsidiary) | | | | | | | | | | | | | | | | | | | | | | | | | | | | | | Organic Fertilizer (ex-stocks supplied by SJAP) | | | 550,054 | | | | 1 | % | | | 441,821 | | | | 80 | % | | | 108,233 | | | | 20 | % | | | j | | | 100% pure organic mixed fertilizer | | | 2,025,030 | | | | 4 | % | | | 1,148,980 | | | | 57 | % | | | 876,050 | | | | 44 | % | | | k | | | HU Plant Sector | | | | | | | | | | | | | | | | | | | | | | | | | | | | | | Jiang Men HST (75% subsidiary) | | | 3,554,986 | | | | 7 | % | | | 1,260,957 | | | | 35 | % | | | 2,294,029 | | | | 65 | % | | | l | | | Corporate Sector (SIAF) | | | | | | | | | | | | | | | | | | | | | | | | | | | | | | SIAF | | | | | | | | | | | | | | | | | | | - | | | | | | | | | | | Consulting and Service | | | 4,272,119 | | | | 8 | % | | | 1,322,097 | | | | 31 | % | | | 2,950,022 | | | | 69 | % | | | m | | | Import and export sales others | | | 5,301,579 | | | | 10 | % | | | 4,444,692 | | | | 84 | % | | | 856,886 | | | | 16 | % | | | n | | | | | | | | | | | | | | | | | | | | | | | | | | | | | | o | | | Total | | | 54,400,329 | | | | 100 | % | | | 35,009,882 | | | | 64 | % | | | 19,390,447 | | | | 36 | % | | | | |
Note (a), (d) and (m) Consulting and Service
The table below highlights on general information of ongoing Consulting and Services of the quarter provided by Capital Award, MEIJI and SIAF respectively:
Name of the developments | | Location of development | | Land area or Built
up area | | Current Phase &
Stage | | Commencement
date | | Estimated
completion date
on or before | | Contractual
amount | | % of work
done as at
30.06.2013The Company was incorporated in the State of Nevada, in the United States of America. The Company has no trading operations in United States of America and no US corporate tax has been provided for in the consolidated financial statements of the Company. However, see the discussion, below, under “Undistributed Earnings of Foreign Subsidiaries”. Undistributed Earnings of Foreign Subsidiaries The Company intends to use the remaining accumulated and future earnings of foreign subsidiaries to expand operations outside the United States, but some of these profits may have to be used to satisfy U.S. income tax liabilities based on the operations of its controlled foreign subsidiaries. Prior to 2017, depending on how and where their controlled foreign corporations were operated, U.S. companies did not always have to pay tax on the earnings of their controlled foreign corporations, and the Company believes that prior to 2017 the earnings of its controlled foreign corporations were not taxable in the United States until distributed to the Company. Accordingly, the Company made no provision for U.S. Federal and State income tax. The Company filed yearly U.S. federal income tax returns from 2007 to 2017 on which it has reported that there was no no tax due to the United States. However, the Tax Cuts and Jobs Act of 2017 (the “2017 Act”) now requires some U.S. companies (starting in 2018) to pay tax on the earnings of their controlled foreign corporations based on complex formulas. The Company has not yet analyzed the impact of these changes on the taxability in the United States of the earnings of its foreign subsidiaries and so does not know whether it has for 2018, or will have for 2019 and future years, any earnings subject to U.S. federal income tax. In addition, the 2017 Act required U.S. companies to repatriate, as of the end of 2017, their accumulated earnings to date. The Company has not yet determined whether it incurred a U.S. tax liability as of the end of 2017 under this repatriation provision of the 2017 Act. The Company is seeking professional advice from U.S. tax accountants as to the impact on the Company of the 2017 Act for 2017 and later years. In fiscal year 2017 the Company had an operating loss of $30,102,943 based on the consolidated financials of its controlled foreign corporations, but it has had operating profits in previous years. No EIT has been provided in the financial statements of SIAF, CA, JHST, JHMC, JFD, HSA, QZH and SJAP since they are exempt from EIT for the twelve months ended December 31, 2018 and 2017 as they are within the agriculture, dairy and fishery sectors. CA, CS and CH are international business companies incorporated in Belize, and are exempt from corporate tax in Belize. No Hong Kong profits tax has been provided in the consolidated financial statements, since TRW did not earn any assessable profits arising in Hong Kong for the twelve months ended December 31, 2018. No Macau corporate income tax has been provided in the consolidated financial statements, since APWAM and MEIJI did not earn any assessable profits in Macau for the twelve months ended December 31, 2018 and 2017. Swedish corporate income tax has been provided in the consolidated financial statements for SAFS at $1,684 for the twelve months ended December 31, 2018 and $1,130 for 2017. No deferred tax assets and liabilities are payable as of December 31, 2018 and December 31, 2017 since there was no difference between the financial statements carrying amounts, and the tax basis of assets and liabilities using enacted tax rates in effect for the period in which the differences are expected to reverse. No EIT has been provided in the financial statements of SIAF, CA, JHST, JHMC, JFD, HSA and SJAP since they are exempt from EIT for the three months ended March 31, 2019 and 2018 as they are within the agriculture, dairy and fishery sectors. CA, CS and CH are international business companies incorporated in Belize and are exempt from corporate tax in Belize. No Hong Kong profits tax has been provided in the consolidated financial statements, since TRW did not earn any assessable profits arising in Hong Kong for the three months ended March 31, 2019 and 2018. No Macau Corporate income tax has been provided in the consolidated financial statements, since APWAM and MEIJI did not earn any assessable profits for the three months ended March 31, 2019 and 2018. No Swedish Corporate income tax has been provided in the consolidated financial statements, since SIAFS incurred a tax loss for the three months ended March 31, 2019. No deferred tax assets and liabilities have been assessed as of March 31, 2019 and December 31, 2018 since there was no difference between the financial statements carrying amounts and the tax basis of assets and liabilities utilizing the enacted tax rates in effect for the period in which the differences are expected to occur. Off Balance Sheet Arrangements: None. Liquidity and Capital Resources As of December 31 2018, unrestricted cash and cash equivalents amounted to $4,950,799 (see notes to the consolidated financial statements), and our net working capital as of December 31, 2018 was $175,298,848. | Contractual Obligations | | Less than 1 year | | | 1-3years | | | 3-5 years | | | More than 5 years | | | Total | | | Short Term Debts | | | 4,589,828 | | | | | | | | | | | | | | | | 4,589,828 | | | Bonds payable | | | 3,894,978 | | | | | | | | | | | | | | | | 3,894,978 | | | Long Term Debts | | | - | | | | 7,792,774 | | | | 5,536,938 | | | | | | | | 13,329,712 | |
| - 54 - | | CA's Consulting and Services | | | | | | | | | | | | | | | | | Fish Farm (2) "The Fish & Eel Farm | | Xin Hui District, Jiang Men. | | 33,000 m2 | | Phase (2) | | 15.Jan. 2013 | | June. 2014 | | 14.9 million | | | 28 | % | Prawn Farm (2) The Hatchery & Nusery & Grow-out prawn farm | | San Jiao Town, Zhong San City, | | 120,000 m2 | | Phase 2 Stage 1 | | 12. Oct. 2012 | | 31. Dec. 2013 | | 8.67 Million | | | 50 | % | MEIJI's Consulting and Services | | | | | | | | | | | | | | | | | Cattle Farm (2) External Road work. | | LiangXi Town, Enping City | | 10 Km Road | | One Phase | | 15. Sept. 2012 | | 31. March. 2013 | | 5.28 Million | | | 100 | % | SIAF's Consulting and Services: | | | | | | | | | | | | | | | | | Wang Xiangcheng Restaurant projects | | Hai Zhu District, Guangzhou City | | Pending | | Phase 1 | | 01. Oct. 2012 | | 30. Sept. 2015 | | 17.5 Million | | | 25 | % | Whole Sale Center (2) (Beef) | | Li Wan District, Guangzhou City | | 5,000 m2 | | Phase 1 Stage 1&2 | | 15. Aug. 2012 | | 30. Sept. 2013 | | 3.7 Million | | | 100 | % |
Whereas CA’s revenues (Note a) generated from its Consulting and Service Contracts (“C&S”) are normal resulting Gross Profit (“GP”) margin around its general standard of (38 to 45%), MEIJI’s GP margin (Note b) (at only 10%) is much lower than its general standard (of about 30 to 35%) due primarily to its work done during the quarter mainly consisting of the finishing work of the external roads that involved many sub-contractors who are registered in the panels of the Government that did not allow MEIJI to gain higher margins and at the same time, the heavy rainy weather of the quarter interrupted many working schedules arranged for the development of Cattle Farm 2 that involved extra costs and SIAF’s work (Note m) performed during the quarter on the development and construction of restaurants and wholesale centers involved much work that was carried out by our own departments resulting in much higher GP margins (69%) for the quarter than our normal standard (recorded at average of 45 to 55%), as such we are expecting that the GP margins will be adjusted and vary from quarter to quarter as the work progresses.
Note (b) and (d): Analysis of Fish sales of Capital Award
During the three month period ended June 30, 2013, Capital Award’s fish sales were derived from following divisional activities:
Capital Award brought from external growers over 318,000 pieces of sleepy cod (at an average weight of 350 gram/piece), around 300,000 pieces of baby eels and 350 MT of fish feed which were sold to Fish Farm 1 as inventory at an average cost of $5.00/piece, $2.06/piece and $1,660/MT respectively.
Capital Award brought from Fish Farm 1 and sold to wholesale markets 478,603 pieces of sleepy cod(at an average weight of 739 gram/fish) for an average price of $15.8/Kg thus earned commissions based on US$3.20/Kg as its marketing and sales agent. Due to the decline in wholesale prices of sleepy cod (from 2012’s average of US$25.5/Kg), Fish Farm 1’s cost of sales increased to 89% during the first quarter of 2013 but, assisted by the proportionate decrease in cost of the inventory stocks during the last quarter, Fish Farm 1 reduced its cost of sales to 66% during this quarter. In this respect Capital Award’s commission charge (based on RMB20/Kg or equivalent to US$3.2/Kg) has not been readjusted downward during the period.
Capital Award has been contracting with external growers to grow sleepy cod since January 2012 at fixed cost from US$13.3/Kg in its early days to its recent cost of $15.30/Kg and when these sleepy would grow to market sizes of 500 gram and above/fish, CA would sell them to the wholesale markets. In this respect during this second quarter, Capital Award sold, from its contracted grown sleepy cod inventory, to the Guangzhou City wholesale markets 244,118 pieces of marketable size sleepy cod at the average price of $7.38/fish and to WSC 1 for distribution to the Shanghai wholesale markets as well as to the Southern coastal town’s wholesale markets 391,854 pieces of bigger sized sleep cod at the average of $10.10/fish. Capital Award also brought from external growers 44,385 pieces of “Dark Ring Circle” eels that weigh between (3.2 to 3.7 Kg/eel) at cost average of US$6.5/Kg and sold them to WSC 1 and to various wholesale markets in the regional cities (e.g., Shanghai, Guangzhou and Beijing) at relatively low margin (of breakeven prices) to get familiar with the eel markets.
As such, Capital Award’s overall GP margin averaged 27% during this quarter derived from the sales of its live aquatic seafood.
Note (e) and (i): referring to Analysis of Cattle sales of MEIJI and SJAP
Note (e) referring to MEIJI’s cattle sales during the three month period ended June30, 2013:
MEIJI brought from Cattle Farm 1 cattle aged between 15 months to 19 months old at live weight (from 579 kg/head to 815 kg/head for 775 heads of cattle or at the average of 715.8 Kg/head) and sold them to Beijing wholesale market sat the average of $5.16/Kg of live weight or $3,693/head (equivalent to RMB22,162/head) that their growing and sales cost (or cost of sales) is at the average of $3,232/head representing around 12.4% GP margin. In this respect, we believe that our Cattle Farm 1 cattle must have good consistent quality being fed with our Aromatic Feed and grown in our semi-free growing conditions that they were getting good responses from the Beijing markets to allow a premium of $0.65/Kg (live weight) above the general wholesale prices of $4.52/Kg that was recorded during this quarter and is lower than the wholesale prices of $5.2/Kg (average) recorded during the first quarter of 2013. MEIJI’s total revenues shown in the table above includes the sales of 550 heads of young cattle (aged between 7 to 12 months old) brought from external growers and sold to Cattle Farm 1 as its inventory at cost for value of $1,095,290.
However, among MEIJI’s sales, there were 350 heads sold to the “Beijing Cattle Farm” joint venture (described above) that will be distributed by and in the “small wholesale shop” to the regional distributors and public of Beijing, a portion of the additional profits generated from which sales will be shared by MEIJI. Taking into consideration that MEIJI’s cattle production is increasing gradually and slowly in comparison to SJAP, it is possible that our Joint Ventured Beijing Cattle Farm will sell all what MEIJI will produce within the next few years and increase MEIJI’s cattle sales GP margins by an additional 10% or more starting from the third quarter of 2013.
Note (i) referring to the sales of cattle at SJAP during the three month period ended June 30, 2013:
SJAP sold over 2,345 heads of cattle from its own cattle station and corporative growers collectively at an average of $3,150/head at cost of sales of ($2,417/head from its own cattle station and $2,659/head from the corporative growers) generating revenue of $7.36 million with GP margin averaging 20%. The reasons SJAP enjoys greater profit margins include; (1) SJAP’s batch of cattle sales this quarter were from young cattle SJAP brought through the winter months of last year when the region was short of livestock feed at lower cost, (2) SJAP’s concentrated livestock feed is manufactured in house starting from early of the quarter saving in logistic transportation cost and the benefit of feeding the cattle with our own concentrated livestock feed, (3) the cattle were grown during the warmer months reducing the associated cost of energy under better growing climates. The average sales prices per head of cattle is lower than MEIJI’s cattle sales due mainly to the fact that SJAP’s cattle are lighter in weight due to the shorter fattening period influenced by its regional market demands of smaller cattle compared to the requirement of cattle grown in our Cattle Farm 1and sold at the Beijing markets.
Note (f, g, h, i and k) referring to Analysis of Fertilizer and Livestock feed of SJAP and HSA:
During the second quarter of 2013;
HSA sold 2,273 MT of organic fertilizer from inventory that was supplied by SJAP in 2012 at the average of US$242/MT and at a cost of US$182.4/MT, and also sold 4,895 MT of 100% Pure Organic mixed fertilizer (“POMF
Cash provided by operating activities amounted to $20,175,276 for the twelve months ended December 31, 2018. This compared with cash provided by operating activities totaled $21,522,275 for the twelve months ended December 31, 2017. The decrease in cash provided by operations is mainly due to the decrease in Other receivables from $35,877,232 for the twelve months ended December 31, 2017 to that of $(7,627,048) for the twelve months ended December 31, 2018. Cash used in investing activities totaled $13,828,019 for the twelve months ended December 31, 2018. This compares with cash used in investing activities totaling $32,717,372 for the twelve months ended December 31, 2017. The decrease in cash flows used in investing activities primarily resulted from the decrease in payment for construction in progress from $10.8million for the twelve months ended December 31, 2017 to that of $6.8 million for the twelve months ended December 31, 2018. Cash provided by financing activities totaled $(75,563) for the twelve months December 31, 2018 compared with cash used in financing activities totaling $9,479,121 for the twelve months ended December 31, 2017. The decrease in cash paid by financing activities is mainly due to net proceeds from convertible bonds payable of $4,000,000 and capital contribution by non-controlling interest of 2,517,035 during the year 2017, but 2018 is 0. As of March 31, 2019, unrestricted cash and cash equivalents amounted to $621,884 (see notes to the consolidated account), and our working capital as of March 31, 2019 was $183,985,026. As of March 31, 2019, our total long-term debts are as follows: | Contractual Obligations | | Less than 1 year | | | 1-3 years | | | 3-5 years | | | More than 5 years | | | Total | | | Short Term Bank Loan | | | 4,677,755 | | | | | | | | | | | | | | | | 4,677,755 | | | Long Term Debts | | | | | | | 5,643,006 | | | | | | | | | | | | 5,643,006 | | | Promissory Notes | | | | | | | 7,759,801 | | | | | | | | | | | | 7,759,801 | |
Cash provided by operating activities amounted to $(2,652,722) for Q1 2019. This compares with cash provided by operating activities totaling $(5,570,600) for Q1 2018. The increase in cash flows from operations primarily resulted from increase in inventories to $(1,819,867) for Q1 2019 from $(5,725,242) for Q1 2018. Cash used in investing activities totaled $(2,908,845) for Q1 2019. This compares with cash used in investing activities totaling $(5,475,604) for Q1 2018. The increase in cash flows used in investing activities primarily resulted from payment for construction in progress of $0 in Q1 2019 from $(3,053,4350 in Q1 2018. Cash used in financing activities totaled $0 for Q1 2019. This compares with cash from financing activities totaling $0 for Q1 2018. CRITICAL ACCOUNTING POLICIES BASIS OF PRESENTATION The audited consolidated financial statements for the twelve months ended December 31, 2018 are prepared in accordance with generally accepted accounting principles in the United States of America (“US GAAP”) from production of its own fertilizer factory at average prices of US$420/MT that cost US$216/MT. SJAP sold 12,015 MT, 14,315 MT and 6,440 MT of organic fertilizer, bulk livestock feed and concentrated livestock feed for US$176.3/MT, US$153.2 and US$419.3 and at cost of sales of US$74.2/MT, US$60.50/MT and US$252.25/MT respectively.
Note (m and n) referring to Analysis of SIAF’s import and export seafood sales:
During the quarter, we imported seafood and sold to WSC 1 under and using its import quotas and licenses deriving revenues based on 16% marked up (inclusive servicing fees of 3.5%) detailed as follows:
6 x 40’ (Sea-containers) of frozen cuttlefish and squid from Malaysia, 3 x 40” (sea-containers) of frozen Salmons from Russia, 74 MT of king sized Live Prawns (or shrimp) from Thailand via its local agent, 37.2 MT of Live Mud Crabs and 35.34 MT of Live Flower Pattern eels for total sales of $5,301,579 with GP margin at 16%.
Income Taxes
There was no income tax payable in six months ended June 30, 2013 or 2012.
Consolidated Results of Operations Fiscal Year 2012 Compared to Fiscal Year 2011
Part A .
Revenues
Revenues including continued and discontinued operations increased by $86,733,736 (or 167.18% from $51,879,903 for the year ended December 31, 2011to $138,613,639 for the year ended December 31, 2012. The increase was primarily due to maturity of all business sectors of the Company except for beef (i.e., fishery, plantation, organic fertilizer and cattle farm) as they gradually move into operational stages instead of developing stages.
The following chart illustrates the changes of revenues by category from the year ended December 31, 2012 to December 31, 2011.
| | | 2012 | | | 2011 | | | Difference | | | | | $ | | | $ | | | $ | | | Fishery | | | 86,346,475 | | | | 26,422,125 | | | | 59,924,350 | | | Plantation | | | 11,878,599 | | | | 6,113,155 | | | | 5,765,444 | | | Beef | | | 14,224,324 | | | | 15,182,222 | | | | -957,898 | | | Organic Fertilizer | | | 9,126,240 | | | | 2,480 | | | | 9,123,760 | | | Cattle Farm | | | 17,038,001 | | | | 4,159,921 | | | | 12,878,080 | | | Total | | | 138,613,639 | | | | 51,879,903 | | | | 86,733,736 | |
Fishery : Revenue from fishery increased by $59,924,350 (or 226.80%) from $26,422,125 for the year ended December 31, 2011 to $86,346,475 for the year ended December 31, 2012. The increase in fishery was primarily due to our increase in revenue from the sale of fish and prawn and development contracting services for the year ended December 31, 2012 compared to the sale of fingerlings and consulting income for the year ended December 31, 2011.
Plantation : Revenue from our plantation increased by $5,765,444 (or 94.31%) from $6,113,155 for the year ended December 31, 2011 to $11,878,599 for the year ended December 31, 2012. The increase was primarily due to the increase of wholesale prices in fresh and dried flowers for the year ended December 31, 2012.
Beef : Revenue from beef decreased by $957,898 (or 6.31%) from $15,182,222 for the year ended December 31, 2011 to $14,224,324 for the year ended December 31, 2012. The decrease was primarily due to the fact that calves grew and become salable beef cattle.
Organic fertilizer : Revenue from organic fertilizer increased by $9,123,760 from $2,480 for the year ended December 31, 2011 to $9,126,240 for the year ended December 31, 2012. The increase was primarily due to the startup of the new business of organic fertilizer during the year ended December 31, 2012.
Cattle farm : Revenue from cattle farm development increased by $12,878,080 (or 309.57%) from $4,159,921 for the year ended December 31, 2011 to $17,038,001 for the year ended December 31, 2012. The increase was primarily due to increased development contract service of cattle farms for the year ended December 31, 2011.
Cost of Goods Sold
Cost of goods sold increased by $41,855,597 (or 155.30%) from $26,951,874 for the year ended December 31, 2011 to $68,807,471 for the year ended December 31, 2012. The increase was primarily due to the Company increasing its scale of operations from continuing operations in terms of its fishery, plantation, cattle farm and beef operations.
The following chart illustrates the changes of cost of goods sold by category from the year ended December 31, 2012 to December 31, 2011.
| Category | | 2012 | | | 2011 | | | Difference | | | | | $ | | | $ | | | $ | | | Fishery | | | 39,862,296 | | | | 15,392,278 | | | | 24,470,018 | | | Plantation | | | 5,035,955 | | | | 2,070,835 | | | | 2,965,120 | | | Beef | | | 11,031,756 | | | | 6,974,847 | | | | 4,056,908 | | | Organic fertilizer | | | 5,266,047 | | | | 2,406 | | | | 5,263,640 | | | Cattle farm | | | 7,611,417 | | | | 2,511,508 | | | | 5,099,909 | | | | | | 68,807,471 | | | | 26,951,874 | | | | 41,855,597 | |
Fishery : Cost of goods sold from fishery increased by $24,470,018 (or 158.98%) from $15,392,278 for the year ended December 31, 2011 to $39,862,296 for the year ended December 31, 2012. The increase was primarily due to an increase in the sales volume relating to fish and the expansion of contracted services for the year ended December 31, 2012 compared to for the year ended December 31, 2011.
Plantation : Cost of goods sold from our plantation increased by $2,965,120 (or 143.18%) from $2,070,835 for the year ended December 31, 2011 to $5,035,955 for the year ended December 31, 2012 due to good harvest in 2012. The increase was primarily due to cost increases in farm labor, logistic and associated general overhead of operations.
Beef : Cost of goods sold from beef increased by $4,056,908 (or 58.16%) from $6,974,847 for the year ended December 31, 2011 to $11,031,756 for the year ended December 31, 2012. The increase was primarily due to fact that cattle are in growing stage and therefore cost of sales increase even though revenue from beef decreases.
Organic fertilizer : Cost of goods sold from organic fertilizer increased by $5,263,640 (or 2,187.71%) from $2,406 for the year ended December 31, 2011 to $5,266,047 for the year ended December 31, 2012. The increase was primarily due to the startup of the new business of organic fertilizer for the year ended December 31, 2012.
Cattle farm : Cost of goods sold from cattle farm development increased by $5,099,909 (or 203.03%) from $2,511,508 for the year ended December 31, 2011 to $7,611,417 for the year ended December 31, 2012. The increase in cattle farm was primarily due to the commencement of our contracting services in the cattle farming industry for the year ended December 31, 2012.
Gross Profit
Gross profit increased by $44,878,139 (or 180.03%) from $24,928,029 for the year ended December 31, 2011 to $69,806,168 for the year ended December 31, 2012. The increase was primarily due to the corresponding increases in revenues from our fishery, plantation, cattle farm and organic fertilizer operations.
The following chart illustrates the changes of gross profit by category from the year ended December 31, 2012 to December 31, 2011.
| Category | | 2012 | | | 2011 | | | Difference | | | | | $ | | | $ | | | $ | | | Fishery | | | 46,484,179 | | | | 11,029,847 | | | | 35,454,332 | | | Plantation | | | 6,842,644 | | | | 4,042,320 | | | | 2,800,324 | | | Beef | | | 3,192,568 | | | | 8,207,375 | | | | (5,014,805 | ) | | Organic fertilizer | | | 3,860,193 | | | | 74 | | | | 3,860,119 | | | Cattle farm | | | 9,426,584 | | | | 1,648,413 | | | | 7,778,169 | | | Total | | | 69,806,168 | | | | 24,928,029 | | | | 44,878,139 | |
Fishery : Gross profit from fishery increased by $35,454,332 from $11,029,847 for the year ended December 31, 2011 to $46,484,179 for the year ended December 31, 2012. The increase was primarily due to our increased contract service income from fishery and prawn development contracts and sale of fish for the year ended December 31, 2012 versus consulting income and sale of fish for the year ended December 31, 2011.
Plantation : Gross profit from our plantation increased by $2,800,324 (or 69.28%) from $4,042,320 for the year ended December 31, 2011 to $6,842,644 for the year ended December 31, 2012. The increase was due mainly to the increase of wholesale prices both on dried and fresh flowers for the year ended December 31, 2012.
Beef : Gross profit from beef decreased by $5,014,805 (or 61.1%) from $8,207,373 for the year ended December 31, 2011 to $3,192,568 for the year ended December 31, 2012. The decrease was primarily due to the decrease of revenue and the increase of cost of sales.
Organic fertilizer : Organic fertilizer increased by $3,860,119 from $74 for the year ended December 31, 2011 to $3,860,193 during the year ended December 31, 2012. The increase was primarily due to the start-up of our new business of organic fertilizer for the year ended December 31, 2012.
Cattle farm : Gross profit from cattle farm development increased by $7,778,171 (or 471.86%) from $1,648,415 for the year ended December 31, 2011 to $9,426,584 for the year ended December 31, 2012. The increase in cattle farm was primarily due to the commencement of our contracting services in the cattle farming industry for the year ended December 31, 2012.
General and Administrative Expenses and Interest Expenses
General and administrative and interest expenses from continuing and discontinued operation (including depreciation and amortization) increased by $3,046,994 (or 57.21%) from $5,302,736 for the year ended December 31, 2011 to $8,349,729 for the year ended December 31, 2012. The increase was primarily due to increase on the depreciation and amortization amounting to $1,764,288 for the year ended December 31, 2012 from $936,509 for the year ended December 31, 2011, and the increase in others and miscellaneous of $2,152,605 for year ended December 31, 2012 from $280,728for the year ended December 31, 2011.
| Category | | 2012 | | | 2011 | | | Difference | | | | | $ | | | $ | | | $ | | | Office and corporate expenses | | | 1,619,888 | | | | 1,718,389 | | | | -98,501 | | | Wages and salaries | | | 2,555,681 | | | | 2,122,975 | | | | 432,706 | | | Traveling and related lodging | | | 77,730 | | | | 94,728 | | | | -16,998 | | | Motor vehicles expenses and local transportation | | | 112,448 | | | | 54,462 | | | | 57,986 | | | Entertainments and meals | | | 103,222 | | | | 94,945 | | | | 8,277 | | | Others and miscellaneous | | | 2,152,605 | | | | 280,728 | | | | 1,871,877 | | | Depreciation and amortization | | | 1,764,288 | | | | 936,509 | | | | 827,779 | | | Sub-total | | | 8,385,862 | | | | 5,302,736 | | | | 3,083,126 | | | Interest expenses | | | 282,320 | | | | - | | | | 282,320 | | | Total | | | 8,668,182 | | | | 5,302,736 | | | | 3,365,446 | |
In this respect, total depreciation and amortization amounted to $2,378,270 for the year ended December 31, 2012, out of which amount, $1,764,288 was reported under general and administration expenses and $613,982 was reported under cost of goods sold; whereas total depreciation and amortization was at $1,475,450 for the year ended December 31, 2011 and out of which amount $936,509 was reported under General and Administration expenses and $538,941 was reported under cost of goods sold.
Part B. Discussion and analysis on the results of operations 2012: This Part B discusses and analyzes certain items that we believe may require further clarification and explanation; and other items of comparison 2012 to 2011 are not discussed in this Part B but in Part A above).
Balance Sheet items (1) on total current assets:
| | As of December
31, 2012 | | | | $ | | | | | | Cash and cash equivalents | | | 8,424,265 | | Inventories | | | 17,114,755 | | Cost and estimated earnings in excess of billings on uncompleted contracts | | | 2,336,880 | | Deposits and prepaid expenses | | | 47,308,857 | | Accounts receivable, net of allowance for doubtful debts | | | 52,948,350 | | | | | | | Other receivables | | | 5,954,248 | | Total current assets | | | 134,087,355 | |
Accounts Receivable:
At December 31, 2012
| | | Accounts receivable | | | Current | | | 0-30 days | | | 31-90 days | | | 91-120 days | | | over 120 days
and
less than 1 year | | | Consulting and Service (from 6 contracts) totaling | | | 32,769,312 | | | | | | | | 6,524,405 | | | | 18,420,793 | | | | 1,811,533 | | | | 6,012,581 | | | | | | | | | | | | | | | | | | | | | | | | | | | | | Sales of Fish (from Farms and from imports) | | | 5,216,923 | | | | | | | | 1,612,905 | | | | 1,726,826 | | | | 1,877,192 | | | | - | | | | | | | | | | | | | | | | | | | | | | | | | | | | | Sales of Cattle and Beef Meats (from Enping Farm) | | | 610,880 | | | | | | | | 335,984 | | | | 274,896 | | | | - | | | | - | | | | | | | | | | | | | | | | | | | | | | | | | | | | | Sales of HU Flowers (Dried) | | | 5,549,439 | | | | | | | | - | | | | 2,538,175 | | | | 2,749,650 | | | | 261,614 | | | | | | | | | | | | | | | | | | | | | | | | | | | | | Sales Fertilizer, Bulk Stock feed and Cattle by SJYL | | | 6,795,524 | | | | | | | | 1,950,575 | | | | 3,634,487 | | | | 10,982 | | | | 1,199,480 | | | | | | | | | | | | | | | | | | | | | | | | | | | | | Sales Fertilizer from HAS | | | 2,006,272 | | | | | | | | 390,112 | | | | 1,189,607 | | | | 417,485 | | | | 9,068 | | | | | | | | | | | | | | | | | | | | | | | | | | | | | Total Accounts Receivable | | | 52,948,350 | | | | | | | | 10,813,981 | | | | 27,784,784 | | | | 6,866,842 | | | | 7,482,743 | | | | | | | | | | | | | | | | | | | | | | | | | | | | | Percentage of total | | | 100 | % | | | | | | | 21 | % | | | 52 | % | | | 13 | % | | | 14 | % |
Provision for diminution in value of accounts receivable:
Receivables from revenue derived from consulting and services billed for work completed are within our normal trading terms with our principal investor and therefore no diminution in value is required.
Fish Sales: Most farmed fish are sold to wholesalers at prevailing daily market prices capped within 90 days trading terms with a small portion at 180 days as the sale of oversized fish takes time to sell.
We sold over US$43 million of fish to the wholesalers in year 2012, and as of December 31, 2012, accounts receivable of $1,877,192 was over 180 days past due representing less than 2% of the total sales. These debtors are wholesalers who are profitable and viable businesses with a good track record and therefore provision of diminution in value is not required.
Sales of dried HU flowers: The dried flowers have been sold to wholesalers with longer trading terms (e.g., up to 180 days) so as to offset with their holding cost so that they could sell the dried flowers through the winter months (from December 2013 to June 2014 when the new season starts) whereby we agreed with the wholesalers that they would buy our dried flowers as soon as we produce them. Therefore, we consider the receivables from the sales of dried HU flowers to be from wholesalers with a good track record and therefore provision for diminution in value is not required.
Sales of fertilizer and bulk livestock feed: Sales are made to regional farmers who agree to grow crops and pasture by purchasing and using our fertilizer. The farmers raise cattle on these pastures and we have agreed to purchase the cattle from these farmers at a later date. Under this arrangement the accounts receivable that are owed to us by the farmers can be offset by the amount that we owe to the farmers for the purchase of the cattle. Therefore there is no need to provide any diminution in value to the account receivable.
Deposits and Prepayments (Break-down)
Deposits for Prepayments for purchases of equipment | | | 318,192 | | Miscellaneous | | | 4,892,258 | | Deposits for- acquisition of land use right | | | 7,826,508 | | Deposits for- inventory purchases | | | 2,228,854 | | Deposits for- aquaculture contract | | | 7,062,600 | | Deposits for- building materials | | | 2,000,000 | | Deposits for- proprietary technology | | | 2,254,839 | | Prepayments for construction in progress | | | 14,423,021 | | Shares issued for employee compensation and oversea professional fee | | | 271,800 | | Temporary deposits payment for acquiring equity investments | | | 6,030,785 | | | | | 47,308,857 | |
Balance Sheet Item (2) on Current Liabilities:
| | As of December 31, 2012 | | | | $ | | Current liabilities | | | | | Accounts payable and accruals | | | 5,762,643 | | Billings in excess of cost and estimated earnings on uncompleted contracts | | | 2,790,084 | | Due to a director | | | 3,345,803 | | Dividend payable | | | 951,308 | | Other payables | | | 6,422,478 | | Short term bank loan | | | 3,181,927 | | Total current liabilities | | | 22,686,243 | |
Account payables and Accruals:
Our current trading environment does not include many suppliers who will offer credit terms which means that most purchases are paid for in cash and this results in a low trade account payables balance of $8,762,643 representing about 8.4% of total sales of $68.8 million for the reasons stated below: (Note: For % cost of sales of the segment, please also refer to the table immediately following this section).
Trading environment of the following activities:
| 1. | Consulting and services since inception account is the major contributor of income to date and cost of sales average 27% for cattle farms and others, and 40% for prawn or fish farms. We supply the following cost elements: our own staff, engineering, technology implementation, supervision, training and associated management work and most of the building sub-contractors worked on sub-contract at cost fixed by us; as such no big profit margin is accepted plus we require a prolonged credit term. For contracts related to the construction of farms we use plants, equipment, parts and components that were specially manufactured and made as per our own designs and engineering by local manufacturers and suppliers (who carry a high amount of initial development costs and inventories for us based on the understanding that we would pay for the deliveries of goods sold within shorter trading terms such that they could afford to carry such costs). We believe that, as time has passed, our track record has earned us excellent credibility with all of our suppliers and subcontractors due to our good standing. |
| 2. | Fish sales started gradually from late 2011with low cost of sales averaging 47% (the bulk of the cost comes from the supplies of baby fingerlings and the live-bait as the main fish feed), and customary trading terms of Chinese suppliers is on a cash on delivery basis, and suppliers who provide credit terms presently is limited to no more than a select few. |
| 3. | Cattle sales at Xining SJAP’s own cattle stations and from its cooperative farmers started in 2011at lower profit margins compared to the sales of fish with cost of sales averaging 77%, and it is also customary in China to pay for the young live-cattle by cash on deliveries. The Enping cattle farm started to buy young cattle in 2011 and started sales of mature cattle in 2012, but at small quantities with cost of sales averaging at 72% which is lower than in SJAP due to the fact that sales of mature cattle were from JHMC directly without the sales from cooperative farmers as in SJAP. Most of the young cattle supplies were from small primary producers (local small farmers) who did not have great resources of finance; as such we paid for these supplies of young cattle in cash on deliveries. |
| 4. | In SJAP, the actual cost of sales are averaging 49% and the bulk of our fertilizers were sold to farmers who are growing pastures and crops for us such that their fertilizer sales were kept as book entries that would be contrasted with the pastures and crops that we would buy back from them. In the case of JHMC, in 2012, its cost of sales were higher than in SJAP at 77% due to the fact that JHMC did not have its own production facilities constructed in 2012, such that its organic fertilizer was supplied from SJAP and thus involved additional transportation costs. |
| 5. | Bulk livestock feed are produced by regional cooperative growers under contract to us and they use our supply of fertilizer and seeds that represented the main cost components enhancing cost of sales at an average of 48%. Again, sale of fertilizer is held on credit against crops and pasture grass purchased from them, as well as bulk livestock feed sold to them for cattle rearing, and reconciled once cattle are purchased from them. |
Other Payables: As of December 31, 2012, we have other payables totaling $6,422,478. Promissory notes amounting to $3,352,394 were issued to third parties and personally guaranteed by a director, repayable within two year with no interest being accrued Promissory notes could be repaid either as cash or shares of the Company or a combination of both. Debt amounts and the conversion rates applicable to the shares are determined by both parties as they agree to settle the debt by the Company’s issuance of shares.
Income Statements (1) Segment break-down on Revenue (to third parties):
| Segments | | Sales Revenue | | | % of total | | | Cost of sales | | | % of total cost | | | Gross Profit | | | % of total | | | | | 2012 | | | Revenue | | | 2012 | | | of sales | | | 2012 | | | gross | | | | | $ | | | | | | $ | | | | | | $ | | | profit | | | Fishery Sector | | | | | | | | | | | | | | | | | | | | | | | | | | Capital Award | | | | | | | | | | | | | | | | | | | | | | | | | | Consulting and Service | | | 36,193,780 | | | | 26 | % | | | 14,340,937 | | | | 21 | % | | | 21,852,843 | | | | 31 | % | | Others in sales of Fish, Prawns and commissions and management services | | | 44,798,779 | | | | 32 | % | | | 23,329,038 | | | | 34 | % | | | 21,469,741 | | | | 31 | % | | Fish Farm 1 | | | | | | | | | | | | | | | | | | | | | | | | | | Sales of Fish | | | 391,009 | | | | 0.28 | % | | | 183,774 | | | | 0 | % | | | 207,235 | | | | 0 | % | | Cattle Farm Sector | | | | | | | | | | | | | | | | | | | | | | | | | | MEIJI | | | | | | | | | | | | | | | | | | | | | | | | | | Consulting and Service | | | 11,080,131 | | | | 8 | % | | | 2,998,343 | | | | 4 | % | | | 8,081,788 | | | | 12 | % | | Others in sales of cattle, meat and commission etc. | | | 5,688,904 | | | | 4 | % | | | 4,419,418 | | | | 6 | % | | | 1,269,486 | | | | 2 | % | | Cattle Farm 1 | | | 268,966 | | | | 0.19 | % | | | 193,656 | | | | 0 | % | | | 75,310 | | | | 0 | % | | Beef Organic fertilizer Sector | | | | | | | | | | | | | | | | | | | | | | | | | | SJAP | | | | | | | | | | | | | | | | | | | | | | | | | | Fertilizer | | | 3,825,194 | | | | 3 | % | | | 2,136,239 | | | | 3 | % | | | 1,688,955 | | | | 2 | % | | Bulk Live Stock Feed | | | 2,863,637 | | | | 2 | % | | | 1,382,827 | | | | 2 | % | | | 1,480,810 | | | | 2 | % | | Cattle | | | 14,445,695 | | | | 10 | % | | | 11,079,144 | | | | 16 | % | | | 3,366,551 | | | | 5 | % | | HSA | | | | | | | | | | | | | | | | | | | | | | | | | | Fertilizer | | | 2,213,038 | | | | 2 | % | | | 1,699,593 | | | | 2 | % | | | 513,445 | | | | 1 | % | | HU Plant Sector | | | | | | | | | | | | | | | | | | | | | | | | | | JHST | | | 11,878,599 | | | | 9 | % | | | 5,035,955 | | | | 7 | % | | | 6,842,644 | | | | 10 | % | | Corporate Sector | | | | | | | | | | | | | | | | | | | | | | | | | | SIAF | | | | | | | | | | | | | | | | | | | | | | | | | | Consulting and Service | | | 3,267,401 | | | | 2 | % | | | 909,677 | | | | 1 | % | | | 2,357,724 | | | | 3 | % | | Others | | | 1,698,506 | | | | 1 | % | | | 1,098,870 | | | | 2 | % | | | 599,636 | | | | 1 | % | | Total | | | 138,613,639 | | | | 100 | % | | | 68,807,471 | | | | 100 | % | | | 69,806,168 | | | | 100 | % |
Segment of Revenue analysis and explanation:
1. In 2012, revenue of the consulting and management service by segments aggregated 36% (or $50.5 million) of the total revenue ($138.6 million) of the Company derived collectively from Capital Award (26% or $36.2 million), MEIJI (8% or $11 million) and SIAF (2% or $3.3 million).
The revenue from consulting and management service by segments has been reduced by 4% from 40% in 2011 to 36% in 2012 as shown in the table below. The reason for such decrease is primarily due to the increase of sales revenue of other segments (e.g., sales of fish, cattle and other goods), and this trend is expected to continue as more farms are anticipated to be developed and as the productivity of the existing developed farms increases. However, as we are an agriculture engineering based company, we intend to continue to build farms and other wholesaling and retailing facilities with the objective of maintaining the revenue from consulting and management service within 25% to 30% of the Company's total consolidated revenue year to year.
| | | Financial information 2010 to 2012 of the segments | | | Segments | | Revenue | | | Cost of Sales | | | Gross Profit | | | | | 2010 | | | 2011 | | | 2012 | | | 2010 | | | 2011 | | | 2012 | | | 2010 | | | 2011 | | | 2012 | | | | | $ | | | $ | | | $ | | | $ | | | $ | | | $ | | | $ | | | $ | | | $ | | | Fishery Sector | | | | | | | | | | | | | | | | | | | | | | | | | | | | | | | | | | | | | | Capital Award | | | | | | | | | | | | | | | | | | | | | | | | | | | | | | | | | | | | | | Consulting and Service | | | 4,163,833 | | | | 16,488,192 | | | | 36,193,780 | | | | 1,006,209 | | | | 7,561,874 | | | | 14,340,937 | | | | 3,157,624 | | | | 8,926,318 | | | | 21,852,843 | | | Beef Sector | | | | | | | | | | | | | | | | | | | | | | | | | | | | | | | | | | | | | | MEIJI | | | | | | | | | | | | | | | | | | | | | | | | | | | | | | | | | | | | | | Consulting and Service | | | - | | | | 4,159,921 | | | | 11,080,131 | | | | - | | | | 2,511,508 | | | | 2,998,343 | | | | - | | | | 1,648,413 | | | | 8,081,788 | | | Corporate Sector | | | | | | | | | | | | | | | | | | | | | | | | | | | | | | | | | | | | | | SIAF | | | | | | | | | | | | | | | | | | | | | | | | | | | | | | | | | | | | | | Consulting and Service | | | | | | | | | | | 3,267,401 | | | | - | | | | - | | | | 909,677 | | | | - | | | | - | | | | 2,357,724 | | | | | | | | | | | | | | | | | | | | | | | | | | | | | | | | | | | | | | | | | Total sales revenue of the segments | | | 4,163,833 | | | | 20,648,113 | | | | 50,541,312 | | | | 1,006,209 | | | | 10,073,382 | | | | 18,248,957 | | | | 3,157,624 | | | | 10,574,731 | | | | 32,292,355 | | | Segment % of the group consolidated total | | | 38 | % | | | 40 | % | | | 36 | % | | | | | | | | | | | | | | | | | | | | | | | | | | Consolidated total of continuing operations | | | 10,918,766 | | | | 51,879,903 | | | | 138,613,639 | | | | 3,731,204 | | | | 26,951,874 | | | | 68,807,471 | | | | 7,187,562 | | | | 24,928,029 | | | | 69,806,168 | |
2. In 2012, the revenue from other segments (e.g., sales of fish, fertilizer, bulk livestock feed, cattle, etc.) increased by 4% from 60% in 2011 to 64%. This increase is due primarily to additional farms being built in 2012, contributing to the increase in production as shown in the table below.
| | | Financial information 2010 to 2012 of the segments | | | Segments | | Revenue | | | Cost of Sales | | | Gross Profit | | | | | 2010 | | | 2011 | | | 2012 | | | 2010 | | | 2011 | | | 2012 | | | 2010 | | | 2011 | | | 2012 | | | | | $ | | | $ | | | $ | | | $ | | | $ | | | $ | | | $ | | | $ | | | $ | | | Fishery Sector | | | | | | | | | | | | | | | | | | | | | | | | | | | | | | | | | | | | | | Capital Award | | | | | | | | | | | | | | | | | | | | | | | | | | | | | | | | | | | | | | Others in sales of Fish, Prawns and commissions etc. | | | | | | | 9,933,933 | | | | 44,798,779 | | | | | | | | 7,830,404 | | | | 23,329,038 | | | | - | | | | 2,103,529 | | | | 21,469,741 | | | Fish Farm 1 | | | | | | | | | | | | | | | | | | | | | | | | | | | - | | | | - | | | | - | | | Sales of Fish | | | - | | | | - | | | | 391,009 | | | | - | | | | - | | | | 183,774 | | | | - | | | | - | | | | 207,235 | | | Cattle Farm Sector | | | | | | | | | | | | | | | | | | | | | | | | | | | - | | | | - | | | | - | | | MEIJI | | | | | | | | | | | | | | | | | | | | | | | | | | | - | | | | - | | | | - | | | Others in sales of cattle, meat and commission etc. | | | - | | | | - | | | | 5,688,904 | | | | - | | | | - | | | | 4,419,418 | | | | - | | | | - | | | | 1,269,486 | | | Cattle Farm 1 | | | - | | | | - | | | | 268,966 | | | | - | | | | - | | | | 193,656 | | | | - | | | | - | | | | 75,310 | | | Beef Organic fertilizer Sector | | | | | | | | | | | | | | | | | | | | | | | | | | | - | | | | - | | | | - | | | SJAP | | | | | | | | | | | | | | | | | | | | | | | | | | | - | | | | - | | | | - | | | Fertilizer | | | 1,400,712 | | | | 11,814,921 | | | | 3,825,194 | | | | 525,646 | | | | 4,975,462 | | | | 2,136,239 | | | | 875,066 | | | | 6,839,459 | | | | 1,688,955 | | | Bulk Live Stock Feed | | | 579,367 | | | | 2,514,617 | | | | 2,863,637 | | | | 371,024 | | | | 1,205,763 | | | | 1,382,827 | | | | 208,343 | | | | 1,308,854 | | | | 1,480,810 | | | Cattle | | | - | | | | 852,751 | | | | 14,445,695 | | | | | | | | 793,649 | | | | 11,079,144 | | | | - | | | | 59,102 | | | | 3,366,551 | | | Concentrated Live Stock Feed (Only for 2013) | | | | | | | | | | | | | | | | | | | | | | | | | | | - | | | | - | | | | - | | | HSA | | | | | | | | | | | | | | | | | | | | | | | | | | | - | | | | - | | | | - | | | Fertilizer | | | - | | | | 2,453 | | | | 2,213,038 | | | | - | | | | 2,381 | | | | 1,699,593 | | | | - | | | | 72 | | | | 513,445 | | | Cattle (Only for 2013) | | | | | | | | | | | | | | | | | | | | | | | | | | | - | | | | - | | | | - | | | HU Plant Sector | | | | | | | | | | | | | | | | | | | | | | | | | | | - | | | | - | | | | - | | | JHST | | | 4,774,854 | | | | 6,113,115 | | | | 11,878,599 | | | | 1,828,325 | | | | 2,070,833 | | | | 5,035,955 | | | | 2,946,529 | | | | 4,042,282 | | | | 6,842,644 | | | Corporate Sector | | | | | | | | | | | | | | | | | | | | | | | | | | | - | | | | - | | | | - | | | SIAF | | | | | | | | | | | | | | | | | | | | | | | | | | | - | | | | - | | | | - | | | Others | | | | | | | | | | | 1,698,506 | | | | - | | | | - | | | | 1,098,870 | | | | - | | | | - | | | | 599,636 | | | | | | | | | | | | | | | | | | | | | | | | | | | | | | - | | | | - | | | | - | | | Segments' Total | | | 6,754,933 | | | | 31,231,790 | | | | 88,072,327 | | | | 2,724,995 | | | | 16,878,492 | | | | 50,558,514 | | | | 4,029,938 | | | | 14,353,298 | | | | 37,513,813 | | | Segment % of the consolidated total | | | 62 | % | | | 60 | % | | | 64 | % | | | | | | | | | | | | | | | | | | | | | | | | | | Consolidated total of | | | 10,918,766 | | | | 51,879,903 | | | | 138,613,639 | | | | 3,731,204 | | | | 26,951,874 | | | | 68,807,471 | | | | 7,187,562 | | | | 24,928,029 | | | | 69,806,168 | |
Income Taxes
No EIT has been provided in the financial statements of CA, ZX, JHST, JHMC, JFD, HSA and SJAP since they are exempt from EIT for the years ended December 31, 2012 and 2011 as they are within the agriculture, dairy and fishery sectors. However as of December 31, 2012 JFD has been levied with an EIT of 25%, which JFD is appealing to the Taxation Department for a waiver of this tax. The Company expects to prevail in its appeal, therefore there is no EIT being provided for JFD during the years ended December 31, 2012 and 2011.
No EIT has been provided in the financial statements of HSA for the income earned for the years December 31, 2012 as they are within the agriculture, dairy and fishery sectors. EIT has been provided in the financial statements of HSA at 25% for the income for the years ended December 31, 2011 as it is not within the agriculture, dairy and fishery sectors.
However, as of December 31, 2012, Taxation Department agreed that HSA is exempt from EIT for the years ended December 31, 2012 and 2011. No EIT has been provided in the financial statements of HSA for the income earned for the years December 31, 2012 as they are within the agriculture, dairy and fishery sectors. EIT has been provided in the financial statements of HSA at 25% for the income for the years ended December 31, 2011 as part of its revenue was generated from other source of supply other than SJAP that was not exempted from EIT.
However, as of December 31, 2012, Taxation Department agreed that JFD is exempt from EIT for the years ended December 31, 2012 and 2011. No EIT has been provided in the financial statements of JFD for the income earned for the years December 31, 2012 as they are within the agriculture, dairy and fishery sectors. JFD had been levied with an EIT of 25% in 2011, but JFD’s appeal to the Taxation Department for a waiver of this tax was successful by December 31, 2012.
Off Balance Sheet Arrangements:
None.
Other Significant Factors That May Affect Cash/Liquidity:
Inflation factors affecting operations:
On the surface the Government’s anti-inflationary measures seemed to be working during the six months ended June 30, 2013. However, management remains concerned since most of the building materials, cost of labor and essential consumer goods are still rising at a higher rate than GDP. Its impact on consumer spending has not seemed to materialize, though, with growth in spending maintaining an upward trajectory.
As of June 30, 2013, the Company had no other significant transactions that may affect our cash/liquidity other than those mentioned in this prospectus.
The Company considers all highly liquid securities with original maturities of three months or less when acquired to be cash equivalents. Cash and cash equivalents kept with financial institutions in People’s Republic of China (“PRC”) are not insured or otherwise protected. Should any of those institutions holding the Company’s cash become insolvent, or the Company is unable to withdraw funds for any reason, the Company could lose the cash on deposit at that institution.
Liquidity and Capital Resources
As of June 30, 2013, we had unrestricted cash and cash equivalents of $9,391,449, (see notes to the consolidated account), and our working capital as of June 30, 2013 was $145,332,475.
As of June 30, 2013, our total long term debts are as follows:
| Contractual Obligations | | Less than 1 year ($) | | | 1-3 years ($) | | | 3-5 years ($) | | | More than 5 years ($) | | | Total ($) | | | Short Term Bank Loan | | | | | | | 2,265,849 | | | | | | | | | | | | | | | Long Term Debts | | | 0 | | | | 0 | | | | 178,031 | | | | 0 | | | | 0 | | | Promissory Notes Issued to third parties | | | 5,915,423 | | | | | | | | | | | | | | | | | |
Cash provided by operating activities totaled $16,120,653 for the six months ended June 30, 2013. This compares with cash provided by operating activities $9,887,541 for the six months ended June 30, 2012. The increase in cash flows from operations primarily resulted from net cash provided by net income for the period after adjustments of non- cash items.
Cash used in investing activities totaled $14,086,955 for the six months ended June 30, 2013. This compares with cash used in investing activities totaled $11,722,784 for the six months ended June 30, 2012. The increase in cash flows used in investing activities primarily resulted from construction payments of $12,596,632 for the six months ended June 30, 2013 as compared to construction payments of $6,626,688 for the six months ended June 30, 2012.
Cash used in financing activities totaled $951,308 for the six months ended June 30, 2013. This compares with cash from financing activities totaled $1,672,033 for the six months ended June 30, 2012. The decrease in cash flows provided by investing activities primarily resulted from non-controlling interests contribution of $1,806,644 for the six months ended June 30, 2012 as compared with no non-controlling interests for the six months ended June 30, 2013.
The following table shows the debt we have exchanged for equity during the periods indicated:
| | | | | Issuance | | | | | | Consideration | | | Investors | | | Date | | Events | | of shares | | | Price / share | | | received | | | Non-USA | | | USA | | | | | | | # of shares | | | US$ | | | US$ | | | # of persons | | | As at | | | | | | | | | | | | | | | | | | | | | | | | 31.12.2010 | | Quoted in 10K and Form 10 | | | 55,474,136 | | | | | | | | 50,884,475 | | | | 136 | | | | 5,123 | | | 03.01.2011 | | Debt settlements | | | 370,000 | | | | 1.50 | | | | 562,500 | | | | | | | | 1 | | | 13.01.2011 | | Debt settlements | | | 491,000 | | | | 1.50 | | | | 736,500 | | | | | | | | 1 | | | 10.02.2011 | | Debt Settlements | | | 425,000 | | | | 1.50 | | | | 637,500 | | | | | | | | 1 | | | 10.02.2011 | | Debt settlements | | | 35,000 | | | | 1.50 | | | | 52,500 | | | | | | | | 1 | | | 16.04.2011 | | Debt settlements | | | 530,000 | | | | 1.50 | | | | 795,000 | | | | | | | | 1 | | | 22.04.2011 | | Debt settlements | | | 400,000 | | | | 1.50 | | | | 600,000 | | | | | | | | 1 | | | 08.05.2011 | | Debt settlements | | | 351,000 | | | | 1.50 | | | | 526,500 | | | | | | | | 1 | | | | | | | | 2,602,000 | | | | | | | | 3,910,500 | | | | | | | | | | | | | | | | | | | | | | | | | | | | | | | | | | | 06.07.2011 | | Brought from third parties for resale | | | -500,000 | | | | 0.78 | | | | -390,000 | | | | -1 | | | | | | | 19.07.2011 | | Brought from third parties for resale | | | -500,000 | | | | 0.78 | | | | -390,000 | | | | -1 | | | | | | | 27.06.2011 | | Debt Settlements | | | 304,878 | | | | 0.82 | | | | 250,000 | | | | | | | | - | | | 21.07.2011 | | Debt Settlements | | | 304,878 | | | | 0.82 | | | | 250,000 | | | | | | | | - | | | 16.08.2011 | | Debt Settlements | | | 377,976 | | | | 0.82 | | | | 309,940 | | | | | | | | 1 | | | 02.09.2011 | | Debt Settlements | | | 12,268 | | | | 0.82 | | | | 10,060 | | | | | | | | | | | 02.09.2011 | | Debt settlements | | | 353,542 | | | | 0.84 | | | | 296,975 | | | | | | | | 1 | | | 02.09.2011 | | Debt settlements | | | 426,787 | | | | 0.69 | | | | 293,629 | | | | 2 | | | | | | | 01.07.2011 | | Worker compensation & adjustments | | | 1,706,620 | | | | 1.01 | | | | 1,723,686 | | | | 79 | | | | | | | 11.7.2011 | | Worker compensation & adjustments | | | 1,054,109 | | | | 0.90 | | | | 943,428 | | | | | | | | | | | 11.07.2011 | | Professional services paid in shares and adjustments | | | 1,800,000 | | | | 0.90 | | | | 1,611,000 | | | | | | | | 4 | | | | | | | | | | | | | | | | | | | | | | | | | | | As at | | | | | | | | | | | | | | | | | | | | | | | | 30.09.2011 | | Total Common shares issued | | | 63,417,194 | | | | | | | | 59,703,693 | | | | 215 | | | | 5,136 | |
| Equity Changes | | | | | | Issurance of | | | | | | Consideration | | | Investors | | | Date | | Events | | shares | | | Price / share | | | received | | | Non-USA | | | USA | | | | | | | # of shares | | | US$ | | | US$ | | | # of persons | | | As at | | | | | | | | | | | | | | | | | | | 30.09.2011 | | Total common shares issued | | | 63,417,194.00 | | | | | | | | 59,703,693.00 | | | | 215.00 | | | | 5,136.00 | | | 08.10.2011 | | Share issued for debt settlement | | | 1,470,588.00 | | | | 0.85 | | | | 1,250,000.00 | | | | | | | | 1.00 | | | 14.10.2011 | | Shares brought = (A) | | | -600,000.00 | | | | 0.65 | | | | -390,000.00 | | | | | | | | -1.00 | | | 19.10.2011 | | Shares brought = (B) | | | -620,000.00 | | | | 0.65 | | | | -403,000.00 | | | | | | | | -1.00 | | | 23.10.2011 | | Shares brought = ( C ) | | | -2,000,000.00 | | | | 0.01 | | | | -20,000.00 | | | | | | | | - | | | 23.10.2011 | | Shares brought = (D) | | | -2,000,000.00 | | | | 0.01 | | | | -20,000.00 | | | | | | | | - | | | 23.10.2011 | | Shares brought = (E) | | | -2,400,000.00 | | | | 0.01 | | | | -24,000.00 | | | | | | | | - | | | 14.10.2011 | | Debt Settlement | | | 600,000.00 | | | | 0.80 | | | | 480,000.00 | | | | 1.00 | | | | | | | 14.11.2011 | | Debt Settlements | | | 620,000.00 | | | | 0.80 | | | | 496,000.00 | | | | 1.00 | | | | | | | 14.11.2011 | | Debt settlement | | | 1,596,480.00 | | | | 0.91 | | | | 1,450,000.00 | | | | 3.00 | | | | | | | 15.11.2011 | | Debt settlement | | | 6,400,000.00 | | | | 0.504 | | | | 3,225,600.00 | | | | 1.00 | | | | | | | 15.12.2011 | | Debt settlement | | | 550,000.00 | | | | 0.504 | | | | 277,200.00 | | | | - | | | | | | | | | | | | | | | | | | | | | | | | | | | | | | | as at 31.12 2011 | | | | | 67,034,262.00 | | | | | | | | 66,025,493.00 | | | | 221.00 | | | | 5,135.00 | |
| Equity Changes | | | | | | Issurance of | | | | | | Consideration | | | Investors | | | Date | | Events | | shares | | | Price / share | | | received | | | Non-USA | | | USA | | | | | | | # of shares | | | US$ | | | US$ | | | # of persons | | | as at 31.12 2011 | | | | | 67,034,262 | | | | | | | | 66,025,493 | | | | 221 | | | | 5,135 | | | 16.01.2012 | | Debt Settlement | | | 867,100 | | | | 0.65 | | | | 563,615 | | | | 1 | | | | | | | | | | | | | | | | | | | | | | | | | | | | | | | 14.02.2012 | | Debt Settlement | | | 1,508,959 | | | | 0.60 | | | | 905,375 | | | | 1 | | | | | | | | | | | | | | | | | | | | | | | | | | | | | | | 07.03.2012 | | Debt Settlement | | | 722,225 | | | | 0.63 | | | | 455,002 | | | | 1 | | | | | | | | | | | | | | | | | | | | | | | | | | | | | | | 23.03.2012 | | Debt Settlements | | | 600,000 | | | | 0.75 | | | | 450,000 | | | | 1 | | | | | | | | | | | | | | | | | | | | | | | | | | | | | | | As at 31.03.2012 | | | | | 70,732,546 | | | | 3 | | | | 68,399,485 | | | | 225 | | | | 5,135 | | | | | | | | | | | | | | | | | | | | | | | | | | | 20.04.2012 | | Debt Settlement | | | 801,666 | | | | 0.71 | | | | 568,118 | | | | 1 | | | | | | | 20.04.2012 | | Debt Settlement | | | 437,370 | | | | 0.71 | | | | 310,000 | | | | 1 | | | | | | | 20.04.2012 | | Debt Settlement | | | 458,524 | | | | 0.71 | | | | 325,015 | | | | 1 | | | | | | | | | | | | | | | | | | | | | | | | | | | | | | | 25.05.2012 | | Debt Settlement | | | 1,280,081 | | | | 0.62 | | | | 793,650 | | | | 1 | | | | | | | 25.05.2012 | | Debt Settlement | | | 2,133,606 | | | | 0.62 | | | | 1,315,475 | | | | 1 | | | | | | | 08.06.2012 | | Debt Settlement | | | 558,538 | | | | 0.65 | | | | 365,000 | | | | 1 | | | | | | | 08.06.2012 | | Debt Settlement | | | 893,639 | | | | 0.65 | | | | 585,000 | | | | 1 | | | | | | | 15.06.2012 | | Debt Settlement | | | 473,923 | | | | 0.65 | | | | 310,000 | | | | - | | | | | | | | | | | | | | | | | | | | | | | | | | | | | | | As at 30.06.2012 | | | | | 77,769,893 | | | | 8 | | | | 72,971,743 | | | | 232 | | | | 5,135 | | | 05.07.2012 | | Debt Settlement | | | 2,151,247 | | | | 0.54 | | | | 1,161,825 | | | | | | | | | | | 19.07.2012 | | Debt Settlement | | | 1,795,307 | | | | 0.52 | | | | 931,825 | | | | | | | | | | | 08.08.2012 | | Debt Settlement | | | 765,000 | | | | 0.52 | | | | 400,000 | | | | | | | | | | | 16.08.2012 | | Worker Compensation | | | 906,000 | | | | 0.395 | | | | 362,400 | | | | 2 | | | | 2 | | | 18.08.2012 | | Debt Settlement | | | 1,678,000 | | | | 0.51 | | | | 859,825 | | | | 1 | | | | | | | 22.08.2012 | | Debt Settlement | | | 1,493,500 | | | | 0.52 | | | | 773,325 | | | | | | | | 1 | | | 17.09.2012 | | Debt Settlement | | | 2,902,960 | | | | 0.64 | | | | 1,862,439 | | | | | | | | | | | 20.09.2012 | | Debt Settlement | | | 390,625 | | | | 0.65 | | | | 250,000 | | | | - | | | | - | | | 24.09.2012 | | Debt Settlement | | | 527,803 | | | | 0.71 | | | | 400,000 | | | | - | | | | - | | | | | | | | 668,647 | | | | 0.71 | | | | 500,000 | | | | - | | | | - | | | As at 30.09.2012 | | | | | 91,048,982 | | | | | | | | 80,473,382 | | | | 235 | | | | 5,138 | | | 12.10.2012 | | Debt Settlement | | | 371,429 | | | | 0.70 | | | | 260,000 | | | | - | | | | - | | | 24.10.2012 | | Debt Settlement | | | 1,062,357 | | | | 0.70 | | | | 743,650 | | | | - | | | | - | | | 01.10.2012 | | Debt Settlement | | | 804,346 | | | | 0.70 | | | | 563,042 | | | | - | | | | - | | | 9.11.2012 | | Debt Settlement | | | 1,209,187 | | | | 0.615 | | | | 743,650 | | | | - | | | | - | | | 9.11.2012 | | Debt Settlement | | | 491,080 | | | | 0.615 | | | | 302,014 | | | | - | | | | - | | | 23.11.2012 | | Debt Settlement | | | 474,364 | | | | 0.615 | | | | 291,734 | | | | - | | | | - | | | 03.12.2012 | | Debt Settlement | | | 392,955 | | | | 0.53 | | | | 208,266 | | | | - | | | | - | | | 03.12.2012 | | Debt Settlement | | | 660,377 | | | | 0.53 | | | | 350,000 | | | | - | | | | - | | | 17.12.2012 | | Debt Settlement | | | 69,732 | | | | 0.53 | | | | 36,958 | | | | - | | | | - | | | 21.12.2012 | | Debt Settlement | | | 188,679 | | | | 0.53 | | | | 100,000 | | | | - | | | | - | | | 21.12.2012 | | Debt Settlement | | | 1,037,736 | | | | 0.53 | | | | 550,000 | | | | - | | | | - | | | 21.12.2012 | | Debt Settlement | | | 1,311,321 | | | | 0.53 | | | | 695,000 | | | | - | | | | - | | | As at 31.12.2012 | | | | | 99,122,545 | | | | 7.13 | | | | 85,317,696 | | | | 235 | | | | 5,138 | |
| Equity Changes Q1 2013 | | | | | | Issurance of | | | | | | Consideration | | | Investors | | | Date | | Events | | shares | | | Price / share | | | received | | | Number of Persons / Entities | | | | | | | | | | # of shares | | | US$ | | | US$ | | | Non-USA | | | USA | | | As at 31.12.2012 Opening Balance | | | | | | | 100,004,850 | | | | | | | | 85,917,696 | | | | 235 | | | | 5,138 | | | | | | | | | | | | | | | | | | | | | | | | | | | | | | | 03.01.2013 | | Debt Settlement | | | | | | | 925,977 | | | | 0.53 | | | | 490,768 | | | | 1 | | | | | | | 03.01.2013 | | Debt Settlement | | | | | | | 835,106 | | | | 0.53 | | | | 442,606 | | | | 1 | | | | | | | 15.01.2013 | | Debt Settlement | | | | | | | 1,415,094 | | | | 0.53 | | | | 750,000 | | | | - | | | | | | | 15.01.2013 | | Debt Settlement | | | | | | | 1,415,094 | | | | 0.53 | | | | 750,000 | | | | - | | | | | | | 20.02.2013 | | Debt Settlement | | | | | | | 1,432,692 | | | | 0.52 | | | | 745,000 | | | | 1 | | | | | | | 25.02.2013 | | Debt Settlement | | | | | | | 961,538 | | | | 0.52 | | | | 500,000 | | | | 1 | | | | | | | 15.03.2013 | | Debt Settlement | | | | | | | 1,181,818 | | | | 0.550 | | | | 650,000 | | | | - | | | | | | | 28.03.2013 | | Debt Settlement | | | | | | | 645,161 | | | | 0.620 | | | | 400,000 | | | | - | | | | | | | 28.03.2013 | | Debt Settlement | | | | | | | 1,532,258 | | | | 0.620 | | | | 950,000 | | | | - | | | | | | | | | | | | | | | | | | | | | | | | | | | | | | | | | | | As at 31.03.2013 (or Q1 2013) | | | | | | | | | 110,349,588 | | | | | | | | 91,596,070 | | | | 239 | | | | 5,138 | | | 18.04.2013 | | Debt Settlement | | | | | | | 2,241,379 | | | | 0.58 | | | | 1,300,000 | | | | - | | | | | | | 18.04.2013 | | Debt Settlement | | | | | | | 932,822 | | | | 0.58 | | | | 541,037 | | | | - | | | | | | | 10.05.2013 | | Debt Settlement | | | | | | | 2,915,055 | | | | 0.46 | | | | 1,340,925 | | | | 1 | | | | | | | 10.05.2013 | | Debt Settlement | | | | | | | 2,084,703 | | | | 0.46 | | | | 958,963 | | | | - | | | | | | | 25.06.2013 | | Debt Settlement | | | | | | | 663,362 | | | | 0.41 | | | | 271,978 | | | | | | | | | | | 25.06.2013 | | Debt Settlement | | | | | | | 986,919 | | | | 0.41 | | | | 404,637 | | | | 1 | | | | | | | | | | | | | | | | | | | | | | | | | | | | | | | | | | | As at 30.06.2013 (or Q2 2013) | | | | | Total | | | | 120,173,828 | | | | | | | | 96,413,610 | | | | 241 | | | | 5,138 | |
CRITICAL ACCOUNTING POLICIES
BASIS OF PRESENTATION
The consolidated financial statements are prepared in accordance with generally accepted accounting principles in the United States of America (“US GAAP”). All material inter-company transactions and balances have been eliminated in consolidation.
The Renminbi of the People’s Republic of China (RMB) has been determined to be the Company’s functional currency. The balance sheets were translated at year end exchange rates. Expenses were translated at moving average exchange rates in effect during the years. The effects of rate changes on assets and liabilities are recorded as accumulated other comprehensive income.
BASIS OF CONSOLIDATION The consolidated financial statements include the financial statements of SIAF, its subsidiaries Capital Award, CS, CH, TRW, MEIJI, HJST,JHST, JFD, JHMC, HSA, and APWAM, SAFS and its variable interest entity SJAP.entities SJAP and QZH. All material inter-company transactions and balances have been eliminated in consolidation. The results of companies acquired or disposed of during the year are included in the consolidated Financial Statements from the effective date of acquisition. BUSINESS COMBINATIONS The Company adopted the accounting pronouncements relating to business combinations (primarily contained in ASC Topic 805 “Business Combinations”), including assets acquired and liabilities assumed arising from contingencies. These pronouncements established principles and requirements for how the acquirer of a business recognizes and measures in its financial statements the identifiable assets acquired, the liabilities assumed, and any non-controlling interest in the acquire as well as provides guidance for recognizing and measuring the goodwill acquired in the business combination and determines what information to disclose to enable users of the financial statements to evaluate the nature and financial effects of the business combination. In addition, these pronouncements eliminate the distinction between contractual and non-contractual contingencies, including the initial recognition and measurement criteria and require an acquirer to develop a systematic and rational basis for subsequently measuring and accounting for acquired contingencies depending on their nature. Our adoption of these pronouncements will have an impact on the manner in which we account for any future acquisitions. NON - CONTROLLING INTEREST IN CONSOLIDATED FINANCIAL STATEMENTS The Company adopted the accounting pronouncement on non-controlling interests in consolidated financial statements, which establishes accounting and reporting standards for the non-controlling interest in a subsidiary and for the deconsolidation of a subsidiary. This guidance is primarily contained in ASC Topic “Consolidation”. It clarifies that a non-controlling interest in a subsidiary is an ownership interest in the consolidated financial statements. The adoption of this standard has not had material impact on our consolidated financial statements. USE OF ESTIMATES The preparation of consolidated financial statements in conformity with accounting principles generally accepted in the United States requires management to make assumptions and estimates that affect the reported amounts of assets and liabilities and disclosure of contingent assets and liabilities at the dates of the consolidated financial statements and the reported amounts of revenues and expenses during the reporting periods covered thereby. Actual results could differ from these estimates. Judgments and estimates of uncertainties are required in applying the Company’s accounting policies in certain areas. The following are some of the areas requiring significant judgments and estimates: determinations of the useful lives of assets, estimates of allowances for doubtful accounts, cash flow and valuation assumptions in performing asset impairment tests of long-lived assets, estimates of the reliability of deferred tax assets and inventory reserves. REVENUE RECOGNITION The Company’s
In May 2014, the FASB issuedAccounting Standard Update 2014-09, Revenue from Contracts with Customers (Topic 606), which replaces numerous requirements in U.S. GAAP, including industry specific requirements, and provides a single revenue recognition policies are in compliancemodel for recognizing revenue from contracts with ASC 605. Sales revenue is recognized when all of the following have occurred: (i) persuasive evidence of an arrangement exists, (ii) delivery has occurred or services have been rendered, (iii) the price is fixed or determinable, and (iv) the ability to collect is reasonably assured. These criteria are generally satisfied at the time of shipment when risk of loss and title passes to the customer. Service revenue is recognized when services have been rendered to a buyer by reference to the stage of completion. License fee income is recognized on the accrual basis in accordance with the underlying agreements.customers. The Company adopted this standard effective January 1, 2018. Government grantsThe core principle of the new standard is that a company should recognize revenue to depict the transfer of promised goods or services to customers in an amount that reflects the consideration to which the company expects to be entitled in exchange for those goods or services. This requires companies to identify contractual performance obligations and determine whether revenue should be recognized at a point in time or over time, based on when control of goods and services transfers to a customer. The Company’s revenues generated mainly from trading of frozen food and sales of agricultural products are recognized upon (i)at a point in time.
The ASU requires the Company has substantially accomplished what we must be done pursuantuse of a new five-step model to the terms of the policies and terms of the grant that are established by the local government; and (ii) the Company receives notificationrecognize revenue from the local governmentcustomer contracts. The five-step model requires that the Company has satisfied all(i) identify the contract with the customer, (ii) identify the performance obligations in the contract, (iii) determine the transaction price, including variable consideration to the extent that it is probable that a significant future reversal will not occur, (iv) allocate the transaction price to the respective performance obligations in the contract, and (v) recognize revenue when (or as) the Company satisfies the performance obligation. The application of the requirementsfive-step model to receive the government grants;revenue streams compared to the prior guidance did not result in significant changes in the way the Company records its revenues. Multiple-Element Arrangements To qualify as a separate unit of accounting under ASC 605-25“Multiple Element Arrangements”, the delivered item must have value to the customer on a standalone basis. The significant deliverables under the Company’s multiple-element arrangements are consulting and or (iii) the amounts are received.service under development contract, commission and management service. Revenues from the Company's fishery development services contract are performed under fixed-price contracts. Revenues under long-term contracts are accounted for under the percentage-of-completion method of accounting in accordance with the Financial Accounting Standards Board (“FASB”FASB”) Accounting Standards Codification (“ASC”ASC”) Topic 605,Revenue Recognition (“(“ASC 605”605”). Under the percentage-of-completion method, the Company estimates profit as the difference between total estimated revenue and total estimated cost of a contract and recognized that profit over the contract term. The percentage of costs incurred determines the amount of revenue to be recognized. Payment terms are generally defined by the installation contract and as a result may not match the timing of the costs incurred by the Company and the related recognition of revenue. Such differences are recorded as either costs or estimated earnings in excess of billings on uncompleted contracts or billings in excess of costs and estimated earnings on uncompleted contracts. The Company determines a customer’s credit worthiness at the time an order is accepted. Sudden and unexpected changes in a customer’s financial condition could put recoverability at risk. The percentage of completion method requires the ability to estimate several factors, including the ability of the customer to meet its obligations under the contract, including the payment of amounts when due. If the Company determines that collectability is not assured, we will defer revenue recognition and use methods of accounting for the contract such as the completed contract method until such time as the Company determines that collectability is reasonably assured or through the completion of the project. For fixed-price contracts, the Company uses the ratio of costs incurred to date on the contract (excluding uninstalled direct materials) to management's estimate of the contract's total costs, to determine the percentage of completion on each contract. This method is used as management considers expended costs to be the best available measure of progression of these contracts. Contract costs included all direct material, subcontract and labor costs and those indirect costs related to contract performance, such as supplies, tool repairs and depreciation. The Company accounts for maintenance and repair services under the guidance of ASC 605 as the services provided relate to construction work. Contract costs incurred to date and expected total contract costs are continuously monitored during the term of the contract. Changes in job performance, job conditions, and estimated profitability arising from contract penalty, change orders and final contract settlements may result in revisions to the estimated profitability during the contract. These changes, which include contracts with estimated costs in excess of estimated revenues, are recognized as contract costs in the period in which the revisions are determined. Profit incentives are included in revenues when their realization is reasonably assured. At the point the Company anticipates a loss on a contract, the Company estimates the ultimate loss through completion and recognizes that loss in the period in which the possible loss was identified. The Company does not provide warranties to customers on a basis customary to the industry; however, the customers can claim warranty directly from product manufacturers for defects in equipment or products. Historically, the Company has experienced no warranty claims. The Company’s fishery development consultancy services revenues are recognized when the relevant services are rendered, and are subject to a Chinese business tax at a rate of 0% of the gross fishery development contract service income approved by the Chinese local government. COST OF GOODS SOLD AND SERVICES Cost of goods sold consists primarily of direct purchase cost of merchandise goods, and related levies. Cost of services consists primarily of direct cost and indirect cost incurred to date for development contracts and provision for anticipated losses on development contracts. SHIPPING AND HANDLING Shipping and handling costs related to cost of goods sold are included in general and administrative expenses, which totaled $84,297$26,129 and $58,392$16,748 for the years ended December 31, 20122018 and December 31, 2011,2017, respectively. Shipping and handling costs related to cost of goods sold are included in general and administrative expenses, which totaled $0 and $786 for the three months ended March 31, 2019 and 2018, respectively. ADVERTISING Advertising costs are included in general and administrative expenses, which totaled $1,973$1,541,484, and $99,526$1,777,383 for the years ended December 31, 20122018 and 2017, respectively. Advertising costs are included in general and administrative expenses, which totaled $377,946 and $400,754 for the three months ended March 31, 2019 and 2018, respectively. RESEARCH AND DEVELOPMENT EXPENSES Research and development expenses are included in general and administrative expenses, which totaled $453, 378 and $1,332,938 for the years ended December 31, 2011,2018 and 2017, respectively. Research and development expenses are included in general and administrative expenses, which totaled $426,115 and $0 for the three months ended March 31, 2019 and 2018, respectively. CASH AND CASH EQUIVALENTS The Company considers all highly liquid securities with original maturities of three months or less when acquired to be cash equivalents. Cash and cash equivalents kept with financial institutions in the People’s Republic of China (“PRC”PRC”) are not insured or otherwise protected. Should any of those institutions holding the Company’s cash become insolvent, or the Company is unable to withdraw funds for any reason, the Company could lose the cash on deposit on that institution. ACCOUNTS RECEIVABLE The Company maintains reserves for potential credit losses on accounts receivable. Management reviews the composition of accounts receivable and analyzes historical bad debts, customer concentrations, customer credit worthiness, current economic trends and changes in customer payment patterns to evaluate the adequacy of these reserves. Terms of the sales vary. Reserves are recorded primarily on a specific identification basis. The standard credit period of the Company’s most of customers is three months. Any amount that has an extended settlement date of over one year is classified as a long term receivable. Management evaluates the collectability of the receivables at least quarterly. Provision for doubtful accounts as of December 31, 2012 and December 31, 2011 are $0. There were nowas a written off on bad debts written offof $14,394,402 arising due to the dispose of QZH for the yearstwelve months ended December 31, 20122018 or December 31, 2011.(2017: Nil) INVENTORIES Inventories are valued at the lower of cost (determined on a weighted average basis) and net realizable value. Costs incurred in bringing each product to its location and conditions are accounted for as follows: raw materials – purchase cost on a weighted average basis;
manufactured finished goods and work-in-progress – cost of direct materials and labor and a proportion of manufacturing overhead based on normal operation capacity but excluding borrowing costs; and
retail and wholesale merchandise finished goods – purchase cost on a weighted average basis.
| • | raw materials - purchase cost on a weighted average basis; | | • | manufactured finished goods and work-in-progress - cost of direct materials and labor and a proportion of manufacturing overhead based on normal operation capacity but excluding borrowing costs; and | | • | retail and wholesale merchandise finished goods - purchase cost on a weighted average basis. |
Net realizable value is the estimated selling price in the ordinary course of business, less estimated costs of completion and the estimated costs necessary to make the sale. PROPERTY AND EQUIPMENT Property and equipment are stated at cost less accumulated depreciation and any accumulated impairment losses. Such costs include the cost of replacing parts that are eligible for capitalization when the cost of replacing the parts is incurred. The assets’ residual values, useful lives and depreciation methods are reviewed, and adjusted if appropriate, at the end of each year. Depreciation is calculated on a straight-line basis over the estimated useful life of the assets. | Milk cows | | 10 years | | Plant and machinery | | 5 - 10 years | | Structure and leasehold improvements | | 10 -20- 30 years | | Mature seed | and herbage cultivation | 20 years | | Furniture, fixtures and equipment | | 2.5 - 10 years | | Motor vehicles | | 5 -104 - 10 years |
An item of property and equipment is removed from the accounts upon disposal or when no future economic benefits are expected to arise from the continued use of the asset. Any gain or loss arising on disposal of the asset (calculated as the difference between the net disposal proceeds and the carrying amount of the item) is included in the consolidated statements of income in the period the item is disposed. GOODWILL Goodwill is an asset representing the fair economic benefits arising from other assets acquired in a business combination that are not individually identified and separately recognized. Goodwill is tested for impairment on an annual basis at the end of the company’s fiscal year, or when impairment indicators arise. The Company uses a fair-value-based approach to test for impairment at the level of each reporting unit. The Company directly acquired MEIJI, which is engaged in Hu Plantation. As a result of this acquisition, the Company recorded goodwill in the amount of $724,940. This goodwill represents the fair value of the assets acquired in these acquisitions over the cost of the assets acquired. PROPRIETARY TECHNOLOGIES The Company has determined that technological feasibility is established at the time a working model of products is completed. Master license of stock feed manufacturing technology was acquired and the costs of acquisition were capitalized as proprietary technologies when technological feasibility had been established. Proprietary technologies are intangible assets of finite lives. Proprietary technologies are amortized using the straight linestraight-line method over their estimated lives of 25 years. An aromatic cattle-feeding formula was acquired and the costs of acquisition are capitalized as proprietary technologies when technological feasibility has been established. Cost of acquisition on aromatic cattle-feeding formula is amortized using the straight-line method over its estimated life of 20 years. The cost of sleepy cod breeding technology license is capitalized as proprietary technologies when technological feasibility has been established. Cost of granting sleepy cod breeding technology license is amortized using the straight-line method over its entitled life of 25 years. Bacterial cellulose technology license and related trademark are capitalized as proprietary technologies when technological feasibility has been established. Cost of license and related trademark is amortized using the straight-line method over its estimated life of 20 years. Management evaluates the recoverability of proprietary technologies on an annual basis of the end of the company’s fiscal year, or when impairment indicators arise. As required by ASC Topic 350 “Intangible –- Goodwill and Other”, the Company uses a fair-value-based approach to test for impairment. CONSTRUCTION IN PROGRESS Construction in progress represents direct costs of construction as well as acquisition and design fees incurred. Capitalization of these costs ceases and the construction in progress is transferred to property and equipment when substantially all the activities necessary to prepare the assets for their intended use are completed. No depreciation is provided until construction is completed and the asset is ready for its intended use..use. LAND USE RIGHTS Land use rights represent acquisition of land use right rights of agriculture land from farmers and are amortized on the straight line basis over the respective lease periods. The lease period of agriculture land is in the range from 3010 years to 60 years. Land use rights purchase prices were determined in accordance with the 2007 PRC Government’s minimum lease payments of agriculture land and mutually agreed between the company and the vendors. No independent professional appraiser performed a valuation of land use rights at the balance sheet dates. CORPORATE JOINT VENTURE A corporation formed, owned, and operated by two or more businesses (ventures) as a separate and discrete business or project (venture) for their mutual benefit is considered to be a corporate joint venture. Investee entities, in which the company can exercise significant influence, but not control, are accounted for under the equity method of accounting. Under the equity method of accounting, the company’s share of the earnings or losses of these companies is included in net income. A loss in value of an investment that is other than a temporary decline is recognized as a charge to operations. Evidence of a loss in value might include, but would not necessarily be limited to absence of an ability to recover the carrying amount of the investment or inability of the investee to sustain an earnings capacity that would justify the carrying amount of the investment. VARIABLE INTEREST ENTITY An entity (investee) in which the investor has obtained less than a majority-owned interest, according to the Financial Accounting Standards Board (FASB). A variable interest entity (VIE) is subject to consolidation if a VIE is an entity meeting one of the following three criteria as elaborated in ASC Topic 810-10,Consolidation. | (a) | equity-at-risk is not sufficient to support the entity's activities |
| (b) | As a group, the equity-at-risk holders cannot control the entity; or |
| (c) | The economics do not coincide with the voting interest |
(a) the equity-at-risk is not sufficient to support the entity's activities; (b) as a group, the equity-at-risk holders cannot control the entity; or (c) the economics do not coincide with the voting interests. If a firm is the primary beneficiary of a VIE, the holdings must be disclosed on the balance sheet. The primary beneficiary is defined as the person or company with the majority of variable interestsinterests. TREASURY STOCK Treasury stock consists of a Company’s own stock which has been issued, but is subsequently reacquired by the Company. Treasury stock does not reduce the number of shares issued but does reduce the number of shares outstanding. These shares are not eligible to receive cash dividends. Accounting for excesses and deficiencies on treasury stock transactions is governed by ASC 505-30-30. State laws and federal agencies closely regulate transactions involving a company’s own capital stock, so the purchase of outstanding shares and converting them into treasury shares must have a legitimate purpose. Some of the most common reasons for purchasing outstanding shares are as follows: (i) to meet additional stock needs for various reasons, including newly implemented stock option plans, the issuance stock for convertible bonds or convertible preferred stock, or a stock dividend; (ii) to eliminate the ownerships interests of a stockholder; (iii) to increase the market price of the stock that returns capital to shareholders; and (iv) to potentially increase earnings per share of the stock by decreasing the shares outstanding on the same earnings. The Company has adopted the cost method of accounting for treasury stock shares has been adopted by the Company.shares. The purchase of outstanding shares is treated as a temporary reduction in shareholders’ equity in view of the expectation to reissue the shares instead of retiring them. When the Company reissues the treasury shares, the temporary account is eliminated. The cost of treasury stock shares reacquired is charged to a contra account, in this case a contra equity account that reduces the stockholder equity balance. INCOME TAXES The Company accounts for income taxes under the provisions of ASC 740 “Accounting for Income Taxes”.Taxes.” Under ASC 740, deferred tax assets and liabilities are determined based on the difference between the financial statement carrying amounts and the tax bases of assets and liabilities using enacted tax rates in effect in the years in which the differences are expected to reverse. The provision for income tax is based on the results for the year as adjusted for items, which are non-assessable or disallowed. It is calculated using tax rates that have been enacted or substantively enacted at the balance sheet date. Deferred taxes area accounted for using the balance sheet liability method in respect of temporary differences arising from differences between the carrying amount of assets and liabilities in the financial statements and the corresponding tax basis used in the computation of assessable tax profit. In principle, deferred tax liabilities are recognized for all taxable temporary differences, and deferred tax assets are recognized to the extent that it is probable that taxable profit will be available against which deductible temporary differences can be utilized. Deferred income taxes are calculated at the tax rates that are expected to apply to the period when the asset is realized or the liability is settled. Deferred tax is charged or credited in the income statement, except when it relates to items credited or charged directly to equity, in which case the deferred tax is also adjusted in the equity accounts. Deferred tax assets and liabilities are offset when they relate to income taxes levied by the same taxation authority and the Company intends to settle its current tax assets and liabilities on a net basis. ASC 740 also prescribes a more-likely-than-not threshold for financial statement recognition and measurement of a tax position taken, or expected to be taken, in a tax return. ASC 740 also provides guidance related to, among other things, classification, accounting for interest and penalties associated with tax positions, and disclosure requirements. Any interest and penalties accrued related to unrecognized tax benefits will be recorded in tax expense. POLITICAL AND BUSINESS RISK The Company's operations are carried out in the PRC.PRC Accordingly, the Company's business, financial condition and results of operations may be influenced by the political, economic and legal environment in the PRC, and by the general state of the PRC's economy. The Company's operations in the PRC are subject to specific considerations and significant risks not typically associated with companies in North America and Western Europe. The Company's results may be adversely affected by changes in governmental policies with respect to laws and regulations, anti-inflationary measures, currency conversion and remittance abroad, and rates and methods of taxation, among other things. IMPAIRMENT OF LONG-LIVED ASSETS AND INTANGIBLE ASSETS In accordance with ASC 360, “Property, Plant and Equipment”, long-lived assets to be held and used are analyzed for impairment whenever events or changes in circumstances indicate that the related carrying amounts may not be recoverable. The Company reviews the carrying amount of its long-lived assets, including intangibles, for impairment, at the end of each fiscal year. An asset is considered impaired when estimated future cash flows are less than the carrying amount of the asset. In the event the carrying amount of such asset is considered not recoverable, the asset is adjusted to its fair value. Fair value is generally determined based on discounted future cash flow. As of December 31, 2011 and December 31, 2010,2017, the Company determined noCompany’s impairment charges were necessary.on interests in an unconsolidated investee of $153,046 was recorded.(2016: Nil). EARNINGS PER SHARE As prescribed in ASC Topic 260 “Earning per Share,”, Basic Earnings per Share (“EPS”) is computed by dividing net income available to common stockholders by the weighted average number of common stock shares outstanding during the year. Diluted EPS is computed by dividing net income available to common stockholders by the weighted-average number of common stock shares outstanding during the year plus potential dilutive instruments such as stock options and warrants. The effect of stock options on diluted EPS is determined through the application of the treasury stock method, whereby proceeds received by the Company based on assumed exercises are hypothetically used to repurchase the Company’s common stock at the average market price during the period. For the years ended December 31, 20122018 and 2011,2017, basic earnings (loss) per share from continuing operations attributable to the Company’s common stockholders amounted to $0.70 and $0.21, respectively. For the years ended December 31, 2012 and 2011, diluted earnings (loss) per share from continuing operations attributable to the Company’s common stockholders amounted to $0.63 and $0.23, respectively. For the years ended December 31, 2012 and 2011, basic earnings per share from continuing and discontinued operations attributable to the Company’s common stockholders amounted to $0.70 and $0.43, respectively. For the years ended December 31, 2012 and 2011, diluted earnings (loss) per share from continuing and discontinued operations attributable to the Company’s common stockholders amounted to $0.63 and $0.39, respectively.
For the six months ended June 30, 2013 and 2012, basic /earnings per share attributable to Sino Agro Food, Inc. and subsidiaries common stockholders amountamounted to $0.28$0.46 and $0.22,$(0.53), respectively. For the six monthsyears ended June 30, 2013December 31, 2018 and 2012,2017, diluted (loss)/earnings per share attributable to Sino Agro Food, Inc. and its subsidiaries’ common stockholders amounted to $0.27$0.46 and $0.20,$(0.53), respectively.
For the quarters ended March 31, 2018 and 2019, basic earnings per share attributable to Sino Agro Food, Inc. and subsidiaries common stockholders for continuing operations amounted to $0.17 and $0.01, respectively. For the quarters ended March 31, 2018 and 2019, diluted earnings per share attributable to Sino Agro Food, Inc. and its subsidiaries’ common stockholders for continuing operations amounted to $0.17 and $0.01, respectively. FOREIGN CURRENCY TRANSLATION The reporting currency of the Company is the U.S. dollar.dollars. The functional currency of the Company is the Chinese Renminbi (RMB). For those entities whose functional currency is other than the U.S. dollars, all assets and liabilities are translated into U.S. dollars at the exchange rate on the balance sheet date; shareholder equity is translated at historical rates and items in the statements of income and of cash flows are translated at the average rate for the period. Because cash flows are translated based on the weighted average translation rate, amounts related to assets and liabilities reported in the statements of cash flows will not necessarily agree with changes in the corresponding balances in the balance sheets. Translation adjustments resulting from this process are included in accumulated other comprehensive income in the consolidated statements of equity. For the fiscal year ended December 31, 20122018 Translation gains and losses that arise from exchange rate fluctuations on transactions denominated in a currency other than the functional currency are included in the statements of income and comprehensive income as incurred. The balance sheet amounts with the exception of equity as of December 31 20122018 and December 31, 20112017 were translated at RMB6.2855RMB6.86 to $1.00 and RMB6.30RMB6.53 to $1.00, respectively. The average translation rates applied to the consolidated statements of income and comprehensive income and of cash flows for the years ended December 31, 20122018 and December 31 20112017 were RMB6.31RMB6.61 to $1.00 and RMB6.33RMB6.75 to $1.00, respectively. For the fiscal quarteryear ended June 30, 2013December 31, 2017 Translation gains and losses that arise from exchange rate fluctuations on transactions denominated in a currency other than the functional currency are included in the statements of income and comprehensive income as incurred. The balance sheet amounts with the exception of equity as of June 30, 2013December 31 2017 and December 31, 20122016 were translated at RMB6.18RMB6.53 to $1.00 and RMB6.29RMB6.94 to $1.00, respectively. The average translation rates applied to the consolidated statements of income and comprehensive income and of cash flows for the six monthsyears ended June 30, 2013December 31, 2017 and June 30, 2012December 31 2016 were RMB6.24RMB6.75 to $1.00 and RMB6.31RMB6.64 to $1.00, respectively. NON-GAAP FINANCIAL MEASURESFor the three months ended March 31, 2019
Non-GAAP financial measures can represent our actual U.S. dollars reported earnings per share including foreign
Translation gains and losses that arise from exchange gain of net assetsrate fluctuations on transactions denominated in RMB asa currency other than the underlying trend shows Chinese Renminbi appreciates steadily against United States dollars. As such, we measure diluted earnings per share growth rate usingfunctional currency are included in the statements of income and comprehensive income divided byas incurred. The balance sheet amounts with the weightedexception of equity as of March 31, 2019 and December 31, 2018 were translated at RMB6.73 to $1.00 and RMB6.86 to $1.00, respectively. The average numbertranslation rates applied to the consolidated statements of shares outstanding,income and provide guidance on the comprehensive income per share. Below is a reconciliationand of reported EPS to non-GAAP EPScash flows for the three months ended June 30 2013March 31, 2019 and 2012:March 31, 2018 were RMB6.75 to $1.00 and RMB6.36 to $1.00, respectively.
| Consolidated results | | First half, 2013 | | | First half 1, 2012 | | | Diluted net earnings per share (EPS) | | $ | 0.12 | | | $ | 0.13 | | | Translational impact (a) | | $ | 0.00 | | | $ | 0.00 | | | Non - GAAP measure EPS | | $ | 0.13 | | | $ | 0.13 | | | Non - GAAP measure EPS growth rate (b) | | | 0 | % | | | | |
For the three months ended March 31, 2018 Translation gains and losses that arise from exchange rate fluctuations on transactions denominated in a currency other than the functional currency are included in the statements of income and comprehensive income as incurred. The balance sheet amounts with the exception of equity as of March 31, 2018 and December 31, 2017were translated at RMB6.29 to $1.00 and RMB6.53 to $1.00, respectively. The average translation rates applied to the consolidated statements of income and comprehensive income and of cash flows for the three months ended March 31, 2018 and March 31, 2017 were RMB6.36 to $1.00 and RMB6.89 to $1.00, respectively. | (a) | Translation impact is the difference between reported EPS and using non -GAAP measure. |
| (b) | Calculated as a percentage of growth from the prior year's reported EPS. |
Below is a reconciliation of reported EPS to non - GAAP measure EPS for the six months ended June 30, 2013 and 2012:
| Consolidated results | | First half, 2013 | | | First half 1, 2012 | | | Diluted net earnings per share (EPS) | | $ | 0.27 | | | $ | 0.20 | | | Translational impact (a) | | $ | 0.00 | | | $ | 0.01 | | | Non - GAAP measure EPS | | $ | 0.27 | | | $ | 0.21 | | | Non - GAAP measure EPS growth rate (b) | | | 28.57 | % | | | | |
| (a) | Translation impact is the difference between reported EPS and using non -GAAP measure. |
| (b) | Calculated as a percentage of growth from the prior year's reported EPS. |
ACCUMULATED OTHER COMPREHENSIVE INCOME ASC Topic 220 “Comprehensive Income” establishes standards for reporting and displaying comprehensive income and its components in financial statements. Comprehensive income is defined as the change in stockholders’ equity of a business enterprise during a period from transactions and other events and circumstances from non-owner sources. The comprehensive income for all periods presented includes both the reported net income and net change in cumulative translation adjustments. RETIREMENT BENEFIT COSTS PRC state managed retirement benefit programs are defined contribution plans and the payments to the plans are charged as expenses when employees have rendered service entitling them to the contribution. STOCK-BASED COMPENSATION The Company adopts both ASC Topic 718, “Compensation - Stock Compensation” and ASC Topic 505-50,”Equity-Based Payments to Non-Employees” using the fair value method in which an entity issues its equity instruments to acquire goods and services from employees and non-employees. Stock compensation for stock granted to non-employees has been determined in accordance with this accounting standard and the accounting standard regarding accounting for equity instruments that are issued to other than employees for acquiring, or in conjunction with selling goods or services, as the fair value of the consideration received or the fair value of equity instruments issued, whichever is more reliably measured. This accounting standard allows the “simplified” method to determine the term of employee options when other information is not available. Under ASC Topic 718 and ASC Topic 505-50, stock compensation expenses is measured at the grant date on the value of the option or restricted stock and is recognized as expenses, less expected forfeitures, over the requisite service period, which is generally the vesting period. FAIR VALUE OF FINANCIAL INSTRUMENTS The Company follows paragraph 825-10-50-10 of the FASB Accounting Standards Codification for disclosures about fair value of its financial instruments and paragraph 820-10-35-37 of the FASB Accounting Standards Codification (“Paragraph 820-10-35-37”) to measure the fair value of its financial instruments. Paragraph 820-10-35-37 establishes a framework for measuring fair value in accounting principles generally accepted in the United States of America (U.S. GAAP), and expands disclosures about fair value measurements. To increase consistency and comparability in fair value measurements and related disclosures, Paragraph 820-10-35-37 establishes a fair value hierarchy, which prioritizes the inputs to valuation techniques used to measure fair value into three (3) broad levels. The fair value hierarchy gives the highest priority to quoted prices (unadjusted) in active markets for identical assets or liabilities and the lowest priority to unobservable inputs. The three (3) levels of fair value hierarchy defined by Paragraph 820-10-35-37 are described below: Level 1 Quoted market prices available in active markets for identical assets or liabilities as of the reporting date.
Level 2 Pricing inputs other than quoted prices in active markets included in Level 1, which are either directly or indirectly observable as of the reporting date.
Level 3 Pricing inputs that are generally observable inputs and not corroborated by market data.
The carrying amounts of the Company’s financial assets and liabilities, such as cash and accrued expenses, approximate their fair values because of the short maturity of these instruments.
The carrying amounts of the Company’s financial assets and liabilities, such as cash and accrued expenses, approximate their fair values because of the short maturity of these instruments. The Company does not have any assets or liabilities measured at fair value on a recurring or a non-recurring basis, consequently, the Company did not have any fair value adjustments for assets and liabilities measured at fair value as of June 30, 2013 or December 31, 2012, nor gains or losses are reported in the statements of income and comprehensive income that are attributable to the change in unrealized gains or losses relating to those assets and liabilities still held at the reporting date for the fiscal period ended June 30, 2013 or June 31, 2012.
NEW ACCOUNTING PRONOUNCEMENTS The Company does not expect any recent accounting pronouncements to have a material effect on the Company’s financial position, results of operations, or cash flows. In January 2011, the FASB issued an Accounting Standard Update (ASU”) No, 2011-01, Receivables Topic 310):Disclosures about the Credit Quality of Financing Receivables and the Allowance for Credit Losses, to be concurrent with the effective date of the guidance for determining what constitutes a troubled debt restructuring, as presented in proposed Accounting Standards Update, Receivables (Topic 310): Clarifications to Accounting for Troubled Debt Restructurings by Creditors. The amendments in this Update apply to all public-entity creditors that modify financing receivables within the scope of the disclosure requirements about troubled debt restructurings in Update 2010-20. Under the existing effective date in Update 2010-20, public-entity creditors would have provided disclosures about troubled debt restructurings for periods beginning on or after December 15, 2010. The amendments in this Update temporarily defer that effective date, enabling public-entity creditors to provide those disclosures after the Board clarifies the guidance for determining what constitutes a troubled debt restructuring. The deferral in this Update will result in more consistent disclosures about troubled debt restructurings. This amendment does not defer the effective date of the other disclosure requirements in Update2010-20. In the proposed Update for determining what constitutes a troubled debt restructuring, the Board proposed that the clarifications would be effective for interim and annual periods ending after June 15, 2011. For the new disclosures about troubled debt restructurings in Update 2010-20, those clarifications would be applied retrospectively to the beginning of the fiscal year in which the proposal is adopted. The Company does not expect the adoption of ASU 2011-01 to have a significant impact on its consolidated financial statements. In April 2011,February 2016, the FASB issued ASU No. 2011-03,Transfers2016-02, Leases, which aims to make leasing activities more transparent and Servicing (Topic 860): Reconsideration of Effective Controlcomparable and requires substantially all leases be recognized by lessees on their balance sheet as a right-of-use asset and corresponding lease liability, including leases currently accounted for Repurchase Agreements (ASU 2011-03), intended to improve financial reporting of repurchase agreements and refocus the assessment of effective control on a transferor’s contractual rights and obligations rather than practical ability to perform those rights and obligations. The guidance inas operating leases. This ASU 2011-03 is effective for the first interim or annual period beginning on or after December 15, 2011.The Company does not expect the adoption of ASU 2011-03 to have a significant impact on its consolidated financial statements.
In May 2011, the FASB issued ASU No. 2011-04,Amendments to Achieve Common Fair Value Measurement and Disclosure Requirements in U.S. GAAP and IFRSs (ASU 2011-04). ASU 2011-04 represents the converged guidance of the FASB and the International Accounting Standards Board (IASB) on fair value measurement. A variety of measures are included in the update intended to either clarify existing fair value measurement requirements, change particular principles requirements for measuring fair value or for disclosing information about fair value measurements. For many of these requirements, the FASB does not intend to change the application of existing requirements under Accounting Standards Codification (ASC) Topic 820, Fair Value Measurements. ASU2011-04 is effective forall interim and annualprospectusing periods beginning after December 15, 2011 and2018, with early application is notadoption permitted. The Company does not expectis currently evaluating the impact that the adoption of ASU 2011-04 to2016-02 will have a significant impact on its consolidated financial statements.statements and related disclosures.
In June 2011,2018, the FASB issued ASU No. 2011-05,Presentation of Comprehensive Income (ASU 2011-05), intended2018-07—Compensation—Stock Compensation (Topic 718): Improvements to increase the prominence of items reported in other comprehensive income and to facilitate convergence of accounting guidance in this area with that of the IASB. The amendments require that all non-owner changes in stockholders’ equity be presented in a single continuous statement of comprehensive income or in two separate but consecutive statements. Amendments under ASU 2011-05 for public entities should be applied retrospectively for fiscal years, and interim periods within those years, beginning December 15, 2011. The Company does not expect the adoption of ASU 2011-05 to have a significant impact on its consolidated financial statements. In July 2011, the FASB issued accounting guidance on disclosures about the credit quality of financing receivables and the allowance for credit losses. The guidance expands disclosures for the allowance for credit losses and financing receivables by requiring entities to disclose information at disaggregated levels. It also requires disclosure of credit quality indicators, past due information and modifications of financing receivables. The Company does not expect the adoption of this guidance to have a significant impact on its consolidated financial statements.
In September 2011, the FASB issued Intangibles – Goodwill and Other (Topic 350) – Testing Goodwill for Impairment (ASU No. 2011-08), which amends ASC 350 to first assess qualitative factors before performing the quantitative goodwill impairment testing. The ASU provides the option to first assess qualitative factors to determine whether the existence of events or circumstances leads to a determination that it is more likely than not that the fair value of a reporting unit is less than its carrying amount. If the results of the qualitative analysis indicate it is not more likely than not that the fair value of a reporting unit is less than its carrying amount, the quantitative two-step impairment test, which is required under current U.S. GAAP, would not be necessary. TheNonemployee Share-Based Payment Accounting. This ASU is effective for annual and interim goodwill impairment tests performedpublic business entities for fiscal years beginning after December 15, 2011.2018, including interim periods within that fiscal year. The Company does not expectis currently evaluating the impact that the adoption of this ASU 2011-08 towill have a significant impact on its consolidated financial statements.statements and related disclosures.
| · | Other relevant historical events and subsequent matters: |
| · | Equity (Historical Balance) |
The bulk of the Company’s agriculture-zoned land banks are owned by the Government that through land-usage rights permit the Company to develop properties, but to which no property title can be granted for them to be recognized as first-tier assets from which to borrow against, thus making obtaining any conventional lending based on those assets, virtually impossible to obtain. Therefore, up until the time that the Company secured the convertible loan of $25m from ECAB, the Company’s capital expenditures had been financed strictly through many individual investors and private entities either through private placements, debt, or services rendered to the Company settled with common shares. The table below summarizes the historical increase of TI&O shares and how they had been applied from 2007 to 2018: In July 2012,
| | | | | | | | | | | | Share destribution (Using ARS) | | | | | As at | | Shares issuance of the year | | | Total I & O shares | | | Investors | | | | | | Loan & facility providers | | | | | | | | | | TI&O | | | | | | Post reversed split | | | After reversed splits | | | Original investors | | | Other payables | | | Staffs &
Consultants (S&C) | | | Collateralized shares
(no dividend & no voting rights) | | | Converted B shares | | | Consideration received
& break-down | | | | Shares | | | % of increase | | | Shares | | | Shares | | | Shares | | | (in debtors, contractors etc.) | | | Shares | | | Shares | | | Shares | | | $ | | 31.12.2007 | | | 44,000,000 | | | | | | | | 44,000,000 | | | | 4,444,444 | | | | 4,444,444 | | | | | | | | - | | | | - | | | | - | | | 44,000,000 | | 31.12.2010 | | | 11,474,136 | | | | 26 | % | | | 55,474,136 | | | | 5,603,448 | | | | | | | | 1,159,004 | | | | - | | | | - | | | | - | | | 6,884,475 | | 31.12.2011 | | | 11,560,126 | | | | 21 | % | | | 67,034,262 | | | | 6,771,138 | | | | | | | | 707,010 | | | | 460,680 | | | | - | | | | - | | | 15,141,018 | | 31.12.2012 | | | 32,970,588 | | | | 49 | % | | | 100,004,850 | | | | 10,101,500 | | | | | | | | 3,238,847 | | | | 91,515 | | | | - | | | | - | | | 19,892,203 | | 31.12.2013 | | | 37,597,193 | | | | 38 | % | | | 137,602,043 | | | | 13,899,196 | | | | | | | | 3,500,487 | | | | 297,209 | | | | - | | | | - | | | 18,164,376 | | 31.12.2014 | | | 32,308,850 | | | | 23 | % | | | 169,910,893 | | | | 17,162,716 | | | | | | | | 2,863,513 | | | | 400,008 | | | | - | | | | - | | | 15,914,829 | | 31.12.2015 | | | 2,971,041 | | | | 17 | % | | | | | | | 20,133,757 | | | | | | | | - | | | | 47,787 | | | | 2,216,184 | | | | 707,070 | | | 24,594,063 | | 31.12.2016 | | | 2,592,812 | | | | 13 | % | | | | | | | 22,726,569 | | | | | | | | - | | | | 1,331,565 | | | | 1,261,247 | | | | - | | | 20,468,192 | | 31.12.2017 | | | 6,636,306 | | | | 29 | % | | | | | | | 29,362,875 | | | | | | | | - | | | | 1,668,302 | | | | 4,968,004 | | | | - | | | 4,389,560 | | 31.12.2018 | | | 20,523,299 | | | | 70 | % | | | | | | | 49,886,174 | | | | | | | | 17,340,690 | | | | 3,182,609 | | | | | | | | | | | 11,750,131 | | | | | | | | | | | | | | | | | | | | | | | | | | | | | | | | | | | | | | | | | | | | | | | | | | | | | | | | | | | | | 4,444,444 | | | | 28,809,550 | | | | 7,479,675 | | | | 8,445,435 | | | | 707,070 | | | 181,198,847 |
l Debt Conversion: From 2010 to present, part of the FASBcapital funding realized by the Company has been by issuing shares to some of the unrelated third parties consisting of service providers, suppliers, lenders, and debtors, etc., totaling 28,809,550 shares. l Shares issued Accounting Standards Update ASU 2012-02,to staff, management, professional consultants and agencies to December 31, 2018 amount to 7,479,675 shares. Since the amendmentsbeginning of the Company’s operations in China the Company provided share entitlement programs to ASC 350, Intangibles—Goodwillselective staff and Other: Testing Indefinite-Lived Intangible Assets for Impairment (“ASU 2012-02”). The amendments applypersonnel that exemplified services and performance beyond their standard responsibilities; the annual amount capped at $1.5 million from 2007 to all entities, both public2013, and nonpublic, that have indefinite-lived intangible assets, other than goodwill, reported inincreased to $2.5 million to present date with share values calculated at their financial statements. In accordancerespective market rates with the amendments an entityunderstanding that the Company reserves the right to defer share distribution until a later date, based on the Company’s assessment that market prices may improve and/or the rate at which they are issued could help mitigate any impact they could pose to the market. Also, shares have been issued to professional consultants and agencies for services rendered that were pre-approved by the Company and written into their respective service contracts, some requiring immediate payment and others allowing their shares to be distributed over a period of time. l Collateral shares: This includes the Trade Facility consisting of 5,708,312 collateral shares, and Third-Party Loans consisting of 2,662,735 collateral shares, collectively that do not hold voting or dividend rights to be returned to the Company upon repayment. The maturity date on the Third-Party Loans and Trade Facility run through September 2019, but the Company anticipates repayment of a portion or all the loan balances as well as a reduction in the maximum Trade Facility line to occur before that time, as exemplified in the reduction of the Trade Facility line from $20,000,000 to $13,000,000 and the third parties’ loan debt has been reduced from $10,428,034 to $2,103,000 as at December 31st 2018. l The total consideration received from the optionabove referred issuance of shares for $181,198,847 (fully paid up capital) together with (i) retained earnings of $458,811,844, (ii) accumulated other comprehensive income of ($10,415,786) and (ii) treasury stock of (1,250,000) forms the Company’s total equity (or, net assets) of $628,696,980 as December 31, 2018 (the equivalent of $16.83/share representing a decrease of $1.70/share compares to 2017’s $18.53/share). l The Company experienced a poor year in 2017 in which SJAP suffered operation losses exceeding $30 million due to the down-turn of the cattle industry in China coupled with the over spending on capital expenditure on Phase (1) of the Mega Farm Project which exceeded the original budget of US$50 million by more than 60% and the operation of AF4 (Production factory 1), the operation of AF5 (Production factory 2) and the open dams at the Mega Farm Project had a poor start and performed badly in 2017 suffering heavy losses such that by the first half of 2018, the Mega farm project had incurred debts over $4.5 million that really affected and tightened the Company’s cash-flow. At the same time, although the Company tried and worked extremely diligently to assess qualitative factorspursue some of the short term and long term loans the Company has been applying yet none of them was materialized enhancing the reason of why the Company had to determine whetherissue over 20 million shares to redeem part of its outstanding debts in 2018. l Although there was no loan made during 2018, there are still on-going discussions with progress being made such that management of the existence of events and circumstances indicatesCompany is rather optimistic that it is more likely than notonly a matter of time until some of them will materialize, improving its cash flow position. l The Company remains committed to minimize any further use of equity in helping to bridge finance its operations yet remains open to the use of equity whenever it serves the purpose of securing conventional financing and other purposes accretive to the Company and its shareholders. | l | Third Party Loans to Tri-way secured by shares of the Company: |
The Company has depended from time to time on bridge loan financing, namely from four individual third parties (“ITP”) whose loans had been repaid either in cash, shares or both. The issuance of shares (referred to as “Debt Settlement”) was in practice until the time that the indefinite-lived intangible assetCompany committed in its August 14, 2014 Convertible Bond agreement with ECAB to discontinue repayment of loans through the issuance of Debt Settlement shares. As it was mentioned in the 10-K for the fiscal year ended 2017, the ITP loans (provided through the same third parties) were provided to Tri-way (“Borrower”) with the final agreement entered into on August 5, 2016; the loan proceeds having been incrementally received between July 15, 2016 through September 28, 2016 for a total net principal amount of $10,428,034 at interest free term collateralized by 2.66 million shares (inclusive all top-up shares) matures by 23, September 2019. When the loan principal amount will be fully repaid the collateralized shares will be returned to the Company. As of December 31, 2018, there was $2,103,000 outstanding in this ITP. General terms of the loans, include: | a) | Tri-way Industries Limited (Tri-way) is the responsible party to cover loan principal, interest, closing and any other related loan costs. |
| b) | SIAF, on behalf of Tri-way, acts as “Security Provider” providing shares of common stock as collateral against the loans. |
| c) | SIAF’s only liability is contingent upon failure of Tri-way to repay the loan. Since the shares have not been sold, but strictly are utilized as security collateral, and, to date, have not incurred further liability to SIAF, the Company has recorded the Consideration (Face Value $13.9 million ; LTV $10.4 million) as Non-Current Assets, offset by the issuance of (collateral) shares, which are reported in our Qs and Ks, accordingly. |
| l | The Trade Facility secured by shares of the Company: |
As it was stated in the 10K 2017 report that “The Trade Facility” was originally entered into on September 22, 2015 that was finalized into an agreement dated June 17th 2016 consisting of SIAF having securitized the loan with 2,133,333 of its common shares valued at $12.50/share equivalent to the full face-value of the loan ($26,666,666), and the TPA having the full use of the trade facility to borrow and repay, against, as warranted, i.e. revolving LOC. As such, the principal terms of this agreement are: · SIAF acts as “Security Provider” to initiate the Trade Facility to be employed. · The Third-Party Agent (“TPA”) (described as an Import & Export Trading House in Shanghai acting as distribution agent for the Company) is impaired. If, after assessing the totalityresponsible party to cover loan principal, interest, closing and any other related loan costs. · SIAF’s only liability is contingent upon failure of eventsTPA to repay the loan. Since the shares are strictly utilized as security collateral, and, circumstances, an entity concludes that itto date, have not incurred further liability to SIAF, the Company has recorded the Consideration (Face Value: $26,666,666; LTV: $20,000,000) as Non-Current Assets, offset by the issuance of collateral shares. The loan’s face value is not more likely than not thatto be secured by 133% of the indefinite-lived intangible asset is impaired, then the entity is not required to take further action. However, if an entity concludes otherwise, then it is required to determine the fair value of the indefinite-lived intangible assetcollateralized shares calculated to the prevailing market values from time to time based on request of the facility provider. | l | Shares issued as security were not issued for market trading, but as security against the loan required to be returned to SIAF upon full loan repayment by TPA, which, to date, has not incurred any liability to the Company. |
As of December 31, 2018 there were a total of 5,708,312 shares (inclusive of top up shares) issued as collateral for the Trade Facility carrying an average value at $2.63/share, which still stands well above SIAF’s current market value. TPA repaid $5,000,000 in Cash payment on December 19th 2017 to the Trade Facility Provider and performagreed to have its facility face-value reduced to $20,000,000 and the quantitative impairment test by comparingnet amount employed to $15,000,000. This amended arrangement was agreed to avoid further issuance of shares due to the current share price. As at December 31, 2018 TPA has further reduced the net amount employed to $13 million. | l | Information related to Tri-way Industries Limited (the unconsolidated investee of the Company) |
Some of the information listed below were reported in 10K 2017 and recapped for 2018 | l | The disposal of JFD and Tri-way (The Carve-out exercise) |
At present, Tri-way remains a private company, but it is intended to be registered at the Hong Kong Stock Exchange within a few years. The Company’s ownership in Tri-way has been valued at USD 124.7 million, equal to 36.6% of the enterprise value (“EV”) of USD 340.6 million. This includes (i) 23.89% (EV = USD 81.4 million) as a result of retained interest in Tri-way, and (ii) 12.71% (EV = USD 43.3 million) acquired in exchange for outstanding debt owed to the Company. These values result from Aquafarm 1, assets held in Aquafarms 2-5 and rights to technology licensed from Capital Award, a wholly owned subsidiary of the Company. An independent appraisal was obtained to determine fair value, and this appraisal resulted in a one-time (deemed) gain of USD 56.9 million for SIAF, as further detailed, below. | Amounts shown incorporate audited adjustments: | | HK$ | | | HK$ | | | $ equivalent | | | | | | | | | | | | | | | | | Fair value of interest retained in Tri-way | | | | | | | | | | | | | | | | | | (US$340,594,377 x 23.89%) | | | | | | | 630,601,974 | | | | | | | | 81,367,997 | | | Less: | | | | | | | | | | | | | | | | | | Amount recognized prior to divestment of Tri-way | | | | | | | | | | | | | | | | | | Net asset of Tri-way | | | 251,946,656 | | | | | | | | 32,509,246 | | | | | | | Non-controlling interest at divestment | | | -62,683,968 | | | | | | | | 8,088,254 | | | | | | | Controlled group assets divested | | | | | | | 189,262,688 | | | | | | | | 24,420,992 | | | Gain on disposal (including master licensing fees) | | | | | | | 441,339,286 | | | | | | | | 56,947,005 | | | | | | | | | | | | | | | | | | | | | Net controlled group assets disposed | | | | | | | | | | | | | | | | | | ($27,872,348 x 76.11%) | | | | | | | -144,047,832 | | | | | | | | -18,586,817 | | | Gain on revaluation of retained interest | | | | | | | | | | | | | | | | | | Fair value of interest retained in Tri-way | | | | | | | 630,601,974 | | | | | | | | 81,367,997 | | | Portion of divested assets retained in Tri-way | | | | | | | | | | | | | | | | | | ($27,872,348 x 23.89%) | | | | | | | -45,214,856 | | | | | | | | -5,834,175 | | | Gain on disposal (including master licensing fees) | | | | | | | 441,339,286 | | | | | | | | 56,947,005 | |
| l | Table X below shows the derivation of $/shares after the injection of farms’ assets |
| | | Fair values of Injected farms' assets | | | | | Inclusive respective indoor and open dams properties | | | US$1=RMB6.7 | | FF1 | | | PF1 | | | PF2 | | | PF3 | | | PF4 | | | Master License | | | Total | | | US$1=HK$7.7 | | AquaFarm(1) | | | Aqua Farm 2 | | | Aqua farm 3 | | | Aqua Farm 4 | | | Aqua Farm 5 | | | | | | | | | In US$ equivalent | | US$ | | | US$ | | | US$ | | | US$ | | | US$ | | | US$ | | | US$ | | | | | | | | | | | | | | | | | | | | | | | | | | The Chattels | | | 8,787,115.6 | | | | 4,199,237.9 | | | | 21,338,881.5 | | | | 33,609,047.1 | | | | - | | | | - | | | | 67,934,282.1 | | | The P&E | | | 5,148,769.2 | | | | 5,391,657.1 | | | | 2,326,044.8 | | | | 24,045,576.5 | | | | - | | | | - | | | | 36,912,047.6 | | | The Intellectual Properties | | | 5,672,862.0 | | | | 6,348,029.3 | | | | 13,669,794.7 | | | | 30,228,181.0 | | | | 69,053,863.7 | | | | 30,000,000.0 | | | | 154,972,730.7 | | | The Buildings | | | 8,256,870.8 | | | | 12,832,764.2 | | | | 12,659,859.0 | | | | 11,883,710.4 | | | | - | | | | - | | | | 45,633,204.4 | | | Immovable structures | | | 5,672,862.0 | | | | 9,897,263.4 | | | | 9,080,438.4 | | | | 8,597,279.9 | | | | 1,894,268.2 | | | | - | | | | 35,142,111.9 | | | Total values | | | 33,538,479.5 | | | | 38,668,951.9 | | | | 59,075,018.4 | | | | 108,363,794.9 | | | | 70,948,132.0 | | | | 30,000,000.0 | | | | 340,594,376.7 | |
| | | Equity shares of Tri-way Industrial Limited (HK) | | | | | | | | | | | | | | Par value | | | Share Capital | | | Value/share | | | | | # of shares | | | HK$ | | | HK$ | | | US$ equivalent | | | HK$ | | | US$ equivalent | | | Shares issued prior to Injection | | | 10,000 | | | | 1 | | | | 10,000 | | | | 1,299 | | | | 1 | | | | 0.13 | | | Addition shares issued after injection | | | 99,990,000 | | | | 1 | | | | 2,622,576,701 | | | | 340,594,377 | | | | | | | | | | | Total Issued shares | | | 100,000,000 | | | | 1 | | | | 2,622,586,701 | | | | 340,595,675 | | | | 26.23 | | | | 3.41 | |
| l | Relevant dates of the transactions: |
| 1 | 18-AUG-2016 | Execution of Investment Agreement (IA) | | 2 | 18-AUG-2016 | Jiangman Fishery Development Co. Ltd (JFD) acquired 25% of Guangzhou Kangi Enterprize Management Co. Ltd such that JFD becomes 100% owned by Tri-way Industries Limited (HK) (Tri-way) | | 3 | 18-AUG-2016 | Effective Date that Investors agreed to inject their respective assets and businesses into the Assets Recipient, JFD, at the exchange value described in the Investment Agreement. | | 4. | 30-SEP-2016 | SIAF assumed ownership of Tri-way’s original assets in exchange for its original investment in Tri-way, in conjunction with TRW/JFD’s exercise of other farm assets owned by other investors injected into it, as well. | | 5. | 05-OCT-2016 | Completion Date on which Tri-way, with JFD having assumed ownership of said farms’ assets (inclusive, all farms), allocated equitable allotments of shares to the Investors (or, their Nominees) in exchange for their injected farms’ assets. |
In reference to the press release dated January 17, 2017, wherein the Company had indicated that legal due diligence had been completed in relation to the carve-out of its aquaculture operations, the announcement that legal due diligence had been performed had been released in conjunction with what had been the carrying amount in accordance with Subtopic 350-30. An entity also hasmain announcement, which was SIAF wishing to convey to its shareholders that JFD had been officially registered as a Wholly Foreign Owned Enterprise of Tri-way, making it legally eligible for SIAF shareholders to now own shares of Tri-way, directly. | l | The list of shareholders of record in Tri-way filed with Hong Kong Company Registrar: |
| Owner | | Shares | | | % | | | Sino Agro Food (OTCQX:SIAF) | | | 36,590,000 | | | | 36,6 | % | | Ample Rise Limited | | | 2,750,000 | | | | 2,8 | % | | Fortune Legend Investments Limited | | | 2,750,000 | | | | 2,8 | % | | Sino Agro Food (HK) Limited | | | 31,998,572 | | | | 32 | % | | Good Sea Limited | | | 4,250,000 | | | | 4,3 | % | | Green & Natural Limited | | | 3,250,000 | | | | 3,3 | % | | Lucky Shine Development Limited | | | 2,750,000 | | | | 2,8 | % | | Yongfeng Agricultural Investment Co | | | 4,180,068 | | | | 4,2 | % | | The Business Advocate | | | 4,521,360 | | | | 4,5 | % | | Fine Happy Limited | | | 2,750,000 | | | | 2,8 | % | | Flying Cristal Limited | | | 4,200,000 | | | | 4,2 | % |
Tri-way Industries is a privately held company, and the option to bypassCompany (holding 36.6% of the qualitative assessment for any indefinite-lived intangible asset in any period and proceed directly to performing the quantitative impairment test. An entity will beshares) is not able to resume performingdisclose the qualitative assessment in any subsequent period. The amendments are effective for annual and interim impairment tests performed for fiscal years beginning after September 15, 2012, and early adoption is permitted. The Company will apply these amendments for reporting periods beginning after December 31, 2012. The Company does not expect the adoptionidentity of the amendments to have a material impact on the consolidated financial statements.remaining holders. BUSINESSBased on information which has been filed with the Hong Kong Companies Registrar and which is publicly available, the following information can be provided about the shareholders of record:
Ø Sino Agro Food (the Company) holds 36.6% of the shares Ø Sino Agro Food (HK) Limited, holding 32%, is primarily formed as a holding company for certain outside owners (ownership interests in Aquafarms 2-5, other than the Company) that when combined with the ownership of the Company provides a majority voting block (68.6%) necessary to meet minimum listing requirements in Hong Kong for adequate “continuation of management/operations”. The Company has no ownership in Sino Agro Food (HK) Limited. Ø The Business Advocate (4.5%) and Flying Cristal Limited (4.2%) are companies appointed by Tri-way to hold in trust on behalf of certain holders of debt owed by Aquafarms 2-5 to keep shares in reserve in the event that their respective debts owed are converted to equity, at maturity. The debt in question relates to costs of development of the Aquafarms 2-5 incurred in connection with the development and construction stages. Ø The remaining smaller holding companies are held by Nominees of ownership interests in Aquafarms 2-5 with their related Beneficial Owners becoming registered at the time that Tri-way becomes a registered public company. The carve-out of Tri-way Industries Inc. (“Tri-way”) from Sino Agro Food Inc. is not a related party transaction. Tri-way is held at 36.6 % by the Company and is thus considered an investment in associate and no longer registered as a subsidiary of the Company. Transactions made in connection with the carve-out process are with entities/parties not related to the Company. Sino Agro Food (HK) Limited is not an affiliate of the Company. To this effect, its directors or officers have not been nor are they currently an officer, director, 10% (or greater) shareholder, or in any other way an affiliate of the Company as that term is defined by Rule 405 of the U.S. Securities Act of 1933, and are not directly or indirectly through one or more intermediaries, in control of, controlled by, or under common control with the Company. No board members of Sino Agro Food Inc., nor members of management of Sino Agro Food Inc., have any positions in the Board of Directors or management of Sino Agro Food (HK) Limited. | l | Status and progress of Tri-way |
ØTri-way’s business operation (1). As it was mentioned in our 10-K 2017 report that Tri-way has been organizing a Trading Division based in HK to import frozen seafood and other frozen food products from other countries to be sold in China by JFD’s commercial arms (which are special vehicles (or companies)) being established since mid-2017 each holding their respective import/export permits and licenses. In this prospectus, unlessregard, Tri-way’s imports (Frozen seafood and other foods) will differentiate from SIAF’s imports that mainly consist of live seafood and slaughtered/dressed beef. Having the context requires otherwise, referencesTrading Division established in HK would 1) allow Tri-way’s China operations to maintain its source of income as a primary producer of agriculture products and forego incurring any tax liability from value added and/or commercial sales of its product; and 2) allow Tri-way through its HK Trading Division to generate sufficient sales through the import/export industry helping it to attain a respectable IPO at a sooner date by helping to increase revenue in a shorter period of time than it would take to both build and initiate production at the Aquafarms in China. Tri-way started its HK trading business since September 2018 and by March 31st 2019, Tri-way ‘s trading activity is generating an average of $2.5 million sales revenues per month at gross profit margin averaging above 13% netting an average of 7.5% after deducting financing cost and other associated expenses. It is important for Tri-way to maintain a consistent trading records for the next and subsequent months with steadily increased sales turn over and with reasonable profitable bottom lines such that it will be qualified to obtain much bigger trading line of credits from its banks when it will materialize some of the long term loans to allow more cash flow into the trading activity thus to increase the trading lines of credits from its banks. Once that has happened, Tri-way will aim to generate trading revenues to gradually reach US$500 million per year by 2021 at average gross profit margins of 12.5%. (2). As of end February 2019, Tri-way’s management decided to concentrate efforts to produce “Mexican White Prawns” (MWP) in the Mega farm using its Aqua-farm (4 & 5) (its indoor APM farms of 18,000 m2) and to retrofit 660 Mu (or 110 acres) of its open dams into ODRAS dams targeting to produce around 3,500 MT of MWP by mid-year 2020 aiming at sales revenue to exceed $35 million at gross profit margin of 52% and gradually increase it up to 10,000 MT/year by mid-year 2022 aiming at sales revenues to exceed $100 m at gross profit margin of 58%. At the end of March 2019, Tri-way has just completed all its civil engineering plans getting ready for the construction team to come in to start work on the open dams as soon as some of the applied financing will be in place. Judging by the engineering information, it will require less than $2 million to complete all retrofitting and reconstruction work as such Tri-way is working hard currently on a small short term loan to come to accommodate said work in progress as soon as possible. At the same time Tri-way has been granted a 60 days credit term by two of the biggest stock feed manufacturers of the country to ease the needs in working capitals to help to fasten the pace of progress of the mega farm. This decision was influenced by the success of the YangJiang Prawn Farm (“YJPF”) situated at YangJiang District Guangdong Province with about 50 Mu of land for production sub-divided into 26 ODRAS dams that was engineered and constructed using CA’s ODRAS technology in 2017 with trailed runs being carried out through 2018 that has been proven successful. YJPF started its first commercial MWP growing program by starting to stock an average of 230,000 pieces of (PL 7 = Post Larvae 7 days old) per Mu on 21st January 2019 in said 26 ODRAS dams and by April 1st 2019 some 70 days later YJPF sold its 1st batch of MWP from 6 ODRAS dams achieving sales over $140,000 from 18 MT of MWP at averaged size of 10 gram/piece recording mortality rate of 18% and FCR (Feed conversion rate) of 1.03. YJPF will definitely improves here onward and this current performance is good when considering that it is YJPF’s first commercial production (3). In Fiscal Year 2018, Tri-way’s existing farms (comprising Aqua-Farm 1 to 3 and 7 other contracted open dam farms) managed to generate sales revenues just on $100 m from the production of 12,300 MT of mixed fish and MWP at averaged gross profit margin of 29% netting over $14 million that is not including Aqua-farm 4 & 5. | l | Distribution of Tri-way shares to Our Shareholders has been delayed. |
As was reported in the 10-K 2017: (a). The Company’s intention to distribute 18.3% ownership of Tri-way Industries Ltd. to SIAF shareholders remains in effect and will be executed based on consideration of other items that need to be assessed and taken into consideration before its shares are available for transfer of ownership to SIAF shareholders. The main items having an impact on timing TRW share distribution are: After consultation with our tax advisor it had been determined that a distribution of TRW shares to SIAF shareholders would incur a tax liability to the “Company,” “Sino Agro” “we,” “our company,” “our”Company just shy of $10 million based on the distribution effectively constituting a dividend equivalent to one-half of the deemed gain on disposal that SIAF obtained at the time of TRW’s carve-out from the Company. The new tax law passed this past December does not lessen the tax liability since the trigger (i.e. deemed gain on disposal) had occurred prior to the new tax law going into effect and “us,” referwould carry over to whatever distribution occurs going forward. The Company has been investigating an option that would allow it to distribute the debt-based ownership it has just acquired from TRW (i.e. 12.71% transferred to the Company in Q4 2017) to SIAF shareholders, essentially allowing each shareholder to receive ownership of the debt owed to SIAF and in exchange allow that debt to be converted into either cash and/or TRW when applicable, likely in the form of a warrant. By the transfer of debt, there is no tax liability on any of the gain incurred as compared to any portion of the 23.89% ownership being distributed, which holds a tax liability due to the value it received from the deemed gain on disposal. Although, transferring debt ownership only accounts for 12.71% of the 18.3% intended to be distributed, the Company is looking at a lesser tax burden in distributing the remaining 5.59% in TRW ownership, were the original distribution option exercised. (2). In addition to the above, distribution timing of TRW shares has also been curtailed due to work that has been in progress within recent months on one of the Company’s corporate exercise plans aiming to generate gains in share values to its shareholders. It is more beneficial to the shareholders if we shall wait a little longer until we shall firm up on said corporate exercise plan before we shall distribute said 18.3% Tri-way shares to its shareholders. (3). The Company aims to honor its commitment of having a portion or all the intended 18.3% ownership in TRW distributed to SIAF shareholders during 2019 prior to the finalization of said corporate exercise plan upon its clearance without further comments from SEC. | l | Appointment of Mr. Colanukuduru Ravindran as independent director |
On March 29, 2019, the Board of Directors (the “Board”) of the Company appointed Colanukuduru Ravindran as an independent director of the Company effective immediately. Mr. Ravindran will receive an annual fee of $60,000, payable in monthly installments, and be required to comply with certain confidentiality provisions. He will also be entitled to receive, on an annual basis, shares of the Company’s common stock having a value equal to $60,000 Mr. Ravindran has been serving as a director and as an executive in a variety of industries including energy (e.g. oil & gas) and information technology with 36 years of experience in strategy, finance, fundraising, and “techno commercial”, in the U.S., India and Singapore. From 2011 to 2015, Mr. Ravindran served as the Chief Executive Officer of Terrasoft, a software development and services company. Beginning in 2015 through the present, Mr. Ravindran has acted as the Director at Union King Corporation and Atlantic Resources, a company based out of Hong Kong that is involved in worldwide trading of garments, electronic household goods, seafood etc. IN addition, in 2016 he was appointed as Director of Tri-way Industries Ltd, an independent private limited company based in Hong Kong. Mr. Ravindran received a Bachelor’s degree in Chemical Technology from Annamalai University in Tamilnadu, India in 1978 and subsequently obtained a post graduate degree in Plastics as well as in International Trade from the Indian Institute of Foreign Trade. There are no arrangements or understandings between Mr. Ravindran and/or any other persons pursuant to which Mr. Ravindran was named as a director of the Company. Mr. Ravindran has no family relationships with any of the Company's directors or executive officers or any persons nominated or chosen by the Company to be a director or executive officer. Mr. Ravindran has been appointed to the audit committee of the Board. Other than as set forth herein, Mr. Ravindran has no direct or indirect material interest in any transaction or proposed transaction required to be reported under Section 404(a) of Regulation S-K or Item 5.02(d) of Form 8-K. | l | Appointment of Mr. Muson Cheung as independent director |
On April 17, 2019, the Board appointed Muson Cheung as an independent director of the Company effective immediately. The Board also appointed Mr. Cheung to the audit committee. Mr. Cheung will receive an annual fee of $60,000, payable in monthly installments, and be required to comply with certain confidentiality provisions. He will also be entitled to receive, on an annual basis, shares of the Company’s common stock having a value equal to $60,000 Mr. Cheung has been serving as a director, officer and as an executive in a variety of financial service companies and firms with over 12 years of experience in securities, finance, and asset management in the U.S. and Hong Kong. From 2011 to 2014, Mr. Cheung served as the Vice President of Marketing at Glory Sky Global Markets Limited, a licensed financial institution in Hong Kong dealing in securities, futures contracts, leveraged foreign exchange trading, and asset management. From 2014 to 2015, Mr. Cheung served as the Vice President of Marketing at Tiger Securities Asset Management Company Limited, a financial institution licensed by the Hong Kong Securities and Futures Commission dealing in securities transactions and asset management. In 2015, he served as the Responsible Officer at MCL Securities Limited, a Hong Kong company that provides execution and advisory services in equities, bonds, equity-linked notes, and mutual funds across all international markets. Since 2017 through the present, Mr. Cheung has served as the Responsible Officer and director at MC Financial Services Limited, a financial management firm in Hong Kong, where his activities include asset management, advisory services in securities, future contracts and securities transactions. Mr. Cheung is also qualified as a securities broker-dealer and broker’s representative by The Stock Exchange of Hong Kong Ltd. since 1995. His accomplishments include teaching at the Vocational Training Council School of Business and Information Systems as a former lecturer in Contemporary Business Issues in China, Logistics and Economics and at The Hong Kong Institute of Vocational Education of the Vocational Training Council as a former lecturer in Economics, Risk Management, Financial Management & Elements of Banking. From 2015 to 2016, he tutored at the Vocational Training Council School for Higher and Professional Education in Risk Management & Investment. Mr. Cheung has also lectured at Coventry University, University of Ballarat, and Nottingham Trent University in England and Southern Cross University in Australia. Mr. Cheung attended Edwards International College in Perth, Australia, where he received a diploma in Management in 1991, and Curtin University of Technology in Perth, Australia, where he received a bachelor in Commerce (Finance & Marketing) in 1993. He subsequently received a Masters of Finance from the Royal Melbourne Institute of Technology in Australia in 1998, followed by a Doctor of Business Administration from the European University in Montreux, Switzerland, in 2014. There are no arrangements or understandings between Mr. Cheung and/or any other persons pursuant to which Mr. Cheung was named as a director of the Company. Mr. Cheung has no family relationships with any of the Company's directors or executive officers or any persons nominated or chosen by the Company to be a director or executive officer. Other than as set forth herein, Mr. Cheung has no direct or indirect material interest in any transaction or proposed transaction required to be reported under Section 404(a) of Regulation S-K or Item 5.02(d) of Form 8-K. | l | The immediate activities and directions of the Company |
At this juncture for SIAF is the same as for Tri-way is to concentrate and to work side by side with Tri-way to generate the funding needed and to reduce capital expenditure spending, carefully nurture all W/C to sustain sales turn overs, restructure of all agriculture assets into more commercially bankable assets thus when funds are available we shall take on the following priorities within 2019: * A well manage and organized Buy-Back Program * Restructuring of debts and debt repayment program * Expansion program on the Trading activities of SIAF * Move forward on CA’s Malaysian and Indian Projects. * Recruiting of the corporate management and corporate operation teams. * Restructuring of agriculture assets into more bankable assets. * Programing of a revitalized plan for SJAP. * Accelerating the studies on merger and/or JV plans for JHST, HSA and MEIJI. BUSINESS Sino Agro Food, Inc., SIAF is an agriculture technology and natural food holding company with principal operations in the People’s Republic of China. The Company acquires and maintains equity stakes in a Nevada corporation together withcohesive portfolio of companies that SIAF forms according to its subsidiaries.core mission to produce, distribute, market and sell natural, sustainable protein food and produce, primarily seafood and cattle, to the rapidly growing middle class in China. SIAF provides financial oversight and strategic direction for each company, and for the interoperation between companies, stressing vertical integration between the levels of the Company’s subsidiary food chain. The Company owns or licenses patents, proprietary methods, and other intellectual properties in its areas of expertise. SIAF provides technology consulting and services to joint venture partners to construct and operate food businesses, primarily producing wholesale fish and cattle. Further joint ventures market and distribute the wholesale products as part of an overall “farm to plate” concept and business strategy. Company Revenues by division were as follows (in millions of U.S. dollars):
| Division (on Sales of Goods) | | 2018 | | | 2017 | | | Fisheries (CA) (Discontinued operation from October 5, 2016) | | $ | | | | $ | - | | | Organic Fertilizer (HSA, SJAP & QZH) | | | 28.9 | | | | 84.4 | | | (QZH derecognized as variable interest entity from December 30, 2017) | | | | | | | | | | Cattle (MEIJI) | | | 29.6 | | | | 20.4 | | | Plantation (JHST) | | | 3.6 | | | | 4.6 | | | Corporate, Marketing & Trading (SIAF) | | | | | | | 71.8 | | | Total Revenues derived on sales of goods | | $ | 68.5 | | | $ | 181.2 | |
| Division (on consulting & services) | | 2018 | | | 2017 | | | CA (Fishery related developments) | | $ | | | | $ | 17.0 | | | Total Revenues derived on consulting & services | | $ | 11.1 | | | $ | 17.0 | |
History Our company,The Company, which was formerly known as Volcanic Gold, Inc. and A Power Agro Agriculture Development, Inc., was incorporated on October 1, 1974 in the State of Nevada. We wereThe Company was formerly engaged in the mining and exploration business but ceased ourthe mining and exploring business on October 14,in 2005. On 24 August 24, 2007, wethe Company entered into a Mergermerger and Acquisition Agreementacquisition agreement with Capital Award Inc.,CA, a Belize corporation and its subsidiaries Capital Stage Inc.CS and Capital Hero Inc.CH. Effective of the same date, Capital AwardCA completed a reverse merger transaction with us. We acquired all the outstanding common stock of Capital Award from Capital Adventure, a shareholder of Capital Award, for 32,000,000 shares of our common stock.Company.
On August 24, 2007 we changed our name from Volcanic Gold, Inc.For two years after its introduction in China, the Company operated in the dairy segment, but sold the dairy business in December of 2009 and began to A Power Agro Agriculture Development, Inc. On December 8, 2007, we changed our nameimplement its five-year plan to Sino Agro Food, Inc. develop its vertically integrated business operations consisting of (i) cattle fattening and production of beef products and (ii) cultivation of fish and prawn and related products. The Company now operates as an engineering, technology and consulting company specializing in building and operating agriculture and aquaculture farms in China.
Our principal executive office is located at Room 3801, 38th Floor, Block A, China Shine Plaza, No. 9 Lin He Xi Road, Tianhe District, Guangzhou City, Guangdong Province, PRC, 510610. We used to operate a dairy segment but sold itThe table below provides an overview of key events in December of 2009. We made the determination to do so because we believed the dairy industry had poor fundamentals in that it was manipulated and controlled by a few value-added manufacturers who obtained a majority of their raw milk supplies from various regional dairy farmersdevelopment of the country who received very little value yet were expected to deliver high quality milk. As a result, the small dairy farmers were essentially forced to use chemicals in their milk to bring up the milk’s protein level that eventually caused the down-fallbusiness of the industry. In our opinion, this state of affairs ledCompany.
| Year | | Event | | 2006 | | · | Initiates agriculture and aquaculture consulting activities in China. | | | | | | 2007 | | · | Changes name from A Power Agro Agriculture Development, Inc. to Sino Agro Food, Inc. | | | · | Acquires the Belize holding company Capital Award. Today, Capital Award is the Company’s subsidiary operating many of the Company’s aquaculture activities. | | | · | Acquires the dairy operations through a 78 percent ownership stake in ZhongXing Agriculture and Husbandry. | | | · | Acquires the HU Plantation through a 75 percent ownership stake in Jiang Men City Heng Sheng Tai Agriculture Development. | | | | | | 2009 | | · | Conducts a strategic review and divests the dairy business in December due to poor industry fundamentals with control of the industry concentrated in a few very large value-added manufacturers. |
| | · | Founded Qinghai Sanjiang A Power Agriculture (“SJAP”). SJAP manufactures bioorganic fertilizer, livestock feed and develops other agriculture projects in the County of Huangyuan, in the vicinity of Xining City, Qinghai Province. | | | | | | 2010 | | · | Creates a five-year plan to develop vertically integrated businesses in primary production, distribution and marketing of beef cattle, beef products and seafood through proprietary recirculating aquaculture systems. | | | · | Begins construction of the Company’s first fish farm, Fish Farm 1, with targeted capacity of 1,000 metric tons per year. | | | | | | 2011 | | · | Begins construction of Prawn Farm 1 & 2, Cattle Farm 1 and Fish Farm 2. | | | · | Becomes a fully reporting SEC company on the OTCQB (as defined below). | | | | | | 2012 | | · | Acquires a 75 percent ownership in Fish Farm 1 and Cattle Farm 1. Advances construction of Cattle Farm 2 and Wholesale Center 1 in Guangzhou. | | | · | Produces 1,800 MT of seafood and raises 6,000 head of cattle. | | | | | | 2013 | | · | Closes the Zhongshan Prawn Farm agreement, targeting production of 10,000 MT of prawn p.a. in 2016/2017 and 100,000 MT in 2024. | | | · | SJAP awarded Dragon Head Enterprise status by the Qinghai provincial government. | | | · | Mr. George Yap and Mr. Nils-Erik Sandberg join SIAF’s Board of Directors, as independent directors. | | | · | Produces 4,700 MT of seafood and raises 15,000 head of cattle. | | | | | | 2014 | | · | SJAP’s abattoir and meat processing facilities commence operations. SJAP signs supplier and concession agreements with Tesco, PLC China for packaged meat products. | | | · | Advances construction of a wholesale and distribution center in Shanghai, targeting ultimate capacity of 12,000 MT of meat and 6,000 MT of seafood per annum. | | | · | Mr. Anthony Soh and Mr. Dan Ritchey join SIAF’s Board of Directors as independent directors. | | | · | Ms. Olivia Lai is hired as Chief Financial Officer. | | | · | Produces 5,600 MT of Seafood and raises 26,000 head of cattle during 2014. | | | | | | 2015 | | · | The Company announces a long-term vision to become a leading sustainable aquaculture company focused on organically farmed fish and prawns. | | | · | Wholesale Center 2 in Shanghai initiates operations | | | · | Mr. Bertil Tiusanen is hired as Chief Financial Officer. Ms. Lai becomes the Company’s Chief Corporate Affairs Officer. | | | · | The Company announces contemplated plan to divest its aquaculture operations and seek a separate listing on the Oslo Stock Exchange. |
| 2016 | | · | The Company was admitted to the Merkur market in Oslo. | | | · | The Company upgraded to OTCQX Premier from the OTCQB®Venture Market. | | | · | Mr. Bertil Tiusanen resigned as Chief Financial Officer and appointed as SVP Business Development, New Ventures Europe | | | · | Officer and Mr. Dan Ritchey appointed as Chief Financial Officer. | | | · | The Company’s carve-out of Tri-way resulting in categorization of Tri-way as an Investor in Associate from a subsidiary status. As such, the Company’s fully owned subsidiary namely, Capital Award Inc (CA), retains its main business activity in the sector of technology and engineering consulting and related services, and Tri-way has assumed all activity regarding aquaculture operations and the sale of all products produced by them. | | | · | Tri-way has purchased Master Developer and Operating licensing rights from CA for purposes of future development of aquaculture projects in China utilizing CA’s APM-indoor and ODRAS technology, and has contracted with CA to provide its turnkey contractor services for those projects in China. | | | | | | 2017 | | · | Mr. George Yap resigned as independent director and Audit Committee chairman and member of Nomination Committee. | | | · | The Company increased its equity interest in Tri-way from 23.89% to 36.6% in the fourth quarter by converting the amount due from Tri-way into equity interest. | | | · | On December 30, 2017 the Company sold its (35.36%) equity in QZH to a third party. (Further details provided throughout report). | | | | | | 2018 | | · | Mr. Dan Ritchey passed away on December 1, 2018. As of the date of this prospectus, the Company has yet to appoint a CFO; consequently, Mr. Solomon Lee currently serves as the Company’s interim CFO. | | | · | Mr. Nils Erik Sandberg resigned as independent director and Audit Committee chairman | | | · | Mr. Colanukuduru Ravindran was appointed as an independent director and the Audit Committee chairman on March 29, 2019. |
Through December 31, 2018, the Company has been contracted as turnkey contractor to the collapseowners and developers of the Chinese dairyC&S Project Companies and acted as the master engineer, pioneering the construction and building of farms, from raw land into fully operational facilities. In each development the Company completes the construction and building of infrastructure including staff quarters, offices, processing facilities, storage, and all related production facilities. The Company’s management teams are responsible for developing all business activities into effective and efficient operations. From October 1, 2016, onward, Tri-way has assumed the role as developer of aquaculture projects in China with CA contracted to provide turnkey contracted services for those projects. Over the past ten years, the Company has matured into a company dedicated to the agriculture and aquaculture industry in 2010. China. The Company currently maintains operations of its HU Plantation as well as its services in engineering consulting and specializing in the development of two major products, namely meat derived from the rearing of beef cattle and seafood derived from the growth of fish, prawns, eel and other marine species. Background After successfully developing many aquaculture fishery farms, cattle farms and related business operations (along with sales and marketing of produce and products) in Australia and Malaysia since 1998, SIAF’s management team introduced our business activities in China in 2006. We are an engineering and consulting company that specializes in building and operating agriculture and aquaculture farms. To accomplish this, we use our expertise and know how in specific agriculture and aquaculture technologies. Our “A Power Re-circulating Aquaculture System,” sometimes referred to herein as APRAS, is a patented and proven technology for indoor fish farming. We have developed modern techniques and technologies to grow, feed and house both fish and cattle. These are engineered into the saledesigns of, and the management systems for, indoor and outdoor fishery and cattle farms. Our experience managing crops, and employing technologies, including hydroponic, to work within climate and growing conditions optimizes production of organic, green and natural agricultural produce. In all of our former dairydevelopments we have acted as the master engineer, pioneering the construction and building of farms, from raw land into fully operational facilities. We complete the construction and building of infrastructure including staff quarters, offices, processing facilities, storage, and all related production facilities. Our management teams are responsible for developing all business we decidedactivities into effective and efficient operations. During the past years, SIAF has matured into a company dedicated to implementthe agriculture and aquaculture industry in China. We currently maintain operation of our growth plan to developHU Plantation as well as our services in engineering consulting, specializing in the vertically integrated business operations in (i) cattle fattening and producingdevelopment of two major products, namely meat derived from the rearing of beef productscattle and (ii) fishery forseafood derived from the cultivationgrowth of fish, prawns, eel and prawnother marine species. Revenues are generated from activities that we divide into five stand-alone business divisions or units: (1) Fishery development, (2) Cattle & Beef, (3) Organic Fertilizer, (4) HU Plantation, and related products, as is further described elsewhere in this prospectus.(5) Marketing and Trading. This fifth and newest division, “Marketing and Trading” represents our strongest push to vertically integrate the Company’s operations, furthering the Company’s overall “farm to plate” concept. Corporate Acquisitions On September 5, 2007, we acquired two existing businesses in the People’s Republic of China or the PRC:(“PRC”): (a) Tri-Way Industries Ltd., Hong Kong (“TRW”TRW”) (formerly known as “Tri-wayTri-way Industries Limited”)Limited), a company incorporated in Hong Kong; and (b) Macau EIJI Co. Ltd., Macau (“MEIJI”MEIJI”) (formerly known as Macau Eiji Company Limited”)Limited), a company incorporated in Macau, and the owner of 75% equity interest in Enping City Juntang Town Hang Sing Tai Agriculture Co. Ltd. (“HST”HST”), a PRC corporate Sino-ForeignSino Foreign joint venture. HST was dissolved in 2010. On November 27, 2007, MEIJI and HST established a corporate Sino - Foreign joint venture, Jiangmen City Heng Sheng Tai Agriculture Development Co. Ltd, China (“JHST”JHST”) (formerly known as Jiang Men City Heng Sheng Tai Agriculture Development Co. Ltd.), a company incorporated in the PRC with MEIJI owning a 75% interest and HST owning a 25% interest. HST was dissolved in 2010. In September 2009, we formed a 100% owned subsidiary in Macau, A Power Agriculture Development (Macau) Ltd., China (“APWAM”APWAM”) (formerly known as “AA Power Agro Agriculture Development (Macau) Limited”)Limited). APWAM presently owns 45% of a corporate Sino-ForeignSino Foreign joint venture, Qinghai Sanjiang A Power Agriculture Co. Ltd. (“SJAP”SJAP”). On March 23, 2017, a third party, Qinghai Quanwang Investment Management Company Limited acquired a 8.3% equity interest and APWAM owned 41.25% equity interest of SJAP as of December 31, 2017. SJAP is engaged in the business of manufacturing bio-organicbioorganic fertilizer, livestock feed and development of other agriculture projects in the County of Huangyuan, in the vicinity of the Xining City, Qinghai Province, PRC. On February 28, 2011, TRW applied to form a corporate joint venture, Enping City A Power Prawn Culture Development Co. Ltd., China (“EBAPCD”EBAPCD”) (formerly known as “EnpingEnping City Bi Tao A Power Fishery Development Co., Limited”)Limited), which is incorporated in the PRC. TRW initially owned a 25% equity interest in EBAPFD. On November 17, 2011, TRW formed Jiangmen City A Power Fishery Development Co. Ltd, China (“JFD”JFD”) (formerly known as “JiangJiang Men City A Power Fishery Development Co., Limited”)Limited) in which it acquired a 25% equity interest, while withdrawing its 25% equity interest in EBAPFD. As of December 31, 2011, we had invested $1,258,607 in JFD. JFD operates an indoor fish farm. On January 1, 2012, we acquired an additional 25% equity interest in JFD for total cash consideration of $1,662,365. On April 1, 2012, we acquired an additional 25% equity interest in JFD for the amount of $1,702,580. We presently ownPrior to October 5th2016 we owned a 75% equity interest in JFD and control its board of directors. As of September 30, 2012, we had consolidated the assets and operations of JFD. From October 5th 2016 we brought out the remaining 25% equity interest in JFD for consideration of $4,517,426 and sold the 100% equity interest in JFD to Tri-way (inclusive all original assets of its one farm namely Fish Farm 1 that was changed to name Aqua-Farm 1 and of other additional assets transferred from work in progress etc.) for $33,538,480; and converted JFD into a Wholly Owned Foreign Entity (WOFE) such that Tri-way is holding 100% equity interest in JFD; and simultaneously (on October 5th 2016) JFD completed the acquisition: of the assets and operation from owners and investors of four other aquaculture farms (namely Aqua-farm 2, 3 and 4) for $277,055,897 collectively; and the acquisition of a Master License from CA for the rights of future development and operation of our APRAS farms in China for $30,000,000 resulting that we were owing 23.89% equity interest in Tri-way as at October 5th 2016. The Company converted the amount due from unconsolidated equity investee into equity interest during the fourth quarter of 2017, which resulted in equity interest in TRW from 23.89% to 36.60%. On April 15, 2011, MEIJI applied to form Enping City A Power Beef Cattle Farm (2)2 Co. Ltd., China (“EAPBCF2”EAPBCF”) (formerly known as “EnpingEnping City A Power Cattle Farm Co., Limited”)Limited), all of which we would indirectly own a 25% equity interest in as of November 17, 2011. On September 13, 2012 MEIJI formed Jiangmen City Hang Mei Cattle Farm Development Co. Ltd., Chinaa company incorporated in the PRC (“JHMC”JHMC”) (formerly known as “JiangJiang Men City Hang Mei Cattle Farm Development Co., Limited”)Limited) in which it owns 75% equity interest with an investment of $3,636,326, while withdrawing its 25% equity interest in ECF. As of September 30, 2012, we had consolidated the assets and operations of JHMC. Cross-Listing on the Merkur Market On January 13, 2016, securities representing beneficial interests in the shares of common stock on the Company, referred to as VPS Shares, began to be traded on the Oslo Børs’ Merkur Market under the symbol “SIAF-ME.” The Company’s common shares continued to trade on the OTCQB under the symbol “SIAF.” The Merkur Market is a multilateral trading facility operated by Oslo Børs ASA. The Merkur Market is subject to the rules in the Norwegian Securities Trading Act and the Securities Trading Regulations that apply to such marketplaces. These rules apply to companies admitted to trading on the Merkur Market, as do the marketplace’s own rules, which are less comprehensive than the rules and regulations that apply to companies listed on Oslo Børs and Oslo Axess. The Merkur Market is not a regulated market, and is therefore not subject to the Norwegian Stock Exchange Act or to the Stock Exchange Regulations. Investors should take this into account when making investment decisions. TablesDelisting from the Merkur Market
In January of information:2019 the Company applied to Oslo Børs ASA for the delisting from the Merkur Market. The tables below show:principal reason for the delisting from the Merkur is the difference in the disclosure rules that the Merkur requires; the Merkur requires the disclosure of information prior to occurrence of a particular event which is inherently forward-looking in nature and thus potentially speculative; consequently, any such disclosure could thus be in conflict with US securities laws. Uplisting to the OTC QX Premier On January 19, 2016, the Company’s shares of common stock began to be traded on the OTCQX® Best Market in the U.S. under its existing ticker symbol “SIAF.” The Company upgraded to OTCQX Premier from the OTCQB®Venture Market. The OTCQX® Market is the top tier of the U.S. over-the-counter markets operated by OTC Markets Company. It is reserved for established investor-focused companies meeting high financial and governance standards, and sponsored by professional third party advisors. SIAF has qualified to trade on OTCQX U.S. Premier, for which eligibility standards are higher still. For comparison, as of December 31, 2015, there were 942 companies traded on the OTCQB, 425 companies traded on the OTCQX and 98 companies traded on OTCQX U.S. Premier, of which only 17 are non-bank companies. With OTCQX admission, OTC Market Company’s Blue Sky Monitoring Service provides the Company with a customized daily audit of its compliance status in all 50 states. Blue Sky compliance is mandatory for broker-dealers and registered investment advisors to solicit or recommend a security to investors. U.S. investors can find current financial disclosure and Real-Time Level 2 quotes for the Company onwww.otcmarkets.com. Emerging Growth Company We are an “emerging growth company,” as defined in the Jumpstart Our Business Startups Act of 2012. We will remain an emerging growth company until the earlier of (1) the last day of the fiscal year (a) in which we have total annual gross revenue of at least $1.0 billion or (b) in which we are deemed to be a large accelerated filer, which means the market value of our common stock that is held by non-affiliates exceeded $700.0 million as of the prior June 30, and (2) the date on which we have issued more than $1.0 billion in non-convertible debt during the prior three-year period. We refer to the Jumpstart Our Business Startups Act of 2012 herein as the “JOBS Act” and references herein to “emerging growth company” shall have the meaning associated with it in the JOBS Act. As an emerging growth company, we may take advantage of specified reduced disclosure and other requirements that are otherwise applicable generally to public companies. These provisions include: | (1)· | Table 1 shows the Company’s Corporate Structure asonly two years of June 30, 2013, where the boxes marked “Unincorporated project companies” mean that their respective Sino Foreign Joint Venture Company (“SJVC”) has not been formed officially,audited consolidated financial statements in addition to any required unaudited interim financial statements with correspondingly reduced “Management’s Discussion and that the Company has paid a 25% deposit as consideration toward their acquisition pending the official formationAnalysis of their corresponding SJVC, allFinancial Conditions and Results of which are scheduled to occur between December 31, 2013 and June 30, 2014.Operations” disclosure; |
| (2)· | Table 2 shows the abbreviation of the names of the companies.reduced disclosure about our executive compensation arrangements; |
| (3)· | Table 3 shows the location of the Company’s businessesno requirement that we hold non-binding advisory notes on executive compensation or golden parachute arrangements; and |
| (4)· | Table 4 showsexemption from the business activities ofauditor attestation requirement in the Company’s businesses. |
| (5) | Table 5 summarizes the general informationassessment of our business and operation models.internal control over financial reporting. |
TABLE 1: CORPORATE STRUCTUREWe have taken advantage of some of these reduced burdens, and thus the information we provide stockholders may be different from what you might receive from other public companies in which you hold shares.
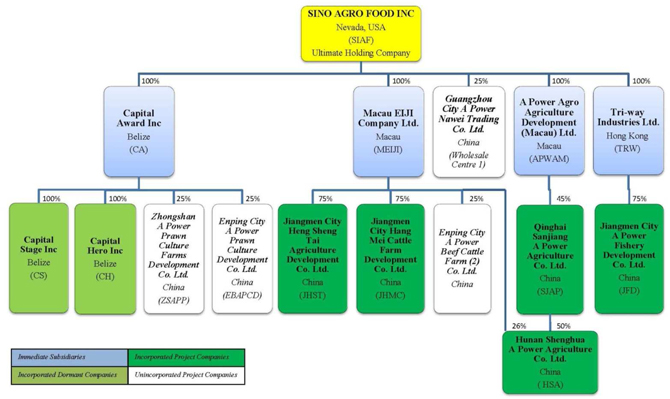
TABLE 2: ABBREVIATION OF THE NAMES OF THE COMPANIESLegal structure
| | | Abbreviation | | Names of entities | | Date of formation | | | | | | | | | | | | | | | | Incorporated Companies | | | | | | | | | | | | | | 1 | | SIAF | | Sino Agro Food, Inc. | | 1974 | | | 2 | | CA | | Capital Award Inc. | | 2003 | | | 3 | | MEIJI | | Macau EIJI Company Ltd. | | 2005 | | | 4 | | APWAM | | A Power Agro Agriculture Development (Macau) Ltd. | | 2007 | | | 5 | | TRW | | Tri-way Industries Ltd. (Hong Kong) | | 2009 | | | 6 | | CS | | Capital Stage Inc. | | 2003 | | | 7 | | CH | | Capital Hero Inc. | | 2003 | | | 8 | | JHST or HU Plantation | | Jiangmen City Heng Sheng Tai Agriculture Development Co. Ltd. | | 2009 | | | 9 | | JHMC or Cattle Farm 1 | | Jiangman City Hang Mei Cattle Farm Development Co. Ltd. | | 2012 | | | 10 | | SJAP | | Qinghai Sanjiang A Power Agriculture Co. Ltd. | | 2009 | | | 11 | | JFD or Fish Farm 1 | | Jiangmen City A Power Fishery Development Co. Ltd. | | 2011 | | | 12 | | HSA | | Hunan Shenghua A Power Agriculture Co. Ltd. | | 2011 | | | | | | | | | | | | | | | | Unincorporated Project Companies | | | | | | | | | | | | | | 13 | | Wholesale Center 1 or APNW | | Guangzhou City A Power Nawei Trading Co. Ltd. China | | 2012 | | | 14 | | ZSAPP or Prawn Farm 2 | | Zhongshan A Power Prawn Culture Farms Development Co. Ltd. China | | 2012 | | | 15 | | EBAPCD or Prawn Farm 1 | | Enping City A Power Prawn Culture Development Co. Ltd. China | | 2011 | | | 16 | | Cattle Farm 2 | | Enping City A Power Beef Cattle Farm 2 Co. Ltd. China | | 2011 | |
All “Unincorporated Project Companies”The Company is primarily a holding company whose operations are private companies formed in China with Chinese citizens acting as their legal representatives as required by company law of China. These companies’ names will be changed in accordance with the names granted by the relevant authorities once their corresponding Sino Foreign Joint Venture company will officially have been formed.carried out through its subsidiaries.
TABLE 3: LOCATION MAP OF GROUP’S BUSINESS
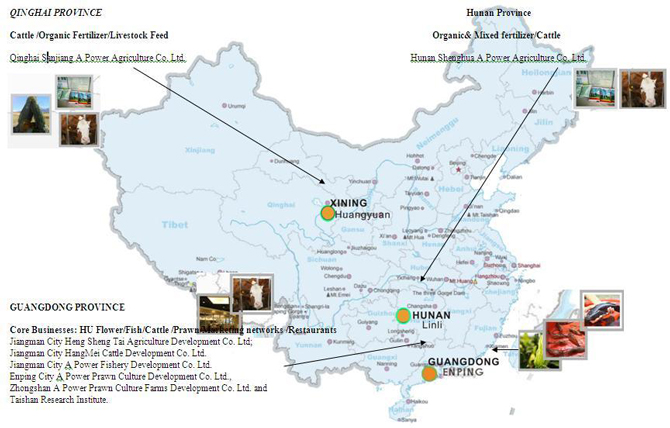

TABLE 4: BUSINESS ACTIVITIES OF THE GROUP’S COMPANIES
The table below sets out a brief description of the companies within the Company as well as the Company’s respective holdings within such companies and their domiciles. ABBREVIATION NamesCompany | | Business activitiesCountry of
incorporation | | Field of activity | | % Holding | | SIAF | | | | | | | | | Sino Agro Food, Inc. | | US | | Engineering consulting (in general(general types of developments), business management, trading, sales and marketing | | | | CA | | | | | | | | | Capital Award Inc. (CA) | | Belize | | Engineering consulting (mainly in development of fishery), management of fishery operation, marketing and sales of fishery produces and products.products | | 100 | | MEIJI | | | | | | | | | Tri-way Industries Limited (TRW) | | Hong Kong | | Holding company and holder of technology licenses | | 36.6 | | | | | | | | | | | Macau Eiji Company Limited (MEIJI) | | Macau | | Engineering consulting (mainly in cattle farming and vegetable farming), management service and marketing and sales of cattle and related products.products | | 100 | | APWAM | | | | | | | | | A Power Agro Agriculture Development (Macau) Limited (APWAM) | | Macau | | Holding Company | TRWcompany | | Holding Company and holders of Technology Licenses.100 | | CS | | | | | | | | | Sino Agro Food Sweden AB (Private) (SAFS) | | Sweden | | Various support and service to parent company, asset management, finance, consulting and provision of services in agriculture and aquaculture, marketing and sale of agricultural products, consultancy for business development in China, and related business | | 100 | | | | | | | | | | | Capital Stage Inc. (CS) | | Belize | | Dormant | | 100 | | CH | | | | | | | | | Capital Hero Inc. (CH) | | Belize | | Dormant | | 100 | | JHST or (HU Plantation) | | H U Plantation, Immortal Vegetable farming, | | | | | | | Jiangmen City A Power Fishery Development Co. Ltd. (JFD) | | China | | (1): Operator in growing of fish (sleepy cod species), eels (flower pattern species) and prawns; Research and Development of growing technique and knowhow of live-seafood and
(2) Marketing and Trading of seafood | | 100% owned by Tri-way | | | | | | | | | | | Jiangmen City Hang Mei Cattle Farm Development Co. Ltd. (JHMC or Cattle Farm 1) | | China | | A demonstration farm for growing cattle in a semi-tropical climate | | 75 | | | | | | | | | | | Jiangmen City Heng Sheng Tai Agriculture Development Co. Ltd. (JHST) | | China | | HU plantation, immortal vegetable and cash crops of vegetables planting, processing and sales of produces and products. | JHMC or (Cattle Farm 1)products | | Rearing of cattle at Cattle Farm 1 which is a demonstration farm75 | | SJAP | |
| | | | | | | Hunan Shenghua A Power Agriculture Co. Ltd. (HSA) | | China | | Existing activities: Manufacturing manufacturing of organic fertilizer, 100% pure organic mixed fertilizer and lake fish farming organic fertilizer. Cattle rearing.
| | 76 | | | | | | | | | | | Qinghai Sanjiang A Power Agriculture Co. Ltd. (SJAP) | | China | | Existing activities: manufacturing of organic fertilizer bulk and concentrated livestock feed, and rearing of cattle and corporative farmingExpected Added activities by 2014
cooperative farming. Slaughter and de-boningdeboning of cattle and value added processing of beef products Manufacturing of Enzyme
Electricity generation via Mash Gas Station
| JFD or (Fish Farm 1)products. | | Growing of fish (sleepy cod species), eels (Flower Pattern species) and prawns (or shrimps) at Fish Farm 1 | HSA41.25% owned by SIAF | | Existing Activities
Manufacturing of organic fertilizer, 100% pure organic mixed fertilizer and lake fish farming organic fertilizer.
Expected Added activities by 2014
Cattle farming
| Wholesale Centre (1) | | Marketing, sales and distribution of seafood and meats and related products.
| ZSAPP or (Prawn Farm2) | | Hatchery and Nursery operation of prawns (or shrimps)
Growing of prawns (or shrimp) using open-dams applying re-circulating filtration systems.
| EBAPCD or (Prawn Farm 1) | | Growing of prawns (or shrimp) | Cattle Farm (2) | | By year 2014—Cattle Growing |
TABLE 5: SUMMARY OF BUSINESS AND OPERATION MODELS AND TECHNOLOGIESIn addition to the legal entities included in the chart and table above, the Company is providing technology know-how with consulting service and turnkey contracting services (“C&S”) to various Chinese owned Project Companies (“C&S Project Company”) which mainly are private companies formed in China with Chinese citizens acting as legal representatives. The Company does not have any ownership in these C&S Project Companies. However, in consideration of the Company’s right to protect its technology and know-how granted to the C&S Project Companies, the Company has an option to acquire equity stakes in the future SFJVC at an agreed value equivalent to the project’s development cost.
OurIn addition, regarding the investment agreement between QZH and QQI, (i) QQI enjoyed 6% annual interest on its capital contribution, but not any profit distribution; (ii) investment period was 3 years, and (iii) SJAP shared 100% (2016: 100%) on profit or loss after 6% interest payment to QQI and enjoyed 100% (2016: 100%) voting rights of QZH’s board and stockholders meetings.
As of December 30, 2017, the Company register authority approved the transferred of the Company’s (35.36%) equity interest in QZH to an unrelated third party, such that as from December 30, 2017 QZH was derecognized as a variable interest entity. (Further related information is provided throughout this prospectus). Business model The Company works with Chinese investors to form operating companies, in which the Company retains the option to acquire equity interest. After a certain period of time and successful operating results, the Company and the Chinese investor may form a Sino Foreign Joint Venture Companies (SJVC)Company (“SFJVC”). Prior to the formal naming, registration, and incorporation of an anticipated SFJVC, the Company prepays a deposit toward the consideration of its future SFJVC stake as a percentage of the assets of the fully developed farm. Upon conversion, the prepayments become equity capital. ThereThe Company oversees financing and provides interoperating strategies, encouraging vertically integrated growth. China has problems with quality assurance in primary production, distribution and poor origin traceability, as well as low food quality. This has created a market where consumers will eventually pay significant price premiums for “BAP (Best Aquaculture Practice) Certified” seafood with brands guaranteeing quality and consistency.
A vertically integrated operation in a fragmented and poorly regulated environment such as in China is the strategy that will yield the most success for the Company. Our presence in retailing and wholesale markets generates market power and provides potential for both margin maintenance and expansion. Integration into fertilizer and feed production for rearing of beef cattle together with breeding of prawn brood stock help decrease primary production operational risks as well as helping to offset price fluctuations that sometimes occur in raw product input prices. 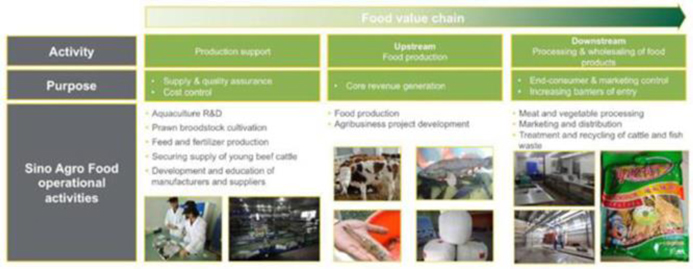
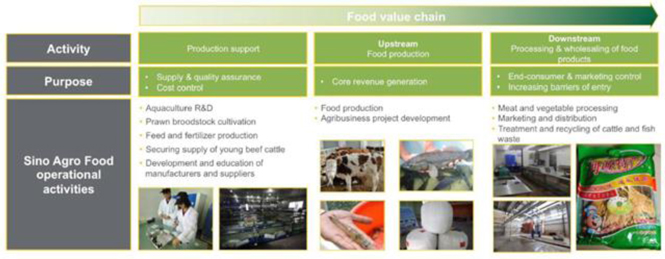
The Company uses expertise and know-how in specific agriculture and aquaculture technologies. The Company’s “A Power Re-circulating Aquaculture System” (the “APRAS”) is a proven recirculating aquaculture system (“RAS”) technology for indoor fish farming. The Company has developed modern techniques and technologies to grow, feed and house both fish and cattle. These are twoengineered into the designs of, and the management systems for, indoor and outdoor fishery and cattle farms. In all developments the Company acts as the master engineer, pioneering the construction and building of farms, from raw land into fully operational facilities. The Company builds the infrastructure including staff quarters, offices, processing facilities, storage, and all related production facilities; then, manages developing of all business activities into effective and efficient operations. The Company’s largest customer represents a Company of thirty separate live seafood wholesalers at the Guangzhou wholesale markets. The Company holds licenses for fertilizer formulas, enzyme patents, and for indoor fish farm techniques, including a “master license” in China for “A Power Technology” (“APT”), a modular land-based fish growing system and technology utilizing RAS. The Company partners with Chinese investors in food projects as a turnkey project manager The Company engages in projects as a technological and engineering expert, partnering with local and regional investors in food related projects. The Company generally has exclusive marketing, sales and distribution rights for each project company. For example, MEIJI purchases all marketable cattle from Cattle farm 2 and distributes them to wholesale markets. Up until September 30,2016, prior to SIAF becoming an investment associate of Tri-way (i.e. post-carve-out), CA had been purchasing all seafood produced by the fishery farms and also supplied the fishery farms with fingerling, baby or adult fish or prawns and stock feed. Thus, CA is no longer involved in any sales, marketing and supplies of fishery goods being operated by Tri-way yet will continue to carry out its current contracts with other entities, as well as developing other business ties that are interested in utilizing its services. 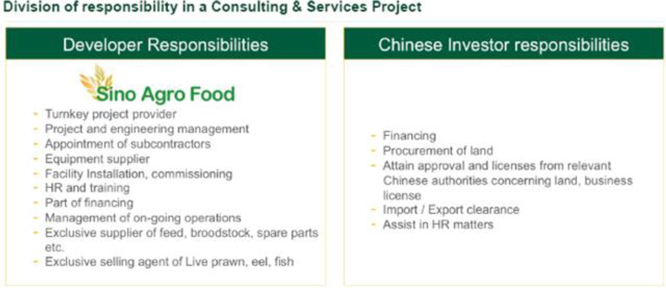
Generally, the Company exercises an option to acquire a majority equity stake in the project company once development of the operating company has matured and successful operating results are demonstrated. Prior to acquisition, the Company prepays a deposit toward the acquisition consideration of the project company. Upon acquisition and conversion into a SFJVC, the pre-payments together with a cash consideration become equity capital, with the Company becoming a major shareholder. Acquired project companies are operated and managed by the management team and the Chinese investor, and overseen by the Company. 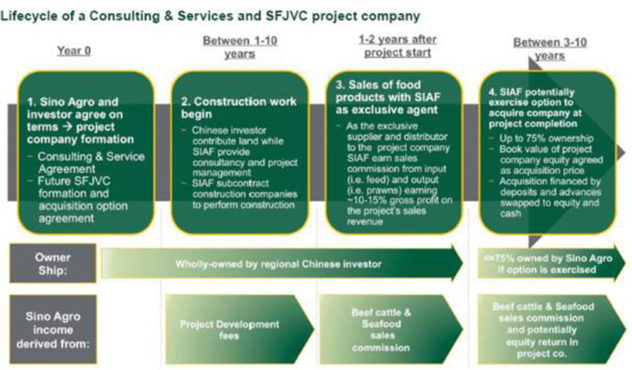
Land ownership in China In China, nearly all land is owned by the Central Government or local village collectives, which grant “usufructuary” rights (i.e., the right to use and enjoy the derived benefits for a period of time) in the form of land use rights. This is similar to “leasehold” land rights in the United States. Corporate entities and individuals may own the property (buildings) erected on Government land. Land use rights may be transferred, but they are based on agricultural contracts, and cannot be changed arbitrarily to non-agricultural purposes. Business overview Introduction The Company is an agriculture technology and natural food holding company with principal operations in China participating in the ongoing transformation of China’s fragmented agrarian sector into a modern food production industry using sustainable and profitable methods. The Company focuses on seafood and beef production with integrated wholesale distribution. The Company acquires and maintains equity stakes in a cohesive portfolio of companies that the Company forms according to its core mission to produce, distribute, market and sell natural, sustainable protein food and produce, primarily seafood and cattle, to the rapidly growing middle class in China. The Company employs a strategy of vertical integration from primary production through processing, distribution and marketing of high quality, organic food products in the food value chain. China’s fast growing middle class is creating rapidly rising demand for gourmet and high-quality protein food. The Company’s core products are live prawns, live eels, whole beef cattle and packaged beef meat. The Company’s operations and strategy are executed through a number of subsidiaries located in China, and the Company contributes financial oversight and strategic direction to otherwise independent management teams which employ the Company’s intellectual property and proprietary methods within aquaculture, beef cattle rearing and production of organic fertilizer. The Company has enjoyed strong growth since the Company initiated its business activities in China in 2006. During the fiscal year of 2018, the Company’s consolidated revenues amounted to USD $141,670,563. The four principal factors that we use to obtain our SJVC’s in China;have enabled the growth are: | l· | One where we payJoint venture investment models with existing local Chinese investors in agriculture and aquaculture; |
| · | Technological competitive advantages in recirculating aquaculture, beef rearing and livestock slaughter; |
| · | Strong growth in Chinese consumers’ demand for our entire sharequality protein food; and |
| · | The Chinese Government’s policy to consolidate the agrarian sector and increase the efficiency of capital expenditures and associated costs (including establishment and development cost) and applying for the formation of the SJVC starting from day one. A Sino Joint Venture Agreement (or Memorandum of Understanding) is usually executed in advance bearing corresponding terms and conditions agreed by the joint venture parties.China’s food production industry. |
Examples: SJAP, JHSTThe Company provides consulting and HAS.services to a number of private Chinese third party companies to construct and operate primary production facilities for fish, prawn and beef cattle, as well as wholesale marketing and distribution centers. As part of its consulting and service agreements, the Company has the option to acquire these operations in order to expand the Company’s proprietary production and wholesaling capacity.
Revenues are generated from activities that are divided into five stand-alone business divisions: | l(i) | The other way involves us acquiring the entity only after its business operation has been developedAquaculture (CA: inclusive Technology engineering consulting & services (Project Development division) and started to generate revenues; in this case, we would have evaluated that the particular operation would be beneficial to the Company in all aspects,sales of goods) |
| (ii) | Integrated Cattle Farm (SJAP) and thereafter we would apply for the formationOrganic Fertilizer (HSA) |
| (iii) | Cattle Farm (MEIJI: sales of its SJVC:goods) |
| (v) | Seafood & Meat Trading (SIAF / CA GZ: inclusive Technology engineering consulting & services (Project Development division) and sales of goods and corporate affairs) |
Examples: JHMC and JFD.Aquaculture division
This method is typically usedCA has entered into and completed several CSC’s (i.e., the Fish Farm 1 (or Aqua-Farm 1)) for JFD, the Prawn Farm 1 (Or Aqua-Farm 3) for EBAPCD and construction and development work still in connectionprogress for the Prawn Farm 2 (or Aqua-Farm 2) at Xin Hui District and the Prawn Farm 3 (or Aqua-Farm 4) and Prawn Farm 4 (or Aqua-Farm 5) at San Jiao Town Zhongshan for ZSAPP.
Prior to September 30, 2016, CA was the sole marketing, sales and distribution agent of the APRAS fishery and prawn farms. CA had purchased all marketable fish and prawn from the farms, and then sold them to wholesale markets. CA also supplied the farms with projectsfingerlings, baby or adult fish or prawns, and stock feed. CA generated revenue from the sale of seafood bought from farms that we builteither had been Company subsidiaries or C&S Project Companies. However, since then, Tri-way has acquired all assets and developed for our Chinese investorsoperation of CA’s C&S related project farms (i.e. Aqua-Farm 1 to 5) and SIAF has carved-out its controlling interest in Tri-way to 23.89% + debt converted to equity of 12.71% totaling to 36.6%, such that Tri-way, the Joint Venture Agreements bear standard termssubsidiary, is categorized as an “investment in associate” holding of SIAF, as a result of SIAF’s deemed disposal of equity interest in the subsidiary. Integrated Cattle Farm division (SJAP & QZH) Operated by SJAP, the Integrated Cattle Farm division is the business unit of the Company active in beef cattle rearing and conditions,value added processing of domestic and imported beef meat. Revenue for fiscal year ended December 31, 2018 was USD 19.23 million or 13.6 percent of the Company’s total sales of goods revenue of USD 141.67 million in other words where the investors agree:same period. Gross profit for SJAP’s integrated cattle farm division in the fiscal year ended December 31, 2018 was USD 4.3 million, or 19.86 percent of the Company’s total gross profit in sales of goods of USD 21.65 million in the same period. | 1. | to appoint us as their Consulting Engineer granting the right for us to appoint local qualified sub-contracts to build/construct the farmsBeef cattle rearing and local suppliers to supply all plants and equipment and related parts and components of the farms; |
| 2. | to let us have full management right on the construction and development of the farm and the management right to manage the operation of the related developed business operation of the farm afterward and as the sole marketing and distribution agent of the farm for the sales and marketing of the farm’s produces and products; |
| 3. | to pay for all construction and development costs in accordance with the terms and conditions of our consulting servicing contracts for acting as their consulting engineer; |
| 4. | in the event that we decide to acquire the developed farm and related business operations, the investors shall agree to incorporate a Sino Foreign Joint Venture Company to acquire all assets and liabilities of the said farm and business and allow us the option to take up to 75% of the SJVC at 100% net asset value of the SJVC and the investors keep 25% of the SJVC; and |
| 5. | in the event if we decide not to acquire the developed farm and related business operation, the investors agree to appoint us as the management of operation of the farm for a minimum period of 15 years.fattening |
Our EmployeesSJAP has slowed down its beef cattle rearing and fattening division since 2017 and is no longer involved with the corporative growers in the fattening of beef cattle due primarily to the depressed markets of the local cattle and beef industry caused mainly by the opening of the beef imports from a great number of developed countries that un-balanced the local cattle industry. Revenue for fiscal year ended December 31, 2018 was USD 6.64 million or 4.7 percent of the Company’s total sales of goods revenue of USD 141.67 million in the same period. Gross profit for same division in the fiscal year ended December 31,2018 was at a loss of USD(0.98) million, or (4.5)% of the Company’s total gross profit in sales of goods of USD 21.65 million in the same period.
SJAP now has in its own property twelve cattle houses, with its smaller buildings housing a minimum of 200 head and larger cattle houses accommodating up to 350 head. | 2. | The Organic fertilizer Chain: |
The SJAP’s fertilizer division’s revenue for fiscal year ended December 31, 2018 was USD 3.02 million or 2.1 percent of the Company’s total sales of goods revenue of USD 141.65 million in the same period. Gross profit for same division in the fiscal year ended December 31, 2018 was USD 0.89 million, or 4.1% of the Company’s total gross profit in sales of goods of USD 21.65 million in the same period. The following table describes our employeesCompany prepares its agricultural wastes into bioorganic fertilizer through the environmentally friendly “Bacterial and for which divisions they work as of August 31, 2013: | Abbreviation | | Management | | | Skilled | | | Non-skilled | | | Casual | | | Total | | | SIAF, including CA, MEIJI, APWAM, TRW, CS and CH | | | 12 | | | | 15 | | | | 3 | | | | 0 | | | | 30 | | | JHST | | | 5 | | | | 18 | | | | 43 | | | | 128 | | | | 194 | | | JHMC | | | 2 | | | | 2 | | | | 13 | | | | 16 | | | | 33 | | | SJAP | | | 16 | | | | 26 | | | | 65 | | | | 150 | | | | 257 | | | JFD | | | 2 | | | | 6 | | | | 6 | | | | 0 | | | | 14 | | | HSA | | | 5 | | | | 5 | | | | 12 | | | | 0 | | | | 22 | | | Total | | | 42 | | | | 72 | | | | 142 | | | | 294 | | | | 550 | |
Cooperative Farming Model
Our Cooperative Farming Model provides us with an intermediary supply pipeline so we can ramp up our production at lower marginal cost to our operations, albeit on favorable trade terms from us.
Our strategy is to identify agriculture projects with strong growth potential linked to sales demand where small farmers lack commercial scale and expertise and where they benefit with our strategic alliance approach so that we have a win-win outcome for local small farmers who cooperate with us as an intermediary to produce the goods to supply our farms. We believe that this model ensures that we have a supply pipeline so we can ramp up production at lower margin cost to our operations albeit on favorable trade terms from us. We then work with the local government and with their help we introduce and initiate Farmers Cooperatives, such as in Huangyuan County, Xining City. This concept of strategic alliance with smallholder farmers under a Cooperative Farming Model was originated based on the following key characteristics and value enhancers:
1. Once we have completed our assessment of the ability of the regional farmers to grow crops and pastures for us as our nominated contractors using our land that was leased to us free of rent by the local government or using the farmer’s own land, and using our plants and equipment for their planting and harvesting, we provide the farmers with supervision and associated services, seeds and organic fertilizer on credit terms offset by the crops and pastures that we purchase from them.
2. We also use this regional farmers’ concept when we are growing cattle as these farmers are our contractors using our bulk livestock feed on credit terms that will be offset by the amount of mature cattle that we buy from them.
3. The ultimate aim of this arrangement is to obtain cattle that will be qualified as “organically reared cattle” such that we shall be able to produce “Organic beef products” on a commercial scale basis.
The Organic Chain: (Organic Beef Product and Supply Chain)
SIAF’s agricultural waste is prepared by SIAF into bio-organic fertilizer.Bio-organic Fertilizer Manufacturing Technology.” Also, the livestock feed is prepared into bio-organicbioorganic livestock feed.
The bio-organic fertilizer and the bio-organic livestock Livestock feed is sold to farmers that work on SIAF’s land-use rights (which are owned by the government) at a discounted price. The fertilizer and the livestock feed is also prepared based on our enzyme. The useconsists of the enzyme is synergistic as the production of fertilizer and livestock feed is permissible during 12 months of the year, which is a competitive advantage.
The farmers use the bio-organic fertilizer on the soil and feed the grain to the cows together with the livestock feed. Tests made by the government that owns the land shows the following results from use of the bio-organic fertilizer:
Additional average weight gain per head of fattening cattle;
Additional fresh milk produced;
All feeds are much easier to digest resulting in a much cleaner environment in the cattle yards and houses;
No sickness during the period was recorded through the cause of consumption of our feeds; and
All cattle preferred to eat our feed and were reluctant to revert back to the consumption of their old feed after they had consumed our feed during the period.
SIAF acquires the young cattle from the regional farmers when they are about 6 months old. Due to the discounted price of the bio-organic fertilizer, SIAF acquires the young cattle to a discounted price from the farmers for a win-win outcome. The young cattle are fed with SIAF’s organic livestock feed (our “Stock Feed Manufacturing Technology”).
Recent Case studies :
Our records show that farmers’ averaged annual incomes increased from RMB 480/Mu (about 660 square meters)/year to RMB 2,100/Mu/year by planting crops and pasture for us applying our fertilizer with harvesting being done by our teams of harvesting workers using our machineries and equipment.
Farmers who grow cattle using our livestock feed and sold their cattle to us has annual incomes increased by 4 times because it used to take them 4 years to grow and fatten a head of cattle to about 600 kg of body weight, but now it takes them less than 12 months to fatten a head of cattle to a body weight of no less than 700 Kg.
Our Technologies
A Power Re-circulating Aquaculture System and Technology
We built our fishery (both for growing of fish or shrimp) farms using our A Power Re-circulating Aquaculture System and Technology (“APRAS”), now in its 10th version, to operate our sizeable commercial farming facilities. The A Power Technology and System is “an engineered, self-contained water treatment and re-circulating aquaculture system (“RAS”) for the growth of aquatic animals on a commercial scale”, whereas in the farm all fish grow-out tanks are in modules that can be built in various sizes to adapt to the growing capacity of the farm. This technology is proven, having been used in Europe and Australia for over 30 years. The Company attributes the following benefits to the system: improved productivity, lower labor requirements, mortality rates of less than 8% and feed-to-fish conversion ratios of 1:1 for pallet feed and 2:1 for non-pallet feed. The indoor system is fully controlled, tank water treated through micro-bio bacterial compartments to digest soluble wastes, solid waste separators remove the insoluble wastes, UV and O3 chambers clean the water and oxygen of the water is maintained by in-built aerators with water temperature controlled by heat exchangers, which is then recycled at the rate between 60 times to 120 times per hour adjustable according to the motion requirement of the growing species of fish with water temperature being maintained at suitable ranges to suit the species of fish. Importantly, this system does not require chemicals or antibiotics and is pollution free. Given the high incidence of pollution in aquaculture and the existing outdated open dam aquaculture methods used in China, we believe that our technology gives us distinct advantages both in the sales of fishes and prawns and for our consulting and service business to develop more farms in China.
At the same time we believe that land prices are rising rapidly in China and our RAS has the ability to maximize the utilization of land because our technology can produce greater quantity per surface area compared to the existing open-dam or caging aquaculture systems and technologies (which are rather old systems) used in China; for instance, a standard AP Modular tank has a surface area of 100 m2 and the capacity to produce over 40 MT of prawns (or shrimp) per year whereas the old systems’ average of production is at 6 Mt/660 m2 per year; in other word, we can produce annually 1,600 MT of prawns (or shrimp) per acre of land whereas the old systems are producing 36 MT of prawns (or shrimp) per acre per year which gives us a considerable advantage. Now that we have established a few commercial APRAS farms in China and proven their commercial viability, we believe the Company has the potential to venture into developing aquaculture projects with annual productivity over hundreds of thousand metric tons will not be too far away.
Our Aromatic Feed formula and Feeding Systems
We feed our cattle with a portion of our aromatic feed (which is a feed mix consisting of various Chinese herbs to improve the health of the cattle) at a ratio in accordance with their needs during each growing stages of the cattle while they are being grown in the farm. The end results are that our cattle have better growth rate and are healthy animals with tender meats that have an aromatic favor.
Our Enzyme Technologies (“Bacterial and Bio-organic Manufacturing Technology).
We have two Enzyme Technologies, one that was invented by SJAP and is being used for the manufacture of organic fertilizer and bulk livestock feed by SJAP at Qinghai, Xining’s operation (T2) and another one that we brought from a third party that is being used in our Cattle Farm 1’s operation to produce livestock feed (T1) and at HSA to produce 100% pure organic mixed fertilizer.
There are fundamental differences between T1 and T2 as shown in Table below:
| Fundamentals | | T1 (Page 65) | | T2 (Page 40) | | Required temperature for fermentation | | 15 degree C | | 4 degree C | | Days required to complete fermentation processes | | 21 days | | 7 days | | Temperature variation for storages | | Up to -10 degree C | | Up to -30 degree C | | Shelve-life | | One year | | Two years or more | | Protein % increases after fermentation | | 3% | | 6% |
T2 is more practical and suitable to apply at colder climate regions such as at SJAP’s operation at Qinghai, Xining which typically has 6 months of winter at average temperature of -20 degree C and below whereas T1 is more suitable to regions where the climate is milder, such as at JHMC (Cattle Farm 1) and HSA where there are typically 10 months of warm and hot climate with mild winters.
An example showing the manufacturing process of Bulk Livestock Feed:
Raw materialsraw material consisting of crop wastes as well as locally grown and available wild wheat plus wild wheat sterns, wild peas with sterns and leaves, and selective pastures grown in the wild. These raw materials will be finely cut and rolled into bales withput through several aging and fermentation processes by adopting a technology and method called “Stock Feed Manufacturing Technology,” and catalyzed by the enzyme being added duringdeveloped by SJAP. Thereafter, the cutting and rolling process thenend materials will be packed and sealed in airtight and weather proofweatherproof packaging ready for storage instorage.
Bioorganic fertilizer and the open. The materials will go through a number of aging and fermentation processes generatedbio-organic livestock feed is sold to farmers that work on the Company’s land-use rights, which is owned by the enzyme such thatgovernment and leased with a subsidy or rent free, due to the feed will be ready for consumption as and when the farmers will require them to feed their cattle or sheep. Our Formulas usedmany benefits for the manufacture of Concentrated livestock feed:
We have 6 formulas that we apply in our concentratedcommunity. Fertilizer and livestock feed manufacturing process, and these are formulas invented by our joint venture partners who were professors atprepared based on the University of Xining before they joined our operation at SJAP. All cattle’s daily dietary needs include the consumption bothCompany’s patented enzyme. The use of the bulkenzyme is synergistic, as the production of fertilizer and concentrated livestock feed that are tailor made to suit each stageis permissible all 12 months of their growing cycles (e.g., milking cows require higher protein diet while weaning calves need more calcium to grow body frames, and fattening cattle need higher energy input to gain body weight) in order that optimal growth efficiency be achieved. The bulk livestock feed provides the carbohydrates while the concentrated livestock feed provides the protein, vitamins, trace elements and other necessary supplements that will be required by cattle at various stages of their growing cycles. Our formulas will enhance feed with specific concentrated raw materials (i.e. soya bean, corns and seeds, etc.), such that no excessive raw materials will be wasted and consumed thus producing healthy cattle with maximal efficiency. At the same time this will reduce excessive body fat of growing cattle.
In this respect SJAP has done many tests to show that on average the fattened cattle has around 15 Kg of fat/body weight of 800 Kg if they were not fed with our concentrated Livestock feed, and the fattened cattle fed with our concentrated livestock feed on average has only 6 Kg of fat/body weight of 800 kgyear, which means that saleable net weight gain per cattle is 9 kg because fats are not saleable.
Vertical Integration
Our five year business plan, which started in January 2010 and runs through December 2014 aims to complete the development of all the integrated activities listed below with a view to achieving our marketing plan concept of “From Farms to Plates.”competitive advantage.
Vertical integration for our fishery developmentsThe Bulk Livestock feed: : We intend to have following activities developed to support one another:
l ResearchThe farmers use the bioorganic fertilizer on the soil and development infeed the fishery technologies, growing techniques, management systems, species of aquatic animals that will be grown that will have commercial market niches, breeding stocks that will havegrain to the ability to producecattle and sustain supplies of fingerling (or baby stocks) in commercial scales, feed analysis and formulation, marketing and sales, logistics and transportation of live aquatic animals and other related general information of the industry (e.g., we have established relationships with a number of local professional sub-contractors and entities to carry out the referred duties for the Company).
l Hatchery and nursery farm. For example, we established ZSAPP (or Prawn Farm 2) to service such purpose.
l Grown-out farms. For example, we established Fish Farm 1 and Prawn Farm 1 for the growth of aquatic animals.
l Marketing and distribution networks, e.g., we are developing Wholesale Center 1 and chains of restaurantssheep together with the intention that they will eventually be used as part of our ultimate distribution channels to sell our aquatic seafood. Our vision of our distribution channels consists of sales channels via secondary wholesalers, restaurant and hotel distributors, super market chain distributors and commissioned sales agents. Some of these will be in direct competition to health shops and super market chains, establishments similar to Wholesale Center 1 and the chains of restaurants that we intend to develop for and on behalf of our Chinese joint venture investors.
Vertical integration for our organic beef and cattle business developments at SJAP : We intend to have following activities developed to support one another:
l Research and Development in the enzyme and feed technologies, growing techniques, management systems, breeding stocks, analysis and formulation, marketing and sales, logistic and transporting, and many aspect information of the industry(we have established this activity in house at SJAP).livestock feed. Government tests show:
| l· | ManufacturingAdditional average weight gain per head of organic fertilizer (in operation since 2009).fattening cattle; |
| l· | Cultivating and planting and harvesting of organic crops and pasture (ongoing since 2010).Additional fresh milk is produced; |
| l· | Manufacturing of Bulk Livestock Feed (ongoing since 2010).All feeds are much easier to digest resulting in much cleaner environment in the cattle yards and houses; |
| l· | Manufacturing of Concentrated Livestock Feed (commenced operation since March 2013).No ill effects were recorded due to the Company’s feed; |
| l· | Cattle GrowingAll cattle preferred to eat the Company’s feed and rearing (in operation since 2010). |
| l | Farming corporative (initiated and formed in 2010 and currently we have over 86 members inwere reluctant to revert back to the corporative). |
| l | Slaughtering, deboning and value added manufacturingconsumption of cattle, beef meats and products (that we are developing and constructing starting in January 2013 targeting completion of and starting operation of Phase (1) developmentstheir old feed after they had consumed the Company’s feed during the first quarter of 2014. |
| l | Marketing and sales and distribution networks (that we plan on starting during the fourth quarter of 2013). |
| l | Manufacturing of enzyme (which we intend to start pre-mobilization work within sometimes at the end of final quarter 2013). |
| l | Development of mash gas station to complete our environmental program such that we shall able to recycle all of our cattle waste into raw material for the manufacture of our organic fertilizer and to supply electricity to our regional neighbors within the District of Huangyuan to service our corporate social responsibility.period. |
Information on Marketing, salesThrough an acquired patent,1the fat content of a 24 month-old cattle can be decreased from 18 kg to 5 kg, which improves the quality of the meat and distribution, produces and products:
its yield. The Fishery Sector The Chinese markets prefer and pay premium prices for Live Aquatic animals, and there are many live seafood wholesale markets with hundredsinventor of wholesalers selling live seafoodthe patent is now an equity partner in many Provinces of China supported by well-developed logistics services in road and air transports. As such we currently are selling our aquatic seafood mainly to wholesalers in the wholesale markets at Shanghai City, Southern Coastal Cities and the Guangzhou City which are the more dominant markets.SJAP.
| l3. | Fish Farm 1: We produce Sleepy Cod which is a tropical species growing mainly in the Southern regions of Guangdong Province, and an attractive breed for aquaculture purposes as it is a relatively small fish that grows best in our APRAS and provides “white pieces of fillets with flaky flesh that are suitable to the gourmet taste liked by Asians,” and is similar to that of the much-prized marble or sand goby. It is easy to ship, as it lies motionless in shipping bags, and stacks well in the live fish tanks used in Asian restaurants. Our APRAS system provides ideal environments to grow Sleepy Cod that always have better appearance and shelf-life when they get to the wholesalers with the important advantage of being free from chemicals and pollutants. Therefore our Sleepy Cod are well received and in demand and creating a niche market such that in general our Sleepy Cod are selling at premium prices receiving between 8 to 10% above the daily market averages. |
The Sleepy Cod
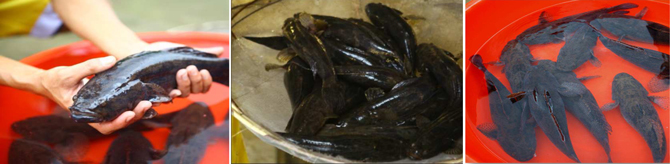
Eels
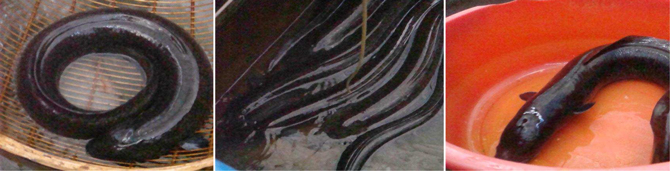
| l | From Prawn Farm 1: Stocking of prawn fingerling (baby prawns of 7 to 15 days old) began during the first quarter of 2013 for growing into marketable sized prawns from count sizes of 90/100 piece/Kg and larger. Larger prawns always demand higher premium prices. There are two varieties being grown; one is the Mexican White Prawns (or shrimp) which is an imported breed grown in water containing approximately 0.5% of salinity and that has a rather sweet flavor and crispy texture that is liked by Chinese consumers; the other variety is a locally bred species that we call the “LawZi Prawn” (its direct English translation is “Big Giant Prawns”) originated from Thailand but now well developed in China. The LawZi Prawns are grown in fresh water and are in high demand in many gourmet kitchens especially so when they are over 50 grams/piece.Feed |
The Mexican White Prawns (or Shrimp)SJAP’s feed division has two types of livestock feeds, namely “Bulk stock feed” mentioned above and “Concentrated stock feed” mentioned below and revenue for fiscal year ended December 31, 2018 was USD 1.52 million or 1.07 percent of the Company’s total sales of goods revenue of USD 141.65 million for the bulk stock feed and USD 8.04 million or 5.7 percent of the Company’s total sales of goods revenue of USD 141.65 million for the Concentrated stock feed in the same period. Gross profit for same division in the fiscal year ended December 31, 2018 was USD 0.82 million, or 3% of and USD 3.56 million, or 13.3% of the Company’s total gross profit in sales of goods of USD 21.65 million for the Bulk stock feed and Concentrated stock feed respectively in the same period.
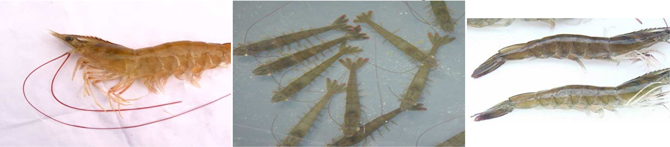
1T1 Enzyme Technology (T1), Patent number ZL2005 10063039.9. The LawZi Prawns (or The Big Giant Prawns) |
| l | From Prawn Farm 2:Up to now it has been developed as a Hatchery and Nursery producing Prawn Fingerling and selling them to the regional prawn farmers. Through June 30, 2013, the Company produced and sold mainly Mexican White Prawn Fingerling (or baby prawns) and will sell the LawZi Prawn fingerling during the third quarter of 2013, having successfully bred the second generation of LawZi brood stock prawns crossed between the wild species and domestic species during the first quarter of 2013. |
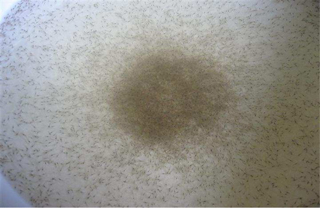 | 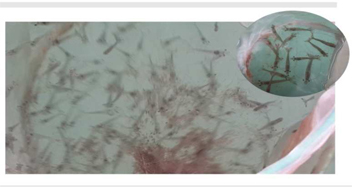 | The 5 days old baby prawns | The 20 or more days old baby prawns |
The Organic Fertilizer, Livestock Feed and Cattle growing at SJAP:Concentrated livestock feed: | l | Currently SJAPis manufacturing organic fertilizer (since 2009), Bulk livestock feed (from 2010), Concentrated Livestock feed (starting March 2013), and has been growing cattle since 2011. |

Organic Fertilizer
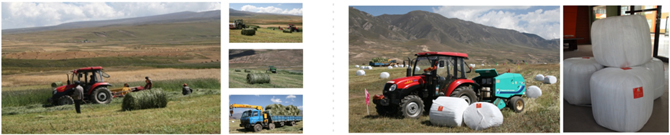
Bulk Livestock Feed
The Organic Fertilizers are sold mainly to our corporative farmers who plant crops and pastures for us that we repurchase to process into Bulk Livestock Feed. Part of this Bulk Livestock feed will be used to grow cattle in our own cattle station and part will be sold to our corporative growers for growing cattle with the remaining part being sold to other regional farmers.
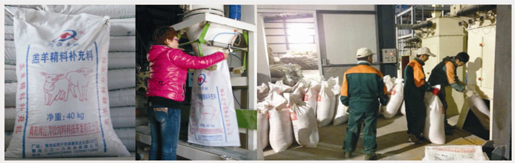
Concentrated Livestock Feed
The Concentrated Livestock Feed (“CLSF”) complements SJAP’s bulk livestock feed to provide the local cattle and sheep farming industry with a unique and completed feed formula that can cater to the growing of cattle and sheep at various growing cycles (e.g., specially formulated mixes with efficient nutrients for dairy cows and sheep, weaning, fattening and mature cattle and sheep). The advantage of the formulated feed combination is that the cattle and sheep growers will realize cost savings in production knowing precisely the amount of concentrated feed that will be needed by their livestock, thus avoiding excess concentrated feed being wasted on over feeding, resulting in worthless excess fat in mature animals. In this respect, the Chinese central government has placed an order with SJAP to reserve annually up to 5000 MT of CLSF as part of the country’s annual reserved emergency livestock feed inventory. From March 2013 onward, SJAP generates additional revenue generated from the sales of CLSF.
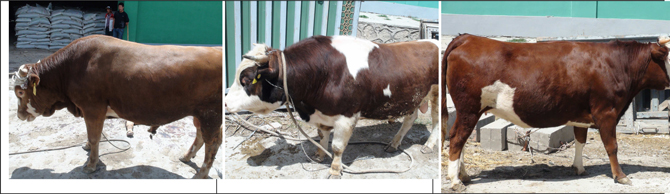
The cattle we grow are primarily Simmental (a common breed introduced to China in the early 20th century), Charolais, and some Angus cattle. In general, we buy 6 to 8 months old cattle when they have established their body frames, then they will be fattened either by us in our indoor cattle stations or by our corporative farmers at their own farms for a further 6 to 10 months until they will reach body weight averaging 700/800 Kg/head and sell them as live cattle to the wholesale cattle buyers. It is because our cattle are well fed and healthy with better meat recovery rates such that we normally get premium prices that are calculated to about 10% above the daily market averages. We also earn between 10 to 12% from buying the cattle back from the corporative farmers and resold to the cattle wholesalers.
SJAP is constructing a slaughter house, a de-boning factory and a value added processing factory that are targeted to be completed and in operation by early 2014. Until such time, there will be no processed or frozen meats marketed and sold. However SJAP is planning on developing its marketing and sales network beginning in the fourth quarter of 2013 based on following marketing plans:
| l | Developing sales offices in main cities of China (starting at Beijing, Shanghai, Changshi and Guangzhou City). |
| l | Initiating and establishing sales with established and reputable first and second tier regional distributors. |
| l | Initiating and establishing sales into first and second tier super market chains either as direct suppliers or as tenants. |
| l | Developing our own chains of butchery shops and outlets using franchising methods. |
| l | Developing our own restaurants based on the concept of our “Bull” restaurant that sells mainly beef dishes that can use up to 85% of a whole cattle instead of the normal 30% used by the most of the top restaurants and hotel caterers. In this respect, the expansion and development of the “Bull” restaurants will be done through franchising methods. |
| l | Developing our own sales teams and personnel to sell and market our meats and products to the first and second tier restaurants and secondary distribution markets regionally. |
Business Overview, Businesses and Progress reports
We introduced our business activity in China in 2006 as an engineering consulting company specializing in building agriculture and aquaculture farms and the developments of related business operation using our expertise and knowhow knowledge in specific agriculture and aquaculture technologies (i.e. our A Power Re-circulating aquaculture system and technology and our cattle growing feeding and caring technology), engineering designs of, and management systems for, indoor and on-land fishery and cattle farms and vegetable farms (based on hydroponic technologies) adaptable to various climate and growing conditions, production of organic, green and natural agriculture produces after having developed many aquaculture fishery farms and cattle farms and related business developments including sales and marketing of produces and products in Australia and Malaysia since 1998.
In 2007 we acquired our first Sino Foreign Joint Venture company in China operating a dairy farm that was sold to our joint venture partner in 2010 followed by the acquisition of JHST (or the HU Plantation) in 2009, the establishment of SJAP (our major cattle growing operation) in 2009 and started the building of our first fishery farm (JFD or Fish Farm 1) in 2010 and continuing until today when we conduct all the activities shown in Table 2 above.
In all these developments we were the master engineers and pioneered the construction and building of farms from bare land into fully operational facilities covering the construction and building of infrastructures, staff quarters, offices, processing facilities, storages, and all related production facilities and their related managements responsible in developing all business activities into effective and efficient operation including all training of personnel.
Our Company is now maturing into a company dedicated to the agriculture and aquaculture industry. We are currently operating the HU Plantation, maintaining our services in engineering consulting, and specializing in the developments of two major products, namely meat derived from the growing of beef cattle and seafood derived from the growing of fish, prawns (or shrimp) and other marine species having niche markets with revenues generating from activities that we divide into five standalone business divisions or units: (1) fishery, (2) cattle, (3) beef organic fertilizer, (4) HU Plantation and (5) Marketing and Trading.
We started our first 5 year business plan in 2010 aiming to develop the concept of “From Farm to Plate” that would be supported with the vertical integration and services defined above.
Below is a summary of our operational and/or developing stage business activities carried out by our existing or newly formed subsidiaries.
| 1. | Fishery Division operated by Capital Award Inc. (“CA”) |
CA generates revenues from two main activities: “Engineering and Consulting Services” and “Marketing and Sales of Aquatic seafood” described below:
Engineering and Technology Services via Consulting and Service Contracts (“CSC’s”) for the development, construction, supplies of plants and equipment and management of fishery (and prawn or shrimp) farms and related business operation.
CA has entered into numerous CSC’s; their information and status are shown in the table below:
Notes to the developments in progress:
Name of the developments | | Location of
development | | Land area or Built up
area | | Current Phase &
Stage | | Commencement
date of development | | (Estimated)
development's
completion date on or
before | | Contractual amount | | % of completion as at
30.06.2013 | | | | | | | | | | | | | $ | | | Fish Farm (1) | | Enping City | | 9,900 m2 | | fully operational | | July. 2010 | | Jun-11 | | $5.3 million | | Fully operational | | | | | | | | | | | | | | | | Prawn Farm (1) | | Enping City | | 23,100 m2 | | 2 phases | | Phase 1 on June 2011 | | Phase (1) on December 2012 | | $11.6 million | | Phase (1) in operation | | | | | | | | | | | | | | | | Fish Farm (2) "The Fish & Eel Farm | | Xin Hui District, Jiang Men. | | 33,000 m2 | | 3 Phases | | Phase 1 January 15, 2013 | | Phase 1 June 2014 | | 14.9 million | | 35% | | | | | | | | | | | | | | | | Prawn Farm (2) The Hatchery & Nusery & Grow-out prawn farm | | San Jiao Town, Zhong San City, | | 120,000 m2 | | 2 phases | | Phase (1) and Phase (2) May 2012 | | Phase (1) Dec. 2012 and Phase (2) December 2013. | | Phase (1) $8.5 m and Phase (2) 8.67 Million | | Phase (1) fully operational and Phase (2) 65% |
(a) | Phase 1 development work on a prawn hatchery and nursery farm (Prawn Farm 2) with Zhongshan A Power Prawn Culture Development Co. Ltd. (“ZSAPP”) (a proposed name of this future SJVC), where the Company owns a direct 25% equity interest, was completed in May 2012. Prawn Farm 2 has generated income since May 2012. Phase 2 development works involves development of facilities for the production of prawns, brood stock, and associated expansion activities that were commenced in May 2012 and are expected to be completed during 2013. The work that has occurred during the second quarter of 2013 includes the development of: (i) an additional indoor prawn nurturing apartment, (ii) three brood stock open dams with all under-ground in built filtration systems that is capable of holding up to 3,000 mother prawns at a time, (iii) all external fences of the farm, and (iv) two open dams with all in built filtration systems that has the capacity to grow out up to 12 MT of fish per year and all associated infrastructure. |
(b) | The development work on the fish and eel farm (Fish Farm 2) with an unrelated entity, Gao A Power Fishery Development Co. Ltd., is still in progress. The project is delayed because the property is situated on an inlet and drainage is extremely difficult to resolve and costly to fix. We are engineering a solution that should resolve this problem. As of the date of this prospectus, our engineering solution involves a semi-open dam and semi-enclosed farm concept built with groups of independent filtration and water recirculation systems that are suitable for the growing of prawns, fishes and/or eels in this farm. We are dividing work flow into phases and stages of work to yield the optimal financial efficiency and benefits. As of June 30, 2013 the revised development plan was finalized; as such the associated infrastructural work is anticipated to commence during the third quarter of 2013. | | | (c) | The development work on a prawn farm at Huanyuan County, Xining City (Prawn Farm 3) is for an unrelated third party Chinese investor, Wu Aquaculture A Power Development Co. Ltd. (a proposed name for this future SJVC) originally planned to be on SJAP property. All engineering design and related pre-development work has been completed, with original plans to begin construction and infrastructure work in May 2013, after the winter season. However, management decided in February 2013 to relocate Prawn Farm 3 to another block of land adjacent to SJAP’s existing property consisting of a much bigger area to accommodate future expansion whenever necessary. This relocation will require the approval of local authorities, resulting in a delay and a new time schedule dependent on the approval by authorities and the said approval is still in progress as of June 30, 2013. | | | | | |
Pictures showing Fish Farm 1
Views of the Fish Farm 1 complex situated on 9,900 m2 of land in district of Enping City. It is a fully self-contained complex showing as one of typical development models being developed in China.
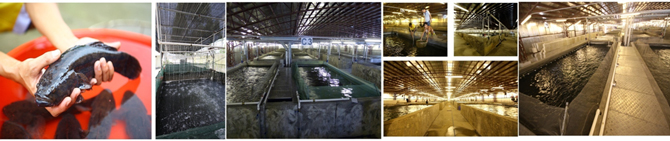
The farm has 16 grow-out APM tanks growing fish in-door and on land with the capacity to grow-out over 1,000 MT of fish/year
Pictures showing Prawn Farm 1
Situated in the district of Enping City on 26,100 m2 of land is our Prawn Farm 1 with a capacity to grow-out 250/300 MT of prawns/year and again is contained in a fully self-serviced complex with office, staff quarters, laboratory, dried and cold storages, stand-by generators’ room, heating rooms, water storage and tanks, landscaping gardens etc.
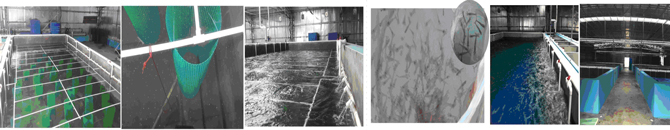
The plastic netting rolls are designed to provide shelter for the prawns and thus to increase the grow out capacity of the tanks.
Pictures showing Prawn Farm 2
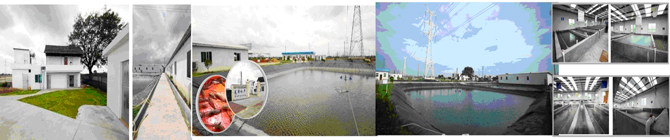
Prawn Farm 2 has a much bigger land bank of 120,000 m2 because apart from its core function of being the hatchery and nursery operation to supply quality prawn fingerling, the farm is now developing open grow-out dams that have built-in RAS filtration systems to save on water consumption as well as to provide cleaner water aimed at reducing the impact of pollution.
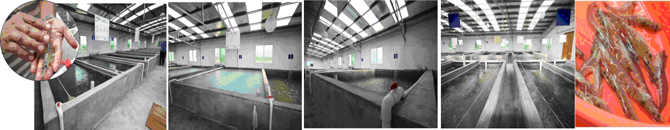
The tanks in the picture are nursery tanks. Each tank has the capacity to nurture up to 10 million prawns every 5 days per 30 cubic liters (or 30 MT) of water. Prawn Farm 2 is also built as a fully self-contained complex with all associated facilities.
Marketing and Sales of aquatic seafood:
CA is the sole marketing, sales and distribution agent of the Re-circulating Aquaculture System (“RAS”) fishery and prawn (or shrimp) farms, such that it purchases all marketable sized fish and prawns (or shrimp) from the farms and in turn sells them to the wholesale markets and at the same time supplies the farms with fingerling, baby or adult fish or prawns and stock feed.
Our RAS farms do not produce enough fish or prawns to warrant the establishment and sales of value added processing products or facilities given that the Chinese markets pay the best prices for live fish and prawns. Therefore, currently CA sells only live fish and prawns.
In this respect, CA generates revenues from the sales of seafood brought from farms that are either a subsidiary of the Company or an incorporated project company and contracted growers in the manner described below:
Fish Farm 1: JFD is the owner and operator of Fish Farm 1; the Company presently owns a 75% equity interest in JFD.
The Fish Farm 1 complex represents our typical model of developments and is built on a block of land measuring 9,900 m2 containing staff quarters providing accommodation for up to 15 workers, a self-contained office, a laboratory, external live bait holding tanks, all season red worm nurturing tanks, dry and cold storages, workshops, processing facilities, a heating room, 500 MT of water holding tanks, landscape gardens, standby generator and rooms, all related underground and on land infrastructure and a fish grow-out farm of 4,000 m2 that has all associated facilities to support 16 RAS tanks with each tank measuring 10 meter (m) x 10 m x 3 m in depth holding up to 240,000 liters (or 240 Metric Tons (MT) of water and has the production capacity to grow up to 80 MT of aquatic animals per year depending on its stocking cycles (or frequency of stocking of fish) and the initial size of the fish being stocked at each cycle. In other words, if the initial stocked fingerling is around 30/40 mm per fish, then it will take over 12 months to grow the fish into a marketable fish (averaging over 500 gram/fish) such that its annual production is only up to 30/35 MT/tank; however if the initial fish being stocked are at an average of 200 to 300 grams each then its stocking and harvesting cycle is 4 times per year, enhancing annual production capacity at up to 80 MT/tank. Initially, Fish Farm 1 was designed to grow sleepy cod, which had a niche market with most attractive prices in Chinese markets.
However, sleepy cod does not have a large market share in China compared to the carp species. Our market research of the sleepy cod market size in 2012 shows that total annual domestic production is about 25,000/28,000 MT distributed to more than 100 wholesale markets throughout many provinces, with the markets at Guangzhou City, Southern Coastal towns of Guangdong and markets in Shanghai City comprising the dominant markets. From the time we started stocking sleepy cod in 2011 until the end of year 2012, live sleepy cod constituted a niche market in China and sold at wholesale for an average price of US$27/Kg until the cheaper imports from other Asian countries were permitted to be imported to China at a low tariff starting in January 2013, such that the wholesale prices fell sharply to an average of US$15/Kg. We mainly had fed live bait fish to our baby sleepy cod (250 to 300 gram each) that we bought from our contracted suppliers at around US$5/fish grown at average feed to weight gain conversion rate of 2.5 Kg of live bait to 1 kg of weight gained. As such, when we purchased our supplies of live bait at an average of US$1.65/Kg, and low mortality rate at the average below 8% coupled with our recorded 3.5 stocking and harvesting cycles per year, Fish Farm 1consistently achieved good sales revenues with gross profit margin of 50/55 % in 2011 and 2012. However its gross profit margin fell in 2013 to between 35/40 % while the cost of supplies of baby sleepy cod and live bait fell correspondingly by an average of only 10%.
In this respect and in mitigating such situation, during the first quarter of 2013 we stepped up the modification of our RAS tanks to adapt to the growth of eels with 4 tanks and prawns (or shrimp) with 8 tanks and the expansion program in the Research and Development Station to accommodate the nurturing of Flower Pattern Eels’ fingerlings to grow into adult eels (of 500 gram/eel and upward) that would be supplied to Fish Farm 1 to grow the adult eels into marketable sized eels (around 1.5 kg/eel and larger) which at present are selling at high prices between US$27/28 per Kg. Fish Farm 1 is now stocked with and growing Flower Pattern eels, prawns and sleepy cod.
Prawn Farm 1 (or EBAPCD) : EBAPCD is the proposed name of the future SJVC (subject to approval by relevant Chinese authorities under our application for SJVC status), established to own and operate Prawn Farm 1. EBAPCD will generate revenue starting during the third quarter of 2013. Capital Award will recognize income from purchases of prawns from Prawn Farm 1 and selling them to the wholesale markets.
On April 22, 2013, we placed our first 500,000 (Mexican White) prawn fingerling in Prawn Farm 1, and as of the date of this prospectus management reported that prawns are meeting growth benchmarks with low mortality reaching around 15 cm/prawn in size. The Company believes that its Prawn Farm 1 represents the first indoor RAS prawn farm in Asia. Going forward, Prawn Farm 1 will carry out its rotational stocking and harvesting program targeting to produce between 250/ 300 MT of live prawns in 2013.
We have seen a rapid increase in live prawn prices in the first quarter of this year (averaging 100% increases in prices compared to the corresponding period last year) with current wholesale price averaging US$15/Kg for size of 80s (equivalent to 80 to 90 pieces of prawn/Kg), and prices going up proportionately to sizes of Mexican White prawns, and at a premium rate for popular, but rarer species (e.g., our big giant prawns, Green Prawn, Banana Prawns and Tiger Prawns). The average time required to grow prawns (of Mexican White Species or Big Giant Prawns) from 14-day old fingerlings to marketable sizes in commercial scale at the Prawn Farm 1 under our RAS system is estimated conservatively between 60/70 days, 90/100 days and 120/130 days for sizes of 80s, 60s and 40s, respectively. We believe, but cannot assure you, that we should be able to reduce this estimated grow-out period under our RAS system since the said grow-out period was calculated from and based on information of open-dam prawn farms as we do not have any conclusive commercial grow-out statistic being recorded at Prawn Farm 1 yet. However, we are confident that we shall be able to experience a much lower mortality rate, between 10/20 %, compared to the 50/60% at the open-dam farms.
Prawn Farm 2 (or ZSAPP) : ZSAPP is also an intended name of the future SJVC (subject to approval by relevant Chinese authorities under our application for SJVC status), established to own and operate Prawn Farm 2. ZSAPP has been generating revenues since May 2012. However, ZSAPP’s financial statements will not be consolidated with ours until approval of this SJVC is formalized, and one of our subsidiaries acquires a majority equity interest therein. However, Capital Award recognizes income from commissions earned from ZSAPP’s sales of prawn fingerling to regional growers who constitute its sole marketing and sales agent.
ZSAPP has been successful during the first two quarters of 2013, producing LawZi Prawn (or the Big Giant Prawns) fingerling from the 5,000 pieces breeding stock that were imported from South-East Asian countries. By the second quarter of 2013, the reproduction of the Big Giant Prawns fingerling had become consistent; consequently, we intend to market the Big Giant Prawn flies beginning during the third quarter of 2013 together with the Mexican White fingerling which constituted our main sales in 2012. During the past two years, our research confirmed that the demand and prices of the Big Giant Prawns in the local domestic markets were high (at between RMB450 to 550/10,000 flies in 2012) because supplies of quality Big Giant Prawn fingerling is fairly low compared to Mexican White (at averaged price between RMB150 to 170/10,000 flies in 2012), due to problems of inbreeding. As such, we expect high demand for our Big Giant Prawn flies by the regional prawn growers as they will be the offspring from our 2nd generation breeding stock free from inbreeding problems.
Fish sales generated from purchases with other open-dam growers contracted by Capital Award. Capital Award has been contracting with local aquaculture farms to grow sleepy cod since 2012 to present based on a fixed production cost, with recently added eel growing contracts commencing in the first quarter of 2013. There are existing contracts that will provide up to 800,000 pieces of sleepy cod and 600,000 pieces of eels to be sold by Capital Award between 2013 through the early part of 2014. However, Capital Award is exploring similar new contracts consistent with local reliable growers who meet our quality standards targeting to increase its fish sales revenue whenever the opportunity presents itself.
| 2. | The Beef Cattle business of MEIJI: |
Similarly to CA, MEIJI has two sources of revenues, its Engineering and Services revenues and its marketing and sales of cattle;
2.1. Engineering and services revenues . These revenues are generated from the Construction and development of Cattle Farm 1 and Cattle Farm 2.
The MEIJI table below shows the latest status of their developments:
Name of the developments | | Location of
development | | Land area or
Built up area | | Current Phase &
Stage | | Commencement
date | | Estimated
completion date
on or before | | Contractual amount | | % of completion as at
30.06.2013 | | Cattle Farm (1) | | LiangXi Town, Enping City | | 165,013 m2 | | 2 phases | | Apr-11 | | Dec. 2011 | | $4.17 million | | 100 | % | Cattle Fram (2) | | LiangXi Town, Enping City | | 230,300 m2 | | 2 Phases | | Feb. 2012 | | March. 2014 | | $10.6 million | | 65 | % | Cattle Farm (1) external road work | | LiangXi Town, Enping City | | 4.5 Km road | | One Phase | | Sept. 2012 | | March. 2013 | | $4.32 million | | 100 | % | Cattle Farm (2) External Road work. | | LiangXi Town, Enping City | | 5.5 Km Road | | One Phase | | Sept. 2012 | | March. 2013 | | $5.28 Million | | 100 | % |
Enping is situated in the Southern part of China with a semi-tropical climate, and the cattle farm is operated based on our semi-free ranged growing and management system that allows the cattle to roam around and feed in our pasture fields during the mornings and be kept and fed with our formulated aromatic feed in our semi-opened cattle houses during the hot days and nights. This is an entirely different agricultural environment than that of SJAP in Huangyuan, Xining, which has bitterly cold and long winter seasons and where all cattle are being grown in fully insulated cattle houses. The 2012 experience of the JHMC farm showed that the growth rate of the cattle in this environment is faster than at SJAP (averaging 1.78 Kg/day/head in weight gain compares to SJAP’s 1.5 kg/day/head). However Cattle Farm 1 showed higher mortality rates than SJAP (recording 5% in Cattle Farm 1 compared to 0.25% in SJAP). The reason for the higher mortality is due mainly to the change of climate, as Cattle Farm 1 has to buy young cattle from farms situated in the cold Northern part of China where they have ample supply of young cattle at lesser costs, but which require over 3 days of transportation, such that some of the weaker young cattle could not adapt to the hot climate of Enping and thus could not recover from the journey. To avoid the repetition of this high mortality rate, Cattle Farm 1 is building additional semi-open cattle houses that are equipped with cooling systems as temporary depots to receive the young cattle and to nurture them back to health before they are grown in our normal cattle houses. The other differential aspect between Cattle Farm 1 and SJAP is in the management of environmental impact; SJAP is going to build a mash gas station (estimated by the year end of 2013) to manage all of its cattle waste into electricity with its residue recycled as raw material used in its manufacturing of organic fertilizer, whereas in Cattle Farm 1, the cattle waste is being kept in septic wells that is treated with our enzyme under fermentation process, and then is channeled to fertilize our pasture fields at the farm. JHMC’s waste treatment program is sufficient for the time being as it has enough pasture fields to absorb the waste yielded from limited number of cattle (up to 500 head) being grown on the farm, however as the cattle number increases to a point where it could exceed the fields’ fertilizer absorption capacity, an alternative environment treatment plan must be implemented in order that this JHMC farm can grow more cattle.
Cattle Farm 2 will be complementary to Cattle Farm 1 having an additional 76 acres of land suitable for growing our type of pasture (a cross between Elephant and Yellow grass) that has a very high yield rate of over 35 MT/1/6 acre/year, and contains an average of over 9% protein that is very suitable for consumption by cattle. Between the two farms, under normal seasons, they have a capacity to produce up to 30,000 MT of pasture/year collectively that is capable to feed up to 5,000 head of cattle/year based on the consumption rate of average of 6 MT/head/year if the environmental issue mentioned above is resolved properly.
By the end of February 2013, the Company had completed the external road works of about 10 Km leading from the outer-boundary access road to and surrounding the two farms. The development cost of this road was shared at the ratio of 2/3 by Cattle Farm 1 and 1/3 by Cattle Farm 2. This all season road was constructed at the request of the district village committee of Enping City, enhancing corporate social responsibility in our development of the two cattle farms.
Pictures showing Cattle Farm 1
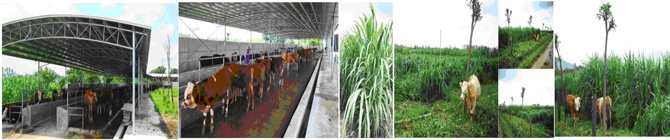
This is our Cattle Farm 1 which was built as a demonstration farm to show that cattle can be raised in a semi-tropical climate using our Semi-grazing and housing method that we call “Semi-free growing” management system” where the cattle are allowed to graze in the field during the early morning and kept indoors and hence away from the hot sun during the hot summer afternoon. So far this method has been proven applicable with the growth rate of the cattle measured slightly better than the cattle at SJAP (i.e., averaging some 0.28 kg/day/cattle better).
2.2. Marketing and sales of live Cattle by MEIJI: Similar to CA in its model of operation, MEIJI purchases fully grown cattle from Cattle Farm 1 and sells them to the cattle wholesalers and brings young cattle from other farmers and sells them to Cattle Farm 1.
All cattle farms developed by MEIJI will be using its “Semi-free growing” management systems and aromatic-feed programs and systems to raise beef cattle.
Beef is traditionally a niche market in China, as it is sold mainly by expensive restaurants of upmarket hotels rather than in the homes of China’s consumers. This situation is rapidly changing owing to urbanization and rising incomes, the rising demand for a high protein diet, and the rise in restaurant dining due to work demands.
Our free range cattle grown in the Enping farms are fed with natural pastures, concentrated livestock feed and our Aromatic Feed that contains Chinese herbal plants specially designed to improve animal health such that these Enping farms produce healthy cattle and in turn quality meat. Although we cannot have them certified as pure organic meat yet because we cannot get certification from suppliers of the raw materials used to make our concentrated feed purely organic, we believe that we are not far away from being qualified to obtain 100% pure organic meat certification.
The Enping cattle farms are situated in Guangdong Province, which is not a traditional cattle growing country due to its tropical climate. Most cattle and beef supplies are imported from the Western and Northern Provinces at higher costs entailing higher wholesale and retail prices in Guangzhou City and in its urban cities, which provides marketing advantages for our cattle sales within the region.
Moreover, our 2012 sampled meat trials carried out with a number of reputable restaurants and hotels in Beijing City were well received with constant requests for us to supply them on a long-term basis. Our strategy is to ensure we can supply the quantity to maintain consistently sustainable supplies as required by our customers. At Enping cattle farms we will grow at least 1,000 head of mature cattle in 2013, which is the minimum number required to sustain the supplies to just a couple of restaurant chains.
According to the China Federal Agriculture Quarterly Report of 2011 the consumption of beef was over 6.48 million MT, 10% of which were premium cuts. Our planned 1,000 head of mature cattle in 2013 will yield approximately 375 MT of meat, which is a tiny fraction of the total market share indicating significant potential for growth in the future.
Cattle Farm 1 is doing well and on target having sold, during first half of this year, over 630 heads of mature cattle grown collectively from the stocked six months old calves and the 12 months yearling cattle brought in January and May of 2012, respectively. Out of the total sales of cattle during the first six months of this year, on April 22, 2013, 180 heads of matured beef cattle had been transported to Beijing City to be sold to one of the wholesalers specializing in supplying quality beef meat to top hotel and restaurant chains.
Under a joint venture with a group of businessmen (the “Joint Venture”), we started the setting up of a Cattle Station and related facilities on a block of leased land measuring about 130,000 m2 within the Central Cattle Market and Facility of Beijing City (that we call “The Beijing Cattle Farm”) to act as an intermediate house aiming to house and to grow our Aromatic beef cattle and to sell together with our Aromatic Cattle from Cattle Farm 1 through regional distributors and in turn to some of the top hotels and restaurants chains in Beijing City and also through wholesale shops that the Joint Venture intends to develop. In this respect, the development of wholesale shops fits in well as part of our interstate wholesale and distribution development plan that we mapped for some of the big cities in China, and this one in Beijing City will see the beginning of such plan being put into motion. By July 31, 2013, the Joint Venture established one small wholesale shop within close proximity to the Beijing Cattle Farm and started sales of our beef meats regionally. The Joint Venture Agreement has not been finalized; consequently, the Joint Venture is currently based on a verbal understanding only.
Pictures Taken in July 2013 showing the Beijing Cattle Farm and the Small Wholesale Shop.
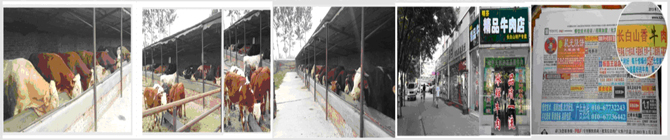
| 3. | SJAP and HSA Division in fertilizer, livestock feed and cattle: |
We have two operations in this division spread over two provinces in China, consisting of the following:
3.1 Operation 1. Operation 1 is operated from Huangyuan County of Xining City, Qinghai Province, by SJAP, a majority owned subsidiary of the Company incorporated in China in 2009. As of the date of this prospectus, SJAP’S principal activities that are generating revenues comprise: (i) manufacturing and sales of organic fertilizer, (ii) manufacturing and sales of livestock feed, and (iii) rearing and sales of beef cattle. On February 28, 2013, SJAP completed its development of the Concentrated Livestock Feed Manufacturing Factory(“CLF”) manufacturing factory, and started the production and sales of Concentrated Livestock Feed (“CLF”).ThisCLF. This CLF complements SJAP’s bulk livestock feed to provide the local cattle and sheep farming industry with a unique and completed feed formula that can cater to the rearing of cattle and sheep at various growing cycles (e.g., specially formulated mixes with efficient nutrients for dairy cows and sheep, weaning, fattening and mature cattle and sheep). The advantage of the formulated feed combination is that the cattle and sheep growers will realize cost savings in production knowing precisely the amount of concentrated feed that will be needed by their livestock, thus avoiding wasted excess concentrated feed being wasted ondue to over feeding, resultingwhich results in worthless excess fat in mature animals. In this respect, the Chinese central government has placed an order with SJAP to reserve annually up to 50005,000 MT of CLF annually as part of the country’s annual reserve emergency livestock feed inventory. Thus, fromsince March 2013 onward, SJAP expects to havehas generated additional revenue generated from the sales of CLF.
The fertilizer, bulk livestock feed and cattle divisions under SJAP contributed 3%, 2% and 10% of the Company’s total revenue and 3%, 2% and 5% of the Company’s total consolidated gross profit, respectively, in 2012 derived from the production of about 4,500 head of mature cattle (between 15 months to 18 months old) fromsells its own cattle houses and the co-operative growers, collectively, 25,000 MT of organic fertilizer, and 22,000 MT of bulk stock feed.
Our strategy is to increase the number of co-operative growers and obtain more internal cattle houses and thus to attempt to double the volume of production of mature cattle during 2013, which would in turn increase the demand for the production of fertilizer and bulk stock feed to grow in tandem. The cost of rearing cattle is expected to be lower as a result of concentrating efforts on manufacturing and/or selling livestock feed. The regional farmers are contracted to grow crops and pasture for us using our land that has been provided lease-free by the local Government or by using their own land, use our equipment for their planting and harvesting, are provided supervision and associated services from us, as well as seeds and organic fertilizer. These items are provided to them on credit, which are then charged against their account when the Company purchases the crops and pasture grass from them in return. Regional farmers also raise cattle for us using our bulk livestock feed under the same credit terms and conditions described above. That is, when the Company purchases the mature cattle from them, their accounts are charged for the feed against the amount paid.
The cattle we grow are primarily Simmental (a common breed introduced to China in the early 20thcentury), Charolais, and some Angus cattle. In general, six month old cattle are sold to local farmers, and we commit to repurchasing the cattle when they are between 15 months to 18 months old.
We also rent cattle housing to farmers, and will provide slaughter and deboning services to them once our abattoir and deboning facilities are completed in 2014.
Beef is distributed through wholesalers and through our own or developed restaurants as described elsewhere in this prospectus. SJAP intends to add sheep farming during 2013 and value added product processing (including abattoir and deboning facilities in 2013 and a value added processing facility in 2014), and aims to, but cannot assure you that it will, expand its steakhouse restaurant “BULL” into a franchisee style chain of 50 outlets over time, whereas currently the one and only “Bull restaurant is to act as SJAP’s first demonstration model converted from one of our old cattle houses situated next to our newly renovated cattle houses at SJAP’s complex. This one Bull has over 130 seating capacity and since its commencement of business operations it is now becoming a popular dining of the locals, having achieved sales of just over $420,000 in year 2012 with net profit of just over $50,000 (or netting about 12%) which is a very small contribution to the Company’s consolidated revenues and profits. However as SJAP’s first demonstration model it has served the purpose.
Overall, SJAP expects that revenues from operations will increase as a result of the addition of further herds, and of comprehensive value added processing and marketing facilities. SJAP sells its organic fertilizer and bulkconcentrated livestock feed mainly to its corporative and regional farmers in addition to using it to rear its own grown cattle, but because its geographic location is so far away from other major provinces there are high costs associated with selling its fertilizer, bulk and concentrated livestock feed and live cattle other than to local purchasers; conversely,purchasers. Conversely, equivalent imports from other provinces must be madepurchased at a higher cost, which providesproviding SJAP with a competitive edge. Further,Furthermore, Qinghai Province is a region rearing a million headmillions of cattle and sheep per year, providing an ample market for SJAP’s fertilizer and livestock feed.
| 4. | Value Added Processing and distribution (VAP)(This division is now a discontinuing operation having disposed QZH in 2017). |
Our strategy includes building
The Company is constantly looking and owning our own abattoir and boning roomanalyzing various optional business plans to enhance SJAP’s operation with improved financial performances, yet at present there is no plan has been finalized. | l | Recapping information of disposal of QZH that was reported in our 10K 2017 . |
| (i) | The live cattle division |
The average price paid to cooperatives for their fattened cattle is RMB50/Kg or RMB4/kg above average market prices, whichever is higher. A commitment by SJAP to the cooperative farmer to exercise its option to purchase cattle is made well in 2013 andadvance to lock-in the value added processing facilitiesprice before other buyers step in 2014, meaning that the distribution of our value added beef products to other provinces and main cities will become feasible as we improve our economies of scale to mitigate cost of transportation being charged on net meat weight instead of live cattle weight, and also exploitto obtain the lower production cost and leverageproducer’s commitment to raise its cattle based on SJAP’s quality standard for purchase. Again, if the quality of our fully integrated operation and benefit from high sale prices due to its higher meat quality. SJAP is making progress with the required merit credentials in China to become a certified China Dragon Head Business, which is a prestigious certification grantedcattle raised by the Governmentcooperative does not meet SJAP standards, then there is no purchase obligation on SJAP’s part to businesses demonstrating corporate social responsibility (“CSR”) by 2014, frequently leading to additional governmental grants and other forms of assistance. Qinghai Province has bigger numbers of ethnic minorities receiving proportionately higher grants, incentives, assistances and subsidies fromcarry out its commitment. Over the past few years until Q3 2015, when the Government andrelaxed its beef import policy, SJAP hashad generated good profit margins working under this arrangement. Since then, profit margins have steadily been well supporteddepleted, such that by the Government duemid-2017 if SJAP had continued to our CSR. In line with the focus on food security and managing the imbalance between rural (i.e., agrarian) and urban communities, this development will only enhance SIAF’s niche market position.
In the longer term, we believe that wholesale prices of SJAP’s fertilizer and bulk livestock feed will maintain a steady growth rate of 5% to 10% per annum influenced mainly by rising labor cost of the country. Further, we expect a trend of continuous increases in beef and cattle prices given the increase in demand for quality beef and beef products (including value-added products) in tandem with the rise of living standards in China, the short supply of quality breeding stock that will be required to produce enough cattle to satisfy the increased demand and the Government’s stringent restrictions placed on imported cattle and beef meat from many developed nations due to disease and quarantine control measures, all of which will influence the price rise in cattle and beef meats in China.
In 2012, we have seen the wholesale prices ramp up from an average of RMB 16/Kg for live cattle and RMB 36/Kg for beef meat in January 2012 to an average of RMB 32/Kg of live cattle and RMB 55/Kg of beef meat at the end of February 2013, representing a rise of 100% in live cattle and 53% in beef meat prices. We do not expect prices to rise continuously at such a rate, but it is reasonable to assume rate increases to be between 10% to 15% per year for the next three years.
Progress reports:
Additional revenues are being generated from our newly built Concentrated Livestock Feed (“CLF”) factory. This factory is designed with an annual production capacity up to 60,000 MT, and it had produced and sold over 10,000 MT of CLF at an average price of RMB 2,600/MT (or US$419/MT) for the period of six months ended June 30,2013.
Work on the construction of all 29 cattle houses and related facilities is progressing and targeted for completion during 2013 (from our present 12 cattle houses) that will have the capacity to house up to 2,500/3,000commit buying additional heads of cattle at any one time. Collectively, thesefrom the cooperatives, it would have resulted in continuous operating losses for SJAP in 2017 and 2018 estimated to total $46.75 million (cumulative) based on an average market loss of RMB11.5/Kg (or $1.75/Kg), excluding other operating expenses. This alone had provided incentive for the Company to decide on what its alternatives were to sustain (and absorb) such losses, which for all intents and purposes was not an option considering current cash flow issues with the Company.
The local Government has been working with SJAP to develop a long-term plan to help ameliorate the problem faced by SJAP as well as other cattle houses willthroughout the region, yet the timeframe that appeared necessary to carry out a solution would also mean incurring more losses without the means to cover those losses in the meantime. What has been decided between SJAP and its investors, including SIAF, and the local Government in the interest of its stakeholders was the following solution: | 1) | The local Government was able to work out an agreement with cooperatives to have them accept a portion of the loss they incurred in 2017 and the losses they have already incurred preparing for 2018 resulting from SJAP no longer being capable of making do on its commitment to purchase. |
| 2) | SJAP agreed to pay the cooperatives a deeply discounted portion of its commitment/obligation to them at an average price of $800/head, about one-third of the out of pocket cost typically paid cooperatives in exchange for release from its commitment to purchase, which totals a one-time cost of $17.75 million. When compared to the estimated cumulative total loss to be incurred of $46.75 million in 2017/2018 due to SJAP’s lock-in commitment to buy, the estimated amount of out of pocket loss to SJAP is estimated to be reduced by about $30 million. |
Also, consideration had to be able to rear up to 6,000 heads of marketable sized cattle annually (estimated at average weight of about 750/800 Kg per head) based on a six months rotational stocking and sales program growing from cattle averaged at 350/400 Kg per head. SJAP’s intention is to lease part of the cattle housesgiven to the corporative growers to grow their own cattle, with SJAP supplying them with feed and associated services in veterinary, management and marketing of their grown cattle. Apart from this cattle house operation, SJAP will continue to promote its concept of the corporative growers in tandem with the increase of productivity of its livestock feed. We cultivate an additional 1,500 acres of land, for a total over 6,500 acres of land that will be harvested in 2013. All of this land was granted rent-free to SJAP by the local government.
We saw an increase in demand for our organic fertilizer this year resulting in doubling shift work at SJAP’s fertilizer factory since mid-Februarycost being incurred to meet the salesnew regulations implemented by the Central Government on slaughterhouse operations, which license is currently held by QZH. Currently, it’s estimated that having both the funding and slaughterhouse operations underway meeting these new standards will take approximately 2 years to materialize; again, another source of 30,000 MT for 2013.
SJAP received a business permit from the Chinese authorities on April 17, 2013, and construction commenced on April 21, 2013 on the abattoir, de-boning factory, and related packaging facility. Since it is rare and difficult to obtain a permit for an abattoir facility in China, having this facility is expected to become a very valuable asset.
The construction of our enzyme factory is targeted to start during the third quarter of 2013 and the construction of a Mash Gas station is targeted to start during the fourth quarter of 2013.These are essential supporting activities to recycle our cattle wastes toincome that would be applied as raw materials for the manufacturing of our organic fertilizer and to further extend our Corporate Social Responsibility to provide free electricity to the regional district within close proximity to our existing complex. In this respect, the Government agreed to provide a grant of up to US$2 million to cover part of the development cost of the Mash Gas Station.completely curtailed until slaughterhouse operations were back online.
Pictures showing SJAP’s operationTaking into consideration and complexweighing its options, SJAP decided to eliminate any additional losses being incurred through QZH and has decided to discontinue QZH operations with the understanding that if favorable market conditions were to reoccur as well as the slaughterhouse license reinstituted in addition to Governmental assistance in developing a long-range plan being implemented that consideration will be given to resuming QZH operations in the future.
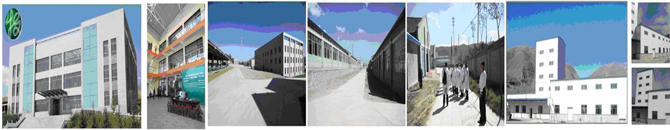
NET LOSS FROM DISPOSAL OF A VARIABLE INTEREST ENTITY | (a) | Net loss from disposal of a variable interest entity, QZH |
| Cash and cash equivalents | | $ | 17,060 | | | Inventories | | | 4,567,530 | | | Prepayments | | | 2,692,571 | | | Accounts receivables | | | 16,403,731 | | | Other receivables | | | 1,855,971 | | | Plant and equipment | | | 3,888,987 | | | Intangible assets | | | 2,870 | | | | | | 29,428,720 | | | Less: Accounts payable | | | (7,140,439 | ) | | Other payables | | | (5,811,425 | ) | | Short term borrowings | | | (1,530,456 | ) | | Non-controlling interests | | | (5,082,410 | ) | | Accumulated exchange difference | | | (498,347 | ) | | Net assets and liabilities disposed as of December 30, 2017 | | $ | 9,365,643 | | | | | | | | | Satisfied by: | | | | | | Cash consideration | | $ | - | |
Under the arrangement of the disposal agreement between all parties, it was agreed to that: • SJAP is no longer liable and responsible for the liabilities of QZH. • If any profit will be derived from the sale of existing fixed assets of QZH, 50% of any gained profit will be paid to SJAP with SIAF receiving its proportional share of the proceeds. • There will be an annual royalty fee paid by QZH to SJAP/SIAF calculated at 25% of QZH net income over the next 3 years beginning January 1, 2018, if operations were to be reinstituted within this period. • Also, if QZH operations were to resume under the Government’s plan to establish QZH as a regional hub for beef processing, value-added production, etc. within the next 3-years, an option to buy up to 25% equity of QZH at its fair book value (net of the loss incurred from disposal) would be made available to the Company or its nominee, on or before December 30, 2020. Taking into consideration all issues related to the ongoing losses incurred by QZH, the Company believes that its support in favor of QZH’s disposal is the best option for its shareholders at this time foregoing incurring further and greater losses from QZH while leaving the door open to reinvest in QZH if, and when, the larger issues are resolved and the regional beef hub plan is able to be implemented. Organic Fertilizer (HSA) division The Corporate office building,Organic fertilizer (HSA)’s revenue generated in fiscal year ended December 31, 2018 was USD 9.67 million, or 6.86%, of the Cattle Station andCompany’s total sales of goods revenue of USD 141.67 million in the concentrated livestock feed manufacturing factory 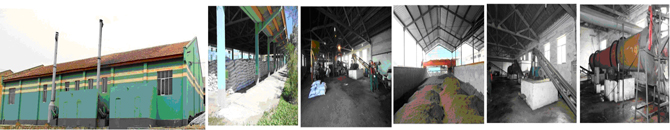
The organic fertilizer factory 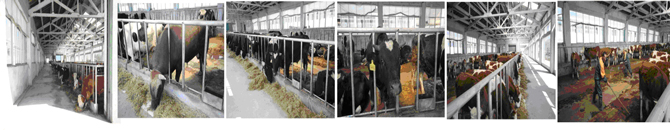
The cattle houses -we now have over 12 cattle houses with each to house over 150 heads with more cattle houses being built
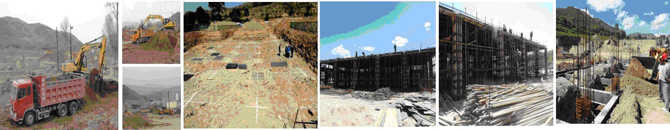
Construction site and construction in progress of the slaughter house and deboning factory as at July30, 2013
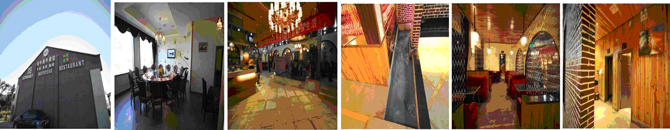
The “Bull” restaurant next to our Cattle Station.
3.2 Operation 2 . Operation 2 is operatedoperation in Linli District, Hunan Province, is run by Hunan Shenghua A Power Agriculture Co. Ltd. China (“HSA”),HSA, a 76%owned Chinese subsidiary. As of the date of this prospectus, HSA conducts the following business activities, both of which are in the development stage: (i) manufacturing and sales of organic and mixed fertilizer, and (ii) cultivation of pastures and crops in preparation for the establishment of beef cattle farm.
| · | manufacturing and sales of organic and mixed fertilizer, and |
| · | cultivation of pastures and crops in preparation for the establishment of beef cattle farms to rear and grow a selective Chinese National Breed of cattle mainly for the domestic market of China. |
By January 2013, itsthe first organic fertilizer production plant was established and started its production of organic fertilizer.fertilizer (“OF”). On March 5, 2013, HSA secured the rights to use an enzyme developed by a Hong Kong company some twenty years ago that has been utilized by global manufacturers of organic fertilizer. The advantage of this particular enzyme is that when it is applied to ourthe organic fertilizer it has the ability to convert part of the organic raw materials into potash and phosphate without having to add in chemically formulated potash and phosphate, such that ourthe Company’s end fertilizer can be qualified as pure organic fertilizer made with 100% natural organic raw materials. With this pure organic fertilizer, HSA is in a position to fully explore the potential market for fish in farm lakes and thereby to attempt to align itself with the Government’sgovernment’s policy of encouraging lake fish Farmersfarmers to use pure organic fertilizer instead of chemical fertilizers. In addition, cost savings from avoiding the use of chemical potash and phosphate will, in management’s belief, result in a better profit margin for the Company. Sales of pure organic fertilizer commenced at the end of Q1 2013. By 2014 HSA successfully developed a different mixed organic fertilizer specially designed and composed for the application in lakes to provide nutrients to enhance growth of water plants and microorganisms in the lakes that the fish are fed on. We call this type of fertilizer “the Organic Mixed Fertilizer” (“OMF”). In the same year, HSA also developed a domestic pack of fertilizer called the “Retailed Pack Fertilizer” (“RPF”) supplying to the super market chain. As such there are three types of fertilizers being produced with: (a). The OF is being used for the growing of crops, vegetables and plants, (b). The OMF is being used for the growing of fish in the lakes, and (c). The Retailed Pack fertilizer (“RPF”) are being used by domestic households. By Q2 2016, HSA completed its construction work of and started production operation with its second fertilizer production plant. Construction work to develop HSA’s cattle station that began in March 2012 by cutting half of the hill at site next to the fertilizer production site that cost far more than the budget originally estimated (from the budgeted $8 million to almost $20 million) due mainly to extra-work required to satisfy compliance of the additional environmental impact conditions implied in the Government’s 2016 regulation and to additional work required to reconstruct the foundation of the land due to a number of land-slides occurred during the fourth weekrainy season, however related main construction work were 95% completed by year end of March, 2013.2017 containing a 2,000 head capacity cattle farm built and pending on the completion of the installation of associated plants and equipment, accessories and operational fittings and other necessities, it will be ready for stocking of cattle for rearing and fattening operation targeting to be within 2018. In this respect, the Company is recruiting and selecting the right management team specializing in the growing of the selected native breed cattle (namely the “Asian Yellow Cattle,” or “AYC”) in readiness to start-up the operation. The AYC are mainly found in Guangxi district and grown in free range conditions by small farms such that our initial stocking up to 2000 heads is rather significant in comparison that really needs a good management team to carry out its operation efficiently. The Company cultivated 75 acres of its land, situated below the fertilizer factory, and planted a high yielded pasture that have been developed in our Cattle Farm 1 in Enping District harvesting up to 200 MT/acre/year for the past year that has been proven as quality livestock feed suitable to the growing and fattening of AYC. The pasture will be harvested from the said 75 acres are the main bulk livestock feed fed to the AYC that will be sufficient for the growing of 2000 heads of AYC per year starting from 2018. In term, the plan is that; the cattle’s liquid waste will be used to fertilize the pasture field and the cattle’s solid waste will be used as raw materials by the fertilizer factory such that all wastes will be recycled, which we refer to as the AYC development project. However this AYC development plan was disrupted and put on hold during mid-year of 2018 when the Government imposed an additional environmental regulation requiring the construction of a mash gas plant before the permit of the cattle farm could be issued. Although the Mash gas plant will be paid by the Government under subsidization program currently available to the project, it will take a further 12 months or more for construction, such that the Company decided to lease out the AYC development project’s property situated on land of 25 Mu to an unrelated third party whilst the Company evaluates other business opportunities and options that may allow better financial returns to the Company in the meantime. HSA produced over 50,000 MT of organic fertilizer and organic mixed fertilizer in 2016, which was reduced to 24,448 Mt in 2018 (a decrease of 59.25%) primarily due to (i) the production of the fertilizer in HSA being affected in the second half of 2017 by the ongoing construction work of cattle station during the year and (ii) the retrofitting of the fertilizer plant to accommodate the application of cattle waste as the main source of raw material versus chicken waste as its main product source. By Q4 2017, HSA’s production lines were back to online. Organic Fertilizer generated sales of 15,105 MT in 2018 from 15,334 MT sold in 2017. Organic Mixed Fertilizer, generated sales of 14,638 MT in 2018 from 9,042 MT sold in 2017. Cattle farms (MEIJI) division The business division Cattle Farms, or MEIJI, refers to SIAF’s cattle rearing operations in Jiangmen, Guangdong Province. Revenue for fiscal year ended December 31, 2018 was $29.56 million, or 29.96%, of the Company’s total sales of goods revenue of USD 141.67 million in the same period. Gross profit for the Cattle Farm (MEIJI) division for the 12 months ended December 31, 2018 was $4.29 million, or 19.81% percent of the Company’s total gross profit on sales of goods of $21.65 million in the same period. Currently chemical fertilizersthere are two operations in this segment, Cattle Farm 1 and Cattle Farm 2.
Cattle Farm 1: Cattle Farm 1 was built as a demonstration farm to show that cattle can be raised in a semi-tropical climate using the Company’s semi-grazing and housing method. Using the Company’s semi-free growing management system, the cattle are allowed to graze in the region are wholesalefield during the early morning and kept indoors and out of the sun during the hot summer days. This method has proven reliable, with the growth rate of the cattle measuring slightly higher than the cattle at SJAP (i.e., averaging around 0.28 kg per day per cattle). Cattle Farm 2:Cattle Farm 2 is a beef cattle farm situated in Guangdong Province, Guangzhou City. Cattle Farm 2 is operated by a private company formed in China with Chinese citizens acting as its legal representative as required by Chinese law. Cattle Farm 2 is complementary to Cattle Farm 1, having an additional 76 acres of land suitable for growing the Company’s type of pasture (a cross between RMB 3,000 to 3,600/elephant grass and yellow grass) that has a very high yield rate of over 35 MT depending upon their chemical compositionper 1/6 acre per year, and our old organic fertilizer from SJAP was sold atcontaining an average of RMB1,200 to RMB1,300/MT. Our new 100% pure organic fertilizer with up to 8% potashover 9 percent protein that is currently being marketed between RMB 2,000 to RMB 2,200/MT targeting to reach an average up to RMB2,600/MT such that its prices will be atvery suitable for consumption by cattle. Between the mid-range of organic and chemical fertilizer. HSA is targetingtwo farms, under normal seasons, they have a capacity to produce up to 30,000 MT of 100% pure organic fertilizer in 2013 under its newly completed production plant and facilities aimingpasture/year collectively that is capable to increase its capacityfeed up to about 90,0005,000 head of cattle/year based on the consumption rate on average of 6 MT/year in stages by 2015 subject to its sales performance within the period. The main hardship related to selling fertilizerhead.
MEIJI is the requirementmarketing and distribution agent for all cattle farms that have been and will be developed by MEIJI using its “Semi-free growing” management systems and aromatic-feed programs and systems to provide longer credit terms (sometimes up to 180 days) to our end buyers because these end users normally can afford to pay for them only after they sell their products; however only farmers who are assessed as creditworthy by us and who plant their fields and follow our requirement to harvest crops each year are considered.grow beef cattle. Development of HSASimilar to CA in Linli District, Hunan Province is modeled like SJAP but it has a much better environment, being situated in a farming rich province that is nextits business model, MEIJI purchases fully-grown cattle from Cattle Farm 1 and sells them to the cattle wholesalers. MEIJI also buys young cattle from other farmers and sells the young stock to Cattle Farm 1. All cattle farms developed by MEIJI will utilize its “semi-free growing” management system and aromatic-feed programs and systems (which is a feeding program with special selected Chinese herbs to improve the health of the cattle to avoid the use of antibiotics) to raise beef cattle, such that cattle raised under this program have a distinct aromatic flavor sought by many restaurants in the Guangdong ProvinceProvinces.
AYC is traditionally a high-end market in China, as it is mainly sold in higher end markets (i.e. its 2016/2017 average of wholesale price was between RMB70 to RMB78/kg (live weight) while the average of other (western origin breed beef) cattle like Angus, etc. was between RMB36 to RMB 48/kg (live weight). We are anticipating that the AYC situation is rapidly changing, though, owing to urbanization and benefitsrising incomes, the rising demand for such quality beef, such that we foresee that eventually, locally grown and produced high quality beef from cheaper logistical costs,local breeds like the AYC will establish its “Brand” and market niche, returning premium prices in China similar to how many locally bred Japanese Cattle found their market niches in Japan that are not be affected by the supplies of imported beef. Initially (as demonstration farms) these farms were going smoothly rearing and fattening mainly the western origin beef cattle (“WOBC”) breeds (i.e. Angus and/or Simmental) similar to cattle fattened at SJAP until the adverse impact caused by said relaxed importation of cattle from other countries that reduced the activity of the fattened WOBC and to grow more AYC. However, although the domestic prices of the AYC were not being closer to large markets and having a more favorable climate (milder winters and longer summers compared to SJAP’s long and bitterly cold winters and short summers). However financial support fromaffected by the Government is more difficult to obtainimports, they do have much lower growth rates due to there being more entities sharingtheir small stature and in turn reduces these farms’ sales revenues based on volume yet make up the Government’s support provisions. HSA had to endure both higher development costs and longer time to construct its facilitiesdifference on their return on gross profit as evidenced in 2018 for gross profit of $4.29 million derived from sales of $29.56 million when compared to SJAP, whose property had 40 older (yet salvageable) buildings, which it has renovated to meet its needs.2016 for gross profit of $1.54 million derived from sales of $29.84 million of WOBC.
Hunan Province is one ofPresently, these farms are carrying on with the biggest primary producing provinces of China with over 4 million primary producers producing rice, tea, tobacco, grapes, citrus, cotton, seedlings, sunflowers, herb plantsgrowing and many varieties of cash crops and it has a long standing history in lake aquaculture producing millions of tons of fish and other seafood annually (e.g., total primary production is over RMB450 Billion, or about US$75 Billion) recorded in 2011 (as announced by Hunan Province Agriculture Department).fattening mainly AYC.
Progress reportPlantation (JHST) division :
At our newly built fertilizer factory, the 100% pure organic mixed fertilizer (“POMF”) is generating stable income and revenues aimingThe business division Plantation refers to reach its 2013 target of 30,000 MT. By the end of June 2013, HSA produced and sold more than 9,000 MT of POMFSIAF’s produce production, situated at an average price above RMB 2,500/MT (or US$403/MT) collectively during the first sixEnping City, Guangdong Province. Revenue for 12 months of 2013.
Work on the construction and development of a cattle station commenced in March 2012 with preparation work in progress being carried out on its general layout, cultivation and planting of crops and pasture on 75 acres situated below the hillended December 31, 2018 was $3.61 million or 2.56% of the fertilizer factory, and hill leveling and cutting withinCompany’s total sales of goods revenue of $141.67 million in the hill next tosame period. Gross profit for the fertilizer factory whereplantation division for the cattle houses will be built, which work is presently12 months ended December 31, 2018 was $0.52 million, or 2.4% percent of the Company’s total gross profit for sales of goods of $21.65 million in progress.the same period.
Pictures showing HSA’s complex and operation
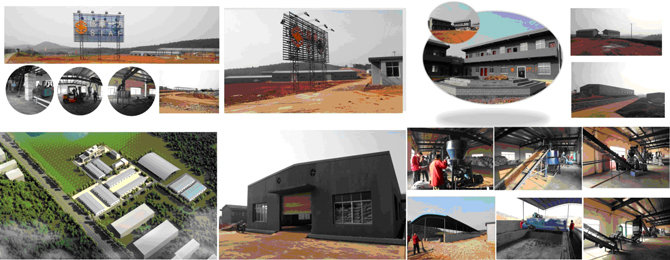
| 4. | Hylocereus Undatus (“HU”) Plantation |
JHST is an SJVCSFJVC that is 75%owned by MEIJI, isSIAF consolidated as a subsidiary, and is the owner and operator of thea Plantation where mainly Hylocereus Undatus, Plantation (the “HU Plantation”), whichor Dragon Fruit, and cash crop vegetables, are grown. Hylocereus Undatus is situated at Enping City, Guangdong Province. In 2012,a cactus commonly referred to as dragon fruit. JHST contributed 9% and 10% of the Company’s revenue and gross profit, respectively. The plantation was developed in 2008 with revenues being generated since year 2009. As of the date of this prospectus, JHST hasconducts two types of operations;main operations: (i) growth and sales of flowers that are consumed as vegetables in China, and (ii) drying and value added processing and sales of HU flower products. Hylocereus Undatus is commonly referred to as Dragon Fruit plants. The HU Plantation has been suffering from plant disease over the past two years, which resultedproducts (used in a reduced yield of HU flowers. The Company tried to overcome this problem with various preventive trials in 2012 (such as green housing, replanting, change of fertilization programhealth-related soups and anti-disease spraying from Malaysia, etc.) with few positive results. Although the overall harvest of 2012 was better than in 2011, it was still far below the harvest of 2010. In fact, the HU Plantation’s 2012 revenue and earnings were mainly supported by the sales of additional dried HU flowers processed from fresh HU flowers that were bought from regional growers. Since October 2012 after the harvesting a season of HU flowers, the Company has dedicated its effort to finding a viable solution to this disease problem, and by the end of February 2013, the Company believed that a solution was found. We started to implement the developments from March 2013 on the HU Plantation with the aim of rectifying the situation before the start of the new harvest season beginning in June 2013.
teas). JHST cultivates 187 acres of Hylocereus Undatus or Dragon Fruit (cacti) flowers in the Guangdong Province. Dragon Fruit flower for a very short period, sometimes only one night, and must be picked before they turn from green to white 20 to 25 cm long flowers, so they are by definition a fairly delicate crop. The harvesting season is from July through October. HU cacti take three years to reach maturity, though they will flower a little even in their first year, and can produce for as long as twenty years. JHST began planting in late 2007, and by 20132015 all of the plants are matured plantsmature (averaging over 4 years old)four years). To date,HU blooms for a very short period, sometimes only one night, and flowers must be 20 to 25 cm long when picked before they turn from green to white. HU is a delicate crop and the product has been sold in the form of dried flowers, which are used in health-related soups and teas, and fresh flowers, consumed as vegetables in China.harvest season runs from July through October. Currently,Small amount of fresh flowers are sold to regional wholesale and retail markets due to their short shelf life whereas driedand most of the flowers are sold after they are dried and packedpacked; these flowers are sold to a few major wholesalers, who in turn distribute them to other wholesale and retail markets and export traders right through the winter and spring months (from October to June each year)June) in Guangdong Province. In this respect, itHU is a distinctly seasonal revenue product, asproduct; more than half of the division’sJHST’s revenues are recognized in the third quarter, and noquarter. No sales are made in the first quarter.
It wasThe Company originally forecastedexpected that by 2014, dried and pickled flowers would make up 96%96 percent of the division’s flower income as produce is diverted away from delicate fresh flowers. However,In 2013, the planting ofCompany also planted a special selenium-rich Chinese herb (called XueYingZi, and commonly referred to asor “Immortal Vegetable” in China), which is richChina and Snowsakurako in selenium, among the HU Plants is expected to helpJapan) and tried many treatment methods hoping to prolong the shelf life of the fresh flowers from 2-3 days up to 12-14 days which willaiming to increase the sales of fresh flowers. This experimentation had not produced the desired outcome; thus the Company instead has processed up to 80 percent of HU as dried flowers that are delicious to eat as fresh vegetables and commonly accepted as quality gourmet vegetables.from 2013, onward.
We expect this improvement of shelf life of the HU flowers to gradually even out our sales of dried flowers and fresh flowers through the harvest season startingare in late June to October of each year and leave our drying and processing facilities extra time to process more flowers that we intend to buy from other regional growers so as to increase our overall revenue from 2013 onwards. Beginning in June 2013, JHST will also add the sales of the Immortal Vegetables planted now, which we expect to harvest within two and half months followed by the replanting of two more crops in 2013 and thereafter 4 crops/year in subsequent years.
Given this progress of improvements, JHST is attempting to eliminate the factor of seasonality in revenue. The overall market situation for HU flowers is thatgreater demand is greater than supply due to the followingcan meet for several reasons; (i) inIn Guangdong Province, HU Plantsplants can only be grown commercially along certain districts wheredistricts; there were over 40,000 acres of HU Plantation back in 2005, but due to the growth of industrialization and modernization, acreage is now less than 4,000 acres, and (ii) farm laborers are getting harder to find, coupled withfind. With the increase of cost of wages and salaries, the rapid rise of the land cost and the increase cost of farm developments, making it is extremely difficult to start up a largebig acreage HU plantation. For these reasons we are anticipatingthe Company anticipates that prices of dried HU flowers towill enjoy a steady rise at an average rate of 8 to 12%12 percent per year, which has been the trend since 2009.
Progress report
We expect a much improved performance However, the biggest risk to yield is weather, as substantially wet rainy seasons can limit the yield of any harvest and damage their roots in 2013.term inducing diseases to the plants.
Our field revitalization programplantation experienced very heavy wet seasons for more than 4-5 years (2013 to 2017) requiring the Company to combat and treat diseases and related problems continuously during the period, but by 2017 had exhausted all various means to recover and to revitalize the HU plantation. With continued wet conditions experienced over the past years, damage to the soil and plant roots has been carried out onincreased disease problems to the HU plantation since early March 2013affecting its overall yield as well as quality of harvested flowers Even though new plants were being planted each year increasing the area of planting by over 900 Mu to a total of over 1700 Mu with certain work still in progress; on April 22, 2013, management reported seeing marked improvement in the field with healthy green everywhere as comparedintent to last year’s concentrationincrease productivity, proportionately, the outcome has fell well short of yellow colors. Coupling this improvement tointended results. Furthermore, poor soil and weather conditions adversely affected the quality of the HU plants andflowers products which caused a significant drop in selling prices (i.e., there was no sales of the extra revenuesfresh HU flowers decreased in 2018 while that will be generatedof dried HU flowers decreased from $5.19/kg in 2017 to $4.93/kg in 2018). At the “Immortal vegetables” being planted now,same time, the regional farmers suffered the same fate that we are optimistic and targeting an increase of at least 25% in revenue oncould not buy enough fresh flowers from them to dry to maintain the plantation itself in 2013 (excluding flowers that will be brought from regional growers for drying and sales of dried flowers).flowers. Therefore, due to deteriorating conditions recurring in the HU sector, the Company is reviewing the following options with the hope to remedy the situation.
ConstructionOne of the expansionplans of JHST was to plant other cash crops to provide an alternative source of income for the drying and packaging factory of the HU Plant division commence over the summer months after we had completed the field revitalization work. As of the date of this prospectus, we had built and started to use three new driers and basic infrastructural works around the site of the packaging factory are in progress expecting completion by the end of 2013.
Pictures showing the HU Plantation andplantation. Immortal vegetable farm
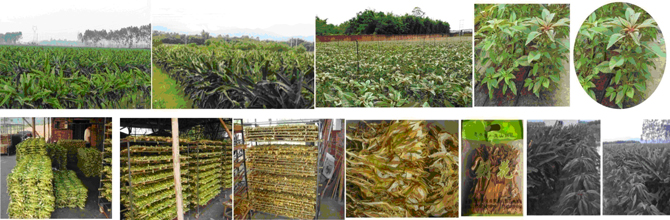
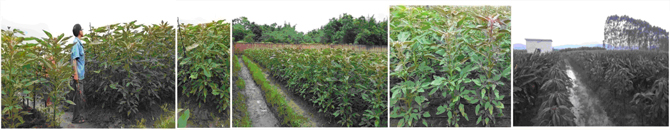
By the fourth week of July, 2013, Immortal Vegetables (the Japanese name for Immortal Vegetables is “Snowsakurako”) are almost 1.6 meter tall and look good. We are now trying to packVegetable (IV) plants have properties that some believe induce good health. The Company has processed these into small gift packs –herbal tea bags - selling them as organic vegetables. Latest laboratoryherbal health tea. Laboratory test results showingshow that each Kgkilo of fresh Immortal Vegetables contains 0.58 gram of selenium, should also addwhich adds value to their sales. Upon close inspection,As of the 2015 season there were 70 Mu designated for growing immortal vegetables on the plantation, however sales of this products did not reach targeted levels such that in 2017 the Company maintained only a small plot of about 10 Mu for growing IV. We did not sell any dried IV tea in 2017, but we kept over 20,000 Kg dried IV tea in inventory planning to relaunch its sales by one of the country’s top e-commerce operators in 2018 that will involve (a) Repackaging the products by a well-known and reputable health food processor and promoter into three separate and different health products with each product reflecting its own health property instead of an all-in-one application like had been, previously, (b) To promote the product under one of China’s best brand names of health herbal products. Our herbal health tea products (“HHTP”) have been accepted by one of their franchisees during March 2018, and, as such, we are working on trials with the processor over the coming months to start launching the HHTP onto an e-commerce platform targeting Q3 2018 depending on the successful outcome of the trials to meet various marketing markers, satisfactorily. If HHTP is launched successfully, there is good potential for JHST’s plantation to generate sustainable high sales revenues and profit from 2018 onward because the IV are very durable plants with strong disease resistant characteristics having good growth rates producing 5 yields per year (average of 50 MT of fresh produce/acre/year) at a reasonable cost of production averaging at RMB1000/MT or the equivalent of RMB 50,000/acre. Practically speaking, the whole plant (that is, the flowers, leaves, sterns and roots) can see therebe dried into the HHTP averaging 5 MT of HHTP/acre/year. We are Immortal Vegetables growntargeting to plant about 15 acres in betweenyear 1 (starting from Q3 2018) to process into 75 MT of HHTP to generate direct farm sales (excluding marketing and other associated sales revenue and costs, etc.) up to RMB45 million/year 1 (or the HU Plants acting asequivalent of $7.2 million) at about a protector70% gross profit margin. If successful, it will enhance revenue and profit by more than 200% of JHST’s annual sales revenue and gross profit generated in FY2018.
In March 2018, JHST signed two growing contracts that have stable pricing conditions: (1). With a herbal plant oil processor to grow 50 acres of plants called “Pogestemon Patchouli” (“PP”) for processing into a type of natural aromatic oil that has experienced a good market in China. 50 acres of trial will be run this year but can be expanded to 150 acres next year if proven successful. It is estimated that the 50 acres of PP will generate sales revenues over $1 million with 50% gross profit margins based on two harvests for the HUyear 2018; and (2). To grow 200 acres of Passion Fruit for a Juice Manufacturer from 2018 to 2020 for 3 years initially estimated to produce around 2,400 MT of fruit/year contracted at RMB 8,000/MT (or $1,280/MT) to generate over $3 million in sales revenue. The combination of both fruits and PP will enhance revenue and gross profit to JHST that again will exceed its performance of FY2018, if their outcomes prove successful. Unfortunately the typhoon during Q3 2018 has destroyed much of the winter cash crops, which reduced JHST’s performances in Q4 2018 and in turn reduced 2018’s annual revenue and incomes by 22% and 62.5% respectively compared to 2017. At the same time the typhoon also destroyed the newly planted herbal PP plants becauseand the Immortal Vegetables havepassion fruit trees delaying their development. Currently as at the ability to repelbeginning of Q2 2019, management of JHST is still evaluating JHST’s overall prospects yet it has not yet come up with any conclusive plans needed for JHST. Marketing & Trading Division Revenue for 12 months ended December 31, 2018 was $68.45 million or 48.5% of the diseases that liveCompany’s total sales of goods revenue of $141.67 million in the HU Plants. As such,same period. Gross profit for the HU Plants are healthy lookingplantation division for the 12 months ended December 31, 2018 was $7.18 million, or 33.16% of the Company’s total gross profit for sales of goods $21.65 million in the same period. The Company distributes imported meat and flowering nicely despite the fact that the region experienced more rain this year than last year, yet the HU Plants are still holding up well.seafood through two completed and operational facilities from which it has acted as turnkey project developer to construct and to provide supervision to these operations: | 5.1) | Wholesale and distribution facilities (“Wholesale Center 1”) for Guangzhou City NaWei Trading Co. Ltd (“NWT”), an unrelated Chinese third party owned company situated at the Guangzhou City, LiWan District, New Wholesale Market. |
| 2) | The Corporate (or SIAF) DivisionShanghai Distribution Center which was built to accommodate a capacity of 50 metric tons of meat per day and to distribute 5,000 metric tons of seafood per year. |
From the last quarter of 2012In 2013, the Company decidedalso constructed a trading complex (the “Trading Center”) for the Import and Export at another building adjacent to generate the following business incomeWholesale Centers 1 and 2. The Trading Center has imported frozen and fresh chilled and live seafood (i.e., cuttlefish, squid, prawns, salmon, crabs and eels) from Malaysia, Thailand, Russia and Madagascar and other local coastal fishing towns. The seafood was sold to fund its shared services operations’ working capital annual budget:
The Wholesale Center 1, which distributed and Distribution Facilities development project including design, constructionsold it into various reputable food chain outlets, wholesale market stores and project management of its business operation of a specialist modern beef wholesale and distribution center (Wholesale Center 2) for Guangzhou City NaWei trading Co. Ltd (“NWT”), an unrelated Chinese third party owned company situated atsupermarket chains in the Guangzhou City, LiWan District, New Wholesale Market. Work startedShanghai City as well as in November 2012, and asthe southern coastal towns of the dateGuangdong Province.
Primarily, the Company distributes meat imported from Australia and seafood from other countries through these operations under their import and export permits conditioned under the China Government’s regulations. We believe this division has excellent growth potential due mainly to the needs of import foods in China, but the sales of this prospectus, wedivision is limited mainly by “insufficient working capital” to really drive up the sales’ turn over. For instance the company’s average of gross profit of import trade is at 10.5% (derived from average of 12.5% in mark-up) for selling the imported goods to its sales agencies to distribute in China when the total working capital(WC) needs for the 1st month’s import and the subsequent 2ndmonths import calculated to about 4 months’ “good-sold” when considering that it will require 2 months times to complete one cycle of the monthly import allowing time provided for “ordering, shipping, custom clearance, good inspection, discharging & local transportation, storing and selling time etc. and another 2 months for subsequent month’s import totaling to 4 months. As such, if the Company wants to generate $120 million in sales in one year it will require WC of about $40 million (or 33.3%) to be locked up month after month continuously during the year whilst the Company did not have completed a freezing room facility$40 million in WC in the past or currently for that purpose, such that it could only build up sales of this division gradually pending on the availability of working capital from time to time. Over the years this division has developed many reliable suppliers and supplied sources that are supplying quality foods to our trust-worthy customers / agencies. Therefore it is within reason to assume that this division will eventually become an effective and major revenue drive of the capacitygroup once when some of the financing plans will have materialized to store upallow more working capital being employed in the division. Overall in 2018 this division achieved average gross profit margins of 11% for the trading of seafood and 10% on the trading of beef from selling imported goods to 150 MTits sales agencies to distribute in China based on an averaged mark-up of frozen food at -25 degrees Celsius with renovation12.5% on cost of goods sold excluding the cost of import duties, value added taxes and alteration work progressing on other facilities (e.g., wholesale shop, packaginglocal associated charges etc. that were paid by respective agencies. This kind of gross profit margin will be increased when the Company will be in the financial position to afford to buy directly from the fishermen and processing facility, office, dry good storage and function room).to sub-contract the value added processors to process the seafood directly. Project Development Division The project developments (or Technology engineering consulting and services) work are carried out by CA on aquaculture related projects and by SIAF on non-aquaculture projects: Introduction The Project Development division earns revenue by providing turnkey project management and engineering services today mainly within aquaculture. Project development revenue for 12 months ended December 31, 2017 was $16.99 million or 8.57% of the Company’s total revenue of $198.17 million (derived collectively from $181.12 million in Sales of goods and Project Development of $16.99 million) in the same period. Gross profit for project development for the 12 months ended December 31,2018 was $3.42 million or 17.42% of the Company’s total gross profit of $19.63 million (derived collectively from $16.21 million of Sales of goods and Project development of $3.42 million) in the same period. All project development activity for the year was carried out through Capital Award for its unconsolidated investee, Tri-way. Historical events: Historical Information and status of CA’s consulting and engineering service are shown in the table below: | Number | | Year | | Name | | Stage of completion | | 1 | | 2010 | | Fish Farm 1 (JFD) | | Completed and acquired by SIAF | | 2 | | 2011 | | Fish Farm 2 | | Under expansion by Tri-way | | 3 | | 2011 | | Cattle Farm 1 (JHMC) | | Completed and acquired by SIAF | | 4 | | 2011 | | Prawn Farm 1 (EBAPCD) | | Completed with hydroponic farm to go | | 5 | | 2011 | | Prawn Farm 2 (ZSAPP) | | Under expansion by Tri-way | | 6 | | 2012 | | Cattle Farm 2 (EAPBCF) | | Completed | | 7 | | 2012 | | Wholesale Center 1 - Guangzhou (APNW)(Phase 1 & 2) | | Completed | | 8 | | 2012 | | Central kitchen, distribution network, signature restaurants | | Completed | | 9 | | 2014 | | Zhongshan New Prawn Project (ZSNP) | | Commencing construction | | 10 | | 2014 | | Wholesale Center 2 - Shanghai (APNW) (Phase 1) | | Completed | | 11. | | 2016 | | Aqua-farm 4 & 5 of the (ZSNP) | | 90% completed under Tri-way’s direction |
Together with its subsidiaries, the Company essentially constitutes an engineering company providing services in engineering consultancy, supervision and management on the development of agriculture and food based projects in China. These include the construction of farms (or other facilities) as well as the development of business operations of related projects that are apply and use the Company’s principal technologies, including the following: | (1)· | An indoor recirculating aquaculture system (APM-RAS) and designs for the growing of aquatic animals (fishery indoor); |
| · | An open-dam recirculating Aquaculture System (ODRAS) for the growing of aquatic animals (Fishery outdoor); |
| · | Semi-free range cattle growing systems and design for raising cattle and sheep in China tropical climate locations, (e.g. Cattle Farm 1 at Enping district); and |
| · | Other associated technologies. |
CA’s standard principal terms and conditions for its Aquaculture project development consulting and service contracts are outlined below: | · | CA is the consulting and service provider as the turnkey contractor of the project; |
| · | The Central KitchenChinese businessmen are the clients of CA and related facilitiesthe investors and owners of the project company; |
| · | CA creates and manages development schedules for the project; |
| · | CA is responsible to build the Aquaculture project (including development of its business operation) using the Company’s APRAS technology, systems, know-how, and management expertise and systems for and on behalf of the developer; |
| · | The developer is responsible to pay CA for its work, including design, construct, projectall subcontractors and suppliers appointed by CA in a timely manner, normally a 60-day term; |
| · | Provision clauses allow CA to appoint and to select sub-contractors and suppliers; |
| · | Clauses allow extra work and additional work and extra cost provisions; and |
| · | Contracts generally include i) warranty and limitation of liabilities, ii) scope of work and lists of supplies (including all plant and equipment), iii) installation, training and commissioning of the developments and business operation; and iv) granting to CA rights to management of developmentoperation, and management of business operation for Guangzhou CityWangxiangcheng (“WXC”), an unrelated Chinese company, of a Central Kitchen, a Central Bakery, a fast food restaurantmarketing and 3 mobile food stores (Central Facility 1) situated adjacent to Wholesale Center 2. Work started in November 2012, and assales of the dateproduce and products from the farm’s operation. |
The Company’s services are comprehensively supportive with vertically integrated operational activities to provide service for the construction of and the business development of the projects to joint ventures. Consulting services include research and development on grown and growing animals, supply of foundation animals (baby calves, fingerling and breeding stocks etc.), supplying designed and configured plants and equipment to the marketing and sales of the end product. Aquaculture Project Development Engineering consulting and services provide a comprehensive range of services in the field of aquaculture. These include research and development, brood stock supply, nurturing of fish fingerlings and prawn post-larvae as well as growing of fish and prawns, engineering designs and planning of farms and associated operations, technology and related implementation, supervision, training and conducting trials, management of farm operation and construction, supply of plants and equipment, training of maintenance and operational services, sales, transportation and marketing of fish and prawns, as well as financing. The Company’s management team and staff in Guangzhou conduct the engineering and consulting work. The Company directs the scope of work so that building subcontractors deliver projects efficiently and cost effectively. Using locally manufactured equipment, parts and components customized to the Company’s proprietary designs and engineering specifications, production costs for machinery and facilities are far lower compared to foreign aquaculture systems. The Company believes that it delivered the first indoor re-circulated aquaculture prawn farm in Asia. From October 1, 2016, onward: CA has granted to Tri-way a Technology Master License for China, such that starting from October 1, 2016, all future fishery project development in China using APM-RAS or ODRAS will be developed by Tri-way. CA has been hired by Tri-way as the Company’s turnkey contractor to provide consultation respective of Tri-way’s operations. CA’s aim, in addition to providing quality service to Tri-way in China, is expecting to expand its reach to introduce and help implement its APM-RAS and ODRAS plant and equipment and services, worldwide. 2017 Research and development (R&D) works on technologies and associated future developments The Mexican White Prawns (MWP) During Q4 2017, CA started the construction and development of an indoor APM-RAS experimental farm (“MWEF”) at Enping’s Aqua-farm (1) (or FF1) for the growing of Mexican White prawns (“MWP”) which is a salt water spices of prawns grown mostly in China or other countries in open dams and channels that have access to sea water. However, due to the rapid growth of industrialization and the increase of prawn growing farms over the past years, pollution has been affecting the quality of sea water in terms of increasing diseases and other associated problems to the MWP industry, thus, reducing the economic viability of the prawn industry by reducing its productivity. The aim of the MWEF is to achieve the growing of MWP economically and commercially in stable environmental conditions supported by economic sustainability so that they can be developed at a lower capital expenditure and returning on capital investments within a reasonable period of time (targeting within 18 to 24 months). Our teams (including some newly recruited technicians and experts) are working diligently on the project having already overcome various problems in construction and associated preparation work on growing MWP, expecting to stock prawn fingerling (PL7days) within the 1st week in April 2018 and if all goes according to plan, are anticipating harvests to begin taking place 7 weeks later (beginning of June 2018) for the smaller sized prawns (i.e. 50/60 pieces/Kg) and final harvest on or before end of June for the larger sized prawns (i.e. 20/25 pieces/Kg). This MWEF is being constructed on a 1000 m2 surface area that has 4 grow-out tanks (to contain 480 m3 of water, collectively) with each tank to have 120m3 of water that is being recycled and serviced by 2 tanks (each of 25m3) that have inbuilt filtration and water treatment systems aiming to produce 3Kg of small sized prawns/m3 of water within 7 weeks and 6Kg/m3 of larger sized prawns within 10 weeks. This production aims to enhance harvests by approximately 3,000 Kg (or 3 MT) per harvest (15 MT/year) of larger sized prawns based on 5 harvests per year. In 2017, the average of wholesale prices of (MWP) prawns is RMB50/kg for small sized prawn and RMB150/Kg for larger sizes. This will mean that there will be RMB2.25 million sales revenues generated per year per 1,000 m2 of developed floor area. We are optimistic to achieve this milestone of securing sound fundamentals for the growing MWP in high salinity water in China under our APRAS system. Up to the end December 2018, at AF1 we had conducted 5 trials in growing MWP in high salinity water (up to 26/1000) with mixed results. We had three trials associated with high mortality, low yield and disease problems, one trial affected by heavy minerals in the water and the final trial with good results where 85% of MWP reached an average body weight of 25 gram per piece during a grow-out period of 100 days from 10 days old where the quality of the MWP were excellent and had a great natural taste. Although the final trial’s result was encouraging, the Company’s desire to develop and construct a production plant on 100 Mu of land next to AF1 using green-house construction systems has been put on temporary hold until such time that the Company improves its cash-flow. | l | The Fresh Water Prawns (BJP)( M. Rosenbergii) & AF4/AF5 |
During 2017, the Aqua-farm (4) (“AF4”) at the Mega Farm Project tried to grow multiple batches of Fresh Water Prawns (“BJP”) in commercial quantity (i.e. stocked over 1 million fingerling (of PL24 days) per APM tank of 200m3 of water to nurture the fingerling up to 54 days old supported with 4 other APM tanks for further grow-out up to 18 weeks old) but did not obtain optimal results mainly due to the BJP having not reached their desired size on schedule, with the majority of them not showing any further growth occurring after week 12. As such, AF 4 had to alter its plan of growing mainly BJP to growing fish (i.e. Jade Perch, Silver cods and other mixed fish) within some of the APM tanks in order to maintain a certain level of productivity at the farm. In conjunction with this exercise, AF4 had to develop 800 Mu of open dams (“ODRAS”) that were built using CA’s 2nd generation open dam recirculating aquaculture systems) to grow fish to certain sizes before they were transferred to the indoor APM farm for final grow-out, and allow the transfer of the 12 week old BJP grown in the indoor APM tanks to be moved to the ODRAS dams for further grow-out in a larger area. Also, in Q3 2017, AF4’s ODRAS open dams suffered damage to its temporary built properties (i.e. the staff quarters, offices, laboratory, etc.) as well as use of AF4, itself, losing many fish and prawns stocked in the open ODRAS dams by one of the strongest typhoons in the past decade hitting the Mega Farm property and other areas of the southern coast of Guangdong Province. Although there was no structural damage done to the main APM farm buildings the damage had interrupted production until repairs were performed to both the APM tanks and ODRAS dams for the transfer of the prawn and fish, and, as such, AF4 decided in Q4 2017 to slow down its grow-out activities until after the Chinese New Year (ended end of February 2018) and in the interim to concentrate on its research and development work on the grow-out of BJP in the APM tanks aiming to find a solution to improve the growth rates and grow-out sizes of BJP to 18-weeks. Research will be focused on system design and water quality limitations. Progress is being made to improve in-tank water chemical and physical characteristics, and source water mineral composition for prawn growth. In addition, progress has been made to understand and manipulate in-tank bacterial populations to create a healthier overall rearing environment. During the first quarter of 2018, research will also assess the biological and economic feasibility of all-female and all-male populations of prawns, using patented endocrine disruptor technologies from third-party collaborators. Such non-GMO technologies result in overall faster and more uniform growth of cohorts compared to mixed populations of both males and females. In fact, the operation of AF4 (Production factory 1), the operation of AF5 (Production factory 2) and the open dams at the Mega Farm Project had a poor start and performed badly in 2017. During the first half of 2018, we incurred debts over RMB 30 million due the followings events and reasons: (i). Unsuccessful management coordination resulting in low productivity and sales of products. (ii). Over spending on capital expenditure on Phase (1) of the Mega Farm Project which exceeded the original budget of US$50 million by more than 60%. | · | As a result, it limited cash-flow to support the needs of this prospectus, about 80% ofworking capital that affected the construction work was completed.overall production and sales. |
| (2)· | And as a result, there were not enough funds to complete some of the supporting facilities needed by the APM farms (i.e., the external filtration systems, lighting, electrical wiring, external drainages for waste water and connection and fitting for the supply of fresh water etc.), supporting external water dams and waste water treatment dams, the heating facility and part of the internal filtration systems that made it difficult for the farms to carry out their production efficiently. |
(iii). AP4 and AP5 are the biggest AP farms that the Company built and the Company did not have a sufficient management team to support their production operations; most of the newly recruited APM farm management personnel & workers did not have the knowledge and experience with the APRAS technology and systems and as a result, there were many mistakes made during their learning curve affecting the farms’ production. (iv). The two APM farms are the biggest indoor farms that we have ever built, and we didn't have enough experienced personnel to support their operation; and managers of other smaller sized APM farms could not work with the Mega Farm’s top management or his team under his management. (v). The production operation of the AF4 and AF5 started prematurely before all the completion of their construction & development works leading to the situation that, at times, the property management team of the Mega Farm Project gave direction to the farm production operation teams resulting in wrong decisions that caused many mistakes. (vi). Guangzhou experienced a very hot summary in 2017 that killed and retarded many stocks in the open dams and one of the big typhoons during August 2017 caused flooding that washed away hundreds of tons of fish and prawns in the open dams that would have been ready for harvest in September & October of 2017. Also, the extremely strong Typhoon in September 2018 caused power stoppage that killed hundreds of tons of stock including some valuable brood stock. | · | By May 2018, our CEO & teams (the “Team”) at head office took the following actions: |
| 1. | Stop all production & operation of all farms (covering both in-door APM farms and open dam farms). |
| 2. | Sell off most inventories in all farms. |
| 3. | Trim down its work force by 85% or more from 155 persons. |
| 4. | Trim down all operational expenditures of the farms |
| 5. | Stop all capital expenditure of the MFP |
| 6. | Reorganize the management team |
| 7. | Form a selective team to start talking to the creditors. |
| · | By July 2018 the Team managed to rectify the following: |
| 1. | All open dam operations stopped with about two tanks of stock remaining in the APM farms. |
| 2. | There were just 20 workers remaining at the farm complex. |
| 3. | Closed the operation at the head quarter office at Zhongshan City. |
| 4. | Cut down the Mega Farm’s monthly expenditures from RMB1.5 million/month to within RMB 450,000/month. |
| 5. | Cut off more than 95% in capital expenditure spending. |
| 6. | Temporary clamming down many creditors and reduced the Mage Farm’s debt of RMB 30 million to just under RMB 21 million financed by other Segments of operation and loans granted by friendly third parties. |
| 7. | Starting to look into the revitalized plan of the MFP. |
| · | By August 2018, the Team initiated the interim direction of the MFP aiming to achieve the following objectives & directions as soon as possible: |
| 1. | Production of the APM farms are the most important fundamentals and it will not mean anything if that cannot be achieved within a short space of time considering that the Mega Farm Project still has a monthly operational expenditure of RMB 450,000/month excluding depreciation & amortization and the Research and Development (R&D) Team monthly wages and expenses are adding an extra (RMB 230,000 to RMB 240,000/month) making the total operation expenses at RMB 690,000/month collectively. |
| 2. | Must develop an operational team that can work effectively and cohesively for the benefit of the Company without fraction among one another and be friendly with one another to help each other to develop efficiency and proficiency as a team that can be relied upon. The Team must be able to work hard, relentlessly and diligently under the Chinese farming customs and practice that is a 24/7 hours per week such that management must keep that in mind and organize their respective roster schedule accordingly. |
| 3. | All management must try to do all interim retrofitting, remodeling, and reconstruction work at the lowest cost as possible and to use whatever is available from inventory without having to buy more new plants and equipment, materials and parts and component etc. The moral of the spirit is that no matter how hard and difficult, the priority is production that must be made to happen, and watch every penny that needs to be spent and don't spend any unless it is absolutely necessary. |
| 4. | To have all production sections find some extra-funds (whether from its own savings or from friendly investors) to support part of the working capital and capital expenditure needs during the interim periods. In this respect, the past attitude of looking at hand - out from the head quarter is definitely out. |
| 5. | There is no borrowing unless production will have the ability to repay the borrowings satisfactorily. |
| 6. | All production must be profitable ultimately within schedule; and any mistakes (if any) must be rectified within the shortest time possible and repetition of the same mistakes will not be tolerated. |
| 7. | A suitable program in "Award and Penalty" must be formulated to provide incentives to all working teams. |
| · | By end August 2018 the Interim Revitalization Plan was formulated and put into motion. |
The revitalization plan has the following basic fundamentals: Essentially, the current Mega Farm Project has two major divisions: (i) the Property Management division and (ii) the Production division: | · | The RestaurantProperty Management division is managing the properties of the Mega Farm Project by leasing out all of the land either to external operators or internal divisional operators at rental fees according to leasing market values (includes the open dams, in-door APM production factories and plantation land, etc.). This division supports the leases with basic maintenance, security and supplies of utilities, etc. |
| · | The Production division will have the following subdivisions: |
At AF4 (Factory 1) | 1. | Fish fingerling production |
| 2. | Mexican White Prawn (“MWP”) production |
| 3. | Research and Development (R&D) and Bio-security Operation. |
At AF5 (Factory 2) | 1. | Nurturing of fish fingerling |
At the end of December 2018, the early winter of the Guangdong districts slowed down the revitalization programs planned for AF4 and AF5 due primarily to the external supporting facilities (i.e. water holding dams, waste water treatment dams, external disinfection tanks and proper heating facilities etc.) were not completed. As such, the revitalization plan of these two farms will be delayed until such time as the supporting facilities are completed and working efficiently. In the meantime, operations on a small scale are being carried out in both AF4 and AF5 with the aim of slowly recruiting the right personnel to move ahead after the spring of 2019. | l | R&D work and development project including design, construct, project management of development and management of its business operation for WXC. As of July 30, 2013, the 3rd generation ODRAS. |
During Q1 2017 CA acted as the turnkey contractor to Tri-way’s Aqua-Farm 3 (formerly, PF2) helping it complete the construction and development of a 150 Mu open dam farm (with effective production dams totaled to 90 Mu) using its 3rd generation ODRAS technology and system (ODRAS (3G) Farm 1) at a sea-shore property in YangJiang district of Guangdong Province (the “YangJiang Farm”) to grow Mexican White Prawns (MWP). This farm started operation in Q2 2017 and by the end of Q4 2017, it produced over a 9 month-period a total of 600 MT of small to large sized MWP generating sales revenue of RMB7.2 million (or $1.152 million) representing an average yield of 6 MT/Mu/9 months/3 harvests (annually yielding 8 MT/Mu) on 100 Mu of net-effective grow-out areas. This farm was operating smoothly in 2018; however, its productivity was not as high as anticipated (i.e. current figures show 5 MT/Mu/year instead of the planned 8 MT/Mu/year). This was due mainly to the inconsistent quality of the sea water over the year affecting the growing conditions in the open dams; as a result, we could not restock at the planned frequencies thereby reducing the productiveness of the farm. On December 2017, CA also acted as a turnkey contractor to AF3 starting the construction and development of ODRAS (3G) Farm 2 on 186 Mu of land located opposite to AF3’s old open dam farm’s property at Shenwan Town, Zhongshan City, Guangdong Province. ODRAS (3G) farm (2) is expecting to start production operation within April 2018 targeting annual production to exceed 1000 MT (annually yielding 8 MT/Mu) on net-effective grow-out area of 130 Mu. Up to date the farm is doing better than Yangjiang farm and on target (to get 8 MT/Mu/Year) judging on its harvest during Q2 2018 due to its location where there are good sources of water underground for supply of both salt and fresh water. AF3’s old open dam farm’s property located at Shenwan Town, Zhongshan City, Guangdong Province was originally 390 Mu that had been expanded to 600 Mu in 2016 and among which 350 Mu are still operating on its old ODRAS systems, wherein 250 Mu was retrofitted into ODRAS (2G) using CA’s 2nd generation ODRAS technology and systems, starting production in Q2 2017. It is the intension of Tri-way to retrofit the original 350 mu farm into ODRAS (3G) within 2019, again dependent on when Tri-way will secure long-term financing. Up to date AF3 didn’t retrofit the 350 Mu due to limited funds allocated for capital expenditures such that these dams were stocked with mixed fish (i.e. mainly fresh water Carp species and other low priced fish with constant demands and stable prices). At the same time since 2017, CA has been servicing groups of farmers aiming to develop some of their properties (estimated over 600 Mu collectively) in nearby regional districts as well as over 400 Mu of land next to ODRAS (3G) farm (1). In so far only a fraction of the land (up to 200 Mu) has been developed in 2018. During 2017, CA improved its designs in ODRAS (3G) technology to have more frequencies in water flows, smaller sized grow-out dams (i.e. average of 6 Mu per dam reduced to 2.5 Mu) that will reduce energy costs by having the dams covered by greenhouse designed structures shaded by trees in between to act as wind breakers and weather adjusters that we think will be very adaptable in southern China to grow both MWP and BJP. These ODRAS (3G) farms can be built at 1/3 of the price of the MWP Farm (1) mentioned earlier for approximately RMB700/m2. Other Project Development (historical) The Company has also, acting as a turnkey project developer, built 8 restaurants with central kitchen and bakery facilities in the greater Guangzhou area. | · | Restaurant 1, at River South District, has been operating for over 18 months, Guangzhou. Operated since Q1 2012. |
| · | Restaurant 2, (atat the UU Park Complex in Tianhe District) has been in operation for 10 months, District, Guangzhou. Operated since Q3 2012. |
| · | Restaurant 3, (atat the Sporting Complex in Tianhe District) has commenced operationDistrict, Guangzhou. Operated since MarchQ1 2013. The Company stopped operating Restaurant 3 in Q3 2013 the work at due to landlord’s failure to provide a Fire Safety Permit. |
| · | Restaurant 4, which is located at Harbor City Shopping Center, Guangzhou City, is almost completed and is targeted to open for business by end of August 2013, design and construction plans for Guangzhou. Operated since Q3 2013. |
| · | Restaurant 5, (located at the center of Zhungzhen City, about a 35 minute drive from the Guangzhou City) have been submitted to the authorities for approval targeting construction work to start in August 2013, and City. Operated since Q1 2014. |
| · | Restaurant 6, (atat the Li Wan District and next to Wholesale Center 1) will start renovation work during September 2013. Collectively, these 6 restaurants cover a total gross area of 5,800 m2 (about 63,800 ft2) with seating capacity for 1,370 persons.1, Guangzhou. Operated since 2014. |
| · | Restaurant 7, at Xining City which is the 2nd “BULL” restaurant established in Qinghai Province operated since 2015. |
| · | Restaurant 8, at JianJiang City, JianJiang District, Guangdong Province, operated since August 2015. |
Pictures below show the restaurants that we developed
Restaurant (1) Restaurant (2) Restaurant (3) Restaurant (4)
| (3) | We are constructing a trading complex for the Import and Export trades of the Company itself at another building adjacent to the Wholesale Center 1 and 2 (the “Trading Center”). As of the date of this prospectus, the Trading Center is importing frozen and fresh chilled and live seafood (i.e. cuttlefish, squid, prawns, salmon, crabs and eels) from Malaysia, Thailand, Russia and Madagascar and other local coastal fishing towns, that were sold to Wholesale Center 1 for Wholesale Center 1’s distribution and sales into various reputable food chain outlets, wholesale market stores and super market chains in the Guangzhou City, Shanghai City as well as in the southern coastal towns of the Guangdong Province. |
We expect to be appointed the turnkey solution provider given our current success on existing projects with our Chinese investor who owns the WXC’s development plan to develop over 50 gourmet restaurants and fast food outlets collectively within 2 years (2013 to 2014) and (via NWT) is planning on the development of a number of modern health food department chains in the Guangzhou City during 2014 and 2015with SIAF as its engineering consultant, management service provider, and marketer. As such, we expect SIAF’s business and engineering development division to be kept busy for the next 3 years. At the same time we are aiming to develop our import and export trades and the seafood value added trades in harmony with WXC’s and NWT’s developments to maintain our growth rates in the sales of fish, seafood and beef products to gain momentum in materializing our business vision of vertically integrated operations.
Progress reports:Intellectual Property Rights
The importCompany and export trading of SIAF: During the first half year of 2013, we made good progress in the marketingits business are, to some extent, dependent on patents, licenses and distribution channels having sold collectively over 50 x 40 ft. sea containers (approximately 1,000 MT) of imported frozen seafood including prawns (or shrimp), squids, octopus, and varieties of fish from Malaysia, Thailand, Norway and Vietnam and from local brokers and agents that were sold to Wholesale Center 1 for it to sell and distribute to various reputable clients in super market chains, central kitchen of restaurant chains and multiple number of seafood wholesale markets at some of the populated centers.
We also discovered, during the first quarter of 2013, the potential of sourcing and importing good quality frozen seafood (mainly in fish) as well as in live seafood (including live Flower Pattern eels, mud-crabs and lobsters) from Madagascar that would provide good profit margins. We had tried a number of sample shipments (by air cargoes) with good success rates; as such we have sent personnel over to Madagascar to liaise with local suppliers and to investigate the situation a number of times already with the intention to send a permanent team of workers over there to set up packaging and related facilities to explore its potential fully.
other intellectual property rights. As of the date of this prospectus, we have established 4 collection centers in 3 major coastal villages (North, Westthe Company holds intellectual property for fertilizer formulas, livestock feed fermenting formulas and south coast) and at the city center of Madagascar and managed to import over 37 MT each of live crabs and Flower Pattern eels from Madagascarindoor fish farm techniques. These include an enzyme technology master license registered under a Chinese patent for the quarter ended June 30, 2013.manufacturing of livestock feed and bioorganic fertilizer, and an aromatic-feed formula technology for the production of aromatic cattle, and a bacterial cellulose technology license. On 12 November 2008, Tri-way Industries Limited entered into a Sales and Purchase of Technology Master License Agreement with the inventor of a patent, Mr. Shan Dezhang, concerning the sale and purchase of the master license rights of a patent registered in China under the name of “Zhi Wu Jei Gan Si Liao Chan Ye Hua Ji Qi Zhi Bei Fang Fa”, with patent number ZL200510063039.9. The Engineeringpatent relates to methods of processing plant straw into animal fodder and Consulting servicesindustrialization of product of plant straw fodder. Under the agreement, Tri-way Industries Limited is licensed to use and to license others to use the secrets, copyrights processes and other intellectual property rights associated with the patent in any territories in the world free from all encumbrances with all rights to the patented intellectual property and related brand and label as provided under the laws of China. The total purchase price of the patent was USD 8,000,000, to be paid in several installments. As Tri-way Industries Limited is not a Chinese company, relevant Chinese authorities must, under applicable Chinese law, approve the assignment. The patent assignment has not been registered. Consequently, under Chinese law, the patent shall not take priority over the interests of third parties who are in good faith. On 15 May 2009, Tri-way Industries Limited (as licensor) entered into a sub-license agreement with SJAP (as licensee) concerning the sub-licensing of the above-mentioned patent (ZL200510063039.9). The license period is 50 years, and the annual license fee is stipulated at USD 450,000. However, as effective patent protection for the patent is 20 years, the excess part of the term is void under Chinese law. The contracting parties of the aforesaid sub-license agreement have never performed the terms of the said agreement and no payment has ever been made by the licensee to the licensor. The parties have no intention to perform the sub-license agreement, and the contracting parties have terminated the said agreement accordingly. Rights to this technology has been transferred to HSA by SIAF after SIAF obtained it, as well as other assets, in exchange for assumed liabilities of Tri-way as a result of the carve-out. On 20 June 2011, SJAP entered into an agreement with Guangzhou City Garwor Trading Company Limited, pursuant to which Guangzhou City Garwor Trading Company Limited transferred its trademarks with registration numbers, 3713869 and 3713868, as well as a microbial patent with patent number ZL200610033295.8. The total transfer fee for the trademarks and the patent was RMB 12 million and the transfer fee for the technology secrets was RMB 1 million. According to the said agreement, the transfer fees shall be paid by the interest generated from the utilization of the patent. Moreover, the said agreement stipulates that any new technology improvements of the invention shall belong to both parties, and that any resulting profits shall be shared equally. Guangzhou City Garwor Trading Company Limited is a shareholder in the transferee and therefore a related party. An evaluation report was not filed with the transaction. Although this is not a formal requirement under Chinese law and the contract is valid, this may lead to the contract being challenged in the future on the basis of unfairness. Moreover, as the transferor, Guangzhou City Garwor Trading Company Limited, is not the owner of the trademark, the said agreement is void under Chinese law and SJAP has therefore not obtained ownership of the aforementioned trademarks. This may be corrected if and when SJAP enters into an agreement with the trademark owner. If SJAP uses the trademark without prior consent of the trademark owner, this would constitute trademark infringement. However, SJAP is intending to write off said trademark, and does not intend to use the trademark in question. Material Agreements Joint Venture Agreements The Company has two types of SFJVCs established under Chinese law: | · | Work is in progress with the developments of Wholesale Centers 1Contractual Joint Ventures (“CJV”); and 2. Operations at Wholesale Center 1 (“WSC 1”) commenced during the first quarter of 2013 and is moving along nicely, developing varieties of regional clients in the Guangzhou City. During the second quarter 2013, we sold over 200 MT of sleepy cod to WSC 1 for it to sell to wholesalers at the Shanghai Wholesale Market and in this respect the corresponding sales were well received by the Shanghai Market such that our sleepy cod was consistently sold at a premium of about RMB6 to RMB10/Kg above its daily market prices. By July 30, 2013, we rectified WSC 1’s water treatment; as such all of its live fish holding tanks are now functioning and stocked with fish from Fish Farm 1. |
| · | Although development work is still in progress on Wholesale Center 2Equity Joint Ventures (“WSC 2”EJV”), having completed of its refrigeration facilities, but in the meantime, and during the first quarter 2013, WSC 2 has started to import Simmental variety of beef cuts from Hubei Province to start selling into local food catering chains with the intention to introduce our beef cuts from SJAP at a later date. However, selling frozen meats requires special quality certificates and retailing permits that WSC 2 is in the process of applying for, but we discovered that the related certification and permits are extremely difficult to obtain and are not confident that they will be obtained before the end of 2013 or beyond.. |
Of the five Chinese joint venture project companies which are CJVs or EJVs, four are CJVs (JFD, JHMC, JHST and SJAP) and one is an EJV (HSA).2 The main difference between an EJV and a CJV is that in a CJV, the obligation of capital contribution shall be determined by the contractual parties themselves. The proportions of capital contribution do not have to be fixed between the Chinese and foreign parties. Profit distribution and risk sharing ratio shall also be determined by the contracting parties themselves which do not have to be the same proportions as the parties’ capital contribution or shareholding therein. The capital contributing parties may specify their profit and risk sharing ratio only and may or may not specify their shareholdings in the CJV. One party may make capital contribution by way of non-monetary assets such as rights in lands, factories and machineries etc. while the other party may make capital contribution by way of cash. In an EJV, the shareholders contribute capital and operate business jointly, and share profits, risks and losses in proportion to their equity contributions. Foreign investor’s capital contribution shall not be less than 25 percent of the total registered capital. The Company engages in projects based on consulting and service agreements (as described under “Consulting and Services Agreements” below), whereby the Company can choose whether the cooperation shall continue under a consulting and service agreement or be acquired by the Company. Consulting and Services Agreement Consulting and service (“C&S”) agreements are important for the operation of the Company’s subsidiaries and partners. Only the Company’s subsidiaries SJAP and HSA do not and have not operated under C&S agreements. Initially, agriculture and aquaculture investors invite the Company to act as a developer and project manager of an agribusiness or food-related project. If the management of the Company sees the proposal as interesting, the Company carries out an in-depth study of the target company including legal due diligence, business plan, budget and projected financial information. The Company makes the decision through a resolution of the Board of Directors. If the Company determines to proceed, the Chinese investor forms a private Chinese company dedicated to the project and the parties sign a C&S agreement. The Company acts as the project manager providing turnkey services to the Chinese developer of the project, meaning that the Company builds the project using its technology, systems, know-how, and management expertise and systems. As such, the Company’s expenditure in the project includes the Company’s own administration and operational expenses provided for and incurred in the project (charged and recorded under the Company’s general and administrative operation expenses), which are billed to the Chinese developer. All other development expenditures (inclusive of the Company’s subcontractors’ and sub-suppliers’ costs and the Company’s marked up profits) are billed to the Chinese developer who will pay accordingly. 2According to the official documents of the Company’s Chinese subsidiary JHMC, the registered capital of such subsidiary is USD 2 million that was paid in full by year ended 31 December 2014. As of April 15, 2019, prospectus, MEIJI, a subsidiary of the Company, has contributed USD 400,000 of the subscribed capital, whereas USD 1.6 million of the subscribed capital has not been paid. Moreover, according to the official documents of the Company’s Chinese subsidiary HSA, the registered capital of such subsidiary is USD 2.5 million and shall be paid in full no later than 18 July 2013. As of April 15, 2019, MEIJI, a subsidiary of the Company, has contributed USD 865,000 of the subscribed capital, whereas USD 234,500 of the subscribed capital has not been paid by the Chinese owner. The aforementioned deadlines can be re-arranged by all the promoters. If no new deadline is agreed upon, failure by MEIJI to make full payment may lead to the other promoters making full payment of the capital contribution on MEIJI’s behalf and requesting MEIJI to compensate for their payment and losses. When the C&S Project Company initiates production the Company acts as the sole marketer of food products and as the supplier for the C&S Project Company under the terms and conditions of the C&S agreement. The Company acts as the selling supplier and buying wholesaler to the company supplying items such as feed, young cattle, and RAS technological components and buys mature prawns, sleepy cod, eels and live cattle. The Company earns a gross profit of between 10-15% based on the C&S Project Company’s revenue on this exclusivity. The C&S Project Company will remain wholly-owned by the Chinese developer until the Company exercises the acquisition option and subsequently converts the company into an SFJVC where the Chinese investor remains as a minority shareholder. The acquisition price is normally determined in accordance with the book value of the Chinese company as of the acquisition date. Consideration will normally consist partly of cash and partly of project loans owed by the Chinese investor, which offset and decrease the purchase proceeds in the corresponding amount. Generally, the agreements that the Company has entered into governing the formation of the unincorporated companies into SFJVCs do not regulate the maturity date for the formation of SFJVC. The date for the formation of the SFJVC is generally left to the discretion of the Company, based on the development and profitability of the relevant project. As of April 15, 2019, the Company has entered into ten C&S agreements. A portion of the C&S agreements contain an acquisition premium clause, in which the accumulated C&S project development fees billed by the Company will be paid in addition to the equity book value at the datetime of this prospectus, we believeacquisition. In the event that either of the investors decides to sell all development work carried out within the first half year of 2013 demonstrated good progress including our own Trading Center (which is now operating althoughor part of its finishing work is stillequity in progress), Leonie Chain’s Central Kitchen (as reported above, 80% has been completed) and the central bakery has been in operation since May 2013, and we have 4 restaurants being completed with work in progress on 2 others. SJAP has completed more than 50% of its construction work on its slaughter house and deboning facilities, HST has completed its revitalization program of its HU Plantation (i.e., new irrigation systems with automatic sprinkle, replacing with organic soil, planting with Immortal Vegetables in between each rollSFJVC to any third party, a portion of the HU plants, extension of staff quarters such that it has accommodation now for more than 40 workers at one time), planned 13 acres of Immortal Vegetable and built associated nursery, commencement of production from Prawn Farm 1, started operationagreements require the selling investor to obtain prior consent of the Beijing Cattle Farmother investor before such sale and wholesale shop, Prawn Farm 2 completed 3 prawn grow-out open dams with RAS systems andto grant the successful breedingright of fingerling of Big Giant Prawns from our 2nd generation breed stocks,first refusal to the establishment of facilities in Madagascar andother investor on the successful production of the lake fish organic fertilizer. We view the foregoing developments as a giant step forward building strong fundamentalslike terms for the Company’s future growth.intended sale. Consequently, we are seeing the 5-year plan play out as envisioned. Particularly at the wholesale level in the fishery and beef divisions, economies of scale are being realized. And the benefits of vertical integration are being achieved gradually, most in evidence between the wholesale and distribution levels. These are enhancing the Company's competitive position. We are beginning to see a multiplier effect generating core sustainable value and adding a layer of corporate maturity and operational reliability, reinforced by all financial metrics continuing to move positively.
Summary of Our Land Assets
| Item | | Owner | | Location | | Project | | Area
(acre) | | Nature of
Ownership | | Tenure | | Date Acquired | | Expiry Date | | Hunan Lot 1 | | Hunan Shenghua A Power Agriculture Co. Ltd. | | Ouchi Village, Fenghuo Town, Linli County | | Fertilizer production | | 31.92 | | Lease | | 43 | | 4-5-11 | | 4-4-54 | | Hunan Lot 2 | | Hunan Shenghua A Power Agriculture Co. Ltd. | | Ouchi Village, Fenghuo Town, Linli County | | Pasture growing | | 247.05 | | Management Rights | | 60 | | 7-18-11 | | — | | Hunan Lot 3 | | Hunan Shenghua A Power Agriculture Co. Ltd. | | Ouchi Village, Fenghuo Town, Linli County | | Fertilizer production | | 8.24 | | Land Usage Rights | | 40 | | 5-24-11 | | 5-23-51 | | Guangdong Lot 1 | | Jiangmen City Heng Sheng Tai Agriculture Development Co. Ltd. | | Yane Village, Liangxi Town, Enping City | | HU Plantation | | 8.23 | | Management Rights | | 60 | | 8-10-07 | | — | | Guangdong Lot 2 | | Jiangmen City Heng Sheng Tai Agriculture Development Co. Ltd. | | Nandu Village of Yane Village, Liangxi Town, Enping City | | HU Plantation | | 27.78 | | Management Rights | | 60 | | 3-14-07 | | 3-13-67 | | Guangdong Lot 3 | | Jiangmen City Heng Sheng Tai Agriculture Development Co. Ltd. | | Nandu Village of Yane Village, Liangxi Town, Enping City | | HU Plantation | | 60.72 | | Management Rights | | 60 | | 4-18-07 | | — | | Guangdong Lot 4 | | Jiangmen City Heng Sheng Tai Agriculture Development Co. Ltd. | | Nandu Village of Yane Village, Liangxi Town, Enping City | | HU Plantation | | 54.68 | | Management Rights | | 60 | | 9-1207 | | — | | Guangdong Lot 5 | | Jiangmen City Heng Sheng Tai Agriculture Development Co. Ltd. | | Jishilu Village of Dawan Village, Juntang Town, Enping City | | HU Plantation | | 28.82 | | Management Rights | | 60 | | 9-12-07 | | — |
| Guangdong Lot 6 | | Jiangmen City Heng Sheng Tai Agriculture Development Co. Ltd. | | Liankai Village of Niujiang Town, Enping City | | Fish Farm, HU Plantation | | 31.84 | | Management Rights | | 60 | | 1-1-08 | | 12-31-68 | | Guangdong Lot 7 | | Jiangmen City Heng Sheng Tai Agriculture Development Co. Ltd. | | Nandu Village of Yane Village, Liangxi Town, Enping City | | HU Plantation | | 41.18 | | Management Rights | | 26 | | 1-1-11 | | 12-31-37 | | Guangdong Lot 8 | | Jiangmen City Heng Sheng Tai Agriculture Development Co. Ltd. | | Shangchong Village of Yane Village, Liangxi Town, Enping City | | HU Plantation | | 11.28 | | Management Rights | | 26 | | 1-1-11 | | 12-31-37 | | Guangdong Lot 9 | | Jiangmen City Hang Mei Cattle Farm Development Co. Ltd. | | Xiaoban Village of Yane Village, Liangxi Town, Enping City | | Cattle Farm | | 41.18 | | Management Rights | | 20 | | 4-1-11 | | 12-31-31 | | Qinghai Lot 1 | | Qinghai Sanjiang A Power Agriculture Co. Ltd. | | No. 498, Bei Da Road, Chengguan Town of Huangyuan County, Xining City, Qinghai Province | | Cattle farm, fertilizer & livestock feed production | | 21.09 | | Land Usage Rights & Building ownership | | 40 | | 11-1-11 | | 10-30-51 | Guangdong Lot 10 | | Jiangmen City Heng Sheng Tai Agriculture Development Co. Ltd. | | Niu Jiang Town Enping City, | | HU Plantation Processing factory | | 6.27 | | Management Right Lease | | 10 | | 4-1-13 | | 4-1-23 | | | | | | | | | | | | | | | | | | | | Total | | | | | | | | 620.28 | | | | | | |
As far as “ownership”of October 1, 2016, when Tri-way became the developer and operator of all fishery C&S Projects formerly under SIAF, CA’s new role is one of turnkey operator appointed by and working on behalf of Tri-way. Land leases Private ownership of land is concerned,not permitted in general allChina. Therefore, the Company leases land that is either collectively owned by the Government. Whereas in urban areas, the land isor state owned directly by the central Government in rural and suburban areas, the land, (agricultural land) is owned by the local village collectives, usually through the villagers’ collective economic organization or the village committees. Uncultivated land in mountain and other remote areas is also Government-owned.use rights. Corporate entities and individuals may own the property (building)(buildings) erected on Governmentthe land. As such, any transferrableLand use rights to the landmay be transferred, but they are in the form of usufructuary rights (i.e., the right to use and enjoy the benefits derived therefrom for a period of time).
There are several types of usufructuary rights. These include the right to land contractual management (granted by local village collectives for agriculture land), the right to use of construction land (state land in urban areas), etc. The right to land contractual management allows a party the right to possess, utilize, and obtain profits from agricultural land. This right is transferrable, but this land use right is based on agricultural household contracts and cannot be changed arbitrarily to non-agricultural purposes.
A usufructuary right properly granted The lease term varies from 27 to 60 years. There are certain uncertainties (e.g., lease term may not exceed 30 years and all transfers have not yet been registered correctly) in accordancerespect of certain leased land due to the fact that not all requirements have been fulfilled or not yet registered. However, the Company believes it is protected against these uncertainties through its agreements with the laws may be transferred, leased, or mortgagedrelevant local Chinese partners and relevant registration processes have been initiated. The Company’s subsidiary HSA has acquired land use rights for state owned land located in accordance with the laws and the terms of the land-grant contract.
1. A lease confers on the recipient the sameOuChi Village, FengHuo Town, LinLi County, Hunan Province. However, HSA has not obtained a land use right to use and enjoy the benefits exceptcertificate for such land, which therefore, for the right to owntime being, cannot be lawfully mortgaged or transferred. Moreover, the building erected byCompany’s subsidiary CA has entered into a Rural Land Management Rights Sub-Sales Agreement for the recipient and the right to transfer. In case of government acquisition of the contractual operating and use rights of 202 mu of collective owned land located in Da San Dui Wei You Nan Village, Shenwan Town, Zhongshan City for a period of 30 years. However, the compensation paid by the government for the building will go to the lessor, unless the lease agreement states otherwise.
The Agreement for the 109.79MU land of HSA is stated to be a lease agreement but the terms therein seem to suggest that HSA is being granted a Management Right.
2 & 3. Land Use Rights and Management Rights confer the same right to use and enjoy the benefits. “Land Use Right” is one granted by the State and usually used in the context of urban land, whereas “Management Right” is granted by local village collectives and the term is usually used in respect of rural land.
4. The term Land Use Right relates to the right to use the land and enjoy the benefits derived there from, whereas Building Ownership Right relates to the right to ownership of the building erected on the land concerned.
SJAP was granted a Land Use Right by the Statetransfer procedures for the land (state-owned land),in question have not been completed. CA is not an enterprise registered in mainland China and therefore, according to Chinese law, cannot acquire the contractual operating and use rights of collective owned land. The Company is currently negotiating with Beijing Hengxintianyi Investment Guarantee Co. Ltd. to designate a subsidiary of the Company in China for the purpose of entering into a new Rural Land Management Rights Sub-Sales Agreement.
License Rights Through the past 10 years (from 2007 to present) the Company has improved and modified the Recirculating Aquaculture System (“RAS”) originally pioneered in Germany into a unique system designed for indoor systems referred to as A Power Module (“APM indoor”) and an outdoor module called open dam RAS (“ODRAS”). We provide two types of licenses under this technology namely, a Developer License permitting a fishery project license to utilize the technology in its design of the APM indoor or ODRAS farms, and an Operator license permitting the use of APM-indoor or ODRAS technology at their respective farms. Each license is granted a 50-year term per assigned module unit for a one-time fee of $50,000 per license, that is a $50,000 fee for rights to the Developer license and a Building Ownership Right$50,000 fee for rights to the buildings erected thereon.Operator license for 50 years per developed module. On November 12, 2008, the Company’s subsidiary TRW entered into an agreement with the inventor of a patent, Mr. Shan Dezhang, concerning the sale and purchase of the master license rights of a patent registered in China with patent number ZL200510063039.9. SIAF's GroupOn May 15, 2009, Tri-way (as licensor) entered into a sub-license agreement with SJAP (as licensee) concerning the sub-licensing of Companies - Rented Premises Profilesthe above-mentioned patent (ZL200510063039.9). For further information on the aforementioned agreements, please refer to the section entitled “Intellectual Property Rights” above.
Carve-outs The Company has announced that it has begun the first of three or four contemplated divestitures. The Company is currently exploring various opportunities for reorganizing or restructuring some of its current assets into new companies by means of mergers and/or acquisitions with the aim to establish higher independent fair market values for said companies (or respective related assets) by either listing each of said companies on a suitable stock exchange or selling them in a receptive market (or to a receptive buyer) The first carve-out (Tri-way) is comprised of aquaculture operations. The new company holds one single share class and shall conform to corporate governance standards assigned by the Hong Kong Securities and Futures Commission as well as the potential Stock Exchange targeted for its listing. The Company’s aquaculture operations, namely the C&S Project farms are, as follows: | · | Company | | Location | | Usage | | Landlord | | Tenure | | | | | | | | | | | | 1 | | Sino Agro Food, Inc. Guangzhou Representative Office | | Room 3801, Block A, China Shine Plaza,
No. 9, Linhexi Rd., Tianhe district,
Guangzhou City | | Head office | | Guangzhou Shine Real Property Development Limited Company | | 9 July 2012 to
8 July 2014 | | | | | | | | | | | | 2 | | Jiangmen City Heng Sheng Tai Agriculture Development Co. Ltd. | | Unit 1-3, Jiangzhou Shuizha Building, No. 19 Jiangjun Rd., Juntang Town, Enping City | | Office | | Enping City Jiangzhou Water Engineering Management Dept. | | 1 April 2013 to
31 March 2018 | | | | | | | | | | | | 3 | | JiangmenJiang Men City A Power Fishery Development Co., Ltd. (Fish Farm 1); |
| | Room 202, Finance Building Chang’an Street, Niujiang Town, Enping City | | Office | | The Economic Development Office of Enping Government | | 15 July 2011 to
14 July 2016 | | | | | | | | | | | | 4 | | Jiangmen City Hang Mei Cattle Farm Development Co. Ltd. | | Unit 4-5, Jiangzhou Shuizha Building No. 19 Jiangjun Rd., Juntang Town, Enping City | | Office | · | Enping City Jiangzhou Water Engineering Management Dept.Bi Tao A Power Prawn Culture Development Co., Ltd. (Prawn Farm 1); |
| · | Zhongshan A Power Prawn Culture Farms Development Co., Ltd. (Prawn Farm 2), and; |
| · | Zhongshan New Prawn Project (ZSNPP) Phase 1 June 2012as well as an opportunity to 30 June 2017acquire additional phases of the project as development continues. The ZSNPP is targeted to reach an annual production capacity of at least 200,000 metric tons over the long term. |
INDUSTRY OVERVIEWEstablishing the proposed new company would in management’s view expedite the attainment of several of the Company’s strategic objectives:
| · | Simplify the structure of the Company by creating a rapidly growing, profitable aquaculture company focused on the production of seafood with unique expansion potential; |
| · | Create a company with an independent board of directors, a shareholder nomination committee, a single share class, a separate management team and auditors, dedicated reporting and investor relations functions; |
| · | Expose the new company to institutional investors with in-depth knowledge and high appreciation of aquaculture businesses. Facilitate funding to increase ownership in existing aquaculture facilities, and; |
| · | Create an independent company to secure funding for the future development of additional stages at the significant Zhongshan New Prawn. |
As a result of the carve-out, Tri-way, as of October 1, 2016, is now categorized under SIAF as an investor in associate status from its original categorization as a SIAF subsidiary. Prior to the carve-out, Tri-way had assumed 100% holdings in JFD (previously, a 75% owned subsidiary) on August 16, 2016. Subsequently, Tri-way has merged/acquired in exchange for equity, all C&S farm projects and their respective assets. Industry Overview This section discusses the industry in which the Company operates. Certain of the information in this section relating to market environment, market developments, growth rates, market trends, industry trends, competition and similar information are estimates based on data compiled by professional organizations, consultants and analysts, in addition to market data from other external and publicly available sources. Economic outlook in China China’s economy is at present second only to that of the United States (third, if the European Union is counted as one economy), having overtaken Japan’s role as number two in 2010.1 The OECD expects that China’s real GDP will grow by 8.5% in 2013 and by 8.9% in 2014.2 The IMF expects that China will be the worlds’ largestStates. China's economy in 2017 with 18.3% of the world economy. The USA’s share is expected to fallexpand 6.2 percent in 2019 from 6.6 percent in 2018. Growth has slowed somewhat following government efforts to 17.9% by 2017.3 The strong growthtry and rein in high levels of debt. China has delivered major improvementsstarted feeling the effects of the trade war with the United States, which has resulted in living standards and poverty has been reduced dramatically.4new tariffs on more than $250 billion of Chinese exports. Based on the World Bank’s classification, China recently graduatedhas had a remarkable period of rapid growth shifting from lowera centrally planned to a market based economy. Today, China is an upper middle-income status. A growing emphasis on improving access to health and education as well as high investment in infrastructure have helped spread the benefits of growth nationally including in rural areas, where incomes have enjoyed consistently strong gains. Recent OECD simulations suggestcountry that China could maintain high, though gradually easing, growth during the current decade, averaging 8% in per capita terms.has complex development needs.
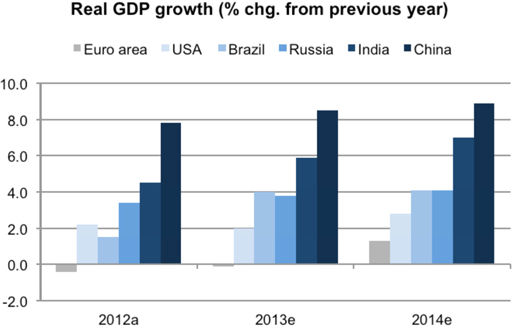
Source: OECD Economic Outlook No. 92 (database)/OECD economic surveys: China 2013
| Time Period | | | Low and middle
income countries | | | | China | | | | High-income
countries | | | | United
States | | | 1990-2000 | | | 3.3 | | | | 10.4 | | | | 2.7 | | | | 3.4 | | | 2000-2010 | | | 5.9 | | | | 10.5 | | | | 1.6 | | | | 1.7 | | | 2010-2020 a | | | 5.6-7.4 | | | | 7.4-10.1 | | | | 2.0-3.1 | | | | 2.3-3.5 | | | 2020-2030 a | | | 4.2-6.6 | | | | 4.2-7.8 | | | | 1.3-2.7 | | | | 1.5-3.0 | | Average annual per capita GDP growth Source: OECD Economic Outlook No. 92 (database)/OECD economic surveys: China 2013 | | | | | | 1990-2000 | | | 1.6 | | | | 9.3 | | | | 2.0 | | | | 2.3 | | | 2000-2010 | | | 4.6 | | | | 9.8 | | | | 1.0 | | | | 0.7 | | | 2010-2020 a | | | 4.4-6.1 | | | | 6.8-9.5 | | | | 1.6-2.6 | | | | 1.5-2.7 | | | 2020-2030 a | | | 3.4 | | | | 3.9-7.6 | | | | 1.1-2.4 | | | | 0.9-2.4 | |
Source: World Bank calculations using Envisage Model.
a. The lower and upper bounds reflect average growth rates in the low-growth and high-growth scenarios.
1 The World Bank; China 2030, Building a Modern, Harmonious, and Creative Society [pages 3, 376-377], 2013
2 OECD Economic Outlook No. 92 (database)/OECD economic surveys: China 2013
3 IMF, October 2012
4 The World Bank; China 2030, Building a Modern, Harmonious, and Creative Society, 2013 [pages 3, 376-377]
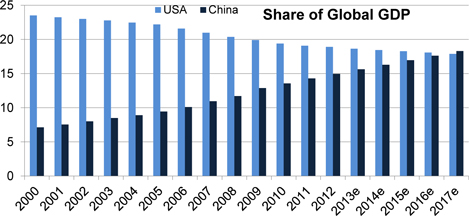
Source: IMF, October 2012
The share of the population aged 20 to 64 in the total population is expected to peak soon, according to the OECD, and the elderly dependency ratio will continue to rise, exerting downward pressure on saving rates. Agricultural employment has been falling for a decade at an average rate of 3.5% annually, with massive migration from the countryside to cities. Continuing migration of workers out of agriculture is expected to help boost farming profitability, leading to further gains from more mechanization. In addition, some consolidation of farms into bigger units may occur provided that the laws governing the ownership of rural land-use rights are changed to allow the sale of use-rights and favor the rental market for agricultural land, according to the OECD.5
Agriculture in China Agriculture is a vital industry in China, is the world’s largest agricultural economy. It is the leading producer of many agricultural commodities such as pork, horticultural products,employing over 300 million farmers. China ranks first in worldwide farm output, primarily producing rice, wheat, potatoes, tomato, sorghum, peanuts, tea, millet, barley, cotton, oilseed and cottonsoybeans and also the largest consumer of many agricultural products, such as pork, rice and soybeans. Although accounting for only 10 percent of arable land worldwide, it produces food for 20 percent of the world's population. While China generally has been successful in meeting its rapidly rising demand for food and fibergrains by increasing domestic production, it has emerged as a leading global importer of several agricultural commodities, including cotton, soybeans, vegetable oils, and animal hides. As its domestic agricultural production has grown, China has also become the largest exporter in global markets for several horticultural products, including mandarin oranges, apples, apple juice, and garlic and other vegetables. China’s increasingly important position in global agricultural markets followed decades of gradual growth in domestic food production and consumption. After the introduction of market-based reforms in 1978 that included the elimination of the collective production system and relaxation of government direction over certain farmingfarmer production and marketing decisions, Chinese agricultural output grew significantly. Between 1978 and 2008, China almost doubled its production of grains (rice, wheat and corn) and quadrupled its production of meats; the production of fruit and milk was about 30 times greater in 2008 than in 1978. During these three decades, population growth of about 1%1 percent annually, coupled with annual per capita income growth of 8%,eight percent, fueled a large increase in demand for more and higher-value agricultural products, especially by China’s large and growing middle class. China’s rapid growth in food consumption was largely met by domestic production growth, enabling it to remain self-sufficient in most major commodities. About 40% of China’s population of 1.3 billion is employed in the agricultural sector, and agriculture contributes about 11% to China’s GDP.6 China’s support for agriculture China’s government support for agriculture is low compared to that of developed countries, such as the United States and the member states of the European Union, but in line with that of other rapidly growing economies, according to the United States International Trade Administration, or the USITC. As measured by the OECD’s PSE73, the amount of support provided to Chinese farmers was low (and sometimes negative) during the 1990’s, but gradually rose to 9% in 2007.during the period 2008-2010. Compared with other countries at a similar level of development, including Brazil, Mexico, Russia, and South Africa, China’s support for farmers falls in the middle of the range. China’s PSE reflects changes in the central government’s policy priorities from grain self-sufficiency and low consumer prices toward a stronger focus on raising farm household incomes, according to the USITC. 5 OECD Economic Surveys China, March 2013 [Pages 20-21]
6 USITC: China’s Agricultural Trade: Competitive Conditions and Effects on U.S. Exports, March 2011 [pages 1-1 and1-8]
7 OECD: PSE is defined as the estimated monetary value of transfers from consumers and taxpayers to farmers, expressed as a percentage of gross farm receipts (defined as the value of total farm production at farm gate prices), plus budgetary support
Government support to China’s agricultural sector indicates that Chinese policymakers are placing a renewed emphasis on the rural economy. Indirect support, in the form of general services, is very high relative to similar support programs in other countries, due largely to investments in agricultural infrastructure. General services include modern research and extension services, food safety agencies, and agricultural price information services, most of which provide benefits to producers and consumers throughout the economy. Compared with direct payments to farmers, general services support is less production-distorting to the sector. Agricultural consumption China is a major global consumer of agricultural products. It consumes one-third of the world’s rice, one-fourth of all corn, and one-halfhalf of all pork and cotton, and it is the largest consumer of oilseeds and most edible oils. The traditional Chinese diet centers around staple foods (mainly grains and starches), which account for nearly one-halfhalf of the daily caloric intake. Average Chinese per capita consumption recently stabilized at approximately 3,000 calories per day, one of the highest levels among Asian countries. Chinese food consumption is influenced by factors such as population size and demographics, income, food prices, and general preferences. Per capita income growth and urbanization are the two factors most responsible for altering recent consumption patterns in China. Rising income translates into higher per capita food consumption, while increasing urbanization is driving diversification of food choices because of greater availability and choice offered through increasingly diverse sales outlets. Chinese consumers generally fall into one of three categories: rural consumers; urban low-income consumers; or urban high-income consumers. Although urban high-income consumers can afford to buy more and better-quality food, the ubiquity of food outlets in cities means that nearly every urban resident, regardless of income, has available an increasingly diverse food selection. Compared to rural diets, urban diets contain less grain and more non staplenon-staple items, including processed and convenience foods. Rural migrants to cities tend to adopt the urban diet. Expenditure on food Food is the largest class of household expenditure for all Chinese income groups; even housing takes a smaller share of average household income, according to the USITC. As income rises, the absolute amount of food expenditure increases, although the share of income spent on food falls. Urban residents spend substantially more on food than their rural counterparts, according to the USITC. Higher incomes lead to an increase in both the quantity and quality of food demanded. However, while demand for higher quantities of food appears to level off in the top income households, demand for higher-quality foods continues to rise with income spending on food consumed outside the home being on the rise. In 2003, about 18% of urban household food expenditures and over 11% of rural household food expenditures were made outside the home. In 2008, the average per capita annual expenditure on dining out was $127 among urban residents, up 26% from a year earlier. Per capita expenditures on food consumed away from home vary among regions, with Shanghai spending the most ($300) and Tibet the least ($84). Most such expenditures are made in restaurants, both independent establishments and fast-food chains. Although consumption away from the household is increasing, most foods are still eaten at home. The exception is meat, with about half of all meat consumed outside the home.income. Food preferences
Along with more varied consumption, higher incomes are leading3OECD: PSE is defined as the estimated monetary value of transfers from consumers and taxpayers to changing food preferences, including demand for better quality and safer foods. Food preferences determine where urban Chinese purchase their food, whether it befarmers, expressed as a percentage of gross farm receipts (defined as the value of total farm production at local “wet markets,” urban supermarkets, or restaurants. Chinese value the diversity in food products that different shopping outlets offer. In the future, analysts predict that further income growth and urbanization will continue to increase demand for a variety of higher quality foods, according to the USITC.farmgate prices), plus budgetary support.
Like that of other countries at similar stages of development, the traditional Chinese diet comprises mostly grains and other starches. Consumption of non-staple, higher-value foods such as meat (especially pork), dairy, fruits, vegetables, and processed food has grown significantly in the past three decades; 30% of the food currently consumed in China has been processed in some way, according to the USITC.
China’s per capita expenditures for animal proteins for 2008 averaged $184, up from $137 in the previous year. The Chinese consume about four times as much pork as poultry, the second most popular animal protein. Pork consumption has been encouraged by improved cold storage distribution, as the product can be transported greater distances to reach more customers. Pork consumption levels are also high due to government support programs, including purchasing pork for reserves and occasionally subsidizing pork purchases for low-income consumers.
Food quality and safety are important factors affecting Chinese food preferences. High-income urban groups that focus their expenditure on high-quality products also seek assurance that their food is safe. Safety concerns can determine where certain foods are bought: fresh produce is usually purchased at a wet market because fresher produce is perceived to be safer, while meats are increasingly bought at a supermarket because of the availability of cold storage.8
The market for aquatic products and aquaculture in China The information in this section regarding aquatic and aquaculture, including graphs, is taken from the USDA’s GAIN Report Number: CH12073 per 12/28/2012 unless otherwise stated.94
Total Aquatic Products Production China has the world’s largest aquatic production and its market share of the world’s fish production has risen from 7%7 percent in 1961 to 35%37 percent by 2010.102012. China alone accounted for 62.5 percent of the aquaculture production in the world by volume in 2015. Aquaculture represents more than 71.9 percent of the total fish production in China. Total 20122015 aquatic production in China is estimated to increase fourincreased 4.38 percent over last year to reach 5847.9 million tons, compared to the 5645.8 million tons in 2011 and 53.7 million tons in 2010, according to2014, per the USDA. FAO. 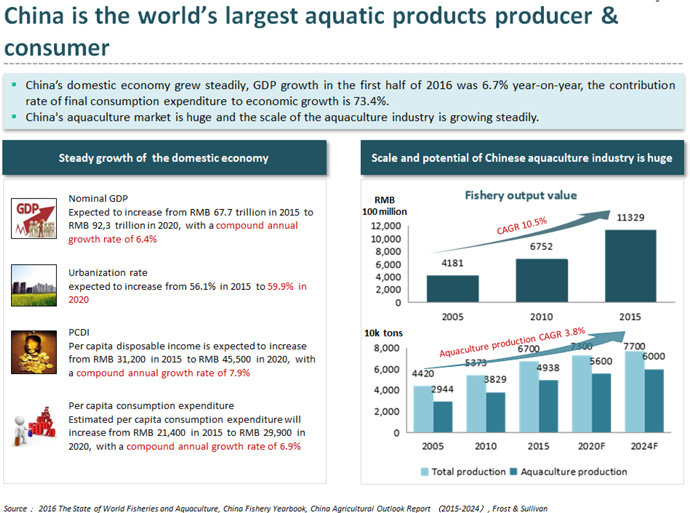
Fish production accounts for 59%59 percent of the total aquatic production, followed by shellfish and crustaceans at 22.6%22.6 percent and 10%,10 percent, respectively. Fish production is, according to the USDA, expected to continue its upward growth trend to reach 34.5 million tons in 2012, up from 33 million tons in 2011 and 31.3 million tons in 2010. In 2011, Shandong, Guangdong, Fujian and Zhejiang provinces profited from favorable coastal locations and abundant freshwater resources/facilities to rank as the top four aquatic production areas. In terms of freshwater cultured production, Hubei, Guangdong, and Jiangsu provinces are the largest producers. These rankings are expected to remain unchanged in 2012, according to the USDA.
China has a long history of aquaculture but large-scale production only began after the founding of the People's Republic of China in 1949. More recently, after China opened up to the outside world in the 1980's, the sector has been growing dramatically, becoming one of the fastest growing sectors among the agriculture industries in China.11
China remains the world largest aquaculture producer with total cultured aquatic production accounting for about 70% of the world total in recent years, based on industry sources. Total aquaculture water area reached 7.83 million hectares (MHa) in 2011 from 7.65 MHa in the previous year, with the majority (164,000 Ha) expansion in freshwater facilities. While the majority of cultured facilities are fresh water due to available natural resources, growth in seawater facilities has outpaced that of freshwater facilities over the past four years, rising 33% between 2008 and 2011, compared to 15% for freshwater. Aquaculture area growth slowing overall, investment in facility expansion is slowing, with 2011’s 2.5% expansion cooling significantly from 2009’s 14% expansion. Government officials relate that environmental concerns and the rapid industrialization/urbanization of China’s coastal region are hampering further aquaculture expansion.
Aquaculture fish production dominates the sector with a total production of 22.8 million tons, accounting for 69% of total fish production in 2011. Carp remains the most popular cultured freshwater fish with total production of 15.6 million tons in 2011 (up from 15.1 million tons in 2010), accounting for 72% of total freshwater cultured fish production, according to the USDA.
Cultured freshwater and seawater shrimp and prawn are produced primarily in Guangdong, Jiangsu, Hubei, Zhejiang and Guangxi provinces. In 2011, Guangdong led shrimp production with total cultured production of 609,207 tons, compared to 554,000 tons in 2010. Eel production is concentrated in Fujian, Guangdong, and Jiangxi provinces, and much of the production is destined for the Japanese market.
Aquatic consumption
As China’s processing and distribution systems become more developed and consumers rising affluence increases their interest in a more diversified and nutritious diet, seafood consumption is on the increase. According to the National Statistics Bureau, the per capita consumption of aquatic products was 14.62 Kg per urban dweller and 5.36 Kg per rural inhabitant in 2011. Per capita consumption is expected to increase steadily, with strong growth potential in the rural sector. The per capita consumption of aquatic products is highest in coastal regions, for example in Shanghai and Guangdong, (where aquatic products have been a traditional source of protein) and locations with relatively high disposable income.
According to Ministry of Agriculture (MOA) survey results (among 80 major aquatic product wholesale markets), the average wholesale price for aquatic products@2019 undercurrent news, China’s seafood imports increased by 8.5%44% to $12bn in 2018. In the first eighttwelve months to the end of 2012 from the previous year. The price increased by 9.7% for sea water products, and 6.9% for fresh water products. Prices for aquatic products are expectedDecember 2018, China imported CNY 787bn worth of seafood, according to grow in 2013, reflecting increases in the price of feed and other inputs.Chinese customs data. 84USITC: China’s Agricultural Trade: Competitive Conditions and Effects on U.S. Exports, March 2011
9Definition of terms: China’s definition of aquatic products includes both cultured (farm-raised) and wild caught products; aquatic products include fish, shrimp/prawn/crab, shellfish, algae, and other. Aquatic catch production is total volume of both fresh and seawater wild caught aquatic products; Aquaculture production is the total volume of both fresh and seawater cultured (farmed) aquatic products. This reportprospectus will use Chinese terminology to maintain consistency between Chinese statistics and product categories. Total aquatic trade statistics below do not include fishmeal.
10 The State of World Fisheries and Aquaculture 2012, FAO
11FAO – National Aquaculture Sector Overview China
TradeAquaculture
Total aquatic trade value in 2012 is estimated at $27 billion, up four percent over $25.8 billion in 2011, according to the USDA. Total trade volume is expected to fall by two percent. According to MOA statistics, in the first three quarters of 2012, total aquatic trade volume stood at 5.86 million tons, down 2.4%, while trade value was $19.4 billion, up 6% over the previous year. Total aquatic import volume was 3.1 million tons, down 0.9% over the previous year; total aquatic trade surplus reached $7.5 billion, up $912 million over the same period from the previous year. Industry sources expect the 2012 total trade value will hit $27 billion. China’s aquatic export trade destinations (with export values over $100 million) rose from 17 countries/regions in 2009 to 25 in 2011 and will likely increase in 2012. Japan continues to be the largest export destination, followed by the United States and South Korea.
Exports and imports
Export value is expected to rise to $18.5 billion, up four percent over 2011. This growth is mainly due to increased prices as volume is expected to fall from the previous year. Most Chinese industry insiders believe that a stable recovery of global economies support higher aquatic exports in the near future.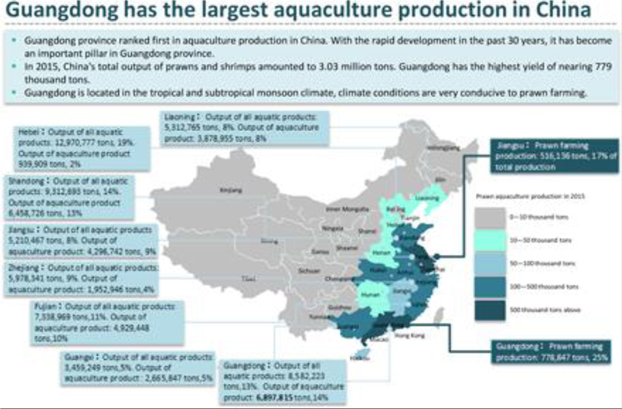
Import value is estimated at $5.7 billion in 2012, almost unchanged from the previous year; however, total import volume is likely to be 2.6 million tons, down four percent over the previous year. Russia is expected to remain China’s largest supplier of aquatic products in 2012, followed distantly by the United States and Japan. Qingdao and Dalian continue to be the two largest arrival ports for aquatic products, accounting for 80% of the total import volume in first ten months of 2012. Well-established facilities, including processing factories in Qingdao and Dalian, solidify their status as the largest seafood import hubs in China.
China’s fishery production policy
China’s fishery production policy remains generally unchanged. In the 12th Five Year Fishery Development Plan, the MOA plans to continue to promote a more sustainable development model with resource utilization, environmental protection, production of safe products, and increases in farmer income as major priorities. In November 2012, MOA published a notice promoting a sustainable and healthy development of marine fishing in other territorial seas. The notice stressed the need to upgrade fishing facilities to maintain a stable catch volume which reached 1.15 million tons in 2011.
Implementation of aquaculture licensing system continues
The MOA will continue to implement a nationwide aquaculture licensing system during the 12th Five Year Fishery Development Plan period. Licensing thousands of small-scale aquaculture facilities, however, has proven to be a challenge for the government. As of the end of 2011, 79% of aquaculture facilities had obtained production licenses.
The policy on aquatic processing trade remains unchanged
China’s government reportedly positive view of the aquatic processing trade may be due to its role in generating new employment and producing rendered feed ingredients that are in demand by the growing feed industry. If imports are exported as processed products, they will not be subject to a tariff or value-added tax (VAT). Imports sold in China are subject to tariff and VAT.
According to MOA, the share of processing trade has declined, accounting for 28.6% of aquatic export value in 2012 (compared to 33% in 2010). Nevertheless, both Chinese industry and official sources claim that China is becoming the world’s processing center for mackerel, salmon, cod, and herring. Industry sources note that the number of enterprises involved in the “Processing Trade” is on the rise, especially in Shandong and Liaoning.
Aquatic exports for domestic consumption
High import costs, which include a duty plus value-added tax approaching 25%, make imports for domestic consumption expensive. Some industry experts are calling for reduced import duties and VAT for seafood species that are not produced in China to encourage more imports for domestic consumption.
Import certificate for live edible aquatic products
Through bilateral consultation, a NOAA amended version of the Health Certificate for live edible aquatic products was approved by the Administration for Quality Supervision, Inspection and Quarantine of China, or AQSIQ. Obtaining the certificate for live edible aquatic product may remain an issue for exporters.
New hygiene certificate for US imported fishmeal
In late July 2011, the Department of Commerce, NOAA, the Seafood Inspection Program and AQSIQ reached agreement on a new health certificate for fish meal and fish oil exports to China, which took effect on July 1, 2012. In addition, AQSIQ approved registration of 26 US fish meal and fish oil exporters.
New health certificate for fish and fishery products
On April 10, 2012, AQSIQ requested an amendment to the US Health Certificate for Fish and Fishery Products destined to China, effective Jan 1, 2013. In late December, the Department of Commerce, NOAA, the Seafood Inspection Program and AQSIQ agreed on a new certificate which will be implemented January 1, 2013. The current certificate will be accepted for entry into China for fish and fishery products exported prior to January 1, 2013. Any fish and fishery products exported from the US after January 1, 2013 to China must be accompanied by the new health certificate.
Marketing
Due to market development efforts, domestic demand has increased for imported frozen aquatic products. Salmon, snow crab legs, and cod are all products commonly available in supermarkets. Product identification, such as brand names, logo and country of origin are important tools to attract consumer interest.
Scallops, salmon, Alaskan snow crab legs, king crabs, black cod, and oysters are popular items in many upscale hotels which commonly feature these products in buffets. With the proper display, high-value imported items can be promoted to customers.
Importers claim high value U.S. seafood products are easy to sell in both first and second tier cities, even in coastal cities such as Qingdao. Major obstacles include inconsistent availability due to insufficient supply and counterfeit products.
The market for meat in China China is by far the world’s largest producer and consumer of meat which includes pork, poultry and beef. Historically, this situation did not have a large impact on the rest of the world, as China, for the most part, maintained self-sufficiency in meat. However, since 2007 the situation has changed dramatically. China has gradually turned into a net importer of meats. World meat production was around 297.1323 million tons in 20112017.5 Global trade in meat is projected to be 20% higher in 2027, representing a slowing down of meat trade growth to an annual average of 1.5% compared to 2.9% during the previous decade.6Meat imports into Asia account for 56% of global trade, and forecast to grow by lesspoultry will constitute more than 2% to 302 million tons in 2012.12half of this additional import demand. China’s meat production reached 79.5786.60 million tons in 2011, including 50.532018, where total meat production in the United States amounted to 47.06 million tons of pork, yet the overall production was slightly less than the consumption; meanwhile, the net imports of meat climbed 33.59% year on year to 1.57 million tons. According to the “12th Five-Year Plan” of the meat industry, it is expected that by the end of 2015, China’s total meat output will have reached 85 million tons, consisting of about 63% pork.in 2018. With strong economic growth and the improvement of living standards, the demand for beef in China is rising.7China’s urbanization has been occurringanimal feed market is projected to grow at a faster pace than commonly expected. By the endCAGR of 2011, the urban population for the first time exceeded the rural population, reaching 51.3% of the total population. If rural migrants working in urban areas are included, the population working and living in urban areas accounted for about 70% of the total population.over 16% till 2019.8 Urbanization5Review of Recirculation Aquaculture System Technologies and rising purchasing power has led to a dietary pattern change switching from the consumptiontheir Commercial Application, Stirling Aquaculture, Institute of traditional food grain products to an increaseAquaculture.
6Food Outlook, FAO, November 2018 7Research Report on Beef Import in consumption of meat.China, 2019-2023 813 The change in consumer preferences, meaning higher priced red meat representing a major part of Chinese consumers main protein source, partly derives from the perception that consumption of red meat is equal to higher status than consumption of poultry or pork.14China Animal Feed Market Forecast and Opportunities, 2019 There are several other specific market drivers which underpin the increase in demand for red meat. One driver is the improved living standard in China which stimulates the growth of beef markets since beef often sells at a much higher price and traditionally goes beyond a majority of people's affordable level.has been more expensive than what most people can afford. Another is the fact that Chinese people'speople’s dietary structure is becoming more diversified and reasonable, bringing larger amount of beef consumption since beef has nutritional benefits. Lastly, further regulationa gradual lowering of China's beef industryimport taxes is likely to ensuresupport sufficient supply of cattle and promote the development of the beef industry which would result in safer and healthier beef products.15cattle. The strong rise in feedFeed grain prices are projected to remain low during 2018-2027. The year 2017 was affected by numerous outbreaks of Avian Influenza (AI) around the world which resulted in a slower increase in world output. China, the past five years is now moving substantially throughsecond largest producer after the market chain and is being reflected in higher meat prices withUnited States, was particularly affected by several outbreaks over the exception of poultry where adjustments have been made. On the contrary, world meat consumption continues to grow at one of the highest rates among major agricultural commodities.last years. Thus, developing countriesChina can expect an increasea return to historical trend growth in poultry production from 2018 onwards. Globally, the share of meat imports despite strong meat prices, driven by population and income growth and high income elasticity of demand. Equally so, strong prices will result in sustained export earnings, which will encourage large meat exporting countries to invest in international meat markets. When breaking the expected increase of demand down by region it is evident that the Asia and Pacific region is projected to stand for the largest increase in demand by far.16
The supporting policies from Chinese governmentoutput traded is expected to ensure adequate supplyremain constant at around 10%, with most of cattle sourcesthe increase in volume coming from the upstream areapoultry meat. The projected production growth in developing countries remains insufficient to satisfy demand grown, particularly in Asia and improve the quality and taste of beef products. Therefore, consumers are likely to get safer and healthier beef products and beef consumptionAfrica. As a result, import demand is expected to moveremain strong.9
Market drivers
The improvement of living standard stimulates the growth of beef markets: Traditionally, Chinese people eat pork and chicken to satisfy their desire for meat. This is largely due to the much higher price of beef which goes beyond normal people’s affordable level. With the improvement of living standards, Chinese people have begun the upgrade of their consumption of meat, and began to eat more beef. Chinese people’s dietary structure becomes more diversified and reasonable, bringing larger amount of beef consumption: At present, Chinese people are changing their diet patterns to higher and richer nutrition. From a higher development levelnutritional perspective, beef not only contains high unsaturated fatty acids and high protein, it also has low fat and lots of nutrition, which makes it perfect for the healthy diet. Thus, in the near future.future, beef is expected to replace some parts of the market shares in pork, chicken and other meats.1710 12Food Outlook Global Market Analysis, published by the Trade and Market Division of FAO under Global Information and Early Warning System (GIEWS), November 2012
13China’s growing appetite for meats: Implications for World meat trade. A Multi-Client Study, April 2012
14China and Hong Kong: Food Opportunities for Maine, Maine International Trade Center, March 2012
15Frost & Sullivan: China’s beef market has great growth potential
16Meat - OECD-FAO Agricultural Outlook 2012-2021
17Frost & Sullivan: China’s beef market has great growth potential
The market for fertilizer in China Demand for fertilizer in China is forecast to increase 3.3% per annum through 2015 to 262 million metric tons. Sales of fertilizers are expected to be supported by healthy expansion of agricultural activities as the amount of sown areas continues to grow and rural income levels rise. Farmers will continue to register steadily increasing incomes, the result of growing crop prices and government subsidies designed to supplement their revenues and reduce their material costs. Subsidies aimed directly at cutting the cost of fertilizers is expected to encourage additional use. In addition, rising crop prices have encouraged farmers to invest in fertilizers to further boost crop yields. Advances will also be driven by increases in the hectaresacreage of sown land dedicated to growing cash crops. However, increasing demand for organic food and improved understanding of the correct application of fertilizers is expected to prevent demand from rising at a faster pace.
In value terms, fertilizer demand is expected to grow 6.0% per yearfrom over $195 billion in 2016 to 548over $245 billion yuan, outpacing gains in volume terms. 2020.11Faster value growth will be driven by strong demand for higher value multi-nutrient fertilizers. In addition, advances will be supported by continued growth in fertilizer prices as the cost of natural gas, oil, coal, and other raw materials continues to increase. Demand for fertilizer nutrients in China is projected to grow 4.4%4.4 percent annually through 2015 to 98.1 million metric tons. Nutrient demand will be stimulated by increasing use of higher nutrient level products as income levels grow in rural areas in China. In addition, government efforts to promote multi-nutrient fertilizers will also support gains in fertilizer nutrient demand. Accounting for more than three-fourths of total fertilizer demand in 2010, single-nutrient fertilizers will remain the larger product type through 2015, despite a relatively low growth rate of 2.1%2.1 percent per year. Sales of single nutrient fertilizers will continue to be supported by their relatively low prices. Multi-nutrient fertilizer demand will post a strong annual growth rate of 7.3% through 2015, fortified by government efforts to promote their utilization. The size, growth and composition of fertilizer demand in the six regions that make up China vary considerably. The Central-South and Central-East will remain the two largest regional fertilizer markets. Due to the comparatively high income levels in the Central-South and Central-East — -which enable residents to afford more expensive food items – -demand for cash crops such as fruits and vegetables will rise in these regions, which in turn will fuel demand for fertilizer. Sales in the Northeast and Northwest regions will outpace the average through 2015, benefiting from the Great Western Development Strategy, the Northeast Revitalization Policy, and increasing income levels for farmers.1812 9 Meat - OECD-FAO Agricultural Outlook 2018-2027 10Frost & Sullivan: China’s beef market has great growth potential 11Fertilizer Market Global Report 2017, Business Research Company 12Fertilizers in China, Industry Study with Forecasts for 2015 & 2020, Freedonia Group; June 2012 In 2006, the central government started a program intended to partially compensate farmers for price increases in fuel, fertilizer and other agricultural inputs. In the case of fertilizers, government support is part of several separate programs targeting fertilizer producers, with cost reductions being passed along to farmers purchasing the input. By 2009, fuel and fertilizer subsidies totaled $10.5 billion.19 Market for fruits and vegetables in China The information in this section regarding the market for fruit in China is taken from the International Trade Center report “Overview of the markets for selected tropical fruits and vegetables in China” unless otherwise stated. China is the biggest producer of fruit in the world, with a total of approximately 10,734,259 hectares of fruit planting area and a fruit output of approximately 192,202,000 tons as of 2008, according to the National Bureau of Statistics of the PRC. The per capita annual fruit consumption in China as of 2008 amounted 149 kilograms per capita, well above the global average of 69.09 kilograms per capita, according to FAO. In 2009, China exported 5,255,000 tons of fruit, an 8.5 percent year-on-year increase compared to the previous year, equivalent to a value USD 3.83 billion according to China Customs. The Chinese import of fruit in 2009 amounted to 2,309,000 tons, valued to USD 1.63 billion, a 37.0 percent increase year-on-year compared to 2008. This led to a fruit trade surplus of USD 2.2 billion, approximately a 27.6 percent decrease compared to 2008 according the Ministry of Agriculture of the PRC. The global tropical fruit output, where the dragon fruit (Hylocereus Undatus) is included, reached roughly 82,700,000 tons in 2008 according to FAO. The output was led by mango, followed by pineapple, guava and avocado. According to the Ministry of Agriculture of the PRC, tropical fruit accounted for approximately 25 percent of the total fruit planting area in China in 2009, equivalent to roughly 2,500,000 hectares providing a total output of more than 20,000,000 tons. The research adds that an additional 17,500,000 hectares spread over China is suitable for planting tropical fruits. The most commonly consumed tropical fruits in China are pineapple, mango, banana, litchi, coconut, longan and cashew. However demand for, e.g., mangosteen, star fruit, durian and dragon fruit is quickly growing among the population in the first and second tier cities. The China Fruit Marketing Association estimates that the consumption of tropical fruits accounts for roughly 10 percent of all the fruit in China, equivalent to approximately 19,000,000 tons. Analysts estimate that about 80 percent of the tropical fruit in China is consumed fresh, contrary to canned or processed fruit. Consumer trends Consumers in the northern and central parts of China generally prefer more sweet tasting fruit, preferably tropical fruits. In the southern regions of China however, the population consumes a broader range of fruits. Overall in China, consumers have started to consume more fruit with distinctive smells, for example durian and jackfruit. During recent years there has been a significant increase in consumption of more expensive fruit, such as durian, mangosteen and jackfruit thanks to the increasing standard of living of the population as well as the increased availability of such imported fruits. The most commonly consumed imported fruits in China include kiwi, durian, mangosteen, grapes, cherries and dragon fruit. Generally, the Chinese population prefers to consume fresh fruit; so when domestic, fresh fruit is available during summer, consumption of the fresher and cheaper domestic fruit increases. In winter, when domestic products cannot be harvested or sold, the import of fruits, and especially tropical fruits, increases immensely. Organic fruits are mostly sold domestically in China and have become increasingly popular in the market; however, the supply is still relatively small and the price is still more expensive (approximately RMB 1-2 more expensive per kg). GOVERNMENT REGULATION
Regulation of M&A and Overseas Listings On August 8, 2006, six PRC regulatory agencies, including the Ministry of Commerce (the “MOFCOM”), the State Assets Supervision and Administration Commission, the State Administration of Taxation (“SAT”), the State Administration of Industry and Commerce (the “SAIC”), the China Securities Regulatory Commission (“CSRC”), and the State Administration of Foreign Exchange (the “SAFE”), jointly issued the Regulations on Mergers and Acquisitions of Domestic Enterprises by Foreign Investors (the “M&A Rules”), which became effective on September 8, 2006 and was amended on June 22, 2009. The M&A Rules include provisions that purport to require that an offshore special purpose vehicle formed for purposes of the overseas listing of equity interests in PRC companies and controlled directly or indirectly by PRC companies or individuals obtain the approval of the CSRC prior to the listing and trading of such special purpose vehicle’s securities on an overseas stock exchange. On September 21, 2006, the CSRC published on its official Website procedures regarding its approval of overseas listings by special purpose vehicles. The CSRC approval procedures require the filing of a number of documents with the CSRC. The application of this new PRC regulation remains unclear, with no consensus currently existing among leading PRC law firms regarding the scope of the applicability of the CSRC approval requirement. The M&A Rules also establish procedures and requirements that could make some acquisitions of Chinese companies by foreign investors more time-consuming and complex, including requirements in some instances that the MOFCOM be notified in advance of any change-of-control transaction in which a foreign investor takes control of a Chinese domestic enterprise. In February 2011, the General Office of the State Council promulgated a Notice on Establishing the Security Review System for Mergers and Acquisitions of Domestic Enterprises by Foreign Investors (“Circular 6”), which established a security review system for mergers and acquisitions of domestic enterprises by foreign investors. Under Circular 6, a security review is required for mergers and acquisitions by foreign investors having “national defense and security” concerns and mergers and acquisitions by which foreign investors may acquire “de facto control” of domestic enterprises with “national security” concerns. In August 2011, the MOFCOM promulgated the Rules on Implementation of Security Review System (the “MOFCOM Security Review Rules”), to replace the Interim Provisions of the Ministry of Commerce on Matters Relating to the Implementation of the Security Review System for Mergers and Acquisitions of Domestic Enterprises by Foreign Investors promulgated by the MOFCOM in March 2011. The MOFCOM Security Review Rules, which came into effect on September 1, 2011, provide that the MOFCOM will look into the substance and actual impact of a transaction and prohibit foreign investors from bypassing the security review requirement by structuring transactions through proxies, trusts, indirect investments, leases, loans, control through contractual arrangements or offshore transactions. Regulation of Foreign Currency Exchange and Dividend Distribution The principal regulations governing foreign currency exchange in China are the Foreign Exchange Administration Regulations (the “FX Regulations”), which were last amended in August 2008. Under the FX Regulations, the RMB is freely convertible for current account items, including the distribution of dividends, interest payments, trade and service-related foreign exchange transactions, but not for capital account items, such as direct investments, loans, repatriation of investments and investments in securities outside of China, unless the prior approval of the SAFE is obtained and prior registration with the SAFE is made. On August 29, 2008, the SAFE issued a notice, Circular 142, regulating the conversion by a foreign-invested company of foreign currency into RMB by restricting how the converted RMB may be used. Circular 142 requires that the registered capital of a foreign-invested company settled in RMB converted from foreign currencies may only be used for purposes within the business scope approved by the applicable governmental authority and may not be used for equity investments within the PRC. In addition, the SAFE increased its oversight of the flow and use of the registered capital of a foreign-invested company settled in RMB converted from foreign currencies. The use of such RMB capital may not be changed without the SAFE’s approval, and may not in any case be used to repay RMB loans if the proceeds of such loans have not been used. Violations of Circular 142 will result in severe penalties, such as heavy fines. As a result, Circular 142 may significantly limit our ability to transfer cash or other assets from The Company and/or our other non-PRC subsidiaries into our subsidiaries in the PRC, which may adversely affect our business expansion and we may not be able to convert the net proceeds into RMB to invest in or acquire any other PRC companies, or establish other variable interest entities (“VIEs”) in the PRC. Dividends paid by a PRC subsidiary to its overseas shareholder are deemed income of the shareholder and are taxable in the PRC. Pursuant to the Administration Rules of the Settlement, Sale and Payment of Foreign Exchange (1996), foreign-invested enterprises in the PRC may purchase or remit foreign currency, subject to a cap approved by the SAFE, for settlement of current account transactions without the approval of the SAFE. Foreign currency transactions under the capital account are still subject to limitations and require approvals from, or registration with, the SAFE and other relevant PRC governmental authorities. In October 2005, the SAFE promulgated the Relevant Issues Concerning Foreign Exchange Control on Domestic Residents’ Corporate Financing and Roundtrip Investment through Offshore Special Purpose Vehicles (“Circular 75”). Under Circular 75, which was issued by SAFE effective November 1, 2005, prior registration with the local SAFE branch is required for PRC residents to establish or to control an offshore company for the purposes of financing that offshore company with assets or equity interests in an onshore enterprise located in the PRC. An amendment to the registration or filing with the local SAFE branch by such PRC resident is also required for the injection of equity interests or assets of an onshore enterprise in the offshore company or overseas funds raised by such offshore company, or any other material change involving a change in the capital of the offshore company. Moreover, Circular 75 applies retroactively. As a result, PRC residents who, prior to November 1, 2005, had established or acquired control of offshore companies that had made onshore investments in the PRC prior to were required to complete the relevant registration procedures with the local SAFE branch by March 31, 2006. Since May 2007, the SAFE has issued a series of guidance to its local branches with respect to the operational process for the SAFE registration under Circular 75. The guidance provides more specific and stringent supervision of the registration required by Circular 75. For example, the guidance imposes obligations on onshore subsidiaries of an offshore entity to make true and accurate statements to the local SAFE authorities regarding any shareholder or beneficial owner of the offshore entity who is a PRC citizen or resident. Untrue statements by the onshore subsidiaries will lead to potential liability for the subsidiaries and, in some instances, for their legal representatives and other related individuals. Under the relevant rules, failure to comply with the registration procedures set forth in Circular 75 may result in restrictions being imposed on the foreign exchange activities of the relevant onshore company, including increases in its registered capital, payment of dividends and other distributions to its offshore parent or affiliate and capital inflows from the offshore entity, and may also subject relevant PRC residents to penalties under PRC foreign exchange administration regulations. PRC residents who control our company from time to time are required to register with the SAFE in connection with their investments in us. On December 25, 2006, the People’s Bank of China (the “PBOC”) issued the Administration Measures on Individual Foreign Exchange Control and related Implementation Rules were issued by the SAFE on January 5, 2007. Both became effective on February 1, 2007. Under these regulations, all foreign exchange transactions involving an employee share incentive plan, share option plan, or similar plan participated in by onshore individuals may be conducted only with approval from the SAFE or its authorized branch. Under the Notice of Issues Related to the Foreign Exchange Administration for Domestic Individuals Participating in Stock Incentive Plan of Overseas Listed Company (“Offshore Share Incentives Rules”), which was issued by the SAFE on February 15, 2012, PRC citizens who are granted share options, restricted share units or restricted shares by an overseas publicly listed company are required to register with the SAFE or its authorized branch and to comply with a series of other requirements. If we, or the PRC employees of ours who hold options, restricted share units or restricted shares fail to comply with these registration or other procedural requirements, we, and/or such employees may be subject to fines and other legal sanctions. The principal regulations governing distribution of dividends of foreign holding companies include the Foreign Investment Enterprise Law (1986), which was amended in October 2000, and the Administrative Rules under the Foreign Investment Enterprise Law (2001). Under these regulations, foreign investment enterprises in China may pay dividends only out of their accumulated profits, if any, determined in accordance with PRC accounting standards and regulations. In addition, foreign investment enterprises in China are required to allocate at least 10% of their accumulated profits each year, if any, to fund certain reserve funds unless these reserves have reached 50% of the registered capital of the enterprises. These reserves are not distributable as cash dividends. Laws and Regulations Related to Employment and Labor Protection On June 29, 2007, the National People’s Congress promulgated the Employment Contract Law of PRC (“Employment Contract Law”), which became effective as of January 1, 2008, and was amended on December 28, 2012. The Employment Contract Law requires employers to provide written contracts to their employees, restricts the use of temporary workers and aims to give employees long-term job security. Pursuant to the Employment Contract Law, employment contracts lawfully concluded prior to the implementation of the Employment Contract Law and continuing as of the date of its implementation shall continue to be performed. Where an employment relationship was established prior to the implementation of the Employment Contract Law but no written employment contract was concluded, a contract must be concluded within one month after its implementation. On September 18, 2008, the State Council promulgated the Implementing Regulations for the PRC Employment Contract Law which came into effect immediately. These regulations interpret and supplement the provisions of the Employment Contract Law. As of December 31, 2015, we had entered written employment contracts with three of our employees. Income Tax On March 16, 2007, the National People’s Congress approved and promulgated the Enterprise Income Tax Law (the “EIT Law”). On December 6, 2007, the State Council approved the Implementing Rules. Both the EIT Law and its Implementing Rules became effective on January 1, 2008. Under the EIT Law and the Implementing Rules, which superseded the previous Income Tax Law, the enterprise income tax rate for both domestic companies and foreign invested enterprises is unified at 25%. On December 26, 2007, the State Council promulgated the Circular on Implementation of Enterprise Tax Transition Preferential Policy, or the Preferential Policy Circular. The EIT Law, its Implementing Rules and the Preferential Policy Circular provide a five-year transitional period for certain entities that had enjoyed a favorable income tax rate of less than 25% under the previous Income Tax Law and were established before March 16, 2007, during which period the applicable enterprises income tax rate shall gradually increase to 25%. On April 14, 2008, the Administration Measures for Recognition of High and New Technology Enterprises, or the Recognition Measures, were jointly promulgated by the Ministry of Science and Technology, the Ministry of Finance, and the SAT, which sets out the standards and process for granting the high and new technology enterprises status. According to the EIT Law and its Implementing Rules as well as the Recognition Measures, enterprises which have been granted the high and new technology enterprises status shall enjoy a favorable income tax rate of 15%. The new EIT Law and its Implementation Rules also provide that “software enterprises” enjoy a two-year income tax exemption starting from the first profit making year, followed by a reduced tax rate of 12.5% for the subsequent three years. The EIT Law also provides that an enterprise established under the laws of a foreign country or region but whose “de facto management body” is in the PRC be treated as a resident enterprise for PRC tax purposes and consequently be subject to the PRC income tax at the rate of 25% for its global income. The Implementing Rules merely defines the location of the “de facto management body” as “the place where the exercising, in substance, of the overall management and control of the production and business operation, personnel, accounting, properties, etc., of a non-PRC company is located.” The SAT issued the Circular regarding the Determination of Chinese-Controlled Offshore Incorporated Enterprises as PRC Tax Resident Enterprises on the Basis of De Facto Management Bodies, or Circular 82, on April 22, 2009. Circular 82 provides certain specific criteria for determining whether the “de facto management body” of a Chinese-controlled offshore-incorporated enterprise is located in China. The SAT issued the Bulletin regarding the Administrative Measures on the Income Tax of Chinese-Controlled Offshore Incorporated Resident Enterprises (Interim) on July 27, 2011, which became effective on September 1, 2011, providing more guidance on the implementation of Circular 82. This bulletin clarifies matters including resident status determination, post-determination administration and competent tax authorities. Although both Circular 82 and the bulletin only apply to offshore enterprises controlled by PRC enterprises, not companies like us, the determining criteria set forth in Circular 82 and the bulletin may reflect the SAT’s general position on how the “de facto management body” test should be applied in determining the tax resident status of offshore enterprises, regardless of whether they are controlled by PRC enterprises or individuals. Based on a review of surrounding facts and circumstances, the Company does not believe that it is likely that its operations outside of the PRC should be considered a resident enterprise for PRC tax purposes. However, due to limited guidance and implementation history of the EIT Law, should the Company be treated as a resident enterprise for PRC tax purposes, the Company will be subject to PRC tax on worldwide income at a uniform tax rate of 25% retroactive to January 1, 2008. The EIT Law also imposes a withholding income tax of 10% on dividends distributed by a Foreign Invested Enterprise (an “FIE”) to its immediate holding company outside of China if such immediate holding company is considered a non-resident enterprise without any establishment or place within China or if the received dividends have no connection with the establishment or place of such immediate holding company within China, unless such immediate holding company’s jurisdiction of incorporation has a tax treaty with China that provides for a different withholding arrangement. Such withholding income tax was exempted under the previous law. The State of Nevada, where the Company is incorporated, does not have such tax treaty with China. The SAT further promulgated a circular, or Circular 601, on October 27, 2009, which provides that the tax treaty benefits will be denied to “conduit” or shell companies without business substance and that a beneficial ownership analysis will be used based on a “substance-over-form” principle to determine whether to grant the tax treaty benefits. Most our subsidiaries in China are directly held by our non-Chinese subsidiaries. If we are regarded as a non-resident enterprise and our non-Chinese subsidiaries are regarded as resident enterprises, then our non-Chinese subsidiaries may be required to pay a 10% withholding tax on any dividends payable to us. If our non-Chinese subsidiaries are regarded as non-resident enterprises, then our PRC subsidiaries may be required to pay a 5% withholding tax for any dividends payable to our non-Chinese subsidiaries, however, it is still unclear at this stage whether Circular 601 applies to dividends from our PRC subsidiaries paid to our non-Chinese subsidiaries, and if our non-Chinese subsidiaries were not considered as “beneficial owners” of any dividends from their PRC subsidiaries, whether the dividends payable to our non-Chinese subsidiaries would be subject to withholding tax at a rate of 10%. The EIT Law and its Implementation Rules have tried to scrutinize transactions between related parties. Pursuant to the EIT Law and its Implementation Rules, the tax authorities may impose mandatory adjustment on tax due to the extent a related party transaction is not in line with arm’s-length principle or was entered with a purpose to reduce, avoid or delay the payment of tax. On January 8, 2009, the SAT issued the Implementation Measures for Special Tax Adjustments (Trial), which clarifies the definition of “related party” and sets forth the tax-filing disclosure and documentation requirements, the selection and application of transfer pricing methods, and transfer pricing investigation and assessment procedures. On December 10, 2009, the SAT issued a circular on Strengthening the Administration of Enterprise Income Tax Collection on Income Derived from Equity Transfer by Non-resident Enterprise, or Circular 698. Pursuant to Circular 698, non-resident enterprises should declare any direct transfer of equity interest of PRC resident enterprises and pay taxes in accordance with the EIT Law and relevant laws and regulations. For an indirect transfer, if the effective tax rate for the transferor (a non-PRC-resident enterprise) is lower than 12.5% under the law of the jurisdiction of the direct transferred target, the transferor is required to submit relevant transaction materials to PRC tax authorities for review. If such indirect transfer is determined by PRC tax authorities to be a transaction without any reasonable business purpose other than for tax avoidance, the gains derived from such transfer will be subject to PRC income tax. In addition to the above, after the EIT Law and its Implementing Rules were promulgated, the SAT released several regulations to stipulate more details for carrying out the EIT Law and its Implementing Rules. These regulations include: • Notice of the State Administration of Taxation on the Issues Concerning the Administration of Enterprise Income Tax Deduction and Exemption (2008); • Notice of the State Administration of Taxation on Strengthening the Withholding of Enterprise Income Tax on Non-resident Enterprises’ Interest Income Sourcing from China (2008); • Notice of the State Administration of Taxation on Several Issues Concerning the Recognition of Incomes Subject to the Enterprise Income Tax (2008); • Opinion of the State Administration of Taxation on Strengthening the Administration of Enterprise Income Tax (2008); • Notice of the Ministry of Finance and State Administration of Taxation on Several Preferential Policies in Respect of Enterprise Income Tax (2008); • Interim Measures for the Administration of Collection of Enterprise Income Tax on the Basis of Consolidation of Trans-regional Business Operations (2008); • Several Issues Concerning the Enterprise Income Tax Treatment on Enterprise Reorganization (2009); • Circular of the State Council on Printing and Distributing Policies for Further Encouraging the Development of the Software Industry and the Integrated Circuit Industry (2011); and • Circular on Income Tax Policies for Further Encouraging the Development of Software Industry and Integrated Circuit Industry (2012). DESCRIPTION OF PROPERTY We use the following properties: Summary of Our Land Assets | Item | | Owner | | Location | | Acres | | Date
Acquired | | Tenure | | Expiry dates | | Nature of ownership | | Nature of project | | | | | | | | | | | | | | | | | | | | Hunan Lot 1 | | HSA | | Ouchi Village, Fenghuo Town, Linli County | | 31.92 | | 4/5/2011 | | 43 | | 3/31/2054 | | Lease | | Fertilizer production | | Hunan Lot 2 | | HSA | | Ouchi Village, Fenghuo Town, Linli County | | 247.05 | | 7/18/2011 | | 60 | | 7/17/2071 | | Management Right | | Pasture growing | | Hunan Lot 3 | | HSA | | Ouchi Village, Fenghuo Town, Linli County | | 8.24 | | 5/24/2011 | | 40 | | 5/23/2051 | | Land Use Rights | | Fertilizer production | | Hunan Lot 4 | | HSA | | Ouchi Village, Fenghuo Town, Linli County | | 24.71 | | 6/1/2018 | | 50 | | 5/31/2068 | | Lease | | Cattle fattening | | Guangdong Lot 1 | | JHST | | Yane Village, Liangxi Town, Enping City | | 8.23 | | 8/10/2007 | | 60 | | 9/8/2067 | | Management Right | | HU Plantation | | Guangdong Lot 2 | | JHST | | Nandu Village of Yane Village, Liangxi Town, Enping City | | 27.78 | | 3/14/2007 | | 60 | | 4/15/2067 | | Management Right | | HU Plantation | | Guangdong Lot 3 | | JHST | | Nandu Village of Yane Village, Liangxi Town, Enping City | | 60.72 | | 4/18/2007 | | 60 | | 4/17/2067 | | Management Right | | HU Plantation | | Guangdong Lot 4 | | JHST | | Nandu Village of Yane Village, Liangxi Town, Enping City | | 54.68 | | 9/12/2007 | | 60 | | 9/11/2067 | | Management Right | | HU Plantation | | Guangdong Lot 5 | | JHST | | Jishilu Village of Dawan Village, Juntang Town, Enping City | | 28.82 | | 9/12/2007 | | 60 | | 9/11/2067 | | Management Right | | HU Plantation | | Guangdong Lot 6 | | JHST | | Liankai Village of Niujiang Town, Enping City | | 31.84 | | 1/1/2008 | | 60 | | 1/1/2068 | | Management Right | | HU Plantation | | Guangdong Lot 7 | | JHST | | Nandu Village of Yane Village, Liangxi Town, Enping City | | 41.18 | | 1/1/2011 | | 26 | | 12/31/2037 | | Management Right | | HU Plantation | | Guangdong Lot 8 | | JHST | | Shangchong Village of Yane Village, Liangxi Town, Enping City | | 11.28 | | 1/1/2011 | | 26 | | 12/31/2037 | | Management Right | | HU Plantation | | Guangdong Lot 9 | | MEIJI | | Xiaoban Village of Yane Village, Liangxi Town, Enping City | | 41.18 | | 4/1/2011 | | 20 | | 3/31/2031 | | Management Right | | Cattle Farm | | Qinghai Lot 1 | | SJAP | | No. 498, Bei Da Road, Chengguan Town of Huangyuan County, Xining City, Qinghai Province | | 21.07 | | 11/1/2011 | | 40 | | 10/30/2051 | | Land Use Right & Building ownership | | Cattle farm, fertilizer and livestock feed production | | Guangdong Lot 10 | | JHST | | Niu Jiang Town, Liangxi Town, Enping City | | 6.27 | | 4/1/2013 | | 10 | | 3/31/2023 | | Management Right | | Processing factory | | Guangdong lot 11 | | CA | | Da San Dui Wei ,You Nan Village, Conghua District of Guangzhou City | | 33.27 | | 10/28/2014 | | 30 | | 10/27/2044 | | Management Right | | Agriculture |
We do not own any of the land mentioned in the table above In general, the Government owns all land. In urban areas, the land is owned directly by the central Government. In rural and suburban areas, the local village collectives, usually through the villagers’ collective economic organization, or the village committees, own the agricultural land. Uncultivated land in mountain and other remote areas is also Government-owned. Corporate entities and individuals may own the enhancements (buildings, fences, and other structures) erected on Government land. As such, any transferrable rights to the land are in the form of usufructuary rights (i.e., the right to use and enjoy the benefits derived therefrom for a period of time). There are several types of usufructuary rights. These include the right to land contractual management (granted by local village collectives for agriculture land), the right to use of construction land (state land in urban areas), etc. The right to land contractual management allows a party the rights to possess, utilize, and obtain profits from agricultural land. This right is transferrable, but this land use right is based on agricultural household contracts and cannot be changed arbitrarily to non-agricultural purposes. A usufructuary right properly granted in accordance with the laws may be transferred, leased, or mortgaged in accordance with the laws and the terms of the land-grant contract. 1. A lease confers on the recipient the same right to use and enjoy the benefits, except for the right to own the building erected by the recipient and the right to transfer. In case of government acquisition of the land, the compensation paid by the government for the building will go to the lessor, unless the lease agreement states otherwise. The Agreement for the 109.79MU land of HSA is stated to be a lease agreement but the terms therein seem to suggest that HSA is being granted a Management Right. 2 & 3. Land Use Rights and Management Rights confer the same right to use and enjoy the benefits. “Land Use Right” is one granted by the State and usually used in the context of urban land, whereas local village collectives grant “Management Rights” and the term usually applies to rural land. 4. The term Land Use Right relates to the right to use the land and enjoy the benefits derived there from, whereas Building Ownership Right relates to the right to ownership of the building erected on the land concerned. SJAP was granted a Land Use Right by the State for the land (state-owned land), and a Building Ownership Right for the buildings erected thereon. As producers active in the agriculture industry, our subsidiaries are presently exempt from income tax and enjoy various incentive grants and subsidies given by the China Government. If the Chinese government were to change its presently favorable policy toward the agriculture industry, we would no longer enjoy our present tax-related privileges, which would materially and adversely impact our sales performance, margins, and net profit and our costs structure. We have experienced, and may continue to experience, quick changes of policies by the Chinese government. If we do not effectively and efficiently manage our growth on time due to lack of capital, we could suffer adversely from the consequences of any such policy changes. SIAF’s Company of Companies - Rented Premises Profiles | Company | | Location | | Usage | | Landlord | | Tenure | | | | | | | | | | | Sino Agro Food, Inc. | | Room 3801, Block A, China Shine Plaza, No. 9, Linhexi Rd., Tianhe District, Guangzhou City | | Head Office | | Guangzhou Shine Real Property Development Limited Company | | July 9, 2018 to July 8, 2020 | | | | | | | | | | | Jiangmen City Heng Sheng Tai Agriculture Development Co. Ltd. | | Unit 1-5, Jiangzhou Shuizha Building, No. 19 Jiangjun Rd., Juntang Town, Enping City | | Office | | Enping City Jiangzhou Water Engineering Management Dept. | | April 1, 2014 to March 31, 2019 |
LEGAL PROCEEDINGS In the ordinary course of business, we may be involved in legal proceedings from time to time. As of the date hereof, except as set forth herein, there are no known or contemplated proceedings that require disclosure under Item 103 of Regulation S-K. On March 26, 2019, a shareholder derivative complaint was filed in the United States District Court for the Southern District of New York against the Company, as well as four of its current directors, styled Heng Ren Silk Road Investments LLC, Heng Ren Investments LP, derivatively on behalf of Sino Agro Food Inc. v. Sino Agro Food Inc., Lee Yip Kun Solomon, Tan Poay Teik, Chen Bor Hann, Lim Chang Soh, and Sino Agro Food Inc., as the nominal defendant (Case No.: 1:19-cv-02680) (the “Complaint”). The Company’s Motion to Dismiss the Complaint is currently due on or before June 28, 2019. The Complaint alleges violations of the federal securities laws and breaches of fiduciary duties (including gross mismanagement of the Company) by the individual defendants, based on allegations concerning, inter alia, a material default of its obligations under a commercial loan agreement, misleading and false statements (including material omissions) by the individual defendants, and unauthorized issuance of new shares of Common Stock to pay debts that, in the view of the plaintiffs, has diluted shareholder ownership and oppressed shareholders of the Company. The Company believes that these claims are without merit and intend to vigorously defend the action. Based on the Company’s assessment of the facts underlying the claims, the uncertainty of litigation, and the preliminary stage of the case, the Company cannot estimate the reasonably possible loss or range of loss that may result from this action. However, an unfavorable outcome may have a material adverse effect on our business, financial condition and results of operations. DIRECTORS AND EXECUTIVE OFFICERS PROMOTERS AND CONTROL PERSONS The Board of Directors elects our executive officers annually. A majority vote of the directors who are in office is required to fill vacancies. Each director shall be elected for the term of one year and until his successor is elected and qualified or until his earlier resignation or removal. Our directors and executive officers are as follows: | Name | | Age | | Position | | Lee Yip Kun Solomon | | 6376 | | CEO, Interim CFO and DirectorChairman of the Board | | Tan Poay Teik | | 5460 | | Chief Marketing Officer and Director | | Chen Bor Hann | | 4854 | | Secretary and Director | Yap Koi Ming (George)Colanukuduru Ravindran | | 6062 | | Independent Director | Nils Erik SandbergMuson Cheung | | 7347 | | Independent Director |
Lee Yip Kun Solomon.Solomon. Mr. Lee has been a Director and our Chief Executive Officer since August 2007. From March 2004 to date he has been GroupCompany Managing Director of Capital Award Inc. Since May, 1993, he has been the CEO of Irama Edaran Sdn. Bhd. (Malaysia), a modern fishery developer. There was no formal relationship between Sino Agro Food and Irama Edaran. He received a B.A. Major in Accounting and Economics from Monash University, Australia in July 1972. As a member of the board, Mr. Solomon contributes his knowledge of our company and a deep understanding of all aspects of our business, products and markets, as well substantial experience developing corporate strategy, assessing emerging industry trends, and business operations. Tan Paoy Teik.Teik. Mr. Tan has been a Director and our Chief Marketing Officer since August 2007. Since July, 2005, he has been GroupCompany Managing Director of Milux Corporation Bhd. (Malaysia), a manufacturer of home and gas appliances. He received an MBA from South Pacific University in 2005. Mr. Tan is currently the Managing Director of Milux Corporation Bhd; as such, he spends half of his working time with Milux and half with our company. As a member of the board, Mr. Tan contributes his knowledge of the company and a deep understanding of all aspects of our business, products and markets, as well substantial experience developing corporate strategy, assessing emerging industry trends, and business operations. 18Fertilizers in China, Industry Study with Forecasts for 2015 & 2020, Freedonia Group; June 2012
19USITC: China’s Agricultural Trade: Competitive Conditions and Effects on U.S. Exports, March 2011
Chen Bor Hann.Hann. Mr. Chen has been a Director and Secretary since August 2007. Since March, 2004, he has been Director and Business Development Manager of Capital Award Inc. From September 1995 to March 2004, he was Fishery Supervisor of Irama Edaran Sdn. Bhd. (Malaysia). As a member of the board, Mr. Chen contributes his knowledge of the company and a deep understanding of all aspects of our business, products and markets, as well substantial experience developing corporate strategy, assessing emerging industry trends, and business operations. Nils-Erik Sandberg.Colanukuduru Ravindran. Mr. SandbergRavindran has been an Independent Director of the Company since January 1, 2013. He brings international investment experienceserving as a director and skills in corporate governance, investor relations, and corporate finance with local knowledge of NASDAQ OMX Stockholm and Swedish Stock Exchange that will benefit the Company. He was appointed the Chairman of the Compensation Committee of the Company as of February 1, 2013. He is President of the Jordan Fund, a Swedish investment group network since 1990. Mr. Sandberg also currently holds a position as an adviser for Gustavia Energyexecutive in a variety of industries including energy (e.g. oil & gas) and Commodities Fund, formerly known asinformation technology with 36 years of experience in strategy, finance, fundraising, and “techno commercial”, in the Stockpicker JF Commodity Energy Fund, since 2008.U.S., India and Singapore. From 2011 to 2015, Mr. Sandberg was the founder andRavindran served as the CEOChief Executive Officer of HydrocarbonTerrasoft, a software development and services company. Beginning in 2015 through the present, Mr. Ravindran has acted as the Director at Union King Corporation and Atlantic Resources, a company based out of Hong Kong that is involved in worldwide trading of garments, electronic household goods, seafood etc. IN addition, in 2016 he was appointed as Director of Tri-way Industries Ltd, an independent private limited company based in Hong Kong. Mr. Ravindran received a Bachelor’s degree in Chemical Technology from Annamalai University in Tamilnadu, India in 1978 and subsequently obtained a post graduate degree in Plastics as well as in International HCI AB,Trade from the Indian Institute of Foreign Trade.
Muson Cheung. Mr. Cheung has been serving as a publicly traded Swedish oil Company, from 1986director, officer and as an executive in a variety of financial service companies and firms with over 12 years of experience in securities, finance, and asset management in the U.S. and Hong Kong. From 2011 to 1993.2014, Mr. Sandberg was the founder andCheung served as the CEOVice President of Grauten Oil AB,Marketing at Glory Sky Global Markets Limited, a publicly traded Swedish oillicensed financial institution in Hong Kong dealing in securities, futures contracts, leveraged foreign exchange trading, and asset management. From 2014 to 2015, Mr. Cheung served as the Vice President of Marketing at Tiger Securities Asset Management Company Limited, a financial institution licensed by the Hong Kong Securities and Futures Commission dealing in securities transactions and asset management. In 2015, he served as the Responsible Officer at MCL Securities Limited, a Hong Kong company from 1986 to 1993.that provides execution and advisory services in equities, bonds, equity-linked notes, and mutual funds across all international markets. Since 2017 through the present, Mr. SandbergCheung has served as the Responsible Officer and director at MC Financial Services Limited, a financial management firm in Hong Kong, where his activities include asset management, advisory services in securities, future contracts and securities transactions. Mr. Cheung is also qualified as a directorsecurities broker-dealer and broker’s representative by The Stock Exchange of International Petroleum Corporation, predecessorHong Kong Ltd. since 1995. His accomplishments include teaching at the Vocational Training Council School of Lundin Oil, later Lundin Petroleum, which trades on both the NASDAQ-OMXBusiness and TSX exchanges. Koi Ming Yap (George) . Mr. Yap has been an Independent DirectorInformation Systems as a former lecturer in Contemporary Business Issues in China, Logistics and Economics and at The Hong Kong Institute of Vocational Education of the Company since January 1, 2013. He brings international investment banking, corporate finance, financial reporting, investment strategies,Vocational Training Council as a former lecturer in Economics, Risk Management, Financial Management & Elements of Banking. From 2015 to 2016, he tutored at the Vocational Training Council School for Higher and international auditing experienceProfessional Education in Risk Management & Investment. Mr. Cheung has also lectured at Coventry University, University of Ballarat, and skills in corporate governance, investor relations, and corporate finance with knowledge of NASDAQ OMX Stockholm and the Swedish Stock Exchange that will benefit the Company. He was appointed the Chairman of the Audit Committee of the Company as of February 1, 2013. He is a practicing international chartered accountant with over 30 years standing and is a practicing member of The Institute of Chartered AccountantsNottingham Trent University in England and Wales since 1984. His international experience has covered Australia-NZ, United Kingdom-, Europe, Malaysia,Southern Cross University in Australia. Mr. Cheung attended Edwards International College in Perth, Australia, where he received a diploma in Management in 1991, and Curtin University of Technology in Perth, Australia, where he received a bachelor in Commerce (Finance & Marketing) in 1993. He subsequently received a Masters of Finance from the ASEAN, China and Hong Kong. Mr. Yap has beenRoyal Melbourne Institute of Technology in Australia in 1998, followed by a Doctor of Business Administration from the managing principal of K M Yap & Company, a sole proprietary firm of Chartered AccountancyEuropean University in NSW, Sydney, since 1990. He has been managing director of Brenna Investments Pty Ltd. since 1998 and has held the position of Public Interest Director (non-executive) for the Federation of Investment Managers Malaysia,Montreux, Switzerland, in Malaysia since 2010 (a position sanctioned by the Securities Commission of Malaysia). Mr. Yap specializes in strategic corporate finance solutions, business plans, registering listings on stock exchanges, international banking, financial management, risk management, financial reporting, auditing, financial management, investment management, and providing corporate finance solutions in terms of sourcing finance, as well as cornerstone investors in IPOs, reverse mergers, and takeovers, that are expected to benefit the Company. 2014.
Family Relationships There are no family relationships among our officers or directors. Involvement in Certain Legal Proceedings None of the director(s) or executive officers of the Company: (i) has been involved as a general partner or executive officer of any business which has filed a bankruptcy petition; (ii) has been convicted in any criminal proceeding nor is subject to any pending criminal proceeding; (iii) has been subjected to any order, judgment or decree of any court permanently or temporarily enjoining, barring, suspending or otherwise limiting his involvement in any type of business, securities or banking activities; and (iv) has been found by a court, the United States Securities and Exchange Commission or the Commodities Futures Trading Commission to have violated a federal or state securities or commodities law. Board Committees:Committees: Audit Committee Our Audit Committee currently consists of two directors: Messrs. Yap (chairman)Mr. Ravindran and Sandberg.Mr. Cheung. The Board has determined that: Mr. Yap qualifies as an “audit committee financial expert,” as defined by the SEC in Item 407(d)(5) of Regulation S-K; and
all members of the Audit Committee (i) are “independent” under the independence requirements of Marketplace Rule 5605(a)(2) of the NASDAQ Stock Market, Inc., (ii) meet the criteria for independence as set forth in the Exchange Act, (iii) have not participated in the preparation of our financial statements at any time during the past three years and (iv) are financially literate and have accounting and finance experience. The designation of Mr. Yap as an “audit committee financial expert” will not impose on him any duties, obligations or liability that are greater than those that are generally imposed on him as a member of our Audit Committee and our Board, and his designation as an “audit committee financial expert” will not affect the duties, obligations or liability of any other member of our Audit Committee or Board.
Compensation Committee Our Compensation Committee currently consists of two directors: Messrs. Sandberg (chairman) and Yap.Mr. Cheung. The Board has determined that: all members of the Compensation Committee qualify as “independent” under the independence requirements of Marketplace Rule 5605(a)(2) of the NASDAQ Stock Market, Inc.; all members of the Compensation Committee qualify as “non-employee directors” under Exchange Act Rule 16b-3; and all members of the Compensation Committee qualify as “outside directors” under Section 162(m) of the Internal Revenue Code of 1986, as amended (the “Code”“Code“). Compensation Committee Interlocks and Insider Participation None of the members of our Compensation Committee is an officer or employee of our company. None of our executive officers currently serves, or in the past year has served, as a member of the board of directors or compensation committee of any entity that has one of more executive officers serving on our Board or Compensation Committee. Code of Conduct The Board has established a corporate Code of Conduct which qualifies as a “code of ethics” as defined by Item 406 of Regulation S-K of the Exchange Act. Among other matters, the Code of Conduct is designed to deter wrongdoing and to promote: honest and ethical conduct, including the ethical handling of actual or apparent conflicts of interest between personal and professional relationships; full, fair, accurate, timely and understandable disclosure in our SEC reports and other public communications; compliance with applicable governmental laws, rules and regulations; prompt internal reporting of violations of the Code of Conduct to appropriate persons identified in the code; and accountability for adherence to the Code of Conduct. Waivers to the Code of Conduct may be granted only by the Board. In the event that the Board grants any waivers of the elements listed above to any of our officers, we expect to announce the waiver within four business days on a Current Report on Form 8-K. The Code of Conduct applies to all of the Company’s employees, including our principal executive officer, the principal financial and accounting officer, and all employees who perform these functions. If we amend our Code of Conduct as it applies to the principal executive officer, principal financial officer, principal accounting officer or controller (or persons performing similar functions), we shall disclose such amendment through the filing of a Current Report on Form 8-K. EXECUTIVE COMPENSATION Summary Compensation Table The table below summarizes all compensation awarded to, earned by, or paid to our Principal Executive Officer, our two most highly compensated executive officers other than our CEO who occupied such position at the end of our latest fiscal year and up to two additional executive officers who would have been included in the table below except for the fact that they were not executive officers at the end of our latest fiscal year, by us, or by any third party where the purpose of a transaction was to furnish compensation, for all services rendered in all capacities to us or our subsidiary for the latest fiscal yearsyear ended December 31, 2011 and December 31, 2012.2018. Name and
Principal Position | | Year | | | Salary($) | | | Bonus ($) | | | Option
Awards ($) | | | Nonequity
incentive plan
compensation | | | Nonqualified
deferred
compensation
earnings ($) | | | All other
compensation ($) | | | Total ($) | | | | | | | | | | | | | | | | | | | | | | | | | | | | | Lee Yip Kun Solomon | | | 2012 | | | | 336,000 | | | | 0 | | | | 0 | | | | 0 | | | | 0 | | | | 0 | | | | 336,000 | | | Chief Executive Officer | | | 2011 | | | | 336,000 | | | | 0 | | | | 0 | | | | 0 | | | | 0 | | | | 0 | | | | 336,000 | | | Tan Paoy Teik | | | 2012 | | | | 174,000 | | | | 0 | | | | 0 | | | | 0 | | | | 0 | | | | 0 | | | | 174,000 | | | Chief Marketing Officer | | | 2011 | | | | 174,000 | | | | 0 | | | | 0 | | | | 0 | | | | 0 | | | | 0 | | | | 174,000 | | | Chen Bor Hann | | | 2012 | | | | 60,000 | | | | 0 | | | | 0 | | | | 0 | | | | 0 | | | | 0 | | | | 60,000 | | | Secretary | | | 2011 | | | | 60,000 | | | | 0 | | | | 0 | | | | 0 | | | | 0 | | | | 0 | | | | 60,000 | |
Name and
Principal Position | | Year | | Salary($) | | | Bonus ($) | | | Option
Awards ($) | | | Non-equity
incentive plan
compensation | | | Nonqualified deferred
compensation earnings ($) | | | All other
compensation ($) | | | Total ($) | | | | | | | | | | | | | | | | | | | | | | | | | | | | Lee Yip Kun Solomon | | 2017 | | | 336,000 | | | | 0 | | | | 0 | | | | 0 | | | | 0 | | | | 0 | | | | 336,000 | | | Chief Executive Officer | | 2018 | | | 336,000 | | | | 0 | | | | 0 | | | | 0 | | | | 0 | | | | 0 | | | | 336,000 | | | Tan Paoy Teik | | 2017 | | | 174,000 | | | | 0 | | | | 0 | | | | 0 | | | | 0 | | | | 0 | | | | 174,000 | | | Chief Marketing Officer | | 2018 | | | 174,000 | | | | 0 | | | | 0 | | | | 0 | | | | 0 | | | | 0 | | | | 174,000 | | | Chen Bor Hann | | 2017 | | | 60,000 | | | | 0 | | | | 0 | | | | 0 | | | | 0 | | | | 0 | | | | 60,000 | | | Secretary | | 2018 | | | 60,000 | | | �� | 0 | | | | 0 | | | | 0 | | | | 0 | | | | 0 | | | | 60,000 | |
Summary Equity Awards or payments for remuneration There has been no equity incentive award made to any of our executive officers as of our fiscal year ended December 31, 2012.2017 and 2018. Employment Agreements Lee Yip Kun Solomon. On June 14, 2011,December 29, 2016, we entered into arenewed the three-year employment agreement effective and continuing as of January 1, 20112019 with Lee Yip Kun Solomon, our Chief Executive Officer and President (the “Lee Agreement”“Lee Agreement”). Pursuant to the Lee Agreement, Mr. Lee is entitled to an annual base salary of $336,000 and to receive 336,000 sharesa certain number of our common stock.stock per year calculated in accordance with a formula of (Number of shares (X) = $336,000 / $ / share ($Y) at time of settlement). Such shares have not been issued to Mr. Lee. Mr. Lee shall also be eligible for discretionary performance bonus payments; no such bonus has been paid. The Lee Agreement provides for Mr. Lee to be eligible to participate in any incentive compensation established by the Company; no such plan has been established. The Lee Agreement also includes confidentiality obligations to which Mr. Lee must adhere. Tan Paoy Teik. On June 14, 2011,December 29, 2016, we entered into arenewed the three-year employment agreement effective and continuing as of January 1, 20112019 with Tan Paoy Teik, our Chief Marketing Officer (the “Tan Agreement”“Tan Agreement”). Pursuant to the Tan Agreement, Mr. Tan is entitled to an annual base salary of $174,000 and to receive 174,000 sharesa certain number of our common stock.stock per year calculated in accordance with a formula of (Number of shares (T) = $174,000 / $ / share ($Y) at time of settlement). Such shares have not been issued to Mr. Tan. Mr. Tan shall also be eligible for discretionary performance bonus payments; no such bonus has been paid. The Tan Agreement provides for Mr. Tan to be eligible to participate in any incentive compensation established by the Company; no such plan has been established. The Tan Agreement also includes confidentiality obligations to which Mr. Tan must adhere. Chen Bor Hann. On June 14, 2011,December 29, 2016, we entered into arenewed the three-year employment agreement effective and continuing as of January 1, 20112019 with Chen Bor Hann, our Secretary (the “Hann Agreement”“Hann Agreement”). Pursuant to the Hann Agreement, Mr. Hann is entitled to an annual base salary of $174,000$60,000 and to receive 174,000 sharesa certain number of our common stock.stock per year calculated in accordance with a formula of (Number of shares (W) = $60,000 / $ / share ($Y) at time of settlement). Such shares have not been issued to Mr. Hann. Mr. Hann shallshal1 also be eligible for discretionary performance bonus payments; no such bonus has been paid. The Hann Agreement provides for Mr. Hann to be eligible to participate in any incentive compensation established by the Company; no such plan has been established. The Hann Agreement also includes confidentiality obligations to which Mr. Hann must adhere. General At no time during the last fiscal year with respect to any person listed in the table above was there: any outstanding option or other equity-based award re-priced or otherwise materially modified (such as by extension of exercise periods, the change of vesting or forfeiture conditions, the change or elimination of applicable performance criteria, or the change of the bases upon which returns are determined; any waiver or modification of any specified performance target, goal or condition to payout with respect to any amount included in non-stock incentive plan compensation or payouts; any option or equity grant; any non-equity incentive plan award made to a named executive officer any nonqualified deferred compensation plans including nonqualified defined contribution plans; or any payment for any item that should be included as All Other Compensation in a Summary Compensation Table. | "- 109 - | any outstanding option or other equity-based award re-priced or otherwise materially modified (such as by extension of exercise periods, the change of vesting or forfeiture conditions, the change or elimination of applicable performance criteria, or the change of the bases upon which returns are determined; | | | " | any waiver or modification of any specified performance target, goal or condition to payout with respect to any amount included in non-stock incentive plan compensation or payouts; | | " | any option or equity grant; | | " | any non-equity incentive plan award made to a named executive officer | | " | any nonqualified deferred compensation plans including nonqualified defined contribution plans; or | | " | any payment for any item that should be included as All Other Compensation in a Summary Compensation Table. |
We have no compensation arrangements (such as fees for retainer, committee service, service as chairman of the board or a committee, and meeting attendance) with directors. Directors did not receive any compensation except for that received as executive officers as set forth above. Equity Compensation Plan Information The following table sets forth certain information as of December 31, 2018, with respect to compensation plans under which the Company’s equity securities are authorized for issuance: | | | (a) | | | (b) | | | (c) | | | | | Number of securities to be
issued upon exercise of
outstanding options, warrants
and rights | | | The weighted-average exercise
price of outstanding options,
warrants and rights | | | Number of securities remaining
available for future issuance under
equity compensation plans (excluding
securities reflected in column (a)) | | | | | | | | | | | | | | Equity compensation Plans approved by Security holders | | | 1,000,000 | | | | - | | | | 1,000,000 | | | | | | | | | | | | | | | | | Equity compensation Plans not approved By security holders | | | None | | | | - | | | | None | | | Total | | | 1,000,000 | | | | | | | | 1,000,000 | |
CERTAIN RELATIONSHIPS AND RELATED PARTY TRANSACTIONS During fiscal year 2010, we borrowed an aggregate of $926,196 from Mr. Lee, our chairman and chief executive officer. During fiscal year 2011, Mr. Lee paid $8,969,078 for and on behalf ofOn December 31, 2017, the Company and we repaid Mr. Lee $9,605,510 of the foregoing amount, leaving uswas indebted to Mr. Lee in the amount of $289,764$2,070,390, and on December 31, 2011. During fiscal year 2012, we borrowed an aggregate of $3,056,039 from Mr. Lee, leaving us2018 is indebted to Mr. Lee in the amount of $3,345,803 on December 31, 2012.$107,074. The amounts are unsecured, interest free and have no fixed term of repayment.
During the year ended December 31, 2011, we repurchased 7,000,000 shares of our common stock from Capital Adventure for $396,400. Capital Adventure is owned by Messrs. Solomon Lee, Tan and Chen, our three executive directors.
The Company does not presently have a policy that addresses related-party matters but is considering implementing such a policy.
SECURITY OWNERSHIP OF CERTAIN BENEFICIAL OWNERS AND MANAGEMENT Prior to the Offering
The following table sets forth certain information concerning the number of shares of our Common Stockcommon stock owned beneficially owned based on 127,713,76649,866,174 issued and outstanding shares of Common Stockcommon stock as of September 4, 2013December 31, 2018 by: (i) each of our directors; (ii) each of our named executive officers; and (iii) each person or groupCompany known by us to beneficially own more than 5% of our outstanding shares of Common Stock. common stock. Beneficial ownership is determined in accordance with SEC rules and generally includes voting or investment power with respect to securities. Other than as described in the notes to the table, we believe that all persons named in the table have sole voting and investment power with respect to shares beneficially owned by them. All share ownership figures include shares issuable upon exercise of options or warrants exercisable within 60 days, of the date of this prospectus, which are deemed outstanding and beneficially owned by such person for purposes of computing his or her percentage ownership, but not for purposes of computing the percentage ownership of any other person. Unless otherwise indicated below, beneficial ownership is calculated based on the 127,713,766 shares of Common Stock issued and outstanding as of the date of this prospectus. | Name and address | | Shares of
Common Stock | | | Percent of Common
Stock | | | Shares of Series A
Preferred Stock | | | Percent of Series A
Preferred Stock | | | Percent of Capital Stock (1) | | | Shares of
Common
Stock | | | Percent of
Common Stock | | | Shares of Series A
Preferred Stock | | | Percent of Series A
Preferred Stock | | | Percent of
Capital Stock (1) | | | Directors and Officers (2): | | | | | | | | | | | | | | | | | | | | | | | | | | | | | | | | | | | | | | | | | | Lee Yip Kun Solomon | | | 12,500,000 | | | | 9.8 | % | | | 75 | | | | 75 | % | | | 62 | % | | | 2,459,697 | | | | 4.93 | % | | | 75 | | | | 75 | % | | | 60.99 | % | | Tan Poay Teik | | | 0 | | | | 0 | | | | 20 | | | | 20 | % | | | 16 | % | | | 220,000 | | | | * | | | | 20 | | | | 20 | % | | | 16.09 | % | | Chen Bor Hann | | | 0 | | | | 0 | | | | 5 | | | | 5 | % | | | 4 | % | | | 82,787 | | | | * | | | | 5 | | | | 5 | % | | | 4.03 | % | | George Yap | | | 0 | | | | 0 | | | | 0 | | | | 0 | | | | 0 | | | | Nils Erik Sandberg (3) | | | 4,123,210 | | | | 3.2 | % | | | 0 | | | | 0 | * | | | | | | | Anthony Soh** | | | | 14,887 | | | | * | | | | — | | | | 0 | | | | * | | | Colanukuduru Ravindran | | | | — | | | | | | | | | | | | | | | | | | | Muson Cheung | | | | — | | | | | | | | | | | | | | | | | | | | | | | | | | | | | | | | | | | | | | | | | | | | | | | | | | | | | | | | | | | | | All Officers and Directors as a Group (5 persons) | | | 16,623,210 | | | | 13 | % | | | 100 | | | | 100 | % | | | 82.6 | % | | | All Officers and Directors as a Company (6 persons) | | | | 2,777,371 | | | | 5.57 | % | | | 100 | | | | 100 | % | | | 81.11 | % | | | | | | | | | | | | | | | | | | | | | | | | | | | | | | | | | | | | �� | | | | | | | | 5% or Greater Beneficial Owners | | | | | | | | | | | | | | | | | | | | | | | | | | | | | | | | | | | | | | | | | | Nordnet Pensionsfoersaekring AB | | | 15,744,591 | | | | 12.3 | % | | | — | | | | 0 | | | | 2.5 | % | | | Nordnet Pensionsförsäkring AB | | | | 4,642,283 | | | | 9.31 | % | | | — | | | | 0 | | | | 1.86 | % | | Forsakringsaktiebolaget Avanza Pension | | | 14,895,771 | | | | 11.7 | % | | | — | | | | 0 | | | | 2.3 | % | | | 4,561,382 | | | | 9.15 | % | | | — | | | | 0 | | | | 1.83 | % | | Iliad Research & Trading, LP (3) | | | | 4,736,292 | | | | 8.67 | % | | | — | | | | 0 | | | | 1.86 | % | | Garrett R. D’Alessandro | | | | 2,821,831 | | | | 5.66 | % | | | — | | | | 0 | | | | 1.13 | % |
* Less than one percent.percent ** Resigned April 30, 2019. (1) Includes the voting power of the 100 shares of Series A Preferred Stock issued and outstanding, which in the aggregate carry the voting power of eighty percent (80%) of all votes entitled to be voted at any annual or special meeting of shareholders of our company or action by written consent of our shareholders. Each outstanding share of the Series A Preferred Stock shall represent its proportionate share of the 80%, which is allocated to the outstanding shares of Series A Preferred Stock. (2) The address for each of the officers and directors is c/o Sino Agro Food, Inc., Room 3801, Block A, China Shine Plaza, No. 9 Lin He Xi Road, Tianhe District, Guangzhou City, (510610), P.R.C. (3) Includes 910,300We believe, based on a Schedule 13G filed with the SEC on January 4, 2019, that the reporting person Iliad Management, LLC is the General Partner of reporting person Iliad. Iliad has rights, under a convertible promissory note, to own an aggregate number of shares of Common Stock owned of record by Mr. Sandberg’s spouse and 850,000 shares ofour common stock ownedwhich, except for a contractual cap on the amount of record by Ängby Sportklubb,outstanding shares that Iliad may own, would exceed such a not-for-profit organization of which Mr. Sandbergcap. Iliad's current ownership cap is the chairman of the board of directors. Mr. Sandberg disclaims any beneficial ownership of the shares of common stock held by Ängby Sportklubb. Subsequent to the Offering
The following table sets forth certain information concerning9.99%. Thus, the number of shares of our Common Stock beneficially owned based on the 127,713,766 issued and outstanding shares of Common Stock as of September 4, 2013 as well as the additional 26,250,000 such shares that would be issued and outstanding assuming completion of the sale of all shares of common stock offered in this prospectus by: (i) each of our directors; (ii) each of our named executive officers; and (iii) each person or group known by us to beneficially own more than 5% of our outstanding shares of Common Stock.
Beneficial ownership is determined in accordance with SEC rules and generally includes voting or investment power with respect to securities. Other than as described in the notes to the table, we believe that all persons named in the table have sole voting and investment power with respect to shares beneficially owned by them. All share ownership figures includeIliad as of January 4, 2019 was 4,736,292 shares, issuable upon exercise of options or warrants exercisable within 60 dayswhich is 8.67% of the date of this prospectus, which are deemed49,866,174 shares outstanding and beneficially owned by such person for purposes of computing his or her percentage ownership, but not for purposes of computing the percentage ownership of any other person. Unless otherwise indicated below, beneficial ownership is calculated based on the 153,963,766 shares of common stock issued and outstanding assuming the sale of all shares of common stock offered by this prospectus.December 31, 2018.
| Name and address | | Shares of
Common Stock | | | Percent of Common
Stock | | | Shares of Series A
Preferred Stock | | | Percent of Series A
Preferred Stock | | | Percent of Capital Stock (1) | | | Directors and Officers (2): | | | | | | | | | | | | | | | | | | | | | | Lee Yip Kun Solomon | | | 12,500,000 | | | | 8.1 | % | | | 75 | | | | 75 | % | | | 61.6 | % | | Tan Poay Teik | | | 0 | | | | 0 | | | | 20 | | | | 20 | % | | | 16 | % | | Chen Bor Hann | | | 0 | | | | 0 | | | | 5 | | | | 5 | % | | | 4 | % | | George Yap | | | 0 | | | | 0 | | | | 0 | | | | 0 | | | | 0 | | | Nils Erik Sandberg (3) | | | 4,123,210 | | | | 2.7 | % | | | 0 | | | | 0 | | | | * | | | | | | | | | | | | | | | | | | | | | | | | | All Officers and Directors as a Group (5 persons) | | | 16,623,210 | | | | 10.8 | % | | | 100 | | | | 100 | % | | | 82.2 | % | | | | | | | | | | | | | | | | | | | | | | | | 5% or Greater Beneficial Owners | | | | | | | | | | | | | | | | | | | | | | Nordnet Pensionsfoersaekring AB | | | 15,744,591 | | | | 10.2 | % | | | — | | | | 0 | | | | 2 | % | | Forsakringsaktiebolaget Avanza Pension | | | 14,895,771 | | | | 9.7 | % | | | — | | | | 0 | | | | 1.9 | % |
* Less than one percent.
(1) Includes the voting power of the 100 shares of Series A Preferred Stock issued and outstanding, which in the aggregate carry the voting power of eighty percent (80%) of all votes entitled to be voted at any annual or special meeting of shareholders of our company or action by written consent of our shareholders. Each outstanding share of the Series A Preferred Stock shall represent its proportionate share of the 80%, which is allocated to the outstanding shares of Series A Preferred Stock.
(2) The address for each of the officers and directors is c/o Sino Agro Food, Inc., Room 3801, Block A, China Shine Plaza, No. 9 Lin He Xi Road, Tianhe District, Guangzhou City (510610), P.R.C.
(3) Includes 910,300 shares of Common Stock owned of record by Mr. Sandberg’s spouse and 850,000 shares of common stock owned of record by Ängby Sportklubb, a not-for-profit organization of which Mr. Sandberg is the chairman of the board of directors. Mr. Sandberg disclaims any beneficial ownership of the shares of common stock held by Ängby Sportklubb.
PLAN OF DISTRIBUTION This is a self-underwritten offering. This prospectus is part of a registration statement that permits our officers and directors to sell the sharessecurities directly to the public, with no commission or other remuneration payable to any of them for any shares that are sold by them. We may also engage registered broker-dealers to offer and sell the shares. We may pay any such registered persons who make such sales a commission of up to __% of the sale price of sharessecurities sold, and provide the registered persons a non-accountable expense allowance of up to 3% of the sale price of sharessecurities sold. However, we have not entered into any underwriting agreement, arrangement or understanding for the sale of the shares being offered. In the event we retain a broker who may be deemed an underwriter, we will file a post-effective amendment to this registration statement with the Securities and Exchange Commission. This offering is intended to be made solely by the delivery of this prospectus and the accompanying subscription agreement to prospective investors. We may terminate this offering prior to the expiration date. Our officers and directors will sell the sharessecurities and intend to offer them to friends, family members and business acquaintances. In offering the securities on our behalf, our directors and officers will rely on the safe harbor from broker dealer registration set out in Rule 3a4-1 under the Securities Exchange Act of 1934. Rule 3a4-1 sets forth those conditions under which a person associated with an issuer may participate in the offering of the issuer’s securities and not be deemed to be a broker-dealer. Those conditions are as follows: | a. | Our officers and directors are not subject to a statutory disqualification, as that term is defined in Section 3(a)(39) of the Act, at the time of their participation; |
| b. | Our officers and directors will not be compensated in connection with their participation by the payment of commissions or other remuneration based either directly or indirectly on transactions in securities; and |
| c. | Our officers and directors are not, nor will they be at the time of their participation in the offering, an associated person of a broker-dealer; and |
| d. | Our officers and directors meet the conditions of paragraph (a)(4)(ii) of Rule 3a4-1 of the Exchange Act, in that they (A) primarily perform, or intend primarily to perform at the end of the offering, substantial duties for or on behalf of our Company, other than in connection with transactions in securities; and (B) are not a broker or dealer, or been associated person of a broker or dealer, within the preceding twelve months; and (C) have not participated in selling and offering securities for any Issuer more than once every twelve months other than in reliance on Paragraphs (a)(4)(i) and (a)(4)(iii). |
Our officers, directors, control persons and affiliates of same do not intend to purchase any sharessecurities in this offering. TERMS OF THE OFFERING This is a direct public offering by Sino Agro Food, Inc. of a maximum of 26,250,0001,000,000 shares of our Series G Preferred Stock, together with 10,000,000 Warrants to purchase an aggregate of 10,000,000 shares of common stock. Each share of our Series G Preferred Stock is being sold together with ten Warrants to purchase an aggregate of ten shares of common stock: (i) three Series 1 Warrants to purchase an aggregate of three shares of common stock, at $1.00 per share.(ii) three Series 2 Warrants to purchase an aggregate of three shares of common stock, and (iii) four Series 1 Warrants to purchase an aggregate of four shares of common stock. The sharesSeries G Preferred Stock, Series 1 Warrants, Series 2 Warrants and the Series 3 Warrants, which we refer to as the "Warrants," are immediately separable and will be issued separately, but will be purchased together in this offering.The securities will be sold at a fixed price of $1.00$40 per share of Series G Preferred Stock and accompanying Warrants until the earlier of (i) the date when the sale of all 26,250,0001,000,000 shares of Series G Preferred Stock and accompanying 10,000,000 Warrants is completed or (ii) 180 days from the date of this prospectus. There is no minimum amount of aggregate subscriptions and there is no minimum amount of subscription required per investor. Subscriptions, once received, are irrevocable. Accordingly, there is no minimum number of sharessecurities that must be sold in the offering, we will retain the proceeds from the sale of any of the offered shares,securities, and funds will not be returned to investors. It is possible that no proceeds will be received by us or that if any proceeds are received, that such proceeds will not be sufficient to cover the costs of the offering. There is no commitment on the part of any person to purchase and pay for any shares. There can be no assurance that all, or any, of the sharessecurities will be sold. In order to comply with the applicable securities laws of certain states, the securities may not be offered or sold unless they have been registered or qualified for sale in such states or an exemption from such registration or qualification requirement is available and with which we have complied. The purchasers in this offering and in any subsequent trading market must be residents of such states where the shares have been registered or qualified for sale or an exemption from such registration or qualification requirement is available. As of the date of this prospectus, we have not identified the specific states where the offering will be sold. We will file a pre-effective amendment indicating which state(s) the securities are to be sold pursuant to this registration statement. PROCEDURES FOR AND REQUIREMENTS FOR SUBSCRIBING This is a direct public offering and, as such, payment for the sale of the sharessecurities in this offering will be payable to Sino Agro Food, Inc. and we will have immediate access to these funds. Investors can purchase common stockour Series G Preferred Stock and accompanying Warrants in this offering by completing a subscription agreement, a copy of which is filed as an exhibit to the registration statement of which this prospectus is a part of. All payments are to be made to Sino Agro Food, Inc. and are required in the form of United States currency either by personal check, bank draft, or by cashier’s check. All subscription agreements and checks are irrevocable and should be delivered to Sino Agro Food, Inc., Room 3801, Block A, China Shine Plaza, No. 9 Lin He Xi Road, Tianhe District, Guangzhou City, 510610, P.R.C., Attn: Solomon Lee, CEO. We reserve the right to either accept or reject any subscription. Any subscription rejected by us will be returned to the subscriber within five business days of the rejection date. Once a subscription agreement is accepted, it will be executed without reconfirmation to or from the subscriber. Once we accept a subscription, the subscriber cannot withdraw it. If you decide to subscribe for any shares of Series G Preferred Stock and accompanying Warrants in this offering, you will be required to execute a Subscription Agreement and tender it, together with a check or certified funds to us. Subscriptions, once received by us, are irrevocable. All checks for subscriptions should be made payable to Sino Agro Food, Inc. After the registration statement of which this prospectus forms a part has been declared effective, we will provide each investor with a copy of the final prospectus relating to this offering. DESCRIPTION OF SECURITIES TO BE REGISTERED General The authorized capital stock of our company consists of 140,000,00060,000,000 shares of capital stock, consisting of 130,000,00050,000,000 shares of Common Stock and 10,000,000 shares of preferred stock, 100 of which have been designated Series A Preferred Stock, 7,000,000 of which have been designated as Series B Preferred Stock and 1,000,000 of which have been designated as Series F Preferred Stock. As of the date of this prospectus, there were 110,308,365 shares49,996,085shares of Common Stock and 100 shares of Series A Preferred Stock issued and outstanding, 7,000,000 shares of Series B Preferred Stock issued and outstanding and no shares of Series F Preferred Stock issued and outstanding. Series A Preferred Stock The Series A Preferred Stock ranks (i) senior to any of the shares of Common Stock, and any other class or series of stock of our company which by its terms shall rank junior to the Series A Preferred Stock, and (ii) junior to any other series or class of preferred stock of our company and any other class or series of stock of our company which by its term shall rank senior to the Series A Preferred Stock. The Series A Preferred Stock pays no dividend. The Series A Preferred Stock is not convertible. In general, the outstanding shares of Series A Preferred Stock shall vote together with the shares of Common Stock as a single class and, regardless of the number of shares of Series A Preferred Stock outstanding and as long as at least one of such shares of Series A Preferred Stock is outstanding, shall represent eighty percent (80%) of all votes entitled to be voted at any annual or special meeting of shareholders of our company or action by written consent of our shareholders. Each outstanding share of the Series A Preferred Stock shall represent its proportionate share of the 80% which is allocated to the outstanding shares of Series A Preferred Stock. Series B Preferred Stock
The Series B Preferred Stock ranks senior to any of the shares of Common Stock and any other class or series of stock of our company which by its terms shall rank junior to the Series B Preferred Stock. The Series B Preferred Stock pays no dividend. Each holder of Series B Preferred Stock shall have the right, at such holder’s option, at any time or from time to time, to convert each share of Series B Stock into one (1) share of Common Stock. The Series B Preferred Stock shall carry no voting power, subject to certain limited exceptions and as provided by the Nevada Revised Statutes.
Series F Preferred Stock
The Series F Preferred Stock ranks junior to any of the shares of Common Stock, and any other class or series of stock of our company. Except for the coupon payment described herein, the Series F Preferred Stock pays no dividend. The Series F Preferred Stock carries with it a cash coupon, which shall be redeemed on May 30, 2014 (the “Coupon Redemption Date”) and thereafter until Redemption (as defined below) occurs. Upon the Coupon Redemption Date, holders of the Series F Preferred Stock shall be entitled to a lump sum cash payment directly from our company (or one or more of our authorized agents) equal to $3.40 for every one (1) share of Series F Preferred Stock then held (the “Redemption”). Upon proper Redemption, the Series F Preferred Stock shall terminate and thereafter cease to exist. The Series F Preferred Stock is not convertible. The Series F Preferred Stock shall carry no voting power, subject to certain limited exceptions and as provided by the Nevada Revised Statutes.
Common Stock Holders of Common Stock are entitled to one vote for each share on all matters submitted to a shareholder vote. Holders of Common Stock do not have cumulative voting rights. Therefore, holders of a majority of the shares of Common Stock voting for the election of directors can elect all of the directors. Holders of Common Stock representing a majority of the voting power of our capital stock issued and outstanding and entitled to vote, represented in person or by proxy, are necessary to constitute a quorum at any meeting of our shareholders. A vote by the holders of a majority of the outstanding shares is required to effectuate certain fundamental corporate changes, such as liquidation, merger or an amendment to the articles of incorporation. Holders of Common Stock are entitled to share in all dividends that the board of directors, in its discretion, declares from legally available funds. In the event of liquidation, dissolution or winding up, each outstanding share entitles its holder to participate pro rata in all assets that remain after payment of liabilities and after providing for each class of stock, if any, having preference over the Common Stock. Holders of the Common Stock have no pre-emptive rights, no conversion rights and there are no redemption provisions applicable to the Common Stock. Transfer Agent Our transfer agent is Broadridge Corporate Issuer Solutions, Inc., 1717 Arch Street, Suite 1300, Philadelphia, PA 19103. Indemnification of Directors and Officers Pursuant to our Articles of Incorporation and By-Laws, we may indemnify an officer or director who is made a party to any proceeding, including a lawsuit, because of his position, if he acted in good faith and in a manner he reasonably believed to be in our best interest. In certain cases, we may advance expenses incurred in defending any such proceeding. To the extent that the officer or director is successful on the merits in any such proceeding as to which such person is to be indemnified, we must indemnify him against all expenses incurred, including attorney’s fees. With respect to a derivative action, indemnity may be made only for expenses actually and reasonably incurred in defending the proceeding, and if the officer or director is judged liable, only by a court order. The indemnification is intended to be to the fullest extent permitted by the laws of the State of Nevada. In the event that a claim for indemnification against such liabilities, other than the payment by us of expenses incurred or paid by one of our directors, officers, or controlling persons in the successful defense of any action, suit or proceeding, is asserted by one of our directors, officers, or controlling person in connection with the securities being registered, we will, unless in the opinion of our counsel the matter has been settled by controlling precedent, submit to a court of appropriate jurisdiction the question whether such indemnification is against public policy as expressed in the Securities Act, and we will be governed by the final adjudication of such issue. Insofar as indemnification for liabilities arising under the Securities Act of 1933, as amended, may be permitted to our directors, officers and persons controlling us, we have been advised that it is the Securities and Exchange Commission’s opinion that such indemnification is against public policy as expressed in the Securities Act of 1933, as amended, and is, therefore, unenforceable. DESCRIPTION OF THE 7% SERIES G NON-CONVERTIBLE CUMULATIVE REDEEMABLE PERPETUAL PREFERRED STOCK The description of certain terms of the 7% Series G Non-Convertible Cumulative Redeemable Perpetual Preferred Stock (the “Series G Preferred Stock”) in this prospectus supplement does not purport to be complete and is in all respects subject to, and qualified in its entirety by references to the relevant provisions of our certificate of incorporation, the certificate of designations establishing the terms of our Series G Preferred Stock, our bylaws and the Nevada Revised Statutes. Copies of our articles of incorporation, certificate of designations and our bylaws are available from us upon request. General Pursuant to our articles of incorporation, we are currently authorized to designate and issue up to 10,000,000 shares of preferred stock, par value $0.001 per share, 100 of which have been designated Series A Preferred Stock, in one or more classes or series and, subject to the limitations prescribed by our articles of incorporation and the Nevada Revised Statutes, with such rights, preferences, privileges and restrictions of each class or series of preferred stock, including dividend rights, voting rights, terms of redemption, liquidation preferences and the number of shares constituting any class or series as our board of directors may determine, without any vote or action by our shareholders. In connection with this offering, our board of directors will designate 2,000,000 shares of our authorized preferred stock as 7% Series G Non-Convertible Cumulative Redeemable Perpetual Preferred Stock, having the rights and privileges described in this prospectus supplement, by adopting and filing the certificate of designations with the State of Nevada. Assuming all of the shares of Series G Preferred Stock offered hereunder are issued, we will have available for issuance 7,999,900 authorized but unissued shares of preferred stock. Our board of directors may, without the approval of holders of the Series G Preferred Stock or our common stock, designate additional series of authorized preferred stock ranking junior to or on parity with the Series G Preferred Stock and authorize the issuance of such shares. Designation of preferred stock ranking senior to the Series G Preferred Stock or designation of additional shares of the Series G Preferred Stock will require approval of the holders of Series G Preferred Stock, as described below in “Voting Rights.” No Maturity, Sinking Fund or Mandatory Redemption The Series G Preferred Stock has no stated maturity and will not be subject to any sinking fund or mandatory redemption. Shares of the Series G Preferred Stock will remain outstanding indefinitely unless we decide to redeem or otherwise repurchase them. Ranking The Series G Preferred Stock will rank, with respect to rights to the payment of dividends and the distribution of assets upon our liquidation, dissolution or winding up: (i) senior to all classes or series of our common stock and to all other equity securities issued by us, the terms of which specifically provide that such equity securities rank junior to the Series G Preferred Stock, other than equity securities referred to in clauses (ii) and (iii); (ii) junior to the Series A Preferred Stock and all equity securities issued by us with terms specifically providing that those equity securities rank senior to the Series G Preferred Stock with respect to rights to the payment of dividends and the distribution of assets upon our liquidation, dissolution or winding up; (iii) in parity with the Series B Preferred Stock and all equity securities issued by us with terms specifically providing that those equity securities rank equal to the Series G Preferred Stock with respect to rights to the payment of dividends and the distribution of assets upon our liquidation, dissolution or winding up (any such issuance would require the affirmative vote of the holders of at least two-thirds of the outstanding shares of Series G Preferred Stock); and (iv) effectively junior to all of our existing and future indebtedness. Dividends Holders of shares of the Series G Preferred Stock are entitled to receive, when, as and if declared by the Board, out of funds legally available for the payment of dividends, cumulative cash dividends at the rate of 7% of the $40.00 per share liquidation preference per annum (equivalent to $2.80 per annum per share). Dividends on the Series G Preferred Stock shall be payable annually on August 15 of the subsequent year, with annual dividend amount calculated from the period of January 1 to December 31 of each year; provided that if any dividend payment date is not a business day, as defined in the certificate of designations, then the dividend that would otherwise have been payable on that dividend payment date may be paid on the next succeeding business day and no interest, additional dividends or other sums will accrue on the amount so payable for the period from and after that dividend payment date to that next succeeding business day. Any dividend payable on the Series G Preferred Stock, including dividends payable for any partial dividend period, will be computed on the basis of a 360-day year consisting of twelve 30-day months. Dividends will be payable to holders of record as they appear in our stock records for the Series G Preferred Stock at the close of business on the applicable record date, which shall be the first day of each month of each year, whether or not a business day, in which the applicable dividend payment date falls. As a result, holders of shares of Series G Preferred Stock will not be entitled to receive dividends on a dividend payment date if such shares were not issued and outstanding on the applicable dividend record date. No dividends on shares of Series G Preferred Stock shall be authorized by our board of directors or paid or set apart for payment by us at any time when the payment thereof would be unlawful under the laws of the State of Nevada or when the terms and provisions of any agreement of ours, including any agreement relating to our indebtedness, prohibit the authorization, payment or setting apart for payment thereof or provide that the authorization, payment or setting apart for payment thereof would constitute a breach of the agreement or a default under the agreement, or if the authorization, payment or setting apart for payment shall be restricted or prohibited by law. You should review the information appearing above under “Risk Factors — The Series G Preferred Stock is equity and is subordinate to our existing and future indebtedness and may be junior in rights and preferences to future preferred stock” for information as to, among other things, other circumstances under which we may be unable to pay dividends on the Series G Preferred Stock. Notwithstanding the foregoing, dividends on the Series G Preferred Stock will accrue whether or not (i) the terms of any senior stock we may issue or agreements we may enter into, including any documents governing our indebtedness, at any time prohibit the current payment of dividends, (ii) we have earnings, (iii) whether or not there are funds legally available for the payment of those dividends and (iv) whether or not those dividends are declared by our board of directors. No interest, or sum in lieu of interest, will be payable in respect of any dividend payment or payments on the Series G Preferred Stock that may be in arrears, and holders of the Series G Preferred Stock will not be entitled to any dividends in excess of full cumulative dividends described above. Any dividend payment made on the Series G Preferred Stock shall first be credited against the earliest accumulated but unpaid dividend due with respect to those shares. Unless full cumulative dividends on all shares of Series G Preferred Stock have been or contemporaneously are declared and paid or declared and a sum sufficient for the payment thereof has been or contemporaneously is set apart for payment for all past dividend periods, no dividends (other than in shares of common stock or in shares of any series of preferred stock that we may issue ranking junior to the Series G Preferred Stock as to the payment of dividends and upon liquidation, dissolution or winding up) shall be declared or paid or set aside for payment upon shares of our common stock or preferred stock that we may issue ranking junior to, or on a parity with, the Series G Preferred Stock. Nor shall any other distribution be declared or made upon shares of our common stock or preferred stock that we may issue ranking junior to, or on a parity with, the Series G Preferred Stock as to the payment of dividends or the distribution of assets upon liquidation, dissolution or winding up. Liquidation Preference In the event of our voluntary or involuntary liquidation, dissolution or winding up, the holders of shares of Series G Preferred Stock will be entitled to be paid out of the assets we have legally available for distribution to our shareholders a liquidation preference of $40.00 per share, plus an amount equal to any accumulated and unpaid dividends to, but not including, the date of payment, before any distribution of assets is made to holders of our common stock or any other class or series of our capital stock we may issue that ranks junior to the Series G Preferred Stock as to liquidation rights. In the event that, upon any such voluntary or involuntary liquidation, dissolution or winding up, our available assets are insufficient to pay the amount of the liquidating distributions on all outstanding shares of Series G Preferred Stock and the corresponding amounts payable on all shares of other classes or series of our capital stock that we may issue ranking senior to or on a parity with the Series G Preferred Stock in the distribution of assets, then the holders of the Series G Preferred Stock and all other such classes or series of capital stock shall share ratably in any such distribution of assets in proportion to the full liquidating distributions to which they would otherwise be respectively entitled. After payment of the full amount of the liquidating distributions to which they are entitled, the holders of Series G Preferred Stock will have no right or claim to any of our remaining assets. The consolidation or merger of us with or into any other corporation, trust or entity or of any other entity with or into us, or the sale, lease, transfer or conveyance of all or substantially all of our property or business, shall not be deemed a liquidation, dissolution or winding up of us. Redemption The Series G Preferred Stock is not redeemable by us prior to __________, 2024. Accumulated dividends, if any. Optional Redemption. On and after _____________, 2024, we may, at our option, upon not less than 30 nor more than 60 days’ written notice, redeem the Series G Preferred Stock, in whole or in part, at any time or from time to time, at the rate of 15 shares of common stock for each share of Series G Preferred Stock, plus any accumulated and unpaid dividends thereon to, but not including, the date fixed for redemption. If we elect to redeem any shares of Series G Preferred Stock as described in this paragraph, we may use any available cash to pay any accumulated and unpaid dividends. Redemption Procedures. In the event we elect to redeem Series G Preferred Stock, the notice of redemption will be mailed to each holder of record of Series G Preferred Stock called for redemption at such holder’s address as it appear on our stock transfer records, not less than 30 nor more than 60 days prior to the redemption date, and will state the following: the redemption date; the number of shares of Series G Preferred Stock to be redeemed; the number of shares of common stock to be issued, plus any accrued and unpaid dividends to and including the date of redemption; the place or places where certificates (if any) for the Series G Preferred Stock, other than through The Depository Trust Company (“DTC”) book entry, are to be surrendered for delivery of the redemption price; that dividends on the shares to be redeemed will cease to accumulate on the redemption date; whether such redemption is being made pursuant to the provisions described above under “Optional Redemption” or “Redemption Procedures”; if applicable, that such redemption is being made in connection with a Change of Control and, in that case, a brief description of the transaction or transactions constituting such Change of Control; and any other information required by law or by the applicable rules of any exchange upon which the Series G Preferred Stock may be listed or admitted for trading. If fewer than all of the Series G Preferred Stock held by any holder are to be redeemed, the notice mailed to such holder shall also specify the number of shares of Series G Preferred Stock held by such holder to be redeemed. Holders of Series G Preferred Stock to be redeemed shall surrender the Series G Preferred Stock at the place designated in the notice of redemption and shall be entitled to the redemption price and any accumulated and unpaid dividends payable upon the redemption following the surrender. If notice of redemption of any shares of Series G Preferred Stock has been given and if we have irrevocably reserved shares of common stock to be issued in connection with such redemption, then from and after the redemption date, dividends will cease to accrue on those shares of Series G Preferred Stock, those shares of Series G Preferred Stock shall no longer be deemed outstanding and all rights of the holders of those shares will terminate, except the right to receive the redemption shares plus accumulated and unpaid dividends, if any, payable upon redemption. In connection with any redemption of Series G Preferred Stock, we shall pay, in cash, any accumulated and unpaid dividends to, but not including, the redemption date, unless a redemption date falls after a dividend record date and prior to the corresponding dividend payment date, in which case each holder of Series G Preferred Stock at the close of business on such dividend record date shall be entitled to the dividend payable on such shares on the corresponding dividend payment date notwithstanding the redemption of such shares before such dividend payment date. Holders of Series G Preferred Stock shall not be entitled to any dividend in excess of all accumulated accrued and unpaid dividends on the Series G Preferred Stock. Any dividend payment made on the Series G Preferred Stock shall first be credited against the earliest accumulated accrued and unpaid dividend due with respect to such shares which remains payable at the time of such payment. Any shares of Series G Preferred Stock that we acquire may be retired and reclassified as authorized but unissued shares of preferred stock, without designation as to class or series, and may thereafter be reissued as any class or series of preferred stock. Voting Rights Holders of the Series G Preferred Stock do not have any voting rights, except as set forth below or as otherwise required by law. Holders of Series G Preferred Stock shall be entitled to vote with holders of outstanding shares of common stock, voting together as a single class, with respect to any and all matters presented to our shareholders for their action or consideration (whether at a meeting of our shareholders, by written action of shareholders in lieu of a meeting or otherwise). In any such vote, each share of Series G Preferred Stock shall carry the voting power of twenty (20) shares of common stock, subject to the provisions of the Nevada corporate law. Each holder of Series G Preferred Stock shall be entitled to notice of all shareholder meetings (or requests for written consent) in accordance with our bylaws. So long as any shares of Series G Preferred Stock remain outstanding, we will not, without the prior written consent of the Holder(s) of a majority of the then outstanding shares of Series G Preferred Stock, (a) alter or change adversely the powers, preferences or rights given to the Series G Preferred Stock or alter or amend this Certificate, (b) amend its Articles of Incorporation or other charter documents in any manner that adversely affects any rights of the Holders of Series G Preferred Stock, (c) increase or decrease the number of authorized shares of Series G Preferred Stock, (d) whether or not prohibited by the terms of the Series G Preferred Stock, circumvent a right or preference of the Series G Preferred Stock, or (e) enter into any agreement with respect to any of the foregoing. Holders shall be entitled to written notice of all shareholder meetings or written consents (and copies of proxy materials and other information sent to shareholders) with respect to which they would be entitled to vote, which notice shall be provided pursuant to our Bylaws and Nevada corporate law (each, an “Event”). An increase in the amount of the authorized preferred stock, including the Series G Preferred Stock, or the creation or issuance of any additional Series G Preferred Stock (but not in excess of the total number of authorized shares of Preferred Stock) or other series of preferred stock that we may issue, or any increase in the amount of authorized shares of such series, in each case ranking on a parity with or junior to the Series G Preferred Stock with respect to payment of dividends or the distribution of assets upon liquidation, dissolution or winding up, shall not be deemed an Event and will not require us to obtain a the prior written consent of the Holder(s) of a majority of the then outstanding shares of Series G Preferred Stock. The foregoing voting provisions will not apply if, at or prior to the time when the act with respect to which such vote would otherwise be required shall be effected, all outstanding shares of Series G Preferred Stock shall have been redeemed or called for redemption upon proper notice and sufficient funds shall have been deposited in trust to effect such redemption. Except as expressly stated in the certificate of designations or as may be required by applicable law, the Series G Preferred Stock do not have any relative, participating, optional or other special voting rights or powers and the consent of the holders thereof shall not be required for the taking of any corporate action. Information Rights During any period in which we are not subject to Section 13 or 15(d) of the Exchange Act and any shares of Series G Preferred Stock are outstanding, we will use our best efforts to (i) transmit by mail (or other permissible means under the Exchange Act) to all holders of Series G Preferred Stock, as their names and addresses appear on our record books and without cost to such holders, copies of the Annual Reports on Form 10-K and Quarterly Reports on Form 10-Q that we would have been required to file with the SEC pursuant to Section 13 or 15(d) of the Exchange Act if we were subject thereto (other than any exhibits that would have been required) and (ii) promptly, upon request, supply copies of such reports to any holders or prospective holder of Series G Preferred Stock. We will use our best effort to mail (or otherwise provide) the information to the holders of the Series G Preferred Stock within 30 days after the respective dates by which a periodic report on Form 10-K or Form 10-Q, as the case may be, in respect of such information would have been required to be filed with the SEC, if we were subject to Section 13 or 15(d) of the Exchange Act, in each case, based on the dates on which we would be required to file such periodic reports if we were a “non-accelerated filer” within the meaning of the Exchange Act. No Preemptive Rights No holders of the Series G Preferred Stock will, as holders of Series G Preferred Stock, have any preemptive rights to purchase or subscribe for our common stock or any other security. Change of Control Provisions in our articles of incorporation and bylaws may make it difficult and expensive for a third party to pursue a tender offer, change in control or takeover attempt, which is opposed by management and the board of directors. Transfer Agent & Registrar Broadridge will be the transfer agent, registrar and dividend disbursing agent for the Series G Preferred Stock. BOOK-ENTRY ISSUANCE
The following description applies to the shares of Series G Preferred Stock held through DTC and excludes the shares held directly through Broadridge, as transfer agent. DTC will act as securities depositary for the Series G Preferred Stock, excluding shares held directly through Broadridge, as transfer agent. We will issue one or more fully registered global securities certificates in the name of DTC’s nominee, Cede & Co. These certificates will represent the total aggregate number of shares of Series G Preferred Stock held through DTC. We will deposit these certificates with DTC or a custodian appointed by DTC. We will not issue certificates to you for the shares of Series G Preferred Stock that you receive. Title to book-entry interests in the Series G Preferred Stock will pass by book-entry registration of the transfer within the records of DTC in accordance with its procedures. Book-entry interests in the securities may be transferred within DTC in accordance with procedures established for these purposes by DTC. Each person owning a beneficial interest in the Series G Preferred Stock must rely on the procedures of DTC and the participant through which such person owns its interest to exercise its rights as a holder of the Series G Preferred Stock. DTC has advised us that it is a limited-purpose trust company organized under the New York Banking Law, a banking organization under the meaning of the New York Banking Law, a member of the Federal Reserve System, a “clearing corporation” under the meaning of the New York Uniform Commercial Code and a “clearing agency” registered under the provisions of Section 17A of the Exchange Act. DTC holds securities that its participants (“Direct Participants”) deposit with DTC. DTC also facilitates the settlement among Direct Participants of securities transactions, such as transfers and pledges, in deposited securities through electronic computerized book-entry changes in Direct Participants’ accounts, thereby eliminating in this manner the need for physical movement of securities certificates. Direct Participants include securities brokers and dealers, banks, trust companies, clearing corporations, and certain other organizations. DTC is owned by a number of its Direct Participants and by the New York Stock Exchange, Inc. and the Financial Industry Regulatory Authority, Inc. Others, like securities brokers and dealers, banks and trust companies that clear through or maintain custodial relationships with Direct Participants, either directly or indirectly, are indirect participants (“Indirect Participants”) and also have access to the DTC system. The rules applicable to DTC and its Direct and Indirect Participants are on file with the SEC. When you receive the Series G Preferred Stock within DTC, the transfer must be made by or through a Direct Participant. The Direct Participant will receive a credit for the Series G Preferred Stock on DTC’s records. You, as the actual owner of the Series G Preferred Stock, are the “beneficial owner.” Your beneficial ownership interest will be recorded on the Direct and Indirect Participants’ records, but DTC will have no knowledge of your individual ownership. DTC’s records reflect only the identity of the Direct Participants to whose accounts shares of Series G Preferred Stock are credited. You will not receive written confirmation from DTC of your receipt of the Series G Preferred Stock. The Direct or Indirect Participants through whom you received the Series G Preferred Stock should send you written confirmations providing details of your transactions, as well as periodic statements of your holdings. The Direct and Indirect Participants are responsible for keeping an accurate account of the holdings of their customers like you. Transfers of ownership interests held through Direct and Indirect Participants will be accomplished by entries on the books of Direct and Indirect Participants acting on behalf of the beneficial owners. Conveyance of notices and other communications by DTC to Direct Participants, by Direct Participants to Indirect Participants, and by Direct Participants and Indirect Participants to beneficial owners will be governed by arrangements among them, subject to any statutory or regulatory requirements as may be in effect from time to time. We understand that, under DTC’s existing practices, in the event that we request any action of the holders, or an owner of a beneficial interest in a global security such as you desires to take any action which a holder is entitled to take under our Certificate of Incorporation, as amended, DTC would authorize the Direct Participants holding the relevant shares to take such action, and those Direct Participants and any Indirect Participants would authorize beneficial owners owning through those Direct and Indirect Participants to take such action or would otherwise act upon the instructions of beneficial owners owning through them. Any redemption notices with respect to the Series G Preferred Stock will be sent to Cede & Co. If less than all of the shares of Series G Preferred Stock are being redeemed, DTC’s current practice is to determine by lot the amount of interest of each Direct Participant to be redeemed. In those instances where a vote is required, neither DTC nor Cede & Co. itself will consent or vote with respect to the Series G Preferred Stock. Under its usual procedures, DTC would mail an omnibus proxy to us as soon as possible after the record date. The omnibus proxy assigns Cede & Co.’s consenting or voting rights to those Direct Participants whose accounts the Series G Preferred Stock are credited on the record date, which are identified in a listing attached to the omnibus proxy. Distributions on the Series G Preferred Stock will be made directly to DTC’s nominee (or its successor, if applicable). DTC’s practice is to credit participants’ accounts on the relevant payment date in accordance with their respective holdings shown on DTC’s records unless DTC has reason to believe that it will not receive payment on that payment date. Payments by Direct and Indirect Participants to beneficial owners will be governed by standing instructions and customary practices, as is the case with securities held for the accounts of customers in bearer form or registered in “street name.” Subject to any statutory or regulatory requirements, these payments will be the responsibility of the participant and not of DTC, us or any agent of ours. We and any paying agent will be responsible for payment of distributions to DTC. Direct and Indirect Participants are responsible for the disbursement of payments to the beneficial owners. DTC may discontinue providing its services as securities depositary with respect to the Series G Preferred Stock at any time by giving reasonable notice to us. Additionally, we may decide to discontinue the book-entry only system of transfers with respect to the Series G Preferred Stock. If DTC notifies us that it is unwilling to continue as securities depositary, or it is unable to continue or ceases to be a clearing agency registered under the Exchange Act and a successor depositary is not appointed by us within 90 days after receiving such notice or becoming aware that DTC is no longer so registered, we will issue the Series G Preferred Stock in definitive or book-entry form, at our expense, upon registration of transfer of, or in exchange for, such global security. According to DTC, the foregoing information with respect to DTC has been provided to the financial community for informational purposes only and is not intended to serve as a representation, warranty or contract modification of any kind. We have obtained the information in this section about DTC and DTC’s book-entry system from sources that we believe to be accurate, but we assume no responsibility for the accuracy of the information. We have no responsibility for the performance by DTC or its Direct or Indirect Participants of their respective obligations as described in this prospectus or under the rules and procedures governing their respective operations. DESCRIPTION OF THE SERIES 1 WARRANTS, SERIES 2 WARRANTS AND SERIES 3 WARRANTS The description of certain terms ofthe Series 1 Warrants, Series 2 Warrants and Series 3 Warrants in this prospectus does not purport to be complete and is in all respects subject to, and qualified in its entirety by references to the relevant provisionscontained in the Series 1 Warrant, Series 2 Warrant and the Series 3 Warrant, the forms of which are filed as an exhibit to the registration statement of which this prospectus forms a part. Amount of Warrant Shares Three Series 1 Warrants to purchase an aggregate of three shares of common stock, three Series 2 Warrants to purchase an aggregate of three shares of common stock and four Series 3 Warrants to purchase an aggregate of four shares of common stock will be issued for every one share of Series G Preferred Stock sold in this offering. The terms of the Series 1 Warrant, the Series 2 Warrant and the Series 3 Warrants are identical, except for the exercise date. Exercisability, Exercise Price and Term Each Warrant will have an initial exercise price of $1.00 per share of common stock.The Series 1 Warrants will be exercisable from January 1, 2022 through their termination on December 31, 2022. The Series 2 Warrants will be exercisable from January 1, 2023 through their termination on December 31, 2023. The Series 3 Warrants will be exercisable from January 1, 2024 through their termination on December 31, 2024. Fractional Shares No fractional shares of common stock will be issued in connection with the exercise of a warrant. In lieu of fractional shares, we will round down to the next whole share. Fundamental Transactions In the event of any fundamental transaction, as described in the Warrants and generally including any merger with or into another entity, sale of all or substantially all of our assets, tender offer or exchange offer, or reclassification of our Common Stock, then upon any subsequent exercise of a Warrant, the holder will have the right to receive as alternative consideration, for each share of our common stock that would have been issuable upon such exercise immediately prior to the occurrence of such fundamental transaction, the number of shares of common stock of the successor or acquiring corporation or of our company, if it is the surviving corporation, and any additional consideration receivable upon or as a result of such transaction by a holder of the number of shares of our common stock that would have been issuable upon exercisable immediately prior to such event. Rights as Stockholders The holders of Warrants do not have the rights or privileges of holders of our common stock and any voting rights until they exercise their Warrants and receive shares of our common stock. After the issuance of shares of our common stock upon exercise of the Warrants, each holder will be entitled to one vote for each share of common stock held of record on all matters to be voted on by stockholders. Transferability Subject to applicable laws and the restriction on transfer set forth in the Warrants, the Warrants may be transferred at the option of the holder upon surrender of the Warrant to us together with the appropriate instruments of transfer. Waivers and Amendments Subject to certain exceptions, any term of the Series 1 Warrants, the Series 2 Warrants or the Series 3 Warrants may be amended or waived with our written consent and the written consent of the holders of the then-outstanding warrants in such series. Market and Exchange Listing The Warrants are a new issue of securities and currently there is no market for the securities. We do not intend to list or qualify for quotation the Warrants on any securities exchange or market. Transfer Agent & Registrar Broadridge will be the warrant agent for the Warrants. CHANGES IN AND DISAGREEMENTS WITH ACCOUNTANTS Effective June 29, 2018, the Company accepted the resignation of David Yueng, ECOVIS HK (“ECOVIS”) as its independent registered public accounting firm. As of June 29, 2018, the Company engaged ZHEN HUI CPA (“ZHCPA”) as its new independent accountant based on the recommendation of the audit committee of its board of directors. The reports of ECOVIS on the financial statements of the Company for the fiscal years ended December 31, 2015, December 31, 2016 and December 31, 2017 contained no adverse opinion or disclaimer of opinion and were not qualified or modified as to uncertainty, audit scope or accounting principle. In connection with its audits of the Company’s financial statements for the fiscal years ended December 31, 2015, December 31, 2016 and December 31, 2017, there were no disagreements with ECOVIS on any matter of accounting principles or practices, financial statement disclosure, or auditing scope or procedure, which disagreements, if not resolved to the satisfaction of ECOVIS, would have caused it to make reference thereto in its report on the financial statements for such years or periods, as the case may be. During the fiscal years ended December 31, 2015, December 31, 2016 and December 31, 2017 and through June 29, 2018, the Company has not consulted with ZHCPA on any matter that (i) involved the application of accounting principles to a specified transaction, either completed or proposed, or the type of audit opinion that might be rendered on the Company’s financial statements, in each case where a written report was provided or oral advice was provided that ZHCPA concluded was an important factor considered by the Company in reaching a decision as to the accounting, auditing or financial reporting issue, or (ii) was either the subject of a disagreement, as that term is defined in Item 304(a)(1)(iv) of Regulation S-K and the related instructions to Item 304 of Regulation S-K, or a reportable event, as that term is defined in Item 304(a)(1)(v) of Regulation S-K. EXPERTS The consolidated financial statements for the fiscal year ending December 31, 2018 included in this prospectus have been audited by Madsen & Associates CPA’s, Inc.,ZHEN HUI CPA, an independent registered public accounting firm, given on the authority of that firm as experts in accounting and auditing to the extent and for the periods indicated in their report appearing elsewhere herein. The consolidated financial statements for the fiscal year ending December 31, 2017 included in this prospectus have been audited by David Yueng, ECOVIS HK, an independent registered public accounting firm, given on the authority of that firm as experts in accounting and auditing to the extent and for the periods indicated in their report appearing elsewhere herein. LEGAL MATTERS Sichenzia Ross Friedman Ference LLP, 61 Broadway, 32nd1185 Avenue of the Americas, 37th Floor, New York, New York 1000610036 has passed upon the validity of the shares of common stockSeries G Preferred Stock to be sold in this offering. WHERE YOU CAN FIND MORE INFORMATION We have filed with the Securities and Exchange Commission a registration statement on Form S-1, together with any amendments and related exhibits, under the Securities Act, with respect to our shares of common stock offered by this prospectus. The registration statement contains additional information about us and our shares of common stock that we are offering in this prospectus. We file annual, quarterly and current reports and other information with the Securities and Exchange Commission under the Securities Exchange Act of 1934, as amended. Our Securities and Exchange Commission filings are available to the public over the Internet at the Securities and Exchange Commission’s website athttp://www.sec.gov. You may also read and copy any document we file at the Securities and Exchange Commission’s public reference room located at 100 F Street, N.E., Washington, D.C. 20549. Please call the Securities and Exchange Commission at 1-800-SEC-0330 for further information on the public reference rooms and their copy charges. Access to those electronic filings is available as soon as practicable after filing with the Securities and Exchange Commission. You may also request a copy of those filings, excluding exhibits, from us at no cost. Any such request should be addressed to us at: Room 3801, Block A, China Shine Plaza, No. 9 Lin He Xi Road, Tianhe District, Guangzhou City, P.R.C., Attn: Solomon Lee, CEO. SINO AGRO FOOD, INC. AND SUBSIDIARIES CONSOLIDATEDQUARTERLY FINANCIAL STATEMENTSREPORT
FOR THE YEARTHREE MONTHS ENDED DECEMBERMARCH 31, 2012 AND 2011 2019 SINO AGRO FOOD, INC. AND SUBSIDIARIES
INDEX TO CONSOLIDATEDQUARTERLY FINANCIAL STATEMENTSREPORT 684 East Vine Street #3, Murray, UT 84107 | PHONE: (801) 268-2632 | FAX: (801) 268-3978 |
REPORT OF INDEPENDENT REGISTERED PUBLIC ACCOUNTING FIRM
To the Board of Directors and Stockholders of
Sino Agro Food, Inc.
(Incorporated in the State of Nevada, United States of America)
We have audited the accompanying consolidated balance sheets of Sino Agro Food, Inc. and subsidiaries as of December 31, 2012 and December 31, 2011, and the consolidated statements of income and other comprehensive income, the consolidated statements of stockholders’ equity, and the consolidated statements of cash flows for the years ended December 31, 2012 and December 31, 2011. These consolidated financial statements are the responsibility of the Company’s management. Our responsibility is to express an opinion on these consolidated financial statements based on our audits.
We conducted our audits in accordance with the standards of the Public Company Accounting Oversight Board (“PCAOB”).Those standards require that we plan and perform the audit to obtain reasonable assurance about whether the financial statements are free of material misstatement. The Company is not required to have, nor have we been engaged to perform, an audit of its internal control over financial reporting. Our audit included consideration of internal control over financial reporting as a basis for designing audit procedures that are appropriate in the circumstances, but not for the purpose of expressing an opinion on the effectiveness of the Company’s internal control over financial reporting. Accordingly, we express no such opinion. An audit also includes examining, on a test basis, evidence supporting the amounts and disclosures in the financial statements, assessing the accounting principles used and significant estimates made by management, as well as evaluating the overall financial statements presentation. We believe that our audits provide a reasonable basis for our opinion.
The Company has restated its statement of cash flows to correct an error related to the reporting of cash flows from the sale of a subsidiary during 2011. The effects of this restatement are explained in note 34 to the consolidated financial statements.
In our opinion, these consolidated financial statements referred to above present fairly, in all material respects, the consolidated financial position of Sino Agro Food, Inc. and subsidiaries as of December 31, 2012, and December 31, 2011, and the consolidated results of its operations and its cash flows for each of the years ended December 31, 2012 and December 31, 2011, in conformity with accounting principles generally accepted in the United States of America.
s/Madsen & Associates CPA’s, Inc. | | Madsen & Associates CPA’s, Inc. | | | | Murray, UtahF-1 | |
April 15, 2013, except for note 34 to the financial statements which is dated April 23, 2013
SINO AGRO FOOD, INC. CONSOLIDATED BALANCE SHEETS AS AT DECEMBER 31, 2012 AND 2011
| | | 2012 | | | 2011 | | | | | $ | | | $ | | | | | | | | | | | ASSETS | | | | | | | | | | Current assets | | | | | | | | | | Cash and cash equivalents | | $ | 8,424,265 | | | $ | 1,387,908 | | | Inventories | | | 17,114,755 | | | | 4,435,445 | | | Cost and estimated earnings in excess of billings on uncompleted contracts | | | 2,336,880 | | | | 456,104 | | | Deposits and prepaid expenses | | | 47,308,857 | | | | 14,868,838 | | | Accounts receivable, net of allowance for doubtful accounts | | | 52,948,350 | | | | 27,531,915 | | | Due from related parties | | | - | | | | 15,820,752 | | | Other receivables | | | 5,954,248 | | | | 9,688,871 | | | Total current assets | | | 134,087,355 | | | | 74,189,833 | | | Property and equipment | | | | | | | | | | Property and equipment, net of accumulated depreciation | | | 19,946,302 | | | | 2,667,765 | | | Construction in progress | | | 24,492,510 | | | | 3,577,869 | | | Land use rights, net of accumulated amortization | | | 55,733,246 | | | | 56,507,470 | | | Total property and equipment | | | 100,172,058 | | | | 62,753,104 | | | Other assets | | | | | | | | | | Goodwill | | | 724,940 | | | | 724,940 | | | Proprietary technologies, net of accumulated amortization | | | 8,114,624 | | | | 6,977,675 | | | Long term accounts receivable | | | - | | | | 5,936,718 | | | License rights | | | 1 | | | | 1 | | | Unconsolidated equity investee | | | - | | | | 1,258,607 | | | Total other assets | | | 8,839,565 | | | | 14,897,941 | | | Total assets | | $ | 243,098,978 | | | $ | 151,840,878 | | | LIABILITIES AND STOCKHOLDERS' EQUITY | | | | | | | | | | Current liabilities | | | | | | | | | | Accounts payable and accrued expenses | | $ | 5,762,643 | | | $ | 1,202,104 | | | Billings in excess of costs and estimated earnings on uncompleted contracts | | | 2,790,084 | | | | 1,962,119 | | | Due to a director | | | 3,345,803 | | | | 289,764 | | | Dividends payable | | | 951,308 | | | | 155,957 | | | Other payables | | | 6,654,478 | | | | 11,968,148 | | | Due to related parties | | | - | | | | 867,413 | | | Short term bank loan | | | 3,181,927 | | | | - | | | | | | 22,686,243 | | | | 16,445,505 | | | Non-current liabilities | | | | | | | | | | Deferred dividends payable | | | 3,146,987 | | | | - | | | Long term debts | | | 175,006 | | | | - | | | | | | 3,321,993 | | | | - | | | Commitments and contingencies | | | - | | | | - | | | Stockholders' equity | | | | | | | | | | Preferred stock: $0.001 par value | | | | | | | | | | (10,000,000 shares authorized, 10,000,100 and 7,000,100 shares issued and outstanding as of December 31, 2012 and December 31, 2011, respectively) | | | - | | | | - | | | Series A preferred stock: $0.001 par value | | | | | | | | | | (100 shares designated, 100 shares issued and outstanding as of December 31, 2012 and December 31, 2011, respectively) | | | - | | | | - | | | Series B convertible preferred stock: $0.001 par value | | | | | | | | | | (10,000,000 shares designated, 10,000,000 and 7,000,000 shares issued and outstanding as of December 31,2012 and December 31, 2011, respectively) | | | 10,000 | | | | 7,000 | | | Series F Non-convertible preferred stock: $0.001 par value | | | | | | | | | | (1,000,000 shares designated, 0 shares issued and outstanding as of December 31, 2012 and December 31, 2011, respectively) | | | - | | | | - | | | Common stock: $0.001 par value | | | | | | | | | | (130,000,000 shares authorized, 100,004,850 and 67,034,262 shares issued and oustanding as of December 31, 2012 and December 31, 2011, respectively) | | | 100,005 | | | | 67,034 | | | Additional paid - in capital | | | 91,216,428 | | | | 72,794,902 | | | Retained earnings | | | 103,864,308 | | | | 50,395,444 | | | Accumulated other comprehensive income | | | 3,868,274 | | | | 3,446,838 | | | Treasury stock | | | (1,250,000 | ) | | | (1,250,000 | ) | | Total Sino Agro Food, Inc. and subsidiaries stockholders' equity | | | 197,809,015 | | | | 125,461,218 | | | Non - controlling interest | | | 19,281,727 | | | | 9,934,155 | | | Total stockholders' equity | | | 217,090,742 | | | | 135,395,373 | | | Total liabilities and stockholders' equity | | $ | 243,098,978 | | | $ | 151,840,878 | |
| | | Note | | March 31, 2019 | | | December 31, 2018 | | | | | | | (Unaudited) | | | (Audited) | | | ASSETS | | | | | | | | | | | | Current assets | | | | | | | | | | | | Cash and cash equivalents | | 5 | | $ | 305,721 | | | $ | 4,950,799 | | | Inventories | | 6 | | | 56,402,108 | | | | 54,582,241 | | | Costs and estimated earnings in excess of billings on uncompleted contracts | | 18 | | | 250,828 | | | | 250,828 | | | Deposits and prepayments | | 7 | | | 53,290,057 | | | | 52,241,190 | | | Accounts receivable, net of allowance for doubtful accounts | | 8 | | | 100,938,113 | | | | 101,652,131 | | | Other receivables | | 9 | | | 31,103,922 | | | | 28,307,526 | | | Total current assets | | | | | 242,290,749 | | | | 241,984,715 | | | Plant and equipment | | | | | | | | | | | | Plant and equipment, net of accumulated depreciation | | 10 | | | 235,473,231 | | | | 230,645,659 | | | Construction in progress | | 11 | | | 13,166,423 | | | | 12,515,527 | | | Land use rights, net of accumulated amortization | | 12 | | | 54,289,629 | | | | 53,814,281 | | | Total plant and equipment | | | | | 302,929,283 | | | | 296,975,467 | | | Other assets | | | | | | | | | | | | Goodwill | | 13 | | | 724,940 | | | | 724,940 | | | Proprietary technologies, net of accumulated amortization | | 14 | | | 8,816,670 | | | | 8,937,071 | | | Interests in unconsolidated equity investees | | 15 | | | 209,435,455 | | | | 207,074,626 | | | Temporary deposits paid to entities for investments in Sino joint venture companies | | 16 | | | 34,894,047 | | | | 34,905,960 | | | Total other assets | | | | | 253,871,112 | | | | 251,642,597 | | | | | | | | | | | | | | | Total assets | | | | $ | 799,091,144 | | | $ | 790,602,779 | | | | | | | | | | | | | | | LIABILITIES AND STOCKHOLDERS’ EQUITY | | | | | | | | | | | | | | | | | | | | | | | | Current liabilities | | | | | | | | | | | | Accounts payable and accrued expenses | | | | $ | 10,425,270 | | | $ | 8,280,358 | | | Billings in excess of costs and estimated earnings on uncompleted contracts | | 18 | | | 5,407,136 | | | | 5,348,293 | | | Due to a director | | | | | 259,193 | | | | 2,046,499 | | | Other payables | | 19 | | | 47,016,748 | | | | 42,523,811 | | | Borrowings - Short term bank loan | | 20 | | | 4,677,755 | | | | 4,589,828 | | | Derivative liability | | 21 | | | - | | | | 2,100 | | | Convertible note payable | | 21 | | | - | | | | 3,894,978 | | | Income tax payable | | | | | - | | | | - | | | | | | | | 67,786,102 | | | | 66,685,867 | | | | | | | | | | | | | | | Non-current liabilities | | | | | | | | | | | | Other payables | | 19 | | | 7,759,801 | | | | 7,792,774 | | | Borrowings - Long term bank loan | | 20 | | | 5,643,006 | | | | 5,536,938 | | | | | | | | 13,402,807 | | | | 13,329,712 | | | | | | | | | | | | | | | Commitments and contingencies | | | | | - | | | | - | | | | | | | | | | | | | | | Stockholders’ equity | | | | | | | | | | | | Common stock: $0.001 par value (50,000,000 shares authorized, 49,976,085 and 49,866,174 shares issued and outstanding as of March 31, 2019 and December 31, 2018, respectively) | | 22 | | | 49,976 | | | | 49,866 | | | Additional paid - in capital | | | | | 181,533,919 | | | | 181,501,056 | | | Retained earnings | | | | | 459,424,518 | | | | 458,811,844 | | | Accumulated other comprehensive income | | | | | (5,316,005 | ) | | | (10,415,786 | ) | | Treasury stock | | | | | (1,250,000 | ) | | | (1,250,000 | ) | | Total Sino Agro Food, Inc. and subsidiaries stockholders’ equity | | | | | 634,442,408 | | | | 628,696,980 | | | Non - controlling interest | | | | | 83,459,827 | | | | 81,890,220 | | | Total stockholders’ equity | | | | | 717,902,235 | | | | 710,587,200 | | | Total liabilities and stockholders’ equity | | | | $ | 799,091,144 | | | $ | 790,602,779 | |
The accompanying notes are an integral part of these consolidated financial statements. SINO AGRO FOOD, INC. CONSOLIDATED STATEMENTS OF INCOME AND OTHER COMPREHENSIVE INCOME FOR THE YEARS ENDED DECEMBER 31, 2012 AND 2011
| | | 2012 | | | 2011 | | | | | $ | | | $ | | | Continuing operations | | | | | | | | | | Revenue | | | 138,613,639 | | | | 51,879,903 | | | | | | | | | | | | | Cost of goods sold | | | 68,807,471 | | | | 26,951,874 | | | | | | | | | | | | | Gross profit | | | 69,806,168 | | | | 24,928,029 | | | | | | | | | | | | | General and administrative expenses | | | (8,385,862 | ) | | | (5,302,736 | ) | | Net income from operations | | | 61,420,306 | | | | 19,625,293 | | | | | | | | | | | | | Other income (expenses) | | | | | | | | | | | | | | | | | | | | Government grant | | | 139,836 | | | | - | | | | | | | | | | | | | Other income | | | 308,332 | | | | 449,498 | | | | | | | | | | | | | Gain of extinguishment of debts | | | 1,666,386 | | | | 987,518 | | | | | | | | | | | | | Interest expenses | | | (282,320 | ) | | | - | | | | | | | | | | | | | Net other income (expenses) | | | 1,832,234 | | | | 1,437,016 | | | | | | | | | | | | | Net income before income taxes | | | 63,252,540 | | | | 21,062,309 | | | | | | | | | | | | | Provision for income taxes | | | - | | | | (31 | ) | | | | | | | | | | | | Net income from continuing operations | | | 63,252,540 | | | | 21,062,278 | | | Less: Net (income) attributable to the non - controlling interest | | | (5,706,708 | ) | | | (5,371,246 | ) | | Net income from continuing operations attributable to the Sino Agro Food, Inc. and subsidiaries | | | 57,545,832 | | | | 15,691,032 | | | Discontinued operations | | | | | | | | | | Net income from discontinued operations | | | - | | | | 10,203,951 | | | Less: Net income attributable to the non - controlling interest | | | - | | | | - | | | Net income from discontinued operations attributable to the Sino Agro Food, Inc. and subsidiaries | | | - | | | | 10,203,951 | | | Net income attributable to the Sino Agro Food, Inc. and subsidiaries | | | 57,545,832 | | | | 25,894,983 | | | Other comprehensive income | | | | | | | | | | Foreign currency translation gain | | | 448,984 | | | | 3,815,775 | | | Comprehensive income | | | 57,994,816 | | | | 29,710,758 | | | Less: other comprehensive (income) loss attributable to the non - controlling interest | | | (27,548 | ) | | | (721,880 | ) | | Comprehensive income attributable to the Sino Agro Food, Inc. and subsidiaries | | | 57,967,268 | | | | 28,988,878 | | | Earnings per share attributable to Sino Agro Food, Inc. and subsidiaries common stockholders: | | | | | | | | | | From continuing and discontinued operations | | | | | | | | | | Basic | | $ | 0.70 | | | $ | 0.43 | | | | | | | | | | | | | Diluted | | $ | 0.63 | | | $ | 0.39 | | | | | | | | | | | | | Earnings per share attributable to Sino Agro Food, Inc. and subsidiaries common stockholders: | | | | | | | | | | From continuing operations | | | | | | | | | | | | | | | | | | | | Basic | | $ | 0.70 | | | $ | 0.26 | | | | | | | | | | | | | Diluted | | $ | 0.63 | | | $ | 0.23 | | | | | | | | | | | | | Weighted average number of shares outstanding: | | | | | | | | | | | | | | | | | | | | Basic | | | 82,016,910 | | | | 60,158,210 | | | | | | | | | | | | | Diluted | | | 92,016,910 | | | | 67,158,210 | |
The accompanying notes are an integral part of these consolidated financial statements.
SINO AGRO FOOD, INC.
CONSOLIDATED STATEMENTS OF SHAREHOLDERS’ EQUITY
FOR THE YEARS ENDED DECEMBER 31, 2012 AND 2011
| | | | | | | | | Series A | | | Series B Convertible | | | Series F Non
convertible | | | | | Common stock | | | Preferred stock | | | Preferred stock | | | preferred stock | | | | | Par value $0.001 | | | Par value $0.001 | | | Par value $0.001 | | | Par value $0.001 | | | | | Number | | | | | | Number | | | | | | Number | | | | | | Number | | | | | | | | of shares | | | Amount | | | of shares | | | Amount | | | of shares | | | Amount | | | of shares | | | Amount | | | | | | | | $ | | | | | | $ | | | | | | $ | | | | | | $ | | | Balance as of January 1, 2011 | | | 55,474,136 | | | | 55,474 | | | | 100 | | | | - | | | | 7,000,000 | | | | 7,000 | | | | - | | | | - | | | | | | | | | | | | | | | | | | | | | | | | | | | | | | | | | | | | | Issue of common stock | | | | | | | | | | | | | | | | | | | | | | | | | | | | | | | | | | - For settlement of debts | | | 15,619,397 | | | | 15,619 | | | | - | | | | - | | | | - | | | | - | | | | - | | | | - | | | - Services rendered | | | 1,800,000 | | | | 1,800 | | | | - | | | | - | | | | - | | | | - | | | | - | | | | - | | | - Employees' compensation | | | 2,760,729 | | | | 2,761 | | | | - | | | | - | | | | - | | | | - | | | | - | | | | - | | | | | | | | | | | | | | | | | | | | | | | | | | | | | | | | | | | | | Common stock redeemed at stated value for cancellation | | | (8,620,000 | ) | | | (8,620 | ) | | | - | | | | - | | | | - | | | | - | | | | - | | | | - | | | | | | | | | | | | | | | | | | | | | | | | | | | | | | | | | | | | | Purchases of treasury stock | | | - | | | | - | | | | - | | | | - | | | | - | | | | - | | | | - | | | | - | | | | | | | | | | | | | | | | | | | | | | | | | | | | | | | | | | | | | Disposal of HYT group | | | - | | | | - | | | | - | | | | - | | | | - | | | | - | | | | - | | | | - | | | | | | | | | | | | | | | | | | | | | | | | | | | | | | | | | | | | | Net income for the year | | | | | | | | | | | | | | | | | | | | | | | | | | | | | | | | | | - Continuing operation | | | - | | | | - | | | | - | | | | - | | | | - | | | | - | | | | - | | | | - | | | - Discontinued operation | | | - | | | | - | | | | | | | | | | | | | | | | | | | | | | | | | | | | | | | | | | | | | | | | | | | | | | | | | | | | | | | | | | | | | Dividends | | | - | | | | - | | | | - | | | | - | | | | - | | | | - | | | | - | | | | - | | | | | | | | | | | | | | | | | | | | | | | | | | | | | | | | | | | | | Foreign currency translation gain | | | - | | | | - | | | | - | | | | - | | | | - | | | | - | | | | - | | | | - | | | | | | | | | | | | | | | | | | | | | | | | | | | | | | | | | | | | | Balance as of December 31, 2011 | | | 67,034,262 | | | | 67,034 | | | | 100 | | | | - | | | | 7,000,000 | | | | 7,000 | | | | - | | | | - | | | | | | | | | | | | | | | | | | | | | | | | | | | | | | | | | | | | | Issue of Series B convertible preferred stock | | | - | | | | - | | | | - | | | | - | | | | 3,000,000 | | | | 3,000 | | | | - | | | | - | | | Issue of common stock | | | | | | | | | | | | | | | | | | | | | | | | | | | | | | | | | | - settlement of debts | | | 32,064,588 | | | | 32,065 | | | | - | | | | - | | | | - | | | | - | | | | - | | | | - | | | - Employees' compensation | | | 906,000 | | | | 906 | | | | | | | | | | | | | | | | | | | | | | | | | | | Amortize discount- Convertible notes | | | | | | | | | | | | | | | | | | | | | | | | | | | | | | | | | | Net income for the year | | | | | | | | | | | | | | | | | | | | | | | | | | | | | | | | | | - Continuing operation | | | - | | | | - | | | | - | | | | - | | | | - | | | | - | | | | - | | | | - | | | | | | | | | | | | | | | | | | | | | | | | | | | | | | | | | | | | | Business combination of subsidiaries | | | | | | | | | | | | | | | | | | | | | | | | | | | | | | | | | | Dividends | | | - | | | | - | | | | - | | | | - | | | | - | | | | - | | | | - | | | | - | | | | | | | | | | | | | | | | | | | | | | | | | | | | | | | | | | | | | Foreign currency translation gain | | | - | | | | - | | | | - | | | | - | | | | - | | | | - | | | | - | | | | - | | | Balance as of December 31, 2012 | | | 100,004,850 | | | | 100,005 | | | | 100 | | | | - | | | | 10,000,000 | | | | 10,000 | | | | - | | | | - | |
| | | Note | | Three months ended
March 31, 2019 | | | Three months ended
March 31, 2018 | | | | | | | (Unaudited) | | | (Unaudited) | | | Revenue | | | | | | | | | | | | - Sale of goods | | | | $ | 28,267,649 | | | $ | 31,258,860 | | | - Consulting and service income from development contracts | | | | | 991,002 | | | | 2,472,404 | | | | | | | | 29,258,651 | | | | 33,731,264 | | | Cost of goods sold | | | | | (23,310,212 | ) | | | (25,863,020 | ) | | Cost of services | | | | | (939,684 | ) | | | (1,784,322 | ) | | Gross profit | | | | | 5,008,755 | | | | 6,083,922 | | | | | | | | | | | | | | | General and administrative expenses | | | | | (3,757,288 | ) | | | (3,662,729 | ) | | Net income from operations | | | | | 1,251,467 | | | | 2,421,193 | | | | | | | | | | | | | | | Other income (expenses) | | | | | | | | | | | | Government grant | | | | | 293,870 | | | | - | | | Share of income from unconsolidated equity investee | | | | | 2,390,454 | | | | 3,782,011 | | | Other income | | | | | - | | | | 878 | | | Loss on restructuring | | | | | (2,404,402 | ) | | | - | | | Non-operating expenses | | | | | (219,727 | ) | | | (22,004 | ) | | Interest expense | | | | | (477,806 | ) | | | (453,651 | ) | | | | | | | | | | | | | | Net income (expenses) | | | | | (417,611 | ) | | | 3,307,234 | | | | | | | | | | | | | | | Net income before income taxes | | | | | 833,856 | | | | 5,728,427 | | | | | | | | | | | | | | | Provision for income taxes | | 4 | | | - | | | | - | | | | | | | | | | | | | | | Net income | | | | | 833,856 | | | | 5,728,427 | | | Less: Net (income) loss attributable to non - controlling interest | | | | | (221,182 | ) | | | (655,708 | ) | | Net income attributable to Sino Agro Food, Inc. and subsidiaries | | | | | 612,674 | | | | 5,072,719 | | | Other comprehensive income (loss) - Foreign currency translation (loss) income | | | | | 6,448,205 | | | | 21,880,850 | | | Comprehensive income | | | | | 7,060,879 | | | | 26,953,569 | | | Less: other comprehensive (income) loss attributable to non - controlling interest | | | | | (1,348,424 | ) | | | (11,253,610 | ) | | Comprehensive income attributable to Sino Agro Food, Inc. and subsidiaries | | | | $ | 5,712,455 | | | $ | 15,699,959 | | | | | | | | | | | | | | | Earnings per share attributable to Sino Agro Food, Inc. and subsidiaries common stockholders: | | | | | | | | | | | | | | | | | | | | | | | | Basic | | 27 | | $ | 0.01 | | | $ | 0.17 | | | Diluted | | 27 | | $ | 0.01 | | | $ | 0.17 | | | Weighted average number of shares outstanding: | | | | | | | | | | | | Basic | | 27 | | | 49,873,502 | | | | 30,653,770 | | | Diluted | | 27 | | | 49,873,502 | | | | 30,653,770 | |
The accompanying notes are an integral part of these consolidated financial statements. SINO AGRO FOOD, INC. CONSOLIDATED STATEMENTS OF SHAREHOLDERS’ EQUITY FOR THE YEARS ENDED DECEMBER 31, 2012 AND 2011CASH FLOWS
| | | | | | | | | | | | | | | Accumulated | | | | | | | | | | | Treasury stock | | | Additional | | | | | | other | | | Non - | | | | | | | | Number | | | | | | paid - in | | | Retained | | | comprehensive | | | controlling | | | | | | | | of shares | | | Amount | | | capital | | | earnings | | | income | | | interest | | | Total | | | | | | | | $ | | | $ | | | $ | | | $ | | | $ | | | $ | | | Balance as of January 1, 2011 | | | - | | | | - | | | | 58,586,362 | | | | 25,019,971 | | | | 3,804,116 | | | | 13,578,958 | | | | 101,051,881 | | | | | | | | | | | | | | | | | | | | | | | | | | | | | | | | | Issue of common stock | | | | | | | | | | | | | | | | | | | | | | | | | | | | | | - settlement of debts | | | - | | | | - | | | | 11,496,767 | | | | - | | | | - | | | | - | | | | 11,512,386 | | | - services rendered | | | - | | | | - | | | | 1,618,200 | | | | - | | | | - | | | | - | | | | 1,620,000 | | | - employees' compensation | | | - | | | | - | | | | 2,664,353 | | | | - | | | | - | | | | - | | | | 2,667,114 | | | | | | | | | | | | | | | | | | | | | | | | | | | | | | | | | Common stock redeemed at stated value for cancellation | | | - | | | | - | | | | (1,570,780 | ) | | | - | | | | - | | | | - | | | | (1,579,400 | ) | | | | | | | | | | | | | | | | | | | | | | | | | | | | | | | | Purchases of treasury stock | | | (1,000,000 | ) | | | (1,250,000 | ) | | | - | | | | - | | | | - | | | | - | | | | (1,250,000 | ) | | | | | | | | | | | | | | | | | | | | | | | | | | | | | | | | Disposal of HYT group | | | - | | | | - | | | | - | | | | - | | | | (3,451,173 | ) | | | (9,737,929 | ) | | | (13,189,102 | ) | | | | | | | | | | | | | | | | | | | | | | | | | | | | | | | | Net income for the year | | | | | | | | | | | | | | | | | | | | | | | | | | | | | | - Continuing operation | | | - | | | | - | | | | - | | | | 15,691,032 | | | | - | | | | 5,371,246 | | | | 21,062,278 | | | - Discontinued operation | | | - | | | | - | | | | - | | | | 10,203,951 | | | | - | | | | - | | | | 10,203,951 | | | | | | | | | | | | | | | | | | | | | | | | | | | | | | | | | Dividends | | | - | | | | - | | | | - | | | | (519,510 | ) | | | - | | | | - | | | | (519,510 | ) | | | | | | | | | | | | | | | | | | | | | | | | | | | | | | | | Foreign currency translation gain | | | - | | | | - | | | | - | | | | - | | | | 3,093,895 | | | | 721,880 | | | | 3,815,775 | | | | | | | | | | | | | | | | | | | | | | | | | | | | | | | | | Balance as of December 31, 2011 | | | (1,000,000 | ) | | | (1,250,000 | ) | | | 72,794,902 | | | | 50,395,444 | | | | 3,446,838 | | | | 9,934,155 | | | | 135,395,373 | | | | | | | | | | | | | | | | | | | | | | . | | | | | | | | | | | Issue of Series B convertible preferred stock | | | - | | | | - | | | | - | | | | - | | | | - | | | | - | | | | 3,000 | | | Issue of common stock | | | | | | | | | | | | | | | | | | | | | | | | | | | | | | - settlement of debts | | | - | | | | - | | | | 17,831,352 | | | | - | | | | - | | | | - | | | | 17,863,417 | | | - employees' compensation | | | - | | | | - | | | | 361,494 | | | | - | | | | - | | | | - | | | | 362,400 | | | Amortize discount - Convertible notes | | | | | | | | | | | 228,680 | | | | | | | | | | | | | | | | 228,680 | | | Net income for the year | | | | | | | | | | | | | | | | | | | | | | | | | | | | | | - Continuing operation | | | - | | | | - | | | | - | | | | 57,545,832 | | | | - | | | | 5,706,708 | | | | 63,252,540 | | | | | | | | | | | | | | | | | | | | | | | | | | | | | | | | | Business combination of subsidiaries | | | - | | | | - | | | | - | | | | - | | | | - | | | | 3,613,31 6 | | | | 3,613,31 6 | | | Dividends | | | - | | | | - | | | | - | | | | (4,076,968 | ) | | | - | | | | - | | | | (4,076,968 | ) | | | | | | | | | | | | | | | | | | | | | | | | | | | | | | | | Foreign currency translation gain | | | - | | | | - | | | | - | | | | - | | | | 421,436 | | | | 27,548 | | | | 448,984 | | | Balance as of December 31, 2012 | | | (1,000,000 | ) | | | (1,250,000 | ) | | | 91,216,428 | | | | 103,864,308 | | | | 3,868,274 | | | | 19,281,727 | | | | 217,090,742 | |
| | | Three months ended
March 31, 2019 | | | Three months ended
March 31, 2018 | | | | | (Unaudited) | | | (Unaudited) | | | Cash flows from operating activities | | | | | | | | | | Net income for the period | | | 833,856 | | | | 5,728,427 | | | Adjustments to reconcile net income for the period to net cash from operations: | | | | | | | | | | Share of income from unconsolidated equity investee | | | (2,390,454 | ) | | | (3,782,011 | ) | | Depreciation | | | 2,542,874 | | | | 2,658,508 | | | Amortization | | | 564,051 | | | | 569,361 | | | Share based compensation costs | | | 411,883 | | | | 226,113 | | | Government grant | | | (293,870 | ) | | | - | | | Loss on restructuring | | | 2,404,402 | | | | - | | | Changes in operating assets and liabilities: | | | | | | | | | | Increase in inventories | | | (1,819,867 | ) | | | (5,725,242 | ) | | Decrease in cost and estimated earnings in excess of billings on uncompleted contacts | | | - | | | | 998,359 | | | (Increase) decrease in deposits and prepaid expenses | | | (1,427,777 | ) | | | 511,765 | | | (Decrease) increase in due to a director | | | (1,787,306 | ) | | | 330,332 | | | Increase in accounts payable and accrued expenses | | | 2,144,912 | | | | 1,163,834 | | | (Decrease) increase in other payables | | | (1,841,516 | ) | | | 1,045,261 | | | Decrease (increase) in accounts receivable | | | 714,018 | | | | (3,595,709 | ) | | Increase in tax payable | | | - | | | | 739 | | | Increase (Decrease) in billings in excess of costs and estimated earnings on uncompleted contracts | | | 58,843 | | | | (57,622 | ) | | Increase in other receivables | | | (2,796,396 | ) | | | (6,629,169 | ) | | Decrease in amount due from unconsolidated investees | | | 29,625 | | | | 986,454 | | | Net cash used in operating activities | | | (2,652,722 | ) | | | (5,570,600 | ) | | Cash flows from investing activities | | | | | | | | | | Purchases of property and equipment | | | (3,202,715 | ) | | | (2,422,169 | ) | | Payment for construction in progress | | | - | | | | (3,053,435 | ) | | Receipt from government grant | | | 293,870 | | | | - | | | Net cash used in investing activities | | | (2,908,845 | ) | | | (5,475,604 | ) | | Effects on exchange rate changes on cash | | | 916,489 | | | | 11,108,045 | | | | | | | | | | | | | (Decrease) increase in cash and cash equivalents | | | (4,645,078 | ) | | | 61,841 | | | Cash and cash equivalents, beginning of period | | | 4,950,799 | | | | 560,043 | | | Cash and cash equivalents, end of period | | $ | 305,721 | | | $ | 621,884 | | | | | | | | | | | | | Supplementary disclosures of cash flow information: | | | | | | | | | | Cash paid for interest | | $ | 149,000 | | | $ | 148,738 | | | Non - cash transactions | | | | | | | | | | Common stock issued for service and compensation | | $ | - | | | $ | 3,082,384 | | | Common stock issued for settling debits | | $ | 32,973 | | | $ | - | |
The accompanying notes are an integral part of these consolidated financial statements. SINO AGRO FOOD, INC. CONSOLIDATED STATEMENT OF CASH FLOWS
FOR THE YEARS ENDED DECEMBER 31, 2012 AND 2011
| | | 2012 | | | 2011 | | | Cash flows from operating activities | | | | | | | | | | Net income from continuing operations | | $ | 63,252,540 | | | $ | 21,062,278 | | | Adjustments to reconcile net income from continuing operations to net cash from operations: | | | | | | | | | | Depreciation | | | 443,361 | | | | 220,810 | | | Amortization | | | 1,934,909 | | | | 1,043,181 | | | (Gain) on extinguishment of debts | | | (1,666,386 | ) | | | (987,518 | ) | | Common stock issued for services and employee's compensation | | | 2,229,657 | | | | 2,139,057 | | | Changes in operating assets and liabilities: | | | | | | | | | | Increase in inventories | | | (10,037,494 | ) | | | (3,018,112 | ) | | Increase in deposits and prepaid expenses | | | (34,307,276 | ) | | | (7,374,355 | ) | | Increase (decrease) in due to a director | | | 12,239,470 | | | | (6,313,966 | ) | | Increase in accounts payable and accrued expenses | | | 3,330,443 | | | | 833,667 | | | (Decrease) increase in other payables | | | 1,482,417 | | | | 16,748,043 | | | Increase in accounts receivable | | | (18,142,198 | ) | | | (18,250,484 | ) | | Increase in cost and estimated earnings in excess of billings on uncompleted contracts | | | (1,880,776 | ) | | | (456,104 | ) | | Increase in billings on uncompleted contracts in excess of costs and estimated earnings | | | 827,965 | | | | 1,962,119 | | | (Decrease) Increase in due to related parties | | | (867,413 | ) | | | 643,529 | | | Decrease (Increase) in due from related parties | | | 15,820,752 | | | | - | | | Decrease (increase) in other receivables | | | 3,734,623 | | | | (3,651,677 | ) | | Net cash provided by operating activities | | | 38,394,594 | | | | 4,600,468 | | | Cash flows from investing activities | | | | | | | | | | Acquisition of proprietary technologies | | | (1,500,000 | ) | | | - | | | Purchases of property and equipment | | | (10,756,744 | ) | | | (252,346 | ) | | Proceeds of disposal of subsidiaries | | | - | | | | 557,700 | | | Investment in unconsolidated equity investees | | | - | | | | (1,258,607 | ) | | Net cash outflow from business combination of subsidiaries less cash acquired | | | (6,893,349 | ) | | | - | | | Payment for construction in progress | | | (19,185,878 | ) | | | (1,346,394 | ) | | Net cash used in investing activities | | | (38,335,971 | ) | | | (2,299,647 | ) | | Cash flows from financing activities | | | | | | | | | | Proceeds From Long term debt | | | 175,006 | | | | - | | | Non-controlling interest contribution | | | 3,634,064 | | | | - | | | Proceeds from Short term debt | | | 3,181,927 | | | | - | | | Dividends paid | | | (134,631 | ) | | | (573,814 | ) | | Net cash provided by (used in) financing activities | | | 6,856,366 | | | | (573,814 | ) | | Net cash provided by continuing operations | | | 6,914,989 | | | | 1,727,007 | | | Cash flows from discontinued operations | | | | | | | | | | Net cash provided by operating activities | | | - | | | | - | | | Net cash used in investing activities | | | - | | | | (3,137,885 | ) | | Net cash used in financing activities | | | - | | | | - | | | Net cash used in discontinued operations | | | - | | | | (3,137,885 | ) | | Effects on exchange rate changes on cash | | | 121,368 | | | | (1,091,240 | ) | | Increase in cash and cash equivalents | | | 7,036,357 | | | | (2,502,118 | ) | | Cash and cash equivalents, beginning of year | | | 1,387,908 | | | | 3,890,026 | | | | | | 8,424,265 | | | | 1,387,908 | | | Less: cash and cash equivalents at the end of the year - discontinued operation | | | - | | | | - | | | Cash and cash equivalents at the end of the year - continuing operations | | $ | 8,424,265 | | | $ | 1,387,908 | | | | | | | | | | | | | Supplementary disclosures of cash flow information: | | | | | | | | | | Cash paid for interest | | $ | 282,320 | | | | - | | | Cash paid for income taxes | | | - | | | $ | 31 | | | Non - cash transactions: | | | | | | | | | | Common stock issued for settlement of debts | | $ | 17,863,417 | | | $ | 11,512,386 | | | Series B convertible preferred stock | | $ | 3,000 | | | | - | | | Common stock issued for service and employee compensation | | $ | 362,400 | | | $ | 4,278,114 | | | Common stock acquired for cancellation | | | - | | | $ | (1,579,400 | ) | | Transfer to property and equipment from construction in progress | | $ | 6,419,170 | | | | - | | | Transfer to land use rights from construction in progress | | $ | 528,451 | | | | - | | | Settlement of land use rights payable in contra of disposal proceeds receivable | | | - | | | $ | 38,056,750 | | | Disposal proceeds receivable from sale of subsidiaries, HYT and ZX | | | - | | | $ | 5,386,233 | | | Purchases of treasury stock | | | - | | | $ | (1,250,000 | ) |
Note: Certain comparative figures have been reclassified to conform to current year presentation.
The accompanying notes are an integral part of these consolidated financial statements.
SINO AGRO FOOD, INC. AND SUBSIDIARIES
NOTES TO CONSOLIDATED FINANCIAL STATEMENTS | 1. | 1. | CORPORATE INFORMATION |
Sino Agro Food, Inc. (the “Company” or “SIAF”) (formerly known as Volcanic Gold, Inc. and A Power Agro Agriculture Development, Inc.) was incorporated on October 1, 1974 in the State of Nevada.Nevada, United States of America. The Company was engaged in the mining and exploration business but ceased its mining and exploring business on October 14, 2005. On August 24, 2007, the Company entered into a Merger and Acquisition Agreement with Capital Award Inc., a Belize corporation (“CA”) and its subsidiaries Capital Stage Inc. (“CS”) and Capital Hero Inc. (“CH”). Effective the same date, CA completed a reverse merger transaction with SIAF. SIAF acquired all the outstanding common stock of CA from Capital Adventure, a shareholder of CA, for 32,000,0003,232,323 shares of the Company’s common stock. On August 24, 2007 the Company changed its name from Volcanic Gold, Inc. to A Power Agro Agriculture Development, Inc. On December 8, 2007, the Company changed its name to Sino Agro Food, Inc. On September 5, 2007, the Company acquired three existing businesses in the People’s Republic of China (the“PRCP.R.C.””): | (a) | Hang Yu Tai Investment Limited (“HYT”), a company incorporated in Macau, the owner of a 78% equity interest in ZhongXingNongMu Ltd (“ZX”), a company incorporated in the PRC;P.R.C.; |
| (b) | Tri-way Industries Limited (“TRW”), a company incorporated in Hong Kong; and |
| (c) | Macau Eiji Company Limited (“MEIJI”MEIJI”), a company incorporated in Macau, the owner of 75% equity interest in Enping City Juntang Town Hang Sing Tai Agriculture Co. Ltd. (“HST”), a PRCP.R.C. corporate Sino-Foreign joint venture. HST was dissolved in 2010. |
On November 27, 2007, MEIJI and HST established a corporate Sino - Foreign joint venture, Jiang Men City Heng Sheng Tai Agriculture Development Co. Ltd. (“JHST”), a company incorporated in the PRCP.R.C. with MEIJI owning a 75% interest and HST owning a 25% interest. On November 26, 2008, SIAF established Pretty Mountain Holdings Limited (“PMH”), a company incorporated in Hong Kong with an 80% equity interest. On May 25, 2009, PMH formed a corporate Sino-Foreign joint venture, Qinghai Sanjiang A Power Agriculture Co. Ltd. (“SJAP”), incorporated in the PRC,P.R.C., of which PMH ownedowns a 45% equity interest. At the time, the remaining 55% equity interest in SJAP was owned by the following entities: Qinghai Province Sanjiang Group Company Limited (English translation) (“Qinghai Sanjiang”), a company owned by the PRC with major business activities in the agriculture industry; and
| · | Qinghai Province Sanjiang Group Company Limited (English translation) (“Qinghai Sanjiang”), a company incorporated in the P.R.C with major business activities in the agriculture industry; and |
Guangzhou City Garwor Company Limited (English translation) (“Garwor”), a private limited company incorporated in the PRC, specializing in sales and marketing.
| · | Guangzhou City Garwor Company Limited (English translation) (“Garwor”), a company incorporated in the P.R.C., specializing in sales and marketing. |
SJAP is engaged in the business of manufacturing bio-organic fertilizer, livestock feed and development of other agriculture projects in the County of Huangyuan, in the vicinity of the Xining City, Qinghai Province, PRC.P.R.C. In September 2009, the Company carried out an internal reorganization of its corporate structure and business, and formed a 100% owned subsidiary, A Power Agro Agriculture Development (Macau) Limited (“APWAM”), which was formed in Macau. APWAM then acquired PMH’s 45% equity interest in SJAP. By virtue of the acquisition, APWAM assumed all obligations and liabilities of PMH under the Sino Foreign Joint Venture Agreement. On May 7, 2010, Qinghai Sanjiang sold and transferred its equity interest in SJAP to Garwor. The State Administration for Industry and Commerce of Xining City Government of the PRC approved the sale and transfer. As a result, APWAM owned 45% of SJAP and Garwor owned the remaining 55%. This remains the case as of the date of this annual report (the “Report”). On September 9, 2010, an application was submitted by the Company to the Companies Registry of Hong Kong for deregistration of PMH under Section 291AA of the Hong Kong Companies Ordinance. On January 28, 2011, PMH was dissolved. On March 23, 2017, Qinghai Quanwang Investment Management Company Limited (” Quanwang “) acquired 8.3% equity interest in SJAP for total cash consideration of $459,137. As of March 31, 2019, APWAM owned 41.25% of SJAP, Garwor owned 50.45% and Quanwang owned the remaining 8.3%. SINO AGRO FOOD, INC. NOTES TO CONSOLIDATED FINANCIAL STATEMENTS | 1. | CORPORATE INFORMATION (CONTINUED) |
On February 15, 2011 and on March 29, 2011, the Company entered into an agreement and a memorandum of understanding (a(an “MOU”), respectively, to sell 100% equity interest in HYT group (including HYT and ZX) to Mr. Xin Ming Sun, a director of ZhongXingNong Nu Co., Ltd for $45,000,000, with an effective date of January 1, 2011. SINO AGRO FOOD, INC. AND SUBSIDIARIES
NOTES TO CONSOLIDATED FINANCIAL STATEMENTS
TheOn February 28, 2011, the Company applied to form Enping City Bi Tao A Power Prawn Culture Development Co.Co Limited (“EBAPCD”EBAPCD”), in whichand the Company would indirectly own a 25% equity interest on February 28, 2011.in future Sino Joint Venture Company (pending approval).
On February 28, 2011, TRW applied to form a corporate joint venture, Enping City Bi Tao A Power Fishery Development Co., Limited (“EBAPFD”), incorporated in the PRC. TRW owned a 25% equity interest in EBAPFD. On November 17, 2011, TRW formed Jiang Men City A Power Fishery Development Co., Limited (“JFD”) in which it acquired a 25% equity interest, while withdrawing its 25% equity interest in EBAPFD. As of December 31, 2011, the Company had invested for total cash consideration of $1,258,607 in JFD. JFD operates an indoor fish farm. On January 1, 2012, the Company acquired an additional 25% equity interest in JFD for total cash consideration of $1,662,365. As of January 1, 2012, the Company had consolidated the assets and operations of JFD. On April 1, 2012, the Company acquired an additional 25% equity interest in JFD for the amounttotal cash consideration of $1,702,580. These acquisitions were at our option according the terms of the original development agreement. The Company presently ownsowned a 75% equity interest in JFD, representing majority of votesvoting rights and controls its board of directors. On August 15, 2016, the acquisition agreement was executed by TRW for acquiring the other 25% equity in JFD which was a Sino Foreign Joint Venture Co. that TRW had 100% equity interest with effect on October 5, 2016. Upon the acquisitions of 3 additional prawn farms assets at fair value of $238.32 million from respective third parties and the master technology license at fair value of $30 million from Capital Award, Inc. by JFD, and the consideration of the above acquisitions were planned to be settled by the new issue shares of 99,990,000 TRW shares at $3.41 amounting to $340.53 million on or before March 31, 2017. As of December 31, 2012,a result, SIAF’s equity interest in TRW was diluted from 100% to 23.89% with effective on October 5, 2016. The above transactions leaded the Company hadloss of control over TRW group, the Company’s investments in TRW and JFD were reclassified from a subsidiary to investments in unconsolidated equity investees as of October 5, 2016. The dilution of the Company’s investments in TRW group constituted a deemed disposal of the subsidiaries. The deemed gain on disposal of $56,947,005 was recorded in net income from discontinued operations of the consolidated statements of income and other comprehensive income of the Company for the year ended 31 December 2016. On October 1, 2016, SIAF took up all assets and operationsliabilities of JFD.TRW and JFD except fish farm. The Company converted the amount due from unconsolidated equity investee into equity interest during the fourth quarter of 2017, which resulted in equity interest in TRW from 23.89% to 36.60%. On April 15, 2011, MEIJI applied to form Enping City A Power Cattle Farm Co., Limited (“ECF”), all of which the Company would indirectly own a 25% equity interest in on November 17, 2011. On January 1, 2012, the Company had invested $1,076,489 in ECF and the amount was settled in contra against accounts receivable due from ECF. On September 17, 2012 MEIJI formed Jiang Men City Hang Mei Cattle Farm Development Co., Limited (“JHMC”) and acquired additional 50% equity interest for the total cash consideration of $2,944,176 on September 30, 2012 while withdrawing its 25% equity interest in ECF. This acquisition was at our option according to the terms of the original development agreement. The Company presently owns 75% equity interest in JHMC, representing majority of votesvoting right and controls its board of directors. As of December 31,September 30, 2012, the Company had consolidated the assets and operations of JHMC. This remains the case as of the date of this report. On July 18, 2011, the Company formed Hunan Shenghua A Power Agriculture Co., Limited (“HSA”), in which the Company owns a 26% equity interest, and SJAP owns a 50% equity interest with the Chinese partner owning the remaining 24%. On April 5, 2017, SJAP transferred all of its equity interest to MEIJI. This remains the case of the date of this report. On November 12, 2013, the Company acquired a shell company, Goldcup9203 AB, incorporated in Sweden, in which the Company owns a 100% equity interest. Goldcup 9203 AB changed its name to Sino Agro Food Sweden AB (publ) (“SAFS”). As of March 31, 2017, the Company invested $77,664 in SAFS. During the year ended December 31, 2012, MEIJI2016, SAFS changed from a public to a private company. SJAP formed Qinghai Zhong He Meat Products Co., Limited (“QZH”), with SJAP would owning 100% equity interest. On October 25, 2015, both QZH and new stockholder, Qinghai Quanwang Investment Management Co., Ltd (“QQI”) contributed additional capital of $4,157,682 and $769,941, respectively. As a result, SJAP invested $130,000decreased its equity interest from 100% to 85% and $425,000QQI owned a 14% equity interest. In addition, according to investment agreement between QZH and QQI, (i) QQI only enjoy interest 6% annually on its capital contribution and did not enjoy profit distribution; (ii) investment period was 3 years only, and (iii) SJAP shared 100% on profit or loss after deduction 6% interest to QQI and enjoyed 100% voting rights of QZH’s board and stockholders meetings. SJAP disposed its 85% equity interest in HSA, respectively.QZH for RMB2 (equivalent to $0) for cash and completed on December 30, 2017. As a result, QZH was derecognized as variable interest entity of the company. The Company’s principal executive office is located at Room 3801, Block A, China Shine Plaza, No. 9 Lin He Xi Road, Tianhe District, Guangzhou City, Guangdong Province, PRC,P.R.C., 510610. The nature of the operations and principal activities of the Company and its subsidiaries are described in Note 2.2. SINO AGRO FOOD, INC. NOTES TO CONSOLIDATED FINANCIAL STATEMENTS | 2. | SUMMARY OF SIGNIFICANT ACCOUNTING POLICIES |
The Company has adopted December 31 as its fiscal year end. | 2.2 | REPORTING ENTITYENTITIES |
The accompanying consolidated financial statements include the following entities:
| Name of subsidiaries | | Place of incorporation | | Percentage heldof interest | | Principal activities | | | | | | | | | | Capital Award Inc. (“CA”) | | Belize | | 100% (12.31.2018: 100%) directly | | Fishery development and holder of AP LicenseA-Power Technology master license. | | | | | | | | | | Capital Stage Inc. (“CS”) | | Belize | | 100% (12.31.2018: 100%) indirectly | | Dormant | | | | | | | | | | Capital Hero Inc. (“CH”) | | Belize | | 100% (12.31.2018: 100%) indirectly | | Dormant | | | | | | | | | Tri-way Industries LimitedSino Agro Food Sweden AB (“TRW”SAFS”) | | Hong Kong, PRCSweden | | 100% (12.31.2018: 100%) directly | | Investment holding, holder of enzyme technology master license for manufacturing of livestock feed and bio-organic fertilizer; has not commenced its planned business of fish farm operations.Dormant | | | | | | | | | Macau MeijiEiji Company Limited (“MEIJI”) | | Macau, PRCP.R.C. | | 100% (12.31.2018: 100%) directly | | Investment holding, cattle farm development, beef cattle and beef trading | | | | | | | | | | A Power Agro Agriculture Development (Macau) Limited (“APWAM”) | | Macau, PRCP.R.C. | | 100% (12.31.2018: 100%) directly | | Investment holding | | | | | | | | | | Jiang Men City Heng Sheng Tai Agriculture Development Co. Ltd (“JHST”) | | PRCP.R.C. | | 75% directly(12.31.2018: 75%) indirectly | | Hylocereus UndatusHylocereusUndatus Plantation (“HU Plantation”). | | | | | | | | | Jiang Men City A Power Fishery Development Co., Limited (“JFD”) | | PRC | | 75% indirectly treated as subsidiary | | Fish cultivation |
SINO AGRO FOOD, INC. AND SUBSIDIARIES
NOTES TO CONSOLIDATED FINANCIAL STATEMENTS
Jiang Men City Hang Mei Cattle Farm Development Co., Limited (“JHMC”) Formerly known as Enping City A Power Cattle Farm Co., Limited (“ECF”) | | PRCP.R.C. | | 75% (12.31.2018:75%) indirectly treated as subsidiary | | Beef cattle cultivation | | | | | | | | | | Hunan Shenghua A Power Agriculture Co., Limited (“HSA”) | | PRCP.R.C. | | 26% directly and 50%76% (12.31.2018:76%) indirectly | | Manufacturing of organic fertilizer, livestock feed, and beef cattle and sheep cultivation, and plantation of crops and pastures | | | | | | | | | | Name of variable interest entity | | Place of incorporation | | Percentage heldof interest | | Principal activities | | | | | | | | | | Qinghai Sanjiang A Power Agriculture Co., Ltd (“SJAP”) | | PRCP.R.C. | | 45%41.25% (12.31.2018: 41.25%) indirectly | | Manufacturing of organic fertilizer, livestock feed, and beef cattle and plantation of crops and pastures |
SINO AGRO FOOD, INC. NOTES TO CONSOLIDATED FINANCIAL STATEMENTS Name of unconsolidated equity investee2. | | Place of incorporationSUMMARY OF SIGNIFICANT ACCOUNTING POLICIES (CONTINUED) | | Percentage held | | Principal activities | | | | | | | | Enping City Bi Tao A Power Prawn Culture Development Co., Limited (“EBAPCD”) (pending approval) | | PRC | | 25% | | Prawn cultivation |
The consolidated financial statements are prepared in accordance with generally accepted accounting principles in the United States of America (“US GAAP”) ”). Interim results are not necessarily indicative of results for a full year. The information included in this interim report should be read in conjunction with the information included in the Company’s annual report on Form 10-K/A for the fiscal year ended December 31, 2012. | 2.4 | BASIS OF CONSOLIDATION |
The consolidated financial statements include the financial statements of the Company, its subsidiaries CA, CS, CH, TRW, MEIJI, HYT, ZX, HJST, JFD,JHST, JHMC, HSA, and APWAM, SAFS and its variable interest entity, SJAP. All material inter-company transactions and balances have been eliminated in consolidation. HYT and ZX were no longer recognized as subsidiaries as of January 1, 2011 and PMH was dissolved on January 28, 2011. SIAF, CA, CS, CH, TRW, MEIJI, JHST, JFD, JHMC, HSA, APWAM, SAFS and SJAP are hereafter referred to as (the “Company”“Company”). The Company adopted the accounting pronouncements relating to business combination (primarily contained in ASC Topic 805 “Business Combinations”), including assets acquired and liabilities assumed on arising from contingencies. These pronouncements established principles and requirement for how the acquirer of a business recognizes and measures in its financial statements hethe identifiable assets acquired, the liabilities assumed, and any non-controlling interest in the acquisition as well as provides guidance for recognizing and measuring the goodwill acquired in the business combination and determines what information to disclose to enable users of the financial statements to evaluate the nature and financial effects of the business combination. In addition, these pronouncements eliminate the distinction between contractual and non-contractual contingencies, including the initial recognition and measurement criteria and require an acquirer to develop a systematic and rational basis for subsequently measuring and accounting for acquired contingencies depending on their nature. The Company’s adoption of these pronouncements will have an impact on the manner in which it accounts for any future acquisitions. | 2.6 | NON - CONTROLLING INTEREST IN CONSOLIDATED FINANCIAL STATEMENTS |
The Company adopted the accounting pronouncement on non-controlling interests in consolidated financial statements, which establishes accounting and reporting standards for the non-controlling interest in a subsidiary and for the deconsolidation of a subsidiary. This guidance is primarily contained in ASC Topic “Consolidation.” It clarifies that a non-controlling interest in a subsidiary is an ownership interest in the consolidated financial statements. The adoption of this standard has not had material impact on the Company’s consolidated financial statements. The preparation of consolidated financial statements in conformity with US GAAP requires management to make assumptions and estimates that affect the reported amounts of assets and liabilities and disclosure of contingent assets and liabilities at the dates of the consolidated financial statements and the reported amounts of revenues and expenses during the reporting periods covered thereby. Actual results could differ from these estimates. Judgments and estimates of uncertainties are required in applying the Company’s accounting policies in certain areas. The following are some of the areas requiring significant judgments and estimates: determinations of the useful lives of assets, estimates of allowances for doubtful accounts, cash flow and valuation assumptions in performing asset impairment tests of long-lived assets, estimates of the realization of deferred tax assets and inventory reserves. SINO AGRO FOOD, INC. AND SUBSIDIARIES NOTES TO CONSOLIDATED FINANCIAL STATEMENTS | 2. | 2.8 | REVENUE RECOGNITIONSUMMARY OF SIGNIFICANT ACCOUNTING POLICIES (CONTINUED) |
The Company’s revenue recognition policies
On January 1, 2018, the Company adopted Topic 606, using the modified retrospective transition method applied to those contracts which were not completed as of January 1, 2018. Results for reporting periods beginning after January 1, 2018 are presented under Topic 606, while prior period amounts have not been adjusted and continue to be reported in complianceaccordance with ASCour historic accounting under Topic 605. SalesThere was no adjustment to beginning retained earnings on January 1, 2018. Under Topic 606, revenue is recognized when allcontrol of the following have occurred: (i) persuasive evidence of an arrangement exists, (ii) delivery has occurredpromised goods or services have been rendered, (iii)is transferred to the pricecustomers, in an amount that reflects the consideration the Company expect to be entitled to in exchange for those goods or services. ASU 2014-09, “Revenue from Contracts with Customers” outlines a single comprehensive model for entities to use in accounting for revenue arising from contracts with customers and supersedes most current revenue recognition guidance, including industry-specific guidance. ASU 2014-09 outlines a five-step process for revenue recognition that focuses on transfer of control, as opposed to transfer of risk and rewards, and also requires enhanced disclosures regarding the nature, amount, timing and uncertainty of revenues and cash flows from contracts with customers. Major provisions include determining which goods and services are distinct and represent separate performance obligations, how variable consideration (which may include change orders and claims) is fixedrecognized, whether revenue should be recognized at a point in time or determinable,over time and (iv)ensuring the abilitytime value of money is considered in the transaction price. ASU 2016-08, “Principal versus Agent Considerations (Reporting Revenue Gross versus Net)” clarifies the principal versus agent guidance in ASU 2014-09. ASU 2016-08 clarifies how an entity determines whether to collectreport revenue gross or net based on whether it controls a specific good or service before it is reasonably assured. These criteria are generally satisfiedtransferred to a customer. ASU 2016-08 also reframes the indicators to focus on evidence that an entity is acting as a principal rather than as an agent. ASU 2016-10, “Identifying Performance Obligations and Licensing” amends certain aspects of ASU 2014-09. ASU 2016-10 amends how an entity should identify performance obligations for immaterial promised goods or services, shipping and handling activities and promises that may represent performance obligations. ASU 2016-10 also provides implementation guidance for determining the nature of licensing and royalties arrangements. ASU 2016-12, “Narrow-Scope Improvements and Practical Expedients” also clarifies certain aspects of ASU 2014-09 including the assessment of collectability, presentation of sales taxes, treatment of noncash consideration, and accounting for completed contracts and contract modifications at transition. ASU 2016-20, “Technical Corrections and Improvements to Topic 606, Revenue from Contracts with Customers” allows an entity to determine the provision for loss contracts at either the contract level or the performance obligation level as an accounting policy election. The company determines its provision for loss contracts at the contract level. ASU 2017-05, “Clarifying the Scope of Asset Derecognition Guidance and Accounting for Partial Sales of Nonfinancial Assets” clarifies that the scope and application of ASC 610-20 on accounting for the sale or transfer of nonfinancial assets and in substance nonfinancial assets to noncustomers, including partial sales, applies only when the asset (or asset group) does not meet the definition of a business. ASU 2017-13, “Amendments to SEC Paragraphs Pursuant to the Staff Announcement at the July 20, 2017 EITF Meeting and Rescission of Prior SEC Staff Announcements and Observer Comments” provides guidance related to the effective dates of the ASUs noted above. We determine revenue recognition through the following steps: | l | identification of the contract, or contracts, with a customer; |
| l | identification of the performance obligations in the contract; |
| l | determination of the transaction price; |
| l | allocation of the transaction price to the performance obligations in the contract; and |
| l | recognition of revenue when, or as, we satisfy a performance obligation. |
SINO AGRO FOOD, INC. NOTES TO CONSOLIDATED FINANCIAL STATEMENTS | 2. | SUMMARY OF SIGNIFICANT ACCOUNTING POLICIES (CONTINUED) |
| 2.8 | REVENUE RECOGNITION (CONTINUED) |
Consulting and service income from development contracts The company recognizes consulting and service income from development contracts revenue over time, as performance obligations are satisfied, due to the continuous transfer of shipment when risk of loss and title passescontrol to the customer.Consulting and service income from development contractsare generally accounted for as a single unit of account (a single performance obligation) and are not segmented between types of services. The company recognizes revenue using the percentage-of-completion method, based primarily on contract cost incurred to date compared to total estimated contract cost. The percentage-of-completion method (an input method) is the most faithful depiction of the company’s performance because it directly measures the value of the services transferred to the customer. Cost of revenue includes an allocation of depreciation and amortization. Customer-furnished materials, labor and equipment and, in certain cases, subcontractor materials, labor and equipment, are included in revenue and cost of revenue when management believes that the company is acting as a principal rather than as an agent (i.e., the company integrates the materials, labor and equipment into the deliverables promised to the customer). Customer-furnished materials are only included in revenue and cost when the contract includes construction activity and the company has visibility into the amount the customer is paying for the materials or there is a reasonable basis for estimating the amount. The company recognizes revenue, but not profit, on certain uninstalled materials that are not specifically produced, fabricated, or constructed for a project. Revenue on these uninstalled materials is recognized when the cost is incurred (when control is transferred). Changes to total estimated contract cost or losses, if any, are recognized in the period in which they are determined as assessed at the contract level. Pre-contract costs are expensed as incurred unless they are expected to be recovered from the client. Project mobilization costs are generally charged to project costs as incurred when they are an integrated part of the performance obligation being transferred to the client. Customer payments on consulting and service income from development contracts are typically due within 360 days of billing, depending on the contract. License fee incomeVariable Consideration
The nature of the company’s contracts gives rise to several types of variable consideration, including claims and unpriced change orders; awards and incentive fees; and liquidated damages and penalties. The company recognizes revenue for variable consideration when it is probable that a significant reversal in the amount of cumulative revenue recognized will not occur. The company estimates the amount of revenue to be recognized on variable consideration using the accrualexpected value (i.e., the sum of a probability-weighted amount) or the most likely amount method, whichever is expected to better predict the amount. Factors considered in determining whether revenue associated with claims (including change orders in dispute and unapproved change orders in regard to both scope and price) should be recognized include the following: (a) the contract or other evidence provides a legal basis for the claim, (b) additional costs were caused by circumstances that were unforeseen at the contract date and not the result of deficiencies in accordancethe company’s performance, (c) claim-related costs are identifiable and considered reasonable in view of the work performed, and (d) evidence supporting the claim is objective and verifiable. If the requirements for recognizing revenue for claims or unapproved change orders are met, revenue is recorded only when the costs associated with the agreements.claims or unapproved change orders have been incurred. Back charges to suppliers or subcontractors are recognized as a reduction of cost when it is determined that recovery of such cost is probable and the amounts can be reliably estimated. Disputed back charges are recognized when the same requirements described above for claims accounting have been satisfied. The company generally provides limited warranties for work performed under its engineering and construction contracts. The warranty periods typically extend for a limited duration following substantial completion of the company’s work on a project. Historically, warranty claims have not resulted in material costs incurred. Revenue excludes sales and usage-based taxes where it has been determined that the Company is acting as a pass-through agent. Government grants are recognized when (i) the Company has substantially accomplished what must be done pursuant to the terms of the grant that are established by the local government; and (ii) the Company receives notification from the local government that the Company has satisfied all of the requirements to receive the government grants; and (iii) the amounts are received. Revenues from the Company's fishery development services contracts are performed under fixed-price contracts. Revenues under long-term contracts are accounted for under the percentage-of-completion method of accounting in accordance with the Financial Accounting Standards Board (“FASB”) Accounting Standards Codification (“ASC”) Topic 605,Revenue Recognition (“ASC 605”). Under the percentage-of-completion method, the Company estimates profit as the difference between total estimated revenue and total estimated cost of a contract and recognizes that profit over the contract term. The percentage of costs incurred determines the amount of revenue to be recognized. Payment terms are generally defined by the installation contract and as a result may not match the timing of the costs incurred by the Company and the related recognition of revenue. Such differences are recorded as either costs or estimated earnings in excess of billings on uncompleted contracts or billings in excess of costs and estimated earnings on uncompleted contracts. The Company determines a customer’s credit worthiness at the time an order is accepted. Sudden and unexpected changes in a customer’s financial condition could put recoverability at risk.
The percentage of completion method requires the ability to estimate several factors, including the ability of the customer to meet its obligations under the contract, including the payment of amounts when due. If the Company determines that collectability is not assured, the Company will defer revenue recognition and use methods of accounting for the contract such as the completed contract method until such time as the Company determines that collectability is reasonably assured or through the completion of the project.
For fixed-price contracts, the Company uses the ratio of costs incurred to date on the contract to management's estimate of the contract's total costs, to determine the percentage of completion on each contract. This method is used as management considers expended costs to be the best available measure of progression of these contracts. Contract costs include all direct material, subcontract and labor costs and those indirect costs related to contract performance, such as supplies, tool repairs and depreciation. The Company accounts for maintenance and repair services under the guidance of ASC 605 as the services provided relate to construction work. Contract costs incurred to date and expected total contract costs are continuously monitored during the term of the contract. Changes in job performance, job conditions, and estimated profitability arising from contract penalty, change orders and final contract settlements may result in revisions to the estimated profit ability during the contract. These changes, which include contracts with estimated costs in excess of estimated revenues, are recognized as contract costs in the period in which the revisions are determined. Profit incentives are included in revenues when their realization is reasonably assured. At the point the Company anticipates a loss on a contract, the Company estimates the ultimate loss through completion and recognizes that loss in the period in which the loss was identified.SINO AGRO FOOD, INC.
The Company’s fishery development consultancy services revenues are recognized when the relevant services are rendered to a buyer.
The Company does not provide warranties to customers on a basis customary to the industry, however, customers can claim warranty directly from product manufacturers for defects in equipment or products. Historically, the Company has experienced no warranty claimsNOTES TO CONSOLIDATED FINANCIAL STATEMENTS
| 2. | 2.9SUMMARY OF SIGNIFICANT ACCOUNTING POLICIES (CONTINUED) |
| 2.9 | COST OF GOODS SOLD AND COST OF SERVICES |
Cost of goods sold consists primarily of direct purchase cost of merchandise goods, and related levies. Cost of services consist primarily direct cost and indirect cost incurred to date for development contracts and provision for anticipated losses for development contracts. | 2.10 | SHIPPING AND HANDLING |
Shipping and handling costs related to cost of goods sold are included in general and administrative expenses, which totaled $84,298$0 and $58,096$786 for the yearsthree months ended DecemberMarch 31, 20122019 and 2011,2018, respectively. SINO AGRO FOOD, INC. AND SUBSIDIARIES
NOTES TO CONSOLIDATED FINANCIAL STATEMENTS
Advertising costs are included in general and administrative expenses, which totaled $1,973$377,946 and $99,526$400,754 for the yearsthree months ended DecemberMarch 31, 20122019 and 2011,2018, respectively. | 2.12 | RESEARCH AND DEVELOPMENT EXPENSES |
Research and development expenses are included in general and administrative expenses, which totaled $426,115, and $0 for the three months ended March 31, 2019 and 2018, respectively. | 2.13 | FOREIGN CURRENCY TRANSLATION AND OTHER COMPREHENSIVE INCOME |
The reporting currency of the Company is the U.S. dollar.dollars. The functional currency of the Company is the Chinese Renminbi (RMB). For those entities whose functional currency is other than the U.S. dollar,dollars, all assets and liabilities are translated into U.S. dollars at the exchange rate on the balance sheet date; shareholders’ equity is translated at historical rates and items in the statements of income and of cash flows are translated at the average rate for the period. Because cash flows are translated based on the average translation rate, amounts related to assets and liabilities reported in the statements of cash flows will not necessarily agree with changes in the corresponding balances in the balance sheets. Translation adjustments resulting from this process are included in accumulated other comprehensive income in the statements of shareholders’ equity. Transaction gains and losses that arise from exchange rate fluctuations on transactions denominated in a currency other than the functional currency are included in the statements of income and comprehensive income, as incurred. Accumulated other comprehensive income in the consolidated statement of shareholders’ equity amounted to $3,875,101$(5,316,005) as of March 31, 2019 and $(10,415,786) as of December 31, 2012 and $ 3,446,838 as of December 31, 2011.2018. The balance sheet amounts with the exception of equity as of DecemberMarch 31, 20122019 and December 31, 20112018 were translated using an exchange rate of RMB 6.296.73 to $1.00 and RMB 6.306.86 to $1.00, respectively. The average translation rates applied to the statements of income and other comprehensive income and of cash flows for the yearsthree months ended DecemberMarch 31, 20122019, and 20112018 were RMB 6.316.75 to $1.00 and RMB 6.336.36 to $1.00, respectively. | 2.132.14 | CASH AND CASH EQUIVALENTS |
The Company considers all highly liquid securities with original maturities of three months or less when acquired to be cash equivalents. Cash and cash equivalents kept with financial institutions in the PRCP.R.C. are not insured or otherwise protected. Should any of those institutions holding the Company’s cash become insolvent, or should the Company become unable to withdraw funds for any reason, the Company could lose the cash on deposit with that institution. | 2.142.15 | ACCOUNTS RECEIVABLE |
The Company maintains reserves for potential credit losses on accounts receivable. Management reviews the composition of accounts receivable and analyzes historical bad debts, customer concentrations, customer credit worthiness, current economic trends and changes in customer payment patterns to evaluate the adequacy of these reserves. Reserves are recorded primarily on a specific identification basis. The standard credit period for most of the Company’s clients is three months. The collection period over 1 year is classified as long-term accounts receivable. Management evaluates the collectability of the receivables at least quarterly. Provision for doubtful accounts as of March 31, 2019 and December 31, 2012 and 20112018 are $0. SINO AGRO FOOD, INC. NOTES TO CONSOLIDATED FINANCIAL STATEMENTS | 2. | SUMMARY OF SIGNIFICANT ACCOUNTING POLICIES (CONTINUED) |
Inventories are valued at the lower of cost (determined on a weighted average basis) and net realizable value. Costs incurred in bringing each product to its location and conditions are accounted for as follows: | (a) | raw materials –- purchase cost on a weighted average basis; |
| (b) | manufactured finished goods and work-in-progress –- cost of direct materials and labor and a proportion of manufacturing overhead based on normal operation capacity but excluding borrowing costs; and |
| (c) | retail and wholesale merchandise finished goods –- purchase cost on a weighted average basis. |
Net realizable value is the estimated selling price in the ordinary course of business, less estimated costs for completion and the estimated costs necessary to make the sale. | 2.162.17 | PROPERTYPLANT AND EQUIPMENT |
Property
Plant and equipment are stated at cost less accumulated depreciation and any accumulated impairment losses. Such costs include the cost of replacing parts that are eligible for capitalization when the cost of replacing the parts is incurred. Similarly, when each major inspection is performed, its cost is recognized in the carrying amount of the propertyplant and equipment as a replacement only if it is eligible for capitalization. The assets’ residual values, useful lives and depreciation methods are reviewed, and adjusted if appropriate, at each financial year end. SINO AGRO FOOD, INC. AND SUBSIDIARIES
NOTES TO CONSOLIDATED FINANCIAL STATEMENTS
Depreciation is calculated on a straight-line basis over the estimated useful lives of the assets. | Plant and machinery | | 5 - 10 years | | Structure and leasehold improvements | | 10 - 2030 years | | Mature seeds and herbage cultivation | | 20 years | | Furniture and equipment | | 2.5 - 10 years | | Motor vehicles | 5 -10 | 4 - 10 years |
An item of propertyplant and equipment is removed from the accounts upon disposal or when no future economic benefits are expected to arise from the continued use of the asset. Any gain or loss arising on disposal of the asset (calculated as the difference between the net disposal proceeds and the carrying amount of the item) is included in the consolidated statements of income in the period the item is disposed. Goodwill is an asset representing the fair economic benefits arising from other assets acquired in a business combination that are not individually identified or separately recognized. Goodwill is tested for impairment on an annual basis at the end of the Company’s fiscal year, or when impairment indicators arise. The Company uses a fair-value-based approach to test for impairment at the level of each reporting unit. The Company directly acquired MEIJI, which is the holding company of JHST that operates the Hu Plantation. As a result of this acquisition, the Company recorded goodwill in the amount of $724,940. This goodwill represents the fair value of the assets acquired in these acquisitions over the cost of the assets acquired. SINO AGRO FOOD, INC. NOTES TO CONSOLIDATED FINANCIAL STATEMENTS | 2. | SUMMARY OF SIGNIFICANT ACCOUNTING POLICIES (CONTINUED) |
| 2.19 | PROPRIETARY TECHNOLOGIES |
A master license of stock feed manufacturing technology was acquired and the costs of acquisition are capitalized as proprietary technologies when technological feasibility has been established. StockCost of acquisition of stock feed manufacturing technology master license is amortized using the straight-line method over its estimated life of 20 years. An aromatic cattle-feeding formula was acquired and the costs of acquisition are capitalized as proprietary technologies when technological feasibility has been established. Stock feed manufacturing technologyCost of acquisition on aromatic cattle-feeding formula is amortized using the straight-line method over its estimated life of 20 years. The cost of sleepy cods breeding technology license is capitalized as proprietary technologies when technological feasibility has been established. Cost of granting sleepy cods breeding technology license is amortized using the straight-line method over its estimated life of 25 years. Bacterial cellulose technology license and related trade mark are capitalized as proprietary technologies when technological feasibility has been established. Cost of license and related trade mark is amortized using the straight-line method over its estimated life of 20 years. The Company has determined that technological feasibility is established at the time a working model of products is completed. Proprietary technologies are intangible assets of finite lives. Management evaluates the recoverability of proprietary technologies on an annual basis at the end of the Company’s fiscal year, or when impairment indicators arise. As required by ASC Topic 350 “Intangible –- Goodwill and Other”, the Company uses a fair-value-based approach to test for impairment. | 2.192.20 | CONSTRUCTION IN PROGRESS |
Construction in progress represents direct costs of construction as well as acquisition and design fees incurred. Capitalization of these costs ceases and the construction in progress is transferred to property and equipment when substantially all the activities necessary to prepare the assets for their intended use are completed. No depreciation is provided until construction is completed and the asset is ready for its intended use. Land use rights represent acquisition of rights to agricultural land from farmers and are amortized on the straight-line basis over their respective lease periods. The lease period of agricultural land is in the range from 3010 to 60 years. Land use rights purchase prices were determined in accordance with the 2007 PRCP.R.C. Government’s minimum lease payments on agricultural land and mutually agreed to terms between the Company and the vendors. | 2.212.22 | EQUITY METHOD INVESTMENTS |
Investee entities, in which the company can exercise significant influence, but not control, are accounted for under the equity method of accounting. Under the equity method of accounting, the company’s share of the earnings or losses of these companies is included in net income. A loss in value of an investment that is other than a temporary decline is recognized as a charge to operations. Evidence of a loss in value might include, but would not necessarily be limited to absence of an ability to recover the carrying amount of the investment or inability of the investee to sustain an earnings capacity that would justify the carrying amount of the investment. | 2.23 | CORPORATE JOINT VENTURE |
A corporation formed, owned, and operated by two or more businesses as a separate and discrete business or project (venture) for their mutual benefit is considered to be a corporate joint venture. Investee entities, in which the Company can exercise significant influence, but not control, are accounted for under the equity method of accounting. Under the equity method of accounting, the Company’s share of the earnings or losses of these companies is included in net income. SINO AGRO FOOD, INC. AND SUBSIDIARIES
NOTES TO CONSOLIDATED FINANCIAL STATEMENTS
A loss in value of an investment that is other than a temporary decline is recognized as a charge to operations. Evidence of a loss in value might include, but would not necessarily be limited to, the absence of an ability to recover the carrying amount of the investment or inability of the investee to sustain an earnings capacity that would justify the carrying amount of the investment. SINO AGRO FOOD, INC. NOTES TO CONSOLIDATED FINANCIAL STATEMENTS | 2. | SUMMARY OF SIGNIFICANT ACCOUNTING POLICIES (CONTINUED) |
| 2.24 | VARIABLE INTEREST ENTITY |
A variable interest entity (“VIE”) is an entity (investee) in which the investor has obtained less than a majority interest, according to the Financial Accounting Standards Board (FASB). A VIE is subject to consolidation if a VIE meets one of the following three criteria as elaborated in ASC Topic 810-10, Consolidation: | (a) | equity-at-risk is not sufficient to support the entity'sentity’s activities; |
| (b) | as a group, the equity-at-risk holders cannot control the entity; or |
| (c) | the economics do not coincide with the voting interestinterest. |
If a firm is the primary beneficiary of a VIE, the holdings must be disclosed on the balance sheet. The primary beneficiary is defined as the person or company with the majority of variable interests. A corporation formed, owned, and operated by two or more businesses (ventures) as a separate and discrete business or project (venture) for their mutual benefit is defined as a joint venture. Treasury stock means shares of a corporation’s own stock that have been issued and subsequently reacquired by the corporation. Converting outstanding shares to treasury shares does not reduce the number of shares issued but does reduce the number of shares outstanding. These shares are not eligible to receive dividends. Accounting for excesses and deficiencies on treasury stock transactions is governed by ASC 505-30-30. State laws and federal agencies closely regulate transactions involving a company’s own capital stock, so the purchase of outstanding shares must have a legitimate purpose. Some of the most common reasons for purchasing outstanding shares are as follows: | (a) | to meet additional stock needs for various reasons, including newly implemented stock option plans, stock for convertible bonds or convertible preferred stock, or a stock dividend. |
| (b) | to make more shares available for acquisitions of other entities. |
The cost method of accounting for treasury shares has been adopted by the Company. The purchase of outstanding shares and thus converting them into treasury shares is treated as a temporary reduction in shareholders’ equity in view of the expectation to reissue the shares instead of retiring them. When the Company reissues the treasury shares, the temporary account is eliminated. The cost of acquiring outstanding shares for converting into treasury shares is charged to a contra account, in this case a contra equity account that reduces the stockholder equity balance. SINO AGRO FOOD, INC. NOTES TO CONSOLIDATED FINANCIAL STATEMENTS | 2. | SUMMARY OF SIGNIFICANT ACCOUNTING POLICIES (CONTINUED) |
The Company accounts for income taxes under the provisions of ASC Topic 740 “Accounting for Income Taxes.” Under ASC Topic 740, deferred tax assets and liabilities are determined based on the difference between the financial statement carrying amounts and the tax bases of assets and liabilities using enacted tax rates in effect in the years in which the differences are expected to reverse. The provision for income tax is based on the results for the year as adjusted for items, which are non-assessable or disallowed. It is calculated using tax rates that have been enacted or substantively enacted at the balance sheet date. Deferred tax is accounted for using the balance sheet liability method in respect of temporary differences arising from differences between the carrying amount of assets and liabilities in the financial statements and the corresponding tax basis used in the computation of assessable tax profit. In principle, deferred tax liabilities are recognized for all taxable temporary differences, and deferred tax assets are recognized to the extent that it is probable that taxable profit will be available against which deductible temporary differences can be utilized. Deferred income taxes are calculated at the tax rates that are expected to apply to the period when the asset is realized or the liability is settled. Deferred tax is charged or credited in the income statement, except when it related to items credited or charged directly to equity, in which case the deferred tax is also dealt with in equity. Deferred tax assets and liabilities are offset when they relate to income taxes levied by the same taxation authority and the Company intends to settle its current tax assets and liabilities on a net basis. SINO AGRO FOOD, INC. AND SUBSIDIARIES
NOTES TO CONSOLIDATED FINANCIAL STATEMENTS
ASC Topic 740 also prescribes a more-likely-than-not threshold for financial statement recognition and measurement of a tax position taken, or for one expected to be taken, in a tax return. ASC Topic 740 also provides guidance related to, among other things, classification, accounting for interest and penalties associated with tax positions, and disclosure requirements. Any interest and penalties accrued related to unrecognized tax benefits will be recorded as tax expense. | 2.252.29 | POLITICAL AND BUSINESS RISK |
The Company'sCompany’s operations are carried out in the PRC.P.R.C. Accordingly, the political, economic and legal environment in the PRCP.R.C. may influence the Company’s business, financial condition and results of operations by the general state of the PRC'sP.R.C.’s economy. The Company'sCompany’s operations in the PRCP.R.C. are subject to specific considerations and significant risks not typically associated with companies in North America and Western Europe. The Company'sCompany’s results may be adversely affected by changes in governmental policies with respect to laws and regulations, anti-inflationary measures, currency conversion and remittance abroad, and rates and methods of taxation, among other things. | 2.262.30 | CONCENTRATION OF CREDIT RISK |
Cash includes cash at banks and demand deposits in accounts maintained with banks within the PRC.P.R.C. Total cash in these banks as of March 31, 2019 and December 31, 2012 and 20112018 amounted to $8,403,458$164,333 and $1,379,837,$4,720,793, respectively, none of which is covered by insurance. The Company has not experienced any losses in such accounts and believes it is not exposed to any risks to its cash in bank accounts. The Company had 5 major customers (A, B, C, D and E) whose business individually represented the following percentages of the Company’s total revenue for the period indicated: | | | Three months ended
March 31, 2019 | | | Three months ended
March 31, 2018 | | | | | | | | | | | Customer A | | | 30.79 | % | | | 31.66 | % | | Customer B | | | 12.94 | % | | | 17.08 | % | | Customer C | | | 27.93 | % | | | 14.82 | % | | Customer D | | | 5.63 | % | | | 8.91 | % | | Customer E | | | 4.81 | % | | | - | % | | Customer F | | | - | % | | | 7.33 | % | | | | | 82.10 | % | | | 79.80 | % |
SINO AGRO FOOD, INC. NOTES TO CONSOLIDATED FINANCIAL STATEMENTS | 2. | SUMMARY OF SIGNIFICANT ACCOUNTING POLICIES (CONTINUED) |
| 2.30 | CONCENTRATION OF CREDIT RISK (CONTINUED) |
| | | | | Percentage
of revenue | | | Amount | | | Customer A | | Corporate and others Division | | | 30.79 | % | | $ | 9,010,021 | | | Customer B | | Corporate and others Division | | | 12.94 | % | | $ | 3,787,039 | | | Customer C | | Cattle Farm Development Division | | | 27.93 | % | | $ | 8,171,443 | |
Accounts receivable are derived from revenue earned from customers located primarily in the PRC.P.R.C. The Company performs ongoing credit evaluations of customers and has not experienced any material losses to date. The Company had 5 major customers (A, B, C, D & E) whose business individually represented the following percentages of the Company’s total revenue for the periods indicated: | | | 2012 | | | 2011 | | | | | | | | | | | Customer A | | | 32.44 | % | | | - | | | Customer B | | | 10.27 | % | | | - | | | Customer C | | | 9.69 | % | | | - | | | Customer D | | | 6.34 | % | | | - | | | Customer E | | | 6.01 | % | | | - | | | Customer F | | | | | | | 29.03 | % | | Customer G | | | - | | | | 13.96 | % | | Customer H | | | - | | | | 13.87 | % | | Customer I | | | - | | | | 8.24 | % | | Customer J | | | - | | | | 6.68 | % | | | | | 64.75 | % | | | 71.78 | % |
| | | Segment | | Amount | | | | | | | | | | Customer A | | Fishery Development Division | | $ | 44,966,265 | | | | | | | | | | | Customer B | | Fishery Development Division | | $ | 17,206,190 | |
The Company’s same 5 major customers (A, B, C, D & E) whose accounts receivable balance individually represented the following percentages of the Company’s total accounts receivable for the periods indicated:receivable:
| | | 2012 | | | 2011 | | | | | | | | | | | Customer A | | | 18.18 | % | | | 15.31 | % | | Customer B | | | 14.32 | % | | | - | | | Customer C | | | 11.14 | % | | | - | | | Customer D | | | 9.94 | % | | | - | | | Customer E | | | 8.23 | % | | | - | | | Customer F | | | | | | | 9.14 | % | | Customer G | | | - | | | | 8.60 | % | | Customer H | | | - | | | | 8.39 | % | | Customer I | | | - | | | | 8.22 | % | | | | | | | | | | | | | | | 61.81 | % | | | 49.66 | % |
SINO AGRO FOOD, INC. AND SUBSIDIARIES
NOTES TO CONSOLIDATED FINANCIAL STATEMENTS
| | | March 31, 2019 | | | December 31, 2018 | | | | | | | | | | | Customer A | | | 11.89 | % | | | 12.76 | % | | Customer B | | | 8.40 | % | | | 9.67 | % | | Customer C | | | 10.53 | % | | | 10.05 | % | | Customer D | | | 61.27 | % | | | 59.81 | % | | Customer E | | | - | % | | | 1.8 | % | | Customer F | | | 1.63 | % | | | - | % | | | | | 93.72 | % | | | 94.09 | % |
| 2.27 | IMPAIRMENT OF LONG-LIVED ASSETS AND INTANGIBLE ASSETS |
As of DecemberMarch 31, 2012,2019, amounts due from customers A, B,C and CD are $9,628,321, $7,584,293$11,997,693, $10,632,798 and $5,898,681respectively.$61,849,210, respectively. The Company has not experienced any significant difficulty in collecting its accounts receivable in the past and is not aware ofanyof any financial difficulties of its major customers. | 2.31 | IMPAIRMENT OF LONG-LIVED ASSETS AND INTANGIBLE ASSETS |
In accordance with ASC Topic 360, “Property, Plant and Equipment,” long-lived assets to be held and used are analyzed for impairment whenever events or changes in circumstances indicate that the related carrying amounts may not be recoverable. The Company reviews the carrying amount of its long-lived assets, including intangibles, for impairment, during each reporting period. An asset is considered impaired when estimated future cash flows are less than the carrying amount of the asset. In the event the carrying amount of such asset is considered not recoverable, the asset is adjusted to its fair value. Fair value is generally determined based on discounted future cash flow. As of March 31, 2019 and December 31, 2012 and 2011,2018, the Company determined no impairment chargeslosses were necessary. | 2.282.32 | EARNINGS PER SHARE |
As prescribed in ASC Topic 260 “”Earnings per Share,” Basic Earnings per Share (“EPS”) is computed by dividing net income available to common stockholders by the weighted average number of common stock shares outstanding during the year. Diluted EPS is computed by dividing net income available to common stockholders by the weighted-average number of common stock shares outstanding during the year plus potential dilutive instruments such as stock options and warrants. The effect of stock options on diluted EPS is determined through the application of the treasury stock method, whereby proceeds received by the Company based on assumed exercises are hypothetically used to repurchase the Company’s common stock at the average market price during the period. ASC 260-10-55 requires that stock dividends or stock splits be accounted for retroactively if the stock dividends or stock splits occur during the year, or retroactively if the stock dividends or stock splits occur after the end of the period but before the release of the financial statements, by considering it outstanding of the entirety of each period presented. Dilution is computed by applying the treasury stock method. Under this method, options and warrants are assumed to be exercised at the beginning of the period (or at the time of issuance, if later), and as if funds obtained thereby were used to purchase common stock at the average market price during the year. For the yearsthree months ended DecemberMarch 31, 20122019 and 2011,2018, basic earnings per share from continuing and discontinued operations attributable to Sino Agro Food, Inc. and subsidiaries common stockholders amountamounted to $0.70$0.01 and $0.43,$0.17, respectively. For the yearsthree months ended DecemberMarch 31, 20122019 and 2011,2018, diluted earnings per share from continuing and discontinued operations attributable to Sino Agro Food, Inc. and its subsidiaries’ common stockholders amounted to $0.63$0.01 and $0.39,$0.17, respectively. For the years ended December 31, 2012 and 2011, basic earnings per share from continuing operations attributable to Sino Agro Food, Inc. and subsidiaries common stockholders amount to $0.70 and $0.26, respectively. For the years ended December 31, 2012 and 2011, diluted earnings per share from continuing operations attributable to Sino Agro Food, Inc. and its subsidiaries’ common stockholders amounted to $0.63 and $0.23, respectively.
SINO AGRO FOOD, INC. NOTES TO CONSOLIDATED FINANCIAL STATEMENTS | 2. | 2.29SUMMARY OF SIGNIFICANT ACCOUNTING POLICIES (CONTINUED) |
| 2.33 | ACCUMULATED OTHER COMPREHENSIVE INCOME |
ASC Topic 220 “Comprehensive Income” establishes standards for reporting and displaying comprehensive income and its components in financial statements. Comprehensive income is defined as the change in stockholders’ equity of a business enterprise during a period from transactions and other events and circumstances from non-owner sources. The comprehensive income for all periods presented includes both the reported net income and net change in cumulative translation adjustments. | 2.302.34 | RETIREMENT BENEFIT COSTS |
PRC
P.R.C. state managed retirement benefit programs are defined contribution plans and the payments to the plans are charged as expenses when employees have rendered service entitling them to the contribution made by the employer. | 2.312.35 | STOCK-BASED COMPENSATION |
The Company has adopted both ASC Topic 718, “Compensation - Stock Compensation” and ASC Topic 505-50, “Equity-Based Payments to Non-Non - Employees” using the fair value method in which an entity issues its equity instruments to acquire goods and services from employees and non-employees. Stock compensation for stock granted to non-employees has been determined in accordance with this accounting standard and the accounting standard regarding accounting for equity instruments that are issued to other than employees for acquiring, or in conjunction with selling goods or services, as the fair value of the consideration received or the fair value of equity instruments issued, whichever is more reliably measured. This accounting standard allows the “simplified” method to determine the term of employee options when other information is not available. Under ASC Topic 718 and ASC Topic 505-50, stock compensation expenses is measured at the grant date on the value of the option or restricted stock and is recognized as expenses, less expected forfeitures, over the requisite service period, which is generally the vesting period. SINO AGRO FOOD, INC. AND SUBSIDIARIES
NOTES TO CONSOLIDATED FINANCIAL STATEMENTS
| 2.322.36 | FAIR VALUE OF FINANCIAL INSTRUMENTS |
The Company follows paragraph 825-10-50-10 of the FASB Accounting Standards Codification for disclosures about fair value of its financial instruments and paragraph 820-10-35-37 of the FASB Accounting Standards Codification (“Paragraph 820-10-35-37”) to measure the fair value of its financial instruments. Paragraph 820-10-35-37 establishes a framework for measuring fair value under U.S. GAAP, and expands disclosures about fair value measurements. To increase consistency and comparability in fair value measurements and related disclosures, Paragraph 820-10-35-37 establishes a fair value hierarchy, which prioritizes the inputs to valuation techniques used to measure fair value into three (3) broad levels. The fair value hierarchy gives the highest priority to quoted prices (unadjusted) in active markets for identical assets or liabilities and the lowest priority to unobservable inputs. The three (3) levels of fair value hierarchy defined by Paragraph 820-10-35-37 are described below: | | Level 1 | Quoted market prices available in active markets for identical assets or liabilities as of the reporting date. |
| | Level 2 | Pricing inputs other than quoted prices in active markets included in Level 1, which are either directly or indirectly observable as of the reporting date. |
| | Level 3 | Pricing inputs that are generally observable inputs and not corroborated by market data. |
The carrying amounts of the Company’s financial assets and liabilities, such as cash and accrued expenses, approximate their fair values because of the short maturity of these instruments. The Company does not have any assets or liabilities measured at fair value on a recurring or a non-recurring basis, consequently, the Company did not have any fair value adjustments for assets and liabilities measured at fair value at Decemberas of March 31, 20122019 or December 31, 2011,2018, nor gains or losses are reported in the statements of income and comprehensive income that are attributable to the change in unrealized gains or losses relating to those assets and liabilities still held at the reporting date for the fiscal yearperiod ended DecemberMarch 31, 20122019 or December 31, 2011. 2018. SINO AGRO FOOD, INC. NOTES TO CONSOLIDATED FINANCIAL STATEMENTS | 2. | 2.33SUMMARY OF SIGNIFICANT ACCOUNTING POLICIES (CONTINUED) |
| 2.37 | NEW ACCOUNTING PRONOUNCEMENTS |
In August 2018, the FASB issued Accounting Standards Update (“ASU”) No. 2018-13,Fair Value Measurement (ASC Topic 820): Disclosure Framework – Changes to the Disclosure Requirements for Fair Value Measurement. This ASU eliminates, modifies and adds disclosure requirements for fair value measurements. The amendments in this ASU are effective for fiscal years, and for interim periods within those fiscal years, beginning after December 15, 2019, with early adoption permitted. The Company is currently evaluating the effects of this ASU on its financial statements and related disclosures and does not expect any recent accounting pronouncementsthere to havebe a material effect on the Company’s financial position, results of operations, or cash flows.impact. In May 2011,June 2016, the FASB issued amendmentsASU No. 2016-13, Financial Instruments – Credit Losses (ASC Topic 326): Measurement of Credit Losses on Financial Instruments. This guidance will require Companies to authoritative guidance relatedrecognize an allowance for credit losses on available-for-sale debt securities rather than the current approach of recording a reduction to fairthe carrying value measurement and disclosure requirements. The new guidance changes some fair value measurement principles and enhances disclosure requirements related to activities in Level 3 of the fair value hierarchy.asset. The amendments areASU is effective for fiscal years beginning after December 15, 2019 and interim andperiods therein. Early adoption is permitted for annual periods beginning after December 15, 2011. The adoption of this guidance did not have a material effect on our consolidated financial statements. In June 2011, the FASB issued authoritative guidance on the presentation of comprehensive income. This guidance specifies that an entity has the option to present the total of comprehensive income, the components of net income, and the components of other comprehensive income either in a single continuous statement of comprehensive income or in two separate but consecutive statements. In both choices, an entity is required to present each component of net income along with total net income, each component of other comprehensive income along with a total for other comprehensive income, and a total amount for comprehensive income. This guidance does not change the items that must be reported in other comprehensive income or when an item of other comprehensive income must be reclassified to net income. It also does not change the presentation of related tax effects, before related tax effects, or the portrayal or calculation of earnings per share. This guidance is to be applied retrospectively and is effective for fiscal years,2018 and interim periods within those years, beginning after December 15, 2011.therein. The adoptionCompany is currently evaluating the effects of this guidance did not have a material effectASU on our consolidatedits financial statements as it amended only the presentation of comprehensive income.
In July 2012, the FASB issued Accounting Standards Update ASU 2012-02, the amendments to ASC 350, Intangibles—Goodwill and Other: Testing Indefinite-Lived Intangible Assets for Impairment (“ASU 2012-02”). The amendments apply to all entities, both publicrelated disclosures and nonpublic, that have indefinite-lived intangible assets, other than goodwill, reported in their financial statements. In accordance with the amendments an entity has the option first to assess qualitative factors to determine whether the existence of events and circumstances indicates that it is more likely than not that the indefinite-lived intangible asset is impaired. If, after assessing the totality of events and circumstances, an entity concludes that it is not more likely than not that the indefinite-lived intangible asset is impaired, then the entity is not required to take further action. However, if an entity concludes otherwise, then it is required to determine the fair value of the indefinite-lived intangible asset and perform the quantitative impairment test by comparing the fair value with the carrying amount in accordance with Subtopic 350-30. An entity also has the option to bypass the qualitative assessment for any indefinite-lived intangible asset in any period and proceed directly to performing the quantitative impairment test. An entity will be able to resume performing the qualitative assessment in any subsequent period. The amendments are effective for annual and interim impairment tests performed for fiscal years beginning after September 15, 2012, and early adoption is permitted. The Company will apply these amendments for reporting periods beginning after December 31, 2012. The Company does not expect the adoption of the amendmentsthere to havebe a material impact on the consolidated financial statements.impact.
SINO AGRO FOOD, INC. AND SUBSIDIARIES NOTES TO CONSOLIDATED FINANCIAL STATEMENTS The Company establishes standards for reporting information about operating segments on a basis consistent with the Company’s internal organization structure as well as business segments and major customers in consolidated financial statements. The Company operatedoperates in fourfive principal reportable segments: Fishery Development Division, and HU Plantation Division, and Organic Fertilizer and Bread Grass Division, Cattle Farm Development Division and discontinued Dairy Production Division since January 1, 2011Corporate and added a new segment in that it refers to as “Corporate and others” in January 2012.Others Division. No geographic information is required as all revenue and assets are located in PRC.the P.R.C. | | | 2012 | | Discontinued | | | | | | | | Continuing operations | | operations | | | | | | | | | | | | Organic | | | | | | | | | | | Three months ended March 31, 2019 | | | | | Fishery | | | | Fertilizer and | | Cattle Farm | | Corporate | | Dairy | | | | | Fishery | | | | | | Organic Fertilizer | | Cattle Farm | | | | | | | | | | Development | | HU Plantation | | Bread Grass | | Development | | and | | Production | | | | | Development | | HU Plantation | | and Bread Grass | | Development | | Corporate and | | | | | | | | Division (1) | | Division (2) | | Division (3) | | Division (4) | | others (5) | | Division (6) | | Total | | | Division(1) | | Division (2) | | Division (3) | | Division (4) | | others (5) | | Total | | | | | | | | | | | | | | | | | | | | | | | | | | | | | | | | | Revenue | | $ | 86,346,475 | | | $ | 11,878,599 | | | $ | 23,350,564 | | | $ | 17,038,001 | | | $ | - | | | $ | - | | | $ | 138,613,639 | | | $ | 991,002 | | | $ | 906,803 | | | $ | 6,403,084 | | | $ | 8,160,703 | | | $ | 12,797,059 | | | $ | 29,258,651 | | | | | | | | | | | | | | | | | | | | | | | | | | | | | | | | | | | | | | | | | | | | | | | | | | | | | | | | | Net income (loss) | | $ | 39,150,568 | | | $ | 6,245,281 | | | $ | 3,875,609 | | | $ | 9,058,822 | | | $ | (784,448 | ) | | $ | - | | | $ | 57,545,832 | | | $ | (75,822 | ) | | $ | (821,204 | ) | | $ | 470,344 | | | $ | 980,976 | | | $ | 58,380 | | | $ | 612,674 | | | | | | | | | | | | | | | | | | | | | | | | | | | | | | | | | | | | | | | | | | | | | | | | | | | | | | | | | Total assets | | $ | 79,222,788 | | | $ | 36,792,718 | | | $ | 96,282,055 | | | $ | 28,265,035 | | | $ | 2,536,382 | | | $ | - | | | $ | 243,098,978 | | | $ | 90,004,486 | | | $ | 43,221,005 | | | $ | 332,091,472 | | | $ | 43,664,450 | | | $ | 290,109,731 | | | $ | 799,091,144 | |
| | | | Three months ended March 31, 2018 | | | | | 2011 | | Discontinued | | | | | Fishery | | | | | | Organic Fertilizer | | Cattle Farm | | | | | | | | | | Continuing operations | | operations | | | | | Development | | HU Plantation | | and Bread Grass | | Development | | Corporate and | | | | | | | | Fishery
Development
Division (1) | | HU Plantation
Division (2) | | Organic
Fertilizer and
Bread Grass
Division (3) | | Cattle Farm
Development
Division (4) | | Corporate and
others (5) | | Dairy
Production
Division (6) | | Total | | | Division(1) | | Division (2) | | Division (3) | | Division (4) | | others (5) | | Total | | | | | | | | | | | | | | | | | | | | | | | | | | | | | | | | | Revenue | | $ | 26,422,125 | | | $ | 6,113,155 | | | $ | 15,184,702 | | | $ | 4,159,921 | | | $ | - | | | $ | - | | | $ | 51,879,903 | | | $ | 2,472,404 | | | $ | 1,050,228 | | | $ | 8,770,592 | | | $ | 4,998,083 | | | $ | 16,439,957 | | | $ | 33,731,264 | | | | | | | | | | | | | | | | | | | | | | | | | | | | | | | | | | | | | | | | | | | | | | | | | | | | | | | | | Net income (loss) | | $ | 10,876,752 | | | | 2,950,339 | | | $ | 3,262,178 | | | $ | 1,466,290 | | | $ | (2,864,527 | ) | | $ | 10,203,951 | | | $ | 25,894,983 | | | $ | 560,943 | | | $ | (340,166 | ) | | $ | 1,344,459 | | | $ | 350,674 | | | $ | 3,812,517 | | | $ | 5,728,427 | | | | | | | | | | | | | | | | | | | | | | | | | | | | | | | | | | | | | | | | | | | | | | | | | | | | | | | | | Total assets | | $ | 37,030,261 | | | $ | 27,672,083 | | | $ | 54,353,901 | | | $ | 7,152,129 | | | $ | 25,632,504 | | | $ | - | | | $ | 151,840,878 | | | $ | 81,042,358 | | | $ | 49,552,231 | | | $ | 357,336,786 | | | $ | 34,311,911 | | | $ | 286,272,364 | | | $ | 808,515,650 | |
Notes
SINO AGRO FOOD, INC. NOTES TO CONSOLIDATED FINANCIAL STATEMENTS | 3. | SEGMENT INFORMATION (CONTINUED) |
| (1) | Operated byCapital Award, Inc. andJiangmen City A Power Fishery Development Co. Ltd.(“CA”). |
| (2) | Operated by JiangmenJiang Men City Heng Sheng Tai Agriculture Development Co. Ltd., Limited (“JHST”). |
| (3) | Operated by Qinghai Sanjiang A Power Agriculture Co. Ltd,, Limited (“SJAP”), A Power Agro Agriculture Development (Macau) Limited (“APWAM”), and Hunan Shenghua A Power Agriculture Co., Limited.Limited (“HSA”). |
| (4) | Operated by JiangmenJiang Men City Hang Mei Cattle Farm Development Co. LtdLimited (“JHMC”) and Macau Meiji Limited.Eiji Company Limited (“MEIJI”). |
| (5) | Operated by Sino Agro Food, Inc. |
| (6) | Operated by Hang Yu Tai Investment Ltd (“SIAF”) and ZhongSingNongMu Ltd (Discontinued operation)Sino Agro Food Sweden AB (“SAFS”). |
SINO AGRO FOOD, INC. NOTES TO CONSOLIDATED FINANCIAL STATEMENTS | 4.3. | INCOME TAXESSEGMENT INFORMATION (CONTINUED) |
Further analysis of revenue:- | | | Three ended March 31, 2019 | | | | | | | | | | | Organic | | | | | | | | | | | | | | Fishery | | | | | | Fertilizer and | | | Cattle Farm | | | | | | | | | | Development | | | HU Plantation | | | Bread Grass | | | Development | | | Corporate and | | | | | | | Division (1) | | | Division (2) | | | Division (3) | | | Division (4) | | | others (6) | | | Total | | | Name of entity | | | | | | | | | | | | | | | | | | | | Sale of goods | | | | | | | | | | | | | | | | | | | | | | | | | | | | | | | | | | | | | | | | Jiang Men City Heng Sheng Tai Agriculture Development Co., Limited (“JHST”) | | $ | - | | | $ | 906,803 | | | $ | - | | | $ | - | | | $ | - | | | $ | 906,803 | | | | | | | | | | | | | | | | | | | | | | | | | | | | | Hunan Shenghua A Power Agriculture Co., Limited (“HSA”) | | | - | | | | - | | | | 2,527,273 | | | | - | | | | - | | | | 2,527,273 | | | | | | | | | | | | | | | | | | | | | | | | | | | | | Qinghai Sanjiang A Power Agriculture Co., Limited (“SJAP”) | | | - | | | | - | | | | 3,875,811 | | | | - | | | | - | | | | 3,875,811 | | | | | | | | | | | | | | | | | | | | | | | | | | | | | Macau Eiji Company Limited (“MEIJI”) | | | - | | | | - | | | | - | | | | 8,160,703 | | | | - | | | | 8,160,703 | | | | | | | | | | | | | | | | | | | | | | | | | | | | | Sino Agro Food, Inc. (“SIAF”) | | | - | | | | - | | | | - | | | | - | | | | 12,797,059 | | | | 12,797,059 | | | | | | | | | | | | | | | | | | | | | | | | | | | | | Consulting and service income for development contracts Capital Award, Inc. (“CA”) | | | 991,002 | | | | - | | | | - | | | | - | | | | - | | | | 991,002 | | | | | $ | 991,002 | | | $ | 906,803 | | | $ | 6,403,084 | | | $ | 8,160,703 | | | $ | 12,797,059 | | | $ | 29,258,651 | |
SINO AGRO FOOD, INC. NOTES TO CONSOLIDATED FINANCIAL STATEMENTS | 3. | SEGMENT INFORMATION (CONTINUED) |
Further analysis of revenue:- | | | Three months ended March 31, 2018 | | | | | | | | | | | Organic | | | | | | | | | | | | | | Fishery | | | | | | Fertilizer and | | | Cattle Farm | | | | | | | | | | | Development | | | HU Plantation | | | Bread Grass | | | Development | | | Corporate and | | | | | | | | Division (1) | | | Division (2) | | | Division (3) | | | Division (4) | | | others (6) | | | Total | | | Name of entity | | | | | | | | | | | | | | | | | | | | Sale of goods | | | | | | | | | | | | | | | | | | | | | | | | | | | | | | | | | | | | | | | | Jiang Men City Heng Sheng Tai Agriculture Development Co., Limited (“JHST”) | | $ | - | | | $ | 1,050,228 | | | $ | - | | | $ | - | | | $ | - | | | $ | 1,050,228 | | | | | | | | | | | | | | | | | | | | | | | | | | | | | Hunan Shenghua A Power Agriculture Co., Limited (“HSA”) | | | - | | | | - | | | | 6,405,025 | | | | - | | | | - | | | | 6,405,025 | | | | | | | | | | | | | | | | | | | | | | | | | | | | | Qinghai Sanjiang A Power Agriculture Co., Limited (“SJAP”) | | | - | | | | - | | | | 2,365,567 | | | | - | | | | - | | | | 2,365,567 | | | | | | | | | | | | | | | | | | | | | | | | | | | | | Qinghai Zhong He Meat Products Co., Limited (“QZH”) | | | - | | | | - | | | | - | | | | - | | | | - | | | | - | | | | | | | | | | | | | | | | | | | | | | | | | | | | | Macau Eiji Company Limited (“MEIJI”) | | | - | | | | - | | | | - | | | | 4,998,083 | | | | - | | | | 4,998,083 | | | | | | | | | | | | | | | | | | | | | | | | | | | | | Sino Agro Food, Inc. (“SIAF”) | | | - | | | | - | | | | - | | | | - | | | | 16,439,957 | | | | 16,439,957 | | | | | | | | | | | | | | | | | | | | | | | | | | | | | Consulting and service income for development contracts Capital Award, Inc. (“CA”) | | | 2,472,404 | | | | - | | | | - | | | | - | | | | - | | | | 2,472,404 | | | | | $ | 2,472,404 | | | $ | 1,050,228 | | | $ | 8,770,592 | | | $ | 4,998,083 | | | $ | 16,439,957 | | | $ | 33,731,264 | |
SINO AGRO FOOD, INC. NOTES TO CONSOLIDATED FINANCIAL STATEMENTS | 3. | SEGMENT INFORMATION (CONTINUED) |
Further analysis of cost of goods sold and cost of services:- COST OF GOODS SOLD | | | Three months ended March 31, 2019 | | | | | | | | | | | Organic | | | | | | | | | | | | | | Fishery | | | HU | | | Fertilizer and | | | Cattle Farm | | | Corporate | | | | | | | | Development | | | Plantation | | | Bread Grass | | | Development | | | and others | | | | | | | | Division (1) | | | Division (2) | | | Division (3) | | | Division (4) | | | (5) | | | Total | | | | | | | | | | | | | | | | | | | | | | | Name of entity | | | | | | | | | | | | | | | | | | | | Sale of goods | | | | | | | | | | | | | | | | | | | | | | | | | | | | | | | | | | | | | | | | Jiang Men City Heng Sheng Tai Agriculture Development Co., Limited (“JHST”) | | $ | - | | | $ | 712,968 | | | $ | - | | | $ | - | | | $ | - | | | $ | 712,968 | | | | | | | | | | | | | | | | | | | | | | | | | | | | | Hunan Shenghua A Power Agriculture Co., Limited (“HSA”) | | | - | | | | - | | | | 1,629,216 | | | | - | | | | - | | | | 1,629,216 | | | | | | | | | | | | | | | | | | | | | | | | | | | | | Qinghai Sanjiang A Power Agriculture Co., Limited (“SJAP”) | | | - | | | | - | | | | 2,772,354 | | | | - | | | | - | | | | 2,772,354 | | | | | | | | | | | | | | | | | | | | | | | | | | | | | Macau Eiji Company Limited (“MEIJI”) | | | - | | | | - | | | | - | | | | 6,820,510 | | | | - | | | | 6,820,510 | | | | | | | | | | | | | | | | | | | | | | | | | | | | | Sino Agro Food, Inc. (“SIAF”) | | | - | | | | - | | | | - | | | | - | | | | 11,375,164 | | | | 11,375,164 | | | | | $ | - | | | $ | 712,968 | | | $ | 4,401,570 | | | $ | 6,820,510 | | | $ | 11,375,164 | | | $ | 23,310,212 | |
COST OF SERVICES | | | Three months ended March 31, 2019 | | | | | | | | | | | Organic | | | | | | | | | | | | | | Fishery | | | | | | Fertilizer and | | | Cattle Farm | | | Corporate | | | | | | | | Development | | | HU Plantation | | | Bread Grass | | | Development | | | and others | | | | | | | | Division (1) | | | Division (2) | | | Division (3) | | | Division (4) | | | (5) | | | Total | | | | | | | | | | | | | | | | | | | | | | | Name of entity | | | | | | | | | | | | | | | | | | | | | | | | | | | | | | | | | | | | | | | | | | | | | | | | | | | | Consulting and service income for development contracts Capital Award, Inc. (“CA”) | | $ | 939,684 | | | $ | - | | | $ | - | | | $ | - | | | $ | - | | | $ | 939,684 | |
SINO AGRO FOOD, INC. NOTES TO CONSOLIDATED FINANCIAL STATEMENTS | 3. | SEGMENT INFORMATION (CONTINUED) |
Further analysis of cost of goods sold and cost of services (Continued):- COST OF GOODS SOLD | | | Three months ended March 31, 2018 | | | | | Fishery
Development
Division (1) | | | HU
Plantation
Division (2) | | | Organic
Fertilizer and
Bread Grass
Division (3) | | | Cattle Farm
Development
Division (4) | | | Corporate
and others
(5) | | | Total | | | Name of entity | | | | | | | | | | | | | | | | | | | | Sale of goods | | | | | | | | | | | | | | | | | | | | | | | | | | | | | | | | | | | | | | | | Jiang Men City Heng Sheng Tai Agriculture Development Co., Limited (“JHST”) | | $ | - | | | $ | 894,722 | | | $ | - | | | $ | - | | | $ | - | | | $ | 894,722 | | | | | | | | | | | | | | | | | | | | | | | | | | | | | Hunan Shenghua A Power Agriculture Co., Limited (“HSA “) | | | - | | | | - | | | | 1,613,685 | | | | - | | | | - | | | | 1,613,685 | | | | | | | | | | | | | | | | | | | | | | | | | | | | | Qinghai Sanjiang A Power Agriculture Co., Limited (“SJAP “) | | | - | | | | - | | | | 4,136,324 | | | | - | | | | - | | | | 4,136,324 | | | | | | | | | | | | | | | | | | | | | | | | | | | | | Qinghai Zhong He Meat Products Co., Limited (“QZH “) | | | - | | | | - | | | | - | | | | - | | | | - | | | | - | | | | | | | | | | | | | | | | | | | | | | | | | | | | | Macau Eiji Company Limited (“MEIJI”) | | | - | | | | - | | | | - | | | | 4,528,498 | | | | - | | | | 4,528,498 | | | | | | | | | | | | | | | | | | | | | | | | | | | | | Sino Agro Food, Inc. (“SIAF”) | | | - | | | | - | | | | - | | | | - | | | | 14,689,791 | | | | 14,689,791 | | | | | $ | - | | | $ | 894,722 | | | $ | 5,750,009 | | | $ | 4,528,498 | | | $ | 14,689,791 | | | $ | 25,863,020 | |
COST OF SERVICES | | | Three months ended March 31, 2018 | | | | | Fishery
Development
Division (1) | | | HU
Plantation
Division (2) | | | Organic
Fertilizer and
Bread Grass
Division (3) | | | Cattle Farm
Development
Division (4) | | | Corporate
and others
(5) | | | Total | | | | | | | | | | | | | | | | | | | | | | | Name of entity | | | | | | | | | | | | | | | | | | | | | | | | | | | | | | | | | | | | | | | | | | | | | | | | | | | | Consulting and service income for development contracts Capital Award, Inc. (“CA”) | | $ | 1,784,322 | | | $ | - | | | $ | - | | | $ | - | | | $ | - | | | $ | 1,784,322 | |
SINO AGRO FOOD, INC. NOTES TO CONSOLIDATED FINANCIAL STATEMENTS United States of America The Company was incorporated in the State of Nevada, in the United States of America. The Company has no trading operations in United States of America and no USU.S. corporate tax has been provided for in the consolidated financial statements of the Company. SINO AGRO FOOD, INC. AND SUBSIDIARIES
NOTES TO CONSOLIDATED FINANCIAL STATEMENTS However, see the discussion, below, under “Undistributed Earnings of Foreign Subsidiaries”.
Undistributed Earnings of Foreign Subsidiaries The Company intends to use the remaining accumulated and future earnings of foreign subsidiaries to expand operations outside the United States, but some of these profits may have to be used to satisfy U.S. income tax liabilities based on the operations of its controlled foreign subsidiaries. Prior to 2017, depending on how and accordingly, undistributedwhere their controlled foreign corporations were operated, U.S. companies did not always have to pay tax on the earnings of their controlled foreign subsidiaries are consideredcorporations, and the Company believes that prior to be indefinitely reinvested outside2017 the earnings of its controlled foreign corporations were not taxable in the United States anduntil distributed to the Company. Accordingly, the Company made no provision for U.S. Federal and State income tax. The Company filed yearly U.S. federal income tax or applicable dividend distributionreturns from 2007 to 2017 on which it has reported that there was no no tax has been provided thereon.due to the United States. However, the Tax Cuts and Jobs Act of 2017 (the “2017 Act”) now requires some U.S. companies (starting in 2018) to pay tax on the earnings of their controlled foreign corporations based on complex formulas. The Company has not yet analyzed the impact of these changes on the taxability in the United States of the earnings of its foreign subsidiaries and so does not know whether it has for 2018, or will have for 2019 and future years, any earnings subject to U.S. federal income tax. In addition, the 2017 Act required U.S. companies to repatriate, as of the end of 2017, their accumulated earnings to date. The Company has not yet determined whether it incurred a U.S. tax liability as of the end of 2017 under this repatriation provision of the 2017 Act. The Company is seeking professional advice from U.S. tax accountants as to the impact on the Company of the 2017 Act for 2017 and later years. In fiscal year 2017 the Company had an operating loss of $30,102,943 based on the consolidated financials of its controlled foreign corporations, but it has had operating profits in previous years. SINO AGRO FOOD, INC. NOTES TO CONSOLIDATED FINANCIAL STATEMENTS | 4. | INCOME TAXES (CONTINUED) |
China Beginning January 1, 2008, the new Enterprise Income Tax (“EIT”) law replaced the existing laws for Domestic Enterprises (“DE’s”) and Foreign Invested Enterprises (“FIE’s”). The new standard EIT rate of 25% replaced the 33% rate currently applicable to both DE’s and FIE’s. The Company is currently evaluating the impact that the new EIT will have on its financial condition. Beginning January 1, 2008, China unified the corporate income tax rule on foreign invested enterprises and domestic enterprises. The unified corporate income tax rate is 25%. Under new tax legislation in China beginning in January 2008, the agriculture, dairy and fishery sectors are exempt from enterprise income taxes. No EIT has been provided in the financial statements of SIAF, CA, ZX, JHST, JHMC, JFD, HSA and SJAP since they are exempt from EIT for the yearsthree months ended DecemberMarch 31, 20122019 and 20112018 as they are within the agriculture, dairy and fisherycattle sectors. However, as of December 31, 2012, Taxation Department agreed that HSA is exempt from EIT for the years ended December 31, 2012 and 2011. No EIT has been provided in the financial statements of HSA for the income earned for the years December 31, 2012 as they are within the agriculture, dairy and fishery sectors. EIT has been provided in the financial statements of HSA at 25% for the income for the years ended December 31, 2011 as part of its revenue was generated from other source of supply other than SJAP that was not exempted from EIT.
However, as of December 31, 2012, Taxation Department agreed that JFD is exempt from EIT for the years ended December 31, 2012 and 2011. No EIT has been provided in the financial statements of JFD for the income earned for the years December 31, 2012 as they are within the agriculture, dairy and fishery sectors. JFD had been levied with an EIT of 25% in 2011, but JFD’s appeal to the Taxation Department for a waiver of this tax was successful by December 31, 2012.
Belize and Malaysia CA, CS and CH are international business companies incorporated in Belize, and are exempt from corporate tax in Belize. All sales invoices of CA were issued by its representative office in Malaysia and its trading and service activities are conducted in China. As the Malaysia tax law is imposed on a territorial basis and not on a worldwide basis, CA’s income is not subject to Malaysian corporate tax.Macau
As a result, neither Belize nor Malaysia corporate tax is provided for in the consolidated financial statements of CA for the years ended December 31, 2012 and 2011.
Hong Kong
No Hong Kong profitsMacau Corporate income tax has been provided in the consolidated financial statements of PMH and TRW, since these entities did not earn any assessable profits for the years ended December 31, 2012 and 2011. Macau
No Macau Corporation tax has been provided in the consolidated financial statements of HYT, APWAM and MEIJI since these entities did not earn any assessable profits for the Decemberthree months ended March 31, 20122019 and 2011.2018.
Provision
Sweden No Sweden Corporate income tax has been provided in the consolidated financial statements of SAFS since SAFS incurred a tax loss for income taxes is as follows:the three months ended March 31, 2019 and 2018. No deferred tax assets and liabilities are of June 30, 2013March 31, 2019 and December 31, 20122018 since there was no difference between the financial statements carrying amounts and the tax bases of assets and liabilities using enacted tax rates in effect in the period in which the differences are expected to reverse. SINO AGRO FOOD, INC. AND SUBSIDIARIES
NOTES TO CONSOLIDATED FINANCIAL STATEMENTS
| | | 2012 | | | 2011 | | | | | | | | | | | SIAF | | $ | - | | | $ | - | | | CA, CS and CH | | | - | | | | - | | | TRW | | | - | | | | - | | | MEIJI and APWAM | | | - | | | | - | | | JHST, JFD, JHMC and SJAP | | | - | | | | - | | | HSA | | | - | | | | 31 | | | | | $ | - | | | $ | 31 | |
| 5. | NET INCOME FROM DISCONTINUED OPERATIONS |
On February 15, 2011 and on March 29, 2011, the Company entered into an agreement and memorandum of understanding, respectively, to sell 100% equity interest in HYT group (including HYT and ZX) to Mr. Xin Ming Sun, a director of ZhongXingNong Nu Co., LtdProvision for $45,000,000, with an effective date of January 1, 2011.HYT group contributed revenue and net income for the Dairy Production Division. Prior to sale of HYT group, the Dairy Production Division represented a separate business segment; the disposal group has been treatedtaxes is as a discontinued operation in this quarterly financial report. The post-tax result of the Dairy Production Division has been disclosed as a discontinued operation in the consolidated statement of income and comprehensive income.
| (a) | Net income from discontinued operations |
| | | Note | | 2012 | | | 2011 | | | | | | | (Unaudited) | | | (Unaudited) | | | | | | | | | | | | | Revenue | | | | $ | - | | | $ | - | | | | | | | | | | | | | | | Cost of goods sold | | | | | - | | | | - | | | | | | | | | | | | | | | Gross profit | | | | | - | | | | - | | | | | | | | | | | | | | | General and administrative expenses | | | | | - | | | | - | | | | | | | | | | | | | | | Net income from operations | | | | | - | | | | - | | | | | | | | | | | | | | | Interest expense | | | | | - | | | | - | | | | | | | | | | | | | | | Net income before income taxes | | | | | - | | | | - | | | | | | | | | | | | | | | Net income from sale of subsidiaries | | | | | - | | | | 10,203,951 | | | | | | | | | | | | | | | Net income before income taxes | | | | | - | | | | 10,203,951 | | | | | | | | | | | | | | | Provision for income taxes | | | | | - | | | | - | | | | | | | | | | | | | | | Net income from discontinued operations | | | | | - | | | | 10,203,951 | | | | | | | | | | | | | | | Less: Net income attributable to the non - controlling interest | | | | | - | | | | - | | | | | | | | | | | | | | | Net income from discontinued operations attributable to the Sino Agro Food, Inc. and subsidiaries | | | | $ | - | | | $ | 10,203,951 | |
| (b) | Consideration received |
| | | 2011 | | | | | | | | Consideration received in cash and cash equivalents | | $ | 704,388 | | | Disposal proceeds receivable of sale of subsidiaries | | | 44,295,612 | | | Total consideration proceeds | | $ | 45,000,000 | |
SINO AGRO FOOD, INC. AND SUBSIDIARIES
NOTES TO CONSOLIDATED FINANCIAL STATEMENTSfollows:
| | | | (c)Three months ended
March 31, 2019 | | | | Net cash outflow on sale of subsidiaries, HYTThree months ended
March 31, 2018 | | | | | (Unaudited) | | | | (Unaudited) | | | SIAF | | $ | - | | | $ | - | | | SAFS | | | - | | | | - | | MEIJI and ZXAPWAM | | | - | | | | - | | | JHST, JHMC, SJAP, QZH and HSA | | | - | | | | - | | | | $ | - | | | $ | - | |
| | | 2011 | | | | | | | | Cash and cash equivalents balance disposed of | | $ | (3,137,885 | ) | | Net cash outflow on sale of subsidiaries, HYT and ZX | | $ | (3,137,885 | ) |
The Company did not recognize any interest or penalties related to unrecognized tax benefits in the three months ended March 31, 2019 and 2018. The Company had no uncertain positions that would necessitate recording of tax related liability. The Company is subject to examination by the respective tax authorities. | | (d)F-26 | Detailed cash flow from discontinued operations |
| | | Note | | 2012 | | | 2011 | | | Cash flows from operating activities | | | | | | | | | | | | Net income for the period | | | | $ | - | | | $ | 10,203,951 | | | | | | | | | | | | | | | Adjustments to reconcile net income to net cash from operations: | | | | | | | | | | | | Depreciation | | | | | - | | | | - | | | Amortization | | | | | - | | | | - | | | Net gain of sale of subsidiaries, HYT and ZX | | | | | - | | | | (10,203,951 | ) | | Changes in operating assets and liabilities: | | | | | | | | | | | | Increase in inventories | | | | | - | | | | - | | | Increase in deposits and prepaid expenses | | | | | - | | | | - | | | Increase in other payables | | | | | - | | | | - | | | Decrease in accounts receivable | | | | | - | | | | - | | | Decrease in other receivables | | | | | - | | | | - | | | Net cash provided by operating activities | | | | | - | | | | - | | | Cash flows from investing activities | | | | | | | | | | | | Net cash outflow on sale of subsidiaries, HYT and ZX | | 5(c) | | | - | | | | (3,137,885 | ) | | Payment for acquisition of land use rights | | | | | - | | | | - | | | Payment for construction in progress | | | | | - | | | | - | | | Net cash used in investing activities | | | | | - | | | | (3,137,885 | ) | | Cash flows from financing activities | | | | | | | | | | | | Net cash provided by financing activities | | | | | - | | | | - | | | | | | | | | | | | | | | Effects on exchange rate changes on cash | | | | | - | | | | - | | | (Decrease) increase in cash and cash equivalents | | | | | - | | | | (3,137,885 | ) | | | | | | | | | | | | | | Cash and cash equivalents, beginning of year | | | | | - | | | | 3,137,885 | | | | | | | | | | | | | | | Cash and cash equivalents, at end of year | | | | $ | - | | | $ | - | | | | | | | | | | | | | | | Supplementary disclosures of cash flow information: | | | | | | | | | | | | Cash paid for interest | | | | $ | - | | | $ | - | | | Cash paid for income taxes | | | | $ | - | | | $ | - | | | Non - cash transactions | | | | | | | | | | | | Disposal proceeds receivable of sale of subsidiaries, HYT and ZX | | | | $ | - | | | $ | 44,295,612 | |
On October 10, 2011, the Company declared a cash dividend of $0.01 share, to be paid on November 15, 2011 to the stockholders as of the close of business on October 30, 2011.
SINO AGRO FOOD, INC. AND SUBSIDIARIES NOTES TO CONSOLIDATED FINANCIAL STATEMENTS
On August 22, 2012, the Company’s Board of Directors declared that the Company’s stockholders were entitled to receive one share of restricted Series F Non-convertible Preferred Stock for every 100 shares of Common Stock owned by the stockholders as of September 28, 2012, with lesser or greater amounts being rounded up to the nearest 100 shares of common stock for purpose of the computing the dividend. The holders of record of shares of Series F Non – Convertible Preferred Stock shall be entitled to a coupon payment directly from the Company at the redemption rate of $3.40 per share and be payable on May 30, 2014.
On December 6, 2012, the Company's Board of Directors has declared cash dividend on its Common Stock, payable in the amount of $0.01 for every one share issued and outstanding as of December 26, 2012, with a distribution date of January 15, 2013.
| | | 2012 | | | 2011 | | | Cash dividend | | | | | | | | | | 95,130,730 (2011: 51,950,974) outstanding shares of $0.01 | | $ | 951,307 | | | $ | 519,509 | | | Deferred dividend | | | | | | | | | | 91,931,287 outstanding shares of $0.01 (2011: 0) | | | 3,125,661 | | | | - | | | | | $ | 4,076,968 | | | $ | 519,509 | |
| 7. | CASH AND CASH EQUIVALENTS |
| | | 2012 | | | 2011 | | | | | | | | | | | Cash and bank balances | | $ | 8,424,265 | | | $ | 1,387,908 | |
As of December 31, 2012, inventories are as follows:
| | | 2012 | | | 2011 | | | | | | | | | | | Sleepy cod and eels | | $ | 4,612,090 | | | $ | - | | | Bread grass | | | 1,473,653 | | | | 449,984 | | | Beef cattle | | | 2,569,659 | | | | 825,853 | | | Organic fertilizer | | | 737,166 | | | | 807,689 | | | Forage for cattle and consumable | | | 278,900 | | | | - | | | Raw materials for bread grass and organic fertilizer | | | 6,765,536 | | | | 1,398,965 | | | Raw materials for HU plantation | | | - | | | | 11,111 | | | Immature seeds | | | 677,751 | | | | 842,313 | | | Unharvested HU plantation | | | - | | | | 99,530 | | | | | $ | 17,114,755 | | | $ | 4,435,445 | |
| 9. | DEPOSITS AND PREPAID EXPENSES |
| | | 2012 | | | 2011 | | | | | $ | | | $ | | | Deposits for Prepayments for purchases of equipment | | | 318,192 | | | | | | | Miscellaneous | | | 4,892,258 | | | | | | | Deposits for- acquisition of land use right | | | 7,826,508 | | | | 4,453,665 | | | Deposits for- inventory purchases | | | 2,228,854 | | | | 5,190,952 | | | Deposits for- aquaculture contract | | | 7,062,600 | | | | 3,085,164 | | | Deposits for- building materials | | | 2,000,000 | | | | - | | | Deposits for- proprietary technology | | | 2,254,839 | | | | - | | | Prepayments for construction in progress | | | 14,423,021 | | | | - | | | Shares issued for employee compensation and oversea professional fee | | | 271,800 | | | | 2,139,057 | | | Temporary deposits payment for acquiring equity investments | | | 6,030,785 | | | | - | | | | | | 47,308,557 | | | | 14,868,838 | |
The Company made temporary deposit payments for equity investments in the future development of a prawn farm hatchery and a prawn farm nursery. Miscellaneous represents the value of the shares of the Company held by the custodian for convertible notes, rental and utility deposits, for sundries purchases and sundries prepaid expenses.
SINO AGRO FOOD, INC. AND SUBSIDIARIES
NOTES TO CONSOLIDATED FINANCIAL STATEMENTS | 10.5. | CASH AND CASH EQUIVALENTS |
| | | March 31, 2019 | | | December 31, 2018 | | | | | (Unaudited) | | | (Audited) | | | | | | | | | | | | | Cash and bank balances | | $ | 305,721 | | | $ | 4,950,799 | |
As of March 31, 2019, inventories are as follows: | | | March 31, 2019 | | | December 31, 2018 | | | | | (Unaudited) | | | (Audited) | | | | | | | | | | | Bread grass | | | 666,989 | | | | 744,378 | | | Beef cattle | | | 14,186,719 | | | | 11,561,117 | | | Organic fertilizer | | | 14,616,370 | | | | 14,266,923 | | | Forage for cattle and consumable | | | 7,605,777 | | | | 7,252,280 | | | Raw materials for bread grass and organic fertilizer | | | 17,951,320 | | | | 18,885,258 | | | Immature seeds | | | 1,374,933 | | | | 1,872,285 | | | | | $ | 56,402,108 | | | $ | 54,582,241 | |
| 7. | DEPOSITS AND PREPAYMENTS |
| | | March 31, 2019 | | | December 31, 2018 | | | | | (Unaudited) | | | (Audited) | | | Deposits for | | | | | | | | | | - purchases of equipment | | $ | 2,196,214 | | | $ | 2,158,867 | | | - acquisition of land use rights | | | 178,200 | | | | 174,851 | | | - inventories purchases | | | 17,181,605 | | | | 16,921,188 | | | - construction in progress | | | 5,354,959 | | | | 4,789,035 | | | - issue of shares as collateral | | | 25,528,325 | | | | 24,928,324 | | | Shares issued for employee compensation and overseas professional and bond interest | | | 231,574 | | | | 643,457 | | | Others | | | 2,619,180 | | | | 2,625,468 | | | | | $ | 53,290,057 | | | $ | 52,241,190 | |
The Company has performed an analysis on all of its accounts receivable and determined that all amounts are collectible by the Company. As such, all accounts receivable are reflected as a current asset and no allowance for bad debt has been recorded as of DecemberMarch 31, 20122019 and December 31, 2011. Bad debts written off for the years ended December 31, 2012 and 2011 are $0.2018. Aging analysis of accounts receivable is as follows: | | | 2012 | | | 2011 | | | | | | | | | | | 0 - 30 days | | $ | 10,813,981 | | | $ | 20,061,598 | | | 31 - 90 days | | | 27,784,784 | | | | 1,828,058 | | | 91 - 120 days | | | 6,866,842 | | | | 2,457,259 | | | over 120 days and less than 1 year | | | 7,482,743 | | | | 3,185,000 | | | over 1 year | | | - | | | | 5,936,718 | | | | | | 52,948,350 | | | | 33,468,633 | | | Less: amounts reclassified as long term accounts receivable | | | - | | | | (5,936,718 | ) | | | | $ | 52,948,350 | | | $ | 27,531,915 | |
| | | 2012 | | | 2011 | | | | | | | | | | | Temporary payments | | $ | - | | | $ | 656,092 | | | Due from employees | | | - | | | | 130,191 | | | Due from third parties | | | 5,954,248 | | | | 8,902,588 | | | | | $ | 5,954,248 | | | $ | 9,688,871 | |
| | | March 31, 2019 | | | December 31, 2018 | | | | | (Unaudited) | | | (Audited) | | | 0 - 30 days | | $ | 8,749,198 | | | $ | 7,447,269 | | | 31 - 90 days | | | 19,554,466 | | | | 22,684,605 | | | 91 - 120 days | | | 11,893,827 | | | | 16,456,895 | | | over 120 days and less than 1 year | | | 17,451,077 | | | | 11,773,454 | | | over 1 year | | | 43,289,545 | | | | 43,289,908 | | | | | $ | 100,938,113 | | | $ | 101,652,131 | |
Payments due from employees and third parties are unsecured, interest free and without fixed term of repayment. Payments due from employees are the amounts advanced for handling business transactions on behalf of the Company, and are reconciled once the business transactions have been completed.
| 12. | DUE FROM RELATED PARTIES |
| | | 2012 | | | 2011 | | | | | | | | | | | Due from proceeds receivable | | $ | - | | | $ | 5,386,233 | | | Due from HYT | | | - | | | | 10,434,519 | | | | | $ | - | | | $ | 15,820,752 | |
The Company sold its 100% equity interest in the HYT Group (This group consisted of HYT and ZX) for the sum of $45,000,000. The purchaser of this equity interest was Mr. Xi Ming Sun, who is a director of ZX and owned an equity interest in the HYT Group prior to this purchase. Mr. Sun paid the Company $10,526,095 in cash (of which $8,969,078 was subsequently refunded by the Company to Mr. Sun) and the Company received land use rights valued at $38,056,750 as partial payment for the purchase of this equity interest. At December 31, 2011, Mr. Sun still owed the Company the sum of $5,386,233 and such amount was repaid to the Company during the fourth quarter of 2012. As of December 31, 2012 and 2011, the outstanding amount due from Mr. Xi Ming Sun is $0 and $5,386,233, respectively.
Due from HYT is an advance, which is unsecured, interest free and to be repaid within one year from December 31, 2011. By December 31, 2012, this sum had been repaid.
SINO AGRO FOOD, INC. AND SUBSIDIARIES NOTES TO CONSOLIDATED FINANCIAL STATEMENTS | 13.9. | PLANT AND EQUIPMENTOTHER RECEIVABLES |
| | | 2012 | | | 2011 | | | | | | | | | | | Plant and machinery | | $ | 3,681,644 | | | $ | 1,855,068 | | | Structure and leasehold improvements | | | 15,446,062 | | | | 27,211 | | | Mature seeds | | | 1,369,626 | | | | 503,663 | | | Furniture and equipment | | | 212,479 | | | | 773,185 | | | Motor vehicles | | | 277,513 | | | | 106,298 | | | | | | 20,987,324 | | | | 3,265,425 | | | | | | | | | | | | | Less: Accumulated depreciation | | | (1,041,022 | ) | | | (597,660 | ) | | Net carrying amount | | | 19,946,302 | | | | 2,667,765 | |
| | | March 31, 2019 | | | December 31, 2018 | | | | | (Unaudited) | | | (Audited) | | | Advanced to employees | | $ | 567,653 | | | $ | 561,330 | | | Advanced to suppliers | | | 3,905,832 | | | | 3,831,926 | | | Advanced to customers | | | 14,114,204 | | | | 14,114,249 | | | Advanced to developers | | | 461,835 | | | | 453,155 | | | Others | | | 12,054,398 | | | | 9,346,866 | | | | | $ | 31,103,922 | | | $ | 28,307,526 | |
Depreciation expense was $443,361Advanced to employees, suppliers, customers and $220,810 for the years ended December 31, 2012developers are unsecured, interest free and 2011, respectively.with no fixed terms of repayment.
| 14.10. | CONSTRUCTION IN PROGRESSPLANT AND EQUIPMENT |
| | | 2012 | | | 2011 | | | | | | | | | | | Construction in progress | | | | | | | | | | - Oven room for production of dried flowers | | $ | 828,905 | | | $ | 826,359 | | | - Office, warehouse and organic fertilizer plant in HSA | | | 10,450,518 | | | | 26,646 | | | - Organic fertilizer and bread grass production plant and office building | | | 7,921,105 | | | | 2,724,864 | | | - rangeland for beef cattle and office building | | | 5,291,982 | | | | - | | | | | $ | 24,492,510 | | | $ | 3,577,869 | |
| | | March 31, 2019 | | | December 31, 2018 | | | | | (Unaudited) | | | (Audited) | | | | | | | | | | | Plant and machinery | | $ | 5,394,528 | | | $ | 5,299,631 | | | Structure and leasehold improvements | | | 204,314,391 | | | | 200,734,812 | | | Mature seeds and herbage cultivation | | | 58,898,928 | | | | 54,643,255 | | | Furniture and equipment | | | 697,403 | | | | 695,461 | | | Motor vehicles | | | 599,689 | | | | 590,416 | | | | | | 269,904,939 | | | | 261,963,575 | | | | | | | | | | | | | Less: Accumulated depreciation | | | (34,431,708 | ) | | | (31,317,916 | ) | | Net carrying amount | | $ | 235,473,231 | | | $ | 230,645,659 | |
Depreciation expenses were $2,542,874 and $2,658,508 for the three months ended March 31, 2019 and 2018, respectively | 15.11. | LAND USE RIGHTSCONSTRUCTION IN PROGRESS |
Private ownership of agricultural land is not permitted in the PRC. Instead, the Company has leased five lots of land. The cost of the first lot of land use rights acquired in 2007 was $6,194,505, which consists of 1,985.06 acres in the Hebei Province with leaseholds expiring in 2036, 2051, 2067 and 2077. The cost of the second lot of land use rights acquired in 2007 in the Guangdong Province was $6,408,289 and consists of 180.23 acres with the lease expiring in 2067. The cost of the third lot of land use rights acquired in 2008 in the Guangdong Province was $764,128, which consists of 31.84 acres with the lease expiring in 2068. The cost of the fourth lot of land use rights acquired in 2010 in the Hebei Province was $3,223,411, which consists of 825 acres with the lease expiring in 2066.The first lot of land use rights with the original cost of $6,194,505 and the fourth lot of land use rights with the original cost of $3,223,411 were disposed of with the sale of a subsidiary of ZX. The cost of the fifth lot of land use rights acquired in 2011 was $12,040,571, which consists of 93.64 acres in the Guangdong Province, with the lease expiring in 2031 and 2037. The cost of the sixth lot of land use rights acquired in 2011 was $35,405,750 which consisted of 287.21 acres in the Hunan Province, PRC and the leases expire in 2061. The cost of the seventh lot of land use rights acquired in 2012 was $528,240 which consisted of 21.09 acres in the Xining City, Qinghai Province, PRC and the leases expire in 2051.
| | | March 31, 2019 | | | December 31, 2018 | | | | | (Unaudited) | | | (Audited) | | | Construction in progress | | | | | | | | | | - Office, warehouse and organic fertilizer plant in HSA | | | 7,425 | | | | 7,285 | | | - Oven room, road for production of dried flowers | | | - | | | | - | | | - Organic fertilizer and bread grass production plant and office building | | | 6,989,159 | | | | 6,484,045 | | | - Rangeland for beef cattle and office building | | | 6,169,839 | | | | 6,024,197 | | | - Fish pond and breeding factory | | | - | | | | - | | | | | | 13,166,423 | | | | 12,515,527 | |
| | | 2012 | | | 2011 | | | | | | | | | | | Cost (Note) | | $ | 58,630,950 | | | $ | 57,845,574 | | | Less: Accumulated amortization | | | (2,897,704 | ) | | | (1,338,104 | ) | | Net carrying amount | | $ | 55,733,246 | | | $ | 56,507,470 | |
Note
SINO AGRO FOOD, INC. AND SUBSIDIARIES NOTES TO CONSOLIDATED FINANCIAL STATEMENTS | Fiscal year | | Expiry date | | Location | | Cost | | | | | | | | | | | | Balance at 1.1.2011 | | | | $ | 18,776,139 | | | 2011 | | 2037 | | Enping City, Guangdong Province, PRC | | | 12,365,293 | | | 2011 | | 2051, 2054 and 2071 | | Linli County, Hunan Province, PRC. | | | 35,405,750 | | | Less: disposal upon sale of a subsidiary,ZX | | | | | | | | Acquired in 2007 | | Huebi Province, PRC | | | (6,194,505 | ) | | | | Acquired in 2010 | | Huebi Province, PRC | | | (3,223,411 | ) | | | | Exchange adjustment | | | | | 716,307 | | | Balance at 12.31.2011 | | | | | 57,845,573 | | | 2012 | | 2051 | | Xining city, Qinghai Province, PRC | | | 528,240 | | | | | Exchange adjustment | | | | | 257,137 | | | Balance at 12.31.2012 | | | | $ | 58,630,950 | |
| | | March 31, 2019 | | | December 31, 2018 | | | | | (Unaudited) | | | (Audited) | | | Cost | | $ | 66,851,156 | | | $ | 65,779,178 | | | Less: Accumulated amortization | | | (12,561,527 | ) | | | (11,964,897 | ) | | Net carrying amount | | $ | 54,289,629 | | | $ | 53,814,281 | |
| | | Amount | | | | | | | | Balance @1.1.2018 | | $ | 65,573,223 | | | Exchange difference | | | 205,955 | | | Balance @12.31.2018 | | $ | 65,779,178 | | | Exchange difference | | | 1,071,978 | | | Balance @3.31.2019 | | $ | 66,851,156 | |
Land use rights are amortized on the straight-line basis over their respective lease periods. The lease period of agriculture land is 3010 to 60 years. Amortization of land use rights was $1,599,600were $418,757 and $732,946$422,580 for the yearsthree months ended DecemberMarch 31, 20122019 and 2011,2018, respectively. | 16.13. | PROPRIETARY TECHNOLOGIESGOODWILL |
By an agreement dated November 12, 2008, TRW acquired an enzyme technology master license, registered under a Chinese patent, for the manufacturing of livestock feed and bioorganic fertilizer and its related labels for $8,000,000. On March 6, 2012 MEIJI acquired an aromatic-feed formula technology for the production of aromatic cattle for $1,500,000.
| | | 2012 | | | 2011 | | | | | | | | | | | Proprietary technologies | | $ | 9,512,258 | | | $ | 8,000,000 | | | Less: Accumulated amortization | | | (1,397,634 | ) | | | (1,022,325 | ) | | Net carrying amount | | $ | 8,114,624 | | | $ | 6,977,675 | |
Amortization of proprietary technologies was $375,309 and $310,235 for the years ended December 31, 2012 and 2011, respectively. No impairments of proprietary technologies have been identified during the years ended December 31, 2012 and 2011.
Goodwill represents the fair value of the assets acquired the acquisitions over the cost of the assets acquired. It is stated at cost less accumulated impairment losses. Management tests goodwill for impairment on an annual basis or when impairment indicators arise. In these instances, the Company recognizes an impairment loss when it is probable that the estimated cash flows are less than the carrying value of the assets. To date, no such impairment loss has been recorded. | | | | March 31, 2019 | | December 31, 2018 | | | | | 2012 | | 2011 | | | (Unaudited) | | (Audited) | | | | | | | | | | | | | | | Goodwill from acquisition | | $ | 724,940 | | | $ | 724,940 | | | $ | 724,940 | | $ | 724,940 | | | Less: Accumulated impairment losses | | | - | | | | - | | | | - | | | - | | | Net carrying amount | | $ | 724,940 | | | $ | 724,940 | | | $ | 724,940 | | $ | 724,940 | |
| 18.14. | UNCONSOLIDATED EQUITY INVESTEEPROPRIETARY TECHNOLOGIES |
By an agreement dated November 12, 2008, TRW acquired an enzyme technology master license, registered under a Chinese patent, for the manufacturing of livestock feed and bioorganic fertilizer and its related labels for $8,000,000. On February 11, 2011, CA appliedOctober 1, 2015, the Company took up such assets at $5,473,720. On March 6, 2012, MEIJI acquired an aromatic-feed formula technology for the production of aromatic cattle for $1,500,000. On October 1, 2013, SIAF was granted a license to form a corporate joint venture, Enping City Bi Tao A Power Prawn Culture Development Co. Limited (“EBAPCD”), incorporated in the People’s Republicexploit sleepy cods breeding technology to grow out of China. CA has the right to acquire up to a 75% equity interest in EBAPCD. EBAPCD has not commenced its business of prawn cultivation.sleepy cods for $2,270,000 for 50 years. SJAP booked bacterial cellulose technology license and related trademark for $2,119,075 and amortized expenditures for 20 years starting from January 1, 2014. SINO AGRO FOOD, INC. AND SUBSIDIARIES NOTES TO CONSOLIDATED FINANCIAL STATEMENTS | 14. | PROPRIETARY TECHNOLOGIES (CONTINUED) |
| | | March 31, 2019 | | | December 31, 2018 | | | | | (Unaudited) | | | (Audited) | | | | | | | | | | | Cost | | $ | 11,146,113 | | | $ | 11,113,267 | | | Less: Accumulated amortization | | | (2,329,443 | ) | | | (2,176,196 | ) | | Net carrying amount | | $ | 8,816,670 | | | $ | 8,937,071 | |
Amortization of proprietary technologies was $145,294 and $146,781 for the three months ended March 31, 2019 and 2018, respectively. No impairments of proprietary technologies have been identified for the three months ended March 31, 2019 and 2018. | 15. | INTERESTS IN UNCONSOLIDATED EQUITY INVESTEES |
On February 28, 2011, TRW applied to form a corporate joint venture, Enping City Bi Tao A Power Fishery Development Co., Limited (“(” EBAPFD”) “), incorporated in the PRC. TRW owned a 25% equity interest in EBAPFD. On November 17, 2011, TRW formed Jiang Men City A Power Fishery Development Co., Limited (“JFD”JFD”) in which it acquired a 25% equity interest, while it withdrewwithdrawing its 25% equity interest in EBAPFD. As of December 31, 2011, the Company had invested for total cash consideration of $1,258,607 in JFD. JFD operates an indoor fish farm. On January 1, 2012, the Company acquired an additional 25% equity interest in JFD for the amounttotal cash consideration of $1,662,365. As of January 1, 2012, the Company had consolidated the assets and operations of JFD. On April 1, 2012, the Company acquired an additional 25% equity interest in JFD for the amounttotal cash consideration of $1,702,580. These acquisitions were at our option according the terms of the original development agreement. The Company presently ownsowned a 75% equity interest in JFD, and controlsrepresenting majority of votesvoting rights and controls its board of directors. As result, the Company has consolidated the assets and operations of JFD. On AprilAugust 15, 2011, MEIJI applied2016, the acquisition agreement was executed by TRW for acquiring the other 25% equity in JFD which was a Sino Foreign Joint Venture Co. that TRW had 100% equity interest with effect on October 5, 2016. Upon the acquisitions of 3 additional prawn farms assets at fair value of $238.32 million from respective third parties and the master technology license at fair value of $30 million from Capital Award, Inc. by JFD, and the consideration of the above acquisitions were planned to form Enping City A Power Cattle Farm Co., Limited (“ECF”), incorporated inbe settled by the People’s Republicnew issue shares of China. MEIJI had 25%99,990,000 TRW shares at $3.41 amounting to $340.53 million on or before March 31, 2017. As a result, SIAF’s equity interest in ECF.TRW was diluted from 100% to 23.89% with effective on October 5, 2016. The PRC Government granted the official name of Jiang Men City Hang Meiji Cattle Farm Development Co., Limited (“JHMC”) to ECF on June 3, 2012. On April 1, 2012,above transactions leaded the Company acquired an additional 25%loss of control over TRW group, the Company’s investments in TRW and JFD were reclassified from a subsidiary to investments in unconsolidated equity investees as of October 5, 2016. The dilution of the Company’s investments in TRW group constituted a deemed disposal of the subsidiaries. The deemed gain on disposal of $56,947,005 was recorded in net income from discontinued operations of the consolidated statements of income and other comprehensive income of the Company for the year ended December 31, 2016. On October 1, 2016, SIAF took up all assets and liabilities of TRW and JFD except plant and equipment - fish farm. The Company converted the amount due from unconsolidated equity investee into equity interest during the fourth quarter of 2017, which resulted in equity interest in JFD for the amount of $1,702,580. The Company presently owns a 75% equity interest in ECF and controls majority of votes and its board of directors. As result, the Company has consolidated the assets and operations of JFD.TRW from 23.89% to 36.60%. | | | 2012 | | | 2011 | | | | | | | | | | | Investment in unconsolidated joint venture | | $ | - | | | $ | 1,258,607 | |
| | | March 31, 2019 | | | December 31, 2018 | | | | | (Unaudited) | | | (Audited) | | | Investments at cost | | | | | | | | | | - TRW | | $ | 153,309,311 | | | $ | 150,918,857 | | | Amount due from a consolidated equity investee - TRW | | | 56,126,144 | | | | 56,155,769 | | | | | $ | 209,435,455 | | | $ | 207,074,626 | |
SINO AGRO FOOD, INC. NOTES TO CONSOLIDATED FINANCIAL STATEMENTS | 19.16. | TEMPORARY DEPOSITS PAID TO ENTITIES FOR EQUITY INVESTMENTS IN FUTURE SINO JOINT VENTURE COMPANIES |
| Intended | | | | | | | | | | | | unincorporated | | Projects | | | | | | | | | | Investee | | Engaged | | | | March 31, 2019 | | | December 31, 2018 | | | | | | | | | (Unaudited) | | | (Audited) | | | A | | Trade center | | * | | $ | 12,000,000 | | | $ | 12,000,000 | | | B | | Fish Farm 2 GaoQiqiang Aquaculture | | * | | | 17,403,959 | | | | 17,403,959 | | | C | | Cattle farm 2 | | * | | | 5,490,088 | | | | 5,502,001 | | | | | | | | | $ | 34,894,047 | | | $ | 34,905,960 | |
The Company made temporary deposits paid to entities for equity investments in future Sino Joint Venture companies (“SJVCs”) engaged in projects development of trade and seafood centers, fish, prawns and cattle farms. Such temporary deposits represented as deposits of the respective consideration required for the purchase of equity stakes of respective future SJVCs. The amounts were classified as temporary because legal procedures of formation of SJVCs have not yet been completed. As of March 31, 2018, the percentages of equity stakes of A (trade and seafood centers), B (fish farm 2 GaoQiqiang Aquaculture Farm) and C (cattle farm 2) are 31%, 23% and 35% respectively. | * | The above amounts were subject to conversion to an additional equity investment in the investees upon the completion of legal procedures of formation of SJVCs. |
| 17. | VARIABLE INTEREST ENTITY |
On September 28, 2009, APWAM acquired the PMH’s 45% equity interest in the Sino-Foreign joint venture company, Qinghai Sanjiang A Power Agriculture Co. Limited (“SJAP”), which was incorporated in the People’s Republic of China.P.R.C. As of DecemberMarch 31, 2012,2019 , the Company has invested $2,251,359 in this joint venture. SJAP is engaged in its business of the manufacturing of organic fertilizer, livestock feed, and beef cattle and plantation of crops and pastures. Continuous assessment of the VIE relationship with SJAP The Company may also have a controlling financial interest in an entity through an arrangement that does not involve voting interests, such as a VIE. The Company evaluates entities deemed to be VIE’s using a risk and reward model to determine whether to consolidate. A VIE is an entity (1) that has total equity at risk that is not sufficient to finance its activities without additional subordinated financial support from other entities, (2) where the group of equity holders does not have the power to direct the activities of the entity that most significantly impact the entity’s economic performance, or the obligation to absorb the entity’s expected losses or the right to receive the entity’s expected residual returns, or both, or (3) where the voting rights of some investors are not proportional to their obligations to absorb the expected losses of the entity, their rights to receive the expected residual returns of the entity, or both, and substantially all of the entity’s activities either involve or are conducted on behalf of an investor that has disproportionately fewfewer voting rights. SINO AGRO FOOD, INC. NOTES TO CONSOLIDATED FINANCIAL STATEMENTS | 17. | VARIABLE INTEREST ENTITY (CONTINUED) |
The Company also quantitatively and qualitatively examined if SJAP is considered a VIE. Qualitative analyses considered the extent to which the nature of its variable interest exposed the Company to losses. For quantitative analyses, the Company also used internal cash flow models to determine if SJAP was a VIE and, if so, whether the Company was the primary beneficiary. The projection of these cash flows and probabilities thereof requires significant managerial judgment because of the inherent limitations that relate to the use of historical data for the projection of future events. On March 31, 2018, the Company evaluated the above VIE testing results and concluded that the Company is the primary beneficiary of SJAP’s expected losses or residual returns and that SJAP qualifies as a VIE of the Company. As result, the Company has consolidated SJAP as a VIE. The reasons for the changes are as follows: | · | Originally, the board of directors of SJAP consisted of 7 members; 3 appointees from Qinghai Sanjiang (one stockholder), 1 from Garwor (one stockholder), and 3 from the Company, such that the Company did not have majority interest represented on the board of directors of SJAP. |
| · | On May 7, 2010, Qinghai Sanjiang sold and transferred its equity interest in SJAP to Garwor. The State Administration for Industry and Commerce of Xining City Government of the P.R.C. approved the sale and transfer. |
Consequently, Garwor and the Company agreed that the new board of directors of SJAP would consist of 3 members; 1 appointee from Garwor and 2 appointees from the Company, such that the Company now had a majority interest in the board of directors of SJAP. Also, and in accordance with the Company’s Sino Joint Venture Agreement, the Company’s management appointed the chief financial officer of SJAP. As a result, the financial statements of SJAP were included in the consolidated financial statements of the Company. SINO AGRO FOOD, INC. NOTES TO CONSOLIDATED FINANCIAL STATEMENTS | 18.. | CONSTRUCTION CONTRACT |
| (i) | Costs and estimated earnings in excess of billings on uncompleted contracts |
| | | March 31, 2019 | | | December 31, 2018 | | | | | (Unaudited) | | | (Audited) | | | Costs | | $ | 6,186,261 | | | $ | 6,186,261 | | | Estimated earnings | | | 4,777,300 | | | | 4,777,300 | | | Less: Billings | | | (10,712,733 | ) | | | (10,712,733 | ) | | Costs and estimated earnings in excess of billings on uncompleted contracts | | $ | 250,828 | | | $ | 250,828 | |
| (ii) | Billings in excess of costs and estimated earnings on uncompleted contracts |
| | | March 31, 2019 | | | December 31, 2018 | | | | | (Unaudited) | | | (Audited) | | | Billings | | $ | 48,467,593 | | | $ | 47,929,092 | | | Less: Costs | | | (29,493,284 | ) | | | (29,094,568 | ) | | Estimated earnings | | | (13,567,173 | ) | | | (13,486,231 | ) | | Billing in excess of costs and estimated earnings on uncompleted contracts | | $ | 5,407,136 | | | $ | 5,348,293 | |
| | | March 31, 2019 | | | December 31, 2018 | | | | | (Unaudited) | | | (Audited) | | | Billings | | $ | 59,180,326 | | | $ | 58,641,825 | | | Less: Costs | | | (35,679,545 | ) | | | (35,280,829 | ) | | Estimated earnings | | | (18,344,473 | ) | | | (18,263,531 | ) | | Billing in excess of costs and estimated earnings on uncompleted contracts | | $ | 5,156,308 | | | $ | 5,097,465 | |
| | | March 31, 2019 | | | December 31, 2018 | | | | | (Unaudited) | | | (Audited) | | | Due to third parties | | $ | 11,347,269 | | | $ | 13,068,387 | | | Straight note payable | | | 35,669,479 | | | | 29,367,999 | | | Promissory notes issued to third parties | | | 7,759,801 | | | | 7,792,774 | | | Due to local government | | | - | | | | 87,425 | | | | | $ | 54,776,549 | | | $ | 50,316,585 | | | | | | | | | | | | | Less: Amount classified as non-current liabilities | | | | | | | | | | Promissory notes issued to third parties | | | (7,759,801 | ) | | | (7,792,774 | ) | | Amount classified as current liabilities | | $ | 47,016,748 | | | $ | 42,523,811 | |
Due to third parties are unsecured, interest free and have no fixed terms of repayment. SINO AGRO FOOD, INC. NOTES TO CONSOLIDATED FINANCIAL STATEMENTS There are no provisions in the Company’s bank borrowings and long term debts that would accelerate repayment of debt as a result of a change in credit ratings or a material adverse change in the Company’s business. Under certain agreements, the Company has the option to retire debt prior to maturity, either at par or at a premium over par. Short term bank loan | Name of lender | | Interest rate | | | Term | | March 31, 2019 | | | December 31, 2018 | | | | | | | | | | (Unaudited) | | | (Audited) | | China Development Bank
Qinghai City, the P.R.C | | | 4.7306 | % | | December 27, 2018 - December 27, 2019 | | $ | 4,455,005 | | | $ | 4,371,265 | | Add: current portion of long term
bank loan | | | | | | | | $ | 222,750 | | | $ | 218,563 | | | | | | | | | | | | 4,677,755 | | | | 4,589,828 | |
Long term bank loan | Name of lender | | Interest rate | | | Term | | March 31, 2019 | | | December 31, 2018 | | | | | | | | | | (Unaudited) | | | (Audited) | | | China Development Bank | | | | | | | | | | | | | Qinghai City, the P.R,C. | | | 5.39 | % | | December 16, 2016 - December 15, 2026 | | $ | 5,865,756 | | | $ | 5,755,501 | | Less: current portion of long term
bank loan | | | | | | | | $ | (222,750 | ) | | $ | (218,563 | ) | | | | | | | | | | | 5,643,006 | | | | 5,536,938 | |
On December 16, 2016, the Company obtained a 10-year long term loan of RMB40million (approximately $5.94million) from China Development Bank for the period from December 16, 2016 to December 15, 2026, bearing an annual interest rate at 110% of the benchmark rate of PBOC on the date of the loan agreement and will be adjusted in line with any adjustment of the benchmark rate which is 5.39% (12.31.2017: 5.39%). The loan was guaranteed by Mr. Zhao Yilin and Ms. Song Haixian, Mr. Zhao Yilin’s wife. The loan was also secured by land use right with net carrying amount of $397,269 as of December 31, 2018 (12.31.2018: 397,269) and a batch of plant, machinery and equipment with net carrying amount of $5,326,385 (12.31.2018: 5,326,385). According to the loan agreement, RMB1,500,000 (approximately $218,563) was scheduled to be repaid by December 20, 2019. On December 27, 2018, the Company obtained a 1-year short term loan of RMB30 million (approximately $4.37 million) from China Development Bank for the period from the December 27, 2018 to December 27, 2019, bearing fixed interest at 4.7306% per annum. This loan was guaranteed by Xining City SME Guarantee Corporation. The above note agreements contained regular provisions requiring timely repayment of principals and accrued interests, payment of default interest in the event of default, and without specific financial covenants. Management of the Company believes the Company is in material compliance with the terms of the loan agreements. SINO AGRO FOOD, INC. NOTES TO CONSOLIDATED FINANCIAL STATEMENTS | 21. | CONVERTIBLE NOTE PAYABLES |
On August 29, 2014, the Company completed the closing of a private placement financing transaction with an accredited investor, which purchased a 10.5% Convertible Note (the “Note 1”) in the aggregate principal amount of up to $33,300,000. The Company received the total advance of $11,632,450. The Company shall offer investor a discount equal to 25% of the amount of the principal advanced by the investor. Interest on the note shall accrue on the outstanding principal balance of this Note from August 29, 2014. Interest shall be payable quarterly on the last day of each of March, June, September and December commencing September 30, 2014 provided, however, that note holder may elect to require the Company to issue to the note holder a promissory note in lieu of cash in satisfaction of any interest due and payable at such time. Any interest payment note shall be subject to the same terms as the note. The note has a maturity date of February 28, 2020. The note is convertible, at the discretion of the note holder, into shares of the Company’s common stock (i) at any time following an Event of Default, or (ii) for a period of thirty (30) calendar days following October 31, 2015 and each anniversary thereof, at an initial conversion price per share of $1.00, (price prior to reversed split) subject to adjustment for stock splits, reverse stock splits, stock dividends and other similar transactions and subject to the terms of the note. As long as the note is outstanding, the investor shall have a right of first refusal, exercisable for thirty (30) calendar days after notice to the note holder, to purchase securities proposed to be offered and sold by the Company. The Company and the note holder entered into a restructuring agreement regarding the settlement of the Note 1. Both parties have agreed to restructure the indebtedness represented by Note 1 as follows: (a) SIAF issues 5,196,333 shares of its common stock and transfer 400,000 shares of TRW to the note holder; and (b) SIAF executes a new promissory note in the principal amount of $15,589,000 to the note holder to be paid in installments over a period of time. However, both parties remain open to negotiate an all-cash settlement of the Note 1. As a result, the amount outstanding under Note 1 was reclassified as other payables – straight note payable of $29,367,999 (see Note 19). On October 20, 2017, the Company issued another Convertible Note (the"Note 2") with a principal amount of $4,000,000 due on February 28, 2018. The note holder had the option to convert all or any part of the outstanding note into the common stock of the Company (the "Primary Optional Conversion") or TRW (the "Secondary Optional Conversion") at any time for a period of eight months from the note's maturity date. The conversion price for Primary Optional Conversion is lesser of $1.5 per share or at 65% of the market share price of the Company. While the conversion price for Secondary Optional Conversion is $3.41 per share subject to equitable adjustment for stock split, stock dividend or right offerings. Under the agreement, the Company shall pay the note holder 120,000 common shares of SIAF or 32,000 common shares of TRW as an origination fee. The note bears a flat interest payment which shall be settled by 200,000 common shares of SIAF or 55,000 common shares of TRW. As of March 31, 2019, no settlement for both origination fee and interest payment. The Company and the note holder entered into a restructuring agreement regarding the settlement of the Note 2. Both parties have agreed to restructure the indebtedness represented by Note 2 where SIAF executes a new promissory note in the principal amount of $6,301,480 to the note holder to be paid in 3 installments by August 31, 2019, October 30, 2019 and December 31, 2019, respectively. As a result, the amount outstanding under Note 2 was reclassified as other payables – straight note payable of $6,301,480 (see Note 19) and a loss on restructuring of $2,404,402 which representing the default interest incurred during the period. | | | March 31, 2019 | | | December 31, 2018 | | | | | (Unaudited) | | | (Audited) | | | | | | | | | | | Convertible note due December 31, 2018 | | $ | - | | | $ | 3,894,978 | | | Less: classified as current liabilities | | | - | | | | (3,894,978 | ) | | Non-current liabilities | | $ | - | | | $ | - | |
The following table sets forth, by level within the fair value hierarchy, the Company’s financial liabilities that were accounted for at fair value as of December 31, 2018. | | | Level 1 | | | Level 2 | | | Level 3 | | | Total | | | | $ | | | $ | | | $ | | | $ | | | LIABILITIES: | | | | | | | | | | | | | | | | | | Derivative liabilities as of December 31, 2018 | | | - | | | | - | | | | 2,100 | | | | 2,100 | |
SINO AGRO FOOD, INC. NOTES TO CONSOLIDATED FINANCIAL STATEMENTS The Group’s share capital as of March 31, 2019 and December 31, 2018 shown on the consolidated balance sheet represents the aggregate nominal value of the share capital of the company as of that date. Common Stock: On November 10, 2014, the Company approved an amendment to the Corporation’s Articles of Incorporation to effectuate a reverse stock split (the “Reverse Split”) of the Corporation’s common stock, par value $0.001 per share (the “Common Stock”) affecting both the authorized and issued and outstanding number of such shares by a ratio of 9.9 for 1. The Reverse Split became effective in the State of Nevada on December 16, 2014. Subsequent to the December 31, 2014, the Board of directors and the holders of a majority of the voting power of our stockholders of the company have approved an amendment to articles of incorporation to increase its authorized shares of Common Stock from 17,171,716 to 22,727,272. The Board of directors and the holders of a majority of the voting power of our stockholders of the company have approved an amendment to articles of incorporation to increase its authorized shares of Common Stock from 22,727,272 to 27,000,000 and the amendment was filed on December 28, 2016. The Board of directors and the holders of a majority of the voting power of our stockholders of the company have approved an amendment to articles of incorporation to increase its authorized shares of Common Stock from 27,000,000 to 50,000,000 and the amendment was filed on August 24, 2017 with an effective date of August 25, 2017. During the year ended December 31, 2018, the Company (i) issued 535,598 shares of common stock valued to employees and directors at ranging from $1 to $1.56 per share for $576,170 for employee compensation; (ii) issued 16,032,262 shares of common stock valued to professionals and contractors ranging from $ 0.55 to $1.00 per share for $9,723,720 for service compensation; and (iii) issued 3,935,439 shares of common stock valued at $ 0.30 to $ 0.50 per share for 1,478,029 for settlement of debts. During the three months ended March 31, 2019, the Company (i) issued 109,911 shares of common stock valued at fair value of $0.3 per share for $32,973 for settling of debts; the shares issued by the Company were valued at the trading price of the stock on the date the shares were issued. The Company has 49,976,085 and 49,866,174 shares of common stock issued and outstanding as of March 31, 2019 and December 31, 2018 respectively. SINO AGRO FOOD, INC. NOTES TO CONSOLIDATED FINANCIAL STATEMENTS | 23. | OBLIGATION UNDER OPERATING LEASES |
The Company leases (i) 2,178 square feet of agriculture space used for offices for a monthly rent of $856 in Enping City, Guangdong Province, P.R.C., its lease expiring on March 31, 2022; and (ii) 2,695 square feet of office space in Guangzhou City, Guangdong Province, P.R.C. for a monthly rent of $6,570, its lease expiring on July 8, 2020. Lease expenses were $22,277 and $40,758 for the three months ended March 31, 2019 and 2018, respectively. The future minimum lease payments as of March 31, 2019, are as follows: | Within 1 year | | $ | 89,202 | | | 2 to 5 years | | | 42,018 | | | Over 5 years | | | - | | | | | $ | 131,220 | |
SINO AGRO FOOD, INC. NOTES TO CONSOLIDATED FINANCIAL STATEMENTS | 24. | STOCK BASED COMPENSATION |
The Company calculated stock-based compensation of $643,457 and $3,785,008 and recognized $411,883 and $226,113 for the three months ended March 31, 2019 and 2018. As of March 31, 2019, the deferred compensation balance for staff, professional and contractors was $231,574 and the deferred compensation balance of $231,574 was to be amortized over 3 months beginning on April 1, 2019. As of March 31, 2018, the deferred compensation balance for staff, professional and contractors was $3,558,895 and the deferred compensation balances of $100,912, $375,600, and $3,082,383 were to be amortized over 3 months, 9 months and 1 year beginning on April 1, 2018, respectively As of March 31, 2019 and December 31, 2018, the Company did not have any pending claims, charges, or litigation that it expects would have a material adverse effect on its consolidated balance sheets, consolidated statements of income and other comprehensive income or consolidated statements of cash flows. On September 19, 2015, the Company entered into a trade facility agreement with two independent third parties. Pursuant to the agreement, the Company provides collateral in the form of Company's common shares to a PRC based lender (the "Lender") and the Lender agrees to provide a revolving trade facility loan up to $20,000,000 to a PRC based borrower. The arrangement was commenced on February 15, 2016 and will be expired on February 15, 2019. As of March 31, 2019, the Company has issued aggregate 4,809,979 (12.31.2018: 5,708,312) common shares as collateral. On March 26, 2019, a shareholder derivative complaint was filed in the United States District Court for the Southern District of New York against the Company, as well as four of its current directors, styled Heng Ren Silk Road Investments LLC, Heng Ren Investments LP, derivatively on behalf of Sino Agro Food Inc. v. Sino Agro Food Inc., Lee Yip Kun Solomon, Tan Poay Teik, Chen Bor Hann, Lim Chang Soh, and Sino Agro Food Inc., as the nominal defendant (Case No.: 1:19-cv-02680) (the “Complaint”). The Company’s Motion to Dismiss the Complaint is currently due on or before June 28, 2019. The Complaint alleges violations of the federal securities laws and breaches of fiduciary duties (including gross mismanagement of the Company) by the individual defendants, based on allegations concerning, inter alia, a material default of its obligations under a commercial loan agreement, misleading and false statements (including material omissions) by the individual defendants, and unauthorized issuance of new shares of Common Stock to pay debts that, in the view of the plaintiffs, has diluted shareholder ownership and oppressed shareholders of the Company. The Company believes that these claims are without merit and intend to vigorously defend the action. Based on the Company’s assessment of the facts underlying the claims, the uncertainty of litigation, and the preliminary stage of the case, the Company cannot estimate the reasonably possible loss or range of loss that may result from this action. However, an unfavorable outcome may have a material adverse effect on our business, financial condition and results of operations. | 26. | RELATED PARTY TRANSACTIONS |
In addition to the transactions and balances as disclosed elsewhere in these consolidated financial statements, during the three months ended March 31, 2019 and 2018, the Company had the following significant related party transactions:- | Name of related party | | Nature of transactions | | | | Mr. Solomon Yip
Kun Lee,
Chairman Tri-way Industries Limited, (“TRW’) Unconsolidated equity investee | | Included in due to a director, due to Mr. Solomon Yip Kun Lee is $259,953 and $2,046,499 as of March 31, 2019 and December 31, 2018, respectively. The amounts are unsecured, interest free and have no fixed terms of repayment. Included in interest in unconsolidated equity investee, due from Tri-way Industries Limited is $57,586,312 and $57,354,208 as of March 31, 2019 and December 31, 2018, respectively. The amounts are unsecured, interest free and have no fixed terms of repayment. Included in accounts receivable, due from Tri-way Industries Limited is $61,849,210 and $60,799,365 as of March 31, 2019 and December 31, 2018, respectively. The amounts are unsecured, interest free and have no fixed terms of repayment. The Company has consulting and service income from development contracts of $2,472,404 and $2,472,404 from Tri-way Industries Limited for the three months ended March 31, 2019 and 2018, respectively. |
SINO AGRO FOOD, INC. NOTES TO CONSOLIDATED FINANCIAL STATEMENTS Basic earnings per share is computed by dividing net income attributable to common shareholders by the weighted average number of common shares outstanding during the year. Diluted earnings per share reflects the potential dilution of securities by including other potential common stock, including convertible preferred stock, stock options and warrants, in the weighted average number of common shares outstanding for the year, if dilutive. The numerators and denominators used in the computations of basic and dilutive earnings per share are presented in the following table: | | | Three months ended
March 31, 2019 | | | Three months ended
March 31, 2018 | | | | | (Unaudited) | | | (Unaudited) | | | BASIC | | | | | | | | | | Numerator for basic earnings per share attributable to the Company’s common stockholders: | | | | | | | | | | | | | | | | | | | | Net income used in computing basic earnings per share | | $ | 612,674 | | | $ | 5,072,719 | | | | | | | | | | | | | Basic earnings per share - continuing and discontinued operations | | $ | 0.01 | | | $ | 0.17 | | | Basic weighted average shares outstanding | | | 49,873,502 | | | | 30,653,770 | |
| | | Three months ended
March 31, 2019 | | | Three months ended
March 31, 2018 | | | | | (Unaudited) | | | (Unaudited) | | | DILUTED | | | | | | | | | | Numerator for basic earnings per share attributable to the Company’s common stockholders: | | | | | | | | | | Net income used in computing basic earnings per share | | $ | 612,674 | | | $ | 5,072,719 | | | Convertible note interest | | | - | | | | - | | | Net income used in computing diluted earnings per share | | $ | 612,674 | | | $ | 5,072,719 | | | | | | | | | | | | | Diluted earnings per share | | $ | 0.01 | | | $ | 0.17 | | | | | | | | | | | | | Basic weighted average shares outstanding | | | - | | | | 30,653,770 | | | | | | | | | | | | | Add: | | | | | | | | | | weight average of common stock convertible from convertible note payables | | | - | | | | - | | | | | | | | | | | | | Diluted weighted average shares outstanding | | | 49,873,502 | | | | 30,653,770 | |
SINO AGRO FOOD, INC. AND SUBSIDIARIES INDEX TO CONSOLIDATED FINANCIAL STATEMENTS Zhen Hui Certified Public Accountants Units 1403-1404, Dominion Centre, 43-59 Queen’s Road East, Wan Chai, Hong Kong. Tel : (852) 2521 0706 Fax : (852) 2521 7624 REPORT OF INDEPENDENT REGISTERED PUBLIC ACCOUNTING FIRM To the stockholders and the board of directors of Sino Agro Food, Inc. (Incorporated in the State of Nevada, United States of America) Opinion on the Financial Statements We have audited the accompanying consolidated balance sheet of Sino Agro Food, Inc. (the Company) and its subsidiaries (collectively referred to as the “Group”) as of December 31, 2018, and the related consolidated statements of income and other comprehensive income, consolidated statements of shareholders’ equity, and consolidated statements of cash flows for the year ended December 31, 2018, and the related notes and schedules (collectively referred to as the financial statements). In our opinion, the consolidated financial statements present fairly, in all material respects, the financial position of the Group as of December 31, 2018, and the results of its operations and its cash flow for the year ended December 31, 2018, in conformity with accounting principles generally accepted in the United States of America. Basis for Opinion These consolidated financial statements are the responsibility of the Company’s management. Our responsibility is to express an opinion on these consolidated financial statements based on our audit. We are a public accounting firm registered with the Public Company Accounting Oversight Board (United States) (PCAOB) and are required to be independent with respect to the Group in accordance with the U.S. federal securities laws and the applicable rules and regulations of the Securities and Exchange Commission and the PCAOB. We conducted our audit in accordance with the standards of the PCAOB. Those standards require that we plan and perform the audit to obtain reasonable assurance about whether the financial statements are free of material misstatement, whether due to error or fraud. The Group is not required to have, nor were we engaged to perform, an audit of its internal control over financial reporting. As part of our audit, we are required to obtain an understanding of internal control over financial reporting, but not for the purpose of expressing an opinion on the effectiveness of the Group’s internal control over financial reporting. Accordingly, we express no such opinion. Our audit included performing procedures to assess the risks of material misstatement of the consolidated financial statements, whether due to error or fraud, and performing procedures that respond to those risks. Such procedures included examining, on a test basis, evidence regarding the amounts and disclosures in the consolidated financial statements. Our audit also included evaluating the accounting principles used and significant estimates made by management, as well as evaluating the overall presentation of the consolidated financial statements. We believe that our audit provides a reasonable basis for our opinion. | /s/Zhen Hui Certified Public Accountants | | | | | We have served as the Company’s auditor since 2018. | | Zhen Hui Certified Public Accountants | |
Hong Kong, April 15, 2019 SINO AGRO FOOD, INC. CONSOLIDATED BALANCE SHEETS | | | Note | | | 2018 | | | 2017 | | | | | | | | | | | | | | ASSETS | | | | | | | | | | | | | | Current assets | | | | | | | | | | | | | | Cash and cash equivalents | | | 7 | | | $ | 4,950,799 | | | $ | 560,043 | | | Inventories | | | 8 | | | | 54,582,241 | | | | 52,628,947 | | | Costs and estimated earnings in excess of billings on uncompleted contracts | | | 20 | | | | 250,828 | | | | 1,249,187 | | | Deposits and prepayments | | | 9 | | | | 52,241,190 | | | | 70,459,650 | | | Accounts receivable, net of allowance for doubtful accounts | | | 10 | | | | 101,652,131 | | | | 82,971,418 | | | Other receivables | | | 11 | | | | 28,307,526 | | | | 20,680,478 | | | Total current assets | | | | | | | 241,984,715 | | | | 228,549,723 | | | Non-current assets | | | | | | | | | | | | | | Plant and equipment, net of accumulated depreciation | | | 12 | | | | 230,645,659 | | | | 246,857,797 | | | Construction in progress | | | 13 | | | | 12,515,527 | | | | 6,178,308 | | | Land use rights, net of accumulated amortization | | | 14 | | | | 53,814,281 | | | | 54,838,031 | | | Total non-current assets | | | | | | | 296,975,467 | | | | 307,874,136 | | | Other assets | | | | | | | | | | | | | | Goodwill | | | 15 | | | | 724,940 | | | | 724,940 | | | Proprietary technologies, net of accumulated amortization | | | 16 | | | | 8,937,071 | | | | 9,588,605 | | | Interests in unconsolidated investees | | | 17 | | | | 207,074,626 | | | | 192,290,541 | | | Temporary deposits paid to entities for investments in Sino joint venture companies | | | 18 | | | | 34,905,960 | | | | 34,917,222 | | | Total other assets | | | | | | | 251,642,597 | | | | 237,521,308 | | | | | | | | | | | | | | | | | Total assets | | | | | | $ | 790,602,779 | | | $ | 773,945,167 | | | | | | | | | | | | | | | | | LIABILITIES AND STOCKHOLDERS’ EQUITY | | | | | | | | | | | | | | | | | | | | | | | | | | | | Current liabilities | | | | | | | | | | | | | | Accounts payable and accrued expenses | | | | | | $ | 8,280,358 | | | $ | 4,243,496 | | | Billings in excess of costs and estimated earnings on uncompleted contracts | | | 20 | | | | 5,348,293 | | | | 5,740,065 | | | Due to a director | | | | | | | 2,046,499 | | | | 107,074 | | | Other payables | | | 21 | | | | 42,523,811 | | | | 40,593,482 | | | Borrowings - Short term bank loans | | | 22 | | | | 4,589,828 | | | | 4,667,890 | | | Derivative liability | | | 23 | | | | 2,100 | | | | 2,100 | | | Convertible note payable | | | 23 | | | | 3,894,978 | | | | 3,894,978 | | | Income tax payable | | | | | | | - | | | | 377 | | | | | | | | | | 66,685,867 | | | | 59,249,462 | | | | | | | | | | | | | | | | | Non-current liabilities | | | | | | | | | | | | | | Other payables | | | 21 | | | | 7,792,774 | | | | 11,089,779 | | | Borrowings - Long term debts and bank loan | | | 22 | | | | 5,536,938 | | | | 6,045,302 | | | | | | | | | | 13,329,712 | | | | 17,135,081 | | | | | | | | | | | | | | | | | Commitments and contingencies | | | 27 | | | | - | | | | - | | | | | | | | | | | | | | | | | Stockholders’ equity | | | | | | | | | | | | | | Common stock: $0.001 par value (50,000,000 shares authorized, 49,866,174 and 29,362,875 shares issued and outstanding as of December 31, 2018 and 2017, respectively) | | | 24 | | | | 49,866 | | | | 29,363 | | | Additional paid - in capital | | | | | | | 181,501,056 | | | | 169,743,640 | | | Retained earnings | | | | | | | 458,811,844 | | | | 441,488,507 | | | Accumulated other comprehensive income | | | | | | | (10,415,786 | ) | | | 2,346,174 | | | Treasury stock | | | | | | | (1,250,000 | ) | | | (1,250,000 | ) | | Total Sino Agro Food, Inc. and subsidiaries stockholders’ equity | | | | | | | 628,696,980 | | | | 612,357,684 | | | Non - controlling interest | | | | | | | 81,890,220 | | | | 85,202,940 | | | Total stockholders’ equity | | | | | | | 710,587,200 | | | | 697,560,624 | | | Total liabilities and stockholders’ equity | | | | | | $ | 790,602,779 | | | $ | 773,945,167 | |
The accompanying notes are an integral part of these consolidated financial statements. SINO AGRO FOOD, INC. CONSOLIDATED STATEMENTS OF INCOME AND OTHER COMPREHENSIVE INCOME | | | Note | | | 2018 | | | 2017 | | | | | | | | | | | | | | Revenue | | | | | | | | | | | | | | - Sale of goods | | | | | | $ | 130,543,170 | | | $ | 181,183,609 | | | - Consulting and service income from development contracts | | | | | | | 11,127,393 | | | | 16,983,330 | | | - Commission income | | | | | | | - | | | | - | | | | | | | | | | 141,670,563 | | | | 198,166,939 | | | Cost of goods sold | | | | | | | (110,967,348 | ) | | | (164,974,247 | ) | | Cost of services | | | | | | | (9,051,408 | ) | | | (13,566,203 | ) | | Gross profit | | | | | | | 21,651,807 | | | | 19,626,489 | | | | | | | | | | | | | | | | | General and administrative expenses | | | | | | | (15,595,032 | ) | | | (19,780,290 | ) | | Net income/(loss) from operations | | | | | | | 6,056,775 | | | | (153,801 | ) | | | | | | | | | | | | | | | | Other income / (expenses) | | | | | | | | | | | | | | Government grant | | | | | | | 649,095 | | | | 2,539,989 | | | | | | | | | | | | | | | | | Other income | | | | | | | 56,672 | | | | 100,218 | | | | | | | | | | | | | | | | | Change in fair value of derivative liability | | | | | | | - | | | | 209,219 | | | | | | | | | | | | | | | | | Loss on restructuring | | | | | | | - | | | | (6,225,204 | ) | | | | | | | | | | | | | | | | Bad debts written off | | | | | | | - | | | | (14,394,402 | ) | | | | | | | | | | | | | | | | Impairment on interests in unconsolidated investees | | | | | | | - | | | | (153,046 | ) | | | | | | | | | | | | | | | | Non-operating expenses | | | | | | | (4,609,253 | ) | | | (10,717,693 | ) | | | | | | | | | | | | | | | | Net loss from disposal of variable interest entity - QZH | | | 6 | | | | - | | | | (9,365,643 | ) | | | | | | | | | | | | | | | | Share of income from unconsolidated equity investee | | | | | | | 14,251,264 | | | | 12,010,051 | | | | | | | | | | | | | | | | | Interest expense | | | | | | | (600,519 | ) | | | (3,952,631 | ) | | | | | | | | | | | | | | | | | | | | | | | 9,747,259 | | | | (29,949,142 | ) | | | | | | | | | | | | | | | | Net income/(loss) before income taxes | | | | | | | 15,804,034 | | | | (30,102,943 | ) | | | | | | | | | | | | | | | | Provision for income taxes | | | 5 | | | | - | | | | (1,684 | ) | | | | | | | | | | | | | | | | Net income/(loss) | | | | | | | 15,804,034 | | | | (30,104,627 | ) | | Less: Net loss attributable to non - controlling interest | | | | | | | 1,519,303 | | | | 17,000,482 | | | Net income/(loss) attributable to Sino Agro Food, Inc. and subsidiaries | | | | | | | 17,323,337 | | | | (13,104,145 | ) | | | | | | | | | | | | | | | | Other comprehensive income/(loss) - Foreign currency translation income/(loss) | | | | | | | (14,555,377 | ) | | | 12,781,924 | | | Comprehensive income/(loss) | | | | | | | 2,767,960 | | | | (322,221 | ) | | Less: other comprehensive loss/(income) attributable to non - controlling interest | | | | | | | 1,793,417 | | | | (5,602,048 | ) | | Comprehensive income/ (loss) attributable to Sino Agro Food, Inc. and subsidiaries | | | | | | | 4,561,377 | | | | (5,924,269 | ) | | | | | | | | | | | | | | | | Earnings per share attributable to Sino Agro Food, Inc. and subsidiaries common stockholders: | | | | | | | | | | | | | | Basic | | | 29 | | | $ | 0.46 | | | $ | (0.53 | ) | | Diluted | | | 29 | | | $ | 0.46 | | | $ | (0.53 | ) | | | | | | | | | | | | | | | | Weighted average number of shares outstanding: | | | | | | | | | | | | | | Basic | | | 29 | | | | 37,336,164 | | | | 24,711,015 | | | Diluted | | | 29 | | | | 37,336,164 | | | | 24,711,015 | |
The accompanying notes are an integral part of these consolidated financial statements. SINO AGRO FOOD, INC. CONSOLIDATED STATEMENTS OF SHAREHOLDERS’ EQUITY | | | | | | | | | Series B Convertible | | | Series F Non Convertible | | | | | Common stock | | | Series A Preferred stock | | | Preferred stock | | | Preferred stock | | | | | Par value $0.001 | | | Par value $0.001 | | | Par value $0.001 | | | Par value $0.001 | | | | | Number | | | Nominal | | | Number | | | Nominal | | | Number | | | Nominal | | | Number | | | Nominal | | | | | of shares | | | Amount | | | of shares | | | Amount | | | of shares | | | Amount | | | of shares | | | Amount | | | | | | | | $ | | | | | | $ | | | | | | $ | | | | | | $ | | | Balance as of January 1, 2017 | | | 22,726,859 | | | | 22,727 | | | | 100 | | | | - | | | | - | | | | - | | | | - | | | | - | | | Issue of common stock | | | | | | | | | | | | | | | | | | | | | | | | | | | | | | | | | | - Employees’ and professional compensation | | | 1,668,302 | | | | 1,668 | | | | - | | | | - | | | | - | | | | - | | | | - | | | | - | | | - As security for finance raised | | | 4,967,714 | | | | 4,968 | | | | - | | | | - | | | | - | | | | - | | | | - | | | | - | | | Net income for the year | | | | | | | | | | | | | | | | | | | | | | | | | | | | | | | | | | Deemed disposal of subsidiaries | | | - | | | | - | | | | - | | | | - | | | | - | | | | - | | | | - | | | | - | | | Foreign currency translation difference | | | - | | | | - | | | | - | | | | - | | | | - | | | | - | | | | - | | | | - | | | Balance as of December 31, 2017 | | | 29,362,875 | | | | 29,363 | | | | 100 | | | | - | | | | - | | | | - | | | | - | | | | - | | | Issue of common stock | | | | | | | | | | | | | | | | | | | | | | | | | | | | | | | | | | - Employees’ and professional compensation | | | 16,567,860 | | | | 16,568 | | | | - | | | | - | | | | - | | | | - | | | | - | | | | - | | | - As security for finance raised | | | 3,935,439 | | | | 3,935 | | | | - | | | | - | | | | - | | | | - | | | | - | | | | - | | | Net income for the year | | | | | | | | | | | | | | | | | | | | | | | | | | | | | | | - | | | Disposal of a variable interest entity - QZH | | | - | | | | - | | | | - | | | | - | | | | - | | | | - | | | | - | | | | - | | | Capital injection by non-controlling interest | | | - | | | | - | | | | - | | | | - | | | | - | | | | - | | | | - | | | | - | | | Foreign currency translation difference | | | - | | | | - | | | | - | | | | - | | | | - | | | | - | | | | - | | | | - | | | Balance as of December 31, 2018 | | | 49,866,174 | | | | 49,866 | | | | 100 | | | | - | | | | - | | | | - | | | | - | | | | - | |
SINO AGRO FOOD, INC. CONSOLIDATED STATEMENTS OF SHAREHOLDERS’ EQUITY The accompanying notes are an integral part of these consolidated financial statements. | | | | | | | | | | | | Accumulated | | | | | | | | | | | Treasury stock | | | Additional | | | | | | other | | | Non - | | | | | | | | Number | | | | | | paid - in | | | Retained | | | comprehensive | | | controlling | | | | | | | | of shares | | | Amount | | | capital | | | earnings | | | income | | | interest | | | Total | | | | | | | | $ | | | $ | | | $ | | | $ | | | $ | | | $ | | | Balance as of January 1, 2017 | | | (101,010 | ) | | | (1,250,000 | ) | | | 155,741,280 | | | | 454,592,652 | | | | (4,335,355 | ) | | | 99,166,749 | | | | 703,938,053 | | | Issue of common stock | | | | | | | | | | | | | | | | | | | | | | | | | | | | | | - Employees’ and professional compensation | | | - | | | | - | | | | 1,953,484 | | | | - | | | | - | | | | - | | | | 1,955,152 | | | - As security for finance raised | | | - | | | | - | | | | 12,048,876 | | | | - | | | | - | | | | - | | | | 12,053,844 | | | Net loss for the year | | | | | | | | | | | | | | | (13,104,145 | ) | | | | | | | (17,000,482 | ) | | | (30,104,627 | ) | | Disposal of a variable interest entity-QZH | | | | | | | | | | | | | | | | | | | (498,347 | ) | | | (5,082,410 | ) | | | (5,580,757 | ) | | Capital injection by non-controlling interest | | | - | | | | - | | | | - | | | | - | | | | - | | | | 2,517,035 | | | | 2,517,035 | | | Foreign currency translation difference | | | - | | | | - | | | | - | | | | - | | | | 7,179,876 | | | | 5,602,048 | | | | 12,781,924 | | | Balance as of December 31, 2017 | | | (101,010 | ) | | | (1,250,000 | ) | | | 169,743,640 | | | | 441,488,507 | | | | 2,346,174 | | | | 85,202,940 | | | | 697,560,624 | | | Issue of common stock | | | | | | | | | | | | | | | | | | | | | | | | | | | | | | - Employees’ compensation | | | - | | | | - | | | | 10,283,322 | | | | - | | | | - | | | | - | | | | 10,299,890 | | | - As security for finance raised | | | - | | | | - | | | | 1,474,094 | | | | - | | | | - | | | | - | | | | 1,478,029 | | | Net income for the year | | | | | | | | | | | | | | | 17,323,337 | | | | | | | | (1,519,303 | ) | | | 15,804,034 | | | Foreign currency translation difference | | | - | | | | - | | | | - | | | | - | | | | (12,761,960 | ) | | | (1,793,417 | ) | | | (14,555,377 | ) | | Balance as of December 31, 2018 | | | (101,010 | ) | | | (1,250,000 | ) | | | 181,501,056 | | | | 458,811,844 | | | | (10,415,786 | ) | | | 81,890,220 | | | | 710,587,200 | |
SINO AGRO FOOD, INC. CONSOLIDATED STATEMENTS OF CASH FLOWS | | | 2018 | | | 2017 | | | | | | | | | | | Cash flows from operating activities | | | | | | | | | | Net income (loss) for the year | | $ | 15,804,034 | | | $ | (30,104,627 | ) | | Adjustments to reconcile net income for the year to net cash from operations: | | | | | | | | | | Depreciation | | | 13,080,991 | | | | 8,350,811 | | | Amortization | | | 2,270,012 | | | | 2,198,080 | | | Gain on deemed disposal of subsidiaries | | | - | | | | - | | | Loss on disposal from a variable interest entity | | | - | | | | 9,365,643 | | | Share based compensation costs | | | 2,308,869 | | | | 4,184,638 | | | Other amortized cost arising from convertible notes and others | | | - | | | | 106,297 | | | Impairment on long outstanding receivables and prepayments | | | - | | | | 2,341,746 | | | Impairment on interests in unconsolidated investees | | | - | | | | 153,046 | | | Change in fair value of a derivative liability | | | - | | | | (209,219 | ) | | Bad debts written off | | | - | | | | 14,394,402 | | | Gain on disposal | | | - | | | | (3,033 | ) | | Loss on restructuring | | | - | | | | 6,225,204 | | | Share of unconsolidated equity investee | | | (14,251,264 | ) | | | (12,010,051 | ) | | Changes in operating assets and liabilities: | | | | | | | | | | Decrease in inventories | | | (1,953,294 | ) | | | 5,395,794 | | | (Increase) decrease in cost and estimated earnings in excess of billings on uncompleted contacts | | | 998,359 | | | | (508,203 | ) | | Increase in deposits and prepaid expenses | | | 15,429,559 | | | | (15,289,681 | ) | | (Decrease) increase in due to a director | | | 1,939,425 | | | | (1,963,316 | ) | | Increase/(decrease) in accounts payable and accrued expenses | | | 5,203,787 | | | | 2,594,611 | | | Increase in other payables | | | 6,577,152 | | | | 19,025,599 | | | Decrease (increase) in accounts receivable | | | (18,680,713 | ) | | | 9,142,535 | | | (Decrease) increase in tax payable | | | - | | | | (753 | ) | | Increase (decrease) in billings in excess of costs and estimated earnings on uncompleted contracts | | | (391,772 | ) | | | 3,109,313 | | | Decrease in other receivables | | | (7,627,048 | ) | | | 35,877,232 | | | Increase in interests in unconsolidated investees | | | (532,821 | ) | | | (38,422,483 | ) | | Net cash provided by operating activities | | | 20,175,276 | | | | 23,953,585 | | | Cash flows from investing activities | | | | | | | | | | Acquisition of plant, property and equipment | | | (7,072,692 | ) | | | (22,809,544 | ) | | Payment for construction in progress | | | (6,755,327 | ) | | | (10,772,885 | ) | | Proceed from disposal of a long term investee | | | - | | | | 740,521 | | | Proceed from disposal of plant, property and equipment | | | - | | | | 124,536 | | | Net cash used in investing activities | | | (13,828,019 | ) | | | (32,717,372 | ) | | Cash flows from financing activities | | | | | | | | | | -Proceeds from convertible bond payable | | | - | | | | 4,000,000 | | | Capital contribution from non-controlling interest | | | - | | | | 2,517,035 | | | Proceeds from short term debts | | | 4,533,777 | | | | 5,924,171 | | | Long term debts repaid | | | (75,563 | ) | | | - | | | Short term bank loan repaid | | | (4,533,777 | ) | | | (2,962,085 | ) | | Net cash provided by financing activities | | | (75,563 | ) | | | 9,479,121 | | | Effects on exchange rate changes on cash | | | (1,880,938 | ) | | | (2,731,349 | ) | | | | | | | | | | | | (Decrease)/increase in cash and cash equivalents | | | 4,390,756 | | | | (2,016,015 | ) | | Cash and cash equivalents, beginning of year | | | 560,043 | | | | 2,576,058 | | | Cash and cash equivalents, end of year | | $ | 4,950,799 | | | $ | 560,043 | | | | | | | | | | | | | Supplementary disclosures of cash flow information: | | | | | | | | | | Cash paid for interest | | $ | 561,176 | | | $ | 1,395,143 | | | Cash paid for income taxes | | $ | - | | | $ | 2,437 | | | Non - cash transactions | | | | | | | | | | Common stock issued as security for finance raised | | $ | 1,478,029 | | | | 12,053,844 | | | Common stock issued for services and compensation | | $ | 10,299,890 | | | $ | 1,955,152 | | | Transfer construction in progress to property and equipment | | $ | - | | | $ | 36,411,070 | | | Transfer deposits and prepaid expenses to property and equipment | | $ | - | | | $ | 107,040 | | | Convertible bond adjustments | | $ | - | | | $ | 105,022 | |
The accompanying notes are an integral part of these consolidated financial statements. SINO AGRO FOOD, INC. NOTES TO CONSOLIDATED FINANCIAL STATEMENTS Sino Agro Food, Inc. (the “Company” or “SIAF”) (formerly known as Volcanic Gold, Inc. and A Power Agro Agriculture Development, Inc.) was incorporated on October 1, 1974 in the State of Nevada, United States of America. The Company was engaged in the mining and exploration business but ceased its mining and exploring business on October 14, 2005. On August 24, 2007, the Company entered into a Merger and Acquisition Agreement with Capital Award Inc., a Belize corporation (“CA”) and its subsidiaries Capital Stage Inc. (“CS”) and Capital Hero Inc. (“CH”). Effective the same date, CA completed a reverse merger transaction with SIAF. SIAF acquired all the outstanding common stock of CA from Capital Adventure, a shareholder of CA, for 3,232,323 shares of the Company’s common stock. On August 24, 2007 the Company changed its name from Volcanic Gold, Inc. to A Power Agro Agriculture Development, Inc. On December 8, 2007, the Company changed its name to Sino Agro Food, Inc. On September 5, 2007, the Company acquired three existing businesses in the People’s Republic of China (the “P.R.C.”): | (a) | Hang Yu Tai Investment Limited (“HYT”), a company incorporated in Macau, the owner of 78% equity interest in ZhongXingNongMu Ltd (“ZX”), a company incorporated in the P.R.C.; |
| (b) | Tri-Way Industries Limited (“TRW”), a company incorporated in Hong Kong; and |
| (c) | Macau Eiji Company Limited (“MEIJI”), a company incorporated in Macau, the owner of 75% equity interest in Enping City Juntang Town Hang Sing Tai Agriculture Co. Ltd. (“HST”), a P.R.C. corporate Sino-Foreign joint venture. HST was dissolved in 2010. |
On November 27, 2007, MEIJI and HST established a corporate Sino - Foreign joint venture, Jiang Men City Heng Sheng Tai Agriculture Development Co. Ltd. (“JHST”), a company incorporated in the P.R.C. with MEIJI owning a 75% interest and HST owning a 25% interest. On November 26, 2008, SIAF established Pretty Mountain Holdings Limited (“PMH”), a company incorporated in Hong Kong with an 80% equity interest. On May 25, 2009, PMH formed a corporate Sino-Foreign joint venture, Qinghai Sanjiang A Power Agriculture Co. Ltd. (“SJAP”), incorporated in the P.R.C., of which PMH owns a 45% equity interest. At the time, the remaining 55% equity interest in SJAP was owned by the following entities: | · | Qinghai Province Sanjiang Group Company Limited (English translation) (“Qinghai Sanjiang”), a company incorporated in the P.R.C with major business activities in the agriculture industry; and |
| · | Guangzhou City Garwor Company Limited (English translation) (“Garwor”), a company incorporated in the P.R.C., specializing in sales and marketing. |
SJAP is engaged in the business of manufacturing bio-organic fertilizer, livestock feed and development of other agriculture projects in the County of Huangyuan, in the vicinity of the Xining City, Qinghai Province, P.R.C. In September 2009, the Company carried out an internal reorganization of its corporate structure and business, and formed a 100% owned subsidiary, A Power Agro Agriculture Development (Macau) Limited (“APWAM”), which was formed in Macau. APWAM then acquired PMH’s 45% equity interest in SJAP. By virtue of the acquisition, APWAM assumed all obligations and liabilities of PMH under the Sino Foreign Joint Venture Agreement. On May 7, 2010, Qinghai Sanjiang sold and transferred its equity interest in SJAP to Garwor. The State Administration for Industry and Commerce of Xining City Government of the PRC approved the sale and transfer. As a result, APWAM owned 45% of SJAP and Garwor owned the remaining 55%. On September 9, 2010, an application was submitted by the Company to the Companies Registry of Hong Kong for deregistration of PMH under Section 291AA of the Hong Kong Companies Ordinance. On January 28, 2011, PMH was dissolved On March 23, 2017, Qinghai Quanwang Investment Management Company Limited (“Quanwang”) acquired 8.3% equity interest in SJAP for total cash consideration of $459,137. As of December 31, 2018, APWAM owned 41.25% of SJAP, Garwor owned 50.45% and Quanwang owned the remaining 8.3%. SINO AGRO FOOD, INC. NOTES TO CONSOLIDATED FINANCIAL STATEMENTS | 1. | CORPORATE INFORMATION (CONTINUED) |
On February 15, 2011 and March 29, 2011, the Company entered into an agreement and a memorandum of understanding (an “MOU”), respectively, to sell 100% equity interest in HYT group (including HYT and ZX) to Mr. Xin Ming Sun, a director of ZhongXingNong Nu Co., Ltd for $45,000,000, with effective date of January 1, 2011. On February 28, 2011, the Company applied to form Enping City Bi Tao A Power Prawn Culture Development Co Limited (“EBAPCD”) , and the Company would indirectly own a 25% equity interest in future Sino Joint Venture Company (pending approval). On February 28, 2011, TRW applied to form a corporate joint venture, Enping City Bi Tao A Power Fishery Development Co., Limited (“EBAPFD”), incorporated in the PRC. TRW owned a 25% equity interest in EBAPFD. On November 17, 2011, TRW formed Jiang Men City A Power Fishery Development Co., Limited (“JFD”) in which it acquired a 25% equity interest, while withdrawing its 25% equity interest in EBAPFD. As of December 31, 2011, the Company had invested for total cash consideration of $1,258,607 in JFD. JFD operates an indoor fish farm. On January 1, 2012, the Company acquired an additional 25% equity interest in JFD for total cash consideration of $1,662,365. As of January 1, 2012, the Company had consolidated the assets and operations of JFD. On April 1, 2012, the Company acquired an additional 25% equity interest in JFD for the total cash consideration of $1,702,580. These acquisitions were at our option according the terms of the original development agreement. The Company owned a 75% equity interest in JFD, representing majority of voting rights and controls its board of directors. On August 15, 2016, the acquisition agreement was executed by TRW for acquiring the other 25% equity in JFD which was a Sino Foreign Joint Venture Co. that TRW had 100% equity interest with effect on October 5, 2016. Upon the acquisitions of 3 additional prawn farms assets at fair value of $238.32 million from respective third parties and the master technology license at fair value of $30 million from Capital Award, Inc. by JFD, and the consideration of the above acquisitions were planned to be settled by the new issue shares of 99,990,000 TRW shares at $3.41 amounting to $340.53 million on or before March 31, 2017. As a result, SIAF’s equity interest in TRW was diluted from 100% to 23.89% with effective on October 5, 2016. The above transactions leaded the Company loss of control over TRW group, the Company’s investments in TRW and JFD were reclassified from a subsidiary to investments in unconsolidated equity investees as of October 5, 2016. The dilution of the Company’s investments in TRW group constituted a deemed disposal of the subsidiaries. The deemed gain on disposal of $56,947,005 was recorded in net income from discontinued operations of the consolidated statements of income and other comprehensive income of the Company for the year ended 31 December 2016. On October 1, 2016, the Company took up all assets and all liabilities of TRW and JFD except plant and equipment - fish farm. The Company converted the amount due from unconsolidated equity investee into equity interest during the fourth quarter of 2017, which resulted in equity interest in TRW from 23.89% to 36.60% On April 15, 2011, MEIJI applied to form Enping City A Power Cattle Farm Co., Limited (“ECF”), all of which the Company would indirectly own a 25% equity interest on November 17, 2011. On January 1, 2012, the Company had invested $1,076,489 in ECF and the amount was settled in contra against accounts receivable due from ECF. On September 17, 2012 MEIJI formed Jiang Men City Hang Mei Cattle Farm Development Co., Limited (“JHMC”) and acquired additional 50% equity interest for the total cash consideration of $2,944,176 on September 30, 2012 while withdrawing its 25% equity interest in ECF. This acquisition was at our option according to the terms of the original development agreement. The Company presently owns 75% equity interest in JHMC, representing majority of voting right and controls its board of directors. As of September 30, 2012, the Company had consolidated the assets and operations of JHMC. As of December 31, 2017, MEIJI total investment in JHMC was $4,385,101. On July 18, 2011, the Company formed Hunan Shenghua A Power Agriculture Co., Limited (“HSA”), in which the Company owns a 26% equity interest, and SJAP owns a 50% equity interest with the Chinese partner owning the remaining 24%. On April 5, 2017, SJAP transfer all of its equity interest to MEIJI. As of December 31, 2017, MEIJI total investment in HSA was $1,651,774. On November 12, 2013, the Company acquired a shell company, Goldcup9203 AB, incorporated in Sweden, in which the Company owns a 100% equity interest. Goldcup 9203 AB changed its name to Sino Agro Food Sweden AB (publ) (“SAFS”). During the year ended December 31, 2016, SAFS changed to a private company. As of December 31, 2017, the Company invested $77,664 in SAFS. SJAP formed Qinghai Zhong He Meat Products Co., Limited (“QZH”) , with SJAP would owning 100% equity interest. SJAP formed Qinghai Zhong He Meat Products Co., Limited (“QZH”), with SJAP would owning 100% equity interest. On October 25, 2015, both QZH and new stockholder, Qinghai Quanwang Investment Management Co., Ltd (“QQI”) contributed additional capital of $4,157,682 and $769,941, respectively. As a result, SJAP decreased its equity interest from 100% to 85% and QQI owned a 14% equity interest. In addition, according to investment agreement between QZH and QQI, (i) QQI only enjoy interest 6% annually on its capital contribution and did not enjoy profit distribution; (ii) investment period was 3 years only, and (iii) SJAP shared 100% on profit or loss after deduction 6% interest to QQI and enjoyed 100% voting rights of QZH’s board and stockholders meetings. SJAP disposed its 85% equity interest in QZH for RMB2 (equivalent to $0) for cash and completed on December 30, 2017. As a result, QZH was derecognized as variable interest entity of the company. The Company’s principal executive office is located at Room 3801, Block A, China Shine Plaza, No. 9 Lin He Xi Road, Tianhe District, Guangzhou City, Guangdong Province, P.R.C., 510610. The nature of the operations and principal activities of the Company and its subsidiaries are described in Note 2.2. SINO AGRO FOOD, INC. NOTES TO CONSOLIDATED FINANCIAL STATEMENTS | 2. | SUMMARY OF SIGNIFICANT ACCOUNTING POLICIES |
The Company has adopted December 31 as its fiscal year end. | Name of subsidiaries | | Place of incorporation | | Percentage of interest* | | Principal activities | | | | | | | | | Capital Award Inc. (“CA”) | | Belize | | 100% (2017: 100%) directly | | Fishery development and holder of A-Power Technology master license. | | | | | | | | | Capital Stage Inc. (“CS”) | | Belize | | 100% (2017: 100%) indirectly | | Dormant | | | | | | | | | Capital Hero Inc. (“CH”) | | Belize | | 100% (2017: 100%) indirectly | | Dormant | | | | | | | | | Sino Agro Food Sweden AB (“SAFS”) | | Sweden | | 100% (2017: 100%) directly | | Dormant | | | | | | | | | Macau Eiji Company Limited (“MEIJI”) | | Macau, P.R.C. | | 100% (2017: 100%) directly | | Investment holding, cattle farm development, beef cattle and beef trading | | A Power Agro Agriculture Development (Macau) Limited (“APWAM”) | | Macau, P.R.C. | | 100% (2017: 100%) directly | | Investment holding | | | | | | | | | Jiang Men City Heng Sheng Tai Agriculture Development Co. Ltd (“JHST”) | | P.R.C. | | 75% (2017: 75%) Indirectly | | HylocereusUndatus Plantation (“HU Plantation”). | | | | | | | | | Jiang Men City Hang Mei Cattle Farm Development Co., Limited (“JHMC”) | | P.R.C. | | 75% (2017:75%) indirectly | | Beef cattle cultivation | | | | | | | | | Hunan Shenghua A Power Agriculture Co., Limited (“HSA”) | | P.R.C. | | 76% (2017:76%) indirectly | | Manufacturing of organic fertilizer, livestock feed, and beef cattle and sheep cultivation, and plantation of crops and pastures | | | | | | | | | Name of variable interest entity (Note 21) | | Place of incorporation | | Percentage of interest | | Principal activities | | | | | | | | | Qinghai Sanjiang A Power Agriculture Co., Ltd (“SJAP”) | | P.R.C. | | 41.25% (2017: 41.25%) indirectly | | Manufacturing of organic fertilizer, livestock feed, and beef cattle |
*This represents stockholding percentage of total equity. SINO AGRO FOOD, INC. NOTES TO CONSOLIDATED FINANCIAL STATEMENTS | 2. | SUMMARY OF SIGNIFICANT ACCOUNTING POLICIES (CONTINUED) |
The consolidated financial statements are prepared in accordance with generally accepted accounting principles in the United States of America (“US GAAP”). | 2.4 | BASIS OF CONSOLIDATION |
The consolidated financial statements include the financial statements of the Company, its subsidiaries CA, CS, CH, MEIJI, JHST, JHMC, HSA, APWAM, SAFS and its variable interest entity SJAP. All material inter-company transactions and balances have been eliminated in consolidation. SIAF, CA, CS, CH, MEIJI, JHST, JHMC, HSA, APWAM, SAFS, and SJAP are hereafter referred to as (the “Company”). The Company adopted the accounting pronouncements relating to business combination (primarily contained in ASC Topic 805 “Business Combinations”), including assets acquired and liabilities assumed on arising from contingencies. These pronouncements established principles and requirement for how the acquirer of a business recognizes and measures in its financial statements the identifiable assets acquired, the liabilities assumed, and any non-controlling interest in the acquisition as well as provides guidance for recognizing and measuring the goodwill acquired in the business combination and determines what information to disclose to enable users of the financial statements to evaluate the nature and financial effects of the business combination. In addition, these pronouncements eliminate the distinction between contractual and non-contractual contingencies, including the initial recognition and measurement criteria and require an acquirer to develop a systematic and rational basis for subsequently measuring and accounting for acquired contingencies depending on their nature. The Company’s adoption of these pronouncements will have an impact on the manner in which it accounts for any future acquisitions. | 2.6 | NON - CONTROLLING INTEREST IN CONSOLIDATED FINANCIAL STATEMENTS |
The Company adopted the accounting pronouncement on non-controlling interests in consolidated financial statements, which establishes accounting and reporting standards for the non-controlling interest in a subsidiary and for the deconsolidation of a subsidiary. This guidance is primarily contained in ASC Topic “Consolidation.” It clarifies that a non-controlling interest in a subsidiary is an ownership interest in the consolidated financial statements. The adoption of this standard has not had material impact on the Company’s consolidated financial statements. The preparation of consolidated financial statements in conformity with US GAAP requires management to make assumptions and estimates that affect the reported amounts of assets and liabilities and disclosure of contingent assets and liabilities at the dates of the consolidated financial statements and the reported amounts of revenues and expenses during the reporting periods covered thereby. Actual results could differ from these estimates. Judgments and estimates of uncertainties are required in applying the Company’s accounting policies in certain areas. The following are some of the areas requiring significant judgments and estimates: determinations of the useful lives of assets, estimates of allowances for doubtful accounts, cash flow and valuation assumptions in performing asset impairment tests of long-lived assets, estimates of the realization of deferred tax assets and inventory reserves. SINO AGRO FOOD, INC. NOTES TO CONSOLIDATED FINANCIAL STATEMENTS | 2. | SUMMARY OF SIGNIFICANT ACCOUNTING POLICIES (CONTINUED) |
In May 2014, the FASB issuedAccounting Standard Update 2014-09, Revenue from Contracts with Customers (Topic 606), which replaces numerous requirements in U.S. GAAP, including industry specific requirements, and provides a single revenue recognition model for recognizing revenue from contracts with customers. The Company adopted this standard effective January 1, 2018. The core principle of the new standard is that a company should recognize revenue to depict the transfer of promised goods or services to customers in an amount that reflects the consideration to which the company expects to be entitled in exchange for those goods or services. This requires companies to identify contractual performance obligations and determine whether revenue should be recognized at a point in time or over time, based on when control of goods and services transfers to a customer. The Company’s revenues generated mainly from trading of frozen food and sales of agricultural products are recognized at a point in time. The ASU requires the use of a new five-step model to recognize revenue from customer contracts. The five-step model requires that the Company (i) identify the contract with the customer, (ii) identify the performance obligations in the contract, (iii) determine the transaction price, including variable consideration to the extent that it is probable that a significant future reversal will not occur, (iv) allocate the transaction price to the respective performance obligations in the contract, and (v) recognize revenue when (or as) the Company satisfies the performance obligation. The application of the five-step model to the revenue streams compared to the prior guidance did not result in significant changes in the way the Company records its revenues. Multiple-Element Arrangements To qualify as a separate unit of accounting under ASC 605-25 “Multiple Element Arrangements”, the delivered item must have value to the customer on a standalone basis. The significant deliverables under the Company’s multiple-element arrangements are consulting and service under development contract, commission and management service. Revenues from the Company’s consulting and services under development contracts are performed under fixed-price contracts. Revenues under long-term contracts are accounted for under the percentage-of-completion method of accounting in accordance with the Financial Accounting Standards Board (“FASB”) Accounting Standards Codification (“ASC”) Topic 605,Revenue Recognition(“ASC 605”). Under the percentage-of-completion method, the Company estimates profit as the difference between total estimated revenue and total estimated cost of a contract and recognize that profit over the contract term. The percentage of costs incurred determines the amount of revenue to be recognized. Payment terms are generally defined by the installation contract and as a result may not match the timing of the costs incurred by the Company and the related recognition of revenue. Such differences are recorded as either costs or estimated earnings in excess of billings on uncompleted contracts or billings in excess of costs and estimated earnings on uncompleted contracts. The Company determines a customer’s credit worthiness at the time an order is accepted. Sudden and unexpected changes in a customer’s financial condition could put recoverability at risk. The percentage of completion method requires the ability to estimate several factors, including the ability of the customer to meet its obligations under the contract, including the payment of amounts when due. If the Company determines that collectability is not assured, the Company will defer revenue recognition and use methods of accounting for the contract such as the completed contract method until such time as the Company determines that collectability is reasonably assured or through the completion of the project. For fixed-price contracts, the Company uses the ratio of costs incurred to date on the contract to management’s estimate of the contract’s total costs, to determine the percentage of completion on each contract. This method is used as management considers expended costs to be the best available measure of progression of these contracts. Contract costs include all direct material, subcontract and labor costs and those indirect costs related to contract performance, such as supplies, tool repairs and depreciation. The Company accounts for maintenance and repair services under the guidance of ASC 605 as the services provided relate to construction work. Contract costs incurred to date and expected total contract costs are continuously monitored during the term of the contract. Changes in job performance, job conditions, and estimated profitability arising from contract penalty, change orders and final contract settlements may result in revisions to the estimated profit ability during the contract. These changes, which include contracts with estimated costs in excess of estimated revenues, are recognized as contract costs in the period in which the revisions are determined. Profit incentives are included in revenues when their realization is reasonably assured. At the point the Company anticipates a loss on a contract, the Company estimates the ultimate loss through completion and recognizes that loss in the period in which the loss was identified. The Company does not provide warranties to customers on a basis customary to the industry, however, customers can claim warranty directly from product manufacturers for defects in equipment or products. Historically, the Company has experienced no warranty claims. The Company provides various management services to its customers in the P.R.C. based on a negotiated fixed-price contract. The clients usually pay the fees when the services contract is signed and services are rendered. The Company recognizes these services-based revenues from contracts when (i) management services are rendered; (ii) clients recognize the completion of services; and (iii) collectability is reasonably assured. Fees received in advance are recorded as deferred revenue under current liabilities. SINO AGRO FOOD, INC. NOTES TO CONSOLIDATED FINANCIAL STATEMENTS | 2. | SUMMARY OF SIGNIFICANT ACCOUNTING POLICIES (CONTINUED) |
| 2.9 | COST OF GOODS SOLD AND COST OF SERVICES |
Cost of goods sold consists primarily of direct purchase cost of merchandise goods, and related levies. Cost of services consist primarily direct cost and indirect cost incurred to date for development contracts and provision for anticipated losses for development contracts. | 2.10 | SHIPPING AND HANDLING |
Shipping and handling costs related to cost of goods sold are included in general and administrative expenses, which totaled $26,129 and $16,748 for the years ended December 31, 2018 and 2017, respectively. Advertising costs are included in general and administrative expenses, which totaled $1,541,484, and $1,777,383 for the years ended December 31, 2018 and 2017, respectively. | 2.12 | RESEARCH AND DEVELOPMENT EXPENSES |
Research and development expenses are included in general and administrative expenses, which totaled $453,378, and $1,332,938 for the years ended December 31, 2018 and 2017, respectively. | 2.13 | FOREIGN CURRENCY TRANSLATION AND OTHER COMPREHENSIVE INCOME |
The reporting currency of the Company is the U.S. dollars. The functional currency of the Company is the Chinese Renminbi (RMB). For those entities whose functional currency is other than the U.S. dollars, all assets and liabilities are translated into U.S. dollars at the exchange rate on the balance sheet date; shareholders’ equity is translated at historical rates and items in the statements of income and of cash flows are translated at the average rate for the period. Because cash flows are translated based on the average translation rate, amounts related to assets and liabilities reported in the statements of cash flows will not necessarily agree with changes in the corresponding balances in the balance sheets. Translation adjustments resulting from this process are included in accumulated other comprehensive income in the statements of shareholders’ equity. Transaction gains and losses that arise from exchange rate fluctuations on transactions denominated in a currency other than the functional currency are included in the statements of income and comprehensive income, as incurred. Accumulated other comprehensive income in the consolidated statement of shareholders’ equity amounted to $10,415,786 as of December 31, 2018 and $2,346,174 as of December 31, 2017. The balance sheet amounts with the exception of equity as of December 31, 2018 and December 31, 2017 were translated using an exchange rate of RMB 6.86 to $1.00 and RMB 6.53 to $1.00, respectively. The average translation rates applied to the statements of income and other comprehensive income and of cash flows for the years ended December 31, 2018 and 2017 were RMB 6.61 to $1.00 and RMB 6.75 to $1.00, respectively. | 2.14 | CASH AND CASH EQUIVALENTS |
The Company considers all highly liquid securities with original maturities of three months or less when acquired to be cash equivalents. Cash and cash equivalents kept with financial institutions in the P.R.C. are not insured or otherwise protected. Should any of those institutions holding the Company’s cash become insolvent, or should the Company become unable to withdraw funds for any reason, the Company could lose the cash on deposit with that institution. The Company maintains reserves for potential credit losses on accounts receivable. Management reviews the composition of accounts receivable and analyzes historical bad debts, customer concentrations, customer credit worthiness, current economic trends and changes in customer payment patterns to evaluate the adequacy of these reserves. Reserves are recorded primarily on a specific identification basis. The standard credit period for most of the Company’s clients is three months. The collection period over 1 year is classified as long-term accounts receivable. Management evaluates the collectability of the receivables at least quarterly. SINO AGRO FOOD, INC. NOTES TO CONSOLIDATED FINANCIAL STATEMENTS | 2. | SUMMARY OF SIGNIFICANT ACCOUNTING POLICIES (CONTINUED) |
Inventories are valued at the lower of cost (determined on a weighted average basis) and net realizable value. Costs incurred in bringing each product to its location and conditions are accounted for as follows: | (a) | raw materials - purchase cost on a weighted average basis; |
| (b) | manufactured finished goods and work-in-progress - cost of direct materials and labor and a proportion of manufacturing overhead based on normal operation capacity but excluding borrowing costs; and |
| (c) | retail and wholesale merchandise finished goods - purchase cost on a weighted average basis. |
Net realizable value is the estimated selling price in the ordinary course of business, less estimated costs for completion and the estimated costs necessary to make the sale. Plant and equipment are stated at cost less accumulated depreciation and any accumulated impairment losses. Such costs include the cost of replacing parts that are eligible for capitalization when the cost of replacing the parts is incurred. Similarly, when each major inspection is performed, its cost is recognized in the carrying amount of the plant and equipment as a replacement only if it is eligible for capitalization. The assets’ residual values, useful lives and depreciation methods are reviewed, and adjusted if appropriate, at each financial year end. Depreciation is calculated on a straight-line basis over the estimated useful lives of the assets. | Plant and machinery | 5 - 10 years | | Structure and leasehold improvements | 10 - 30 years | | Mature seeds and herbage cultivation | 20 years | | Furniture and equipment | 2.5 - 10 years | | Motor vehicles | 4 - 10 years |
An item of plant and equipment is removed from the accounts upon disposal or when no future economic benefits are expected to arise from the continued use of the asset. Any gain or loss arising on disposal of the asset (calculated as the difference between the net disposal proceeds and the carrying amount of the item) is included in the consolidated statements of income in the period the item is disposed. Goodwill is an asset representing the fair economic benefits arising from other assets acquired in a business combination that are not individually identified or separately recognized. Goodwill is tested for impairment on an annual basis at the end of the Company’s fiscal year, or when impairment indicators arise. The Company uses a fair-value-based approach to test for impairment at the level of each reporting unit. The Company directly acquired MEIJI, which is the holding company of JHST that operates the Hu Plantation. As a result of this acquisition, the Company recorded goodwill in the amount of $724,940. This goodwill represents the fair value of the assets acquired in these acquisitions over the cost of the assets acquired. SINO AGRO FOOD, INC. NOTES TO CONSOLIDATED FINANCIAL STATEMENTS | 2. | SUMMARY OF SIGNIFICANT ACCOUNTING POLICIES (CONTINUED) |
| 2.19 | PROPRIETARY TECHNOLOGIES |
A master license of stock feed manufacturing technology was acquired and the costs of acquisition are capitalized as proprietary technologies when technological feasibility has been established. Cost of acquisition of stock feed manufacturing technology master license is amortized using the straight-line method over its estimated life of 25 years. An aromatic cattle-feeding formula was acquired and the costs of acquisition are capitalized as proprietary technologies when technological feasibility has been established. Cost of acquisition on aromatic cattle-feeding formula is amortized using the straight-line method over its estimated life of 20 years. The cost of sleepy cods breeding technology license is capitalized as proprietary technologies when technological feasibility has been established. Cost of granting sleepy cods breeding technology license is amortized using the straight-line method over its estimated life of 25 years. Bacterial cellulose technology license and related trade mark are capitalized as proprietary technologies when technological feasibility has been established. Cost of license and related trade mark is amortized using the straight-line method over its estimated life of 20 years. The Company has determined that technological feasibility is established at the time a working model of products is completed. Proprietary technologies are intangible assets of finite lives. Management evaluates the recoverability of proprietary technologies on an annual basis at the end of the Company’s fiscal year, or when impairment indicators arise. As required by ASC Topic 350 “Intangible - Goodwill and Other”, the Company uses a fair-value-based approach to test for impairment. | 2.20 | CONSTRUCTION IN PROGRESS |
Construction in progress represents direct costs of construction as well as acquisition and design fees incurred. Capitalization of these costs ceases and the construction in progress is transferred to property and equipment when substantially all the activities necessary to prepare the assets for their intended use are completed. No depreciation is provided until construction is completed and the asset is ready for its intended use. Land use rights represent acquisition of rights to agricultural land from farmers and are amortized on the straight-line basis over their respective lease periods. The lease period of agricultural land is in the range from 10 to 60 years. Land use rights purchase prices were determined in accordance with the P.R.C. Government’s minimum lease payments on agricultural land and mutually agreed to terms between the Company and the vendors. | 2.22 | EQUITY METHOD INVESTMENTS |
Investee entities in which the company can exercise significant influence, but not control, are accounted for under the equity method of accounting. Under the equity method of accounting, the company’s share of the earnings or losses of these companies is included in net income. A loss in value of an investment that is other than a temporary decline is recognized as a charge to operations. Evidence of a loss in value might include, but would not necessarily be limited to absence of an ability to recover the carrying amount of the investment or inability of the investee to sustain an earnings capacity that would justify the carrying amount of the investment. | 2.23 | CORPORATE JOINT VENTURE |
A corporation formed, owned, and operated by two or more businesses as a separate and discrete business or project (venture) for their mutual benefit is considered to be a corporate joint venture. Investee entities, in which the Company can exercise significant influence, but not control, are accounted for under the equity method of accounting. Under the equity method of accounting, the Company’s share of the earnings or losses of these companies is included in net income. A loss in value of an investment that is other than a temporary decline is recognized as a charge to operations. Evidence of a loss in value might include, but would not necessarily be limited to, the absence of an ability to recover the carrying amount of the investment or inability of the investee to sustain an earnings capacity that would justify the carrying amount of the investment. SINO AGRO FOOD, INC. NOTES TO CONSOLIDATED FINANCIAL STATEMENTS | 2. | SUMMARY OF SIGNIFICANT ACCOUNTING POLICIES (CONTINUED) |
| 2.24 | VARIABLE INTEREST ENTITY |
A variable interest entity (“VIE”) is an entity (investee) in which the investor has obtained less than a majority interest, according to the Financial Accounting Standards Board (FASB). A VIE is subject to consolidation if a VIE meets one of the following three criteria as elaborated in ASC Topic 810-10, Consolidation: | (a) | equity-at-risk is not sufficient to support the entity’s activities; |
| (b) | as a group, the equity-at-risk holders cannot control the entity; or |
| (c) | the economics do not coincide with the voting interest. |
If a firm is the primary beneficiary of a VIE, the holdings must be disclosed on the balance sheet. The primary beneficiary is defined as the person or company with the majority of variable interests. A corporation formed, owned, and operated by two or more businesses (ventures) as a separate and discrete business or project (venture) for their mutual benefit is defined as a joint venture. Treasury stock means shares of a corporation’s own stock that have been issued and subsequently reacquired by the corporation. Converting outstanding shares to treasury shares does not reduce the number of shares issued but does reduce the number of shares outstanding. These shares are not eligible to receive dividends. Accounting for excesses and deficiencies on treasury stock transactions is governed by ASC 505-30-30. State laws and federal agencies closely regulate transactions involving a company’s own capital stock, so the purchase of outstanding shares must have a legitimate purpose. Some of the most common reasons for purchasing outstanding shares are as follows: | (a) | to meet additional stock needs for various reasons, including newly implemented stock option plans, stock for convertible bonds or convertible preferred stock, or a stock dividend. |
| (b) | to make more shares available for acquisitions of other entities. |
The cost method of accounting for treasury shares has been adopted by the Company. The purchase of outstanding shares and thus converting them into treasury shares is treated as a temporary reduction in shareholders’ equity in view of the expectation to reissue the shares instead of retiring them. When the Company reissues the treasury shares, the temporary account is eliminated. The cost of acquiring outstanding shares for converting into treasury shares is charged to a contra account, in this case a contra equity account that reduces the stockholder equity balance. The Company accounts for income taxes under the provisions of ASC Topic 740 “Accounting for Income Taxes.” Under ASC Topic 740, deferred tax assets and liabilities are determined based on the difference between the financial statement carrying amounts and the tax bases of assets and liabilities using enacted tax rates in effect in the years in which the differences are expected to reverse. The provision for income tax is based on the results for the year as adjusted for items, which are non-assessable or disallowed. It is calculated using tax rates that have been enacted or substantively enacted at the balance sheet date. Deferred tax is accounted for using the balance sheet liability method in respect of temporary differences arising from differences between the carrying amount of assets and liabilities in the financial statements and the corresponding tax basis used in the computation of assessable tax profit. In principle, deferred tax liabilities are recognized for all taxable temporary differences, and deferred tax assets are recognized to the extent that it is probable that taxable profit will be available against which deductible temporary differences can be utilized. Deferred income taxes are calculated at the tax rates that are expected to apply to the period when the asset is realized or the liability is settled. Deferred tax is charged or credited in the income statement, except when it related to items credited or charged directly to equity, in which case the deferred tax is also dealt with in equity. Deferred tax assets and liabilities are offset when they relate to income taxes levied by the same taxation authority and the Company intends to settle its current tax assets and liabilities on a net basis. ASC Topic 740 also prescribes a more-likely-than-not threshold for financial statement recognition and measurement of a tax position taken, or for one expected to be taken, in a tax return. ASC Topic 740 also provides guidance related to, among other things, classification, accounting for interest and penalties associated with tax positions, and disclosure requirements. Any interest and penalties accrued related to unrecognized tax benefits will be recorded as tax expense. SINO AGRO FOOD, INC. NOTES TO CONSOLIDATED FINANCIAL STATEMENTS | 2. | SUMMARY OF SIGNIFICANT ACCOUNTING POLICIES (CONTINUED) |
| 2.27 | POLITICAL AND BUSINESS RISK |
The Company’s operations are carried out in the P.R.C. Accordingly, the political, economic and legal environment in the P.R.C. may influence the Company’s business, financial condition and results of operations by the general state of the P.R.C.’s economy. The Company’s operations in the P.R.C. are subject to specific considerations and significant risks not typically associated with companies in North America and Western Europe. The Company’s results may be adversely affected by changes in governmental policies with respect to laws and regulations, anti-inflationary measures, currency conversion and remittance abroad, and rates and methods of taxation, among other things. | 2.28 | CONCENTRATION OF CREDIT RISK |
Cash includes cash at banks and demand deposits in accounts maintained with banks within the P.R.C. Total cash in these banks as of December 31, 2018 and 2017 amounted to $4,720,793 and $327,019, respectively, none of which is covered by insurance. The Company has not experienced any losses in such accounts and believes it is not exposed to any risks to its cash in bank accounts. The Company had 5 major customers (A, B, C, D and E) whose business individually represented the following percentages of the Company’s total revenue for the period indicated: | | | 2018 | | | 2017 | | | | | | | | | | | Customer A | | | 31.65 | % | | | 26.00 | % | | Customer B | | | 21.33 | % | | | 10.88 | % | | Customer C | | | 16.68 | % | | | 10.23 | % | | Customer D | | | 7.85 | % | | | 8.57 | % | | Customer E | | | 5.68 | % | | | - | % | | Customer F | | | - | % | | | 22.08 | % | | | | | 83.19 | % | | | 77.76 | % |
| | | | | Percentage
of revenue | | | Amount | | | Customer A | | Corporate Division | | | 31.65 | % | | $ | 44,833,142 | | | Customer B | | Cattle Farm Development and HU Plantation Division | | | 21.33 | % | | $ | 30,218,987 | | | Customer C | | Corporate Division | | | 16.68 | % | | $ | 23,624,028 | |
Accounts receivable are derived from revenue earned from customers located primarily in the P.R.C. The Company performs ongoing credit evaluations of customers and has not experienced any material losses to date. The Company had 5 major customers whose accounts receivable balance individually represented the following percentages of the Company’s total accounts receivable: | | | 2018 | | | 2017 | | | | | | | | | | | Customer A | | | 12.76 | % | | | 7.34 | % | | Customer B | | | 9.67 | % | | | 4.78 | % | | Customer C | | | 10.05 | % | | | 7.49 | % | | Customer D | | | 59.81 | % | | | 27.13 | % | | Customer E | | | 1.8 | % | | | - | % | | Customer F | | | - | % | | | 12.31 | % | | | | | 94.09 | % | | | 59.05 | % |
As of December 31, 2018, amounts due from customers A, C and D are $12,966,579, $10,212,016 and $60,799,365, respectively. The Company has not experienced any significant difficulty in collecting its accounts receivable in the past and is not aware of any financial difficulties of its major customers. SINO AGRO FOOD, INC. NOTES TO CONSOLIDATED FINANCIAL STATEMENTS | 2. | SUMMARY OF SIGNIFICANT ACCOUNTING POLICIES (CONTINUED) |
| 2.29 | IMPAIRMENT OF LONG-LIVED ASSETS AND INTANGIBLE ASSETS |
In accordance with ASC Topic 360, “Property, Plant and Equipment,” long-lived assets to be held and used are analyzed for impairment whenever events or changes in circumstances indicate that the related carrying amounts may not be recoverable. The Company reviews the carrying amount of its long-lived assets, including intangibles, for impairment, during each reporting period. An asset is considered impaired when estimated future cash flows are less than the carrying amount of the asset. In the event the carrying amount of such asset is considered not recoverable, the asset is adjusted to its fair value. Fair value is generally determined based on discounted future cash flow. As of December 31, 2018 and 2017, the Company determined no impairment losses were necessary. As prescribed in ASC Topic 260 “Earnings per Share,” Basic Earnings per Share (“EPS”) is computed by dividing net income available to common stockholders by the weighted average number of common stock shares outstanding during the year. Diluted EPS is computed by dividing net income available to common stockholders by the weighted-average number of common stock shares outstanding during the year plus potential dilutive instruments such as stock options and warrants. The effect of stock options on diluted EPS is determined through the application of the treasury stock method, whereby proceeds received by the Company based on assumed exercises are hypothetically used to repurchase the Company’s common stock at the average market price during the period. ASC 260-10-55 requires that stock dividends or stock splits be accounted for retroactively if the stock dividends or stock splits occur during the year, or retroactively if the stock dividends or stock splits occur after the end of the period but before the release of the financial statements, by considering it outstanding of the entirety of each period presented. Dilution is computed by applying the treasury stock method. Under this method, options and warrants are assumed to be exercised at the beginning of the period (or at the time of issuance, if later), and as if funds obtained thereby were used to purchase common stock at the average market price during the year. For the years ended December 31, 2018 and 2017, basic earnings (loss) per share attributable to Sino Agro Food, Inc. and subsidiaries common stockholders amounted to $0.46, and $(0.53), respectively. For the years ended December 31, 2018 and 2017, diluted earnings (loss) per share attributable to Sino Agro Food, Inc. and its subsidiaries’ common stockholders amounted to $0.46, and $(0.53), respectively. | 2.31 | ACCUMULATED OTHER COMPREHENSIVE INCOME |
ASC Topic 220 “Comprehensive Income” establishes standards for reporting and displaying comprehensive income and its components in financial statements. Comprehensive income is defined as the change in stockholders’ equity of a business enterprise during a period from transactions and other events and circumstances from non-owner sources. The comprehensive income for all periods presented includes both the reported net income and net change in cumulative translation adjustments. | 2.32 | RETIREMENT BENEFIT COSTS |
P.R.C. state managed retirement benefit programs are defined contribution plans and the payments to the plans are charged as expenses when employees have rendered service entitling them to the contribution made by the employer. | 2.33 | STOCK-BASED COMPENSATION |
The Company has adopted both ASC Topic 718, “Compensation - Stock Compensation” and ASC Topic 505-50, “Equity-Based Payments to Non - Employees” using the fair value method in which an entity issues its equity instruments to acquire goods and services from employees and non-employees. Stock compensation for stock granted to non-employees has been determined in accordance with this accounting standard and the accounting standard regarding accounting for equity instruments that are issued to other than employees for acquiring, or in conjunction with selling goods or services, as the fair value of the consideration received or the fair value of equity instruments issued, whichever is more reliably measured. This accounting standard allows the “simplified” method to determine the term of employee options when other information is not available. Under ASC Topic 718 and ASC Topic 505-50, stock compensation expenses is measured at the grant date on the value of the option or restricted stock and is recognized as expenses, less expected forfeitures, over the requisite service period, which is generally the vesting period. SINO AGRO FOOD, INC. NOTES TO CONSOLIDATED FINANCIAL STATEMENTS | 2. | SUMMARY OF SIGNIFICANT ACCOUNTING POLICIES (CONTINUED) |
| 2.34 | FAIR VALUE OF FINANCIAL INSTRUMENTS |
The Company follows paragraph 825-10-50-10 of the FASB Accounting Standards Codification for disclosures about fair value of its financial instruments and paragraph 820-10-35-37 of the FASB Accounting Standards Codification (“Paragraph 820-10-35-37”) to measure the fair value of its financial instruments. Paragraph 820-10-35-37 establishes a framework for measuring fair value under U.S. GAAP, and expands disclosures about fair value measurements. To increase consistency and comparability in fair value measurements and related disclosures, Paragraph 820-10-35-37 establishes a fair value hierarchy, which prioritizes the inputs to valuation techniques used to measure fair value into three (3) broad levels. The fair value hierarchy gives the highest priority to quoted prices (unadjusted) in active markets for identical assets or liabilities and the lowest priority to unobservable inputs. The three (3) levels of fair value hierarchy defined by Paragraph 820-10-35-37 are described below: | Level 1 | Quoted market prices available in active markets for identical assets or liabilities as of the reporting date. |
| Level 2 | Pricing inputs other than quoted prices in active markets included in Level 1, which are either directly or indirectly observable as of the reporting date. |
| Level 3 | Pricing inputs that are generally observable inputs and not corroborated by market data. |
Financial instruments consist principally of cash, accounts receivable, Deposits and prepayments, accounts payable and accrued expenses, other payables, due to a director and income tax payables. The carrying amounts of such financial instruments in the accompanying condensed consolidated balance sheet approximate their fair values due to their relatively short-term nature. The Company’s long-term borrowing, promissory notes and convertible notes payable approximates the fair value of such instrument based upon management’s best estimate of interest rates that would be available to the Company for similar financial arrangement at December 31, 2018. It is management's opinion that the Company is not exposed to any significant currency or credit risks arising from these financial instruments. The Company revalues its derivative liability at every reporting period and recognizes gains or losses in the consolidated statement of income and other comprehensive income that are attributable to the change in the fair value of the derivative liability. The Company has no other assets or liabilities measured at fair value on a recurring basis. | 2.35 | RECENT ACCOUNTING PRONOUNCEMENTS |
In February 2016, the FASB issued ASU 2016-02, Leases, which aims to make leasing activities more transparent and comparable and requires substantially all leases be recognized by lessees on their balance sheet as a right-of-use asset and corresponding lease liability, including leases currently accounted for as operating leases. This ASU is effective for all interim and annual reporting periods beginning after December 15, 2018, with early adoption permitted. The Company is currently evaluating the impact that the adoption of ASU 2016-02 will have on its consolidated financial statements and related disclosures. In June 2018, the FASB issued ASU 2018-07—Compensation—Stock Compensation (Topic 718): Improvements to Nonemployee Share-Based Payment Accounting. This ASU is effective for public business entities for fiscal years beginning after December 15, 2018, including interim periods within that fiscal year. The Company is currently evaluating the impact that the adoption of this ASU will have on its consolidated financial statements and related disclosures. Certain balances have been reclassified in the December 31, 2017 consolidated balance sheet and the consolidated statement of cash flows on a basis consistent with the financial statements as of and for the year ended December 31, 2018. SINO AGRO FOOD, INC. NOTES TO CONSOLIDATED FINANCIAL STATEMENTS The Company establishes standards for reporting information about operating segments on a basis consistent with the Company’s internal organization structure as well as business segments and major customers in consolidated financial statements. The Company operates in five principal reportable segments: Fishery Development Division, HU Plantation Division, Organic Fertilizer and Bread Grass Division, Cattle Farm Development Division and Corporate and Others Division. | | | 2018 | | | | | | | | Fishery | | | | | | Organic Fertilizer | | | Cattle Farm | | | | | | | | | | | Development | | | HU Plantation | | | and Bread Grass | | | Development | | | Corporate and | | | | | | | | Division(1) | | | Division (2) | | | Division (3) | | | Division (4) | | | others (5) | | | Total | | | | | | | | | | | | | | | | | | | | | | | Revenue | | $ | 11,127,393 | | | $ | 3,617,249 | | | $ | 28,909,768 | | | $ | 29,558,983 | | | $ | 68,457,170 | | | $ | 141,670,563 | | | | | | | | | | | | | | | | | | | | | | | | | | | | | Net income (loss) | | $ | 1,567,429 | | | $ | (3,037,306 | ) | | $ | (280,356 | ) | | $ | 3,491,893 | | | $ | 15,581,677 | | | $ | 17,323,337 | | | | | | | | | | | | | | | | | | | | | | | | | | | | | Total assets | | $ | 87,129,117 | | | $ | 43,484,157 | | | $ | 327,374,461 | | | $ | 42,288,332 | | | $ | 290,326,712 | | | $ | 790,602,779 | |
| | | 2017 | | | | | | | | Fishery | | | | | | Organic Fertilizer | | | Cattle Farm | | | | | | | | | | | Development | | | HU Plantation | | | and Bread Grass | | | Development | | | Corporate and | | | | | | | | Division(1) | | | Division (2) | | | Division (3) | | | Division (4) | | | others (5) | | | Total | | | | | | | | | | | | | | | | | | | | | | | | | | | | | Revenue | | $ | 16,983,330 | | | $ | 4,638,095 | | | $ | 84,356,986 | | | $ | 20,401,361 | | | $ | 71,787,167 | | | $ | 198,166,939 | | | | | | | | | | | | | | | | | | | | | | | | | | | | | Net income (loss) | | $ | 3,224,985 | | | $ | (1,440,925 | ) | | $ | (18,090,904 | ) | | $ | 2,623,332 | | | $ | 579,367 | | | $ | (13,104,145 | ) | | | | | | | | | | | | | | | | | | | | | | | | | | | | Total assets | | $ | 79,997,651 | | | $ | 47,881,252 | | | $ | 336,073,537 | | | $ | 33,207,995 | | | $ | 276,784,732 | | | $ | 773,945,167 | |
SINO AGRO FOOD, INC. NOTES TO CONSOLIDATED FINANCIAL STATEMENTS | 3. | SEGMENT INFORMATION (CONTINUED) |
Note | (1) | Operated by Capital Award, Inc. (“CA”). |
| (2) | Operated by Jiang Men City Heng Sheng Tai Agriculture Development Co., Limited (“JHST”). |
| (3) | Operated by Qinghai Sanjiang A Power Agriculture Co., Limited (“SJAP”), A Power Agro Agriculture Development (Macau) Limited (“APWAM”), and Hunan Shenghua A Power Agriculture Co., Limited (“HSA”). On December 30, 2017 QZH was disposed to third party and derecognized as variable interest entity on the same date. |
| (4) | Operated by Jiang Men City Hang Mei Cattle Farm Development Co. Limited (“JHMC”) and Macau Eiji Company Limited (“MEIJI”). |
| (5) | Operated by Sino Agro Food, Inc. (“SIAF”) and Sino Agro Food Sweden AB (publ) (“SAFS”). |
SINO AGRO FOOD, INC. NOTES TO CONSOLIDATED FINANCIAL STATEMENTS | 3. | SEGMENT INFORMATION (CONTINUED) |
Further analysis of revenue:- | | | 2018 | | | | | | | | | | | | | | Organic | | | | | | | | | | | | | | Fishery | | | | | | Fertilizer and | | | Cattle Farm | | | | | | | | | | | Development | | | HU Plantation | | | Bread Grass | | | Development | | | Corporate and | | | | | | | | Division (1) | | | Division (2) | | | Division (3) | | | Division (4) | | | others (5) | | | Total | | | | | | | | | | | | | | | | | | | | | | Name of entity
Sale of goods
Capital Award, Inc. (“CA”) | | $ | - | | | $ | - | | | $ | - | | | $ | - | | | $ | - | | | $ | - | | | | | | | | | | | | | | | | | | | | | | | | | | | | | Jiang Men City Heng Sheng Tai Agriculture Development Co., Limited (“JHST”) | | | - | | | | 3,617,249 | | | | - | | | | - | | | | - | | | | 3,617,249 | | | | | | | | | | | | | | | | | | | | | | | | | | | | | Hunan Shenghua A Power Agriculture Co., Limited (“HSA”) | | | - | | | | - | | | | 9,671,330 | | | | - | | | | - | | | | 9,671,330 | | | | | | | | | | | | | | | | | | | | | | | | | | | | | Qinghai Sanjiang A Power Agriculture Co., Limited (“SJAP”) | | | - | | | | - | | | | 19,238,438 | | | | - | | | | - | | | | 19,238,438 | | | | | | | | | | | | | | | | | | | | | | | | | | | | | Macau Eiji Company Limited (“MEIJI”) | | | - | | | | - | | | | - | | | | 29,558,983 | | | | - | | | | 29,558,983 | | | | | | | | | | | | | | | | | | | | | | | | | | | | | Sino Agro Food, Inc. (“SIAF”) | | | - | | | | - | | | | - | | | | - | | | | 68,457,170 | | | | 68,457,170 | | | | | | | | | | | | | | | | | | | | | | | | | | | | | Consulting and service income for development contracts Capital Award, Inc. (“CA”) | | | 11,127,393 | | | | - | | | | - | | | | - | | | | - | | | | 11,127,393 | | | | | | | | | | | | | | | | | | | | | | | | | | | | | | | $ | 11,127,393 | | | $ | 3,617,249 | | | $ | 28,909,768 | | | $ | 29,558,983 | | | $ | 68,457,170 | | | $ | 141,670,563 | |
SINO AGRO FOOD, INC. NOTES TO CONSOLIDATED FINANCIAL STATEMENTS | 3. | SEGMENT INFORMATION (CONTINUED) |
Further analysis of revenue:- | | | 2017 | | | | | | | | | | | | | | Organic | | | | | | | | | | | | | | Fishery | | | | | | Fertilizer and | | | Cattle Farm | | | | | | | | | | | Development | | | HU Plantation | | | Bread Grass | | | Development | | | Corporate and | | | | | | | | Division (1) | | | Division (2) | | | Division (3) | | | Division (4) | | | others (5) | | | Total | | | | | | | | | | | | | | | | | | | | | | Name of entity
Sale of goods
Capital Award, Inc. (“CA”) | | $ | - | | | $ | - | | | $ | - | | | $ | - | | | $ | - | | | $ | - | | | | | | | | | | | | | | | | | | | | | | | | | | | | | Jiang Men City Heng Sheng Tai Agriculture Development Co., Limited (“JHST”) | | | - | | | | 4,638,095 | | | | - | | | | - | | | | - | | | | 4,638,095 | | | | | | | | | | | | | | | | | | | | | | | | | | | | | Hunan Shenghua A Power Agriculture Co., Limited (“HSA”) | | | - | | | | - | | | | 7,167,845 | | | | - | | | | - | | | | 7,167,845 | | | | | | | | | | | | | | | | | | | | | | | | | | | | | Qinghai Sanjiang A Power Agriculture Co., Limited (“SJAP”) | | | - | | | | - | | | | 27,911,680 | | | | - | | | | - | | | | 27,911,680 | | | | | | | | | | | | | | | | | | | | | | | | | | | | | Qinghai Zhong He Meat Products Co., Limited (“QZH”) | | | - | | | | - | | | | 49,277,461 | | | | - | | | | - | | | | 49,277,461 | | | | | | | | | | | | | | | | | | | | | | | | | | | | | Macau Eiji Company Limited (“MEIJI”) | | | - | | | | - | | | | - | | | | 20,401,361 | | | | - | | | | 20,401,361 | | | | | | | | | | | | | | | | | | | | | | | | | | | | | Sino Agro Food, Inc. (“SIAF”) | | | - | | | | - | | | | - | | | | - | | | | 71,787,167 | | | | 71,787,167 | | | | | | | | | | | | | | | | | | | | | | | | | | | | | Consulting and service income for development contracts Capital Award, Inc. (“CA”) | | | 16,983,330 | | | | - | | | | - | | | | - | | | | - | | | | 16,983,330 | | | | | | | | | | | | | | | | | | | | | | | | | | | | | | | $ | 16,983,330 | | | $ | 4,638,095 | | | $ | 84,356,986 | | | $ | 20,401,361 | | | $ | 71,787,167 | | | $ | 198,166,939 | |
SINO AGRO FOOD, INC. NOTES TO CONSOLIDATED FINANCIAL STATEMENTS Further analysis of cost of goods sold and cost of services:- COST OF GOODS SOLD | | | 2018 | | | | | | | | | | | | | | Organic | | | | | | | | | | | | | | Fishery | | | HU | | | Fertilizer and | | | Cattle Farm | | | Corporate | | | | | | | | Development | | | Plantation | | | Bread Grass | | | Development | | | and others | | | | | | | | Division (1) | | | Division (2) | | | Division (3) | | | Division (4) | | | (5) | | | Total | | | | | | | | | | | | | | | | | | | | | | Name of entity
Sale of goods
Capital Award, Inc. (“CA”) | | $ | - | | | $ | - | | | $ | - | | | $ | - | | | $ | - | | | $ | - | | | | | | | | | | | | | | | | | | | | | | | | | | | | | Jiang Men City Heng Sheng Tai Agriculture Development Co., Limited (“JHST”) | | | - | | | | 3,098,390 | | | | - | | | | - | | | | - | | | | 3,098,390 | | | | | | | | | | | | | | | | | | | | | | | | | | | | | Hunan Shenghua A Power Agriculture Co., Limited (“HSA”) | | | - | | | | - | | | | 6,894,335 | | | | - | | | | - | | | | 6,894,335 | | | | | | | | | | | | | | | | | | | | | | | | | | | | | Qinghai Sanjiang A Power Agriculture Co., Limited (“SJAP”) | | | - | | | | - | | | | 14,937,535 | | | | - | | | | - | | | | 14,937,535 | | | | | | | | | | | | | | | | | | | | | | | | | | | | | Macau Eiji Company Limited (“MEIJI”) | | | - | | | | - | | | | - | | | | 24,761,345 | | | | - | | | | 24,761,345 | | | | | | | | | | | | | | | | | | | | | | | | | | | | | Sino Agro Food, Inc. (“SIAF”) | | | - | | | | - | | | | - | | | | - | | | | 61,275,743 | | | | 61,275,743 | | | | | $ | - | | | $ | 3,098,390 | | | $ | 21,831,870 | | | $ | 24,761,345 | | | $ | 61,275,743 | | | $ | 110,967,348 | |
COST OF SERVICES | | | 2018 | | | | | | | | | | | | | | Organic | | | | | | | | | | | | | | Fishery | | | | | | Fertilizer and | | | Cattle Farm | | | Corporate | | | | | | | | Development | | | HU Plantation | | | Bread Grass | | | Development | | | and others | | | | | | | | Division (1) | | | Division (2) | | | Division (3) | | | Division (4) | | | (5) | | | Total | | | | | | | | | | | | | | | | | | | | | | | Name of entity | | | | | | | | | | | | | | | | | | | | | | | | | | | | | | | | | | | | | | | | | | | | | | | | | | | | Consulting and service income for development contracts | | | | | | | | | | | | | | | | | | | | | | | | | | | | | | | | | | | | | | | | | | | | | | | | | | | | Capital Award, Inc. (“CA”) | | $ | 9,051,408 | | | $ | - | | | $ | - | | | $ | - | | | $ | - | | | $ | 9,051,408 | | | | | | | | | | | | | | | | | | | | | | | | | | | | | | | $ | 9,051,408 | | | $ | - | | | $ | - | | | $ | - | | | $ | - | | | $ | 9,051,408 | |
SINO AGRO FOOD, INC. NOTES TO CONSOLIDATED FINANCIAL STATEMENTS | 4. | SEGMENT INFORMATION (CONTINUED) |
Further analysis of cost of goods sold and cost of services (Continued):- COST OF GOODS SOLD | | | 2017 | | | | | | | | | | | | | | Organic | | | | | | | | | | | | | | Fishery | | | HU | | | Fertilizer and | | | Cattle Farm | | | Corporate | | | | | | | | Development | | | Plantation | | | Bread Grass | | | Development | | | and others | | | | | | | | Division (1) | | | Division (2) | | | Division (3) | | | Division (4) | | | (5) | | | Total | | | | | | | | | | | | | | | | | | | | | | Name of entity
Sale of goods
Capital Award, Inc. (“CA”) | | $ | - | | | $ | - | | | $ | - | | | $ | - | | | $ | - | | | $ | - | | | | | | | | | | | | | | | | | | | | | | | | | | | | | Jiang Men City Heng Sheng Tai Agriculture Development Co., Limited (“JHST”) | | | - | | | | 3,254,567 | | | | - | | | | - | | | | - | | | | 3,254,567 | | | | | | | | | | | | | | | | | | | | | | | | | | | | | Hunan Shenghua A Power Agriculture Co., Limited (“HSA”) | | | - | | | | - | | | | 4,991,411 | | | | - | | | | - | | | | 4,991,411 | | | | | | | | | | | | | | | | | | | | | | | | | | | | | Qinghai Sanjiang A Power Agriculture Co., Limited (“SJAP”) | | | - | | | | - | | | | 18,961,620 | | | | - | | | | - | | | | 18,961,620 | | | | | | | | | | | | | | | | | | | | | | | | | | | | | Qinghai Zhong He Meat Products Co., Limited (“QZH”) | | | - | | | | - | | | | 57,314,727 | | | | - | | | | - | | | | 57,314,727 | | | | | | | | | | | | | | | | | | | | | | | | | | | | | Macau Eiji Company Limited (“MEIJI”) | | | - | | | | - | | | | - | | | | 16,629,579 | | | | - | | | | 16,629,579 | | | | | | | | | | | | | | | | | | | | | | | | | | | | | Sino Agro Food, Inc. (“SIAF”) | | | - | | | | - | | | | - | | | | - | | | | 63,822,343 | | | | 63,822,343 | | | | | $ | - | | | $ | 3,254,567 | | | $ | 81,267,758 | | | $ | 16,629,579 | | | $ | 63,822,343 | | | $ | 164,974,247 | |
COST OF SERVICES | | | 2017 | | | | | | | | | | | | | | Organic | | | | | | | | | | | | | | Fishery | | | | | | Fertilizer and | | | Cattle Farm | | | Corporate | | | | | | | | Development | | | HU Plantation | | | Bread Grass | | | Development | | | and others | | | | | | | | Division (1) | | | Division (2) | | | Division (3) | | | Division (4) | | | (5) | | | Total | | | | | | | | | | | | | | | | | | | | | | | Name of entity | | | | | | | | | | | | | | | | | | | | | | | | | | | | | | | | | | | | | | | | | | | | | | | | | | | | Consulting and service income for development contracts | | | | | | | | | | | | | | | | | | | | | | | | | | | | | | | | | | | | | | | | | | | | | | | | | | | | Capital Award, Inc. (“CA”) | | $ | 13,566,203 | | | $ | - | | | $ | - | | | $ | - | | | $ | - | | | $ | 13,566,203 | | | | | | | | | | | | | | | | | | | | | | | | | | | | | | | $ | 13,566,203 | | | $ | - | | | $ | - | | | $ | - | | | $ | - | | | $ | 13,566,203 | |
SINO AGRO FOOD, INC. NOTES TO CONSOLIDATED FINANCIAL STATEMENTS United States of America The Company was incorporated in the State of Nevada, in the United States of America. The Company has no trading operations in United States of America and no U.S. corporate tax has been provided for in the consolidated financial statements of the Company. Undistributed Earnings of Foreign Subsidiaries The Company intends to use the remaining accumulated and future earnings of foreign subsidiaries to expand operations outside the United States and accordingly, undistributed earnings of foreign subsidiaries are considered to be indefinitely reinvested outside the United States and no provision for U.S. Federal and State income tax or applicable dividend distribution tax has been provided thereon. As of December 31, 2018, the Company reviewed its tax position with the assistance US tax professionals and believed that there would be no taxes and no penalties assessed by the IRS in the United States of America. SINO AGRO FOOD, INC. NOTES TO CONSOLIDATED FINANCIAL STATEMENTS | 5. | INCOME TAXES (CONTINUED) |
China The Enterprise Income Tax (“EIT”) law replaced the existing laws for Domestic Enterprises (“DE’s”) and Foreign Invested Enterprises (“FIE’s”). The new standard EIT rate of 25% replaced the 33% rate currently applicable to both DE’s and FIE’s. The Company is currently evaluating the impact that the new EIT will have on its financial condition. Beginning January 1, 2008, China unified the corporate income tax rule on foreign invested enterprises and domestic enterprises. The unified corporate income tax rate is 25%. Under new tax legislation in China beginning in January 2008, the agriculture, dairy and fishery sectors are exempt from enterprise income taxes. No EIT has been provided in the financial statements of SIAF, JHST, JHMC, HSA, and SJAP since they are exempt from EIT for the years ended December 31, 2018 and 2017 as they are within the agriculture, and cattle sectors. No EIT has been provided in the financial statements of QZH since they are exempt from EIT for the period ended December 30, 2017 (date of de-recognition QZH as subsidiary) and as it is within the cattle sectors. Belize CA, CS and CH are international business companies incorporated in Belize, and are exempt from corporate tax in Belize. Macau No Macau Corporate income tax has been provided in the consolidated financial statements of APWAM and MEIJI since these entities did not earn any assessable profits for the years ended December 31, 2018 and 2017. Sweden Sweden Corporate income tax has been provided at 22% on reported profit for the year ended December 31, 2018 and 2017 in the consolidated financial statements of SAFS. No deferred tax assets and liabilities are of December 31, 2018 and 2017 since there was no difference between the financial statements carrying amounts and the tax bases of assets and liabilities using enacted tax rates in effect in the period in which the differences are expected to reverse. Provision for income taxes is as follows: | | | 2018 | | | 2017 | | | | | | | | | | | SIAF | | $ | - | | | $ | - | | | SAFS | | | - | | | | 1,684 | | | CA, CH and CS | | | - | | | | - | | | MEIJI and APWAM | | | - | | | | - | | | JHST, JHMC, SJAP, QZH and HSA | | | - | | | | - | | | | | $ | - | | | $ | 1,684 | |
The Company did not recognize any interest or penalties related to unrecognized tax benefits in the years ended December 31, 2018 and 2017. The Company had no uncertain positions that would necessitate recording of tax related liability. The Company is subject to examination by the respective tax authorities. SINO AGRO FOOD, INC. NOTES TO CONSOLIDATED FINANCIAL STATEMENTS | 6. | NET LOSS FROM DISPOSAL OF A VARIABLE INTEREST ENTITY |
As of December 31, 2016, the SJAP’s total investment in QZH was $4,645,489. During the period ended December 30, 2017, QZH incurred a loss of $30,682,576. SJAP disposed its entire 85% equity interest in QZH for RMB2 (equivalent to $0) for cash and completed on December 30, 2017. As a result, QZH was derecognized as VIE of the company. | (a) | Net loss from disposal of a variable interest entity, QZH |
| Cash and cash equivalents | | $ | 17,060 | | | Inventories | | | 4,567,530 | | | Prepayments | | | 2,692,571 | | | Accounts receivables | | | 16,403,731 | | | Other receivables | | | 1,855,971 | | | Plant and equipment | | | 3,888,987 | | | Intangible assets | | | 2,870 | | | | | | 29,428,720 | | | Less: Accounts payable | | | (7,140,439 | ) | | Other payables | | | (5,811,425 | ) | | Short term borrowings | | | (1,530,456 | ) | | Non-controlling interests | | | (5,082,410 | ) | | Accumulated exchange difference | | | (498,347 | ) | | Net assets and liabilities disposed as of December 30, 2017 | | $ | 9,365,643 | | | | | | | | | Satisfied by: | | | | | | Cash consideration | | $ | - | |
| (b) | Net cash outflow from disposal of a variable interest entity, QZH |
| | | 2018 | | | | | | | | Cash and cash equivalents disposed of | | $ | (17,060 | ) | | Net cash outflow disposal of a variable interest entity, QZH | | $ | (17,060 | ) |
| 7. | CASH AND CASH EQUIVALENTS |
| | | 2018 | | | 2017 | | | | | | | | | | | | | Cash and bank balances | | $ | 4,950,799 | | | $ | 560,043 | |
SINO AGRO FOOD, INC. NOTES TO CONSOLIDATED FINANCIAL STATEMENTS As of December 31, 2018, inventories are as follows: | | | 2018 | | | 2017 | | | | | | | | | | | Bread grass | | $ | 744,378 | | | $ | 976,514 | | | Beef cattle | | | 11,561,117 | | | | 5,903,442 | | | Organic fertilizer | | | 14,266,923 | | | | 16,832,390 | | | Forage for cattle and consumable | | | 7,252,280 | | | | 7,397,910 | | | Raw materials for bread grass and organic fertilizer | | | 18,885,258 | | | | 19,113,274 | | | Immature seeds | | | 1,872,285 | | | | 2,405,417 | | | | | $ | 54,582,241 | | | $ | 52,628,947 | |
| 9. | DEPOSITS AND PREPAYMENTS |
| | | 2018 | | | 2017 | | | | | | | | | | | Deposits for | | | | | | | | | | - purchases of equipment | | $ | 2,158,867 | | | $ | 2,815,774 | | | - acquisition of land use rights | | | 174,851 | | | | 3,244,567 | | | - inventories purchases | | | 16,921,188 | | | | 24,282,950 | | | - construction in progress | | | 4,789,035 | | | | 11,365,748 | | | - issue of shares as collateral | | | 24,928,324 | | | | 25,427,293 | | | Shares issued for employee compensation and overseas professional and bond interest | | | 643,457 | | | | 702,625 | | | Others | | | 2,625,468 | | | | 2,620,693 | | | | | $ | 52,241,190 | | | $ | 70,459,650 | |
Impairment were $nil and $1,378,957 for the years ended December 31, 2018 and 2017, respectively. The impairment was included in non-operating expenses. All accounts receivable are reflected as a current asset and no allowance for bad debt of December 31, 2018 and 2017, respectively. Aging analysis of accounts receivable is as follows: | | | 2018 | | | 2017 | | | | | | | | | | | 0 - 30 days | | $ | 7,447,269 | | | $ | 7,973,308 | | | 31 - 90 days | | | 22,684,605 | | | | 18,240,251 | | | 91 - 120 days | | | 16,456,895 | | | | 5,725,069 | | | over 120 days and less than 1 year | | | 11,773,454 | | | | 21,551,845 | | | over 1 year | | | 43,289,908 | | | | 29,480,945 | | | | | $ | 101,652,131 | | | $ | 82,971,418 | |
SINO AGRO FOOD, INC. NOTES TO CONSOLIDATED FINANCIAL STATEMENTS | | | 2018 | | | 2017 | | | | | | | | | | | Advanced to employees | | $ | 561,330 | | | $ | 219,186 | | | Advanced to suppliers | | | 3,831,926 | | | | 3,768,585 | | | Advanced to customers | | | 14,114,249 | | | | 11,982,331 | | | Advanced to developers | | | 453,155 | | | | 399,449 | | | Others | | | 9,346,866 | | | | 4,310,927 | | | | | $ | 28,307,526 | | | $ | 20,680,478 | |
Advanced to employees, suppliers, customers and developers are unsecured, interest free and with no fixed terms of repayment. Impairment were $nil and $962,789 for the years ended December 31, 2018 and 2017, respectively. The impairment was included in non-operating expenses. | | | 2018 | | | 2017 | | | | | | | | | | | Plant and machinery | | $ | 5,299,631 | | | $ | 5,501,975 | | | Structure and leasehold improvements | | | 200,734,812 | | | | 209,378,338 | | | Mature seeds and herbage cultivation | | | 54,643,255 | | | | 49,685,830 | | | Furniture and equipment | | | 695,461 | | | | 699,494 | | | Motor vehicles | | | 590,416 | | | | 614,792 | | | | | | 261,963,575 | | | | 265,880,429 | | | | | | | | | | | | | Less: Accumulated depreciation | | | (31,317,916 | ) | | | (19,022,632 | ) | | Net carrying amount | | $ | 230,645,659 | | | $ | 246,857,797 | |
Depreciation expenses were $13,080,991 and $8,350,811 for the years ended December 31, 2018, and 2017, respectively SINO AGRO FOOD, INC. NOTES TO CONSOLIDATED FINANCIAL STATEMENTS | 13. | CONSTRUCTION IN PROGRESS |
| | | 2018 | | | 2017 | | | | | | | | | | | Construction in progress | | | | | | | | | | - Office, warehouse and organic fertilizer plant in HSA | | $ | 7,285 | | | $ | - | | | - Oven room, road for production of dried flowers | | | - | | | | - | | | - Organic fertilizer and bread grass production plant and office building | | | 6,484,045 | | | | - | | | - Rangeland for beef cattle and office building | | | 6,024,197 | | | | 6,178,308 | | | - Fish pond and breeding factory | | | - | | | | - | | | | | $ | 12,515,527 | | | $ | 6,178,308 | |
SINO AGRO FOOD, INC. NOTES TO CONSOLIDATED FINANCIAL STATEMENTS | | | 2018 | | | 2017 | | | | | | | | | | | Cost | | $ | 65,779,178 | | | $ | 65,573,223 | | | Less: Accumulated amortization | | | (11,964,897 | ) | | | (10,735,192 | ) | | Net carrying amount | | $ | 53,814,281 | | | $ | 54,838,031 | |
| | | Amount | | | | | | | | Balance @1.1.2017 | | $ | 62,341,829 | | | Exchange difference | | | 3,231,394 | | | Balance @12.31.2017 | | $ | 65,573,223 | | | Exchange difference | | | 205,955 | | | Balance @12.31.2018 | | $ | 65,779,178 | |
Land use rights are amortized on the straight-line basis over their respective lease periods. The lease period of agriculture land is 10 to 60 years. Amortization of land use rights were $1,686,879 and $1,616,471 for the years ended December 31, 2018 and 2017, respectively. No impairment of land use right has been identified for the years ended December 31, 2018 and 2017. Goodwill represents the fair value of the assets acquired the acquisitions over the cost of the assets acquired. It is stated at cost less accumulated impairment losses. Management tests goodwill for impairment on an annual basis or when impairment indicators arise. In these instances, the Company recognizes an impairment loss when it is probable that the estimated cash flows are less than the carrying value of the assets. To date, no such impairment loss has been recorded. | | | 2018 | | | 2017 | | | | | | | | | | | Goodwill from acquisition | | $ | 724,940 | | | $ | 724,940 | | | Less: Accumulated impairment losses | | | - | | | | - | | | Net carrying amount | | $ | 724,940 | | | $ | 724,940 | |
| 16. | PROPRIETARY TECHNOLOGIES |
By an agreement dated November 12, 2008, CA acquired an enzyme technology master license, registered under a Chinese patent, for the manufacturing of livestock feed and bioorganic fertilizer and its related labels for $8,000,000. On October 1, 2015, the Company took up such assets at $5,473,720. On March 6, 2012, MEIJI acquired an aromatic-feed formula technology for the production of aromatic cattle for $1,500,000. On October 1, 2013, SIAF was granted a license to exploit sleepy cods breeding technology to grow out of sleepy cods for $2,270,000 for 50 years. SJAP booked bacterial cellulose technology license and related trademark for $2,119,075 and amortized expenditures for 20 years starting from January 1, 2014. | | | 2018 | | | 2017 | | | | | | | | | | | Cost | | $ | 11,113,267 | | | $ | 11,211,100 | | | Less: Accumulated amortization | | | (2,176,196 | ) | | | (1,622,495 | ) | | Net carrying amount | | $ | 8,937,071 | | | $ | 9,588,605 | |
Amortization of proprietary technologies was $583,133 and $581,609 for the years ended December 31, 2018 and 2017 respectively. No impairments of proprietary technologies have been identified for the years ended December 31, 2018 and 2017 SINO AGRO FOOD, INC. NOTES TO CONSOLIDATED FINANCIAL STATEMENTS | 17. | INTERESTS IN UNCONSOLIDATED EQUITY INTERESTS |
On February 28, 2011, TRW applied to form a corporate joint venture, Enping City Bi Tao A Power Fishery Development Co., Limited (“EBAPFD”), incorporated in the PRC. TRW owned a 25% equity interest in EBAPFD. On November 17, 2011, TRW formed Jiang Men City A Power Fishery Development Co., Limited (“JFD”) in which it acquired a 25% equity interest, while withdrawing its 25% equity interest in EBAPFD. As of December 31, 2011, the Company had invested for total cash consideration of $1,258,607 in JFD. JFD operates an indoor fish farm. On January 1, 2012, the Company acquired an additional 25% equity interest in JFD for total cash consideration of $1,662,365. As of January 1, 2012, the Company had consolidated the assets and operations of JFD. On April 1, 2012, the Company acquired an additional 25% equity interest in JFD for the total cash consideration of $1,702,580. These acquisitions were at our option according the terms of the original development agreement. The Company owned a 75% equity interest in JFD, representing majority of voting rights and controls its board of directors. On August 15, 2016, the acquisition agreement was executed by TRW for acquiring the other 25% equity in JFD which was a Sino Foreign Joint Venture Co. that TRW had 100% equity interest with effect on October 5, 2016. Upon the acquisitions of 3 additional prawn farms assets at fair value of $238.32 million from respective third parties and the master technology license at fair value of $30 million from Capital Award, Inc. by JFD, and the consideration of the above acquisitions were planned to be settled by the new issue shares of 99,990,000 TRW shares at $3.41 amounting to $340.53 million on or before March 31, 2017. As a result, SIAF’s equity interest in TRW was diluted from 100% to 23.89% with effective on October 5, 2016. The above transactions leaded the Company loss of control over TRW group, the Company’s investments in TRW and JFD were reclassified from a subsidiary to investments in unconsolidated equity investees as of October 5, 2016. The dilution of the Company’s investments in TRW group constituted a deemed disposal of the subsidiaries. The deemed gain on disposal of $56,947,005 was recorded in net income from discontinued operations of the consolidated statements of income and other comprehensive income of the Company for the year ended December 31, 2016. The Company converted the amount due from unconsolidated equity investee into equity interest during the fourth quarter of 2017, which resulted in equity interest in TRW from 23.89% to 36.60% On May 6, 2016, SJAP invested in 30% equity interest in Guangzhou Horan Taita Information Technology Co., Limited (“HTIT”), a company incorporated in P.R.C. for RMB1,000,000. Impairment were $nil and $153,046 for the years ended December 31, 2018 and 2017, respectively. | | | 2018 | | | 2017 | | | | | | | | | | | Investments at cost | | $ | | | | $ | | | | - TRW | | | 149,720,418 | | | | 134,694,930 | | | - HITT | | | - | | | | - | | | Amount due from a consolidated equity investee - TRW | | | 57,354,208 | | | | 57,595,611 | | | | | $ | 207,074,626 | | | $ | 192,290,541 | |
SINO AGRO FOOD, INC. NOTES TO CONSOLIDATED FINANCIAL STATEMENTS
| 18. | TEMPORARY DEPOSITS PAID TO ENTITIES FOR EQUITY INVESTMENTS IN FUTURE SINO JOINT VENTURE COMPANIES |
| Intended | | | | | | | | | | | | unincorporated | | Projects | | | | | | | | | | Investee | | Engaged | | | | 2018 | | | 2017 | | | | | | | | | | | | | | | A | | Trade center | | * | | $ | 12,000,000 | | | $ | 12,000,000 | | | B | | Fish and prawn Farm 2 GaoQiqiang Aquaculture | | * | | | 17,403,959 | | | | 17,403,959 | | | C | | Cattle farm 2 | | * | | | 5,502,001 | | | | 5,513,263 | | | | | | | | | $ | 34,905,960 | | | $ | 34,917,222 | |
The Company made temporary deposits paid to entities for equity investments in future Sino Joint Venture companies (“SJVCs”) engaged in projects development of trade and seafood centers, fish, prawns and cattle farms. Such temporary deposits represented as deposits of the respective consideration required for the purchase of equity stakes of respective future SJVCs. The amounts were classified as temporary because legal procedures of formation of SJVCs have not yet been completed. As of December 31, 2018, the percentages of equity stakes of A (trade and seafood centers), B (fish farm 2 GaoQiqiang Aquaculture Farm) and C (cattle farm 2) are 31%, 23% and 35% respectively. | * | The above amounts were subject to conversion to an additional equity investment in the investees upon the completion of legal procedures of formation of SJVCs. |
| 19. | VARIABLE INTEREST ENTITY |
On September 28, 2009, APWAM acquired the PMH’s 45% equity interest in the Sino-Foreign joint venture company, Qinghai Sanjiang A Power Agriculture Co. Limited (“SJAP”), which was incorporated in the P.R.C. As of December 31, 2018, the Company has invested $2,251,359 in this joint venture. SJAP is engaged in its business of the manufacturing of organic fertilizer, livestock feed, and beef cattle and plantation of crops and pastures. Continuous assessment of the VIE relationship with SJAP The Company may also have a controlling financial interest in an entity through an arrangement that does not involve voting interests, such as a VIE. The Company evaluates entities deemed to be VIE’s using a risk and reward model to determine whether to consolidate. A VIE is an entity (1) that has total equity at risk that is not sufficient to finance its activities without additional subordinated financial support from other entities, (2) where the group of equity holders does not have the power to direct the activities of the entity that most significantly impact the entity’s economic performance, or the obligation to absorb the entity’s expected losses or the right to receive the entity’s expected residual returns, or both, or (3) where the voting rights of some investors are not proportional to their obligations to absorb the expected losses of the entity, their rights to receive the expected residual returns of the entity, or both, and substantially all of the entity’s activities either involve or are conducted on behalf of an investor that has disproportionately fewer voting rights. SINO AGRO FOOD, INC. NOTES TO CONSOLIDATED FINANCIAL STATEMENTS | 19. | VARIABLE INTEREST ENTITY (CONTINUED) |
The Company also quantitatively and qualitatively examined if SJAP is considered a VIE. Qualitative analyses considered the extent to which the nature of its variable interest exposed the Company to losses. For quantitative analyses, the Company also used internal cash flow models to determine if SJAP was a VIE and, if so, whether the Company was the primary beneficiary. The projection of these cash flows and probabilities thereof requires significant managerial judgment because of the inherent limitations that relate to the use of historical data for the projection of future events. On December 31, 2012,2018, the Company evaluated the above VIE testing results and concluded that the Company is the primary beneficiary of SJAP’s expected losses or residual returns and that SJAP qualifies as a VIE of the Company. As result, the Company has consolidated SJAP as a VIE. The reasons for the changes are as follows: • Originally, the board of directors of SJAP consisted of 7 members; 3 appointees from Qinghai Sanjiang (one stockholder), 1 from Garwor (one stockholder), and 3 from the Company, such that the Company did not have majority interest represented on the board of directors of SJAP.
| · | Originally, the board of directors of SJAP consisted of 7 members; 3 appointees from Qinghai Sanjiang (one stockholder), 1 from Garwor (one stockholder), and 3 from the Company, such that the Company did not have majority interest represented on the board of directors of SJAP. |
• On May 7, 2010, Qinghai Sanjiang sold and transferred its equity interest in SJAP to Garwor. The State Administration for Industry and Commerce of Xining City Government of the People’s Republic of China approved the sale and transfer.
SINO AGRO FOOD, INC. AND SUBSIDIARIES
NOTES TO CONSOLIDATED FINANCIAL STATEMENTS
| · | On May 7, 2010, Qinghai Sanjiang sold and transferred its equity interest in SJAP to Garwor. The State Administration for Industry and Commerce of Xining City Government of the P.R.C. approved the sale and transfer. |
Consequently Garwor and the Company agreed that the new board of directors of SJAP would consist of 3 members; 1 appointee from Garwor and 2 appointees from the Company, such that the Company now had a majority interest in the board of directors of SJAP. Also, and in accordance with the Company’s Sino Joint Venture Agreement, the Company’s management appointed the chief financial officer of SJAP. As a result, the financial statements of SJAP were included in the consolidated financial statements of the Company. PursuantContinuous assessment of the VIE relationship with QZH
The Company may also have a controlling financial interest in an entity through an arrangement that does not involve voting interests, such as a VIE. The Company evaluates entities deemed to be VIE’s using a risk and reward model to determine whether to consolidate. A VIE is an agreement dated August 1, 2006 between Infinity Environmental Group Limited (“Infinity”)entity (1) that has total equity at risk that is not sufficient to finance its activities without additional subordinated financial support from other entities, (2) where the group of equity holders does not have the power to direct the activities of the entity that most significantly impact the entity’s economic performance, or the obligation to absorb the entity’s expected losses or the right to receive the entity’s expected residual returns, or both, or (3) where the voting rights of some investors are not proportional to their obligations to absorb the expected losses of the entity, their rights to receive the expected residual returns of the entity, or both, and substantially all of the entity’s activities either involve or are conducted on behalf of an investor that has disproportionately fewer voting rights. The Company also quantitatively and qualitatively examined if QZH is considered a VIE. Qualitative analyses considered the extent to which the nature of its variable interest exposed the Company to losses. For quantitative analyses, the Company also used internal cash flow models to determine if QZH was a VIE and, if so, whether the Company was granted an A Power Technology License with the conditionprimary beneficiary. The projection of these cash flows and probabilities thereof requires significant managerial judgment because of the inherent limitations that relate to the use of historical data for the projection of future events. Before December 30, 2017, the Company was required to payevaluated the license fee covering 500 units of APM as performance payment to Infinity on or before July 31, 2008. This license allows the Company to develop service, manageabove VIE testing results and supply A Power Technology Farms in the PRC using the A Power Technology, but subject to a conditionconcluded that the Company is required to paythe primary beneficiary of QZH’s expected losses or residual returns and that QZH qualifies as a license fee to Infinity onceVIE of the Company. As result, the Company has soldconsolidated QZH as a VIE. The reasons for the license to its customer. Under the said license, the Company has the right to authorize developers and/or joint venture partners to develop A Power Technology Farms in the PRC. Infinity isQZH qualified as a company incorporated in Australia.VIE are as follows: | · | Originally, SJAP was sole stockholder of QZH, owned 100% equity interest in QZH and controlled directorship of QZH. |
| · | On October 25, 2015, both QZH and new stockholder, Qinghai Quanwang Investment Management Co., Ltd (“QQI”) contributed additional capital of $4,157,682 and $769,941, respectively. As of result, SJAP decreased its equity interest from 100% to 86% and QQI owned 14% equity interest. In addition, according to investment agreement between QZH and QQI, (i) QQI only enjoyed interest 6% annually on its capital contribution and did not enjoy any profit distribution; (ii) investment period was 3 years only, and (iii) SJAP shared 100% on profit or loss after deduction 6% interest to QQI and enjoyed 100% voting rights of QZH’s board and stockholders meetings. |
| · | Consequently, the Company still indirectly control directorship of QZH, such that the Company now had a majority interest in the directorship of QZH. Also, and in accordance with the Company’s Sino Joint Venture Agreement, the Company’s controlled QZH’s chief financial officer appointment. As a result, the financial statements of QZH were included in the consolidated financial statements of the Company. |
As of December 30, 2017, QZH was derecognized as a VIE. SINO AGRO FOOD, INC. NOTES TO CONSOLIDATED FINANCIAL STATEMENTS | 21.20. | OTHER PAYABLESCONSTRUCTION CONTRACT |
| | | 2012 | | | 2011 | | | | | | | | | | | Due to third parties | | $ | 877,259 | | | $ | 10,794,449 | | | Promissory notes issued to third parties | | | 3,352,394 | | | | - | | | Convertible notes payable | | | 232,000 | | | | - | | | Due to local government | | | 2,192,825 | | | | - | | | Due to employees and others | | | - | | | | 1,114,848 | | | Land use rights payable | | | - | | | | 58,851 | | | | | $ | 6,654,478 | | | $ | 11,968,148 | |
| (i) | Costs and estimated earnings in excess of billings on uncompleted contracts |
| | | 2018 | | | 2017 | | | | | | | | | | | Costs | | $ | 6,186,261 | | | $ | 8,208,912 | | | Estimated earnings | | | 4,777,300 | | | | 6,740,289 | | | Less: Billings | | | (10,712,733 | ) | | | (13,700,014 | ) | | Costs and estimated earnings in excess of billings on uncompleted contracts | | $ | 250,828 | | | $ | 1,249,187 | |
| (ii) | Billings in excess of costs and estimated earnings on uncompleted contracts |
| | | 2018 | | | 2017 | | | | | | | | | | | Billings | | $ | 47,929,092 | | | $ | 41,543,554 | | | Less: Costs | | | (29,094,568 | ) | | | (23,980,880 | ) | | Estimated earnings | | | (13,486,231 | ) | | | (11,822,609 | ) | | Billing in excess of costs and estimated earnings on uncompleted contracts | | $ | 5,348,293 | | | $ | 5,740,065 | |
| | | 2018 | | | 2017 | | | | | | | | | | | Billings | | $ | 58,641,825 | | | $ | 55,243,568 | | | Less: Costs | | | (35,280,829 | ) | | | (32,189,792 | ) | | Estimated earnings | | | (18,263,531 | ) | | | (18,562,898 | ) | | Billing in excess of costs and estimated earnings on uncompleted contracts | | $ | 5,097,465 | | | $ | 4,490,878 | |
| | | 2018 | | | 2017 | | | | | | | | | | | Due to third parties | | $ | 13,068,387 | | | $ | 11,133,656 | | | Straight note payable (note 23(i)) | | | 29,367,999 | | | | 29,367,999 | | | Promissory notes issued to third parties | | | 7,792,774 | | | | 11,089,779 | | | Due to local government | | | 87,425 | | | | 91,827 | | | | | $ | 50,316,585 | | | $ | 51,683,261 | | | | | | | | | | | | | Less: Amount classified as non-current liabilities | | | | | | | | | | Promissory notes issued to third parties | | | (7,792,774 | ) | | | (11,089,779 | ) | | Amount classified as current liabilities | | $ | 42,523,811 | | | $ | 40,593,482 | |
Due to third parties employees and others are unsecured, interest free and have no fixed terms of repayment. | | | 2012 | | | 2011 | | | | | | | | | | | Due to third parties | | $ | - | | | $ | 867,413 | |
Due to third parties represents short term advances to various companies and individuals that in the opinion of management are for the benefit of the Company. These advances are unsecured, interest fee, have no fixed terms of repayment and are due upon demand by the Company.
| 23. | CONSTRUCTION CONTRACTS |
| (i) | Construction Billing in Excess of Costs and Estimated Earnings on uncompleted contracts. |
| | | 2012 | | | 2011 | | | | | | | | | | | Billings | | $ | 9,810,427 | | | $ | 19,066,400 | | | Less: Costs | | | (1,886,705 | ) | | | (8,249,145 | ) | | Estimated earnings | | | (5,133,638 | ) | | | (8,855,136 | ) | | Billing in excess of costs and estimated earnings on uncompleted contract | | $ | 2,790,084 | | | $ | 1,962,119 | |
SINO AGRO FOOD, INC. AND SUBSIDIARIES NOTES TO CONSOLIDATED FINANCIAL STATEMENTS | (ii)22. | Costs and estimated earnings in excess of billing on uncompleted contractsBORROWINGS |
| | | 2012 | | | 2011 | | | | | | | | | | | Costs | | $ | 3,755,046 | | | $ | 887,540 | | | Estimated earnings | | | 8,307,452 | | | | 1,974,204 | | | Less: Billings | | | (9,725,618 | ) | | | (2,405,640 | ) | | Costs and estimated earnings in excess of billings on uncompleted contract | | $ | 2,336,880 | | | $ | 456,104 | |
| (iii) | Billings on uncompleted contracts in excess of costs and estimated earning |
| | | 2012 | | | 2011 | | | | | | | | | | | Billings | | $ | 19,536,045 | | | $ | 21,472,040 | | | Less: Costs | | | (5,641,751 | ) | | | (9,136,685 | ) | | Estimated earnings | | | (13,441,090 | ) | | | (10,829,340 | ) | | Billing in excess of costs and estimated earnings on uncompleted contract | | $ | 453,204 | | | $ | 1,506,015 | |
There are no provisions in the Company’s bank borrowings and long term debts that would accelerate repayment of debt as a result of a change in credit ratings or a material adverse change in the Company’s business. Under certain agreements, the Company has the option to retire debt prior to maturity, either at par or at a premium over par. | Name of lender | | Interest
rate | | | Term | | 2018 | | | 2017 | | | | | | | | | | | | | | | China Development Bank
Qinghai Province, the P.R.C. | | | 5.2835 | % | | November 29, 2017 - November 28, 2018 | | | - | | | | 3,060,913 | | | | | | | | | | | | | | | | | | China Development Bank
Qinghai Province, the P.R.C. | | | 5.2835 | % | | December 14, 2017 - December 13, 2018 | | | - | | | | 1,530,455 | | | | | | | | | | | | | | | | | | China Development Bank
Qinghai Province, the P.R.C | | | 4.7306 | % | | December 27, 2018 - December 27, 2019 | | | 4,371,265 | | | | - | | | | | | | | | | | | | | | | | | | Add: current portion of a long term bank loan | | | | | | | | | 218,563 | | | | 76,522 | | | | | | | | | | | | | | | | | | | Short term bank loans | | | | | | | | | 4,589,828 | | | | 4,667,890 | | | | | | | | | | | | | | | | | | China Development Bank
Qinghai Province, the P.R.C. | | | 5.39 | % | | December 16, 2016 - December 15, 2026 | | | 5,755,501 | | | | 6,121, 824 | | | | | | | | | | | | | | | | | | | Less: current portion of long term bank loan | | | | | | | | | (218,563 | ) | | | (76,522 | ) | | | | | | | | | | | | | | | | | | Long term bank loans | | | | | | | | $ | 5,536,938 | | | $ | 6,045,302 | |
Short
On November 29, 2017 and December 14, 2017, the Company obtained two 1-year short term bank loanloans of RMB20 million (approximately $3.06million) and RMB10 million (approximately $1.53million) respectively from China Development Bank for the period from November 29, 2017 to November 28, 2018 and December 14, 2017 to December 13, 2018 respectively, bearing fixed interest at 5.2835% per annum. Both loans were guaranteed by Xining City SME Guarantee Corporation and have been repaid on November 28, 2018 and December 13, 2018, respectively. | Name of bank | | Interest rate | | | Term | | 2012 | | | 2011 | | | | | | | | | | | | | | | | Agricultural Bank of China | | | 6 | % | | August 8, 2012 - August 29, 2013 | | | | | | | | | | Huangyuan County Branch, Xining City, Qinghai Province, | | | | | | | | | | | | | | | | P.R.C. | | | | | | | | $ | 3,181,927 | ^* | | $ | - | |
On December 16, 2016, the Company obtained a 10-year long term loan of RMB40million (approximately $6.05million) from China Development Bank for the period from December 16, 2016 to December 15, 2026, bearing an annual interest rate at 110% of the benchmark rate of PBOC on the date of the loan agreement and will be adjusted in line with any adjustment of the benchmark rate which is 5.39% (2017: 5.39%). The loan was guaranteed by Mr. Zhao Yilin and Ms. Song Haixian, Mr. Zhao Yilin’s wife. The loan was also secured by land use right with net carrying amount of $397,269 as of December 31, 2018 (2017: 429,982) and a batch of plant, machinery and equipment with net carrying amount of $5,326,385 (2017: 5,954,915). On December 14, 2018, RMB500,000 (approximately $75,563) was repaid to the bank. According to the loan agreement, RMB1,500,000 (approximately $218,563) was schedule to be repaid by November 20, 2019 in two partial repayments. On December 27, 2018, the Company obtained a 1-year short term loan of RMB30 million (approximately $4.37 million) from China Development Bank for the period from December 27, 2018 to December 27, 2019, bearing fixed interest at 4.7306% per annum. This loan was guaranteed by Xining City SME Guarantee Corporation. The above note agreements contained regular provisions requiring timely repayment of principals and accrued interests, payment of default interest in the event of default, and without specific financial covenants. Management of the Company believes the Company is in material compliance with the terms of the loan agreements. SINO AGRO FOOD, INC. NOTES TO CONSOLIDATED FINANCIAL STATEMENTS | 23. | CONVERTIBLE NOTE PAYABLES |
| (i) | On August 29, 2014, the Company completed the closing of a private placement financing transaction with an accredited investor, which purchased a 10.5% Convertible Note (the “Note 1”) in the aggregate principal amount of up to $33,300,000. The Company received the total advance of $11,632,450. The Company shall offer investor a discount equal to 25% of the amount of the principal advanced by the investor. |
Interest on the note shall accrue on the outstanding principal balance of this Note from August 29, 2014. Interest shall be payable quarterly on the last day of each of March, June, September and December commencing September 30, 2014 provided, however, that note holder may elect to require the Company to issue to the note holder a promissory note in lieu of cash in satisfaction of any interest due and payable at such time. Any interest payment note shall be subject to the same terms as the note. The note has a maturity date of February 28, 2020. The note is convertible, at the discretion of the note holder, into shares of the Company’s common stock (i) at any time following an Event of Default, or (ii) for a period of thirty (30) calendar days following October 31, 2015 and each anniversary thereof, at an initial conversion price per share of $1.00, subject to adjustment for stock splits, reverse stock splits, stock dividends and other similar transactions and subject to the terms of the note. As long as the note is outstanding, the investor shall have a right of first refusal, exercisable for thirty (30) calendar days after notice to the note holder, to purchase securities proposed to be offered and sold by the Company. The Company and the note holder entered into a restructuring agreement regarding the settlement of the Note 1. Both parties have agreed to restructure the indebtedness represented by Note 1 as follows: (a) SIAF issues 5,196,333 shares of its common stock and transfer 400,000 shares of TRW to the note holder; and (b) SIAF executes a new promissory note in the principal amount of $15,589,000 to the note holder to be paid in installments over a period of time. However, both parties remain open to negotiate an all-cash settlement of the Note 1. As a result, the amount outstanding under Note 1 was reclassified as other payables – straight note payable of $29,367,999 (see Note 21) and a loss on restructuring of $6,225,204 which representing the non-amortized part of the discount upon the issuing of the convertible bond incurred during the year. | (ii) | On October 20, 2017, the Company issued another Convertible Note (the "Note 2") with a principal amount of $4,000,000 due on February 28, 2018. The note holder had the option to convert all or any part of the outstanding note into the common stock of the Company (the "Primary Optional Conversion") or TRW (the "Secondary Optional Conversion") at any time for a period of eight months from the note's maturity date. The conversion price for Primary Optional Conversion is lesser of $1.5 per share or at 65% of the market share price of the Company. While the conversion price for Secondary Optional Conversion is $3.41 per share subject to equitable adjustment for stock split, stock dividend or right offerings. |
Under the agreement, the Company shall pay the note holder 120,000 common shares of SIAF or 32,000 common shares of TRW as an origination fee. The note bears a flat interest payment which shall be settled by 200,000 common shares of SIAF or 55,000 common shares of TRW. As of December 31, 2018, no settlement for both origination fee and interest payment. The supplemental agreement to the Bond Subscription Agreement with the Subscriber to extend the Bond Issue by a year to December 31, 2018 was signed. All other terms and conditions of the Bond Subscription Agreement and the Conditions continue in full force and effect. | | | 2018 | | | 2017 | | | | | | | | | | | (i) 10.50% convertible note due February 28, 2020 | | $ | - | | | $ | - | | | (ii) Convertible note due December 31, 2018 | | | 3,894,978 | | | | 3,894,978 | | | | | | 3,894,978 | | | | 3,894,978 | | | Less: classified as current liabilities | | | (3,894,978 | ) | | | (3,894,978 | ) | | Non-current Liabilities | | | - | | | | - | |
The fair value of the conversion option was approximately $211,320, the Company discounted the note and created a derivative liability, which will be evaluated each quarter and adjusted for any change in value. For the year ended December 31, 2018 and 2017, the Company recognized the amortization of the discount of approximately $nil and $106,297, respectively. The Company estimated the fair value of the derivative liabilities using the Binomial Option Pricing Model and the following key assumptions during 2018 | | ^ | personal and corporate guaranteed by third parties.2018 | | | Expected dividends | * | secured by land use rights with net carrying amount of $528,240. | - | | | Expected term (years) | | | 0.34 | | | Volatility | | | 52.09% - 54.32% | | | Risk-free rate | | | 1.65% - 1.9% | |
SINO AGRO FOOD, INC. NOTES TO CONSOLIDATED FINANCIAL STATEMENTS | Name of lender | | Interest rate | | | Term | | 2012 | | | 2011 | | | | | | | | | | | | | | | | Gan Guo Village Committee | | | 12.22 | % | | June 2012 - June 2017 | | | | | | | | | | Bo Huang Town | | | | | | | | | | | | | | | | Huangyuan County, Xining City | | | | | | | | | | | | | | | | Qinghai Province, P.R.C. | | | | | | | | $ | 175,006 | | | $ | - | |
The following table sets forth, by level within the fair value hierarchy, the Company’s financial liabilities that were accounted for at fair value as of December 31, 2018 and 2017 | | | Level 1 | | | Level 2 | | | Level 3 | | | Total | | | | | $ | | | $ | | | $ | | | $ | | | LIABILITIES: | | | | | | | | | | | | | | Derivative liabilities as of December 31, 2018 | | | - | | | | - | | | | 2,100 | | | | 2,100 | | | Derivative liabilities as of December 31, 2017 | | | - | | | | - | | | | 2,100 | | | | 2,100 | |
The following table represents the change in the fair value of the derivative liabilities during the year ended December 31, 2018 | | $ | | | Fair value of derivative liabilities as of December 31, 2017 | | | 2,100 | | | Change in fair value of derivative liabilities | | | - | | | Fair value of derivative liabilities as of December 31, 2018 | | | 2,100 | |
The above note agreement contained regular provisions requiring timely repayment of principals and accrued interests, payment of default interest in the event of default, default and optional conversion and without specific financial covenants. Management of the Company believes the Company is in material compliance with the terms of the convertible note agreement. SINO AGRO FOOD, INC. NOTES TO CONSOLIDATED FINANCIAL STATEMENTS | 25.24. | SHAREHOLDERS’ EQUITY |
The Group’s share capital as atof December 31, 20122018 and December 31, 2011shown2017 shown on the consolidated balance sheet represents the aggregate nominal value of the share capital of the Company as atof that date. Common Stock: On March 22, 2010,November 10, 2014, the Company designated 100 sharesapproved an amendment to the Corporation’s Articles of Series A preferredIncorporation to effectuate a reverse stock at asplit (the “Reverse Split”) of the Corporation’s common stock, par value $0.001 per share of $0.001. As of(the “Common Stock”) affecting both the same date, 100 shares of Series A preferred stock were issued at $1 per share for cash in the amount of $100. The Series A Preferred Stock:
| (i) | does not pay a dividend; |
SINO AGRO FOOD, INC. AND SUBSIDIARIES
NOTES TO CONSOLIDATED FINANCIAL STATEMENTS
| (ii) | votes together with the shares of Common Stock of the Corporation as a single classauthorized and regardless of the number of shares of Series A Preferred Stock outstanding and as long as at least one of such shares of Series A Preferred Stock is outstanding, shall represent eighty percent (80%) of all votes entitled to be voted at any annual or special meeting of shareholders of the Corporation or action by written consent of shareholders. Each outstanding share of the Series A Preferred Stock shall represent its proportionate share of the 80%, which is allocated to the outstanding shares of Series A Preferred Stock; and |
| (iii) | ranks senior to common stockholders, holders of Series B convertible preferred stockholders and any other stockholders on liquidation. |
The Company has designated 100 shares of Series A preferred stock with 100 shares issued and outstanding asnumber of such shares by a ratio of 9.9 for 1. The Reverse Split became effective in the State of Nevada on December 16, 2014. Subsequent to the December 31, 20122014, the Board of directors and 2011, respectively.
The Series B Convertible Preferred Stock:
On March 22, 2010, the Company designated 7,000,000holders of a majority of the voting power of our stockholders of the company have approved an amendment to articles of incorporation to increase its authorized shares of Series B convertible preferred stock at a par value per share of $0.001. The Series B convertible preferred stock is redeemable, the stockholders are not entitledCommon Stock from 17,171,716 to receive any dividend and voting rights but rank senior over common stockholders on liquidation, and can convert to common stock on a one for one basis at any time. On June 26, 2010, 7,000,000 shares of common stock were surrendered for cancellation and the Company issued 7,000,000 shares of Series B convertible preferred stock at $1.00 per share. Pursuant to share exchange agreement made as of December 22, 2012, between the Company and a stockholder, Capital Adventure Inc., a holder of 3,000,000 shares of common shares, with the consent of Board of Directors, to exchange for 3,000,000 shares of Series B convertible preferred stock on one-for-one basis. As of December 23, 2012, 3,000,000 shares of Series B convertible preferred stock were issued to Capital Adventure Inc., for the exchange of its holding of 3,000,000 shares of common stocks. As of December 31, 2012, 3,000,000 shares of common stocks were still not returned to the Company.
There were 10,000,000 shares and 7,000,000 shares of Series B convertible preferred stock issued and outstanding as of December 31, 2012 and December 31, 2011, respectively.
The Series F Non-Convertible Preferred Stock:
On August 13, 2012, the Company designated 1,000,000 shares of preferred stock with a par value per share of $0.001 as Series F Non-Convertible Preferred Stock with a face value of $1.00 per share with 0 shares issued and outstanding as of December 31, 2012.22,727,272.
The Series F Non-Convertible Preferred Stock:Board of directors and the holders of a majority of the voting power of our stockholders of the company have approved an amendment to articles of incorporation to increase its authorized shares of Common Stock from 22,727,272 to 27,000,000 and the amendment was filed on December 28, 2016. | (ii) | except for (iv), with respect to dividend rights, rights on liquidation, winding up and dissolution, rank junior and subordinate to (a) all classes of Common Stock,(b) all other classes of Preferred Stock and (c) any class or series of capital securities of the Company. |
| (iii) | except for (iv), shall not entitled to receive any dividend; and |
| (iv) | on May 30, 2014, the holders of recordThe Board of directors and the holders of a majority of the voting power of our stockholders of the company have approved an amendment to articles of incorporation to increase its authorized shares of Series F Non-Convertible Preferred Stock shall be entitled to a coupon payment directly from the Company at the redemption rate of $3.40 per share. Upon redemption, the Record Holder shall no longer own any shares of Series F that have been redeemed, and all such redeemed shares shall disappear and no longer exist on the books and records of the Company; redeemed shares of Series F which no longer exist upon redemption shall thereafter be counted toward the authorized but unissued “blank check” preferred stock of the Company. |
Common Stock: from 27,000,000 to 50,000,000 and the amendment was filed on August 24, 2017 with an effective date of August 25, 2017. During the year ended December 31, 2011: (i)2017, the Company reacquired 1,000,000(i) issued 1,167,502 shares of its common stock which became treasury shares, for $1,250,000employees and directors at a pricefair value of $1.25 per share; (ii) the Company issued 15,619,397 shares of common stock for $12,499,902 at values ranging from$0.50$1.00 to $1.50$3.45 per share to settle debts due to third parties; (iii) the Company purchased 8,620,000 shares for $1,579,400 at prices ranging from $0.01 to $0.78$1,454,352 for cancellation; (iv) the Companyemployee compensation; (ii) issued employees a total of 2,760,729500,800 shares of common stock valued to professionals at fair value of range from $0.895 per share to $1.01$1 per share for $2,667,114; and (v) the Company$500,800 for service compensation; (iii) issued 1,800,0004,074,979 shares of common stock ranging from $1.40 to a certain company that provided consulting services for$5.15 amounting to $12,053,844 as collateral to secure trade and loan facilities, and the benefit of the Company at $0.895 per share for $1,620,000. SINO AGRO FOOD, INC. AND SUBSIDIARIES
NOTES TO CONSOLIDATED FINANCIAL STATEMENTS
The Company executed several agreements with third parties to settle debts by issuance of the Company’s common stock. The shares issued by the Company were valued at the trading price of the stock on the date the shares were issued. Any excess of the fair value of the shares over the carrying cost of the debt has been reported as a gain on the extinguishment of debts of $987,518 has been credited to operations under Other income/(expenses) for the year ended December 31, 2011. As these activities were not part of our ordinary activities, we classified them as other income/(expenses).
On December 5, 2012, the Company obtained stockholder consent for the approval of an amendment to our articles of incorporation to increase our authorizedissued; and (iv) 892,735 shares of common stock no par value (the “Common Stock”), from 100,000,000 to 130,000,000. The board of directors believes that the increase in our authorized Common Stock will provide is with greater flexibility with respect to our capital structureissued for purposes including additional equity financings and stock based acquisitions.$0 as top up securities for debts loans.
During the year ended December 31, 2012,2018, the Company (i) issued (i) 32,064,588 shares of common stock for 18,193,714 at values ranging from $0.40 to $0.71 per share to settle debts due to third parties; and (ii) 906,000535,598 shares of common stock valued to employees and directors at fair value of $0.40ranging from $1 to $1.56 per share for $362,400$576,170 for employee compensation. The fair valuecompensation; (ii) issued 16,032,262 shares of the common stock valued to professionals and contractors ranging from $ 0.55 to $1.00 per share for $9,723,720 for service compensation; and (iii) issued was determined by using the trading price3,935,439 shares of the Company’s common stock on the date the Shares were issued.valued at $ 0.30 to $ 0.50 per share for 1,478,029 for settlement of debts. The Company executed several agreements with third parties to settle debts by issuancehas 49,866,174 and 29,362,875 shares of the Company’s common stock. The shares issued by the Company were valued at the trading price of the stock on the date the shares were issued. Any excess of the fair value of the shares over the carrying cost of the debt has been reported as a gain on the extinguishment of debts of $1,666,386 has been credited to operations under Other income/(expenses) for the year ended December 31, 2012. As these activities were not part of our ordinary activities, we classified them as other income/(expenses). The Company had common stock 100,004,850 and 67,034,262 issued and outstanding as of December 31, 20122018 and 2011,2017, respectively.
| 26.F-79 | CONVERTIBLE NOTES PAYABLE |
In December of 2011, the Board of Directors passed a resolution authorizing the Company to enter into an agreement to borrow funds from a third party to assist in providing a method for certain Chinese shareholders to sell their shares in the Company. The Company entered into a series of convertible promissory notes along with common stock purchase warrants whereby this third party could exercise the conversion option and settle the amount due by receiving shares of stock from these certain Chinese shareholders. The monies borrowed from this third party were deposited into a custodial account that was not controlled by the Company. The Chinese shareholders also deposited their shares with this custodian. The shares transferred to the custodian were at all times, in the opinion of management, sufficient to satisfy the obligations of the convertible promissory notes and the outstanding common stock purchase warrants. All amounts owed this financing arrangement were to be repaid through the conversion options exercised by the third party and by the deliverance of the common shares of these certain Chinese investors.
During 2012, the Company borrowed a total of $ 460,000 from this third party under five separate promissory notes. Each note carried an interest rate of 12% per annum with a maturity date of six months from the date of issuance. Under the terms of the notes, the holder of the note has the option to convert the note to common shares at a discount of 15% from the average market price of the lowest three trading prices for the common stock during the ten trading days prior to the conversion date. The Company also issued a total of 842,500 common stock purchase warrants with an exercise price of $0.50 per share with an expiration date six months from the date of issuance.
The Company calculated the fair value of the warrants and the beneficial conversion feature utilizing the Black Scholes model at the date of the issuance of each promissory note. The relative fair values were allocated to the warrants and the debt. Accordingly, a discount was created on the debt and this discount will be amortized to interest expense of the life of the debt. Debt discount amortization as of December 31, 2012 was $ 178,867.
At December 31, 2012, there was $ 232,000 principal outstanding and accrued interest in the amount of $ 9,764 that was owed under the terms of the promissory notes. The Company has recorded these amounts as payable by the Company with a corresponding asset represented by the value of the shares of the Company held by the custodian at December 31, 2012.
As indicated in the convertible promissory note footnote, during 2012, the Company borrowed a total of $ 460,000 from a third party under five separate promissory notes secured by personal guarantee of a director. Each note carried an interest rate of 12% per annum with a maturity date of six months from the date of issuance. Under the terms of the notes, the holder of the note has the option to convert the note to common shares at a discount of 15% from the average market price of the lowest three trading prices for the common stock during the ten trading days prior to the conversion date. The Company also issued a total of 842,500 common stock purchase warrants with an exercise price of $0.50 per share with an expiration date six months from the date of issuance. The Company valued the warrants on the date of issuances and recorded amounts based on their relative fair values to the debt and to the warrants. The fair value of the warrants was determined using the Black-Scholes pricing model and included the following assumptions
SINO AGRO FOOD, INC. AND SUBSIDIARIES NOTES TO CONSOLIDATED FINANCIAL STATEMENTS | Expected annual dividend rate | | | 0.00 | % | | Weighted average exercise price | | $ | 0.50 | | | Risk-free interest rate | | | 2.00 | % | | Average expected life | | | 6 months | | | Expected volatility of common stock | | | 80.00 | % | | Forfeiture rate | | | 0.00 | % |
The warrants have an exercise price of $0.5 and have a contractual life of 6 months from the date of issuance. The value of the discounts created by the warrants and beneficial conversion feature were $36,113 and $52,118, respectively. The discount related to the beneficial conversion feature will be amortized to interest expense over the life of the debt and the discount for the warrants will be amortized to interest expense over the contractual life of the warrants. The relative fair values were allocated to the warrants and the debt. Accordingly, a discount was created on the debt and this discount will be amortized to interest expense of the life of the debt.
As of December 31, 2012, the following share purchase warrants were outstanding and exercisable:
| Expiry date | | Exercise date | | | December 31, 2012 | | | | | | | | | | | January 8, 2013 | | $ | 0.50 | | | | 150,000 | | | February 15, 2013 | | $ | 0.50 | | | | 78,500 | | | April 9, 2013 | | $ | 0.50 | | | | 157,000 | | | | | | | | | | 385,500 | |
Share purchase warrant transactions and the number of share purchase warrants outstanding and exercisable are summarized as follows:
| | | 2012 | | | Exercise price | | | Number of warrants outstanding at January 1, 2012 | | | - | | | | - | | | Issued | | | 842,000 | | | $ | 0.50 | | | Exercised | | | - | | | | - | | | Expired | | | (457,000 | ) | | | - | | | Number of warrants outstanding at December 31, 2012 | | | 385,000 | | | | | |
| 28.25. | OBLIGATION UNDER OPERATING LEASES |
The Company leases (i) 2,178 square feet of agriculture space used for offices for a monthly rent of $512$804 in Enping City, Guangdong Province, PRC,P.R.C., its lease expiring on March 31, 2014;2019; and (ii) 2,3002,695 square feet of office space in Guangzhou City, Guangdong Province, PRCP.R.C. for a monthly rent of $4,238, its lease expiring on October 15, 2012; (iii)5,081 square feet of office space in Guangzhou City, Guangdong Province, PRC for a monthly rent of $11,838,$6,699, its lease expiring on July 8, 2014; and (iv) 1,555 square feet each for two staff quarter in Linli District, Hunan Province, PRC for a monthly rent of $159, its lease expiring on January 23, 2013 and May 1, 2014.2020. Lease expense was $155,119expenses were $140,132 and $64,256$159,195 for the years ended December 31, 20122018 and 2011,2017, respectively. The future minimum lease payments as of December 31, 2012,2018, are as follows: | | | 2012 | | | | | | | | Year ended December 31, 2013 | | $ | 156,401 | | | Year ended December 31, 2014 | | | 87,843 | | | Thereafter | | | - | | | | | $ | 244,244 | |
SINO AGRO FOOD, INC. AND SUBSIDIARIES
NOTES TO CONSOLIDATED FINANCIAL STATEMENTS
| Within 1 year | | $ | 83,005 | | | 2 to 5 years | | | 40,194 | | | Over 5 years | | | - | | | | | $ | 123,199 | |
| 29.26. | BUSINESS COMBINATIONSSTOCK BASED COMPENSATION |
Business combination of JFD
On February 28, 2011, TRW applied to form a corporate joint venture, Enping City Bi Tao A Power Fishery Development Co., Limited (“EBAPFD”), incorporated in the PRC. TRW owned a 25% equity interest in EBAPFD. On November 17, 2011, TRW formed Jiang Men City A Power Fishery Development Co., Limited (“JFD”) in which it acquired a 25% equity interest, while withdrawing its 25% equity interest in EBAPFD. As of December 31, 2011, the Company had invested $1,258,607 in JFD. JFD is engaged as an operator of an indoor fish farm. Prior to December 31, 2011, JFD has not commenced its principal business activity. The Company owned a 50% Interest in JFD at January 1, 2012 and at the time consolidated the Assets and operation with the Company. The Company controlled the board of directors and Voting Rights at that time. On January 1, 2012, the Company acquired an additional 25% equity interest in JFD for total cash consideration of $1,662,365. On April 1, 2012, the Company acquired an additional 25% equity interest in JFD for the amount of $1,702,580.The Company presently owns a 75% equity interest in JFD and controls its majority of votes board of directors. As result, the Company had consolidated the assets and operations of JFD.
Second acquisition on January 1, 2012 – 25% additional equity interest in JFD.
The Company allocated the purchase price on the fair value of the assets acquired as of January 1, 2012.
| Net assets at fair value acquired: | | | | | | Property, plant and equipment | | $ | 34,919 | | | Construction in progress | | | 4495306 | | | Inventory | | | 1838337 | | | | | | 6368562 | | | Less: Other payables | | | (92,603 | ) | | Non-controlling interest | | | (3,324,729 | ) | | 25% held by the Company | | | (1,662,365 | ) | | | | $ | 1,288,865 | | | Satisfied by | | | | | | Purchase consideration | | $ | 1,662,365 | | | Less: Cash acquired | | | (373,500 | ) | | | | $ | 1,288,865 | |
Third acquisition on April 1, 2012 – 25% additional equity interest in JFD.
The Company allocated the purchase price based on the fair value of the assets acquired as of April 1, 2012.
| Net assets at fair value acquired: | | | | | | Property, plant and equipment | | $ | 33,535 | | | Construction in progress | | | 4,499,376 | | | Inventory | | | 1,970,387 | | | Accounts receivable | | | 1,337,519 | | | | | | 7,840,817 | | | Less: Other payables | | | (292,663 | ) | | Accounts payable | | | (1,230,096 | ) | | Non-controlling interest | | | (1,702,580 | ) | | 50% held by the Company | | | (3,405,159 | ) | | | | $ | 1,210,319 | | | Satisfied by | | | | | | Purchase consideration | | $ | 1,702,580 | | | Less: Cash acquired | | | (492,261 | ) | | | | $ | 1,210,319 | |
SINO AGRO FOOD, INC. AND SUBSIDIARIES
NOTES TO CONSOLIDATED FINANCIAL STATEMENTS
Business combination of JHMC
Second acquisition on September 30, 2012 - 50% additional equity interest in JHMC
On April 15, 2011, MEIJI applied to form Enping City A Power Cattle Farm Co., Limited (“ECF”), all of whichMay 10, 2016, the Company would indirectly own a 25% equity interest in on November 17, 2011. On January 1, 2012, the Company had invested $1,076,489 in ECF. On September 17, 2012 MEIJI formed Jiang Men City Hang Mei Cattle Farm Development Co., Limited (“JHMC”)issued directors and acquired an additional 50% equity interest for $2,944,176 on September 30, 2012 while withdrawing its 25% equity interest in ECF. The Company presently owns a 75% equity interest in JHMC, representing majority of votes and controls its board of directors. As result, the Company has consolidated the assets and operations of JHMC. The Company allocated the purchase price based on the fair value of the assets acquired as of September 30, 2012.
| Net assets at fair value acquired: | | | | | | Property, plant and equipment | | $ | 512,450 | | | Construction in progress | | | 4,177,007 | | | Inventory | | | 671,429 | | | | | | 5,360,886 | | | Less: Non - controlling interest | | | (1,340,221 | ) | | | | $ | 4,020,665 | | | Satisfied by | | | | | | Purchase consideration | | $ | 4,020,665 | |
The following table summarizes our unaudited consolidated results of operations for the years ended December 31, 2012 and 2011, as well as unaudited consolidated results of operations as though the JFD and JHMC acquisitions had occurred on January 1, 2011.
| | | 2012 | | | 2011 | | | | | As reported | | | Pro Forma | | | As reported | | | Pro Forma | | | | | | | | | | | | | | | | | Revenue | | $ | 138,612,639 | | | $ | 128,725,067 | | | $ | 51,879,903 | | | $ | 47,718,758 | | | Net income from continuing operations | | $ | 57,545,832 | | | $ | 50,655,603 | | | $ | 15,691,032 | | | $ | 14,041,347 | | | Net income from discontinued operations | | $ | - | | | $ | - | | | $ | 10,203,951 | | | $ | 10,203,951 | | | Total net income from continuing and discontinued operations | | $ | 57,545,832 | | | $ | 50,655,603 | | | $ | 25,894,983 | | | $ | 24,245,298 | | | From continuing and discontinued operations Earning per share | | | | | | | | | | | | | | | | | | Basic | | $ | 0.70 | | | $ | 0.68 | | | $ | 0.43 | | | $ | 0.40 | | | Diluted | | $ | 0.63 | | | $ | 0.55 | | | $ | 0.39 | | | $ | 0.36 | | | From continuing operations Earning per share | | | | | | | | | | | | | | | | | | Basic | | $ | 0.70 | | | $ | 0.68 | | | $ | 0.26 | | | $ | 0.23 | | | Diluted | | $ | 0.63 | | | $ | 0.55 | | | $ | 0.23 | | | $ | 0.21 | |
The unaudited pro forma information set forth above is for informational purpose only and include adjustments related to elimination of revenue from JFD and JHMC before acquisition of equity interests. The pro forma information should not be considered indicative of actual results that would have been achieved if JFD and JHMC have been acquired at the beginning of 2011 or results that may be obtained in any future period.
| 30. | STOCK BASED COMPENSATION |
On July 1, 2011 and July 11, 2011, the Company issued employees a total of 2,760,7291,199,068 shares of common stock valued at fair value of range from $0.895 per share to $1.00$5.98 per share for services rendered to the Company. On July 11, 2011, the Company issued 1,800,000 shares of common stock to a company to provide consulting services for the benefit of the Company. The fair valuevalues of the common stock issued waswere determined by using the trading price of the Company’s common stock on the date of issuance of $0.895$5.98 per share.
SINO AGRO FOOD, INC. AND SUBSIDIARIES
NOTES TO CONSOLIDATED FINANCIAL STATEMENTS
The Company calculated stock based compensation of $4,278,114 and recognized $2,139,057 for On the year ended December 31, 2011. As of December 31, 2011, the deferred compensation balance was $2,139,057, and the deferred compensation balance of $2,139,057 was to be amortized over 6 months beginning on January 1, 2012.
On August 16, 2012,same date, the Company issued employeesprofessionals a total of 100,000132,787 shares of common stock valued at fair value of range from $0.40$5.98 per share for services rendered to the Company. On the same date, the Company issued 906,000 shares of common stock to a company to provide consulting services for the benefit of the Company. The fair valuevalues of the common stock issued waswere determined by using the trading price of the Company’s common stock on the date of issuance of $0.40$5.98 per share.
The Company calculated stock based compensation of $2.501,457$7,965,624 and recognized $2,229,657$4,345,993 for the year ended December 31, 2012.2016. As of December 31, 2012,2016, the deferred compensation balance for staff was $271,800$3,982,813 and thisthe deferred compensation balance of $271,800$3,982,813 was to be amortized over 96 months beginning on January 1, 2013.2017. On June 30, 2017, the Company issued employees total of 117,000 shares of common stock valued at fair value of $3.45 per share for services rendered to the Company. The fair values of the common stock issued were determined by using the trading price of the Company’s common stock on the date of issuance of $3.45 per share. On December 31, 2017, the Company issued employees total of 500,800 shares of common stock valued at fair value of $1 per share for services rendered to the Company. The fair values of the common stock issued were determined by using the trading price of the Company’s common stock on the date of issuance of $3.45 per share. On December 31, 2017, the Company issued employees total of 1,050,502 shares of common stock valued at fair value of $1 per share for services rendered to the Company. The fair values of the common stock issued were determined by using the trading price of the Company’s common stock on the date of issuance of $1 per share. The Company calculated stock based compensation of 2,952,327 and 5,937,765 and recognized $2,308,869 and $4,184,638 for the year ended December 31, 2018 and 2017, respectively. As of December 31, 2018, the deferred compensation balance for staff was $296,096 and $347,362 which were to be amortized over 3 months and 6 months, respectively beginning on January 1, 2019. As of December 31, 2017, the deferred compensation balance for staff was $2,101,825 and $1,551,302 were to be amortized over 6 months and 1 year, respectively beginning on January 1, 2018. SINO AGRO FOOD, INC. NOTES TO CONSOLIDATED FINANCIAL STATEMENTS As
On March 26, 2019, a shareholder derivative complaint was filed in the United States District Court for the Southern District of December 31, 2012 and 2011,New York against the Company, didas well as four of its current directors. The Complaint alleges violations of securities law and state law, breaches of fiduciary duties (including gross mismanagement of the Company) by the individual defendants, a material default of its obligations under a commercial loan agreement, misleading and false statements (including material omissions) by the individual defendants, and unauthorized issuance of new shares of Common Stock to pay debts that, in the view of the plantiffs, has diluted shareholder ownership and oppressed shareholders of the Company. The Company and the individual defendants believe that these claims are without merit and intend to vigorously defend against the Complaint. Management does not have any pending claims, charges,currently believe that such claim and proceeding are likely, individually or litigation that it expects wouldin aggregate, to have a material adverse effect on its consolidated balance sheets, consolidated statementsthe financial condition of incomesthe Company. On September 22, 2015, the Company entered into a trade facility agreement with two independent third parties. Pursuant to the agreement, the Company provides collateral in the form of Company's common shares to a PRC based lender (the "Lender") and other comprehensive income or cash flows.the Lender agrees to provide a revolving trade facility loan up to $20,000,000 to a PRC based borrower. The arrangement was commenced on February 15, 2016 and will be expired on September 15, 2019. As of December 31, 2018, the Company has issued aggregate 5,708,312 common shares as collateral and the trade facility line reduced to $13 million. | 32.28. | GAIN ON EXTINGUISHMENT OF DEBTS |
The Company executed several agreements with third parties to settle debts by issuance of the Company’s common stock. The shares issued by the Company were valued at the trading price of the stock on the date the shares were issued. Any excess of the fair value of the shares over the carrying cost of the debt has been reported as a gain on the extinguishment of debts of $1,666,386 and $987,518 has been credited to operations under Other income/(expenses) for the years ended December 31, 2012 and 2011, respectively. As these activities were not part of our ordinary activities, we classified them as other income/(expenses).
| 33. | RELATED PARTY TRANSACTIONS |
In addition to the transactions and balances as disclosed elsewhere in these consolidated financial statements, during the years ended December 31, 20122018 and 2011,2017, the Company had the following significant related party transactions:- | Name of related party | | Nature of transactions | | | | | Mr. Xi Ming Sun, director of ZhongXingNong Nu Co., Ltd | | During the year ended December 31, 2011, the Company sold its 100% equity interest in HYT group (including HYT and ZX) for $45,000,000. During the year ended December 31, 2011, as disclosed in the statements of cash flow, disposal proceeds of HYT group amounting to $38,056,750 was settled in contra against payable of acquisition ofthe fifth and sixth land use rights as mentioned in notes 12 and 15. | | | | | | | | Included in due from related parties, due from Mr. Xi Ming Sun is $0 and $5,386,233 as of December 31, 2012 and 2011. The amount is unsecured, interest free and has a fixed term of repayment. | | | | Enping City Bi Tao A Power Prawn Culture Development Co. Limited, equity investee | | During the year ended December 31, 2011, the Company entered into a prawn farm contract with Enping Bi Tao A Power Prawn Culture Development Co. Ltd (under application) with a contract value of $8,740,980 and recognized income of $4,021,554. | | | | | | Billings in excess costs and estimated earnings on uncompleted contract, due to Enping City Bi Tao A Power Prawn Culture Development Co. Limited (under application) is $0 and $225,835 as of December 31, 2012 and 2011, respectively. The amount is unsecured, interest free and has no fixed term of repayment. | | | | Dongguan City Shenghua A Power Agriculture Development Co., Limited, stockholder of Hunan Shenghua A Power Agriculture Co., Limited | | Included in due to related parties, due to Dongguan City Shenghua A Power Agriculture Development Co., Limited is $0 and $66,000 as of December 31, 2012 and 2011. The amount is unsecured, interest free and has fixed term of repayment. |
SINO AGRO FOOD, INC. AND SUBSIDIARIES
NOTES TO CONSOLIDATED FINANCIAL STATEMENTS
Mr. Yue Xiong He, director of Jiang Men City Hang Sing Tai Agriculture Development Co Ltd, subsidiary of the Company | | Included in due to related parties, due to Mr. Yue Xiong He is $0 and $800,000 as of December 31, 2012 and 2011, respectively. The amounts are unsecured, interest free and have no fixed term of repayment. | | | | Capital Adventures, Inc. owned by Messrs. Solomon Lee Yip Kun, Tan Paoy Teik and Chen Bor Han | | During the year ended December 31, 2011, the Company purchased 7,000,000 shares of the Company from Capital Adventure, Inc. for $396,400. | | | | Xiang Jun Fang, director of Jiang Men City Hang Sing Tai Agriculture Development Co Ltd, a subsidiary of the Company | | Included in due to related parties, due to Mr. Xiang Jun Fang is $0 and $1,413 as of December 31, 2012 and 2011, respectively. The amount is unsecured, interest free and has no fixed term of repayment. |
| Mr. Solomon Yip Kun Lee, Chairman | | Included in due to a director, due to Mr. Solomon Yip Kun Lee is $3,345,803$2,046,499 and $289,764$107,074 as of December 31, 20122018 and 2011,2017, respectively. The amounts are unsecured, interest free and have no fixed termterms of repayment. | | | | | | Hang Yu Tai Investment | Tri-Way Industries Limited controlled by Mr. Xi Ming Sun(“TRW”) Unconsolidated equity investee | | Included in interest in unconsolidated equity investee, due from related parties, due from Hang Yu Tai InvestmentTri-Way Industries Limited is $0$57,354,208 and $10,434,519$58,572,766 as of December 31, 20122018 and 2011,December 31, 2017, respectively. The amount isamounts are unsecured, interest free and hashave no fixed termterms of repayment. | | | | | Jiang Men City A Power Fishery Development Co., Limited (“JFD”), equity investee | | During the year ended December 31, 2011, the Company entered into a fishery farm contract with Jiang Men City A Power Fishery Development Co., Limited with a contract value of $5,906,956 and recognized income of $3,181,774. | | | | | | | | Billings | Included in excess costs and estimated earnings on uncompleted contract,accounts receivable due to Jiang Men City A Power Fishery Development Co.,from Tri-Way Industries Limited is $0$60,799,365 and $1,484,320$49,065,385 as of December 31, 20122018 and 2011,December 31, 2017, respectively. The amount isamounts are unsecured, interest free and hashave no fixed termterms of repayment. | | | | | Jiang Men City Hang Mei Cattle Farm Development Co., Limited ("JHMC") (Formerly known as Enping City A Power Cattle Farm Co., Limited ("ECF")), an equity investee | | During the year ended December 31, 2011, the Company entered into a cattle farm contract with Jiang Men City Hang Mei Cattle Farm Development Co., Limited with a contract value of $4,418,464 and recognized income of $1,651,808. | | | | | | | | Billings in excess costs | The Company has revenue of consulting income of $11,127,393 and estimated earnings on uncompleted contract, due to Jiang Men City Hang Mei Cattle Farm Development Co.,$16,983,330 from Tri-Way Industries Limited is $0 and $251,964 as offor the year ended December 31, 20122018 and December 31, 2011,2017, respectively. The amount is unsecured, interest free and has no fixed term of repayment. |
SINO AGRO FOOD, INC. NOTES TO CONSOLIDATED FINANCIAL STATEMENTS Basic earnings per share is computed by dividing net income attributable to common shareholders by the weighted average number of common shares outstanding during the period.year. Diluted earnings per share reflects the potential dilution of securities by including other potential common stock, including convertible preferred stock, stock options and warrants, in the weighted average number of common shares outstanding for the period,year, if dilutive. The numerators and denominators used in the computations of basic and dilutive earnings per share are presented in the following table: | | | 2012 | | | 2011 | | | BASIC | | | | | | | | | | Numerator for basic earnings per share attributable to the Company’s common stockholders: | | | | | | | | | | Net income of continued operation used in computing basic earnings per share | | $ | 57,545,832 | | | $ | 15,691,0322 | | | Basic earnings per share | | $ | 0.70 | | | $ | 0.23 | | | Basic weighted average shares outstanding | | | 82,016,910 | | | | 60,158,210 | |
SINO AGRO FOOD, INC. AND SUBSIDIARIES
NOTES TO CONSOLIDATED FINANCIAL STATEMENTS
| | | 2018 | | | 2017 | | | | | | | | | | | BASIC | | | | | | | | | | | | | | | | | | | | Numerator for basic earnings per share attributable to the Company’s common stockholders: | | | | | | | | | | Net income used in computing basic earnings per share | | $ | 17,323,337 | | | $ | (13,104,145 | ) | | Basic earnings per share | | $ | 0.46 | | | $ | (0.53 | ) | | Basic weighted average shares outstanding | | | 37,336,164 | | | | 24,711,015 | |
| | | 2012 | | | 2011 | | | DILUTED | | | | | | | | | | Numerator for basic earnings per share attributable to the Company’s common stockholders: | | | | | | | | | | Net income of continued operation used in computing basic earnings per share | | $ | 57,545,832 | | | $ | 15,691,032 | | | Basic earnings per share | | $ | 0.63 | | | $ | 0.13 | | | Basic weighted average shares outstanding | | | 82,016,910 | | | | 60,158,210 | | | Add: weight average Series B Convertible preferred shares outstanding | | | 7,000,000 | | | | 7,000,000 | | | Diluted weighted average shares outstanding | | | 89,016,910 | | | | 67,158,210 | |
| | | 2012 | | | 2011 | | | BASIC | | | | | | | | | | Numerator for basic earnings per share attributable to the Company’s common stockholders: | | | | | | | | | | Net income of continued and discontinued operation used in computing basic earnings per share | | $ | 57,545,832 | | | $ | 25,894,983 | | | Basic earnings per share | | $ | 0.70 | | | $ | 0.43 | | | Basic weighted average shares outstanding | | | 82,016,910 | | | | 60,158,210 | |
| | | 2012 | | | 2011 | | | DILUTED | | | | | | | | | | Numerator for basic earnings per share attributable to the Company’s common stockholders: | | | | | | | | | | Net income of continued and discontinued operation used in computing basic earnings per share | | $ | 57,545,832 | | | $ | 25,894,983 | | | Basic earnings per share | | $ | 0.63 | | | $ | 0.39 | | | Basic weighted average shares outstanding | | | 82,016,910 | | | | 60,158,210 | | | Add: weight average Series B Convertible preferred shares outstanding | | | 7,000,000 | | | | 7,000,000 | | | Diluted weighted average shares outstanding | | | 89,016,910 | | | | 67,158,210 | |
| | | 2018 | | | 2017 | | | | | | | | | | | DILUTED | | | | | | | | | | Numerator for basic earnings per share attributable to the Company’s common stockholders: | | | | | | | | | | Net income used in computing diluted earnings per share | | $ | 17,323,337 | | | $ | (13,104,145 | ) | | Diluted earnings per share | | $ | 0.46 | | | $ | (0.53 | ) | | Diluted weighted average shares outstanding | | | 37,336,164 | | | | 24,711,015 | |
SINO AGRO FOOD, INC. AND SUBSIDIARIES
NOTES TO CONSOLIDATED FINANCIAL STATEMENTS
| 35. | RESTATEMENT OF CONSOLIDATED STATEMENTS OF CASH FLOWS |
| | | 2011 | | | | | | 2011 | | | | | As reported | | | Adjustments | | | Restated | | | Cash flows from operating activities | | | | | | | | | | | | | | Net income from continuing operations | | $ | 21,062,278 | | | | | | | $ | 21,062,278 | | | Adjustments to reconcile net income from continuing operations to net cash from operations: | | | | | | | | | | | | | | Depreciation | | | 220,810 | | | | | | | | 220,810 | | | Amortization | | | 1,043,181 | | | | | | | | 1,043,181 | | | (Gain) on extinguishment of debts | | | (987,518 | ) | | | | | | | (987,518 | ) | | Common stock issued for services and employee's compensation | | | 2,139,057 | | | | | | | | 2,139,057 | | | Changes in operating assets and liabilities: | | | | | | | | | | | | | | Increase in inventories | | | (4,477,682 | ) | | | 1,459,570 | | (1) | | (3,018,112 | ) | | Increase in deposits and prepaid expenses | | | 1,499,930 | | | | (8,874,285 | ) | (2) | | (7,374,355 | ) | | Decrease (increase) in due to a director | | | (6,313,946 | ) | | | | | | | (6,313,966 | ) | | Increase in accounts payable and accrued expenses | | | 811,258 | | | | 22,409 | | (3) | | 833,667 | | | Increase in other payables | | | 11,798,629 | | | | 4,949,414 | | (4) | | 16,748,043 | | | Increase in accounts receivable | | | (9,567,456 | ) | | | (8,683,028 | ) | (5) | | (18,250,484 | ) | | Increase in cost and estimated earnings in excess of billings on uncompleted contracts | | | (456,104 | ) | | | | | | | (456,104 | ) | | Increase in billings on uncompleted contracts in excess of costs and estimated earnings | | | 1,962,119 | | | | | | | | 1,962,119 | | | Increase in due from related parties | | | (10,434,519 | ) | | | 10,434,519 | | (6) | | - | | | Decrease (increase) in due to related parties | | | 643,529 | | | | | | | | 643,529 | | | Decrease (increase) in other receivables | | | (5,721,191 | ) | | | 2,069,514 | | (7) | | (3,651,677 | ) | | Net cash provided by operating activities | | | 3,222,375 | | | | | | | | 4,600,468 | | | | | | | | | | | | | | | | | Cash flows from investing activities | | | | | | | | | | | | | | Purchases of property and equipment | | | (252,346 | ) | | | | | | | (252,346 | ) | | Proceeds of disposal of subsidiaries | | | 557,700 | | | | | | | | 557,700 | | | Investment in unconsolidated equity investees | | | (1,258,607 | ) | | | | | | | (1,258,607 | ) | | Payment for construction in progress | | | (1,346,394 | ) | | | | | | | (1,346,394 | ) | | Net cash used in investing activities | | | (2,299,647 | ) | | | | | | | (2,299,647 | ) | | Cash flows from financing activities | | | | | | | | | | | | | | Dividends paid | | | (573,814 | ) | | | | | | | (573,814 | ) | | Net cash provided by (used in) financing activities | | | (573,814 | ) | | | | | | | (573,814 | ) | | Net cash provided by continuing operations | | | 348,914 | | | | | | | | 1,727,007 | | | Cash flows from discontinued operations | | | | | | | | | | | | | | Net cash provided by operating activities | | | - | | | | | | | | - | | | Net cash used in investing activities | | | (3,137,885 | ) | | | | | | | (3,137,885 | ) | | Net cash used in financing activities | | | - | | | | | | | | - | | | Net cash used in discontinued operations | | | (3,137,885 | ) | | | | | | | (3,137,885 | ) | | | | | | | | | | | | | | | | Effects on exchange rate changes on cash | | | 286,853 | | | | (1,378,093 | ) | (8) | | (1,091,240 | ) | | Increase in cash and cash equivalents | | | (2,502,118 | ) | | | | | | | (2,502,118 | ) | | Cash and cash equivalents, beginning of year | | | 3,890,026 | | | | | | | | 3,890,026 | | | | | | 1,387,908 | | | | | | | | 1,387,908 | | | Less: cash and cash equivalents at the end of the year - discontinued operations | | | - | | | | | | | | - | | | Cash and cash equivalents at the end of the year - continuing operations | | $ | 1,387,908 | | | | | | | $ | 1,387,908 | |
The statement of cash flows has been restated to correct an error related to the reporting of cash flows from sale of subsidiaries during the year ended December 31, 2011. The effects of this restatement are outlined below:
| (1) | | | HYT's inventories have been excluded from the statement of cash flows. | | (2) | | | HYT's deposits and prepaid expenses of $8,874,285 have been excluded from deposits and prepaid expenses. |
SINO AGRO FOOD, INC. AND SUBSIDIARIES
NOTES TO CONSOLIDATED FINANCIAL STATEMENTS
| (3) | | | HYT's accounts payable and accrued expenses of $22,409 have been excluded from deposits and prepaid expenses. | | (4) | | | HYT'S other payables have been excluded from the statement of cash flows. | | (5) | | | HYT'S accounts receivable have been excluded from the statement of cash flows. | | (6) | | | HYT's due from related parties have been excluded from the statement of cash flows. | | (7) | | | HYT's other receivables have been excluded from the statement of cash flows. | | (8) | | | The Company has recognized an additional exchange loss due to the correction regarding the HYT disposal. |
| (i) | On March 27, 2013, 3,000,000 shares of Series B convertible preferred stock were cancelled. As result, total issued and outstanding preferred stock as of that date is 7,000,100 shares. |
| (ii) | On March 28, 2013, the Company filed a prospectus related to a public offering of Common Stocks of the Company for maximum aggregate gross proceeds of $26,250,000 within a period not to exceed 180 days from the date of this prospectus. |
| (iii) | The shareholders of the Company voted to increase the authorized shares of common stock to 130,000,000 on December 5, 2012. The certificate of amendment effectuating the vote by the shareholders was filed with the State of Nevada on January 24, 2013. |
SINO AGRO FOOD, INC. AND SUBSIDIARIES
QUARTERLY FINANCIAL REPORT
FOR THE SIX MONTHS ENDED JUNE 30, 2013
INDEX TO QUARTERLY FINANCIAL REPORT
| | PAGE | | | | CONSOLIDATED BALANCE SHEETS | | F-40 | | | | CONSOLIDATED STATEMENTS OF INCOME AND OTHER COMPREHENSIVE INCOME | | F-41 | | | | CONSOLIDATED STATEMENTS OF CASH FLOWS | | F-42 | | | | NOTES TO CONSOLIDATED FINANCIAL STATEMENTS | | F-43 - F-77 |
F-39
SINO AGRO FOOD, INC.
CONSOLIDATED BALANCE SHEETS
| | | June 30, 2013 | | December 31, 2012 | | | | | (Unaudited) | | (Audited) | | | ASSETS | | | | | | | | | Current assets | | | | | | | | | Cash and cash equivalents | | $ | 9,391,449 | | $ | 8,424,265 | | | Inventories | | | 18,887,433 | | | 17,114,755 | | | Cost and estimated earnings in excess of billings on uncompleted contracts | | | 1,286,775 | | | 2,336,880 | | | Deposits and prepaid expenses | | | 52,091,997 | | | 47,308,857 | | | Accounts receivable, net of allowance for doubtful accounts | | | 82,373,870 | | | 52,948,350 | | | Other receivables | | | 6,374,272 | | | 5,954,248 | | | Total current assets | | | 170,405,796 | | | 134,087,355 | | | Property and equipment | | | | | | | | | Property and equipment, net of accumulated depreciation | | | 21,019,253 | | | 19,946,302 | | | Construction in progress | | | 38,089,142 | | | 24,492,510 | | | Land use rights, net of accumulated amortization | | | 56,379,855 | | | 55,733,246 | | | Total property and equipment | | | 115,488,250 | | | 100,172,058 | | | Other assets | | | | | | | | | Goodwill | | | 724,940 | | | 724,940 | | | Proprietary technologies, net of accumulated amortization | | | 7,906,667 | | | 8,114,624 | | | License rights | | | 1 | | | 1 | | | Total other assets | | | 8,631,608 | | | 8,839,565 | | | | | | | | | | | | Total assets | | $ | 294,525,654 | | $ | 243,098,978 | | | | | | | | | | | | LIABILITIES AND STOCKHOLDERS' EQUITY | | | | | | | | | Current liabilities | | | | | | | | | Accounts payable and accrued expenses | | $ | 8,368,834 | | $ | 5,762,643 | | | Billings in excess of costs and estimated earnings on uncompleted contracts | | | 922,375 | | | 2,790,084 | | | Due to a director | | | 3,257,085 | | | 3,345,803 | | | Dividends payable | | | - | | | 951,308 | | | Other payables | | | 10,259,178 | | | 6,654,478 | | | Short term bank loan | | | 2,265,849 | | | 3,181,927 | | | | | | 25,073,321 | | | 22,686,243 | | | Non-current liabilities | | | | | | | | | Deferred dividends payable | | | 3,146,987 | | | 3,146,987 | | | Long term debts | | | 178,031 | | | 175,006 | | | | | | 3,325,018 | | | 3,321,993 | | | Commitments and contingencies | | | - | | | - | | | | | | | | | | | | Stockholders' equity | | | | | | | | | Preferred stock: $0.001 par value | | | | | | | | (10,000,000 shares authorized, 0 share issued and outstanding as of
June 30, 2013 and December 31, 2012, respectively) | | | | | | | | | Series A preferred stock: $0.001 par value | | | - | | | - | | (100 shares designated, 100 shares issued and outstanding as of June 30,
2013 and December 31, 2012, respectively) | | | | | | | | | Series B convertible preferred stock: $0.001 par value) | | | 7,000 | | | 10,000 | | (10,000,000 shares designated, 7,000,000 and 10,000,000 shares issued and
outstanding) as of June 30, 2013 and December 31, 2012, respectively) | | | | | | | | | Series F Non-convertible preferred stock: $0.001 par value) | | | | | | | | (1,000,000 shares designated, 0 shares issued and outstanding) as of June
30, 2013 and December 31, 2012, respectively) | | | | | | | | | Common stock: $0.001 par value | | | 120,174 | | | 100,005 | | (130,000,000 shares authorized, 120,173,827 and 100,004,850
shares issued and oustanding as of June 30, 2013 and
December 31, 2012, respectively) | | | | | | | | | Additional paid - in capital | | | 100,615,051 | | | 91,216,428 | | | Retained earnings | | | 134,574,019 | | | 103,864,308 | | | Accumulated other comprehensive income | | | 5,139,044 | | | 3,868,274 | | | Treasury stock | | | (1,250,000) | | | (1,250,000) | | | Total Sino Agro Food, Inc. and subsidiaries stockholders' equity | | | 239,205,288 | | | 197,809,015 | | | Non - controlling interest | | | 26,922,027 | | | 19,281,727 | | | Total stockholders' equity | | | 266,127,315 | | | 217,090,742 | | | Total liabilities and stockholders' equity | | $ | 294,525,654 | | $ | 243,098,978 | |
The accompanying notes are an integral part of these consolidated financial statements.
SINO AGRO FOOD, INC.
CONSOLIDATED STATEMENTS OF INCOME AND OTHER COMPREHENSIVE INCOME
| | | Three | | Three | | Six | | Six | | | | | months ended | | months ended | | months ended | | months ended | | | | | June 30, 2013 | | June 30, 2012 | | June 30, 2013 | | June 30, 2012 | | | | | (Unaudited) | | (Unaudited) | | (Unaudited) | | (Unaudited) | | | | | | | | | | | | | | | | | | Revenue | | $ | 54,400,329 | | $ | 25,348,287 | | $ | 109,508,080 | | $ | 41,328,303 | | | Cost of goods sold | | | 35,009,882 | | | 11,790,039 | | | 68,594,816 | | | 19,756,463 | | | Gross profit | | | 19,390,447 | | | 13,558,248 | | | 40,913,264 | | | 21,571,840 | | | General and administrative expenses | | | (1,608,304) | | | (2,735,677) | | | (3,813,692) | | | (4,957,999) | | | Net income from operations | | | 17,782,143 | | | 10,822,571 | | | 37,099,572 | | | 16,613,841 | | | Other income | | | | | | | | | | | | | | | Government grant | | | - | | | - | | | 79,759 | | | 79,401 | | | Other income | | | 47,718 | | | 20,797 | | | 65,907 | | | 436,649 | | | Gain on extinguishment of debts | | | 498,025 | | | 562,361 | | | 1,051,013 | | | 817,513 | | | Interest expense | | | (54,958) | | | - | | | (112,010) | | | - | | | Net income | | | 490,785 | | | 583,158 | | | 1,084,669 | | | 1,333,563 | | | Net income before income taxes | | | 18,272,928 | | | 11,405,729 | | | 38,184,241 | | | 17,947,404 | | | Provision for income taxes | | | - | | | - | | | - | | | - | | | Net income | | | 18,272,928 | | | 11,405,729 | | | 38,184,241 | | | 17,947,404 | | Less: Net (income) loss attributable
to the non - controlling interest | | | (3,941,988) | | | (1,115,707) | | | (7,474,529) | | | (1,985,920) | | Net income from continuing operations attributable
to Sino Agro Food, Inc. and subsidiaries | | | 14,330,940 | | | 10,290,022 | | | 30,709,712 | | | 15,961,484 | | | Other comprehensive income | | | | | | | | | | | | | | | Foreign currency translation gain | | | 1,728,409 | | | (73,645) | | | 1,436,541 | | | 546,712 | | | Comprehensive income | | | 16,059,349 | | | 10,216,377 | | | 32,146,253 | | | 16,508,196 | | Less: other comprehensive (income) loss attributable
to the non - controlling interest | | | (217,553) | | | 23,878 | | | (165,771) | | | (131,211) | | | Comprehensive income attributable to | | | | | | | | | | | | | | | Sino Agro Food, Inc. and subsidiaries | | $ | 15,841,796 | | $ | 10,240,255 | | $ | 31,980,482 | | $ | 16,376,985 | | | Earnings per share attributable to Sino Agro Food, Inc. | | | | | | | | | | | | | | | and subsidiaries common stockholders: | | | | | | | | | | | | | | | Basic | | $ | 0.13 | | $ | 0.14 | | $ | 0.28 | | $ | 0.22 | | | Diluted | | $ | 0.12 | | $ | 0.13 | | $ | 0.27 | | $ | 0.20 | | | Weighted average number of shares outstanding: | | | | | | | | | | | | | | | Basic | | | 115,366,595 | | | 73,836,392 | | | 110,403,819 | | | 71,312,129 | | | Diluted | | | 122,366,595 | | | 80,836,392 | | | 117,403,819 | | | 78,312,129 | |
SINO AGRO FOOD, INC.
CONSOLIDATED STATEMENTS OF CASH FLOWS
| | | Six months ended | | Six months ended | | | | | June 30, 2013 | | June 30, 2012 | | | | | (Unaudited) | | (Unaudited) | | | | | | | | (Restated) | | | Cash flows from operating activities | | | | | | | | | Net income | | $ | 38,184,241 | | $ | 17,947,404 | | | Adjustments to reconcile net income to net cash from operations: | | | | | | | | | Depreciation | | | 638,671 | | | 183,154 | | | Amortization | | | 976,294 | | | 1,138,176 | | | Common stock issued for services | | | 181,200 | | | 2,139,057 | | | Gain on extinguishment of debts | | | (1,051,013) | | | (817,513) | | | Changes in operating assets and liabilities: | | | | | | | | | Increase in inventories | | | (1,842,406) | | | (4,618,431) | | (Increase) decrease in cost and estimated earnings in excess of
billings on uncompleted contacts | | | 1,050,105 | | | (1,966,711) | | | Increase in deposits and prepaid expenses | | | (4,783,140) | | | (10,893,566) | | | Increase in due to a director | | | 8,264,907 | | | 346,076 | | | Increase (decrease) in accounts payable and accrued expenses | | | 2,606,191 | | | (509,997) | | | (Decrease) increase in other payables | | | 3,608,856 | | | 9,426,533 | | | (Increase) decrease in accounts receivable | | | (29,425,520) | | | (5,173,526) | | (Decrease) increase in billings in excess of costs and estimated earnings
on uncompleted contracts | | | (1,867,709) | | | 578,889 | | | Decrease in amount due to related parties | | | - | | | (52,321) | | | Increase in other receivables | | | (420,024) | | | (839,683) | | | Net cash provided by operating activities | | | 16,120,653 | | | 9,887,541 | | | Cash flows from investing activities | | | | | | | | | Purchases of property and equipment | | | (490,323) | | | (20,423) | | | Acquisition of proprietary technologies | | | - | | | (1,500,000) | | | Acquisition of land use rights | | | (490,323) | | | - | | | Investment in unconsolidated equity investee | | | - | | | (1,076,489) | | | Business combination of a subsidiary | | | | | | (2,499,184) | | | Payment for construction in progress | | | (13,596,632) | | | (6,626,688) | | | Net cash used in investing activities | | | (14,086,955) | | | (11,722,784) | | | Cash flows from financing activities | | | | | | | | | Non - controlling interest contribution | | | - | | | 1,806,664 | | | Dividends paid | | | (951,308) | | | (134,631) | | | Net cash (used in) provided by financing activities | | | (951,308) | | | 1,672,033 | | | Effects on exchange rate changes on cash | | | (115,206) | | | 1,467,667 | | | Increase in cash and cash equivalents | | | 967,184 | | | 1,304,457 | | | Cash and cash equivalents, beginning of period | | | 8,424,265 | | | 1,387,908 | | | Cash and cash equivalents, end of period | | $ | 9,391,449 | | $ | 2,692,365 | | | Supplementary disclosures of cash flow information: | | | | | | | | | Cash paid for interest | | $ | 112,010 | | | - | | | Cash paid for income taxes | | | - | | | - | | | Non - cash transactions | | | | | | | | | Common stock issued for settlement of debts | | $ | 9,404,638 | | $ | 2,373,992 | | | Series B Convertible preferred shares cancelled | | $ | (3,000) | | $ | - | |
SINO AGRO FOOD, INC.
NOTES TO CONSOLIDATED FINANCIAL STATEMENTS
1.
| CORPORATE INFORMATION
|
|
| | Sino Agro Food, Inc. (the “Company” or “SIAF”) (formerly known as Volcanic Gold, Inc. and A Power Agro Agriculture Development, Inc.) was incorporated on October 1, 1974 in the State of Nevada.
| | | | The Company was engaged in the mining and exploration business but ceased its mining and exploring business on October 14, 2005. On August 24, 2007, the Company entered into a Merger and Acquisition Agreement with Capital Award Inc., a Belize corporation (“CA”) and its subsidiaries Capital Stage Inc. (“CS”) and Capital Hero Inc. (“CH”). Effective the same date, CA completed a reverse merger transaction with SIAF. SIAF acquired all the outstanding common stock of CA from Capital Adventure, a shareholder of CA, for 32,000,000 shares of the Company’s common stock.
| | | | On August 24, 2007 the Company changed its name from Volcanic Gold, Inc. to A Power Agro Agriculture Development, Inc. On December 8, 2007, the Company changed its name to Sino Agro Food, Inc. | | | | On September 5, 2007, the Company acquired three existing businesses in the People’s Republic of China (the “PRC”):
|
| (a) | Hang Yu Tai Investment Limited (“HYT”), a company incorporated in Macau, the owner of a 78% equity interest in ZhongXingNongMu Ltd (“ZX”), a company incorporated in the PRC;
| | | | | (b) | Tri-way Industries Limited (“TRW”), a company incorporated in Hong Kong;
| | | | | (c) | Macau Eiji Company Limited (“MEIJI”), a company incorporated in Macau, the owner of 75% equity interest in Enping City Juntang Town Hang Sing Tai Agriculture Co. Ltd. (“HST”), a PRC corporate Sino-Foreign joint venture. HST was dissolved in 2010.
|
| On November 27, 2007, MEIJI and HST established a corporate Sino - Foreign joint venture, Jiang Men City Heng Sheng Tai Agriculture Development Co. Ltd. (“JHST”), a company incorporated in the PRC with MEIJI owning a 75% interest and HST owning a 25% interest.
| | | | On November 26, 2008, SIAF established Pretty Mountain Holdings Limited (“PMH”), a company incorporated in Hong Kong with an 80% equity interest. On May 25, 2009, PMH formed a corporate Sino-Foreign joint venture, Qinghai Sanjiang A Power Agriculture Co. Ltd. (“SJAP”), incorporated in the PRC, of which PMH owns a 45% equity interest. At the time, the remaining 55% equity interest in SJAP was owned by the following entities:
|
| • | Qinghai Province Sanjiang Group Company Limited (English translation) (“Qinghai Sanjiang”), a company owned by the PRC with major business activities in the agriculture industry; and
| | | | | • | Guangzhou City Garwor Company Limited (English translation) (“Garwor”), a private limited company incorporated in the PRC, specializing in sales and marketing.
|
| SJAP is engaged in the business of manufacturing bio-organic fertilizer, livestock feed and development of other agriculture projects in the County of Huangyuan, in the vicinity of the Xining City, Qinghai Province, PRC. | | | | In September 2009, the Company carried out an internal reorganization of its corporate structure and business, and formed a 100% owned subsidiary, A Power Agro Agriculture Development (Macau) Limited (“APWAM”), which was formed in Macau. APWAM then acquired PMH’s 45% equity interest in SJAP. By virtue of the acquisition, APWAM assumed all obligations and liabilities of PMH under the Sino Foreign Joint Venture Agreement. On May 7, 2010, Qinghai Sanjiang sold and transferred its equity interest in SJAP to Garwor. The State Administration for Industry and Commerce of Xining City Government of the PRC approved the sale and transfer. As a result, APWAM owned 45% of SJAP and Garwor owned the remaining 55%. This remains the case as of the date of this quarterly report (the “Report”).
| | | | On September 9, 2010, an application was submitted by the Company to the Companies Registry of Hong Kong for deregistration of PMH under Section 291AA of the Hong Kong Companies Ordinance. On January 28, 2011, PMH was dissolved. |
F-43
SINO AGRO FOOD, INC.
NOTES TO CONSOLIDATED FINANCIAL STATEMENTS
1.
| CORPORATE INFORMATION (CONTINUED)
| | | | The Company applied to form Enping City Bi Tao A Power Prawn Culture Development Co. Limited (“EBAPCD”), in which the Company would indirectly own a 25% equity interest on February 28, 2011.
| | | | On February 28, 2011, TRW applied to form a corporate joint venture, Enping City Bi Tao A Power Fishery Development Co., Limited (“EBAPFD”), incorporated in the PRC. TRW owned a 25% equity interest in EBAPFD. On November 17, 2011, TRW formed Jiang Men City A Power Fishery Development Co., Limited (“JFD”) in which it acquired a 25% equity interest, while withdrawing its 25% equity interest in EBAPFD. As of December 31, 2011, the Company had invested $1,258,607 in JFD. JFD operates an indoor fish farm. On January 1, 2012, the Company acquired an additional 25% equity interest in JFD for total cash consideration of $1,662,365. On April 1, 2012, the Company acquired an additional 25% equity interest in JFD for the amount of $1,702,580. The Company presently owns a 75% equity interest in JFD, representing majority of voting rights and controls its board of directors. As of January 1, 2012, the Company had consolidated the assets and operations of JFD.
| | | | On April 15, 2011, MEIJI applied to form Enping City A Power Cattle Farm Co., Limited (“ECF”), all of which the Company would indirectly own a 25% equity interest in on November 17, 2011. On January 1, 2012, the Company had invested $1,076,489 in ECF. On September 17, 2012 MEIJI formed Jiang Men City Hang Mei Cattle Farm Development Co., Limited (“JHMC”) and acquired additional 50% equity interest for $2,944,176 on September 30, 2012 while withdrawing its 25% equity interest in ECF. The Company presently owns 75% equity interest in JHMC, representing majority of voting right and controls its board of directors. As of September 30, 2012, the Company had consolidated the assets and operations of JHMC. During the quarter ended June 30, 2013, MEIJI further invested $400,000 in JHMC, respectively.
| | | | On July 18, 2011, the Company formed Hunan Shenghua A Power Agriculture Co., Limited (“HSA”), in which the Company owns a 26% equity interest, and SJAP owns a 50% equity interest with the Chinese partner owning the remaining 24%. During the quarter ended June 30, 2013, MEIJI and SJAP further invested $280,000 and $719,100 in HSA, respectively.
| | | | The Company’s principal executive office is located at Room 3801, Block A, China Shine Plaza, No. 9 Lin He Xi Road, Tianhe District, Guangzhou City, Guangdong Province, PRC, 510610. | | | | The nature of the operations and principal activities of the Company and its subsidiaries are described in Note 2.2. |
2.
| SUMMARY OF SIGNIFICANT ACCOUNTING POLICIES
|
| 2.1
| FISCAL YEAR
| | | | | | The Company has adopted December 31 as its fiscal year end. |
F-44
SINO AGRO FOOD, INC.
NOTES TO CONSOLIDATED FINANCIAL STATEMENTS
2.
| SUMMARY OF SIGNIFICANT ACCOUNTING POLICIES (CONTINUED)
|
| 2.2
| REPORTING ENTITY
| | | | | | The accompanying consolidated financial statements include the following entities: |
| Name of subsidiaries | | Place of incorporation | | Percentage of interest | | Principal activities | | | | | | | | | | | | Capital Award Inc. ("CA") | | Belize | | 100% (12.31.2012: 100%) directly
| | Fishery development and holder of A-Power Technology master license. | | | | | | | | | | | | Capital Stage Inc. ("CS") | | Belize | | 100% (12.31.2012:100%) indirectly
| | Dormant | | | | | | | | | | | | Capital Hero Inc. ("CH") | | Belize | | 100% (12.31.2012:100%) indirectly
| | Dormant | | | | | | | | | | | | Tri-way Industries Limited ("TRW") | | Hong Kong, PRC | | 100% (12.31.2012: 100%) directly
| | Investment holding, holder of enzyme technology master license for manufacturing of livestock feed and bio-organic fertilizer and has not commenced its planned business of fish farm operations. | | | | | | | | | | | | Macau Meiji Limited ("MEIJI") | | Macau, PRC | | 100% (12.31.2012: 100%) directly | | Investment holding, cattle farm development, beef cattle and beef trading | | | | | | | | | | | | A Power Agro Agriculture Development (Macau) Limited ("APWAM") | | Macau, PRC | | 100% (12.31.2012: 100%) directly | | Investment holding | | | | | | | | | | | | Jiang Men City Heng Sheng Tai Agriculture Development Co. Ltd ("JHST") | | PRC | | 75% (12.31.2012: 75%) directly | | Hylocereus Undatus Plantation ("HU Plantation"). | | | | | | | | | | | | Jiang Men City A Power Fishery Development Co., Limited ("JFD") | | PRC | | 75% (12.31.2012: 75%) indirectly
| | Fish cultivation | | | | | | | | | | | | Jiang Men City Hang Mei Cattle Farm Development Co., Limited ("JHMC") | | PRC | | 75% (12.31.2012: 75%) indirectly
| | Beef cattle cultivation | | | | | | | | | | | | Hunan Shenghua A Power Agriculture Co., Limited ("HSA") | | PRC | | 26% directly and 50% indirectly (12.31.2012: 26% directly and 50% indirectly)
| | Manufacturing of organic fertilizer,livestock feed, and beef cattle and sheep cultivation, and plantation of crops and pastures | | | | | | | | | | |
| Name of variable interest entity | | Place of incorporation | | Percentage of interest | | Principal activities | | | | | | | | | | | | Qinghai Sanjiang A Power Agriculture Co., Ltd ("SJAP") | | PRC | | 45% (12.31.2012: 45%) indirectly
| | Manufacturing of organic fertilizer,livestock feed, and beef cattle and plantation of crops and pastures | | | | | | | | | | |
| Name of unconsolidated equity
investee | | Place of incorporation | | Percentage of interest | | Principal activities | | | | | | | | | | | | Enping City Bi Tao A Power Prawn Culture Development Co., Limited ("EBAPCD") (pending approval) | | PRC | | 25% (12.31.2012: 25% indirectly)
| | Prawn cultivationF-82 | |
SINO AGRO FOOD, INC.
NOTES TO CONSOLIDATED FINANCIAL STATEMENTS
2.
| SUMMARY OF SIGNIFICANT ACCOUNTING POLICIES (CONTINUED)
|
| 2.3
| BASIS OF PRESENTATION
| | | | | | The consolidated financial statements are prepared in accordance with generally accepted accounting principles in the United States of America (“US GAAP”).
| | | | | | Interim results are not necessarily indicative of results for a full year. The information included in this interim report should be read in conjunction with the information included in the Company’s annual report on Form 10-K for the fiscal year ended December 31, 2012. | | | | | 2.4
| BASIS OF CONSOLIDATION
| | | | | | The consolidated financial statements include the financial statements of the Company, its subsidiaries CA, CS, CH, TRW, MEIJI, JHST, JFD, JHMC, HSA and APWAM and its variable interest entity SJAP. All material inter-company transactions and balances have been eliminated in consolidation. | | | | | | SIAF, CA, CS, CH, TRW, MEIJI, JHST, JFD, JHMC, HSA, APWAM and SJAP are hereafter referred to as (“the Company”). | | | | | 2.5
| BUSINESS COMBINATION
| | | | | | The Company adopted the accounting pronouncements relating to business combination (primarily contained in ASC Topic 805 “Business Combinations”), including assets acquired and liabilities assumed on arising from contingencies. These pronouncements established principles and requirement for how the acquirer of a business recognizes and measures in its financial statements he identifiable assets acquired, the liabilities assumed, and any non-controlling interest in the acquisition as well as provides guidance for recognizing and measuring the goodwill acquired in the business combination and determines what information to disclose to enable users of the financial statements to evaluate the nature and financial effects of the business combination. In addition, these pronouncements eliminate the distinction between contractual and non-contractual contingencies, including the initial recognition and measurement criteria and require an acquirer to develop a systematic and rational basis for subsequently measuring and accounting for acquired contingencies depending on their nature. The Company’s adoption of these pronouncements will have an impact on the manner in which it accounts for any future acquisitions. | | | | | 2.6
| NON - CONTROLLING INTEREST IN CONSOLIDATED FINANCIAL STATEMENTS
| | | | | | The Company adopted the accounting pronouncement on non-controlling interests in consolidated financial statements, which establishes accounting and reporting standards for the non-controlling interest in a subsidiary and for the deconsolidation of a subsidiary. This guidance is primarily contained in ASC Topic “Consolidation.” It clarifies that a non-controlling interest in a subsidiary is an ownership interest in the consolidated financial statements. The adoption of this standard has not had material impact on the Company’s consolidated financial statements. | | | | | 2.7
| USE OF ESTIMATES
| | | | | | The preparation of consolidated financial statements in conformity with US GAAP requires management to make assumptions and estimates that affect the reported amounts of assets and liabilities and disclosure of contingent assets and liabilities at the dates of the consolidated financial statements and the reported amounts of revenues and expenses during the reporting periods covered thereby. Actual results could differ from these estimates. Judgments and estimates of uncertainties are required in applying the Company’s accounting policies in certain areas. The following are some of the areas requiring significant judgments and estimates: determinations of the useful lives of assets, estimates of allowances for doubtful accounts, cash flow and valuation assumptions in performing asset impairment tests of long-lived assets, estimates of the realization of deferred tax assets and inventory reserves. |
SINO AGRO FOOD, INC.
NOTES TO CONSOLIDATED FINANCIAL STATEMENTS
2.
| SUMMARY OF SIGNIFICANT ACCOUNTING POLICIES (CONTINUED)
|
| 2.8
| REVENUE RECOGNITION
|
|
|
| | | The Company’s revenue recognition policies are in compliance with ASC 605. Sales revenue is recognized when all of the following have occurred: (i) persuasive evidence of an arrangement exists, (ii) delivery has occurred or services have been rendered, (iii) the price is fixed or determinable, and (iv) the ability to collect is reasonably assured. These criteria are generally satisfied at the time of shipment when risk of loss and title passes to the customer. | | | | | | License fee income is recognized on the accrual basis in accordance with the agreements. | | | | | | Government grants are recognized when (i) the Company has substantially accomplished what must be done pursuant to the terms of the grant that are established by the local government; and (ii) the Company receives notification from the local government that the Company has satisfied all of the requirements to receive the government grants; and (iii) the amounts are received. | | | | | | Revenues from the Company's fishery development services contracts are performed under fixed-price contracts. Revenues under long-term contracts are accounted for under the percentage-of-completion method of accounting in accordance with the Financial Accounting Standards Board (“FASB”) Accounting Standards Codification (“ASC”) Topic 605, Revenue Recognition (“ASC 605”). Under the percentage-of-completion method, the Company estimates profit as the difference between total estimated revenue and total estimated cost of a contract and recognizes that profit over the contract term. The percentage of costs incurred determines the amount of revenue to be recognized. Payment terms are generally defined by the installation contract and as a result may not match the timing of the costs incurred by the Company and the related recognition of revenue. Such differences are recorded as either costs or estimated earnings in excess of billings on uncompleted contracts or billings in excess of costs and estimated earnings on uncompleted contracts. The Company determines a customer’s credit worthiness at the time an order is accepted. Sudden and unexpected changes in a customer’s financial condition could put recoverability at risk.
| | | | | | The percentage of completion method requires the ability to estimate several factors, including the ability of the customer to meet its obligations under the contract, including the payment of amounts when due. If the Company determines that collectability is not assured, the Company will defer revenue recognition and use methods of accounting for the contract such as the completed contract method until such time as the Company determines that collectability is reasonably assured or through the completion of the project. | | | | | | For fixed-price contracts, the Company uses the ratio of costs incurred to date on the contract to management's estimate of the contract's total costs, to determine the percentage of completion on each contract. This method is used as management considers expended costs to be the best available measure of progression of these contracts. Contract costs include all direct material, subcontract and labor costs and those indirect costs related to contract performance, such as supplies, tool repairs and depreciation. The Company accounts for maintenance and repair services under the guidance of ASC 605 as the services provided relate to construction work. Contract costs incurred to date and expected total contract costs are continuously monitored during the term of the contract. Changes in job performance, job conditions, and estimated profitability arising from contract penalty, change orders and final contract settlements may result in revisions to the estimated profit ability during the contract. These changes, which include contracts with estimated costs in excess of estimated revenues, are recognized as contract costs in the period in which the revisions are determined. Profit incentives are included in revenues when their realization is reasonably assured. At the point the Company anticipates a loss on a contract, the Company estimates the ultimate loss through completion and recognizes that loss in the period in which the loss was identified. | | | | | | The Company’s fishery development consultancy services revenues are recognized when the relevant services are rendered to a buyer. | | | | | | The Company does not provide warranties to customers on a basis customary to the industry, however, customers can claim warranty directly from product manufacturers for defects in equipment or products. Historically, the Company has experienced no warranty claims. |
F-47
SINO AGRO FOOD, INC.
NOTES TO CONSOLIDATED FINANCIAL STATEMENTS
2.
| SUMMARY OF SIGNIFICANT ACCOUNTING POLICIES (CONTINUED)
|
| 2.9
| COST OF GOODS SOLD
| | | | | | Cost of goods sold consists primarily of direct purchase cost of merchandise goods, and related levies. | | | |
| 2.10
| SHIPPING AND HANDLING
| | | | | | Shipping and handling costs related to cost of goods sold are included in general and administrative expenses, which totaled $6,429, $1,113, $2,151 and $0 for the three months and the six months ended June 30, 2013 and 2012, respectively.
| | | | | 2.11
| ADVERTISING
| | | | | | Advertising costs are included in general and administrative expenses, which totaled $542, $2,849, $542 and $3,167 for the three months and the six months ended June 30, 2013 and 2012, respectively.
| | | | | 2.12
| FOREIGN CURRENCY TRANSLATION AND OTHER COMPREHENSIVE INCOME
| | | | | | The reporting currency of the Company is the U.S. dollar. The functional currency of the Company is the Chinese Renminbi (RMB). | | | | | | For those entities whose functional currency is other than the U.S. dollar, all assets and liabilities are translated into U.S. dollars at the exchange rate on the balance sheet date; shareholders’ equity is translated at historical rates and items in the statements of income and of cash flows are translated at the average rate for the period. Because cash flows are translated based on the average translation rate, amounts related to assets and liabilities reported in the statements of cash flows will not necessarily agree with changes in the corresponding balances in the balance sheets. Translation adjustments resulting from this process are included in accumulated other comprehensive income in the statements of shareholders’ equity. Transaction gains and losses that arise from exchange rate fluctuations on transactions denominated in a currency other than the functional currency are included in the statements of income and comprehensive income, as incurred. | | | | | | Accumulated other comprehensive income in the consolidated statement of shareholders’ equity amounted to $5,139,044 as of June 30, 2013 and $ 3,875,101 as of December 31, 2012. The balance sheet amounts with the exception of equity as of June 30, 2013 and December 31, 2012 were translated using an exchange rate of RMB 6.18 to $1.00 and RMB 6.29 to $1.00, respectively. The average translation rates applied to the statements of income and other comprehensive income and of cash flows for the three months ended June 30, 2013 and 2012 were RMB 6.24 to $1.00 and RMB 6.31 to $1.00, respectively.
| | | | | 2.13
| CASH AND CASH EQUIVALENTS
| | | | | | The Company considers all highly liquid securities with original maturities of three months or less when acquired to be cash equivalents. Cash and cash equivalents kept with financial institutions in the PRC are not insured or otherwise protected. Should any of those institutions holding the Company’s cash become insolvent, or should the Company become unable to withdraw funds for any reason, the Company could lose the cash on deposit with that institution. | | | | | 2.14
| ACCOUNTS RECEIVABLE
| | | | | | The Company maintains reserves for potential credit losses on accounts receivable. Management reviews the composition of accounts receivable and analyzes historical bad debts, customer concentrations, customer credit worthiness, current economic trends and changes in customer payment patterns to evaluate the adequacy of these reserves. Reserves are recorded primarily on a specific identification basis. | | | | | | The standard credit period for most of the Company’s clients is three months. The collection period over 1 year is classified as long-term accounts receivable. Management evaluates the collectability of the receivables at least quarterly. Provision for doubtful accounts as of June 30, 2013 and December 31, 2012 is $0. |
F-48
SINO AGRO FOOD, INC.
NOTES TO CONSOLIDATED FINANCIAL STATEMENTS
2.
| SUMMARY OF SIGNIFICANT ACCOUNTING POLICIES (CONTINUED)
|
| 2.15
| INVENTORIES
| | | | | | Inventories are valued at the lower of cost (determined on a weighted average basis) and net realizable value. | | | | | | Costs incurred in bringing each product to its location and conditions are accounted for as follows: |
| (a) | raw materials – purchase cost on a weighted average basis; | | | | | (b) | manufactured finished goods and work-in-progress – cost of direct materials and labor and a proportion of manufacturing overhead based on normal operation capacity but excluding borrowing costs; and | | | | | (c) | retail and wholesale merchandise finished goods – purchase cost on a weighted average basis. |
| | Net realizable value is the estimated selling price in the ordinary course of business, less estimated costs for completion and the estimated costs necessary to make the sale. | | | | | 2.16
| PROPERTY AND EQUIPMENT
| | | | | | Property and equipment are stated at cost less accumulated depreciation and any accumulated impairment losses. Such costs include the cost of replacing parts that are eligible for capitalization when the cost of replacing the parts is incurred. Similarly, when each major inspection is performed, its cost is recognized in the carrying amount of the property and equipment as a replacement only if it is eligible for capitalization. The assets’ residual values, useful lives and depreciation methods are reviewed, and adjusted if appropriate, at each financial year end. | | | | | | Depreciation is calculated on a straight-line basis over the estimated useful lives of the assets. |
| Plant and machinery | 5 - 10 years | | Structure and leasehold improvements | 10 - 20 years | | Mature seeds | 20 years | | Furniture and equipment | 2.5 - 10 years | | Motor vehicles | 5 -10 years |
| | An item of property and equipment is removed from the accounts upon disposal or when no future economic benefits are expected to arise from the continued use of the asset. Any gain or loss arising on disposal of the asset (calculated as the difference between the net disposal proceeds and the carrying amount of the item) is included in the consolidated statements of income in the period the item is disposed. | | | |
| 2.17
| GOODWILL
| | | | | | Goodwill is an asset representing the fair economic benefits arising from other assets acquired in a business combination that are not individually identified or separately recognized. Goodwill is tested for impairment on an annual basis at the end of the Company’s fiscal year, or when impairment indicators arise. The Company uses a fair-value-based approach to test for impairment at the level of each reporting unit. The Company directly acquired MEIJI, which is the holding company of JHST that operates the Hu Plantation. As a result of this acquisition, the Company recorded goodwill in the amount of $724,940. This goodwill represents the fair value of the assets acquired in these acquisitions over the cost of the assets acquired. |
F-49
SINO AGRO FOOD, INC.
NOTES TO CONSOLIDATED FINANCIAL STATEMENTS
2.
| SUMMARY OF SIGNIFICANT ACCOUNTING POLICIES (CONTINUED)
|
|
|
|
| 2.18
| PROPRIETARY TECHNOLOGIES
| | | | | | A master license of stock feed manufacturing technology was acquired and the costs of acquisition are capitalized as proprietary technologies when technological feasibility has been established. Stock feed manufacturing technology is amortized using the straight-line method over its estimated life of 20 years. | | | | | | An aromatic cattle-feeding formula was acquired and the costs of acquisition are capitalized as proprietary technologies when technological feasibility has been established. Stock feed manufacturing technology is amortized using the straight-line method over its estimated life of 25 years. | | | | | | The Company has determined that technological feasibility is established at the time a working model of products is completed. Proprietary technologies are intangible assets of finite lives. Management evaluates the recoverability of proprietary technologies on an annual basis at the end of the Company’s fiscal year, or when impairment indicators arise. As required by ASC Topic 350 “Intangible – Goodwill and Other”, the Company uses a fair-value-based approach to test for impairment. | | | |
| 2.19
| CONSTRUCTION IN PROGRESS
| | | | | | Construction in progress represents direct costs of construction as well as acquisition and design fees incurred. Capitalization of these costs ceases and the construction in progress is transferred to property and equipment when substantially all the activities necessary to prepare the assets for their intended use are completed. No depreciation is provided until construction is completed and the asset is ready for its intended use. | | | |
| 2.20
| LAND USE RIGHTS
| | | | | | Land use rights represent acquisition of rights to agricultural land from farmers and are amortized on the straight-line basis over their respective lease periods. The lease period of agricultural land is in the range from 30 to 60 years. Land use rights purchase prices were determined in accordance with the 2007 PRC Government’s minimum lease payments on agricultural land and mutually agreed to terms between the Company and the vendors. | | | |
| 2.21
| CORPORATE JOINT VENTURE
| | | | | | A corporation formed, owned, and operated by two or more businesses as a separate and discrete business or project (venture) for their mutual benefit is considered to be a corporate joint venture. Investee entities, in which the Company can exercise significant influence, but not control, are accounted for under the equity method of accounting. Under the equity method of accounting, the Company’s share of the earnings or losses of these companies is included in net income. | | | | | | A loss in value of an investment that is other than a temporary decline is recognized as a charge to operations. Evidence of a loss in value might include, but would not necessarily be limited to, the absence of an ability to recover the carrying amount of the investment or inability of the investee to sustain an earnings capacity that would justify the carrying amount of the investment. |
SINO AGRO FOOD, INC.
NOTES TO CONSOLIDATED FINANCIAL STATEMENTS
2.
| SUMMARY OF SIGNIFICANT ACCOUNTING POLICIES (CONTINUED)
| | | |
| 2.22
| VARIABLE INTEREST ENTITY
| | | | | | A variable interest entity (“VIE”) is an entity (investee) in which the investor has obtained less than a majority interest, according to the Financial Accounting Standards Board (FASB). A VIE is subject to consolidation if a VIE meets one of the following three criteria as elaborated in ASC Topic 810-10, Consolidation:
|
| (a) | equity-at-risk is not sufficient to support the entity's activities; | | | | | (b) | as a group, the equity-at-risk holders cannot control the entity; or | | | | | (c) | the economics do not coincide with the voting interest |
| | If a firm is the primary beneficiary of a VIE, the holdings must be disclosed on the balance sheet. The primary beneficiary is defined as the person or company with the majority of variable interests. A corporation formed, owned, and operated by two or more businesses (ventures) as a separate and discrete business or project (venture) for their mutual benefit is defined as a joint venture. |
|
|
|
| 2.23
| TREASURY STOCK
| | | | | | Treasury stock means shares of a corporation’s own stock that have been issued and subsequently reacquired by the corporation. Converting outstanding shares to treasury shares does not reduce the number of shares issued but does reduce the number of shares outstanding. These shares are not eligible to receive dividends. Accounting for excesses and deficiencies on treasury stock transactions is governed by ASC 505-30-30. | | | | | | State laws and federal agencies closely regulate transactions involving a company’s own capital stock, so the purchase of outstanding shares must have a legitimate purpose. Some of the most common reasons for purchasing outstanding shares are as follows: |
| (a) | to meet additional stock needs for various reasons, including newly implemented stock option plans, stock for convertible bonds or convertible preferred stock, or a stock dividend. | | | | | (b) | to make more shares available for acquisitions of other entities. |
| | The cost method of accounting for treasury shares has been adopted by the Company. The purchase of outstanding shares and thus converting them into treasury shares is treated as a temporary reduction in shareholders’ equity in view of the expectation to reissue the shares instead of retiring them. When the Company reissues the treasury shares, the temporary account is eliminated. The cost of acquiring outstanding shares for converting into treasury shares is charged to a contra account, in this case a contra equity account that reduces the stockholder equity balance. | | | |
| 2.24
| INCOME TAXES
| | | | | | The Company accounts for income taxes under the provisions of ASC Topic 740 “Accounting for Income Taxes.” Under ASC Topic 740, deferred tax assets and liabilities are determined based on the difference between the financial statement carrying amounts and the tax bases of assets and liabilities using enacted tax rates in effect in the years in which the differences are expected to reverse. | | | | | | The provision for income tax is based on the results for the year as adjusted for items, which are non-assessable or disallowed. It is calculated using tax rates that have been enacted or substantively enacted at the balance sheet date. Deferred tax is accounted for using the balance sheet liability method in respect of temporary differences arising from differences between the carrying amount of assets and liabilities in the financial statements and the corresponding tax basis used in the computation of assessable tax profit. In principle, deferred tax liabilities are recognized for all taxable temporary differences, and deferred tax assets are recognized to the extent that it is probable that taxable profit will be available against which deductible temporary differences can be utilized. |
F-51
SINO AGRO FOOD, INC.
NOTES TO CONSOLIDATED FINANCIAL STATEMENTS
2.
| SUMMARY OF SIGNIFICANT ACCOUNTING POLICIES (CONTINUED)
|
|
|
| 2.24
| INCOME TAXES (CONTINUED)
| | | | | | Deferred income taxes are calculated at the tax rates that are expected to apply to the period when the asset is realized or the liability is settled. Deferred tax is charged or credited in the income statement, except when it related to items credited or charged directly to equity, in which case the deferred tax is also dealt with in equity. Deferred tax assets and liabilities are offset when they relate to income taxes levied by the same taxation authority and the Company intends to settle its current tax assets and liabilities on a net basis. | | | | | | ASC Topic 740 also prescribes a more-likely-than-not threshold for financial statement recognition and measurement of a tax position taken, or for one expected to be taken, in a tax return. ASC Topic 740 also provides guidance related to, among other things, classification, accounting for interest and penalties associated with tax positions, and disclosure requirements. Any interest and penalties accrued related to unrecognized tax benefits will be recorded as tax expense. | | | |
| 2.25
| POLITICAL AND BUSINESS RISK
| | | | | | The Company's operations are carried out in the PRC. Accordingly, the political, economic and legal environment in the PRC may influence the Company’s business, financial condition and results of operations by the general state of the PRC's economy. The Company's operations in the PRC are subject to specific considerations and significant risks not typically associated with companies in North America and Western Europe. The Company's results may be adversely affected by changes in governmental policies with respect to laws and regulations, anti-inflationary measures, currency conversion and remittance abroad, and rates and methods of taxation, among other things. |
F-52
SINO AGRO FOOD, INC.
NOTES TO CONSOLIDATED FINANCIAL STATEMENTS
2.
| SUMMARY OF SIGNIFICANT ACCOUNTING POLICIES (CONTINUED)
| | |
| 2.26
| CONCENTRATION OF CREDIT RISK
| | | | | | Cash includes cash at banks and demand deposits in accounts maintained with banks within the PRC. Total cash in these banks as of June 30, 2013 and December 31, 2012 amounted to $9,274,048 and $8,403,458, respectively, none of which is covered by insurance. The Company has not experienced any losses in such accounts and believes it is not exposed to any risks to its cash in bank accounts. Accounts receivable are derived from revenue earned from customers located primarily in the PRC. The Company performs ongoing credit evaluations of customers and has not experienced any material losses to date. | | | | | | The Company had 5 major customers whose revenue individually represented the following percentages of the Company’s total revenue: |
| | | Three months | | | Three months | | | Six months | | | Six months | | | | | | ended | | | ended | | | ended | | | ended | | | | | | June 30, | | | June 30, | | | June 30, | | | June 30, | | | | | | 2013 | | | 2012 | | | 2013 | | | 2012 | | | | | | | | | | | | | | | | | | | Customer A | | 26.94 | % | | 12.76 | % | | 18.57 | % | | 7.82 | % | | | Customer B | | - | | | 25.65 | % | | 16.71 | % | | 21.85 | % | | | Customer C | | 12.51 | % | | 14.44 | % | | 12.32 | % | | 12.21 | % | | | Customer D | | 8.90 | % | | - | | | 10.09 | % | | 11.87 | % | | | Customer E | | - | | | - | | | 8.20 | % | | - | | | | Customer F | | - | | | 18.99 | % | | - | | | 20.63 | % | | | Customer G | | - | | | 8.21 | % | | - | | | - | | | | Customer H | | 7.98 | % | | | | | | | | | | | | Customer I | | 7.86 | % | | | | | | | | | | | | | | 64.19 | % | | 80.05 | % | | 65.89 | % | | 74.38 | % | |
| | | | Segment | | Amount | | | Customer A | | | Fishery Development Division | | $ | 20,338,677 | | | Customer B | | | Fishery Development Division | | $ | 18,293,639 | | | Customer C | | | Organic Fertilizer and Bread Grass Division | | $ | 13,494,997 | | | Customer D | | | Fishery Development Division | | $ | 11,051,367 | |
SINO AGRO FOOD, INC.
NOTES TO CONSOLIDATED FINANCIAL STATEMENTS
2.
| SUMMARY OF SIGNIFICANT ACCOUNTING POLICIES (CONTINUED)
| | | |
| 2.26
| CONCENTRATION OF CREDIT RISK (CONTINUED)
| | | | | | The Company had 5 major customers whose accounts receivable balance individually represented the following percentages of the Company’s total accounts receivable: |
| | | June 30, 2013 | | | December 31, 2012 | | | | | | | | | | | Customer A | | 15.21 | % | | 11.14 | % | | Customer B | | 15.01 | % | | 14.32 | % | | Customer C | | 12.03 | % | | 9.94 | % | | Customer D | | 11.69 | % | | 18.18 | % | | Customer E | | 8.26 | % | | 8.23 | % | | | | 62.20 | % | | 61.81 | % |
| As of June 30, 2013, amounts due from customers A, B, C and D are $12,529258, $12,365,914, $9,908,296 and $9,628.321, respectively. The Company has not experienced any significant difficulty in collecting its accounts receivable in the past and is not aware of any financial difficulties of its major customers. |
| 2.27
| IMPAIRMENT OF LONG-LIVED ASSETS AND INTANGIBLE ASSETS
|
| | | | | In accordance with ASC Topic 360, “Property, Plant and Equipment,” long-lived assets to be held and used are analyzed for impairment whenever events or changes in circumstances indicate that the related carrying amounts may not be recoverable. The Company reviews the carrying amount of its long-lived assets, including intangibles, for impairment, each reporting period. An asset is considered impaired when estimated future cash flows are less than the carrying amount of the asset. In the event the carrying amount of such asset is considered not recoverable, the asset is adjusted to its fair value. Fair value is generally determined based on discounted future cash flow. As of June 30, 2013 and December 31, 2012, the Company determined no impairment charges were necessary. |
SINO AGRO FOOD, INC.
NOTES TO CONSOLIDATED FINANCIAL STATEMENTS
2.
| SUMMARY OF SIGNIFICANT ACCOUNTING POLICIES (CONTINUED)
| | | |
| 2.28
| EARNINGS PER SHARE
| | | | | | As prescribed in ASC Topic 260 “Earnings per Share,” Basic Earnings per Share (“EPS”) is computed by dividing net income available to common stockholders by the weighted average number of common stock shares outstanding during the year. Diluted EPS is computed by dividing net income available to common stockholders by the weighted-average number of common stock shares outstanding during the year plus potential dilutive instruments such as stock options and warrants. The effect of stock options on diluted EPS is determined through the application of the treasury stock method, whereby proceeds received by the Company based on assumed exercises are hypothetically used to repurchase the Company’s common stock at the average market price during the period.
| | | | | | For the three months ended June 30, 2013 and 2012, basic earnings per share attributable to Sino Agro Food, Inc. and subsidiaries common stockholders amount to $0.13 and $0.14, respectively. For the three months ended June 30, 2013 and 2012, diluted earnings per share attributable to Sino Agro Food, Inc. and its subsidiaries’ common stockholders amounted to $0.12 and $0.13, respectively
| | | | | | For the six months ended June 30, 2013 and 2012, basic earnings per share attributable to Sino Agro Food, Inc. and subsidiaries common stockholders amount to $0.28 and $0.22, respectively. For the six months ended June 30, 2013 and 2012, diluted earnings per share attributable to Sino Agro Food, Inc. and its subsidiaries’ common stockholders amounted to $0.27 and $0.20, respectively
| | | |
| 2.29
| ACCUMULATED OTHER COMPREHENSIVE INCOME
| | | | | | ASC Topic 220 “Comprehensive Income” establishes standards for reporting and displaying comprehensive income and its components in financial statements. Comprehensive income is defined as the change in stockholders’ equity of a business enterprise during a period from transactions and other events and circumstances from non-owner sources. The comprehensive income for all periods presented includes both the reported net income and net change in cumulative translation adjustments.
| | | |
| 2.30
| RETIREMENT BENEFIT COSTS
| | | | | | PRC state managed retirement benefit programs are defined contribution plans and the payments to the plans are charged as expenses when employees have rendered service entitling them to the contribution made by the employer. | | | |
| 2.31
| STOCK-BASED COMPENSATION
| | | | | | The Company has adopted both ASC Topic 718, “Compensation - Stock Compensation” and ASC Topic 505-50, “Equity-Based Payments to Non- Employees” using the fair value method in which an entity issues its equity instruments to acquire goods and services from employees and non-employees. Stock compensation for stock granted to non-employees has been determined in accordance with this accounting standard and the accounting standard regarding accounting for equity instruments that are issued to other than employees for acquiring, or in conjunction with selling goods or services, as the fair value of the consideration received or the fair value of equity instruments issued, whichever is more reliably measured. This accounting standard allows the “simplified” method to determine the term of employee options when other information is not available. Under ASC Topic 718 and ASC Topic 505-50, stock compensation expenses is measured at the grant date on the value of the option or restricted stock and is recognized as expenses, less expected forfeitures, over the requisite service period, which is generally the vesting period. |
SINO AGRO FOOD, INC.
NOTES TO CONSOLIDATED FINANCIAL STATEMENTS
2.
| SUMMARY OF SIGNIFICANT ACCOUNTING POLICIES (CONTINUED)
| | | |
| 2.32
| FAIR value of financial INSTRUMENTS
| | | | | | The Company follows paragraph 825-10-50-10 of the FASB Accounting Standards Codification for disclosures about fair value of its financial instruments and paragraph 820-10-35-37 of the FASB Accounting Standards Codification (“Paragraph 820-10-35-37”) to measure the fair value of its financial instruments. Paragraph 820-10-35-37 establishes a framework for measuring fair value under U.S. GAAP, and expands disclosures about fair value measurements. To increase consistency and comparability in fair value measurements and related disclosures, Paragraph 820-10-35-37 establishes a fair value hierarchy, which prioritizes the inputs to valuation techniques used to measure fair value into three (3) broad levels. The fair value hierarchy gives the highest priority to quoted prices (unadjusted) in active markets for identical assets or liabilities and the lowest priority to unobservable inputs. The three (3) levels of fair value hierarchy defined by Paragraph 820-10-35-37 are described below:
|
| Level 1 | Quoted market prices available in active markets for identical assets or liabilities as of the reporting date. | | | | | Level 2 | Pricing inputs other than quoted prices in active markets included in Level 1, which are either directly or indirectly observable as of the reporting date. | | | | | Level 3 | Pricing inputs that are generally observable inputs and not corroborated by market data. |
| | The carrying amounts of the Company’s financial assets and liabilities, such as cash and accrued expenses, approximate their fair values because of the short maturity of these instruments. The Company does not have any assets or liabilities measured at fair value on a recurring or a non-recurring basis, consequently, the Company did not have any fair value adjustments for assets and liabilities measured at fair value as of June 30, 2013 or December 31, 2012, nor gains or losses are reported in the statements of income and comprehensive income that are attributable to the change in unrealized gains or losses relating to those assets and liabilities still held at the reporting date for the fiscal period ended June 30, 2013 or June 31, 2012. |
|
|
|
| 2.33
| NEW ACCOUNTING PRONOUNCEMENTS
| | | | | | The Company does not expect any recent accounting pronouncements to have a material effect on the Company’s financial position, results of operations, or cash flows. | | | | | | In July 2012, the FASB issued Accounting Standards Update ASU 2012-02, the amendments to ASC 350, Intangibles—Goodwill and Other: Testing Indefinite-Lived Intangible Assets for Impairment (“ASU 2012-02”). The amendments apply to all entities, both public and nonpublic, that have indefinite-lived intangible assets, other than goodwill, reported in their financial statements. In accordance with the amendments an entity has the option first to assess qualitative factors to determine whether the existence of events and circumstances indicates that it is more likely than not that the indefinite-lived intangible asset is impaired. If, after assessing the totality of events and circumstances, an entity concludes that it is not more likely than not that the indefinite-lived intangible asset is impaired, then the entity is not required to take further action. However, if an entity concludes otherwise, then it is required to determine the fair value of the indefinite-lived intangible asset and perform the quantitative impairment test by comparing the fair value with the carrying amount in accordance with Subtopic 350-30. An entity also has the option to bypass the qualitative assessment for any indefinite-lived intangible asset in any period and proceed directly to performing the quantitative impairment test. An entity will be able to resume performing the qualitative assessment in any subsequent period. The amendments are effective for annual and interim impairment tests performed for fiscal years beginning after September 15, 2012, and early adoption is permitted. The Company will apply these amendments for reporting periods beginning after December 31, 2012. The Company does not expect the adoption of the amendments to have a material impact on the consolidated financial statements. |
SINO AGRO FOOD, INC.
NOTES TO CONSOLIDATED FINANCIAL STATEMENTS
3.
| SEGMENT INFORMATION
| | | | The Company establishes standards for reporting information about operating segments on a basis consistent with the Company’s internal organization structure as well as business segments and major customers in consolidated financial statements. The Company operates in four principal reportable segments: Fishery Development Division, and HU Plantation Division and Organic Fertilizer and Bread Grass Division, and Cattle Development Division. No geographic information is required as all revenue and assets are located in PRC. |
| For the three months ended June 30, 2013 | | | | | Fishery
Development
Division (1) | | HU Plantation
Division (2) | | Organic
Fertilizer and
Bread Grass
Division (3) | | Cattle Farm
Development
Division (4) | | Corporate and
others (5) | | Total | | | | | | | | | | | | | | | | | | | | | | | | Revenue | | $ | 17,904,106 | | $ | 3,554,986 | | $ | 16,946,378 | | $ | 6,421,161 | | | 9,573,698 | | $ | 54,400,329 | | | | | | | | | | | | | | | | | | | | | | | | Net income (loss) | | $ | 2,898,600 | | $ | 2,452,706 | | $ | 5,679,317 | | $ | 929,277 | | $ | 2,371,040 | | $ | 14,330,940 | | | | | | | | | | | | | | | | | | | | | | | | Total assets | | $ | 67,526,143 | | $ | 38,726,053 | | $ | 120,479,483 | | $ | 41,542,654 | | $ | 26,251,321 | | $ | 294,525,654 | |
| For the three months ended June 30, 2012 | | | | | | Fishery
Development
Division (1) | | | HU Plantation
Division (2) | | | Organic
Fertilizer and
Bread Grass
Division (3) | | | Cattle Farm
Development
Division (4) | | | Corporate and
others (5) | | | Total | | | | | | | | | | | | | | | | | | | | | | | | Revenue | | $ | 15,799,765 | | $ | 2,081,863 | | $ | 3,684,693 | | $ | 1,781,966 | | $ | - | | $ | 25,348,287 | | | | | | | | | | | | | | | | | | | | | | | | Net income (loss) | | $ | 8,321,886 | | $ | 1,117,450 | | $ | 469,629 | | $ | 461,438 | | $ | (80,381) | | $ | 10,290,022 | | | | | | | | | | | | | | | | | | | | | | | | Total assets | | $ | 59,793,491 | | $ | 27,151,644 | | $ | 71,872,466 | | $ | 9,791,026 | | $ | 14,721,073 | | $ | 183,329,700 | |
SINO AGRO FOOD, INC.
NOTES TO CONSOLIDATED FINANCIAL STATEMENTS
| | | Fishery
Development
Division (1) | | HU Plantation
Division (2) | | Organic
Fertilizer and
Bread Grass
Division (3) | | Cattle Farm
Development
Division (4) | | Corporate and
others (5) | | Total | | | | | | | | | | | | | | | | | | | | | | | | Revenue | | $ | 42,122,633 | | $ | 3,554,986 | | $ | 31,824,277 | | $ | 14,783,718 | | | 17,222,466 | | $ | 109,508,080 | | | | | | | | | | | | | | | | | | | | | | | | Net income (loss) | | $ | 11,053,353 | | $ | 2,211,567 | | $ | 9,342,579 | | $ | 3,369,881 | | $ | 4,732,332 | | $ | 30,709,712 | | | | | | | | | | | | | | | | | | | | | | | | Total assets | | $ | 67,526,143 | | $ | 38,726,053 | | $ | 120,479,483 | | $ | 41,542,654 | | $ | 26,251,321 | | $ | 294,525,654 | |
For the six months ended June 30, 2012
| | | Fishery
Development
Division (1) | | HU Plantation
Division (2) | | Organic
Fertilizer and
Bread Grass
Division (3) | | Cattle Farm
Development
Division (4) | | Corporate and
others (5) | | Total | | | | | | | | | | | | | | | | | | | | | | | | Revenue | | $ | 26,894,373 | | $ | 2,081,863 | | $ | 9,628,641 | | $ | 2,723,426 | | $ | - | | $ | 41,328,303 | | | | | | | | | | | | | | | | | | | | | | | | Net income (loss) | | $ | 13,592,472 | | $ | 1,090,577 | | $ | 1,035,018 | | $ | 1,186,596 | | $ | (943,177) | | $ | 15,961,484 | | | | | | | | | | | | | | | | | | | | | | | | Total assets | | $ | 59,793,491 | | $ | 27,151,644 | | $ | 71,872,466 | | $ | 9,791,026 | | $ | 14,721,073 | | $ | 183,329,700 | |
| Note | | (1) | Operated byCapital Award, Inc. andJiangmen City A Power Fishery Development Co. Ltd.
| | (2) | Operated by Jiangmen City Heng Sheng Tai Agriculture Development Co. Ltd. | | (3) | Operated by Qinghai Sanjiang A Power Agriculture Co. Ltd, A Power Agro Agriculture Development (Macau)Limited and Hunan Shenghua A Power Agriculture Co., Limited. | | (4) | Operated by Jiangmen City Hang Mei Cattle Farm Development Co. Ltd and Macau Meiji Limited. | | (5) | Operated by Sino Agro Food, Inc. |
SINO AGRO FOOD, INC.
NOTES TO CONSOLIDATED FINANCIAL STATEMENTS
| United States of America
| | | | The Company was incorporated in the State of Nevada, in the United States of America. The Company has no trading operations in United States of America and no US corporate tax has been provided for in the consolidated financial statements of the Company | | | | Undistributed Earnings of Foreign Subsidiaries
| | | | The Company intends to use the remaining accumulated and future earnings of foreign subsidiaries to expand operations outside the United States and accordingly, undistributed earnings of foreign subsidiaries are considered to be indefinitely reinvested outside the United States and no provision for U.S. Federal and State income tax or applicable dividend distribution tax has been provided thereon.
| | |
| China
| | | | Beginning January 1, 2008, the new Enterprise Income Tax (“EIT”) law replaced the existing laws for Domestic Enterprises (“DE’s”) and Foreign Invested Enterprises (“FIE’s”). The new standard EIT rate of 25% replaced the 33% rate currently applicable to both DE’s and FIE’s. The Company is currently evaluating the impact that the new EIT will have on its financial condition. Beginning January 1, 2008, China unified the corporate income tax rule on foreign invested enterprises and domestic enterprises. The unified corporate income tax rate is 25%.
| | | | Under new tax legislation in China beginning in January 2008, the agriculture, dairy and fishery sectors are exempt from enterprise income taxes. | | | | No EIT has been provided in the financial statements of CA, ZX, JHST, JHMC, HSA and SJAP since they are exempt from EIT for the six months ended June 30, 2013 and 2012 as they are within the agriculture, dairy and fishery sectors. | | | | On December 31, 2012, Tax authority agreed that HSA and JFD were exempt from EIT since January 1, 2011 as both companies are within the agriculture, dairy and fishery sectors. | | |
| Belize and Malaysia
| | | | CA, CS and CH are international business companies incorporated in Belize, and are exempt from corporate tax in Belize. | | | | All sales invoices of CA were issued by its representative office in Malaysia and its trading and service activities are conducted in China. As the Malaysia tax law is imposed on a territorial basis and not on a worldwide basis, CA’s income is not subject to Malaysian corporate tax. | | | | As a result, neither Belize nor Malaysia corporate tax is provided for in the consolidated financial statements of CA for the six months ended June 30, 2013 and 2012. | | |
| Hong Kong
| | No Hong Kong profits tax has been provided in the consolidated financial statements of TRW, since these entities did not earn any assessable profits for the six months ended June 30, 2013 and 2012. | | |
| Macau
| | No Macau Corporation tax has been provided in the consolidated financial statements of HYT, APWAM and MEIJI since these entities did not earn any assessable profits for the six months ended June 30, 2013 and 2012. |
|
| | No deferred tax assets and liabilities are of June 30, 2013 and December 31, 2012 since there was no difference between the financial statements carrying amounts and the tax bases of assets and liabilities using enacted tax rates in effect in the period in which the differences are expected to reverse. |
F-59
SINO AGRO FOOD, INC.
NOTES TO CONSOLIDATED FINANCIAL STATEMENTS
4.
| INCOME TAXES (CONTINUED)
|
| Provision for income taxes is as follows: |
| | Three | | Three | | Six | | Six | | | | months ended | | months ended | | months ended | | months ended | | | | June 30, 2013 | | June 30, 2012 | | June 30, 2013 | | June 30, 2012 | | | | | | | | | | | | | | | | Income tax provision | | | | | | | | | | | | | | - SIAF | | $ | - | | $ | - | | $ | - | | $ | - | | - CA, CS and CH | | | - | | | - | | | - | | | - | | - TRW | | | - | | | - | | | - | | | - | | - MEIJI and APWAM | | | - | | | - | | | - | | | - | | - JHST, JHMC, JFD, HSA and SJAP | | | - | | | - | | | - | | | - | | Deferred tax provision | | | - | | | - | | | - | | | - | | | | $ | - | | $ | - | | $ | - | | $ | - | |
| The Company did not recognize any interest or penalties related to unrecognized tax benefits in the six months ended June 30, 2013 and 2012.The Company had no uncertain positions that would necessitate recording of tax related liability. The Company is subject to examination by the respective tax authorities.
|
5.
| CASH AND CASH EQUIVALENTS
|
| | | June 30, 2013 | | December 31, 2012 | | | | | | | | | | | | Cash and bank balances | | $ | 9,391,449 | | $ | 8,424,265 | |
| As of June 30, 2013, inventories are as follows: |
| | | June 30, 2013 | | December 31, 2012 | | | | | | | | | | | | Sleepy cods and eels | | $ | 5,432,990 | | $ | 4,612,090 | | | Bread grass | | | 709,366 | | | 1,473,653 | | | Beef cattle | | | 2,985,965 | | | 2,569,659 | | | Organic fertilizer | | | 702,836 | | | 737,166 | | | Forage for cattle and consumable | | | 3,144,896 | | | 278,900 | | | Raw materials for bread grass and organic fertilizer | | | 5,237,102 | | | 6,765,536 | | | Unharvested HU plantation | | | 674,278 | | | - | | | Immature seeds | | | - | | | 677,751 | | | | | $ | 18,887,433 | | $ | 17,114,755 | |
SINO AGRO FOOD, INC.
NOTES TO CONSOLIDATED FINANCIAL STATEMENTS
7.
| DEPOSITS AND PREPAID EXPENSES
|
| The Company made temporary deposit payments for equity investments in the future development of a prawn farm hatchery and a prawn farm nursery. |
| | | June 30, 2013 | | December 31, 2012 | | | | | | | | | | | | Deposits for | | | | | | | | | - purchases of equipment | | $ | 2,059,776 | | $ | 318,192 | | | - acquisition of land use rights | | | 7,826,508 | | | 7,826,508 | | | - inventories purchases | | | 4,940,767 | | | 2,228,854 | | | - aquaculture contract | | | 6,022,708 | | | 7,062,600 | | | - building materials | | | 1,281,935 | | | 2,000,000 | | | - proprietary technologies | | | 2,254,839 | | | 2,254,839 | | | - construction in progress | | | 19,658,537 | | | 14,423,021 | | | Miscellaneous | | | 251,657 | | | 4,892,258 | | | Shares issued for employee compensation and overseas professional | | | 90,600 | | | 271,800 | | | Temporary deposits paid to entities for investments in future Sino Foreign Joint Venture companies | | | 7,704,670 | | | 6,030,785 | | | | | | 52,091,997 | | | 47,308,857 | |
| The Company has performed an analysis on all of its accounts receivable and determined that all amounts are collectible by the Company. As such, all accounts receivable are reflected as a current asset and no allowance for bad debt has been recorded as of June 30, 2013 and December 31, 2012. Bad debts written off for the three months ended and six months ended June 30, 2013 and 2012 are $0.
| | | | Aging analysis of accounts receivable is as follows: |
| | | June 30, 2013 | | December 31, 2012 | | | | | | | | | | | | 0 - 30 days past due | | $ | 25,564,050 | | $ | 10,813,981 | | | 31 - 90 days past due | | | 40,853,659 | | | 27,784,784 | | | 91 - 120 days past due | | | 15,251,513 | | | 6,866,842 | | | over 120 days and less than 1 year past due | | | 704,648 | | | 7,482,743 | | | over 1 year past due | | | - | | | - | | | | | | 82,373,870 | | | 52,948,350 | |
| | | June 30,2013 | | December 31, 2012 | | | | | | | | | | | | Cash advances paid as consideration to acquire investments. | | $ | 4,657,728 | | $ | 4,657,728 | | | Advanced to employees | | | 206,046 | | | 166,722 | | | Advanced to suppliers | | | 573,001 | | | 205,088 | | | Miscellaneous | | | 937,497 | | | 924,710 | | | | | $ | 6,374,272 | | $ | 5,954,248 | |
SINO AGRO FOOD, INC.
NOTES TO CONSOLIDATED FINANCIAL STATEMENTS
| | | June 30, 2013 | | December 31, 2012 | | | | | | | | | | | | Plant and machinery | | $ | 3,681,644 | | $ | 3,681,644 | | | Structure and leasehold improvements | | | 15,446,062 | | | 15,446,062 | | | Mature seeds | | | 2,660,357 | | | 1,369,626 | | | Furniture and equipment | | | 633,370 | | | 212,479 | | | Motor vehicles | | | 277,513 | | | 277,513 | | | | | | 22,698,946 | | | 20,987,324 | | | | | | | | | | | | Less: Accumulated depreciation | | | (1,679,693) | | | (1,041,022) | | | Net booking value | | | 21,019,253 | | | 19,946,302 | |
| Depreciation expense was $331,596 and $125,530 for the three months ended June 30, 2013 and 2012, respectively.
| | Depreciation expense was $638,671 and $183,154 for the six months ended June 30, 2013 and 2012, respectively.
|
11.
| CONSTRUCTION IN PROGRESS
|
| | | June 30, 2013 | | December 31, 2012 | | | | | | | | | | | | Construction in progress | | | | | | | | | - Oven room for production of dried flowers | | $ | 828,905 | | $ | 828,905 | | | - Office, warehouse and organic fertilizer plant in H S A | | | 10,450,518 | | | 10,450,518 | | - Organic fertilizer and bread grass production plant and
office buildingin SJAP | | | 13,228,105 | | | 7,921,105 | | | - Rangeland for beef cattle and office building in Enping | | | 5,291,982 | | | 5,291,982 | | | - Cattle houses, office building and staff quarter in SJAP | | | 8,289,632 | | | - | | | | | $ | 38,089,142 | | $ | 24,492,510 | |
SINO AGRO FOOD, INC.
NOTES TO CONSOLIDATED FINANCIAL STATEMENTS
12.
| LAND USE RIGHTS
| | | | Private ownership of agricultural land is not permitted in the PRC. Instead, the Company has leased five lots of land. The cost of the first lot of land use rights acquired in 2007 in Guangdong Province was $6,408,289 and consists of 180.23 acres with the lease expiring in 2067. The cost of the second lot of land use rights acquired in 2008 in Guangdong Province was $764,128, which consists of31.84 acres with the lease expiring in 2068. The cost of the third lot of land use rights acquired in 2011 was $7,042,831, which consists of 52.46 acres in Guangdong Province, with the lease expiring in 2037. The cost of the fourth lot of land use rights acquired in 2011 was $35,405,750 which consisted of 287.21 acres in the Hunan Province, PRC and the leases expire in 2051, 2054 and 2071. The cost of the fifth lot of land use rights acquired in 2012 was $528,240 which consisted of 21.09 acres in Qinghai Province, PRC and the leases expire in 2051. The cost of the sixth lot of land use rights acquired in 2013 was $528,240 which consisted of 41.80 acres in Guangdong Province, PRC and the leases expire in 2051.
|
| | | June 30, 2013 | | December 31,2012 | | | | | | | | | | | | Cost | | $ | 60,045,896 | | $ | 58,630,950 | | | Less: Accumulated amortisation | | | (3,666,041) | | | (2,897,704) | | | Net carrying amount | | $ | 56,379,855 | | $ | 55,733,246 | |
| Land use rights are amortized on the straight-line basis over their respective lease periods. The lease period of agriculture land is 30 to 60 years.
| | | | Amortization of land use rights was $539,677 and $642,905 for the three months ended June 30, 2013 and 2012, respectively. Amortization of land use rights was $768,337 and $944,176 for the three months ended June 30, 2013 and 2012, respectively.
|
13.
| PROPRIETARY TECHNOLOGIES
|
| By an agreement dated November 12, 2008, TRW acquired an enzyme technology master license, registered under a Chinese patent, for the manufacturing of livestock feed and bioorganic fertilizer and its related labels for $8,000,000. On March 6, 2012 MEIJI acquired an aromatic-feed formula technology for the production of aromatic cattle for $1,500,000.
|
| | | June 30, 2013 | | December 31, 2012 | | | | | $ | | $ | | | | | | | | | | | | Cost | | | 9,512,258 | | | 9,512,258 | | | Less: Accumulated amortization | | | (1,605,591) | | | (1,397,634) | | | Net carrying amount | | | 7,906,667 | | | 8,114,624 | |
| Amortization of proprietary technologies was $98,750 and $145,500 for the three months ended June 30, 2013 and 2012, respectively.Amortization of proprietary technologies was $207,957 and $194,000 for the six months ended June 30, 2013 and 2012, respectively. No impairments of proprietary technologies have been identified for the three months ended and the six months ended June 30, 2013 and 2012.
|
SINO AGRO FOOD, INC.
NOTES TO CONSOLIDATED FINANCIAL STATEMENTS
| Goodwill represents the fair value of the assets acquired the acquisitions over the cost of the assets acquired. It is stated at cost less accumulated impairment losses. Management tests goodwill for impairment on an annual basis or when impairment indicators arise. In these instances, the Company recognizes an impairment loss when it is probable that the estimated cash flows are less than the carrying value of the assets. To date, no such impairment loss has been recorded.
|
| | | June 30, 2013 | | December 31, 2012 | | | | | | | | | | | | Goodwill from acquisition | | $ | 724,940 | | $ | 724,940 | | | Less: Accumulated impairment losses | | | - | | | - | | | Net carrying amount | | $ | 724,940 | | $ | 724,940 | |
15.
| VARIABLE INTEREST ENTITY
|
| On September 28, 2009, APWAM acquired the PMH’s 45% equity interest in the Sino-Foreign joint venture company, Qinghai Sanjiang A Power Agriculture Co. Limited (“SJAP”), which was incorporated in the People’s Republic of China. As of June 30, 2013, the Company has invested $2,251,359 in this joint venture. SJAP is engaged in its business of the manufacturing of organic fertilizer, livestock feed, and beef cattle and plantation of crops and pastures.
| | |
| Continuous assessment of the VIE relationship with SJAP
| | | | The Company may also have a controlling financial interest in an entity through an arrangement that does not involve voting interests, such as a VIE. The Company evaluates entities deemed to be VIE’s using a risk and reward model to determine whether to consolidate. A VIE is an entity (1) that has total equity at risk that is not sufficient to finance its activities without additional subordinated financial support from other entities, (2) where the group of equity holders does not have the power to direct the activities of the entity that most significantly impact the entity’s economic performance, or the obligation to absorb the entity’s expected losses or the right to receive the entity’s expected residual returns, or both, or (3) where the voting rights of some investors are not proportional to their obligations to absorb the expected losses of the entity, their rights to receive the expected residual returns of the entity, or both, and substantially all of the entity’s activities either involve or are conducted on behalf of an investor that has disproportionately few voting rights. | | | | The Company also quantitatively and qualitatively examined if SJAP is considered a VIE. Qualitative analyses considered the extent to which the nature of its variable interest exposed the Company to losses. For quantitative analyses, the Company also used internal cash flow models to determine if SJAP was a VIE and, if so, whether the Company was the primary beneficiary. The projection of these cash flows and probabilities thereof requires significant managerial judgment because of the inherent limitations that relate to the use of historical data for the projection of future events. On June 30, 2013, the Company evaluated the above VIE testing results and concluded that the Company is the primary beneficiary of SJAP’s expected losses or residual returns and that SJAP qualifies as a VIE of the Company. As result, the Company has consolidated SJAP as a VIE. | | | | The reasons for the changes are as follows: | | | | •Originally, the board of directors of SJAP consisted of 7 members; 3 appointees from Qinghai Sanjiang (one stockholder), 1 from Garwor (one stockholder), and 3 from the Company, such that the Company did not have majority interest represented on the board of directors of SJAP. | | | | •On May 7, 2010, Qinghai Sanjiang sold and transferred its equity interest in SJAP to Garwor. The State Administration for Industry and Commerce of Xining City Government of the People’s Republic of China approved the sale and transfer. | | | | Consequently Garwor and the Company agreed that the new board of directors of SJAP would consist of 3 members; 1 appointee from Garwor and 2 appointees from the Company, such that the Company now had a majority interest in the board of directors of SJAP. Also, and in accordance with the Company’s Sino Joint Venture Agreement, the Company’s management appointed the chief financial officer of SJAP. As a result, the financial statements of SJAP were included in the consolidated financial statements of the Company. |
SINO AGRO FOOD, INC.
NOTES TO CONSOLIDATED FINANCIAL STATEMENTS
| Pursuant to an agreement dated August 1, 2006 between Infinity Environmental Group Limited (“Infinity”) and the Company, the Company was granted an A Power Technology License with the condition that the Company was required to pay the license fee covering 500 unitsof APM as performance payment to Infinity on or before July 31, 2008. This license allows the Company to develop service, manage and supply A Power Technology Farms in the PRC using the A Power Technology, but subject to a condition that the Company is required to pay a license fee to Infinity once the Company has sold the license to its customer. Under the said license, the Company has the right to authorize developers and/or joint venture partners to develop A Power Technology Farms in the PRC. Infinity is a company incorporated in Australia.
|
| | | June 30, 2013 | | December 31, 2012 | | | | | | | | | | | | Due to third parties | | $ | 664,865 | | $ | 877,259 | | | Promissory notes issued to third parties | | | 4,477,414 | | | 3,352,394 | | | Convertible notes payable | | | - | | | 232,000 | | | Due to local government | | | 2,192,825 | | | 2,192,825 | | | Miscellaneous | | | 2,924,074 | | | - | | | | | $ | 10,259,178 | | $ | 6,654,478 | |
| Due to third parties are unsecured, interest free and have no fixed terms of repayment. |
| (i) | Cost and estimated earnings in excess of billings on uncompleted contracts |
| | | June 30, 2013 | | December 31, 2012 | | | | | | | | | | | | Cost | | $ | 2,505,402 | | $ | 3,755,046 | | | Estimated earnings | | | 4,746,626 | | | 8,307,452 | | | Less: Billings | | | (5,965,253) | | | (9,725,618) | | | Costs and estimated earnings in excess of billings on uncompleted contract | | $ | 1,286,775 | | $ | 2,336,880 | |
SINO AGRO FOOD, INC.
NOTES TO CONSOLIDATED FINANCIAL STATEMENTS
18.
| CONSTRUCTION CONTRACT (CONTINUED)
|
| (ii) | Cost and estimated earnings in excess of billings on uncompleted contracts |
| | | June 30, 2013 | | December 31, 2012 | | | | | | | | | | | | Billings | | $ | 14,916,618 | | $ | 9,810,427 | | | Less: Cost | | | (4,302,086) | | | (1,886,705) | | | Estimated earnings | | | (9,692,157) | | | (5,133,638) | | | Billing in excess of costs and estimated earnings on uncompleted contract | | $ | 922,375 | | $ | 2,790,084 | |
| | | June 30, 2013 | | December 31, 2012 | | | Cost | | $ | 6,807,488 | | $ | 5,641,751 | | | Estimated earnings | | | 14,438,783 | | | 13,441,090 | | | Less: Billings | | | (20,881,871) | | | (19,536,045) | | | Cost and estimated earnings in excess of billings on uncompleted contract/(Billing in excess of Costs and estimated earnings on uncompleted contract) | | $ | 364,400 | | $ | (453,204) | |
19.
| BORROWINGS
| | | | There are no provisions in the Company’s bank borrowings and long term debts that would accelerate repayment of debt as a result of a change in credit ratings or a material adverse change in the Company’s business. Under certain agreements, the Company has the option to retire debt prior to maturity, either at par or at a premium over par.
| | |
| Short term bank loan
|
| Name of bank | | Interest
rate | | | Term | | June 30, 2013 | | | December 31, 2012 | | | Agricultural Bank of China | | 6 | % | | August 8, 2012 - August 29, 2013 | | | | | | | | | | Huangyuan County Branch, | | | | | | | | | | | | | | | Xining , Qinghai Province, | | | | | | | | | | | | | | | P.R.C. | | | | | | | $ | 2,265,849 | ^* | | $ | 3,181,927 | |
| | personal and corporate guaranteed by third parties. | | * | secured by land use rights with net carrying amount of $515,186.
|
SINO AGRO FOOD, INC.
NOTES TO CONSOLIDATED FINANCIAL STATEMENTS
19.
| BORROWINGS (CONTINUED)
|
| Name of lender | | Interest rate | | | Term | | June 30, 2013 | | December 31, 2012 | | | | | | | | | | | | | | | | | Gan Guo Village Committee | | 12.22 | % | | June 2012 - June 2017 | | | | | | | | | Bo Huang Town | | | | | | | | | | | | | | Huangyuan County, | | | | | | | | | | | | | | Xining City, | | | | | | | | | | | | | | Qinghai Province, P.R.C. | | | | | | | $ | 178,031 | | $ | 175,006 | |
| The Group’s share capital as of June 30, 2013 and December 31, 2012 shown on the consolidated balance sheet represents the aggregate nominal value of the share capital of the Company as at that date. | | | | On March 22, 2010, the Company designated 100 shares of Series A preferred stock at a par value per share of $0.001. As of the same date, 100 shares of Series A preferred stock were issued at $1 per share for cash in the amount of $100.
| | | | The Series A preferred stock: |
| (i) | does not pay a dividend; |
| (ii) | votes together with the shares of Common Stock of the Corporation as a single class and, regardless of the number of shares of Series A Preferred Stock outstanding and as long as at least one of such shares of Series A Preferred Stock is outstanding, shall represent eighty percent (80%) of all votes entitled to be voted at any annual or special meeting of shareholders of the Corporation or action by written consent of shareholders. Each outstanding share of the Series A Preferred Stock shall represent its proportionate share of the 80%, which is allocated to the outstanding shares of Series A Preferred Stock; and
|
| (iii) | ranks senior to common stockholders, holders of Series B convertible preferred stockholders and any other stockholders on liquidation. |
| The Company has designated 100 shares of Series A preferred stock with 100 shares issued and outstanding as of March 31, 2013 and December 31, 2012, respectively.
| | | | The Series B convertible preferred stock: | | | | On March 22, 2010, the Company designated 7,000,000 shares of Series B convertible preferred stock at a par value per share of $0.001. The Series B convertible preferred stock is redeemable, the stockholders are not entitled to receive any dividend and voting rights but rank senior over common stockholders on liquidation, and can convert to common stock on a one for one basis at any time. On June 26, 2010, 7,000,000 shares of common stock were surrendered for cancellation and the Company issued 7,000,000 shares of Series B convertible preferred stock at $1.00 per share. Pursuant to share exchange agreement made as of December 22, 2012, between the Company and a stockholder, Capital Adventure Inc., a holder of 3,000,000 shares of common shares, with the consent of Board of Directors, to exchange for 3,000,000 shares of Series B convertible preferred stock on one-for-one basis. As of December 23, 2012, 3,000,000 shares of Series B convertible preferred stock were issued to Capital Adventure Inc., for the exchange of its holding of 3,000,000 shares of common stocks. As of December 31, 2012, 3,000,000 shares of common stocks were still not returned to the Company.
| | | | On March 27, 2013, 3,000,000 Series B convertible preferred stock were cancelled. As a result, total issued and outstanding preferred stock as of that date is 7,000,100 shares.
|
F-67
SINO AGRO FOOD, INC.
NOTES TO CONSOLIDATED FINANCIAL STATEMENTS
20.
| SHAREHOLDERS’ EQUITY (CONTINUED)
|
| There were 7,000,000 shares and 10,000,000 shares of Series B convertible preferred stock issued and outstanding as of June 30, 2013 and December 31, 2012, respectively.
| | | | The Series F Non-Convertible preferred stock: | | | | On August 13, 2012, the Company designated 1,000,000 shares of preferred stock with a par value per share of $0.001 as Series F Non-Convertible Preferred Stock with a face value of $1.00 per share with 0 shares issued and outstanding as of June 30, 2013 and December 31, 2012.
| | | | The Series F Non-Convertible Preferred Stock: |
| (ii) | except for (iv), with respect to dividend rights, rights on liquidation, winding up and dissolution, rank junior and subordinate to (a) all classes of Common Stock,(b) all other classes of Preferred Stock and (c) any class or series of capital securities of the Company. |
| (iii) | except for (iv), shall not entitled to receive any dividend; and |
| (iv) | on May 30, 2014, the holders of record of shares of Series F Non-Convertible Preferred Stock shall be entitled to a coupon payment directly from the Company at the redemption rate of $3.40 per share. Upon redemption, the Record Holder shall no longer own any shares of Series F that have been redeemed, and all such redeemed shares shall disappear and no longer exist on the books and records of the Company; redeemed shares of Series F which no longer exist upon redemption shall thereafter be counted toward the authorized but unissued “blank check” preferred stock of the Company.
|
| Common Stock: | | | | On December 5, 2012, the Company obtained stockholder consent for the approval of an amendment to our articles of incorporation to increase our authorized shares of common stock, no par value (the “Common Stock”), from 100,000,000 to 130,000,000. The board of directors believes that the increase in our authorized Common Stock will provide is with greater flexibility with respect to our capital structure for purposes including additional equity financings and stock based acquisitions. The certificate of amendment effectuating the vote by the shareholders was filed with the State of Nevada on January 24, 2013.
| | | | During the year ended December 31, 2012, the Company issued (i) 32,064,588 shares of common stock for 18,193,714 at values ranging from $0.40 to $0.71 per share to settle debts due to third parties. The Company executed several agreements with third parties to settle debts by issuance of the Company’s common stock. The shares issued by the Company were valued at the trading price of the stock on the date the shares were issued. Any excess of the fair value of the shares over the carrying cost of the debt has been reported as a gain on the extinguishment of debts under other income of $552,988 have been credited to consolidated statements of income as other income for the year ended December 31, 2012; and (ii) 906,000 shares of common stock valued to employees at fair value of $0.40 per share for $362,400 for employee compensation. The fair value of the common stock issued was determined by using the trading price of the Company’s common stock on the date of issuance of $0.40 per share.
| | | | During the three months ended June 30, 2013, the Company issued 9,824,239 shares of common stock for $4,777,277 at values ranging from $0.37 to $0.49 per share to settle debts due to third parties. The Company executed several agreements with third parties to settle debts by issuance of the Company’s common stock. The shares issued by the Company were valued at the trading price of the stock on the date the shares were issued. Any excess of the fair value of the shares over the carrying cost of the debt has been reported as a gain on the extinguishment of debts of $498,025 and $562,361 has been credited to consolidated statements of income as other income for the three months ended June 30, 2013 and 2012, respectively.
|
F-68
SINO AGRO FOOD, INC.
NOTES TO CONSOLIDATED FINANCIAL STATEMENTS
20.
| SHAREHOLDERS’ EQUITY (CONTINUED)
|
| During the six months ended June 30, 2013, the Company issued 20,168.977 shares of common stock for $10,793,415 at values ranging from $0.37 to $0.527 per share to settle debts due to third parties. The Company executed several agreements with third parties to settle debts by issuance of the Company’s common stock. The shares issued by the Company were valued at the trading price of the stock on the date the shares were issued. Any excess of the fair value of the shares over the carrying cost of the debt has been reported as a gain on the extinguishment of debts of $1,051,013 and $817,513 has been credited to consolidated statements of income as other income for the six months ended June 30, 2013 and 2012, respectively. On March 28, 2013, the Company filed a prospectus related to a public offering of Common Stock of the Company for maximum aggregate gross proceeds of $26,250,000 within a period not to exceed 180 days from the date of this prospectus.
| | | | During the six months ended June 30, 2012, the Company issued 20,168,977 shares of common stock for $6,946,250 at values ranging from $0.37 to $0.527 per share to settle debts due to third parties.
|
|
| | The Company has common stock of 120,173,827 and 100,004,850 shares issued and outstanding as of June 30, 2013 and December 31, 2012, respectively.
|
21.
| CONVERTIBLE NOTES PAYABLE
|
| In December of 2011, the Board of Directors passed a resolution authorizing the Company to enter into an agreement to borrow funds from a third party to assist in providing a method for certain Chinese shareholders to sell their shares in the Company. The Company entered into a series of convertible promissory notes along with common stock purchase warrants whereby this third party could exercise the conversion option and settles the amount due by receiving shares of stock from these certain Chinese shareholders. The monies borrowed from this third party were deposited into a custodial account that was not controlled by the Company. The Chinese shareholders also deposited their shares with this custodian. The shares transferred to the custodian were at all times, in the opinion of management, sufficient to satisfy the obligations of the convertible promissory notes and the outstanding common stock purchase warrants. All amounts owed this financing arrangement were to be repaid through the conversion options exercised by the third party and by the deliverance of the common shares of these certain Chinese investors. | | | | During the year 2012, the Company borrowed a total of $ 460,000 from this third party under five separate promissory notes. Each note carried an interest rate of 12% per annum with a maturity date of six months from the date of issuance. Under the terms of the notes, the holder of the note has the option to convert the note to common shares at a discount of 15% from the average market price of the lowest three trading prices for the common stock during the ten trading days prior to the conversion date. The Company also issued a total of 842,500 common stock purchase warrants with an exercise price of $0.50 per share with an expiration date six months from the date of issuance.
| | | | The Company calculated the fair value of the warrants and the beneficial conversion feature utilizing the Black Scholes model at the date of the issuance of each promissory note. The relative fair values were allocated to the warrants and the debt. Accordingly, a discount was created on the debt and this discount will be amortized to interest expense of the life of the debt. Debt discount amortization as of December 31, 2012 was $ 178,867.
| | | | As of December 31, 2012, there was $ 232,000 principal outstanding and accrued interest in the amount of $ 9,764 that was owed under the terms of the promissory notes. The Company has recorded these amounts as payable by the Company with a corresponding asset represented by the value of the shares of the Company held by the custodian at December 31, 2012.
|
|
| | As of June 30, 2013, there was $0 principal outstanding and accrued interest in the amount of $0 that was owed under the terms of the promissory notes. The Company has recorded these amounts as payable by the Company with a corresponding asset represented by the value of the shares of the Company held by the custodian as of June 30, 2013.
|
F-69
SINO AGRO FOOD, INC.
NOTES TO CONSOLIDATED FINANCIAL STATEMENTS
| As indicated in the convertible promissory note footnote, during the year 2012, the Company borrowed a total of $460,000 from a third party under five separate promissory notes secured by personal guarantee of a director. Each note carried an interest rate of 12% per annum with a maturity date of six months from the date of issuance. Under the terms of the notes, the holder of the note has the option to convert the note to common shares at a discount of 15% from the average market price of the lowest three trading prices for the common stock during the ten trading days prior to the conversion date. The Company also issued a total of 842,500 common stock purchase warrants with an exercise price of $0.50 per share with an expiration date six months from the date of issuance. The Company fair valued the warrants on the date of issuances and recorded amounts based on their relative fair values to the debt and to the warrants. The fair value of the warrants was determined using the Black-Scholes pricing model and included the following assumptions
|
| Expected annual dividend rate | | | 0.00 | % | | | Weighted average exercise price | | $ | 0.50 | | | | Risk-free interest rate | | | 2.00 | % | | | Average expected life | | | 6 months | | | | Expected volatility of common stock | | | 80.00 | % | | | Forfeiture rate | | | 0.00 | % | |
| The warrants have an exercise price of $0.50 and have a contractual life of 6 months from the date of issuance. The value of the discounts created by the warrants and beneficial conversion feature were $36,113 and $52,118, respectively. The discount related to the beneficial conversion feature will be amortized to interest expense over the life of the debt and the discount for the warrants will be amortized to interest expense over the contractual life of the warrants. The relative fair values were allocated to the warrants and the debt. Accordingly, a discount was created on the debt and this discount will be amortized to interest expense of the life of the debt.
| | | | As of June 30, 2013, the following share purchase warrants were outstanding and exercisable: |
| Expiry date | | Exercise date | | June 30, 2013 | | | | | | | | | | | | April 9, 2013 | | $ | 0.50 | | | 0 | |
| Share purchase warrant transactions and the number of share purchase warrants outstanding and exercisable are summarized as follows: |
| | | June 30, 2013 | | Exercise price | | | Number of warrants outstanding as of January 1, 2013 | | | - | | | - | | | Issued | | | 385,000 | | $ | 0.50 | | | Exercised | | | - | | | - | | | Expired | | | (385,000) | | | - | | | Number of warrants outstanding as of June 30, 2013 | | | - | | | | |
SINO AGRO FOOD, INC.
NOTES TO CONSOLIDATED FINANCIAL STATEMENTS
23.
| OBLIGATION UNDER OPERATING LEASES
|
| The Company leases (i) 2,178 square feet of agriculture space used for offices for a monthly rent of $512 in Enping City, Guangdong Province, PRC, its lease expiring on March 31, 2014; (ii)5,081 square feet of office space in Guangzhou City, Guangdong Province, PRC for a monthly rent of $11,838, its lease expiring on July 8, 2014; and (iii) 1,555 square feet each for two staff quarter in Linli District, Hunan Province, PRC for a monthly rent of $159, its lease expiring on January 23, 2013 and May 1, 2014.
| | | | Lease expense was $38,002 and $14,150 for the three months ended June 30, 2013 and 2012, respectively.
| | Lease expense was $75,052 and $28,300 for the six months ended June 30, 2013 and 2012, respectively.
| | | | The future minimum lease payments as of June 30, 2013, are as follows: |
| | | June 30, 2013 | | | | | | | | | Year ended December 31,2013 | | $ | 76,004 | | | Year ended December 31,2014 | | | 85,038 | | | Thereafter | | | - | | | | | $ | 161,042 | |
| Business combination of JFD
| | | | On February 28, 2011, TRW applied to form a corporate joint venture, Enping City Bi Tao A Power Fishery Development Co., Limited (“EBAPFD”), incorporated in the PRC. TRW owned a 25% equity interest in EBAPFD. On November 17, 2011, TRW formed Jiang Men City A Power Fishery Development Co., Limited (“JFD”) in which it acquired a 25% equity interest, while withdrawing its 25% equity interest in EBAPFD. As of December 31, 2011, the Company had invested $1,258,607 in JFD. JFD is engaged as an operator of an indoor fish farm. Prior to December 31, 2011, JFD has not commenced its principal business activity. Management did not retain a specialist or valuation expert to value the purchase of this additional 25% interest. As of January 1, 2012, JFD had not commenced its principal operations and was in the process of finalizing the construction of the indoor fish farm facilities. Management determined that the fair value of the assets approximated the historical cost carried on the books of JFD. On January 1, 2012, the Company acquired an additional 25% equity interest in JFD for total cash consideration of $1,662,365. On April 1, 2012, the Company acquired an additional 25% equity interest in JFD for the amount of $1,702,580.The Company presently owns a 75% equity interest in JFD and controls its board of directors. As of January 1, 2012, the Company had consolidated the assets and operations of JFD.
|
SINO AGRO FOOD, INC.
NOTES TO CONSOLIDATED FINANCIAL STATEMENTS
24.
| BUSINESS COMBINATION (CONTINUED)
|
| Business combination of JFD(Continued)
| | | | Second acquisition on January 1, 2012 – 25% additional equity interest in JFD. | | | | The Company allocated the purchase price on the fair value of the assets acquired as of January 1, 2012. |
| Net assets at fair value acquired: | | | | | | Property, plant and equipment | | $ | 34,919 | | | Construction in progress | | | 4,495,306 | | | Inventory | | | 1,838,337 | | | | | | 6,368,562 | | | Less: Other payables | | | (92,603) | | | Non-controlling interest | | | (3,324,729) | | | 25% held by the Company | | | (1,662,365) | | | | | $ | 1,288,865 | | | | | | | | | Satisfied by | | | | | | Purchase consideration | | $ | 1,662,365 | | | Less: Cash acquired | | | (373,500) | | | | | $ | 1,288,865 | |
SINO AGRO FOOD, INC.
NOTES TO CONSOLIDATED FINANCIAL STATEMENTS
24.
| BUSINESS COMBINATION (CONTINUED)
|
| Business combination of JFD (Continued)
| | | | Third acquisition on April 1, 2012 – 25% additional equity interest in JFD. | | The Company allocated the purchase price based on the fair value of the assets acquired as of April 1, 2012. |
| Net assets at fair value acquired: | | | | | | Property, plant and equipment | | $ | 33,535 | | | Construction in progress | | | 4,499,376 | | | Inventory | | | 1,970,387 | | | Accounts receivable | | | 1,337,519 | | | | | | 7,840,817 | | | Less: Other payables | | | (292,663) | | | Accounts payable | | | (1,230,096) | | | Non-controlling interest | | | (1,702,580) | | | 50% held by the Company | | | (3,405,159) | | | | | $ | 1,210,319 | | | Satisfied by | | | | | | Purchase consideration | | $ | 1,702,580 | | | Less: Cash acquired | | | (492,261) | | | | | $ | 1,210,319 | |
| Business combination of JHMC
| | | | Second acquisition on September 30, 2012 - 50% additional equity interest in JHMC
|
|
| | On April 15, 2011, MEIJI applied to form Enping City A Power Cattle Farm Co., Limited (“ECF”), all of which the Company would indirectly own a 25% equity interest in on November 17, 2011. On September 17, 2012 MEIJI formed Jiang Men City Hang Mei Cattle Farm Development Co., Limited (“JHMC”) in which it owns 75% equity interest with investment $4,020,665 while withdrawing its 25% equity interest in ECF. As of September 30, 2012, the Company had consolidated the assets and operations of JHMC.
| | | | The Company allocated the purchase price based on the fair value of the assets acquired as of September 30, 2012. |
SINO AGRO FOOD, INC.
NOTES TO CONSOLIDATED FINANCIAL STATEMENTS
24.
| BUSINESS COMBINATION (CONTINUED)
|
| Net assets at fair value acquired: | | | | | | Property, plant and equipment | | $ | 512,450 | | | Construction in progress | | | 4,177,007 | | | Inventory | | | 671,429 | | | | | | 5,360,886 | | | Less: Non - controlling interest | | | (1,340,221) | | | | | $ | 4,020,665 | | | Satisfied by | | | | | | Purchase consideration | | $ | 4,020,665 | |
SINO AGRO FOOD, INC.
NOTES TO CONSOLIDATED FINANCIAL STATEMENTS
25.
| STOCK BASED COMPENSATION
|
| On August 16, 2012, the Company issued employees a total of 100,000 shares of common stock valued at fair value of range from $0.40 per share for services rendered to the Company. On the same date, the Company issued 806,000 shares of common stock to a company to provide consulting services for the benefit of the Company. The fair value of the common stock issued was determined by using the trading price of the Company’s common stock on the date of issuance of $0.40 per share.
| | | | The Company calculated stock based compensation of $2,501,457 and $4,278,114, and recognized $90,600 and $1,069,529, $181,200 and $2,139,058 for the three months and six months ended June 30, 2013 and 2012, respectively. As of June 30, 2013, the deferred compensation balance was $90,600 and the deferred compensation balance of $90,600 was to be amortized over 3 months beginning on July 1, 2013.
|
| As of June 30, 2013 and December 31, 2012, the Company did not have any pending claims, charges, or litigation that it expects would have a material adverse effect on its consolidated balance sheets, consolidated statements of incomes and other comprehensive income or cash flows. |
27.
| GAIN ON EXTINGUISHMENT OF DEBTS
|
| The Company executed several agreements with third parties to settle debts by issuance of the Company’s common stock. The shares issued by the Company were valued at the trading price of the stock on the date the shares were issued. Any excess of the fair value of the shares over the carrying cost of the debt has been reported as a gain on the extinguishment of debts of $498,025 and $562,361 has been credited to consolidated statements of income as other income for the three months ended June 30, 2013 and 2012, respectively. Any excess of the fair value of the shares over the carrying cost of the debt has been reported as a gain on the extinguishment of debts of $1,051,013 and $817,513 has been credited to consolidated statements of income as other income for the six months ended June 30, 2013 and 2012, respectively.
|
28.
| RELATED PARTY TRANSACTIONS
|
| In addition to the transactions and balances as disclosed elsewhere in these consolidated financial statements, during the six months ended June 30, 2013 and 2012, the Company had the following significant related party transactions:- |
Name of related party
| | Nature of transactions
| | | | Mr. Solomon Yip Kun Lee, Chairman | | Included in due to a director, due to Mr. Solomon Yip Kun Lee is $3,257,085 and $3,345,803 as of June 30, 2013 and December 31, 2012, respectively. The amounts are unsecured, interest free and have no fixed term of repayment.
|
SINO AGRO FOOD, INC.
NOTES TO CONSOLIDATED FINANCIAL STATEMENTS
| Basic earnings per share is computed by dividing net income attributable to common shareholders by the weighted average number of common shares outstanding during the period. Diluted earnings per share reflects the potential dilution of securities by including other potential common stock, including convertible preferred stock, stock options and warrants, in the weighted average number of common shares outstanding for the period, if dilutive. The numerators and denominators used in the computations of basic and dilutive earnings per share are presented in the following table: |
| | | Three months
ended | | Three months
ended | | | | | June 30, 2013 | | June 30, 2012 | | | BASIC | | | | | | | | Numerator for basic earnings per share attributable to the Company’s common
stockholders: | | | | | | | | | Net income used in computing basic earnings per share | | $ | 14,330,940 | | $ | 10,290,022 | | | Basic earnings per share | | $ | 0.12 | | $ | 0.14 | | | | | | | | | | | | Basic weighted average shares outstanding | | | 115,366,595 | | | 73,836,392 | |
| | | Three months
ended
June 30, 2013 | | Three months
ended
June 30, 2012 | | | DILUTED | | | | | | | | Numerator for basic earnings per share attributable to the Company’s common
stockholders: | | | | | | | | | Net income used in computing basic earnings per share | | $ | 14,330,940 | | $ | 10,290,022 | | | Basic earnings per share | | $ | 0.12 | | $ | 0.13 | | | | | | | | | | | | Basic weighted average shares outstanding | | | 115,366,595 | | | 73,836,392 | | | Add: weight average Series B Convertible preferred shares outstanding | | | 7,000,000 | | | 7,000,000 | | | Diluted weighted average shares outstanding | | | 122,366,595 | | | 80,836,392 | |
29.
| EARNINGS PER SHARE (CONTINUED)
|
| | | Six months
ended | | Six months
ended | | | | | June 30, 2013 | | June 30, 2012 | | | BASIC | | | | | | | | Numerator for basic earnings per share attributable to the Company’s common
stockholders: | | | | | | | | | Net income used in computing basic earnings per share | | $ | 30,709,712 | | $ | 15,961,484 | | | Basic earnings per share | | $ | 0.28 | | $ | 0.22 | | | | | | | | | | | | Basic weighted average shares outstanding | | | 110,403,819 | | | 71,312,129 | |
| | | Six months
ended
June 30, 2013 | | Six months
ended
June 30, 2012 | | | | | | | | | | | | DILUTED | | | | | | | | Numerator for basic earnings per share attributable to the Company’s common
stockholders: | | | | | | | | | Net income used in computing basic earnings per share | | $ | 30,709,712 | | $ | 15,961,484 | | | Basic earnings per share | | $ | 0.26 | | $ | 0.20 | | | | | | | | | | | | Basic weighted average shares outstanding | | | 110,403,819 | | | 71,312,129 | | | Add: weight average Series B Convertible preferred shares outstanding | | | 8,607,734 | | | 7,000,000 | | | Diluted weighted average shares outstanding | | | 119,011,553 | | | 78,312,129 | |
For the three months and six months ended June 30, 2013 and 2012, 0 and 457,000 warrants, respectively were not included in include the number of potentially dilutive securities excluded from the calculation of diluted EPS due to anti- because shares issued in respect of the share warrants exercised was from Chinese shareholders as mentioned in note 21.
|
PART II INFORMATION NOT REQUIRED IN PROSPECTUS Item 13. Other Expenses of Issuance and Distribution The following table sets forth the costs and expenses, other than underwriting discounts and commissions, if any, payable by us relating to the sale of common stockSeries G Preferred Stock being registered. All amounts are estimates except the SEC registration fee. | SEC registration fee | | $ | 3,580.50 | | | $ | 4,848.00 | | | Legal fees and expenses | | $ | 90,000 | * | | $ | 280,000 | * | | Accounting fees and expenses | | $ | 10,000 | * | | $ | 80,000 | * | | Miscellaneous, including clerical, administrative, printing, edgarizing, general and internal expenses | | $ | 70,000 | * | | | Miscellaneous | | | $ | 2,000 | * | | | | | | | | | | | | Total | | $ | 173,580.50 | * | | $ | 3,666,848 | * |
* Estimates Item 14. Indemnification of Directors and Officers Pursuant to the Articles of Incorporation and By-Laws of the Company, we may indemnify an officer or director who is made a party to any proceeding, including a lawsuit, because of his position, if he acted in good faith and in a manner he reasonably believed to be in our best interest. In certain cases, we may advance expenses incurred in defending any such proceeding. To the extent that the officer or director is successful on the merits in any such proceeding as to which such person is to be indemnified, we must indemnify him against all expenses incurred, including attorney’s fees. With respect to a derivative action, indemnity may be made only for expenses actually and reasonably incurred in defending the proceeding, and if the officer or director is judged liable, only by a court order. The indemnification is intended to be to the fullest extent permitted by the laws of the State of Nevada. In the event that a claim for indemnification against such liabilities, other than the payment by us of expenses incurred or paid by one of our directors, officers, or controlling persons in the successful defense of any action, suit or proceeding, is asserted by one of our directors, officers, or controlling person in connection with the securities being registered, we will, unless in the opinion of our counsel the matter has been settled by controlling precedent, submit to a court of appropriate jurisdiction the question whether such indemnification is against public policy as expressed in the Securities Act, and we will be governed by the final adjudication of such issue. Insofar as indemnification for liabilities arising under the Securities Act of 1933, as amended, may be permitted to our directors, officers and persons controlling us, we have been advised that it is the Securities and Exchange Commission’s opinion that such indemnification is against public policy as expressed in the Securities Act of 1933, as amended, and is, therefore, unenforceable. Item 15. Recent Sales of Unregistered Securities During the last three years, we have issued unregistered securities to the persons, as described below. None of these transactions involved any underwriters, underwriting discounts or commissions, or any public offering. The sales of these securities were, except as set forth below, deemed to be exempt from the registration requirements of the Securities Act of 1933 by virtue of Section 4(2) thereof, and/or Rule 506 of Regulation D promulgated thereunder, as transactions by an issuer not involving a public offering. The recipients of securities in each such transaction represented their intention to acquire the securities for investment only and not with a view to or for sale in connection with any distribution thereof and appropriate legends were affixed to the certificates issued in such transactions. All purchasers of our securities were accredited or sophisticated persons and had adequate access, through employment, business or other relationships, to information about us. 2010During the year ended December 31, 2016, the Company (i) issued 1,199,068 shares of common stock to employees and directors valued at fair value of $5.98 per share for $7,169,823 for employee compensation; (ii) issued 132,787 shares of common stock valued to professionals at fair value of $5.98 per share for $794,066 for service compensation; and (iii) issued 2,461,247 shares of common stock ranging from $6.96 to $8.91 amounting to $5,765,476 as collateral to secure debts loan of $4,797,332, and the shares issued by the Company were valued at the trading price of the stock on the date the shares were issued.
First quarter
During the period beginning January 1, 2010 and ending Marchyear ended December 31, 2010, we2017, the Company (i) issued an aggregate of 4,747,0001,167,502 shares of Common Stockemployees and directors at fair value of $1.00 to eleven persons, none$3.45 per share for $1,452,984 for employee compensation; (ii) issued 500,800 shares of whom was a residentcommon stock valued to professionals at fair value of $1 per share for $500,800 for service compensation; (iii) issued 4,074,979 shares of common stock ranging from $1.40 to $5.15 amounting to $12,054,045 as collateral to secure trade and loan facilities, and the shares issued by the Company were valued at the trading price of the United States. All thesestock on the date the shares were issued; and (iv) 892,735 shares of Common Stock werecommon stock issued in consideration for extinguishment of debt in the aggregate amount of $5,723,830. In addition, we issued 100 shares of Series A Preferred Stock to three individuals, none of whom was a resident of the United States,$0 as top up securities for $1.00 per share.debts loans. Second quarter
DuringOn October 20, 2017, the period beginning April 1, 2010 and ending June 30, 2010, weCompany issued an aggregatea convertible note with a principal amount of 3,702,059 shares of Common Stock$4,000,000 due on February 28, 2018. The note holder had the option to 39 persons, none of whom was a residentconvert all or any part of the United States. All these shares of Common Stock were issued in consideration for extinguishment of debt in the aggregate amount of $2,741,309. In addition, we issued 7,000,000 shares of Series B Preferred Stock to three individuals, none of whom was a resident of the United States, in consideration for the cancellation by such persons of 7,000,000 shares of Common Stock.
Third quarter
During the period beginning July 1, 2010 and ending September 30, 2010, we issued an aggregate of 3,980,000 shares of Common Stock to Mr. Shan De Zhang, who was not a resident of the United States. All these shares of Common Stock were issued in consideration for extinguishment of debt in the aggregate amount of $2,911,050. The shares were issued to Mr. Shan De Zhang as payment for the “Stock Feed Manufacturing Technology” that the Company acquired from this individual.
Fourth quarter
During the period beginning October 1, 2010 and ending December 31, 2010, we issued an aggregate of 2,551,500 shares of Common Stock to three persons, none of whom was a resident of the United States. Of these shares, (i) 2,529,000 shares of Common Stock were issued in consideration for extinguishment of debt in the aggregate amount of $3,481,390 and (ii) an aggregate of 22,500 shares of Common Stock were issued to 3 persons on workers compensation under Rule 144 for consideration of $33,750.
We relied upon Regulation S of the Securities Act of 1933, as amended, for the above issuances, none of which was made to US citizens or residents. We believe that Regulation S was available because:
None of these issuances involved underwriters, underwriting discounts or commissions;
We placed Regulation S required restrictive legends on all certificates issued;
No offers or sales of stock under the Regulation S offering were made to persons in the United States; and
No direct selling efforts of the Regulation S offering were made in the United States.
2011
First quarter
During the period beginning January 1, 2011 and ending March 31, 2011, we issued an aggregate of 1,321,000 shares of Common Stock to 4 persons, all of whom were residents of the United States. All these shares of Common Stock were issued in consideration for extinguishment of debt in the aggregate amount of $1,989,000.
Second quarter
During the period beginning April 1, 2011 and ending June 30, 2011, we issued an aggregate of 1,281,000 shares of Common Stock to three persons, all of whom were residents of the United States. All these shares of Common Stock were issued in consideration for extinguishment of debt in the aggregate amount of $1,921,500.
Third quarter
During the period beginning July 1, 2011 and ending September 30, 2011, we issued an aggregate of 5,353,326 shares of Common Stock to 86 persons, six of whom were residents of the United States. All these shares of Common Stock were issued in consideration for extinguishment of debt in the aggregate amount of $4,887,778.
Fourth quarter
During the period beginning October 1, 2011 and ending December 31, 2011, we issued an aggregate of 3,617,068 shares of Common Stock to six persons, none of whom was a resident of the United States. All these shares of Common Stock were issued in consideration for extinguishment of debt in the aggregate amount of $2,977,200.
We relied upon Section 4(2) of the Securities Act of 1933, as amended for the above issuances to US citizens or residents. We believe that Section 4(2) of the Securities Act of 1933 was available because:
None of these issuances involved underwriters, underwriting discounts or commissions.
Restrictive legends were and will be placed on all certificates issued as described above.
The distribution did not involve general solicitation or advertising.
The distributions were made only to investors who were sophisticated enough to evaluate the risks of the investment.
We relied upon Regulation S of the Securities Act of 1933, as amended, for the above issuances made to persons who were not US citizens or residents. We believe that Regulation S was available because:
None of these issuances involved underwriters, underwriting discounts or commissions;
We placed Regulation S required restrictive legends on all certificates issued;
No offers or sales of stock under the Regulation S offering were made to persons in the United States; and
No direct selling efforts of the Regulation S offering were made in the United States.
2012
First quarter
During the period beginning January 1, 2012 and ending March 31, 2012, we issued an aggregate of 3,698,284 shares of Common Stock to four persons, none of whom was a resident of the United States.
Second quarter
During the period beginning April 1, 2012 and ending June 30, 2012, we issued an aggregate of 7,037,348 shares of Common Stock to eight persons, three of whom were residents of the United States. All these shares of Common Stock were issued in consideration for extinguishment of debt in the aggregate amount of $4,572,258.
Third quarter
During the period beginning July 1, 2012 and ending September 30, 2012, we issued an aggregate of 14,161,393 shares of Common Stock to 17 persons, one of whom was a resident of the United States. Of these shares, (i) 13,255,393 shares of Common Stock were issued in consideration for extinguishment of debt in the aggregate amount of $7,739,239 and (ii) an aggregate of 906,000 shares of Common Stock were issued to 28 persons as compensation for services performed on behalf of the Company and were valued at an aggregate of $362,400. These shares were subject to the resale restrictions imposed by Rule 144 of the Securities Act.
Fourth quarter
During the period beginning October 1, 2012 and ending December 31, 2012, we issued an aggregate of 8,073,563 shares of Common Stock to 5 persons, none of whom was a resident of the United States. All these shares of Common Stock were issued in consideration for extinguishment of debt in the aggregate amount of $4,844,314.
2013
First quarter
During the period beginning January 1, 2013 and ending March 31, 2013, we issued an aggregate of 10,344,738 shares of our common stock to 4 Chinese persons. The shares were issued in consideration for extinguishment of debt in the aggregate amount of $5,678,374 based on a price ofoutstanding note into the common stock of an averagethe Company (the "Primary Optional Conversion") or TRW (the "Secondary Optional Conversion") at any time for a period of approximately $0.55eight months from the note's maturity date. The conversion price for Primary Optional Conversion is lesser of $1.5 per share.share or at 65% of the market share price of the Company. While the conversion price for Secondary Optional Conversion is $3.41 per share subject to equitable adjustment for stock split, stock dividend or right offerings.
Second quarterUnder the agreement, the Company shall pay the note holder 120,000 common shares of SIAF or 32,000 common shares of TRW as an origination fee. The note bears a flat interest payment which shall be settled by 200,000 common shares of SIAF or 55,000 common shares of TRW. As of September 30, 2018, no settlement for both origination fee and interest payment. The supplemental agreement to the Bond Subscription Agreement with the Subscriber to extend the Bond Issue by a year to December 31, 2018 was signed. All other terms and conditions of the Bond Subscription Agreement and the Conditions continue in full force and effect.
During the period beginning April 1, 2013 and ending June 30, 2013, weyear ended December 31, 2018, the Company (i) issued an aggregate of 9,824,239535,598 shares of our common stock. The shares were issued in consideration for extinguishment of debt in the aggregate amount of $4,777,277 based on a price of the common stock valued to employees and directors at values ranging from $0.37$1 to $0.49$1.56 per share.share for $576,170 for employee compensation; (ii) issued 16,032,262 shares of common stock valued to professionals and contractors ranging from $ 0.55 to $1.00 per share for $9,723,720 for service compensation; and (iii) issued 3,935,439 shares of common stock valued at $ 0.30 to $ 0.50 per share for 1,478,029 for settlement of debts. We relied upon Section 4(2)
From January 1, 2019 through the date of this registration statement, the Securities ActCompany issued 109,911 shares of 1933, as amendedcommon stock valued at $ 0.30 per share for the above issuances to US citizens or residents. We believe that Section 4(2)settlement of the Securities Act32,973.30 of 1933 was available because: None of these issuances involved underwriters, underwriting discounts or commissions.
Restrictive legends were and will be placed on all certificates issued as described above.
The distribution did not involve general solicitation or advertising.
The distributions were made only to investors who were sophisticated enough to evaluate the risks of the investment.
We relied upon Regulation S of the Securities Act of 1933, as amended, for the above issuances made to persons who were not US citizens or residents. We believe that Regulation S was available because:
None of these issuances involved underwriters, underwriting discounts or commissions;
We placed Regulation S required restrictive legends on all certificates issued;
No offers or sales of stock under the Regulation S offering were made to persons in the United States; and
No direct selling efforts of the Regulation S offering were made in the United States.
In connection with the above transactions, although some of the investors may have also been accredited, we provided the following to all investors:
Access to all our books and records.
Access to all material contracts and documents relating to our operations.
The opportunity to obtain any additional information, to the extent we possessed such information necessary to verify the accuracy of the information to which the investors were given access.
Prospective investors were invited to review at our offices at any reasonable hour, after reasonable advance notice, any materials available to us concerning our business. Prospective investors were also invited to visit our offices.debts.
Item 16. Exhibits and Financial Statement Schedules Exhibit No.
Number | | Exhibit Description | | | | | 2.1 3.1 | | Stock Purchase Agreement and Share Exchange – Volcanic Gold and Capital Award. Incorporated herein by reference to the Registration Statement on Form 10 filed on November 19, 2010 as Exhibit 2.1 thereto. | | | | 2.2 | | Acquisition Agreement - Hang Yu Tai Investment Limited. Incorporated herein by reference to the Registration Statement on Form 10 filed on November 19, 2010 as Exhibit 2.2 thereto. | | | | 2.3 | | Acquisition Agreement - Macau Eiji Company Limited. Incorporated herein by reference to the Registration Statement on Form 10 filed on November 19, 2010 as Exhibit 2.3 thereto. | | | | 2.4 | | Acquisition Agreement - Tri-way Industries Limited. Incorporated herein by reference to the Registration Statement on Form 10 filed on November 19, 2010 as Exhibit 2.4 thereto. | | | | 2.5 | | Disposition Agreement - Triway selling equity interest in TianQuan Science. Incorporated herein by reference to the Registration Statement on Form 10 filed on November 19, 2010 as Exhibit 2.5 thereto. | | | | 2.6 | | Acquisition Agreement - A Power Agro Agriculture Development (Macau) Limited acquired the Pretty Mountains’ 45% equity interest in Sanjiang A Power. Incorporated herein by reference to the Registration Statement on Form 10 filed on November 19, 2010 as Exhibit 2.6 thereto. | | | | 3.1 | | Articles of Incorporation of Volcanic Gold, Inc. Incorporated herein by reference to the Registration Statement on Form 10 filed on November 19, 2010 as Exhibit 3.1 thereto. | | | | | | 3.2 | | Amendment to Articles of Incorporation –- Name Change: Volcanic Gold, Inc. to A Power Agro Agriculture Development, Inc. Incorporated herein by reference to the Registration Statement on Form 10 filed on November 19, 2010 as Exhibit 3.2 thereto. | | | | | | 3.3 | | Certificate of Correction. Incorporated herein by reference to the Registration Statement on Form 10 filed on November 19, 2010 as Exhibit 3.3 thereto. | | | | | | 3.4 | | Amendment to Articles of Incorporation –- Name Change: A Power Agro Agriculture Development, Inc. to Sino Agro Food, Inc. Incorporated herein by reference to the Registration Statement on Form 10 filed on November 19, 2010 as Exhibit 3.4 thereto. | | | | | | 3.5 | | Bylaws of Volcanic Gold, Inc. Incorporated herein by reference to the Registration Statement on Form 10 filed on November 19, 2010 as Exhibit 3.5 thereto. | | | | 3.6 | | Organizational Documents: Capital Award, Inc. Incorporated herein by reference to the Registration Statement on Form 10 filed on November 19, 2010 as Exhibit 3.6 thereto. |
3.7 | | Organizational Documents: Hang Yu Tai Investment Limited. Incorporated herein by reference to the Registration Statement on Form 10 filed on November 19, 2010 as Exhibit 3.7 thereto. | | | | 3.8 | | Organizational Documents: ZhongXingNongMu Co. Ltd. Incorporated herein by reference to the Registration Statement on Form 10 filed on November 19, 2010 as Exhibit 3.8 thereto. | | | | 3.9 | | Organizational Documents: Macau Eiji Company Limited. Incorporated herein by reference to the Registration Statement on Form 10 filed on November 19, 2010 as Exhibit 3.9 thereto. | | | | 3.10 | | Organizational Documents: Jiang Men City Heng Sheng Tai Agriculture Development Co. Ltd. Incorporated herein by reference to the Registration Statement on Form 10 filed on November 19, 2010 as Exhibit 3.10 thereto. | | | | 3.11 | | Organizational Documents: Tri-way Industries Limited. Incorporated herein by reference to the Registration Statement on Form 10 filed on November 19, 2010 as Exhibit 3.11 thereto. | | | | 3.12 | | Organizational Documents: A Power Agro Agriculture Development (Macau) Limited. Incorporated herein by reference to the Registration Statement on Form 10 filed on November 19, 2010 as Exhibit 3.12 thereto. | | | | 3.13 | | Bylaws. Incorporated herein by reference to the Current Report on Form 8-K filed on November 28, 2012 as Exhibit 3.1 thereto. | | | | 3.14 | | Certificate of Amendment to Articles of Incorporation. Incorporated herein by reference to the Current Report on Form 8-K filed on January 30, 2013 as Exhibit 3.1thereto.3.1 thereto. | | | | | 4.13.6 | | Form of common stock Certificate of Sino Agro Foods,Amendment to Articles of Incorporation. Incorporated herein by reference to the Current Report on Form 8-K filed on November 1, 2013 as Exhibit 3.1 thereto. | | | | | 3.7 | | Certificate of Amendment to Articles of Incorporation. Incorporated herein by reference to the Current Report on Form 8-K filed on June 12, 2014 as Exhibit 3.1 thereto. | | | | | 3.8 | | Certificate of Amendment to Articles of Incorporation. Incorporated herein by reference to the Current Report on Form 8-K filed on November 10, 2014 as Exhibit 3.1 thereto. | | | | | 3.9 | | Certificate of Amendment to Articles of Incorporation. Incorporated herein by reference to the Current Report on Form 8-K filed on December 17, 2014 as Exhibit 3.1 thereto. |
| 3.10 | | Bylaws of Volcanic Gold, Inc. Incorporated herein by reference to the Registration Statement on Form 10 filed on November 19, 2010 as Exhibit 4.13.5 thereto. | | | | | 4.23.11 | | Form of Certificate of Series A Preferred.Bylaws. Incorporated herein by reference to the Registration StatementCurrent Report on Form 108-K filed on November 19, 201028, 2012 as Exhibit 4.23.1 thereto. | | | | | 4.33.12 | | Form of Certificate of Series B Preferred. Incorporated herein by reference to the Registration Statement on Form 10 filed on November 19, 2010 as Exhibit 4.3 thereto. | | | | 4.4 | | Certificate of Rights and Preferences – Series A Preferred. Incorporated herein by reference to the Registration Statement on Form 10 filed on April 25, 2011 as Exhibit 4.4 thereto. | | | | 4.5 | | Certificate of Rights and Preferences –- Series B Preferred. Incorporated herein by reference to the Registration Statement on Form 10 filed on April 25, 2011 as Exhibit 4.5 thereto. | | | | | 4.63.13* | | Form of Certificate of Designationthe Designations, Powers, Preferences and Rights of the 7% Series FG Non-Convertible Cumulative Redeemable Perpetual Preferred Stock. Incorporated herein by reference to the Current Report on Form 8-K filed on November 16, 2012 as Exhibit 3.1 thereto.Stock | | | | | 5.15.1* | | Opinion of Sichenzia Ross Friedman Ference LLP*LLP as to validity of the Series G Preferred Stock. | | | | | 10.110.1** | | Patented “Intellectual Property” namely “Zhi Wu Jei Gan Si Liao Chan Ye Hua Chan Pin Ji Qi Zhi Bei Fang Fa” registered under the Patent Number “ZL2005 10063039.9” and Certificate number “329722”Form of China. Incorporated herein by reference to the Registration Statement on Form 10 filed on November 19, 2010 as Exhibit 10.1 thereto.Subscription Agreement | | | | | 10.210.2** | | Sino Foreign Joint Venture Agreement: Jiang Men City Heng Sheng Tai Agriculture Development Co. Ltd. Incorporated herein by reference to the Registration Statement on Form 10 filed on November 19, 2010 as Exhibit 10.2 thereto.of Series 1, Series 2 and Series 3 Warrant | | | | | 10.321.1 | | Sino Foreign Joint Venture Agreement: Qinghai Sanjiang A Power Agriculture Co. Ltd. Incorporated herein by referenceSubsidiaries of the Company (filed as Exhibit 21 to the Company’s Registration Statement on Form 10S-1 filed on November 19, 2010 as Exhibit 10.3 thereto.September 23, 2013, and incorporated by reference herein) | | | | | 10.423.1* | | DeedConsent of Trust - A Power Agro Agriculture Development (Macau) Limited. Incorporated herein by reference to the Registration Statement on Form 10 filed on November 19, 2010 as Exhibit 10.4 thereto.David Yueng, ECOVIS HK | | | | | 10.523.2* | | DeedConsent of Trust - Macau Eiji Company Limited. Incorporated herein by reference to the Registration Statement on Form 10 filed on November 19, 2010 as Exhibit 10.5 thereto. |
10.6 | | Deed of Trust - Hang Yu Tai Investment Limited. Incorporated herein by reference to the Registration Statement on Form 10 filed on November 19, 2010 as Exhibit 10.6 thereto.ZHEN HUI CPA. | | | | | 10.723.3* | | Master License from Infinity Environmental Group, a Belize corporation. Incorporated herein by reference to the Registration Statement on Form 10 filed on November 19, 2010 as Exhibit 10.7 thereto. | | | | 10.8 | | Capital Award Consulting Service Agreement. Incorporated herein by reference to the Registration Statement on Form 10 filed on January 19, 2011 as Exhibit 10.8 thereto. | | | | 10.9 | | Tri-Way Joint Venture Agreement. Incorporated herein by reference to the Registration Statement on Form 10 filed on January 19, 2011 as Exhibit 10.9 thereto. | | | | 10.10.a | | Share Sale Agreement of Zhongxingnongmu Co. Ltd. ** | | | | 10.10.b | | MOU SIAF and Mr. Sun Sales and Purchase of shares Hang Yu Tai. Incorporated herein by reference to the Registration Statement on Form 10 filed on July 6, 2011 as Exhibit 10.10(b) thereto. | | | | 10.11 | | Joint Venture Agreement for Enping City Bi Tao A Power Prawn Culture Development Co., Ltd. Incorporated herein by reference to the Registration Statement on Form 10 filed on April 25, 2011 as Exhibit 10.11 thereto. | | | | 10.12 | | AP Technology Consulting Services Agreement between Capital Award and a Group of China Parties. Incorporated herein by reference to the Registration Statement on Form 10 filed on April 25, 2011 as Exhibit 10.12 thereto. | | | | 10.13 | | Organic Premium Beef Cattle (Fragrant Beef) Breeding and Feed Production Technology Cooperation Agreement. Incorporated herein by reference to the Registration Statement on Form 10 filed on April 25, 2011 as Exhibit 10.13 thereto. | | | | 10.14 | | Organic Premium Beef Cattle (Fragrant Beef) Breeding and Feed Production Technology Sale and Transfer Agreement. Incorporated herein by reference to the Registration Statement on Form 10 filed on April 25, 2011 as Exhibit 10.14 thereto. | | | | 10.15 | | Employment Agreement – Lee. Incorporated herein by reference to the Registration Statement on Form 10 filed on July 6, 2011 as Exhibit 10.15 thereto. | | | | 10.16 | | Employment Agreement – Tan. Incorporated herein by reference to the Registration Statement on Form 10 filed on July 6, 2011 as Exhibit 10.16 thereto. | | | | 10.17 | | Employment Agreement – Chen. Incorporated herein by reference to the Registration Statement on Form 10 filed on July 6, 2011 as Exhibit 10.17 thereto. | | | | 10.18 | | SJVC Enping Cattle and Sheep Farm Joint Venture Agreement. Incorporated herein by reference to the Registration Statement on Form 10 filed on July 6, 2011 as Exhibit 10.18 thereto. | | | | 10.19 | | Bait Fish Contract between Enping A Power Fishery Development Co. Ltd. and Guangzhou Jinyang Aquaculture Co. Ltd. Incorporated herein by reference to the Current Report on Form 8-K filed on December 19, 2011 as Exhibit 10.1 thereto. | | | | 10.20 | | Sleepy Cod Contract between Enping A Power Fishery Development Co. Ltd. and Guangzhou Jinyang Aquaculture Co. Ltd. Incorporated herein by reference to the Current Report on Form 8-K filed on December 19, 2011 as Exhibit 10.2 thereto. | | | | 10.21 | | Agreement between Capital Award, Inc. and Liu Gang, et al. Incorporated herein by reference to the Current Report on Form 8-K filed on February 29, 2012 as Exhibit 10.1 thereto. | | | | 10.22 | | Agreement between Macau Eiji Company Limited and Mr. Jin Xuesong. Incorporated herein by reference to the Current Report on Form 8-K filed on March 28, 2012 as Exhibit 10.1 thereto. | | | | 10.23 | | Addendum to Consulting and Services Agreement. Incorporated herein by reference to the Quarterly Report on Form 10-Q filed on August 14, 2012 as Exhibit 10.1 thereto. | | | | 10.24 | | SJVC Agreement between MEIJI and Mr. He Yue Xiong. Incorporated herein by reference to the Quarterly Report on Form 10-Q filed on August 14, 2012 as Exhibit 10.2 thereto. |
10.25 | | Consulting and Services Agreement MEIJI and Mr. He Yue Xiong, et al. Incorporated herein by reference to the Quarterly Report on Form 10-Q filed on August 14, 2012 as Exhibit 10.3 thereto. | | | | 10.26 | | Agreement to Purchase Young Beef between MEIJI and Yang Zi Shao Town Cattle Farm. Incorporated herein by reference to the Quarterly Report on Form 10-Q filed on August 14, 2012 as Exhibit 10.4 thereto. | | | | 10.27 | | WSPS SJVC between the Company and Zhou Jianfeng. Incorporated herein by reference to the Quarterly Report on Form 10-Q filed on August 14, 2012 as Exhibit 10.5 thereto. | | | | 10.28 | | WSPS Consulting and Services Agreement between Capital Award and Zhou Jianfeng, et al. Incorporated herein by reference to the Quarterly Report on Form 10-Q filed on August 14, 2012 as Exhibit 10.6 thereto. | | | | 10.29 | | Memorandum of Understanding between the Company and Wu Xiaofeng. Incorporated herein by reference to the Quarterly Report on Form 10-Q filed on August 14, 2012 as Exhibit 10.7 thereto. | | | | 10.30 | | Jiangman Hang Meiji Cattle Farm Co. Ltd. Statutory Documents. Incorporated herein by reference to the Quarterly Report on Form 10-Q filed on November 15, 2012 as Exhibit 10.8 thereto. | | | | 10.31 | | Consulting and Service Agreement (Wholesale 2) between the Company and Guangzhou YiLi Na Wei Trading Co. Ltd. Incorporated herein by reference to the Quarterly Report on Form 10-Q filed on November 15, 2012 as Exhibit 10.9 thereto. | | | | 10.32 | | JFD Lease agreement. ** | | | | 10.33 | | JHMC Lease Agreement. ** | | | | 10.34 | | JHST Lease Agreement. ** | | | | 10.35 | | Sino Agro Food, Inc. Lease Agreement. ** | | | | 10.36 | | Capital Award Consulting Service Agreement related to Fish Farm 2. ** | | | | 10.37 | | WXC Consulting Agreement. ** | | | | 10.38 | | Consulting and Service Agreement between MEIJI and Wei Da Xing, et al.** | | | | 14 | | Code of Ethics. Incorporated herein by reference to the Registration Statement on Form S-1 filed on March 28, 2013 as Exhibit 14 thereto. | | | | 21 | | List of subsidiaries. ** | | | | 23.1 | | Consent of Madsen & Associates CPA’s, Inc. ** | | | | 23.2 | | Consent of Sichenzia Ross Friedman Ference LLP (included in Exhibit 5.1)* | | | | 99.1 | | Opinion of PR Counsel **5.1 to this Registration Statement). |
* Included herein. ** To be filed by amendment ** Filed herewithamendment.
Item 17. Undertakings (a) The undersigned registrant hereby undertakes:
(1) To file, during any period in which offers or sales are being made, a post-effective amendment to this registration statement: (i) To include any prospectus required by sectionSection 10(a)(3) of the Securities Act of 1933; (ii) To reflect in the prospectus any facts or events arising after the effective date of the registration statement (or the most recent post-effective amendment thereof) which, individually or in the aggregate, represent a fundamental change in the information set forth in the registration statement. Notwithstanding the foregoing, any increase or decrease in volume of securities offered (if the total dollar value of securities offered would not exceed that which was registered) and any deviation from the low or high end of the estimated maximum offering range may be reflected in the form of prospectus filed with the Commission pursuant to Rule 424(b) of this chapter) if, in the aggregate, the changes in volume and price represent no more than a 20%20 percent change in the maximum aggregate offering price set forth in the “Calculation of Registration Fee” table in the effective registration statement; and (iii) To include any material information with respect to the plan of distribution not previously disclosed in the registration statement or any material change to such information in the registration statement. (2) That, for the purposespurpose of determining any liability under the Securities Act of 1933, each such post-effective amendment shall be deemed to be a new registration statement relating to the securities offered therein, and the offering of thesuch securities at that time shall be deemed to be the initialbona fide offering thereof. (3) To remove from registration by means of a post-effective amendment any of the securities being registered which remain unsold at the termination of the offering. (5) That, for(4) For determining liability of the purpose of determining liabilityundersigned small business issuer under the Securities Act of 1933 to any purchaser, each prospectus filed pursuant to Rule 424(b) as part of a registration statement relating to an offering, other than registration statements relying on Rule 430B or other than prospectuses filed in reliance on Rule 430A, shall be deemed to be part of and included in the registration statement as of the date it is first used after effectiveness. Provided, however, that no statement made in a registration statement or prospectus that is part of the registration statement or made in a document incorporated or deemed incorporated by reference into the registration statement or prospectus that is part of the registration statement will, as to a purchaser with a time of contract of sale prior to such first use, supersede or modify any statement that was made in the registration statement or prospectus that was part of the registration statement or made in any such document immediately prior to such date of first use.
(6) For the purpose of determining liability of the registrant under the Securities Act of 1933 to any purchaser in the initial distribution of the securities, the undersigned undertakes that in a primary offering of securities of the undersigned registrantsmall business issuer pursuant to this registration statement, regardless of the underwriting method used to sell the securities to the purchaser, if the securities are offered or sold to such purchaser by means of any of the following communications, the undersigned registrantsmall business issuer will be a seller to the purchaser and will be considered to offer or sell such securities to such purchaser:
(i) Any preliminary prospectus or prospectus of the undersigned registrant relating to the offering required to be filed pursuant to Rule 424; (ii) Any free writing prospectus relating to the offering prepared by or on behalf of the undersigned registrantsmall business issuer or used or referred to by the undersigned registrant; (iii) The portion of any other free writing prospectus relating to the offering containing material information about the undersigned registrantsmall business issuer or its securities provided by or on behalf of the undersigned registrant;small business issuer; and (iv) Any other communication that is an offer in the offering made by the undersigned registrant to the purchaser. (h) (5) For purposes of determining any liability under the Securities Act of 1933, the information omitted from the form of prospectus filed as part of this registration statement in reliance upon Rule 430A and contained in a form of prospectus filed by the registrant pursuant to Rule 424(b) (1) or (4) or 497(h) under the Securities Act shall be deemed to be part of this registration statement as of the time it was declared effective.
(6) For the purpose of determining any liability under the Securities Act of 1933, each post-effective amendment that contains a form of prospectus shall be deemed to be a new registration statement relating to the securities offered therein, and the offering of such securities at that time shall be deemed to be the initial bona fide offering thereof. Insofar as indemnification for liabilities arising under the Securities Act of 1933 (the “Act”) may be permitted to directors, officers and controlling persons of the registrant pursuant to the foregoing provisions, or otherwise, the registrant has been advised that in the opinion of the Securities and Exchange Commission such indemnification is against public policy as expressed in the Securities Act of 1933 and is, therefore, unenforceable. In the event that a claim for indemnification against such liabilities other(other than the payment by the registrant of expenses incurred andor paid by a director, officer or controlling person of the registrant in the successful defense of any action, suit or proceeding,proceeding) is asserted by such director, officer or controlling person in connection with the securities being registered, hereby, the registrant will, unless in the opinion of its counsel the matter has been settled by controlling precedent, submit to a court of appropriate jurisdiction the question whether such indemnification by it is against public policy as expressed in the Securities Act of 1933 and will be governed by the final adjudication of such issue. (i) The undersigned Registrant hereby undertakes that it will:
(1) for determining any liability under the Securities Act, treat the information omitted from the form of prospectus filed as part of this registration statement in reliance upon Rule 430A and contained in a form of prospectus filed by the registrant under Rule 424(b)(1), or (4) or 497(h) under the Securities Act as part of this registration statement as of the time the Commission declared it effective.
(2) for determining any liability under the Securities Act, treat each post-effective amendment that contains a form of prospectus as a new registration statement for the securities offered in the registration statement, and that offering of the securities at that time as the initial bona fide offering of those securities.
SIGNATURES Pursuant to the requirements of the Securities Act of 1933, as amended, the registrant certifies that it has reasonable grounds to believe that the registrant meets all of the requirements for filing on Form S-1 and has duly caused this Registration Statement to be signed on its behalf by the undersigned, thereunto duly authorized, in the City of Guangzhou, in the PRC, on this 23rd27th day of September, 2013.June 2019. | | | SINO AGRO FOOD, INC. | | | | | September 23, 2013June 27, 2019 | By: | /s/ LEE YIP KUN SOLOMON | | | | Lee Yip Kun Solomon Chief Executive Officer, Interim Chief Financial Officer and Chairman (Principal Executive Officer, Principal Financial Officer Principal Accounting Officer) |
In accordance with the requirements of the Securities Act, this Registration Statement has been signed below by the following persons in the capacities and on the dates indicated. September 23, 2013June 27, 2019 | By: | /s/ LEE YIP KUN SOLOMON | | | | Lee Yip Kun Solomon Chief Executive Officer, DirectorInterim Chief Financial Officer and Chairman (Principal Executive Officer, Principal Financial Officer Principal Accounting Officer) |
September 23, 2013 | | | | June 27, 2019 | By: | /s/ TAN POAY TEIK | | | | Tan PoayTeikPoay Teik Chief Officer, Marketing, Officer and Director |
September 23, 2013 | | | | June 27, 2019 | By: | /s/ CHEN BORHANNBOR HANN | | | | Chen BorHannBor Hann Corporate Secretary and Director |
September 23, 2013 | | | | June 27, 2019 | By: | /s/ YAP KOI MINGCOLANUKUDURU RAVINDRAIN | | | | Yap Koi MingColanukuduru Ravindran,
Director |
September 23, 2013 | | | | June 27, 2019 | By: | /s/ NILS-ERIK SANDBERGMUSON CHEUNG | | | | Nils-Erik SandbergMuson Cheung
Director |
|
|
|
|