As filed with the Securities and Exchange Commission on November 17, 2014April 26, 2018
RegistrationFile No. 333-199160333-________
UNITED STATES
SECURITIES AND EXCHANGE COMMISSION
Washington, D.C. 20549
AMENDMENT NO. 1 TO FORM
Form S-1
REGISTRATION STATEMENT
UNDER
THE SECURITIES ACT OF 1933
SINO-GLOBAL SHIPPING AMERICA, LTD.
(Exact Namename of Registrantregistrant as Specifiedspecified in Charter)its charter)
| Virginia | | 4731 | | 11-3588546 |
(State or Other Jurisdictionother jurisdiction of Incorporationincorporation or Organization)organization)
| | (Primary Standard Industrial Classification Classification Code Number) | | (IRSI.R.S. Employer Identification No.) |
1044 Northern Boulevard, Suite 305
Roslyn, New York 11576-1514
(718) 888-1814
(Address, including zip code, and telephone number, including area code, of registrant’s principal executive offices)place of business)
Lei Cao,
Chief Executive Officer
Sino-Global Shipping America, Ltd.
1044 Northern Boulevard, Suite 305
Roslyn, New York 11576-1514
(718) 888-1814
(Name, address, including zip code, and telephone number, including area code, of registrant’s agent for service)
Copies to:
Elizabeth F. Chen, Esq. Michael T. Campoli, Esq. Pryor Cashman LLP 7 Times Square New York, New York 10036 (212) 421-4100 (phone) Lawrence G. Nusbaum, Esq.
Bryan Dixon, Esq.
Gusrae Kaplan Nusbaum PLLC
120 Wall Street, 25th Floor
New York, New York 10005
Tel: (212) 269-1400
Fax: (212) 809-5449
| | Darrick M. Mix, Esq.
David A. Sussman, Esq.
Duane Morris LLP
30 South 17th Street
Philadelphia, PA 19103-4196
Tel: (215) 979-1000
Fax: (215) 405-2906
|
Approximate date of commencement of proposed sale to the public:public. As soon as practicable after the effective date of this Registration Statement becomes effective.registration statement.
If any of the securitiesSecurities being registered on this Form are to be offered on a delayed or continuous basis pursuant to Rule 415 under the Securities Act of 1933, as amended, check the following box:¨ ☒
If this Form is filed to register additional securities for an offering pursuant to Rule 462(b) under the Securities Act, please check the following box and list the Securities Act registration statementRegistration Statement number of the earlier effective registration statementRegistration Statement for the same offering:¨ ☐
If this Form is a post-effective amendment filed pursuant to Rule 462(c) under the Securities Act, please check the following box and list the Securities Act registration statementRegistration Statement number of the earlier effective registration statementRegistration Statement for the same offering. ¨offering: ☐
If this Form is a post-effective amendment filed pursuant to Rule 462(d) under the Securities Act, check the following box and list the Securities Act registration statementRegistration Statement number of the earlier effective registration statementRegistration Statement for the same offering. ¨offering: ☐
Indicate by check mark whether the registrant is a large accelerated filer, an accelerated filer, a non-accelerated filer, or a smallsmaller reporting company:company. See the definitions of “large accelerated filer,” “accelerated filer” and “smaller reporting company” in Rule 12b-2 of the Exchange Act.
Large accelerated filer¨ | ☐ | Accelerated filer¨ | ☐ |
Non-accelerated filer¨ | ☐ (Do not check if a smaller reporting company) | Smaller reporting companyx | ☒ |
| | Emerging Growth Company | ☐ |
If an emerging growth company, indicate by check mark if the registrant has elected not to use the extended transition period for complying with any new or revised financial accounting standards provided pursuant to section 7(a)(2)(B) of the Securities Act: ☐
Calculation of Registration Fee
CALCULATION OF REGISTRATION FEE
Title of each class of securities to be
registered | | Amount to
be registered | | | Proposed
maximum
offering price
per share | | | Proposed
maximum
aggregate offering
price(1)(2) | | | Amount of
registration Fee (3) (4) | |
| | | | | | | | | | | | | | | | | |
| Common stock, without par value per share | | | | | | | | | | $ | 8,400,000 | | | $ | 976 | |
| Title Of Each Class Of Securities To Be Registered | | Amount
to be
Registered(1) | | Proposed
Maximum
Offering Price
Per Share(3) | | | Proposed
Maximum
Aggregate
Offering Price(3) | | | Amount Of Registration Fee | |
| Common Stock, without par value per share | | 4,000,000
Shares (2) | | $ | 1.16 | | | $ | 4,640,000 | | | $ | 578 | |
| (1) | Pursuant to Rule 416(a) of the Securities Act of 1933, as amended, this registration statement also covers such additional shares as may hereafter be offered or issued to prevent dilution resulting from stock splits, stock dividends, recapitalizations or similar transactions. |
| (2) | Consists of 4,000,000 shares of common stock issuable upon exercise of warrants that were issued to the Selling Shareholders named herein. |
| (3) | Estimated solely for the purpose of calculating the registration fee underin accordance with Rule 457(o) under the Securities Act. |
| (2) | Includes the offering price of shares of common stock that may be sold if the over-allotment option granted by us to the underwriter is exercised. |
| (3) | Calculated pursuant to Rule 457(a)457(c) under the Securities Act of 1933, as amended, based on an estimatethe average of the proposed maximum aggregate offering price.high and low prices per share of the registrant’s common stock on the Nasdaq Capital Market on April 24, 2018. |
The Registrantregistrant hereby amends this registration statementRegistration Statement on such date or dates as may be necessary to delay its effective date until the Registrantregistrant shall file a further amendment which specifically states that this registration statementRegistration Statement shall hereafterthereafter become effective in accordance with Sectionsection 8(a) of the Securities Act of 1933 or until the registration statementRegistration Statement shall become effective on such date as the Commission,commission, acting pursuant to Sectionsection 8(a), may determine.
The information contained in this preliminary prospectus is not complete and may be changed. These securitiesThe selling shareholders may not be soldsell these securities until the registration statement filed with the Securities and Exchange Commission is effective. This preliminary prospectus is not an offer to sell these securities and is not soliciting an offer to buy these securities in any jurisdictionstate where the offer or sale is not permitted.
SUBJECT TO COMPLETION
PRELIMINARY PROSPECTUS DATED NOVEMBER __, 2014Subject to Completion, dated April 26, 2018


SINO-GLOBAL SHIPPING AMERICA, LTD.
__________4,000,000 Shares of Common Stock Issuable upon Exercise of Warrants
This prospectus relates to the resale of up to 4,000,000 shares of the common stock of Sino-Global Shipping America, Ltd., a Virginia corporation (the “Company”), that may be sold from time to time by the selling shareholders named in this prospectus (the “Selling Shareholders”).
The shares of common stock offered under this prospectus consist of 2,000,000 shares of common stock issuable upon the exercise of certain series “A” warrants (the “Series A Warrants”), and 2,000,000 shares of common stock issuable upon the exercise of certain series “B” warrants (the “Series B Warrants”, and together with the Series A Warrants, the “Warrants”), that we issued to the Selling Shareholders, each of whom is an accredited investor, on March 14, 2018, in a private placement pursuant to a Securities Purchase Agreement dated as of March 12, 2018, by and among the Company and the purchasers named therein. The issuance of the Warrants was made in reliance on the exemptions from registration afforded by Section 4(a)(2) of the Securities Act of 1933, as amended (the “Securities Act”), and Rule 506(b) promulgated thereunder.
We are offering [__________]shareswill not receive any proceeds from the sale of our common stock, at a public offering price of $[____] per share.
For a more detailed descriptionany of the shares of common stock seeoffered hereby by the section entitled “DescriptionSelling Shareholders. To the extent that any of Securities”the Warrants are exercised for cash, if at all, we will receive the exercise price for those Warrants.
The Selling Shareholders or their pledgees, assignees or successors-in-interest may offer and sell or otherwise dispose of the shares of common stock described in this prospectus from time to time through underwriters, broker-dealers or agents, in public or private transactions at prevailing market prices, at prices related to prevailing market prices or at privately negotiated prices. The Selling Shareholders will bear all commissions and discounts, if any, attributable to the sales of shares. We will bear all other costs, expenses and fees in connection with the registration of the shares. See “Plan of Distribution” beginning on page 49.43 of this prospectus for more information about how the Selling Shareholders may sell or dispose of their shares of common stock.
Our common stock is listed on the NASDAQNasdaq Capital Market under the symbol “SINO”. On November 10, 2014,April 24, 2018, the last reported closingsale price offor our common stock as reported on the Nasdaq Capital Market was $2.06$1.13 per share.
We have agreed to issue at the election of the underwriter, up to [________] additional shares of our common stock, at the public offering price of $[____], to cover over-allotments. INVESTING IN OUR COMMON STOCK INVOLVES SUBSTANTIAL RISKS. SEE THE SECTION TITLED “RISK FACTORS” BEGINNING ON PAGE 4 OF THIS PROSPECTUS TO READ ABOUT FACTORS YOU SHOULD CONSIDER BEFORE BUYING SHARES OF OUR COMMON STOCK.
NEITHER THE SECURITIES AND EXCHANGE COMMISSION NOR ANY STATE SECURITIES COMMISSION HAS APPROVED OR DISAPPROVED OF THESE SECURITIES OR PASSED UPON THE ADEQUACY OR ACCURACY OF THIS PROSPECTUS. ANY REPRESENTATION TO THE CONTRARY IS A CRIMINAL OFFENSE.
Investing in our common stock involves a high degree of risk. You should purchase shares of our common stock only if you can afford a complete loss of your investment. See “Risk Factors” beginning on page 5.
| | Per
Common
Share | | | Total | |
Public Offering Price | | $ | | | | $ | | |
Underwriting discount(1) | | $ | | | | $ | | |
Proceeds, before expenses, to us | | $ | | | | $ | | |
(1) In addition, we have agreed to pay or reimburse the underwriter for certain expenses. See “Underwriting” in this prospectus for additional disclosure regarding underwriting discounts and estimated offering expenses.
The underwriter expects to deliver the shares of common stock to the purchasers on or about [____________], 2014.
Neither the Securities and Exchange Commission nor any state securities commission has approved or disapproved of these securities or passed upon the adequacy or accuracy of this prospectus. Any representation to the contrary is a criminal offense.
National Securities Corporation
The date of this prospectus is _________, 2014._______, 2018
TABLE OF CONTENTS
ABOUT THIS PROSPECTUS
This prospectus is part of a registration statement on Form S-1 that we have filed with the Securities and Exchange Commission (the “SEC”) pursuant to which the Selling Shareholders named herein may, from time to time, offer and sell or otherwise dispose of the shares of our common stock covered by this prospectus. You should rely only on the information contained in this prospectus. Neither we nor the underwriter hasprospectus or any related prospectus supplement. We have not authorized anyone to provide you with different information. If anyone provides you with different or inconsistent information, additional to or different from that contained in this prospectus. Neither we nor the underwriter take any responsibility for any other information others may give you. We and the underwriter are offering to sell, and seeking offers to buy, shares of our common stock only in jurisdictions where offers and sales are permitted.you should not rely on it. The information contained in this prospectus is accurate only as ofon the date of this prospectus, regardlessprospectus. Our business, financial condition, results of operations and prospects may have changed since such date. Other than as required under the timefederal securities laws, we undertake no obligation to publicly update or revise such information, whether as a result of delivery of this prospectusnew information, future events or any saleother reason.
This prospectus does not constitute an offer to sell or the solicitation of an offer to buy any of our shares of common stock other than the shares of our common stock.
Neither westock covered hereby, nor the underwriter has done anything that would permit this offering or possession or distribution ofdoes this prospectus constitute an offer to sell or the solicitation of an offer to buy any securities in any jurisdiction where action for that purposeto any person to whom it is required, other thanunlawful to make such offer or solicitation in the United States.such jurisdiction. Persons outside the United States who come into possession of this prospectus mustin jurisdictions outside the United States are required to inform themselves about, and to observe, any restrictions relatingas to the offering of the sales of common stock and the distribution of this prospectus outsideapplicable to those jurisdictions.
Some of the United States.industry data contained in this prospectus is derived from data from various third-party sources. We have not independently verified any of this information and cannot assure you of its accuracy or completeness. Such data is subject to change based on various factors, including those discussed under the “Risk Factors” section beginning on page 4 of this prospectus.
PROSPECTUS SUMMARY
The followingThis summary highlights selected information contained in greater detail elsewhere in this prospectus. This summary does not contain all of the information that you shouldconsider before investing in our common stock. Before making an investmentdecision youwith respect to our securities. You should read thethis entire prospectus carefully, including the sections titled “Risk Factors” and “Management’s Discussion and Analysis of Financial Condition and Results of Operations”especially any risk factors contained herein and our financial statements and therelated notes to the financialstatements included elsewherecontained in this prospectus.
Inprospectus before making an investment decision with respect to our securities. Please see the section titled, “Where You Can Find More Information,” beginning on page 46 of this prospectus, unlessprospectus. Unless the context indicates otherwise, indicated,references to “SINO,” the terms (i) “Sino-Global Shipping America, Ltd.”, “Sino-Global,“Company,” “SINO”, the “Company”, “we”,“we,” “us”, and “our” or similar terms refer and relate to Sino-Global Shipping America, Ltd., a Virginia corporation and its consolidated subsidiaries, (ii) “Trans Pacific” refers and relates collectively to (a) Trans Pacific Shipping Ltd., our wholly-owned subsidiary located in China, and (b) Trans Pacific Logistics Shanghai Ltd., 90% of whose equity is owned by Trans Pacific Shipping Ltd., and (iii) “Sino-China” refers and relates to Sino-Global Shipping Agency Ltd., our variable interest entity (“VIE”), in China. References to “China” or the “PRC” mean the People’s Republic of China.subsidiaries.
Our Company
Overview
We areSino-Global Shipping America, Ltd., a Virginia corporation, was founded in the United States (“US”) in 2001. Sino is a non-asset based global shipping agency,and freight logistics integrated solution provider. Sino provides tailored solutions and ship managementvalue added services company.to its customers to drive effectiveness and control in related aspects throughout the entire shipping and freight logistics chain. Our current service offerings consist of inland transportation management services, freight logistics services, container trucking services and bulk cargo container services. We suspended our shipping agency and ship management services from the beginning of the fiscal year 2016, primarily due to changes in market conditions. We also suspended our shipping and chartering services inland transportation management servicesprimarily as a result of the termination of vessel acquisition in December 2015.
The Company conducts its business primarily through its wholly-owned subsidiaries in the U.S. (New York and ship management services. Substantially allCalifornia), China (including Hong Kong), Australia and Canada. Currently, a significant portion of our business is generated from our clients located in the People’s Republic of China (the “PRC”). In the third quarter of fiscal year 2017, the Company established ACH Trucking Center Corp. in New York as a joint venture with Jetta Global Logistics Inc. The Company owns 51% of ACH Trucking Center Corp. Although the establishment of ACH Center brought benefit for the Company and Jetta Global, it could not satisfy long term development for both the Company and Jetta Global. The Company signed a termination agreement with Jetta Global to terminate the joint venture agreement on December 4, 2017. The organizational structure of the Company is set forth in the chart below.

The Company’s subsidiary in China, Trans Pacific Shipping Limited (“Trans Pacific Beijing”), a wholly owned foreign enterprise, invested in one 90%-owned subsidiary, Trans Pacific Logistics Shanghai Limited (“Trans Pacific Shanghai”, and our operations are primarily conductedtogether with Trans Pacific Beijing, “Trans Pacific”). As PRC laws and regulations restrict foreign ownership of local shipping agency service businesses, the Company provided its shipping agency services in the PRC through Sino-Global Shipping Agency Ltd. (“Sino-China” or “VIE”), a Chinese legal entity, which holds the licenses and Hong Kong.
Since our inception in 2001 and through our fiscal year ended June 30, 2013, our sole business was providingpermits necessary to operate local shipping agency services. While we wereservices in the PRC. Trans Pacific Beijing and Sino-China do not have a parent-subsidiary relationship. Trans Pacific Beijing has contractual arrangements with Sino-China and its shareholders that enable the Company to substantially control Sino-China. Through Sino-China, the Company was able to consistently generate net revenues from such business, we were not able to achieve profitability as our costs and expenses continued to be higher than our net revenues.
Restructuring
Commencingprovide local shipping agency services in all commercial ports in the latter partPRC. In light of fiscal year 2013 and continuing through our fiscal year ended June 30, 2014, we took various actionsthe Company’s decision not to restructure our business withpursue the goal of achieving profitability. These actions included lowering our operating costs and expenses, reducing our dependency on ourlocal shipping agency business, the Company has suspended its shipping agency services through its VIE and hiring a new executive vice president and other consultantshas not undertaken any business through or with Sino-China since June 2014. Nevertheless, the Company continues to assist usmaintain its contractual relationship with the VIE because Sino-China is one of the committee members of the China Association of Shipping Agencies & Non-Vessel-Operating Common Carriers (“CASA”). CASA was approved to form by China Ministry of Communications. Sino-China is also our only entity that is qualified to conduct the shipping agency business in implementing our business restructuring efforts.
China. We keep the VIE to prepare ourselves if the market turns around.
Also, during the first and second quarters of fiscal year 2014, we expanded our service platform by adding two new services: shipping and chartering services and inland transportation management services. These two new services were added to service certain business needs of Tianjin Zhi Yuan Investment Group Co., Ltd. (the “Zhiyuan Investment Group”). The Zhiyuan Investment Group is controlled by Mr. Zhong Zhang (“Mr. Zhang”), who in April 2013, as approved by our Board of Directors and shareholders, purchased from us 1,800,000 shares of our common stock for approximately $3 million, resulting in Mr. Zhang becoming our largest shareholder.
Fiscal Year 2014 and 1st Quarter 2015 Profitability
As a result of our restructuring and the addition of our two new service lines, fiscal year 2014 represented our first year of profitability since our initial public offering, as we reported net income attributable to Sino-Global of $1,586,353 as compared to net loss attributable to Sino-Global of $1,799,755 for fiscal year 2013; and for the three months ended September 30, 2014, we reported net income attributable to Sino-Global of $332,459 as compared to net income attributable to Sino-Global of $275,394 for the three months ended September 30, 2013.
Complementary Acquisition in Fiscal Year 2015
As part of our strategy to expand our service platform, in September 2014, as approved by our Board of Directors, we acquired Longhe Ship Management (Hong Kong) Co., Limited (“LSM”), a ship management company based in Hong Kong from Mr. Deming Wang (“Mr. Wang”), who in June 2014, as approved by our Board of Directors, purchased from us 200,000 shares of our common stock for $444,000, resulting in Mr. Wang, as of the date of this prospectus, owning approximately 3.2% of our outstanding common stock. We believe that the acquisition of LSM will complement our existing service platform. Between September 8, 2014, the completion date of our acquisition of LSM, and September 30, 2014, LSM generated net revenues of $47,587 and net income of $23,178. The acquisition of LSM will result in the issuance of between 20,000 and 200,000 shares of our common stock to Mr. Wang, depending on whether LSM reaches certain net income targets for the period July 4, 2014 through December 31, 2014.
Our Strategy
Our strategy is to:
| · | Develop and implement a business model that drives sustainable earnings and profitability; |
| · | Diversify our service lines organically and/or through acquisitions;
|
| · | Continue to streamline our operations and improve our operating efficiency through effective planning, budgeting and cost control; |
| · | Continue to reduce our dependency on our shipping agency services business; |
| · | Add additional clients to reduce our dependency on a few key customers; and |
| · | Continue to monetize our relationship with strategic partners.
|
Currently, the Company’s inland transportation management services are operated by its subsidiaries in the PRC (including Hong Kong) and the U.S. Our Management Teamfreight logistics services are operated by our subsidiaries in the PRC, New York and California (Los Angeles). Our container trucking services are mainly operated by our subsidiaries and joint venture company in the PRC, New York and California (Los Angeles).
We believe we have a strongThe following table breaks down the revenues for our business segments for the fiscal years ended June 30, 2017 and experienced management team including our chief executive officer and chairman Mr. Lei Cao, our acting chief financial officer Mr. Anthony S. Chan, and our chief operating officer Mr. Zhikang Huang, who, together as a team, have many years of experience and a significant network of business contacts in the shipping industry in China and substantial experience in SEC reporting and compliance, business reorganization, mergers and acquisitions, accounting, risk management and operating both public and private companies.2016:
Risks Associated with Our Business
| | | Fiscal Year 2017 | | | Fiscal Year 2016 | |
| Key Services | | Revenues | | | % | | | GM | | | Revenues | | | % | | | GM | |
| Inland Transportation Management Services | | $ | 5,758,600 | | | | 50.3 | % | | | 89.2 | % | | $ | 4,340,522 | | | | 59.4 | % | | | 68.9 | % |
| Freight Logistics Services | | $ | 4,815,450 | | | | 42.1 | % | | | 22.9 | % | | $ | -- | | | | -- | % | | | -- | % |
| Container Trucking Services | | $ | 871,563 | | | | 7.6 | % | | | 25.4 | % | | $ | -- | | | | -- | % | | | -- | % |
| Shipping Agency and Ship Management Services | | $ | -- | | | | -- | % | | | -- | % | | $ | 2,507,800 | | | | 34.3 | % | | | 13.3 | % |
| Shipping and Chartering Services | | $ | -- | | | | -- | % | | | -- | % | | $ | 462,218 | | | | 6.3 | % | | | 54.0 | % |
| | | $ | 11,445,613 | | | | 100.0 | % | | | 56.5 | % | | $ | 7,310,540 | | | | 100.0 | % | | | 48.9 | % |
We are aware that moving forward, we are subject to various risks and uncertainties including:
| · | Our reliance on a limited number of customers;
|
| · | Our ability to continue to generate net revenues and operating profits from our two new service lines that we added during fiscal year 2014; |
| · | Our continued ability to keep our operating expenses at manageable levels; and
|
| · | Certain other risks and uncertainties set forth elsewhere in this prospectus under the section titled “Risk Factors”.
|
Certain CompanyCorporate Information
We are a Virginia corporation and ourOur principal executive offices are located at 1044 Northern Boulevard, Suite 305, Roslyn, New York 11576-1514. Our telephone number at this address is (718) 888-1814. Our shares of common stock is listedare traded on the NASDAQ Capital Market under the symbol “SINO”.“SINO.”
Our internetInternet website, www.sino-global.com, provides a variety of information about our company.Company. We do not incorporate by reference into this prospectus the information on, or accessible through, our website, and you should not consider it as part of this prospectus. Our annual reports on Form 10-K, quarterly reports on Form 10-Q and current reports on Form 8-K filed with the United States Securities and Exchange Commission (the “SEC”) are available, as soon as practicable after filing, at the investors’ page on our corporate website, or by a direct link to itsour filings on the SEC’s website.free website (www.sec.gov).
THE OFFERING
Issuer:Common Stock offered by the Selling Shareholders: | | Sino-Global Shipping America, Ltd.4,000,000 shares of common stock issuable upon exercise of the Warrants. |
| | | |
Common stock offered by us (assuming no exercise of the underwriter’s over allotment option): outstanding prior to this offering: | | 3,398,05812,533,035 shares
as of March 29, 2018 |
| | | |
Common stock to be outstanding after this offering (assuming no exercise of the underwriter’s option to purchase additional shares):
| | 9,598,899 shares
|
Underwriter’s option to purchase additional shares:
| | 509,708 shares
|
| Use of proceeds: | | We estimate thatThe Selling Shareholders will receive the net proceeds received by us from this offering will be approximately $6 Million, or approximately $6.96 Million if the underwriters exercise their option to purchase additionalsale of the shares in full based upon an assumed public offering price of $2.06 per share, which is the reported closing price of a share of our common stock on the NASDAQ Capital Market on November 10, 2014, after deducting underwriting discounts and commissions and estimated offering expenses payable by us.offered hereby. We intend to use the netwill not receive any proceeds from this offering for general corporate and working capital purposes. Wethe sale of the shares of common stock. However, we may also usereceive proceeds in the aggregate amount of up to $7.0 million if all or a portion of such net proceeds for acquisitions of strategic and/or complementary businesses and/or assets, all as more fully described inthe Warrants covered by this prospectus under the headingare exercised for cash. See “Use of Proceeds.”
Proceeds” on page 7 of this prospectus. |
| | | |
Risk factors:Factors: | | Investing inThe purchase of our securities involves a high degree of risk. See the information contained in the section of this prospectus titled “Risk Factors” beginning on page 5,4 and other information included in this prospectus for a discussion of factors that you should carefully consider carefully before deciding to invest in our common stock
securities. |
| | | |
Market for the shares of common stock: | | Our common stock is listed on the NASDAQ Capital Market under the symbolSymbol: | | “SINO”. |
Unless expressly otherwise indicated herein, this prospectus assumes a per share public offering priceThe number of $2.06, the last reported closing price of a shareshares of our common stock outstanding, as set forth in the table above, is based on the NASDAQ Capital Market on November 10, 2014,12,533,035 shares outstanding as of March 29, 2018, and an offeringexcludes, as of $7,000,000 gross proceeds (assuming no exercise of the underwriter’s over-allotment option), and an offering of $8,050,000 gross proceeds (assuming the underwriter’s over-allotment option is fully exercised), this and all calculations based upon an assumed offering per share and the gross proceeds from the offering are based upon the above $2.06 per share offering price and a $7,000,000 offering and an $8,050,000 offering (assuming the underwriter’s over-allotment option is fully exercised).
such date:
3 | ● | 139,032 shares of common stock issuable upon the exercise of outstanding warrants with a weighted average exercise price of $9.30 per share; |
| ● | 141,000 shares of common stock issuable upon the exercise of outstanding options with a weighted average exercise price of $3.81 per share, granted under our 2008 Incentive Plan and our 2014 Incentive Plan; |
| ● | 8,698,903 shares of common stock that are available for future option grants under our 2008 Incentive Plan and our 2014 Incentive Plan; and |
| ● | 4,000,000 shares of common stock issuable upon exercise of the Warrants. |
Table of Contents
SELECTED SUMMARY CONDENSED CONSOLIDATED FINANCIAL DATARISK FACTORS
The selected condensed summaryInvesting in our securities has a high degree of financial data set forth belowrisk. Before making an investment in our securities, you should be readcarefully consider the following risks, as well as the other information contained in conjunction withthis prospectus, including our consolidated financial statements and related notes and “Management’s Discussion and Analysis of Financial Condition and Results of Operations” included elsewhere in this prospectus.
We derived the following statement of operations data for the fiscal years ended June 30, 2014Operations.” The risks and 2013 and the balance sheet data as of June 30, 2014 from our audited financial statements included elsewhere in this prospectus. We derived the following statement of operations data for the three month period ended September 30, 2014 and 2013 and the balance sheet data as of September 30, 2014 from our unaudited condensed consolidated financial statements included elsewhere in this prospectus. Our statement of operations data for the three months ended September 30, 2014uncertainties described below are not necessarily indicative of the results to be expected for the full year.
Statement of Operations Data:
| | | Unaudited | | | Audited | |
| | | Three Months Ended September 30, | | | Year Ended June 30, | |
| | | 2014 | | | 2013 | | | 2014 | | | 2013 | |
| | | | | | | | | | | | | |
| Net revenues | | $ | 2,605,925 | | | $ | 3,317,661 | | | $ | 11,644,392 | | | $ | 17,331,759 | |
| Cost of revenues | | | 1,409,153 | | | | 2,387,803 | | | | 7,613,459 | | | | 15,402,743 | |
| Gross profit | | | 1,196,772 | | | | 929,858 | | | | 4,030,933 | | | | 1,929,016 | |
| Operating income (loss) | | | 200,628 | | | | (17,394) | | | | 300,130 | | | | (2,203,540) | |
| Net income (loss) | | | 165,501 | | | | 28,973 | | | | 434,486 | | | | (2,576,896) | |
| Net loss attributable to non-controlling interest | | | (166,958) | | | | (246,421) | | | | (1,151,867) | | | | (777,141) | |
| Net income (loss) attributable to Sino-Global | | | 332,459 | | | | 275,394 | | | | 1,586,353 | | | | (1,799,755) | |
| Comprehensive income (loss) | | | 232,035 | | | | 3,336 | | | | 435,979 | | | | (2,592,830) | |
| Comprehensive income (loss) attributable to Sino-Global | | | 367,259 | | | | 263,510 | | | | 1,556,180 | | | | (1,761,673) | |
| | | | | | | | | | | | | | | | | |
| Net income (loss) per common share: | | | | | | | | | | | | | | | | |
| Basic | | | 0.06 | | | | 0.06 | | | | 0.34 | | | | (0.38) | |
| Diluted | | | 0.06 | | | | 0.06 | | | | 0.34 | | | | (0.38) | |
Balance Sheet Data:
| | | September 30,
2014
(Unaudited) | | | June 30,
2014
(Audited) | |
| Cash and cash equivalents | | $ | 3,533,187 | | | $ | 902,531 | |
| Total assets | | | 7,591,374 | | | | 5,713,954 | |
| Total liabilities | | | 1,152,860 | | | | 1,230,795 | |
| Total equity | | | 6,438,514 | | | | 4,483,159 | |
RISK FACTORS
An investment in our common stock by you involves significant risks. You should carefully consider the followingonly ones we face. Additional risks and all other information set forth inuncertainties of which we are unaware or that we believe are not material at this prospectus before deciding to invest in our common stock. If any of the events or developments described below occurs,time could also materially adversely affect our business, financial condition andor results of operations may suffer.operations. In thatany case, the market pricevalue of our common stock maysecurities could decline and you could lose all or part of your investment. Additional risks and uncertainties not presently known to us or that we currently deem immaterial maySee also impair our business operations.
Our business operations are primarily conductedthe information contained under the heading “Cautionary Statement Regarding Forward-Looking Statements” elsewhere in the PRC. Because China’s economy and its laws, regulations and policies are different from those typically found in the United States and are continually changing, we face certain risks, which are summarized below.
Risks Related to Our Business
Despite generating net income attributable to Sino-Global in our fiscal year 2014 and the three months ended September 30, 2014, we have a history of operating losses and may need to raise additional funds to continue our operations and to execute our business plan. We may not be able to obtain additional debt or equity funding under commercially reasonable terms or issue additional securities.
We reported net income attributable to Sino-Global of $1,586,353 for fiscal year 2014 and of $332,459 for the three months ended September 30, 2014, as compared to net loss attributable to Sino-Global of $1,799,755 for fiscal year 2013 and net income attributable to Sino-Global of $275,394 for the three months ended September 30, 2013. As of September 30, 2014, we had an accumulated deficit of $2,937,801 and cash and cash equivalents of $3,553,187 as compared to an accumulated deficit and cash and cash equivalents of $3,270,260 and $902,531 as of June 30, 2014, respectively. If we are not able to generate sufficient income and cash flows from operations to fund our operations and strategic growth plans, we may be required to seek additional funding through the issuance of equity or debt securities. Additional funding may not be available on terms favorable to us, or at all. If we raise additional funds by issuing equity securities, our shareholders may experience dilution. Debt financing, if available, may involve restrictive covenants or security interests in our assets. If we are unable to raise adequate funds or generate them from operations, we may have to delay, reduce the scope of, or eliminate some or all of our growth plans and/or liquidate some or all of our assets.
We have historically relied on a limited number of customers for a substantial portion of our business and no longer provide shipping agency services to our former largest customer.
In fiscal year 2014, we commenced providing shipping and chartering services and inland transportation management services to a single customer, the Zhiyuan Investment Group, an entity controlled by Mr. Zhang, our largest shareholder. During fiscal year 2014, $4,120,409 (or 35.4%), of our net revenues and $2,517,008 (or 62.4%), of our gross profits came from providing shipping and chartering services and inland transportation management services to the Zhiyuan Investment Group. For the three months ended September 30, 2014, we have not provided shipping and chartering services to the Zhiyuan Investment Group. The nature of our business is driven by the needs of our clients, and we cannot predict when, or if ever, we will receive another order for shipping and chartering services from the Zhiyuan Investment Group. For the three months ended September 30, 2014, $361,394 (or 13.9%) of our net revenues and $313,769 (or 26.2%) of our gross profits came from providing inland transportation management services to the Zhiyuan Investment Group. If we do not provide shipping and chartering services to the Zhiyuan Investment Group in the future, our business and results of operations would be materially adversely affected. Further, we cannot guarantee that we would be able to replace this customer with one or more new customers of similar size. Prior to fiscal year 2014, we relied heavily on Beijing Shourong Forwarding Service, Co., Ltd. (“Shourong”), an affiliate of Capital Steel, a steel company in China, for a substantial percentage of our shipping agency business. As part of the restructuring of our business, we exited our non-performing service arrangements including our shipping agency service with Shourong, who in fiscal year 2013, accounted for approximately 63% of our total net revenues. We did not provide any shipping agency services to Shourong in fiscal year 2014 or during the three months ended September 30, 2014 and cannot determine the extent of services, if any, we will deliver to Shourong in the future.prospectus.
We have recently entered shipping and chartering services and inland transportation management services businesses and cannot guarantee thatSince we will be able to compete effectively in these business areas.
Prior to fiscal year 2014, our sole line of business was providing shipping agency services. We expanded our services to include shipping and chartering services in the quarter ended September 30, 2013 and inland transportation management services in the quarter ended December 31, 2013. As we are a new entrant into these two business lines, we do not have a significant market presence. Further, we currently only provide shipping and chartering services and inland transportation services to one customer, the Zhiyuan Investment Group, who is controlled by Mr. Zhang, our largest shareholder. We may not have been able to enter into these business lines without our relationship with Mr. Zhang, and we cannot guarantee that we will be successful in securing and providing shipping and chartering services and inland transportation management services contracts for other customers on acceptable terms, if at all.
The fees that we received from the Zhiyuan Investment Group for our shipping and chartering services and inland transportation management services may not be indicative of the fees that we may receive for the same services provided to unaffiliated customers and may be materially lower, which would have an adverse effect on our results of operations.
Our shipping and chartering services and inland transportation management services to date have been provided primarily to a single customer, the Zhiyuan Investment Group. Therefore, we cannot provide any assurances that the fees we have received for these services from this customer are indicative of the fees that we may receive if we are able to obtain non-affiliated customers for these services. The fees that we may receive from non-affiliated customers may be less than what we have received from our affiliated customer, and could possibly be so low as to make these lines of business unprofitable, which would have a material adverse effect on our results of operations and could require us to terminate such service lines.
We have entered into a number of business arrangements that are significant to us with two of our shareholders including Mr. Zhang, our largest shareholder, and through Mr. Zhang, the Zhiyuan Investment Group, who is controlled by Mr. Zhang. The failure to maintain our business relationship with either or both of such shareholders would have a material adverse effect on our business and results of operations.
In April 2013, as approved by our Board of Directors and shareholders, Mr. Zhang purchased 1,800,000 shares of our common stock for approximately $3 million, which as of the date of this prospectus represents approximately 29% of our issued and outstanding common stock, resulting in Mr. Zhang becoming our largest shareholder. As a result of Mr. Zhang’s desire to find business opportunities that would mutually benefit us and the Zhiyuan Investment Group, a company controlled by Mr. Zhang, which owns a number of businesses in China, in June 2013, we signed a 5-year Global Logistic Service Agreement with two parties, one of which was the Zhiyuan Investment Group and the other was TEWOO Chemical & Light Industry Zhiyuan Trade Co., Ltd. (“Tewoo”). Thereafter, during the quarter ended September 30, 2013, we executed a shipping and chartering services agreement with the Zhiyuan Investment Group, pursuant to which we assisted the Zhiyuan Investment Group in the transportation of approximately 51,000 tons of chromite ore from South Africa to China; and in September 2013, we executed an inland transportation management service contract with the Zhiyuan Investment Group pursuant to which we agreed to provide certain advisory services and assist the Zhiyuan Investment Group in attempting to control its potential commodities loss during the transportation process. On a one time basis, we executed a one year short-term loan agreement with the Zhiyuan Investment Group, effective January 1, 2014, to facilitate the working capital needs of the Zhiyuan Investment Group. As of June 30, 2014, the net amount due to us from the Zhiyuan Investment Group was $2,920,950 consisting of funds borrowed from us pursuant to the short-term loan agreement and trade receivables due us from the Zhiyuan Investment Group. In September 2014, we collected approximately $2.7 million from the Zhiyuan Investment Group, representing full repayment of all funds borrowed by the Zhiyuan Investment Group from us pursuant to the short-term loan agreement and the payment to us of approximately $1.6 million of outstanding trade receivables. During the three months ended September 30, 2014, we continued to provide inland transportation management services to the Zhiyuan Investment Group. The net amount due to us from the Zhiyuan Investment Group at September 30, 2014 was $627,951. In October 2014, we collected approximately $384,000 from the Zhiyuan Investment Group which reduced the outstanding trade receivables due to us from the Zhiyuan Investment Group.
In May 2014, we signed a strategic agreement with Qingdao Zhenghe Shipping Group Limited (“Zhenghe”), to jointly explore mutually beneficial business development opportunities. Zhenghe is a PRC company to which Mr. Wang is the majority shareholder. To demonstrate the commitment by Zhenghe to its business relationship with us, in June 2014, as approved by our Board of Directors, Mr. Wang, through a company owned by him, purchased 200,000 shares of our common stock for $444,000, resulting in Mr. Wang owning as of the date of this prospectus, approximately 3.2% of our outstanding common stock. Subsequently, and as part of our strategy to expand our service platform, in September 2014, as approved by our Board of Directors, we acquired LSM, a ship management company based in Hong Kong from Mr. Wang. While to date the net revenues generated from such business have been immaterial, we believe that ship management is a good complement to our existing service platform. The acquisition of LSM will result in the issuance of between 20,000 and 200,000 shares of our common stock to Mr. Wang, depending on whether LSM reaches certain net income targets for the period July 4, 2014 through December 31, 2014. LSM outsources its ship management services to Qingdao Longhe Ship Management Services Co., Ltd., a company controlled by Mr. Wang.
As a result of our business relationship with Mr. Zhang and Mr. Wang, since April 2013, we have received approximately $3.5 million from the sale of 2,000,000 shares of our common stock to such two persons and added shipping and chartering, inland transportation management and ship management services to our service platform, which shipping and chartering services and inland transportation management services generated 35.4% and 62.4% of our net revenues and gross profit in fiscal year 2014, respectively and 13.9% and 26.2% of our net revenues and gross profit for the three months ended September 30, 2014, respectively.
Based upon the above, the failure by us to maintain our existing business relationship with Mr. Zhang and/or Mr. Wang would have a material adverse effect on our business and results of operations.
The shipping agency business is very competitive in nature and many of our competitors have greater financial, marketing and other resources than we have.
Our competitors in the shipping agency business include three major shipping agencies, China Ocean Shipping Agency Co., Ltd. (“Penavico”), China Shipping (Group) Company (“China Shipping”) and China Marine Shipping Agency Co., Ltd. (“Sinoagent”). These competitors have significantly greater financial, marketing and other resources and name recognition than we have. In addition, we also face competition from a large number of smaller, local shipping agents. Our competitors may introduce new business models, and if these new business models are more attractive to customers than the business models we currently use, our customers may switch to our competitors’ services, and we may lose market share. We believe that competition in China’s shipping agency industry may become more intense as more shipping agencies, including Chinese/foreign joint ventures, are qualified to conduct business. We cannot assure you that we will be able to compete successfully against any new or existing competitors, or against any new business models our competitors may implement. In addition, the increased competition we anticipate in the shipping agent industry may also reduce the number of vessels for which we are able to provide shipping agency services, or cause us to reduce agency fees in order to attract or retain customers. All of these competitive factors could have a material adverse effect on our business and results of operations.
Our three largest shipping agency competitors, Penavico, China Shipping and Sinoagent, are partly owned by the Chinese government which places us at a significant competitive disadvantage.
The Chinese government’s ownership interests in Penavico, China Shipping and Sinoagent, place us at a significant competitive disadvantage. When the Chinese government founded Penavico, it closed the shipping agency industry to a number of foreign shipping agents that had been providing services in China. These restrictions have since been removed, but there can be no assurance that the Chinese government will not reinstate these restrictions or impose other restrictions, or nationalize the shipping agency industry in the future. Further, we believe that state ownership provides Penavico, China Shipping and Sinoagent, with advantages and leverage over local government officials and local companies that we, as a non-state owned company, do not have. Also, due to their relationship with the Chinese government, these competitors may have access to funding that is not available to us. This access may allow them to grow their businesses at a rate we are not able to match. If the Chinese government were to take actions to limit competition or provide these competitors with preferential access to business and funding, which results in our losing business, it would have a material adverse effect on our operations and financial condition.
We believe that our competitors in the shipping and chartering services and inland transportation management services business, have greater name recognition, significantly more experience, financial, marketing and other resources than we have and we expect to face intense competition in these business segments.
We have recently launched the shipping and chartering services and inland transportation management services business and so we expect that our competitors in these segments will have greater experience and name recognition than we do, which is a competitive disadvantage to us. Further, we expect that these competitors will be larger than us and have greater financial and marketing resources than we have, which also puts us at a significant competitive disadvantage. Since larger competitors may be able to offer the same services we offer at lower rates than what we would need to charge to operate profitably, this would have a material adverse effect on our business and results of operation.
The barriers to enter into the business segments in which we operate are low and we may face competition from new entrants into these business segments.
The number of competitors offering the same services that we do may increase in the future since the barriers to entry are low. Increases in competition could lead to revenue reductions, reduced profit margins, or a loss of market share, any one of which could have a material adverse effect on our business and results of operations.
Our customers are engaged in the shipping industry, and, consequently, our financial performance is dependent upon the economic conditions of that industry.
We derive our revenues from providing services to customers in the business of shipping materials to China and our success is dependent upon our customer’s shipping needs. Our customers’ shipping needs are intrinsically linked to economic conditions in the shipping industry in general and trade with China in particular. The shipping industry, in turn, is subject to intense competitive pressures and is affected by overall economic conditions. Accordingly, demand for our services could be harmed by instability or downturns in the shipping industry, reductions in trade between China and other countries or a combination of both which could materially lower demand or cause our customers to forego the shipping agency services we provide by attempting to provide such services in-house. If any of the foregoing occurs, it would have a material adverse effect on our business and our results of operations.
We may be required to assume liabilities for our clients in the future.
An increasing number of companies that require shipping agency services have pressured shipping agents to guarantee their clients’ liabilities. Some companies have required shipping agents, as a condition of doing business, to pay for tariffs, port charges, and other fees, or to pay these fees with the promise of reimbursement at a later date. Other companies have sought to include shipping agents as parties in voyage charter agreements, leading to potential liability for shipping agents in the event of a breach by another party. We expect that these pressures on shipping agents to accept more liability will increase as competition among shipping agencies intensifies. While we do not currently pay these liabilities and have no present intention to begin doing so in the future, the assumption of any of these or other liabilities could have a material adverse effect on our business and results of operations.
We are heavily dependent upon the services of experienced personnel who possess skills that are valuable in our industry, and we may have to actively compete for their services.
We are a small company with limited resources, and we compete in large part on the basis of the quality of services we are able to provide our clients. As a result, we are heavily dependent upon our ability to attract, retain and motivate skilled personnel to serve our clients. Many of our personnel possess skills that would be valuable to other companies engaged in one or more of our business lines. Consequently, we expect that we will have to actively compete with other Chinese shipping agencies to retain these employees. Some of our competitors may be able to pay our employees more than we are able to pay to retain them. Our ability to profitably operate is substantially dependent upon our ability to locate, hire, train and retain our personnel. Although we have not experienced difficulty locating, hiring, training or retaining our employees to date, there can be no assurance that we will be able to retain our current personnel, or that we will be able to attract and assimilate other qualified personnel in the future. If we are unable to effectively obtain and maintain skilled personnel, the quality of the shipping services that we provide could be materially impaired, which would have a material adverse effect on our business and results of operations.
We are substantially dependent upon our key personnel.
Our performance is substantially dependent on the performance of our executive officers and key employees. In particular, the services of:
·Mr. Lei Cao, Chief Executive Officer;
·Mr. Anthony S. Chan, Acting Chief Financial Officer; and
· Mr. Zhikang Huang, Chief Operating Officer
would be difficult for us to replace. While we have employment contracts with each of our executive officers, such contracts may be terminated in certain circumstances by the executive officers. Moreover, we do not have any “key person” life insurance policies on any of our employees. The loss of the services of any of our executive officers or other key employees could substantially impair our ability to effectively execute our business and expand our service platform, which would have a material adverse effect on our business and results of operations.
We need to maintain our relationships with local agents.
Our shipping agency business is dependent upon our relationships with local agents operating in the ports where our customers ship their products. As a general agent, substantially all of our shipping agency revenues have been derived from services delivered by the local agents and we believe local agent relationships will remain critical to our success in the future. We have a number of local agents that account for a significant portion of our business, the loss of one or more of which could materially and negatively impact our ability to retain and service our customers. We cannot be certain that we will be able to maintain and expand our existing local agent relationships or enter into new local agent relationships, or that new or renewed local agent relationships will be available on commercially reasonable terms. If we are unable to maintain and expand our existing local agent relationships, renew existing local agent relationships, or enter into new local agent relationships, we may lose customers, customer introductions and co-marketing benefits, and our business and results of operations may suffer significantly.
We are dependent on third party carriers and inland transportation companies to transport our client’s cargo.
We rely on commercial ocean freight carriers and inland transportation companies, for the movement of our client’s cargo. Consequently, our ability to provide services for our clients could be adversely impacted by: shortages in available cargo capacity; changes by carriers and transportation companies in policies and practices such as scheduling, pricing, payment terms and frequency of service or increases in the cost of fuel, taxes and labor; and other factors not within our control. Reductions in ocean freight capacity could negatively impact our yields. Material interruptions in service or stoppages in transportation, whether caused by strike, work stoppage, lock-out, slowdown or otherwise, could adversely impact our business, results of operations and financial condition.
Our profitability depends on our ability to effectively manage our cost structure as we grow the business.
As we continue to attempt to increase our revenues through the expansion of our service offerings, we must maintain an appropriate cost structure to maintain and increase our profitability. While we intend to increase our revenues by increasing the number and quality of the shipping services we provide by strategic acquisitions, and by maintaining and expanding our gross profit margins by reducing costs, our profitability will be driven in large part by our ability to manage our agent commissions, personnel and general and administrative costs as a function of our net revenues. There can be no assurances that we will be able to effectively control our costs and failure to do so would result in lack of profitability, which would have a material adverse effect our business and results of operations.
Comparisons of our operating results from period to period are not necessarily meaningful and should not be relied upon as an indicator of future performance.
Our operating results have fluctuated in the past and likely will continue to fluctuate in the future because of a variety of factors, many of which are beyond our control. In fiscal year 2014, a substantial portion of our revenues was derived from the Zhiyuan Investment Group whose business needs we believe are tied closely to economic trends and consumer demand that can be difficult to predict. There can be no assurance that our historic operating performance will continue in future periods as we cannot assume or provide any assurance that the Zhiyuan Investment Group will continue to utilize our services, or have the same level of demand for our services that it had in fiscal year 2014. Because our quarterly revenues and operating results vary significantly, comparisons of our period-to-period results are not necessarily meaningful and should not be relied upon as an indicator of future performance.
We have not paid any dividends and we do not foresee paying dividends in the future.
We have never declared or paid any cash dividends on our common stock. We do not anticipate paying any cash dividends on our common stock in the foreseeable future, if ever. Any future determination to pay cash dividends will be at the discretion of our Board of Directors and will depend upon our financial condition, operating results, capital requirements, Virginia and PRC laws, and other factors that our Board of Directors deems relevant.
Foreign Operational Risks
We do not have business liability, disruption, or director and officer liability insurance.
We do not have any business liability or disruption insurance coverage for our operations in China, or any director and officer liability insurance coverage for our directors and officers in the United States or China. Any business interruption, litigation or natural disaster and/or any claim against any of our directors or officers resulting from any of their actions in such capacities, may result in our business incurring substantial costs and the diversion of resources.
Trans Pacific’s contractual arrangements with Sino-China may result in adverse tax consequences to us.
As a result of our corporate structure and contractual arrangements between Trans Pacific and Sino-China, any revenues generated by Sino-China’s operations in China and/or any revenues derived from Trans Pacific‘s contractual arrangements with Sino-China are subject to PRC tax. Moreover, we could face material and adverse tax consequences if the PRC tax authorities determine that Trans Pacific’s contractual arrangements with Sino-China were not made on an arm’s length basis and adjust our income and expenses for PRC tax purposes in the form of a transfer pricing adjustment. A transfer pricing adjustment could result in a reduction, for PRC tax purposes, of adjustments recorded by Sino-China, which could adversely affect us by increasing Sino-China’s tax liability without reducing Trans Pacific’s tax liability, which could further result in late payment fees and other penalties to Sino-China for underpaid taxes.
Trans Pacific’s contractual arrangements with Sino-China may not be as effective in providing control over Sino-China as direct ownership of Sino-China.
Until fiscal year 2014, we conducted a significant portion of our shipping agency business through contractual arrangements with Sino-China that provided us, through our ownership of Trans Pacific, with effective control over Sino-China. Although each contract under Trans Pacific’s contractual arrangements with Sino-China is valid, binding and enforceable under current PRC laws and regulations, there are substantial uncertainties regarding the interpretation and application of PRC laws and regulations governing the enforcement and performance of such contractual control over Sino-China. If the PRC government determines that these contractual arrangements as a whole do not comply with applicable regulations, our business could be substantially adversely affected. In addition, these contractual arrangements may not be as effective in providing us with control over Sino-China as direct ownership of Sino-China would. Furthermore, Sino-China may breach the contractual arrangements. For example, Sino-China may decide not to pay consulting or marketing fees to Trans Pacific, and consequently to our company, in accordance with the existing contractual arrangements. In event of any such breach, we would have to rely on legal remedies under PRC law. These remedies may not always be effective, particularly in light of uncertainties in the PRC legal system. In light of rising operating costs and expenses associated with doing business in China, consecutive years of operating losses reported by Sino-China, concerns raised by the US regulators over the last few years about VIE’s and our belief that the investing public may have a negative perception of publicly traded companies with VIE structures, we decided to reorganize our shipping agency business in fiscal year 2013. As a result of our reorganization efforts, we reduced our overhead, changed our service mix, stopped providing agency services to Shourong, one of our largest customers, and shifted our agency business operation from Sino-China to our wholly-owned subsidiaries in China and Hong Kong.
Uncertainties with respect to the PRC legal system could adversely affect us.
There are substantial uncertainties regarding the interpretation and application of PRC laws and regulations, including, but not limited to, the laws and regulations governing our business, or the enforcement and performance of our contractual arrangements with Sino-China and its shareholders.
We conduct a substantial portion of our business through Trans Pacific and Sino-Global Shipping (HK) Ltd. Sino-Global Shipping (HK) Ltd., Trans Pacific and our company are generally subject to laws and regulations applicable to foreign investment in China and, in particular, laws applicable to wholly foreign-owned enterprises. Trans Pacific, Sino-Global Shipping (HK) Ltd. and our company are considered foreign persons or foreign invested enterprises under PRC law. As a result, Trans Pacific, Sino-Global Shipping (HK) Ltd. and our company are subject to PRC law limitations on foreign ownership of Chinese companies. These laws and regulations are relatively new and may be subject to change, and their official interpretation and enforcement may involve substantial uncertainty. The effectiveness of newly enacted laws, regulations or amendments may be delayed, resulting in detrimental reliance by foreign investors. New laws and regulations that affect existing and proposed future businesses may also be applied retroactively.
In addition, we depend on Sino-China to honor its agreements with Trans Pacific. Almost all of these agreements are governed by PRC law. The PRC legal system is based on written statutes. Prior court decisions may be cited for reference but have limited precedential value. Since 1979, PRC legislation and regulations have significantly enhanced the protections afforded to various forms of foreign investments in China. However, since the PRC legal system continues to rapidly evolve, the interpretations of many laws, regulations and rules are not always uniform and enforcement of these laws, regulations and rules involve uncertainties, which may limit legal protections available to us. In addition, any litigation in China may be protracted and result in substantial costs and diversion of resources and management attention.
The PRC government has broad discretion in dealing with violations of laws and regulations, including levying fines, revoking business and other licenses and requiring actions necessary for compliance. In particular, licenses and permits issued or granted to us by relevant governmental bodies may be revoked at a later time by higher regulatory bodies. We cannot predict the effect of the interpretation of existing or new PRC laws or regulations on our businesses. We cannot assure you that our current ownership and operating structure would not be found in violation of any current or future PRC laws or regulations. As a result, we may be subject to sanctions, including fines, and could be required to restructure our operations or cease to provide certain services. Any of these or similar actions could significantly disrupt our business operations or restrict us from conducting a substantial portion of our business operations, which could materially and adversely affect our business, financial condition and results of operations.
The shareholders of Sino-China have potential conflicts of interest with us, which may adversely affect our business.
Neither we nor Trans Pacific owns any portion of the equity interests of Sino-China. Instead, we and Trans Pacific rely on contractual obligations to enforce our interest in receiving payments from Sino-China. Conflicts of interest may arise between Sino-China’s shareholders and our company if, for example, their interests in receiving dividends from Sino-China were to conflict with our interest requiring Sino-China to make contractually-obligated payments to Trans Pacific. As a result, we have required Sino-China and each of its shareholders to execute irrevocable powers of attorney to appoint the individual designated by us to be his attorney-in-fact to vote on their behalf on all matters requiring shareholder approval by Sino-China and to require Sino-China’s compliance with the terms of its contractual obligations. We cannot assure you, however, that when conflicts of interest arise, Sino-China’s shareholders will act completely in our interests or that conflicts of interests will be resolved in our favor. In addition, Sino-China’s shareholders could violate their agreements with us by diverting business opportunities from us to others. If we cannot resolve any conflicts of interest between us and Sino-China’s shareholders, we would have to rely on legal proceedings, which could result in the disruption of our business. In addition, these contractual relationships are governed by PRC law, which may result in uncertainty as to application and enforcement.
We rely on dividends paid by our subsidiary for our cash needs.
We rely on dividends paid by Trans Pacific for our cash needs, including the funds necessary to pay dividends and other cash distributions, if any, to our shareholders, to service any debt we may incur and to pay our operating expenses. The payment of dividends by entities organized in China is subject to limitations. Regulations in the PRC currently permit payment of dividends only out of accumulated profits as determined in accordance with accounting standards and regulations in China. Our subsidiary in China is also required to set aside a portion of their after-tax profits according to PRC accounting standards and regulations to reserve fund and other funds required by PRC law. The PRC government also imposes controls on the conversion of Renminbi (“RMB”) into foreign currencies and the remittance of currencies out of China. We may experience difficulties in completing the administrative procedures necessary to obtain and remit foreign currency. Pursuant to the PRC enterprise income tax law and its implementation rules that were effective on January 1, 2008, dividends payable by a foreign investment entity to its foreign investors are subject to a withholding tax of up to 10%. Meanwhile, the United States and China are signatories to the 1984 People’s Republic of China-United States Income Tax Agreement, which would allow our company to claim a deemed-paid credit, which is an indirect tax credit, on any taxes paid to China by Trans Pacific. To the extent we were not eligible to receive or were unable to use the credit, this tax could have an adverse effect on our company.
Governmental control of currency conversion may affect the value of your investment.
In the course of providing services for international shipments, we occasionally require currencies from other countries to conduct our business. While we believe that we have complied with applicable currency control laws and regulations in all material aspects, we cannot guarantee you that our efforts will be free from challenge or that, if challenged, we will be successful in our defense of our current practices. Under our current corporate structure, our income is paid in different currencies, depending on our agreements with individual customers. We then pay in local currencies the expenses associated with operating a company in several countries. Shortages in the availability of foreign currency may restrict our ability to pay such expenses unless and until we convert currencies that we have into those that we require.
One of the currencies we often convert among is the RMB. The PRC government imposes controls on the convertibility of the RMB into foreign currencies and, in certain cases, the remittance of currency out of China. Under existing PRC foreign exchange regulations, payments of current account items, including profit distributions, interest payments and expenditures from trade-related transactions, can be made in foreign currencies without prior approval from the PRC State Administration of Foreign Exchange by complying with certain procedural requirements. However, approval from appropriate government authorities is required where RMB is to be converted into foreign currency and remitted out of China to pay capital expenses such as the repayment of bank loans denominated in foreign currencies. The PRC government may also at its discretion restrict access in the future to foreign currencies for current account transactions. If the foreign exchange control system prevents us from obtaining sufficient foreign currency to satisfy our currency demands, we may not be able to pay dividends, if any, in foreign currencies to our shareholders.
Fluctuation in the value of the RMB may have a material adverse effect on your investment.
The value of the RMB against the U.S. dollar and other currencies may fluctuate and is affected by, among other things, changes in political and economic conditions. On July 21, 2005, the PRC government changed its decade-old policy of pegging the value of the RMB to the U.S. dollar. Under the new policy, the RMB is permitted to fluctuate within a narrow and managed band against a basket of certain foreign currencies. This change in policy has resulted in an appreciation of the RMB against the U.S. dollar. While the international reaction to the RMB revaluation has generally been positive, there remains significant international pressure on the PRC government to adopt an even more flexible currency policy, which could result in a further and more significant appreciation of the RMB against the U.S. dollar. We rely largely on payments from Trans Pacific and Sino-China. While we charge our fees in U.S. dollars, Sino-China and Trans Pacific nevertheless operate within China and will rely heavily on RMB in their operations. Any significant revaluation of RMB may materially and adversely affect our cash flows, revenues, earnings and financial position, and the value of, and any dividends payable on, our common stock in U.S. dollars. For example, an appreciation of RMB against the U.S. dollar would make any new RMB denominated investments or expenditures more costly to us, to the extent that we need to convert U.S. dollars into RMB for such purposes.
Changes in China’s political and economic policies could harm our business.
China’s economy has historically been a planned economy subject to governmental plans and quotas and has, in certain aspects, been transitioning to a more market-oriented economy. Although we believe that the economic reform and the macroeconomic measures adopted by the Chinese government have had a positive effect on the economic development of China, we cannot predict the future direction of these economic reforms or the effects these measures may have on our business, financial position or results of operations. In addition, the Chinese economy differs from the economies of most countries belonging to the Organization for Economic Cooperation and Development, or OECD. These differences include:
·economic structure;
·level of government involvement in the economy;
·level of development;
·level of capital reinvestment;
·control of foreign exchange;
·methods of allocating resources; and
·balance of payments position.
As a result of these differences, our business may not develop in the same way or at the same rate as might be expected if the Chinese economy were similar to those of the OECD member countries.
Since 1979, the Chinese government has promulgated many new laws and regulations covering general economic matters. Despite this activity to develop a legal system, China’s system of laws is not yet complete. Even where adequate law exists in China, enforcement of existing laws or contracts based on existing law may be uncertain or sporadic, and it may be difficult to obtain swift and equitable enforcement or to obtain enforcement of a judgment by a court of another jurisdiction. The relative inexperience of China’s judiciary, in many cases, creates additional uncertainty as to the outcome of any litigation. In addition, interpretation of statutes and regulations may be subject to government policies reflecting domestic political changes. Our activities in China will also be subject to administration review and approval by various national and local agencies of China’s government. Because of the changes occurring in China’s legal and regulatory structure, we may not be able to secure the requisite governmental approval for our activities. Although we have obtained all required governmental approval to operate our business as currently conducted, to the extent we are unable to obtain or maintain required governmental approvals, the Chinese government may, in its sole discretion, prohibit us from conducting our business.”
The Chinese government could change its policies toward private enterprise or even nationalize or expropriate private enterprises, which could result in the total loss of our investment in that country.
Our business is subject to significant political and economic uncertainties and may be adversely affected by political, economic and social developments in China. Over the past several years, the Chinese government has pursued economic reform policies including the encouragement of private economic activity and greater economic decentralization. The Chinese government may not continue to pursue these policies or may significantly alter them to our detriment from time to time with little, if any, prior notice.
Changes in policies, laws and regulations or in their interpretation or the imposition of confiscatory taxation, restrictions on currency conversion, restrictions or prohibitions on dividend payments to shareholders, devaluations of currency or the nationalization or other expropriation of private enterprises could have a material adverse effect on our business. Nationalization or expropriation could even result in the total loss of our investment in China and in the total loss of your investment in us.
As most of our officers, directors and assets are outside the United States, it will be extremely difficult to acquire jurisdiction and enforce liabilities against us and our officers, directors and assets based in China.
Most of our directors and officers reside outside the United States. In addition, the majority of our assets are located outside the United States. As a result, it may be difficult or impossible to effect service of process within the United States upon most, if not all, of our directors or officers and our subsidiaries, or enforce against any of them court judgments obtained in United States courts, including judgments relating to United States federal securities laws. Furthermore, because the majority of our assets are located in China and PRC does not have treaties with the United States or many other countries providing for the reciprocal recognition and enforcement of judgment of courts, it would also be extremely difficult to access those assets to satisfy an award entered against us in United States court.
Our international operations require us to comply with a number of U.S. regulations.
In addition to the Chinese laws and regulations with which we must comply, we must also comply with the United States Foreign Corrupt Practices Act (“FCPA”), which prohibits U.S. companies or their agents and employees from providing anything of value to a foreign official for the purposes of influencing any act or decision of these individuals in their official capacity to help obtain or retain business, direct business to any person or corporate entity or obtain any unfair advantage. Any failure by us to adopt appropriate compliance procedures and ensure that our employees and agents comply with the FCPA and applicable laws and regulations in foreign jurisdictions could result in substantial penalties and/or restrictions in our ability to conduct business in certain foreign jurisdictions. The U.S. Department of the Treasury’s Office of Foreign Asset Control (“OFAC”) administers and enforces economic and trade sanctions against targeted foreign countries, entities and individuals based on U.S. foreign policy and national security goals. As a result, we are restricted from entering into transactions with certain targeted foreign countries, entities, and individuals except as permitted by OFAC, which could reduce our future growth.
Risks Related to This Offering
Our management will have broad discretion in how we use any proceeds that we may receive from the proceeds from this offering,exercise of the Warrants, we may use the proceeds in ways with which you disagree.
Our management will have broad discretionsignificant flexibility in applying any proceeds we may receive from the net proceedsexercise of this offering.the Warrants. You will be relying on the judgment of our management with regard to the use of these net proceeds, and you will not have the opportunity, as part of your investment decision, to assess whetherinfluence how the proceeds are being used appropriately.used. It is possible that the netthese proceeds will be used by usinvested in a way that does not yield a favorable, or any, return for us. The failure of our management to use such funds effectively could have a material adverse effect on our business, financial condition, prospects, operating results and cash flow.
You will experience immediate dilution in the book value per share of the common stock you purchase.
Because the price per share of our common stock being offered is substantially higher than the book value per share of our common stock, you will suffer substantial dilution in the net tangible book value of the common stock you purchase in this offering. After giving effect to the sale by us of an assumed 3,398,058 shares of common stock in this offering, and based upon an assumed public offering price of $2.06 per share, which is the last reported closing price of a share of our common stock on the NASDAQ Capital Market on November 10, 2014, and a net tangible book value per share of our common stock of $1.04 as of September 30, 2014, if you purchase shares of our common stock in this offering, you will suffer immediate and substantial dilution of $0.76 per share in the net tangible book value of each share of our common stock purchased by you. See “Dilution” on page 19 for a more detailed discussion of the dilution you will incur in connection with this offering.
We currently have a sporadic, illiquid and volatile market for our common stock, and the market for our common stock is and may remain sporadic, illiquid and volatile in the future.
We currently have a sporadic, illiquid and volatile market for our common stock, which market is anticipated to remain sporadic, illiquid and volatile in the future. Factors that could affect our stock price or result in fluctuations in the market price or trading volume of our common stock include:
| · | quarterly variations in the rate of growth of our financial indicators, such as net income per share, net income and cash flows, or those of companies that are perceived to be similar to us; |
| · | speculation in the press or investment community; |
| · | public reaction to our press releases, announcements and filings with the SEC; |
| · | sales of our equity or debt securities by us or our shareholders, or the perception that such sales may occur; |
| · | the realization of any of the risk factors presented in this prospectus; |
| · | the recruitment or departure of key personnel; |
| · | commencement of, or involvement in, litigation; |
| · | changes in market valuations of companies similar to ours; and |
| · | domestic and international economic, legal and regulatory factors unrelated to our performance. |
Our stock price may be impacted by factors that are unrelated or disproportionate to our operating performance or our actual value. The stock markets in general have experienced extreme volatility that has often been unrelated to the operating performance of particular companies. These broad market fluctuations may adversely affect the trading price of our common stock. Additionally, general economic, political and market conditions, such as recessions, interest rates or international currency fluctuations may adversely affect the market price of our common stock. Due to the limited volume of our shares which trade, we believe that our stock prices (bid, ask and closing prices) may not be related to our actual value, and not reflect the actual value of our common stock. Shareholders and potential investors in our common stock should exercise caution before making an investment in us.
An active liquid trading market for our common stock may not develop in the future.
Our common stock currently trades on the NASDAQ Capital Market, although our common stock’s trading volume is low. Liquid and active trading markets usually result in less price volatility and more efficiency in carrying out investors’ purchase and sale orders. However, our common stock may continue to have limited trading volume, and many investors may not be interested in owning our common stock because of the inability to acquire or sell a substantial block of our common stock at one time. Such illiquidity could have an adverse effect on the market price of our common stock. In addition, a shareholder may not be able to borrow funds using our common stock as collateral because lenders may be unwilling to accept the pledge of securities having such a limited market. We cannot assure you that an active trading market for our common stock will develop or, if one develops, be sustained.
Because we are a small company, the requirements of being a public company, including compliance with the reporting requirements of the Securities Exchange Act, of 1934, as amended (the “Exchange Act”) and the requirements of the Sarbanes-Oxley Act and the Dodd-Frank Act, may strain our resources, increase our costs and distract management, and we may be unable to comply with these requirements in a timely or cost-effective manner.
As a public company with listed equity securities, we must comply with the federal securities laws, rules and regulations, including certain corporate governance provisions of the Sarbanes-Oxley Act of 2002 (the “Sarbanes-Oxley Act”) and the Dodd-Frank Act, related rules and regulations of the SEC and the NASDAQ, Capital Market, with which a private company is not required to comply. Complying with these laws, rules and regulations occupies a significant amount of the time of our Board of Directors and management and will significantly increaseincreases our costs and expenses. Among other things, we must:
| ·● | maintain a system of internal control over financial reporting in compliance with the requirements of Section 404 of the Sarbanes-Oxley Act and the related rules and regulations of the SEC and the Public Company Accounting Oversight Board; |
| ·● | comply with rules and regulations promulgated by the NASDAQ Capital Market;NASDAQ; |
| ·● | prepare and distribute periodic public reports in compliance with our obligations under the federal securities laws; |
| ·● | maintain various internal compliance and disclosures policies, such as those relating to disclosure controls and procedures and insider trading in our common stock; |
| ·● | involve and retain to a greater degree outside counsel and accountants in the above activities; |
| ·● | maintain a comprehensive internal audit function; and |
| ·● | maintain an investor relations function. |
Future sales of our common stock, whether by us or our stockholders, could cause our stock price to decline.
If we sell, or the public market perceives we may sell, substantial amounts of our common stock in the public market, the market price of our common stock could decline significantly. Pursuant to our Registration Statement on Form S-3 (Registration Statement No. 333-194211, which the SEC declared effective on April 15, 2014), we have the right to sell, subject to certain limitations, in one or more offerings to the public, up to $8,860,000 of a variety of our securities, including shares of our common stock. Additionally, if our existing shareholders sell, or indicate an intent to sell, substantial amounts of our common stock in the public market, the trading price of our common stock could decline significantly. Similarly, the perception in the public market that our shareholders might sell shares of our common stock could also depress the market price of our common stock. A decline in the price of shares of our common stock might significantly impede our ability to raise capital through the issuance of additional shares of our common stock or other equity securities. In addition, the issuance and sale by us of additional shares of our common stock or securities convertible into or exercisable for shares of our common stock, or the perception that we will issue such securities, could reduce the trading price for our common stock as well as make future sales of equity securities by us less attractive or not feasible. The sale of shares of common stock issued upon the exercise of our outstanding options and warrants could further dilute the holdings of our then existing shareholders.
Securities analysts may not cover our common stock and this may have a negative impact on the market price of our common stock’s market price.stock.
The trading market for our common stock will depend, in part, on the research and reports that securities or industry analysts publish about us or our business. We do not have any control over independent analysts.analysts (provided that we have engaged various non-independent analysts). We do not currently have and may never obtain research coverage by independent securities and industry analysts. If no independent securities or industry analysts commence coverage of us, the trading price for our common stock would be negatively impacted. If we obtain independent securities or industry analyst coverage and if one or more of the analysts who covers us downgrades our common stock, changes their opinion of our shares or publishes inaccurate or unfavorable research about our business, our stock price would likely decline. If one or more of these analysts ceases coverage of us or fails to publish reports on us regularly, demand for our common stock could decrease and we could lose visibility in the financial markets, which could cause our stock price and trading volume to decline.
The sharesThere has been and may continue to be significant volatility in the volume and price of our common stock are listed on the NASDAQ Capital Market. If we fail to meet the NASDAQ Capital Market’s continued listing requirements and other NASDAQ rules, we may risk delisting. Delisting could negatively affect the
The market price of our common stock which could make it more difficulthas been and may continue to be highly volatile. Factors, including timing, progress and results of the development of our newly added bulk cargo container tracking services and our mobile application that will provide a full-service logistics platform between the U.S. and the PRC for usshort-haul trucking in the U.S.; regulatory matters, concerns about our financial position, operations results, litigation, government regulation, or developments or disputes relating to sellagreements or proprietary rights, may have a significant impact on the market volume and price of our securitiesstock. Unusual trading volume in a future financing or for youour shares occurs from time to selltime.
We have not paid and do not intend to pay dividends on our common stock in the foreseeable future. Any return on investment may be limited to the value of our securities.
We have not paid dividends on our common stock inception, and do not intend to pay any dividends on our common stock in the foreseeable future. We intend to reinvest earnings, if any, in the development and expansion of our business. Accordingly, you purchasewill need to rely on sales of your shares of common stock after price appreciation, which may never occur, in this offering.order to realize a return on your investment.
The shares of our common stock are listed on the NASDAQ Capital Market and we are required to meet the continued listing requirements of the NASDAQ Capital Market and other NASDAQ rules, including those regarding director independence and independent committee requirements, minimum shareholders’ equity, minimum share price and certain other corporate governance requirements. In particular, we are required to maintain a minimum bid price for our listed common stock of $1.00 per share and a minimum of $2.5 million of shareholders’ equity. If we do not meet these continued listing requirements, our common stock could be delisted. Delisting from the NASDAQ Capital Market would cause us to pursue eligibility for trading of our common stock on other markets or exchanges, or on the “pink sheets.” In such case, our shareholders’ ability to trade, or obtain quotations of the market value of our common stock would be severely limited because of lower trading volumes and transaction delays. These factors could contribute to lower prices and larger spreads in the bid and ask prices of our common stock. There can be no assurance that our common stock, including our shares that you purchase in this Offering, if delisted from the NASDAQ Capital Market in the future, would be listed on a national securities exchange, a national quotation service, the over-the-counter markets or the pink sheets. Delisting from the NASDAQ Capital Market, or even the issuance of a notice of potential delisting, would also result in negative publicity, make it more difficult for us to raise additional capital, adversely affect the market liquidity of our common stock, decrease securities analysts’ coverage of us, if any at such time, or diminish investor, supplier and employee confidence. In November 2012, we received a notification letter from NASDAQ indicating that for the quarter ended September 30, 2012 our shareholders’ equity was below NASDAQ’s $2.5 million minimum continued listing requirement. As a result of the sale by us in April 2013, as approved by our Board of Directors and shareholders, of 1,800,000 shares of our common stock for approximately $3 million to Mr. Zhang, we returned to compliance with NASDAQ’s continued listing requirements. If, however, in the future we fail to meet such and/or any other NASDAQ continued listing requirement, we may risk delisting.
You may experience future dilution as a result of future equity offerings or other equity issuances.
We may in the future issue additional shares of our common stock or other securities convertible into or exchangeable for our common stock. We cannot assure you that we will be able to sell shares or other securities in any other offering or other transactions at a price per share that is equal to or greater than the price per share paid by investors in this offering. The price per share at which we sell additional shares of our common stock or other securities convertible into or exchangeable for our common stock in future transactionsis not always active, liquid and orderly, which may be higher or lower thaninhibit the price per share in this offering.
We are obligated to develop and maintain proper and effective internal control over financial reporting. We may not complete our analysisability of our internal control over financial reporting in a timely manner, or these internal controls may not be determinedshareholders to be effective, which may adversely affect investor confidence in our company and, as a result, the value of oursell common stock.
Each year we are required, pursuant to Section 404 of the Sarbanes-Oxley Act, to furnish a report by management on, among other things, the effectiveness of our internal control over financial reporting. This assessment will need to include disclosure of any material weaknesses identified by our management in our internal control over financial reporting and, if we cease to be a “smaller reporting company,” a statement that our independent registered public accounting firm has issued an opinion on our internal control over financial reporting. We may not be able to complete our evaluation, testing and any required remediation in a timely fashion. During the evaluation and testing process, if we identify one or more material weaknesses in our internal control over financial reporting, we will be unable to assert that our internal controls are effective. If we are unable to assert that our internal control over financial reporting is effective, we could lose investor confidence in the accuracy and completeness of our financial reports, which would cause the price ofThe trading market for our common stock is not always active, liquid or orderly. The lack of an active market at times may impair your ability to decline. To comply withsell your shares at the requirementstime you wish to sell them or at a price that you consider reasonable. The lack of being a public company, wean active market may needalso reduce the fair market value of your shares. An inactive market may also impair our ability to undertake various actions, such as implementing new internal controls and procedures and hiring accountingraise capital through the issuance of our equity securities (or securities that are convertible into or internal audit staff.exercisable therefor).
StatementsCAUTIONARY STATEMENT REGARDING FORWARD-LOOKING STATEMENTS
Certain statements contained or incorporated by reference in this prospectus, concerning our future plans and operations are dependent on our abilityincluding the documents referred to secure adequate funding and the absence of unexpected delays or adverse developments. We may not be able to secure required funding.
The statements contained in this prospectus concerning future events or developments orstatements of our future activities, such as concerning strategic business plans and other statements concerningmanagement referring to our future operations and activities, aresummarizing the contents of this prospectus, include “forward-looking statements”. We have based these forward-looking statements that in each instance assume that we are able to obtain sufficient funding in the near term and thereafter to support such activities and continueon our operations and planned activities in a timely manner. There can be no assurance that this will be the case. Also, such statements assume that there are no significant unexpected developments or events that delay or prevent such activities from occurring. Failure to timely obtain sufficient funding, or unexpected development or events, could delay the occurrence of such events or prevent the events described in any such statements from occurring which could adversely affect our business, financial condition and results of operations.
SPECIAL NOTE REGARDING FORWARD-LOOKING STATEMENTS
This prospectus, including the sections titled “Prospectus Summary,” “Risk Factors,” “Management’s Discussion and Analysis of Financial Condition and Results of Operations” and “Our Company,” contains certain statements that constitute “forward-looking statements” within the meaning of Section 27A of the Securities Act of 1933 and Section 21E of the Securities Exchange Act of 1934. Such forward-looking statements, including but not limited to statements regarding our projected growth, trends and strategies, future operating and financial results, financialcurrent expectations and current business indicators are based upon current information and expectations and are subject to change based on factors beyond our control.projections about future events. Our actual results may differ materially or perhaps significantly from those discussed herein, or implied by, these forward-looking statements. Forward-looking statements typically are identified by the use of termswords such as “look,” “may,” “will,” “should,” “might,” “believe,” “plan,” “expect,” “anticipate,” “estimate”“intend,” “estimate,” “plan,” “project” and other similar words, although someexpressions. In addition, any statements that refer to expectations or other characterizations of future events or circumstances are forward-looking statements. Forward-looking statements included in this prospectus or our other filings with the SEC include, but are expressed differently. The accuracy of such statements may be impacted by a number of business risks and uncertainties we face that could cause our actual results to differ materially from those projected or anticipated, including but not necessarily limited to, the following:those relating to:
| ·● | Our ability to timely and properly deliver shipping agency, shipping and chartering, inland transportation management services, freight logistics services, and ship managementcontainer trucking services; |
| ·● | Our dependence on a limited number of major customers and related parties; |
| ·● | Political and economic factors in China; |
| ·● | Our ability to expand and grow our lines of business; |
| ·● | Unanticipated changes in general market conditions or other factors which may result in cancellations or reductions in the need for our services; |
| ·● | The effect of terrorist acts, or the threat thereof, on consumer confidence and spending or the production and distribution of product and raw materials which could, as a result, adversely affect our services, operations and financial performance; |
| ·● | The acceptance in the marketplace of our new lines of services; |
| ·● | ForeignThe foreign currency exchange rate fluctuations; |
| ·● | Hurricanes or other natural disasters; |
| ·● | Our ability to identify and successfully execute cost control initiatives; |
| ·● | The impact of quotas, tariffs or safeguards on our customer products that we service; and |
| ·● | Our ability to attract, retain and motivate skilled personnel.personnel; and |
16 | ● | Our expansion and growth into other areas of the shipping industry. |
TheseThe foregoing does not represent an exhaustive list of matters that may be covered by the forward-looking statements contained herein or risk factors with which we are based on management’s current expectations, estimates, forecastsfaced that may cause our actual results to differ from those anticipated in our forward-looking statements. Please see the “Risk Factors” contained in our reports and projections aboutother filings with the SEC or in this prospectus for additional risks which could adversely impact our business and the industry in which we operatefinancial performance.
Moreover, new risks regularly emerge and management’s beliefs and assumptions are not guarantees of future performance or development and are subject to a number of known and unknown risks, uncertainties and assumptions, including those described in “Risk Factors.” Moreover, we operate in a very competitive and rapidly changing environment. New risks emerge from time to time. Itit is not possible for our management to predict or articulate all risks we face, nor can we assess the impact of all factorsrisks on our business or the extent to which any factor,risk, or combination of factors,risks, may cause actual results to differ materially from those contained in any forward-looking statements. All forward-looking statements we may make. In light of these risks, uncertainties and assumptions, the forward-looking events and circumstances we discussincluded in this prospectus may not occur and actual results could differ materially and adversely from those anticipatedare based on information available to us on the date of this prospectus. Except to the extent required by applicable laws or implied in the forward-looking statements.
You should not rely upon forward-looking statements as predictions of future events. Althoughrules, we believe that the expectations reflected in the forward-looking statements are reasonable, we cannot guarantee that the future results, levels of activity, performance or events and circumstances reflected in the forward-looking statements will be achieved or occur. We undertake no obligation to publicly update publiclyor revise any forward-looking statement, whether as a result of new information, future events or otherwise. All subsequent written and oral forward-looking statements for any reason afterattributable to us or persons acting on our behalf are expressly qualified in their entirety by the date ofcautionary statements contained above and throughout this prospectus to conform these statements to actual results or to changes in our expectations.prospectus.
You should read this prospectus and the documents that we reference in this prospectus and have filed with the SEC as exhibits to the registration statementTable of which this prospectus is a part with the understanding that our actual future results, levels of activity, performance and events and circumstances may be materially different from what we expect.Contents
MARKET INDUSTRY AND OTHER DATA
We obtained the industry, market and similar data set forth in this prospectus from our own internal estimates and research, and from industry publications and research, surveys and studies conducted by third party consultants, which were commissioned by us. These data involve a number of assumptions and limitations, and you are cautioned not to give undue weight to such information and estimates.
Information that is based on estimates, forecasts, projections, market research or similar methodologies is inherently subject to uncertainties and actual events or circumstances may differ materially from events and circumstances that are assumed in this information. In some cases, we do not expressly refer to the sources from which this data is derived. In that regard, when we refer to one or more sources of this type of data in any paragraph, you should assume that other data of this type appearing in the same paragraph is derived from the same sources, unless otherwise expressly stated or the context otherwise requires.
USE OF PROCEEDS
We estimate that the net proceeds we will receive from this offering will be approximately $6 million after deducting the underwriting discount and our estimated expenses of the offering, and based upon an assumed public offering price of $2.06 per share, which is the reported closing price of a share of common stock on the NASDAQ Capital Market on November 10, 2014. If the underwriter’s over-allotment option is exercised in full, we estimate that the net proceeds we receive from this offering will be approximately $6.96 million.
The principal purpose of this offering is to raise additional capital to assist us in our continued growth and expansion as part of our growth strategy of continuing to develop a scalable platform in the shipping industry that we believe is capable of generating sustainable and increasing earnings. As of the date of this prospectus, we cannot specify with certainty all of the particular uses for our net proceeds to be received by us from the Offering, or the amounts that we plan to use for any particular purpose. Accordingly, our management team will have broad discretion in using our net proceeds. We currently expect, however, to use such net proceeds primarily for general corporate and working capital purposes including hiring additional personnel with experience and knowledge in one or more of our offered services. We may also use all or a portion of the net proceeds received by us in the offering to make what we believe are strategic and/or complementary acquisitions of businesses and/or assets as, if and when we find any such opportunities, including, but not limited to, acquisitions of a vessel, logistics companies and/or shipping agency companies. From time to time the Company has discussions with third parties to explore strategic arrangements and/or partnerships including possible acquisitions. We currently have no commitments, understandings, arrangements or agreements to effectuate any acquisition. We believe that by having additional available cash, if we find strategic and/or complementary businesses and/or assets acquisition opportunities, we will be better situated to act quickly to secure such opportunities, which without such additional funds, we could risk the loss of such opportunities.
Our expected use of the net proceeds we receive from this offering represents our current intentions based on our current plans and business conditions. The amount and timing of our actual expenditures will depend on numerous factors, including how quickly we collect our receivables, the outlays of funds we are required to expend in connection with our business operations, any unforeseen cash needs and/or whether we locate and are able to effectuate any acquisitions described generally above. As a result, we will retain broad discretion in the allocation and use of the net proceeds we receive from this offering.
Pending our use of the net proceeds we receive from this offering, we may invest such net proceeds in a variety of capital preservation investments, including short-term investment grade, interest bearing, instruments and U.S. government securities.
DIVIDEND POLICYUSE OF PROCEEDS
We have never declared or paidwill not receive any cash dividends on our common stock. We do not anticipate paying any cash dividends on our common stock in the foreseeable future, if ever. Any future determination to pay cash dividends will be at the discretion of our Board of Directors and will depend upon our financial condition, operating results, capital requirements, Virginia and PRC laws, and other factors that our Board of Directors deems relevant.
We conduct our operations primarily through our subsidiaries, Trans Pacific, Sino-Global Shipping Australia Pty Ltd., Sino-Global Shipping (HK) Ltd. and our VIE, Sino-China. As a result, our ability to pay dividends and to finance any debt we may incur depends upon dividends paid by our subsidiaries and management fees paid by Sino-China. If our subsidiaries incur debt on their own behalf in the future, the instruments governing their debt may restrict their ability to pay dividends to us. In addition, Trans Pacific is permitted to pay dividends to us only out of its retained earnings, if any, as determined in accordance with PRC accounting standards and regulations. Under PRC law, wholly foreign-owned enterprises like Trans Pacific are required to set aside at least 10% of their after-tax profit each year to fund a statutory reserve until the amount of the reserve reaches 50% of such entity’s registered capital.
To the extent Trans Pacific does not generate sufficient after-tax profits to fund this statutory reserve, its ability to pay dividends to us may be limited. Although these statutory reserves can be used, among other ways, to increase the registered capital and eliminate future losses in excess of retained earnings of the respective companies, these reserve funds are not distributable as cash dividends except in the event of a solvent liquidation of the companies. Other than as described in the previous sentences, China’s State Administration of Foreign Exchange (“SAFE”) has approved the company structure between our company and Trans Pacific, and Trans Pacific is permitted to pay dividends to our company.
CAPITALIZATION
You should read this table together with the sections in this prospectus titled “Selected Condensed Summary Consolidated Financial Data, Management’s Discussion and Analysis of Financial Condition and Results of Operations,” and our financial statements and related notes appearing elsewhere in this prospectus.
The following table sets forth our capitalization as of September 30, 2014 on:
| · | an as-adjusted basis to reflectproceeds from the sale of an estimated 3,398,058 shares of our common stock in this offering, at an assumed public offering price of $2.06 per share, which is the reported closing price of a share of our common stock on the NASDAQ Capital Market on November 10, 2014, less underwriter discount estimated and estimated offering expenses payable by us.
|
| | | September 30, 2014 | |
| | | Actual | | | As Adjusted (1) | |
| | | | | | | |
| Assets | | | | | | |
| Cash and cash equivalents | | $ | 3,553,187 | | | $ | 9,550,660 | |
| Liabilities | | | | | | | | |
| Total current liabilities | | | 1,152,860 | | | | 1,152,860 | |
| Equity | | | | | | | | |
| Preferred stock, without par value per share, 2,000,000 shares authorized, none issued | | | - | | | | - | |
| Common stock, without par value per share, 50,000,000 shares authorized, 6,326,032 shares issued and 6,200,841 shares outstanding actual and 9,598,899 shares issued and outstanding, as adjusted (2) | | | 13,385,477 | | | | 19,382,950 | |
| Additional paid-in capital | | | 1,144,842 | | | | 1,144,842 | |
| Accumulated deficit | | | (2,937,801 | ) | | | (2,372,527 | ) |
| Non-controlling interest | | | (4,829,255 | ) | | | (4,829,255 | ) |
| Total equity | | $ | 6,438,514 | | | $ | 12,435,987 | |
(1) Assumes the underwriter’s over-allotment option has not been exercised.
(2) Based upon 6,200,841 shares of our common stock outstanding as of September 30, 2014, excluding (i) 205,032 shares of our common stock issuable upon exercise of our outstanding stock options and warrants with weighted average exercise prices ranging from $6.88 to $9.30 per share outstanding as of the date of this prospectus, (ii) 9,400,000 shares of our common stock available for issuance as of the date of this prospectus under our 2014 Stock Incentive Plan, and (iii) 236,903 shares of our common stock available for issuance as of the date of this prospectus under our 2008 Stock Incentive Plan.
DILUTION
Purchasers of shares of our common stock offered in this offering will experience an immediate dilution in the net tangible book value of their shares of our common stock from the offering price of the shares of our common stock in this offering. Our net tangible book value asThe Selling Shareholders will receive all of September 30, 2014 was $6,438,514,the proceeds from this offering. However, we may receive proceeds in the aggregate amount of up to approximately $7.0 million if all of the Warrants that are covered by this prospectus are exercised for cash. We cannot predict when, or approximately $1.04 per share. Net tangible book value per shareif, the Warrants will be exercised. It is possible that the Warrants may expire and may never be exercised. We intend to use any proceeds from the exercise of the Warrants for general corporate and working capital purposes.
The Selling Shareholders will pay any underwriting discounts and commissions and expenses incurred by the Selling Shareholders for brokerage, accounting, tax or legal services or any other expenses incurred by the Selling Shareholders in disposing of the shares. We will bear all other costs, fees and expenses incurred in effecting the registration of the shares covered by this prospectus, including all registration and filing fees, and fees and expenses of our common stock is equal tocounsel and our net tangible assets (tangible assets less total liabilities), as of September 30, 2014, divided by the number of shares of common stock issued and outstanding as of September 30, 2014.independent registered public accountants.
Dilution per share represents the difference between the public offering price per share of our common stock and the adjusted net tangible book value per share of our common stock after giving effect to this offering. After reflecting the sale of an assumed 3,398,058 shares of our common stock offered by us at the public offering price of $2.06 per share, which is the reported closing price of a share of our common stock on the NASDAQ Capital Market on November 10, 2014, less underwriter discount and estimated offering expenses, our adjusted net tangible book value and our adjusted net tangible book value per share of our common stock as of September 30, 2014 would have been $12,435,987, or $1.30 per share. The change represents an immediate increase in net tangible book value per share of our common stock of $0.26 per share to existing shareholders and an immediate dilution of $0.76 per share to new investors purchasing the shares of common stock in this offering. The following table illustrates this per share dilution:MARKET PRICE OF OUR COMMON STOCK AND RELATED STOCKHOLDER MATTERS
| Public offering price per share of our common stock | | $ | 2.06 | |
| Net tangible book value per share as of September 30, 2014 (1) | | | 1.04 | |
| Increase per share attributable to this offering (2) | | | 0.26 | |
| | | | | |
| As adjusted net tangible book value per share after this offering (2) | | $ | 1.30 | |
| | | | | |
| Dilution per share to new investors in this offering (2) | | $ | 0.76 | |
(1) Based upon 6,200,841 shares of our common stock outstanding as of September 30, 2014, excluding (i) 205,032 shares of our common stock issuable upon exercise of our outstanding stock options and warrants with weighted average exercise prices ranging from $6.88 to $9.30 per share outstanding as of the date of this prospectus, (ii) 9,400,000 shares of our common stock available for issuance as of the date of this prospectus under our 2014 Share Incentive Plan, and (iii) 236,903 shares of our common stock available for issuance as of the date of this prospectus under our 2008 Incentive Plan.
(2) Assumes the underwriter’s over-allotment option has not been exercised.
MARKET PRICE
OF COMMON EQUITY AND RELATED SHAREHOLDER MATTERS
Market Information
Market for Our Common Stock
Our common stock is traded on the NASDAQ CapitalStock Market under the symbol “SINO.”SINO. The high and low common stock sales prices per share during the periods indicated were as follows:
| Quarter Ended/Ending | | Sep. 30 | | | Dec. 31 (1) | | | Mar. 31 | | | June 30 | | | Year | |
| | | | | | | | | | | | | | | | |
| Fiscal year 2015 | | | | | | | | | | | | | | | | | | | | |
| Common stock price per share: | | | | | | | | | | | | | | | | | | | | |
| High | | $ | 4.69 | | | | 2.339 | | | | | | | | | | | $ | 4.69 | |
| Low | | $ | 1.37 | | | | 1.453 | | | | | | | | | | | $ | 1.37 | |
| | | | | | | | | | | | | | | | | | | | | |
| Fiscal year 2014 | | | | | | | | | | | | | | | | | | | | |
| Common stock price per share: | | | | | | | | | | | | | | | | | | | | |
| High | | $ | 3.52 | | | $ | 2.90 | | | $ | 2.97 | | | $ | 3.00 | | | $ | 3.52 | |
| Low | | $ | 1.43 | | | $ | 1.57 | | | $ | 2.26 | | | $ | 2.01 | | | $ | 1.43 | |
| | | | | | | | | | | | | | | | | | | | | |
| Fiscal year 2013 | | | | | | | | | | | | | | | | | | | | |
| Common Stock price per share: | | | | | | | | | | | | | | | | | | | | |
| High | | $ | 2.73 | | | $ | 2.49 | | | $ | 2.75 | | | $ | 1.89 | | | $ | 2.75 | |
| Low | | $ | 1.85 | | | $ | 1.30 | | | $ | 1.71 | | | $ | 1.24 | | | $ | 1.24 | |
| | | High | | | Low | |
| Fiscal 2016: | | | | | | |
| First Quarter | | $ | 1.60 | | | $ | 0.81 | |
| Second Quarter | | | 1.29 | | | | 0.69 | |
| Third Quarter | | | 0.88 | | | | 0.40 | |
| Fourth Quarter | | | 1.33 | | | | 0.58 | |
| | | | | | | | | |
| Fiscal 2017: | | | | | | | | |
| First Quarter | | $ | 2.24 | | | $ | 0.64 | |
| Second Quarter | | | 6.73 | | | | 0.97 | |
| Third Quarter | | | 4.70 | | | | 2.34 | |
| Fourth Quarter | | | 3.45 | | | | 2.57 | |
| | | | | | | | | |
| Fiscal 2018: | | | | | | | | |
| First Quarter | | $ | 3.84 | | | $ | 2.85 | |
| Second Quarter | | | 3.40 | | | | 2.45 | |
| Third Quarter | | | 2.80 | | | | 1.04 | |
| Fourth Quarter (through April 24, 2018) | | | 1.44 | | | | 1.07 | |
Approximate Number of Holders of Our Common Stock
(1)
As of November 10, 2014
On November 10, 2014, the reported closing price on the NASDAQ Capital Market of our common stock was $2.06 per share. As of November 10, 2014, we had seven (7)March 29, 2018, there are 15 holders of record of our common stock. TheThis number of holders of record is based upon the actual number of holders registered at such date and does not include holdersshareholders who hold their shares of sharescommon stock in “street name” or persons, partnerships, associates, corporations or other entities in security position listings maintained by depositories.street name.
Dividend Policy
We have never declared or paid any cash dividends on our common stock. We anticipate that we will retain any earnings to support operations and to finance the growth and development of our business. Therefore, we do not expect to pay cash dividends in the foreseeable future. Any future determination relating to our dividend policy will be made at the discretion of our Board of Directors and will depend on a number of factors, including future earnings, capital requirements, financial conditions and future prospects and other factors the Board of Directors may deem relevant. Payments of dividends by Trans Pacific to our company are subject to restrictions including primarily the restriction that foreign invested enterprises may only buy, sell and/or remit foreign currencies at those banks authorized to conduct foreign exchange business after providing valid commercial documents.
MANAGEMENT’S DISCUSSION AND ANALYSIS OF
FINANCIAL CONDITION AND RESULTS OF OPERATIONSOPERATION
The following discussion and analysis of our company’s financial condition and results of operations should be read in conjunction with our audited consolidated financial statements and the related notes included elsewhere in this prospectus. This discussion contains forward-looking statements that involve risks and uncertainties. Actual results and the timing of selected events could differ materially from those anticipated in these forward-looking statements as a result of various factors. We do not undertake any obligation to update forward-looking statements.
Overview
Second Quarter 2018 Highlights
FoundedRevenue in the three months ended December 31, 2017 increased by $3,091,933, or 145.3%, over the comparable period in 2016. The increase was primarily due to:
| ● | We have expanded the freight logistics segment through cooperating with our major customers. In particular, our subsidiary, Trans Pacific Shanghai, has increased sales to BAO-NYK Shipping PTE. Ltd. (“BAO-NYK”). For the three months ended December 31, 2017, our total sales to BAO-NYK totaled approximately $3.1 million, as compared to $nil for the corresponding period in 2016. |
| ● | Prior to second quarter of fiscal 2018, bulk cargo container services were included in our freight logistics services segment and were operated by our New York subsidiary. Due to the growth of this business line, and to enable our chief operating decision maker to better assess the financial performance of the Company, we separated our bulk cargo container services as a unique segment starting this quarter. We have reclassified $474,855 of revenue from freight logistics services to bulk cargo container services for the six months ended December 31, 2017 for comparison purpose. |
Historically, containers shipping from the U.S. to China have low utilization rates. As a result, large shipping lines in China, including COSCO Shipping Lines Co., Ltd (“COSCO Shipping Lines”), have to bear the shipping costs of empty containers and are seeking solutions to work strategically with local logistics companies in the US. With the Chinese government banning the import of environmental wastes by the end of 2017, the empty container rate of COSCO Group's container shipping from the United States to China will be further reduced. Therefore COSCO Beijing signed a strategic cooperation agreement with us to jointly promote bulk cargo container transportation. Bulk freight rate is usually lower than that of container freight rate, however the transit time is much longer and customers have low flexibility in arrangement with freight carriers. COSCO Group headquarters will give us the same container freight rate as bulk freight, even lower than bulk shipping fee, to support our expansion from bulk to container shipping, so as to transport more cargoes from the United States to China. In the first quarter, we cooperated with Guangxi Sinotrans Group for the first trial operation of bulk cargo container. During the quarter, we cooperated with another customer, Sichuan Minmetals Import and Export Company, for trial operation. Based on the two trial runs with positive response, we signed a service agreement with Chengdu Dingxu International Trade Co., Ltd. ("Chengdu Dingxu") to coordinate sulfur suppliers in the United States to supply 100,000 tons of America (the “US”)sulfur to Chengdu Dingxu on annual basis. Pursuant to the agreement, we will organize the shipping carriers, help customer to complete the duty and custom declaration and arrange transportation to the destination designated by Chengdu Dingxu. We will not take any title of any of their purchases and we will not take any inventory risks. We will be reimbursed by Chengdu Dingxu once our performance obligations are completed for the money we advanced on these purchases.
First Quarter 2018 Highlights
Sales in 2001, we are a shipping agency, logistics and ship management services company. Our current service offerings consist of shipping agency services, shipping and chartering services, inland transportation management services and ship management services. We conduct our business primarily through our wholly-owned subsidiariesthe three months ended September 30, 2017 increased by $3,435,609, or 176.7%, over the comparable period in China, Hong Kong, Australia, Canada and New York. Substantially all of our business is2016. The revenue generated from clients locatedthe U.S. increased from $1,807,113 in the People’s Republic of China (the “PRC”), and our operations are primarily conductedthree months ended September 30, 2016 to $2,352,163 in the PRC and Hong Kong.three months ended September 30, 2017. The increase was mainly due to:
| ● | According to our strategic plan in fiscal year 2017, we set our target to provide inland container trucking services and extend to other logistics services between the United States and China, and our new innovative profit model is to use the internet platform to perform the seamless connection for these kinds of services. |
| ● | The Company’s subsidiary, Trans Pacific Shanghai, began providing container trucking services in the second quarter of fiscal year 2017. In addition to the launch of our full-service logistics platform, Trans Pacific Shanghai signed a service agreement with Shanghai International Port (Group) Co. Ltd. to provide freight logistics services and container trucking services to end users, resulting in a significant increase in the subsidiary’s revenues for the three months ended September 30, 2017 as compared to the same period in 2016. |
| ● | In connection with the joint agreements signed with Sinotrans Guangxi Company and COSCO Shipping Lines Co., Ltd (Beijing) (formerly known as COSFRE Beijing) in the fourth quarter of fiscal year 2017, the Company has taken a leading position to finish a joint trial project with these two state-owned companies during first quarter of fiscal year 2018. The project involves a shift from the current bulk cargo transportation model to a containerized model. The Company has started a trial for the delivery of sulphur by containers from Long Beach, California, in the U.S., to Fangcheng Port, Guangxi, PRC and ultimately to the warehouse of the customer. During the three months ended September 30, 2017, approximately $0.50 million in service revenue was recognized under this business model and was included in the freight logistics services segment. This trial has laid a strong foundation for the Company to provide bulk cargo transport via containerized model for high volume cargo export from the U.S. to China. |
| ● | During the first quarter of fiscal 2018, the Company signed a service agreement with a Chinese trading company in the U.S. to complete a trial involving services on supply chain logistics from a factory in China to a warehouse in the U.S. This also established a strong basis for the Company to provide logistics services within the supply chain for cross-border electronic commerce from China to the U.S. in the future. |
| ● | On September 11, 2017, the Company established a wholly foreign owned enterprise (WFOE) in Ningbo City, China, named Ningbo Saimeinuo Supply Chain Management Co. Ltd. (Ningbo), which is owned by Sino-Global Shipping New York Inc. The new company’s business scope includes supply chain management. The purpose of establishing this WFOE was to obtain the government support in Ningbo in order to help the Company find a feasible profit model in assisting with cross-border e-commerce enterprises in Ningbo and providing logistics services in the U.S. over the whole supply chain from China to the U.S. Ningbo is one of fifteen pilot cities appointed by the Chinese Commerce Department for e-commerce model. The Chinese Commerce Department also invested funds in these fifteen pilot cities. We expect to promote our services over the supply chain to cross-border e-commerce companies in all fifteen pilot cities in China supported by Chinese government. |
Fiscal Year 2017 Highlights
Our subsidiarySales for the year ended June 30, 2017 increased by $4,135,073, or 56.6%, from $7,310,540 for the year ended June 30, 2016, to $11,445,613 for the comparable period in China, Trans Pacific Shipping Limited (“Trans Pacific Beijing”2017. The increase was mainly due to:
| ● | The Company’s subsidiary, Trans Pacific Shanghai, began providing container trucking services in the second quarter of fiscal year 2017. In addition to the launch of our full-service logistics platform, Trans Pacific Shanghai signed a service agreement with Shanghai International Port (Group) Co. Ltd., resulting in a significant increase in the subsidiary’s revenues. Trans Pacific Shanghai’s revenues generated by its container trucking services and revenues from freight logistic services were $573,341 and $2,964,226 for the year ended June 30, 2017, respectively. |
| ● | Pursuant to the Strategic Cooperation Agreement signed with COSCO Logistics (Americas) Inc. (“COSCO Logistics”), in July 2016, starting in the third quarter of fiscal year 2017, the Company’s subsidiary in Los Angeles, California began providing freight logistic services and container trucking services to COSCO Logistics. |
| ● | Pursuant to an agreement signed in December 2016, the Company and Jetta Global Logistics Inc. (“Jetta Global”) established ACH Trucking Center Corp. (“ACH Center”), a joint venture based in New York that provides trucking services. During the year ended June 30, 2017, ACH Center began to provide freight logistics services and container trucking services to COSCO Beijing International Freight Co., Ltd. (“COSFRE Beijing”) in the New York and New Jersey areas. |
| ● | As an extension of the two agreements the Company signed with Sinotrans Guangxi and COSFRE Beijing, Sino has signed joint project agreements with Sinotrans Guangxi and COSFRE Beijing during the fourth quarter of fiscal year 2017. The project will involve a shift from the current bulk cargo transportation model to a containerized model. The Company has started a trial by facilitating the delivery of Sulphur from Long Beach, California, in the U.S., to Fangcheng Port, Guangxi, PRC and ultimately to the warehouse of the customer. By the end of the fiscal year 2017, there was no revenue or cost of revenue recognized from this business model. Management expects the transportation of cargo via a containerized model to become a new business segment in incoming year. |
On February 16, 2017, the Company raised capital by issuing 1.5 million shares of common stock to three institutional investors at a wholly owned foreign enterprise, purchased and owns 90%purchase price of Trans Pacific Logistics Shanghai Limited (“Trans Pacific Shanghai,” and, together with Trans Pacific Beijing are referred to collectively herein as “Trans Pacific”). As PRC laws and regulations restrict foreign ownership of shipping agency service businesses, we previously provided shipping agency services in the PRC through Sino-Global Shipping Agency Ltd. (“Sino-China”), a Chinese legal entity, which holds the licenses and permits necessary to operate shipping agency services in the PRC. Trans Pacific Beijing and Sino-China do not have a parent-subsidiary relationship. Trans Pacific Beijing has contractual arrangements with Sino-China and its shareholders that enable us to substantially control Sino-China. Through Sino-China, we have the ability to provide shipping agency services in all commercial ports in the PRC. During fiscal year 2014, we completed a number of cost reduction initiatives and reorganized our shipping agency business in the PRC. As a result$3.18 per share. The aggregate gross proceeds of the business reorganizationsale to the Company totaled $4.77 million, and to improve our operating margin, we do not provide shipping agency services through Sino-China as of September 30, 2014.
Our shipping agency business is operated by our subsidiaries in Hong Kongnet proceeds after deducting offering expenses and Australia. As aplacement agent fees equaled approximately $4.3 million. The Company will use the funds for working capital and general shipping agent, we serve ships coming to and departing from a number of countries, including China, Australia, South Africa, Brazil and Canada. The shipping and chartering services are operated by Sino-Global Shipping (HK) Ltd; the inland transportation management services are operated by Trans Pacific Beijing. As part of our strategy to expand our service platform, in September 2014, as approved by our Board of Directors, we acquired Longhe Ship Management (Hong Kong) Co., Limited (“LSM”), a ship management company that is based in Hong Kong.corporate purposes.
Other 2017 Highlights:
| ● | In July 2016, the Company signed a Strategic Cooperation Agreement with COSCO Logistics, which is owned by the PRC’s largest integrated shipping company, China COSCO Holdings Company Ltd. Pursuant to the agreement, both parties will provide logistics services between the PRC and the U.S. and develop shipping customers as an end-to-end global logistics service. Starting in the third quarter of fiscal year 2017, the Company and COSCO Logistics began providing container trucking services on the west coast of the U.S. The Company expects to increase its cooperation with COSCO Logistics and to provide inland transportation services in the U.S. for shipments to and from the PRC. According to the agreement, the two companies will also assess locations in the U.S. to potentially establish warehouse and/or distribution facilities in the coming months and share pricing information for short-haul trucking services across selected regions of the U.S. |
| ● | In December 2016, the Company completed the development of its full-service logistics platform, and a website portal to seamlessly connect shipping customers with short-haul trucking transportation services throughout the U.S. is now accessible through the Company’s website. In connection with the new platform, the Company signed strategic cooperation agreements with one major Chinese shipping company, China Ocean Shipping Company (“COSCO”) (consisting of both COSFRE Beijing and COSCO Qingdao) in December 2016 and January 2017. We believe that the Company’s cooperation with COSCO will increase door-to-door short-haul trucking volumes and boost revenues from inland transportation services in the U.S. |
| ● | On April 20, 2017, the Company signed a Strategic Cooperation Agreement with Ningbo Xinyang Shipping Co., Ltd (“COSCO Xinyang”). This agreement with COSCO Xinyang is a continuation of the Company’s ongoing partnership with COSCO. Pursuant to the agreement with COSCO Xinyang, which is similar with the Company’s previously announced inland transportation agreements with COSCO; Sino-Global will receive a percentage of the total amount of each transportation fee for arranging inland transportation services for COSCO Xinyang’s container shipments into U.S. ports. The Company continues to work to expand its business to provide logistics services to customers who ship goods into the U.S. |
Fiscal year 2018 Trends
In fiscal year 2018, we will continue to focus on developing business to increase revenue and cash flow in the United States and continue to use bulk cargo containerized business between container shipping lines of the U.S. to China as the major part of our growth.
We will continue our cooperation with COSCO to promote bulk cargo container shipping. Our goal is to promote shipping of not only sulfur products but also other products that are in high demand in China, such as petroleum coke, alfalfa and DDGS. We expect to ship these bulk container products to reach 400-500 containers per month. Through the implementation of the bulk cargo container transport business, more smaller truck companies can be attracted to join our short-haul container truck online service platform, so that the online service platform can be improved and further upgraded and eventually become a peer-to peer online platform that connects truckers and customers.
Our main objective for the calendar year 2018 is to continuously increase our business in the U.S. and to enhance the core competitiveness of our company in its market sector. To achieve this, we plan to further integrate technology into our business model to yield additional benefits for the Company and our clients. With the aid of specialized technology, we aim to strengthen our profit margins even further and to create efficient profitable opportunities between our logistic service networks in the U.S. and China. Over the long run, we hope to revolutionize and lead the market segment in which we specialize through the precise matching of our clients’ needs with service providers.
In light of the COSCO container shipping route from the U.S. to China, and the rising demand in China for U.S. based products combined with COSCO's empty container shipments rate along these routes (U.S. to China unutilized shipments currently averages around 80-90%), another key objective for 2018 and into fiscal year 2019 is to assist COSCO in the widespread adoption of containerization. We intend to do this by continuing to build relationships and to partner with suppliers.
We have signed two agreements with leading suppliers for trial “bulk-to-container” runs, which were successfully completed, and have started the new calendar year with a significant purchase order that we expect will generate approximately $10 million in gross revenue for the Company. By leveraging our platform and relationships, we believe we can utilize an online-driven platform to take advantage of this trade imbalance on behalf of our primary customers.
Business SegmentsResults of Operations
Fiscal Year Ended June 30, 2017 Compared to Fiscal Year Ended June 30, 2016
We currently deliver
Revenues
Total revenues increased by $4,135,073, or 56.6%, from $7,310,540 for the following services:year ended June 30, 2016 to $11,445,613 for the comparable period in 2017. This increase was primarily due to the Company’s efforts to diversify its business in the inland transportation management, freight logistic, and container trucking services, resulting in an increase in revenues since the first and second quarters of fiscal year 2017. The increase was partially offset by the decreased revenue from shipping agency and ship management services sector due to the decrease in the number of ships served, and the decreased revenue from our shipping and chartering services and inland transportation management services. Historically we were insector as a result of the businesstermination of solely providing shipping agency services. With the support of our largest shareholder, Mr. Zhong Zhang and the company he controls, Tianjin Zhi Yuan Investment Group Co., Ltd. (the “Zhiyuan Investment Group”), we expanded our service platform during fiscal year 2014 to include shipping and chartering services (launched during the quarter ended September 30, 2013) and inland transportation management services (launched during the quarter ended December 31, 2013). With the LSM acquisition, we added ship management services to our service platform in September 2014. a planned vessel acquisition.
The following table presentstables present summary information by segment for the three months ended September 30, 2014 and 2013:
| | | For the Three Months Ended September 30, 2014 | | | For the Three Months Ended September 30, 2013 | |
| | | Shipping
Agency and
Ship
Management
Services | | | Shipping
and
Chartering
Services | | | Inland
Transportation
Management
Services | | | Consolidated | | | Shipping
Agency and
Ship
Management
Services | | | Shipping and
Chartering
Services | | | Inland
Transportation
Management
Services | | | Consolidated | |
| Revenues | | $ | 1,659,291 | | | | - | | | $ | 946,634 | | | $ | 2,605,925 | | | $ | 1,430,661 | | | $ | 1,887,000 | | | | - | | | $ | 3,317,661 | |
| Cost of revenues | | $ | 1,283,505 | | | | - | | | $ | 125,648 | | | $ | 1,409,153 | | | $ | 1,112,803 | | | $ | 1,275,000 | | | | - | | | $ | 2,387,803 | |
| Gross profit | | $ | 375,786 | | | | - | | | $ | 820,986 | | | $ | 1,196,772 | | | $ | 317,858 | | | $ | 612,000 | | | | - | | | $ | 929,858 | |
| Gross margin | | | 22.6 | % | | | - | | | | 86.7 | % | | | 45.9 | % | | | 22.2 | % | | | 32.4 | % | | | - | | | | 28.0 | % |
The following table presents summary information by segment for the fiscal years ended June 30, 20142017 and 2013:2016:
| | | For the Year Ended June 30, 2014 | | | For the Year Ended June 30, 2013 | |
| | | Shipping
Agency Service | | | Shipping and
Chartering
Services | | | Inland
Transportation
Management
Services | | | Consolidated | | | Shipping
Agency Service | | | Shipping and
Chartering
Services | | | Inland
Transportation
Management
Services | | | Consolidated | |
| Revenues | | $ | 7,523,983 | | | $ | 1,937,196 | | | $ | 2,183,213 | | | $ | 11,644,392 | | | $ | 17,331,759 | | | $ | - | | | $ | - | | | $ | 17,331,759 | |
| Cost of revenues | | $ | 6,010,058 | | | | 1,291,048 | | | $ | 312,353 | | | $ | 7,613,459 | | | $ | 15,402,743 | | | $ | - | | | $ | - | | | $ | 15,402,743 | |
| Gross profit | | $ | 1,513,925 | | | | 646,148 | | | $ | 1,870,860 | | | $ | 4,030,933 | | | $ | 1,929,016 | | | $ | - | | | $ | - | | | $ | 1,929,016 | |
| Gross margin | | | 20.1 | % | | | 33.4 | % | | | 85.7 | % | | | 34.6 | % | | | 11.1 | % | | | - | | | | - | | | | 11.1 | % |
| | | For the year ended June 30, 2017 | |
| | | Shipping Agency
and Ship
Management
Services | | | Shipping and
Chartering
Services | | | Inland
Transportation
Management
Services | | | Freight
Logistic
Services | | | Container
Trucking
Services | | | Total | |
| Revenues | | | | | | | | | | | | | | | | | | |
| - Related party | | $ | - | | | $ | - | | | $ | 2,746,423 | | | $ | - | | | $ | - | | | $ | 2,746,423 | |
| - Third parties | | $ | - | | | $ | - | | | $ | 3,012,177 | | | $ | 4,815,450 | | | $ | 871,563 | | | $ | 8,699,190 | |
| Cost of revenues | | $ | - | | | $ | - | | | $ | 620,259 | | | $ | 3,710,364 | | | $ | 649,968 | | | $ | 4,980,591 | |
| Gross profit | | $ | - | | | $ | - | | | $ | 5,138,341 | | | $ | 1,105,086 | | | $ | 221,595 | | | $ | 6,465,022 | |
| GM% | | | - | % | | | - | % | | | 89.2 | % | | | 22.9 | % | | | 25.4 | % | | | 56.5 | % |
| | | For the year ended June 30, 2016 | |
| | | Shipping Agency
and Ship
Management
Services | | | Shipping and
Chartering
Services | | | Inland
Transportation
Management Services | | | Total | |
| Revenues | | | | | | | | | | | | |
| - Related party | | $ | - | | | $ | - | | | $ | 2,269,346 | | | $ | 2,269,346 | |
| - Third parties | | $ | 2,507,800 | | | $ | 462,218 | | | $ | 2,071,176 | | | $ | 5,041,194 | |
| Cost of revenues | | $ | 2,175,109 | | | $ | 212,510 | | | $ | 1,350,370 | | | $ | 3,737,989 | |
| Gross profit | | $ | 332,691 | | | $ | 249,708 | | | $ | 2,990,152 | | | $ | 3,572,551 | |
| GM % | | | 13.3 | % | | | 54.0 | % | | | 68.9 | % | | | 48.9 | % |
Revenues
(1) Revenues from Shipping Agency and Ship Management Services
| · | Shipping Agency Services |
We provide two types ofFor the years ended June 30, 2017 and June 30, 2016, our revenues generated from the shipping agency services: loading/discharging servicessegment were nil and protective services. For protective$2,507,800, respectively. As the Company has stated in its previous annual report for the fiscal year ended June 30, 2016, management decided to suspend the shipping agency services we charge fixed fees while our customers are responsible forbecause the payment of port costs and expenses. For loading/discharging agency services, we receive the total amount from our customers and pay the port charges on our customers’ behalf. Under these circumstances, we generally require paymentsshipping industry is experiencing a downturn. The decline in advance from customers and bill them the balances within 30 days after the transactions are completed. We believe the most significant factors that directly or indirectly affect our shipping agencyrevenues in this service revenues are:
| ¨ | the number of ships to which we provide port loading/discharging services; |
| ¨ | the size and types of ships we serve; |
| ¨ | the type of services we provide, for example loading/discharging, protective, owner’s affairs, shipping and chartering service; |
| ¨ | the rate of service fees we charge; |
| ¨ | the number of ports at which we provide services; and |
| ¨ | the number of customers we serve. |
For the three months ended September 30, 2014 and 2013, our shipping agency revenues were $1,611,704 and $1,430,661, respectively. The revenue increasesector was due mainly to the increasethis suspension. As a result, there was a decrease in the total number of ships wethe Company served - from 6419 ships for the three monthsyear ended SeptemberJune 30, 20132016 to 70nil for the same period in 2014.
| | | For the three months ended September 30, | |
| | | 2014 | | | 2013 | | | Change | | | % | |
| Number of ships served | | | | | | | | | | | | | | | | |
| Loading/discharging | | | 15 | | | | 14 | | | | 1 | | | | 7.1 | |
| Protective | | | 55 | | | | 50 | | | | 5 | | | | 10.0 | |
| Total | | | 70 | | | | 64 | | | | 6 | | | | 9.4 | |
During fiscal year 2014,ended June 30, 2017. Our decision to suspend our shipping agency business continued to be negatively impacted, we believe, by the softening of the Chinese economy and its import ofwas based on reduced market demand for imported iron ore as well as the decline in the number of ships to which we provided loading/discharging agency services and protective agency service. Moreover, during our fiscal year 2014, we completed a number of cost reduction initiatives and reorganized our shipping agency business in China. As a result of an across-the-board general economic slow-down, decreased manufacturing activities, rising labor costs in the above factors includingPRC and intense competition in the exit fromshipping industry with established and new competitors offering rates that in many cases are lower than the rates we can offer. Rising labor costs and increased overhead costs also reduced our non-performing service arrangements including ourprofitability in this segment. However, we plan to resume providing shipping agency service relationship with Shourong, ourservices once the shipping agency revenues decreasedindustry outlook turns positive.
We did not generate any revenue from $17.3 millionproviding ship management services for fiscal year 2013 to $7.5 million for fiscal year 2014. In addition, the number of ships we served decreased from 438 to 312 for the fiscal years ended June 30, 20132017 and 2014, respectively.
| | | For the years ended June 30, | |
| | | 2014 | | | 2013 | | | Change | | | % | |
| Number of ships served | | | | | | | | | | | | | | | | |
| Loading/discharging | | | 60 | | | | 161 | | | | (101 | ) | | | (62.7 | ) |
| Protective | | | 252 | | | | 277 | | | | (25 | ) | | | (9.0 | ) |
| Total | | | 312 | | | | 438 | | | | (126 | ) | | | (28.8 | ) |
Historically, our revenues have been primarily driven by2016 as management decided to suspend the number of ships and customers we serve, provided that the service fees are determined by market competition. To stabilize our shipping agency business, we have shifted our focus to protective agency services, initiated actions to streamline our operations and reduce our overhead.
| · | Ship Management Services |
On September 8, 2014, we acquired LSM, a ship management services company based in Hong Kong from Mr. Deming Wang. LSM currently manages seven vessels and outsourcesbusiness segment at the actual ship management duties (which include among other things, crew, technical and insurance arrangements) to Qingdao Longhe Ship Management Services Co., Ltd., a company controlled by Mr. Deming Wang. The ship management services generated revenuesbeginning of $47,587 from September 8, 2014 to September 30, 2014.fiscal year 2016.
As we acquired LSM following the end of the fiscal year 2014, we did not generate any revenues from our ship management services during fiscal 2014.
(2) Revenues from Shipping and Chartering Services
During September 2013, we executed aIn connection with the termination of the acquisition of Rong Yao International Shipping Limited (“Rong Yao”) on December 7, 2015, the Company realigned its development strategy and temporarily suspended its shipping and chartering services. As a result, we reported nil and $462,218 in revenue from this segment for the years ended June 30, 2017 and 2016, respectively.
Temporary suspension of the two above business sectors are not treated as discontinued operations since management believes they will continue to operate through these segments once the shipping business market recovers and the overall economy improves. Management is still actively identifying new potential relationships with targets for generating ship management service agreement withrevenue, as well as developing the Zhiyuan Investment Groupwhereby weshipping agency sales network. The Company has also retained the employees who previous handled the business in relation to these two sectors. Although there is no current revenue from these two business sectors, the employees who previously were engaged to assistemployed in the shipping agency and ship management business currently participate in the organization and development of inland transportation of approximately 51,000 tons of chromite ore from South Africa to China. The service agreement withmanagement services, freight logistics services and container trucking services. Once the Zhiyuan Investment Group resulted in revenues of approximately $1.90 millionshipping agency and gross profit of approximately $0.60 million for the three months ended September 30, 2013, which also reflected the revenuesship management services and gross profit from our shipping and chartering services restarts again, the employees who previously worked for fiscal 2014.We did not provide any shipping and charteringthese sectors will revert to their previous positions to service to the Zhiyuan Investment Group or any other customers in the three months ended September 30, 2014.theses business segments.
(3) Revenues from Inland Transportation Management Services
In September 2013, wethe Company executed an inland transportation management service contract with the Zhiyuan Investment Group, a related party, whereby we wouldthe Company agreed to provide certain advisory servicessolutions to help control the potential loss of commodities loss during the transportation process. We did not reportThe Company also began providing inland transportation management services to a third-party customer, Tengda Northwest, following the quarter ended September 2014. As a result, for the years ended June 30, 2017 and 2016, inland transportation management services revenue generated from related-party was $2,746,423 and $2,269,346, respectively, and revenue generated from third-party was $3,012,177 and $2,071,176, respectively. For the years ended June 30, 2017 and 2016, gross profits from inland transportation management serviceservices amounted to $5,138,341 and $2,990,152, respectively.
The increase in total revenues from this segment foris due to the three months ended September 30, 2013 because we only started providing such services toincrease in the amount of commodities transported through both Zhiyuan Investment Group inand Tengda Northwest. For Tengda Northwest, the three monthsservice fee was RMB 32 per ton. Transported quantities were 648,739 tons for the year ended December 31, 2013.June 30, 2017 compared to 365,104 tons for the year ended June 30, 2016. For Zhiyuan Investment Group, the three monthsservice fee was RMB 38 per ton. Transported quantities were 498,210 tons for the year ended SeptemberJune 30, 2014, our inland transportation management services generated revenues of approximately $0.95 million and gross profit of approximately $0.82 million.2017 compared to 442,757 tons for the year ended June 30, 2016.
InlandOverall gross margin for this segment increased to 89.2% for the year ended June 30, 2017 from 68.9% for the year ended June 30, 2016. The increase in gross margin is mainly due to:
| 1) | Increased efficiency: When the Company takes in a new customer in this segment, the majority of the costs are incurred upfront when the Company uses its professional expertise to assist the customer in setting up efficient and sound procedures and policies to minimize losses in the transportation process. Once the process is set up, marginal cost is needed as the Company is only required to spend labor costs to monitor and improve the operation process and handling specific issues as needed. The component of the costs associated with inland transportation management services is primarily the salaries of the employees who are assigned to maintain the transportation services. The logistic transportation fees made directly by the end customers to the logistics companies. During the door-to-door transportation progress, the assigned personnel will monitor the progress of transportation, coordinate with the logistics companies and warehouses in order for the products to be transported safely to the agreed destination. The Company has been providing such business services since 2014. Throughout the three years of development, the employees familiarized with the tasks in providing such services and the Company’s network with those logistics companies has matured. The Company has also become more effective and efficient in handling such business. During the year ended June 30, 2017, only two employees in Beijing and Hong Kong were authorized by management in Company headquarters to spend a limited number of hours per day handling inland transportation services. For the same period in 2016, a greater number of employees were assigned to work on such services. The cost of revenues for providing inland transportation management services are measured based on the number of hours allocated to perform such services. As the number of employees assigned for the services decreased and the hours assigned for each employee per day also decreased, the total hours related to perform such services decreased accordingly, which led to the significant decrease in cost of revenues. |
| 2) | Increased transportation volume: Due to the increase of price in Chrome ore and Chrome iron in the commodity market, our customers have increased demand for shipments resulting increased transportation volume we managed. As discussed above, no substantial costs were incurred to handle the extra volume; economies of scale led to further increases of our gross margin. |
(4) Revenues from Freight Logistic Services
Since we formed our new subsidiary, Sino-Global Shipping LA, Inc., in January 2016, we began providing freight logistic services, including cargo forwarding and truck transportation managementservices. During the year ended June 30, 2017, the portion of revenues generated from freight logistic services has increased significantly, and the Company presents the related revenue as a separate business segment. The Company has signed agreements with non-related parties, LJC Trading New York Ltd. and Zhiyuan (Hong Kong) Chromium Group Co., to provide freight logistic services.
Pursuant to the strategic cooperation agreement with COSCO Logistics, signed in July 2016, Sino-Global Shipping LA, Inc. began to provide logistic services to COSCO Logistics beginning the third quarter of fiscal year 2017. These services include cargo forwarding, trucking and customs declaration and filings.
In the third quarter of fiscal year 2017, the Company entered into an agreement with COSFRE Beijing, pursuant to which the Company formed a new joint venture company, ACH Trucking Center, with Jetta Global to provide short-haul trucking transportation and freight logistics services to customers located in the New York and New Jersey areas. Benefitting from the Company’s new logistics platform, strategic cooperation with COSCO Logistics and the new joint venture, revenue generated revenues of approximately $2.2 millionfrom freight logistic services was $4,815,450, and the related gross profit was $1,105,086 for the year ended June 30, 2017.
(5) Revenues from Container Trucking Services
Since we completed our website version of approximately $1.9forshort distance container truck service platform in December 2016, we began to generate revenue from short distance trucking and containers services through the service platform and presents this as a new segment, “Container Trucking Services” beginning in the second quarter of 2017. Since the second quarter of fiscal year 2014.
2017, the Company has provided container trucking services in the PRC, and began to provide related services in the U.S. beginning in the third quarter of fiscal year 2017. This new business segment is based on a modified and improved version of our freight logistics services business segment. For the year ended June 30, 2017, revenue generated from container trucking services was $871,563 and the related gross profit was $221,595.
Operating Costs and Expenses
OurTotal operating costs and expenses consist of cost of revenues,decreased by $215,336 or 2.5%, from $8,559,767 for the year ended June 30, 2016 to $8,344,431 for the year ended June 30, 2017. This decrease was primarily due to the decrease in general and administrative expenses and selling expenses. As a resultexpenses partially offset by the increase in cost of a change in service mix year over year toward lower cost services, we were able to reduce our total operating costs and expenses by approximately $930,000 for the three months ended September 30, 2014revenues as compared to the same period of 2013.discussed below.
The following tables settable sets forth the components of ourthe Company’s costs and expenses for the periods indicated.
indicated:
| | | For the three months ended September 30, | |
| | | 2014 | | | 2013 | | | Change | |
| | | US$ | | | % | | | US$ | | | % | | | US$ | | | % | |
| | | | | | | | | | | | | | | | | | | |
| Revenues | | | 2,605,925 | | | | 100.0 | % | | | 3,317,661 | | | | 100.0 | % | | | (711,736 | ) | | | -21.5 | % |
| Cost of revenues | | | 1,409,153 | | | | 54.1 | % | | | 2,387,803 | | | | 72.0 | % | | | (978,650 | ) | | | -41.0 | % |
| Gross margin | | | 45.9 | % | | | | | | | 28.0 | % | | | | | | | 17.9 | % | | | | |
| | | | | | | | | | | | | | | | | | | | | | | | | |
| General and administrative expenses | | | 939,805 | | | | 36.1 | % | | | 896,164 | | | | 27.0 | % | | | 43,641 | | | | 4.9 | % |
| Selling expenses | | | 56,339 | | | | 2.2 | % | | | 51,088 | | | | 1.5 | % | | | 5,251 | | | | 10.3 | % |
| Total Costs and Expenses | | | 2,405,297 | | | | 92.3 | % | | | 3,335,055 | | | | 100.5 | % | | | (929,758 | ) | | | -27.9 | % |
As a result of factors discussed elsewhere in this prospectus, we reduced our total operating costs and expenses by approximately $8.2 million for fiscal year 2014 as compared to the same period of 2013.
| | | For the years ended June 30, | |
| | | 2017 | | | 2016 | | | Change | |
| | | US$ | | | % | | | US$ | | | % | | | US$ | | | % | |
| | | | | | | | | | | | | | | | | | | |
| Revenues | | | 11,445,613 | | | | 100.0 | % | | | 7,310,540 | | | | 100.0 | % | | | 4,135,073 | | | | 56.6 | % |
| Cost of revenues | | | 4,980,591 | | | | 43.5 | % | | | 3,737,989 | | | | 51.1 | % | | | 1,242,602 | | | | 33.2 | % |
| Gross margin | | | 56.5 | % | | | | | | | 48.9 | % | | | | | | | 7.6 | % | | | | |
| | | | | | | | | | | | | | | | | | | | | | | | | |
| General and administrative expenses | | | 3,152,336 | | | | 27.5 | % | | | 4,346,159 | | | | 59.5 | % | | | (1,193,823 | ) | | | (27.5 | )% |
| Selling expenses | | | 211,504 | | | | 1.8 | % | | | 475,619 | | | | 6.5 | % | | | (264,115 | ) | | | (55.5 | )% |
| Total Costs and Expenses | | | 8,344,431 | | | | 72.8 | % | | | 8,559,767 | | | | 117.1 | % | | | (215,336 | ) | | | (2.5 | )% |
The following tables set forth the componentsCosts of our costs and expenses for the periods indicated.
Revenues
| | | For the years ended June 30, | |
| | | 2014 | | | 2013 | | | Change | |
| | | US$ | | | % | | | US$ | | | % | | | US$ | | | % | |
| Revenues | | | 11,644,392 | | | | 100.0 | % | | | 17,331,759 | | | | 100.0 | % | | | (5,687,367 | ) | | | -32.8 | % |
| Cost of revenues | | | 7,613,459 | | | | 65.4 | % | | | 15,402,743 | | | | 88.9 | % | | | (7,789,284 | ) | | | -50.6 | % |
| Gross margin | | | 34.6 | % | | | | | | | 11.1 | % | | | | | | | 23.5 | % | | | | |
| | | | | | | | | | | | | | | | | | | | | | | | | |
| General and administrative expenses | | | 3,470,669 | | | | 29.8 | % | | | 3,878,569 | | | | 22.4 | % | | | (407,900 | ) | | | -10.5 | % |
| Selling expenses | | | 260,134 | | | | 2.2 | % | | | 253,987 | | | | 1.5 | % | | | 6,147 | | | | 2.4 | % |
| Total Costs and Expenses | | | 11,344,262 | | | | 97.4 | % | | | 19,535,299 | | | | 112.8 | % | | | (8,191,037 | ) | | | -41.9 | % |
OurCost of revenues was $4,980,591 for the year ended June 30, 2017, an increase of $1,242,602, or 33.2%, as compared to $3,737,989 for the year ended June 30, 2016. The overall cost of revenues as a percentage of our revenues decreased from 72.0%51.1% for the three monthsyear ended SeptemberJune 30, 20132016, to 54.1%43.5% for the three monthsyear ended SeptemberJune 30, 2014.2017. The decrease wasin the overall costs of revenues in percentage terms for the year ended June 30, 201 7is due mainly to the change in our service mix. Forfact that the three months ended September 31, 2014,majority of our revenues during the year ended June 30, 2017 came mainlyfrom the more profitable inland transportation services and freight logistics services rather than the less profitable shipping agency service sector. Since revenue from shipping agency services and inland transportation management services. However, for the same period in 2013, our revenues came mainly from shipping agency services and shipping and chartering services. The decline in our overall cost of revenues was due mainlyhas been decreased to the nature of ournil, inland transportation management services that feature lower overhead thanand freight logistic services are now considered to be our shippingessential revenue sources.
General and chartering services.Administrative Expenses
As a result of factors discussed elsewhere in this prospectus, our overall cost of revenues as a percentage of our total revenues decreased from 88.9% to 65.4% for fiscal years 2013 and 2014, respectively. Likewise, our gross margin increased from 11.1% to 34.6% for fiscal years 2013 and 2014, respectively. The improvement in our overall gross margin was due mainly to our cost reduction measures undertaken as part of our restructuring and the launch of the shipping and chartering service and the inland transportation management services during the first half of fiscal year 2014, as these new business segments feature lower overhead than our core shipping agency business.
| · | General and Administrative Expenses |
Our general and administrative expenses consist primarily of salaries and benefits, business development, office rental, meetingrent, office expenses, regulatory filing and listing fees, amortization of stock-based compensation expenses, legal, accounting and other professional services.service fees. For the year ended June 30, 2017, we had $3,152,336 of general and administrative expenses, as compared to $4,346,159 for the year ended June 30, 2016, a decrease of $1,193,823, or 27.5%. The decrease was mainly due to decreased stock-based compensation for common stock issued to consultants, decreased stock compensation for management, a recovery on allowance for doubtful accounts, and fewer legal fees incurred during the year ended June 30, 2017 compared to the corresponding period in 2016. As a result of the substantial reduction in general and administrative expenses and the increase in revenues, our general and administrative expenses, as a percentage of revenue, decreased from 59.5% for the year ended June 30, 2016 to 27.5% for the corresponding period in 2017.
Selling Expenses
The Company’s selling expenses consist primarily of business development costs and salaries and commissions for our operating staff at the ports at which we provide services. For the year ended June 30, 2017, we had $211,504 of selling expenses as compared to $475,619 for the year ended June 30, 2016, a decrease of $264,115, or 55.5%. The decrease was mainly attributable to the suspension of shipping agency services during the year ended June 30, 2017. No salaries and commissions were made for the operating staff at the ports. On the other hand, the Company clarified responsibilities for the sales personnel and centralized major sales activities functions in our headquarters in order to decrease selling expenses incurred in different subsidiaries in 2016. As a percentage of revenue, our selling expenses decreased from 6.5% for the year ended June 30, 2016, to 1.8% for the corresponding period in 2017.
Operating Income (Loss)
The Company had an operating income of $3,101,182 for the year ended June 30, 2017, compared to an operating loss of $1,249,227 for the comparable period ended June 30, 2016. The increase was mainly due to increased revenue generated from inland transportation management services and freight logistic services with strong gross profit contributions, and the significant decline in general and administrative expenses and selling expenses discussed above.
Financial Income (Expense), Net
The Company’s net financial income was $30,278 for the year ended June 30, 2017, compared to net financial expense of $247,530 for the same period of 2016. We have operations in the U.S., Canada, Australia, Hong Kong and the PRC, and our financial income (expenses) for the years ended June 30, 2017 and 2016 mainly reflects the foreign currency transaction income expressed in USD.
Taxation
The Company’s income tax benefit was $472,084 for the year ended June 30, 2017, compared to an income tax expense of $812,593 for the year ended June 30, 2016. During the year ended June 30, 2017, the amount of net operating loss (“NOL”) utilized was $1,853,000 and the tax benefit derived from such NOL was $630,000; in the corresponding period for the year ended June 30, 2016, the utilization of NOL was nil and no tax benefit was derived from NOL. During the year ended June 30, 2017, the Company provided an allowance against the deferred tax assets based on the Company’s projected taxable income and resulted in a net deferred tax asset of approximately $749,000; in the corresponding period of 2016, the Company provided a 100% valuation allowance against the deferred tax assets and no tax benefit was derived therefrom. The decrease in income tax expense was also attributable to a decrease in the taxable income of Trans Pacific during the year ended June 30, 2017 in comparison to the same period in 2016.
Net Income (Loss)
As a result of the foregoing, the Company had a net income of $3,603,544 for the year ended June 30, 2017, compared to a net loss of $2,301,522 for the year ended June 30, 2016. After the deduction of non-controlling interest, net income attributable to Sino-Global was $3,624,892 for the year ended June 30, 2017; for the year ended June 30, 2016, the Company had a net loss of $1,965,929. Comprehensive income attributable to the Company was $3,491,235 for the year ended June 30, 2017, compared to a comprehensive loss of $2,338,268 for the year ended June 30, 2016.
The Three Months Ended December 31, 2017 Compared to the Three Months Ended December 31, 2016
Revenues
Revenues increased by approximately $44,000$3,091,933, or 145.3%, from $2,128,548 for the three months ended December 31, 2016 to $5,220,481 for the comparable period in 2017. This increase was primarily due to the Company’s efforts to diversify its business in freight logistics services. The revenues generated from freight logistics services increased by $3,079,257, or 595.5%, from $517,066 for the three months ended December 31, 2016 to $3,596,323 for the comparable period in 2017.
This quarter we ended our joint venture with Jetta Global on ACH Trucking Center and created a new segment for bulk cargo container services; see more discussion in the related segments below.
The following tables present summary information by segment for the three months ended December 31, 2017 and 2016:
| | | For the three months ended December 31, 2017 | |
| | | Inland
Transportation
Management
Services | | | Freight Logistics Services | | | Container Trucking Services | | | Bulk Cargo Container Services | | | Total | |
| Revenues | | | | | | | | | | | | | | | |
| - Related party | | $ | 555,246 | | | $ | - | | | $ | - | | | $ | - | | | $ | 555,246 | |
| - Third parties | | $ | 838,595 | | | $ | 3,596,323 | | | $ | 126,865 | | | $ | 103,452 | | | $ | 4,665,235 | |
| Total revenues | | $ | 1,393,841 | | | $ | 3,596,323 | | | $ | 126,865 | | | $ | 103,452 | | | $ | 5,220,481 | |
| Cost of revenues | | $ | 174,025 | | | $ | 3,108,195 | | | $ | 49,848 | | | $ | 43,810 | | | $ | 3,375,878 | |
| Gross profit | | $ | 1,219,816 | | | $ | 488,128 | | | $ | 77,017 | | | $ | 59,642 | | | $ | 1,844,603 | |
| GM% | | | 87.5 | % | | | 13.6 | % | | | 60.7 | % | | | 57.7 | % | | | 35.3 | % |
| | | For the three months ended December 31, 2016 | |
| | | Inland Transportation Management Services | | | Freight Logistic Services | | | Container Trucking Services | | | Bulk Cargo Container Services | | | Total | |
| Revenues | | | | | | | | | | | | | | | |
| - Related party | | $ | 616,924 | | | $ | - | | | $ | - | | | $ | - | | | $ | 616,924 | |
| - Third parties | | $ | 834,679 | | | $ | 517,066 | | | $ | 159,879 | | | $ | - | | | $ | 1,511,624 | |
| Total revenues | | $ | 1,451,603 | | | $ | 517,066 | | | $ | 159,879 | | | $ | - | | | $ | 2,128,548 | |
| Cost of revenues | | $ | 87,800 | | | $ | 167,035 | | | $ | 95,961 | | | $ | - | | | $ | 350,796 | |
| Gross profit | | $ | 1,363,803 | | | $ | 350,031 | | | $ | 63,918 | | | $ | - | | | $ | 1,777,752 | |
| GM% | | | 94.0 | % | | | 67.7 | % | | | 40.0 | % | | | - | | | | 83.5 | % |
(1) Revenues from Inland Transportation Management Services
In September 30, 20142013, the Company executed an inland transportation management service contract with Zhiyuan Investment Group, a related party, whereby the Company agreed to provide certain solutions to help control the potential loss of commodities during the transportation process. The Company also began providing inland transportation management services to a third-party customer, Tengda Northwest, following the quarter ended September 2014. The fluctuation in revenue from this segment is due to the change in the quantities of commodities transported by both Zhiyuan Investment Group and Tengda Northwest.
For Tengda Northwest, the service fee charge was RMB 32 per ton. For Zhiyuan Investment Group, the service fee charge was RMB 38 per ton.
Revenue from the inland transportation management services segment decreased $57,762 from $1,451,603 for the three months ended December 31, 2016 to $1,393,841 for the three months ended December 31, 2017. Revenue from related party customers decreased $61,678 from $616,924 for the three months ended December 31, 2016 to $555,246 for the three months ended December 31, 2017 since the transported quantities decreased from 112,000 tons to 97,489 tons. Revenue from third party customers increased $3,916 from $834,679 for the three months ended December 31, 2016 to $838,595 for the three months ended December 31, 2017. The increase was primarily due to the depreciation of USD against RMB from 6.8328 for the three months ended December 31, 2016 to 6.6153 for the corresponding period in 2017.
For the three months ended December 31, 2017 and 2016, gross profit from inland transportation management services amounted to $1,219,816 and $1,363,803, respectively.
Overall gross margins for this segment decreased to 87.5% for the three months ended December 31, 2017 from 94.0% for the three months ended December 31, 2016. The decrease of gross margins in the current quarter was due to the change of product mix with different service fees per ton.
(2) Revenues from Freight Logistics Services
Since we formed our new subsidiary, Sino-Global Shipping LA, Inc., in January 2016, we began to provide freight logistics services, including cargo forwarding and truck transportation services. Since the revenue increased significantly for providing such services from period to period, the Company has presented the related revenue as a separated business segment since the first quarter of 2017 fiscal year.
During the three months ended December 31, 2017, the portion of revenues generated from freight logistics services has increased significantly. The increase was primarily due to increased orders from one of our clients, BAO-NYK Shipping PTE. Ltd. (“BAO-NYK”), during the current period, as compared to $nil in the corresponding period in 2016. The gross margin decreased to 13.6% from 67.7%, primarily due to the changing variety of services provided between the current period and the corresponding period in 2016. Every single business of freight logistics services has a unique gross margin according to a different service scope. Usually, a business in full-scale scope has a higher gross margin, and business with fragmented scope has a lower gross margin. Our fragmented scope business increased significantly, such as revenue from BAO-NYK, and contributed a much higher portion of revenue in this sector than full-scale businesses, as compared to the prior period.
The revenue generated from freight logistics services was $3,596,323, and the related gross profit was $488,128 for the three months ended December 31, 2017. For the three months ended December 31, 2016, the revenue generated from freight logistics services was $517,066, and the related gross profit was $350,031.
(3) Revenues from Container Trucking Services
Since we completed our web-based short-haul container truck service platform in December 2016, we began generating revenue from short-haul trucking and containers services through the service platform and introduced this Container Trucking Services as a new segment in the second quarter of 2017. Since the second quarter of the fiscal year 2017, the Company has provided container trucking services in the PRC regions and, as of the third quarter of the fiscal year 2017, has begun to provide related services in certain U.S. regions. This new business segment is based on a modified and improved version of our freight logistics services business segment.
On January 5, 2017, we entered into a joint venture agreement and formed a new joint venture company named ACH Trucking Center Corp. (“ACH Center”) with Jetta Global Logistics Inc. (“Jetta Global”). Along with the establishment of ACH Center, we began providing short haul trucking transportation and logistics services to customers located in the New York and New Jersey areas. We hold a 51% ownership stake in ACH Center. Although the establishment of ACH Center brought benefits for us and Jetta Global, it could not satisfy long term development for both us and Jetta Global. We signed a termination agreement with Jetta Global to terminate the joint venture agreement on December 4, 2017. As ACH center’s operating revenue was less than 1% of our consolidated revenue and the termination did not constitute a strategic shift that will have a major effect on our operations and financial results, the results of operations for ACH Center were not reported as discontinued operations. For the three months ended December 31, 2017, revenue from container trucking services decreased by $33,014 from $159,879 for the three months ended December 31, 2016, to $126,865. The decrease was primarily due to the termination of our joint venture agreement with Jetta Global.
(4) Revenues from Bulk Cargo Container Services
For the three months ended December 31, 2017, we shipped 120 containers with 18 tons per container of sulfur from Long Beach, CA in the U.S. to our customers in China. The arrangement included coordinating the customer to sign the purchase contract with sulfur suppliers in the United States, organizing the container shipping, custom clearance; all have been fulfilled when we shipped the product to our customer’s designated port, Qingdao PRC. For the three months ended December 31, 2017, gross revenue generated from bulk cargo container services was $103,452 and the related cost was $43,810 with gross profit of $59,642 or 57.7%. We were the agent in this transaction as we did not take any inventory risk; we reported revenue on a net basis less the cost of sulfur. Due to the integrated and value added services we provide to our customers, the average gross profit was higher than freight logistics.
Operating Costs and Expenses
Operating costs and expenses increased by $4,364,198 or 371.8%, from $1,173,955 for the three months ended December 31, 2016 to $5,538,153 for the three months ended December 31, 2017. This increase was primarily due to the increase in the cost of revenue, general and administrative expense and selling expenses, as discussed below.
The following table sets forth the components of the Company’s costs and expenses for the periods indicated:
| | | For the three months ended December 31, | |
| | | 2017 | | | 2016 | | | Change | |
| | | US$ | | | % | | | US$ | | | % | | | US$ | | | % | |
| | | | | | | | | | | | | | | | | | | |
| Revenues | | | 5,220,481 | | | | 100.0 | % | | | 2,128,548 | | | | 100.0 | % | | | 3,091,933 | | | | 145.3 | % |
| Cost of revenues | | | 3,375,878 | | | | 64.7 | % | | | 350,796 | | | | 16.5 | % | | | 3,025,082 | | | | 862.3 | % |
| Gross margin | | | 35.3 | % | | | | | | | 83.5 | % | | | | | | | (48.2 | )% | | | | |
| | | | | | | | | | | | | | | | | | | | | | | | | |
| General and administrative expenses | | | 1,827,014 | | | | 35.0 | % | | | 776,284 | | | | 36.5 | % | | | 1,050,730 | | | | 135.4 | % |
| Selling expenses | | | 335,261 | | | | 6.4 | % | | | 46,875 | | | | 2.2 | % | | | 288,386 | | | | 615.2 | % |
| Total Costs and Expenses | | | 5,538,153 | | | | 106.1 | % | | | 1,173,955 | | | | 55.2 | % | | | 4,364,198 | | | | 371.8 | % |
Costs of Revenues
Cost of revenues was $3,375,878 for the three months ended December 31, 2017, an increase of $3,025,082, or 862.3%, as compared to $350,796 for the three months ended December 31, 2016. The overall cost of revenues as a percentage of our revenues increased from 16.5% for the three months ended December 31, 2016, to 64.7% for the three months ended December 31, 2017. The increase stemmed from the majority of the revenues during the three months ended December 31, 2017, which comes from the less profitable freight logistic services segment discussed above.
During the three months ended December 31, 2017, 69% of total revenue was from the freight logistics services segment with a gross profit margin of 14% and 27% of total revenue was from the inland transportation management services segment with a gross profit margin of 88%. During the three months ended December 31, 2016, 24% of total revenue was from the freight logistics services segment with a gross profit margin of 68%, and 68% of total revenue was from the inland transportation management service segment with a gross profit margin of 94%. The significant decrease of gross profit margin of the freight logistics services segment is due to a change in our variety of services that caused revenue from the fragmented scope to contribute a much larger portion of total revenue under the freight logistics services segment in the current period in comparison with the prior period.
General and Administrative Expenses
General and administrative expenses consist primarily of salaries and benefits, office rent, office expenses, regulatory filing and listing fees, amortization of stock-based compensation, legal, accounting and other professional service fees. For the three months ended December 31, 2017, we had $1,827,014 of general and administrative expenses, as compared to $776,284 for the three months ended December 31, 2016, an increase of $1,050,730, or 135.4%. The increase was primarily due to increases in labor expense of $277,981, provision for doubtful accounts of $598,403, consulting fees of $37,500, and legal fees of $27,258, partially offset by the complaint settlement payments made to a former vice president of the Company. As a result of the increase in general and administrative expenses of 135.4% and the increase in revenues of 145.3%, our general and administrative expenses, as a percentage of revenue, decreased from 36.5% for the three months ended December 31, 2016 to 35.0% for the corresponding period in 2017.
Selling Expenses
Selling expenses consist primarily of business development costs, such as traveling expenses for sales purposes, and salaries and benefits for our sales staff. For the three months ended December 31, 2017, we had $335,261 of selling expenses as compared to $46,875 for the three months ended December 31, 2016, an increase of $288,386, or 615.2%. During the three months ended December 31, 2017, we increased our business development efforts to explore new business opportunities while maintaining our current customer relationships. Rising labor costs also increased our overall selling expenses as compared to the same period of 2013 was due mainly to the higher professional service fees as we engaged two consultants to assist us in the reorganization of our business.2016. As a percentage of revenue, our selling expenses increased from 2.2% for the three months ended December 31, 2016, to 6.4% for the corresponding period in 2017.
Operating Income (loss)
The Company had an operating loss of $317,672 for the three months ended December 31, 2017, compared to an operating income of $954,593 for the comparable period ended December 31, 2016. The decrease was primarily due to the significant increase in the cost of revenues and general and administrative expenses, partially offset by increased revenue generated from freight logistics services as discussed above.
Financial Income (Expense), Net
The Company’s net financial income was $137,799 for the three months ended December 31, 2017, compared to the net financial expense of $88,470 for the same period of 2016. We have operations in the U.S., Canada, Australia, Hong Kong and the PRC, and our financial income (expenses) for the three months ended December 31, 2017 and 2016 primarily reflects the foreign currency transaction income or loss expressed in U.S. Dollars.
Taxation
The Company’s income tax benefit was $571,121 for the three months ended December 31, 2017, compared to an income tax expense of $73,391 for the three months ended December 31, 2016. The increase in income tax benefit was due to the increased allowance for doubtful accounts of approximately $598,403 and partly offset by an increased current income tax expense.
During the three months ended December 31, 2017, the Company recognized a total deferred income tax benefit of $1,173,600, which derived from the utilization of net operating loss (“NOL”) and the decrease in the valuation allowance against the deferred tax assets, based on the Company’s latest projected taxable income.
On December 22, 2017, the “Tax Cuts and Jobs Act” (“The Act”) was enacted. Under the provisions of the Act, the U.S. corporate tax rate decreased from 35% to 21%. As the Company has a June 30 fiscal year-end, the lower corporate income tax rate will be phased in, resulting in a U.S. statutory federal rate of approximately 28% for our fiscal year ending June 30, 2018, and 21% for subsequent fiscal years. Additionally, the Tax Act imposes a one-time transition tax on deemed repatriation of historical earnings of foreign subsidiaries, and future foreign earnings are subject to U.S. taxation. The change in rate has caused us to re-measure all U.S. deferred income tax assets and liabilities for temporary differences and NOL carryforwards, and record a deferred income tax expense of $120,400.
Meanwhile, we accrued a one-time transition tax on accumulated foreign earnings in the amount of $478,499, which will be paid over 8 years. The increase in current income tax expenses was also attributable to the increase in the taxable income of Trans Pacific during the three and six months ended December 31, 2017 in comparison to the same period in 2016.
We periodically evaluate the likelihood of the realization of deferred tax assets, and reduce the carrying amount of the deferred tax assets by a valuation allowance to the extent it believes a portion will not be realized. We consider many factors when assessing the likelihood of future realization of the deferred tax assets, including our recent cumulative earnings, expectation of future income, the carry forward periods available for tax reporting purposes, and other relevant factors. We have provided an allowance against the deferred tax assets balance as of December 31, 2017. The net decrease in the valuation allowance for the three months ended December 31, 2017 amounted to $1,038,600 on the basis of our reassessment of the amount of our deferred tax assets that are more likely than not to be realized. We considered new evidence, both positive and negative, that could affect the future realization of deferred tax assets. Due to enactment of the Act, NOL could be carried forward indefinitely and we had pretax income resulting in utilization of NOL in the current period, we believe that there is sufficient positive evidence to conclude that it is more likely than not that all of our NOL are realizable.
Net Income
As a result of the foregoing, the Company had a net income of $391,248 for the three months ended December 31, 2017, compared to a net income of $792,732 for the three months ended December 31, 2016. After the deduction of non-controlling interest, net income attributable to Sino-Global was $297,703 for the three months ended December 31, 2017; for the three months ended December 31, 2016, the Company had a net income of $892,901. Comprehensive income attributable to the Company was $468,230 for the three months ended December 31, 2017, compared to a comprehensive income of $666,908 for the three months ended December 31, 2016.
Six Months Ended December 31, 2017 Compared to Six Months Ended December 31, 2016
Revenues
Revenues increased by $6,527,542, or 160.3%, from $4,072,950 for the six months ended December 31, 2016 to $10,600,492 for the comparable period in 2017. This increase was primarily due to the Company’s efforts to diversify its business in the freight logistics services and bulk cargo container services. The Company separately presents bulk cargo container services as a new segment during the three months ended December 31, 2017, total $608,267 bulk cargo container service revenue, of which $474,855 was reclassified from freight logistics services for the six months ended December 31, 2017. The revenues generated from freight logistics services increased by $5,624,479, or 576.4%, from $975,733 for the six months ended December 31, 2016 to $6,600,212 for the comparable period in 2017. The revenues generated from bulk cargo services for the six months ended December 31, 2017 were $608,267, as compared to $nil for the comparable period in 2016.
The following tables present summary information by segment for the six months ended December 31, 2017 and 2016:
| | | For the six months ended December 31, 2017 | |
| | | Inland
Transportation
Management
Services | | | Freight Logistics Services | | | Container Trucking Services | | | Bulk Cargo Container Services | | | Total | |
| Revenues | | | | | | | | | | | | | | | |
| - Related party | | $ | 1,120,406 | | | $ | - | | | $ | - | | | $ | - | | | $ | 1,120,406 | |
| - Third parties | | $ | 1,691,901 | | | $ | 6,600,212 | | | $ | 579,706 | | | $ | 608,267 | | | $ | 9,480,086 | |
| Total revenues | | $ | 2,812,307 | | | $ | 6,600,212 | | | $ | 579,706 | | | $ | 608,267 | | | $ | 10,600,492 | |
| Cost of revenues | | $ | 356,175 | | | $ | 5,828,108 | | | $ | 393,024 | | | $ | 464,489 | | | $ | 7,041,796 | |
| Gross profit | | $ | 2,456,132 | | | $ | 772,104 | | | $ | 186,682 | | | $ | 143,778 | | | $ | 3,558,696 | |
| GM% | | | 87.3 | % | | | 11.7 | % | | | 32.2 | % | | | 23.6 | % | | | 33.6 | % |
| | | For the six months ended December 31, 2016 | |
| | | Inland Transportation Management Services | | | Freight Logistic Services | | | Container Trucking Services | | | Bulk Cargo Container Services | | | Total | |
| Revenues | | | | | | | | | | | | | | | |
| - Related party | | $ | 1,466,403 | | | $ | - | | | $ | - | | | $ | - | | | $ | 1,466,403 | |
| - Third parties | | $ | 1,470,935 | | | $ | 975,733 | | | $ | 159,879 | | | $ | - | | | $ | 2,606,547 | |
| Total revenues | | $ | 2,937,338 | | | $ | 975,733 | | | $ | 159,879 | | | $ | - | | | $ | 4,072,950 | |
| Cost of revenues | | $ | 191,801 | | | $ | 369,373 | | | $ | 95,961 | | | $ | - | | | $ | 657,135 | |
| Gross profit | | $ | 2,745,537 | | | $ | 606,360 | | | $ | 63,918 | | | $ | - | | | $ | 3,415,815 | |
| Depreciation and amortization | | $ | 14,667 | | | $ | 10,740 | | | $ | - | | | $ | - | | | $ | 25,407 | |
| Total capital expenditures | | $ | 45,466 | | | $ | - | | | $ | - | | | $ | - | | | $ | 45,466 | |
| GM% | | | 93.5 | % | | | 62.1 | % | | | 40.0 | % | | | - | | | | 83.9 | % |
(1) Revenues from Inland Transportation Management Services
In September 2013, the Company executed an inland transportation management service contract with Zhiyuan Investment Group, a related party, whereby the Company agreed to provide certain solutions to help control the potential loss of commodities during the transportation process. The Company also began providing inland transportation management services to a third-party customer, Tengda Northwest, following the quarter ended September 2014. The fluctuation in revenue from this segment is due to the change in the quantities of commodities transported by both Zhiyuan Investment Group and Tengda Northwest.
For Tengda Northwest, the service fee charge was RMB 32 per ton. For Zhiyuan Investment Group, the service fee charge was RMB 38 per ton.
Revenue from the inland transportation management services segment decreased $125,031 from $2,937,338 for the six months ended December 31, 2016 to $2,812,307 for the six months ended December 31, 2017. Revenue from related-party customers decreased $345,997 from $1,466,403 for the six months ended December 31, 2016 to $1,120,406 for the six months ended December 31, 2017 since the transported quantities decreased from 262,465 tons to 197,545 tons. Revenue from third-party customers increased $220,966 from $1,470,935 for the six months ended December 31, 2016 to $1,691,901 for the six months ended December 31, 2017 since the transported quantities increased from 313,773 tons to 350,834 tons for the period indicated.
For the six months ended December 31, 2017 and 2016, gross profit from inland transportation management services amounted to $2,456,132 and $2,745,537, respectively.
Overall gross margins for this segment decreased to 87.3% for the six months ended December 31, 2017 from 93.5% for the six months ended December 31, 2016. The decrease of gross margins in the current is due to the change of product mix with different service fee per ton.
(2) Revenues from Freight Logistics Services
Since we formed our new subsidiary, Sino-Global Shipping LA, Inc., in January 2016, we began to provide freight logistics services, including cargo forwarding and truck transportation services. Since the revenue increased significantly for providing such services from period to period, the Company has presented the related revenue as a separated business segment since the first quarter of 2017 fiscal year.
During the six months ended December 31, 2017, the portion of revenues generated from freight logistics services has increased significantly. The increase was primarily due to orders from one of our clients: approximately $5.7 million of revenue was generated from BAO-NYK Shipping PTE. Ltd. (“BAO-NYK”) during the current period, as compared to less than $2,000 in the corresponding period in 2016. The gross margin decreased to 11.7% from 62.1% primarily due to the change in the variety of services currently provided in comparison with those services provided in the corresponding period of 2016. Every single business of freight logistics services has a unique gross margin according to different service scope. Usually, a business in full-scale scope has a higher gross margin, and the business with fragmented scope has a lower gross margin. Our fragmented scope business increased significantly, such as revenue from BAO-NYK, and contributed a much higher portion of revenue in this sector than full-scale business compared to prior period.
The revenue generated from freight logistics services was $6,600,212 and the related gross profit was $772,104 for the six months ended December 31, 2017. For the six months ended December 31, 2016, the revenue generated from freight logistics services was $975,733, and the related gross profit was $606,360.
Revenue from ACH Center amounted to $46,937 or 0.7% of the segment’s revenue for the six months ended December 31, 2017 and gross profit from ACH Center amounted to $13,989 representing 1.8% of the segment’ gross profit.
(3) Revenues from Container Trucking Services
Since we completed our web-based short-haul container truck service platform in December 2016, we began generating revenue from short-haul trucking and containers services through the service platform and presented this as a new segment, "Container Trucking Services," from in the second quarter of 2017. Since the second quarter of the fiscal year 2017, the Company has provided container trucking services in PRC regions and, as of the third quarter of the fiscal year 2017, has begun to provide related services in certain U.S. regions. This new business segment is based on a modified and improved version of our freight logistics services business segment.
On January 5, 2017, we entered into a joint venture agreement and formed a new joint venture company named ACH Trucking Center Corp. (“ACH Center”) with Jetta Global Logistics Inc. (“Jetta Global”). Along with the establishment of ACH Center, we began providing short haul trucking transportation and logistics services to customers located in the New York and New Jersey areas. We hold a 51% ownership stake in ACH Center. Although the establishment of ACH Center brought benefit for us and Jetta Global, it could not satisfy long term development for both us and Jetta Global. We signed a termination agreement with Jetta Global to terminate the joint venture agreement on December 4, 2017. As ACH center’s operating revenue was less than 1% of our consolidated revenue and the termination did not constitute a strategic shift that will have a major effect on our operations and financial results, the results of operations for ACH Center were not reported as discontinued operation.
For the six months ended December 31, 2017, revenue generated from container trucking services was $579,706 and the related gross profit was $186,682. Revenue from ACH Center amounted to $42,968 or 7.8% of the segment’s revenue for the six months ended December 31, 2017 and gross profit from ACH Center amounted to $4,297 representing 2.3% of the segment’s gross profit.
(4) Revenues from Bulk Cargo Container Services
For the six months ended December 31, 2017, we shipped 140 containers with 18 tons per container of sulfur from Long Beach, CA in the U.S. to our customers in China. The arrangement included coordinating the customer to sign the purchase contract with sulfur suppliers in the United States, organizing the container shipping, custom clearance; all have been fulfilled when we shipped the product to our customer’s designated port, Qingdao PRC. For the six months ended December 31, 2017, gross revenue generated from bulk cargo container services was $608,267 and the related cost was $464,489 with gross profit of $143,778 or 23.6%. We were the agent in this transaction as we did not take any inventory risk; we reported revenue on a net basis less the cost of sulfur. Due to the integrated and value added services we provide to our customers, the average gross profit was higher than freight logistics.
Operating Costs and Expenses
Operating costs and expenses increased by $7,584,377 or 315.3%, from $2,405,517 for the six months ended December 31, 2016 to $9,989,894 for the six months ended December 31, 2017. This increase was primarily due to the increase in the cost of revenues and general and administrative expenses as discussed below.
The following table sets forth the components of the Company’s costs and expenses for the periods indicated:
| | | For the six months ended December 31, | |
| | | 2017 | | | 2016 | | | Change | |
| | | US$ | | | % | | | US$ | | | % | | | US$ | | | % | |
| | | | | | | | | | | | | | | | | | | |
| Revenues | | | 10,600,492 | | | | 100.0 | % | | | 4,072,950 | | | | 100.0 | % | | | 6,527,542 | | | | 160.3 | % |
| Cost of revenues | | | 7,041,796 | | | | 66.4 | % | | | 657,135 | | | | 16.1 | % | | | 6,384,661 | | | | 971.6 | % |
| Gross margin | | | 33.6 | % | | | | | | | 83.9 | % | | | | | | | (50.3 | )% | | | | |
| | | | | | | | | | | | | | | | | | | | | | | | | |
| General and administrative expenses | | | 2,590,371 | | | | 24.4 | % | | | 1,636,198 | | | | 40.2 | % | | | 954,173 | | | | 58.3 | % |
| Selling expenses | | | 357,727 | | | | 3.4 | % | | | 112,184 | | | | 2.8 | % | | | 245,543 | | | | 218.9 | % |
| Total Costs and Expenses | | | 9,989,894 | | | | 94.2 | % | | | 2,405,517 | | | | 59.1 | % | | | 7,584,377 | | | | 315.3 | % |
Costs of Revenues
Cost of revenues was $7,041,796 for the six months ended December 31, 2017, an increase of $6,384,661, or 971.6%, as compared to $657,135 for the six months ended December 31, 2016. The overall cost of revenues as a percentage of our revenues increased from 16.1% for the six months ended December 31, 2016, to 66.4% for the six months ended December 31, 2017. The increase in the overall costs of revenues in percentage terms for the six months ended December 31, 2017 stemmed from the majority of the revenues during the six months ended December 31, 2017 coming from the less profitable freight logistics services segment, rather than the more profitable inland transportation management services segment.
During the six months ended December 31, 2017, 63% of total revenue was from the freight logistics services segment, with a gross profit margin of 12%, and 27% of total revenue was from the inland transportation management services segment with a gross profit margin of 87%. During the six months ended December 31, 2016, 24% of total revenue was from the freight logistics services segment with a gross profit margin of 62% and 72% of total revenue was from the inland transportation management service segment with a gross profit margin of 94%. The significant decrease of gross profit margin of the freight logistics services segment is due to a change in the variety of services provided, which caused revenue from the fragmented scope to contribute a much larger portion of total revenue under the freight logistics services segment in the current period as compared to the prior period.
General and Administrative Expenses
General and administrative expenses consist primarily of salaries and benefits, office rent, office expenses, regulatory filing and listing fees, amortization of stock-based compensation, legal, accounting and other professional service fees. For the six months ended December 31, 2017, we had $2,590,371 of expenses, as compared to $1,636,198 for the six months ended December 31, 2016, an increase of $954,173, or 58.3%. The increase was primarily due to increases in labor expense of $232,367, provision for doubtful accounts of $598,403, consulting fees of $79,074, and legal fees of $54,952. As a percentage of revenue, our general and administrative expenses increaseddecreased from 27.0%40.2% for the threesix months ended September 30, 2013December 31, 2016 to 36.1%24.4% for the threecorresponding period in 2017.
Selling Expenses
Selling expenses consist primarily of business development costs, such as traveling expenses for sales purposes, and salaries and benefits for our sales staff. For the six months ended September 30, 2014. The increase was attributed mainlyDecember 31, 2017, we had $357,727 of sales expenses as compared to lower revenues during$112,184 for the threesix months ended September 30, 2014December 31, 2016, an increase of $245,543, or 218.9%. During the six months ended December 31, 2017, we increased our business development efforts to explore new business opportunities while maintaining our current customer relationships. Rising labor costs also increased our overall selling expenses as compared to the same period of 2013.2016. As a percentage of revenue, our selling expenses increased from 2.8% for the six months ended December 31, 2016, to 3.4% for the corresponding period in 2017.
Operating Income
The declineCompany had an operating income of $610,598 for the six months ended December 31, 2017, compared to an operating income of $1,667,433 for the comparable period ended December 31, 2016. The decrease was primarily due to the increase in our general and administrative expenses, partially offset by the increased gross profit generated from freight logistics services and bulk cargo container services as discussed above.
Financial Income (Expense), Net
The Company’s net financial income was $222,595 for the six months ended December 31, 2017, compared to the net financial expense of $91,904 for the same period of 2016. We have operations in the U.S., Canada, Australia, Hong Kong and the PRC, and our financial income (expenses) for the six months ended December 31, 2017 and 2016 primarily reflects the foreign currency transaction income or loss expressed in U.S. Dollars.
Taxation
The Company’s income tax benefit was $274,692 for the six months ended December 31, 2017, compared to an income tax expense of $145,012 for the six months ended December 31, 2016. The increase in income tax benefit was due to the change in valuation allowance and partly offset by an increased current income tax expense.
During the six months ended December 31, 2017, the Company recognized a total deferred income tax benefit of $1,073,700, which derived from the utilization of NOL and the decrease in the valuation allowance against the deferred tax assets, based on the Company’s latest projected taxable income.
On December 22, 2017, the “Tax Cuts and Jobs Act” (“The Act”) was enacted. Under the provisions of the Act, the U.S. corporate tax rate decreased from 35% to 21%. As the Company has a June 30 fiscal year-end, the lower corporate income tax rate will be phased in, resulting in a U.S. statutory federal rate of approximately 28% for our fiscal year 2014 as comparedending June 30, 2018, and 21% for subsequent fiscal years. Additionally, the Tax Act imposes a one-time transition tax on deemed repatriation of historical earnings of foreign subsidiaries, and future foreign earnings are subject to U.S. taxation. The change in rate has caused us to remeasure all U.S. deferred income tax assets and liabilities for temporary differences and NOL carryforwards and record a deferred income tax expense of $120,400.
Meanwhile, we accrued a one-time transition tax on accumulated foreign earnings in the amount of $478,499 which will be paid over eight years. The increase in current income tax expense was also attributable to the increase in the taxable income of Trans Pacific during the six months ended December 31, 2017 in comparison to the same period in 2016.
We periodically evaluate the likelihood of 2013the realization of deferred tax assets and reduce the carrying amount of the deferred tax assets by a valuation allowance to the extent it believes a portion will not be realized. We consider many factors when assessing the likelihood of future realization of the deferred tax assets, including our recent cumulative earnings, expectation of future income, the carry forward periods available for tax reporting purposes, and other relevant factors. We have provided an allowance against the deferred tax assets balance as of December 31, 2017. The net decrease in the valuation allowance for the six months ended December 31, 2017 amounted to $1,097,700 on the basis of our reassessment of the amount of our deferred tax assets that are more likely than not to be realized. We considered new evidence, both positive and negative, that could affect the future realization of deferred tax assets. Due to enactment of the Act, NOL could be carried forward indefinitely and we had pretax income resulting in utilization of NOL in the current period, we believe that there is sufficient positive evidence to conclude that it is more likely than not that all of our NOL are realizable.
Net Income
As a result of the foregoing, the Company had a net income of $1,107,885 for the six months ended December 31, 2017, compared to a net income of $1,430,517 for the six months ended December 31, 2016. After the deduction of non-controlling interest, net income attributable to Sino-Global was $914,892 for the six months ended December 31, 2017; for the six months ended December 31, 2016, the Company had a net income of $1,538,621. Comprehensive income attributable to the Company was $1,191,837 for the six months ended December 31, 2017, compared to a comprehensive income of $1,287,514 for the six months ended December 31, 2016.
Liquidity and Capital Resources
Cash Flows and Working Capital (December 31, 2017)
As of December 31, 2017, the Company had $7,219,848 in cash and cash equivalents. We held approximately 5.1% of our cash in banks located in New York, Los Angeles, Canada, Australia and Hong Kong and held approximately 94.9% of our cash in banks located in the PRC.
The following table sets forth a summary of our cash flows for the periods indicated:
| | | For the six months ended
December 31, | |
| | | 2017 | | | 2016 | |
| Net cash provided by (used in) operating activities | | $ | (1,259,714 | ) | | $ | 1,922,458 | |
| Net cash used in investing activities | | $ | (250,278 | ) | | $ | - | |
| Net (decrease) increase in cash and cash equivalents | | $ | (1,513,894 | ) | | $ | 1,907,459 | |
| Cash and cash equivalents at the beginning of period | | $ | 8,733,742 | | | $ | 1,385,994 | |
| Cash and cash equivalents at the end of period | | $ | 7,219,848 | | | $ | 3,293,453 | |
The following table sets forth a summary of our working capital:
| | | December 31,
2017 | | | June 30,
2017 | | | Variation | | | % | |
| | | | | | | | | | | | | |
| Total Current Assets | | $ | 17,879,083 | | | $ | 16,754,888 | | | $ | 1,124,195 | | | | 6.7 | % |
| Total Current Liabilities | | $ | 3,486,218 | | | $ | 3,086,496 | | | $ | 399,722 | | | | 13.0 | % |
| Working Capital | | $ | 14,392,865 | | | $ | 13,668,392 | | | $ | 724,473 | | | | 5.3 | % |
| Current Ratio | | | 5.13 | | | | 5.43 | | | | (0.30 | ) | | | (5.5 | )% |
Cash Flows and Working Capital (June 30, 2017)
As of June 30, 2017, we had $8,733,742 in cash and cash equivalents. We held approximately 28.2% of our cash in banks located in New York, Los Angeles, Canada, Australia and Hong Kong and held approximately 71.8% of our cash in banks located in the PRC.
The following table sets forth a summary of our cash flows for the periods indicated:
| | | For the years ended
June 30, | |
| | | 2017 | | | 2016 | |
| Net cash provided by (used in) operating activities | | $ | 2,994,770 | | | $ | (121,048 | ) |
| Net cash provided by (used in) investing activities | | $ | (62,412 | ) | | $ | 294,376 | |
| Net cash provided by financing activities | | $ | 4,402,488 | | | $ | 646,589 | |
| Net increase in cash and cash equivalents | | $ | 7,347,748 | | | $ | 655,672 | |
| Cash and cash equivalents at the beginning of year | | $ | 1,385,994 | | | $ | 730,322 | |
| Cash and cash equivalents at the end of year | | $ | 8,733,742 | | | $ | 1,385,994 | |
The following table sets forth a summary of our working capital:
| | | June 30,
2017 | | | June 30,
2016 | | | Variation | | | % | |
| | | | | | | | | | | | | |
| Total Current Assets | | $ | 16,754,888 | | | $ | 8,651,985 | | | $ | 8,102,903 | | | | 93.7 | % |
| Total Current Liabilities | | $ | 3,086,496 | | | $ | 2,437,382 | | | $ | 649,114 | | | | 26.6 | % |
| Working Capital | | $ | 13,668,392 | | | $ | 6,214,603 | | | $ | 7,453,789 | | | | 119.9 | % |
| Current Ratio | | | 5.43 | | | | 3.55 | | | | 1.88 | | | | 53.0 | % |
We finance our ongoing operating activities primarily by using funds from our operations. We routinely monitor current and expected operational requirements to evaluate the use of available funding sources. In assessing liquidity, management monitors and analyzes the Company’s cash on-hand, its ability to generate sufficient revenue sources in the future and the Company’s operating and capital expenditure commitments. The Company plans to fund continuing operations through identifying new prospective joint ventures and strategic alliance opportunities for new revenue sources, and by reducing costs to improve profitability and replenish working capital. Considering our existing working capital position and our ability to access other funding sources, management believes that the foregoing measures will provide sufficient liquidity for the Company to meet its future liquidity and capital obligations.
Operating Activities
Net cash used in operating activities was $1,259,714 for the six months ended December 31, 2017, including net income of $1.11 million from increased revenue generated from freight logistics services, deferred tax benefit of $1.07 million, provision for doubtful accounts of $0.84 million and amortization of stock-based compensation to consultants of $0.33 million as reconciled. In the current period, accounts receivable increased by $2.21 million and the amount due from related parties increased $0.92 million because of increased revenue for the period. On the other hand, taxes payable increased by $0.73 million primarily due to tight budgetary controlthe one-time transition tax on accumulated foreign earnings. Cash outflows from operating activities for the six months ended December 31, 2017 reflect the above mentioned major factors.
Net cash derived from operating activities was $1,922,458 for the six months ended December 31, 2016, including net income of $1.43 million from increased revenue generated from inland transportation management services and freight logistics services with strong margin contributions and decreased general and administrative expenses. In addition, a significant decrease in provisions for doubtful accounts during the current period and accounts receivable decreased by $0.62 million, as a result of our strengthened cash collection efforts and payments received from Tengda Northwest, our major third-party customer for inland transportation management services, as well as other customers. However, advances to suppliers increased by $1.42 million because we reorganizedprepaid certain freight fees pursuant to our Memorandum of Understanding with Singapore Metals & Minerals Pte Ltd. and streamlined our service platform. Galasi Jernsih Sdn BHD. Cash inflows from operating activities for the six months ended December 31, 2016 reflect the above mentioned factors.
Our net cash derived from operating activities was $2,994,770 for the year ended June 30, 2017, including net income of $3.60 million from increased revenue generated from inland transportation management services, freight logistics services with strong margin contributions and decreased general and administrative expenses and sales expenses. In addition, advances to third party suppliers- decreased by $2.09 million because we received certain freight services prepayments pursuant to our Memorandum of Understanding with Singapore Metals & Minerals Pte Ltd. and Galasi Jernsih Sdn BHD in the third and fourth quarter of 2017. However, advances to related-party suppliers increased by $3.32 million as a result of Cooperative Transportation Agreement signed with Zhiyuan International Investment & Holding Group (Hong Kong) Co., Ltd. (“Zhiyuan Hong Kong”), a related party, pursuant to which we advanced transportation payments of approximately $3.33 million during the year ended June 30, 2017. Cash inflows from approximately $3.9operating activities for the year ended June 30, 2017 reflect the above mentioned major factors.
Net cash used in operating activities was $121,048 for the year ended June 30, 2016, which included our operating loss of $2.30 million to approximately $3.5 million for fiscal years 2013 and 2014, respectively. As a percentage of revenues, our general and administrative expenses increased from 22.4% to 29.8% for fiscal years 2013 and 2014, respectively. The increase was due to lower revenuesour decreased revenue in fiscalthe shipping agency service sector and increased selling expenses. In addition, the advances to third-party suppliers increased by $2.14 million because we prepaid freight fees of RMB 14.58 million (approximately $2.2 million) based on our Memorandum of Understanding (“MOU”) with Singapore Metals & Minerals Pte Ltd. (“the Buyer”) and Galasi Jernsih Sdn BHD (“the Seller”), the accounts receivable decreased by $0.62 million because we strengthened our cash collection efforts and received a payment of RMB 13.4 million (approximately $2.0 million) from Tengda Northwest, our major third-party customer of inland transportation services, and due from related parties decreased by $1.16 million because we collected RMB 22.2 million (approximately $3.3 million) from our related party customer, Zhiyuan. The Company’s cash outflows from operating activities for the year 2014.ended June 30, 2016 reflected the above mentioned factors.
Investing Activities
Our selling expenses consist primarily of commissionsThe Company’s net cash used in investing activities was $250,278 for our operating staff to the ports at which we provide services. Our selling expenses slightly increased when comparing threesix months ended September 30, 2014December 31, 2017 compared to net cash provided by investing activities of $nil for the same period of 2013. The increase in our selling expenses was mainly due to higher commission rates.2016. For the six months ended December 31, 2017, we developed four information platforms, purchased a motor vehicle and office equipment.
Our selling expenses slightly increasedThe Company’s net cash used in investing activities was $62,412 for the year ended June 30, 2017 compared to net cash provided by $6,147investing activities of $294,376 for fiscal year 2014 as compared to the same period of 2013,2016. For the year ended June 30, 2017, we purchased a vehicle in the amount of $55,339. For the year ended June 30, 2016, the amount was mainly due to higher commission rates.generated by cash collection from the termination of our $326,035 vessel acquisition.
Financing Activities
The Company’s net cash derived from financing activities was $4,402,488 for the year ended June 30, 2017, compared to $646,589 for the year ended June 30, 2016. During the year ended June 30, 2017, 75,000 stock options were exercised by the two employees of the Company with an exercise price of $1.10. As a result, net proceeds of $82,500 were recognized as net proceeds from exercise of stock options by the Company. In addition, the Company received net proceeds in the amount of $4,319,988 from a registered direct sale of 1.5 million shares of its common stock to three institutional investors.
Net cash provided by financing activities was $646,589 for the year ended June 30, 2016, of which $691,600 resulted from the proceeds from the issuance of common stock to one individual investor in a private sale transaction on July 10, 2015. During the year ended June 30, 2016, the Company repurchased 50,306 common shares and recorded such shares as treasury stock, with a payment of $45,011.
Critical Accounting Policies
We prepare our auditedLiquidity and the unaudited condensed consolidated financial statements in accordance with accounting principles generally accepted in the United States of America (“US GAAP”). These accounting principles require us to make judgments, estimates and assumptions on the reported amounts of assets and liabilities at the end of each fiscal period, and the reported amounts of revenues and expenses during each fiscal period. We continually evaluate these judgments and estimates based on our own historical experience, knowledge and assessment of current business and other conditions, our expectations regarding the future based on available information and assumptions that we believe to be reasonable.
We accounted for the business acquisition of Longhe Ship Management (Hong Kong) Co., Limited (“LSM”) under the purchase method of accounting. Under the purchase method, assets and liabilities of the business acquired are recorded at their estimated fair values as of the date of acquisition with any excess of the cost of the acquisition over the fair value of the net tangible and intangible assets acquired recorded as goodwill. Results of operations of the acquired business are included in the income statement from the date of acquisition.
The selection of critical accounting policies, the judgments and other uncertainties affecting application of those policies and the sensitivity of reported results to changes in conditions and assumptions are factors that should be considered when reviewing our financial statements. We believe the following accounting policies involve the most significant judgments and estimates used in the preparation of our consolidated financial statements.Capital Resources
Revenue Recognition
| · | Revenues from shipping agency services are recognized upon completion of services, which coincides with the date of departure of the relevant vessel from port. Advance payments and deposits received from customers prior to the provision of services and recognition of the related revenues are presented as advances from customers. |
| · | Revenues from shipping and chartering services are recognized upon performance of services as stipulated in the underlying contract. |
| · | Revenues from inland transportation management services are recognized when commodities are being released from the customer’s warehouse. |
Basis of ConsolidationCash Flows and Working Capital (December 31, 2017)
As of December 31, 2017, the Company had $7,219,848 in cash and cash equivalents. We held approximately 5.1% of our cash in banks located in New York, Los Angeles, Canada, Australia and Hong Kong and held approximately 94.9% of our cash in banks located in the PRC.
The consolidated financial statements include the accountsfollowing table sets forth a summary of the parent and its subsidiaries. All significant inter-company transaction and balances are eliminated in consolidation. Sino-China is our VIE and we are the primary beneficiary. Our company through Trans Pacific entered into agreements with Sino-China, pursuant to which we receive 90% of Sino-China’s net income. We do not receive any payment from Sino-China unless Sino-China recognizes net income during its fiscal year. These agreements do not entitle us to any consideration if Sino-China incurs a net loss during its fiscal year. If Sino-China incurs a net loss during its fiscal year, we are not required to absorb such net loss. In accordance with the agreements, Sino-China pays consulting and marketing fees equal to 85% and 5%, respectively, of its net income to Trans Pacific, and Trans Pacific supplies the technology and personnel needed to service Sino-China. Sino-China was designed to operate in Chinacash flows for the benefitperiods indicated:
| | | For the six months ended
December 31, | |
| | | 2017 | | | 2016 | |
| Net cash provided by (used in) operating activities | | $ | (1,259,714 | ) | | $ | 1,922,458 | |
| Net cash used in investing activities | | $ | (250,278 | ) | | $ | - | |
| Net (decrease) increase in cash and cash equivalents | | $ | (1,513,894 | ) | | $ | 1,907,459 | |
| Cash and cash equivalents at the beginning of period | | $ | 8,733,742 | | | $ | 1,385,994 | |
| Cash and cash equivalents at the end of period | | $ | 7,219,848 | | | $ | 3,293,453 | |
The following table sets forth a summary of our company.working capital:
| | | December 31,
2017 | | | June 30,
2017 | | | Variation | | | % | |
| | | | | | | | | | | | | |
| Total Current Assets | | $ | 17,879,083 | | | $ | 16,754,888 | | | $ | 1,124,195 | | | | 6.7 | % |
| Total Current Liabilities | | $ | 3,486,218 | | | $ | 3,086,496 | | | $ | 399,722 | | | | 13.0 | % |
| Working Capital | | $ | 14,392,865 | | | $ | 13,668,392 | | | $ | 724,473 | | | | 5.3 | % |
| Current Ratio | | | 5.13 | | | | 5.43 | | | | (0.30 | ) | | | (5.5 | )% |
Cash Flows and Working Capital (June 30, 2017)
As of June 30, 2017, we had $8,733,742 in cash and cash equivalents. We held approximately 28.2% of our cash in banks located in New York, Los Angeles, Canada, Australia and Hong Kong and held approximately 71.8% of our cash in banks located in the PRC.
The following table sets forth a summary of our cash flows for the periods indicated:
| | | For the years ended
June 30, | |
| | | 2017 | | | 2016 | |
| Net cash provided by (used in) operating activities | | $ | 2,994,770 | | | $ | (121,048 | ) |
| Net cash provided by (used in) investing activities | | $ | (62,412 | ) | | $ | 294,376 | |
| Net cash provided by financing activities | | $ | 4,402,488 | | | $ | 646,589 | |
| Net increase in cash and cash equivalents | | $ | 7,347,748 | | | $ | 655,672 | |
| Cash and cash equivalents at the beginning of year | | $ | 1,385,994 | | | $ | 730,322 | |
| Cash and cash equivalents at the end of year | | $ | 8,733,742 | | | $ | 1,385,994 | |
The following table sets forth a summary of our working capital:
| | | June 30,
2017 | | | June 30,
2016 | | | Variation | | | % | |
| | | | | | | | | | | | | |
| Total Current Assets | | $ | 16,754,888 | | | $ | 8,651,985 | | | $ | 8,102,903 | | | | 93.7 | % |
| Total Current Liabilities | | $ | 3,086,496 | | | $ | 2,437,382 | | | $ | 649,114 | | | | 26.6 | % |
| Working Capital | | $ | 13,668,392 | | | $ | 6,214,603 | | | $ | 7,453,789 | | | | 119.9 | % |
| Current Ratio | | | 5.43 | | | | 3.55 | | | | 1.88 | | | | 53.0 | % |
The accountsWe finance our ongoing operating activities primarily by using funds from our operations. We routinely monitor current and expected operational requirements to evaluate the use of Sino-China are consolidatedavailable funding sources. In assessing liquidity, management monitors and analyzes the Company’s cash on-hand, its ability to generate sufficient revenue sources in the accompanying consolidated financial statements pursuantfuture and the Company’s operating and capital expenditure commitments. The Company plans to Accounting Standard Codification (“ASC”) 810-10, “Consolidation”. As a VIE, Sino-China’s sales are included infund continuing operations through identifying new prospective joint ventures and strategic alliance opportunities for new revenue sources, and by reducing costs to improve profitability and replenish working capital. Considering our total sales, its income (loss) from operations is consolidated with our company’s,existing working capital position and our net income (loss) from continuing operations before non-controlling interest in income (loss) includes all of Sino-China’s net income (loss). Our non-controlling interest inability to access other funding sources, management believes that the foregoing measures will provide sufficient liquidity for the Company to meet its income (loss) is then subtracted in calculating the net income (loss) attributable to our company. Because of the contractual arrangements, our company had a pecuniary interest in Sino-China that requires consolidation of ourfuture liquidity and Sino-China’s financial statements.capital obligations.
Accounts Receivable and AdvancesOperating Activities
Accounts receivable are recognized atNet cash used in operating activities was $1,259,714 for the six months ended December 31, 2017, including net realizable value. We maintain allowancesincome of $1.11 million from increased revenue generated from freight logistics services, deferred tax benefit of $1.07 million, provision for doubtful accounts for estimated losses resulting fromof $0.84 million and amortization of stock-based compensation to consultants of $0.33 million as reconciled. In the failure of customers to make required payments in the relevant time period. We review thecurrent period, accounts receivable on a periodic basisincreased by $2.21 million and record general and specific allowances when there is doubt asthe amount due from related parties increased $0.92 million because of increased revenue for the period. On the other hand, taxes payable increased by $0.73 million primarily due to the collectability of individual balances. In evaluatingone-time transition tax on accumulated foreign earnings. Cash outflows from operating activities for the collectability of individual receivable balances, we consider many factors, includingsix months ended December 31, 2017 reflect the age of the balance, the customer’s historical payment history, its current credit-worthiness and current economic trends. Receivables are considered past due after 365 days. Accounts are written off only after exhaustive collection efforts. Because of the worldwide financial crisis, we have experienced difficulties in collecting cash from some of our customers.above mentioned major factors.
We generally obtain advance payment of our shipping agency fees prior to providing service to our clients. This significantly reduces the amount of accounts receivable when the shipping agency fees are recognized. To the extent our estimates are insufficient; we bill our clientsNet cash derived from operating activities was $1,922,458 for the balance which is expected to be paid within 30 days.
We use advance payments to pay a number of fees on behalf of our clients before their ships arrive in port, including harbor, berthing, mooring/unmooring, tonnage, immigration, quarantine and tug hire fees. We record the amounts we receive as Advances from Customers and the amounts we pay as Advances to Suppliers. We recognize revenues and expenses once the client’s ship leaves the harbor and the client pays any outstanding amounts. In some cases, a delay in receiving bills will require us to estimate the Service Revenues and Costs of Services in accordance with the rate and formulas approved by the Ministry of Communications. When this happens, we record the difference between Service Revenues (as recognized) and Advances from Customers as Accounts Receivable and the difference between Cost of Services and Advances to Suppliers as Accounts Payable. To the extent we recognize revenues and costs in this way, our Accounts Receivable and Accounts Payable will reflect this estimation until we receive the bills and information we require to adjust revenues and expenses to reflect our actual Service Revenues and Cost of Services. Any adjustment to actual from the estimated Revenues and Cost of Services recorded has been and is expected to be immaterial.
Translation of Foreign Currency
The accounts of our company and Sino-China are measured using the currency of the primary economic environment in which the entity operates (the “functional currency”). Our functional currency is the U.S. dollar, while Trans Pacific and Sino-China report their financial position and results of operations in RMB. The accompanying consolidated financial statements are presented in U.S. dollars. Foreign currency transactions are translated into U.S. dollars using the fixed exchange rates in effect at the time of the transaction. Generally foreign exchange gains and losses resulting from the settlement of such transactions are recognized in the consolidated statements of operations. We translate foreign currency financial statements of Sino-China, Trans Pacific, Sino-Global HK and Sino-Global AUS in accordance with ASC 830-10, “Foreign Currency Matters”. Assets and liabilities are translated at current exchange rates quoted by the People’s Bank of China at the balance sheet dates and revenues and expenses are translated at average exchange rates in effect during the periods.
Taxation
Because we and Sino-China are incorporated in different jurisdictions, we file separate income tax returns. We are subject to income and capital gains taxes in the United States. Additionally, dividend payments made by our company are subject to withholding tax in the United States.
We follow the provisions of ASC 740-10, “Accounting for Income Taxes”, which addresses the determination of whether tax benefits claimed or expected to be claimed on a tax return should be recorded in the financial statements. Under ASC 740-10, we may recognize the tax benefit from an uncertain tax position only if it is more likely than not that the tax position will be sustained on examination by the taxing authorities, based on the technical merits of the position. The tax benefits recognized in the financial statements from such a position would be measured based on the largest benefit that has a greater than fifty percent likelihood of being realized upon ultimate settlement. ASC 740-10 also provides guidance on derecognition, classification, interest and penalties on income taxes, accounting in interim periods and requires increased disclosures.
The implementation of ASC 740-10 resulted in no material liability for unrecognized tax benefits and no material change to the beginning retained earnings of our company. Our company recognizes interest and penalties, if any, related to unrecognized tax benefits as income tax expense in the Statement of Operations. We use the liability method of accounting for income taxes in accordance with US GAAP. Deferred taxes, if any, are recognized for the future tax consequences of temporary differences between the tax basis of assets and liabilities and their reported amounts in the consolidated financial statements. We may recognize the tax benefit from an uncertain tax position only if it is more likely than not that the tax position will be sustained on examination by the taxing authorities, based on the technical merits of the position. The tax benefits recognized in the financial statements from such a position would be measured based on the largest benefit that has a greater than fifty percent likelihood of being realized upon ultimate settlement.
2015 Trends
On balance, we expect difficult macroeconomic conditions in fiscal year 2014 to continue in fiscal year 2015; and we believe competition and rising labor costs in the PRC will continue to pressure our operating model. As a small company with limited resources, we expect to face an uphill battle when it comes to margin enhancement and cost containment. To attempt to generate consistent earnings, we will continue to attempt to leverage our business relationship with the Zhiyuan Investment Group and broaden our experience and expertise in the logistics services. With the LSM acquisition, we believe we have gained significant leverage to expand our service platform along the shipping industry value chain.
Results of Operations
Three Months Ended September 30, 2014 Compared to Three Months Ended September 30, 2013
Revenues.
Our total revenues decreased by $711,736 or 21.5% from $3,317,661 for the threesix months ended September 30, 2013 to $2,605,925 for the comparable period in 2014. The decline was due mainly to no revenueDecember 31, 2016, including net income of $1.43 million from shipping and chartering services during the three months ended September 30, 2014, partially offset byincreased revenue generated from inland transportation management services.services and freight logistics services with strong margin contributions and decreased general and administrative expenses. In addition, a significant decrease in provisions for doubtful accounts during the current period and accounts receivable decreased by $0.62 million, as a result of our strengthened cash collection efforts and payments received from Tengda Northwest, our major third-party customer for inland transportation management services, as well as other customers. However, advances to suppliers increased by $1.42 million because we prepaid certain freight fees pursuant to our Memorandum of Understanding with Singapore Metals & Minerals Pte Ltd. and Galasi Jernsih Sdn BHD. Cash inflows from operating activities for the six months ended December 31, 2016 reflect the above mentioned factors.
Our net cash derived from operating activities was $2,994,770 for the year ended June 30, 2017, including net income of $3.60 million from increased revenue generated from inland transportation management services, freight logistics services with strong margin contributions and decreased general and administrative expenses and sales expenses. In addition, advances to third party suppliers- decreased by $2.09 million because we received certain freight services prepayments pursuant to our Memorandum of Understanding with Singapore Metals & Minerals Pte Ltd. and Galasi Jernsih Sdn BHD in the third and fourth quarter of 2017. However, advances to related-party suppliers increased by $3.32 million as a result of Cooperative Transportation Agreement signed with Zhiyuan International Investment & Holding Group (Hong Kong) Co., Ltd. (“Zhiyuan Hong Kong”), a related party, pursuant to which we advanced transportation payments of approximately $3.33 million during the year ended June 30, 2017. Cash inflows from operating activities for the year ended June 30, 2017 reflect the above mentioned major factors.
| · | Revenues from our shipping agency services increased by $181,043 from $1,430,661 for the three months ended September 30, 2013 to $1,611,704 for the same period in 2014. The increase was due mainly to the increase in the total number of ships we served - increased from 64 for the three months ended September 30, 2013 to 70 for the same period of 2014. We provided loading/discharging services to 15 ships and protective services to 55 ships during the three months ended September 30, 2014, as compared to 14 ships for loading/discharging services and 50 ships for protective services for the same period in 2013. |
Net cash used in operating activities was $121,048 for the year ended June 30, 2016, which included our operating loss of $2.30 million due to our decreased revenue in the shipping agency service sector and increased selling expenses. In addition, the advances to third-party suppliers increased by $2.14 million because we prepaid freight fees of RMB 14.58 million (approximately $2.2 million) based on our Memorandum of Understanding (“MOU”) with Singapore Metals & Minerals Pte Ltd. (“the Buyer”) and Galasi Jernsih Sdn BHD (“the Seller”), the accounts receivable decreased by $0.62 million because we strengthened our cash collection efforts and received a payment of RMB 13.4 million (approximately $2.0 million) from Tengda Northwest, our major third-party customer of inland transportation services, and due from related parties decreased by $1.16 million because we collected RMB 22.2 million (approximately $3.3 million) from our related party customer, Zhiyuan. The Company’s cash outflows from operating activities for the year ended June 30, 2016 reflected the above mentioned factors.
| · | Revenues from the newly acquired ship management services were $47,587. |
| · | We did not provide any shipping and chartering services during the three months ended September 30, 2014. For the same period in 2013, we reported revenues of $1,887,000 for providing such services to the Zhiyuan Investment Group. |
| · | For the three months ended September 30, 2014, we recognized revenues of $946,634 from our inland transportation management services. The inland transportation management services were launched in the quarter ended December 31, 2013. |
Total Operating Costs and Expenses.Investing Activities Our total operating costs and expenses decreased by $929,758 or 27.9% from $3,335,055
The Company’s net cash used in investing activities was $250,278 for the threesix months ended September 30, 2013December 31, 2017 compared to $2,405,297net cash provided by investing activities of $nil for the same period in 2014. This decrease was due primarily to a decrease in our overall cost of revenues, partially offset by higher general and administrative and selling expenses.
| · | Our cost of revenues decreased by 41.0% from $2,387,803 for the three2016. For the six months ended September 30, 2013 to $1,409,153 for the three months ended September 30, 2014. The decrease was due mainly to favorable service mix. For the three months ended September 31, 2014, our revenues came mainly from shipping agency services and inland transportation management services. However, for the same period in 2013, our revenues came mainly from the shipping agency services and the shipping and chartering services. The decline in our overall cost of revenues was due mainly to the nature of our inland transportation management services that feature lower overhead than our shipping and chartering services |
| · | Our general and administrative expenses increased by $43,641 or 4.9% from $896,164 for the three months ended September 30, 2013 to $939,805 for the three months ended September 30, 2014. This increase was mainly due to higher business development expenses of $63,942; recognition of stock based compensation for common stock issued to consultants of $71,689, partially offset by decreased office expenses of $53,783. |
| · | Our selling expenses increased by $5,251 or 10.3% from $51,088 for the three months ended September 30, 2013 to $56,339 for the three months ended September 30, 2014, mainly due to higher commission ratio. |
Operating Income. We had an operating income of $200,628 for the three months ended September 30, 2014, compared to an operating loss of $17,394 for the comparable period ended September 30, 2013. The turnaround was due mainly to higher gross profit margin from the inland transportation management services that were launched in the quarter ended December 31, 2013.2017, we developed four information platforms, purchased a motor vehicle and office equipment.
Financial Expense, Net. OurThe Company’s net financial expensecash used in investing activities was $62,382$62,412 for the three months ended September 30, 2014, compared to financial income of $23,867 for the three months ended September 30, 2013. We have operations in the U.S., Canada, Australia, Hong Kong and China. Our financial expense or income reflected the foreign currency exchange effect for each reporting period indicated.
Taxation. Our income tax benefit was $27,255 for the three months ended September 30, 2014, compared to $22,500 for the three months ended September 30, 2013. As we had a tax expense of $1,645 and deferred tax benefit of $28,900, the income tax benefit for the three months ended September 30, 2014 was $27,255. The income tax benefit for three months ended September 30, 2013 included an adjustment to decrease our valuation allowance for deferred tax assets of $22,500.
Net income. As a result of the foregoing, we had net income of $165,501 for the three months ended September 30, 2014, compared to net income of $28,973 for the three months ended September 30, 2013. After deduction of non-controlling interest, net income attributable to Sino Global was $332,459 for the three months ended September 30, 2014, compared to net income of $275,394 for the three months ended September 30, 2013. With other comprehensive loss foreign currency translation, comprehensive income attributable to Sino-Global was $367,259 for the three months ended September 30, 2014, compared to comprehensive income of $263,510 for the three months ended September 30, 2013.
Fiscal Year Ended June 30, 2014 Compared to Fiscal Year Ended June 30, 2013
Revenues.Our shipping agency business continued to be negatively impacted by the softening of the Chinese economy and its import of iron ore. Our total revenues decreased by $5,687,367 or 32.8% from $17,331,759 for the fiscal year ended June 30, 2013 to $11,644,392 for fiscal year ended June 30, 2014. The number of ships we served decreased from 438 to 312 for the fiscal years ended June 30, 2013 and 2014, respectively.
For the fiscal year ended June 30, 2014, we provided protective services to 252 ships, as2017 compared to 277 shipsnet cash provided by investing activities of $294,376 for the same period in 2013. In contrast, we only provided loading/discharging services to 60 ships for the fiscal year ended June 30, 2014 as compared to 161 ships for the same period in 2013.
The decline in revenues from the shipping agency business was partially compensated by our new revenue sources generated from our shipping and chartering services and inland transportation management services that were launched in the first and second quarter, respectively.of 2016. For the year ended June 30, 2014,2017, we recognized revenues of:
| · | $1,937,196 from our shipping and chartering business; and |
| · | $2,183,213 from our inland transportation management business. |
Total Operating Costs and Expenses.Our total operating costs and expenses decreased by $8,191,037 or 41.9% from $19,535,299 forpurchased a vehicle in the fiscalamount of $55,339. For the year ended June 30, 2013 to $11,344,2622016, the amount was mainly generated by cash collection from the termination of our $326,035 vessel acquisition.
Financing Activities
The Company’s net cash derived from financing activities was $4,402,488 for the fiscal year ended June 30, 2014. This decrease was primarily due2017, compared to decreases in our costs of revenues and general and administrative expenses, as discussed below.
| Ÿ | Costs of Revenues.Our cost of revenues decreased by 50.6% from $15,402,743$646,589 for the fiscal year ended June 30, 2013 to $7,613,459 for the fiscal year ended June 30, 2014. The decline was primarily driven by lower cost generated from the shipping agency business, partially offset by the launch of the shipping and chartering services in the first quarter and inland transportation management services in the second quarter, which featured lower overhead and allowed our cost of revenues to decrease more quickly than our revenues.
|
| Ÿ | General and Administrative Expenses. Our general and administrative expenses decreased by $407,900 or 10.5% from $3,878,569 for the fiscal year ended June 30, 2013 to $3,470,669 for the fiscal year ended June 30, 2014. This decrease was mainly due to (1) decreased salaries and benefits for our staff of $114,951, (2) decreased meeting expense of $103,576, (3) decreased bad debt provision of $419,832. The decrease of general and administrative expenses was partially offset by an increase of $173,387 in travelling expenses and an increase of $113,515 in business development expenses.
|
| Ÿ | Selling Expenses.Our selling expenses increased by $6,147 or 2.4% from $253,987 for the fiscal year ended June 30, 2013 to $260,134 for the fiscal year ended June 30, 2014, mainly due to lower commission payments related to the sales decrease, partially offset by increased commissions payments as a result of higher commission ratio. |
Operating Income.We had an operating income of $300,130 for the fiscal year ended June 30, 2014, compared to an operating loss of $2,203,540 for2016. During the comparable year ended June 30, 2013. The turnaround was due mainly2017, 75,000 stock options were exercised by the two employees of the Company with an exercise price of $1.10. As a result, net proceeds of $82,500 were recognized as net proceeds from exercise of stock options by the Company. In addition, the Company received net proceeds in the amount of $4,319,988 from a registered direct sale of 1.5 million shares of its common stock to net profit from the newly developed shipping and chartering services as well as the inland transportation management services.three institutional investors.
Financial Expense, Net. Our net financial expenseNet cash provided by financing activities was $50,170$646,589 for the fiscal year ended June 30, 2014, compared2016, of which $691,600 resulted from the proceeds from the issuance of common stock to $15,520 forone individual investor in a private sale transaction on July 10, 2015. During the fiscal year ended June 30, 2013. The variance was due largely to2016, the foreign exchange losses recognized in the financial statements consolidation.
Company repurchased 50,306 common shares and recorded such shares as treasury stock, with a payment of $45,011.
Taxation. Our income tax expense was $79,823 for the fiscal year ended June 30, 2014, compared to $410,089 for the fiscal year ended June 30, 2013. As we had a tax expense of $138,623 and deferred tax benefit of $50,445, the income tax expense for the fiscal year ended June 30, 2014 was $79,823. The income tax expense for fiscal year 2013 included an adjustment to increase our valuation allowance for deferred tax assets of $413,900.
Net income (Loss).As a result of the foregoing, we had net income of $434,486 for the fiscal year ended June 30, 2014, compared to net loss of $2,576,896 for the fiscal year ended June 30, 2013. After deduction of non-controlling interest, net income attributable to Sino-Global was $1,586,353 for the fiscal year ended June 30, 2014, compared to net loss of $1,799,755 for the fiscal year ended June 30, 2013. With other comprehensive loss foreign currency translation, comprehensive income attributable to Sino-Global was $1,556,180 for the fiscal year ended June 30, 2014, compared to comprehensive loss of $1,761,673 for the fiscal year ended June 30, 2013.
Liquidity and Capital Resources
Cash Flows and Working Capital (December 31, 2017)
We have financed our operations primarily through cash flows from operations and proceeds from issuing common stock. As ofSeptember 30, 2014, we December 31, 2017, the Company had $3,553,187$7,219,848 in cash and cash equivalents as compared to $902,531 as of June 30, 2014. 50.2%equivalents. We held approximately 5.1% of our cash in banks are located in New York, Los Angeles, Canada, Australia and Hong Kong and 49.8%held approximately 94.9% of our cash in banks are located in China as compared to 67.6% and 32.4%, respectively, as of June 30, 2014. Such increase resulted from the payment received by us from the Zhiyuan Investment Group in September 2014.PRC.
The following table sets forth a summary of our cash flows for the periods indicated:
| | | For the three months ended
September 30, | | | For the years ended
June 30, | |
| | | 2014 | | | 2013 | | | 2014 | | | 2013 | |
| Net cash provided by (used in) operating activities | | $ | 524,352 | | | $ | (1,030,634 | ) | | $ | (1,242,471 | ) | | $ | (4,361,613 | ) |
| Net cash provided by (used in) investing activities | | $ | 1,103,902 | | | $ | (3,399 | ) | | $ | (1,361,034 | ) | | $ | (50,931 | ) |
| Net cash provided by financing activities | | $ | 967,820 | | | $ | - | | | $ | 444,000 | | | $ | 3,026,536 | |
| Net increase (decrease) in cash and cash equivalents | | $ | 2,650,656 | | | $ | (1,062,294 | ) | | $ | (2,146,300 | ) | | $ | (1,384,502 | ) |
| Cash and cash equivalents at the beginning of the period | | $ | 902,531 | | | $ | 3,048,831 | | | $ | 3,048,831 | | | $ | 4,433,333 | |
| Cash and cash equivalents at the end of the period | | $ | 3,553,187 | | | $ | 1,986,537 | | | $ | 902,531 | | | $ | 3,048,831 | |
| | | For the six months ended
December 31, | |
| | | 2017 | | | 2016 | |
| Net cash provided by (used in) operating activities | | $ | (1,259,714 | ) | | $ | 1,922,458 | |
| Net cash used in investing activities | | $ | (250,278 | ) | | $ | - | |
| Net (decrease) increase in cash and cash equivalents | | $ | (1,513,894 | ) | | $ | 1,907,459 | |
| Cash and cash equivalents at the beginning of period | | $ | 8,733,742 | | | $ | 1,385,994 | |
| Cash and cash equivalents at the end of period | | $ | 7,219,848 | | | $ | 3,293,453 | |
The following table sets forth a summary of our working capitalcapital:
| | | December 31,
2017 | | | June 30,
2017 | | | Variation | | | % | |
| | | | | | | | | | | | | |
| Total Current Assets | | $ | 17,879,083 | | | $ | 16,754,888 | | | $ | 1,124,195 | | | | 6.7 | % |
| Total Current Liabilities | | $ | 3,486,218 | | | $ | 3,086,496 | | | $ | 399,722 | | | | 13.0 | % |
| Working Capital | | $ | 14,392,865 | | | $ | 13,668,392 | | | $ | 724,473 | | | | 5.3 | % |
| Current Ratio | | | 5.13 | | | | 5.43 | | | | (0.30 | ) | | | (5.5 | )% |
Cash Flows and Working Capital (June 30, 2017)
As of June 30, 2017, we had $8,733,742 in cash and cash equivalents. We held approximately 28.2% of our cash in banks located in New York, Los Angeles, Canada, Australia and Hong Kong and held approximately 71.8% of our cash in banks located in the PRC.
The following table sets forth a summary of our cash flows for the periods so indicated:
| | | For the years ended
June 30, | |
| | | 2017 | | | 2016 | |
| Net cash provided by (used in) operating activities | | $ | 2,994,770 | | | $ | (121,048 | ) |
| Net cash provided by (used in) investing activities | | $ | (62,412 | ) | | $ | 294,376 | |
| Net cash provided by financing activities | | $ | 4,402,488 | | | $ | 646,589 | |
| Net increase in cash and cash equivalents | | $ | 7,347,748 | | | $ | 655,672 | |
| Cash and cash equivalents at the beginning of year | | $ | 1,385,994 | | | $ | 730,322 | |
| Cash and cash equivalents at the end of year | | $ | 8,733,742 | | | $ | 1,385,994 | |
The following table sets forth a summary of our working capital:
| | | June 30,
2017 | | | June 30,
2016 | | | Variation | | | % | |
| | | | | | | | | | | | | |
| Total Current Assets | | $ | 16,754,888 | | | $ | 8,651,985 | | | $ | 8,102,903 | | | | 93.7 | % |
| Total Current Liabilities | | $ | 3,086,496 | | | $ | 2,437,382 | | | $ | 649,114 | | | | 26.6 | % |
| Working Capital | | $ | 13,668,392 | | | $ | 6,214,603 | | | $ | 7,453,789 | | | | 119.9 | % |
| Current Ratio | | | 5.43 | | | | 3.55 | | | | 1.88 | | | | 53.0 | % |
| | | September 30,
2014 | | | June 30, 2014 | | | Diff. | | | % | |
| Total Current Assets | | $ | 6,353,818 | | | $ | 4,957,798 | | | $ | 1,396,020 | | | | 28.2% | |
| Total Current Liabilities | | $ | 1,152,860 | | | $ | 1,230,795 | | | $ | (77,935 | ) | | | -6.3% | |
| Working Capital | | $ | 5,200,958 | | | $ | 3,727,003 | | | $ | 1,473,955 | | | | 39.5% | |
| Current Ratio | | | 5.51 | | | | 4.03 | | | | 1.48 | | | | 36.8% | |
We finance our ongoing operating activities primarily by using funds from our operations. We routinely monitor current and expected operational requirements to evaluate the use of available funding sources. In assessing liquidity, management monitors and analyzes the Company’s cash on-hand, its ability to generate sufficient revenue sources in the future and the Company’s operating and capital expenditure commitments. The Company plans to fund continuing operations through identifying new prospective joint ventures and strategic alliance opportunities for new revenue sources, and by reducing costs to improve profitability and replenish working capital. Considering our existing working capital position and our ability to access other funding sources, management believes that the foregoing measures will provide sufficient liquidity for the Company to meet its future liquidity and capital obligations.
Operating Activities
Net cash provided by operating activities was $524,352 for the three months ended September 30, 2014, as compared to net cash used in operating activities of $1,030,634 for the comparable period in 2013. The increase in our operating cash inflows was mainly attributable to net income of $165,501, a decrease in due from related parties of $1,174,234 resulted from collection of outstanding receivables from the Zhiyuan Investment Group, partially offset by an increase in accounts receivable of $477,001, increase in other receivables of $296,828, and a decrease in accounts payable of $156,245.
Net cash used in operating activities was $1,242,471$1,259,714 for the six months ended December 31, 2017, including net income of $1.11 million from increased revenue generated from freight logistics services, deferred tax benefit of $1.07 million, provision for doubtful accounts of $0.84 million and amortization of stock-based compensation to consultants of $0.33 million as reconciled. In the current period, accounts receivable increased by $2.21 million and the amount due from related parties increased $0.92 million because of increased revenue for the period. On the other hand, taxes payable increased by $0.73 million primarily due to the one-time transition tax on accumulated foreign earnings. Cash outflows from operating activities for the six months ended December 31, 2017 reflect the above mentioned major factors.
Net cash derived from operating activities was $1,922,458 for the six months ended December 31, 2016, including net income of $1.43 million from increased revenue generated from inland transportation management services and freight logistics services with strong margin contributions and decreased general and administrative expenses. In addition, a significant decrease in provisions for doubtful accounts during the current period and accounts receivable decreased by $0.62 million, as a result of our strengthened cash collection efforts and payments received from Tengda Northwest, our major third-party customer for inland transportation management services, as well as other customers. However, advances to suppliers increased by $1.42 million because we prepaid certain freight fees pursuant to our Memorandum of Understanding with Singapore Metals & Minerals Pte Ltd. and Galasi Jernsih Sdn BHD. Cash inflows from operating activities for the six months ended December 31, 2016 reflect the above mentioned factors.
Our net cash derived from operating activities was $2,994,770 for the year ended June 30, 2014, as compared to net cash used in operating activities of $4,361,613 for the comparable period in 2013. The decrease in our operating cash outflows was mainly attributable to2017, including net income of $434,486,$3.60 million from increased revenue generated from inland transportation management services, freight logistics services with strong margin contributions and decreased general and administrative expenses and sales expenses. In addition, advances to third party suppliers- decreased by $2.09 million because we received certain freight services prepayments pursuant to our Memorandum of Understanding with Singapore Metals & Minerals Pte Ltd. and Galasi Jernsih Sdn BHD in the third and fourth quarter of 2017. However, advances to related-party suppliers increased by $3.32 million as a decrease in advanceresult of Cooperative Transportation Agreement signed with Zhiyuan International Investment & Holding Group (Hong Kong) Co., Ltd. (“Zhiyuan Hong Kong”), a related party, pursuant to supplierswhich we advanced transportation payments of $223,290, a decrease in accounts receivable of $201,155, partially offset by an increase in dueapproximately $3.33 million during the year ended June 30, 2017. Cash inflows from related parties of $1,473,752, a decrease in advance from customers of $506,066, and recovery of doubtful accounts of $246,206operating activities for the year ended June 30, 2014.2017 reflect the above mentioned major factors.
Net cash used in operating activities was $121,048 for the year ended June 30, 2016, which included our operating loss of $2.30 million due to our decreased revenue in the shipping agency service sector and increased selling expenses. In addition, the advances to third-party suppliers increased by $2.14 million because we prepaid freight fees of RMB 14.58 million (approximately $2.2 million) based on our Memorandum of Understanding (“MOU”) with Singapore Metals & Minerals Pte Ltd. (“the Buyer”) and Galasi Jernsih Sdn BHD (“the Seller”), the accounts receivable decreased by $0.62 million because we strengthened our cash collection efforts and received a payment of RMB 13.4 million (approximately $2.0 million) from Tengda Northwest, our major third-party customer of inland transportation services, and due from related parties decreased by $1.16 million because we collected RMB 22.2 million (approximately $3.3 million) from our related party customer, Zhiyuan. The Company’s cash outflows from operating activities for the year ended June 30, 2016 reflected the above mentioned factors.
Investing Activities
Net cash provided by investing activities was $1,103,902 for the three months ended September 30, 2014, as compared toThe Company’s net cash used in investing activities was $250,278 for the six months ended December 31, 2017 compared to net cash provided by investing activities of $3,399$nil for the same period in 2013. The change was due mainly toof 2016. For the collection ofsix months ended December 31, 2017, we developed four information platforms, purchased a short-term loan from our related party, the Zhiyuan Investment Group of $1,119,241.motor vehicle and office equipment.
NetThe Company’s net cash used in investing activities was $1,361,034$62,412 for the year ended June 30, 2017 compared to net cash used inprovided by investing activities of $50,931$294,376 for the fiscal years ended June 30, 2014 and 2013, respectively, due to acquisitionssame period of fixed assets of $203,252 and loans to related party of $1,158,636 for2016. For the fiscal year ended June 30, 2014 compared to acquisitions2017, we purchased a vehicle in the amount of fixed assets$55,339. For the year ended June 30, 2016, the amount was mainly generated by cash collection from the termination of $67,116 and offset by proceeds from saleour $326,035 vessel acquisition.
Financing Activities
NetThe Company’s net cash provided byderived from financing activities was $967,820$4,402,488 for the three monthsyear ended SeptemberJune 30, 2014, due2017, compared to $646,589 for the year ended June 30, 2016. During the year ended June 30, 2017, 75,000 stock options were exercised by the two employees of the Company with an exercise price of $1.10. As a result, net proceeds of $82,500 were recognized as net proceeds from exercise of stock options by the Company. In addition, the Company received net proceeds in the amount of $4,319,988 from a registered direct sale of 647,0001.5 million shares of ourits common stock in July 2014.to three institutional investors.
Net cash provided by financing activities was $444,000$646,589 for the year ended June 30, 2016, of which $691,600 resulted from the proceeds from the issuance of common stock to one individual investor in a private sale transaction on July 10, 2015. During the year ended June 30, 2016, the Company repurchased 50,306 common shares and recorded such shares as treasury stock, with a payment of $45,011.
Critical Accounting Policies
We prepare our unaudited condensed consolidated financial statements in accordance with U.S. GAAP. These accounting principles require us to make judgments, estimates and assumptions on the reported amounts of assets and liabilities at the end of each fiscal period, and the reported amounts of revenues and expenses during each fiscal period. We continually evaluate these judgments and estimates based on our own historical experience, knowledge and assessment of current business and other conditions, our expectations regarding the future based on available information and assumptions that we believe to be reasonable.
There have been no material changes during the six months ended December 31, 2017 in our accounting policies from those previously disclosed in the Company’s annual report for the fiscal year 2014 which resulted mainly fromended June 30, 2017.
The selection of critical accounting policies, the salejudgments and other uncertainties affecting the application of 200,000 sharesthose policies and the sensitivity of reported results to changes in conditions and assumptions are factors that should be considered when reviewing our common stock for $444,000 to Mr. Wang.
financial statements. We believe the following accounting policies involve the most significant judgments and estimates used in the preparation of our unaudited condensed consolidated financial statements.
Working CapitalRevenue Recognition
| ● | Revenues from shipping agency services are recognized upon completion of services, which coincides with the date of departure of the relevant vessel from port. Advance payments and deposits received from customers prior to the provision of services and recognition of the related revenues are presented as advances from customers. |
| ● | Revenues from shipping and chartering services are recognized upon performance of services as stipulated in the underlying contracts. |
| ● | Revenues from inland transportation management services are recognized when commodities are being released from the customer’s warehouse. |
| ● | Revenues from ship management services are recognized when the related contractual services are rendered. |
| ● | Revenues from freight logistics services are recognized when the related contractual services are rendered. |
| ● | Revenues from container trucking services are recognized when the related contractual services are rendered. |
Basis of Consolidation
The Company’s consolidated financial statements include the accounts of the parent, its subsidiaries and its affiliates. All inter-company transactions and balances are eliminated in consolidation. Sino-Global Shipping Agency Ltd. (“Sino-China”) is considered to be a Variable Interest Entity (VIE) and the Company is the primary beneficiary. Because of the contractual arrangements, the Company had a pecuniary interest in Sino-China that requires consolidation of our and Sino-China’s financial statements. The accounts of Sino-China are consolidated in the accompanying consolidated financial statements pursuant to Accounting Standard Codification (“ASC”) 810-10, “Consolidation”. As a VIE, Sino-China’s revenues are included in our total revenues, its net loss from operations is consolidated with our net income (loss) before non-controlling interest. Our non-controlling interest in its net loss is then subtracted to calculate the net income attributable to the Company. The Company temporarily suspended its business with Sino-China in June 2014, therefore, there is no net income generated by Sino-China in the present.
Use of Estimates and Assumptions
Total working capital amountedThe preparation of the consolidated financial statements in conformity with U.S. GAAP requires management to $5,200,958 asmake estimates and assumptions that affect the reported amounts of assets and liabilities and disclosure of contingent assets and liabilities at September 30, 2014 comparedthe dates of the financial statements and the reported amounts of revenues and expenses during the reporting periods. Estimates are adjusted to $3,727,003 as at June 30, 2014. Total current assets increased by $1,396,020 or 28.2%reflect actual experience when necessary. Significant accounting estimates reflected in the Company’s consolidated financial statements include revenue recognition, fair value of stock based compensation, cost of revenues, allowance for doubtful accounts, deferred income taxes, and the useful lives of property and equipment. Since the use of estimates is an integral component of the financial reporting process, actual results could differ from $4,957,798 as at June 30, 2014 to $6,353,818 as at September 30, 2014. Increase in total current assets is due mainly to increase in cash and cash equivalents of approximately $2.65 million, increase in accounts receivable of approximately $0.48 million, offset by decrease in due from related parties of approximately $2.30 million.those estimates.
Current liabilities amounted to $1,152,860 as at September 30, 2014, in comparison to $1,230,795 as at June 30, 2014. The decrease was mainly attributable to decrease in accounts payable of $156,245 and decrease in accrued expenses of $35,808, offset by increase in advance from customers of $124,704.
Accounts Receivable
AsAccounts receivable are recognized at net realizable value. The Company maintains allowances for doubtful accounts for estimated losses resulting from the failure of customers to make required payments in the relevant time period. Management reviews the accounts receivable on a resultperiodic basis and record general and specific allowances when there is doubt as to the collectability of individual balances. In evaluating the collectability of individual receivable balances, we consider many factors, including the age of the overall increasebalance, the customer’s historical payment history, its current credit-worthiness and current economic trends. Receivables are considered past due after 365 days. Accounts are written off against the allowance only after exhaustive collection efforts.
Stock-based Compensation
Valuations are based upon highly subjective assumptions about the future, including stock price volatility and exercise patterns. The fair value of share-based payment awards was estimated using the Black-Scholes option pricing model. Expected volatilities are based on the historical volatility of the Company’s stock. The Company uses historical data to estimate option exercise and employee terminations. The expected term of options granted represents the period of time that options granted are expected to be outstanding. The risk-free rate for periods within the expected life of the option is based on the U.S. Treasury yield curve in our currenteffect at the time of the grant.
Taxation
Because the Company and its subsidiaries and Sino-China are incorporated in different jurisdictions, they file separate income tax returns. The Company uses the liability method of accounting for income taxes in accordance with U.S. Generally Accepted Accounting Principles (“US GAAP”). Deferred taxes, if any, are recognized for the future tax consequences of temporary differences between the tax basis of assets and liabilities and their reported amounts in the current ratio increasedconsolidated financial statements. A valuation allowance is provided against deferred tax assets if it is more likely than not that the asset will not be utilized in the future.
The Company recognizes the tax benefit from 4.03 atan uncertain tax position only if it is more likely than not that the tax position will be sustained on examination by the taxing authorities, based on the technical merits of the position. The Company recognizes interest and penalties, if any, related to unrecognized tax benefits as income tax expense. The Company had no uncertain tax positions as of June 30, 2014 to 5.51 at September 30, 2014.
2017 and 2016, respectively.
We believe that current cashIncome tax returns for the years prior to 2014 are no longer subject to examination by U.S. tax authorities. Income tax returns for the years prior to 2012 are no longer subject to examination by PRC authorities.
PRC Enterprise Income Tax
PRC enterprise income tax is calculated based on taxable income determined under the PRC Generally Accepted Accounting Principles (“PRC GAAP”) at 25%. Sino-China and cash equivalents,Trans Pacific are registered in PRC and governed by the anticipated cash flowEnterprise Income Tax Laws of the PRC.
PRC Business Tax and Surcharges
Revenues from our operations will be sufficientservices provided by the Company’s PRC subsidiaries and affiliates, including Sino-China and Trans Pacific are subject to meet our anticipated cash needs, including cash needs for working capitalthe PRC business tax of 5%. Business tax and capital expenditures, for at leastsurcharges are paid on gross revenues generated from shipping agency services minus the next 12 months. We may, however, require additional cash due to changing business conditionscosts of services which are paid on behalf of the customers.
Enterprises or other future developments, including any investmentsindividuals who sell commodities, engage in services or acquisitions we may decide to pursue. If our existing cash is insufficient to meet our requirements, we may seek to sell additional equity securities or borrow from banks. However, financing may not be availableselling of goods in the amounts we need or on terms acceptablePRC are subject to us, if at all. The sale of additional equity securities, including convertible debt securities, would dilute our shareholders. The incurrence of debt would divert cash from working capital and capital expenditures to service debt obligations and could result in operating and financial covenants that would restrict our operations and our ability to pay dividends to our shareholders.
Contractual Obligations and Commercial Commitments
We have leased certain office premisesunder operating leases through August 31, 2019. Below is a summary of our contractual obligations and commitments as of September 30, 2014:
| | | Amount | |
| | | | |
| Twelve months ending September 30, | | | | |
| | | | | |
| 2015 | | $ | 155,463 | |
| 2016 | | | 77,506 | |
| 2017 | | | 64,122 | |
| 2018 | | | 65,856 | |
| 2019 | | | 67,641 | |
| Thereafter | | | 5,649 | |
| | | $ | 436,237 | |
Company Structure
We conduct our operations primarily through our wholly-owned subsidiaries. As a result, our ability to pay dividends and to finance any debt we may incur depends upon dividends paid by our subsidiaries and management fees paid by Sino-China, our variable interest entity. If our subsidiaries incur debt on their own behalf in the future, the instruments governing their debt may restrict their ability to pay dividends to us. In addition, Trans Pacific, our subsidiary in China, is permitted to pay dividends to us only out of its retained earnings, if any, as determinedvalue added tax (“VAT”) in accordance with PRC accounting standardslaws. All of the Company’s revenue generated in the PRC are subject to a VAT on the gross sales price. The VAT rates are 6% and regulations. Under11%, depending on the type of services provided. The VAT may be offset by VAT paid by the Company on service.
In addition, under PRC law, wholly foreign-owned enterprises like Trans Pacificregulations, the Company’s PRC subsidiaries and affiliates are required to set aside at least 10% of their after-tax profit each year to fund a statutory reserve until the amount of the reserve reaches 50% of such entity’s registered capital.
pay city construction taxes (7%) and education surcharges (3%) based on calculated business tax payments.
ToThe Company’s PRC subsidiaries and affiliates report revenues net of PRC’s VAT, business tax and surcharges for all the extent Trans Pacific does not generate sufficient after-tax profits to fund this statutory reserve, its ability to pay dividends to us may be limited. Although these statutory reserves can be used, among other ways, to increase the registered capital and eliminate future losses in excess of retained earnings of the respective companies, these reserve funds are not distributable as cash dividends exceptperiods presented in the eventconsolidated statements of a solvent liquidation of the companies. Other than as described in the previous sentences, China’s State Administration of Foreign Exchange (“SAFE”) has approved the company structure between our company and Trans Pacific, and Trans Pacific is permitted to pay dividends to our company.operations.
Off-Balance Sheet Commitments and Arrangements
We have not entered into any financial guarantees or other commitments to guarantee the payment obligations of any third parties. We have not entered into any derivative contracts that are indexed to our shares and classified as shareholders’ equity or that are not reflected in ourconsolidated financial statements. Furthermore, we do not have any retained or contingent interest in assets transferred to an unconsolidated entity that serve as credit, liquidity or market risk support to such entity. We do not have any variable interest in any unconsolidated entity that provides financing, liquidity, market risk or credit support to us or engages in leasing, hedging or research and development services with us.
BUSINESS
Overview
We are Sino-Global Shipping America, Ltd., a Virginia corporation, was founded in the United States (“US”) in 2001. Sino is a non-asset based global shipping agency,and freight logistics integrated solution provider. Sino provides tailored solutions and ship managementvalue added services company.to its customers to drive effectiveness and control in related aspects throughout the entire shipping and freight logistics chain. Our current service offerings consist of inland transportation management services, freight logistics services, container trucking services and bulk cargo container services. We suspended our shipping agency and ship management services from the beginning of the fiscal year 2016, primarily due to changes in market conditions. We also suspended our shipping and chartering services inland transportation management servicesprimarily as a result of the termination of vessel acquisition in December 2015.
The Company conducts its business primarily through its wholly-owned subsidiaries in the U.S. (New York and ship management services. Substantially allCalifornia), China (including Hong Kong), Australia and Canada. Currently, a significant portion of our business is generated from our clients located in the People’s Republic of China (the “PRC”). In the third quarter of fiscal year 2017, the Company established ACH Trucking Center Corp. in New York as a joint venture with Jetta Global Logistics Inc. The Company owns 51% of ACH Trucking Center Corp. Although the establishment of ACH Center brought benefit for the Company and our operations are primarily conductedJetta Global, it could not satisfy long term development for both the Company and Jetta Global. The Company signed a termination agreement with Jetta Global to terminate the joint venture agreement on December 4, 2017. The organizational structure of the Company is set forth in the chart below.
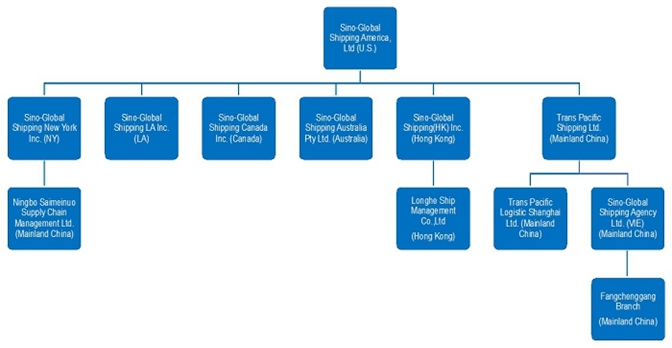
The Company’s subsidiary in China, Trans Pacific Shipping Limited (“Trans Pacific Beijing”), a wholly owned foreign enterprise, invested in one 90%-owned subsidiary, Trans Pacific Logistics Shanghai Limited (“Trans Pacific Shanghai”, and together with Trans Pacific Beijing, “Trans Pacific”). As PRC laws and regulations restrict foreign ownership of local shipping agency service businesses, the Company provided its shipping agency services in the PRC through Sino-Global Shipping Agency Ltd. (“Sino-China” or “VIE”), a Chinese legal entity, which holds the licenses and permits necessary to operate local shipping agency services in the PRC. Trans Pacific Beijing and Sino-China do not have a parent-subsidiary relationship. Trans Pacific Beijing has contractual arrangements with Sino-China and its shareholders that enable the Company to substantially control Sino-China. Through Sino-China, the Company was able to provide local shipping agency services in all commercial ports in the PRC. In light of the Company’s decision not to pursue the local shipping agency business, the Company has suspended its shipping agency services through its VIE and has not undertaken any business through or with Sino-China since June 2014. Nevertheless, the Company continues to maintain its contractual relationship with the VIE because Sino-China is one of the committee members of the China Association of Shipping Agencies & Non-Vessel-Operating Common Carriers (“CASA”). CASA was approved to form by China Ministry of Communications. Sino-China is also our only entity that is qualified to conduct the shipping agency business in China. We keep the VIE to prepare ourselves if the market turns around.
Currently, the Company’s inland transportation management services are operated by its subsidiaries in the PRC (including Hong Kong.Kong) and the U.S. Our freight logistics services are operated by our subsidiaries in the PRC, New York and California (Los Angeles). Our container trucking services are mainly operated by our subsidiaries and joint venture company in the PRC, New York and California (Los Angeles).
Corporate History and Our Business
Since our inception in 2001 and through our fiscal year ended June 30, 2013, our sole business was providing shipping agency services. In general, we provided two types of shipping agency services: loading/discharging services and protective agency services, in which we acted as a general agent to provide value added solutions to our customers. For loading/discharging agency services, we received the total payment from our customers in U.S. dollars and paid the port charges on behalf of our customers in RMB. For protective agency services, we charged a fixed amount as agent fee while customers are responsible for the payment of port costs and expenses. Under these circumstances, we generally required a portion of a customer’s payment in advance and billed the remaining balance within 30 days after the transaction were completed. We believe the most significant factors that directly or indirectly affected our shipping agency service revenues were:
| ● | the number of ship-times to which we provide port loading/discharging services; |
| | |
| ● | the size and types of ships we serve; |
| | |
| ● | the type of services we provide; |
| | |
| ● | the rate of service fees we charge; |
| | |
| ● | the number of ports at which we provide services; and |
| | |
| ● | the number of customers we serve. |
While we were able to consistently generate net revenues from suchshipping agency business, we werethis business was not ableprofitable largely due to achieve profitability as ourthe rising operating costs associated with doing business in China including the appreciation of RMB against U.S. dollar. In light of consecutive years of operating losses and expenses continuedconcerns raised by the U.S. regulators over our VIE structure, the Company decided to be higher than our net revenues.
reorganize its business structure in fiscal year 2013. Commencing in the latterlater part of fiscal year 2013 and continuing throughin fiscal year 2014, we took various actions to restructure our business with the goal of achieving a certain level of profitability. These actions included loweringAs a result of these business reorganization efforts, we optimized our operating costs and expenses, reducingcost structure, reduced our dependency on our shipping agency business, and hiring a new executive vice presidentshifted our shipping agency operation from our VIE to our wholly-owned subsidiaries in China and other consultants to assist us in implementing our business restructuring efforts.Hong Kong.
Also duringIn June 2013, the first and second quarters of fiscal year 2014, we expanded ourCompany executed a 5-year global logistics service platformagreement with TEWOO Chemical & Light Industry Zhiyuan Trade Co., Ltd, which is controlled by adding two new services: shipping and chartering services and inland transportation management services. These two new services were added to service certain specific business needs of theTianjin Zhiyuan Investment Group whoCo., Ltd (“Zhiyuan”). Zhiyuan is controlled by Mr. Zhong Zhang. Mr. Zhang and whopurchased 1,800,000 shares of our common stock for approximately $3 million in April 2013 as approved by our Board of Directors and shareholders, purchased from us 1,800,000 shares of our common stock for approximately $3.0 million, resulting inwhich made Mr. Zhang becoming our largest shareholder.
We added Leveraging our shipping and chartering service line to assist thebusiness relationship with Zhiyuan, Investment Group in a specific project of transporting approximately 51,000 tons of chromite from South Africa to China. Thereafter, we added our inland transportation management service line to assist the Zhiyuan Investment Group in its efforts to control the potential commodities loss incurred during the transportation process.
As part of our strategy to expandexpanded our service platform, in September 2014, as approved by our Board of Directors, we acquired LSM, a ship management company based in Hong Kong from Mr. Wang, the owner of approximately 3.2% of our outstanding common stock. Whileofferings to date the net revenues generated from such business have been immaterial, we believe that it is a good complement to our existing service platform. The acquisition of LSM will result in the issuance of between 20,000 and 200,000 shares of our common stock to Mr. Wang, depending on whether LSM reaches certain net income targets for the period July 4, 2014 through December 31, 2014.
Company History
We were incorporated as a New York corporation in February 2001 under the name “Sino-Global Shipping Consulting Ltd.” In September 2007, we reincorporated as a Virginia corporation under our current name Sino-Global Shipping America, Ltd.
Since our incorporation through fiscal year 2013, our sole business was to provide our customers with shipping agency services, primarily as a general agent. In fiscal year 2014, we entered into two new segments of the shipping business:include shipping and chartering services and inland transportation management services to diversify our business. Leveraging our in-depth knowledge of the shipping industry, inland transportation management services are our tailored value-added solution developed for Zhiyuan to prevent high-priced bulk from damage or loss during its inland transportation from warehouses to factories. Given the industry norm of 12% of loss rate during transportation, our integrated inland transportation solution significantly reduces bulk losses and effectively addresses issues in the freight logistics chain. In August 2017, the Company entered into a supplemental agreement with Zhiyuan to extend the service period until September 1, 2018. Furthermore, after we conducted an effective trial for Zhiyuan to reduce their bulk losses at the end of September 2014, Tengda Northwest Ferroalloy Co., Ltd. (“Tengda Northwest”) signed a contract with us to mitigate their bulk losses through our inland transportation management services. In July 2017 the Company entered into a supplemental agreement with Tengda Northwest to extend the service period until July 3, 2018.
In May 2014, the Company signed a strategic cooperation agreement with Qingdao Zhenghe Shipping Group Limited (“Zhenghe”), one of the largest shipping and transportation companies in China, to jointly explore mutually beneficial business development opportunities. In June 2014, Mr. Deming Wang, a major owner of Zhenghe, acquired 200,000 shares of the Company’s common stock. In August 2014, the Company executed an agreement to acquire all of the equity of Longhe Ship Management (Hong Kong) Co., Limited (“LSM”) through its subsidiary, Sino-Global Shipping (HK) Inc. from Mr. Wang, to further broaden our scope of services and expertise in the ship management business. Due to market condition and high operating costs associated with this business line, the Company decided to suspend the ship management business starting from the fiscal year 2016.
On April 10, 2015, the Company entered into an Asset Purchase Agreement with Rong Yao International Shipping Limited, a Hong Kong company (the “Vessel Seller”), pursuant to which the Company agreed to acquire, subject to a number of closing conditions, “Rong Zhou”, an 8,818 gross tonnage oil/chemical transportation tanker (the “Vessel”) from the Vessel Seller; and in connection therewith, the Company issued to the Vessel Seller 1.2 million shares of its restricted common stock representing $2,220,000 of the $10.5 million purchase price for the Vessel. On December 7, 2015, the Company and the Vessel Seller entered into a supplemental agreement to terminate the proposed Vessel acquisition.
The Company received $330,000 from the Vessel Seller in December 2015 in connection with the termination. The 1.2 million shares were returned to the Company on February 12, 2016 and were thereafter cancelled. In connection with the termination of the acquisition of Rong Yao International Shipping Limited (“Rong Yao”) on December 7, 2015, the Company realigned its development strategy and suspended shipping and chartering services until the economy is improved.
In January 2016, the Company formed a new subsidiary, Sino-Global Shipping LA Inc. (“Sino LA”), for the purpose of expanding its business to provide import security filing services with U.S Customs and Department of Homeland Security, on behalf of importers who ship goods into the U.S. and also providing inland transportation services to these importers in the U.S. On April 18, 2016, Sino LA signed a Memorandum of Understanding (“MOU”) with Yaxin International Co., Ltd. (“Yaxin”), pursuant to which Sino LA will provide logistics services to Yaxin, who ship goods via containers into the U.S. and places them onAmazon.com. The services include cargo forwarding, customs filing and declaration, trucking and other services.
In May 2016, the Company entered into a strategic partnership with Shandong Hi-speed TEU Logistics Co., LTD. (“Shandong Hi-speed TEU”), which belongs to one of China’s largest state-owned enterprises, Shandong Hi-Speed Group Co., Ltd., to jointly establish a platform for coordinated transport between China and North America. The Company and Shandong Hi-speed TEU intend to cooperate in creating a standardized network that will unite carriers of the twenty-foot equivalent units or TEUs in China via sea and rail and coordinate with parties in North America and Australia. The companies will serve both upstream and downstream customers through the platform, establish a door-to-door logistics and provide supply chain service.
In fiscal year 2016, affected by worsening market conditions in the shipping industry, the Company’s shipping agency business sector suffered a significant decrease in revenue due to a reduced number of ships served. As a result, the Company has suspended its shipping agency services business. Also as a result of these market condition changes, the Company has suspended its shipping management services business. In addition, in December 2015, the Company suspended its shipping and chartering services business, primarily as a result of the termination of a previously-contemplated vessel acquisition. As of December 31, 2017, the Company’s business segments consist of inland transportation management services, freight logistics services, container trucking services and bulk cargo container services.
In August 2016, the Board authorized management to move forward with the development of a mobile application that will provide a full-service logistics platform between the U.S. and the PRC for short-haul trucking in the U.S.
Sino-Global completed development of a full-service logistics platform as of December 2016. Upon the completion of the platform, the Company signed two significant agreements with COSCO Beijing International Freight Co., Ltd. (“COSFRE Beijing”) and Sino-Trans Guangxi in December 2016. Pursuant to the agreement with COSFRE Beijing, the Company will receive a percentage of the total amount of each transportation fee for the arrangement of inland transportation services for COSFRE Beijing’s container shipments into U.S. ports. For the strategic cooperation framework agreement with Sino-Trans Guangxi, which is a subsidiary of Sino-Trans Limited, the Company expects to utilize both parties’ existing resources and establish an integrated logistics plan to provide an end-to-end supply chain solution for customers shipping soybeans and sulfur products from the U.S. to southern PRC via container.
On January 5, 2017, the Company entered into a joint venture agreement and formed a new joint venture company named ACH Trucking Center Corp. (“ACH Center”) with Jetta Global Logistics Inc. (“Jetta Global”). Along with the establishment of ACH Center, the Company began providing short haul trucking transportation and logistics services to customers located in the New York and New Jersey areas. The Company holds a 51% ownership stake in ACH Center. Although the establishment of ACH Center brought benefits for the Company and Jetta Global, it could not satisfy long term development for both the Company and Jetta Global. The Company signed a termination agreement with Jetta Global to terminate the joint venture agreement on December 4, 2017. As the operating revenue generated by ACH Center was less than 1% of the Company’s consolidated revenue and the termination of the joint venture did not constitute a strategic shift that will have a major effect on the Company’s operations and financial results, the results of operations for ACH Center was not reported as discontinued operations under the guidance of Accounting Standards Codification 205.
On January 9, 2017, the Company entered into a strategic cooperation agreement with China Ocean Shipping Agency Qingdao Co. Ltd. (“COSCO Qingdao”). COSCO Qingdao will utilize the Company’s full-service logistics platform to arrange the transportation of its container shipments into U.S. ports. Sino-Global will receive a percentage of the total amount of each transportation fee in exchange for the arrangement of inland transportation services for COSCO Qingdao’s container shipments into U.S. ports.
On February 18, 2017, the Company entered into a cooperative transportation agreement with a related party, Zhiyuan International Investment & Holding Group (Hong Kong) Co., Ltd. (“Zhiyuan Hong Kong”). Zhiyuan Hong Kong, jointly with China Minmetals Corporation and China Metallurgical Group Corporation, acts as the general designer, general equipment provider and general service contractor in the upgrade and renovation project of Perwaja Steel, located in Malaysia (the “Project”). The Company agreed to provide high-quality services, including the design of a detailed transportation plan as well as execution and necessary supervision of the plan at Zhiyuan Hong Kong’s demand, in consideration for which the Company will receive a 1% to 1.25% transportation fee incurred in the Project as a commission for its services rendered (see Note 3 and Note 15). On July 7, 2017, the Company signed a supplemental agreement with Zhiyuan Hong Kong, pursuant to which the Company will cooperate with Zhiyuan Hong Kong exclusively on the entire Project’s transportation needs. Pursuant to the supplemental agreement, the Company agrees to make prepayments to Zhiyuan Hong Kong for its share of packaging and transporting costs related to the Project; in return, the Company will receive 15% of the cost incurred in the Project from Zhiyuan Hong Kong as a service fee. The Project is expected to be completed in one to two years and the Company will collect its service fee in accordance with Project completion.
On September 11, 2017, the Company set up a new wholly-owned subsidiary, Ningbo Saimeinuo Supply Chain Management Ltd. (“Sino Ningbo”), via the wholly-owned entity, Sino-Global Shipping New York Inc. This subsidiary primarily engages in supply chain management and freight logistics services.
Our Strategy
Our strategy is to:
| ● | Provide better solutions for issues and challenges faced by the entire shipping and freight logistic chain to better serve our customers and explore additional growth avenues; |
| ● | Diversify our current service offerings organically or through acquisitions and/or strategic alliance; continue to grow our business in the U.S. market; |
| ● | Continue to streamline our business practice, optimize our cost structure and improve our operating efficiency through effective planning, budgeting, execution and cost control; |
| ● | Continue to reduce our dependency on our legacy business and few key customers; and |
| ● | Continue to monetize our relationships with our strategic partners and leverage their support and our innovation to expand our business. |
Our Management Team
We believe we have a strong and experienced management team including our Chief Executive Officer and Chairman, Mr. Lei Cao; our Acting Chief Financial Officer, Ms. Tuo Pan; our Chief Operating Officer, Mr. Zhikang Huang; and our Chief Technical Officer, Mr. Yafei Li, who, together as a team, have many years of experience, extensive business connections in the shipping industry in China, and substantial experience in SEC reporting and compliance, business reorganization, mergers and acquisitions, accounting, risk management and operations of both public and private companies.
Business Segments
As of December 31, 2017, Sino-Global delivers inland transportation management services, freight logistics services, container trucking services and bulk cargo container services to our customers.
Historically, the Company was in the business of solely providing shipping agency services. In fiscal year 2014, by leveraging the support of Sino-Global’s largest shareholder, Mr. Zhang and the company he controls, Zhiyuan Investment Group, the Company expanded its service platform to include shipping and chartering services during the quarter ended September 30, 2013 and inland transportation management services during the quarter ended December 31, 2013. We suspended shipping and chartering services as a result of the termination of the vessel acquisition in December 2015. With the acquisition of LSM in 2014, we added ship management services to our service platform but we suspended it together with shipping agency services in 2016 primarily due to market conditions. With the acquisitionestablishment of Longhe Ship Management (HK) Co., Ltd.Sino-LA, we added cargo forwarding services to our service platform in the second quarter of fiscal 2017, which is included in our inland transportation business line at the end of June 30, 2016. As we are developing our cargo forwarding services, the Company provides freight logistics services and container trucking services as two new business segments during fiscal year 2017. We began to provide bulk cargo container services from the first quarter of fiscal year 2018.
The following diagram illustrates our corporate structure:Our Goals and Strategic Plan
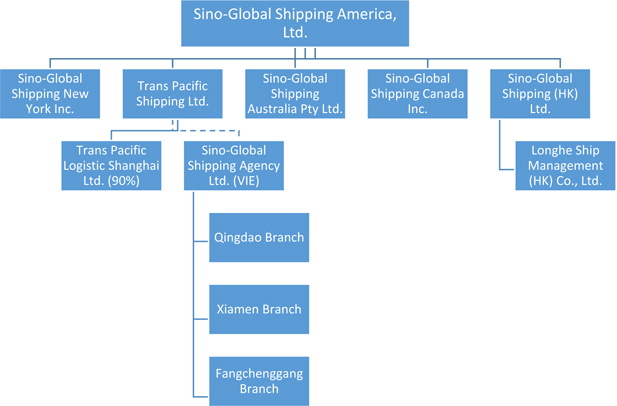
Trans Pacific Shipping Ltd. isWe historically focused our wholly owned subsidiary locatedbusiness on providing our customers with customized shipping agency services. In the past, our business came predominately from our strong business relationships with our key strategic partners in China which isChina. To reduce our dependency on a single business line, we have leveraged, and will continue to leverage, our business relationships with strategic partners to introduce new service offerings to the owner of 90%market and to diversify our business. In light of the equityslowdown of Transthe Chinese economy and its negative impact on the shipping business across the Pacific Logistic Shanghai Ltd.Ocean, our strategic plan for the next 5 years is to continue to diversify our service mix and actively seek new growth opportunities to expand our business footprint in the U.S. market to reduce our dependency on the revenue generated from China. For decades, the shipping industry has been operated under traditional business models without many meaningful changes. Today, technological innovation has already played a big role in changing every conventional industry. We referbelieve theinternet will be a big part of the future logistics chain services and a transformative era in shipping and freight logistic business is coming. As an innovative solution provider, we plan to Trans Pacific Shipping Ltd.apply our technical ability, industry expertise and Trans Pacific Logistics Shanghai Ltd. collectively as “Trans Pacific.”.cutting-edge information technology in the conventional shipping business tobetter connect supply and demand and to develop seamless linkages in logistic chains.
Until fiscal year 2014, because PRC laws and regulations restrict foreign ownership of entitiesAfter going through two years on our business restructuring, Sino changed its business models from providing traditional shipping agency services we conducted a substantial portion of our shipping agencyto providing solutions and services infocused on inland transportation logistics between the PRC through Sino-China, our VIE, which we control through contractual arrangements between Sino-China, its shareholdersU.S. and Trans Pacific. Sino-China is headquartered in Beijing with branches in Qingdao, XiamenChina, such as providing freight logistics services, container trucking services and Fangchenggang and holds the licenses and permits necessary to operate and provide shipping services in the PRC. Through Sino-China, we are able to provide services in all commercial ports in the PRC.
In light of rising operating costs and expenses associated with doing business in China, consecutive years of operating losses reported by Sino-China, concerns raised by the US regulators over the last few years about VIE’s and our belief that the investing public may have a negative perception of publicly traded companies with VIE structures, we decided to reorganize our shipping agency business in fiscal year 2013.bulk cargo container services. As a result of our reorganizationcontinued restructuring efforts, we reduced our overhead, changed our service mix, stopped providing agency services to Shourong, one of our largest customers, and shifted our agency business operation from Sino-China to our wholly-owned subsidiaries in China and Hong Kong.
Shipping Agency Business
We provide two types of customized general agency services to our customers: loading/discharging services and protective services. Generally, our loading/discharging services involve the appointment of local agentsturned an operating loss for the arrangement of ship's berthing/unberthing and loading/unloading operations; while our protective services focus mainly onyear ended June 30, 2016 to a profit for the issuance of the document - Laytime Statement of Facts after completion of loading. For protective services, we charge customers fixed fees,year ended June 30, 2017 and the customers are responsible for the payment of port costs and expenses. For loading/discharging services, our customers pay us an inclusive fee out of which we pay the port charges on our customers’ behalf. We generally require payments in advance from customers and bill them the balances within 30 days after the transactions are completed.
We believe the most significant factors that directly or indirectly affect our shipping agency service revenues are:
| · | the number of ships to which we provide port loading/discharging services; |
| · | the size and types of ships we serve; |
| · | the type of services we provide; |
| · | the rate of service fees we charge; |
| · | the number of ports at which we provide services; and |
| · | the number of customers we serve. |
During fiscal year 2014, we served a total of 312 ships: 60 related to loading/discharging services (loading raw materials such as iron ore or coal) from Brazilian, South African, Australian and Canadian ports to China); and 252 related to protective services where we served as owner's protecting agent for 30 Chinese ports.
In fiscal year 2014, our shipping agency business generated net revenues of approximately $7.5 million and gross profit of approximately $1.5 million. For the threesix months ended September 30, 2014, our shipping agency business generated net revenues of approximately $1.6 million and gross profit of approximately $350,000.
Shipping and Chartering Services
In September 2013, we entered into a shipping and chartering service agreement with the Zhiyuan Investment Group pursuant to which we assisted the Zhiyuan Investment GroupDecember 31, 2017. As shown in the transportation of approximately 51,000 tons of chromite oretable below, our current business operating revenue is generated primarily from South Africa to China which resulted in net revenues of approximately $1.9 million and gross profit of approximately $0.6 million to us in fiscal year 2014. We did not provide any shipping and chartering services to any customers in the three months ended September 30, 2014.
Our shipping and chartering services include the arrangement of appropriate commercial vessels to transport our customer’s products and the appointment of respective vessel and port agents. Fees for shipping and chartering services are usually based upon the material and tonnage to be shipped.
Inland Transportation Management Services
In September 2013, we entered into an inland transportation management service contract with the Zhiyuan Investment Group pursuant to which we agreed to provide certain advisory services designed to control potential commodities loss during the transportation process. Working closely with the Zhiyuan Investment Group’s logistics department, our inland transportation management services segment generated net revenues of approximately $2.2 million and gross profit of approximately $1.9 million in fiscal year 2014. For the three months ended September 30, 2014, our inland transportation management services generated revenues of approximately $0.95 million and gross profit of approximately $0.82 million.
Our inland transportation management services are focused on optimizing the local transportation process and controlling the potential commodities loss as they are being transported from port to warehouse to final customer destination. Generally this involves evaluating available transport services, usually rail or truck and determining which provides the most cost effective solution. The fees that we receive for these services are based upon the material and the tonnage shipped.
Together, shipping and charteringfreight logistic services and inland transportation management services.
| | | Six Months Ended
December 31, 2017 | | | Fiscal Year 2017 | | | Fiscal Year 2016 | |
| Key Services | | Revenue | | | % | | | Revenue | | | % | | | Revenue | | | % | |
| Shipping Agency & Ship Management | | $ | - | | | | - | | | $ | - | | | | - | % | | $ | 2,507,800 | | | | 34 | % |
| Shipping & Chartering | | | - | | | | - | | | | - | | | | - | % | | | 462,218 | | | | 7 | % |
| Inland Transportation Management | | | 2,812,307 | | | | 27 | % | | | 5,758,600 | | | | 50 | % | | | 4,340,522 | | | | 59 | % |
| Freight Logistic Services | | | 6,600,212 | | | | 62 | % | | | 4,815,450 | | | | 42 | % | | | - | | | | - | % |
| Bulk Cargo Container Services | | | 608,267 | | | | 6 | % | | | - | | | | - | % | | | - | | | | - | % |
| Container Trucking Services | | | 579,706 | | | | 5 | % | | | 871,563 | | | | 8 | % | | | - | | | | - | % |
| | | | | | | | | | | | | | | | | | | | | | | | | |
| Total | | $ | 10,600,492 | | | | 100 | % | | $ | 11,445,613 | | | | 100 | % | | $ | 7,310,540 | | | | 100 | % |
The business restructuring of Sino is gradually on track. During this process, we will continue to adjust and develop our strategic plans based on the change of business environment. In the future, we will provide more services to our customers, and we will use our internet platform to connect our worldwide businesses to our customers.
Our Customers
For the six months ended December 31, 2017, three customers accounted for 35.4%54%, 16% and 11% of ourthe Company’s revenues, respectively. For the six months ended December 31, 2016, three customers accounted for 36%, 36% and 12% of the Company’s revenues, respectively.
Our Suppliers
For the six months ended December 31, 2017, one supplier accounted for 71% of the total revenuescosts of revenue. For the six months ended December 31, 2016, two suppliers accounted for 28% and 62.4%10% of our gross profit in fiscal year 2014.
the total costs of revenue, respectively.
Ship Management Services
In September 2014, we acquired LSM, a ship management service company based in Hong Kong from Mr. Wang. LSM currently manages seven vessels and outsources the actual ship management duties (which include among other things, crew, technical and insurance arrangements) to Qingdao Longhe Ship Management Services Co., Ltd., a company controlled by Mr. Wang.The ship management services generated revenuesTable of $47,587 from September 8, 2014 to September 30, 2014.Contents
Sales and Marketing
To date, we do not have a formal sales and marketing plan, but rather have obtained our business through “word-of-mouth” and our existing business relationships in China.
Market Background
According to the National Bureau of Statistics of the PRC, China’s nominal GDP grew at a compound annual growth rate of 15.8% between 1980 and 2013 and reached RMB 56.9 trillion in 2013. Adjusted for inflation, China’s real GDP maintained an average annual growth rate of 9.9% between 1980 and 2013, significantly outpacing the world’s other major economies, such as the United States, Japan, India and Germany. Since 2010, China has been the world’s second largest economy behind the United States.

Source: National Bureau of Statistics of the PRC

Source: National Bureau of Statistics of the PRC
Growth of foreign trade, including both exports and imports, has been a major component supporting China’s rapid economic expansion over the past thirty plus years. According to data compiled by National Bureau of Statistics and General Administration of Customs of the PRC, China became the world’s biggest trading nation in 2012, with the total value of exports and imports reaching $3.87 trillion and surpassing those of the United States. In 2013, the total value of exports and imports for China further increased 7.6% to $4.16 trillion, with exports growing 7.9% to $2.21 trillion and imports growing 7.3% to $1.95 trillion. As a result of the rapid expansion of international trade between China and other countries, the shipping industry in China has also grown.
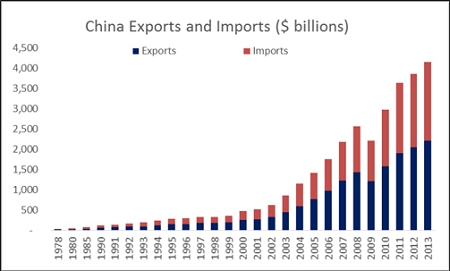
Source: National Bureau of Statistics of the PRC; General Administration of Customs of the PRC
The evolution of the shipping agency and logistics businesses in the PRC has followed that of the shipping industry in general. China’s shipping industry with its relatively short modern history of only 60 plus years, is very different from its counterparts in the US and Europe, as highlighted by a lack of information transparency, lack of standardized port operations, and Chinese governmental restrictions on foreign shipping companies.Our Strengths
We believe that the following strengths differentiate us from our competitors:
| ● | Proven industry experience and problem-solving reputation. We are a non-asset based global shipping and freight logistics solution provider. Unlike a traditional shipping agent, we provide tailored solutions and value-added services to our customers to drive effectiveness and control in related aspects throughout the entire shipping and freight logistic chain. We believe that our years of successful track record of applying integrated solutions to complex issues in the global shipping logistics business gives us a competitive advantage in attracting large clients and helps us maintain strong long terms business relationship with them. |
| ● | Strong leadership and a competent professional team. Our CEO is an industry veteran with more than thirty years of extensive industry experiences including ten years’ working for COSCO, one of the largest shipping companies in the world. Most of our employees have marine business experience, and many of our managers/chief operators served in other large Chinese shipping companies prior to joining us. With these professionals and experienced staff, we believe that we provide the best services to our customers at competitive prices. |
| ● | Extensive network and positive industry recognition.Doing business in China often requires a strong business network and support of key strategic partners. The Company served as one of the executive directors of China Association of Shipping Agencies & Non-Vessel-Operating Common Carriers (CASA), the authoritative industry association in China. We are the only non-state-owned enterprise represented on the CASA board guiding the development of the industry. Our good reputation and industry recognition enables us to maintain strong relationships with our business partners and have an extensive network of contacts throughout the industry, which helps us gain necessary support to execute our business plans. |
| ● | Lean organization and a flexible business model.Although we are a small business with limited resources, we have a cohesive and effective organizational structure with the goal of maximizing customer value while minimizing waste. Our unique flexible business model allows us to quickly respond to changing market demand and offer our customers innovative problem-solving solutions, quality customer service, and competitive prices to achieve greater market acceptance and gain additional market share. |
| ● | U.S.-registered and NASDAQ-listed public company. We believe our status as a U.S. corporation gives us more credibility among existing and potential customers, suppliers, and other business partners than a privately owned company would have in our industry. Our ability to raise capital through the capital market or use our common stock as “currency” to facility potential merger and acquisition transactions can also help us carry out or accelerated our growth strategies. |
Our Opportunities
For more than thirty years, the shipping and freight logistic industry has been operated under traditional business models without meaningful change. Many of these business practices are inefficient and problematic; therefore, maintaining an innovative mindset is critical to achieving continuous business success and growth. We are a seasoned shipping agentvalue-added logistics solution provider with successful past performance and NASDAQ-listed companyindividuals that have been in the industry for a long time. Instead of playing the traditional logistics broker role, we focus on providing technology solutions and innovative leading-edge services to bridge the asset-based world with extensive business relationshipsthe digital world. We shape our industry practice and profit model by analyzing wider developments both in Chinathe global markets and overseas,the technology industry so we can address unique problems that are well positioned betweencurrently pervasive across the state-owned agency giantsshipping and local agents to provide our customers with economical yet customized general shipping agency services.freight logistics industry.
CustomersWe believe we can capture the business opportunity and grow our business organically or through acquisitions or strategic alliance by:
| ● | Continuing to streamline our business operations and improve our operating efficiency through innovative technology, effective planning, budgeting, execution and cost control; |
| ● | Restructuring our business to focus on providing innovative technology based solution to our customers to promote our sustainable business growth; |
| ● | Developing new service lines along the shipping and freight logistic industry value chain, and leveraging our relationships with COSCO, Zhiyuan Investment Group and other potential strategic business partners to expand our global business footprint. |
Our Challenges
SinceWe face significant challenges when executing our initial public offering in 2008, our revenues have come primarily from a few key customers. Prior to the restructuring of our shipping agency business in fiscal year 2014, a significant portion of our revenues were driven by Shourong. In light of our strategic relationship with the Zhiyuan Investment Group that began with the signing of a 5-year global logistics service agreement in June 2013, we expanded our business platform to include shipping and chartering services and inland transportation management services. Revenues from these two new services provided to the Zhiyuan Investment Group amounted to approximately $4.1 million or approximately 35% of total net revenues for fiscal year 2014. For the three months ended September 30, 2014, three customers, Tengda Northwest Ferroalloy Co., Ltd., BAO NYK Shipping Pte. Ltd., and the Zhiyuan Investment Group accounted for approximately 23%, 20% and 14% of our revenues, respectively; and for the same period in 2013, two customers, BAO NYK Shipping Pte. Ltd. and the Zhiyuan Investment Group accounted for approximately 57% and 21% of our revenues, respectively. For fiscal year 2014, two customers, the Zhiyuan Investment Group and BAO NYK Shipping Pte. Ltd. accounted for approximately 35% and 18% of our revenues, respectively. For fiscal year 2013, approximately 63% of our net revenues were from Shourong.
strategy, including:
| ● | Given the complexity and length of restructuring our business, we face the challenge of generating sufficient cash from our current business activities to support our daily operations during the transition; |
Vendors
| ● | We may not be able to establish a separate department to solve critical issues in today’s shipping logistics industry; |
| ● | We may not have or not be able to get the necessary funds to continue to expand our services and market our services successfully; |
| ● | Our ability to respond to increasing competitive pressure on our growth and margins; |
| ● | Our ability to gain further expertise and to serve new customers in new service areas; |
| ● | From time to time, we may have difficulty carrying out services effectively and in a profitable way due to the cyclical nature of the shipping industry, which could lead to a prolonged period of sluggish demand for our services; |
| ● | Our ability to respond promptly to a changing regulatory environment, macroeconomic conditions, industry trends, and competitive landscape; and |
| ● | Developing a winning business model takes time and a new business model may not be recognized by the market immediately. As a publicly traded company, management may be forced to fulfill near-term performance goals that may not be consistent with the Company’s long-term vision. |
Much of our operations consist of working directly with our customers to understand in detail their needs and expectations and then managing local vendors to ensure that our customers’ needs are met. For the three months ended September 30, 2014, three vendors, Monson Agencies Australia Pty. Ltd., Wilson, Sons, Agencia Maritima Ltda., and ACGI Shipping Inc. accounted for approximately 47%, 18% and 13% of the total cost of our revenues, respectively, and for the three months ended September 30, 2013, two vendors, China Cosco Bulk Shipping (Group) Co., Ltd. and Monson Agencies Australia Pty. Ltd. accounted for approximately 53% and 40% of the total cost of revenues, respectively. For fiscal year 2014, two vendors, Wilson, Sons, Agencia Maritima Ltda. and ACGI Shipping Inc. accounted for approximately 21% and 12% of the total cost of revenues, respectively; and for fiscal year 2013, two vendors, Tangshan Hengye Shipping Agent Co., Ltd. and China Shipping Agency Qinhuangdao Co., Ltd. accounted for approximately 22% and 10% of the total cost of our revenues.
Our Competition
The market segments that we serve do not have high entry barriers. There are many companies ranging from small to large in China that provide shipping and freight-related logistics services. At present, the state-owned companies in China still dominate the industry and generate a majority of the revenues in the industry. These companies have greater service capabilities, a larger customer base and more financial, marketing, network and human resources than we do. Most of them concentrate their business on shipping agency services to meet general market demand. However, we focus on providing tailored solutions and value-added services to select high-profile customers to drive effectiveness and control in related aspects throughout the entire shipping and freight logistic chain. As a smallboutique company that provides specialized services with limited resources and history, we face intense competition in the PRC.
We believeparticular market segments that there are hundreds of licensed shipping agencies in China. At present, the state-owned shipping agency companies, namely Penavico, Sinoagent, CSA and Cosa, still dominate China’s shipping agency industry, combining to generate majority of the revenues in the industry.we serve. Our ability to be successful in our industry depends on our deep understanding of the complexity of industry issues and challenges and our technical ability to develop best solutions to respond to the identified issues and provide effective problem-solving strategies to our targeted customers to achieve the fastest and most cost-effective outcomes. Our value-added services and innovative approaches are highly recognized by our customers, which helps us to gain additional market share and compete effectively with companies that may be better capitalized than we are or may provide shipping agency services we do not or cannot provide to our customers. While China’s shipping agency industry has a variety of small shipping agencies, our primary competitors are Penavico, Sinoagent and CSA. These companies are state-owned in part and much larger than we are and derive significantly more revenue from shipping agency services in China.
• Penavico. Founded in 1953, Penavico is the oldest and largest state-owned shipping agency in China. Beginning in 1955, Penavico took over China’s shipping agency business from the foreign agents that previously did business in China and, until 1985, Penavico was the only shipping agency operating in China. Penavico now has more than 80 local agencies and 300 business networks across China. Penavico maintains offices in America, Europe, Japan, Korea, Singapore and Hong Kong. Penavico’s shipping agency business, bulk ships and container ships currently account for approximately 40% of China’s market.
• Sinoagent. Sinoagent was formed in 1985 as a specialized subsidiary of Sinotrans Limited Company (“Sinotrans”), a company that provides integrated ocean transportation, land transport, airfreight, warehousing, express services, shipping agency and freight forwarding services. Due to its relationship with Sinotrans, Sinoagent is able to provide a seamless, integrated set of services to its customers. Sinoagent is the second largest state-owned shipping agency and has approximately 30% of shipping agency market in China.
• CSA. CSA, established in 1997, and an affiliate of China Shipping Group, specializes in the shipping agency business for both domestic and international vessels and other related businesses such as cargo agency and customs declaration. With its headquarters in Shanghai, CSA has set up more than 54 subsidiaries in major ports along the national coastline, the Yangtze River and the Pearl River of China. The subsidiaries undertake shipping agency business as well as cargo agency business and customs declaration etc. for both Chinese and foreign vessels navigating among the international lines and the vessels calling HK, Macao, Taiwan areas, and the coastlines and other water areas of China.
We believe that the three shipping agents’ primary strengths include the following:
• the establishment of a complete port network in mainland China;
• the presence of a large base of clients; and
• the availability of funding and financial support from state-owned financial institutions.
With respect to the shipping and chartering services and inland transportation management services, our competition are local companies that have good business relationships and a mature business platform. We are a new market entrant and until we master the tricks of the trade and enhance our operational efficiency, it is difficult to be profitable without the support of Zhiyuan.
Regulations on Foreign Exchange
Foreign Currency Exchange. Pursuant to the Foreign Currency Administration Rules promulgated in 1996, as amended in 2007 and 2008, and various regulations issued by State Administration of Foreign Exchange (“SAFE”), and other relevant PRC government authorities, RMB is freely convertible only to the extent of current account items, such as trade related receipts and payments, interests and dividends. Capital account items, such as direct equity investments, loans and repatriation of investment, require prior approval from SAFE or its provincial branch for conversion of RMB into a foreign currency, such as U.S. dollars, and remittance of the foreign currency outside the PRC. Payments for transactions that take place within the PRC must be made in RMB. Unless otherwise approved, PRC companies must repatriate foreign currency payments received from abroad. Foreign-invested enterprises may retain foreign exchange in accounts with designated foreign exchange banks subject to a cap set by SAFE or its local counterpart. Unless otherwise approved, domestic enterprises must convert all of their foreign currency receipts into RMB.
Dividend Distribution. The principal regulations governing divided distributions by wholly foreign-owned enterprises and Sino-foreign equity joint ventures include:
• Wholly Foreign-Owned Enterprise Law (1986), as amended;
• Wholly Foreign-Owned Enterprise Law Implementing Rules (1990), as amended;
• Sino-Foreign Equity Joint Venture Enterprise Law (1979), as amended; and
• Sino-Foreign Equity Joint Venture Enterprise Law Implementing Rules (1983), as amended.
Under these regulations, wholly foreign-owned enterprises and Sino-foreign equity joint ventures in the PRC may pay dividends only out of their accumulated profits, if any, as determined in accordance with PRC accounting standards and regulations. Additionally, these foreign-invested enterprises are required to set aside certain amounts of their accumulated profits each year, if any, to fund certain reserve funds. These reserves are not distributable as cash dividends.
Regulation of foreign exchange in certain onshore and offshore transactions. Under recent notices issued by SAFE, PRC residents are required to register with and receive approvals from SAFE in connection with offshore investment activities. SAFE has stated that the purpose of these notices is to ensure the proper balance of foreign exchange and the standardization of cross-border flow of funds.
In January 2005, SAFE issued a notice stating that SAFE approval is required for any sale or transfer by PRC residents of a PRC company’s assets or equity interests to foreign entities in exchange for the equity interests or assets of the foreign entities. The notice also states that, when registering with the foreign exchange authorities, a PRC company acquired by an offshore company must clarify whether the offshore company is controlled or owned by PRC residents and whether there is any share or asset link between or among the parties to the acquisition transaction.
In April 2005, SAFE issued another notice further explaining and expanding upon the January notice. The April notice clarified that, where a PRC company is acquired by an offshore company in which PRC residents directly or indirectly hold shares, such PRC residents must (i) register with the local SAFE branch regarding their respective ownership interests in the offshore company, even if the transaction occurred prior to the January notice, and (ii) file amendments to such registration concerning any material events of the offshore company, such as changes in share capital and share transfers. The April notice also expanded the statutory definition of the term “foreign acquisition,” making the notices applicable to any transaction that results in PRC residents directly or indirectly holding shares in the offshore company that has an ownership interest in a PRC company. The April notice also provided that failure to comply with the registration procedures set forth therein may result in the imposition of restrictions on the PRC company’s foreign exchange activities and its ability to distribute profits to its offshore parent company.
On October 21, 2005, SAFE issued a new public notice concerning PRC residents’ investments through offshore investment vehicles. This notice took effect on November 1, 2005 and replaces prior SAFE notices on this topic. According to the November 2005 notice:
• any PRC resident that created an off-shore holding company structure prior to the effective date of the November notice must submit a registration form to a local SAFE branch to register his or her ownership interest in the offshore company on or before May 31, 2006;
• any PRC resident that purchases shares in a public offering of a foreign company would also be required to register such shares an notify SAFE of any change of their ownership interest; and
• following the completion of an off-shore financing, any PRC shareholder may transfer proceeds from the financing into China for use within China.
In accordance with the October 2005 notice, on December 12, 2007, Mr. Lei Cao obtained appropriate registration from their local SAFE offices.
Employees
As of September 30, 2014,the date of this prospectus, we had 16have 25 employees, 814 of whom are based in China. Of the total, 3four are in management, 4twelve are in operations, 5five are in financial affairs,finance and 4accounting and three are in administration and technical support. We believe that our relationship with our employees is good. We have never had a work stoppage, and our employees are not subject to a collective bargaining agreement.
Recent Developments
March 2018 Financing
On March 12, 2018, we entered into a Securities Purchase Agreement (the “Purchase Agreement”) with the investors specified on the signature page thereto (the “Investors”) pursuant to which we agreed to sell to the Investors, and the Investors agreed to purchase from us, in a registered direct offering, an aggregate of 2,000,000 shares (the “Shares”) of our common stock, at a purchase price of $1.50 per Share, for aggregate gross proceeds to us of $3 million. We also agreed to sell to the Investors Series A Warrants to purchase up to an aggregate of 2,000,000 shares of our common stock at an exercise price of $1.75 per share and Series B Warrants to purchase up to an aggregate of 2,000,000 shares of our common stock at an exercise price of $1.75 per share.
Net proceeds to us from the sale of the Shares and the Warrants, after deducting estimated offering expenses and placement agent fees, were approximately $2.6 million. The offering closed on March 14, 2018.
The offering of the Shares was made pursuant to our effective shelf registration statement on Form S-3 (File No. 333-222098), which was originally filed with the SEC on December 15, 2017 and was declared effective by the SEC on February 16, 2018. The offering of the Warrants was made pursuant to an exemption from the registration requirements of Section 5 of the Securities Act contained in Section 4(a)(2) thereof and/or Regulation D promulgated thereunder.
Other Matters
Sino has signed joint project agreements with Sinotrans Guangxi and COSFRE Beijing during the fourth quarter of fiscal year 2017. The project will involve a shift from the current bulk cargo transportation model to a containerized model. The Company has started a trial by facilitating the delivery of Sulphur from Long Beach, California, in the U.S., to Fangcheng Port, Guangxi, PRC and ultimately to the warehouse of the customer. The related revenue and cost of revenue has been recognized during first quarter of fiscal year 2018. During the second quarter of fiscal year 2018, SINO cooperated with another customer, Sichuan Minmetals Import and Export Company, for trial operations. Based on the two trial runs with positive response, we signed a service agreement with Chengdu Dingxu International Trade Co., Ltd. ("Chengdu Dingxu") to coordinate sulfur suppliers in the United States to supply 100,000 tons of sulfur to Chengdu Dingxu on an annual basis. Pursuant to the agreement, we will organize the shipping carriers, help customer to complete the duty and custom declaration and arrange transportation to the destination designated by Chengdu Dingxu. We will not take any title of any of their purchases and we will not take any inventory risks. We will be reimbursed by Chengdu Dingxu once our performance obligations are completed for the money we advanced on these purchases.
Historically, containers shipping from the U.S. to China have low utilization rates. As a result, large shipping lines in China, including COSCO Shipping Lines Co., Ltd (“COSCO Shipping Lines”), have to bear the shipping costs of empty containers and are seeking solutions to work strategically with local logistics companies in the US. With the Chinese government banning the import of environmental wastes by the end of 2017, the empty container rate of COSCO Group's container shipping from the United States to China will be further reduced. Therefore, COSCO Beijing signed a strategic cooperation agreement with us to jointly promote bulk cargo container transportation. Bulk freight rate is usually lower than that of container freight rate, however the transit time is much longer and customers have low flexibility in arrangements with freight carriers. COSCO Group headquarters will give us the same container freight rate as bulk freight, even lower than the bulk shipping fee, to support our expansion from bulk to container shipping, so as to transport more cargo from the United States to China. Management expects to continue our cooperation with COSCO to promote bulk cargo container shipping.
On August 24, 2017, Sino signed a marketing promoting service agreement with COSCO Qingdao. According to this agreement, COSCO Qingdao will help Sino to promote shipping and multimodal transportation, including inland trucking container transportation services, switch bill of lading and freight collection services.
On September 11, 2017, the Company set up a new wholly-owned subsidiary, Ningbo Saimeinuo Supply Chain Management Ltd. (“Sino Ningbo”), via the wholly-owned entity, Sino-Global Shipping New York Inc. This subsidiary primarily engages in supply chain management and freight logistics services.
Properties
We currently rent fourfive facilities in the PRC, Hong Kong and the United States. Our PRC headquartersheadquarter is in Beijing, and our US headquartersU.S. headquarter is in New York.
| Office | | Address | | Rental Term | | Space |
| Beijing, PRC | | Room 502,2212, Tower CB YeQing PlazaBoya International Center,
No. 9, Wangjing North1, Lizezhongyi Road, Wangjing, Chaoyang District Beijing, PRC 100102 | | Expires 12/14/1511/30/2018 | | 16091.08 m2 |
| | | | | | | |
| Shanghai, PRC | | Rm 12B1/12C,12D & 12E, No.359 Dongdaming Road, Hongkou District, Shanghai, PRC 200080 | | Expires 05/07/31/20152018 | | 145285.99 m2 |
| | | | | | | |
| New York, USA | | 1044 Northern Boulevard, Suite 305 Roslyn, New York 11576-1514 | | Expires 08/31/2019 | | 179 m2 |
| | | | | | | |
| Hong Kong | | 20/F, Hoi Kiu Commercial Building, 158 Connaught Road Central, HK | | Expires 05/17/20152019 | | 77 m2 |
| | | | | | | |
| Los Angeles, USA | | 21680 Gateway Center Drive, Suite 330 Diamond Bar, California 91765 | | Expires 04/30/2020 | | 121.24 m2 |
Legal Proceedings
From time to time, we may become involved in various lawsuits and legal proceedings, which arise in the ordinary course of business. However, litigation is subject to inherent uncertainties, and an adverse result in these or other matters may arise from time to time thatand may harm our business. WeHowever, we are currently not aware of any such legal proceedings or claims that we believe will have, individually or in the aggregate, a material adverse effect on our business, financial condition or operating results.
Changes in and Disagreements with Accountants on Accounting and Financial Disclosure
Not applicable.
MANAGEMENT
Directors, Executive Officers and Significant EmployeesDirectors
The following table sets forth information regardingAs of April 24, 2018, the members of our Board of Directors, and our executive officers, and directorswere as of the date of this prospectus:
Name | | Age | | Position |
| | | | |
Lei Cao | | 50 | | Chief Executive Officer and Director |
Anthony S. Chan | | 50 | | Acting Chief Financial Officer and Director |
Zhikang Huang | | 37 | | Chief Operating Officer |
Jing Wang | | 65 | | Independent Director |
Tieliang Liu | | 54 | | Independent Director |
Ming Zhu | | 56 | | Independent Director |
follows:
Lei Cao
Chief Executive Officer and Director. Director
Age - 55
Director since 2001
Mr. Cao founded our Company in 2001 and since that time he has served asis our Chief Executive Officer and a director.Director. Mr. Cao founded our company in 2001 and has been the Chief Executive Officer since that time. Mr. Cao has been Chief Executive officer of our company since its formation. Prior to founding our Company,company, Mr. Cao was a Chief Representative of Wagenborg-Lagenduk Scheepvaart BV, Holland, from 1992 –to 1993, Director of the Penavico-Beijing’s shipping agency from 1987 through 1992, and a seaman for Cosco-Hong Kong from 1984 through 1987. Mr. Cao received his EMBA degree in 2009 from Shanghai Jiao Tong University. Mr. Cao was chosen as a director because he is the founder of our company and we believe his knowledge of our company and years of experience in our industry give him the ability to guide our company as a director.
Anthony S. Chan,acting Chief Financial Officer, Executive Vice President and Director. Mr. Chan has served as our acting Chief Financial Officer, Executive Vice President and a directorJing Wang
Independent Director
Age - 70
Director since 2014. Mr. Chan is a seasoned CPA licensed in New York with over 25 years of professional experience in auditing and SEC reporting, mergers and acquisitions (M&A), SOX compliance, internal controls and risk management. Mr. Chan has advised and audited public companies and privately-held organization across various industries including manufacturing, shipping, media and publishing, entertainment, communications, insurance, and real estate. Prior to joining Sino-Global, Mr. Chan was an audit partner specializing in the delivery of assurance and advisory services to public companies with operations in China. From 2012 until 2013, he was an audit partner with UHY LLP. From 2011 until 2012, he was an audit partner at Friedman LLP. From 2007 through 2011, he was a partner at Berdon LLP, an auditing firm. In addition, Mr. Chan was a former divisional CFO for a publicly traded company and had spent more than a decade at Big Four accounting firms delivering assurance and M&A consulting services. His international experience also includes providing financial due diligence for strategic and financial buyers on various cross-border opportunities in mainland China, Taiwan, Finland, Mexico, and Puerto Rico. Mr. Chan currently also serves as an independent director of Aoxin Tianli Group, Inc. (Nasdaq: ABAC), a member of the Board of Directors of the New York State Society of Certified Public Accountants, and a member of the editorial board for The CPA Journal.
Zhikang Huang, Chief Operating Officer. Mr. Huang has served as our Chief Operating Officer since 2010. Prior to 2010, he served as Director of Sino-Global Shipping Australia Pty Ltd., for which he was responsible for regional operations, marketing and regulation oversight. From 2006 through 2010, Mr. Huang served as our Company’s Vice President, with duties focused on company operation and strategy, international shipping and marketing. From 2004 through 2006, Mr. Huang served as our Company’s Operations Manager, and from 2002 through 2004, he served as an operator with our Company. Mr. Huang obtained his degree in English from Guangxi University in 1999.
Jing Wang,Independent Director. Mr. Wang has served as a member of our Board of Directors since 2007. Mr. Wang currently serves as Chief Economist to China Minsheng Banking Corp., Ltd. and has held this position since December 2002. Mr. Wang was a Chinese Project Advisor for the World Bank from 1990 until 1994. From 1998 through 2000, Mr. Wang was the vice director of Tianjin Security and Futures Supervision Office, in charge of initial public offerings and listing companies. Mr. Wang is an independent director for Tianjin Binhai Energy & Development Co. Ltd., (Shenzhen Stock Exchange: 000695); Tianjin Marine Shipping Co., Ltd. (Shanghai Stock Exchange: 600751);, and ReneSola Company (London Stock Exchange: SOLA). Mr. Wang received a Bachelor degree in Economics from Tianjin University of Finance and Economics. The Board believes that Mr. Wang’s economics background and experience working with public companies qualify him to serve a director of the Company.
Tieliang Liu
Independent Director. Dr. Liu has served as a member of our Board of DirectorsDirector
Age - 58
Director since 2013. 2013
Dr. Liu currently serves as the vice president in charge of accounting and finance to China Sun-Trust Group Ltd. and has held this position since 2001. Dr. Liu was a financial controller for Huaxing Group Ltd from 1998 to 2001. From 1996 through 1998, he was the chief accountant of China Enterprise Consulting Co., Ltd. Before working in industry, Dr. Liu taught accounting and finance in a university for more than ten years and has published tensdozens of books and articles. Dr. Liu is a CPA in China. He received a PhD, mastermaster’s and bachelorbachelor’s degrees from Tianjin University of Finance and Economics. Dr. Liu has been chosen to serve as a director because of his accounting and business knowledge and experience in working with small and medium-sized companies.
Ming Zhu
Independent Director. Mr. Zhu has served as a member of our Board of DirectorsDirector
Age - 59
Director since 2014. 2014
Mr. Zhu has been an international business consultant with RMCC Investment LLC, a Richmond, Virginia based consulting firm, since 1994. Mr. Zhu holds a master'smaster’s degree in tourism and business from Virginia Commonwealth University. Mr. Zhu has also served as an independent director at eFuture Information Technology Inc. since 2007 and as an independent director of Tri-Tech Holding, Inc. since 2012. Mr. Zhu was chosen as a director because of his experience with public companies and his knowledge of our company.
Staggered Board
Our First Amended and Restated Articles of Incorporation provides for a staggered term Board of Directors consisting of no less than 5 and no more than 9 directors, with the classification of the Board of Directors into three classes (Class I, Class II and Class III), as nearly equal in number as possible. If the number of directors changes, any increase or decrease will be apportioned among the classes so as to maintain the number of directors in each class as nearly as possible. Any additional directors of a class elected to fill a vacancy resulting from an increase in such class will hold office for a term that coincides with the remaining term of that class. Decreases in the number of directors will not shorten the term of any incumbent director. These board provisions could make it more difficult for third parties to gain control of our company by making it difficult to replace members of the Board of Directors.
Committees of the Board of Directors
Our Board of Directors has a standing Audit Committee, Compensation Committee, and Corporate Governance Committee. Our Board of Directors appoints the members of each Committee.
Audit Committee
The primary responsibility of the Audit Committee is to assist the Board of Directors in monitoring the integrity of the Company’s financial statements and the independence of its external auditors. The current members of the Audit Committee are Tieliang Liu, Jing Wang and Ming Zhu. We believe that each of the current members of the Audit Committee is independent and that Tieliang Liu, who is the Chairman of the Audit Committee, qualifies as an “audit committee financial expert” in accordance with applicable NASDAQ Capital Market listing standards.
Our Board of Directors has adopted a written charter for the Audit Committee which is available on the Company’s website (www.sino-global.com) or directly at the following link:http://media.corporate-ir.net/media_files/irol/22/221375/corpgov/AuditCommCharte09272008.pdf.
Compensation Committee
The Compensation Committee’s principal responsibilities include:
| 35 | · | Making recommendations to our Board of Directors concerning executive management organization matters generally; |
| · | In the area of compensation and benefits, making recommendations to the Board of Directors concerning employees who are also directors of the Company, consult with the CEO on matters relating to other executive officers, and make recommendations to the Board of Directors concerning policies and procedures relating to executive officers; provided, however, that the Compensation Committee has full decision-making powers with respect to compensation for executive officers to the extent such compensation is intended to be performance-based compensation within the meaning of Section 162(m) of the Internal Revenue Code; |
| · | Making recommendations to our Board of Directors regarding all contracts of the Company with any officer for remuneration and benefits after termination of regular employment of such officer; |
| · | Making recommendations to our Board of Directors concerning policy matters relating to employee benefits and employee benefit plans, including incentive compensation plans and equity based plans; and |
| · | Administering our formal incentive compensation programs, including equity based plans. |
The current members of the Compensation Committee are Ming Zhu, Tieliang Liu, and Jing Wang, who is the Chairman of the Compensation Committee.
Corporate Governance Committee
The Corporate Governance Committee’s primary responsibilities include the following:
| · | Identify individuals qualified to become members of the Board of Directors and to make recommendations to the Board of Directors with respect to candidates for nomination for election at the next annual meeting of shareholders or at such other times when candidates surface and, in connection therewith, consider suggestions submitted by shareholders of the Company; |
| · | Determine and make recommendations to the Board of Directors with respect to the criteria to be used for selecting new members of the Board of Directors; |
| · | Oversee the process of evaluation of the performance of the Company’s Board of Directors and committees; |
| · | Make recommendations to the Board of Directors concerning the membership of committees of the Board and the chairpersons of the respective committees; |
| · | Make recommendations to the Board of Directors with respect to the remuneration paid and benefits provided to members of the Board in connection with their service on the Board or on its committees; and |
| · | Evaluate Board and committee tenure policies as well as policies covering the retirement or resignation of incumbent directors. |
The current members of the Corporate Governance Committee are Ming Zhu, who is the Chairman of the Corporate Governance Committee, Tieliang Liu and Jing Wang.
Director Independence
The Board of Directors maintains a majority of independent directors who are deemed to be independent under the definition of independence provided by NASDAQ Stock Market Rule 4200(a)(15).
Zhikang Huang
Chief Operating Officer and Director
Age - 41
Mr. Huang has been our Chief Operating Officer since 2010. Prior to 2010, he served as Director of Sino-Global Shipping Australia, for which he was responsible for regional operations, marketing and regulation oversight. From 2006 through 2010, Mr. Huang served as our Company’s Vice President, with duties focused on company operation and strategy, international shipping and marketing. From 2004 through 2006, Mr. Huang served as our Company’s Operations Manager, and from 2002 through 2004, he served as an operator with our Company. Mr. Huang obtained his degree in English from Guangxi University in 1999.
Tuo Pan
Acting Chief Financial Officer
Age – 33
Ms. Pan is our Acting Chief Financial Officer and a seasoned Certified Public Accountant licensed in Australia. Since 2008, Ms. Pan has overseen the finance and accounting functions of Sino-Global Shipping Australia Pty Ltd. Ms. Pan received her bachelor’s degree in Accounting and Finance and a master’s degree in Advance Accounting from the Curtin University of Technology in Western Australia. From August 2007 to July 2008, Ms. Pan worked as an auditor and project manager of Baker Tilly China Ltd., and participated in various projects from e-Future Information Technology Inc, TMC Education Corporation Ltd, China Ministry of Commerce, etc.
Family Relationships
There are no familial relationships between any of our officers and directors.
Involvement in Certain Legal Proceedings
To the best of our knowledge, none of our directors or executive officers has been convicted in a criminal proceeding, excluding traffic violations or similar misdemeanors, or has been a party to any judicial or administrative proceeding during the past ten years that resulted in a judgment, decree or final order enjoining the person from future violations of, or prohibiting activities subject to, federal or state securities laws, or a finding of any violation of federal or state securities or commodities laws, any laws respecting financial institutions or insurance companies, any law or regulation prohibiting mail or wire fraud in connection with any business entity or been subject to any disciplinary sanctions or orders imposed by a stock, commodities or derivatives exchange or other self-regulatory organization, except for matters that were dismissed without sanction or settlement. None of our directors, director nominees or executive officers has been involved in any transactions with us or any of our directors, executive officers, affiliates or associates which are required to be disclosed pursuant to the rules and regulations of the SEC.
Board Leadership StructureAudit Committee
Mr. Lei Cao currently holds both the positions of Chief Executive Officer and ChairmanThe Company has an audit committee, consisting solely of the Board. Company’s independent directors, Tieliang Liu, Jing Wang and Ming Zhu. Mr. Liu qualifies as the audit committee financial expert. The Company’s audit committee charter is available on the Company’s website (www.sino-global.com) or directly at the following link: http://media.corporate-ir.net/media_files/irol/22/221375/corpgov/AuditCommCharte09272008.pdf.
Code of Ethics
We have adopted a Code of Ethics, which we have filed with the SEC. Any amendment to or waiver of the Code of Ethics will be disclosed on our website promptly following the date of such amendment or waiver.
Independence of the Board of Directors
The Board of Directors believes that Mr. Cao’s service as both Chief Executive Officer and Chairmanmaintains a majority of independent directors who are deemed to be independent under the Board is in the best interestsdefinition of the Company and its shareholders. Mr. Cao possesses detailed and in-depth knowledge of the issues, opportunities and challenges facing the Company and its business and is thus best positioned to develop agendas that ensure that the Board’s time and attention are focused on the most critical matters. His combined role enables decisive leadership, ensures clear accountability, and enhances the Company’s ability to communicate its message and strategy clearly and consistently to the Company’s shareholders, employees, customers and suppliers.independence provided by NASDAQ Stock Market Rule 4200(a)(15).
EXECUTIVE COMPENSATION
The Summary Compensation Table below sets forth information regarding the compensation awarded to or earned by our named executive officers for our fiscal years 2014 and 2013.
The following table shows the annual compensation paid by us to Mr. Lei Cao, our Principal Executive Officer, Mrs. Tuo Pan, our Acting Chief Financial Officer, Mr. Anthony S. Chan, our former Executive Vice President and Acting Chief Financial Officer and Mr. Zhikang Huang, our Chief Operating Officer, for our fiscalthe years 2014ended June 30, 2017 and 2013.2016. No other executive officer had total compensation during either of such fiscal yearthe previous two years of more than $100,000.
Summary Compensation Table
| Name | | Year | | | Salary | | | Bonus | | | Securities-based
Compensation | | | All other
compensation | | | Total | |
| | | | | | US$ | | | US$ | | | US$ | | | US$ | | | US$ | |
| Lei Cao, Principal Executive Officer | | | 2014 | | | | 180,000 | | | | — | | | | — | | | | — | | | | 180,000 | |
| | | | 2013 | | | | 150,811 | | | | — | | | | — | | | | — | | | | 150,811 | |
| | | | | | | | | | | | | | | | | | | | | | | | | |
| Anthony S. Chan, Acting Chief Financial Officer | | | 2014 | | | | 150,000 | | | | 100,000 | (1) | | | — | | | | — | | | | 250,000 | |
| | | | 2013 | | | | — | | | | — | | | | — | | | | — | | | | — | (2) |
| | | | | | | | | | | | | | | | | | | | | | | | | |
| Zhikang Huang, Chief Operating Officer | | | 2014 | | | | 100,000 | | | | — | | | | — | | | | — | | | | 100,000 | |
| | | | 2013 | | | | 60,000 | | | | — | | | | — | | | | — | | | | 60,000 | |
| | | | | | | | | | | | Securities- | | | | | | | |
| | | | | | | | | | | | based | | | All other | | | | |
| Name | | Year | | | Salary | | | Bonus | | | Compensation | | | Compensation | | | Total | |
| Lei Cao, | | 2017 | | | $ | 180,000 | | | | - | | | | - | | | | - | | | $ | 180,000 | |
| Principal Executive Officer | | 2016 | | | $ | 180,000 | | | | - | | | $ | 159,000 | | | | - | | | $ | 339,000 | |
| Tuo Pan, (1) | | 2017 | | | $ | 60,000 | | | | - | | | | - | | | | - | | | $ | 60,000 | |
| Acting Chief Financial Officer | | 2016 | | | $ | 60,000 | | | | - | | | $ | 21,200 | | | | - | | | $ | 81,200 | |
| Anthony S. Chan, (2) | | 2017 | | | | - | | | $ | - | | | | - | | | | - | | | | - | |
| Acting Chief Financial Officer | | 2016 | | | $ | 83,333 | | | $ | 50,000 | | | | - | | | | - | | | $ | 133,333 | |
| Zhikang Huang, | | 2017 | | | $ | 100,000 | | | | - | | | | - | | | | - | | | $ | 100,000 | |
| Chief Operating Officer | | 2016 | | | $ | 100,000 | | | | - | | | $ | 95,400 | | | | - | | | $ | 195,400 | |
| (1) | Represents a one-time hiring bonus.Ms. Pan was appointed as our Acting Chief Financial Officer on October 15, 2015. |
| (2) | Effective October 15, 2015, Mr. Anthony S. Chan was hired in September 2013 and received no compensation in fiscal 2013.resigned as our Acting Chief Financial Officer. |
Outstanding Equity Awards of ourNamed Executive Officers at Fiscal Year-End
As of SeptemberJune 30, 2014,2017, we had three named executive officers, Mr. Lei Cao, our Chief Executive Officer, Mr. Anthony S. Chan,Ms. Tuo Pan, our Acting Chief Financial Officer, and Mr. Zhikang Huang, our Chief Operating Officer.
Option Awards(1)
| Name | | Number of
securities
underlying
unexercised
options (#)
exercisable | | | Number of
securities
underlying
unexercised
options (#)
unexercisable | | | Equity
incentive plan
awards:
Number of
securities
underlying
unexercised
Unearned
options (#) | | | Option
exercise
price ($) | | | Option
expiration
date | |
| (a) | | (b) | | | (c) | | | (d) | | | (e) | | | (f) | |
| Lei Cao, Principal Executive Officer | | | 36,000 | | | | — | | | | — | | | $ | 7.75 | | | | May 19, 2018 | |
| Anthony S. Chan, Acting Chief Financial Officer | | | — | | | | — | | | | — | | | | — | | | | — | |
| Zhikang Huang, Chief Operating Officer | | | — | | | | — | | | | — | | | | — | | | | — | |
| | | | | | | | | Equity | | | | | | | |
| | | | | | | | | incentive plan | | | | | | | |
| | | | | | | | | awards: | | | | | | | |
| | | Number of | | | Number of | | | Number of | | | | | | | |
| | | securities | | | securities | | | securities | | | | | | | |
| | | underlying | | | underlying | | | underlying | | | | | | | |
| | | unexercised | | | unexercised | | | unexercised | | | Option | | | Option | |
| | | options (#) | | | options (#) | | | unearned | | | Exercise | | | expiration | |
| Name | | exercisable | | | unexercisable | | | options (#) | | | price ($) | | | date | |
| (a) | | (b) | | | (c) | | | (d) | | | (e) | | | (f) | |
| Lei Cao, | | | | | | | | | | | | | | | | | | | | |
| Principal Executive Officer | | | 36,000 | | | | - | | | | - | | | $ | 7.75 | | | | 5/19/18 | |
| Tuo Pan, | | | | | | | | | | | | | | | | | | | | |
| Acting Chief Financial Officer | | | - | | | | - | | | | - | | | | - | | | | - | |
| Zhikang Huang, | | | | | | | | | | | | | | | | | | | | |
| Chief Operating Officer | | | - | | | | - | | | | - | | | | - | | | | - | |
| (1) | Our Company has not made any stock awards to any named executive officer. Forofficers. The details are set forth in the table appearing under “Principal Stockholders” on page 39 of this reason, we have excludedprospectus. |
Director Compensation for the year ended June 30, 2017(1)
| Name | | Fees earned or
paid in cash
($) | | | Stock
awards
($) | | | Option awards ($)(2) | | | All other
compensation
($) | | | Total
($) | |
| Tieliang Liu | | | 20,000 | | | | 0 | | | | 0 | | | | 0 | | | | 20,000 | |
| Jing Wang | | | 20,000 | | | | 0 | | | | 0 | | | | 0 | | | | 20,000 | |
| Ming Zhu | | | 20,000 | | | | 0 | | | | 0 | | | | 0 | | | | 20,000 | |
| (1) | This table does not include Mr. Lei Cao, our Chief Executive Officer, because although Mr. Cao is a director, Mr. Cao’s compensation is fully reflected in the following columns fromSummary Compensation Table. |
| (2) | We granted options to purchase 10,000 shares of our common stock to Mr. Jing Wang on May 20, 2008. We granted options to purchase 10,000 shares of our common stock to Mr. Tieliang Liu on January 31, 2013. No value is reflected for the awards in this table: (g) Number of shares or units of stock that have not vested (#); (h) Markettable because the grant date fair value of sharesall grants was reflected in the year of units of stock that have not vested ($); (i) Equity incentive plan awards: Number of unearned shares, units or other rights that have not vested (#); and (j) Equity incentive plan awards: Market or payout value of unearned shares, units or other rights that have not vested ($).the applicable grant. |
Employment Agreements with the Company’s Named Executive Officers
Sino-China hasWe have employment agreements with each of Mr. Lei Cao, Mr. Anthony S. ChanMs. Tuo Pan and Mr. Zhikang Huang. These employment agreements provide for one-year terms that extend automatically in the absence of termination provided at least 60 days prior to the anniversary date of the agreement. If we fail to provide this notice or if we wish to terminate an employment agreement in the absence of cause, then we are obligated to provide at least 30 days’ prior notice. In such case during the initial term of the agreement, we would need to pay such executive (a) in the absence of a change of control, a one-time payment of the then applicablethen-applicable annual salary of such executive or (b) in the event of a change of control, a one-time payment of one-and-a-half times the then applicablethen-applicable annual salary of such executive. In the event of termination due to death or disability, the payment is equal to two times the executive’s salary.
We are, however, permitted to terminate an employee for cause without penalty to our company, where the employee has committed a crime or the employee’s actions or inactions have resulted in a material adverse effect to us.
Equity Compensation Plan Information
2014 Share Incentive Plan
In December 2013, our Board of Directors adopted the 2014 Share Incentive Plan (the “2014 Plan”), which was approved by shareholders at our 2014 Annual Meeting of Shareholders on January 21, 2014. The 2014 Plan provides for the grant of incentive stock options, nonqualified stock options and common stock awards. The plan authorizes a new pool of 10,000,000 shares of our common stock and securities exercisable for or convertible into our common stock.
The 2014 Plan is administered by the Compensation Committee of our Board of Directors. The 2014 Plan provides our Compensation Committee with flexibility to design compensatory awards that are responsive to our strategic and business needs. Subject to the terms of the 2014 Plan, the Compensation Committee has the discretion to determine the terms of each award. The Compensation Committee may delegate to one or more of our officers the authority to grant awards to individuals who are not our directors, executive officers or 5% shareholders.
2008 Incentive Plan
In 2008, our Board of Directors and shareholders approved the 2008 Incentive Plan. Our 2008 Incentive Plan established a pool for stock options for our employees. Options granted under our 2008 Incentive Plan vest at a rate of 20% per year for five years and have exercise prices equal to the market price of our common stock on the date the options are granted. The number of shares of our common stock that may be issued under our 2008 Incentive Plan is 302,903 shares.
The below table reflects, as of SeptemberJune 30, 2014,2017, the number of shares of our common stock authorized by our shareholders to be issued (directly or by way of issuance of securities exercisable for or convertible into) as incentive compensation to our officers, directors, employees and consultants.
| Plan category | | Number
of vested
shares or
units of
stock
issued
(a) | | Number of securities
to be issued upon
exercise of
outstanding options,
warrants and rights
(b) | | Weighted-average
exercise price of
outstanding
options, warrants
and rights (c) | | Number of securities
remaining available for
future issuance under equity
compensation plans
(excluding securities
reflected in column (a) and
(b)) | | | Number of securities to be issued upon exercise of outstanding options, warrants and rights (a) | | | Weighted-average exercise price of outstanding options, warrants and rights (b) | | | Number of securities remaining available for future issuance under equity compensation plans (excluding securities reflected in column (a)) (c) | |
| Equity compensation plans approved by security holders | | | 600,000 | | | | 66,000 | | | $ | 6.88 | | | | 9,636,903 | (1) | |
| | | | | | | | | |
| Equity compensation plans under the 2008 Incentive Plan approved by security holders | | | | 64,000 | | | $ | 7.03 | | | | 238,903 | (1) |
| | | | | | | | | | | | | | |
| Equity compensation plans under the 2014 Incentive Plan approved by security holders | | | | 75,000 | | | $ | 1.10 | | | | 8,590,000 | (1) |
| | | | | | | | | | | | | | |
| Equity compensation plans not approved by security holders | | | | | | | — | | | | — | | | | — | | | | - | | | | - | | | | - | |
| (1) | Pursuant to our 2008 Incentive Plan, we are authorized to issue options to purchase 302,903 shares of our common stock. All of the 66,000The 64,000 outstanding options disclosed in the above table are taken from ourthe 2008 Incentive Plan. Pursuant to our 2014 Incentive Plan, we are authorized to issue, in the aggregate, 10,000,000 shares of our common stock or other securities convertible or exercisable for common stock. We have notgranted options to purchase an aggregate of 150,000 shares of common stock under the 2014 Incentive Plan in July 2016, among which, options to purchase 75,000 shares of common stock have been exercised. In addition, we have issued, any options or convertible securities into our 2014 Plan; however, we issuedin the aggregate, 600,000 shares of our common stock to two consultants to our Company in 2014 and 660,000 shares of common stock to our officers and directors in 2016 under ourthe 2014 Incentive Plan. Accordingly, we may issue options to purchase 236,903238,903 shares of our common stock under ourthe 2008 Incentive Plan, and we may issue 9,400,0008,590,000 shares of our common stock or other securities convertible or exercisable for our common stock under ourthe 2014 Incentive Plan. |
LimitationTable of Director and Officer LiabilityContents
Pursuant to our First Amended and Restated Articles of Incorporation and Bylaws, every director or officer and the personal representatives of the same shall be indemnified and secured harmless out of our assets and funds against all actions, proceedings, costs, charges, expenses, losses, damages or liabilities incurred or sustained by him or her in or about the conduct of our business or affairs or in the execution or discharge of his or her duties, powers, authorities or discretions, including without prejudice to the generality of the foregoing, any costs, expenses, losses or liabilities incurred by him in defending (whether successfully or otherwise) any civil proceedings concerning us or our affairs in any court whether in Virginia or elsewhere. No such director or officer will be liable for: (a) the acts, receipts, neglects, defaults or omissions of any other such Director or officer or agent; or (b) any loss on account of defect of title to any of our property; or (c) account of the insufficiency of any security in or upon which any of our money shall be invested; or (d) any loss incurred through any bank, broker or other similar person; or (e) any loss occasioned by any negligence, default, breach of duty, breach of trust, error of judgment or oversight on his or her part; or (f) any loss, damage or misfortune whatsoever which may happen in or arise from the execution or discharge of the duties, powers authorities, or discretions of his or her office or in relation thereto, unless the same shall happen through his or her own dishonesty.
Insofar as indemnification for liabilities arising under the Securities Act of 1933 may be permitted to our directors, officers or persons controlling us under the foregoing provisions, we have been informed that in the opinion of the SEC such indemnification is against public policy as expressed in the Securities Act of 1933 and is therefore unenforceable as a matter of United States law.
Director Compensation(1)
| Name | | Fees earned or paid in cash ($) | | | All other compensation ($)(2) | | | Total ($) | |
| Dennis O. Laing(3) | | | 20,000 | | | | — | | | | 20,000 | |
| Tieliang Liu | | | 20,000 | | | | — | | | | 20,000 | |
| Jing Wang | | | 20,000 | | | | — | | | | 20,000 | |
| Ming Zhu(4) | | | 0 | | | | — | | | | 0 | |
| (1) | This table does not include Mr. Lei Cao, our Principal Executive Officer, or Mr. Mingwei Zhang, our prior Principal Financial and Accounting Officer, who were both directors and named executive officers, because Mr. Cao’s compensation is fully reflected in the Summary Compensation Table and because Mr. Zhang received no payment solely because of his service as a director during fiscal year 2014. |
| (2) | We did not grant any stock awards, option awards, non-equity incentive plan compensation awards or nonqualified deferred compensation earnings awards to any of our directors in fiscal year 2014; accordingly, we have excluded such columns from the above table. We granted options to purchase 10,000 shares of our common stock to each of Mr. Dennis Laing and Mr. Jing Wang on May 20, 2008. We granted options to purchase 10,000 shares of our common stock to Mr. Tieliang Liu on January 31, 2013. No value is reflected for the awards in this table because the grant date fair value of all grants was reflected in the year of the applicable grant. |
| (3) | Mr. Laing retired as a director effective as of August 15, 2014. |
| (4) | Mr. Ming Zhu joined our Board of Directors on August 15, 2014 and thus received no compensation as a director in fiscal 2014. |
CERTAIN RELATIONSHIPS AND RELATED TRANSACTIONS
In April 2013, as approved by our Board of Directors and our shareholders, Mr. Zhang purchased 1,800,000 shares of our common stock for approximately $3 million, which as of the date of this prospectus represents approximately 29% of our issued and outstanding common stock, resulting in Mr. Zhang becoming our largest shareholder. As a result of Mr. Zhang’s desire to find business opportunities that would mutually benefit us and the Zhiyuan Investment Group, a company controlled by Mr. Zhang, which owns a number of businesses in China, in June 2013, we signed a 5-year Global Logistic Service Agreement with the Zhiyuan Investment Group and Tewoo. Thereafter, during the quarter ended September 30, 2013, we executed a shipping and chartering services agreement with the Zhiyuan Investment Group, pursuant to which we assisted the Zhiyuan Investment Group in the transportation of approximately 51,000 tons of chromite ore from South Africa to China; and in September 2013, we executed an inland transportation management service contract with the Zhiyuan Investment Group pursuant to which we agreed to provide certain advisory services and assist the Zhiyuan Investment Group in attempting to control its potential commodities losses during the transportation process. On a one time basis, we executed a one year short-term loan agreement with the Zhiyuan Investment Group, effective January 1, 2014, to facilitate the working capital needs of the Zhiyuan Investment Group. As of June 30, 2014, the net amount due to us from the Zhiyuan Investment Group was $2,920,950 consisting of funds borrowed from us pursuant to the short-term loan agreement and trade receivables due to us from the Zhiyuan Investment Group. In September 2014, we collected approximately $2.7 million from the Zhiyuan Investment Group, representing full repayment of all funds borrowed by the Zhiyuan Investment Group from us pursuant to the short-term loan agreement and the payment of approximately $1.6 million of outstanding trade receivables. During the three months ended September 30, 2014, we continued to provide inland transportation management services to the Zhiyuan Investment Group, and the net amount due to us from the Zhiyuan Investment Group for such services at September 30, 2014 was $627,951. In October 2014, we collected approximately $384,000 from the Zhiyuan Investment Group which reduced the outstanding trade receivables due to us from the Zhiyuan Investment Group.
In May 2014, we signed a strategic agreement with Zhenghe, to jointly explore mutually beneficial business development opportunities. Zhenghe is a PRC company to which Mr. Wang is the majority shareholder. To demonstrate the commitment by Zhenghe to its business relationship with us, in June 2014, as approved by our Board of Directors, Mr. Wang, through a company owned by him, purchased 200,000 shares of our common stock for $444,000, resulting in Mr. Wang owning as of the date of this prospectus, approximately 3.2% of our outstanding common stock. Subsequently, and as part of our strategy to expand our service platform, in September 2014, as approved by our Board of Directors, we acquired LSM, a ship management company based in Hong Kong from Mr. Wang. While to date the net revenues generated from such business have been immaterial, we believe that ship management is a good complement to our existing service platform. The acquisition of LSM will result in the issuance of between 20,000 and 200,000 shares of our common stock to Mr. Wang, depending on whether LSM reaches certain net income targets for the period July 4, 2014 through December 31, 2014. LSM outsources the ship management services to Qingdao Longhe Ship Management Services Co., Ltd., a company controlled by Mr. Wang.
As of June 30, 2014 and 2013, the Company is owed $252,815 and $541,400, respectively, from Sino-G Trading Inc. (“Sino-G”), an entity that is owned by the brother-in-law of the Company’s CEO. Sino-G previously served as a funds transfer agent for the Company’s services in Tianjin, PRC. We expect the entire amount to be repaid without interest during fiscal year 2015.
PRINCIPAL SHAREHOLDERSSTOCKHOLDERS
The following table sets forth certain information regarding the beneficial ownership of our common stock as of the dateMarch 29, 2018 (the “Determination Date”) by: (i) each current director of this prospectus, and the anticipated beneficial ownership percentages immediately following this offering, of:
our company; (ii) each of our directors;
eachNamed Executive Officers; (iii) all current executive officers and directors of our executive officers;
all of our directors and executive officerscompany as a group; and
each person, or group of affiliated persons, who is (iv) all those known by us to
beneficially ownbe beneficial owners of more than
5%five percent (5%) of our
outstandingcommon stock.Beneficial ownership and percentage ownership are determined in accordance with the rules of the SEC. Under these rules, beneficial ownership generally includes any shares as to which the individual or entity has sole or shared voting power or investment power and includes any shares that an individual or entity has the right to acquire beneficial ownership of within sixty (60) days of the Determination Date, through the exercise of any option, warrant or similar right (such instruments being deemed to be “presently exercisable”). In computing the number of shares beneficially owned by a person and the percentage ownership of that person, shares of our common stock.
Each shareholder’s percentageTo our knowledge, except as indicated in the footnotes to the following table, and subject to state community property laws where applicable, all beneficial owners named in the following table have sole voting and investment power with respect to all shares shown as beneficially owned by them. Percentage of ownership before the offering is based on 6,200,84112,533,035 shares of our common stock outstanding as of the date of this prospectus. Each shareholder’s percentage ownership after the offering is based on 9,598,899Determination Date. No shares of our common stock outstanding immediately after the completion of this offering. We have granted the underwriters an optionidentified below are subject to purchase up to an aggregate of 509,708 additional shares of our common stock to cover over-allotments, if any, and the table below assumes no exercise of that option.
a pledge.
Beneficial ownership is determined in accordance with the rules and regulations of the SEC and includes voting or investment power with respect to our common stock. Shares of our common stock subject to options or warrants that are exercisable or exercisable within 60 days of the date of this prospectus are considered outstanding and beneficially owned by the person holding the options or warrants for the purposes of calculating the percentage ownership of that person but not for the purpose of calculating the percentage ownership of any other person. Except as disclosed in the footnotes to this table and subject to applicable community property laws, we believe that each shareholder identified in the table possesses sole voting and investment power over all shares of common stock shown as beneficially owned by the shareholder. Except as otherwise set forth below, the address of the beneficial owner is c/o Sino-Global Shipping America, Ltd., 1044 Northern Blvd, Roslyn, New York 11576-1514.
| Name and Address | | Title of
Class | | Amount of
Beneficial
Ownership | | | Percentage
Ownership | |
| Mr. Lei Cao (1)(2) | | Common | | | 1,405,040 | | | | 11.3 | % |
| Mrs. Tuo Pan (1) | | Common | | | 15,000 | | | | * | |
| Mr. Zhikang Huang (1) | | Common | | | 80,000 | | | | * | |
| Mr. Jing Wang (1)(3) | | Common | | | 50,000 | | | | * | |
| Mr. Liu Tieliang (1)(4) | | Common | | | 46,000 | | | | * | |
| Mr. Ming Zhu (1) | | Common | | | 40,000 | | | | * | |
| Mr. Yafei Li (1) | | Common | | | 19,000 | | | | * | |
| Total Officers and Directors (6 individuals) | | Common | | | 1,655,040 | | | | 13.3 | % |
| | | | | | | | | | | |
| Other Five Percent Shareholders | | | | | | | | | | |
| Mr. Zhong Zhang (5) | | Common | | | 1,800,000 | | | | 14.5 | % |
| Director and Executive Officers: | | Number of Shares
of Common Stock
Beneficially
Owned | | | Percentage
of Shares Beneficially
Owned | |
| | | | | | Before
Offering (%) | | | After
Offering (%) | |
| | | | | | | | | | |
| Mr. Lei Cao(1) | | | 1,366,040 | | | | 21.86 | | | | 14.16 | |
| | | | | | | | | | | | | |
| Mr. Anthony S. Chan | | | 0 | | | | * | | | | * | |
| | | | | | | | | | | | | |
| Mr. Zhikang Huang | | | 0 | | | | * | | | | * | |
| | | | | | | | | | | | | |
| Mr. Jing Wang (2) | | | 10,000 | | | | * | | | | * | |
| | | | | | | | | | | | | |
| Mr. Tieliang Liu (3) | | | 2,000 | | | | * | | | | * | |
| | | | | | | | | | | | | |
| Mr. Ming Zhu | | | 0 | | | | * | | | | * | |
| | | | | | | | | | | | | |
| All Current Officers and Directors as a group (5 persons) | | | 1,378,040 | | | | 22.05 | | | | 14.28 | |
| | | | | | | | | | | | | |
| 5% Shareholders | | | | | | | | | | | | |
| Mr. Zhong Zhang(4) | | | 1,800,000 | | | | 28.81 | | | | 18.66 | |
| Mr. Daniel E. Kern(5) | | | 389,100 | | | | 6.23 | | | | 4.03 | |
______________
* Less than 1%.
| (1) | IncludesThe individual’s address is c/o Sino-Global Shipping America, Ltd., 1044 Northern Boulevard, Roslyn, New York 11576-1514. |
| (2) | Mr. Cao has received options to purchase 36,000 shares of ourthe Company’s common stock, issuable upon exerciseall of stock options owned by such person. which are presently exercisable. |
(2)(3) | Consists ofMr. Wang has received options to purchase 10,000 shares of ourthe Company’s common stock, issuable upon exerciseall of stock options owned by such person. |
(3) | Consists of 2,000 shares of our common stock issuable upon exercise of stock options owned by such person.which are presently exercisable. |
| (4) | Mr. ZhongLiu has received options to purchase 10,000 shares of the Company’s common stock, all of which are presently exercisable. |
| (5) | Mr. Zhang’s address is c/ocare of Tianjin Zhiyuan Investment Group Co., Ltd, 10th Floor, Tianwu Huaqing Building, No.22, Jinrong Road, Dasi Industrial Park, Xiqing District Economic Development Zone, Tianjin City, P.R. China, 300385. |
(5) | Mr. Kern’s address is 1027 Goldenrod Ave., Corona Del Mar, CA 92625. We have been advised that Mr. Kern owns 176,20039 | |
CERTAIN RELATIONSHIPS AND RELATED PARTY TRANSACTIONS
The Board of Directors maintains a majority of independent directors who are deemed to be independent under the definition of independence provided by NASDAQ Stock Market Rule 4200(a)(15). Other than as described herein, no transactions required to be disclosed under Item 404 of Regulation S-K have occurred since the beginning of the Company’s last fiscal year.
On June 27, 2013, we signed a 5-year global logistic service agreement with TEWOO Chemical & Light Industry Zhiyuan Trade Co., Ltd and TianJin Zhi Yuan Investment Group Co., Ltd (together “Zhiyuan”). Zhiyuan is owned by Mr. Zhang, the largest shareholder of the Company. For the year ended June 30, 2013, we had no business transaction with Zhiyuan. Before Mr. Zhang was a shareholder of the Company, he agreed with the Company to cause Zhiyuan to procure certain services from the Company. The 5-year global logistic service agreement details the nature of such cooperation between Zhiyuan and the Company. Thus, while Mr. Zhang’s initial agreement to direct business to the company was made when he was not a related party, the subsequent agreement was entered after he was a related party. During the quarter ended September 30, 2013, the Company executed a shipping and chartering services agreement with Zhiyuan whereby it assisted in the transportation of approximately 51,000 tons of chromite ore from South Africa to China. In September 2013, the Company executed an inland transportation management service contract with Zhiyuan whereby it would provide certain advisory services and help control its potential commodities loss during the transportation process. In addition, the Company executed a one-year short-term loan agreement with Zhiyuan, effective January 1, 2014, to facilitate the working capital needs of Zhiyuan on an as-needed basis. In September 2014, the Company collected approximately $2.7 million from the Zhiyuan Investment Group, representing full repayment of the short-term loan and payment of approximately $1.6 million of outstanding trade receivable. In October 2014, the Company collected approximately $384,000 from the Zhiyuan Investment Group to reduce the outstanding trade receivable. For the years ended June 30, 2016 and 2017, the Company continued to provide inland transportation management services to the Zhiyuan Investment Group. The net amount due from the Zhiyuan Investment Group at June 30, 2016 and 2017 were $1,622,519 and $1,715,130.
SELLING STOCKHOLDERS
The following table sets forth the name of each Selling Shareholder and the number of shares of common stock that each Selling Shareholder may offer from time to time pursuant to this prospectus. The shares of common stock that may be offered by the Selling Shareholders hereunder may be acquired by the Selling Shareholders upon the exercise by the Selling Shareholders of the Warrants that are held by the Selling Shareholders and that were previously issued in private transactions by our company. The shares of common stock that may be offered by the Selling Shareholders hereunder consist of 4,000,000 shares of common stock issuable upon the exercise of the Warrants that were issued to the Selling Shareholders on March 14, 2018 pursuant to a Securities Purchase Agreement dated as of March 12, 2018 by and among the Company and the purchasers named therein. Except as otherwise indicated, we believe that each of the beneficial owners and Selling Shareholders listed below has sole voting and investment power with respect to such shares of common stock, subject to community property laws, where applicable.
Except as noted in the table below, none of the Selling Shareholders has had a material relationship with us other than as a stockholder at any time within the past three years or has ever been one of our or our affiliates’ officers or directors. Each of the Selling Shareholders has acquired the Warrants (and the shares of common stock issuable upon the exercise thereof) in the ordinary course of business and, at the time of acquisition of the Warrants, none of the Selling Shareholders was a party to any agreement or understanding, directly or indirectly, with any person to distribute the shares of common stock to be resold by such Selling Shareholders under the registration statement of which this prospectus forms a part.
Because a Selling Shareholder may sell all, some or none of the shares of common stock that it holds that are covered by this prospectus, and because the offering contemplated by this prospectus is not underwritten, no estimate can be given as to the number of shares of our common stock that will be held by a Selling Shareholder upon termination of the offering. The information set forth in the following table regarding the beneficial ownership after resale of shares is based upon the assumption that the Selling Shareholders will sell all of the shares of common stock covered by this prospectus.
In accordance with the rules and regulations of the SEC, in computing the number of shares of common stock beneficially owned by a person and the percentage ownership of that person, shares issuable through the exercise of any option, warrant or right, through conversion of any security held by that person that are currently exercisable or that are exercisable within sixty (60) days are included. These shares are not, however, deemed outstanding for the purpose of computing the percentage ownership of any other person.
| | | Shares Owned Prior to
the Offering | | | Number of
Shares
Offered | | | Shares Owned After
the Offering | |
| Name | | Number | | | Percent (1) | | | Shares | | | Number | | | Percent (1) | |
| Alto Opportunity Master Fund SPC – Segregated Master Portfolio B (2) | | | 200,000 | | | | 1.6 | % | | | 200,000 | | | | -0- | | | | N/A | |
| Anson Investments Master Fund LP (3) | | | 201,336 | | | | 1.6 | % | | | 201,336 | | | | -0- | | | | N/A | |
| Bellridge Capital LP (4) | | | 266,666 | | | | 2.1 | % | | | 266,666 | | | | -0- | | | | N/A | |
| Bigger Capital Find, LP (5) | | | 400,000 | | | | 3.1 | % | | | 400,000 | | | | -0- | | | | N/A | |
| CVI Investments, Inc. (6) | | | 300,000 | | | | 2.3 | % | | | 300,000 | | | | -0- | | | | N/A | |
| Black Mountain Equities, Inc. (7) | | | 100,000 | | | | * | | | | 100,000 | | | | -0- | | | | N/A | |
| Empery Asset Master, Ltd. (8) | | | 242,512 | | | | 1.9 | % | | | 242,512 | | | | -0- | | | | N/A | |
| Empery Tax Efficient II, LP (9) | | | 145,040 | | | | 1.1 | % | | | 145,040 | | | | -0- | | | | N/A | |
| Empery Tax Efficient, LP (10) | | | 112,448 | | | | * | | | | 112,448 | | | | -0- | | | | N/A | |
| Firstfire Global Opportunities Fund LLC (11) | | | 66,666 | | | | * | | | | 66,666 | | | | -0- | | | | N/A | |
| Hudson Bay Master Fund Ltd. (12) | | | 266,666 | | | | 2.1 | % | | | 266,666 | | | | -0- | | | | N/A | |
| Intracoastal Capital, LLC (13) | | | 300,000 | | | | 2.3 | % | | | 300,000 | | | | -0- | | | | N/A | |
| Iroquois Master Fund Ltd. (14) | | | 233,334 | | | | 1.8 | % | | | 233,334 | | | | -0- | | | | N/A | |
| Iroquois Capital Investment Group LLC (15) | | | 33,332 | | | | * | | | | 33,332 | | | | -0- | | | | N/A | |
| KBB Asset Management LLC (16) | | | 400,000 | | | | 3.1 | % | | | 400,000 | | | | -0- | | | | N/A | |
| L1 Capital Global Opportunities Master Fund (17) | | | 600,000 | | | | 4.6 | % | | | 600,000 | | | | -0- | | | | N/A | |
| Warberg WF VI LP (18) | | | 132,000 | | | | 1.0 | % | | | 132,000 | | | | -0- | | | | N/A | |
| (1) | Based on 12,533,035 shares issued and outstanding as of March 29, 2018. |
| (2) | Consists of Warrants to purchase up to 200,000 shares of our common stockstock. Ayrton Capital LLC, the investment manager to Alto Opportunity Master Fund SPC – Segregated Master Portfolio B, has discretionary authority to vote and dispose of the shares held by the selling shareholder and may be deemed to be the beneficial owner of these shares. Waqas Khatri, in his name, 187,900capacity as Managing Member of Ayrton Capital LLC, may also be deemed to have investment discretion and voting power over the shares held by the selling shareholder. The selling shareholder and Mr. Khatri each disclaim any beneficial ownership of these shares. The address of Alto Opportunity Master Fund SPC – Segregated Master Portfolio B is c/o Ayrton Capital LLC, 222 Broadway, 19th Floor, New York, NY 10038. |
| (3) | Consists of Warrants to purchase up to 201,336 shares of our common stock. Anson Advisors Inc. and Anson Funds Management LP, the Co-Investment Advisers of Anson Investments Master Fund LP (“Anson”), hold voting and dispositive power over the common stock inheld by Anson. Bruce Winson is the Daniel E. Kern ROTH IRA,managing member of Anson Management GP LLP, which is the general partner of Anson Funds Management LP. Moez Kassam and 25,000Amin Nathoo are directors of Anson Advisors Inc. Mr. Winson, Mr. Kassam and Mr. Nathoo each disclaim beneficial ownership of these common shares except to the extent of their pecuniary interest therein. The principal business address of Anson is 190 Elgin Avenue, George Town, Grand Cayman. |
| (4) | Consists of Warrants to purchase up to 266,666 shares of our common stock through Kern Asset Management. We have been advised that Mr. Kern maintains sole votingstock. The address of Bellridge Capital LP is 515 E. Las Olas Boulevard, Suite 120A, Fort Lauderdale, FL 33301, and dispositive powerthe control person with respect to the securities held by such entity is Robert Klimov. |
| (5) | Consists of all of suchWarrants to purchase up to 400,000 shares of our common stock. The address of Bigger Capital Fund, LP is 159 Jennings Road, Cold Spring Harbor, N.Y. 11724. |
| (6) | Consists of Warrants to purchase up to 300,000 shares of our common stock. Heights Capital Management, Inc., the authorized agent of CVI Investments, Inc. (“CVI”), has discretionary authority to vote and dispose of the securities held by CVI and may be deemed to be the beneficial owner of these shares. Martin Kobinger, in his capacity as Investment Manager of Heights Capital Management, Inc., may also be deemed to have investment discretion and voting power over the shares held by CVI. Mr. Kobinger disclaims any such beneficial ownership of the shares. The address of CVI Investments, Inc. is c/o Heights Capital Management, 101 California Street, Suite 3250, San Francisco, CA 94111. |
| (7) | Consists of Warrants to purchase up to 100,000 shares of our common stock. The address of Black Mountain Equities is 13366 Greenstone Court, San Diego, CA 92131, and the control person with respect to the securities held by such entity is Adam W. Baker. |
| (8) | Consists of Warrants to purchase up to 242,512 shares of our common stock. Empery Asset Management LP, the authorized agent of Empery Asset Master Ltd. (“EAM”), has discretionary authority to vote and dispose of the shares held by EAM and may be deemed to be the beneficial owner of these shares. Martin Hoe and Ryan Lane, in their capacity as investment managers of Empery Asset Management LP, may also be deemed to have investment discretion and voting power over the shares held by EAM. EAM, Mr. Hoe and Mr. Lane each disclaim any beneficial ownership of these shares. The address of Empery Asset Master, Ltd. is c/o Empery Asset Management LP, 1 Rockefeller Plaza, Suite 1205, New York, N.Y. 10020. |
| (9) | Consists of Warrants to purchase up to 145,040 shares of our common stock. Empery Asset Management LP, the authorized agent of Empery Tax Efficient II, LP (“ETE II”), has discretionary authority to vote and dispose of the shares held by ETE II and may be deemed to be the beneficial owner of these shares. Martin Hoe and Ryan Lane, in their capacity as investment managers of Empery Asset Management LP, may also be deemed to have investment discretion and voting power over the shares held by ETE II. ETE II, Mr. Hoe and Mr. Lane each disclaim any beneficial ownership of these shares. The address of Empery Tax Efficient II, LP is c/o Empery Asset Management, LP, 1 Rockefeller Plaza, Suite 1205, New York, N.Y. 10020. |
| (10) | Consists of Warrants to purchase up to 112,448 shares of our common stock. Empery Asset Management LP, the authorized agent of Empery Tax Efficient, LP (“ETE”), has discretionary authority to vote and dispose of the shares held by ETE and may be deemed to be the beneficial owner of these shares. Martin Hoe and Ryan Lane, in their capacity as investment managers of Empery Asset Management LP, may also be deemed to have investment discretion and voting power over the shares held by ETE. ETE, Mr. Hoe and Mr. Lane each disclaim any beneficial ownership of these shares. The address of Empery Tax Efficient, LP is c/o Empery Asset Management, LP, 1 Rockefeller Plaza, Suite 1205, New York, N.Y. 10020. |
| (11) | Consists of Warrants to purchase up to 66,666 shares of our common stock. The address of Firstfire Global Opportunities Fund LLC is 1040 First Avenue, Suite 190, New York, N.Y. 10022. |
| (12) | Consists of Warrants to purchase up to 266,666 shares of our common stock. Hudson Bay Capital Management LP, the investment manager of Hudson Bay Master Fund Ltd., has voting and investment power over these securities. Sander Gerber is the managing member of Hudson Bay Capital GP LLC, which is the general partner of Hudson Bay Capital Management LP. Each of Hudson Bay Master Fund Ltd. and Sander Gerber disclaims beneficial ownership over these securities. The address of Hudson Bay Master Fund Ltd. is 777 Third Avenue, 30th Floor, New York, N.Y. 10017. |
| (13) | Consists of Warrants to purchase up to 300,000 shares of our common stock. Mitchell P. Kopin and Daniel B. Asher, each of whom are managers of Intracoastal Capital, LLC (“Intracoastal”), have shared voting control and investment discretion over the securities reported herein that are held by Intracoastal. As a result, each of Mr. Kopin and Mr. Asher may be deemed to have beneficial ownership (as determined under Section 13(d) of the Exchange Act) of the securities reported herein that are held by Intracoastal. The address for Intracoastal Capital, LLC is 2211A Lakeside Drive, Bannockburn, IL 60015. |
| (14) | Consists of Warrants to purchase up to 233,334 shares of our common stock. The control person for Iroquois Master Fund is Richard Abbe. The address for Iroquois Master Fund Ltd. is 205 East 42nd Street, 20th Floor, New York, N.Y. 10017. |
| (15) | Consists of Warrants to purchase up to 33,332 shares of our common stock. The control person for Iroquois Capital Investment Group LLC is Richard Abbe, its Managing Member. The address for Iroquois Capital Investment Group LLC is 205 East 42nd Street, 20th Floor, New York, N.Y. 10017. |
| (16) | Consists of Warrants to purchase up to 400,000 shares of our common stock. The address for KBB Asset Management LLC is 253 West 73rd Street, Unit 4C, New York, N.Y. 10023, Attn: Steven Segal, Managing Member. |
| (17) | Consists of Warrants to purchase up to 600,000 shares of our common stock. The address for L1 Capital Global Opportunities Master Fund is 1688 Meridian Avenue, 6th & 7thFloor, Miami Beach, FL 33139, and its control person is David Feldman. |
| (18) | Consists of Warrants to purchase up to 132,000 shares of our common stock. The address for Warberg WF VI LP is 716 Oak Street, Winnetka, IL 60093, and the control person with respect to the securities held by such entity is Daniel Warsh. |
PLAN OF DISTRIBUTION
The Selling Shareholders and any of their pledgees, donees, assignees and successors-in-interest may, from time to time, sell any or all of their shares of common stock being offered under this prospectus on any stock exchange, market or trading facility on which our common stock is traded or in private transactions. These sales may be at fixed or negotiated prices. The Selling Shareholders may use any one or more of the following methods when disposing of the Shares:
| ● | ordinary brokerage transactions and transactions in which the broker-dealer solicits purchasers; |
| ● | block trades in which the broker-dealer will attempt to sell the shares as agent but may position and resell a portion of the block as principal to facilitate the transaction; |
| ● | purchases by a broker-dealer as principal and resales by the broker-dealer for its account; |
| ● | an exchange distribution in accordance with the rules of the applicable exchange; |
| ● | privately negotiated transactions; |
| ● | to cover short sales made after the date that the registration statement of which this prospectus is a part is declared effective by the SEC; |
| ● | broker-dealers may agree with the Selling Shareholders to sell a specified number of such shares at a stipulated price per share; |
| ● | a combination of any of these methods of sale; and |
| ● | any other method permitted pursuant to applicable law. |
The shares may also be sold under Rule 144 under the Securities Act, or any other exemption from registration under the Securities Act, if available for a Selling Shareholder, rather than under this prospectus. The Selling Shareholders have the sole and absolute discretion not to accept any purchase offer or make any sale of shares if it deems the purchase price to be unsatisfactory at any particular time.
The Selling Shareholders may pledge their shares to their respective brokers under the margin provisions of customer agreements. If a Selling Shareholder defaults on a margin loan, the broker may, from time to time, offer and sell the pledged shares.
Broker-dealers engaged by the Selling Shareholders may arrange for other broker-dealers to participate in sales. Broker-dealers may receive commissions or discounts from the Selling Shareholders (or, if any broker-dealer acts as agent for the purchaser of shares, from the purchaser) in amounts to be negotiated, which commissions as to a particular broker or dealer may be in excess of customary commissions to the extent permitted by applicable law.
If sales of shares offered under this prospectus are made to broker-dealers as principals, we would be required to file a post-effective amendment to the registration statement of which this prospectus is a part. In the post-effective amendment, we would be required to disclose the names of any participating broker-dealers and the compensation arrangements relating to such sales.
The Selling Shareholders and any broker-dealers or agents that are involved in selling the shares offered under this prospectus may be deemed to be “underwriters” within the meaning of the Securities Act in connection with these sales. Commissions received by these broker-dealers or agents and any profit on the resale of the shares purchased by them may be deemed to be underwriting commissions or discounts under the Securities Act. Any broker-dealers or agents that are deemed to be underwriters may not sell shares of common stock offered under this prospectus unless and until we set forth the names of the underwriters and the material details of their underwriting arrangements in a supplement to this prospectus or, if required, in a replacement prospectus included in a post-effective amendment to the registration statement of which this prospectus is a part.
The Selling Shareholders and any other persons participating in the sale or distribution of the shares offered under this prospectus will be subject to applicable provisions of the Exchange Act, and the rules and regulations under that act, including Regulation M. These provisions may restrict activities of, and limit the timing of purchases and sales of any of the shares by, the Selling Shareholders or any other person. Furthermore, under Regulation M, persons engaged in a distribution of securities are prohibited from simultaneously engaging in market making and other activities with respect to those securities for a specified period of time prior to the commencement of such distributions, subject to specified exceptions or exemptions. All of these limitations may affect the marketability of the shares.
If any of the shares offered for sale pursuant to this prospectus are transferred other than pursuant to a sale under this prospectus, then subsequent holders could not use this prospectus until a post-effective amendment or prospectus supplement is filed, naming such holders. We offer no assurance as to whether any of the Selling Shareholders will sell all or any portion of the shares offered under this prospectus.
We agreed to use commercially reasonable efforts to keep the registration statement of which this prospectus is a part effective at all times until none of the Selling Shareholders owns any Warrants or shares of common stock issuable upon the exercise thereof. The shares will be sold only through registered or licensed brokers or dealers if required under applicable state securities laws. In addition, in certain states, the shares covered hereby may not be sold unless they have been registered or qualified for sale in the applicable state or an exemption from the registration or qualification requirement is available and is complied with.
DESCRIPTION OF SECURITIESCAPITAL STOCK
Our authorized capital stock consists of 50,000,000 shares of our common stock, without par value per share, and 2,000,000 shares of our preferred stock, without par value per share. As of the date of this prospectus, 6,200,841March 29, 2018, 12,533,035 shares of our common stock are issued and outstanding, and no shares of our preferred stock are issued and outstanding.have been issued. The following summary description relating to our capital stock does not purport to be complete and is qualified in its entirety by our First Amended and Restated Articles of Incorporation and Bylaws.
Common Stock
Holders of our common stock are entitled to cast one vote for each share on all matters submitted to a vote of shareholders, including the election of directors. The holders of our common stock are entitled to receive ratably such dividends, if any, as may be declared by the Board of Directors out of funds legally available therefor and subject to any preference of any then authorized and issued shares of our preferred stock. Such holders do not have any preemptive or other rights to subscribe for additional shares. All holders of shares of our common stock are entitled to share ratably in any assets for distribution to shareholders upon the liquidation, dissolution or winding up of our company, subject to any preference of any then authorized and issued preferred stock. There are no conversion, redemption or sinking fund provisions applicable to ourthe common stock. All outstanding shares of our common stock are fully paid and nonassessable.
Preferred Stock
Our First Amended and Restated Articles of Incorporation authorizesand Bylaws provide that upon completion of our initial public offering, our board of directors are authorized to issue, without shareholder approval, blank check preferred stock. Blank check preferred stock can operate as a defensive measure known as a “poison pill” by diluting the issuancestock ownership of a potential hostile acquirer to prevent an acquisition that is not approved by our board of directors.
Limitations on the Right to Own Shares
There are no limitations on the right to own our shares.
Disclosure of Shareholder Ownership
There are no provisions in our First Amended and Restated Articles of Incorporation and Bylaws governing the ownership threshold above which shareholder ownership must be disclosed.
Changes in Capital
We may from time to time by ordinary resolution increase the share capital by such sum, to be divided into shares of such amount, as the resolution shall prescribe. The new shares shall be subject to the same provisions with reference to the payment of calls, lien, transfer, transmission, forfeiture and otherwise as the shares in the original share capital. We may by ordinary resolution:
| ● | consolidate and divide all or any of our share capital into shares of larger amount than our existing shares; |
| | |
| ● | convert all or any of our paid up shares into stock and reconvert that stock into paid up shares of any denomination; |
| ● | in many circumstances, sub-divide our existing shares, or any of them, into shares of smaller amount provided that in the subdivision the proportion between the amount paid and the amount, if any, unpaid on each reduced share shall be the same as it was in the case of the share form which the reduced share is derived; and |
| ● | cancel any shares which, at the date of the passing of the resolution, have not been taken or agreed to be taken by any person and diminish the amount of its share capital by the amount of the shares so cancelled. |
We may by special resolution reduce our share capital and any capital redemption reserve fund in any manner authorized by law.
Incentive Plan
Pursuant to our 2008 Stock Incentive Plan (the “2008 Plan”), we are authorized to issue options to purchase 302,903 shares of our preferredcommon stock. There are 64,000 outstanding options taken from the 2008 Incentive Plan. Pursuant to our 2014 Stock Incentive Plan (the “2014 Plan”), we are authorized to issue, in the aggregate, 10,000,000 shares of common stock or other securities convertible or exercisable for common stock. We have granted options to purchase an aggregate of 150,000 shares of common stock under the 2014 Plan in oneJuly 2016, among which, options to purchase 75,000 shares of common stock have been exercised. In addition, we have issued, in the aggregate, 600,000 shares of common stock to consultants to our company in 2014 and 660,000 shares of common stock to our officers and directors in 2016 under the 2014 Plan. In October 2017, we issued 130,000 restricted shares to three employees under the 2014 Plan. Accordingly, we may issue options to purchase 238,903 shares under the 2008 Plan, and we may issue 8,460,000 shares of common stock or more series. Our Board of Directors hasother securities convertible or exercisable for common stock under the authority, without any vote or action by2014 Plan.
Warrants
We have issued to the shareholders,Selling Shareholders Series A Warrants to create one or more series of our preferred stockpurchase up to the limitan aggregate of our authorized but unissued2,000,000 shares of our preferredcommon stock at an initial exercise price equal to $1.75 per share and Series B Warrants to fix:purchase up to an aggregate of 2,000,000 shares of common stock at an initial exercise price equal to $1.75 per share. The exercise price of the Warrants is subject to certain adjustments in the event of (1) payment of a dividend or other distribution on any class of capital stock that is payable in common stock; (2) subdivisions of outstanding shares of common stock into a larger number of shares; or (3) combinations of outstanding shares of common stock into a smaller number of shares.
Each Series A Warrant is exercisable beginning on September 14, 2018 and has a term of exercise equal to five and a half (5.5) years from the date of issuance, and each Series B Warrant is exercisable beginning on September 14, 2018 and has a term of exercise equal to thirteen (13) months from the date of issuance. Subject to limited exceptions, a holder of Warrants will not have the right to exercise any portion of its Warrants if the holder, together with its affiliates, would beneficially own in excess of 4.99% of the number of shares constituting such series and the designation of such series, (2) the voting powers (if any) of the shares of such series and the relative participating, option or other special rights (if any), and (3) any qualifications, preferences, limitations or restrictions pertaining to such series; all of which may be fixed by our Board of Directors pursuant to a resolution or resolutions providing for the issuance of such series duly adopted by our Board of Directors.
The provisions of a particular series of our authorized preferred stock, as designated by our Board of Directors, may include restrictions on the payment of dividends on our common stock. Such provisions may also include restrictions on our ability to purchase shares of our common stock oroutstanding immediately after giving effect to purchase or redeemsuch exercise. At any time after the initial exercise date of the Warrants, if a registration statement and current prospectus covering the resale of the shares of common stock issuable upon exercise of the Warrants is not available, the holder may exercise the Warrants in whole or in part on a particular seriescashless basis.
If, at any time while the Warrants are outstanding: (1) we consolidate or merge with or into another entity in which the Company is not the surviving entity; (2) we sell, lease, assign, convey or otherwise transfer all or substantially all of our authorized preferred stock. Dependingassets; (3) any tender offer or exchange offer (whether completed by us or a third party) is completed pursuant to which holders of a majority of our outstanding shares of common stock tender or exchange their shares for securities, cash or other property; (4) we effect any reclassification of our shares of common stock or compulsory share exchange pursuant to which outstanding shares of common stock are converted or exchanged for other securities, cash or property; or (5) any transaction is consummated whereby any person or entity acquires more than 50% of our outstanding shares of common stock (each, a “Fundamental Transaction”), then upon any subsequent exercise of a Warrant, the holder thereof will have the right to receive the same amount and kind of securities, cash or other property as it would have been entitled to receive upon the voting rights grantedoccurrence of such Fundamental Transaction if it had been, immediately prior to such Fundamental Transaction, the holder of the number of shares then issuable upon exercise of the Warrant.
If, at any seriestime while the Warrants are outstanding, we declare or make any dividend or other distribution of our authorized preferred stock, issuance thereof could result in a reduction in the voting power of the holders ofassets (or rights to acquire our common stock. In the event we dissolve, liquidate or wind up our business, whether voluntarily or involuntarily, the holders of our preferred stock, if any, will receive, in priority over theassets) to holders of our common stock, any liquidation preference established by our Boardway of Directors, together with accumulated and unpaid dividends. Depending upon the consideration paid for our preferred stock, the liquidation preferencereturn of our preferred stock and other matters, the issuancecapital or otherwise, then each holder of our preferred stock could resulta Warrant shall be entitled to participate in a reduction in the assets available forsuch distribution to the same extent that the holder would have participated therein if the holder had held the number of shares of common stock acquirable upon complete exercise of the Warrant immediately prior to the record date for such distribution.
If at any time while the Warrants are outstanding we grant, issue or sell any common stock equivalents or rights to purchase stock, warrants, securities or other property pro rata to the record holders of our common stock in(“Purchase Rights”), then each holder of a Warrant will be entitled to acquire, upon the event we liquidate.
terms applicable to such Purchase Rights, the aggregate Purchase Rights which such holder could have acquired if such holder had held the number of shares of common stock acquirable upon complete exercise of the Warrant immediately prior to the date on which a record is taken for the grant, issuance or sale of such Purchase Rights, or, if no such record is taken, the date as of which the record holders of common stock are to be determined for the grant, issue or sale of such Purchase Rights.
UNDERWRITING
We have entered into an underwriting agreement with National Securities Corporation (the “underwriter”) pursuant to whichThe Warrants were, and the underwriter has agreed to purchase from us [_________] shares of our common stock toissuable upon exercise of the Warrants will be, issued and sold without registration under the Securities Act, or state securities laws, in this offering at the public offering price set forthreliance on the cover pageexemptions provided by Section 4(a)(2) of this prospectus, less the underwriting discount.Securities Act and/or Regulation D promulgated thereunder and in reliance on similar exemptions under applicable state laws.
We have agreed, on or prior to indemnifyApril 30, 2018, to file a registration statement on Form S-1 providing for the underwriter and its officers, directors, principals, employees, affiliates and shareholders against certain liabilities, including civil liabilities underresale by the Securities Act, resulting from this offering and to contribute to payments the underwriter may be required to make in respect of such liabilities.
The underwriter is offering the shares, subject to prior sale, when, as and if issued to and accepted by it, subject to approval of legal matters by its counsel, including the validitySelling Shareholders of the shares issued and other conditions contained inissuable upon the underwriting agreement, such as the receipt by the underwriter of officer’s certificates and legal opinions. The underwriter reserves the right to withdraw, cancel or modify offers to the public and to reject orders in whole or in part.
The underwriter has advised us that it proposes to initially offer the shares of our common stock to the public at $[__] per share. The underwriter proposes to offer the shares to certain dealers at the same price less a concession of not more than $[____] per share. After the initial offering of the shares, the underwriter may from time to time vary the offering prices and other selling terms.
Over-allotment Option to Purchase Additional Shares
We have granted to the underwriter an option to purchase up to _______ additional shares of our common stock from us at the same price to the public, less the same underwriting discount, as set forth in the table below. The underwriter may exercise this option any time during the 30-day period after the date of this prospectus, but only to cover over-allotments, if any, including as described below.
Underwriter Discount and Expenses
The following table summarizes the public offering price, underwriting discount and proceeds before expenses to us. These amounts are shown assuming both no exercise and full exercise of the underwriter’s over-allotment option. We have also agreed to pay up to $125,000 of the out-of-pocket fees and expenses of the underwriter, which include the fees and expenses of counsel to the underwriter. The fees and expenses of the underwriter that we have agreed to reimburse are not included in the underwriting discount set forth in the table below. The underwriting discount was determined through arms’ length negotiations between us and the underwriter.
| | | | | TOTAL FEES | |
| | Per Share
Underwriting
Discount | | | Without Exercise of
Option to Purchase
Additional Shares | | | With Full Exercise of
Option to Purchase
Additional Shares | |
Underwriting discount to be paid by us | | $ | | | | $ | | | | $ | | |
Warrants.
We estimate that the total expenses of the offering, excluding the underwriting discount, will be approximately $442,736. This includes an 8% selling discount plus $125,000 of fees and expenses of the underwriter. These expenses are payable by us.Common Stock Listing
After deducting fees due to the underwriter and our estimated offering expenses, we expect the net proceeds from this offering to be approximately $[________].
Stabilization
To facilitate this offering, the underwriter may engage in transactions that stabilize, maintain or otherwise affect the price of ourOur common stock during and after this offering. Specifically, the underwriter may over-allot or otherwise create a short position in our common stock for its own account by selling more shares of our common stock than have been sold to it by us. The underwriter may elect to cover any such short position by purchasing shares of our common stock in the open market or by exercising the over-allotment option granted to the underwriter. In addition, the underwriter may stabilize or maintain the price of our common stock by bidding for or purchasing shares of our common stock in the open market and may impose penalty bids. If penalty bids are imposed, selling concessions allowed to broker-dealers participating in this offering are reclaimed if shares of our common stock previously distributed in this offering are repurchased, whether in connection with stabilization transactions or otherwise. The effect of these transactions may be to stabilize or maintain the market price of our common stock at a level above that which might otherwise prevail in the open market. The imposition of a penalty bid may also affect the price of our common stock to the extent that it discourages resales of our common stock. The magnitude or effect of any stabilization or other transactions is uncertain. These transactions may be effectedlisted on the NASDAQ Capital Market or otherwise and, if commenced, may be discontinued at any time. Neither we norunder the underwriter make any representation or prediction as to the effect that the transactions described above may have on the price of our common stock.trading symbol “SINO”.
Passive Market Making
In connection with this offering, the underwriter (and any dealers that are members of the selling group) may also engage in passive market making transactions in the common stock. Passive market making consists of displaying bids limited by the prices of independent market makers and effecting purchases limited by those prices in response to order flow. Rule 103 of Regulation M promulgated by the SEC limits the amount of net purchases that each passive market maker may make and the displayed size of each bid. Passive market making may stabilize the market price of our common stock at a level above that which might otherwise prevail in the open market and, if commenced, may be discontinued at any time.
Electronic Offer, Sale and Distribution of Shares
A prospectus in electronic format may be made available on the websites maintained by the underwriter and the underwriter may distribute prospectuses electronically. In those cases, prospective investors may view offering terms and a prospectus online and place orders online or through their financial advisors. Other than the prospectus in electronic format, the information on these websites is not part of this prospectus, the accompanying prospectus or the registration statement of which this prospectus and the accompanying prospectus form a part, has not been approved or endorsed by us or the underwriter, and should not be relied upon by investors.
Other Relationships with the Underwriter
From time to time in the ordinary course of business, the underwriter and its respective affiliates may in the future perform various commercial banking financial advisory, investment banking and other financial services for us for which it will receive customary fees and reimbursement of expenses.
Offer Restrictions Outside the United States
Other than in the United States, no action has been taken by us or the underwriter that would permit a public offering of the securities offered by this prospectus in any jurisdiction where action for that purpose is required. The shares of our common stock offered in this offering may not be offered or sold, directly or indirectly, nor may this prospectus or any other offering material or advertisements in connection with the offer and sale of any such securities be distributed or published in any jurisdiction, except under circumstances that will result in compliance with the applicable rules and regulations of that jurisdiction. Persons into whose possession this prospectus comes are advised to inform themselves about and to observe any restrictions relating to this offering and the distribution of this prospectus. This prospectus does not constitute an offer to sell or a solicitation of an offer to buy any shares of our common stock offered in this offering in any jurisdiction in which such an offer or a solicitation is unlawful.
Delivery of Shares of Common Stock
Delivery of shares of our common stock issued and sold in this offering will occur on or before [_________], 2014.
Transfer Agent and Registrar
The transfer agent and registrar for shares of our common stock is Computershare Inc. located in 350 IndianaMeidinger Tower, 462 S. 4th Street, Suite 750, Golden CO, 80401Louisville, KY 40202 U.S. Our transfer agent’s phone number is 303-262-0678502-301-6108 and facsimile number is 312-601-2312.
Listing
Shares of our common stock are quoted on the NASDAQ Capital Market under the trading symbol “SINO”.886-519-2854.
LEGAL MATTERS
Certain legal matters as to certain United States federal securities lawThe validity of the common stock registered for resale hereby will be passed upon for us by Gusrae Kaplan Nusbaum PLLC, New York, New York. Duane Morris LLP is acting as counsel for the underwriter in connection with this offering. Certain legal matters as to Virginia law will be passed upon for us by KaufmanWoods Rogers PLC (d/b/a Woods Rogers Edmunds & Canoles, P.C., Richmond, Virginia. Gusrae Kaplan Nusbaum PLLC will rely upon Kaufman & Canoles, P.C. with respect to matters governed by Virginia law.
Williams).
EXPERTS
OurThe consolidated financial statements as of June 30, 2014 and 2013, andour Company appearing in our annual report on Form 10-K for each of the twofiscal years in the period ended June 30, 2014, included in this prospectus,2017 and 2016 have been so included in reliance on the report ofaudited by Friedman LLP, an independent registered public accounting firm, as set forth in the reports thereon included therein. Such consolidated financial statements are included herein in reliance upon such reports given on the authority of such firmfirms as experts in accounting and auditing.
WHERE YOU CAN FIND ADDITIONALMORE INFORMATION
We have filed with the SEC a registration statement on Form S-1 under the Securities Act with respect to our shares of common stock offered in this offering. This prospectus does not contain allthat registers the distribution of the information set forth in the registration statement. For further information with respect to us and the shares of our common stock, we refer you to thesecurities offered under this prospectus. The registration statement, and to the attached exhibits. With respect to each such document filed as an exhibit to the registration statement, we refer you to the exhibit for a more complete description of the matters involved.
You may inspect our registration statement andincluding the attached exhibits and schedules, without chargecontains additional relevant information about us and the securities. The rules and regulations of the SEC allow us to omit from this prospectus certain information included in the registration statement.
In addition, we file annual, quarterly and special reports, proxy statements and other information with the SEC. You may read and copy this information and the registration statement at the SEC public reference facilities maintained by the SECroom located at 100 F Street, N.E., Washington D.C. 20549. You may obtain copies of all or any part of our registration statement fromPlease call the SEC upon payment of prescribed fees. You may obtainat 1-800-SEC-0330 for more information onabout the operation of the public reference room by callingroom.
In addition, any information we file with the SEC at 1-800-SEC-0330.
Our SEC filings, including the registration statement and the exhibits filed with the registration statement, areis also available fromon the SEC’s website atwww.sec.gov, http://www.sec.gov. We also maintain a web site at www.sino-global.com, which contains reports, proxyprovides additional information about our company and through which you can also access our SEC filings. The information statements and other information regarding issuers that file electronically with the SEC.set forth on our web site is not part of this prospectus.
Index to Financial StatementsINDEX TO FINANCIAL STATEMENTS

SINO-GLOBAL SHIPPING AMERICA, LTD. AND AFFILIATES
CONDENSED CONSOLIDATED BALANCE SHEETS
(UNAUDITED)
| | | September 30, | | | June 30, | |
| | | 2014 | | | 2014 | |
| | | | | | | |
| Assets | | | | | | | | |
| Current assets | | | | | | | | |
| Cash and cash equivalents | | $ | 3,553,187 | | | $ | 902,531 | |
| Advances to suppliers | | | 28,612 | | | | 8,482 | |
Accounts receivable, less allowance for doubtful accounts of $443,711 and $443,858 as
of September 30, 2014 and June 30, 2014, respectively | | | 959,033 | | | | 481,885 | |
Other receivables, less allowance for doubtful accounts of $251,139 and $250,100 as of
September 30, 2014 and June 30, 2014, respectively | | | 471,234 | | | | 174,406 | |
| Prepaid expenses – current | | | 461,462 | | | | 216,729 | |
| Due from related parties | | | 880,290 | | | | 3,173,765 | |
| | | | | | | | | |
| Total Current Assets | | | 6,353,818 | | | | 4,957,798 | |
| | | | | | | | | |
| Property and equipment, net | | | 266,454 | | | | 294,722 | |
| Prepaid expenses – noncurrent | | | 749,438 | | | | 280,800 | |
| Other long-term assets | | | 28,864 | | | | 16,734 | |
| Deferred tax assets | | | 192,800 | | | | 163,900 | |
| | | | | | | | | |
| Total Assets | | $ | 7,591,374 | | | $ | 5,713,954 | |
| | | | | | | | | |
| Liabilities and Equity | | | | | | | | |
| Current liabilities | | | | | | | | |
| Advances from customers | | $ | 213,181 | | | $ | 88,477 | |
| Accounts payable | | | 242,511 | | | | 398,756 | |
| Accrued expenses | | | 142,069 | | | | 177,877 | |
| Other current liabilities | | | 555,099 | | | | 565,685 | |
| | | | | | | | | |
| Total Current Liabilities | | | 1,152,860 | | | | 1,230,795 | |
| | | | | | | | | |
| Total Liabilities | | | 1,152,860 | | | | 1,230,795 | |
| | | | | | | | | |
| Commitments and Contingency | | | | | | | | |
| | | | | | | | | |
| Equity | | | | | | | | |
| Preferred stock, 2,000,000 shares authorized, no par value, none issued. | | | - | | | | - | |
Common stock, 50,000,000 shares authorized, no par value; 6,326,032 and 5,229,032 shares
issued as of September 30, 2014 and June 30, 2014; 6,200,841 and 5,103,841 shares outstanding
as of September 30, 2014 and June 30, 2014 | | | 13,385,477 | | | | 11,662,157 | |
| Additional paid-in capital | | | 1,144,842 | | | | 1,144,842 | |
| Treasury stock, at cost - 125,191 shares | | | (372,527 | ) | | | (372,527 | ) |
| Accumulated deficit | | | (2,937,801 | ) | | | (3,270,260 | ) |
| Accumulated other comprehensive income | | | 59,418 | | | | 24,618 | |
| Unearned stock-based compensation | | | (11,640 | ) | | | (11,640 | ) |
| | | | | | | | | |
| Total Sino-Global Shipping America Ltd. Stockholders' Equity | | | 11,267,769 | | | | 9,177,190 | |
| | | | | | | | | |
| Non-Controlling Interest | | | (4,829,255 | ) | | | (4,694,031 | ) |
| | | | | | | | | |
| Total Equity | | | 6,438,514 | | | | 4,483,159 | |
| | | | | | | | | |
| Total Liabilities and Equity | | $ | 7,591,374 | | | $ | 5,713,954 | |
The accompanying notes are an integral part of these unaudited condensed consolidated financial statements.
SINO-GLOBAL SHIPPING AMERICA, LTD. AND AFFILIATES
CONDENSED CONSOLIDATED STATEMENTS OF OPERATIONS AND COMPREHENSIVE INCOME
(UNAUDITED)
| | | For the three months ended September 30, | |
| | | 2014 | | | 2013 | |
| | | | | | | |
| Net revenues | | $ | 2,605,925 | | | $ | 3,317,661 | |
| | | | | | | | | |
| Cost of revenues | | | (1,409,153 | ) | | | (2,387,803 | ) |
| Gross profit | | | 1,196,772 | | | | 929,858 | |
| | | | | | | | | |
| General and administrative expenses | | | (939,805 | ) | | | (896,164 | ) |
| Selling expenses | | | (56,339 | ) | | | (51,088 | ) |
| | | | (996,144 | ) | | | (947,252 | ) |
| | | | | | | | | |
| Operating income (loss) | | | 200,628 | | | | (17,394 | ) |
| | | | | | | | | |
| Financial (expense) income, net | | | (62,382 | ) | | | 23,867 | |
| | | | | | | | | |
| Net income before provision for income taxes | | | 138,246 | | | | 6,473 | |
| | | | | | | | | |
| Income tax benefit | | | 27,255 | | | | 22,500 | |
| | | | | | | | | |
| Net income | | | 165,501 | | | | 28,973 | |
| | | | | | | | | |
| Net loss attributable to non-controlling interest | | | (166,958 | ) | | | (246,421 | ) |
| | | | | | | | | |
| Net income attributable to Sino-Global Shipping America, Ltd. | | $ | 332,459 | | | $ | 275,394 | |
| | | | | | | | | |
| Comprehensive income | | | | | | | | |
| Net income | | $ | 165,501 | | | $ | 28,973 | |
| Foreign currency translation gain (loss) | | | 66,534 | | | | (25,637 | ) |
| Comprehensive income | | | 232,035 | | | | 3,336 | |
| Less: Comprehensive loss attributable to non-controlling interest | | | (135,224 | ) | | | (260,174 | ) |
| | | | | | | | | |
| Comprehensive income attributable to Sino-Global Shipping America Ltd. | | $ | 367,259 | | | $ | 263,510 | |
| | | | | | | | | |
| Earnings per share | | | | | | | | |
| -Basic and diluted | | $ | 0.06 | | | $ | 0.06 | |
| | | | | | | | | |
| Weighted average number of common shares used in computation | | | | | | | | |
| -Basic and diluted | | | 5,920,950 | | | | 4,703,841 | |
The accompanying notes are an integral part of these unaudited condensed consolidated financial statements.
SINO-GLOBAL SHIPPING AMERICA LTD. AND AFFILIATES
CONDENSED CONSOLIDATED STATEMENTS OF CASH FLOWS
(UNAUDITED)
| | | For the three months ended September 30, | |
| | | 2014 | | | 2013 | |
| | | | | | | |
| Operating Activities | | | | | | | | |
| | | | | | | | | |
| Net income | | $ | 165,501 | | | $ | 28,973 | |
| Adjustment to reconcile net income to net cash provided by (used in) operating activities | | | | | | | | |
| Depreciation and amortization | | | 55,560 | | | | 27,575 | |
| Amortization of stock-based compensation to consultants | | | 71,689 | | | | - | |
| (Recovery of) provision for doubtful accounts | | | (147 | ) | | | 108 | |
| Deferred tax benefit | | | (28,900 | ) | | | (22,500 | ) |
| Changes in assets and liabilities | | | | | | | | |
| (Increase) decrease in advances to suppliers | | | (20,130 | ) | | | 101,992 | |
| (Increase) decrease in accounts receivable | | | (477,001 | ) | | | 236,660 | |
| Increase in other receivables | | | (296,828 | ) | | | (375,498 | ) |
| Increase in prepaid expenses | | | (113,060 | ) | | | (558 | ) |
| Decrease in employee loan receivables | | | - | | | | 5,338 | |
| Increase in other long-term assets | | | (12,130 | ) | | | (7,522 | ) |
| Decrease (increase) in due from related parties | | | 1,174,234 | | | | (612,000 | ) |
| Increase (decrease) in advances from customers | | | 124,704 | | | | (407,030 | ) |
| Decrease in accounts payable | | | (156,245 | ) | | | (33,359 | ) |
| (Decrease) increase in accrued expenses | | | (35,808 | ) | | | 76,096 | |
| (Decrease) increase in other current liabilities | | | 72,913 | | | | (48,909 | ) |
| | | | | | | | | |
| Net cash provided by (used in) operating activities | | | 524,352 | | | | (1,030,634 | ) |
| | | | | | | | | |
| Investing Activities | | | | | | | | |
| Acquisitions of property and equipment | | | (15,339 | ) | | | (3,399 | ) |
| Collection of short-term loan from related party | | | 1,119,241 | | | | - | |
| | | | | | | | | |
| Net cash provided by (used in) investing activities | | | 1,103,902 | | | | (3,399 | ) |
| | | | | | | | | |
| Financing Activities | | | | | | | | |
| Proceeds from issuance of common stock, net | | | 967,820 | | | | - | |
| | | | | | | | | |
| Net cash provided by financing activities | | | 967,820 | | | | - | |
| | | | | | | | | |
| Effect of exchange rate fluctuations on cash and cash equivalents | | | 54,582 | | | | (28,261 | ) |
| | | | | | | | | |
| Net increase (decrease) in cash and cash equivalents | | | 2,650,656 | | | | (1,062,294 | ) |
| | | | | | | | | |
| Cash and cash equivalents at beginning of period | | | 902,531 | | | | 3,048,831 | |
| | | | | | | | | |
| Cash and cash equivalents at end of period | | $ | 3,553,187 | | | $ | 1,986,537 | |
| | | | | | | | | |
| Supplemental information: | | | | | | | | |
| Income taxes paid | | $ | 8,104 | | | $ | 7,949 | |
| Non-cash transactions of operating activities: | | | | | | | | |
| Common stock issued for LSM acquisition and stock-based compensation to consultants | | $ | 755,500 | | | $ | - | |
The accompanying notes are an integral part of these unaudited condensed consolidated financial statements.
SINO-GLOBAL SHIPPING AMERICA, LTD. AND AFFILIATES
NOTES TO THE UNAUDITED CONDENSED CONSOLIDATED FINANCIAL STATEMENTS
1. ORGANIZATION AND NATURE OF BUSINESS
Founded in the United States of America (“US”) in 2001, Sino-Global Shipping America, Ltd. (“Sino-Global” or the “Company”) is a shipping agency, logistics and ship management services company. The Company’s current service offerings consist of shipping agency services, shipping and chartering services, inland transportation management services and ship management services. The Company conducts its business primarily through its wholly-owned subsidiaries in China, Hong Kong, Australia, Canada and New York. Substantially all of the Company’s business is generated from clients located in the People’s Republic of China (the “PRC”), and its operations are primarily conducted in the PRC and Hong Kong.
The Company’s subsidiary in China, Trans Pacific Shipping Limited (“Trans Pacific Beijing”), a wholly owned foreign enterprise, invested in one 90%-owned subsidiary, Trans Pacific Logistics Shanghai Limited (“Trans Pacific Shanghai”. Trans Pacific Beijing and Trans Pacific Shanghai are referred to collectively as “Trans Pacific”). As PRC laws and regulations restrict foreign ownership of shipping agency service businesses, the Company used to provide its shipping agency services in the PRC through Sino-Global Shipping Agency Ltd. (“Sino-China”), a Chinese legal entity, which holds the licenses and permits necessary to operate shipping agency services in the PRC. Trans Pacific Beijing and Sino-China do not have a parent-subsidiary relationship. Trans Pacific Beijing has contractual arrangements with Sino-China and its shareholders that enable the Company to substantially control Sino-China. Through Sino-China, the Company has the ability to provide shipping agency services in all commercial ports in the PRC. During fiscal year 2014, the Company completed a number of cost reduction initiatives and reorganized its shipping agency business in the PRC. As a result of the business reorganization, the Company does not provide shipping agency services through Sino-China as of September 30, 2014.
The Company’s shipping agency business is operated by its subsidiaries in Hong Kong and Australia. As a general shipping agent, the Company serves ships coming to and departing from a number of countries, including China, Australia, South Africa, Brazil and Canada. The shipping and chartering services are operated by Sino-Global Shipping (HK) Ltd; the inland transportation management services are operated by Trans Pacific Beijing. As part of Sino-Global’s strategy to expand its service platform, the Company acquired Longhe Ship Management (Hong Kong) Co., Limited (“LSM”), a ship management company that is based in Hong Kong in September 2014.
2. SUMMARY OF SIGNIFICANT ACCOUNTING POLICIES
(a) Basis of Presentation
The accompanying unaudited condensed consolidated financial statements have been prepared in accordance with accounting principles generally accepted in the United States of America (“US GAAP”) for interim financial information pursuant to the rules and regulations of the Securities Exchange Commission (“SEC”). The financial statements include the accounts of all directly, indirectly owned subsidiaries and variable interest entity (VIE”). All material intercompany transactions and balances have been eliminated in consolidation. In the opinion of management, all adjustments considered necessary to give a fair presentation have been included. Interim results are not necessarily indicative of results of a full year. Certain prior year balances were reclassified to conform to the current year presentation. These reclassifications have no material impact on the previously reported financial position, results of operations or cash flows.
(b) Basis of Consolidation
The unaudited condensed consolidated financial statements include the accounts of the Company, its subsidiaries, and its affiliates. All intercompany transactions and balances are eliminated in consolidation. Sino-China is considered a variable interest entity (“VIE”), and the Company is the primary beneficiary. The Company through Trans Pacific Beijing entered into agreements with Sino-China, pursuant to which the Company receives 90% of Sino-China’s net income. Sino-China was designed to operate in China for the benefit of the Company. The Company does not receive any payment from Sino-China unless Sino-China recognizes net income during its fiscal year. These agreements do not entitle the Company to any consideration if Sino-China incurs a net loss during its fiscal year. If Sino-China incurs a net loss during its fiscal year, the Company is not required to absorb such net loss.
As a VIE, Sino-China’s revenues are included in the Company’s total revenues, and its income (loss) from operations is consolidated with the Company’s. Because of the contractual arrangements, the Company had a pecuniary interest in Sino-China that requires consolidation of the Company’s and Sino-China’s financial statements.
The Company has consolidated Sino-China’s operating results because the entities are under common control in accordance with ASC 805-10, “Business Combinations”. The agency relationship between the Company and Sino-China and its branches is governed by a series of contractual arrangements pursuant to which the Company has substantial control over Sino-China. Management makes ongoing reassessments of whether the Company is the primary beneficiary of Sino-China. .
The carrying amount and classification of Sino-China's assets and liabilities included in the Company’s Condensed Consolidated Balance Sheets are as follows:
| | | September 30, | | | June 30, | |
| | | 2014 | | | 2014 | |
| | | | | | | |
| Total current assets | | $ | 224,612 | | | $ | 173,273 | |
| Total assets | | | 446,401 | | | | 419,048 | |
| Total current liabilities | | | 278,795 | | | | 312,521 | |
| Total liabilities | | | 278,795 | | | | 312,521 | |
(c) Revenue Recognition Policy
| Ÿ | Revenues from shipping agency services are recognized upon completion of services, which coincides with the date of departure of the relevant vessel from port. Advance payments and deposits received from customers prior to the provision of services and recognition of the related revenues are presented as advances from customers. |
| Ÿ | Revenues from shipping and chartering services are recognized upon performance of services as stipulated in the underlying contract. |
| Ÿ | Revenues from inland transportation management services are recognized when commodities are being released from the customer’s warehouse. |
| Ÿ | Revenues from ship management services are recognized when the related contractual services are rendered. |
(d) Translation of Foreign Currency
The accounts of the Company and its subsidiaries, including Sino-China and each of its branches are measured using the currency of the primary economic environment in which the entity operates (the “functional currency”). The Company’s functional currency is the US dollars (“USD”) while Sino-China reports its financial position and results of operations in Renminbi (“RMB”). The accompanying unaudited condensed consolidated financial statements are presented in US dollars. Foreign currency transactions are translated into USD using fixed exchange rates in effect at the time of the transaction. Generally foreign exchange gains and losses resulting from the settlement of such transactions are recognized in the unaudited condensed consolidated statements of operations. The Company translates foreign currency financial statements of Sino-China, Sino-Global Shipping Australia, Sino-Global Shipping Hong Kong, Sino-Global Shipping Canada and Trans Pacific Beijing in accordance with ASC 830-10, “Foreign Currency Matters”. Assets and liabilities are translated at current exchange rates quoted by the People’s Bank of China at the balance sheet dates and revenues and expenses are translated at average exchange rates in effect during the year. Resulting translation adjustments are recorded as other comprehensive income (loss) and accumulated as a separate component of equity of the Company and also included in non-controlling interest.
The exchange rates as of September 30, 2014 and June 30, 2014 and for the three months ended September 30, 2014 and 2013 are as follows:
| | | September 30, | | | June 30, | | | Three months ended
September 30, | |
| | | 2014 | | | 2014 | | | 2014 | | | 2013 | |
| Foreign currency | | BS | | | BS | | | PL | | | PL | |
| RMB:1USD | | | 6.1502 | | | | 6.2043 | | | | 6.1646 | | | | 6.1266 | |
| 1AUD:USD | | | 1.1451 | | | | 1.0609 | | | | 1.0813 | | | | 0.9154 | |
| 1HKD:USD | | | 7.7649 | | | | 7.7503 | | | | 7.7509 | | | | 0.1289 | |
| 1CAD:USD | | | 1.1154 | | | | 1.0672 | | | | 1.0888 | | | | 0.9625 | |
(e) Cash and Cash Equivalents
Cash and cash equivalents consist of cash on hand, and other highly liquid investments which are unrestricted as to withdrawal or use, and which have maturities of three months or less when purchased. The Company maintains cash and cash equivalents with various financial institutions mainly in the PRC, Australia, Hong Kong and the United States. As of September 30, 2014 and June 30, 2014, the Company’s uninsured bank balance was mainly maintained at financial institutions located in the PRC, totaled $1,757,201 and $262,885 respectively.
(f) Accounts Receivable
Accounts receivable are presented at net realizable value. The Company maintains allowances for doubtful accounts for estimated losses. The Company reviews the accounts receivable on a periodic basis and makes general and specific allowances when there is doubt as to the collectability of individual balances. In evaluating the collectability of individual receivable balances, the Company considers many factors, including the age of the balances, customers’ historical payment history, their current credit-worthiness and current economic trends. Receivables are considered past due after 365 days. Accounts are written off after exhaustive efforts at collection.
(g) Earnings per Share (“EPS”)
Basic earnings per share is computed by dividing net income attributable to holders of common shares by the weighted average number of common shares outstanding during the applicable period. Diluted earnings per share reflect the potential dilution that could occur if securities or other contracts to issue common shares were exercised or converted into common shares. Common share equivalents are excluded from the computation of diluted earnings per share if their effects would be anti-dilutive.
The effect of 66,000 stock options and 139,032 warrants for all periods presented were not included in the calculation of diluted EPS because they would be anti-dilutive as the exercise prices for such options and warrants were higher than the average market price for the three months ended September 30, 2014 and 2013.
(h) Risks and Uncertainties
The operations of the Company are primarily located in the PRC. Accordingly, the Company’s business, financial condition, and results of operations may be influenced by the political, economic, and legal environments in the PRC, as well as by the general state of the PRC economy. The Company’s operations in the PRC are subject to special considerations and significant risks not typically associated with companies in North America and Western Europe. These include risks associated with, among others, the political, economic and legal environment and foreign currency exchange. The Company’s results may be adversely affected by exchanges in the political, regulatory and social conditions in the PRC, and by changes in governmental policies or interpretations with respect to laws and regulations, anti-inflationary measures, currency conversion, remittances abroad, and rates and methods of taxation, among other things. In addition, the Company only controls Sino-China through a series of agreements. If such agreements were cancelled, modified or otherwise not complied with, the Company may not be able to retain control of this consolidated entity and the impact could be material to the Company’s operations. Moreover, the Company’s ability to grow its business and maintain its profitability could be negatively affected by the nature and extent of services provided to its major customer, Tianjin Zhi Yuan Investment Group Co., Ltd. (“Zhiyuan Investment Group”).
(i) Business Combinations
Business combinations are accounted for under the purchase method of accounting. Under the purchase method, assets and liabilities of the business acquired are recorded at their estimated fair values as of the date of acquisition with any excess of the cost of the acquisition over the fair value of the net tangible and intangible assets acquired recorded as goodwill. Results of operations of the acquired business are included in the income statement from the date of acquisition.
(j) Recent Accounting Pronouncements
In June 2014, the FASB issued ASU No. 2014-12, Compensation-Stock Compensation: Topic 718. This amendment requires that a performance target that affects vesting and that could be achieved after the requisite service period be treated as a performance condition. This ASU is effective for annual periods and interim periods within those annual periods beginning after December 15, 2015. Earlier adoption is permitted. The Company does not expect the adoption of this guidance will have a significant impact on the Company’s consolidated financial statements.
In August 2014, the FASB issued ASU No. 2014-15, “Disclosure of Uncertainties About an Entity’s Ability to Continue as a Going Concern” (“ASU 2014-15”), which requires management to perform interim and annual assessments of an entity’s ability to continue as a going concern within one year of the date the financial statements are issued and provides guidance on determining when and how to disclose going concern uncertainties in the financial statements. Certain disclosures will be required if conditions give rise to substantial doubt about an entity’s ability to continue as a going concern. ASU 2014-15 applies to all entities and is effective for annual and interim reporting periods ending after December 15, 2016, with early adoption permitted. The Company does not expect that the adoption of this standard will have a material effect on the Company’s consolidated financial statements.
In November 2014, FASB issued Accounting Standards Update No. 2014-16,Derivatives and Hedging (Topic 815): Determining Whether the Host Contract in a Hybrid Financial Instrument Issued in the Form of a Share Is More Akin to Debt or to Equity(a consensus of the FASB Emerging Issues Task Force). The amendments permit the use of the Fed Funds Effective Swap Rate (also referred to as the Overnight Index Swap Rate, or OIS) as a benchmark interest rate for hedge accounting purposes. Public business entities are required to implement the new requirements in fiscal years (and interim periods within those fiscal years) beginning after December 15, 2015. All other types of entities are required to implement the new requirements in fiscal years beginning after December 15, 2015, and interim periods beginning after December 15, 2016. The Company does not expect the adoption of ASU 2014-16 to have material impact on the Company's consolidated financial statement.
3. ACQUISITION OF LONGHE SHIP MANAGEMENT COMPANY
On August 8, 2014, the Company entered into an agreement to acquire all of the equity of Longhe Ship Management (Hong Kong) Co., Limited (“LSM”) from Mr. Deming Wang to further broaden its service platform. Mr. Deming Wang is a shareholder of the Company who held approximately 3.6% of the shares of common stock of the Company at the time of the acquisition agreement. Under the terms of the acquisition agreement, the purchase price for the equity of LSM will be between 20,000 and 200,000 shares of common stock of the Company, depending on the net income of LSM from July 4, 2014 through December 31, 2014. The first payment due under the agreement was an escrow payment of 50,000 shares of common stock of the Company. On August 22, 2014, the Company issued such 50,000 shares to be held in escrow to Mr. Deming Wang, in connection with the acquisition of LSM. The purchase price is estimated using the net equity of LSM as of the closing date and it will be adjusted when the earnout payment has been finalized.
On September 8, 2014, the closing date, LSM’s total assets were $199,482, or 2.6% of the Company’s consolidated total assets; and its total liabilities were $26,655, or 2.3% of the Company’s consolidated total liabilities. The assets acquired consisted of cash of $23,289, account receivable of $47,409 and other receivable of $128,784, the liabilities consisted of accounts payable of $24,054, other accounts payable of $2,022 and accrued expenses of $579. The revenue was $47,587, or 1.8% of the Company’s consolidated total revenue reported since the closing date to September 30, 2014. LSM reported a net income of $23,178, or 7.0% of the net income attributable to Sino-Global from the closing date to September 30, 2014. No pro forma information was disclosed in the footnotes due to the immateriality of assets and liabilities acquired.
4. ACCOUNTS RECEIVABLE, NET
The Company’s net accounts receivable is as follows:
| | | September 30, 2014 | | | June 30, 2014 | |
| Trade accounts receivable | | $ | 1,402,744 | | | $ | 925,743 | |
| Less: allowances for doubtful accounts | | | (443,711 | ) | | | (443,858 | ) |
| Accounts receivables, net | | $ | 959,033 | | | $ | 481,885 | |
5. OTHER RECEIVABLES / OTHER CURRENT LIABILITIES
Other receivables represent mainly travel and business advances to employees; as well as guarantee deposit for ship owners. Other current liabilities represent mainly advance payments received from customers for reimbursable port agent charges to be incurred and other miscellaneous accrued liabilities.
6. PREPAID EXPENSES
Prepaid expenses are as follows:
| | | September 30, | | | June 30, | |
| | | 2014 | | | 2014 | |
| | | | | | | |
| Prepaid consultant fees (See note 8) | | $ | 1,068,311 | | | $ | 468,000 | |
| Prepaid legal fees | | | 85,000 | | | | 24,802 | |
| Prepaid other | | | 57,589 | | | | 4,727 | |
| Total | | | 1,210,900 | | | | 497,529 | |
| Less current portion | | | 461,462 | | | | 216,729 | |
| Total noncurrent portion | | $ | 749,438 | | | $ | 280,800 | |
7. PROPERTY AND EQUIPMENT, AT COST
Property and equipment are as follows:
| | | September 30, | | | June 30, | |
| | | 2014 | | | 2014 | |
| | | | | | | |
| Land and building | | $ | 218,860 | | | $ | 216,951 | |
| Motor vehicles | | | 716,609 | | | | 710,148 | |
| Computer equipment | | | 135,837 | | | | 133,145 | |
| Office equipment | | | 64,618 | | | | 50,790 | |
| Furniture and fixtures | | | 100,739 | | | | 100,021 | |
| System software | | | 129,258 | | | | 128,178 | |
| Leasehold improvement | | | 69,301 | | | | 68,697 | |
| | | | | | | | | |
| Total | | | 1,435,222 | | | | 1,407,930 | |
| | | | | | | | | |
| Less: Accumulated depreciation and amortization | | | 1,168,768 | | | | 1,113,208 | |
| | | | | | | | | |
| Property and equipment, net | | $ | 266,454 | | | $ | 294,722 | |
Depreciation and amortization expense for the three months ended September 30, 2014 and 2013 was $55,560 and $27,575, respectively.
8. EQUITY TRANSACTIONS
On June 27, 2014, the Company entered into an Underwriting Agreement (the “Underwriting Agreement”) with National Securities Corporation (the “Underwriter”) relating to the registered offering of 572,000 shares of common stock, without par value per share. The price to the public in the offering was $1.76 per share. Under the terms of the Underwriting Agreement, the Company also granted the Underwriter an option, exercisable for 30 days, to purchase up to an additional 85,800 shares of common stock from the Company at the same price to cover over- allotments, if any. The Company closed the public offering on July 2, 2014 and the Underwriter purchased an additional 75,000 shares. The offering was made pursuant to our effective shelf registration statement on Form S-3 (Registration Statement No. 333-194211) declared effective by the Securities and Exchange Commission on April 15, 2014, as supplemented by an applicable prospectus supplement. The total number of shares sold in the offering was 647,000. The Company received total cash proceeds of approximately $1 million from this public offering.
The Company entered into management consulting and advisory services agreements with two consultants on June 6, 2014. In return for their services, as approved by the Company’s Board of Directors, a total of 600,000 shares of the Company’s common stock were issued to these two consultants. During June 2014, a total of 200,000 shares of the Company’s common stock were issued to the consultants as prepayment for their services. The value of their consulting services was determined using the fair value of the Company’s common stock of $2.34 per share when the shares were issued to the consultants. The remaining 400,000 shares of the Company's common stock were issued to the consultants on August 29, 2014 at $1.68 per share. Their service agreements are for the period July 1, 2014 to December 31, 2016; the related consulting fees have been and will be ratably charged to expense over the term of the agreements.
On August 22, 2014, the Company issued 50,000 shares of the Company’s common stock to be held in escrow to Mr. Deming Wang, in connection with the acquisition of LSM (see Note 3, Acquisition of Longhe Ship Management Company).
9. NON-CONTROLLING INTEREST
Non-controlling interest consists of the following:
| | | September 30, | | | June 30, | |
| | | 2014 | | | 2014 | |
| | | | | | | |
| Sino-China: | | | | | | |
| Original paid-in capital | | $ | 356,400 | | | $ | 356,400 | |
| Additional paid-in capital | | | 1,044 | | | | 1,044 | |
| Accumulated other comprehensive loss | | | (93,631 | ) | | | (64,872 | ) |
| Accumulated deficit | | | (5,115,588 | ) | | | (5,006,843 | ) |
| | | | (4,851,775 | ) | | | (4,714,271 | ) |
| Trans Pacific Logistics Shanghai Ltd. | | | 22,520 | | | | 20,240 | |
| Total | | $ | (4,829,255 | ) | | $ | (4,694,031 | ) |
10. COMMITMENTS
The Company leases certain office premises under operating leases through August 31, 2019. Future minimum lease payments under operating leases agreements are as follows:
| | | Amount | |
| | | | |
| Twelve months ending September 30, | | | |
| | | | |
| 2015 | | $ | 155,463 | |
| 2016 | | | 77,506 | |
| 2017 | | | 64,122 | |
| 2018 | | | 65,856 | |
| 2019 | | | 67,641 | |
| Thereafter | | | 5,649 | |
| | | $ | 436,237 | |
Rent expense for the three months ended September 30, 2014 and 2013 was $60,951 and $46,525, respectively.
11. INCOME TAXES
Income tax expense for the three months ended September 30, 2014 and 2013 varied from the amount computed by applying the statutory income tax rate to income before taxes. A reconciliation between the expected federal income tax rate using the federal statutory tax rate of 35% to the Company’s effective tax rate is as follows:
| | | For the three months ended September 30, | |
| | | 2014 | | | 2013 | |
| | | % | | | % | |
| U.S. expected federal income tax benefit | | | (35.0 | ) | | | (35.0 | ) |
| U.S. state, local tax net of federal benefit | | | (10.9 | ) | | | (10.9 | ) |
| U.S. permanent difference | | | 0.1 | | | | 0.6 | |
| U.S. temporary difference | | | 45.7 | | | | 45.3 | |
| Permanent difference related to other countries | | | 14.9 | | | | 347.6 | |
| Hong Kong statutory income tax rate | | | 16.5 | | | | 16.5 | |
| Hong Kong income tax benefit | | | (11.6 | ) | | | (16.5 | ) |
| Total tax expense | | | 19.7 | | | | 347.6 | |
The U.S. temporary difference consisted mainly of unearned compensation amortization and provision for allowance for doubtful accounts.
The income tax benefit for the three months ended September 30, 2014 and 2013 are as follows:
| | | For the three months ended
September 30, | |
| | | 2014 | | | 2013 | |
| | | | | | | |
| Current | | | | | | |
| USA | | $ | - | | | $ | - | |
| Hong Kong | | | 1,645 | | | | - | |
| China | | | - | | | | - | |
| | | | 1,645 | | | | - | |
| Deferred | | | | | | | | |
| USA | | | (28,900 | ) | | | (22,500 | ) |
| China | | | - | | | | - | |
| | | | (28,900 | ) | | | (22,500 | ) |
| Total | | $ | (27,255 | ) | | $ | (22,500 | ) |
Deferred tax assets are comprised of the following:
| | | September 30, | | | June 30, | |
| | | 2014 | | | 2014 | |
| | | | | | | |
| Allowance for doubtful accounts | | $ | 224,000 | | | $ | 224,000 | |
| Stock-based compensation | | | 411,000 | | | | 411,000 | |
| Net operating loss | | | 1,293,000 | | | | 1,004,000 | |
| Total deferred tax assets | | | 1,928,000 | | | | 1,639,000 | |
| Valuation allowance | | | (1,735,200 | ) | | | (1,475,100 | ) |
| Deferred tax assets, net - long-term | | $ | 192,800 | | | $ | 163,900 | |
Operations in the USA have incurred a cumulative net operating loss of $4,159,442 as of September 30, 2014, which may be available to reduce future taxable income. This carry-forward will expire if not utilized by 2034. Deferred tax assets relating to the allowance for doubtful accounts, stock compensation expenses and net operating loss amounting to $224,000, $411,000 and $1,293,000 have been recorded respectively. 90% of the deferred tax assets balance has been provided as valuation allowance as of September 30, 2014 based on management’s estimate.
12. CONCENTRATIONS
Major Customers
For the three months ended September 30, 2014, three customers accounted for 23%, 20% and 14% of the Company’s revenues. For the three months ended September 30, 2013, two customers accounted for 57% and 21% of the Company’s revenues.
Major Suppliers
For the three months ended September 30, 2014, three suppliers accounted for 47%, 18% and 13% of the total cost of revenues. For the three months ended September 30, 2013, two suppliers accounted for 53% and 40% of the total cost of revenues.
13. SEGMENT REPORTING
ASC 280, “Segment Reporting”, establishes standards for reporting information about operating segments on a basis consistent with the Company's internal organizational structure as well as information about geographical areas, business segments and major customers in financial statements for details on the Company's business segments.
The Company's chief operating decision maker has been identified as the Chief Executive Officer who reviews the financial information of separate operating segments when making decisions about allocating resources and assessing performance of the group. Based on management's assessment, the Company has determined that it has three operating segments: shipping agency and ship management services, shipping and chartering services, and in land transportation management services.
The following tables present summary information by segment for the three months ended September 30, 2014 and 2013, respectively:
| | | For the three months Ended September 30, 2014 | |
| | | Shipping Agency and Ship
Management Services | | | Shipping & Chartering
Services | | | Inland Transportation
Management Services | | | Total | |
| Revenues | | $ | 1,659,291 | | | $ | | | | $ | 946,634 | | | $ | 2,605,925 | |
| Cost of revenues | | $ | 1,283,505 | | | $ | | | | $ | 125,648 | | | $ | 1,409,153 | |
| Gross profit | | $ | 375,786 | | | $ | | | | $ | 820,986 | | | $ | 1,196,772 | |
| Depreciation and amortization | | $ | 52,744 | | | $ | | | | $ | 2,816 | | | $ | 55,560 | |
| Total capital expenditures | | $ | 15,339 | | | $ | | | | $ | - | | | $ | 15,339 | |
| Total assets | | $ | 5,300,982 | | | $ | | | | $ | 2,290,392 | | | $ | 7,591,374 | |
| | | | | | | | | | | | | | | | | |
| | | For the three months Ended September 30, 2013 | |
| | | Shipping Agency and Ship
Management Services | | | Shipping & Chartering
Services | | | Inland Transportation
Management Services | | | Total | |
| Revenues | | $ | 1,430,661 | | | $ | 1,887,000 | | | $ | | | | $ | 3,317,661 | |
| Cost of revenues | | $ | 1,112,803 | | | $ | 1,275,000 | | | $ | | | | $ | 2,387,803 | |
| Gross profit | | $ | 317,858 | | | $ | 612,000 | | | $ | | | | $ | 929,858 | |
| Depreciation and amortization | | $ | 27,342 | | | $ | 233 | | | $ | | | | $ | 27,575 | |
| Total capital expenditures | | $ | 3,399 | | | $ | - | | | $ | | | | $ | 3,399 | |
| Total assets | | $ | 6,024,155 | | | $ | 1,102,185 | | | $ | | | | $ | 7,126,340 | |
14. RELATED PARTY TRANSACTIONS
In June 2013, the Company signed a 5-year global logistic service agreement with TEWOO Chemical & Light Industry Zhiyuan Trade Co., Ltd. and TianJin Zhi Yuan Investment Group Co., Ltd. (together “Zhiyuan”). TianJin Zhi Yuan Investment Group Co., Ltd. (“Zhiyuan Investment Group”) is owned by Mr. Zhong Zhang, the largest shareholder of the Company. During the quarter ended September 30, 2013, the Company executed a shipping and chartering services agreement with Zhiyuan Investment Group whereby it assisted in the transportation of approximately 51,000 tons of chromite ore from South Africa to China. In September 2013, the Company executed an inland transportation management service contract with Zhiyuan Investment Group whereby it would provide certain advisory services and help control its potential commodities loss during the transportation process. In addition, the Company executed a one-year short-term loan agreement with the Zhiyuan Investment Group, effective January 1, 2014, to facilitate the working capital needs of the Zhiyuan Investment Group on an as-needed basis. As at June 30, 2014, the net amount due from the Zhiyuan Investment Group was $2,920,950. In September 2014, the Company collected approximately $2.7 million from the Zhiyuan Investment Group, representing full repayment of the short-term loan and payment of approximately $1.6 million of outstanding trade receivable. During the three months ended September 30, 2014, the Company continued to provide inland transportation management services to the Zhiyuan Investment Group. The net amount due from the Zhiyuan Investment Group at September 30, 2014 was $627,951. In October 2014, the Company collected approximately $384,000 from the Zhiyuan Investment Group to reduce the outstanding trade receivable.
As at September 30, 2014 and June 30, 2014, the Company is owed $252,339 and $252,815, respectively, from Sino-G Trading Inc. (“Sino-G”), an entity that is owned by the brother-in-law of the Company’s CEO. Sino-G used to act as a funds transfer agent for the Company’s services in Tianjin, PRC. In accordance with a repayment agreement between the Company and Sino-G, the amount is expected to be repaid during fiscal year 2015.

REPORT OF INDEPENDENT REGISTERED PUBLIC ACCOUNTING FIRM
To the Board of Directors and ShareholdersStockholders of
Sino-Global Shipping America, Ltd.
We have audited the accompanying consolidated balance sheets of Sino-Global Shipping America, Ltd. and Affiliates (the “Company”) as of June 30, 20142017 and 2013,2016, and the related consolidated statements of operations and comprehensive income (loss), changes in equity and cash flows for each of the two years in the two-year period ended June 30, 2014.2017. The Company’s management is responsible for these consolidated financial statements. Our responsibility is to express an opinion on these consolidated financial statements based on our audits.
We conducted our audits in accordance with the standards of the Public Company Accounting Oversight Board (United States). Those standards require that we plan and perform the auditsaudit to obtain reasonable assurance about whether the consolidated financial statements are free of material misstatement. The Company is not required to have, nor were we engaged to perform, an audit of its internal control over financial reporting. Our audit included consideration of internal control over financial reporting as a basis for designing audit procedures that are appropriate in the circumstances, but not for the purpose of expressing an opinion on the effectiveness of the Company’s internal control over financial reporting. Accordingly, we express no such opinion. An audit also includes examining, on a test basis, evidence supporting the amounts and disclosures in the financial statements, assessing the accounting principles used and significant estimates made by management, as well as evaluating the overall financial statement presentation. We believe that our audits provide a reasonable basis for our opinion.
In our opinion, the consolidated financial statements referred to above present fairly, in all material respects, the financial position of the Company as of June 30, 20142017 and 2013,2016, and the results of theirits operations and theirits cash flows for each of the two years in the two-year period ended June 30, 20142017, in conformity with accounting principles generally accepted in the United States of America.
/s/ Friedman LLP
| /s/ Friedman LLP | |
| New York, New York | |
| |
| September 27, 2017 | |
New York, New York
September 15, 2014
SINO-GLOBAL SHIPPING AMERICA, LTD. AND AFFILIATES
CONSOLIDATED BALANCE SHEETS
| | | June 30, | | |
| | | 2014 | | | 2013 | | | June 30, | | June 30, | |
| | | | | | | | 2017 | | | 2016 | |
| Assets | | | | | | | | | | | | | |
| Current assets | | | | | | | | | | | | | |
| Cash and cash equivalents | | $ | 902,531 | | | $ | 3,048,831 | | | $ | 8,733,742 | | | $ | 1,385,994 | |
| Advances to suppliers | | | 8,482 | | | | 231,772 | | |
| Accounts receivable, less allowance for doubtful accounts of $443,858 and $690,065 as of June 30, 2014 and 2013, respectively | | | 481,885 | | | | 3,142,203 | | |
| Other receivables, less allowance for doubtful accounts of $250,100 and $233,950 as of June 30, 2014 and June 30,2013, respectively | | | 174,406 | | | | 142,206 | | |
| Deferred expense and other current assets | | | 497,529 | | | | 12,488 | | |
| Prepaid taxes | | | - | | | | 26,288 | | |
| Accounts receivable, less allowance for doubtful accounts of $185,821 and $207,028 as of June 30, 2017 and 2016, respectively | | | | 2,569,141 | | | | 2,333,024 | |
| Other receivables, less allowance for doubtful accounts of $145,244 and $145,186 as of June 30, 2017 and 2016, respectively | | | | 37,811 | | | | 290,907 | |
| Advances to suppliers-third parties | | | | 54,890 | | | | 2,192,910 | |
| Advances to suppliers-related party | | | | 3,333,038 | | | | - | |
| Prepaid expenses and other current assets | | | | 311,136 | | | | 826,631 | |
| Due from related parties | | | 3,173,765 | | | | 541,377 | | | | 1,715,130 | | | | 1,622,519 | |
| | | | | | | | | | | | | | | | | |
| Total Current Assets | | | 5,238,598 | | | | 7,145,165 | | | | 16,754,888 | | | | 8,651,985 | |
| | | | | | | | | | | | | | | | | |
| Property and equipment, net | | | 294,722 | | | | 267,662 | | | | 187,373 | | | | 176,367 | |
| Prepaid expenses | | | | 6,882 | | | | 178,982 | |
| Other long-term assets | | | 16,734 | | | | 18,278 | | | | 117,478 | | | | 46,810 | |
| Deferred tax assets | | | 163,900 | | | | 105,100 | | | | 749,400 | | | | - | |
| | | | | | | | | | | | | | | | | |
| Total Assets | | $ | 5,713,954 | | | $ | 7,536,205 | | | $ | 17,816,021 | | | $ | 9,054,144 | |
| | | | | | | | | | | | | | | | | |
| Liabilities and Equity | | | | | | | | | | | | | | | | |
| Current liabilities | | | | | | | | | |
| | | | | | | | | | |
| Current Liabilities | | | | | | | | | |
| Advances from customers | | $ | 88,477 | | | $ | 710,172 | | | $ | 369,717 | | | $ | 24,373 | |
| Accounts payable | | | 398,756 | | | | 3,219,240 | | | | 206,211 | | | | 489,490 | |
| Accrued expenses | | | 177,877 | | | | 51,352 | | |
| Other current liabilities | | | 565,685 | | | | 424,141 | | |
| Taxes payable | | | | 1,886,216 | | | | 1,637,197 | |
| Due to related parties | | | | 206,323 | | | | - | |
| Accrued expenses and other current liabilities | | | | 418,029 | | | | 286,322 | |
| | | | | | | | | | | | | | | | | |
| Total Current Liabilities | | | 1,230,795 | | | | 4,404,905 | | | | 3,086,496 | | | | 2,437,382 | |
| | | | | | | | | | | | | | | | | |
| Total Liabilities | | | 1,230,795 | | | | 4,404,905 | | | | 3,086,496 | | | | 2,437,382 | |
| | | | | | | | | | | | | | | | | |
| Commitments and Contingency | | | | | | | | | |
| Commitments and Contingencies | | | | | | | | | |
| | | | | | | | | | | | | | | | | |
| Equity | | | | | | | | | | | | | | | | |
| Preferred stock, 2,000,000 shares authorized, no par value, none issued. | | | - | | | | - | | | | - | | | | - | |
| Common stock, 50,000,000 shares authorized, no par value; 5,229,032 and 4,829,032 shares issued as of June 30, 2014 and 2013; 5,103,841 and 4,703,841 outstanding as of June 30, 2014 and 2013 | | | 11,662,157 | | | | 10,750,157 | | |
| Common stock, 50,000,000 shares authorized, no par value; 10,281,032 and 8,456,032 shares issued as of June 30, 2017 and 2016; 10,105,535 and 8,280,535 outstanding as of June 30, 2017 and 2016, respectively | | | | 20,535,379 | | | | 15,500,391 | |
| Additional paid-in capital | | | 1,144,842 | | | | 1,144,842 | | | | 688,934 | | | | 1,140,962 | |
| Treasury stock, at cost - 125,191 shares | | | (372,527 | ) | | | (372,527 | ) | |
| Treasury stock, at cost, 175,497 shares as of June 30, 2017 and 2016 | | | | (417,538 | ) | | | (417,538 | ) |
| Accumulated deficit | | | (3,270,260 | ) | | | (4,856,613 | ) | | | (893,907 | ) | | | (4,518,799 | ) |
| Accumulated other comprehensive income | | | 24,618 | | | | 54,791 | | |
| Unearned Stock-based Compensation | | | (11,640 | ) | | | (15,520 | ) | |
| Accumulated other comprehensive loss | | | | (414,564 | ) | | | (280,907 | ) |
| | | | | | | | | | | | | | | | | |
| Total Sino-Global Shipping America Ltd. Stockholders' equity | | | 9,177,190 | | | | 6,705,130 | | |
| Total Sino-Global Shipping America Ltd. Stockholders’ Equity | | | | 19,498,304 | | | | 11,424,109 | |
| | | | | | | | | | | | | | | | | |
| Non-controlling Interest | | | (4,694,031 | ) | | | (3,573,830 | ) | | | (4,768,779 | ) | | | (4,807,347 | ) |
| | | | | | | | | | | | | | | | | |
| Total Equity | | | 4,483,159 | | | | 3,131,300 | | | | 14,729,525 | | | | 6,616,762 | |
| | | | | | | | | | | | | | | | | |
| Total Liabilities and Equity | | $ | 5,713,954 | | | $ | 7,536,205 | | | $ | 17,816,021 | | | $ | 9,054,144 | |
The accompanying notes are an integral part of these consolidated financial statements.statements
SINO-GLOBAL SHIPPING AMERICA, LTD. AND AFFILIATES
CONSOLIDATED STATEMENTS OF OPERATIONS AND COMPREHENSIVE INCOME (LOSS)
| | | For the years ended June 30, | | | For the Years Ended
June 30, | |
| | | 2014 | | | 2013 | | | 2017 | | | 2016 | |
| | | | | | | | | | | |
| Net revenues | | $ | 11,644,392 | | | $ | 17,331,759 | | |
| | | | | | | | | | |
| Net revenues - third parties | | | $ | 8,699,190 | | | $ | 5,041,194 | |
| Net revenues - related party | | | | 2,746,423 | | | | 2,269,346 | |
| Total revenues | | | | 11,445,613 | | | | 7,310,540 | |
| Cost of revenues | | | (7,613,459 | ) | | | (15,402,743 | ) | | | (4,980,591 | ) | | | (3,737,989 | ) |
| Gross profit | | | 4,030,933 | | | | 1,929,016 | | | | 6,465,022 | | | | 3,572,551 | |
| | | | | | | | | | | | | | | | | |
| General and administrative expenses | | | (3,470,669 | ) | | | (3,878,569 | ) | | | (3,152,336 | ) | | | (4,346,159 | ) |
| Selling expenses | | | (260,134 | ) | | | (253,987 | ) | | | (211,504 | ) | | | (475,619 | ) |
| | | | (3,730,803 | ) | | | (4,132,556 | ) | |
| Total operating expenses | | | | (3,363,840 | ) | | | (4,821,778 | ) |
| | | | | | | | | | | | | | | | | |
| Operating income (loss) | | | 300,130 | | | | (2,203,540 | ) | | | 3,101,182 | | | | (1,249,227 | ) |
| | | | | | | | | | | | | | | | | |
| Financial expense, net | | | (50,170 | ) | | | (15,520 | ) | |
| Financial income (expense), net | | | | 30,278 | | | | (247,530 | ) |
| Other income, net | | | 264,349 | | | | 52,253 | | | | - | | | | 7,828 | |
| | | | 214,179 | | | | 36,733 | | |
| Total other income (expense) | | | | 30,278 | | | | (239,702 | ) |
| | | | | | | | | | | | | | | | | |
| Net income (loss) before provision for income taxes | | | 514,309 | | | | (2,166,807 | ) | | | 3,131,460 | | | | (1,488,929 | ) |
| | | | | | | | | | | | | | | | | |
| Income tax expense | | | (79,823 | ) | | | (410,089 | ) | |
| Income tax benefit (expense) | | | | 472,084 | | | | (812,593 | ) |
| | | | | | | | | | | | | | | | | |
| Net income (loss) | | | 434,486 | | | | (2,576,896 | ) | | | 3,603,544 | | | | (2,301,522 | ) |
| | | | | | | | | | | | | | | | | |
| Net loss attributable to non-controlling interest | | | (1,151,867 | ) | | | (777,141 | ) | | | (21,348 | ) | | | (335,593 | ) |
| | | | | | | | | | | | | | | | | |
| Net income (loss) attributable to Sino-Global Shipping America, Ltd. | | $ | 1,586,353 | | | $ | (1,799,755 | ) | | $ | 3,624,892 | | | $ | (1,965,929 | ) |
| | | | | | | | | | | | | | | | | |
| Comprehensive income (loss) | | | | | | | | | | | | | | | | |
| Net income (loss) | | $ | 434,486 | | | $ | (2,576,896 | ) | | $ | 3,603,544 | | | $ | (2,301,522 | ) |
| Foreign currency translation gain (loss) | | | 1,493 | | | | (15,934 | ) | |
| Other comprehensive loss - foreign currency translation loss | | | | (73,741 | ) | | | (134,155 | ) |
| Comprehensive income (loss) | | | 435,979 | | | | (2,592,830 | ) | | | 3,529,803 | | | | (2,435,677 | ) |
| Less: Comprehensive loss attributable to non-controlling interest | | | (1,120,201 | ) | | | (831,157 | ) | |
| | | | | | | | | | |
| Less: Comprehensive income (loss) attributable to non-controlling interest | | | | 38,568 | | | | (97,409 | ) |
| | | | | | | | | | | | | | | | | |
| Comprehensive income (loss) attributable to Sino-Global Shipping America Ltd. | | $ | 1,556,180 | | | $ | (1,761,673 | ) | | $ | 3,491,235 | | | $ | (2,338,268 | ) |
| | | | | | | | | | | | | | | | | |
| Earnings (loss) per share | | | | | | | | | | | | | | | | |
| -Basic and diluted | | $ | 0.34 | | | $ | (0.38 | ) | |
| -Basic | | | $ | 0.41 | | | $ | (0.23 | ) |
| -Diluted | | | $ | 0.41 | | | $ | (0.23 | ) |
| | | | | | | | | | | | | | | | | |
| Weighted average number of common shares used in computation | | | | | | | | | | | | | | | | |
| -Basic and diluted | | | 4,721,923 | | | | 4,703,841 | | |
| -Basic | | | | 8,911,494 | | | | 8,651,606 | |
| -Diluted | | | | 8,949,960 | | | | 8,651,606 | |
The accompanying notes are an integral part of these consolidated financial statements.statements
SINO-GLOBAL SHIPPING AMERICA, LTD. AND AFFILIATES
CONSOLIDATED STATEMENTS OF CASH FLOWSCHANGES IN EQUITY
FOR THE YEARS ENDED JUNE 30, 2017 AND 2016
| | | For the years ended June 30, | |
| | | 2014 | | | 2013 | |
| | | | | | | |
| Operating Activities | | | | | | | | |
| | | | | | | | | |
| Net income (loss) | | $ | 434,486 | | | $ | (2,576,896 | ) |
| Adjustment to reconcile net income (loss) to net cash used in operating activities | | | | | | | | |
| Amortization of stock option expense | | | 3,880 | | | | 139,615 | |
| Depreciation and amortization | | | 155,657 | | | | 198,825 | |
| (Recovery of) provision for doubtful accounts | | | (246,206 | ) | | | 518,835 | |
| Deferred tax (benefit) expense | | | (50,445 | ) | | | 413,900 | |
| Gain on disposition of property and equipment | | | (385 | ) | | | (3,448 | ) |
| Changes in assets and liabilities | | | | | | | | |
| Decrease in advances to suppliers | | | 223,290 | | | | 128,505 | |
| Decrease in accounts receivable | | | 201,155 | | | | 127,928 | |
| Decrease in other receivables | | | 16,154 | | | | 235,629 | |
| (Increase) decrease in other current assets | | | (17,041 | ) | | | 74,984 | |
| Decrease in prepaid taxes | | | 26,288 | | | | 1,068 | |
| Decrease in other long-term assets | | | 1,544 | | | | 6,964 | |
| Increase in due from related parties | | | (1,473,752 | ) | | | - | |
| (Decrease) increase in advances from customers | | | (506,066 | ) | | | 406,735 | |
| Decrease in accounts payable | | | (230,745 | ) | | | (4,247,905 | ) |
| Increase (decrease) in accrued expenses | | | 126,525 | | | | (40,865 | ) |
| Increase in other current liabilities | | | 93,190 | | | | 254,513 | |
| | | | | | | | | |
| Net cash used in operating activities | | | (1,242,471 | ) | | | (4,361,613 | ) |
| | | | | | | | | |
| Investing Activities | | | | | | | | |
| Acquisitions of property and equipment | | | (203,252 | ) | | | (67,116 | ) |
| Proceeds from sale of fixed assets | | | 854 | | | | 16,185 | |
| Loan to related party | | | (1,158,636 | ) | | | - | |
| | | | | | | | | |
| Net cash used in investing activities | | | (1,361,034 | ) | | | (50,931 | ) |
| | | | | | | | | |
| Financing Activities | | | | | | | | |
| Proceeds from issuance of common stock | | | 444,000 | | | | 3,040,412 | |
| Decrease in non-controlling interest in majority-owned subsidiary | | | - | | | | (13,876 | ) |
| | | | | | | | | |
| Net cash provided by financing activities | | | 444,000 | | | | 3,026,536 | |
| | | | | | | | | |
| Effect of exchange rate fluctuations on cash and cash equivalents | | | 13,205 | | | | 1,506 | |
| | | | | | | | | |
| Net decrease in cash and cash equivalents | | | (2,146,300 | ) | | | (1,384,502 | ) |
| | | | | | | | | |
| Cash and cash equivalents at beginning of year | | | 3,048,831 | | | | 4,433,333 | |
| | | | | | | | | |
| Cash and cash equivalents at end of year | | $ | 902,531 | | | $ | 3,048,831 | |
| | | | | | | | | |
| Supplemental information: | | | | | | | | |
| Income taxes paid | | $ | 24,841 | | | $ | 26,400 | |
| Non-cash transactions of operating activities: | | | | | | | | |
| Settlement of related accounts receivable and payable | | $ | 2,589,739 | | | $ | - | |
| Common stock issued for unearned stock-based compensation | | $ | 468,000 | | | $ | - | |
| | | Common stock | | | Additional
paid-in | | | Treasury stock | | | Accumulated | | | Accumulated other Comprehensive | | | Total stockholders’ | | | Non-controlling | | | Total | |
| | | Shares | | | Amount | | | capital | | | Shares | | | Amount | | | deficit | | | income (loss) | | | Equity | | | interest | | | Equity | |
| Balance as of June 30, 2015 | | | 7,996,032 | | | $ | 16,303,327 | | | $ | 1,137,082 | | | | (125,191 | ) | | $ | (372,527 | ) | | $ | (2,552,870 | ) | | $ | 91,432 | | | $ | 14,606,444 | | | $ | (4,709,938 | ) | | $ | 9,896,506 | |
| | | | | | | | | | | | | | | | | | | | | | | | | | | | | | | | | | | | | | | | | |
| Issuance of common stock, net of issuance costs of $59,336 | | | 1,000,000 | | | | 1,067,264 | | | | - | | | | - | | | | - | | | | - | | | | - | | | | 1,067,264 | | | | - | | | | 1,067,264 | |
| Stock-based compensation to management | | | 660,000 | | | | 349,800 | | | | - | | �� | | - | | | | - | | | | - | | | | - | | | | 349,800 | | | | - | | | | 349,800 | |
| Cancellation of common stock | | | (1,200,000 | ) | | | (2,220,000 | ) | | | - | | | | - | | | | - | | | | - | | | | - | | | | (2,220,000 | ) | | | - | | | | (2,220,000 | ) |
| Purchase of common stock | | | - | | | | - | | | | - | | | | (50,306 | ) | | | (45,011 | ) | | | - | | | | - | | | | (45,011 | ) | | | - | | | | (45,011 | ) |
| Amortization of stock options | | | - | | | | - | | | | 3,880 | | | | - | | | | - | | | | - | | | | - | | | | 3,880 | | | | - | | | | 3,880 | |
| Foreign currency translation | | | - | | | | - | | | | - | | | | - | | | | - | | | | - | | | | (372,339 | ) | | | (372,339 | ) | | | 238,184 | | | | (134,155 | ) |
| Net loss | | | - | | | | - | | | | - | | | | - | | | | - | | | | (1,965,929 | ) | | | - | | | | (1,965,929 | ) | | | (335,593 | ) | | | (2,301,522 | ) |
| | | | | | | | | | | | | | | | | | | | | | | | | | | | | | | | | | | | | | | | | |
| Balance as of June 30, 2016 | | | 8,456,032 | | | $ | 15,500,391 | | | $ | 1,140,962 | | | | (175,497 | ) | | $ | (417,538 | ) | | $ | (4,518,799 | ) | | $ | (280,907 | ) | | $ | 11,424,109 | | | $ | (4,807,347 | ) | | $ | 6,616,762 | |
| | | | | | | | | | | | | | | | | | | | | | | | | | | | | | | | | | | | | | | | | |
| Issuance of common stock, net of issuance costs of $450,013 | | | 1,500,000 | | | | 4,319,988 | | | | - | | | | - | | | | - | | | | - | | | | - | | | | 4,319,988 | | | | - | | | | 4,319,988 | |
| Exercise of stock options | | | 75,000 | | | | 82,500 | | | | - | | | | - | | | | - | | | | - | | | | - | | | | 82,500 | | | | - | | | | 82,500 | |
| Amortization of stock options | | | - | | | | - | | | | 110,195 | | | | - | | | | - | | | | - | | | | - | | | | 110,195 | | | | - | | | | 110,195 | |
| Shares issued for services | | | 250,000 | | | | 632,500 | | | | (562,223 | ) | | | - | | | | - | | | | - | | | | - | | | | 70,277 | | | | - | | | | 70,277 | |
| Foreign currency translation | | | - | | | | - | | | | - | | | | - | | | | - | | | | - | | | | (133,657 | ) | | | (133,657 | ) | | | 59,916 | | | | (73,741 | ) |
| Net income (loss) | | | - | | | | - | | | | - | | | | - | | | | - | | | | 3,624,892 | | | | - | | | | 3,624,892 | | | | (21,348 | ) | | | 3,603,544 | |
| | | | | | | | | | | | | | | | | | | | | | | | | | | | | | | | | | | | | | | | | |
| Balance as of June 30, 2017 | | | 10,281,032 | | | $ | 20,535,379 | | | $ | 688,934 | | | | (175,497 | ) | | $ | (417,538 | ) | | $ | (893,907 | ) | | $ | (414,564 | ) | | $ | 19,498,304 | | | $ | (4,768,779 | ) | | $ | 14,729,525 | |
The accompanying notes are an integral part of these consolidated financial statements.statements
SINO-GLOBAL SHIPPING AMERICA LTD. AND AFFILIATES
AFFILIATE
CONSOLIDATED STATEMENTS OF CHANGES IN EQUITYCASH FLOWS
| | | Common stock | | | Additional
paid-in capital | | | Treasury
stock | | | Accumulated
deficit | | | Accumulated
other
comprehensive
income | | | Unearned
stock-based
compensation | | | Total stockholders'
Equity | | | Non-controlling
interest | | | Total Equity | |
| | | Shares | | | Amount | | | | | | | | | | | | | | | | | | | | | | | | | |
| | | | | | | | | | | | | | | | | | | | | | | | | | | | | | | |
| Balance as of June 30, 2012 | | | 3,029,032 | | | | 7,709,745 | | | | 1,191,796 | | | | (372,527 | ) | | | (3,056,858 | ) | | | 16,709 | | | | (202,089 | ) | | | 5,286,776 | | | | (2,742,673 | ) | | | 2,544,103 | |
| | | | | | | | | | | | | | | | | | | | | | | | | | | | | | | | | | | | | | | | | |
| Issuance of common stock | | | 1,800,000 | | | | 3,040,412 | | | | | | | | | | | | | | | | | | | | | | | | 3,040,412 | | | | | | | | 3,040,412 | |
| Stock options forfeited | | | | | | | | | | | (46,954 | ) | | | | | | | | | | | | | | | 46,954 | | | | - | | | | | | | | - | |
| Amortization of stock options | | | | | | | | | | | | | | | | | | | | | | | | | | | 139,615 | | | | 139,615 | | | | | | | | 139,615 | |
| Foreign currency translation | | | | | | | | | | | | | | | | | | | | | | | 38,082 | | | | | | | | 38,082 | | | | (54,016 | ) | | | (15,934 | ) |
| Net loss | | | | | | | | | | | | | | | | | | | (1,799,755 | ) | | | | | | | | | | | (1,799,755 | ) | | | (777,141 | ) | | | (2,576,896 | ) |
| | | | | | | | | | | | | | | | | | | | | | | | | | | | | | | | | | | | | | | | | |
| Balance as of June 30, 2013 | | | 4,829,032 | | | $ | 10,750,157 | | | $ | 1,144,842 | | | $ | (372,527 | ) | | $ | (4,856,613 | ) | | $ | 54,791 | | | $ | (15,520 | ) | | $ | 6,705,130 | | | $ | (3,573,830 | ) | | $ | 3,131,300 | |
| | | | | | | | | | | | | | | | | | | | | | | | | | | | | | | | | | | | | | | | | |
| Issuance of common stock | | | 400,000 | | | | 912,000 | | | | | | | | | | | | | | | | | | | | | | | | 912,000 | | | | | | | | 912,000 | |
| Amortization of stock options | | | | | | | | | | | | | | | | | | | | | | | | | | | 3,880 | | | | 3,880 | | | | | | | | 3,880 | |
| Foreign currency translation | | | | | | | | | | | | | | | | | | | | | | | (30,173 | ) | | | | | | | (30,173 | ) | | | 31,666 | | | | 1,493 | |
| Net income (loss) | | | | | | | | | | | | | | | | | | | 1,586,353 | | | | | | | | | | | | 1,586,353 | | | | (1,151,867 | ) | | | 434,486 | |
| | | | | | | | | | | | | | | | | | | | | | | | | | | | | | | | | | | | | | | | | |
| Balance as of June 30, 2014 | | | 5,229,032 | | | $ | 11,662,157 | | | $ | 1,144,842 | | | $ | (372,527 | ) | | $ | (3,270,260 | ) | | $ | 24,618 | | | $ | (11,640 | ) | | $ | 9,177,190 | | | $ | (4,694,031 | ) | | $ | 4,483,159 | |
| | | For the years ended
June 30, | |
| | | 2017 | | | 2016 | |
| | | | | | | |
| Operating Activities | | | | | | |
| | | | | | | |
| Net income (loss) | | $ | 3,603,544 | | | $ | (2,301,522 | ) |
| Adjustment to reconcile net income (loss) to net cash provided by (used in) operating activities: | | | | | | | | |
| Amortization of stock-based compensation to management | | | - | | | | 349,800 | |
| Amortization of stock-based compensation to consultants | | | 599,846 | | | | 1,327,780 | |
| Amortization of employee stock options | | | 110,195 | | | | 3,880 | |
| Depreciation and amortization | | | 49,367 | | | | 59,508 | |
| Provision for (recovery of) doubtful accounts | | | (18,912 | ) | | | 132,915 | |
| Deferred tax provision (benefit) | | | (749,400 | ) | | | 280,600 | |
| Changes in assets and liabilities | | | | | | | | |
| (Increase) decrease in accounts receivable | | | (260,165 | ) | | | 616,280 | |
| Decrease (increase) in other receivables | | | 249,768 | | | | (98,935 | ) |
| Decrease (increase) in advances to suppliers-third parties | | | 2,085,281 | | | | (2,141,935 | ) |
| Increase in advances to suppliers-related party | | | (3,317,382 | ) | | | - | |
| Decrease (increase) in prepaid expenses | | | 162,727 | | | | (4,228 | ) |
| Increase in other current assets | | | (18,931 | ) | | | (30,600 | ) |
| Increase in other long-term assets | | | (70,806 | ) | | | - | |
| (Increase) decrease in due from related parties | | | (117,772 | ) | | | 1,162,072 | |
| Increase (decrease) in advances from customers | | | 343,790 | | | | (101,828 | ) |
| Decrease in accounts payable | | | (272,474 | ) | | | (202,098 | ) |
| Increase in taxes payable | | | 278,288 | | | | 640,549 | |
| Increase in due to related parties | | | 206,323 | | | | - | |
| Increase in accrued expenses and other current liabilities | | | 131,483 | | | | 186,714 | |
| | | | | | | | | |
| Net cash provided by (used in) operating activities | | | 2,994,770 | | | | (121,048 | ) |
| | | | | | | | | |
| Investing Activities | | | | | | | | |
| Acquisition of property and equipment | | | (62,412 | ) | | | (31,659 | ) |
| Cash collected from the termination of vessel acquisition | | | - | | | | 326,035 | |
| | | | | | | | | |
| Net cash provided by (used in) investing activities | | | (62,412 | ) | | | 294,376 | |
| | | | | | | | | |
| Financing Activities | | | | | | | | |
| Proceeds from issuance of common stock, net | | | 4,319,988 | | | | 691,600 | |
| Proceeds from exercise of employee stock options for common stock | | | 82,500 | | | | - | |
| Repurchase of common stock | | | - | | | | (45,011 | ) |
| | | | | | | | | |
| Net cash provided by financing activities | | | 4,402,488 | | | | 646,589 | |
| | | | | | | | | |
| Effect of exchange rate fluctuations on cash and cash equivalents | | | 12,902 | | | | (164,245 | ) |
| | | | | | | | | |
| Net increase in cash and cash equivalents | | | 7,347,748 | | | | 655,672 | |
| | | | | | | | | |
| Cash and cash equivalents at beginning of year | | | 1,385,994 | | | | 730,322 | |
| | | | | | | | | |
| Cash and cash equivalents at end of year | | $ | 8,733,742 | | | $ | 1,385,994 | |
| | | | | | | | | |
| Supplemental information | | | | | | | | |
| Income taxes paid | | $ | 89,324 | | | $ | 23,286 | |
| Non-cash investing and financing activities: | | | | | | | | |
| Return of common stock issued for vessel acquisition | | $ | - | | | $ | (2,220,000 | ) |
| Issuance of common stock to pay for professional services | | $ | 632,500 | | | $ | 435,000 | |
The accompanying notes are an integral part of these consolidated financial statements.statements
SINO-GLOBAL SHIPPING AMERICA, LTD. AND AFFILIATES
NOTES TO THE CONSOLIDATED FINANCIAL STATEMENTS
Note 1. ORGANIZATION AND NATURE OF BUSINESS
Founded in the United States of America (“US”(the “U.S.”) in 2001, Sino-Global Shipping America, Ltd., a Virginia corporation (“Sino-Global” or the “Company”), is a Virginia corporation with its primary US operations in New York. Historically, the Company has been in the business of providing shipping agency services, but during fiscal year 2014, it reorganized its shipping agency business and expanded its service platform to includenon-asset based global shipping and charteringfreight logistic integrated solution provider. The Company provides tailored solutions and value-added services (launched duringfor its customers to drive effectiveness and control in related links throughout the quarter ended September 30, 2013)entire shipping and inland transportation management services (launched during the quarter ended December 31, 2013). These new services are part of the Company’s strategic initiatives to diversify its service offering, broaden its service platform, and improve its operating profit.
Sino-Global’s principal geographic market is in the People’s Republic of China (“PRC”).freight logistics chain. The Company conducts its business primarily through its wholly-owned subsidiaries in the U.S., the People’s Republic of China, including Hong Kong (the “PRC”), Australia Canada and New York. Canada. Currently, a significant portion of the Company’s business is generated from clients located in the PRC.
The Company’s Chinese subsidiary, in China, Trans Pacific Shipping Limited, a wholly-owned foreign enterprise (“Trans Pacific Beijing”), a wholly owned foreign enterprise, invested in oneis the 90%-owned subsidiary, owner of Trans Pacific Logistics Shanghai Limited (“Trans Pacific Shanghai”). Trans Pacific Beijing and Trans Pacific Shanghai are referred to collectively as “Trans Pacific”).
As PRC laws and regulations restrict foreign ownership of shipping agency service businesses, the Company provides its shipping agency services in the PRC through Sino-Global Shipping Agency Ltd. (“Sino-China”), a Chinese legal entity, which holds the licenses and permits necessaryPrior to operate shipping services in the PRC. Sino-China is headquartered in Beijing with branches in Qingdao, Xiamen and Fangchenggang. Trans Pacific Beijing and Sino-China do not have a parent-subsidiary relationship. Trans Pacific Beijing has contractual arrangements with Sino-China and its shareholders that enable the Company to substantially control Sino-China. Through Sino-China, the Company has the ability to provide shipping agency services in all commercial ports in the PRC.
During fiscal year 2014,2016, the Company completed a number of cost reduction initiatives and reorganized its shipping agency business in the PRC. As a result of the business reorganization to improve its operating margin, the Company does not provide shipping agency services through Sino-China as of June 30, 2014. The Company’s shipping agency business iswas operated by its subsidiaries in the PRC. The Company’s ship management services were operated by its subsidiary in Hong Kong and Australia. As a general shipping agent, the Company serves ships coming to and departing from a number of countries, including China, Australia, South Africa, Brazil, New Zealand and Canada.Kong. The Company’s shipping and chartering services arewere operated by its subsidiaries in the U.S. and subsidiary in Hong Kong. Currently, the Company’s HK subsidiary; the inland transportation management services are operated by Trans Pacific Beijing.its subsidiaries in the PRC, Hong Kong and the U.S. The Company’s freight logistic services are operated by its subsidiaries in the PRC and the U.S. The Company’s container trucking services are currently operated by its subsidiaries in the PRC and through a joint venture in the U.S. The Company has increased its businesses in the U.S. from third quarter of fiscal year 2017 since the website of the short haul container truck services platform has launched in December 2016.
In January 2016, the Company formed a subsidiary, Sino-Global Shipping LA Inc., a California corporation (“Sino LA”), for the purpose of expanding its business to provide freight logistic services to importers who ship goods into the U.S. The Company expects to generate additional revenues from providing inland transportation services and bulk cargo container services in the coming fiscal year.
In fiscal year 2016, affected by worsening market conditions in the shipping industry, the Company’s shipping agency business sector suffered a significant decrease in revenue due to a reduced number of ships served. As a result, the Company has suspended its shipping agency services business. Also, as a result of these market condition changes, the Company has suspended its ship management services business. In addition, in December 2015, the Company suspended its shipping and chartering services business, primarily as a result of the termination of a previously-contemplated vessel acquisition. As of June 30, 2017, the Company’s business segments consist of inland transportation management services, freight logistics services and container trucking services.
In August 2016, the Company’s Board of Directors (the “Board”) authorized management to move forward with the development of a mobile application that will provide a full-service logistics platform between the U.S. and the PRC for short-haul trucking in the U.S.
Sino-Global completed development of a full-service logistics platform as of December 2016. Upon the completion of the platform, the Company signed two significant agreements with COSCO Beijing International Freight Co., Ltd. (“COSFRE Beijing”) and Sino-Trans Guangxi in December 2016. Pursuant to the agreement with COSFRE Beijing, the Company will receive a percentage of the total amount of each transportation fee for the arrangement of inland transportation services for COSFRE Beijing’s container shipments into U.S. ports. For the strategic cooperation framework agreement with Sino-Trans Guangxi, which is a subsidiary of Sino-Trans Limited, the Company expects to utilize both parties’ existing resources and establish an integrated logistics plan to provide an end-to-end supply chain solution for customers shipping soybeans and sulfur products from the U.S. to southern PRC via container.
On January 5, 2017, the Company entered into a joint venture agreement and formed a new joint venture company named ACH Trucking Center Corp. (“ACH Center”) with Jetta Global Logistics Inc. (“Jetta Global”). Along with the establishment of ACH Center, the Company began providing short haul trucking transportation and logistics services to customers located in the New York and New Jersey areas. The Company holds a 51% ownership stake in ACH Trucking Center. The financial statements of ACH Center have been included in the consolidated financial statements of the Company.
On January 9, 2017, the Company entered into a strategic cooperation agreement with China Ocean Shipping Agency Qingdao Co. Ltd. (“COSCO Qingdao”). COSCO Qingdao will utilize the Company’s full-service logistics platform to arrange the transport of its container shipments into U.S. ports. Sino-Global will receive a percentage of the total amount of each transportation fee in exchange for the arrangement of inland transportation services for COSCO Qingdao’s container shipments into U.S. ports.
On February 18, 2017, the Company entered into a cooperative transportation agreement with related party, Zhiyuan International Investment & Holding Group (Hong Kong) Co., Ltd. (the “Buyer” or “Zhiyuan Hong Kong”). Zhiyuan Hong Kong, jointly with China Minmetals Corporation and China Metallurgical Group Corporation, acts as the general designer, general equipment provider and general service contractor in the upgrade and renovation project of Perwaja Steel, located in Malaysia (the “Project”). The Company agreed to provide high-quality services including detailed transportation plan design, plan execution and necessary supervision of the execution at Zhiyuan Hong Kong’s demand, and the Company will receive 1% to 1.25% transportation fee incurred in the Project as commission for its services rendered (see Note 3 and Note 16). On July 7, 2017, the Company signed a supplemental agreement with the buyer, pursuant to which Sino will cooperate with Zhiyuan Hong Kong exclusively on the entire project’s transportation needs. Pursuant to the supplemental agreement, the Company agrees to make prepayments to Zhiyuan Hong Kong for its share of packaging and transporting costs related to the project, in return the Company will receive 15% of its share of the cost incurred in the project from Zhiyuan Hong Kong as a service fee. The project is expected to complete in one to two years and the Company will collect is service fee in accordance with project completion.
Note 2. SUMMARY OF SIGNIFICANT ACCOUNTING POLICIES
(a) Basis of Presentation
The accompanying consolidated financial statements have been prepared in accordance with accounting principles generally accepted in the United States of America (“US GAAP”). Certain prior yearThe consolidated financial statements include the accounts of all directly, indirectly owned subsidiaries and variable interest entity. All intercompany transactions and balances were reclassified to conform to the current year presentation. These reclassifications have no material impact on the previously reported financial position, results of operations or cash flows.been eliminated in consolidation.
(b) Basis of Consolidation
The consolidated financial statements include the accounts of the Company, its subsidiaries, and its affiliates. All significant intercompany transactions and balances are eliminated in consolidation. Sino-ChinaSino-Global Shipping Agency Ltd., a PRC corporation (“Sino-China”), is considered a variable interest entity (“VIE”), andwith the Company isas the primary beneficiary. The Company, through Trans Pacific Beijing, entered into certain agreements with Sino-China, pursuant to which the Company receives 90% of Sino-China’s net income. Sino-China was designed to operate in China for the benefit of the Company. The Company does not receive any paymentpayments from Sino-China unless Sino-China recognizes net income during its fiscal year. These agreements do not entitle the Company to any consideration if Sino-China incurs a net loss during its fiscal year. If Sino-China incurs a net loss during its fiscal year, the Company is not required to absorb such net loss.
As a VIE, Sino-China’s revenues are included in the Company’s total revenues, and its income (loss)any loss from operations is consolidated with that of the Company’s.Company. Because of the contractual arrangements between the Company hadand Sino-China, the Company has a pecuniary interest in Sino-China that requires consolidation of the Company’sfinancial statements of the Company and Sino-China’s financial statements.Sino-China.
The Company has consolidated Sino-China’s operating results because the entities are under common control in accordance with ASC 805-10, “Business Combinations”. The agency relationship between the Company and Sino-China and its branches is governed by a series of contractual arrangements pursuant to which the Company has substantial control over Sino-China. Management makes ongoing reassessments of whether the Company isremains the primary beneficiary of Sino-China. .As mentioned elsewhere in this report, due to the worsening market conditions in the shipping industry, Sino-China’s shipping agency business suffered a significant decrease in revenue due to a reduced number of ships served. As a result, the Company has temporarily suspended this business. Sino-China is also providing services in other related business segments of the Company.
The carrying amount and classification of Sino-China'sSino-China’s assets and liabilities included in the Company’s Consolidated Balance Sheets areconsolidated balance sheets were as follows:
| | | June 30, | | | June 30, | | | June 30, | | June 30, | |
| | | 2014 | | | 2013 | | | 2017 | | | 2016 | |
| | | | | | | | | | | |
| Total current assets | | $ | 173,273 | | | $ | 145,307 | | | $ | 9,327,990 | | | $ | 31,128 | |
| Total assets | | | 419,048 | | | | 326,480 | | | | 9,472,651 | | | | 129,463 | |
| Total current liabilities | | | 312,521 | | | | 324,334 | | | | 4,517 | | | | 7,222 | |
| Total liabilities | | | 312,521 | | | | 324,334 | | | | 4,517 | | | | 7,222 | |
(c) Fair Value of Financial Instruments
We follow the provisions of ASC 820, Fair Value Measurements and Disclosures, which clarifies the definition of fair value, prescribes methods for measuring fair value, and establishes a fair value hierarchy to classify the inputs used in measuring fair value as follows:
Level 1 -— Observable inputs such as unadjusted quoted prices in active markets for identical assets or liabilities available at the measurement date.
Level 2 -— Inputs other than quoted prices that are observable for the asset or liability in active markets, quoted prices for identical or similar assets and liabilities in markets that are not active, inputs other than quoted prices that are observable, and inputs derived from or corroborated by observable market data.
Level 3 -— Unobservable inputs that reflect management’s assumptions based on the best available information.
The carrying value of accounts receivable, other receivables, other current assets, and current liabilities approximate their fair values because of the short-term nature of these instruments.
(d) Use of Estimates and Assumptions
The preparation of the Company’s consolidated financial statements in conformity with US GAAP requires management to make estimates and assumptions that affect the reported amounts of assets and liabilities and disclosure of contingent assets and liabilities at the dates of the financial statements and the reported amounts of revenues and expenses during the reporting periods. Estimates are adjusted to reflect actual experience when necessary. Significant accounting estimates reflected in the Company’s consolidated financial statements include revenue recognition, fair value of stock options,based compensation, cost of revenues, allowance for doubtful accounts, deferred income taxes, and the useful lives of property and equipment.
Since the use of estimates is an integral component of the financial reporting process, actual results could differ from those estimates.
(e) Translation of Foreign Currency
The accounts of the Company and its subsidiaries, including Sino-China and each of its branches are measured using the currency of the primary economic environment in which the entity operates (the “functional currency”). The Company’s functional currency is the US dollarsU.S. dollar (“USD”) while its subsidiaries in the PRC, including Sino-China, reports itsreport their financial positionpositions and results of operations in Renminbi (“RMB”). The accompanying consolidated financial statements are presented in US dollars.USD. Foreign currency transactions are translated into US dollarsUSD using the fixed exchange rates in effect at the time of the transaction. Generally, foreign exchange gains and losses resulting from the settlement of such transactions are recognized in the consolidated statements of operations. The Company translates the foreign currency financial statements of Sino-China, Sino-Global Shipping Australia, Sino-Global Shipping Hong Kong, Sino-Global Shipping Canada, Trans Pacific Beijing and Trans Pacific BeijingShanghai in accordance with ASC 830-10, “Foreign Currency Matters”. Assets and liabilities are translated at current exchange rates quoted by the People’s Bank of China at the balance sheet dates and revenues and expenses are translated at average exchange rates in effect during the year. ResultingThe resulting translation adjustments are recorded as other comprehensive income (loss) and accumulated other comprehensive loss as a separate component of equity of the Company, and also included in non-controlling interest.interests.
The exchange rates for the years ended June 30, 20142017 and June 30, 20132016 are as follows:
| | | June 30, | |
| | | 2014 | | | 2013 | |
| Foreign currency | | Balance Sheet | | | Profits/Loss | | | Balance Sheet | | | Profits/Loss | |
| RMB:1USD | | | 6.2043 | | | | 6.1374 | | | | 6.1787 | | | | 6.2458 | |
| 1AUD:USD | | | 1.0609 | | | | 1.0898 | | | | 0.9143 | | | | 1.0266 | |
| 1HKD:USD | | | 7.7503 | | | | 7.7552 | | | | 0.1289 | | | | 0.1289 | |
| 1CAD:USD | | | 1.0672 | | | | 1.0704 | | | | 0.9506 | | | | 0.9956 | |
| | | June 30, | |
| | | 2017 | | | 2016 | |
| Foreign currency | | Balance
Sheet | | | Profits/Loss | | | Balance
Sheet | | | Profits/Loss | |
| RMB:1USD | | | 6.7806 | | | | 6.8126 | | | | 6.6487 | | | | 6.4416 | |
| AUD:1USD | | | 1.3028 | | | | 1.3267 | | | | 1.3433 | | | | 1.3755 | |
| HKD:1USD | | | 7.8059 | | | | 7.7651 | | | | 7.7595 | | | | 7.7594 | |
| CAD:1USD | | | 1.2982 | | | | 1.3270 | | | | 1.2992 | | | | 1.3266 | |
(f) Cash and Cash Equivalents
Cash and cash equivalents consist of cash on hand and other highly liquid investments which are unrestricted as to withdrawal or use, and which have maturitiesan original maturity of three months or less when purchased. The Company maintains cash and cash equivalents with various financial institutions mainly in the PRC, Australia, Hong Kong, Canada and the United States. CashU.S. As of June 30, 2017 and 2016, cash balances of $262,885 are$6,246,337 and $1,333,713, respectively, were maintained at financial institutions in the PRC, which were not insured by any of the Chinese authorities. As of June 30, 2017 and 2016, cash balance of $2,462,792 and $43,760, respectively, were maintained at U.S. financial institutions, and were insured by the Federal Deposit Insurance Corporation or other programs.programs subject to certain limitations.
(g) Accounts Receivable
Accounts receivable are presented at net realizable value. The Company maintains allowances for doubtful accounts and for estimated losses. The Company reviews the accounts receivable on a periodic basis and makes general and specific allowances when there is doubt as to the collectability of individual receivable balances. In evaluating the collectability of individual receivable balances, the Company considers many factors, including the age of the balances, customers’ historical payment history, their current credit-worthiness and current economic trends. Receivables are considered past due after 365 days. Accounts areReceivable is written off against the allowances only after exhaustive efforts at collection. As of June 30, 2014 and 2013, the allowance for doubtful accounts totaled $443,858 and $690,065, respectively.collection efforts.
(h) Property and Equipment, net
PropertyNet property and equipment are stated at historical cost less accumulated depreciation. Historical cost comprises its purchase price and any directly attributable costs of bringing the assets to its working condition and location for its intended use. Depreciation is calculated on a straight-line basis over the following estimated useful lives:
| Buildings | 20 years |
| Motor vehicles | 5-10 years |
| Furniture and office equipment | 3-5 years |
The carrying value of a long-lived asset is considered impaired by the Company when the anticipated undiscounted cash flows from such asset is less than its carrying value. If impairment is identified, a loss is recognized based on the amount by which the carrying value exceeds the fair value of the long-lived asset. Fair value is determined primarily using the anticipated cash flows discounted at a rate commensurate with the risk involved or based on independent appraisals. Management has determined that there were no impairments at the balance sheet dates.
(i) Revenue Recognition
| ·
● | Revenues from shipping agency services are recognized upon completion of services, which coincides with the date of departure of the relevant vessel from port. Advance payments and deposits received from customers prior to the provision of services and recognition of the related revenues are presented as advances from customers. |
| | ·● | Revenues from shipping and chartering services are recognized upon performance of services as stipulated in the underlying contract.contracts. |
| | ·● | Revenues from inland transportation management services are recognized when commodities are being released from the customer’scustomers’ warehouse. |
| ● | Revenues from ship management services are recognized when the related contractual services are rendered. |
| ● | Revenues from freight logistics services are recognized when the related contractual services are rendered. |
| ● | Revenues from container trucking services are recognized when the related contractual services are rendered. |
(j) Taxation
Because the Company and its subsidiaries and Sino-China are incorporated in different jurisdictions, they file separate income tax returns. The Company uses the liability method of accounting for income taxes in accordance with US GAAP. Deferred taxes, if any, are recognized for the future tax consequences of temporary differences between the tax basis of assets and liabilities and their reported amounts in the consolidated financial statements. A valuation allowance is provided against deferred tax assets if it is more likely than not that the asset will not be utilized in the future.
The Company recognizes the tax benefit from an uncertain tax position only if it is more likely than not that the tax position will be sustained on examination by the taxing authorities, based on the technical merits of the position. The Company recognizes interest and penalties, if any, related to unrecognized tax benefits as income tax expense. The Company had no uncertain tax positions as of June 30, 2014 and 2013, respectively.
Income tax returns for the years prior to 20112014 are no longer subject to examination by USU.S. tax authorities.
PRC Enterprise Income Tax
PRC enterprise income tax is calculated based on taxable income determined under the PRC GAAPGenerally Accepted Accounting Principles (“PRC GAAP”) at 25%. Sino-China and Trans Pacific are registered in PRC and governed by the Enterprise Income Tax Laws of the PRC.
PRC Business Tax and Surcharges
Revenues from services provided by the Company’s PRC subsidiaries and affiliates, including Sino-China and Trans Pacific are subject to the PRC business tax of 5%. Business tax and surcharges are paid on gross revenues generated from shipping agency services minus the costs of services which are paid on behalf of the customers.
Enterprises or individuals who sell commodities, engage in services or selling of goods in the PRC are subject to a value added tax (“VAT”) in accordance with PRC laws. All of the Company’s revenue generated in the PRC and are subject to a VAT on the gross sales price. The VAT rates are 6% and 11%, depending on the type of services provided. The VAT may be offset by VAT paid by the Company on service.
In addition, under the PRC regulations, Sino-China isthe Company’s PRC subsidiaries and affiliates are required to pay the city construction taxtaxes (7%) and education surcharges (3%) based on the calculated business tax payments.
Sino-China reports itsThe Company’s PRC subsidiaries and affiliates report revenues net of PRC’s VAT, business tax and surcharges for all the periods presented in the consolidated statements of operations.
(k) Earnings (Loss)(loss) per Share (“EPS”)
Basic earnings (loss) per share is computed by dividing net income (loss) attributable to holders of common shares of the Company by the weighted average number of common shares of the Company outstanding during the years.applicable period. Diluted earnings (loss) per share reflect the potential dilution that could occur if securities or other contracts to issue common shares of the Company were exercised or converted into common shares.shares of the Company. Common share equivalents are excluded from the computation of diluted earnings (loss) per share if their effects would be anti-dilutive asanti-dilutive.
For the year ended June 30, 2017, the basic average shares outstanding and diluted average shares of the Company outstanding were not the same because the effect of potential shares of common stock of the Company was dilutive since the exercise prices for such options and warrants were at least equal tolower than the closingaverage market price of our common stock onfor the related periods. For the year ended June 30, 2014.
The effect2017, a total of 66,000 stock38,466 unexercised options were dilutive and 139,032 warrants for all periods presented were not included in the calculationcomputation of diluted EPS because they would be anti-dilutive asearnings per share. For the exercise prices for such options and warrants were at least equal to the closing price of our common stock onyear ended June 30, 2014.2016, no unexercised warrants and options were dilutive.
(l) Comprehensive Income (Loss)(loss)
The Company reports comprehensive income (loss) in accordance with the FASBFinancial Accounting Standards Board (“FASB”) issued authoritative guidance which establishes standards for reporting comprehensive income (loss) and its component in financial statements. Comprehensive income (loss), as defined, includes all changes in equity during a period from non-owner sources.sources.
(m) Stock-based Compensation
Valuations are based upon highly subjective assumptions about the future, including stock price volatility and exercise patterns. The fair value of share-based payment awards was estimated using the Black-Scholes option pricing model. Expected volatilities are based on the historical volatility of the Company’s stock. The Company uses historical data to estimate option exercise and employee terminations. The expected term of options granted represents the period of time that options granted are expected to be outstanding. The risk-free rate for periods within the expected life of the option is based on the U.S. Treasury yield curve in effect at the time of the grant.
(n) Risks and Uncertainties
The operations of the Company are primarily located in the PRC. Accordingly, the Company’s business, financial condition,position and results of operations may be influenced by the political, economic, and legal environments in the PRC, as well as by the general state of the PRC economy. The Company’s operations in the PRC are subject to special considerations and significant risks not typically associated with companies in North America and Western Europe. These include risks associated with, among others, the political, economic and legal environment and foreign currency exchange. The Company’s results may be adversely affected by exchangeschanges in the political, regulatory and social conditions in the PRC, and by changes in governmental policies or interpretations with respect to laws and regulations, anti-inflationary measures, currency conversion, remittances abroad, and rates and methods of taxation, among other things. In addition,Moreover, the Company only controls Sino-China through a series of agreements. If such agreements were cancelled, modified or otherwise not complied with, the Company may not be ableCompany’s ability to retain control of this consolidated entitygrow its business and the impactmaintain its profitability could be materialnegatively affected by the nature and extent of services provided to the Company’s operations.its major customers, Tianjin Zhiyuan Investment Group Co., Ltd. (the “Zhiyuan Investment Group”) and Tengda Northwest Ferroalloy Co., Ltd. (“Tengda Northwest”).
(o) Reclassifications
Certain prior year amounts have been reclassified to conform to the current period presentation. These reclassifications have no effect on the results of operations and cash flows.
(p) Recent Accounting Pronouncements
In January 2016, the FASB issued ASU 2016-01, Financial Instruments – Overall (Subtopic 825-10): Recognition and Measurement of Financial Assets and Financial Liabilities, to enhance the reporting model for financial instruments to provide users of financial statements with more decision-useful information. The update requires equity investments (except those accounted for under the equity method or those that result in consolidation of the investee) to be measured at fair value with changes in fair value recognized in net income. It eliminated the requirement for public entities to disclose the method(s) and significant assumptions used to estimate the fair value that is require to be disclosed for financial instruments measured at amortized cost on the balance sheet. For public entities, the ASU is effective for the fiscal years beginning after December 15, 2017, including interim periods within those fiscal years. Management does not believe the adoption of this ASU would have a material effect on the Company’s consolidated financial statements.
In April 2014,February 2016, the Financial Accounting StandardsStandard Board (“FASB”) has issued Accounting Standards Update (ASU) No. 2014-08, Presentation2016-02, Amendments to the ASC 842 Leases. This update requires lessee to recognize the assets and liability (the lease liability) arising from operating leases on the balance sheet for the lease term. When measuring assets and liabilities arising from a lease, a lessee (and a lessor) should include payments to be made in optional periods only if the lessee is reasonably certain to exercise an option to extend the lease or not to exercise an option to terminate the lease. Within twelve months or less lease term, a lessee is permitted to make an accounting policy election not to recognize lease assets and liabilities. If a lessee makes this election, it should recognize lease expense on a straight-line basis over the lease term. In transition, this update will be effective for public entities for fiscal years beginning after December 15, 2018, including interim periods within those fiscal years. The Company is currently evaluating the impact of Financial Statementsthis new standard on its consolidated financial statements.
In April 2016, the FASB issued ASU 2016-10, Revenue from Contracts with Customers (Topic 205)606): Identifying Performance Obligations and Property, Plant,Licensing. The objective is to clarify the two aspects of Topic 606: identifying performance obligations and Equipmentthe licensing implementation guidance, while retaining the related principles for these areas. The ASU affects the guidance in ASU 2014-09, Revenue from Contracts with Customers (Topic 360)606), which is not yet effective. The effective date and transition requirements for this ASU are the same as the effective date and transition requirements in Topic 606 (and any other Topic amended by ASU 2014-09). ASU 2015-14, Revenue from Contracts with Customers (Topic 606): Reporting Discontinued Operations and Disclosures of Disposals of Components of an Entity. Under the new guidance, only disposals representing a strategic shift in operations should be presented as discontinued operations. The new guidance also requires disclosureDeferral of the pre-tax income attributable to a disposalEffective Date, defers the effective date of a significant part of an organization thatASU 2014-09 by one year. Management does not qualify for discontinued operations reporting. The amendments in the ASU are effective in the first quarter of 2015 for public organizations with calendar year ends. Early adoption is permitted. The Company does not expectbelieve the adoption of this guidance willASU would have a significant impactmaterial effect on the Company’s consolidated financial statements.
In May 2014,2016, the FASB issued ASU 2016-12, Revenue from Contracts with Customers (Topic 606): Narrow-Scope Improvements and Practical Expedients. The object is to address certain issues identified by the FASB-IASB Joint Transition Resource Company for Revenue Recognition. The amendments in this Update affect the guidance in Accounting Standards Update 2014-09, Revenue from Contracts with Customers (Topic 606), which is not yet effective. The effective date and transition requirements for the amendments in this Update are the same as the effective date and transition requirements for Topic 606 (and any other Topic amended by Update 2014-09). Accounting Standards Update 2015-14, Revenue from Contracts with Customers (Topic 606): Deferral of the Effective Date, defers the effective date of Update 2014-09 by one year. Management does not believe the adoption of this ASU would have a material effect on the Company’s consolidated financial statements.
In August 2016, the FASB issued Accounting Standards Update (ASU) No. 2016-15, Statement of Cash Flows (Topic 230): Classification of Certain Cash Receipts and Cash Payments, to address diversity in how certain cash receipts and cash payments are presented and classified in the statement of cash flows. The amendments provide guidance on the following eight specific cash flow issues: (1) Debt Prepayment or Debt Extinguishment Costs; (2) Settlement of Zero-Coupon Debt Instruments or Other Debt Instruments with Coupon Interest Rates That Are Insignificant in Relation to the Effective Interest Rate of the Borrowing; (3) Contingent Consideration Payments Made after a Business Combination; (4) Proceeds from the Settlement of Insurance Claims; (5) Proceeds from the Settlement of Corporate-Owned Life Insurance Policies, including Bank-Owned; (6) Life Insurance Policies; (7) Distributions Received from Equity Method Investees; (8) Beneficial Interests in Securitization Transactions; and Separately Identifiable Cash Flows and Application of the Predominance Principle. The amendments are effective for public business entities for fiscal years beginning after December 15, 2017, and interim periods within those fiscal years. Early adoption is permitted, including adoption in an interim period. The amendments should be applied using a retrospective transition method to each period presented. If it is impracticable to apply the amendments retrospectively for some of the issues, the amendments for those issues would be applied prospectively as of the earliest date practicable. Management does not believe the adoption of this ASU would have a material effect on the Company’s consolidated financial statements.
In January 2017, the FASB issued ASU No. 2014-09, Revenue from Contracts2017-01, “Business Combinations (Topic 805): Clarifying the Definition of a Business”. The amendments in this ASU clarify the definition of a business with Customers: Topic 606. This Update affects any entitythe objective of adding guidance to assist entities with evaluating whether transactions should be accounted for as acquisitions (or disposals) of assets or businesses. Basically, these amendments provide a screen to determine when a set is not a business. If the screen is not met, the amendments in this ASU first require that either enters into contracts with customers to transfer goods or services or enters into contractsbe considered a business, a set must include, at a minimum, an input and a substantive process that together significantly contribute to the ability to create output, and second, they require removal of the evaluation of whether a market participant could replace missing elements. These amendments take effect for public businesses for fiscal years beginning after December 15, 2017 and interim periods within those periods, and all other entities should apply these amendments for fiscal years beginning after December 15, 2018, and interim periods within annual periods beginning after December 15, 2019. The Company does not expect that the transferadoption of nonfinancial assets, unless those contracts are withinthis guidance will have a material impact on its consolidated financial statements.
In May 2017, the FASB issued ASU 2017-09, Scope of Modification Accounting, which amends the scope of other standards. Themodification accounting for share-based payment arrangements, provides guidance in this Update supersedeson the revenue recognition requirements in Topic 605, Revenue Recognition and most industry-specific guidance. The core principletypes of changes to the guidance is thatterms or conditions of share-based payment awards to which an entity should recognize revenuewould be required to illustrateapply modification accounting under ASC 718. For all entities, the transfer of promised goods or services to customers in an amount that reflects the consideration to which the entity expects to be entitled in exchange for those goods or services. The new guidance also includes a cohesive set of disclosure requirements that will provide users of financial statements with comprehensive information about the nature, amount, timing, and uncertainty of revenue and cash flows arising from a reporting organization’s contracts with customers. This ASU is effective retrospectively for annual reporting periods, including interim periods within those annual reporting periods, beginning after December 15, 2017. Early adoption is permitted, including adoption in any interim period. The Company does not expect that the Companyadoption of this guidance will have a material impact on its consolidated financial statements.
In July 2017, the FASB issued ASU 2017-11, “Earnings Per Share (Topic 260)”, Distinguishing Liabilities from Equity (Topic 480), Derivatives and Hedging (Topic 815). The amendments in Part I of this Update change the classification analysis of certain equity-linked financial instruments (or embedded features) with down round features. When determining whether certain financial instruments should be classified as liabilities or equity instruments, a down round feature no longer precludes equity classification when assessing whether the instrument is indexed to an entity’s own stock. The amendments also clarify existing disclosure requirements for equity-classified instruments. The amendments in Part II of this Update recharacterize the indefinite deferral of certain provisions of Topic 480 that now are presented as pending content in the Codification, to a scope exception. Those amendments do not have an accounting effect. For public business entities, the amendments in Part I of this Update are effective for fiscal years, and interim periods within those fiscal years, beginning after December 15, 2016. Management is evaluating the effect, if any, on the Company’s financial position and results of operations.
In June 2014, the FASB issued ASU No. 2014-12, Compensation-Stock Compensation: Topic 718. This amendment requires that a performance target that affects vesting and that could be achieved after the requisite service period be treated as a performance condition. This ASU is effective for annual periods and interim periods within those annual periods beginning after December 15, 2015. Earlier2018. Early adoption is permitted.permitted for all entities, including adoption in an interim period. If an entity early adopts the amendments in an interim period, any adjustments should be reflected as of the beginning of the fiscal year that includes that interim period. The Company does not expect that the adoption of this guidance will have a significantmaterial impact on the Company’sits consolidated financial statements.
Note 3. ACCOUNTS RECEIVABLE / ACCOUNTS PAYABLEADVANCES TO SUPPLIERS
In July and December 2013,The Company’s advances to third-party suppliers are as follows:
| | | June 30, | | | June 30, | |
| | | 2017 | | | 2016 | |
| | | | | | | |
| Freight fees | | $ | 29,960 | | | $ | 2,192,910 | |
| Others | | | 24,930 | | | | - | |
| Total advances to suppliers-third parties | | $ | 54,890 | | | $ | 2,192,910 | |
As of June 2017, the Company executedis undergoing a totaltrial on the transporting of fourSulphur product as containerized bulk cargo under joint agreements (the “settlement agreements”) with Sino-Trans Guangxi and COSFRE Beijing. As of the end of fiscal year 2017, there was no revenue or cost of revenue recognized as the service provided has not been completed. $50,020 advances payment made to suppliers (including $29,960 advanced freight fees and the remaining balance was included in other prepayment) in relation of the trial of bulk cargo containerized was included in the balance of advances to suppliers as of June 30, 2017.
The Company’s advances to suppliers – related party are as follows:
| | | June 30, | | | June 30, | |
| | | 2017 | | | 2016 | |
| | | | | | | |
| Freight fees | | $ | 3,333,038 | | | $ | - | |
| Total advances to suppliers-related party | | $ | 3,333,038 | | | $ | - | |
As discussed in Note 1, on February 18, 2017, the Company entered into a major customercooperative transportation agreement with Zhiyuan Hong Kong . Zhiyuan Hong Kong is owned by our largest shareholder. On July 7, 2017, the Company signed a supplemental agreement, pursuant to settlewhich Sino will cooperate with Zhiyuan Hong Kong exclusively on the entire project’s transportation needs. Pursuant to the supplemental agreement, the Company agrees to make prepayments to Zhiyuan Hong Kong for its share of packaging and transporting costs related accounts receivable and payable that were associated withto the Company’s shipping agency business. In connection with the settlement agreements,project, in return the Company will reducereceive 15% of its share of the amount ofcost incurred in the project from Zhiyuan Hong Kong as a service fee. The project is expected to complete in one to two years and the Company will collect is service fee in accordance with project completion.
Note 4. ACCOUNTS RECEIVABLE, NET
The Company’s net accounts receivable from this major customer based on payments made by such customer directly to the respective local shipping agents. is as follows:
| | | June 30, | | | June 30, | |
| | | 2017 | | | 2016 | |
| Trade accounts receivable | | $ | 2,754,962 | | | $ | 2,540,052 | |
| Less: allowances for doubtful accounts | | | (185,821 | ) | | | (207,028 | ) |
| Accounts receivables, net | | $ | 2,569,141 | | | $ | 2,333,024 | |
For the year ended June 30, 2014, such customer made a total payment2017, recovery of $2,589,739 to the respective local shipping agents; and the Company reduced its reporteddoubtful accounts receivable and payable accordingly.
4. PROPERTY AND EQUIPMENT, AT COST.was $18,912. For the year ended June 30, 2016, $132,915 was charged to allowance for doubtful accounts.
PropertyNote 5. OTHER RECEIVABLES
The Company’s other receivables represent mainly prepaid employee insurance and equipmentwelfare benefits, which will be subsequently deducted from the employee payroll, guarantee deposits on behalf of ship owners as well as office lease deposits.
Note 6. PREPAID EXPENSES AND OTHER CURRENT ASSETS
The Company’s prepaid expenses and other current assets are as follows:
| | | June 30, | | | June 30, | |
| | | 2014 | | | 2013 | |
| | | | | | | |
| Land and building | | $ | 216,951 | | | $ | 80,461 | |
| Motor vehicles | | | 710,148 | | | | 731,372 | |
| Computer equipment | | | 133,145 | | | | 122,002 | |
| Office equipment | | | 50,790 | | | | 46,319 | |
| Furniture and fixtures | | | 100,021 | | | | 52,687 | |
| System software | | | 128,178 | | | | 123,391 | |
| Leasehold improvement | | | 68,697 | | | | 68,981 | |
| | | | | | | | | |
| Total | | | 1,407,930 | | | | 1,225,213 | |
| | | | | | | | | |
| Less: Accumulated depreciation and amortization | | | 1,113,208 | | | | 957,551 | |
| | | | | | | | | |
| Property and equipment, net | | $ | 294,722 | | | $ | 267,662 | |
| | | June 30, | | | June 30, | |
| | | 2017 | | | 2016 | |
| | | | | | | |
| Consultant fees (1) | | $ | 158,150 | | | $ | 845,420 | |
| Advance to employees | | | 64,160 | | | | 105,137 | |
| Other (including prepaid web hosting , public relations services) | | | 95,708 | | | | 55,056 | |
| Total | | | 318,018 | | | | 1,005,613 | |
| Less : current portion | | | 311,136 | | | | 826,631 | |
| Total noncurrent portion | | $ | 6,882 | | | $ | 178,982 | |
5. STOCK-BASED COMPENSATION(1) The Company entered into a management consulting services agreement with a consulting company on November 12, 2015, pursuant to which the consulting company shall assist the Company with its regulatory filings during the period from July 1, 2016 to June 30, 2018. In return for its services, as approved by the Board, a total of RMB 2,100,000 ($316,298) was paid to the consulting company. The above-mentioned consulting fees have been and will be ratably charged to expense over the terms of the above-mentioned agreement.
On January 31, 2013, the Company issued options to a member of the audit committee, to purchase 10,000 shares of the Company’s common stock. On January 1, 2013, options to purchase 46,000 shares of common stock were cancelled due to resignation of one employee and one member of the audit committee from the Company. Accordingly, the Company reversed the unvested amount of $46,954 from unearned stock-based compensation. On January 31, 2014, options to purchase 36,000 shares of common stock were cancelled due to resignation of one officer and director from the Company. As the options were fully vested, this did not result in any reversal of stock-based compensation.
A summary of the options is presented in the table below:
| | | June 30, 2014 | | | June 30, 2013 | |
| | | Shares | | | Weighted
Average
Exercise Price | | | Shares | | | Weighted
Average
Exercise Price | |
| | | | | | | | | | | | | |
| | | | | | | | | | | | | |
| Options outstanding, beginning of year | | | 102,000 | | | $ | 6.90 | | | | 138,000 | | | $ | 7.43 | |
| Granted | | | - | | | | - | | | | 10,000 | | | | 2.01 | |
| Canceled, forfeited or expired | | | (36,000 | ) | | $ | 7.75 | | | | (46,000 | ) | | | 7.43 | |
| | | | | | | | | | | | | | | | | |
| Options outstanding, end of year | | | 66,000 | | | $ | 6.88 | | | | 102,000 | | | $ | 6.90 | |
| | | | | | | | | | | | | | | | | |
| Options exercisable, end of year | | | 58,000 | | | $ | 7.55 | | | | 92,000 | | | $ | 7.75 | |
Following is a summary of the status of options outstanding and exercisable at June 30, 2014:
| Outstanding Options | | Exercisable Options |
| Exercise Price | | | Number | | | Average
Remaining
Contractual Life | | Average Exercise
Price | | | Number | | | Average
Remaining
Contractual Life |
| $ | 7.75 | | | | 56,000 | | | 4.0 years | | $ | 7.75 | | | | 56,000 | | | 4.0 years |
| $ | 2.01 | | | | 10,000 | | | 3.6 years | | $ | 2.01 | | | | 2,000 | | | 3.6 years |
| | | | | | 66,000 | | | | | | | | | | 58,000 | | | |
Note 7. PROPERTY AND EQUIPMENT, NET
The Company’s net property and equipment as follows:
| | | June 30, | | | June 30, | |
| | | 2017 | | | 2016 | |
| | | | | | | |
| Land and buildings | | $ | 198,512 | | | $ | 202,450 | |
| Motor vehicles | | | 542,471 | | | | 497,006 | |
| Computer equipment | | | 155,141 | | | | 156,890 | |
| Office equipment | | | 66,097 | | | | 59,899 | |
| Furniture and fixtures | | | 163,219 | | | | 164,701 | |
| System software | | | 117,733 | | | | 119,964 | |
| Leasehold improvements | | | 62,857 | | | | 64,105 | |
| | | | | | | | | |
| Total | | | 1,306,030 | | | | 1,265,015 | |
| | | | | | | | | |
| Less: Accumulated depreciation and amortization | | | 1,118,657 | | | | 1,088,648 | |
| | | | | | | | | |
| Property and equipment, net | | $ | 187,373 | | | $ | 176,367 | |
Depreciation and amortization expense for the years ended June 30, 2017 and 2016 were $49,367 and $59,508, respectively.
Note 8. ACCRUED EXPENSES AND OTHER CURRENT LIABILITIES
Accrued expenses and other current liabilities represent mainly payroll and welfare payable, accrued expenses and other miscellaneous items.
Note 9. STOCK-BASED COMPENSATION
The issuance of the OptionsCompany’s options is exempted from registration under of the Securities Act of 1933, as amended (the “Act”). The Options will vest at a rate of 20% per year, with 20% vesting initially when granted. The Common Stock underlying the OptionsCompany’s options granted may be sold in compliance with Rule 144 under the Act. The term of the Options is 10 years and the exercise price of the 2013 options is $2.01 (10,000 options). Each Optionoption may be exercised to purchase one share of Common Stock.the common stock of the Company, no par value per share (the “Common Stock”). Payment for the Optionsoptions may be made in cash or by exchanging shares of Common Stock at their Fair Market Value.fair market value. The Fair Market Valuefair market value will be equal to the average of the highest and lowest registered sales prices of Company Stock on the date of exercise.
The term of the 56,000 options granted in 2009 is for 10 years and the exercise price of the 56,000 options issued in 2009 is $7.75. The fair value of share-based compensationthe 56,000 stock options was estimated using the Black-Scholes option pricing model.option-pricing model with the following assumptions: volatility of 173.84%, risk free interest rate of 3.02% and expected life of 10 years. The aggregatetotal fair value of $11,640 and $15,520 at June 30, 2014 and 2013, respectively, is presented as “Unearned Stock-based Compensation”. Thethe options was $413,107. In accordance with the vesting periods, the Company amortized stock option expenses of $3,880 and $139,615recorded no stock-based compensation expense for the years ended June 30, 20142017 and 2013 respectively.2016. The options are fully vested at June 30, 2017.
The term of the 10,000 options granted in 2013 is 10 years and the exercise price of the 10,000 options issued in 2013 is $2.01. The fair value of the 10,000 stock options granted in 2013 was calculated at the grant date using the Black−Scholes option−Black-Scholes option-pricing model with the following assumptions: volatility of 452.04%, risk free interest rate of 0.88% and expected life of 10 years. The total fair value of the options was $19,400. In accordance with the vesting periods, the Company amortized stock option expense of $3,880 for each of the years ended June 30, 2017 and 2016. As of June 30, 2017, 8,000 options were vested.
Pursuant to the Company’s 2014 Stock Incentive Plan, effective on July 26, 2016, the Company granted a total of 150,000 to two employees with a one-year vesting period, one half of which vested on October 26, 2016, and the other half will vest on July 26, 2017. The exercise price of the 150,000 options is $1.10, which was equal to the share price of the Company’s Common Stock on July 26, 2016. The grant date fair value of such options was $0.77 per share. The fair value of the 150,000 options was calculated using the Black-Scholes options pricing model with the following assumptions: volatility of 99.68%, risk free interest rate of 1.15%, and expected life of 5 years. The total fair value of the options was $115,979. In accordance with the vesting periods, $106,315 and nil were recorded as general and administrative expenses related to these options for the years ended June 30, 2017 and 2016. In February 2017, 75,000 of these options were exercised by the two employees of the Company.
| Black-Scholes Option Pricing Model for 2008 options | | | |
| Assumptions: | | | | |
| Stock Price | | $ | 7.75 | |
| Strike Price | | $ | 7.75 | |
| Volatility | | | 173.84 | % |
| Risk-free Rate | | | 3.02 | % |
| Expected life | | | 5 yrs | |
| Dividend Yield | | | 0.00 | % |
| Number of Options | | | 66,000 | |
| | | | | |
| Black-Scholes Option Pricing Model for 2013 options | | | | |
| Assumptions: | | | | |
| Stock Price | | $ | 1.94 | |
| Strike Price | | $ | 2.01 | |
| Volatility | | | 452.04 | % |
| Risk-free Rate | | | 0.88 | % |
| Expected life | | | 5 yrs | |
| Dividend Yield | | | 0.00 | % |
| Number of Options | | | 10,000 | |
In connectionPursuant to the Company’s 2014 Stock Incentive Plan, the Company granted a total of 800,000 options on December 14, 2016, to purchase an aggregate of 800,000 shares of Common Stock to seven employees, with a vesting period from one to three years. The grant date fair value of such options was $2.24 per option. The fair value of the 800,000 options was calculated using the Black-Scholes options pricing model with the initial public offeringfollowing assumptions: volatility of 112.70%, risk free interest rate of 2.02%, and expected life of 5 years. The total fair value of the Company’s common stock on May 20, 2008, 139,032 warrants were issued tooptions was $1,788,985. With the underwriterseven employees’ consent, the Company cancelled the 800,000 options, effective February 16, 2017 and nil was recorded as part of their compensation. Each warrant hasgeneral and administrative expenses related to these options for the right to purchase one shareyear ended June 30, 2017.
A summary of $9.30 per share withthe options is presented in the table below:
| | | Shares | | | Weighted Average
Exercise Price | |
| | | | | | | |
| Options outstanding, as of June 30, 2016 | | | 66,000 | | | $ | 6.88 | |
| Granted | | | 950,000 | | | | 2.78 | |
| Exercised | | | (75,000 | ) | | | 1.10 | |
| Cancelled | | | (800,000 | ) | | | 3.10 | |
| | | | | | | | | |
| Options outstanding, as of June 30, 2017 | | | 141,000 | | | $ | 3.81 | |
| | | | | | | | | |
| Options exercisable, as of June 30, 2017 | | | 64,000 | | | $ | 7.03 | |
Following is a termsummary of 10 years.the status of options outstanding and exercisable at June 30, 2017:
| Outstanding Options | | Exercisable Options |
| Exercise Price | | | Number | | | Average
Remaining
Contractual Life | | Average
Exercise
Price | | | Number | | | Average
Remaining
Contractual
Life |
| $ | 7.75 | | | | 56,000 | | | 0.88 years | | $ | 7.75 | | | | 56,000 | | | 0.88 years |
| $ | 2.01 | | | | 10,000 | | | 5.59 years | | $ | 2.01 | | | | 8,000 | | | 5.59 years |
| $ | 1.10 | | | | 75,000 | | | 4.07 years | | $ | 1.10 | | | | - | | | - |
| | | | | | 141,000 | | | | | | | | | | 64,000 | | | |
Following is a summary of the status of warrants outstanding and exercisable at June 30, 2014:2017:
Warrants
Outstanding | | | Warrants Exercisable | | | Weighted
Average
Exercise Price | | | Average
Remaining
Contractual Life |
| | 139,032 | | | | 139,032 | | | $ | 9.30 | | | 0.88 years |
Total expenses for options and warrants amounted to $110,195 and $3,880 for the year ended June 30, 2017 and 2016, respectively.
| Warrants Outstanding | | Warrants Exercisable | | Weighted
Average
Exercise Price | | | Average
Remaining
Contractual Life |
| 139,032 | | 139,032 | | $ | 9.30 | | | 4.0 years |
6.Note 10. EQUITY TRANSACTIONS
On April 19, 2013, the Company’s shareholders at the 2013 Annual Meeting of Shareholders voted and approved the issuance of 1,800,000 shares at price $1.71 per share to Mr. Zhang, a 90% shareholder in Tianjin Zhiyuan Investment Group Ltd.
At theJune 6, 2014, Annual Meeting of Shareholders held on January 21, 2014, the Company’s shareholders voted to increase the number of authorized shares of common stock from 10 million to 50 million shares and the number of authorized shares of Preferred Stock from 1 million to 2 million shares. The Company filed its First Amended and Restated Articles of Incorporation with the Commonwealth of Virginia State Corporation Commission on February 10, 2014.
To strengthen the Company’s efforts in business reorganization, development and acquisitions as well as enterprise risk management and process flow enhancements, the Company entered into management consulting and advisory services agreements with two consultants, on June 6, 2014.pursuant to which the consultants assisted the Company in, among other things, financial and tax due diligence, business evaluation and integration, development of pro forma financial statements. In return for their services, as approved by the Company’s Board of Directors, a total of 600,000 shares of the Company’s common stock have beenwere to be issued to these two consultants. During June 2014, a total of 200,000 shares of the Company’s common stock were issued to the consultants as a prepayment for their services. The value of their consulting services iswas determined using the fair value of the Company’s common stock of $2.34 per share when the shares were issued to the consultants. The remaining 400,000 shares of the Company's common stock were issued to the consultants on August 29, 2014. TheTheir service agreements arewere for the period July 1, 2014 to December 31, 2016. The remaining 400,000 shares of the Company’s common stock were then issued to the consultants on September 30, 2014 at $1.68 per share, and the service terms are from September 2014 to November 2016. These shares were valued at $1,140,000 and the related consulting fees have been ratably charged to expense over the term of the agreements. Consulting expenses for the above services were $218,045 and $485,867 for the years ended June 30, 2017 and 2016, respectively.
On June 23, 2014,May 5, 2015, the Company sold 200,000entered into management consulting and advisory services agreements with three consultants, pursuant to which the consultants assisted the Company in, among other things, review of time charter agreements; crew management advisory; development of permanent and preventive maintenance standards related to dry dockings and ship repairs; development of regular technical and marine vessel inspections and quality control procedures; and development and implementation of alternative remedial actions to address technical problems that may arise. In return for their services, as approved by the Company’s Board of Directors, a total of 500,000 shares of the Company’s common stock were to be issued to these three consultants at $1.50 per share. Their service agreements are for a period of 18 months, effective May 2015. These shares were valued at $750,000 and the related consulting fees have been ratably charged to expense over the term of the agreements. Consulting expenses for the above services were $173,137 and $498,633 for the years ended June 30, 2017 and 2016, respectively
On December 9, 2015, the Company entered into a consulting and advisory services agreement with a consultant, pursuant to which the consultant will assist the Company for corporate restructuring, business evaluation and capitalization during the period from November 20, 2015 to November 19, 2016. In return for such services, the Company issued 250,000 shares of the Company’s common stock to this consultant for services to be rendered during the first half of the service period. Such shares were issued as restricted shares at $1.02 per share on December 9, 2015. On May 23, 2016, the Company issued additional 250,000 shares of common stock to this consultant at $0.72 per share to cover the services from the seventh month to November 19, 2016. These shares were valued at $435,000 and consulting expenses were $138,387 and $296,612 for the years ended June 30, 2017 and 2016, respectively.
Pursuant to the Company’s 2014 Incentive Plan (the “Plan”), the Company is authorized to issue, in the aggregate, 10,000,000 shares of common stock or other securities convertible or exercisable for common stock. Effective February 11, 2016, the Compensation Committee of the Board of Directors of the Company granted 660,000 shares of common stock to seven directors and executive officers under the Plan. Pursuant to the terms and conditions of the Plan and the plan stock award agreements, these shares vested immediately, with a total value of $349,800, at $0.53 per share based on the Company’s stock price on February 10, 2016. In addition, the Compensation Committee authorized the grant of a total of $300,000 worth of share awards under the Plan and/or the 2008 Equity Stock Incentive Plan for each fiscal year going forward to its directors and executive officers in the same proportion as they were granted for the fiscal year 2016, as long as such a director or executive officer is in his position and fulfills his duty.
In March 2017, the Company entered into a consulting and advisory services agreement with Jianwei Li, who will provide management consulting services that include marketing program designing and implementation and cooperative partner selection and management. The service period is from March 2017 to February 2020. The Company issued 250,000 shares of common stock as the remuneration of the service, which were issued as restricted shares at $2.53 per share on March 22, 2017 to the consultant. These shares were valued at $632,500 and consulting expenses were $70,278 for the year ended June 30, 2017.
$599,846 and $1,327,780 were charged to expenses during the years ended June 30, 2017 and 2016, respectively.
On February 21, 2017, the Company completed a sale of 1.5 million registered shares of its common stock, no par value, at a purchase price of $3.18 per share, at $2.22 to Crystal Spring Holdings Limited, a company owned by Mr. Deming Wang, a major shareholder of Zhenghe Shipping Group Limited. Subsequentthree institutional investors, for aggregate gross proceeds to June 30, 2014, the Company entered into another agreement with Mr. Wang. Please see Note 13, Subsequent Events.of $4.77 million. The Company’s net proceeds from the offering, after deducting offering expenses and placement agent fees in the amount of $0.45 million, were approximately $4.32 million. Sino-Global will use the net proceeds from the offering for working capital and general corporate purposes.
7.Note 11. NON-CONTROLLING INTEREST
Non-controllingThe Company’s non-controlling interest consists of the following:
| | | June 30, | | | June 30, | |
| | | 2014 | | | 2013 | |
| | | | | | | |
| Sino-China: | | | | | | | | |
| Original paid-in capital | | $ | 356,400 | | | $ | 356,400 | |
| Additional paid-in capital | | | 1,044 | | | | 1,044 | |
| Accumulated other comprehensive loss | | | (64,872 | ) | | | (85,653 | ) |
| Accumulated deficit | | | (5,006,843 | ) | | | (3,849,640 | ) |
| | | | (4,714,271 | ) | | | (3,577,849 | ) |
| Trans Pacific Logistics Shanghai Ltd. | | | 20,240 | | | | 4,019 | |
| Total | | $ | (4,694,031 | ) | | $ | (3,573,830 | ) |
| | | June 30, | | | June 30, | |
| | | 2017 | | | 2016 | |
| | | | | | | |
| Sino-China: | | | | | | |
| Original paid-in capital | | $ | 356,400 | | | $ | 356,400 | |
| Additional paid-in capital | | | 1,044 | | | | 1,044 | |
| Accumulated other comprehensive income | | | 217,379 | | | | 157,019 | |
| Accumulated deficit | | | (5,421,578 | ) | | | (5,349,210 | ) |
| | | | (4,846,755 | ) | | | (4,834,747 | ) |
| Trans Pacific Logistics Shanghai Ltd. | | | 46,047 | | | | 27,400 | |
| ACH Trucking Center Corp. | | | 31,929 | | | | - | |
| Total | | $ | (4,768,779 | ) | | $ | (4,807,347 | ) |
8.Note 12. COMMITMENTS AND CONTINGENCY
(a) Office leasesLease Obligations
The Company leases certain office premises and apartments for employees under operating leaseslease agreements with various terms through August 31, 2019.April 16, 2020. Future minimum lease payments under the operating leaseslease agreements are as follows:
| | | Amount | |
| | | | | |
| Twelve months ending June 30, | | | | |
| | | | | |
| 2015 | | $ | 162,229 | |
| 2016 | | | 92,569 | |
| 2017 | | | 63,981 | |
| 2018 | | | 65,711 | |
| 2019 | | | 67,492 | |
| Thereafter | | | 11,298 | |
| | | $ | 463,280 | |
| Twelve months ending June 30, | | Amount | |
| 2018 | | $ | 215,560 | |
| 2019 | | | 149,081 | |
| 2020 | | | 48,597 | |
| | | $ | 413,238 | |
Rent expenseRental expenses for the years ended June 30, 20142017 and 20132016 was $205,753$266,316 and $214,066,$243,374, respectively.
(b) Contingency
Legal proceedings
During the quarter ended December 31, 2015, a former vice president of the Company (the “Former Officer”) filed a complaint with the U.S. Department of Labor-Occupational Safety and Health Administration (“OSHA”) against the Company and three current or former executives. The Former Officer sought $350,000 in damages plus attorney’s fees for alleged retaliation and a purported breach of his employment agreement. The Company responded to the complaint filed with OSHA and provided arguments and information supporting the Company’s position that no violation of law in connection with the Former Officer’s employment occurred. The complaint was settled on January 24, 2017, and the Company is required to pay a total of $185,000, of which $60,000 was paid on February 6, 2017 to the former officer. The settlement payment of $185,000 included the former officer’s salary, unemployment compensation and legal expenses incurred in connection with the complaint, which has been fully recorded and included in general and administrative expenses. The balance of $125,000 was paid to the Former Officer on April 26, 2017.
Contingencies
The Labor Contract Law of the People’s Republic of ChinaPRC requires employers to insure the liability of the severance payments iffor terminated employees are terminated andthat have been workingworked for the employers for at least two years prior to January 1, 2008. The employers will beEmployers are liable for one month forof severance pay for eachper year of the service provided by the employees. As of June 30, 2014,2017 and 2016, the Company has estimated its severance payments of approximately $84,600,$48,713 and $62,500, respectively, which hashave not been reflected in its consolidated financial statements, because management cannot predict what the actual payment, if any, will be in the future.
9.Note 13. INCOME TAXES
Income tax expense for the years ended June 30, 20142017 and 20132016 varied from the amount computed by applying the statutory income tax rate to income before taxes. A reconciliationReconciliations between the expected federal income tax raterates using the federal statutory tax rate of 35%34% to the Company’s effective tax rate isare as follows:
| | | For the years ended June 30, | |
| | | 2014 | | | 2013 | |
| | | % | | | % | |
| | | | | | | |
| U.S. expected federal income tax benefit | | | (35.0 | ) | | | (35.0 | ) |
| U.S. state, local tax net of federal benefit | | | (10.9 | ) | | | (10.9 | ) |
| U.S. permanent difference | | | 0.3 | | | | 1.2 | |
| U.S. temporary difference | | | 45.5 | | | | 44.7 | |
| Permanent differences related to other countries | | | (0.9 | ) | | | 19.3 | |
| Other | | | 0.0 | | | | (0.4 | ) |
| Hong Kong statutory income tax rate | | | 16.5 | �� | | | 0.0 | |
| Total tax expense | | | 15.5 | | | | 18.9 | |
| | | For the years ended
June 30, | |
| | | 2017 | | | 2016 | |
| | | % | | | % | |
| | | | | | | |
| U.S. statutory tax rate | | | 34.0 | | | | 34.0 | |
| U.S. permanent difference | | | 3.9 | | | | (11.0 | ) |
| Change in valuation allowance | | | (39.9 | ) | | | (105.9 | ) |
| Rate differential in foreign jurisdiction | | | (13.1 | ) | | | 25.0 | |
| Other | | | - | | | | 3.3 | |
| | | | (15.1 | ) | | | (54.6 | ) |
The U.S. temporary difference was mainly comprised of unearned compensation amortization and provision for allowance for doubtful accounts.
TheCompany’s income tax expense (benefit)benefit (expense) for the years ended June 30, 20142017 and 20132016 are as follows:
| | | For the years ended June 30, | | | For the years ended
June 30, | |
| | | 2014 | | | 2013 | | | 2017 | | | 2016 | |
| | | | | | | | | | | |
| Current | | | | | | | | | | | | | |
| USA | | $ | - | | | $ | (3,811 | ) | | $ | - | | | $ | - | |
| Hong Kong | | | 130,268 | | | | - | | | | (70,958 | ) | | | 23,287 | |
| Other countries | | | - | | | | - | | |
| China | | | - | | | | - | | | | (206,358 | ) | | | (555,280 | ) |
| | | | 130,268 | | | | (3,811 | ) | | | (277,316 | ) | | | (531,993 | ) |
| | | | | | | | | | | | | | | | | |
| Deferred | | | | | | | | | | | | | | | | |
| USA | | | (50,330 | ) | | | 413,900 | | | | 749,400 | | | | (280,600 | ) |
| Hong Kong | | | - | | | | - | | |
| Other countries | | | (115 | ) | | | - | | |
| China | | | - | | | | - | | |
| | | | (50,445 | ) | | | 413,900 | | | | 749,400 | | | | (280,600 | ) |
| | | | | | | | | | | | | | | | | |
| Total | | $ | 79,823 | | | $ | 410,089 | | |
| Total income tax benefit (expense) | | | $ | 472,084 | | | $ | (812,593 | ) |
Deferred
The Company’s deferred tax assets are comprised of the following:
| | | For the years ended June 30, | | | For the years ended
June 30, | |
| | | 2014 | | | 2013 | | | 2017 | | | 2016 | |
| | | | | | | | | | | |
| Allowance for doubtful accounts | | $ | 224,000 | | | $ | 301,000 | | | $ | 106,000 | | | $ | 112,000 | |
| Stock-based compensation | | | 411,000 | | | | 307,000 | | | | 790,000 | | | | 735,000 | |
| Net operating loss | | | 1,004,000 | | | | 443,000 | | | | 1,464,000 | | | | 3,752,000 | |
| Total deferred tax assets | | | 1,639,000 | | | | 1,051,000 | | | | 2,360,000 | | | | 4,599,000 | |
| Valuation allowance | | | (1,475,100 | ) | | | (945,900 | ) | | | (1,610,600 | ) | | | (4,599,000 | ) |
| Deferred tax assets, net - long-term | | $ | 163,900 | | | $ | 105,100 | | | $ | 749,400 | | | $ | - | |
OperationsThe Company’s operations in the USAU.S. have incurred a cumulative net operating loss (“NOL”) of approximately $3,465,850$6,205,000 as of June 30, 2014,2017, which may be available to reduce future taxable income. For the year ended June 30, 2017, approximately $1,853,000 of NOL was utilized and the tax benefit derived from such NOL was approximately $630,000. For the year ended June 30, 2016, the utilization of NOL was nil and no tax benefit was derived from NOL. This carry-forward will expire if not utilized by 2034. Other2036.
The Company periodically evaluates the likelihood of the realization of deferred tax assets, relating toand reduces the allowance for doubtful accounts, stock compensation expenses and net operating loss amounting to $224,000, $411,000 and $1,004,000 have been recorded respectively. 90%carrying amount of the deferred tax assets balanceby a valuation allowance to the extent it believes a portion will not be realized. The Company considers many factors when assessing the likelihood of future realization of the deferred tax assets, including its recent cumulative earnings experience, expectation of future income, the carry forward periods available for tax reporting purposes, and other relevant factors. Part of the Company’s traditional business, such as shipping agency services and shipping and chartering services, is temporarily suspended. Management has been provided as valuationan allowance against the deferred tax assets balance as of June 30, 2014 based on management’s estimate.2017. The net decrease in the valuation allowance for the year ended June 30, 2017 was $2,988,000 and the net increase in the valuation allowance for the same period of 2016 was $2,026,600.
The Company’s taxes payable consists of the following:
| | | June 30, | | | June 30, | |
| | | 2017 | | | 2016 | |
| | | | | | | |
| VAT tax payable | | $ | 520,436 | | | $ | 475,066 | |
| Corporate income tax payable | | | 1,290,832 | | | | 1,100,380 | |
| Others | | | 74,948 | | | | 61,751 | |
| Total | | $ | 1,886,216 | | | $ | 1,637,197 | |
10.Note 14. CONCENTRATIONS
Major CustomerCustomers
For the year ended June 30, 2014,2017, three customers accounted for 26%, 24% and 19% of the Company’s revenues. At June 30, 2017, one of these three customers accounted for 100% of the Company’s accounts due from related parties (See Note 16) and the remaining two customers accounted for approximately 35% and 18%63% of the Company’s revenues. accounts receivable.
For the year ended June 30, 2013, approximately 63%2016, two customers accounted for 31% and 27% of the Company’s revenues wererevenues. At June 30, 2016, these two customers accounted for 100% and approximately 70% of the Company’s due from one customer.related parties and accounts receivable.
Major Suppliers
For the year ended June 30, 2014,2017, two suppliers accounted for 21%42% and 12%11% of the total costcosts of revenues, respectively.revenue. For the year ended June 30, 2013, two2016, three suppliers accounted for 22%27%, 15% and 10% of the total cost of revenues, respectively.revenues.
11.Note 15. SEGMENT REPORTING
ASC 280, “Segment Reporting”, establishes standards for reporting information about operating segments on a basis consistent with the Company'sCompany’s internal organizational structure as well as information about geographical areas, business segments and major customers in financial statements for details ondetailing the Company'sCompany’s business segments.
The Company'sCompany’s chief operating decision maker has been identified asis the Chief Executive Officer, who reviews the financial information of the separate operating segments when making decisions about allocating resources and assessing the performance of the group. Based on management's assessment, theThe Company has determined that it has threefive operating segments: (1) shipping agency service,and ship management services; (2) shipping and chartering services, andservices; (3) inland transportation management services; (4) freight logistics services; and (5) container trucking services.
Historically, However, due to the downturn in the shipping industry, the Company engages primarily in the delivery ofhas decided to suspend to its shipping agency and ship management services but during fiscal 2014, it has expanded its service delivery platform to includeand shipping and chartering services (launched during the quarter ended September 30, 2013) and inland transportation management services (launched during the quarter ended December 31, 2013). These new services are part of the Company’s strategic initiatives to diversify its service offering, broaden its service platform, and improve its operating profit.services.
The following tables present summary information by segment for the years ended June 30, 20142017 and 2013,2016, respectively:
| | | For the Year Ended June 30, 2014 | | | For the year ended June 30, 2017 | |
| | | Shipping Agency
Service | | Shipping & Chartering
Services | | Inland Transportation
Management Services | | Total | | | Shipping
Agency and Ship
Management
Services | | Shipping and
Chartering
Services | | Inland
Transportation
Management
Services | | Freight
Logistic
Services | | Container
Trucking
Services | | Total | |
| Revenues | | $ | 7,523,983 | | | $ | 1,937,196 | | | $ | 2,183,213 | | | $ | 11,644,392 | | | | | | | | | | | | | | |
| - Related party | | | $ | - | | | $ | - | | | $ | 2,746,423 | | | $ | - | | | $ | - | | | $ | 2,746,423 | |
| - Third parties | | | $ | - | | | $ | - | | | $ | 3,012,177 | | | $ | 4,815,450 | | | $ | 871,563 | | | $ | 8,699,190 | |
| Cost of revenues | | $ | 6,010,058 | | | $ | 1,291,048 | | | $ | 312,353 | | | $ | 7,613,459 | | | $ | - | | | $ | - | | | $ | 620,259 | | | $ | 3,710,364 | | | $ | 649,968 | | | $ | 4,980,591 | |
| Gross profit | | $ | 1,513,925 | | | $ | 646,148 | | | $ | 1,870,860 | | | $ | 4,030,933 | | | $ | - | | | $ | - | | | $ | 5,138,341 | | | $ | 1,105,086 | | | $ | 221,595 | | | $ | 6,465,022 | |
| Depreciation and amortization | | $ | 120,095 | | | $ | 875 | | | $ | 34,687 | | | $ | 155,657 | | | $ | - | | | $ | - | | | $ | 27,857 | | | $ | 21,510 | | | $ | - | | | $ | 49,367 | |
| Total capital expenditures | | $ | 192,434 | | | $ | - | | | $ | 10,818 | | | $ | 203,252 | | | $ | - | | | $ | - | | | $ | 61,359 | | | $ | 1,053 | | | $ | - | | | $ | 62,412 | |
| Total assets | | $ | 3,094,804 | | | $ | 425,410 | | | $ | 2,193,740 | | | $ | 5,713,954 | | |
| | | For the Year Ended June 30, 2013 | | | For the year ended June 30, 2016 | |
| | | Shipping Agency
Service | | Shipping & Chartering
Services | | Inland Transportation
Management Services | | Total | | | Shipping
Agency and Ship
Management
Services | | Shipping and
Chartering
Services | | Inland
Transportation
Management
Services | | Total | |
| Revenues | | $ | 17,331,759 | | | $ | - | | | $ | - | | | $ | 17,331,759 | | | | | | | | | | |
| - Related party | | | $ | - | | | $ | - | | | $ | 2,269,346 | | | $ | 2,269,346 | |
| - Third parties | | | $ | 2,507,800 | | | $ | 462,218 | | | $ | 2,071,176 | | | $ | 5,041,194 | |
| Cost of revenues | | $ | 15,402,743 | | | $ | - | | | $ | - | | | $ | 15,402,743 | | | $ | 2,175,109 | | | $ | 212,510 | | | $ | 1,350,370 | | | $ | 3,737,989 | |
| Gross profit | | $ | 1,929,016 | | | $ | - | | | $ | - | | | $ | 1,929,016 | | | $ | 332,691 | | | $ | 249,708 | | | $ | 2,990,152 | | | $ | 3,572,551 | |
| Depreciation and amortization | | $ | 198,825 | | | $ | - | | | $ | - | | | $ | 198,825 | | | $ | 45,434 | | | $ | 1,410 | | | $ | 12,664 | | | $ | 59,508 | |
| Total capital expenditures | | $ | 67,116 | | | $ | - | | | $ | - | | | $ | 67,116 | | | $ | 13,537 | | | $ | 2,854 | | | $ | 15,268 | | | $ | 31,659 | |
| Total assets | | $ | 7,536,205 | | | $ | - | | | $ | - | | | $ | 7,536,205 | | |
| | | June 30, | | | June 30, | |
| | | 2017 | | | 2016 | |
| Total assets: | | | | | | |
| Shipping Agency and Ship Management Services | | $ | - | | | $ | 1,271,948 | |
| Shipping and Chartering Services | | | - | | | | 534,896 | |
| Inland Transportation Management Services | | | 15,552,593 | | | | 7,247,300 | |
| Freight Logistic Services | | | 1,704,946 | | | | - | |
| Container Trucking Services | | | 558,482 | | | | - | |
| Total Assets | | $ | 17,816,021 | | | $ | 9,054,144 | |
12.Note 16. OTHER RELATED PARTY TRANSACTIONS
As of June 30, 2017 and 2016, the outstanding amounts due from related party consist of the following:
| | | June 30, | | | June 30, | |
| | | 2017 | | | 2016 | |
| | | | | | | |
| Tianjin Zhiyuan Investment Group Co., Ltd. | | | 1,715,130 | | | | 1,622,519 | |
| Total | | $ | 1,715,130 | | | $ | 1,622,519 | |
In June 2013, the Company signed a 5-yearfive-year global logisticlogistics service agreement with Tianjin Zhiyuan Investment Group Co., Ltd. (the “Zhiyuan Investment Group”) and TEWOO Chemical & Light Industry Zhiyuan Trade Co., Ltd. and TianJin Zhi Yuan(together with Zhiyuan Investment Group, Co., Ltd. (together “Zhiyuan”). TianJin Zhi YuanZhiyuan Investment Group Co., Ltd. is owned by Mr. Zhong Zhang, the largest shareholder of the Company. For the year ended June 30, 2013, the Company had no business transaction with Zhiyuan. During the quarter ended September 30, 2013, the Company executed a shipping and chartering services agreement with Zhiyuan whereby it assisted in the transportation of approximately 51,000 tons of chromite ore from South Africa to China. In September 2013, the Company executed an inland transportation management service contract with the Zhiyuan Investment Group whereby it would provide certain advisory services and help control its potential commodities loss during the transportation process. In addition,As a result of the inland transportation management services provided to Zhiyuan, the Company executed a one-year short-term loan agreement withgenerated revenue of $2,746,423 (24% of the Company’s total revenue in 2017) and $2,269,346 (31% of the Company’s total revenue in 2016) for the years ended June 30, 2017 and 2016, respectively. The amount due from Zhiyuan effective January 1, 2014,Investment Group at June 30, 2016 was $1,622,519. During the year ended June 30, 2017, the Company continued to facilitate the working capital needs ofprovide inland transportation management services to Zhiyuan on an as-needed basis.and collected approximately $2.7 million from Zhiyuan to reduce outstanding accounts receivable. As of June 30, 2014,2017, the net amount due from Zhiyuan was $2,920,950, inclusive$1,715,130, the aging of a non-interest bearing short-term loan of $1,801,709.which is less than 180 days.
As of June 30, 20142017 and 2013,2016, the outstanding amounts of advance to suppliers-related party consist of the following:
| | | June 30, | | | June 30, | |
| | | 2017 | | | 2016 | |
| | | | | | | |
| Zhiyuan International Investment & Holding Group (Hong Kong) Co., Ltd. | | | 3,333,038 | | | | - | |
| Total | | $ | 3,333,038 | | | $ | - | |
On February 18, 2017, Trans Pacific Beijing (subsidiary) and Sino China (VIE) (collectively, the “Seller”), a subsidiary and VIE of the Company, entered into a Cooperative Transportation Agreement (the “Agreement”) with Zhiyuan International Investment & Holding Group (Hong Kong) Co., Ltd. (the “Buyer” or “Zhiyuan Hong Kong”). The Buyer is owed $252,815 and $541,400, respectively, from Sino-G Trading Inc. (“Sino-G”), an entity that isalso owned by Mr. Zhang, the brother-in-lawlargest shareholder of the Company’s CEO. Sino-G previously servedCompany. Pursuant to the Agreement, the Buyer jointly with China Minmetals Corporation and China Metallurgical Group Corporation acts as the general designer, general equipment provider and general service contractor in the upgrade and renovation project of Perwaja Steel Indonesia which is located in Malaysia (the “Project”). The Seller shall be appointed as general agent to handle all related logistics and transportation occurring in the Project.
On July 7, 2017, the Company signed a supplemental agreement with the Buyer, pursuant to which Sino will cooperate with Zhiyuan Hong Kong exclusively on the entire project’s transportation needs. Pursuant to the supplemental agreement, the Company agrees to make prepayments to Zhiyuan Hong Kong for its share of packaging and transporting costs related to the project, in return the Company will receive 15% of its share of the cost incurred in the project from Zhiyuan Hong Kong as a funds transfer agent forservice fee. The project is expected to complete in one to two years and the Company’sCompany will collect is service fee in accordance with project completion.
As of June 30, 2017 and 2016, the outstanding amounts due to related parties consist of the following:
| | | June 30, | | | June 30, | |
| | | 2017 | | | 2016 | |
| | | | | | | |
| ACH Logistic Inc. | | $ | 131,262 | | | $ | - | |
| Jetta Global Logistics Inc. | | | 75,061 | | | | - | |
| Total | | $ | 206,323 | | | $ | - | |
In December 2016, the Company entered into a joint venture agreement with Jetta Global to form ACH Trucking Center to provide short-haul trucking transportation and logistics services to customers located in the New York and New Jersey areas. ACH Logistic Inc. (ACH Logistic) and Jetta Global are invested by the same owner and both of the companies provided freight logistic service and container trucking service to the Company. For the year ended June 30, 2017, ACH Logistic and Jetta Global provided services in Tianjin, PRC. Thethe amount of $788,775 and $222,869 to the Company, expects the entire amount to be repaid without interest during fiscal year 2015.respectively.
13.Note 17. SUBSEQUENT EVENTS
On June 27, 2014,In July 2017 the Company entered into an Underwriting Agreement (the “Underwriting Agreement”)a supplemental agreement with National Securities Corporation (the “Underwriter”) relatingTengda Northwest to extend the registered offering of 572,000 shares of common stock, without par value per share. The price to the public in the offering was $1.76 per share. Under the terms of the Underwriting Agreement,global logistic service period until July 3, 2018.
In August 2017, the Company also grantedentered into a supplemental agreement with Zhiyuan to extend the Underwriter an option, exercisable for 30 days, to purchase up to an additional 85,800 shares of common stock from the Company at the same price to cover over-allotments, if any. The Company closed the public offering on July 2, 2014 and the Underwriter subsequently purchased an additional 75,000 shares. The offering was made pursuant to our effective shelf registration statement on Form S-3 (Registration Statement No. 333-194211) declared effective by the Securities and Exchange Commission on April 15, 2014, as supplemented by an applicable prospectus supplement. The total number of shares sold in the offering was 647,000 shares of common stock.inland transportation management service period until September 1, 2018.
On August 8, 2014,24, 2017, Sino signed a marketing promoting service agreement with COSCO Qingdao. Pursuant to the agreement, COSCO Qingdao will help Sino to promote shipping and multimodal transportation including inland trucking container transportation services, switch bill and freight collection services. On August 24, 2017, Sino has paid $100,000 to COSCO Qingdao for first installment (September 1, 2017 to December 31, 2017) of the marketing expense.
SINO-GLOBAL SHIPPING AMERICA, LTD. AND AFFILIATES
CONDENSED CONSOLIDATED BALANCE SHEETS
(UNAUDITED)
| | | December 31, | | | June 30, | |
| | | 2017 | | | 2017 | |
| | | | | | | |
| Assets | | | | | | |
| Current assets | | | | | | |
| Cash and cash equivalents | | $ | 7,219,848 | | | $ | 8,733,742 | |
| Accounts receivable, less allowance for doubtful accounts of $763,984 and $185,821 as of December 31, 2017 and June 30, 2017, respectively | | | 4,248,363 | | | | 2,569,141 | |
| Other receivables, less allowance for doubtful accounts of $145,279 and $145,244 as of December 31, 2017 and June 30, 2017, respectively | | | 318,827 | | | | 37,811 | |
| Advances to suppliers-third parties | | | 14,611 | | | | 54,890 | |
| Advances to suppliers-related party | | | 3,473,717 | | | | 3,333,038 | |
| Prepaid expenses and other current assets | | | 230,721 | | | | 311,136 | |
| Due from related parties, net | | | 2,372,996 | | | | 1,715,130 | |
| | | | | | | | | |
| Total Current Assets | | | 17,879,083 | | | | 16,754,888 | |
| | | | | | | | | |
| Property and equipment, net | | | 217,335 | | | | 187,373 | |
| Intangible assets, net | | | 184,722 | | | | - | |
| Prepaid expenses | | | - | | | | 6,882 | |
| Other long-term assets | | | 119,059 | | | | 117,478 | |
| Deferred tax assets | | | 1,823,100 | | | | 749,400 | |
| | | | | | | | | |
| Total Assets | | $ | 20,223,299 | | | $ | 17,816,021 | |
| | | | | | | | | |
| Liabilities and Equity | | | | | | | | |
| | | | | | | | | |
| Current Liabilities | | | | | | | | |
| Advances from customers | | $ | 360,744 | | | $ | 369,717 | |
| Accounts payable | | | 506,989 | | | | 206,211 | |
| Taxes payable | | | 2,258,737 | | | | 1,886,216 | |
| Due to related parties | | | - | | | | 206,323 | |
| Accrued expenses and other current liabilities | | | 359,748 | | | | 418,029 | |
| Total Current Liabilities | | | 3,486,218 | | | | 3,086,496 | |
| Income tax payable - noncurrent portion | | | 440,219 | | | | - | |
| Total Liabilities | | | 3,926,437 | | | | 3,086,496 | |
| Commitments and Contingencies | | | | | | | | |
| | | | | | | | | |
| Equity | | | | | | | | |
| Preferred stock, 2,000,000 shares authorized, no par value, none issued. | | | - | | | | - | |
| Common stock, 50,000,000 shares authorized, no par value; 10,611,032 and 10,281,032 shares issued as of December 31, 2017 and June 30, 2017, respectively; 10,435,535 and 10,105,535 outstanding as of December 31, 2017 and June 30, 2017, respectively | | | 20,535,379 | | | | 20,535,379 | |
| Additional paid-in capital | | | 1,032,016 | | | | 688,934 | |
| Treasury stock, at cost, 175,497 shares as of December 31, 2017 and June 30, 2017 | | | (417,538 | ) | | | (417,538 | ) |
| Retained earnings (accumulated deficit) | | | 20,985 | | | | (893,907 | ) |
| Accumulated other comprehensive loss | | | (134,637 | ) | | | (414,564 | ) |
| | | | | | | | | |
| Total Sino-Global Shipping America Ltd. Stockholders' Equity | | | 21,036,205 | | | | 19,498,304 | |
| Non-controlling Interest | | | (4,739,343 | ) | | | (4,768,779 | ) |
| Total Equity | | | 16,296,862 | | | | 14,729,525 | |
| Total Liabilities and Equity | | $ | 20,223,299 | | | $ | 17,816,021 | |
The accompanying notes are an integral part of these unaudited condensed consolidated financial statements
SINO-GLOBAL SHIPPING AMERICA, LTD. AND AFFILIATES
CONDENSED CONSOLIDATED STATEMENTS OF OPERATIONS AND COMPREHENSIVE INCOME
(UNAUDITED)
| | | For the Three Months Ended December 31, | | | For the Six Months Ended December 31, | |
| | | 2017 | | | 2016 | | | 2017 | | | 2016 | |
| | | | | | | | | | | | | |
| Net revenues - third parties | | $ | 4,665,235 | | | $ | 1,511,624 | | | $ | 9,480,086 | | | $ | 2,606,547 | |
| Net revenues - related party | | | 555,246 | | | | 616,924 | | | | 1,120,406 | | | | 1,466,403 | |
| Total revenues | | | 5,220,481 | | | | 2,128,548 | | | | 10,600,492 | | | | 4,072,950 | |
| Cost of revenues | | | (3,375,878 | ) | | | (350,796 | ) | | | (7,041,796 | ) | | | (657,135 | ) |
| Gross profit | | | 1,844,603 | | | | 1,777,752 | | | | 3,558,696 | | | | 3,415,815 | |
| | | | | | | | | | | | | | | | | |
| General and administrative expenses | | | (1,827,014 | ) | | | (776,284 | ) | | | (2,590,371 | ) | | | (1,636,198 | ) |
| Selling expenses | | | (335,261 | ) | | | (46,875 | ) | | | (357,727 | ) | | | (112,184 | ) |
| Total operating expenses | | | (2,162,275 | ) | | | (823,159 | ) | | | (2,948,098 | ) | | | (1,748,382 | ) |
| | | | | | | | | | | | | | | | | |
| Operating income (loss) | | | (317,672 | ) | | | 954,593 | | | | 610,598 | | | | 1,667,433 | |
| | | | | | | | | | | | | | | | | |
| Other income (expense) | | | | | | | | | | | | | | | | |
| Financial income (expense), net | | | 137,799 | | | | (88,470 | ) | | | 222,595 | | | | (91,904 | ) |
| Total other income (expense) | | | 137,799 | | | | (88,470 | ) | | | 222,595 | | | | (91,904 | ) |
| | | | | | | | | | | | | | | | | |
| Net income (loss) before provision for income taxes | | | (179,873 | ) | | | 866,123 | | | | 833,193 | | | | 1,575,529 | |
| | | | | | | | | | | | | | | | | |
| Income tax benefit (expense) | | | 571,121 | | | | (73,391 | ) | | | 274,692 | | | | (145,012 | ) |
| | | | | | | | | | | | | | | | | |
| Net income | | | 391,248 | | | | 792,732 | | | | 1,107,885 | | | | 1,430,517 | |
| | | | | | | | | | | | | | | | | |
| Net income (loss) attributable to non-controlling interest | | | 93,545 | | | | (100,169 | ) | | | 192,993 | | | | (108,104 | ) |
| | | | | | | | | | | | | | | | | |
| Net income attributable to Sino-Global Shipping America, Ltd. | | $ | 297,703 | | | $ | 892,901 | | | $ | 914,892 | | | $ | 1,538,621 | |
| | | | | | | | | | | | | | | | | |
| Comprehensive income | | | | | | | | | | | | | | | | |
| Net income | | $ | 391,248 | | | $ | 792,732 | | | $ | 1,107,885 | | | $ | 1,430,517 | |
| Foreign currency translation income (loss) | | | 97,600 | | | | (104,312 | ) | | | 145,317 | | | | (118,882 | ) |
| Comprehensive income | | | 488,848 | | | | 688,420 | | | | 1,253,202 | | | | 1,311,635 | |
| Less: Comprehensive income attributable to non-controlling interest | | | 20,618 | | | | 21,512 | | | | 61,365 | | | | 24,121 | |
| | | | | | | | | | | | | | | | | |
| Comprehensive income attributable to Sino-Global Shipping America Ltd. | | $ | 468,230 | | | $ | 666,908 | | | $ | 1,191,837 | | | $ | 1,287,514 | |
| | | | | | | | | | | | | | | | | |
| Earnings per share | | | | | | | | | | | | | | | | |
| -Basic | | $ | 0.03 | | | $ | 0.11 | | | $ | 0.09 | | | $ | 0.19 | |
| -Diluted | | $ | 0.03 | | | $ | 0.11 | | | $ | 0.09 | | | $ | 0.18 | |
| | | | | | | | | | | | | | | | | |
| Weighted average number of common shares used in computation | | | | | | | | | | | | | | | | |
| -Basic | | | 10,367,492 | | | | 8,280,535 | | | | 10,236,513 | | | | 8,280,535 | |
| -Diluted | | | 10,415,503 | | | | 8,342,870 | | | | 10,286,683 | | | | 8,318,541 | |
The accompanying notes are an integral part of these unaudited condensed consolidated financial statements
SINO-GLOBAL SHIPPING AMERICA LTD. AND AFFILIATE
CONDENSED CONSOLIDATED STATEMENTS OF CASH FLOWS
(UNAUDITED)
| | | For the six months ended December 31, | |
| | | 2017 | | | 2016 | |
| | | US$ | | | US$ | |
| | | | | | | |
| Cash flows from operating Activities | | | | | | |
| | | | | | | |
| Net income | | $ | 1,107,885 | | | $ | 1,430,517 | |
| Adjustment to reconcile net income to net cash provided by (used in) operating activities: | | | | | | | | |
| Stock - based compensation expense | | | 9,665 | | | | 92,472 | |
| Amortization of stock - based compensation to consultants | | | 333,417 | | | | 529,569 | |
| Depreciation and amortization | | | 31,742 | | | | 25,407 | |
| Provision for (recovery of) doubtful accounts | | | 837,431 | | | | (108,344 | ) |
| Deferred tax benefit | | | (1,073,700 | ) | | | - | |
| Changes in assets and liabilities | | | | | | | | |
| Accounts receivable | | | (2,210,485 | ) | | | 615,324 | |
| Other receivables | | | (234,751 | ) | | | 219,860 | |
| Advances to suppliers - third parties | | | 50,465 | | | | (1,417,731 | ) |
| Prepaid expense and other current assets | | | 80,952 | | | | 42,906 | |
| Other long-term assets | | | - | | | | 5,693 | |
| Due from related parties | | | (921,532 | ) | | | (133,713 | ) |
| Advances from customers | | | (23,001 | ) | | | 369,626 | |
| Accounts payable | | | 288,283 | | | | (309,941 | ) |
| Taxes payable | | | 731,456 | | | | 174,432 | |
| Due to related parties | | | (206,323 | ) | | | - | |
| Accrued expenses and other current liabilities | | | (61,218 | ) | | | 386,381 | |
| | | | | | | | | |
| Net cash provided by (used in) operating activities | | | (1,259,714 | ) | | | 1,922,458 | |
| | | | | | | | | |
| Cash flows from investing Activities | | | | | | | | |
| | | | | | | | | |
| Acquisition of property and equipment | | | (50,278 | ) | | | - | |
| Acquisition of intangible assets | | | (190,000 | ) | | | - | |
| Prepayment for acquisition of intangible assets | | | (10,000 | ) | | | - | |
| | | | | | | | | |
| Net cash used in investing activities | | | (250,278 | ) | | | - | |
| | | | | | | | | |
| Effect of exchange rate fluctuations on cash and cash equivalents | | | (3,902 | ) | | | (14,999 | ) |
| | | | | | | | | |
| Net (decrease) increase in cash and cash equivalents | | | (1,513,894 | ) | | | 1,907,459 | |
| | | | | | | | | |
| Cash and cash equivalents at beginning of period | | | 8,733,742 | | | | 1,385,994 | |
| | | | | | | | | |
| Cash and cash equivalents at end of period | | $ | 7,219,848 | | | $ | 3,293,453 | |
| | | | | | | | | |
| Supplemental information | | | | | | | | |
| Income taxes paid | | $ | 60,162 | | | $ | 6,446 | |
The accompanying notes are an integral part of these unaudited condensed consolidated financial statements
SINO-GLOBAL SHIPPING AMERICA, LTD. AND AFFILIATES
NOTES TO THE CONDENSED CONSOLIDATED FINANCIAL STATEMENTS
(UNAUDITED)
Note 1. ORGANIZATION AND NATURE OF BUSINESS
Founded in the United States (the “U.S.”) in 2001, Sino-Global Shipping America, Ltd., a Virginia corporation (“Sino-Global” or the “Company”), is a non-asset based global shipping and freight logistics integrated solutions provider. The Company provides tailored solutions and value-added services for its customers to drive effectiveness and control in related links throughout the entire shipping and freight logistics chain. The Company conducts its business primarily through its wholly-owned subsidiaries in the U.S., the People’s Republic of China, including Hong Kong (the “PRC”), Australia and Canada. Currently, a significant portion of the Company’s business is generated from clients located in the PRC.
The Company’s Chinese subsidiary, Trans Pacific Shipping Limited, a wholly-owned foreign enterprise (“Trans Pacific Beijing”), is the 90% owner of Trans Pacific Logistics Shanghai Limited (“Trans Pacific Shanghai”). Trans Pacific Beijing and Trans Pacific Shanghai are referred to collectively as “Trans Pacific”.
Prior to fiscal year 2016, the Company’s shipping agency business was operated by its subsidiaries in the PRC. The Company’s shipping management services were operated by its subsidiary in Hong Kong. The Company’s shipping and chartering services were operated by its subsidiaries in the U.S. and subsidiary in Hong Kong. Currently, the Company’s inland transportation management services are operated by its subsidiaries in the PRC, Hong Kong and the U.S. The Company’s freight logistics services are operated by its subsidiaries in the PRC and the U.S. The Company’s container trucking services are currently operated by its subsidiaries in the PRC and through a joint venture in the U.S. The Company’s newly added bulk cargo container trucking services are currently operated by its subsidiary in the U.S. The Company has increased its business in the U.S. since the launch of the short haul container truck services web-based platform in December 2016.
In January 2016, the Company formed a subsidiary, Sino-Global Shipping LA Inc., a California corporation (“Sino LA”), for the purpose of expanding its business to provide freight logistics services to importers who ship goods into the U.S. The Company expects to generate a majority of its revenues from providing inland transportation services and bulk cargo container services in the coming fiscal year.
In fiscal year 2016, affected by worsening market conditions in the shipping industry, the Company’s shipping agency business sector suffered a significant decrease in revenue due to a reduced number of ships served. As a result, the Company has suspended its shipping agency services business. Also as a result of these market condition changes, the Company has suspended its shipping management services business. In addition, in December 2015, the Company suspended its shipping and chartering services business, primarily as a result of the termination of a previously-contemplated vessel acquisition. As of December 31, 2017, the Company’s business segments consist of inland transportation management services, freight logistics services, container trucking services and bulk cargo container services.
In August 2016, the Company’s Board of Directors (the “Board”) authorized management to move forward with the development of a mobile application that will provide a full-service logistics platform between the U.S. and the PRC for short-haul trucking in the U.S.
Sino-Global completed development of a full-service logistics platform as of December 2016. Upon the completion of the platform, the Company signed two significant agreements with COSCO Beijing International Freight Co., Ltd. (“COSFRE Beijing”) and Sino-Trans Guangxi in December 2016. Pursuant to the agreement with COSFRE Beijing, the Company will receive a percentage of the total amount of each transportation fee for the arrangement of inland transportation services for COSFRE Beijing’s container shipments into U.S. ports. For the strategic cooperation framework agreement with Sino-Trans Guangxi, which is a subsidiary of Sino-Trans Limited, the Company expects to utilize both parties’ existing resources and establish an integrated logistics plan to provide an end-to-end supply chain solution for customers shipping soybeans and sulfur products from the U.S. to southern PRC via container.
On January 5, 2017, the Company entered into a joint venture agreement and formed a new joint venture company named ACH Trucking Center Corp. (“ACH Center”) with Jetta Global Logistics Inc. (“Jetta Global”). Along with the establishment of ACH Center, the Company began providing short haul trucking transportation and logistics services to customers located in the New York and New Jersey areas. The Company holds a 51% ownership stake in ACH Center. Although the establishment of ACH Center brought benefit for the Company and Jetta Global, it could not satisfy long term development for both the Company and Jetta Global. The Company signed a termination agreement with Jetta Global to terminate the joint venture agreement on December 4, 2017. As ACH center’s operating revenue was less than 1% of the Company’s consolidated revenue and the termination did not constitute a strategic shift that will have a major effect on the Company’s operations and financial results, the results of operations for ACH Center was not reported as discontinued operations under the guidance of Accounting Standards Codification 205.
On January 9, 2017, the Company entered into a strategic cooperation agreement with China Ocean Shipping Agency Qingdao Co. Ltd. (“COSCO Qingdao”). COSCO Qingdao will utilize the Company’s full-service logistics platform to arrange the transportation of its container shipments into U.S. ports. Sino-Global will receive a percentage of the total amount of each transportation fee in exchange for the arrangement of inland transportation services for COSCO Qingdao’s container shipments into U.S. ports.
On February 18, 2017, the Company entered into a cooperative transportation agreement with a related party, Zhiyuan International Investment & Holding Group (Hong Kong) Co., Ltd. (the “Buyer” or “Zhiyuan Hong Kong”). Zhiyuan Hong Kong, jointly with China Minmetals Corporation and China Metallurgical Group Corporation, acts as the general designer, general equipment provider and general service contractor in the upgrade and renovation project of Perwaja Steel, located in Malaysia (the “Project”). The Company agreed to provide high-quality services, including the design of a detailed transportation plan as well as execution and necessary supervision of the plan at Zhiyuan Hong Kong’s demand, in consideration for which the Company will receive a 1% to 1.25% transportation fee incurred in the Project as a commission for its services rendered (see Note 3 and Note 15). On July 7, 2017, the Company signed a supplemental agreement with the Buyer, pursuant to which the Company will cooperate with Zhiyuan Hong Kong exclusively on the entire Project’s transportation needs. Pursuant to the supplemental agreement, the Company agrees to make prepayments to Zhiyuan Hong Kong for its share of packaging and transporting costs related to the Project; in return, the Company will receive 15% of the cost incurred in the Project from Zhiyuan Hong Kong as a service fee. The Project is expected to be completed in one to two years and the Company will collect its service fee in accordance with Project completion.
On September 11, 2017, the Company set up a new wholly-owned subsidiary, Ningbo Saimeinuo Supply Chain Management Ltd. (“Sino Ningbo”), via the wholly-owned entity, Sino-Global Shipping New York Inc. This subsidiary primarily engages in supply chain management and freight logistics services.
Note 2. SUMMARY OF SIGNIFICANT ACCOUNTING POLICIES
(a) Basis of Presentation
The accompanying unaudited condensed consolidated financial statements have been prepared in accordance with accounting principles generally accepted in the United States of America (“US GAAP”) for information pursuant to the rules and regulations of the Securities Exchange Commission (“SEC”).
In the opinion of management, all adjustments, consisting only of normal recurring adjustments, considered necessary to give a fair presentation have been included. Interim results are not necessarily indicative of results of a full year. The information in this Form 10-Q should be read in conjunction with information included in the annual report for the fiscal year ended June 30, 2017 on Form 10-K filed with the SEC on September 27, 2017.
(b) Basis of Consolidation
The unaudited condensed consolidated financial statements include the accounts of the Company, its subsidiaries, and its affiliates. All significant intercompany transactions and balances are eliminated in consolidation. A subsidiary is an agreemententity in which the Company, directly or indirectly, controls more than one half of the voting power or has the power to: govern the financial and operating policies; appoint or remove the majority of the members of the board of directors; cast a majority of votes at the meeting of the board of directors.
U.S. GAAP provides guidance on the identification of variable interest entity (“VIE”) and financial reporting for entities over which control is achieved through means other than voting interests. The Company evaluates each of its interests in an entity to acquiredetermine whether or not the investee is a VIE and, if so, whether the Company is the primary beneficiary of such VIE. In determining whether the Company is the primary beneficiary, the Company considers if the Company (1) has power to direct the activities that most significantly affects the economic performance of the VIE, and (2) receives the economic benefits of the VIE that could be significant to the VIE. If deemed the primary beneficiary, the Company consolidates the VIE. Sino-Global Shipping Agency Ltd., a PRC corporation (“Sino-China”), is considered a VIE, with the Company as the primary beneficiary. The Company, through Trans Pacific Beijing, entered into certain agreements with Sino-China, pursuant to which the Company receives 90% of Sino-China’s net income. The Company does not receive any payments from Sino-China unless Sino-China recognizes net income during its fiscal year.
As a VIE, Sino-China’s revenues are included in the Company’s total revenues, and any loss from operations is consolidated with that of the Company. Because of contractual arrangements between the Company and Sino-China, the Company has a pecuniary interest in Sino-China that requires consolidation of the financial statements of the Company and Sino-China.
The Company has consolidated Sino-China’s operating results because the entities are under common control in accordance with ASC 805-10, “Business Combinations”. The agency relationship between the Company and Sino-China and its branches is governed by a series of contractual arrangements pursuant to which the Company has substantial control over Sino-China. Management makes ongoing reassessments of whether the Company remains the primary beneficiary of Sino-China. As mentioned elsewhere in this report, due to the worsening market conditions in the shipping industry, Sino-China’s shipping agency business suffered a significant decrease in revenue due to a reduced number of ships served. As a result, the Company has temporarily suspended this business. Sino-China is also providing services in other related business segments of the Company.
The carrying amount and classification of Sino-China’s assets and liabilities included in the Company’s unaudited condensed consolidated balance sheets were as follows:
| | | December 31, | | | June 30, | |
| | | 2017 | | | 2017 | |
| | | | | | | |
| Total current assets | | $ | 9,736,634 | | | $ | 9,327,990 | |
| Total assets | | | 9,877,880 | | | | 9,472,651 | |
| Total current liabilities | | | 6,279 | | | | 4,517 | |
| Total liabilities | | | 6,279 | | | | 4,517 | |
(c) Fair Value of Financial Instruments
We follow the provisions of ASC 820, Fair Value Measurements and Disclosures, which clarifies the definition of fair value, prescribes methods for measuring fair value, and establishes a fair value hierarchy to classify the inputs used in measuring fair value as follows:
Level 1 — Observable inputs such as unadjusted quoted prices in active markets for identical assets or liabilities available at the measurement date.
Level 2 — Inputs other than quoted prices that are observable for the asset or liability in active markets, quoted prices for identical or similar assets and liabilities in markets that are not active, inputs other than quoted prices that are observable, and inputs derived from or corroborated by observable market data.
Level 3 — Unobservable inputs that reflect management’s assumptions based on the best available information.
The carrying value of accounts receivable, other receivables, other current assets and current liabilities approximate their fair values because of the short-term nature of these instruments.
(d) Use of Estimates and Assumptions
The preparation of the Company’s unaudited condensed consolidated financial statements in conformity with U.S. GAAP requires management to make estimates and assumptions that affect the reported amounts of assets and liabilities and disclosure of contingent assets and liabilities at the dates of the financial statements and the reported amounts of revenues and expenses during the reporting periods. Estimates are adjusted to reflect actual experience when necessary. Significant accounting estimates reflected in the Company’s unaudited condensed consolidated financial statements include revenue recognition, fair value of stock based compensation, cost of revenues, allowance for doubtful accounts, deferred income taxes, and the useful lives of property and equipment. Since the use of estimates is an integral component of the financial reporting process, actual results could differ from those estimates.
(e) Translation of Foreign Currency
The accounts of the Company and its subsidiaries, including Sino-China and each of its branches are measured using the currency of the primary economic environment in which the entity operates (the “functional currency”). The Company’s functional currency is the U.S. dollar (“USD”) while its subsidiaries in the PRC, including Sino-China, report their financial positions and results of operations in Renminbi (“RMB”). The accompanying unaudited condensed consolidated financial statements are presented in USD. Foreign currency transactions are translated into USD using the fixed exchange rates in effect at the time of the transaction. Generally, foreign exchange gains and losses resulting from the settlement of such transactions are recognized in the unaudited condensed consolidated statements of operations. The Company translates the foreign currency financial statements of Sino-China, Sino-Global Shipping Australia, Sino-Global Shipping Hong Kong, Sino-Global Shipping Canada, Trans Pacific Beijing, Trans Pacific Shanghai and Sino Ningbo in accordance with ASC 830-10, “Foreign Currency Matters”. Assets and liabilities are translated at current exchange rates quoted by the People’s Bank of China at the balance sheet dates and revenues and expenses are translated at average exchange rates in effect during the year. The resulting translation adjustments are recorded as other comprehensive income (loss) and accumulated other comprehensive loss as a separate component of equity of the Company, and also included in non-controlling interests.
The exchange rates as of December 31, 2017 and June 30, 2017 and for the three and six months ended December 31, 2017 and 2016 are as follows:
| | | December 31, | | | June 30, | | | Three months ended
December 31, | | | Six months ended
December 31, | |
| | | 2017 | | | 2017 | | | 2017 | | | 2016 | | | 2017 | | | 2016 | |
| Foreign currency | | Balance
Sheet | | | Balance
Sheet | | | Profits/Loss | | | Profits/Loss | | | Profits/Loss | | | Profits/Loss | |
| RMB:1USD | | | 6.5060 | | | | 6.7806 | | | | 6.6153 | | | | 6.8328 | | | | 6.6428 | | | | 6.7498 | |
| AUD:1USD | | | 1.2797 | | | | 1.3028 | | | | 1.3007 | | | | 1.3357 | | | | 1.2838 | | | | 1.3275 | |
| HKD:1USD | | | 7.8118 | | | | 7.8059 | | | | 7.8076 | | | | 7.7576 | | | | 7.8112 | | | | 7.7571 | |
| CAD:1USD | | | 1.2573 | | | | 1.2982 | | | | 1.2702 | | | | 1.3351 | | | | 1.2620 | | | | 1.3198 | |
(f) Cash and Cash Equivalents
Cash and cash equivalents consist of cash on hand and other highly liquid investments which are unrestricted as to withdrawal or use, and which have an original maturity of three months or less when purchased. The Company maintains cash and cash equivalents with various financial institutions mainly in the PRC, Australia, Hong Kong, Canada and the U.S. As of December 31, 2017 and June 30, 2017, cash balances of $6,812,501 and $6,246,337, respectively, were maintained at financial institutions in the PRC, which were not insured by any of the Chinese authorities. As of December 31, 2017 and June 30, 2017, cash balance of $364,722 and $2,462,792, respectively, were maintained at U.S. financial institutions, and were insured by the Federal Deposit Insurance Corporation or other programs subject to certain limitations.
(g) Accounts Receivable and Allowance for Doubtful Accounts
Accounts receivable are presented at net realizable value. The Company maintains allowances for doubtful accounts and for estimated losses. The Company reviews the accounts receivable on a periodic basis and makes general and specific allowances when there is doubt as to the collectability of individual receivable balances. In evaluating the collectability of individual receivable balances, the Company considers many factors, including the age of the balances, customers’ historical payment history, their current credit-worthiness and current economic trends. Receivables are considered past due after 180 days. Accounts Receivable are written off against the allowances only after exhaustive collection efforts.
(h) Property and Equipment, net
Net property and equipment are stated at historical cost less accumulated depreciation. Historical cost comprises the asset’s purchase price and any directly attributable costs of bringing the asset to its working condition and location for its intended use. Depreciation is calculated on a straight-line basis over the following estimated useful lives:
| Buildings | | 20 years |
| Motor vehicles | | 5-10 years |
| Furniture and office equipment | | 3-5 years |
| Leasehold improvements | | Shorter of lease term or useful life |
The carrying value of a long-lived asset is considered impaired by the Company when the anticipated undiscounted cash flows from such asset are less than the asset’s carrying value. If impairment is identified, a loss is recognized based on the amount by which the carrying value exceeds the fair value of the long-lived asset. Fair value is determined primarily using the anticipated cash flows discounted at a rate commensurate with the risk involved or based on independent appraisals. Management has determined that there were no impairments as of the balance sheet dates.
(i) Intangible Assets, net
Intangible assets are recorded at cost less accumulated amortization. Amortization is calculated on a straight-line basis over the following estimated useful lives:
The Company evaluates intangible assets for impairment whenever events or changes in circumstances indicate that the assets might be impaired. There was no such impairment as of December 31, 2017.
(j) Revenue Recognition
Revenue is recognized when all of the equityfollowing have occurred: (i) persuasive evidence of Longhe Ship Management (Hong Kong) Co.an arrangement exists, (ii) delivery has occurred or services have been rendered, (iii) the price is fixed or determinable, and (iv) the ability to collect is reasonably assured
| ● | Revenues from inland transportation management services are recognized when commodities are being released from the customers’ warehouse. |
| | |
| ● | Revenues from freight logistics services are recognized when the related contractual services are rendered. |
| | |
| ● | Revenues from container trucking services are recognized when the related contractual services are rendered. |
| | |
| ● | Revenues from bulk cargo container services are recognized when the related contractual services are rendered. |
Bulk cargo container services included shipping of products, arranging cargo container shipping from U.S. to China port, then from China port to end user. Revenue is recognized upon completion of shipping arrangements agreed with customers, either at customer’s designated port or final destination.
(k) Taxation
Because the Company and its subsidiaries and Sino-China are incorporated in different jurisdictions, they file separate income tax returns. The Company uses the asset and liability method of accounting for income taxes in accordance with U.S. GAAP. Deferred taxes, if any, are recognized for the future tax consequences of temporary differences between the tax basis of assets and liabilities and their reported amounts in the unaudited condensed consolidated financial statements. A valuation allowance is provided against deferred tax assets if it is more likely than not that the asset will not be utilized in the future.
The Company recognizes the tax benefit from an uncertain tax position only if it is more likely than not that the tax position will be sustained on examination by the taxing authorities, based on the technical merits of the position. The Company recognizes interest and penalties, if any, related to unrecognized tax benefits as income tax expense.
Income tax returns for the years prior to 2014 are no longer subject to examination by U.S. tax authorities.
On December 22, 2017, the “Tax Cuts and Jobs Act” (“The Act”) was enacted. Under the provisions of The Act, the U.S. corporate tax rate decreased from 35% to 21%. Since the Company has a June 30 fiscal year-end, the U.S. statutory federal blended rate will be approximately 28% for our fiscal year ending June 30, 2018, and 21% for subsequent fiscal years. Additionally, the Tax Act imposes a one-time transition tax on deemed repatriation of historical earnings of foreign subsidiaries, and future foreign earnings are subject to U.S. taxation. The change in rate has caused the Company to re-measure all U.S. deferred income tax assets and liabilities for temporary differences using the blended rate. Net operating loss (“NOL”) carryforwards are limited to 80% of taxable income and can be carried forward indefinitely.
PRC Enterprise Income Tax
PRC enterprise income tax is calculated based on taxable income determined under the PRC Generally Accepted Accounting Principles (“PRC GAAP”) at 25%. Sino-China and Trans Pacific are registered in PRC and governed by the Enterprise Income Tax Laws of the PRC.
PRC Business Tax and Surcharges
Revenues from services provided by the Company’s PRC subsidiaries and affiliates, including Sino-China and Trans Pacific are subject to the PRC business tax of 5%. Business tax and surcharges are paid on gross revenues generated minus the costs of services which are paid on behalf of the customers.
Enterprises or individuals who sell commodities, engage in services or selling of goods in the PRC are subject to a value added tax (“VAT”) in accordance with PRC laws. All of the Company’s revenue generated in the PRC are subject to a VAT on the gross sales price. The VAT rates are 6% and 11%, Limited (“LSM”depending on the type of services provided. The Company is entitled to a deduction or offset for VAT paid on the services rendered by the vendors against the VAT when the Company engage in services.
In addition, under PRC regulations, the Company’s PRC subsidiaries and affiliates are required to pay city construction taxes (7%) from Mr. Deming Wangand education surcharges (3%) based on calculated business tax payments.
The Company’s PRC subsidiaries and affiliates report revenues net of PRC’s VAT, business tax and surcharges for all the periods presented in the consolidated statements of operations.
(l) Earnings per Share
Basic earnings per share is computed by dividing net income attributable to further broaden its service platform and ship management business. Mr. Deming Wang is a shareholderholders of common shares of the Company who held approximately 3.6%by the weighted average number of common shares of the Company outstanding during the applicable period. Diluted earnings per share reflect the potential dilution that could occur if securities or other contracts to issue common shares of the Company were exercised or converted into common shares of the Company. Common share equivalents are excluded from the computation of diluted earnings per share if their effects would be anti-dilutive.
For the three and six months ended December 31, 2017, the basic average shares outstanding and diluted average shares of the Company outstanding were not the same because the effect of potential shares of common stock of the Company was dilutive since the exercise prices for options were lower than the average market price for the related periods. For the three and six months ended December 31, 2017, a total of 48,011 and 50,170 unexercised options were dilutive, respectively, and were included in the computation of diluted earnings per share. For the three and six months ended December 31, 2016, a total of 62,335 and 38,006 unexercised options were dilutive, respectively, and were included in the computation of diluted EPS.
(m) Comprehensive Income (loss)
The Company reports comprehensive income (loss) in accordance with the Financial Accounting Standards Board (“FASB”) issued authoritative guidance which establishes standards for reporting comprehensive income (loss) and its component in financial statements. Comprehensive income (loss), as defined, includes all changes in equity during a period from non-owner sources.
(n) Stock-based Compensation
Stock-based payment transactions with employees are measured on the grant-date fair value of the equity instrument issued and recognized as compensation expense over the requisite service period. Valuations are based upon highly subjective assumptions about the future, including stock price volatility and exercise patterns. The fair value of share-based payment awards was estimated using the Black-Scholes option pricing model. Expected volatilities are based on the historical volatility of the Company’s stock. The Company uses historical data to estimate option exercise and employee terminations. The expected term of options granted represents the period of time that options granted are expected to be outstanding. The risk-free rate for periods within the expected life of the option is based on the U.S. Treasury yield curve in effect at the time of the acquisition agreement. Undergrant.
(o) Risks and Uncertainties
The Company’s business, financial position and results of operations may be influenced by the political, economic, and legal environments in the PRC, as well as by the general state of the PRC economy. The Company’s operations in the PRC are subject to special considerations and significant risks not typically associated with companies in North America and Western Europe. These include risks associated with, among others, the political, economic and legal environment and foreign currency exchange. The Company’s results may be adversely affected by changes in the political, regulatory and social conditions in the PRC, and by changes in governmental policies or interpretations with respect to laws and regulations, anti-inflationary measures, currency conversion, remittances abroad, and rates and methods of taxation, among other things. Moreover, the Company’s ability to grow its business and maintain its profitability could be negatively affected by the nature and extent of services provided to its major customers, Tianjin Zhiyuan Investment Group Co., Ltd. (the “Zhiyuan Investment Group”) and Tengda Northwest Ferroalloy Co., Ltd. (“Tengda Northwest”).
(p) Reclassification
Certain prior period amounts have been reclassified to conform to the current period presentation, including reclassification of $125,755 amortization of stock-based compensation to consultants as prepaid expense and other current assets, and reclassification of $504,815 revenue and $390,719 cost of revenue from freight logistics service segment to bulk cargo container service segment. These reclassifications have no effect on the results of operations and cash flows.
(q) Recent Accounting Pronouncements
Revenue Recognition:In May 2014, the FASB issued Accounting Standards Update No. 2014-09,Revenue from Contracts with Customers: Topic606 (ASU 2014-09), to supersede nearly all existing revenue recognition guidance under U.S. GAAP. The core principle of ASU 2014-09 is to recognize revenues when promised goods or services are transferred to customers in an amount that reflects the consideration that is expected to be received for those goods or services. ASU 2014-09 defines a five step process to achieve this core principle and, in doing so, it is possible more judgment and estimates may be required within the revenue recognition process than are required under existing U.S. GAAP, including identifying performance obligations in the contract, estimating the amount of variable consideration to include in the transaction price and allocating the transaction price to each separate performance obligation. ASU 2014-09 is effective for the Company in the first quarter of fiscal year 2018 using either of two methods: (i) retrospective to each prior reporting period presented with the option to elect certain practical expedients as defined within ASU 2014-09 (full retrospective method); or (ii) retrospective with the cumulative effect of initially applying ASU 2014-09 recognized at the date of initial application and providing certain additional unaudited condensed as defined per ASU 2014-09 (modified retrospective method). The Company is currently assessing the impact to its unaudited condensed financial statements, and has not yet selected a transition approach.
Leases: In February 2016, the FASB issued ASU No. 2016-02, Leases (Topic 842) (“ASU 2016-2”), which provides guidance on lease amendments to the FASB Accounting Standard Codification. This ASU will be effective for us beginning in December 15, 2018. The Company is currently in the process of evaluating the impact of the adoption of ASU 2016-2 on unaudited condensed financial statements.
Statement of Cash Flows:In August 2016, the FASB issued ASU 2016-15, Statement of Cash Flows (Topic 230): The amendments in this Update apply to all entities, including both business entities and not-for-profit entities that are required to present a statement of cash flows under Topic 230. The amendments in this Update provide guidance on the following eight specific cash flow issues. The amendments are an improvement to GAAP because they provide guidance for each of the eight issues, thereby reducing the current and potential future diversity in practice described above. ASU 2016-15 is effective for the Company for fiscal years beginning after December 15, 2017, including interim periods within those fiscal years. Early adoption is permitted, including adoption in an interim period. The Company is still evaluating the effect that this guidance will have on the Company’s unaudited condensed financial statements and related disclosures.
Business Combination: In January 2017, the FASB issued Accounting Standards Update No. 2017-01,Business Combinations (Topic 805): Clarifying the Definition of a Business(ASU 2017-01), which revises the definition of a business and provides new guidance in evaluating when a set of transferred assets and activities is a business. This guidance will be effective in the fiscal year beginning after December 15, 2017 and interim periods within those periods on a prospective basis, and early adoption is permitted. The Company does not expect the standard to have a material impact on its consolidated financial statements.
Stock-based Compensation: In May 2017, the FASB issued ASU No. 2017-09, “Compensation—Stock compensation (Topic 718): Scope of modification accounting” (“ASU 2017-09”). The purpose of the amendment is to clarify which changes to the terms or conditions of a share-based payment award require an entity to apply modification accounting. For all entities that offer share based payment awards, ASU 2017-09 is effective for interim and annual reporting periods beginning after December 15, 2017. The Company is currently assessing the impact of ASU 2017-09 on its unaudited condensed financial statements.
Stock-based Compensation: In July 2017, the FASB issued ASU 2017-11, “Earnings Per Share (Topic 260)”, Distinguishing Liabilities from Equity (Topic 480), Derivatives and Hedging (Topic 815). The amendments in Part I of this Update change the classification analysis of certain equity-linked financial instruments (or embedded features) with down round features. When determining whether certain financial instruments should be classified as liabilities or equity instruments, a down round feature no longer precludes equity classification when assessing whether the instrument is indexed to an entity’s own stock. The amendments also clarify existing disclosure requirements for equity-classified instruments. The amendments in Part II of this Update recharacterize the indefinite deferral of certain provisions of Topic 480 that now are presented as pending content in the Codification, to a scope exception. Those amendments do not have an accounting effect. For public business entities, the amendments in Part I of this Update are effective for fiscal year and interim periods within those fiscal years, beginning after December 15, 2018. Early adoption is permitted for all entities, including adoption in an interim period. If an entity early adopts the amendments in an interim period, any adjustments should be reflected as of the beginning of the fiscal year that includes that interim period. The Company does not expect that the adoption of this guidance will have a material impact on its unaudited condensed financial statements.
Revenue Recognition and Leases: In September 2017, the FASB issued ASU 2017-13, Revenue from Contracts with Customers (Topic 606) and Leases (Topic 842). The main objective of this pronouncement is to clarify the effective date of the adoption of ASC Topic 606 and ASC Topic 842 and the definition of public business entity as stipulated in ASU 2014-09 and ASU 2016-02. ASU 2014-09 provides that a public business entity and certain other specified entities adopt ASC Topic 606 for annual reporting periods beginning after December 15, 2017, including interim reporting periods within that reporting period. All other entities are required to adopt ASC Topic 606 for annual reporting periods beginning after December 15, 2018, and interim reporting periods within annual reporting periods beginning after December 15, 2019. ASU 2016-12 requires that “a public business entity and certain other specified entities adopt ASC Topic 842 for fiscal years beginning after December 15, 2018, and interim periods within those fiscal years. All other entities are required to adopt ASC Topic 842 for fiscal years beginning after December 15, 2019, and interim periods within fiscal years beginning after December 15, 2020”. ASU 2017-13 clarifies that the SEC would not object to certain public business entities electing to use the non-public business entities effective dates for applying ASC 606 and ASC 842. ASU 2017-13, however, limits such election to certain public business entities that “otherwise would not meet the definition of a public business entity except for a requirement to include or inclusion of its financial statements or financial information in another entity’s filings with the SEC”. Management does not expect the adoption of ASU 2017-13 to have any material impact on its financial positions and results of operations or cash flows.
Except for the ASU’s described above, no ASU’s are expected to have a material impact on the unaudited condensed consolidated financial statements upon adoption.
Note 3. ADVANCES TO SUPPLIERS
The Company’s advances to third - party suppliers are as follows:
| | | December 31, | | | June 30, | |
| | | 2017 | | | 2017 | |
| | | | | | | |
| Intelligent logistics system deposit | | $ | 10,000 | | | $ | - | |
| Freight fees | | | - | | | | 29,960 | |
| Other | | | 4,611 | | | | 24,930 | |
| Total advances to suppliers - third parties | | $ | 14,611 | | | $ | 54,890 | |
On December 27, 2017, with the approval of the Board of Directors, the Company signed a contract with Tianjin Anboweiye Technology Ltd Co. (“Tianjin Anboweiye”), to develop a more complete and intelligent logistics system based on the Company’s current container trucking platform. The purpose is to help the Company make better connections with the system used by state-owned companies in China, and to satisfy such state-owned companies’ demand for container trucks in the United States.
As of December 31, 2017, advances to third-party suppliers were primarily related to freight logistics services.
The Company’s advances to related-party suppliers are as follows:
| | | December 31, | | | June 30, | |
| | | 2017 | | | 2017 | |
| | | | | | | |
| Freight fees | | $ | 3,473,717 | | | $ | 3,333,038 | |
| Total advances to suppliers - related party | | $ | 3,473,717 | | | $ | 3,333,038 | |
As discussed in Note 1, on February 18, 2017, the Company entered into a cooperative transportation agreement with Zhiyuan Hong Kong. Zhiyuan Hong Kong is owned by the Company’s largest shareholder. On July 7, 2017, the Company signed a supplemental agreement, pursuant to which the Company will cooperate with Zhiyuan Hong Kong exclusively on the entire Project’s transportation needs. Pursuant to the supplemental agreement, the Company agrees to make prepayments to Zhiyuan Hong Kong for its share of packaging and transporting costs related to the Project; in return the Company will receive 15% of the cost incurred in the Project from Zhiyuan Hong Kong as a service fee. The Project is expected to be completed in one to two years, and the Company will collect its service fee in accordance with Project completion. As of December 31, 2017, no cost was recognized under this Project. No additional freight fees were advanced during the three and six months ended December 31, 2017.
Note 4. ACCOUNTS RECEIVABLE, NET
The Company’s net accounts receivable is as follows:
| | | December 31, | | | June 30, | |
| | | 2017 | | | 2017 | |
| | | | | | | |
| Trade accounts receivable | | $ | 5,012,347 | | | $ | 2,754,962 | |
| Less: allowances for doubtful accounts | | | (763,984 | ) | | | (185,821 | ) |
| Accounts receivables, net | | $ | 4,248,363 | | | $ | 2,569,141 | |
Movement of allowance for doubtful accounts is as follows:
| | | Six months ended December 31, 2017 | | | Year ended June 30,
2017 | |
| | | | | | | |
| Beginning balance | | $ | 185,821 | | | $ | 207,028 | |
| Provision for doubtful accounts | | | 598,403 | | | | - | |
| Less: write-off/recovery | | | (24,638 | ) | | | (18,912 | ) |
| Exchange rate effect | | | 4,398 | | | | (2,295 | ) |
| Ending balance | | $ | 763,984 | | | $ | 185,821 | |
Note 5. PREPAID EXPENSES AND OTHER ASSETS
The Company’s prepaid expenses and other current assets are as follows:
| | | December 31, | | | June 30, | |
| | | 2017 | | | 2017 | |
| | | | | | | |
| Consultant fees (1) | | $ | 79,075 | | | $ | 158,150 | |
| Advance to employees | | | 57,859 | | | | 64,160 | |
| Other | | | 93,787 | | | | 95,708 | |
| Total | | | 230,721 | | | | 318,018 | |
| Less: current portion | | | 230,721 | | | | 311,136 | |
| Total noncurrent portion | | $ | - | | | $ | 6,882 | |
(1) The Company entered into a management consulting services agreement with a consulting company on November 12, 2015, pursuant to which the consulting company shall assist the Company with its regulatory filings during the period from July 1, 2016 to June 30, 2018. In return for its services, as approved by the Board, a total of RMB 2,100,000 ($316,298) was paid to the consulting company. The above-mentioned consulting fees have been and will be ratably charged to expense over the terms of the acquisition agreement, the purchase priceabove-mentioned agreement.
Note 6. PROPERTY AND EQUIPMENT, NET
The Company’s net property and equipment as follows:
| | | December 31, | | | June 30, | |
| | | 2017 | | | 2017 | |
| | | | | | | |
| Buildings | | $ | 206,891 | | | $ | 198,512 | |
| Motor vehicles | | | 608,862 | | | | 542,471 | |
| Computer equipment | | | 156,826 | | | | 155,141 | |
| Office equipment | | | 78,273 | | | | 66,097 | |
| Furniture and fixtures | | | 166,372 | | | | 163,219 | |
| System software | | | 122,479 | | | | 117,733 | |
| Leasehold improvements | | | 65,511 | | | | 62,857 | |
| | | | | | | | | |
| Total | | | 1,405,214 | | | | 1,306,030 | |
| | | | | | | | | |
| Less: Accumulated depreciation | | | 1,187,879 | | | | 1,118,657 | |
| | | | | | | | | |
| Property and equipment, net | | $ | 217,335 | | | $ | 187,373 | |
Depreciation expense for the equitythree months ended December 31, 2017 and 2016 were $13,261 and $12,065, respectively.
Depreciation expense for the six months ended December 31, 2017 and 2016 were $26,464 and $25,407, respectively.
Note 7. INTANGIBLE ASSETS, NET
Intangible assets consisted of LSM willthe following:
| | | December 31, | | | June 30, | |
| | | 2017 | | | 2017 | |
| | | | | | | |
| Full service logistics platforms | | $ | 190,000 | | | $ | - | |
| | | | | | | | | |
| Less: Accumulated amortization | | | 5,278 | | | | - | |
| | | | | | | | | |
| Intangible asset, net | | $ | 184,722 | | | $ | - | |
As a part of the above-mentioned intelligent logistics system (see Note 3), four information platforms were completed by the Tianjin Anboweiye research team in November 2017 and placed into service. The platforms are being amortized over five years.
Amortization expense of intangible assets amounted to $5,278 and $nil for the three and six months ended December 31, 2017 and 2016, respectively.
Note 8. STOCK-BASED COMPENSATION
The issuance of the Company’s options is exempted from registration under of the Securities Act of 1933, as amended (the “Act”). The Common Stock underlying the Company’s options granted may be between 20,000 and 200,000 sharessold in compliance with Rule 144 under the Act. Each option may be exercised to purchase one share of the common stock of the Company, dependingno par value per share (the “Common Stock”). Payment for the options may be made in cash or by exchanging shares of Common Stock at their fair market value. The fair market value will be equal to the average of the highest and lowest registered sales prices of Company Stock on the net incomedate of LSM from July 4, 2014 throughexercise.
The term of the options granted in 2009 is for 10 years and the exercise price of the 56,000 options is $7.75 which vested over 5 years and were fully vested as of December 31, 2014.2017. The fair value of the stock options was estimated using the Black-Scholes option-pricing model.
The term of the 10,000 options granted in 2013 is 10 years and the exercise is $2.01. The fair value of the 10,000 stock options was calculated at the grant date using the Black-Scholes option-pricing model with the following assumptions: volatility of 452.04%, risk free interest rate of 0.88% and expected life of 10 years. The total fair value of the options was $19,400. In accordance with the vesting periods, the Company recorded no stock-based compensation expense for the three and six months ended December 31, 2017 and 2016. As of December 31, 2017, 8,000 options were vested.
Pursuant to the Company’s 2014 Stock Incentive Plan, effective on July 26, 2016, the Company granted options to purchase a total of 150,000 shares of the Company’s Common Stock to two employees with a one-year vesting period, one half of which vested on October 26, 2016, and the other half vested on July 26, 2017. The exercise price of the options is $1.10, which was equal to the share price of the Company’s Common Stock on July 26, 2016. The grant date fair value of such options was $0.77 per share. The fair value of the options was calculated using the Black-Scholes options pricing model with the following assumptions: volatility of 99.68%, risk free interest rate of 1.15%, and expected life of 5 years. The total fair value of the options was $115,979. In accordance with the vesting periods, $nil and $28,995 were expensed related to these options for the three months ended December 31, 2017 and 2016, respectively. $9,665 and $48,325 were expensed related to these options for the six months ended December 31, 2017 and 2016, respectively. In February 2017, 75,000 of these options were exercised by the two employees of the Company.
A summary of the options is presented in the table below:
| | | Shares | | | Weighted Average
Exercise Price | |
| | | | | | | |
| Options outstanding, as of June 30, 2017 | | | 141,000 | | | $ | 3.81 | |
| Granted | | | - | | | | - | |
| Exercised | | | - | | | | - | |
| Cancelled | | | - | | | | - | |
| | | | | | | | | |
| Options outstanding, as of December 31, 2017 | | | 141,000 | | | $ | 3.81 | |
| | | | | | | | | |
| Options exercisable, as of December 31, 2017 | | | 139,000 | | | $ | 3.83 | |
Following is a summary of the status of options outstanding and exercisable as of December 31, 2017
| Outstanding Options | | Exercisable Options |
| Exercise Price | | | Number | | | Average
Remaining
Contractual Life | | Average
Exercise
Price | | | Number | | | Average
Remaining
Contractual
Life |
| $ | 7.75 | | | | 56,000 | | | 0.38 years | | $ | 7.75 | | | | 56,000 | | | 0.38 years |
| $ | 2.01 | | | | 10,000 | | | 5.08 years | | $ | 2.01 | | | | 8,000 | | | 5.08 years |
| $ | 1.10 | | | | 75,000 | | | 3.57 years | | $ | 1.10 | | | | 75,000 | | | 3.57 years |
| | | | | | 141,000 | | | | | | | | | | 139,000 | | | |
Following is a summary of the status of warrants outstanding and exercisable as of December 31, 2017:
| Warrants Outstanding | | | Warrants Exercisable | | | Weighted
Average Exercise Price | | | Average
Remaining Contractual Life |
| | 139,032 | | | | 139,032 | | | $ | 9.30 | | | 0.38 years |
Total expenses for options and warrants amounted to $Nil and $9,665 for three and six months ended December 31, 2017, respectively. Total expenses for options and warrants amounted to $28,995 and $92,472 for three and six months ended December 31, 2016, respectively.
Note 9. EQUITY TRANSACTIONS
On June 6, 2014, the Company entered into management consulting and advisory services agreements with two consultants, pursuant to which the consultants assisted the Company in, among other things, financial and tax due diligence, business evaluation and integration, and development of pro forma financial statements. In return for their services, as approved by the Company’s Board of Directors, a total of 600,000 shares of the Company’s common stock were to be issued to these two consultants. In June 2014, 200,000 shares of the Company’s common stock were issued to the consultants as a prepayment for their services. The value of their consulting services was determined using the fair value of the Company’s common stock of $2.34 per share when the shares were issued to the consultants. Their service agreements were for the period July 1, 2014 to December 31, 2016. The remaining 400,000 shares of the Company’s common stock were then issued to the consultants on September 30, 2014 at $1.68 per share, and the service terms are from September 2014 to November 2016. These shares were valued at $1,140,000 and the related consulting fees have been ratably charged to expense over the term of the agreements. Consulting expenses for the above services were $nil and $96,578 for the three months ended December 31, 2017 and 2016, respectively. Consulting expenses for the above services were $nil and $218,045 for the six months ended December 31, 2017 and 2016, respectively.
On May 5, 2015, the Company entered into management consulting and advisory services agreements with three consultants, pursuant to which the consultants assisted the Company in, among other things, review of time charter agreements; crew management advisory; development of permanent and preventive maintenance standards related to dry dockings and ship repairs; development of regular technical and marine vessel inspections and quality control procedures; and development and implementation of alternative remedial actions to address technical problems that may arise. In return for their services, as approved by the Company’s Board of Directors, a total of 500,000 shares of the Company’s common stock were to be issued to these three consultants at $1.50 per share. Their service agreements are for a period of 18 months, effective May 2015. These shares were valued at $750,000 and the related consulting fees have been ratably charged to expense over the term of the agreements. Consulting expenses for the above services were $nil and $48,478 for the three months ended December 31, 2017 and 2016, respectively. Consulting expenses for the above services were $nil and $173,137 for the six months ended December 31, 2017 and 2016, respectively.
On December 9, 2015, the Company entered into a consulting and advisory services agreement with a consultant, pursuant to which the consultant will assist the Company with corporate restructuring, business evaluation and capitalization during the period from November 20, 2015 to November 19, 2016. In return for such services, the Company issued 250,000 shares of the Company’s common stock to this consultant for services to be rendered during the first payment due underhalf of the agreement isservice period. Such shares were issued as restricted shares at $1.02 per share on December 9, 2015. On May 23, 2016, the Company issued an escrow payment of 50,000additional 250,000 shares of common stock ofto this consultant at $0.72 per share to cover the Company. On August 22, 2014,services from the seventh month to November 19, 2016. These shares were valued at $435,000. Consulting expenses were $nil and $48,387 for the three months ended December 31, 2017 and 2016, respectively. Consulting expenses were $nil and $138,387 for the six months ended December 31, 2017 and 2016, respectively.
In March 2017, the Company entered into a consulting and advisory services agreement with Jianwei Li, who will provide management consulting services that include marketing program designing and implementation and cooperative partner selection and management. The service period is from March 2017 to February 2020. The Company issued such 50,000250,000 shares of common stock as the remuneration for the services, which were issued as restricted shares at $2.53 per share on March 22, 2017 to be held in escrow to Mr. Deming Wang, in connection with the acquisition of LSM.consultant. These shares were valued at $632,500. Consulting expenses were $52,709 and $nil for the three months ended December 31, 2017 and 2016, respectively. Consulting expenses were $105,417 and $nil for the six months ended December 31, 2017 and 2016, respectively.
On August 29, 2014,October 23, 2017, the Company issued 130,000 shares to its employees of its restricted common stock valued at $2.80 per share. One fourth of the total number of common shares issued shall become vested on each of November 16, 2017, February 16, 2018, May 16, 2018 and August 16, 2018. These shares were valued at $364,000. $91,000 and $nil are recorded in the aggregate 400,000Company’s G&A expenses for the three and six months ended December 31, 2017 and 2016, respectively.
On October 27, 2017, the Company issued 200,000 shares of restricted common stock with a fair value of $548,000 to a company pursuant to a consulting agreement. The scope of services primarily covers advising on business development, strategic planning and compliance during the one-year service period from October 17, 2017 to October 16, 2018. Consulting expenses were $137,000 and $nil for the three and six months ended December 31, 2017 and 2016, respectively.
Total consulting expenses were $280,709 and $193,443 for the three months ended December 31, 2017 and 2016, and $333,417 and $529,569 for the six months ended December 31, 2017 and 2016, respectively.
Note 10. NON-CONTROLLING INTEREST
The Company’s non-controlling interest consists of the following:
| | | December 31, | | | June 30, | |
| | | 2017 | | | 2017 | |
| | | | | | | |
| Sino-China: | | | | | | | | |
| Original paid-in capital | | $ | 356,400 | | | $ | 356,400 | |
| Additional paid-in capital | | | 1,044 | | | | 1,044 | |
| Accumulated other comprehensive income | | | 82,769 | | | | 217,379 | |
| Accumulated deficit | | | (5,277,982 | ) | | | (5,421,578 | ) |
| | | | (4,837,769 | ) | | | (4,846,755 | ) |
| Trans Pacific Logistics Shanghai Ltd. | | | 98,426 | | | | 46,047 | |
| ACH Trucking Center Corp. (A) | | | - | | | | 31,929 | |
| Total | | $ | (4,739,343 | ) | | $ | (4,768,779 | ) |
(A) The Company has terminated the joint venture agreement with Jetta Global on ACH Trucking Center Corp. on December 4, 2017.
Note 11. COMMITMENTS AND CONTINGENCY
Lease Obligations
The Company leases certain office premises and apartments for employees under operating lease agreements with various terms through April 16, 2020. Future minimum lease payments under the operating lease agreements are as follows:
| | | Amount | |
| | | | |
| Twelve months ending December 31, | | | |
| | | | |
| 2018 | | $ | 175,651 | |
| 2019 | | | 104,222 | |
| 2020 | | | 15,053 | |
| | | $ | 294,926 | |
Rental expense for the three months ended December 31, 2017 and 2016 were $54,445 and $65,555, respectively. Rental expense for the six months ended December 31, 2017 and 2016 were $119,307 and $127,890, respectively.
Contingencies
The Labor Contract Law of the PRC requires employers to insure the liability of the severance payments for terminated employees that have worked for the employers for at least two years prior to January 1, 2008. Employers are liable for one month of severance pay per year of service provided by employees. As of December 31, 2017 and June 30, 2017, the Company has estimated its severance payments to be approximately $54,313 and $48,713, respectively. Such payments have not been reflected in its unaudited condensed consolidated financial statements because management cannot predict what the actual payment, if any, will be in the future.
Note 12. INCOME TAXES
On December 22, 2017, the “Tax Cuts and Jobs Act” (“The Act”) was enacted. Under the provisions of the Act, the U.S. corporate tax rate decreased from 35% to 21%. Since the Company has a June 30 fiscal year-end, a blended U.S. statutory federal rate of approximately 28% for the fiscal year ending June 30, 2018 is applied to the provision for income tax, and a 21% for subsequent fiscal years.
The Company re-measured certain deferred tax assets based on blended rate of 28% at which these deferred tax amounts are expected to reverse in the future and the re-measurement resulted in a tax expense of $120,400 being recognized during the three and six months ended December 31, 2017.
In addition, the Company recorded a provisional amount for its one-time transition tax for all of its foreign subsidiaries, resulting in an increase in income tax expense of $478,499 for the three and six months ended December 31, 2017. The one-time transition tax was calculated using the Company’s incentive plantotal post-1986 overseas net earnings and profits which amounted to approximately $5.7 million. The one-time transition tax is taxed at the rate of 15.5% for the Company’s cash and cash equivalents and 8% for the other assets to be paid over 8 years.
The Company’s income tax benefit (expense) for the three and six months ended December 31, 2017 and 2016 is as follows:
| | | For the three months ended December 31, | | | For the six months ended December 31, | |
| | | 2017 | | | 2016 | | | 2017 | | | 2016 | |
| | | | | | | | | | | | | |
| Current | | | | | | | | | | | | |
| USA | | $ | - | | | $ | - | | | $ | (60,162 | ) | | $ | - | |
| Hong Kong | | | (5,113 | ) | | | (27,576 | ) | | | (9,422 | ) | | | (34,101 | ) |
| China | | | (118,867 | ) | | | (45,815 | ) | | | (250,925 | ) | | | (110,911 | ) |
| One-time transition tax on accumulated foreign earnings | | | (478,499 | ) | | | - | | | | (478,499 | ) | | | - | |
| | | | (602,479 | ) | | | (73,391 | ) | | | (799,008 | ) | | | (145,012 | ) |
| Deferred | | | | | | | | | | | | | | | | |
| | | | | | | | | | | | | | | | | |
| USA | | | 1,173,600 | | | | - | | | | 1,073,700 | | | | - | |
| Total income tax benefit (expense) | | $ | 571,121 | | | $ | (73,391 | ) | | $ | 274,692 | | | $ | (145,012 | ) |
The Company recorded income tax benefit of $571,121 in the three months ended December 31, 2017, compared to income tax expense of $73,391 in the three months ended December 31, 2016. The Company recorded income tax benefit of $274,692 in the six months ended December 31, 2017, compared to income tax expense of $145,012 in the six months ended December 31, 2016.
The Company’s deferred tax assets are comprised of the following:
| | | December 31, | | | June 30, | |
| | | 2017 | | | 2017 | |
| | | | | | | |
| Allowance for doubtful accounts | | $ | 333,000 | | | $ | 106,000 | |
| Stock-based compensation | | | 687,000 | | | | 790,000 | |
| Net operating loss | | | 1,316,000 | | | | 1,464,000 | |
| Total deferred tax assets | | | 2,336,000 | | | | 2,360,000 | |
| Valuation allowance | | | (512,900 | ) | | | (1,610,600 | ) |
| Deferred tax assets, net - long-term | | $ | 1,823,100 | | | $ | 749,400 | |
The Company’s operations in the U.S. for federal tax purposes have incurred a cumulative net operating loss (“NOL”) of approximately $5,567,000 as of December 31, 2017, which may reduce federal future taxable income. For the three and six months ended December 31, 2017, approximately $241,000 and 637,000 of NOL was utilized, respectively.
The Company periodically evaluates the likelihood of the realization of deferred tax assets, and reduces the carrying amount of the deferred tax assets by a valuation allowance to the extent it believes a portion will not be realized. The Company considers many factors when assessing the likelihood of future realization of the deferred tax assets, including its recent cumulative earnings experience, expectation of future income, the carry forward periods available for tax reporting purposes, and other relevant factors. Management has provided an allowance against the deferred tax assets balance as of December 31, 2017. The net decrease in the valuation allowance for the three and six months ended December 31, 2017 amounted to $1,038,600 and $1,097,700, respectively on the basis of management’s reassessment of the amount of its deferred tax assets that are more likely than not to be realized. Management considers new evidence, both positive and negative, that could affect its future realization of deferred tax assets. Due to enactment of the Act, NOL could be carried forward indefinitely and the Company has pretax income resulting in utilization of the NOL in the current period, management determined that there is sufficient positive evidence to conclude that it is more likely than not that all of its NOL are realizable.
The Company’s taxes payable consists of the following:
| | | December 31, | | | June 30, | |
| | | 2017 | | | 2017 | |
| | | | | | | |
| VAT tax payable | | $ | 552,144 | | | $ | 520,436 | |
| Corporate income tax payable | | | 2,079,776 | | | | 1,290,832 | |
| Others | | | 67,036 | | | | 74,948 | |
| Total | | | 2,698,956 | | | | 1,886,216 | |
| Less: current portion | | | 2,258,737 | | | | 1,886,216 | |
| Income tax payable - noncurrent portion | | $ | 440,219 | | | $ | - | |
Note 13. CONCENTRATIONS
Major Customers
For the three months ended December 31, 2017, three customers accounted for 60%, 16% and 11% of the Company’s revenues, respectively. As of December 31, 2017, one of these three customers accounted for 100% of the Company’s accounts due from related parties and the remaining two consultants,customers accounted for approximately 74% of the Company’s accounts receivable.
For the three months ended December 31, 2016, four customers accounted for 39%, 29%, 11% and 10% of the Company’s revenues, respectively. At December 31, 2016, one of these four customers accounted for 100% of the Company’s accounts due from related parties and the remaining three customers accounted for approximately 86% of the Company’s accounts receivable.
For the six months ended December 31, 2017, three customers accounted for 54%, 16% and 11% of the Company’s revenues, respectively. As of December 31, 2017, one of these three customers accounted for 100% of the Company’s accounts due from related parties and the remaining two customers accounted for approximately 74% of the Company’s accounts receivable.
For the six months ended December 31, 2016, three customers accounted for 36%, 36% and 12% of the Company’s revenues, respectively. At December 31, 2016, one of these three customers accounted for 100% of the Company’s accounts due from related parties and the remaining two customers accounted for approximately 79% of the Company’s accounts receivable.
Major Suppliers
For the three months ended December 31, 2017, two suppliers accounted for 82% and 15% of the total costs of revenue, respectively. For the three months ended December 31, 2016, one supplier accounted for 47% of the total costs of revenue.
For the six months ended December 31, 2017, one supplier accounted for 71% of the total costs of revenue. For the six months ended December 31, 2016, two suppliers accounted for 28% and 10% of the total costs of revenue, respectively.
Note 14. SEGMENT REPORTING
ASC 280, “Segment Reporting”, establishes standards for reporting information about operating segments on a basis consistent with the Company’s internal organizational structure as more fully described above underwell as information about geographical areas, business segments and major customers in financial statements for detailing the Company’s business segments.
The Company’s chief operating decision maker is the Chief Executive Officer, who reviews the financial information of the separate operating segments when making decisions about allocating resources and assessing the performance of the group. The Company has determined that it has six operating segments: (1) shipping agency and shipping management services; (2) shipping and chartering services; (3) inland transportation management services; (4) freight logistics services; (5) container trucking services; (6) bulk cargo container services. However, due to the downturn in the shipping industry, the Company has decided to suspend to its shipping agency and shipping management services and shipping and chartering services.
As stated in Note 6, Equity Transactions.1, ACH Center’s operating revenue was less than 1% of the Company’s consolidated revenue and the results of operations for ACH Center was not reported as discontinued operations and was included in the container trucking services segment and freight logistics services segment below. For the three and six months ended December 31, 2017, revenue from ACH Center for container trucking services amounted to $nil and $42,968 respectively, representing 0% and 8% of the segment’s revenue. For the three and six months ended December 31, 2017, gross profit from ACH Center for container trucking services amounted to $nil and $4,297 respectively, representing 0% and 2% of the segment’ gross profit. For the three and six months ended December 31, 2017, revenue from ACH Center for freight logistics services amounted to $nil and $46,937 respectively, representing 0% and 1% of the segment’s revenue. For the three and six months ended December 31, 2017, gross profit from ACH Center for freight logistics services amounted to $nil and $13,989 respectively, representing 0% and 2% of the segment’ gross profit.
Prior to second quarter of fiscal 2018, bulk cargo container services were included in our freight logistics services segment and were operated by our New York subsidiary. Due to the growth of this business line and to enable our CODM to better assess the financial performance of the Company, we separated bulk cargo container services as a separate segment starting from this quarter. We have reclassified $504,815 of revenue from freight logistics services to bulk cargo container services for the six months ended December 31, 2017 for better comparison.
The following tables present summary information by segment for the three and six months ended December 31, 2017 and 2016, respectively:
| | | For the three months ended December 31, 2017 | |
| | | Inland
Transportation
Management
Services | | | Freight Logistics Services | | | Container Trucking Services | | | Bulk Cargo
Container
Services | | | Total | |
| Revenues | | | | | | | | | | | | | | | |
| - Related party | | $ | 555,246 | | | $ | - | | | $ | - | | | $ | - | | | $ | 555,246 | |
| - Third parties | | $ | 838,595 | | | $ | 3,596,323 | | | $ | 126,865 | | | $ | 103,452 | | | $ | 4,665,235 | |
| Total revenues | | $ | 1,393,841 | | | $ | 3,596,323 | | | $ | 126,865 | | | $ | 103,452 | | | $ | 5,220,481 | |
| Cost of revenues | | $ | 174,025 | | | $ | 3,108,195 | | | $ | 49,848 | | | $ | 43,810 | | | $ | 3,375,878 | |
| Gross profit | | $ | 1,219,816 | | | $ | 488,128 | | | $ | 77,017 | | | $ | 59,642 | | | $ | 1,844,603 | |
| Depreciation and amortization | | $ | 12,736 | | | $ | 476 | | | $ | 5,327 | | | $ | - | | | $ | 18,539 | |
| Total capital expenditures | | $ | - | | | $ | 2,721 | | | $ | 42,480 | | | $ | - | | | $ | 45,201 | |
| | | For the three months ended December 31, 2016 | |
| | | Inland Transportation Management Services | | | Freight Logistic Services | | | Container Trucking Services | | | Bulk Cargo
Container
Services | | | Total | |
| Revenues | | | | | | | | | | | | | | | |
| -Related party | | $ | 616,924 | | | $ | - | | | $ | - | | | $ | - | | | $ | 616,924 | |
| -Third parties | | $ | 834,679 | | | $ | 517,066 | | | $ | 159,879 | | | $ | - | | | $ | 1,511,624 | |
| Total revenues | | $ | 1,451,603 | | | $ | 517,066 | | | $ | 159,879 | | | $ | - | | | $ | 2,128,548 | |
| Cost of revenues | | $ | 87,800 | | | $ | 167,035 | | | $ | 95,961 | | | $ | - | | | $ | 350,796 | |
| Gross profit | | $ | 1,363,803 | | | $ | 350,031 | | | $ | 63,918 | | | $ | - | | | $ | 1,777,752 | |
| Depreciation and amortization | | $ | 6,695 | | | $ | 5,370 | | | $ | - | | | $ | - | | | $ | 12,065 | |
| Total capital expenditures | | $ | 45,466 | | | $ | - | | | $ | - | | | $ | - | | | $ | 45,466 | |
| | | For the six months ended December 31, 2017 | |
| | | Inland
Transportation
Management
Services | | | Freight Logistics Services | | | Container Trucking Services | | | Bulk Cargo
Container
Services | | | Total | |
| Revenues | | | | | | | | | | | | | | | |
| - Related party | | $ | 1,120,406 | | | $ | - | | | $ | - | | | $ | - | | | $ | 1,120,406 | |
| - Third parties | | $ | 1,691,901 | | | $ | 6,600,212 | | | $ | 579,706 | | | $ | 608,267 | | | $ | 9,480,086 | |
| Total revenues | | $ | 2,812,307 | | | $ | 6,600,212 | | | $ | 579,706 | | | $ | 608,267 | | | $ | 10,600,492 | |
| Cost of revenues | | $ | 356,175 | | | $ | 5,828,108 | | | $ | 393,024 | | | $ | 464,489 | | | $ | 7,041,796 | |
| Gross profit | | $ | 2,456,132 | | | $ | 772,104 | | | $ | 186,682 | | | $ | 143,778 | | | $ | 3,558,696 | |
| Depreciation and amortization | | $ | 20,397 | | | $ | 951 | | | $ | 10,394 | | | $ | - | | | $ | 31,742 | |
| Total capital expenditures | | $ | - | | | $ | 7,798 | | | $ | 42,480 | | | $ | - | | | $ | 50,278 | |
| | | For the six months ended December 31, 2016 | |
| | | Inland Transportation Management Services | | | Freight Logistic Services | | | Container Trucking Services | | | Bulk Cargo
Container
Services | | | Total | |
| Revenues | | | | | | | | | | | | | | | |
| - Related party | | $ | 1,466,403 | | | $ | - | | | $ | - | | | $ | - | | | $ | 1,466,403 | |
| - Third parties | | $ | 1,470,935 | | | $ | 975,733 | | | $ | 159,879 | | | $ | - | | | $ | 2,606,547 | |
| Total revenues | | $ | 2,937,338 | | | $ | 975,733 | | | $ | 159,879 | | | $ | - | | | $ | 4,072,950 | |
| Cost of revenues | | $ | 191,801 | | | $ | 369,373 | | | $ | 95,961 | | | $ | - | | | $ | 657,135 | |
| Gross profit | | $ | 2,745,537 | | | $ | 606,360 | | | $ | 63,918 | | | $ | - | | | $ | 3,415,815 | |
| Depreciation and amortization | | $ | 14,667 | | | $ | 10,740 | | | $ | - | | | $ | - | | | $ | 25,407 | |
| Total capital expenditures | | $ | 45,466 | | | $ | - | | | $ | - | | | $ | - | | | $ | 45,466 | |
| | December 31, | | | June 30, | |
| | | 2017 | | | 2017 | |
| Total assets: | | | | | | |
| Inland Transportation Management Services | | $ | 18,219,884 | | | $ | 15,552,593 | |
| Freight Logistic Services | | | 206,190 | | | | 1,704,946 | |
| Container Trucking Services | | | 1,100,081 | | | | 558,482 | |
| Bulk Cargo Container Services | | | 697,144 | | | | - | |
| Total Assets | | $ | 20,223,299 | | | $ | 17,816,021 | |
____________ Shares of Common StockNote 15. OTHER RELATED PARTY TRANSACTIONS

| | | December 31, | | | June 30, | |
| | | 2017 | | | 2017 | |
| | | | | | | |
| Tianjin Zhiyuan Investment Group Co., Ltd. | | $ | 2,636,662 | | | $ | 1,715,130 | |
| Less: allowance for doubtful accounts | | | (263,666 | ) | | | - | |
| Total | | $ | 2,372,996 | | | $ | 1,715,130 | |
In June 2013, the Company signed a five-year global logistics service agreement with Tianjin Zhiyuan Investment Group Co., Ltd. (the “Zhiyuan Investment Group”) and TEWOO Chemical & Light Industry Zhiyuan Trade Co., Ltd. (together with Zhiyuan Investment Group, “Zhiyuan”). Zhiyuan Investment Group is owned by Mr. Zhang, the largest shareholder of the Company. In September 2013, the Company executed an inland transportation management service contract with the Zhiyuan Investment Group, whereby it would provide certain advisory services and help control potential commodities loss during the transportation process. As a result of the inland transportation management services provided to Zhiyuan, the Company generated revenue of $555,246 (11% of the Company’s total revenue) and $616,924 (29% of the Company’s total revenue) for the three months ended December 31, 2017 and 2016, respectively. The Company generated revenue of $1,120,406 (11% of the Company’s total revenue) and $1,466,403 (36% of the Company’s total revenue) for the six months ended December 31, 2017 and 2016, respectively. The amount due from Zhiyuan Investment Group at June 30, 2017 was $1,715,130. During the six months ended December 31, 2017, the Company continued to provide inland transportation management services to Zhiyuan and collected nil from Zhiyuan to increase outstanding accounts receivable. As of December 31, 2017, the Company provided a 10% allowance for doubtful accounts of the amount due from Zhiyuan.
SINO-GLOBAL SHIPPING AMERICA, LTD.As of December 31, 2017 and June 30, 2017, the outstanding amounts of advance to suppliers-related party consist of the following:
| | | December 31, | | | June 30, | |
| | | 2017 | | | 2017 | |
| | | | | | | |
| Zhiyuan International Investment & Holding Group (Hong Kong) Co., Ltd. | | $ | 3,473,717 | | | $ | 3,333,038 | |
| Total | | $ | 3,473,717 | | | $ | 3,333,038 | |
PROSPECTUS
NATIONAL SECURITIES CORPORATION
Until _______ __, 2014, all dealers that effect transactionsOn February 18, 2017, Trans Pacific Beijing (subsidiary) and Sino China (VIE) (collectively, the “Seller”), a subsidiary and VIE of the Company, entered into a Cooperative Transportation Agreement (the “Agreement”) with Zhiyuan International Investment & Holding Group (Hong Kong) Co., Ltd. (the “Buyer” or “Zhiyuan Hong Kong”). Mr. Zhang has also invested in these securities, whether or not participating in this offering, may be required to deliver a prospectus. Thisthe Buyer and is in additionthe largest shareholder of the Company. Pursuant to the dealers’ obligationAgreement, the Buyer, jointly with China Minmetals Corporation and China Metallurgical Group Corporation, acts as the general designer, general equipment provider and general service contractor in the upgrade and renovation project of Perwaja Steel Indonesia, which is located in Malaysia (the “Project”). The Seller shall be appointed as general agent to deliverhandle all related logistics and transportation occurring in the Project, ranging from equipment manufacturing, assembling, processing to instalment as referenced in the Agreement. The Seller agrees to make certain advance transportation payments during the Project on the basis of current practice in China’s transportation agency industry. The Buyer agrees to repay the advances to the Seller at any time as requested and, as instructed by the Seller, to satisfy the security repayment test in light of the Seller’s listed company profile. The Seller is contracted to provide high-quality services including the design of a prospectus when actingdetailed transportation plan as underwriterswell as execution and with respect to their unsold allotments or subscriptions.necessary supervision of the transportation plan at the Buyer’s demand, and shall receive from the Buyer 1% - 1.25% of the total transportation expense incurred in the Project as commission for its professional design and execution of transportation plan as the general agent. No additional freight fees were advanced during the three and six months ended December 31, 2017.
PART II - INFORMATION NOT REQUIRED IN PROSPECTUS
ITEM 13. OTHER EXPENSES OF ISSUANCE AND DISTRIBUTION
| Item 13. | Other Expenses of Issuance and Distribution. |
The following table sets forth the costs and expenses, to be paidother than underwriting discounts and placement agent fees, if applicable, payable by the Registrant are as follows.registrant in connection with the sale of the shares of common stock being registered. All amounts other thanare estimates except the SEC registration fee,fees payable to the Nasdaq Capital Market fee and FINRA filing fee, are estimates.SEC.
| | | Amount to | |
| | | Be Paid | |
| SEC registration fee | | $ | 976 | |
| Nasdaq Capital Market additional listing fee | | $ | 5,000 | |
| FINRA filing fee | | $ | 1,760 | |
| Printing and engraving expenses | | $ | 10,000 | |
| Legal fees and expenses | | $ | 300,000 | |
| Accounting fees and expenses | | $ | 70,000 | |
| Transfer agent and registrar fees | | $ | 5,000 | |
| Miscellaneous | | $ | 50,000 | |
| Total | | $ | 442,736 | |
| SEC registration fee | | $ | 578 | |
| Legal fees and expenses | | $ | 20,000 | |
| Accounting fees and expenses | | $ | 10,000 | |
| Miscellaneous fees and expenses | | $ | 5,000 | |
| Total | | $ | 35,578 | |
ITEM 14. INDEMNIFICATION OF DIRECTORS AND OFFICERS
| Item 14. | Indemnification of Directors and Officers. |
Section 13.1-697 of the Virginia Stock Corporation Act permits corporations to indemnify an individual made a party to a proceeding because he is or was a director against liability incurred in the proceeding if the director:
| 1. | Conducted himself in good faith; and |
| | a. | In the case of conduct in his official capacity with the corporation, that his conduct was in its best interests; and |
| | b. | In all other cases, that his conduct was at least not opposed to its best interests; and |
| 3. | In the case of any criminal proceeding, he had no reasonable cause to believe his conduct was unlawful. |
Our First Amended and Restated Articles of Incorporation contain the following provision relating to indemnification of our officers and directors:
The Corporation shall indemnify (a) any person who was, is or may become a party to any proceeding, including a proceeding brought by a shareholder in the right of the Corporation or brought by or on behalf of shareholders of the Corporation, by reason of the fact that he is or was a director or officer of the Corporation, or (b) any director or officer who is or was serving at the request of the Corporation as a director, trustee, partner or officer of another corporation, partnership, joint venture, trust, employee benefit plan or other enterprise, against any liability incurred by him in connection with such proceeding unless he engaged in willful misconduct or a knowing violation of criminal law. A person is considered to be serving an employee benefit plan at the Corporation’s request if his duties to the Corporation also impose duties on, or otherwise involve securities by, him to the plan or to participants in or beneficiaries of the plan. The Board of Directors is hereby empowered, by a majority vote of a quorum of disinterested Directors, to enter into a contract to indemnify any Director or officer in respect of any proceedings arising from any act or omission, whether occurring before or after the execution of such contract.
Expenses incurred by a person who is otherwise entitled to be indemnified by us in defending or investigating a threatened or pending action, suit or proceeding shall be paid by us in advance of the final disposition of such action, suit or proceeding upon receipt of an undertaking by or on behalf of such person to repay such amount if it shall ultimately be determined that he or she is not entitled to be indemnified by us.
Our Bylaws provide that we may indemnify every person who was or is a party or is or was threatened to be made a party to any action, suit, or proceeding, whether civil, criminal, administrative or investigative, by reason of the fact that he or she is or was our employee or agent or, while our employee or agent, is or was serving at our request as an employee or agent or trustee or another corporation, partnership, limited liability company, joint venture, trust, employee benefit plan or other enterprise, against expenses (including counsel fees), judgments, fines and amounts paid in settlement actually and reasonably incurred by him or her in connection with such action, suit or proceeding, to the extent permitted by applicable law.
Insofar as indemnification for liabilities arising under the Securities Act may be permitted to our directors, officers and controlling persons, we have been advised that in the opinion of the SEC, such indemnification is against public policy as expressed in the Securities Act and is, therefore, unenforceable.
ITEM 15. RECENT SALES OF UNREGISTERED SECURITIES
| Item 15. | Recent Sales of Unregistered Securities. |
Following are all issuances of securities byDuring the last three years, the registrant duringhas not issued unregistered securities to any person, except as described below. None of these transactions involved any underwriters, underwriting discounts or commissions, except as specified below, or any public offering, and, unless otherwise indicated below, the past three years which were not registered underregistrant believes that each transaction was exempt from the Securities Act of 1933, as amended (the "Securities Act"). The Company relied on Section 4(2)registration requirements of the Securities Act of 1933 asby virtue of Section 4(a)(2) thereof and/or Rule 506 of Regulation D promulgated thereunder. All recipients had adequate access, though their relationships with the basis forregistrant, to information about the registrant.
On March 14, 2018, the registrant sold Series A Warrants to purchase up to 2,000,000 shares of common stock, and Series B Warrants to purchase up to 2,000,000 shares of common stock, to select accredited investors in a private transaction.
On October 27, 2017, the registrant issued 200,000 shares of common stock to a consultant in connection with services rendered to the registrant.
On October 23, 2017, the registrant issued 130,000 shares of common stock to employees in connection with services rendered to the registrant.
In March 2017, the registrant issued 250,000 shares of common stock to a consultant in connection with services rendered to the registrant.
The registrant issued 250,000 shares of common stock to a consultant on each of December 9, 2015 and May 23, 2016 in connection with services rendered to the registrant.
The registrant issued an exemption from registration foraggregate of 500,000 shares of common stock to three consultants pursuant to management consulting and advisory services agreements dated May 5, 2015.
As of August 29, 2014, the following issuances. Unless noted otherwise,registrant issued an aggregate of 600,000 shares of common stock to two consultants in connection with services rendered to the proceeds were used for working capital and general corporate purposes.registrant.
| | · | On April 19, 2013, the Company sold 1,800,000 shares of its common stock for a purchase price of $3,040,412 to Mr. Zhong Zhang, a majority shareholder in the Zhiyuan Investment Group. |
| II-2 | |
| ·Item 16. | On June 23, 2014, the Company sold 200,000 shares of its common stock for $444,000 to Crystal Spring Holdings Limited, a company owned by Mr. Deming Wang, a major shareholder of Zhenghe. |
| | |
| · | In connection with our September 2014 acquisition of LSM, 50,000 shares of our common stock which may be issued to Mr. Wang as the purchase price based upon LSM achieving certain net income targets, are being held in escrowExhibits and are treated as being issued and outstanding. The exact number of our shares Mr. Wang will be entitled to receive will be determined subsequent to December 31, 2014.Financial Statement Schedules. |
ITEM 16. EXHIBITS AND FINANCIAL STATEMENT SCHEDULESThe exhibits listed on the Index to Exhibits of this Registration Statement are filed herewith or are incorporated herein by reference to other filings.
(a)Exhibits.The following exhibits are included herein or incorporated herein by reference.
| Number | | Exhibit |
2.1 | | Underwriting Agreement+ |
| 3.1 | | First Amended and Restated Articles of Incorporation of Sino-Global Shipping America, Ltd.(1) |
| 3.2 | | Bylaws of Sino-Global Shipping America, Ltd. (2) |
| 4.1 | | Specimen Certificate for Common Stock (2) |
| 4.2 | | Form of Series A Warrant to purchase Common Stock. (2)(7) |
| 4.3 | | Form of Series B Warrant to purchase Common Stock. (7) |
| 5.1 | | OpinionLegal opinion of KaufmanWoods Rogers PLC (d/b/a Woods Rogers Edmunds & Canoles+Williams). (10) |
| 10.1 | | Exclusive Management Consulting and Technical Services Agreement by and between Trans Pacific and Sino-China. (2) |
| 10.2 | | Exclusive Marketing Agreement by and between Trans Pacific and Sino-China. (2) |
| 10.3 | | Proxy Agreement by and among Lei Cao, Mingwei Zhang, the Company and Sino-China. (2) |
| 10.4 | | Equity Interest Pledge Agreement by and among Trans Pacific, Lei Cao and Mingwei Zhang. (2) |
| 10.5 | | Exclusive Equity Interest Purchase Agreement by and among the Company, Lei Cao, Mingwei Zhang and Sino-China. (2) |
| 10.6 | | First Amended and Restated Exclusive Management Consulting and Technical Services Agreement by and between Trans Pacific and Sino-China. (2) |
| 10.7 | | First Amended and Restated Exclusive Marketing Agreement by and between Trans Pacific and Sino-China. (2) |
| 10.8 | | The Company’s 2008 Stock Incentive Plan. (2)(9) |
| 10.9 | | The Company’s 2014 Stock Incentive Plan. (3)(6)(9) |
| 10.10 | | Asset Purchase Agreement by and between Sino-Global and the selling shareholder dated April 10, 2015. (4) |
| 10.11 | | Employment Agreement by and between Mr. Lei Cao and Sino-Global Shipping America, Ltd. dated as of September 30, 2017. (8)(9) |
| 10.12 | | Employment Agreement by and between Ms. Tuo Pan and Sino-Global Shipping America, Ltd. dated as of September 30, 2017. (8)(9) |
| 10.13 | | Employment Agreement by and between Mr. Zhikang Huang and Sino-Global Shipping America, Ltd. dated as of September 30, 2017. (8)(9) |
| 10.14 | | Securities Purchase Agreement dated March 12, 2018. (7) |
| 10.15 | | Placement Agent Agreement dated March 12, 2018. (7) |
| 14.1 | | Code of Ethics of the Company.(4)(3) |
| 21.1 | | List of subsidiaries of the Company.(5) (10) |
| 23.1 | | Consent of Kaufman & Canoles (included in Exhibit 5.1.)+Independent Audit Firm. (10) |
| 23.2 | | Consent of Gusrae Kaplan Nusbaum PLLC+Woods Rogers PLC (d/b/a Woods Rogers Edmunds & Williams) (included in Exhibit 5.1) |
23.3101.INS | | Consent of Friedman LLP, Independent Registered Public Accounting firm. +XBRL Instance Document. (10) |
24.1101.SCH | | Power of Attorney. (on signature page). |
+ | Filed herewithXBRL Taxonomy Extension Schema. (10) |
*101.CAL | To be filed by amendment | XBRL Taxonomy Extension Calculation Linkbase. (10) |
| 101.DEF | | XBRL Taxonomy Extension Definition Linkbase. (10) |
| 101.LAB | | XBRL Taxonomy Extension Label Linkbase. (10) |
| 101.PRE | | XBRL Taxonomy Extension Presentation Linkbase. (10) |
| (1) | Incorporated by reference to the Company’s Current Report on Form 8-K filed on January 27, 2014. |
| (2) | Incorporated by reference to the Company’s Registration Statement on Form S-1, (FileRegistration Nos. 333-150858 and 333-148611).333-148611. |
(3) | Incorporated by reference to the Company’s Form 10-KSB filed on September 29, 2008, File No. 001-34024. |
| (4) | Incorporated by reference to the Company’s Registration Statement on Form S-8, filed with the SEC on April 23, 2014 (FileS-1, Registration No. 333-194211). |
(4) | Incorporated by reference to the Company’s Annual Report on Form 10-KSB filed on September 29, 2008 (File No. 001-34024).333-199160. |
| (5) | Incorporated by reference to the Company’s Annual Report on Form 10-K filed on September 30,18, 2015. |
| (6) | Incorporated by reference to the Company’s Form S-8 filed on April 23, 2014. |
| (7) | Incorporated by reference to the Company’s Form 8-K filed on March 12, 2018. |
| (8) | Incorporated by reference to the Company’s Form 8-K filed on March 6, 2018. |
| (9) | Indicates management contract or compensatory plan or arrangement. |
| (10) | Filed herewith. |
| (11) | Furnished herewith. |
(b) Financial Statement Schedules. All financial statement schedules are omitted because they are not applicable or not required or because the required information is included in the financial statements or notes thereto.
ITEM 17. UNDERTAKINGS
The Registrant hereby undertakes:
| (a) | The undersigned registrant hereby undertakes: |
(a) to file, during any period in which offers or sales are being made, a post-effective amendment to this registration statement to:
| (1) | To file, during any period in which offers or sales are being made, a post-effective amendment to this registration statement: |
(i) To include any prospectus required by sectionSection 10(a)(3) of the Securities Act;Act of 1933;
(ii) To reflect in the prospectus any facts or events arising after the effective date of the registration statement (or the most recent post-effective amendment thereof) which, individually or together,in the aggregate, represent a fundamental change in the information set forth in the registration statement. Notwithstanding the foregoing, any increase or decrease in volume of securities offered (if the total dollar value of securities offered would not exceed that which was registered) and any deviation from the low or high end of the estimated maximum offering range may be reflected in the form of prospectus filed with the SECCommission pursuant to Rule 424(b) if, in the aggregate, the changes in volume and price represent no more than a 20% change in the maximum aggregate offering price set forth in the “Calculation of Registration Fee” table in the effective registration statement; and
(iii) To include any additional or changedmaterial information with respect to the plan of distribution.distribution not previously disclosed in the registration statement or any material change to such information in the registration statement.
(b) that,
| (2) | That, for the purpose of determining any liability under the Securities Act of 1933, each such post-effective amendment shall be deemed to be a new registration statement relating to the securities offered therein, and the offering of such securities at that time shall be deemed to be the initial bona fide offering thereof. |
| (3) | To remove from registration by means of a post-effective amendment any of the securities being registered which remain unsold at the termination of the offering. |
| (4) | That, for the purpose of determining liability under the Securities Act of 1933 to any purchaser: |
(i) If the registrant is relying on Rule 430B:
(A) Each prospectus filed by the registrant pursuant to Rule 424(b)(3) shall be deemed to be part of the registration statement as of the date the filed prospectus was deemed part of and included in the registration statement; and
(B) Each prospectus required to be filed pursuant to Rule 424(b)(2), (b)(5), or (b)(7) as part of a registration statement in reliance on Rule 430B relating to an offering made pursuant to Rule 415(a)(1)(i), (vii), or (x) for the purpose of providing the information required by section 10(a) of the Securities Act of 1933 shall be deemed to be part of and included in the registration statement as of the earlier of the date such form of prospectus is first used after effectiveness or the date of the first contract of sale of securities in the offering described in the prospectus. As provided in Rule 430B, for liability purposes of the issuer and any person that is at that date an underwriter, such date shall be deemed to be a new effective date of the registration statement relating to the securities in the registration statement to which that prospectus relates, and the offering of such securities at that time shall be deemed to be the initial bona fide offering thereof. Provided, however, that no statement made in a registration statement or prospectus that is part of the registration statement or made in a document incorporated or deemed incorporated by reference into the registration statement or prospectus that is part of the registration statement will, as to a purchaser with a time of contract of sale prior to such effective date, supersede or modify any statement that was made in the registration statement or prospectus that was part of the registration statement or made in any such document immediately prior to such effective date; or
(c)(ii) If the registrant is subject to file a post-effective amendment to remove from registration any of the securities that remain unsold at the end of the offering.
(d) that insofar as indemnification for liabilities arising under the Securities Act may be permitted to directors, officers and controlling persons of the Registrant, the Registrant has been advised that in the opinion of the SEC, such indemnification is against public policy as expressed in the Act and is, therefore, unenforceable. In the event that a claim for indemnification against such liabilities (other than the payment by the Registration of expenses incurred or paid by a director, officer or controlling person to the Registrant in the successful defense of any action, suit or proceeding) is asserted by such director, officer or controlling person in connection with the securities being registered, the Registrant will, unless in the opinion of its counsel the matter has been settled by controlling precedent, submit to a court of appropriate jurisdiction the question of whether such indemnification by it is against public policy as expressed in the Securities Act and will be governed by the final adjudication of such issue.
(e) that, for the purpose of determining liability under the Securities Act to any purchaser,Rule 430C, each prospectus filed pursuant to Rule 424(b) as part of a registration statement relating to an offering, other than registration statements relying on Rule 430B or other than prospectuses filed in reliance on Rule 430A, shall be deemed to be part of and included in the registration statement as of the date it is first used after effectiveness. Provided, however, that no statement made in a registration statement or prospectus that is part of the registration statement or made in a document incorporated or deemed incorporated by reference into the registration statement or prospectus that is part of the registration statement will, as to a purchaser with a time of contract of sale prior to such first use, supersede or modify any statement that was made in the registration statement or prospectus that was part of the registration statement or made in any such document immediately prior to such date of first use.
II-3 | (b) | The undersigned registrant hereby undertakes that, for purposes of determining any liability under the Securities Act of 1933, each filing of the registrant’s annual report pursuant to Section 13(a) or Section 15(d) of the Securities Exchange Act of 1934 (and, where applicable, each filing of an employee benefit plan’s annual report pursuant to Section 15(d) of the Securities Exchange Act of 1934) that is incorporated by reference in the registration statement shall be deemed to be a new registration statement relating to the securities offered therein, and the offering of such securities at that time shall be deemed to be the initial bona fide offering thereof. |
| (c) | Insofar as indemnification for liabilities arising under the Securities Act of 1933 may be permitted to directors, officers and controlling persons of the registrant, the registrant has been advised that in the opinion of the Securities and Exchange Commission such indemnification is against public policy as expressed in the Securities Act of 1933 and is, therefore, unenforceable. In the event that a claim for indemnification against such liabilities (other than the payment by the registrant of expenses incurred or paid by a director, officer or controlling person of the registrant in the successful defense of any action, suit or proceeding) is asserted by such director, officer or controlling person in connection with the securities being registered, the registrant will, unless in the opinion of its counsel the matter has been settled by controlling precedent, submit to a court of appropriate jurisdiction the question whether such indemnification by it is against public policy as expressed in the Securities Act of 1933 and will be governed by the final adjudication of such issue. |
SIGNATURES
Pursuant to the requirements of the Securities Act of 1933, as amended, the registrant has duly caused this registration statement to be signed on its behalf by the undersigned, thereunto duly authorized, on November 17, 2014.April 26, 2018.
| | SINO-GLOBAL SHIPPING AMERICA, LTD. |
| | | |
| | By: | /s/ Lei Cao |
| | Name: | Name: Lei Cao |
| | Title: | Title: Chief Executive Officer (Principal (Principal Executive Officer) |
Power of AttorneyPOWER OF ATTORNEY
KNOW ALL PERSONS BY THESE PRESENTS, that each person whose signature appears below constitutes and appoints Lei Cao and Anthony S. Chan,Zhikang Huang, and each of them, his or her true and lawful attorneys-in-fact and agents, each with full power of substitution and re-substitution, for him or her and in his or her name, place and stead, in any and all capacities, to sign any or all amendments (including post-effective amendments) to this Registration Statement and any and all related registration statements pursuant to Rule 462(b) of the Securities Act of 1933, as amended, and to file the same, with all exhibits thereto, and other documents in connection therewith, with the Securities and Exchange Commission, hereby ratifying and confirming all that said attorneys-in-fact and agents, or any of them, or their substitute or substitutes, may lawfully do or cause to be done by virtue hereof.
Pursuant to the requirements of the Securities Act of 1933, as amended, this registration statement has been signed by the following persons in the capacities andindicated on the dates indicated have signed this Registration Statement or Amendment thereto on Form S-1.April 26, 2018.
SIGNATURESignature | | TITLE | | DATETitle |
| | | | |
| /s/ Lei Cao | | Chief Executive Officer and Director | | November 17, 2014 |
Lei Cao | | (Principal Executive Officer) |
| | |
| /s/ Tuo Pan | | Acting Chief Financial Officer |
Tuo Pan | | (Principal Accounting and Financial Officer) |
| | |
| /s/ Zhikang Huang | | Chief Operating Officer and Director |
Zhikang Huang | | |
| | | | | |
/s/ Anthony S. ChanMing Zhu | | Acting Chief Financial Officer | | November 17, 2014Director |
Anthony S. Chan | | (Principal Accounting and Financial Officer) and DirectorMing Zhu | | |
| | | |
| /s/ Tieliang Liu | | Director |
| Tieliang Liu | | |
| | | |
| /s/ Jing Wang | | Director | | November 17, 2014 |
| Jing Wang | | | | |
| | | | |
/s/ Ming Zhu | | Director | | November 17, 2014 |
Ming Zhu | | | | |
| | | | |
/s/ Tieliang Liu | | Director | | November 17, 2014 |
Tieliang Liu | | | | |
EXHIBIT INDEX
Number | | Exhibit |
2.1 | | Underwriting Agreement+ |
3.1 | | First Amended and Restated Articles of Incorporation of Sino-Global Shipping America, Ltd.(1) |
3.2 | | Bylaws of Sino-Global Shipping America, Ltd. (2) |
4.1 | | Specimen Certificate for Common Stock. (2) |
5.1 | | Opinion of Kaufman & Canoles+ |
10.1 | | Exclusive Management Consulting and Technical Services Agreement by and between Trans Pacific and Sino-China. (2) |
10.2 | | Exclusive Marketing Agreement by and between Trans Pacific and Sino-China. (2) |
10.3 | | Proxy Agreement by and among Lei Cao, Mingwei Zhang, the Company and Sino-China. (2) |
10.4 | | Equity Interest Pledge Agreement by and among Trans Pacific, Lei Cao and Mingwei Zhang. (2) |
10.5 | | Exclusive Equity Interest Purchase Agreement by and among the Company, Lei Cao, Mingwei Zhang and Sino-China. (2) |
10.6 | | First Amended and Restated Exclusive Management Consulting and Technical Services Agreement by and between Trans Pacific and Sino-China. (2) |
10.7 | | First Amended and Restated Exclusive Marketing Agreement by and between Trans Pacific and Sino-China. (2) |
10.8 | | The Company’s 2008 Stock Incentive Plan. (2) |
10.9 | | The Company’s 2014 Stock Incentive Plan. (3) |
14.1 | | Code of Ethics of the Company.(4) |
21.1 | | List of subsidiaries of the Company.(5) |
23.1 | | Consent of Kaufman & Canoles (included in Exhibit 5.1.)+ |
23.2 | | Consent of Gusrae Kaplan Nusbaum PLLC+ |
23.3 | | Consent of Friedman LLP, Independent Registered Public Accounting firm. + |
24.1 | | Power of Attorney. (on signature page). |
+ | Filed herewith |
* | To be filed by amendment |
(1) | Incorporated by reference to the Company’s Current Report on Form 8-K filed on January 27, 2014. |
(2) | Incorporated by reference to the Company’s Registration Statement on Form S-1 (File Nos. 333-150858 and 333-148611). |
(3)
| Incorporated by reference to the Company’s Registration Statement on Form S-8, filed with the SEC on April 23, 2014 (File No. 333-194211). |
(4) | Incorporated by reference to the Company’s Annual Report on Form 10-KSB filed on September 29, 2008 (File No. 001-34024). |
(5) | Incorporated by reference to the Company’s Annual Report on Form 10-K filed on September 30, 2014. |
II-5