SUBJECT TO COMPLETION, DATED MARCH 28, JANUARY 21, 2014
PRELIMINARY PROSPECTUS


BioSig Technologies, Inc.
Up to 3,128,043 4,981,530 Shares of Common Stock Underlying Series C Preferred Stock and Warrants
Up to 8,941 Shares of Common Stock
This prospectus relates to the resale of up to (i) 3,128,043 4,981,530 shares of our common stock to be offered by the selling stockholders upon the conversion of 2,781 shares of our Series C Preferred Stock, at a conversion price of $2.09 $ 1.50 per share, and upon the exercise of outstanding common stock purchase warrants, and (ii) 8,941 shares of our common stock to be offered by the selling stockholders.
Our common stock is presently not listed or quoted on any national securities exchange or quotation system. The selling stockholders will be selling their shares of common stock at a fixed price of $2.09 $ 1.50 per share until our common stock is quoted on the OTC Bulletin Board, and thereafter, at prevailing market prices or privately negotiated prices .prices. After the effective date of the registration statement relating to this prospectus, we hope to have a market maker file an application with the Financial Industry Regulatory Authority for our common stock to eligible for trading on the OTC Bulletin Board. There can be no assurance that a market maker will agree to file the necessary documents with the Financial Industry Regulatory Authority, nor can there be any assurance that such an application for quotation will be approved.
We will not receive any of the proceeds from the sale of common stock by the selling stockholders. All expenses of registration incurred in connection with this offering are being borne by us, but all selling and other expenses incurred by the selling stockholders will be borne by the selling stockholders.
We qualify as an “emerging growth company” as defined in the Jumpstart our Business Startups Act of 2012, or JOBS Act. Please read the related disclosure contained on page 13 of this prospectus.
Investing in our common stock is highly speculative and involves a high degree of risk. You should carefully consider the risks and uncertainties in the section entitled “Risk Factors” beginning on page 2 of this prospectus before making a decision to purchase our stock.
We may amend or supplement this prospectus from time to time by filing amendments or supplements as required. You should read the entire prospectus and any amendments or supplements carefully before you make your investment decision.
Neither the Securities and Exchange Commission nor any state securities commission has approved or disapproved of these securities or passed upon the adequacy or accuracy of this prospectus. Any representation to the contrary is a criminal offense.
The date of this prospectus is , 2014
TABLE OF CONTENTS
| Page | ||
| 1 | ||
| 3 | ||
| 17 | ||
| 17 | ||
| 17 | ||
| 18 | ||
| 18 | ||
22 | ||
| 34 | ||
| 37 | ||
| 39 | ||
| 40 | ||
| 44 | ||
| 55 | ||
| 56 | ||
| 63 | ||
| 65 | ||
| 65 | ||
| 65 | ||
| F-1 |
You should rely only on the information contained in this prospectus. We have not authorized any other person to provide you with different information. If anyone provides you with different or inconsistent information, you should not rely on it. We are not making an offer to sell these securities in any jurisdiction where offer or sale is not permitted. You should assume that the information appearing in this prospectus is accurate only as of the date on the front cover of this prospectus. Our business, financial condition, results of operations and prospects may have changed since that date.
Information contained on our website is not part of this prospectus.
PROSPECTUS SUMMARYSUMMARY
The following summary highlights information contained elsewhere in this prospectus. It may not contain all the information that may be important to you. You should read this entire prospectus carefully, including the sections entitled “Risk Factors” and “Management’s Discussion and Analysis of Financial Condition and Results of Operations,” and our historical financial statements and related notes included elsewhere in this prospectus or any accompanying prospectus supplement before making an investment decision. In this prospectus, unless the context requires otherwise, all references to “we,” “our,” “us” and the “Company” refer to BioSig Technologies, Inc.
Overview
We are a development stage medical device company that is developing a proprietary technology platform to minimize noise and artifacts from cardiac recordings during electrophysiology studies, where signals that measure electrical activity of the heart, such as electrocardiograms and electrograms, are measured. These signals are also evaluated during ablation, a procedure that involves delivery of energy through the tip of a catheter that scars or destroys heart tissue in order to correct heart rhythm disturbances. Our product under development, the PURE EP System, is a surface electrocardiogram and intracardiac multichannel recording and analysis system that acquires, processes and displays electrocardiogram and electrograms required during electrophysiology studies and ablation procedures. The PURE EP System is intended to be used in addition to existing electrophysiology recorders. We believe that data provided by the PURE EP System will increase the workload ability and enhance the capabilities of the typical electrophysiology laboratory.
We were formed as BioSig Technologies, Inc., a Nevada corporation, in February 2009 and in April 2011 we merged with our wholly-owned subsidiary, BioSig Technologies Inc., a Delaware corporation, with the Delaware corporation continuing as the surviving entity. We have not generated any revenue to date and consequently our operations are subject to all risks inherent in the establishment of a new business enterprise.
On January 7, 2014, David Drachman, our former chief executive officer and president, filed a statement of claim against us with the American Arbitration Association with respect to his resignation from his positions with us in November 2013. Mr. Drachman alleges, among other things, that (i) we misled him with respect to the status of our technology and required him to perform capital raising duties that had not been previously agreed upon, (ii) he resigned from his positions with us for good reason, as such term was defined in his employment agreement with us, and (iii) he, in his individual capacity, has full rights to the ownership and control of a patent application describing a combined ablation and recording unit directed at the use of electrocardiography sensing for control of radiofrequency renal denervation that we filed with the U.S. Patent and Trademark Office during the time Mr. Drachman served in his positions with us. Mr. Drachman’s claims against us include breach of agreement, breach of good faith and fair dealing and unjust enrichment. Mr. Drachman is seeking, among other things, (a) payment of his salary and pro-rated bonus for the time he served in his positions with us and the severance payments due under his employment agreement, which include 12 months of base salary and full bonus payments, with the total sum of payments equaling approximately $612,000, including $58,000 of accrued and unpaid salary, (b) full vesting of stock options equivalent to 10% of our outstanding common stock, and (c) a declaration by us that Mr. Drachman has full rights to the ownership and control of the patent application related to a combined ablation and recording unit that we filed with the U.S. Patent and Trademark Office during the time Mr. Drachman served in his positions with us. We intend to fully dispute Mr. Drachman’s allegations and his relief sought to the fullest extent permitted by the law and believe them to be wholly without merit. On February 21, 2014, we filed an answer to Mr. Drachman’s statement of claim that disputed all of Mr. Drachman’s claims against us and counter-claimed against Mr. Drachman, seeking declaratory judgment concerning our rights to the ownership and control of the patent application related to a combined ablation and recording unit that we filed with the U.S. Patent and Trademark Office during the time Mr. Drachman served in his positions with us. We believe that the intellectual property included in the patent application does not represent our core proprietary intellectual property but instead represents a different use and application of our proprietary technology.
While we believe that Mr. Drachman did not have good reason to resign and should therefore only be entitled to receive any accrued and unpaid salary and reimbursements and payment for accrued and unused vacation due under his employment agreement, if we receive an adverse outcome in arbitration or if we settle the dispute with Dr. Drachman, we may be obligated to pay or award to him some or all of the monetary relief that he is seeking, which could have a material adverse effect on our business and results of operations. In addition, while we fully dispute his rights to the ownership and control of the aforementioned patent application and related patent(s) and intend to challenge his claim to the fullest extent permitted by law, if we are obligated to transfer the ownership and control of such patent application and related patent(s) to Mr. Drachman, we would lose rights to a portion of our intellectual property, which could impair our ability to develop certain products in the future that are complementary to our core technology.
Our principal executive offices are located at 12424 Wilshire Boulevard, Suite 745, Los Angeles, California 90025. Our telephone number is (310) 820-8100. Our website address is www.biosigtech.com . Information accessed through our website is not incorporated into this prospectus and is not a part of this prospectus.
The Offering
Common stock offered by the selling stockholders: | Up to | |||
Common stock outstanding prior to the offering: | ||||
Common stock outstanding after this offering: | 14,574,095 | |||
Use of proceeds: | We will not receive any proceeds from the sale of the common stock offered by the selling stockholders. | |||
Offering price: | The selling stockholders will be selling their shares of common stock at a fixed price of | |||
Market for the common stock: | There has been no market for our securities and a public market may not develop, or, if any market does develop, it may not be sustained. Our common stock is not listed on any exchange or quoted on the OTC Bulletin Board. After the effective date of the registration statement relating to this prospectus, we hope to have a market maker file an application with the Financial Industry Regulatory Authority, for our common stock to eligible for trading on the OTC Bulletin Board. We do not yet have a market maker who has agreed to file such application. | |||
Risk factors: | You should carefully consider the information set forth in this prospectus and, in particular, the specific factors set forth in the “Risk Factors” section beginning on page 2 of this prospectus before deciding whether or not to invest in shares of our common stock. | |||
| (1) | The number of shares of common stock outstanding after the offering is based upon |
The number of shares of common stock outstanding after this offering excludes:
2,990,977 shares of common stock issuable upon the exercise of currently outstanding options at a weighted average exercise price of $2.09 per share; and |
3,015,146 shares of common stock available for future issuance under the BioSig Technologies, Inc. 2012 Equity Incentive Plan. |
RISK FACTORSFACTORS
Investing in our common stock involves a high degree of risk. You should carefully consider the following factors and other information in this prospectus or any accompanying prospectus supplement before making a decision to invest in our common stock. If any of the risks actually occur, our business, financial conditions and operating results may be materially and adversely affected. In that event, the trading price of our common stock may decline, and you could lose all or part of your investment.
Risks Related to Our Business and Industry
Because our condition as a going concern is in doubt, we will be forced to cease our business operations unless we can raise sufficient funds to satisfy our working capital needs.
As shown in the accompanying financial statements during years ended December 31, 2013 and 2012, and 2011, we incurred net losses attributable to common stockholders of $2,477,002 $ 10,101,846 and $1,178,101, $ 2,477,002, respectively and used $1,524,956 $ 1,762,459 in cash for operating activities for the year ended December 31, 2012.2013. As of January 14, March 27, 2014, we had cash on hand of approximately $ 30,000. 4,375. These factors, among others, raise substantial doubt that we will be able to continue as a going concern for a reasonable period of time.
Our existence is dependent upon management’s ability to develop profitable operations. Our management is devoting substantially all of its efforts to developing its products and services and there can be no assurance that our efforts will be successful. There is no assurance that can be given that management’s actions will result in our profitable operations or the resolution of our liquidity problems.
Because we are an early development stage company with no products near commercialization, we expect to incur significant additional operating losses.
We are an early development stage company and we expect to incur substantial additional operating expenses over the next several years as our research, development, pre-clinical testing, regulatory approval and clinical trial activities increase. The amount of our future losses and when, if ever, we will achieve profitability are uncertain. We have no products that have generated any commercial revenue and do not expect to generate revenues from the commercial sale of our products in the near future, if ever. Our ability to generate revenue and achieve profitability will depend on, among other things, the following:
| ● | successful completion of the preclinical and clinical development of our products; |
| ● | obtaining necessary regulatory approvals from the U.S. Food and Drug Administration or other regulatory authorities; |
| ● | establishing manufacturing, sales, and marketing arrangements, either alone or with third parties; and |
| ● | raising sufficient funds to finance our activities. |
We might not succeed at all, or at any, of these undertakings. If we are unsuccessful at some or all of these undertakings, our business, prospects, and results of operations may be materially adversely affected.
Our product candidates are at an early stage of development and may not be successfully developed or commercialized.
Our main product candidate, the PURE EP System, is in the early stage of development and will require substantial further capital expenditures, development, testing, and regulatory clearances prior to commercialization, especially given that we have not yet completed pre-clinical testing on this product. The development and regulatory approval process takes several years and it is not likely that the PURE EP System, even if successfully developed and approved by the U.S. Food and Drug Administration, may not be commercially available for a number of years. In addition, due to budgetary constraints, we recently have not been able to devote the level of resources that we desired to our research and development efforts. The continued development of our product candidates is dependent upon our ability to obtain sufficient financing. However, even if we are able to obtain the requisite financing to fund our development program, we cannot assure you that our product candidates will be successfully developed or commercialized. Our failure to develop, manufacture or receive regulatory approval for or successfully commercialize any of our product candidates could result in the failure of our business and a loss of all of your investment in our company.
Our former chief executive officer and president filed a statement of claims against us with the American Arbitration Association and we may owe material obligations to our former chief executive officer and president related to such arbitration.
David Drachman, our former chief executive officer and president, resigned from his positions with us in November 2013. On January 7, 2014, Mr. Drachman filed a statement of claim against us with the American Arbitration Association with respect to his resignation from his positions with us. Mr. Drachman alleges, among other things, that (i) we misled him with respect to the status of our technology and required him to perform capital raising duties that had not been previously agreed upon, (ii) he resigned from his positions with us for good reason, as such term was defined in his employment agreement with us, and (iii) he, in his individual capacity, has full rights to the ownership and control of a patent application describing a combined ablation and recording unit directed at the use of electrocardiography sensing for control of radiofrequency renal denervation that we filed with the U.S. Patent and Trademark Office during the time Mr. Drachman served in his positions with us. Mr. Drachman is seeking, among other things, (a) payment of his salary and pro-rated bonus for the time he served in his positions with us and his severance payments that he would be due under his employment agreement, which include 12 months of base salary and full bonus payments, with the total sum of payments equaling approximately $612,000, including $58,000 of accrued and unpaid salary, (b) full vesting of stock options equivalent to 10% of our outstanding common stock, and (c) a declaration by us that Mr. Drachman has full rights to the ownership and control of the patent application related to a combined ablation and recording unit that we filed with the U.S. Patent and Trademark Office during the time Mr. Drachman served in his positions with us. On February 21, 2014, we filed an answer to Mr. Drachman’s statement of claim that disputed all of Mr. Drachman’s claims against us and counter-claimed against Mr. Drachman, seeking declaratory judgment concerning our rights to the ownership and control of the patent application related to a combined ablation and recording unit that we filed with the U.S. Patent and Trademark Office during the time Mr. Drachman served in his positions with us.
While we believe that Mr. Drachman did not have good reason to resign and should therefore only be entitled to receive any accrued and unpaid salary and reimbursements and payment for accrued and unused vacation due under his employment agreement, if we receive an adverse outcome in arbitration or if we settle the dispute with Dr. Drachman, we may be obligated to pay or award to him some or all of the monetary relief that he is seeking, which could have a material adverse effect on our business and results of operations. In addition, while we fully dispute his rights to the ownership and control of the aforementioned patent application and related patent(s) and intend to challenge have challenged his claim to the fullest extent permitted by law, if we are obligated to transfer the ownership and control of such patent application and related patent(s) to Mr. Drachman, we would lose rights to a portion of our intellectual property, which could have a material adverse effect onimpair our business.
ability to develop certain products in the future that are complementary to our core technology.We expect to derive our revenue from sales of our PURE EP System and other products we may develop. If we fail to generate revenue from these sources, our results of operations and the value of our business will be materially and adversely affected.
We expect our revenue to be generated from sales of our PURE EP System and other products we may develop. Future sales of these products, if any, will be subject to, among other things, the receipt of regulatory approvals and commercial and market uncertainties that may be outside our control. If we fail to generate our intended revenues from these products, our results of operations and the value of our business and securities would be materially and adversely affected.
We may need to finance our future cash needs through public or private equity offerings, debt financings or corporate collaboration and licensing arrangements. Any additional funds that we obtain may not be on terms favorable to us or our stockholders and may require us to relinquish valuable rights.
Until and unless we receive approval from the U.S. Food and Drug Administration and other regulatory authorities for our products, we will not generate revenues from our products. Therefore, for the foreseeable future, we will have to fund all of our operations and capital expenditures from cash on hand, public or private equity offerings, debt financings, bank credit facilities or corporate collaboration and licensing arrangements. We believe that our existing cash on hand will be sufficient to enable us to fund our projected operating requirements for approximately the next five months. However, we may need to raise additional funds more quickly if one or more of our assumptions prove to be incorrect or if we choose to expand our product development efforts more rapidly than we presently anticipate. We also may decide to raise additional funds before we require them if we are presented with favorable terms for raising capital.
If we seek to sell additional equity or debt securities, obtain a bank credit facility or enter into a corporate collaboration or licensing arrangement, we may not obtain favorable terms for us and/or our stockholders or be able to raise any capital at all, all of which could result in a material adverse effect on our business and results of operations. The sale of additional equity or debt securities, if convertible, could result in dilution to our stockholders. The incurrence of indebtedness would result in increased fixed obligations and could also result in covenants that would restrict our operations. Raising additional funds through collaboration or licensing arrangements with third parties may require us to relinquish valuable rights to our technologies, future revenue streams, research programs or product candidates, or to grant licenses on terms that may not be favorable to us or our stockholders. In addition, we could be forced to discontinue product development, reduce or forego sales and marketing efforts and forego attractive business opportunities, all of which could have an adverse impact on our business and results of operations.
We may be unable to develop our existing or future technology.
Our product, the PURE EP System, may not deliver the levels of accuracy and reliability needed to make it a successful product in the market place. Additionally, the development of such accuracy and reliability may be indefinitely delayed or may never be achieved. Failure to develop this or other technology could have an adverse material effect on our business, financial condition, results of operations and future prospects.
The results of clinical studies may not support the usefulness of our technology.
Conducting clinical trials is a long, expensive and uncertain process that is subject to delays and failure at any stage. Clinical trials can take months or years. The commencement or completion of any of our clinical trials may be delayed or halted for numerous reasons, including:
| ● | the U.S. Food and Drug Administration may not approve a clinical trial protocol or a clinical trial, or may place a clinical trial on hold; |
| ● | subjects may not enroll in clinical trials at the rate we expect or we may not follow up on subjects at the rate we expect; |
| ● | subjects may experience events unrelated to our products; |
| ● | third-party clinical investigators may not perform our clinical trials consistent with our anticipated schedule or the clinical trial protocol and good clinical practices, or other third-party organizations may not perform data collection and analysis in a timely or accurate manner; |
| ● | interim results of any of our clinical trials may be inconclusive or negative; |
| ● | regulatory inspections of our clinical trials may require us to undertake corrective action or suspend or terminate the clinical trials if investigators find us not to be in compliance with regulatory requirements; or |
| ● | governmental regulations or administrative actions may change and impose new requirements, particularly with respect to reimbursement. |
Results of pre-clinical studies do not necessarily predict future clinical trial results and previous clinical trial results may not be repeated in subsequent medical trials. We may experience delays, cost overruns and project terminations despite achieving promising results in pre-clinical testing or early clinical testing. In addition, the data obtained from clinical trials may be inadequate to support approval or clearance of a submission. The U.S. Food and Drug Administration may disagree with our interpretation of the data from our clinical trials, or may find the clinical trial design, conduct or results inadequate to demonstrate the safety and effectiveness of the product candidate. The U.S. Food and Drug Administration may also require us to conduct additional pre-clinical studies or clinical trials that could further delay approval of our products. If we are unsuccessful in receiving U.S. Food and Drug Administration approval of a product, we would not be able to commercialize the product in the U.S., which could seriously harm our business. Moreover, we face similar risks in other jurisdictions in which we may sell or propose to sell our products.
The medical device industry is subject to stringent regulation and failure to obtain regulatory approval will prevent commercialization of our products.
Medical devices are subject to extensive and rigorous regulation by the U.S. Food and Drug Administration pursuant to the Federal Food, Drug, and Cosmetic Act, by comparable agencies in foreign countries and by other regulatory agencies and governing bodies. Under the Federal Food, Drug, and Cosmetic Act and associated regulations, manufacturers of medical devices must comply with certain regulations that cover the composition, labeling, testing, clinical study, manufacturing, packaging and distribution of medical devices. In addition, medical devices must receive U.S. Food and Drug Administration clearance or approval before they can be commercially marketed in the U.S., and the U.S. Food and Drug Administration may require testing and surveillance programs to monitor the effects of approved products that have been commercialized and can prevent or limit further marketing of a product based on the results of these post-market evaluation programs. The process of obtaining marketing clearance from the U.S. Food and Drug Administration for new products could take a significant period of time, require the expenditure of substantial resources, involve rigorous pre-clinical and clinical testing, require changes to the products and result in limitations on the indicated uses of the product. In addition, if we seek regulatory approval in non-U.S. markets, we will be subject to further regulatory approvals, that will require additional costs and resources. There is no assurance that we will obtain necessary regulatory approvals in a timely manner, or at all.
Our product, the PURE EP System, will need to receive 510(k) marketing clearance from the U.S. Food and Drug Administration in order permit us to market this product in the U.S. In addition, if we intend to market our product for additional medical uses or indications, we will need to submit additional 510(k) applications to the U.S. Food and Drug Administration that are supported by satisfactory clinical trial results specifically for the additional indication. The results of our initial clinical trials may not provide sufficient evidence to allow the U.S. Food and Drug Administration to grant us such additional marketing clearances and even additional trials requested by the U.S. Food and Drug Administration may not result in our obtaining 510(k) marketing clearance for our product. The failure to obtain U.S. Food and Drug Administration marketing clearance for the PURE EP System, any additional indications for the PURE EP System or any other of our future products would have a material adverse effect on our business.
Even if regulatory approval is obtained, our products will be subject to extensive post-approval regulation.
Once a product is approved by the relevant regulatory body for our targeted commercialization market, numerous post-approval requirements apply, including but not limited to requirements relating to manufacturing, labeling, packaging, advertising and record keeping. Even if regulatory approval of a product is obtained, the approval may be subject to limitations on the uses for which the product may be marketed, or contain requirements for costly post-marketing testing and surveillance to monitor the safety or efficacy of the product. Any such post-approval requirement could reduce our revenues, increase our expenses and render the approved product candidate not commercially viable. If we fail to comply with the regulatory requirements of the applicable regulatory authorities, or if previously unknown problems with any approved commercial products, manufacturers or manufacturing processes are discovered, we could be subject to administrative or judicially imposed sanctions or other negative consequences, including:
| ● | restrictions on our products, manufacturers or manufacturing processes; |
| warning letters and untitled letters; |
| ● | civil penalties and criminal prosecutions and penalties; |
| fines; |
| ● | injunctions; |
| ● | product seizures or detentions; |
| ● | import or export bans or restrictions; |
| ● | voluntary or mandatory product recalls and related publicity requirements; |
| ● | suspension or withdrawal of regulatory approvals; |
| ● | total or partial suspension of production; and |
| ● | refusal to approve pending applications for marketing approval of new products or of supplements to approved applications. |
Regulations are constantly changing, and in the future our business may be subject to additional regulations that increase our compliance costs.
We believe that we understand the current laws and regulations to which our products will be subject in the future. However, federal, state and foreign laws and regulations relating to the sale of our products are subject to future changes, as are administrative interpretations of regulatory agencies. If we fail to comply with such federal, state or foreign laws or regulations, we may fail to obtain regulatory approval for our products and, if we have already obtained regulatory approval, we could be subject to enforcement actions, including injunctions preventing us from conducting our business, withdrawal of clearances or approvals and civil and criminal penalties. In the event that federal, state, and foreign laws and regulations change, we may need to incur additional costs to seek government approvals, in addition to the clearance we intend to seek from the U.S. Food and Drug Administration in order to sell or market our products. If we are slow or unable to adapt to changes in existing regulatory requirements or the promulgation of new regulatory requirements or policies, we or our licensees may lose marketing approval for our products which will impact our ability to conduct business in the future.
The market for our technology and revenue generation avenues for our products may be slow to develop, if at all.
The market for our products may be slower to develop or smaller than estimated or it may be more difficult to build the market than anticipated. The medical community may resist our products or be slower to accept them than we anticipate. Revenues from our products may be delayed or costs may be higher than anticipated which may result in our need for additional funding. We anticipate that our principal route to market will be through commercial distribution partners. These arrangements are generally non-exclusive and have no guaranteed sales volumes or commitments. The partners may be slower to sell our products than anticipated. Any financial, operational or regulatory risks that affect our partners could also affect the sales of our products. In the current economic environment, hospitals and clinical purchasing budgets may exercise greater restraint with respect to purchases, which may result in purchasing decisions being delayed or denied. If any of these situations were to occur this could have a material adverse effect on our business, financial condition, results of operations and future prospects.
If we seek to market our products in foreign jurisdictions, we may need to obtain regulatory approval in these jurisdictions.
In order to market our products in the European Union and many other foreign jurisdictions, we may need to obtain separate regulatory approvals and comply with numerous and varying regulatory requirements. Approval procedures vary among countries (except with respect to the countries that are part of the European Economic Area) and can involve additional clinical testing. The time required to obtain approval may differ from that required to obtain U.S. Food and Drug Administration approval. Should we decide to market our products abroad, we may fail to obtain foreign regulatory approvals on a timely basis, if at all. Approval by the U.S. Food and Drug Administration does not ensure approval by regulatory authorities in other countries, and approval by one foreign regulatory authority, including obtaining CE Mark approval, does not ensure approval by regulatory authorities in other foreign countries or by the U.S. Food and Drug Administration. We may be unable to file for, and may not receive, necessary regulatory approvals to commercialize our products in any foreign market, which could adversely affect our business prospects.
If we fail to obtain an adequate level of reimbursement for our system by third-party payors, there may be no commercially viable markets for our system or the markets may be much smaller than expected.
The availability and levels of reimbursement by governmental and other third-party payors significantly affect the market for our system. Reimbursement by third-party payors in the U.S. typically is based on the device’s perceived benefit and whether it is deemed medically reasonable and necessary. Reimbursement levels of third-party payors in the U.S. are also based on established payment formulas that take into account part or all of the cost associated with these devices and the related procedures performed. We cannot assure you the level of reimbursement we might obtain in the U.S., if any, for our system. If we do not obtain adequate levels of reimbursement for our system by third-party payors in the U.S., which we believe is largest potential market for our system, our financial condition, results of operations and prospects would be harmed.
Reimbursement and health care payment systems in international markets vary significantly by country, and include both government-sponsored health care and private insurance. To obtain reimbursement or pricing approval in some countries, we may be required to produce additional clinical data, which may involve one or more additional clinical trials, that compares the cost-effectiveness of our system to other available therapies. We may not obtain international reimbursement or pricing approvals in a timely manner, if at all. Our failure to receive international reimbursement or pricing approvals would negatively impact market acceptance of our system in the international markets in which those approvals are sought.
We believe that future reimbursement may be subject to increased restrictions both in the U.S. and in international markets. Future legislation, regulation or reimbursement policies of third-party payors may adversely affect the demand for the PURE EP System or any of our other future products and limit our ability to sell the PURE EP System or any of our other future products on a profitable basis. In addition, third-party payors continually attempt to contain or reduce the costs of health care by challenging the prices charged for health care products and services. If reimbursement for our system is unavailable in any market or limited in scope or amount, or if pricing is set at unsatisfactory levels, market acceptance of our system would be significantly impaired and our future revenues, if any, would be significantly harmed.
The electrophysiology market is highly competitive.
There are a number of groups and organizations, such as healthcare, medical device and software companies in the electrophysiology market that may develop a competitive offering to our products, especially given that we have not yet filed for patent protection for any of our intellectual property. The largest companies in the electrophysiology market are GE, Johnson & Johnson, C.R. Bard, Inc., Siemens and St. Jude Medical. All of these companies have significantly greater resources, experience and name recognition than we possess. There is no assurance that they will not attempt to develop similar or superior products, that they will not be successful in developing such products or that any products they may develop will not have a competitive advantage over our products. If we experience delayed regulatory approvals or disputed clinical claims, we may not have a commercial or clinical advantage over competitors’ products that we believe we currently possess. Should a superior offering come to market, this could have a material adverse effect on our business, financial condition, results of operations and future prospects.
We rely on key officers, , consultants and scientific and medical advisors, and their knowledge of our business and technical expertise would be difficult to replace.
We are highly dependent on our officers, consultants and scientific and medical advisors because of their expertise and experience in medical device development. We do not have “key person” life insurance policies for any of our officers. Our former chief executive officer and president relieved most of our employees and consultants of their duties in October 2013 and, after the resignation of our former chief executive officer and president in November 2013, we rehired such employees and consultants. Due to our funding constraints, we made irregular payments to such employees and consultants until January 2014, at which time we compensated them in full for their accrued but unpaid service. If we are unable to obtain additional funding, we will be unable to meet our current and future compensation obligations to such employees and consultants. In light of the foregoing, we are at risk that one or more of our consultants or employees may leave our company for other opportunities where there is no concern about such employers fulfilling their compensation obligations, or for other reasons. The loss of the technical knowledge and management and industry expertise of any of our key personnel could result in delays in product development, loss of customers and sales and diversion of management resources, which could adversely affect our results of operations.
We may fail to attract and retain qualified personnel.
We expect to rapidly expand our operations and grow our sales, research and development and administrative operations. This expansion is expected to place a significant strain on our management and will require hiring a significant number of qualified personnel. Accordingly, recruiting and retaining such personnel in the future will be critical to our success. There is intense competition from other companies, research and academic institutions, government entities and other organizations for qualified personnel in the areas of our activities. Many of these companies, institutions and organizations have greater resources than we do, along with more prestige associated with their names. If we fail to identify, attract, retain and motivate these highly skilled personnel, we may be unable to continue our marketing and development activities, and this could have a material adverse effect on our business, financial condition, results of operations and future prospects.
If we do not effectively manage changes in our business, these changes could place a significant strain on our management and operations.
Our ability to grow successfully requires an effective planning and management process. The expansion and growth of our business could place a significant strain on our management systems, infrastructure and other resources. To manage our growth successfully, we must continue to improve and expand our systems and infrastructure in a timely and efficient manner. Our controls, systems, procedures and resources may not be adequate to support a changing and growing company. If our management fails to respond effectively to changes and growth in our business, including acquisitions, there could be a material adverse effect on our business, financial condition, results of operations and future prospects.
Our strategic business plan may not produce the intended growth in revenue and operating income.
Our strategies ultimately include making significant investments in sales and marketing programs to achieve revenue growth and margin improvement targets. If we do not achieve the expected benefits from these investments or otherwise fail to execute on our strategic initiatives, we may not achieve the growth improvement we are targeting and our results of operations may be adversely affected. We may also fail to secure the capital necessary to make these investments, which will hinder our growth.
In addition, as part of our strategy for growth, we may make acquisitions and enter into strategic alliances such as joint ventures and joint development agreements. However, we may not be able to identify suitable acquisition candidates, complete acquisitions or integrate acquisitions successfully, and our strategic alliances may not prove to be successful. In this regard, acquisitions involve numerous risks, including difficulties in the integration of the operations, technologies, services and products of the acquired companies and the diversion of management’s attention from other business concerns. Although we will endeavor to evaluate the risks inherent in any particular transaction, there can be no assurance that we will properly ascertain all such risks. In addition, acquisitions could result in the incurrence of substantial additional indebtedness and other expenses or in potentially dilutive issuances of equity securities. There can be no assurance that difficulties encountered with acquisitions will not have a material adverse effect on our business, financial condition and results of operations.
We currently have no sales, marketing or distribution operations and will need to expand our expertise in these areas.
We currently have no sales, marketing or distribution operations and, in connection with the expected commercialization of our system, will need to expand our expertise in these areas. To increase internal sales, distribution and marketing expertise and be able to conduct these operations, we would have to invest significant amounts of financial and management resources. In developing these functions ourselves, we could face a number of risks, including:
| ● | we may not be able to attract and build an effective marketing or sales force; |
| ● | the cost of establishing, training and providing regulatory oversight for a marketing or sales force may be substantial; and |
| ● | there are significant legal and regulatory risks in medical device marketing and sales that we have never faced, and any failure to comply with applicable legal and regulatory requirements for sales, marketing and distribution could result in an enforcement action by the U.S. Food and Drug Administration, European regulators or other authorities that could jeopardize our ability to market the system or could subject us to substantial liability. |
The liability of our directors and officers is limited.
The applicable provisions of the Delaware General Corporation Law and our Amended and Restated Certificate of Incorporation and By-laws limit the liability of our directors to us and our stockholders for monetary damages for breaches of their fiduciary duties, with certain exceptions, and for other specified acts or omissions of such persons. In addition, the applicable provisions of the Delaware General Corporation Law and of our Amended and Restated Certificate of Incorporation and Bylaws provide for indemnification of such persons under certain circumstances. In the event we are required to indemnify any of our directors or any other person, our financial strength may be harmed.
Our product development program depends upon third-party researchers who are outside our control and whose negative performance could materially hinder or delay our pre-clinical testing or clinical trials
We do not have the ability to conduct all aspects of pre-clinical testing or clinical trials ourselves. We depend upon independent investigators and collaborators, such as commercial third-parties, government, universities and medical institutions, to conduct our preclinical and clinical trials under agreements with us. These collaborators are not our employees and we cannot control the amount or timing of resources that they devote to our programs. These investigators may not assign as great a priority to our programs or pursue them as diligently as we would if we were undertaking such programs ourselves. The failure of any of these outside collaborators to perform in an acceptable and timely manner in the future, including in accordance with any applicable regulatory requirements, such as good clinical and laboratory practices, or pre-clinical testing or clinical trial protocols, could cause a delay or otherwise adversely affect our pre-clinical testing or clinical trials, our success in obtaining regulatory approvals and, ultimately, the timely advancement of our development programs. In addition, these collaborators may also have relationships with other commercial entities, some of whom may compete with us. If our collaborators assist our competitors at our expense, our competitive position would be harmed.
Negative publicity or unfavorable media coverage could damage our reputation and harm our operations.
In the event that the marketplace perceives our products as not offering the benefits which we believe they offer, we may receive negative publicity. This publicity may result in litigation and increased regulation and governmental review. If we were to receive such negative publicity or unfavorable media attention, whether warranted or unwarranted, our ability to market our products would be adversely affected. We may be required to change our products and services and become subject to increased regulatory burdens, and we may be required to pay large judgments or fines and incur significant legal expenses. Any combination of these factors could further increase our cost of doing business and adversely affect our financial position, results of operations and cash flows.
We may face risks associated with future litigation and claims.
In addition to the existing arbitration with our former chief executive officer and president, we may, , in the future, be involved in one or more lawsuits, claims or other proceedings. These suits could concern issues including contract disputes, employment actions, employee benefits, taxes, environmental, health and safety, personal injury and product liability matters. Due to the uncertainties of litigation, we can give no assurance that we will prevail on any claims made against us in any such lawsuit. Also, we can give no assurance that any other lawsuits or claims brought in the future will not have an adverse effect on our financial condition, liquidity or operating results.
Specifically, we believe we will be subject to product liability claims or product recalls, particularly in the event of false positive or false negative reports, because we plan to develop and manufacture medical diagnostic products. We intend to obtain appropriate insurance coverage once we reach a manufacturing stage. A product recall or a successful product liability claim or claims that exceed our planned insurance coverage could have a material adverse effect on us. In addition, product liability insurance is expensive. In the future we may not be able to obtain coverage on acceptable terms, if at all. Moreover, our insurance coverage may not adequately protect us from liability that we incur in connection with clinical trials or sales of our products. In the event of an award against us during a time when we have no available insurance or insufficient insurance, we may sustain significant losses of our operating capital. In addition, any products liability litigation, regardless of outcome or strength of claims, may divert time and resources away from the day-to-day operation of our business and product development efforts. Any of these outcomes could adversely impact our business and results of operations, as well as impair our reputation in the medical and investment communities.
Recent global economic trends could adversely affect our business, liquidity and financial results.
Recent global economic conditions, including disruption of financial markets, could adversely affect us, primarily through limiting our access to capital and disrupting our potential clients’ businesses. In addition, continuation or worsening of general market conditions in economies important to our businesses may adversely affect our potential customers’ level of spending and ability to obtain financing, leading to us being unable to generate the levels of sales that we anticipate. Continued disruption of financial markets could have a material adverse effect on our business, financial condition, results of operations and future prospects.
We may be subject, directly or indirectly, to U.S. federal and state health care fraud and abuse and false claims laws and regulations. Prosecutions under such laws have increased in recent years and we may become subject to such litigation. If we are unable to, or have not fully complied with such laws, we could face substantial penalties.
If we are successful in achieving regulatory approval to market our PURE EP System, our operations will be directly, or indirectly through our customers and health care professionals, subject to various U.S. federal and state fraud and abuse laws, including, without limitation, the federal Anti-Kickback Statute, federal False Claims Act, and federal Foreign Corrupt Practices Act. These laws may impact, among other things, our proposed sales, and marketing and education programs.
The federal Anti-Kickback Statute prohibits persons from knowingly and willfully soliciting, offering, receiving or providing remuneration, directly or indirectly, in exchange for or to induce either the referral of an individual, or the furnishing or arranging for a good or service, for which payment may be made under a federal health care program such as the Medicare and Medicaid programs. Several courts have interpreted the statute’s intent requirement to mean that if any one purpose of an arrangement involving remuneration is to induce referrals of federal health care covered business, the statute has been violated. The Anti-Kickback Statute is broad and, despite a series of narrow safe harbors, prohibits many arrangements and practices that are lawful in businesses outside of the health care industry. Penalties for violations of the federal Anti-Kickback Statute include criminal penalties and civil and administrative sanctions such as fines, imprisonment and possible exclusion from Medicare, Medicaid and other federal health care programs. An alleged violation of the Anti-Kickback Statute may be used as a predicate offense to establish liability pursuant to other federal laws and regulations such as the federal False Claims Act. Many states have also adopted laws similar to the federal Anti-Kickback Statute, some of which apply to the referral of patients for health care items or services reimbursed by any source, not only the Medicare and Medicaid programs.
The federal False Claims Act prohibits persons from knowingly filing, or causing to be filed, a false claim to, or the knowing use of false statements to obtain payment from, the federal government. Suits filed under the False Claims Act, known as “qui tam” actions, can be brought by any individual on behalf of the government and such individuals, commonly known as “relators” or “whistleblowers,” may share in any amounts paid by the entity to the government in fines or settlement. The frequency of filing qui tam actions has increased significantly in recent years, causing greater numbers of medical device and health care companies to have to defend a False Claim Act action. The federal Patient Protection and Affordable Care Act includes provisions expanding the ability of certain relators to bring actions that would have been previously dismissed under prior law. When an entity is determined to have violated the federal False Claims Act, it may be required to pay up to three times the actual damages sustained by the government, plus civil penalties for each separate false claim. The Deficit Reduction Act of 2005 encouraged states to enact or modify their state false claims act to be at least as effective as the federal False Claims Act by granting states a portion of any federal Medicaid funds recovered through Medicaid-related actions. Most states have enacted state false claims laws, and many of those states included laws including qui tam provisions. States have until March 31, 2013 to enact or amend their false claims laws modeled after the federal False Claims Act for review and approval to receive a greater portion of any recovery.
The federal Patient Protection and Affordable Care Act includes provisions known as the Physician Payments Sunshine Act, which requires manufacturers of drugs, biologics, devices and medical supplies covered under Medicare and Medicaid starting in 2012 to record any transfers of value to physicians and teaching hospitals and to report this data beginning in 2013 to the Centers for Medicare and Medicaid Services for subsequent public disclosure. Manufacturers must also disclose investment interests held by physicians and their family members. Failure to submit the required information may result in civil monetary penalties of up to $1 million per year for knowing violations and may result in liability under other federal laws or regulations. Similar reporting requirements have also been enacted on the state level in the U.S., and an increasing number of countries worldwide either have adopted or are considering similar laws requiring transparency of interactions with health care professionals. In addition, some states such as Massachusetts and Vermont impose an outright ban on certain gifts to physicians. If we receive U.S. Food and Drug Administration clearance to market our system in the U.S., these laws could affect our promotional activities by limiting the kinds of interactions we could have with hospitals, physicians or other potential purchasers or users of our system. Both the disclosure laws and gift bans will impose administrative, cost and compliance burdens on us.
We are unable to predict whether we could be subject to actions under any of these laws, or the impact of such actions. If we are found to be in violation of any of the laws described above and other applicable state and federal fraud and abuse laws, we may be subject to penalties, including civil and criminal penalties, damages, fines, or an administrative action of suspension or exclusion from government health care reimbursement programs and the curtailment or restructuring of our operations.
In addition, to the extent we commence commercial operations overseas, we will be subject to the Foreign Corrupt Practices Act and other countries’ anti-corruption/anti-bribery regimes, such as the U.K. Bribery Act. The Foreign Corrupt Practices Act prohibits improper payments or offers of payments to foreign governments and their officials for the purpose of obtaining or retaining business. Safeguards we implement to discourage improper payments or offers of payments by our employees, consultants, sales agents or distributors may be ineffective, and violations of the Foreign Corrupt Practices Act and similar laws may result in severe criminal or civil sanctions, or other liabilities or proceedings against us, any of which would likely harm our reputation, business, financial condition and results of operations.
Risks Related to Our Intellectual Property
If we do not obtain protection for our intellectual property rights, our competitors may be able to take advantage of our research and development efforts to develop competing products.
We intend to rely on a combination of patents, trade secrets, and nondisclosure and non-competition agreements to protect our proprietary intellectual property. We have filed two patent applications in the U.S. and plan to file additional patent applications in the U.S. and in other countries, as we deem appropriate for our products. Our applications have and will include claims intended to provide market exclusivity for certain commercial aspects of the products, including the methods of production, the methods of usage and the commercial packaging of the products. However, we cannot predict:
| ● | the degree and range of protection any patents will afford us against competitors, including whether third parties will find ways to invalidate or otherwise circumvent our patents; |
| ● | if and when such patents will be issued, and, if granted, whether patents will be challenged and held invalid or unenforceable; |
| ● | whether or not others will obtain patents claiming aspects similar to those covered by our patents and patent applications; or |
| ● | whether we will need to initiate litigation or administrative proceedings which may be costly regardless of outcome. |
Our success also depends upon the skills, knowledge and experience of our scientific and technical personnel, our consultants and advisors as well as our licensors and contractors. To help protect our proprietary know-how and our inventions for which patents may be unobtainable or difficult to obtain, we rely on trade secret protection and confidentiality agreements. To this end, it is our policy to require all of our employees, consultants, advisors and contractors to enter into agreements which prohibit the disclosure of confidential information and, where applicable, require disclosure and assignment to us of the ideas, developments, discoveries and inventions important to our business. These agreements may not provide adequate protection for our trade secrets, know-how or other proprietary information in the event of any unauthorized use or disclosure or the lawful development by others of such information. If any of our trade secrets, know-how or other proprietary information is disclosed, the value of our trade secrets, know-how and other proprietary rights would be significantly impaired and our business and competitive position would suffer.
Given the fact that we may pose a competitive threat, competitors, especially large and well-capitalized companies that own or control patents relating to electrophysiology recording systems, may successfully challenge our patent applications, produce similar products or products that do not infringe our patents, or produce products in countries where we have not applied for patent protection or that do not respect our patents.
If any of these events occurs, or we otherwise lose protection for our trade secrets or proprietary know-how, the value of our intellectual property may be greatly reduced. Patent protection and other intellectual property protection are important to the success of our business and prospects, and there is a substantial risk that such protections will prove inadequate.
Our former chief executive officer and president has filed a statement of claims against us with the American Arbitration Association that challenges the ownership of one of our patent applications with the U.S. Patent and Trademark Office.
David Drachman, our former chief executive officer and president, filed a statement of claim against us with the American Arbitration Association with respect to his resignation from his positions with us in November 2013, pursuant to which Mr. Drachman is seeking, among other things, a declaration by us that Mr. Drachman has full rights to the ownership and control of the patent application related to a combined ablation and recording unit directed at the use of electrocardiography sensing for control of radiofrequency renal denervation that we filed with the U.S. Patent and Trademark Office during the time Mr. Drachman served in his positions with us. We fully dispute his rights to the ownership and control of such patent application and related patent(s) and intend to challenge his claim to the fullest extent permitted by law. However, if we are obligated to transfer the ownership and control of such patent application and related patent(s) to Mr. Drachman, we would lose rights to a portion of our intellectual property, which could have a material adverse effect on
impair our business.
ability to develop certain products in the future that are complementary to our core technology.If we infringe upon the rights of third parties, we could be prevented from selling products and forced to pay damages and defend against litigation.
If our products, methods, processes and other technologies infringe the proprietary rights of other parties, we could incur substantial costs and we may be required to:
| ● | obtain licenses, which may not be available on commercially reasonable terms, if at all; |
| ● | abandon an infringing product candidate; |
| ● | redesign our product candidates or processes to avoid infringement; |
| ● | cease usage of the subject matter claimed in the patents held by others; |
| ● | pay damages; and/or |
| ● | defend litigation or administrative proceedings which may be costly regardless of outcome, and which could result in a substantial diversion of our financial and management resources. |
Any of these events could substantially harm our earnings, financial condition and operations.
Risks Related to our Common Stock
There is no current trading market for our common stock, and there is no assurance of an established public trading market, which would adversely affect the ability of our investors to sell their securities in the public market.
Our common stock is not currently listed or quoted for trading on any national securities exchange or national quotation system. We believe that our common stock will be quoted on the OTC Bulletin Board. The OTC Bulletin Board is an inter-dealer, over-the-counter market that provides significantly less liquidity than the NASDAQ Global Market and NYSE MKT. Quotes for stocks included on the OTC Bulletin Board are not listed in the financial sections of newspapers as are those for the NASDAQ Stock Market and NYSE MKT. Therefore, prices for securities traded solely on the OTC Bulletin Board may be difficult to obtain and holders of common stock may be unable to resell their securities at or near their original offering price or at any price.
If our common stock is quoted on the OTC Bulletin Board, we could face significant consequences, including:
| ● | a limited availability for market quotations for our shares of common stock; |
| ● | reduced liquidity with respect to our shares of common stock; |
| ● | a determination that our shares of common stock is a “penny stock,” which will require brokers trading in our common stock to adhere to more stringent rules and possibly result in a reduced level of trading activity in the secondary trading market for our common stock; and |
| ● | limited amount of news and analyst coverage. |
Our common stock will not be registered under the Securities Exchange Act of 1934, as amended, and as a result we will have limited reporting duties which could make our common stock less attractive to investors.
We do not intend to register our common stock under the Securities Exchange Act of 1934, as amended, for the foreseeable future, provided that, we will register our common stock under the Exchange Act if we have, after the last day of our fiscal year, more than either (i) 2,000 shareholders of record; or (ii) 500 shareholders of record who are not accredited investors, in accordance with Section 12(g) of the Securities Exchange Act of 1934, as amended. As a result, although, upon the effectiveness of the registration statement of which this prospectus forms a part, we will be required to file annual, quarterly, and current reports pursuant to Section 15(d) of the Securities Exchange Act of 1934, as amended, so long as our common stock is not registered under the Securities Exchange Act of 1934, as amended, we will not be subject to Section 14 of the Securities Exchange Act of 1934, as amended, which, among other things, prohibits companies that have securities registered under the Securities Exchange Act of 1934, as amended, from soliciting proxies or consents from shareholders without furnishing to shareholders and filing with the Securities and Exchange Commission a proxy statement and form of proxy complying with the proxy rules. In addition, so long as our common stock is not registered under the Securities Exchange Act of 1934, as amended, our directors and executive officers and beneficial holders of 10% or more of our outstanding shares of common stock will not be subject to Section 16 of the Securities Exchange Act of 1934, as amended. Section 16(a) of the Securities Exchange Act of 1934, as amended, requires executive officers and directs, and persons who beneficially own more than 10% of a registered class of equity securities to file with the Securities and Exchange Commission initial statements of beneficial ownership, reports of changes in ownership and annual reports concerning their ownership of common stock and other equity securities, on Forms 3, 4 and 5, respectively. Such information about our directors, executive officers, and beneficial holders will only be available through this (and any subsequent) registration statement, and periodic reports we file thereunder. Furthermore, so long as our common stock is not registered under the Securities Exchange Act of 1934, as amended, our obligation to file reports under Section 15(d) of the Securities Exchange Act of 1934, as amended, will be automatically suspended if, on the first day of any fiscal year (other than a fiscal year in which a registration statement under the Securities Act of 1933, as amended, has gone effective), we have fewer than 300 shareholders of record. This suspension is automatic and does not require any filing with the Securities and Exchange Commission. In such an event, we may cease providing periodic reports and current or periodic information, including operational and financial information, may not be available with respect to our results of operations. Our limited reporting duties, as compared to issuers with common stock registered under Section 12(g) of the Securities Exchange Act of 1934, as amended, may make our common stock less attractive to the investing public.
Unless we are required to register our securities under Section 12(g) of the Securities Exchange Act of 1934, as amended, we do not intend to voluntarily comply with the registration requirements of Section 12(g) of the Securities Exchange Act of 1934, as amended.
Since we believe that that our securities will be listed on the OTC Bulletin Board, our securities holders may face significant restrictions on the resale of our securities due to state “Blue Sky” laws.
Each state has its own securities laws, often called “blue sky” laws, which (i) limit sales of securities to a state’s residents unless the securities are registered in that state or qualify for an exemption from registration, and (ii) govern the reporting requirements for broker-dealers doing business directly or indirectly in the state. Before a security is sold in a state, there must be a registration in place to cover the transaction, or the transaction must be exempt from registration. The applicable broker must be registered in that state. We do not know whether our common stock will be registered or exempt from registration under the laws of any state. Since we believe that our common stock will be listed on the OTC Bulletin Board, a determination regarding registration will be made by those broker-dealers, if any, who agree to serve as the market-makers for our common stock. There may be significant state blue sky law restrictions on the ability of investors to sell, and on purchasers to buy, our common stock. The resale market for our common stock may be limited, as holders may be unable to resell their shares of common stock without the significant expense of state registration or qualification.
The market price and trading volume of shares of our common stock may be volatile.
When and if a market develops for our securities, the market price of our common stock could fluctuate significantly for many reasons, including reasons unrelated to our specific performance, such as limited liquidity for our stock, reports by industry analysts, investor perceptions, or announcements by our competitors regarding their own performance, as well as general economic and industry conditions. For example, to the extent that other large companies within our industry experience declines in their share price, our share price may decline as well. Fluctuations in operating results or the failure of operating results to meet the expectations of public market analysts and investors may negatively impact the price of our securities. Quarterly operating results may fluctuate in the future due to a variety of factors that could negatively affect revenues or expenses in any particular quarter, including vulnerability of our business to a general economic downturn, changes in the laws that affect our products or operations, competition, compensation related expenses, application of accounting standards and our ability to obtain and maintain all necessary government certifications and/or licenses to conduct our business. In addition, when the market price of a company’s shares drops significantly, stockholders could institute securities class action lawsuits against the company. A lawsuit against us could cause us to incur substantial costs and could divert the time and attention of our management and other resources.
The interests of our controlling stockholders may not coincide with yours and such controlling stockholder may make decisions with which you may disagree.
As of January 17, March 27, 2014, two of our stockholders beneficially owned over 85 %85% of our common stock. As a result, our controlling stockholders control substantially all matters requiring stockholder approval, including the election of directors and approval of significant corporate transactions. In addition, this concentration of ownership may delay or prevent a change in control of our company and make some future transactions more difficult or impossible without the support of our controlling stockholders. The interests of our controlling stockholders may not coincide with our interests or the interests of other stockholders.
If securities or industry analysts do not publish research or publish inaccurate or unfavorable research about our business, our stock price and trading volume could decline.
The trading market for our common stock will depend in part on the research and reports that securities or industry analysts publish about us or our business. We do not currently have research coverage by securities and industry analysts and you should not invest in our common stock in anticipation that we will obtain such coverage. If we obtain securities or industry analyst coverage and if one or more of the analysts who covers us downgrades our stock or publishes inaccurate or unfavorable research about our business, our stock price would likely decline. If one or more of these analysts ceases coverage of us or fails to publish reports on us regularly, demand for our stock could decrease, which could cause our stock price and trading volume to decline.
Upon becoming a publicly-reporting company, we will be obligated to develop and maintain proper and effective internal controls over financial reporting. We may not complete our analysis of our internal controls over financial reporting in a timely manner, or these internal controls may have one or more material weaknesses, which may adversely affect investor confidence in our company and, as a result, the value of our common stock.
Ensuring that we have adequate internal financial and accounting controls and procedures in place so that we can produce accurate financial statements on a timely basis is a costly and time-consuming effort that will need to be evaluated frequently. Section 404 of the Sarbanes-Oxley Act requires public companies to conduct an annual review and evaluation of their internal controls and attestations of the effectiveness of internal controls by independent auditors. Upon becoming a publicly-reporting company, we will be required to perform an annual review and evaluation of our internal controls no later than for the fiscal year ending December 31, 2015.
We are in the early stages of the costly and challenging process of compiling the system and processing documentation necessary to evaluate and correct a material weakness in internal controls needed to comply with Section 404 of the Sarbanes-Oxley Act. The material weakness relates to our being a small company with a limited number of employees which limits our ability to assert the controls related to the segregation of duties. During the evaluation and testing process, if we identify one or more additional material weaknesses in our internal control over financial reporting, we will be unable to assert that our internal controls are effective. If we are unable to assert that our internal control over financial reporting is effective, we could lose investor confidence in the accuracy and completeness of our financial reports, which would cause the price of our common stock to decline.
While we currently qualify as an “emerging growth company” under the Jumpstart of Business Startups Act of 2012, or the JOBS Act, when we lose that status the costs and demands placed upon our management will increase .increase.
Once we become a publicly reporting company, we will continue to be deemed an emerging growth company until the earliest of (i) the last day of the fiscal year during which we had total annual gross revenues of $1 billion (as indexed for inflation); (ii) the last day of the fiscal year following the fifth anniversary of the date of the first sale of common stock under this registration statement; (iii) the date on which we have, during the previous 3-year period, issued more than $1 billion in non-convertible debt; or (iv) the date on which we are deemed to be a “ large“large accelerated filer, ” as defined by the Securities and Exchange Commission, which would generally occur upon our attaining a public float of at least $700 million. Once we lose emerging growth company status, we expect the costs and demands placed upon our management to increase, as we would have to comply with additional disclosure and accounting requirements, particularly if we would also no qualify as a smaller reporting company.
We are an “emerging growth company” and we cannot be certain that the reduced disclosure requirements applicable to emerging growth companies will make our common stock less attractive to investors.
The JOBS Act permits “emerging growth companies” like us, , upon becoming a publicly-reporting company, to rely on some of the reduced disclosure requirements that are already available to smaller reporting companies. As long as we qualify as an emerging growth company or a smaller reporting company, we would be permitted to omit the auditor’s attestation on internal control over financial reporting that would otherwise be required by the Sarbanes-Oxley Act, as described above, and are also exempt from the requirement to submit “say-on-pay”, “say-on-pay frequency” and “say-on-parachute” votes to our stockholders and may avail ourselves of reduced executive compensation disclosure that is already available to smaller reporting companies.
In addition, Section 107 of the JOBS Act also provides that an emerging growth company can take advantage of the exemption from complying with new or revised accounting standards provided in Section 7(a)(2)(B) of the Securities Act of 1933, as amended, as long as we are an emerging growth company. An emerging growth company can therefore delay the adoption of certain accounting standards until those standards would otherwise apply to private companies. We intend to take advantage of the benefits of this until we are no longer an emerging growth company or until we affirmatively and irrevocably opt out of this exemption. Our financial statements may therefore not be comparable to those of companies that comply with such new or revised accounting standards.
We will cease to be an emerging growth company at such time as described in the risk factor immediately above. Until such time, however, we cannot predict if investors will find our common stock less attractive because we may rely on these exemptions. If some investors find our common stock less attractive as a result, there may be a less active trading market for our common stock and our stock price may be more volatile and could cause our stock price to decline.
Delaware law and our corporate charter and bylaws contain anti-takeover provisions that could delay or discourage takeover attempts that stockholders may consider favorable.
Our board of directors is authorized to issue shares of preferred stock in one or more series and to fix the voting powers, preferences and other rights and limitations of the preferred stock. Accordingly, we may issue shares of preferred stock with a preference over our common stock with respect to dividends or distributions on liquidation or dissolution, or that may otherwise adversely affect the voting or other rights of the holders of common stock. Issuances of preferred stock, depending upon the rights, preferences and designations of the preferred stock, may have the effect of delaying, deterring or preventing a change of control, even if that change of control might benefit our stockholders. In addition, we are subject to Section 203 of the Delaware General Corporation Law. Section 203 generally prohibits a public Delaware corporation from engaging in a “business combination” with an “interested stockholder” for a period of three years after the date of the transaction in which the person became an interested stockholder, unless (i) prior to the date of the transaction, the board of directors of the corporation approved either the business combination or the transaction which resulted in the stockholder becoming an interested stockholder; (ii) the interested stockholder owned at least 85% of the voting stock of the corporation outstanding at the time the transaction commenced, excluding for purposes of determining the number of shares outstanding (a) shares owned by persons who are directors and also officers and (b) shares owned by employee stock plans in which employee participants do not have the right to determine confidentially whether shares held subject to the plan will be tendered in a tender or exchange offer; or (iii) on or subsequent to the date of the transaction, the business combination is approved by the board and authorized at an annual or special meeting of stockholders, and not by written consent, by the affirmative vote of at least 66 2/3% of the outstanding voting stock which is not owned by the interested stockholder.
Section 203 could delay or prohibit mergers or other takeover or change in control attempts with respect to us and, accordingly, may discourage attempts to acquire us even though such a transaction may offer our stockholders the opportunity to sell their stock at a price above the prevailing market price.
The terms of our Series C Preferred Stock prohibit us from paying dividends in the future. As a result, any return on investment may be limited to the value of our common stock.
The terms of our Series C Preferred Stock prohibit us from paying dividends in the future on our common stock, absent consent from the holders representing a super-majority of the outstanding shares of our Series C Preferred Stock and a certain investor. Because we will likely not pay dividends, our common stock may be less valuable because a return on an investment in our common stock will only occur if our stock price appreciates.
Risks Related to our Series C Preferred Stock
Our Series C Preferred Stock contains covenants that could limit our financing options and liquidity position, which would limit our ability to grow our business.
Covenants in the certificate of designation for our Series C Preferred Stock impose operating and financial restrictions on us. These restrictions prohibit or limit our ability to, among other things:
| ● | incur additional indebtedness; |
| ● | permit liens on assets; |
| ● | repay, repurchase or otherwise acquire more than a de minimis number of shares of common stock, Series A Preferred Stock or Series B Preferred Stock; |
| ● | pay cash dividends to our stockholders; and |
| ● | engage in transactions with affiliates. |
These restrictions may limit our ability to obtain financing, withstand downturns in our business or take advantage of business opportunities. Moreover, debt financing we may seek may contain terms that include more restrictive covenants, may require repayment on an accelerated schedule or may impose other obligations that limit our ability to grow our business, acquire needed assets, or take other actions we might otherwise consider appropriate or desirable.
In addition, the certificate of designation for our Series C Preferred Stock requires us to redeem shares of our Series C Preferred Stock, at each holder’s option and for an amount greater than their stated value, inupon the event thatoccurrence of certain events, including our being subject to a judgment of greater than $100,000 or our initiation of bankruptcy proceedings. Pursuant to an amendment to the terms of our Series C Preferred Stock, because we fail to comply with certain covenants, including if we fail failed to complete a financing or series of related financings by February 12, 2014 that results resulted in gross proceeds to us of at least $3 million at a valuation of at least $30 million or, if at any time after February 12, 2014,and because we fail failed to maintain the listing of our common stock on a trading market for more than five trading days in any twelve month period. In addition, if we fail to completeperiod after February 12, 2014, the aforementioned financing, holders conversion price of our Series C Preferred Stock may alternatively elect to reduce the conversion price of their shares of Series C Preferred Stock was reduced to $1.50 per share.
The holders of our Series C Preferred Stock are entitled to receive a dividend, which may be increased if we do not comply with certain covenants, and are also entitled to receive a make-whole payment if the Series C Preferred Stock is converted into common stock prior to February 12, 2016.
The holders of the Series C Preferred Stock are entitled to a 9% annual dividend on the $1,000 per share stated value of our Series C Preferred Stock, which is payable in cash or, subject to the satisfaction of certain conditions, in pay-in-kind shares. The dividend may be increased to a 18% annual dividend if we fail to comply with certain covenants, including if we failour being subject to complete a financingjudgment of greater than $100,000 or seriesour initiation of related financings by February 12, 2014 that results in gross proceeds to us of at least $3 million at a valuation of at least $30 million or, if at any time after February 12, 2014, we fail to maintain the listing of our common stock on a trading market for more than five trading days in any twelve month period.bankruptcy proceedings . In addition, if a holder of the Series C Preferred Stock converts its shares of Series C Preferred Stock into shares of common stock any time prior to February 12, 2016, the holder will be deemed to have earned a make whole amount equal to the amount that would have been due if such shares of Series C Preferred Stock had been outstanding until such date, which may be paid in cash or pay-in-kind shares, depending upon the availability of funds to us to make such payments and the fulfillment of certain conditions relating to our company and our common stock. As a result of the payment of dividends and the make whole amounts related to our Series C Preferred Stock, we may be obligated to pay significant sums of money or issue significantly more shares of common stock than our Series C Preferred Stock would otherwise be convertible into, which could negatively affect our operations or result in the dilution of the holders of our common stock, respectively.
Our Series C Preferred Stock and our warrants contain anti-dilution provisions that may result in the reduction of their conversion prices or exercise prices in the future.
Our Series C Preferred Stock and our warrants contain anti-dilution provisions, which provisions require the lowering of the conversion price or exercise price, as applicable, to the purchase price of future offerings. Furthermore, with respect to our warrants, if we complete an offering below the exercise price of such warrants, the number of shares issuable under such warrants will be proportionately increased such that the aggregate exercise price payable after taking into account the decrease in the exercise price, shall be equal to the aggregate exercise price prior to such adjustment. If in the future we issue securities for less than the conversion or exercise price of our Series C Preferred Stock and our warrants, respectively, we will be required to further reduce the relevant conversion or exercise prices, and the number of shares underlying the warrants will be increased. We may find it more difficult to raise additional equity capital while our Series C Preferred Stock and our warrants are outstanding.
In addition, in connection with the sale and issuance of our Series C Preferred Stock, we amended the terms of our Series A Preferred Stock and Series B Preferred Stock to reduce each preferred stock’s conversion price. Although we do not intend to reduce the conversion or exercise prices of our outstanding securities in the future, if we do so, the holders of our common stock may experience greater dilution upon the conversion or exercise of our outstanding securities convertible or exercisable into our common stock.
SPECIAL NOTE REGARDING FORWARD-LOOKING STATEMENTS
This prospectus contains “forward-looking statements,” which include information relating to future events, future financial performance, strategies, expectations, competitive environment and regulation. Words such as “may,” “should,” “could,” “would,” “predict,” “potential,” “continue,” “expect,” “anticipate,” “future,” “intend,” “plan,” “believe,” “estimate,” and similar expressions, as well as statements in future tense, identify forward-looking statements. Forward-looking statements should not be read as a guarantee of the occurrence or the expected timing of future performance or results. Forward-looking statements are based on information we have when those statements are made or our management’s good faith belief as of that time with respect to future events, and are subject to risks and uncertainties that could cause actual performance or results to differ materially from those expressed in or suggested by the forward-looking statements. Important factors that could cause such differences include, but are not limited to:
| inability to manufacture our product candidates on a commercial scale on our own, or in collaboration with third parties; |
| difficulties in obtaining financing on commercially reasonable terms; |
| changes in the size and nature of our competition; |
| loss of one or more key executives or scientists; and |
| changes in general, national or regional economic conditions. |
You should review carefully the section entitled “Risk Factors” beginning on page 2 of this prospectus for a discussion of these and other risks that relate to our business and investing in shares of our common stock. We undertake no obligation to update or revise publicly any forward-looking statements, whether as a result of new information, future events or otherwise.
USE OF PROCEEDS
All shares of our common stock offered by this prospectus are being registered for the accounts of the selling stockholders and we will not receive any proceeds from the sale of these shares.
DETERMINATION OF OFFERING PRICE
Because our common stock is not listed or quoted on any exchange or quotation system, the offering price of the shares of common stock was determined by the price of the common stock, on an as-converted basis, that was sold to our security holders pursuant to an exemption under Section 4(2) of the Securities Act of 1933, as amended, and Rule 506 of Regulation D promulgated under the Securities Act of 1933, as amended.
The offering price of the shares of our common stock does not necessarily bear any relationship to our book value, assets, past operating results, financial condition or any other established criteria of value. The facts considered in determining the offering price were our financial condition and prospects, our limited operating history and the general condition of the securities market.
Although our common stock is not listed on a public exchange, we will be filing to obtain a quotation on the OTC Bulletin Board with the filing of this prospectus. In order to be quoted on the OTC Bulletin Board, a market maker must file an application on our behalf in order to make a market for our common stock. There can be no assurance that a market maker will agree to file the necessary documents with the Financial Industry Regulatory Authority, which operates the OTC Bulletin Board, nor can there be any assurance that such an application for quotation will be approved.
In addition, there is no assurance that our common stock will trade at market prices in excess of the initial offering price as prices for the common stock in any public market which may develop will be determined in the marketplace and may be influenced by many factors, including the depth and liquidity.
Our net tangible book value was negative $ 0.49 0.59 per share as of September 30, December 31, 2013.
DIVIDEND POLICYPOLICY
In the past, we have not declared or paid cash dividends on our common stock. In addition, the terms of our Series C Preferred Stock prohibit us from paying dividends in the future on our common stock, absent consent from both the holders representing a super-majority of the outstanding shares of our Series C Preferred Stock and a certain holder of our Series C Preferred Stock. The prohibition on paying dividends will remain in effect so long as at least 15% of the originally issued shares of our Series C Preferred Stock remain outstanding. We will retain future earnings, if any, to fund the operation and expansion of our business and for general corporate purposes.
MANAGEMENT’S DISCUSSION AND ANALYSIS OF
FINANCIAL CONDITION AND RESULTS OF OPERATIONS
You should read the following discussion and analysis of our financial condition and results of operations in conjunction with our financial statements and the related notes thereto that are included in this prospectus. In addition to historical information, the following discussion and analysis includes forward-looking statements that reflect our plans, estimates and beliefs. Our actual results could differ materially from those discussed in the forward-looking statements. Factors that could cause or contribute to these differences include those discussed below and elsewhere in this prospectus, particularly in the section entitled “Risk Factors.” See “Special Note Regarding Forward-Looking Statements.”
Our Business
We are a development stage medical device company that is developing a proprietary technology platform to minimize noise and artifacts from cardiac recordings during electrophysiology studies and ablation. Our product under development, the PURE EP System, is a surface electrocardiogram and intracardiac multichannel recording and analysis system that acquires, processes and displays electrocardiogram and electrograms required during electrophysiology studies and ablation procedures.
We have not generated any revenue to date and consequently our operations are subject to all risks inherent in the establishment of a new business enterprise.
Critical Accounting Policies and Estimates
The following discussion and analysis of our financial condition and results of operations are based upon our financial statements, which have been prepared in accordance with generally accepted accounting principles in the U.S. The preparation of financial statements in accordance with generally accepted accounting principles in the U.S. requires us to make estimates and assumptions that affect the amounts reported in our financial statements. The financial statements include estimates based on currently available information and our judgment as to the outcome of future conditions and circumstances. Significant estimates in these financial statements include allowance for doubtful accounts and accruals for inventory claims. Changes in the status of certain facts or circumstances could result in material changes to the estimates used in the preparation of the financial statements and actual results could differ from the estimates and assumptions.
Among the significant judgments made by management in the preparation of our financial statements are the following:
Research and Development.
We account for research and development costs in accordance with the Accounting Standards Codification subtopic 730-10, Research and Development (“ASC 730-10”). Under ASC 730-10, all research and development costs must be charged to expense as incurred. Accordingly, internal research and development costs are expensed as incurred. Third-party research and developments costs are expensed when the contracted work has been performed or as milestone results have been achieved. Company-sponsored research and development costs related to both present and future products are expensed in the period incurred.
Stock Based Compensation.
All stock-based payments to employees and to nonemployee directors for their services as directors consisted of grants of restricted stock and stock options, which are measured at fair value on the grant date and recognized in the statements of operations as compensation expense over the relevant vesting period. Restricted stock payments and stock-based payments to nonemployees are recognized as an expense over the period of performance. Such payments are measured at fair value at the earlier of the date a performance commitment is reached or the date performance is completed. In addition, for awards that vest immediately and are non-forfeitable, the measurement date is the date the award is issued.
Because there is no viable market for our common stock in order to determine its fair value, we are required to estimate the fair value to be utilized in the determining stock based compensation costs. In estimating the fair value, we consider recent sales of our common stock or common stock equivalents to independent qualified investors, our placement agents’ assessments of the underlying common shares relating to our sale of preferred stock and validation by independent fair value experts. Considerable judgment is necessary to estimate the fair value. Accordingly, actual results could vary significantly from our estimates.
Income Taxes.
Deferred income tax assets and liabilities are determined based on the estimated future tax effects of net operating loss and credit carryforwards and temporary differences between the tax basis of assets and liabilities and their respective financial reporting amounts measured at the current enacted tax rates. We record an estimated valuation allowance on our deferred income tax assets if it is not more likely than not that these deferred income tax assets will be realized. We recognize a tax benefit from an uncertain tax position only if it is more likely than not that the tax position will be sustained on examination by taxing authorities, based on the technical merits of the position. The tax benefits recognized in the financial statements from such a position are measured based on the largest benefit that has a greater than 50% likelihood of being realized upon ultimate settlement.
Results of Operations
We anticipate that our results of operations will fluctuate for the foreseeable future due to several factors, such as the progress of our research and development efforts and the timing and outcome of regulatory submissions. Due to these uncertainties, accurate predictions of future operations are difficult or impossible to make.
Twelve Months Ended September 30, December 31, 2013 Compared to NineTwelve Months Ended September 30, December 31, 2012
Revenues and Cost of Goods Sold. We had no revenues or cost of goods sold during the ninetwelve months ended September 30, December 31, 2013 and 2012.
Research and Development Expenses. Expenses. Research and development expenses for the ninetwelve months ended September 30, December 31, 2013 were $ 774,810, a decrease 992,207, an increase of $ 40,463, 103,259, or 5 %,12 %, from $ 815,273 888,948 for the ninetwelve months ended September 30, December 31, 2012. This decreaseincrease is primarily due to reduced increases in both personnel and research and development consulting services expenses related to the development ofas we develop our proprietary technology platformplatform. Research and development expenses were comprised of $ 632,881 of personnel costs and $ 359,326 consulting services for the twelve months ended December 31, 2013 as compared to $ 586,593 and $ 302,355 for the same period last year, respectively. This increase is primarily due to funding constraints.increases in both personnel and research and development consulting services expenses, including accounting for payments to our scientists as personnel costs, as we develop our proprietary technology platform.
General and Administrative Expenses. Expenses. General and administrative expenses for the ninetwelve months ended September 30, December 31, 2013 were $ 4,570,716, 5,229,252, an increase of $ 3,930,663, 3,866,245, or 728 %,284 %, from $ 640,053 1,363,007 incurred in the ninetwelve months ended September 30, December 31, 2012. This increase is primarily due to increases in payroll related expenses and professional services and, to a lesser extent, due to increases in consulting costs as detailed below.fees and travel, meals and entertainment costs.
Payroll related expenses increased to $ 3,181,878 3,465,680 in the current periodtwelve months ended December 31, 2013 from $ 299,547 $439,625 for the ninetwelve months ended September 30, 2013, December 31, 2012, an increase of $ 2,882,331, 3,026,055, or 962 %. We incurred $ 2,959,865 in688 %. This increase is due to the value of the stock based compensation increasing to $3,247,187 in connection with 2013, as a result of the vesting of stock and stock options issued to board members, officers and employees in the nine months ended September 30, 2013 , as compared to $107,409 in$185,323 of stock based compensation during the same period in 2012.
Professional services for the ninetwelve months ended September 30, December 31, 2013 totaled $ 284,022, 552,481, an increase of $ 162,140, 354,790, or 133 %,179 %, over the $ 121,882 197,691 recognized for the ninetwelve months ended September 30, December 31, 2012. Of professional services, legal fees totaled $ 164,737 309,193 for the ninetwelve months ended September 30, December 31, 2013, an increase of $ 97,755, 198,748, or 146 %,180 %, from $ 66,982 110,445 incurred for the ninetwelve months ended September 30, December 31, 2012. Accounting fees incurred in the ninetwelve months ended September 30, 2013December 31, 2012 amounted to $ 79,308, 93,558, an increase of $ 36,108, 18,608, or 84 %,25 %, from $ 43,200 74,950 incurred infor the same period last year.in 2012. The increase in professional fees was primarily related to increasedan increase in auditing, compensation programs and plans and other legal requirements as we continue to develop our operations.operations, including legal fees associated with our capital raising transactions and the filing of our initial registration statement .
Consulting fees totaled $ 960,103 855,656 for the ninetwelve months ended September 30,December 31, 2013, as compared $29,873 inan increase of $658,363 or 334%, from $ 197,293 for the twelve months ended December 31, 2012. The consulting fees incurred for the nine monthyear ended September 30, 2012. During the nine months ended September 30,December 31, 2013 we incurredincluded $800,823 in stock based compensation for investment and finance consultants to assist in our fund raising and investor relations efforts as a result of to support our increased efforts in market research and potential investor identification.
identification .Travel, meals and entertainment costs for the ninetwelve months ended September 30, December 31, 2013 were $ 90,230, 90,779, a decrease of $17,319,$69,013, or 16 %,43 %, from $ 107,549 159,792 incurred induring the ninetwelve months ended September 30, December 31, 2012. Travel, meals and entertainment costs includeDuring 2013, less travel related to business and technology development. was required than in 2012. Rent for the ninetwelve months ended September 30, December 31, 2013 totaled $ 54,482, 74,005, an increase of $ 329, 1,597, or 1 %,2 %, from $ 54,153 72,408 incurred during the same period in nine months ended September 30, 2012.2011.
Depreciation Expense.Expense. Depreciation expense for the ninetwelve months ended September 30, 2013 totaled $ 12,424, 17,059, an increase of $ 3,347, 7,039, or 37 %,70 %, over the expense of $ 9,077 10,020 incurred during the same period in the nine months ended September 30, 2012, as a result of the purchase of new office computers and other equipment.
Interest Income (expense)Expense. Interest expense for the ninetwelve months ended September 30, December 31, 2013 totaled $ 20,604, 70,061, an increase of $ 20,621 51,775 from interest income of $ 17 18,286 incurred during the same period last year. In the ninetwelve months ended September 30, December 31, 2012. During the twelve months ended December 31, 2013, we accrued estimated liquidated damages of $48,668 relating to our registration rights obligations in connection to the issuance of our Series C preferred stock. In addition, other interest costs were comprised primarily of bridge and related party notes issued in 2012 and early 2013 compared to no interest expense for the nine months ended September 30,late 2012.
Financing Costs. Financing costs for the nine monthsyear ended September 30,December 31, 2013 totaled $ 2,765,599,$3,496,052, an increase of $ 2,686,188,$3,390,171 or 3,384 %3,202% from $ 79,411$105,881 incurred during the nine monthsyear ended September 30,December 31, 2012. Financing costs are primarily related to the fees paid related to the issuance of our Series A and Series B Preferred Stock in 2011 and 2012 and a beneficial conversion feature in and the fees paid related to the issuance of our Series C Preferred Stock issued in 2013. The beneficial conversion feature associated with the Series C Preferred Stock is comprised of the allocated fair value of the conversion feature and the allocated fair value of warrants issued in connection with the sale of the Series C Preferred Stock.
Preferred Stock Dividend. PreferredOur preferred stock dividends for the nine months ended September 30, 2013 totaled $ 211,323, an increase of $ 143,268, or 211 % from $ 68,055 incurred during the nine months ended September 30, 2012. Preferred stock dividends are primarily related to the issuance of our Series A, Series B and Series C Preferred Stock from 2011 through 2013.
dividend Net Loss. As a result of the foregoing, net loss for the nine months ended September 30, 2013 was $ 8,355,475, compared to a net loss of $ 1,611,852 for the nine months ended September 30, 2012.
90,860 General and Administrative Expenses. General and administrative expenses for the twelve months ended December 31, 2012 were $1,363,007, an increase of $878,880, or 181%, from $484,127 incurred in the twelve months ended December 31, 2011. This increase is primarily due to increases in payroll related expenses and professional services and, to a lesser extent, due to increases in consulting fees and travel, meals and entertainment costs.
2012. Depreciation Expense. Depreciation expense for the twelve months ended 2012 totaled $10,020, an increase of $3,225, or 47%, over the expense of $6,795 incurred during the same period in 2011, as a result of the purchase of new office computers and other equipment.
Net Loss. Net loss for the twelve months ended December 31, 2012 2013 was $2,477,002, $ 10,101,846, compared to a net loss of $1,178,101 $ 2,477,002 for the twelve months ended December 31, 2011, 2012, an increase of $1,298,901 $ 7,624,844 or 110.25%307.8 %. The primary reasons for the increase, as described above, are the increase in personnel and consulting services stock based compensation incurred in both research and development and general and administrative expenses coupled with higher interest and financing costs due to our Series B C financing transaction in 2012.2013.
Twelve Months Ended December 31, 2013 Compared to Twelve Months Ended December 31, 2012
As of December 31, 2012,2013, we had a working capital deficit of $472,176, $ 2,715,314, comprised primarily of cash of $24,237 and prepaid expenses and other assets of $245,760, $ 302,187, which was offset by $472,882 $ 819,330 of accounts payable and accrued expenses, short term related party advances of $ 30,781, accrued dividends on preferred stock issuances of $ 414,967 and notes payable of $57,040, liability to the placement agent for our Redeemable Series A and Series B Preferred Stock transactions of $94,500$884,601 and accrued dividends on preferred stock issuances of $117,751.$815,022, respectively. For the twelve months ended December 31, 2012,2013, we used $1,524,956 $1,762,459 of cash in operating activities. Cash provided by financing activities totaled $1,495,650 $ 2,052,125, comprised of proceeds from the sale of our Series C Preferred Stock of $1,768,410, proceeds from the sale of our common stock of $299,974 and proceeds of related party advances of $13,741, net with repayments of related party notes of $ 30,000. In the comparable period in 2012, $647,650 was raised through the sale of our Series B Preferred Stock, of $647,650, proceeds from$ 600,000 through the issuance of convertible bridge notes of $600,000payable and proceeds of related party notes of $248,000. In the comparable period in 2011, $859,900 was raised through the sale of our Series A and B Preferred Stock, $92,500 through the sale of our common stock and $5,500 $248,000 through the issuance of related party notes payable. At December 31, 2012, 2013, we had cash of $24,237 $ 302,187 compared to $69,020 $ 24,237 at December 31, 2011. 2012. Our cash is held in bank deposit accounts. At December 31, 2012, 2013, we had $613,812 of no convertible debentures outstanding as compared to no convertible debentures outstanding$613,812 at December 31, 2011.2012.
Cash used in operations for the twelve months ended December 31, 2013 and 2012 was $ 1,762,459 and 2011 was $1,524,956 and $838,367, $ 1,524,956, respectively, which represent cash outlays for research and development and general and administrative expenses in such periods. Increase in cash outlays principally resulted from increased research and development and general and administrative expenses due to the continued development of our operations.
Cash used in investing activities for the twelve months ended December 31, 2012 2013 was $15,477, $ 11,716, compared to $56,547$ 15,477 for the twelve months ended December 31, 2011. In2012. During both the twelve months ended December 31, 2013 and the twelve months ended December 31, 2012, and 2011, we purchased office furniture and computer equipment of $15,477 and $31,547, respectively. In the twelve months ended December 31, 2011, we paid a real estate deposit relating to our office lease of $25,000, which we did not have to pay in 2012. .
In their report dated May 7, 2013, March 27, 2014 , our independent registered public accounting firm stated at December 31, 2012, 2013, there is substantial doubt about our ability to continue as a going concern. Our ability to continue as a going concern is an issue raised due to our net losses and negative cash flows from operations since inception and our expectation that these conditions will continue for the foreseeable future. In addition, we will require additional financing to fund future operations. Further, we do not have any commercial products available for sale and have not generated revenues to date, and there is no assurance that, if approval of our products is received, we will be able to generate cash flow to fund operations. In addition, there can be no assurance that our research and development will be successfully completed or that any product will be approved or commercially viable. Our ability to continue as a going concern is subject to our ability to obtain necessary funding from outside sources, including obtaining additional funding from the sale of our securities, obtaining loans from various financial institutions or being awarded grants from government agencies, where possible. Our continued net operating losses increase the difficulty in meeting such goals and there can be no assurances that such methods will prove successful.
Our Series C Preferred Stock contains triggering events which would, among other things, require redemption (i) in cash, at the greater of (a) 120% of the stated value of $1,000 or (b) the product of (I) the variable weighted average price of our common stock on the trading day immediately preceding the date of the triggering event and (II) the stated value divided by the then conversion price or (ii) in shares of our common stock, equal to a number of shares equal to the amount set forth in (i) above divided by 75%. The triggering events include our failure being subject to complete a financingjudgment of greater than $100,000 or seriesour initiation of related financings by February 12, 2014 that results in gross proceeds to us of at least $3 million at a valuation of at least $30 million, and our failure to maintain the listing of our common stock on a trading market for more than five trading days in any twelve month period at any time after February 12, 2014. bankruptcy proceedings. If any of the triggering events contained in our Series C Preferred Stock occur, the holders of our Series C Preferred Stock may demand redemption, an obligation we may not have the ability to meet at the time of such demand. We will be required to pay interest on any amounts remaining unpaid after the required redemption of our Series C Preferred Stock, at rate equal to the lesser of 18% per annum or the maximum rate permitted by applicable law.
We expect to incur losses from operations for the near future. We expect to incur increasing research and development expenses, including expenses related to clinical trials. We expect that our general and administrative expenses will increase in the future as we expand our business development, add infrastructure and incur additional costs related to being a public company, including incremental audit fees, investor relations programs and increased professional services.
Our future capital requirements will depend on a number of factors, including the progress of our research and development of product candidates, the timing and outcome of regulatory approvals, the costs involved in preparing, filing, prosecuting, maintaining, defending and enforcing patent claims and other intellectual property rights, the status of competitive products, the availability of financing and our success in developing markets for our product candidates. We believe our existing cash will not be sufficient to fund our operating expenses and capital equipment requirements. We anticipate we will need approximately $2 million in addition to our current cash on hand to fund our operating expenses and capital equipment requirements for the next 12 months. We will have to raise additional funds to continue our operations and, while we have been successful in doing so in the past, there can be no assurance that we will be able to do so in the future. Our continuation as a going concern is dependent upon our ability to obtain necessary additional funds to continue operations and the attainment of profitable operations.
Future financing may include the issuance of equity or debt securities, obtaining credit facilities, or other financing mechanisms. Even if we are able to raise the funds required, it is possible that we could incur unexpected costs and expenses or experience unexpected cash requirements that would force us to seek alternative financing. Furthermore, if we issue additional equity or debt securities, existing holders of our securities may experience additional dilution or the new equity securities may have rights, preferences or privileges senior to those of existing holders of our securities.
If additional financing is not available or is not available on acceptable terms, we may be required to delay, reduce the scope of or eliminate our research and development programs, reduce our commercialization efforts or obtain funds through arrangements with collaborative partners or others that may require us to relinquish rights to certain product candidates that we might otherwise seek to develop or commercialize independently.
Off-Balance Sheet Arrangements
We do not have any off-balance sheet arrangements.
History
We were formed as BioSig Technologies, Inc., a Nevada corporation, in February 2009 and in April 2011 we merged with our wholly-owned subsidiary, BioSig Technologies Inc., a Delaware corporation, with the Delaware corporation continuing as the surviving entity. In September 2011, we completed a private placement of our Series A Preferred Stock to certain accredited investors, with gross proceeds of $922,000 and, in April 2012, we completed a private placement of our Series B Preferred Stock to certain accredited investors, with gross proceeds of $887,500. In July 2013, we completed a private placement of our Series C Preferred Stock and warrants to purchase our common stock to certain accredited investors, with gross proceeds of $2,781,000, including the conversion of $600,000 of our outstanding bridge notes.
Overview
We are a development stage medical device company that is developing a proprietary technology platform to minimize noise and artifacts from cardiac recordings during electrophysiology studies and ablation. We are developing the PURE EP System, a surface electrocardiogram and intracardiac multichannel recording and analysis system that acquires, processes and displays electrocardiogram and electrograms required during electrophysiology studies and ablation procedures.
The PURE (Precise Uninterrupted Real-time evaluation of Electrograms) EP System is designed to assist electrophysiologists in making clinical decisions in real-time by providing information that, we believe, is not easily obtained, if at all, from any other equipment presently used in electrophysiology labs. PURE EP System’s ability to acquire high fidelity cardiac signals will potentially increase these signals’ diagnostic value, and therefore offer improved accuracy and efficiency of the EP studies and related procedures. We are developing signal processing tools within the PURE EP System, which we call confidence indexes. We believe that these will assist electrophysiologists in further differentiating true signals from noise, and will provide guidance in identifying ablation targets.
Since June 2011, we have collaborated with physicians affiliated with the Texas Cardiac Arrhythmia Institute at St. David’s Medical Center in Austin, Texas for initial technology validation. The physicians affiliated with the Texas Cardiac Arrhythmia Institute has provided us with digital recordings obtained with conventional electrophysiology recording systems during different stages of electrophysiology studies. Using our proprietary signal processing tools that are part of the PURE EP System, we analyzed these recordings and successfully removed baseline wander, noise and artifacts from the data thereby providing better diagnostic quality signals.
We are focused on improving the quality of cardiac recordings obtained during ablation of atrial fibrillation, the most common cardiac arrhythmia, and ventricular tachycardia, an arrhythmia evidenced by a fast heart rhythm originating from the lower chambers of the heart, which can be life-threatening. Cardiac ablation is a procedure that corrects conduction of electrical impulses in the heart that cause arrhythmias. During this invasive procedure, a catheter is usually inserted using a venous access into a specific area of the heart. A special radiofrequency generator delivers energy through the catheter to small areas of the heart muscle that cause the abnormal heart rhythm. According to a 2009 article in Circulation: Arrhythmia and Electrophysiology, ablation is superior to pharmacological treatments and is becoming a first line of therapy for certain patients with arrhythmias (“Treatment of Atrial Fibrillation With Antiarrhythmic Drugs or Radiofrequency Ablation,” Circulation: Arrhythmia and Electrophysiology 2: 349-361 (2009)).
Our overall goal is to establish our proprietary technology as a new platform that will have the following advantages over the electrophysiology recording systems currently available on the market:
| | ● | Higher quality cardiac signal acquisition for accurate and more efficient electrophysiology studies; |
| ● | Precise, uninterrupted, real time evaluations of electrograms; |
| ● | Reliable cardiac recordings to better determine precise ablation targets, strategy and end point of procedures; and |
| ● | A portable device that can be fully integrated into existing electrophysiology lab environments. |
If we are able to develop our product as designed, we believe that the PURE EP System and its signal processing tools will contribute to an increase in the number of procedures performed in each electrophysiology lab and possibly improved patient outcomes.
Our significant scientific achievements to date include:
| ● | Initial system concept validation has been performed in collaboration with physicians at the Texas Cardiac Arrhythmia Institute at St. David’s Medical Center in Austin, Texas in June 2011. The Texas Cardiac Arrhythmia Institute provided challenging recordings obtained with electrophysiology recording systems presently in use at the institute during various electrophysiology studies. Our technology team successfully imported the data into the PURE EP System and using proprietary signal processing, the PURE EP System was able to reduce baseline wander, noise, and artifacts from the data and therefore provide better diagnostic quality signals. |
| ● | We have established clinical and/or advisory relationships for both technology development and validation studies with physicians and researchers affiliated with the following medical centers: Texas Cardiac Arrhythmia Institute, Austin, TX; Cardiac Arrhythmia Center at the University of California at Los Angeles, Los Angeles, CA; Mount Sinai Medical Center, New York, NY; Beaumont Medical Center, Detroit, MI; University Hospitals Case Medical Center, Cleveland, OH; and The Heart Rhythm Institute, University of Oklahoma Health Sciences Center, Oklahoma City, OK. |
| ● | As part of our pre-clinical trials, physicians affiliated with the Texas Cardiac Arrhythmia Institute, University Hospitals Case Medical Center and Mount Sinai Medical Center provide us with recordings from challenging ablation procedures, mainly for ventricular tachycardia and atrial fibrillation, where the attending electrophysiologists face clinical dilemmas with the recordings obtained by their current recording systems. We believe that the recordings that the PURE EP System has provided them, which show a reduction in baseline wander, noise, and artifacts, are of higher diagnostic value than the original recordings. |
| ● | The Cardiac Arrhythmia Center at the University of California at Los Angeles and Dr. Kalyanam Shivkumar, a member of our board of directors, have played a significant role in the initial functional testing of our hardware. Dr. Shivkumar and his team have enabled us to learn the connectivity of the lab and its devices that pertain to where our PURE EP System will fit in. In June 2013, we commenced our first proof-of-concept animal study with the assistance of Dr. Shivkumar. |
| ● | We are developing a confidence index that will assist electrophysiologists in further differentiating true signals from noise, which may potentially provide guidance in identifying ablation targets. The confidence index is expected to be an integral part of the software of the PURE EP System, which we believe will significantly facilitate the locating of ablation targets. |
Because we are an early development stage company, with our initial product under development, we currently do not have any customers. We anticipate that our initial customers will be hospitals and other health care facilities that operate electrophysiology labs.
Our Industry
Electrophysiology is the study of the propagation of electrical impulses throughout the heart. Electrophysiology studies are focused on the diagnosis and treatment of arrhythmias, a medical condition in which conduction of electrical impulses within the heart vary from the normal. Such conditions may be associated with significant health risks to patients. The invasive cardiac electrophysiology study for the evaluation of cardiac conduction disorders has evolved rapidly from a research tool to an established clinical treatment. This technique permits detailed analyses of the mechanism underlying cardiac arrhythmias and determines precise locations of the sites of origin of these arrhythmias, thereby aiding in treatment strategies.
Pharmacological, or medicine-based, therapies have traditionally been used as initial treatments, but they often fail to adequately control the arrhythmia and may have significant side effects. Catheter ablation is now often recommended for an arrhythmia that medicine cannot control. Catheter ablation involves advancing several flexible catheters into the patient’s blood vessels, usually either in the femoral vein, internal jugular vein or subclavian vein. The catheters are then advanced towards the heart. Electrical impulses are then used to induce the arrhythmia and local heating or freezing is used to ablate (destroy) the abnormal tissue that is causing it. Catheter ablation of most arrhythmias has a high success rate and multiple procedures per patient have been found to be more successful. One recent study found that arrhythmia-free survival rates after a single catheter ablation procedure were 40%, 37%, and 29% at one, two and five years, respectively, with most recurrences over the first six months (“Catheter Ablation for Atrial Fibrillation - Are Results Maintained at 5 Years of Follow-Up?” J Am Coll Cardiol. 2011;57(2):160-166). Another study stated that catheter ablation of atrial fibrillation has been shown to be effective in approximately 80% of patients after 1.3 procedures per patient, with approximately 70% of such patients requiring no further antiarrhythmic drugs during intermediate follow-up (Updated Worldwide Survey on the Methods, Efficacy, and Safety of Catheter Ablation for Human Atrial Fibrillation Circulation: Arrhythmia and Electrophysiology. 2010; 3: 32-38).
Catheter ablation is usually performed by an electrophysiologist (a specially trained cardiologist) in a catheterization lab or a specialized electrophysiology lab. It is estimated that there are about 2,000 electrophysiology labs in the U.S. and 2,000 electrophysiology labs outside the U.S., each with an electrophysiology recording system costing an average of $250,000. We believe that the current value of the electrophysiology recording device market in the U.S. is approximately $500 million, based upon the number of electrophysiology labs in U.S. and the average cost of the recording system in each lab. With the potential of 12 million atrial fibrillation patients by the year 2050 (according to the Atrial Fibrillation Fact Sheet, February 2010, published by the Centers for Disease Control and Prevention) and improvements in technology for atrial fibrillation ablation therapy, significant growth is predicted for the number of hospitals building electrophysiology labs. A July 2012 report published by the Millennium Research Group predicted rapid growth in the U.S. market for electrophysiology mapping and ablation devices from 2012 to 2016, due to the medical community’s growing focus on treating atrial fibrillation. The report further predicts that even with advances in drug treatments and management devices to treat or manage arrhythmias, the electrophysiology mapping and ablation device market will be sustained by the continued development of advanced technologies that decrease ablation procedure times and improve success rates. According to a 2011 report by Axis Research Mind, “Global Electrophysiology Devices – Market Growth Analysis, 2009-2015,” total global electrophysiology devices market is forecasted to reach at $4.4 billion by 2015 with a compound annual growth rate of 9.7%.
Treatment of Atrial Fibrillation and Ventricular Tachycardia
We believe that the clearer recordings and additional information provided by the PURE EP System may improve outcomes during electrophysiology studies and ablation procedures for a variety of arrhythmias. For patients who are candidates for ablation, an electrophysiology study is necessary to define the targeted sites for the ablation procedure. Two common, yet complex, conditions for which ablation procedures are performed are atrial fibrillation and ventricular tachycardia. We believe that in the near future, the PURE EP System may have a great impact on assisting ablation strategies for these conditions.
Most cardiac arrhythmias are well understood and ablation simply requires destroying a small area of heart tissue possessing electrical abnormality. In contrast, complex arrythmias, such as atrial fibrillation and ventricular tachycardia, have complex pathophysiology and because knowledge of their origins and mechanisms are incomplete, ablation treatments for these arrhythmias are largely empirical. Catheter ablation is now an important option to control recurrent ventricular tachycardias (“EHRA/HRS Expert Consensus on Catheter Ablation of Ventricular Arrhythmias,” Europace (2009)11 (6): 771-817). Catheter ablation of ventricular tachycardia in nonischemic heart diseases can be challenging, and outcomes across different diseases are incompletely defined (“Catheter Ablation of Ventricular Tachycardia in Nonischemic Heart Disease,” Circulation: Arrhythmia and Electrophysiology (2012) 5: 992-1000). In addition, limitations of atrial fibrillation ablation include the use of catheters designed for pinpoint lesions to perform large area ablations in a point-by-point fashion, and the dexterity required to perform the procedure (“New Technologies in Atrial Fibrillation Ablation,” Circulation (2009)). Furthermore, the length of these procedures exposes the physician and staff to extensive radiation, requiring them to wear heavy lead vests. Consequently, ablating atrial fibrillation and ventricular tachycardia have been regarded as being extremely difficult. Therefore, access to these procedures has been limited to being performed by only especially well-trained cardiologists.
According to the National Institute of Health National Heart Lung and Blood Institute, there are approximately 3 million Americans suffering with atrial fibrillation and about 850,000 patients are hospitalized annually for this condition. As many as 600,000 new cases of atrial fibrillation are diagnosed each year. According to the Millennium Research Group, despite the fact that physicians have been performing radiofrequency ablations since the 1990s, catheter-based treatment is offered to less than 1% of the atrial fibrillation patient population in the U.S. and Europe. We believe that the number of ablation procedures will grow with further advances in ablation treatment and diagnostic techniques. Studies have demonstrated the effectiveness of atrial fibrillation ablation as compared to anti- arrhythmic drug therapy, which has led to ablation’s acceptance as a primary treatment strategy. The American College of Cardiology Foundation/American Heart Association Task Force reported that catheter-directed ablation of atrial fibrillation represents a substantial achievement that promises better therapy for a large number of patients presently resistant to pharmacological or electrical conversion to sinus rhythm (“2011 ACCF/AHA/HRS Focused Update on the Management of Patients With Atrial Fibrillation (Updating the 2006 Guideline)”). However, rates of success and complications may vary, sometimes considerably.
According to the Heart Rhythm Society, ventricular tachycardia is the most dangerous arrhythmia since it may result in ventricular fibrillation, a rapid chaotic heartbeat in the lower chambers of the heart. Because the fibrillating muscle cannot contract and pump blood to the brain and vital organs, ventricular fibrillation is the number one cause of sudden cardiac death accounting for more than 350,000 deaths in the U.S. each year. Ventricular tachycardia is typically treated with implantable cardioverter defibrillators, or ICDs, or a combination of ablation along with an ICD. The American College of Cardiology/American Heart Association Task Force on Practice Guidelines/European Society of Cardiology Committee for Practice Guidelines, or ACC/AHA/ESC, 2009 guidelines recommend ablation in patients who either have sustained predominantly monomorphic ventricular tachycardia that is drug resistant, are drug intolerant or do not wish for long-term drug therapy. According to a recent study, catheter ablation has been found to reduce ventricular tachycardia/ventricular fibrillation recurrences and thereby ICD interventions, including ICD shocks, by approximately 75% in patients that have undergone multiple ICD shocks (Kuck, “Should Catheter Ablation be the Preferred Therapy for Reducing ICD Shocks? Ventricular Tachycardia in Patients With an Implantable Defibrillator Warrants Catheter Ablation,” Circulation: Arrhythmia and Electrophysiology (2009; 2: 713-720)). More importantly, according to Kuck, catheter ablation is the only treatment that can terminate and eliminate incessant ventricular tachycardia and acutely abolish electrical storm in ICD patients. Typically, patients who receive ICDs are at high risk for recurrent arrhythmia; hence, most patients receive one or more ICD therapies for spontaneous arrhythmias after implantation. Despite the technological evolution of ICD systems, more than 20% of shocks are due to supraventricular arrhythmia and hence are inappropriate. Although the ICD aborts ventricular tachycardia/ventricular fibrillation, many patients continue to have symptoms. These shocks are physically and emotionally painful and lead to poor quality of life and adverse psychological outcomes in patients and their families.
According to Dr. Srijoy Mahapatra, the status of ventricular tachycardia ablation is growing at a 14-17% growth rate due to the fact that ablation of ventricular tachycardia may help patients feel better and live longer, despite the risks, including the occurrence of stroke, and the modest success rates. The success of ventricular tachycardia ablation varies, depending on the patient’s specific heart condition that caused ventricular tachycardia. The procedure is most effective in patients with otherwise normal hearts, in whom the success rate exceeds 90%. In patients with structural heart disease resulting from scar or cardiomyopathy, success rates range between 50% and 75% at six to 12 months. In cases in which a patient experiences a recurrence, two of three patients will still have less ventricular tachycardia than before the initial ablation (Circulation. 2010; 122: e389-e391). Therefore, we believe that ablation will continue to become a preferred treatment for ventricular tachycardia, especially in light of the challenges presented by ICD therapies; this increase in demand for ablation procedures will likely also increase the demand for technological advances in medical devices essential to ablation procedures, including electrophysiology recorders, in order to better support and ablation procedures.
Electrophysiology Lab Environment and Electrophysiology Recording Systems
The electrophysiology lab environment and recording systems create significant amounts of noise and artifacts during electrophysiology procedures. Current surface and intracardiac recording systems typically consist of large workstations interconnected by a complex set of cables that contribute to significant amounts of noise during signal acquisition. Additional noise and artifacts generated from the electrophysiology lab equipment further hamper recordings of small electrophysiological potentials. Preserving spaciotemporal (space and time) characteristics of the signal in a very challenging electrophysiology recording environment is a difficult task. To remove noise and artifacts, recorders that are currently on the market offer a family of low pass, high pass and notch filters, but these filters alter signal information context.
The shape and amplitude of electrocardiograms, unipolar and bipolar electrograms, and, consequently, reconstructed endocardial and epicardial maps, are influenced not only by electrophysiological and structural characteristics of the myocardial tissue involved, but with characteristics of the recording system. Amplitude and morphology of electrocardiogram and intracardiac signals are significantly affected by filters used to remove noise. Because of the number of amplitude and interval measurements made during an electrophysiology study, it is imperative that the recording system faithfully acquires surface electrocardiogram and intracardiac electrograms. We believe that the recording systems that are currently available on the market are ineffective in preserving the optimal amount of original information contained in the cardiac signals.
In addition, the electrophysiology lab consists of sophisticated equipment that requires an electrophysiologist to mentally integrate information from a number of sources during procedures. There are numerous monitors in an electrophysiology lab that provide and display this variety of information. An electrophysiologist needs to evaluate the acquired cardiac signals and the patient’s responses to any induced arrhythmias during the procedure. However, it is difficult for an electrophysiologist to synthesize the disparate information produced by the numerous monitors in the lab and calculate the real-time, three-dimensional orientation of the anatomy and the location of the recording and ablation catheters. As the number of electrophysiology procedures increase, a variety of diagnostic and therapeutic ablation catheters are becoming more widely available and new highly specialized catheters are being developed. In addition, remote robotic and magnetic navigation systems are being developed to address limitations of dexterity in controlling the catheter tip, especially during complex arrhythmia ablation procedures. We believe that, considering the improvements being made with respect to other equipment used in the electrophysiology lab and the continual increase of ablation procedures, the electrophysiology recorders currently available on the market are not sufficiently advanced with respect to the quality of their recordings to deliver adequate results. We believe that the PURE EP System will be able to deliver superior quality of recordings that will allow it to successfully integrate with the other advanced equipment found in the electrophysiology lab.
The requirement for optimal signal integrity is further amplified during ablation treatments of atrial fibrillation and ventricular tachycardia. Presently, one of the main objectives of the atrial fibrillation ablation procedure is to precisely identify, ablate and eliminate pulmonary vein potentials and one of the main objectives of the ventricular tachycardia procedure is to map the arrhythmia substrate and precisely identify, ablate and eliminate small abnormal potentials. The information provided by recorders is essential for an electrophysiologist to determine ablation strategy during termination of both pulmonary vein potentials and ventricular tachycardia. Therefore, it is important that the recording system’s noise removal technique does not alter appearance and fidelity of these potentials. As a result, it is necessary that any new signal processing preserves signal fidelity as much as possible during electrophysiology recordings; otherwise, the signals that are needed to guide the ablation procedures will be difficult to distinguish due to noise interference.
Our Products
We intend to bring to the electrophysiology market the PURE EP System, an electrocardiogram/intracardiac recorder that will be coupled with an array of software tools intended for electrophysiology studies and procedures ranging from simple diagnostic tests to ablation for the most complex cases of arrhythmias. We believe that this system will provide unique recording capabilities because we are developing it to allow precise, uninterrupted, real-time evaluations of electrocardiograms and electrograms, and allow electrophysiologists to obtain data that cannot be acquired from present day recorders.
The PURE EP System uses a combination of analog and digital signal processing to acquire and display cardiac data. Because our technology consists of proprietary hardware, software and algorithms, the original cardiac data is not distorted. In addition, we are developing a library of software tools that are designed to be configured to fit the needs of electrophysiologists in different settings and/or for different arrhythmia treatments. With the software, the PURE EP System can be positioned to provide information that can be used by electrophysiologists to help guide the ablation catheter; shorten procedure times; and can reduce the complexity of maneuvers necessary for identifying ablation targets for various arrhythmias, including atrial fibrillation and ventricular tachycardia. The PURE EP system is intended to be used in addition to existing electrophysiology recorders. We believe that the less distorted cardiac data provided by the PURE EP system will increase the workload ability and enhance the capabilities of the typical electrophysiology laboratory.
Initial Analysis
According to S. J. Asirvatham, MD, et. al. (“Signals and Signal Processing for the Electrophysiologist,” Circ Arrhythm Electrophysiol. 2011;4:965-973), recording environments in a typical electrophysiology laboratory presents challenging situations. S. J. Asirvatham, MD, et. al., state, “Successful mapping and ablation in the electrophysiology laboratory is critically dependent on acquiring multiple, low-amplitude, intracardiac signals in the presence of numerous sources of electric noise and interference and displaying these signals in an uncomplicated and clinically relevant fashion, with minimal artifacts. This represents a significant engineering challenge and, in real-life electrophysiology laboratory, is not always successful.”
To determine and validate the state of present electrophysiology recording technology in the field, we completed a detailed analysis of the effect of filters used by existing EP recorders to reduce noise on spaciotemporal characteristics of electrocardiograms and intracardiac electrograms. We used a custom built electrocardiogram/intracardiac simulator with a database of various electrocardiogram signals combined with electrophysiology signals, along with waveforms from publicly available databases. The ability to faithfully reproduce database waveforms generated by an electrocardiogram/intracardiac simulator was tested using the PURE EP System and conventional electrophysiology recorders, the GE CardioLab and St. Jude EP-WorkMate.
To validate present technology in the field, we completed a detailed analysis of the effect of filters used by existing EP recorders to reduce noise on spaciotemporal characteristics of electrocardiograms and intracardiac electrograms. We used a custom built electrocardiogram/intracardiac simulator with a database of various electrocardiogram signals combined with electrophysiology signals, along with waveforms from publicly available databases. The ability to faithfully reproduce database waveforms generated by an electrocardiogram/intracardiac simulator was tested using the PURE EP System and conventional electrophysiology recorders, the GE CardioLab and St. Jude EP-WorkMate.
We evaluated the signal quality (amplitude, morphology and duration) of the different recorders, along with the ability of the recorders to reduce noise level and remove baseline wander, which are the cardiac signals that have shifted from the isoelectric line (the base line of the signal tracing). The electrocardiogram and intracardiac signals subjected to the PURE EP System’s signal processing showed less baseline wander, noise and artifacts compared to the conventional electrophysiology recorders (as evidenced in the picture below from our initial validation). Further, spaciotemporal characteristics of signals were greatly distorted by the conventional electrophysiology system, particularly when a notch filter was used, as compared to the recording of the same spaciotemporal characteristics by the PURE EP System. A notch filter is used to remove a specific frequency from the signal, especially either 60Hz in the U.S. and 50Hz in Europe, and can be implemented in hardware or software.
While preliminary analysis of the data from this study has been performed, the analysis of the data will be presented more formally in the future in conjunction with data from our other studies , including our proof-of-concept animal study . As such, our data has not been subjected to any third-party review, as would be required for the publication of a formal study. If we are able to demonstrate a similar level of success in removing baseline wander and reducing noise level for our planned pre-clinical, animal and clinical studies and trials, we believe that the PURE EP System’s signal processing will become a vital part of electrophysiology labs and will greatly assist in the ablation treatment for complex arrhythmias, including atrial fibrillation and ventricular tachycardia.
During initial software validation of the PURE EP System, Texas Cardiac Arrhythmia Institute provided data from its current recording system (ABLd, the ablation catheter’s distal electrode situated at the tip of the catheter, furthest from the handle) that was recorded in an electrophysiology laboratory that presented a real-life challenging recording environment. The PURE EP System removed baseline wander, noise and artifacts and provided a clean signal (ABLd PURE) to assist in identification of ablation sites.
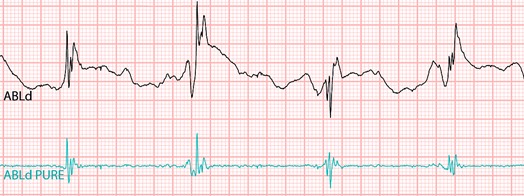
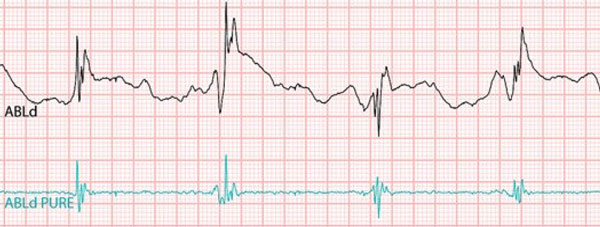
Screen shot of the PURE EP System’s software analyzing data from an EP study.
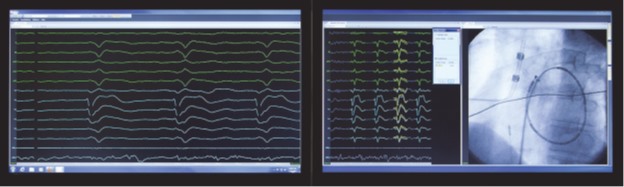

Growth Strategy
Technology and Development Plan
Our technology team consists of six engineers with expertise in digital signal processing, low power analog and digital circuit design, software development, embedded system development, electromechanical design, testing and system integration, and the regulatory requirements for medical devices. We have also entered into collaboration agreements with advisors and medical institutions in the fields of cardiology and electrophysiology, including the Texas Cardiac Arrhythmia Institute (see “–Strategic Alliances”). We currently intend to outsource manufacturing, assembling, and testing.
We are currently conducting retrospective proof-of-concept studies using the PURE EP System to analyze electrophysiology recordings obtained by existing electrophysiology recorders.recorders in both electrophysiology labs and animal labs . We believe these retrospective studies will be completed by the first half of 2014. We intend to conduct more formal animal studies using the PURE EP System and initial human clinical trials . Our objective is to complete all studies by the fourth first quarter of 2014.2015. We have also begun planning and implementing steps for obtaining 510(k) approval from the U.S. Food and Drug Administration for the PURE EP System. We believe that by first half of 2015, we will have obtained 510(k) marketing clearance from the FDA and will be able to commence marketing and commercialization of the PURE EP System.
Strategic Alliances
We formed a scientific advisory board in order to foster collaborations with physicians in the global electrophysiology market to help test and commercialize our PURE EP System. We also plan to develop studies, beginning with studies with physicians and researchers affiliated with the UCLA Cardiac Arrhythmia Center and the Texas Cardiac Arrhythmia Institute that are intended to demonstrate clinical advantages, build scientific evidence and accelerate technology awareness and market adoption of the PURE EP System. Thus far, we have we have developed both formal, compensated relationships with physicians and researchers, as well as more informal relationships with physicians and researchers that have provided us with data to be read by the PURE EP System, as well as advice and consulting services at no cost to us.
Beginning in the second quarter of 2011, we have collaborated, and continue to collaborate, with Dr. Andrea Natale of the Texas Cardiac Arrhythmia Institute and Dr. Luigi Di Biase of the Montefiore Einstein Center for Heart and Vascular Care in New York, who had previously worked with other companies such as St. Jude Medical, Boston Scientific, Biosense Webster, Inc., and Medtronic, Inc. Drs. Natale and Di Biase have provided their advisory and consulting services to us at no cost. We have also developed informal advisory relationships with physicians and researchers at other electrophysiology centers including Beaumont Medical Center, Detroit, MI, and the Heart Rhythm Institute at the University of Oklahoma Health Sciences Center. These relationships consist of the physicians and researchers reviewing our data and technology and providing us advice. To date, we have not entered into any agreements with these physicians and researchers, nor have we compensated them in any way. As explained below, we have entered into formal agreements with physicians affiliated with University Hospitals Case Medical Center in Cleveland, University of California at Los Angeles Cardiac Arrhythmia Center and Mount Sinai Hospital Cardiovascular Institute in New York. We envision beginning clinical trials or other further studies of our products at some or all of these institutions in 2014.
On March 30, 2012, we entered into a consulting agreement with Dr. Mauricio Arruda, who is affiliated with University Hospitals Case Medical Center in Cleveland, pursuant to which Dr. Arruda would provide us with advisory services related to the development and implementation of software and/or hardware designed for the purpose of mapping cardiac signals during electrophysiologic studies in exchange for a fee of $3,000 per day or occurrence or $300 per hour, depending upon the nature of the services we requested, in addition to reimbursement for reasonable expenses. Our agreement with Dr. Arruda renews annually unless terminated by either party at least 30 days prior to the renewal.
On February 12, 2013, we entered into a consulting agreement with Dr. Rony Shimony, who is affiliated with Mount Sinai Hospital Cardiovascular Institute in New York, pursuant to which Dr. Shimony would provide us with advisory services related to our PURE EP System in exchange for a grant of an option to purchase 283,750 shares of our common stock with an exercise price of $2.09 per share with the following vesting schedule: (i) 48,611 shares vest on the first, second and third monthly anniversaries of the February 12, 2013, and (ii) one twenty fourth (1/24) of the remaining 137,917 shares vest on each monthly anniversary of the February 12, 2013,, provided on each such vesting date Dr. Shimony is still providing services to us. We will also reimburse Dr. Shimony for reasonable expenses. Our agreement with Dr. Shimony has a term of two years unless otherwise earlier terminated by either party.
On April 1, 2013, we entered into a consulting agreement with Dr. Vivek Reddy, who is affiliated with Mount Sinai Hospital Cardiovascular Institute in New York, pursuant to which Dr. Reddy would provide us with advisory services related to our PURE EP System in exchange for a grant of an option to purchase 30,000 shares of our common stock with an exercise price of $2.09 per share and vesting in equal amounts every month for nine months, in addition to reimbursement for reasonable expenses. Our agreement with Dr. Reddy has a term of one year unless otherwise earlier terminated by either party.
In June 2013, we commenced our first proof-of-concept animal study with the assistance of our director Dr. Kalyanam Shivkumar, who is affiliated with the Cardiac Arrhythmia Center at the University of California at Los Angeles. Dr. Shivkumar is not receiving any additional compensation for his assistance with our animal study.
Competition
The electrophysiology market is characterized by intense competition and rapid technological advances. There are currently four large companies that share the majority of the electrophysiological recording market share. They produce the following electrophysiology recording systems, each with a unit price of approximately $250,000 per unit:
| ● | GE’s CardioLab Recording System was developed in the early 1990s by Prucka Engineering and was acquired by GE in 1999. |
| ● | Bard’s LabSystem PRO EP Recording System was originally designed in the late 1980s. |
| ● | Siemens developed the Axiom Sensis XP in 2002. |
| ● | St. Jude Medical’s EP-WorkMate Recording System was acquired from EP MedSystems in 2008, which had received approval for the product from the U.S. Food and Drug Administration in 2003. |
Based upon our analysis of data taken from patent applications filed with the U.S. Patent and Trademark Office and 510(k) approval applications filed with the U.S. Food and Drug Administration, we believe that the above recording systems are built on relatively old technologies and all use the identical approach in applying digital filters to remove noise and artifacts. We are of the opinion that such an approach sacrifices cardiac signal fidelity and, in the case of ablation, the filters have a direct impact on the ablation strategy of an electrophysiologist. The imprecise method to remove noise and artifacts used by the old recorders could be a contributing factor to the multiple (or repeated) ablation procedures that are frequently required in order to completely cure patients from atrial fibrillation and ventricular tachycardia. We are not currently aware of any other companies that are developing new recording technology for electrophysiology recorders.
Suppliers
The PURE EP System contains proprietary hardware and software modules that are assembled into the system. Hardware boards contain components that are available from different distributors. The parts used to manufacture analog and digital boards are readily available from a number of distributors or manufacturers. We obtained components from various suppliers and have assembled our first prototype in-house. We envision outsourcing manufacturing of the complete PURE EP System to a local medical device manufacturer in California.
Research and Development Expenses
Research and development expenses for the fiscal years ended December 31, 2012 and 2011 were $888,948 and $582,525, respectively.
Sales, Marketing and Customer Service
We plan to implement a market development program prior to launch of our PURE EP System. As the product progresses through development and testing, we intend to gather the data produced by the PURE EP System’s processing and presenting electrocardiogram and intracardiac signals and use such data for posters, presentations at cardiology conferences, and, if appropriate, submissions to scientific journals. We believe that as we gather additional data from our existing proof-of-concept tests and our planned animal and clinical studies and user preference studies, we will be able to better determine the focus of our marketing efforts. We also plan to leverage our relationships with cardiac research and treatment centers to gain early product evaluation and validation. We believe that through these efforts, we may be able to gain preliminary acceptance of our PURE EP product by experienced professionals and academics in the electrophysiology field.
We also intend to simultaneously develop a branding strategy to introduce and support the PURE EP System. The strategy may include our presence at major relevant cardiology meetings on a national and regional basis to engage and educate physicians concerning the PURE EP System and any of our other products, as well as engaging in a variety of other direct marketing methods. We also intend to develop a small direct sales force together with a distribution network that has existing relationships with hospitals and electrophysiologists. We believe that we may be able to begin commercial sales of the PURE EP System in 2015.
Intellectual Property
Patents
Our success depends in large part on our ability to establish and maintain the proprietary nature of our technology. Our co-founder and former chief technology officer, Budimir S. Drakulic, Ph.D., conceived of the proprietary elements of the PURE EP System in 2009 and 2010. We filed a patent application with the U.S. Patent and Trademark Office in December 2013 directed at systems and methods for the evaluation of electrophysiology systems. In March 2014, the inventors listed on the patent application filed in December 2013 assigned all of their rights to the patent application to us. In addition, we filed a patent application with the U.S. Patent and Trademark Office in October 2013 directed at the use of electrocardiography sensing for control of radiofrequency renal denervation. David Drachman, our former chief executive officer and president, filed a statement of claim against us with the American Arbitration Association with respect to his resignation from his positions with us in November 2013, pursuant to which Mr. Drachman is seeking, among other things, a declaration by us that Mr. Drachman has full rights to the ownership and control of the patent application we filed with the U.S. Patent and Trademark Office in October 2013, during the time Mr. Drachman served in his positions with us. We fully dispute his rights to the ownership and control of such patent application and related patent(s) and intend to challenge his claim to the fullest extent permitted by law. On February 21, 2014, we filed an answer to Mr. Drachman’s statement of claim that disputed all of Mr. Drachman’s claims against us and counter-claimed against Mr. Drachman, seeking declaratory judgment concerning our rights to the ownership and control of the patent application related to a combined ablation and recording unit that we filed with the U.S. Patent and Trademark Office during the time Mr. Drachman served in his positions with us. However, if we are obligated to transfer the ownership and control of such patent application and related patent(s) to Mr. Drachman, we would lose rights to a portion of our intellectual property.property related to potential future products, but we would retain all rights related to our intellectual property necessary for our PURE EP System .
We intend to file one or more additional patents in the U.S. in the future.We believe that our patent application filed in October 2013, which is being disputed by Mr. Drachman, represents an application for a different application and use of our proprietary technology that we do not intend to explore in the near future. Our patent application filed in December 2013, on the other hand , represents a significant portion of our core proprietary intellectual property, especially with respect to the testing and training on our PURE EP System. The additional patent applications that we intend to file in the U.S. in the future . are expected to represent portions of the hardware and software technology associated with our PURE EP System. Upon filing of such patent applications, we believe that the novel aspects of our PURE EP System should be subject to pending patent application; however, we cannot be assured that all of the patents related to our patent applications, if any, will be granted.
We believe that our existing rights to the technology relating to the proprietary elements of the PURE EP System and the invention rights not contained in our patent applications are based upon the fiduciary duties owed to us by Dr. Drakulic when he served as an officer and director of our company, which obligate obligated him to grant us rights to technology essential to our products. In addition, under the work-for-hire doctrine, we have rights to all works of authorship (including for software products developed related to the PURE EP System) by our employees acting within the scope of their employment.
Trademarks
Our trademark application applications to register “PURE EP” and “BioSig” in the U.S. was accepted and our trademark application to register “BioSig” in the U.S. is are pending.
Government Regulation
Our solutions include software and hardware, which will be used for patient diagnosis and, accordingly, are subject to regulation by the U.S. Food and Drug Administration and other regulatory agencies. U.S. Food and Drug Administration regulations govern, among other things, the following activities that we perform and will continue to perform in connection with:
| ● | Product design and development; |
| ● | Product testing; |
| ● | Product manufacturing; |
| ● | Product labeling and packaging; |
| ● | Product handling, storage, and installation; |
| ● | Pre-market clearance or approval; |
| ● | Advertising and promotion; and |
| ● | Product sales, distribution, and servicing. |
U.S. Food and Drug Administration’s Pre-market Clearance and Approval Requirements
The U.S. Food and Drug Administration classifies all medical devices into one of three classes. Devices deemed to pose lower risks are placed in either Class I or II, which requires the manufacturer to submit to the U.S. Food and Drug Administration a pre-market notification, known as a PMN, and a 510(k) approval, requesting clearance of the device for commercial distribution in the U.S. Class III devices are devices which must be approved by the pre-market approval process. These tend to be devices that are permanently implanted into a human body or that may be necessary to sustain life. For example, an artificial heart meets both these criteria. Based on analysis of predicate devices, we believe that our products will be classified as Class II. Pursuant to U.S. Food and Drug Administration guidelines, Class II devices include a programmable diagnostic computer, which is a device that can be programmed to compute various physiologic or blood flow parameters based on the output from one or more electrodes, transducers, or measuring devices; this device includes any associated commercially supplied programs. Because the PURE EP System is a surface electrocardiogram and intracardiac multichannel recording and analysis system that acquires, processes and displays electrocardiogram and electrograms, we believe it will be classified as a Class II device. We must, therefore, first receive a 510(k) clearance from the U.S. Food and Drug Administration for our PURE EP system before we can commercially distribute it in the U.S. In the event that our PURE EP system is classified as a Class III device, which we believe is unlikely to occur, the U.S. Food and Drug Administration regulatory approval process and the subsequent commercialization of our product will require significantly greater time and resources than if it is classified as a Class II device, which would require us to reassess our strategic business plan of operations.
510(k) Clearance Process
For our PURE EP System, we must submit a pre-market notification to the U.S. Food and Drug Administration demonstrating that the proposed device is substantially equivalent to a previously cleared 510(k) device, a device that was in commercial distribution before May 28, 1976 for which the U.S. Food and Drug Administration has not yet called for the submission of pre-market approval applications, or is a device that has been reclassified from Class III to either Class II or I.
The U.S. Food and Drug Administration’s 510(k) clearance process usually takes three to six months from the date the application is submitted and filed with the U.S. Food and Drug Administration, but it can take significantly longer. A device that reaches market through the 510(k) process is not considered to be “approved” by the U.S. Food and Drug Administration. They are generally referred to as “cleared” or “510(k) cleared” devices. Nevertheless, it can be marketed and sold in the U.S.
After a device receives 510(k) clearance, any modification that could significantly affect its safety or effectiveness, or that would constitute a major change in its intended use, will require a new 510(k) clearance or could require a pre-market approval, which requires more data and is generally a significantly longer process than the 510(k) clearance process. The U.S. Food and Drug Administration requires each manufacturer to make this determination initially, but the U.S. Food and Drug Administration can review any such decision and can disagree with a manufacturer’s determination. If the U.S. Food and Drug Administration disagrees with a manufacturer’s determination, the U.S. Food and Drug Administration can require the manufacturer to cease marketing and/or recall the modified device until 510(k) clearance or a pre-market approval is obtained.
Pervasive and continuing U.S. Food and Drug Administration regulation
After a medical device is placed on the market, numerous U.S. Food and Drug Administration regulatory requirements apply, including, but not limited to the following:
| ● | Quality System regulation, which requires manufacturers to follow design, testing, control, documentation and other quality assurance procedures during the manufacturing process; |
| ● | Establishment Registration, which requires establishments involved in the production and distribution of medical devices intended for commercial distribution in the U.S. to register with the U.S. Food and Drug Administration; |
| ● | Medical Device Listing, which requires manufacturers to list the devices they have in commercial distribution with the U.S. Food and Drug Administration; |
| ● | Labeling regulations, which prohibit “misbranded” devices from entering the market, as well as prohibit the promotion of products for unapproved or “off-label” uses and impose other restrictions on labeling; and |
| ● | Medical Device Reporting regulations, which require that manufacturers report to the U.S. Food and Drug Administration if their device may have caused or contributed to a death or serious injury or malfunctioned in a way that would likely cause or contribute to a death or serious injury if it were to recur. |
Failure to comply with applicable regulatory requirements can result in enforcement action by the U.S. Food and Drug Administration, which may include one or more of the following sanctions:
| ● | Fines, injunctions, and civil penalties; |
| ● | Mandatory recall or seizure of our products; |
| ● | Administrative detention or banning of our products; |
| ● | Operating restrictions, partial suspension or total shutdown of production; |
| ● | Refusing our request for 510(k) clearance or pre-market approval of new product versions; |
| ● | Revocation of 510(k) clearance or pre-market approvals previously granted; and |
| ● | Criminal penalties. |
International Regulation
International sales of medical devices are subject to foreign government regulations, which vary substantially from country to country. The time required to obtain approval by a foreign country may be longer or shorter than that required for U.S. Food and Drug Administration approval, and the requirements may differ significantly.
The European Union has adopted legislation, in the form of directives to be implemented in each member state, concerning the regulation of medical devices within the European Union. The directives include, among others, the Medical Device Directive that establishes standards for regulating the design, manufacture, clinical trials, labeling, and vigilance reporting for medical devices. Our PURE EP system may be affected by this legislation. Under the European Union Medical Device Directive, medical devices are classified into four classes, I, IIa, IIb, and III, with class I being the lowest risk and class III being the highest risk. Under the Medical Device Directive, a competent authority is nominated by the government of each member state to monitor and ensure compliance with the Medical Device Directive. The competent authority of each member state then designates a notified body to oversee the conformity assessment procedures set forth in the Medical Device Directive, whereby manufacturers demonstrate that their devices comply with the requirements of the Medical Device Directive and are entitled to bear the CE mark. CE is an abbreviation for Conformite Europeenne (or European Conformity) and the CE mark, when placed on a product, indicates compliance with the requirements of the applicable directive. Medical devices properly bearing the CE mark may be commercially distributed throughout the European Union. Failure to obtain the CE mark will preclude us from selling the PURE EP System and related products in the European Union.
Employees
As of January 17, March 27, 2014, we had 8 full-time employees and 1 part-time employee .employee. Additionally, we use consultants as needed to perform various specialized services. None of our employees are represented under a collective bargaining agreement.
Properties
Our headquarters are located in Los Angeles, California, where we lease office space. Because we do not have any manufacturing requirements at this time, we believe our current headquarters is sufficient to meet our current needs.
Legal Proceedings
From time to time, we may be involved in litigation that arises through the normal course of business. As of the date of this filing, we are not a party to any material litigation nor are we aware of any such threatened or pending litigation, , except for the matters described below.
On January 7, 2014, David Drachman, our former chief executive officer and president, filed a statement of claim against us with the American Arbitration Association with respect to his resignation from his positions with us in November 2013. Mr. Drachman alleges, among other things, that (i) we misled him with respect to the status of our technology and required him to perform capital raising duties that had not been previously agreed upon, (ii) he resigned from his positions with us for good reason, as such term was defined in his employment agreement with us, and (iii) he, in his individual capacity, has full rights to the ownership and control of a patent application describing a combined ablation and recording unit directed at the use of electrocardiography sensing for control of radiofrequency renal denervation that we filed with the U.S. Patent and Trademark Office during the time Mr. Drachman served in his positions with us. Mr. Drachman’s claims against us include breach of agreement, breach of good faith and fair dealing and unjust enrichment. Mr. Drachman is seeking, among other things, (a) payment of his salary and pro-rated bonus for the time he served in his positions with us and the severance payments due under his employment agreement, which include 12 months of base salary and full bonus payments, with the total sum of payments equaling approximately $612,000, including $58,000 of accrued and unpaid salary, (b) full vesting of stock options equivalent to 10% of our outstanding common stock, and (c) a declaration by us that Mr. Drachman has full rights to the ownership and control of the patent application related to a combined ablation and recording unit that we filed with the U.S. Patent and Trademark Office during the time Mr. Drachman served in his positions with us. We intend to fully dispute Mr. Drachman’s allegations and his relief sought to the fullest extent permitted by the law and believe them to be wholly without merit. On February 21, 2014, we filed an answer to Mr. Drachman’s statement of claim that disputed all of Mr. Drachman’s claims against us and counter-claimed against Mr. Drachman, seeking declaratory judgment concerning our rights to the ownership and control of the patent application related to a combined ablation and recording unit that we filed with the U.S. Patent and Trademark Office during the time Mr. Drachman served in his positions with us.
Other than as set forth above, there are no material proceedings in which any of our directors, officers or affiliates or any registered or beneficial shareholder of more than 5% of our common stock is an adverse party or has a material interest adverse to our interest .
interest.EXECUTIVE OFFICERS AND DIRECTORS
The following table sets forth information regarding our executive officers and the members of our board of directors.
| Name | Age | Position with the Company | |||
Kenneth | 46 | Executive Chairman and Director | |||
Steve Chaussy | 60 | Chief Financial Officer | |||
Asher Holzer, Ph.D. | 63 | Chief Scientific Advisor and Director | |||
Kalyanam Shivkumar, MD, Ph.D. | 45 | Director | |||
Roy Tanaka | 66 | Director | |||
Jonathan Steinhouse | 46 | Director | |||
Seth H. Z. Fischer | 56 | Director |
Biographical Information
Kenneth L. Londoner. Mr. Londoner has served as our director since February 2009 and as our executive chairman since November 2013. He previously served as our chairman and chief executive officer from February 2009 to September 2013. Mr. Londoner has served as the managing partner of Endicott Management Partners, LLC, a firm dedicated to assisting emerging growth companies in their corporate development, since February 2010.From April 2007 to October 2009, he served as executive vice president – corporate business development and senior director of business development and, from November 2009 to December 2010, he served as a consultant to NewCardio, Inc., a medical device designer and developer. Mr. Londoner has also served as a director of Alliqua, Inc. since May 2012 and a director of chatAND Inc. since January 2012. Mr. Londoner is a co-founder and board member of Safe Ports Holdings, Charleston, South Carolina. Mr. Londoner also served as a director of MedClean Technologies, Inc. from November 2008 to September 2010. Mr. Londoner was an investment officer and co-manager of the Seligman Growth Fund, Seligman Capital Fund, and approximately $2 billion of pension assets at J & W Seligman & Co, Inc. in New York from 1991 to 1997. Mr. Londoner graduated from Lafayette College in 1989 with a degree in economics and finance and received his MBA from New York University’s Leonard N. Stern School of Business in 1994.We believe that Mr. Londoner’s extensive experience in financial and venture capital matters, as well as his intimate knowledge of our company as its co-founder make him an asset to our board of directors.
Steve Chaussy. Mr. Chaussy has served as our chief financial officer on a part time basis since May 2011. Since 2005, Mr. Chaussy has acted as a consultant for small publicly traded entities with a special emphasis towards SEC reporting and compliance. In 2013, Mr. Chaussy provided consulting services both directly and through his wholly-owned entity, Anna & Co., Inc., to a number of public companies, including Tonix Pharmaceuticals Holding Corp., a specialty pharmaceutical company, Bioheart, Inc., a biotechnology company focused on the treatment of chronic and acute heart damage, and Energy Telecom, Inc., a company specializing in the personal protection equipment industry. From 2001 to 2005, Mr. Chaussy provided services as both a chief financial officer and as a consultant to small publicly traded companies. Prior to 2001, Mr. Chaussy served as chief financial officer for a large private distribution and wholesaling company, where he gained international experience. Mr. Chaussy is a graduate of Virginia Polytechnic Institute and State University and is a licensed certified public accountant in Virginia, California and Florida.
Asher Holzer, Ph.D. Dr. Holzer has served as our chief scientific officer and our director since September 2012. Dr. Holzer serves as a director of InspireMD, Inc., an Israeli-based developer of a new stent platform, and served as that company’s president from March 2011 until June 2012 and chairman from March 2011 until November 2011. In addition, Dr. Holzer co-founded InspireMD Ltd., the predecessor and later wholly-owned subsidiary of InspireMD, Inc., and served as its president and chairman of the board from April 2007 until June 2012. Previously, Dr. Holzer founded Adar Medical Ltd., an investment firm specializing in medical device startups, and served as its chief executive officer from 2002 through 2004. Dr. Holzer currently serves on the board of directors of Adar Medical Ltd., O.S.H.-IL The Israeli Society of Occupational Safety and Health Ltd., Theracoat Ltd., 2to3D Ltd., and S.P. Market Windows Cyprus. Dr. Holzer earned his Ph.D. in Applied Physics from the Hebrew University. Dr. Holzer is also an inventor and holder of numerous patents. Dr. Holzer brings to the board his more than 25 years of experience in advanced medical devices, as well as expertise covering a wide range of activities, including product development, clinical studies, regulatory affairs, market introduction and the financial aspects of the advance medical device business.
Kalyanam Shivkumar, MD, Ph.D. Dr. Shivkumar has served as our director since September 2012. Since 2002, Dr. Shivkumar serves as Professor of Medicine at the University of California at Los Angeles and currently holds a joint appointment in the department of Radiology at the university. Dr. Shivkumar serves as a director of Epicardial Technologies, Inc., a company developing percutaneous (minimally invasive), single-use products for heart treatment through the epicardial surface. He also co-founded and serves on the board of EP Dynamics, a company developing innovative products using electrophysiology for invasive cardiology. Dr. Shivkumar is certified by the American Board of Internal Medicine in the subspecialties of cardiovascular disease and clinical cardiac electrophysiology. His field of specialization is interventional cardiac electrophysiology and he heads a group at University of California at Los Angeles that is involved in developing innovative techniques for the non-pharmacological management of cardiac arrhythmias. In 2002, he joined the newly created UCLA Cardiac Arrhythmia Center at the David Geffen School of Medicine at University of California at Los Angeles. Dr. Shivkumar received his medical degree from the University of Madras, India in 1991 and his Ph.D. from UCLA in 2000. Dr. Shivkumar brings to the board extensive experience in the fields of cardiovascular disease and clinical cardiac electrophysiology, as well as a viewpoint from the clinical and academic medical field.
Roy Tanaka. Mr. Tanaka has served as our director since July 2012. From 2004 until his retirement in September 2008, Mr. Tanaka served as the worldwide president of Biosense Webster, Inc., a Johnson & Johnson company, a market and technology leader in the field of electrophysiology. He joined Biosense Webster, Inc. as its U.S. president in 1997. Previously he held a variety of senior management positions at Sorin Biomedical, Inc., including president and chief executive officer, and leadership roles at CooperVision Surgical and Shiley, a division of Pfizer, Inc. He currently serves on the boards of directors of Volcano Corporation, Coherex Medical, Inc., Advanced Cardiac Therapeutics Inc., a company using electrophysiology to develop technology to measure the temperature in a lesion during cardiac ablation procedures, and VytronUS Inc. In addition, Mr. Tanaka served as a director of Tomo Therapy until its acquisition in June 2011. Mr. Tanaka brings broad experience in executive leadership in the medical device field. His operational expertise and knowledge of the regulatory environment, both in the U.S. and globally, also bring a valuable perspective.
Jonathan Steinhouse. Mr. Steinhouse has served as our director since February 2011. Since 2012, Mr. Steinhouse has served as vice president of sales for Sandlot Solutions in Philadelphia, PA, a health information exchange and analytics software company. From 2008 to 2011, he served as director of healthcare for Oracle Corporation in Philadelphia, PA, where he was responsible for overall sales (acquiring new, maintaining revenue and growing existing accounts) for direct and the channel sales to hospitals. From 2005 to 2008, he was regional manager of Concerro Incorporated, where he was responsible for new “software as a service” to increase utilization of internal employee resources. Mr. Steinhouse brings to the board the experience of a senior sales executive with over 23 years of experience in healthcare industry.
Seth H. Z. Fischer. Mr. Fischer has served as our director since May 2013. Since September 2013, Mr. Fischer has served as the chief executive officer and director of Vivus, Inc., a biopharmaceutical company focusing on the treatment of obesity, sleep apnea, diabetes and sexual health. Prior to that, Mr. Fischer served in positions of increasing responsibility with Johnson & Johnson until 2012. Most recently Mr. Fischer served as Company Group Chairman Johnson & Johnson, Worldwide Franchise Chairman Cordis Corporation from 2008 to 2012, which included responsibility for Cordis and Biosense Webster Inc., a market and technology leader in the field of electrophysiology. Previously, he served as Company Group Chairman North America Pharmaceuticals from 2004 to 2007. In this position he had responsibilities for Ortho-McNeil Pharmaceuticals, Janssen and Scios. Mr. Fischer serves on the board of directors of Trius Therapeutics, Inc. We believe that Mr. Fischer’s extensive executive experience in a major health care company and his specific experience in launching and growing new pharmaceutical products make him an ideal candidate for our board.
Family Relationships
We have no family relationships amongst our directors and executive officers.
Independent Directors
Our board of directors has determined that each of Kalyanam Shivkumar, MD, Ph.D., Roy Tanaka, Jeffrey O’Donnell, Jonathan Steinhouse and Seth H. Z. Fischer is independent within the meaning of applicable listing rules of the Section 803A(2) of the NYSE MKT Rules and the rules and regulations promulgated by the Securities and Exchange Commission.
Committees of the Board of Directors
We expect our board of directors, in the future, to appoint an audit committee, nominating committee and compensation committee, and to adopt charters relative to each such committee. We intend to appoint such persons to committees of the board of directors as are expected to be required to meet the corporate governance requirements imposed by a national securities exchange, although we are not required to comply with such requirements until we elect to seek a listing on a national securities exchange. In addition, we intend that at least one of our directors who serves on our audit committee will qualify as an “audit committee financial expert,” within the meaning of Item 407(d)(5) of Regulation S-K, as promulgated by the Securities and Exchange Commission. We do not currently have an “audit committee financial expert” since we currently do not have an audit committee in place.
Code of Ethics
We intend to adopt a code of ethics that applies to our officers, directors and employees, including our principal executive officer and principal accounting officer, but have not done so to date due to our relatively small size. We intend to adopt a written code of ethics in the near future.
2013 and 2012 Summary Compensation Table
The table below sets forth, for our last two fiscal years, the compensation earned by our named executive officers: (i) Kenneth L. Londoner, our current executive chairman and director who served as our chairman and chief executive officer from February 2009 to September 2013, and (ii) David Drachman, , our former chief executive officer, president and chairman, who served in his roles from September to November 2013.
| Name and principal position | Year | Salary ($) | Stock Awards ($) (1) | Total ($) | ||||||||||
Kenneth L. Londoner, Executive Chairman and Director | 2013 | 211,500 | 458,400 | (2) | 669,900 | |||||||||
2012 | 144,000 | — | 144,000 | |||||||||||
David Drachman, Former Chief Executive Officer, President and Chairman | 2013 | 0 | 3,414,646 | 3,414,646 | (3 ) | |||||||||
| Name and principal position | Year | Salary ($) | Stock Awards ($) (1) | Total ($) | ||||||||||
Kenneth L. Londoner, Executive Chairman and Director | 2013 | 211,500 | 458,400 | 669,900 | ||||||||||
2012 | 144,000 | - | 144,000 | |||||||||||
David Drachman, Former Chief Executive Officer, President and Chairman | 2013 | 0 | - | 0 (2) | ||||||||||
(1) Amounts represent the aggregate grant date fair value, as determined in accordance with FASB ASC Topic 718, with the exception that the amounts shown assume no forfeitures. For additional discussion of the valuation assumptions used in determining stock-based compensation and the grant date fair value for stock options, see “Management’s Discussion and Analysis of Financial Condition and Results of Operation — Critical Accounting Policies — Stock based compensation” and Note 1 — “Summary of Significant Accounting Policies” of the Notes to the Financial Statements included herein. These amounts do not represent the actual value that may be realized by our named executive officers, as that is dependent on the long-term appreciation in our common stock.
(2) Represents a stock option granted on January 16, 2013 for the purchase of 250,000 shares of common stock, exercisable immediately, at an exercise price of $2.09 per share and a termination date of January 16, 2020.
Employment Agreements
We entered into an employment agreement with Kenneth Londoner on March 1, 2013. The employment agreement terminates on March 1, 2015, after which Mr. Londoner ’sLondoner’s employment will be on at-will basis. Mr. Londoner’s annual base salary is $225,000, which will be paid entirely as salary. Mr. Londoner will also be eligible for annual discretionary bonuses and equity-based incentives, as our board may determine. Mr. Londoner is subject to non-competition and non-solicitation obligations, whereby, for a period lasting until one year after the termination of his employment with us, Mr. Londoner is not permitted to, directly or indirectly, (i) in any state in the U.S. or country that we conduct business and for which Mr. Londoner had responsibility, work for, invest in, provide financing to or establish a business that competes with our business, other than an exception that permits limited investment in publicly-traded competitors, (ii) solicit business from or do business with any customer, client, manufacturer or vendor with whom we did business or who we solicited within the preceding two years, and (iii) solicit, engage or hire any person employed by or who served as a consultant to us within the preceding twelve months. In September 2013, Mr. Londoner resigned as our chief executive officer, but remained with us in an executive role. In November 2013, Mr. Londoner became our executive chairman. During this time, Mr. Londoner was and will continue to be, , compensated pursuant to his employment agreement for his contributions with respect to corporate finance, investor relations, and business development.
Prior to entering into his employment agreement, Mr. Londoner was an at-will employee.
On September 10, 2013, we entered into an employment agreement with David Drachman. In November 2013, Mr. Drachman resigned from his positions with us. Pursuant to his employment agreement, Mr. Drachman’s annual base salary was $250,000 and, upon our closing of a financing with proceeds to us of at least $5 million, Mr. Drachman’s salary would have been increased to $350,000 and he would have received a one-time payment equal to the difference of his base salary of $250,000 and an annual salary of $350,000 for the time period from the beginning of his employment until the closing of such financing. Mr. Drachman was eligible for additional annual raises beginning on January 1, 2015. Mr. Drachman was also eligible to receive bonuses of at least 50% of his base salary, based on performance criteria established by our board. Mr. Drachman was also to receive stock options to purchase (i) 10% of our outstanding shares of common stock, as calculated on a fully-diluted basis, which shall vest monthly for a period of four years, and (ii) 234,000 shares of common stock, upon our closing of a financing with proceeds to us of between $3 million and less than $5 million, or 328,000 shares of common stock, upon our closing of a financing with proceeds to us of at least $5 million. Mr. Drachman was eligible for additional stock option grants beginning on January 1, 2015, at the discretion of our board. Mr. Drachman is also subject to confidentiality, non-disparagement and non-solicitation covenants, whereby, for a period lasting until one year after the termination of Mr. Drachman’s employment with us, he is not permitted to, directly or indirectly, (i) solicit business from or do business with any customer, referral source and/or sponsor with whom Mr. Drachman did business as our employee, Mr. Drachman learned of solely through his employment with us or about whom Mr. Drachman received confidential information from us, and (ii) solicit, engage or hire any person employed by or who served as a consultant to us within the preceding twelve months.
Budimir Drakulic, our former chief technology officer and director, and Lora Mikolaitis, our former director of administration, left their respective positions with us in November 2013.
Potential Payments Upon Termination or Change In Control
Pursuant to Mr. Londoner’s employment agreement, upon his termination without cause, including in the event of our change of control, Mr. Londoner will receive severance pay equal to his base salary until March 1, 2015, which represents the end of his employment agreement, so long as he executes a release that releases any of his claims against us. In the event Mr. Londoner voluntarily resigns, he will not be entitled to any further payments, other than those accrued through the date of resignation. Cause means, with respect to Mr. Londoner, , termination because of (i) an act of willful or material misrepresentation, fraud or willful dishonesty, (ii) any willful misconduct with regard to us; (iii) any violation of any fiduciary duties owed to us; (iv) conviction of, or pleading nolo contendere or guilty to, a felony (other than a traffic infraction) or (v) any other material breach of Mr. Londoner ’sLondoner’s employment agreement that is not cured within twenty days after receipt of a written notice.
Pursuant to Mr. Drachman’s employment agreement, if Mr. Drachman’s employment with us is terminated for cause, which includes conviction of a felony, refusal to cooperate with our board or Mr. Drachman’s material breach of the employment agreement, which remains uncured after 60 days’ notice, or upon Mr. Drachman’s resignation, Mr. Drachman will receive any accrued and unpaid salary and reimbursements and payment for accrued and unused vacation. Upon his death or permanent disability, Mr. Drachman or his estate will receive, in addition to any accrued and unpaid salary and reimbursements, one year of base salary and target bonus, continuation of benefits for one year and full vesting of any unvested equity award grants. If Mr. Drachman’s employment is terminated without cause or for good reason, which includes our breach of the employment agreement, a material reduction of Mr. Drachman’s duties or salary and bonus or a relocation of Mr. Drachman’s employment, Mr. Drachman will be entitled to receive the same severance package as upon his death or disability, provided that Mr. Drachman complies with his confidentiality, non-disparagement and non-solicitation requirements. Upon our change of control, if Mr. Drachman’s employment is terminated without cause or for good reason, Mr. Drachman will receive, in addition to any accrued and unpaid salary and reimbursements, an amount equal to 2.5 times his base salary and 2.5 times the greater of the average of the bonuses received in the previous three years and the target bonus for the year in which the change of control occurs, which such amount will be paid in 24 equal monthly payments, continuation of benefits for one year and full vesting of any unvested equity award grants.
2013 Outstanding Equity Awards at Fiscal Year End
At December 31, 2013, Kenneth Londoner held an option to purchase 250,000 shares of our common stock, with an exercise price of $2.09 per share and an expiration date of January 16, 2020. As disclosed above, David Drachman, our former chief executive officer, president and chairman filed a statement of claim against us with the American Arbitration Association with respect to his resignation from his positions with us in November 2013. All stock options previously awarded to Mr. Drachman were rescinded, and the amount of stock options due to Mr. Drachman is currently in dispute .
dispute.BioSig Technologies, Inc. 2011 Long-Term Incentive Plan
On October 19, 2011, our board of directors and stockholders adopted and approved the BioSig Technologies, Inc. 2011 Long-Term Incentive Plan. Under the BioSig Technologies, Inc. 2011 Long-Term Incentive Plan, we reserved 1,500,000 shares of our common stock as awards to our employees, consultants, and service providers.
The purpose of the BioSig Technologies, Inc. 2011 Long-Term Incentive Plan was to provide an incentive to attract and retain employees, officers, consultants, directors, and service providers whose services are considered valuable, to encourage a sense of proprietorship and to stimulate an active interest of such persons in our development and financial success. The BioSig Technologies, Inc. 2011 Long-Term Incentive Plan was administered by our board of directors. On October 19, 2012, our board of directors elected to terminate the BioSig Technologies, Inc. 2011 Long Term Incentive Plan. We did not grant options to purchase common stock under the BioSig Technologies, Inc. 2011 Long-Term Incentive Plan to any of our named executive officers:
BioSig Technologies, Inc. 2012 Equity Incentive Plan
On October 19, 2012, our board of directors adopted the BioSig Technologies, Inc. 2012 Equity Incentive Plan, which provides for the grant of stock options, stock appreciation rights, restricted stock and restricted stock units to employees, directors and consultants, to be granted from time to time as determined by our board of directors or its designees. In addition, 1,500,000 shares under the BioSig Technologies, Inc. 2011 Long Term Incentive Plan that were not subject to outstanding stock options or similar awards were rolled into the BioSig Technologies, Inc. 2012 Equity Incentive Plan. An aggregate of 6,006,123 shares of common stock are reserved for issuance under the BioSig Technologies, Inc. 2012 Equity Incentive Plan. As of January 17, March 27, 2014, the number of options granted the under the BioSig Technologies, Inc. 2012 Equity Incentive Plan are 2,990,977.
Since its adoption, we have granted options to purchase common stock under the BioSig Technologies, Inc. 2012 Equity Incentive Plan that are currently outstanding to the following named executive officers.
| Name | Shares Subject to Options | Exercise Price | Date of Grant | Vesting Schedule | Expiration | ||||||
Kenneth L. Londoner | 250,000 | $ | 2.09 | 01/16/2013 | Exercisable immediately | 01/16/2020 | |||||
DIRECTOR COMPENSATIONCOMPENSATION
The following table provides compensation information for the one year period ended December 31, 2013 for each non-employee member of our board of directors. Directors are not paid for attendance (in person or by telephone) at meetings of the board of directors and no compensation was paid to our non-employee directors unless indicated below .below. Each stock option grant was made under the BioSig Technologies, Inc. 2012 Equity Incentive Plan.
| Name | Fees earned or paid in cash ($) | Stock Awards ($) (1) | Option Awards ($) (1) | All other compensation ($) | Total ($) | Fees earned or paid in cash ($) | Stock Awards ($) (1) | Option Awards ($) (1) | All other compensation ($) | Total ($) | |||||||||||||||||||||||||||||||||
Kalyanam Shivkumar, MD, Ph.D. | - | - | - | - | 0 | — | — | — | — | 0 | |||||||||||||||||||||||||||||||||
Roy Tanaka | - | - | - | - | 0 | — | — | — | — | 0 | |||||||||||||||||||||||||||||||||
Jeffrey O’Donnell | - | - | 175,624 | (2) | - | 175,624 | — | — | 175,624 | ( 3 ) | — | 175,624 | |||||||||||||||||||||||||||||||
William Uglow (3) | - | - | - | - | 0 | ||||||||||||||||||||||||||||||||||||||
William Uglow ( 4 ) | — | — | — | — | 0 | ||||||||||||||||||||||||||||||||||||||
Jonathan Steinhouse | - | - | - | - | 0 | — | — | — | — | 0 | |||||||||||||||||||||||||||||||||
Asher Holzer, Ph.D. | - | - | - | - | 0 | — | — | — | — | 0 | |||||||||||||||||||||||||||||||||
Seth H. Z. Fischer | - | - | 337,880 | (4) | - | 337,880 | — | — | 337,880 | ( 5 ) | — | 337,880 | |||||||||||||||||||||||||||||||
| (1) | Amounts represent the aggregate grant date fair value, as determined in accordance with FASB ASC Topic 718, with the exception that the amounts shown assume no forfeitures. For additional discussion of the valuation assumptions used in determining stock-based compensation and the grant date fair value for stock options, see “Management’s Discussion and Analysis of Financial Condition and Results of Operation — Critical Accounting Policies — Stock based compensation” and Note 1 — “Summary of Significant Accounting Policies” of the Notes to the Financial Statements included herein. These amounts do not represent the actual value that may be realized by our non-employee directors, as that is dependent on the long-term appreciation in our common stock. |
| (2) | Mr. O’Donnell resigned as a member of our board of directors in February 2014 . |
( 3 ) | The stock option award is comprised of an option to purchase 95,800 shares of common stock, which vested in 12 equal monthly installments beginning on February 1, 2013, with an exercise price of |
( 4 ) | Mr. Uglow resigned as a member of our board of directors in October 2013. |
( 5 ) | The stock option award is comprised of an option to purchase 187,500 shares of common stock, which vested and will continue to vest in 12 equal monthly installments beginning on June 2, 2013, with an exercise price of $2.09 per share and an expiration of May 2, 2020, so long as Mr. Fischer is providing services to us. If |
SECURITY OWNERSHIP OF CERTAIN BENEFICIAL OWNERS AND MANAGEMENT
Common Stock
The following table sets forth information with respect to the beneficial ownership of our common stock as of January 17, March 27, 2014 by:
| each person known by us to beneficially own more than 5.0% of our common stock; |
| each of our directors; |
| each of the named executive officers; and |
| all of our directors and executive officers as a group. |
The percentages of common stock beneficially owned are reported on the basis of regulations of the Securities and Exchange Commission governing the determination of beneficial ownership of securities. Under the rules of the Securities and Exchange Commission, a person is deemed to be a beneficial owner of a security if that person has or shares voting power, which includes the power to vote or to direct the voting of the security, or investment power, which includes the power to dispose of or to direct the disposition of the security. With respect to the Series C Preferred Stock and warrants held by the beneficial owners listed below, there exist contractual provisions limiting conversion and exercise to the extent such conversion or exercise would cause such beneficial owner, together with its affiliates or members of a “group,” to beneficially own a number of shares of common stock which would exceed from 4.99% to 9.99% of our then outstanding shares of common stock following such conversion or exercise. The shares and percentage ownership of our outstanding shares indicated in the table below do not give effect to these limitations. Except as indicated in the footnotes to this table, to our knowledge and subject to community property laws where applicable, each beneficial owner named in the table below has sole voting and sole investment power with respect to all shares beneficially owned and each person’s address is c/o BioSig Technologies, Inc., 12424 Wilshire Boulevard, Suite 745, Los Angeles, California 90025.
| Name of Beneficial Owner | Number of Shares Beneficially Owned(1) | Percentage of Common Stock Owned (1)(2) | ||||||
| 5% Owners | ||||||||
Miko Consulting Group, Inc. (3) | 3,442,474 | 40.41 | % | |||||
Alpha Capital Anstalt ( 4 ) | 1,708,396 | ( 5 ) | 17.47 | % | ||||
Officers and Directors | ||||||||
Kenneth L. Londoner | 4,191,245 | ( 6 ) | 45.44 | % | ||||
Asher Holzer, Ph.D. | 81,000 | ( 7 ) | * | |||||
Kalyanam Shivkumar, MD, Ph.D. | 50,000 | ( 8 ) | * | |||||
Roy Tanaka | 119,821 | ( 9 ) | 1.39 | % | ||||
Jonathan Steinhouse | 250,633 | (10) | 2.92 | % | ||||
Seth H. Z. Fischer | 187,500 | (11) | 2.15% | |||||
All directors and executive officers as a group ( 7 persons) | 4,973,561 | 58.01 | % | |||||
| Name of Beneficial Owner | Number of Shares Beneficially Owned(1) | Percentage of Common Stock Owned (1)(2) | ||||||
| 5% Owners | ||||||||
Miko Consulting Group, Inc. | 3,467,474 | 41.2 | % | |||||
Alpha Capital Anstalt (3) | 1,208,833 | (4) | 13.1 | % | ||||
Officers and Directors | ||||||||
Kenneth L. Londoner | 4,109,883 | ( 5 ) | 45.8 | % | ||||
Asher Holzer, Ph.D. | 81,000 | (6) | * | |||||
Kalyanam Shivkumar, MD, Ph.D. | 50,000 | (7) | * | |||||
Roy Tanaka | 119,821 | (8) | 1.4 | % | ||||
Jeffrey O’Donnell | 183,300 | (9) | 2.2 | % | ||||
Jonathan Steinhouse | 195,914 | ( 10 ) | 2.3 | % | ||||
Seth H. Z. Fischer | 156,250 | ( 11 ) | 1.8 | |||||
All directors and executive officers as a group ( 8 persons) | 4,989,530 | 52.2 | % | |||||
* Less than 1%
| (1) | Shares of common stock beneficially owned and the respective percentages of beneficial ownership of common stock assume the exercise of all options and other securities convertible into common stock beneficially owned by such person or entity currently exercisable or exercisable within 60 days of |
| (2) | These percentages have been calculated based on |
| (3) | Each of Budimir Drakulic and Lora Mikolaitis has joint voting and dispositive power over the securities held for the account of this stockholder . |
| (4) | The address for Alpha Capital Anstalt is Pradafant 7, 9490 Furstentums, Vaduz, Lichtenstein. Konrad Ackermann has sole voting and dispositive power over the securities held for the account of this stockholder. |
Comprised of (i) |
Comprised of (i) 101,890 shares of common stock directly held by Mr. Londoner, (ii) |
| (7) | Comprised of options to purchase |
| (8) | Comprised of options to purchase |
Comprised of options to purchase 119,821 shares of common stock that are currently exercisable . |
| (10) | Comprised of (i) |
Consists of options to purchase |
Series B Preferred Stock
The following table sets forth information with respect to the beneficial ownership of shares of our Series B Preferred Stock as of January 17, March 27, 2014 by:
| each of our directors; |
| each of the named executive officers; and |
| all of our directors and executive officers as a group. |
The percentages of shares of our Series B Preferred Stock beneficially owned are reported on the basis of regulations of the Securities and Exchange Commission governing the determination of beneficial ownership of securities. To our knowledge and subject to community property laws where applicable, each beneficial owner named in the table below has sole voting and sole investment power with respect to all shares beneficially owned and each person’s address is c/o BioSig Technologies, Inc., 12424 Wilshire Boulevard, Suite 745, Los Angeles, California 90025. As of January 17, March 27, 2014, we had 177.5 shares of our Series B Preferred Stock outstanding.
| Name of Beneficial Owner | Number of Shares Beneficially Owned(1) | Percentage of Common Stock Owned (1)(2) | ||||||
Officers and Directors | ||||||||
Kenneth L. Londoner | 10 | (3) | 5.6 | % | ||||
| Name of Beneficial Owner | Number of Shares Beneficially Owned(1) | Percentage of Common Stock Owned (1)(2) | ||||||
| Officers and Directors | ||||||||
Kenneth L. Londoner | 10 | (3) | 5.6 | % | ||||
| (1) | Shares of common stock beneficially owned and the respective percentages of beneficial ownership of common stock assume the exercise of all options and other securities convertible into common stock beneficially owned by such person or entity currently exercisable or exercisable within 60 days of |
| (2) | These percentages have been calculated based on 177.5 shares of our Series B Preferred Stock outstanding as of |
| (3) | Mr. Londoner’s shares are convertible into 24,752 shares of common, based upon a conversion price of $2.02 per share. The shares of our Series B Preferred Stock will automatically convert immediately upon us becoming subject to the reporting requirements under Section 13 or 15(d) of the Securities and Exchange Act, as amended. |
Series C Preferred Stock
The following table sets forth information with respect to the beneficial ownership of shares of our Series C Preferred Stock as of January 17, March 27, 2014 by:
| each person known by us to beneficially own more than 5.0% of our common stock; |
| each of our directors; |
| each of the named executive officers; and |
| all of our directors and executive officers as a group. |
The percentages of common stock beneficially owned are reported on the basis of regulations of the Securities and Exchange Commission governing the determination of beneficial ownership of securities. The percentages of common stock beneficially owned are reported on the basis of regulations of the Securities and Exchange Commission governing the determination of beneficial ownership of securities. Under the rules of the Securities and Exchange Commission, a person is deemed to be a beneficial owner of a security if that person has or shares voting power, which includes the power to vote or to direct the voting of the security, or investment power, which includes the power to dispose of or to direct the disposition of the security. Except as indicated in the footnotes to this table, to our knowledge and subject to community property laws where applicable, each beneficial owner named in the table below has sole voting and sole investment power with respect to all shares beneficially owned and each person’s address is c/o BioSig Technologies, Inc., 12424 Wilshire Boulevard, Suite 745, Los Angeles, California 90025. As of January 17, March 27, 2014, we had 2,781 shares of Series C Preferred Stock outstanding.
| Name of Beneficial Owner | Number of Shares Beneficially Owned (1) | Percentage of Common Stock Owned (1)(2) | ||||||
| 5% Owners | ||||||||
Alpha Capital Anstalt (3) | 625 | 22.5 | % | |||||
Michael N. Emmerman (4) | 200 | 7.2 | % | |||||
David W. Frost (5) | 150 | 5.4 | ||||||
Michael B Carroll & Sheila J Carroll JTWROS (6) | 150 | 5.4 | ||||||
Officers and Directors | ||||||||
Kenneth L. Londoner | 200 | 7.2 | % | |||||
Jonathan Steinhouse | 25 | * | ||||||
All directors and executive officers as a group (2 persons) | 225 | 8.1 | % | |||||
* Less than 1%
| (1) | Shares of common stock beneficially owned and the respective percentages of beneficial ownership of common stock assume the exercise of all options and other securities convertible into common stock beneficially owned by such person or entity currently exercisable or exercisable within 60 days of |
| (2) | These percentages have been calculated based on 2,781 shares of our Series C Preferred Stock outstanding as of |
| (3) | The address of this stockholder is Pradafant 7, 9490 Furstentums, Vaduz, Lichtenstein. |
| (4) | The address of this stockholder is 151 East 63rd Street, New York, NY 10065. |
| (5) | The address of this stockholder is 4701 Pleasant Street, Apartment 361, West Des Moines, Iowa 50266. |
| (6) | The address of this stockholder is 3919 Happy Valley Road, Lafayette, California 94549. |
SELLING STOCKHOLDERSSTOCKHOLDERS
Up to 3,136,984 4,990,471 shares of our common stock are currently being offered by the selling stockholders under this prospectus. This reflects the sum of (a) number of shares of common stock into which (i) the Series C Preferred Stock are currently convertible, at a price of $2.09 $ 1.50 per share per $1,000 principal amount of Series C Preferred Stock and (ii) the warrants are exercisable, and (b) the shares of common stock issued in lieu of cash payments on the interest accrued on the bridge notes. Interest accrued on the bridge notes at a rate of 8% per annum. The total accrued interest on the bridge notes, which were exchanged for shares of common stock at a price of $2.09 per share, represented amounts accrued from the issuance of the bridge notes in the fourth quarter of 2013 until such bridge notes were exchanged for shares of the Series C Preferred Stock on February 6, 2013. All of the shares of Series C Preferred Stock and warrants were purchased by the selling stockholders in multiple closings from February to July 2013 pursuant to the same securities purchase agreement, except for (i) the warrants issued to the holders of our Series C Preferred Stock in consideration of certain amendments made to the related Securities Purchase Agreement and Registration Rights Agreement, and (ii) the warrants held by Laidlaw & Co. (UK) Ltd., which were issued as part of the compensation for serving as our placement agent in connection with the private placement of our Series C Preferred Stock and the related warrants. The selling stockholders paid $1,000 for a unit consisting of one share of Series C Preferred Stock and a warrant to purchase up to a number of shares of our common stock equal to 100% of $1,000 divided by $2.09. The terms of the Series C Preferred Stock were amended on March 27, 2014 to provide for a decrease of the conversion price of the Series C Preferred Stock from $2.09 per share to $1.50 per share. As a result of the amendment, the full-ratchet anti-dilution protection provision of the related warrants decreased the exercise price of the warrants from $2.61 per share to $1.50 per share and increased the number of shares issuable under each warrant was increased such that the aggregate exercise price payable under such warrant, after taking into account the decrease in the exercise price, is equal to the aggregate exercise price prior to such adjustment. In addition, due to our failure to fulfill our obligations under the registration rights agreement entered into with the holders of our Series C Preferred Stock, we owe such holders liquidated damages in an amount equal to.25% of the aggregate purchase price paid by such holders per month for each month period beginning on November 22, 2013. Because we have not paid such liquidated damages, we are also obligated to pay interest of 18% per annum, accruing daily, on such unpaid amounts to the holders of our Series C Preferred Stock.
The shares of common stock referred to above are being registered to permit public sales of the shares, and the selling stockholders may offer the shares for resale from time to time pursuant to this prospectus. The selling stockholders may also sell, transfer or otherwise dispose of all or a portion of their shares in transactions exempt from the registration requirements of the Securities Act of 1933, as amended, or pursuant to another effective registration statement covering those shares.
The table below sets forth certain information regarding the selling stockholders and the shares of our common stock offered by them in this prospectus. The selling stockholders have not had a material relationship with us within the past three years other than as described in the footnotes to the table below or as a result of their acquisition of our shares or other securities. To our knowledge, subject to community property laws where applicable, each person named in the table has sole voting and investment power with respect to the shares of common stock set forth opposite such person’s name. None of the selling stockholders are broker-dealers or affiliates of broker-dealers,, unless otherwise noted.noted.
Beneficial ownership is determined in accordance with the rules of the Securities and Exchange Commission. In computing the percentage of our common stock beneficially owned by each selling stockholder after the offering, we have assumed that all shares offered by such selling stockholder have been sold, and therefore the calculation is based on a number of shares of common stock outstanding comprised of (i) 8,412,101 8,519,809 shares of common stock outstanding as of January 17, March 27, 2014 plus (ii) the number of shares offered by the selling stockholder in this offering. The shares offered by one selling stockholder are not deemed outstanding for the purpose of computing the percentage ownership of any other selling stockholder. With respect to the Series C Preferred Stock and warrants held by the selling stockholders, there exist contractual provisions limiting conversion and exercise to the extent such conversion or exercise would cause such selling stockholder, together with its affiliates or members of a “group,” to beneficially own a number of shares of common stock which would exceed from 4.99% to 9.99% of our then outstanding shares of common stock following such conversion or exercise. The shares and percentage ownership of our outstanding shares indicated in the table below do not give effect to these limitations.
| Ownership Before Offering | Ownership After Offering | |||||||||||||||
| Selling Stockholder | Number of shares of common stock beneficially owned (1) | Number of shares offered | Number of shares of common stock beneficially owned (1) | Percentage of common stock beneficially owned (1) (2) | ||||||||||||
Michael N. Emmerman | 343,452 | (3) | 219,528 | ( 4 ) | 123,924 | (5) | 1.5 | % | ||||||||
Lau Family Fund LP ( 6 ) | 60,724 | ( 7 ) | 54,742 | ( 8 ) | 5,982 | (9) | * | |||||||||
Jonathan Steinhouse ( 10 ) | 195,914 | ( 11 ) | 27,298 | ( 12 ) | 168,616 | (13) | 2.0 | % | ||||||||
Kenneth L. Londoner ( 14 ) | 4,109,883 | ( 15 ) | 217,891 | ( 16 ) | 3,891,992 | ( 17 ) | 44.4 | % | ||||||||
R. Ian Chaplin | 55,221 | ( 18 ) | 27,230 | ( 19 ) | 27,991 | (20) | * | |||||||||
Kenneth Epstein | 120,153 | ( 21 ) | 108,191 | ( 22 ) | 11,962 | (23) | * | |||||||||
Jerome B. Zeldis | 59,811 | ( 24 ) | 53,829 | ( 25 ) | 5,982 | (26) | * | |||||||||
Brio Capital Master Fund Ltd. ( 27 ) | 149,524 | ( 28 ) | 134,571 | ( 29 ) | 14,953 | (30) | * | |||||||||
Alpha Capital Anstalt ( 31 ) | 1,208,834 | ( 32 ) | 672,847 | ( 33 ) | 535,987 | (34) | 6.3 | |||||||||
Sterne Agee & Leach Inc C/F Maree Casatelli SEP IRA | 29,906 | ( 35 ) | 26,915 | ( 36 ) | 2,991 | (37) | * | |||||||||
Ron D Craig | 136,238 | ( 38 ) | 99,762 | ( 39 ) | 36,476 | (40) | * | |||||||||
Michael & Susan Engdall JTWROS | 40,673 | ( 41 ) | 36,485 | ( 42 ) | 4,188 | (43) | * | |||||||||
David W Frost | 179,426 | ( 44 ) | 161,483 | ( 45 ) | 17,943 | (46) | * | |||||||||
Phillip Todd Herndon | 84,562 | ( 47 ) | 53,828 | ( 48 ) | 30,734 | (49) | * | |||||||||
Rex A Jones | 173,966 | ( 50 ) | 107,656 | ( 51 ) | 66,310 | (52) | * | |||||||||
Nabil M Yazgi | 128,934 | ( 53 ) | 21,531 | ( 54 ) | 107,403 | (55) | 1.3 | % | ||||||||
Portofino Ventures LP ( 56 ) | 23,924 | ( 57 ) | 21,531 | ( 58 ) | 2,393 | (59) | * | |||||||||
Thomas G Hoffman | 37,332 | ( 60 ) | 26,915 | ( 61 ) | 10,417 | (62) | * | |||||||||
James W Lees | 35,291 | ( 63 ) | 31,701 | ( 64 ) | 3,590 | (65) | * | |||||||||
Martin F Sauer | 57,080 | ( 66 ) | 26,915 | ( 67 ) | 30,165 | (68) | * | |||||||||
Ray Weber | 52,633 | ( 69 ) | 47,249 | ( 70 ) | 5,384 | (71) | * | |||||||||
Sterne Agee & Leach Inc C/F Raymond E Weber IRA | 41,866 | ( 72 ) | 37,679 | ( 73 ) | 4,187 | (74) | * | |||||||||
Fourfathom Capital, LLC ( 75 ) | 119,618 | ( 76 ) | 107,656 | ( 77 ) | 11,962 | (78) | * | |||||||||
Michael B & Sheila J Carroll JTWROS | 179,426 | ( 79 ) | 161,483 | ( 80 ) | 17,943 | (81) | * | |||||||||
Scott D. Gamble | 119,618 | ( 82 ) | 107,656 | ( 83 ) | 11,962 | (84) | * | |||||||||
Brian E. Jones & Peggy A. Jones JTWROS | 84,562 | ( 85 ) | 53,828 | ( 86 ) | 30,734 | (87) | * | |||||||||
David Patterson | 23,924 | ( 88 ) | 21,531 | ( 89 ) | 2,393 | (90) | * | |||||||||
Herschel E. Johnson | 20,336 | ( 91 ) | 18,302 | ( 92 ) | 2,034 | (93) | - | |||||||||
George & Karin Alexa Elefther JTWROS | 18,972 | ( 94 ) | 4,786 | ( 95 ) | 14,186 | (96) | * | |||||||||
L. Dean Fox | 18,972 | ( 97 ) | 4,786 | ( 98 ) | 14,186 | (99) | * | |||||||||
Sterne Agee & Leach Inc C/F John L Sommer IRA | 60,272 | ( 100 ) | 9,570 | ( 101 ) | 50,702 | (102) | * | |||||||||
Sterne Agee & Leach Inc C/F David W Frost IRA | 6,460 | ( 103 ) | 5,742 | ( 104 ) | 718 | (105) | * | |||||||||
Allan D Carlson | 10,767 | ( 106 ) | 9,570 | ( 107 ) | 1,197 | (108) | * | |||||||||
Ian H Murray | 10,767 | ( 109 ) | 9,570 | ( 110 ) | 1,197 | (111) | * | |||||||||
Sterne Agee & Leach Inc C/F Randy Payne IRA | 35,519 | ( 112 ) | 9,570 | ( 113 ) | 25,949 | (114) | * | |||||||||
Dr. Richard & Anita Matter JTWROS | 21,533 | ( 115 ) | 19,140 | ( 116 ) | 2,393 | (117) | * | |||||||||
Robert J Gray | 40,502 | ( 118 ) | 23,924 | ( 119 ) | 16,578 | (120) | * | |||||||||
Randal E Margo | 26,915 | ( 121 ) | 23,924 | ( 122 ) | 2,991 | (123) | * | |||||||||
Eugene E Eubank | 53,829 | ( 124 ) | 47,848 | ( 125 ) | 5,981 | (126) | * | |||||||||
Robert W Baird & Co Inc TTEE FBO Brian Mark Miller ROTH IRA | 107,656 | ( 127 ) | 95,694 | ( 128 ) | 11,962 | (129) | * | |||||||||
Sterne Agee & Leach Inc C/F Dr Gary W Chmielewski IRA | 10,767 | ( 130 ) | 9,570 | ( 131 ) | 1,197 | (132) | * | |||||||||
Laidlaw & Co (UK) Ltd ( 133 ) | 177,057 | ( 134 ) | 177,057 | ( 134 ) | 0 | - | ||||||||||
| Ownership Before Offering | Ownership After Offering | ||||||||||||||
| Selling Stockholder | Number of shares of common stock beneficially owned (1) | Number of shares offered | Number of shares of common stock beneficially owned (1) | Percentage of common stock beneficially owned (1) (2) | |||||||||||
Michael N. Emmerman | 487,314 | (3) | 345,686 | (4) | 141,628 | (5) | 1.65 | ||||||||
Lau Family Fund LP (6) | 96,693 | (7) | 86,284 | (8) | 10,409 | (9) | * | ||||||||
Jonathan Steinhouse (10) | 250,633 | ( 1 1 ) | 43,068 | (12) | 207,565 | (13) | 2.43 | ||||||||
Kenneth L. Londoner (14) | 4,191,245 | (15) | 344,049 | (16) | 3,847,196 | (17) | 41.75 | ||||||||
R. Ian Chaplin | 73,204 | (18) | 43,000 | (19) | 30,204 | (20) | * | ||||||||
Kenneth Epstein | 192,084 | (21) | 171,270 | (22) | 20,814 | (23) | * | ||||||||
Jerome B. Zeldis | 114,148 | (24) | 85,371 | (25) | 28,777 | (26) | * | ||||||||
Brio Capital Master Fund Ltd. (27) | 239,438 | (28) | 213,420 | (29) | 26,018 | (30) | * | ||||||||
Alpha Capital Anstalt (31) | 1,708,396 | (32) | 1,067,086 | (33) | 641,310 | (34) | 7.36% | ||||||||
Sterne Agee & Leach Inc C/F Maree Casatelli SEP IRA | 47,889 | (35) | 42,685 | (36) | 5,204 | (37) | * | ||||||||
Ron D Craig | 202,484 | (38) | 157,332 | (39) | 45,152 | (40) | * | ||||||||
Michael & Susan Engdall JTWROS | 64,965 | (41) | 57,678 | (42) | 7,287 | (43) | * | ||||||||
David W Frost | 287,322 | (44) | 256,101 | (45) | 31,221 | (46) | * | ||||||||
Phillip Todd Herndon | 120,530 | (47) | 85,369 | (48) | 35,161 | (49) | * | ||||||||
Rex A Jones | 245,897 | (50) | 170,735 | (51) | 75,162 | (52) | * | ||||||||
Nabil M Yazgi | 143,322 | (53) | 34,148 | (54) | 109,174 | (55) | 1.27 | ||||||||
Portofino Ventures LP (56) | 38,312 | (57) | 34,148 | (58) | 4,164 | (59) | * | ||||||||
Thomas G Hoffman | 55,315 | (60) | 42,685 | (61) | 12,630 | (62) | * | ||||||||
James W Lees | 56,429 | (63) | 50,183 | (64) | 6,246 | (65) | * | ||||||||
Martin F Sauer | 75,063 | (66) | 42,685 | (67) | 32,378 | (68) | * | ||||||||
Ray Weber | 84,118 | (69) | 74,750 | (70) | 9,368 | (71) | * | ||||||||
Sterne Agee & Leach Inc C/F Raymond E Weber IRA | 67,042 | (72) | 59,757 | (73) | 7,285 | (74) | * | ||||||||
Fourfathom Capital, LLC (75) | 191,549 | (76) | 170,735 | (77) | 20,814 | (78) | * | ||||||||
Michael B & Sheila J Carroll JTWROS | 287,321 | ( 29 ) | 256,101 | (80) | 31,221 | (81) | * | ||||||||
Scott D. Gamble | 191,549 | (82) | 170,735 | (83) | 20,814 | (84) | * | ||||||||
Brian E. Jones & Peggy A. Jones JTWROS | 120,530 | (85) | 85,369 | (86) | 35,161 | (87) | * | ||||||||
David Patterson | 38,312 | (88) | 34,148 | (89) | 4,164 | (90) | * | ||||||||
Herschel E. Johnson | 32,565 | (91) | 29,026 | (92) | 3,539 | (93) | — | ||||||||
George & Karin Alexa Elefther JTWROS | 22,127 | (94) | 7,498 | (95) | 14,629 | (96) | * | ||||||||
L. Dean Fox | 22,127 | (97) | 7,498 | (98) | 14,629 | (99) | * | ||||||||
Sterne Agee & Leach Inc C/F John L Sommer IRA | 66,581 | (100) | 14,993 | (101) | 51,588 | (102) | * | ||||||||
Sterne Agee & Leach Inc C/F David W Frost IRA | 10,245 | (103) | 8,996 | (104) | 1,249 | (105) | * | ||||||||
Allan D Carlson | 17,076 | (106) | 14,993 | (107) | 2,083 | (108) | * | ||||||||
Ian H Murray | 17,076 | (109) | 14,993 | (110) | 2,083 | (111) | * | ||||||||
Sterne Agee & Leach Inc C/F Randy Payne IRA | 41,828 | (112) | 14,993 | (113) | 26,835 | (114) | * | ||||||||
Dr. Richard & Anita Matter JTWROS | 34,150 | (115) | 29,986 | (116) | 4,164 | (117) | * | ||||||||
Robert J Gray | 56,272 | (118) | 37,481 | (119) | 18,791 | (120) | * | ||||||||
Randal E Margo | 42,685 | (121) | 37,481 | (122) | 5,204 | (123) | * | ||||||||
Eugene E Eubank | 85,369 | (124) | 74,962 | (125) | 10,407 | (126) | * | ||||||||
Robert W Baird & Co Inc TTEE FBO Brian Mark Miller ROTH IRA | 170,735 | (127) | 149,921 | (128) | 20,814 | (129) | * | ||||||||
Sterne Agee & Leach Inc C/F Dr Gary W Chmielewski IRA | 17,076 | (130) | 14,993 | (131) | 2,083 | (132) | * | ||||||||
Laidlaw & Co (UK) Ltd (133) | 373,910 | (134) | 308,079 | (134) | 65,831 | (136) | — | ||||||||
| (1) | Shares of common stock beneficially owned and the respective percentages of beneficial ownership of common stock assume the exercise of all options and other securities convertible into common stock beneficially owned by such person or entity currently exercisable or exercisable within 60 days of |
| (2) | These percentages have been calculated based on |
| (3) | Includes 4,216 shares of common stock issued in lieu of cash payments on the interest accrued on his bridge notes, |
| (4) | Includes 4,216 shares of common stock issued in lieu of cash payments on the interest accrued on his bridge notes, |
| (5) | Includes |
| (6) | S7 Capital, the general partner of Lau Family Fund LP, has voting and dispositive power over the securities held for the account of this selling stockholder. S7 Capital is controlled by Steven Lau, its manager, and accordingly, Mr. Lau may be deemed to have sole voting and dispositive power over the securities owned by Lau Family Fund LP. |
| (7) | Comprised of 913 shares of common stock issued in lieu of cash payments on the interest accrued on his bridge notes, |
| (8) | Comprised of 913 shares of common stock issued in lieu of cash payments on the interest accrued on his bridge notes, |
| (9) | Comprised of |
| (10) | Jonathan Steinhouse is a member of our board of directors. |
| (11) | Includes 383 shares of common stock issued in lieu of cash payments on the interest accrued on his bridge notes, |
| (12) | Comprised of 383 shares of common stock issued in lieu of cash payments on the interest accrued on his bridge notes, |
| (13) | Includes |
| (14) | Kenneth L Londoner is our executive chairman. |
| (15) | Comprised of (i) 99,311 shares of common stock directly held by Mr. Londoner and 2,579 shares of common stock issued in lieu of cash payments on the interest accrued on his bridge notes, (ii) |
| (16) | Comprised of 2,579 shares of common stock issued in lieu of cash payments on the interest accrued on his bridge notes, |
| (17) | Comprised of (i) |
| (18) | Includes 315 shares of common stock issued in lieu of cash payments on the interest accrued on the bridge notes, |
| (19) | Comprised of 315 shares of common stock issued in lieu of cash payments on the interest accrued on the bridge notes, |
| (20) | Includes |
| (21) | Comprised of 535 shares of common stock issued in lieu of cash payments on the interest accrued on his bridge notes, |
| (22) | Comprised of 535 shares of common stock issued in lieu of cash payments on the interest accrued on his bridge notes, |
| (23) | Comprised of |
| (24) | Comprised of |
| (25) | Comprised of |
| (26) | Comprised of |
| (27) | Shaye Hirsch, director of Brio Capital Master Fund Ltd., has sole voting and dispositive power over the securities held for the account of this selling stockholder. |
| (28) | Comprised of |
| (29) | Comprised of |
| (30) | Comprised of |
| (31) | Konrad Ackermann has sole voting and dispositive power over the securities held for the account of this selling stockholder. Pursuant to the Securities Purchase Agreement by and among us and the holders of the Series C Preferred Stock, Alpha Capital Anstalt was entitled to an expense reimbursement from us of $95,000, of which $62,500 was paid in cash and $32,500 was paid shares of common stock at a conversion price of $2.09 per share, and a warrant to purchase 8,700 shares of common stock. In addition, any amendments to the Securities Purchase Agreement must be approved by holders representing at least 67% of the outstanding shares of the Series C Preferred Stock, which holders must include Alpha Capital Anstalt, so long as Alpha Capital Anstalt holds not less than $100,000 of Series C Preferred Stock. Also, we may not (i) increase the number of authorized shares of preferred stock, (ii) amend our charter documents, including the terms of the Series C Preferred Stock, in any manner adverse to the holders of the Series C Preferred Stock, or (iii) perform certain covenants, including restrictions on incurrence of debt and liens, repurchasing our equity securities, payment of cash dividends and engaging in affiliate transactions without the approval of holders representing at least 67% of the outstanding shares of the Series C Preferred Stock, which holders must include Alpha Capital Anstalt, so long as Alpha Capital Anstalt holds not less than $100,000 of Series C Preferred Stock. |
| (32) | Comprised of |
| (33) | Comprised of |
| (34) | Includes |
| (35) | Comprised of |
| (36) | Comprised of |
| (37) | Comprised of |
| (38) | Comprised of (i) 10 shares of Series B Preferred Stock that are convertible into 24,752 shares of common stock, which were purchased for an aggregate purchase price of $50,000, (ii) |
| (39) | Comprised of |
| (40) | Includes |
| (41) | Comprised of |
| (42) | Comprised of |
| (43) | Comprised of |
| (44) | Comprised of |
| (45) | Comprised of |
| (46) | Comprised of |
| (47) | Comprised of (i) 10 shares of Series B Preferred Stock that are convertible into 24,752 shares of common stock, which were purchased for an aggregate purchase price of $50,000, (ii) |
| (48) | Comprised of |
| (49) | Includes |
| (50) | Comprised of (i) 20 shares of Series A Preferred Stock that are convertible into 54,348 shares of common stock, which were purchased for an aggregate purchase price of $100,000, (ii) |
| (51) | Comprised of |
| (52) | Includes 20,814 shares of common stock issuable upon the exercise of warrants. |
| (53) | Comprised of (i) 35 shares of Series A Preferred Stock that are convertible into 95,109 shares of common stock, which were purchased for an aggregate purchase price of $175,000, (ii) 4 shares of Series B Preferred Stock that are convertible into 9,901 shares of common stock, which were purchased for an aggregate purchase price of $20,000, (iii) |
| (54) | Comprised of |
| (55) | Includes |
| (56) | Portofino Management, Inc., the general partner of Portofino Ventures LP, has voting and dispositive power over the securities held for the account of this selling stockholder. Portofino Management, Inc. is controlled by Michael Knudsen, its president, and accordingly, Mr. Knudsen may be deemed to have sole voting and dispositive power over the securities owned by Portofino Management, Inc. |
| (57) | Comprised of |
| (58) | Comprised of |
| (59) | Comprised of |
| (60) | Comprised of (i) 3 shares of Series B Preferred Stock that are convertible into 7,426 shares of common stock, which were purchased for an aggregate purchase price of $15,000, (ii) |
| (61) | Comprised of |
| (62) | Includes |
| (63) | Comprised of |
| (64) | Comprised of |
| (65) | Comprised of |
| (66) | Comprised of (i) 10 shares of Series A Preferred Stock that are convertible into 27,174 shares of common stock, which were purchased for an aggregate purchase price of $50,000, (ii) |
| (67) | Comprised of |
| (68) | Includes |
| (69) | Comprised of |
| (70) | Comprised of |
| (71) | Comprised of |
| (72) | Comprised of |
| (73) | Comprised of |
| (74) | Comprised of |
| (75) | Brian Miller, manager of Fourfathom Capital, LLC, has sole voting and dispositive power over the securities held for the account of this selling stockholder. |
| (76) | Comprised of |
| (77) | Comprised of |
| (78) | Comprised of |
| (79) | Comprised of |
| (80) | Comprised of |
| (81) | Comprised of |
| (82) | Comprised of |
| (83) | Comprised of |
| (84) | Comprised of |
| (85) | Comprised of (i) 10 shares of Series B Preferred Stock that are convertible into 24,752 shares of common stock, which were purchased for an aggregate purchase price of $50,000, (ii) |
| (86) | Comprised of |
| (87) | Includes |
| (88) | Comprised of |
| (89) | Comprised of |
| (90) | Comprised of |
| (91) | Comprised of |
| (92) | Comprised of |
| (93) | Comprised of |
| (94) | Comprised of (i) 5 shares of Series A Preferred Stock that are convertible into 13,587 shares of common stock, which were purchased for an aggregate purchase price of $25,000, (ii) |
| (95) | Comprised of |
| (96) | Includes |
| (97) | Comprised of (i) 5 shares of Series A Preferred Stock that are convertible into 13,587 shares of common stock, which were purchased for an aggregate purchase price of $25,000, (ii) |
| (98) | Comprised of |
| (99) | Includes |
| (100) | Comprised of (i) 20 shares of Series B Preferred Stock that are convertible into 49,505 shares of common stock, which were purchased for an aggregate purchase price of $100,000, (ii) |
| (101) | Comprised of |
| (102) | Includes |
| (103) | Comprised of |
| (104) | Comprised of |
| (105) | Comprised of |
| (106) | Comprised of |
| (107) | Comprised of |
| (108) | Comprised of |
| (109) | Comprised of |
| (110) | Comprised of |
| (111) | Comprised of |
| (112) | Comprised of (i) 5 shares of Series B Preferred Stock that are convertible into 24,752 shares of common stock, which were purchased for an aggregate purchase price of $25,000, (ii) |
| (113) | Comprised of |
| (114) | Includes |
| (115) | Comprised of |
| (116) | Comprised of |
| (117) | Comprised of |
| (118) | Comprised of (i) 5 shares of Series A Preferred Stock that are convertible into 13,587 shares of common stock, which were purchased for an aggregate purchase price of $25,000, (ii) |
| (119) | Comprised of |
| (120) | Includes |
| (121) | Comprised of |
| (122) | Comprised of |
| (123) | Comprised of |
| (124) | Comprised of |
| (125) | Comprised of |
| (126) | Comprised of |
| (127) | Comprised of |
| (128) | Comprised of |
| (129) | Comprised of |
| (130) | Comprised of |
| (131) | Comprised of |
| (132) | Comprised of |
| (133) | Laidlaw & Co (UK) Ltd is a registered broker-dealer. Matthew Eitner is the chief executive officer of Laidlaw & Co (UK) Ltd and, in such capacity, he may be deemed to have voting and dispositive power over the securities held for the account of this selling stockholder. On January 17, 2013, we engaged Laidlaw & Co (UK) Ltd to serve as our placement agent in connection with the private placement of our Series C Preferred Stock and the related warrants. In connection with such private placement, we paid Laidlaw & Co (UK) Ltd a fee of $166,860 and we issued it a five-year warrant to purchase 177,057 shares of our common stock, at an initial exercise price of $2.61 per share. As a result of the amendment to our Series C Preferred Stock, the full-ratchet anti-dilution protection provision of the such warrant decreased the exercise price to $1.50 per share and increased the number of shares issuable to 308,079. In addition, on January 18, 2013, we issued Laidlaw & Co (UK) Ltd (or its assigns) two seven-year warrants to purchase: 35,076 shares at an initial exercise price of $1.84 per share in connection with the private placement of our Series A Preferred Stock; and 30,755 shares at an initial exercise price of $2.02 per share in connection with our Series B Preferred Stock. |
| (134) | Comprised of 308,079 shares of common stock issuable upon the exercise of warrants. |
| (135) | Comprised of 65,831 shares of common stock issuable upon the exercise of warrants. |
CERTAIN RELATIONSHIPS AND RELATED PARTY TRANSACTIONS
On May 15, 2011, we issued to each of an entity wholly-owned by Mr. Londoner and Miko Consulting Group, Inc., an entity jointly controlled by Dr. Drakulic and Ms. Mikolaitis, 1,700,000 shares of common stock issued at par value for services rendered as our founders in 2009.
On August 1, 2012, we entered into a consulting agreement with Asher Holzer, Ph.D., a member of our board of directors. Pursuant to the consulting agreement, Dr. Holzer was to serve as our chief scientific officer and assist in the development of our technology and our PURE EP System, in exchange for monthly payments of $10,000. We have paid Dr. Holzer an initial payment of $7,500 pursuant to the consulting agreement and we are negotiating an amendment to the consulting agreement with Dr. Holzer that will reflect the parties’ current relationship.
On November 21, 2012, we issued an unsecured promissory note for $218,000 to Kenneth L. Londoner, our then chairman and chief executive officer, for previously advanced funds with interest payable annually, in arrears, on each anniversary at the short term “Applicable Federal Rate” within the meaning of Section 1274(d) of the Internal Revenue Code of 1986, as amended, which was 0.22% in November 2012, and which will be adjusted each anniversary date. The promissory note matures November 21, 2021 and may be prepaid, without premium or penalty, at any time. In connection with the private placement of our Series C Preferred Stock and warrants, on February 6, 2013, Mr. Londoner agreed not to receive payments (by voluntary prepayment, acceleration, set-off or otherwise) associated with the unsecured promissory note absent the prior written consent of the purchasers holding at least 67% interest of our Series C Preferred Stock outstanding, which purchasers must include Alpha Capital Anstalt so long as Alpha Capital Anstalt holds not less than $100,000 of our Series C Preferred Stock. As of June 30, 2013, aggregate interest of $277.19 has accrued on this unsecured promissory note.
On December 6, 2012, we issued an unsecured promissory note for $30,000 to a company under the control of Mr. Londoner for previously advanced funds, interest free and due the earlier of (i) the next financing of not less than $300,000; (ii) February 28, 2013 or (iii) occurrence of an event of default, as defined. The promissory note has been paid in full.
In the fourth quarter of 2012, we sold $600,000 principal amount of certain bridge notes and related warrants in a private placement to selected accredited investors. These bridge notes and related warrants were converted into shares of our Series C Preferred Stock and warrants on February 6, 2013. Kenneth L. Londoner, our then chairman and chief executive officer, purchased $200,000 principal amount of notes, which were converted into 200 shares of Series C Preferred Stock and a warrant to purchase 95,694 shares of our common stock, and Jonathan Steinhouse; a member of our board of directors, purchased $25,000 principal amount of notes, which were converted into 25 shares of Series C Preferred Stock and a warrant to purchase 11,962 shares of our common stock. We also issued to Mr. Londoner and Mr. Steinhouse, in lieu of cash payments on the interest accrued on their respective bridge notes, 2,579 and 383 shares of common stock, respectively.
From 2010 to 2013, Mr. Londoner made four different advances of funds to us in the aggregate amount of $22,000, of which $12,000 has been repaid. In 2013, Mr. Steinhouse made an advance of funds to us in the amount of $20,000, which has been repaid in full. These advances were interest-free and not made on condition of any specific terms.
On February 12, 2013, we issued to Alpha Capital Anstalt 625 shares of Series C Preferred Stock and a warrant to purchase 299,043 shares of our common stock for a purchase price of $625,000.
On May 2, 2013, we entered into an indemnity agreement with Seth H. Z. Fischer in connection with our appointment of Mr. Fischer to our board of directors. Pursuant to the indemnity agreement, we agreed to indemnify Mr. Fischer for all costs and losses relating to proceedings arising out of his service on our board of directors, to the fullest extent permitted by applicable law, subject to certain exceptions, including, but limited to, a final adjudication that Mr. Fischer’s conduct was in bad faith, knowingly fraudulent or deliberately dishonest or constituted willful misconduct, or a final adjudication that established Mr. Fischer breached his duty of loyalty to us or that his conduct resulted in illegal personal profits. In addition, we agreed to advance Mr. Fischer expenses when properly requested and we will be entitled to assume the defense of Mr. Fischer if he requests payment of expenses under the indemnity agreement.
On December 31, 2013, as part of a private placement transaction of our common stock and warrants, (i) $228,000 of our outstanding indebtedness that was due to Mr. Londoner was converted into 93,061 shares of common stock and a warrant to purchase 46,531 shares of our common stock; and (ii) we issued to Alpha Capital Anstalt 122,448 shares of our common stock and a warrant to purchase 61,225 shares of our common stock for a purchase price of $300,000.
On January 31, 2014, as part of a private placement transaction of our common stock and warrants, Mr. Steinhouse purchased an aggregate of 24,490 shares of common stock and a warrant to purchase 12,246 shares of common stock for an aggregate purchase price of $60,000.
We have authorized 51,000,000 shares of capital stock, par value $0.001 per share, of which 50,000,000 are shares of common stock and 1,000,000 are shares of “blank check” preferred stock, of which 200 are authorized as Series A Preferred Stock, 600 are authorized as Series B Preferred Stock and 4,200 are authorized as Series C Preferred Stock. On January 17, March 27, 2014, there were 8,412,101 shares of common stock issued and outstanding, 184.4 shares of Series A Preferred Stock issued and outstanding, 177.5 shares of Series B Preferred Stock issued and outstanding and 2,781 shares of Series C Preferred Stock issued and outstanding.
Pursuant to the terms of our Series A Preferred Stock and our Series B Preferred Stock, upon us becoming subject to the reporting requirements under Section 13 or 15(d) of the Securities and Exchange Act, as amended, all shares of our Series A Preferred Stock and our Series B Preferred Stock will automatically convert into shares of our common stock. As a result, upon the effectiveness of this registration statement, the outstanding shares of our Series A Preferred Stock and our Series B Preferred Stock will convert into an aggregate of 1,037,974 1,072,757 shares of our common stock, including dividends accrued on the shares of preferred stock that will be paid in kind and automatically converted. In addition, there will be 43 additional holders of our common stock. Therefore, upon the effectiveness of this registration statement, there will be an aggregate of 9,225,624 14,574,095 shares of our common stock outstanding, separate from any shares registered on this registration statement.
The shares of common stock offered by this prospectus are issuable upon the exercise of common stock purchase warrants or the conversion of shares of Series C Preferred Stock. As such, if a selling stockholder exercises all or any portion of its warrants on a cash basis, we will receive the aggregate exercise price paid by such selling stockholder in connection with any such warrant exercise. The maximum amount of proceeds we would receive upon the exercise of all the warrants on a cash basis would be approximately $4,690,000. However, certain of the selling stockholders may also exercise their warrants through a cashless exercise. In the event a selling stockholder exercises a warrant through a cashless exercise, we will not receive any proceeds from such exercise. We expect to use the proceeds received from the exercise of the warrants, if any, for general working capital purposes.
Holders of Capital Stock
As of January 17, March 27, 2014, we had 25 holders of our common stock, 20 holders of our Series A Preferred Stock, 24 holders of our Series B Preferred Stock and 41 55 holders of our Series C Preferred Stock.
Rule 144 Shares
As of January 17,March 27, 2014, we had 1,563,4282,490,068 shares of our common stock that are currently available for sale to the public, , including shares of common stock issuable upon conversion of our Series A Preferred Stock, and Series B Preferred Stock .and certain shares of our Series C Preferred Stock. On May 6, 2014, 124,669 shares of our common stock issuable upon conversion of our Series C Preferred Stock will have satisfied the holding period requirements of Rule 144. On July 15, 2014, 239,340 shares of our common stock issuable upon conversion of our Series C Preferred Stock will have satisfied the holding period requirements of Rule 144. On January 31, 2015, 83,218 shares of our common stock will have satisfied the holding period requirements of Rule 144.
Common Stock
The holders of common stock are entitled to one vote per share on all matters to be voted upon by stockholders. Holders of our common stock are entitled to receive ratably dividends as may be declared by the board of directors out of funds legally available for that purpose. In the event of our liquidation, dissolution, or winding up, the holders of common stock are entitled to share ratably in all assets remaining after payment of liabilities. The common stock has no preemptive or conversion rights, other subscription rights, or redemption or sinking fund provisions.
Each share of common stock entitles the holder to one vote, either in person or by proxy, at meetings of stockholders. The holders are not permitted to vote their shares cumulatively. Accordingly, the stockholders of our common stock who hold, in the aggregate, more than fifty percent of the total voting rights can elect all of our directors and, in such event, the holders of the remaining minority shares will not be able to elect any of such directors. The vote of the holders of a majority of the issued and outstanding shares of common stock entitled to vote thereon is sufficient to authorize, affirm, ratify or consent to such act or action, except as otherwise provided by law.
Subject to the rights of the holders of any preferred stock, holders of common stock are entitled to receive ratably such dividends, if any, as may be declared by our board of directors out of funds legally available. We have not paid any dividends since our inception, and, subject to our obligations to pay dividends to the holders of our preferred stock as described below, we presently anticipate that all earnings, if any, will be retained for development of our business. Any future disposition of dividends will be at the discretion of our board of directors and will depend upon, among other things, our future earnings, operating and financial condition, capital requirements, and other factors.
Holders of our common stock have no preemptive rights or other subscription rights, conversion rights, redemption or sinking fund provisions. Subject to the rights of the holders of our preferred stock, upon our liquidation, dissolution or winding up, the holders of our common stock will be entitled to share ratably in the net assets legally available for distribution to stockholders after the payment of all of our debts and other liabilities. There are no provisions in our certificate of incorporation or our by-laws that would prevent or delay a change in our control.
Series A Preferred Stock
The holders of the Series A Preferred Stock are entitled to a five percent (5%) dividend on the $5,000 per share stated value. From and after May 31, 2011, cumulative, preferential dividends on outstanding shares of Series A Preferred Stock have accrued and have been payable quarterly, in arrears, beginning on August 31, 2011. Dividends are payable at our option in cash or in shares of Series A Preferred Stock. If not previously converted, the shares of the Series A Preferred Stock will be redeemed by us on December 31, 2014. In the event of our liquidation or winding up of affairs, the holders of the Series A Preferred Stock will be entitled to a liquidation preference of the stated value plus any accrued but unpaid dividends.
Upon us being required to file reports with the Securities and Exchange Commission pursuant to Section 13 or 15(d) of the Securities Exchange Act of 1934, as amended, the shares of Series A Preferred Stock will automatically convert into shares of common stock at a conversion price equal to $1.84 per share. In addition, at any time prior to the automatic conversion of the Series A Preferred Stock, the holders of the Series A Preferred Stock have the option to convert some or all of their shares of Series A Preferred Stock into shares of common stock at a conversion price equal to $1.84 per share.
The holders of the Series A Preferred Stock have no voting rights, except as required by law. Any amendment to our certificate of incorporation that adversely affects the Series A Preferred Stock requires the approval of the holders of a majority of the shares of Series A Preferred Stock then outstanding.
Series B Preferred Stock
The holders of the Series B Preferred Stock are entitled to a five percent (5%) dividend on the $5,000 per share stated value. From and after December 31, 2011, cumulative, preferential dividends on outstanding shares of Series B Preferred Stock have accrued and have been payable quarterly, in arrears, beginning on March 31, 2012. Dividends are payable at our option in cash or in shares of Series B Preferred Stock. If not previously converted, the shares of the Series B Preferred will be redeemed by us on December 31, 2014. In the event of our liquidation or winding up of affairs, the holders of the Series B Preferred Stock, subject to the rights of the holders of the Series A Preferred Stock, will be entitled to a liquidation preference of the stated value plus any accrued but unpaid dividends.
Upon us being required to file reports with the Securities and Exchange Commission pursuant to Section 13 or 15(d) of the Securities Exchange Act of 1934, as amended, the shares of Series B Preferred will automatically convert into shares of common stock at a conversion price equal to $2.02 per share. In addition, at any time prior to the automatic conversion of the Series B Preferred Stock, the holders of the Series B Preferred Stock have the option to convert some or all of their shares of Series B Preferred Stock into shares of common stock at a conversion price equal to $2.02 per share.
The holders of the Series B Preferred Stock have no voting rights, except as required by law. Any amendment to our certificate of incorporation that adversely affects the Series B Preferred Stock requires the approval of the holders of a majority of the shares of Series B Preferred Stock then outstanding.
Series C Preferred Stock
The holders of the Series C Preferred Stock are entitled to a nine percent (9%) dividend on the $1,000 per share Stated Value. Unless the Series C Preferred Stock is converted into shares of common stock, from and after February 12, 2013, the dividends have accrued and have been payable in cash or, subject to the satisfaction of certain conditions, in pay-in-kind shares. Such cumulative dividends are payable quarterly, commencing on September 30, 2013 and on each conversion date; provided, however, that if a holder converts its shares of Series C Preferred Stock into shares of common stock any time prior to February 12, 2016, the holder will be deemed to have earned a make whole amount as if such shares of Series C Preferred Stock had been outstanding until such date. The terms of the Series C Preferred Stock were amended on March 27, 2014. The description herein reflects such amended terms.
In the event that
| (i) | we fail to, or announce our intention not to, deliver common stock share certificates upon conversion of our Series C Preferred Stock prior to the seventh trading day after such shares are required to be delivered, |
| (ii) | we fail for any reason to pay in full the amount of cash due pursuant to our failure to deliver common stock share certificates upon conversion of our Series C Preferred Stock within five calendar days after notice therefor is delivered, |
| (iii) | we fail to have available a sufficient number of authorized and unreserved shares of common stock to issue to upon a conversion of our Series C Preferred Stock, |
| (iv) | we fail to observe or perform any other covenant, agreement or warranty contained in, or otherwise commit any breach of our obligations under, the securities purchase agreement, the registration rights agreement, the certificate of designation or the warrants entered into pursuant to the private placement transaction for our Series C Preferred Stock, which failure or breach could have a material adverse effect, and such failure or breach is not cured within 30 calendar days after written notice was delivered, |
| (v) | we are party to a change of control transaction, |
| (vi) | we file for bankruptcy or a similar arrangement or are adjudicated insolvent, |
| (vii) | we are subject to a judgment of greater than $100,000, and such judgment remains unvacated, unbonded or unstayed for a period of 45 calendar days, |
the holders of the Series C Preferred Stock are entitled, among other rights, to redeem their shares of Series C Preferred Stock at any time for greater than their stated value, increase the dividend rate on their shares of Series C Preferred Stock to 18% .
Because we failed to complete a financing or solely uponseries of related financings by February 12, 2014 that resulted in gross proceeds to us of at least $3 million at a valuation of at least $30 million, and because we failed to maintain the occurrencelisting of (v) above, reduce our common stock on a trading market for more than five trading days in any twelve month period at any time after February 12, 2014, the conversion price of their shares ofthe Series C Preferred Stock was reduced to $1.50 per share.
In the event of our liquidation or winding up of affairs, the holders of the Series C Preferred Stock will be entitled to a liquidation preference of the stated value plus any accrued but unpaid dividends or any other fees due the holder. The shares of the Series C Preferred Stock rank senior to the rights of the common stock and all other securities exercisable or convertible into shares of common stock.
Any holder of Series C Preferred Stock is entitled at any time to convert any whole or partial number of shares of Series C Preferred Stock into shares of our common stock at a price based on a pre-money valuation of $20 million, or $2.09 $1.50 per share. The Series C Preferred Stock is subject to full ratchet anti-dilution price protection upon the issuance of equity or equity-linked securities at an effective common stock purchase price of less than $2.09 $ 1.50 per share as well as other customary anti-dilution protection. As noted above, in the event that we fail to complete a financing pursuant to which we raise at least $3 million at a valuation of at least $30 million within 12 months following the closing, the conversion price of the Series C Preferred Stock may be reset to $1.50 per share at the discretion of the holders.
In the event we issue any equity or equity-linked securities with terms more favorable than those of the Series C Preferred Stock, any holder of the Series C Preferred Stock may request to amend the terms of such holder’s Series C Preferred Stock to be equivalent to the terms of such issued equity or equity-linked securities, subject to certain exempted issuances.
The holders of the Series C Preferred Stock vote together with the holders of our common stock on an as-converted basis, but may not vote the Series C Preferred Stock in excess of the beneficial ownership limitation of the Series C Preferred Stock. The beneficial ownership limitation is 4.99% of our then outstanding shares of common stock following such conversion or exercise, which may be increased to up to 9.99% of our then outstanding shares of common stock following such conversion or exercise upon the request of an individual holder. The beneficial ownership limitation is determined on an individual holder basis, such that the as-converted number of shares of one holder is not included in the shares outstanding when calculating the limitation for a different holder. In addition, absent the approval of holders representing at least 67% of the outstanding shares of the Series C Preferred Stock, which holders must include Alpha Capital Anstalt, so long as Alpha Capital Anstalt holds not less than $100,000 of Series C Preferred Stock, we may not (i) increase the number of authorized shares of preferred stock, (ii) amend our charter documents, including the terms of the Series C Preferred Stock, in any manner adverse to the holders of the Series C Preferred Stock, including authorizing or creating any class of stock ranking senior to, or otherwise pari passu with, the shares of Series C Preferred Stock as to dividends, redemption or distribution of assets upon a liquidation, or (iii) perform certain covenants, including:
| ● | incur additional indebtedness; |
| ● | permit liens on assets; |
| ● | repay, repurchase or otherwise acquire more than a de minimis number of shares of common stock, Series A Preferred Stock or Series B Preferred Stock; |
| ● | pay cash dividends to our stockholders; and |
| ● | engage in transactions with affiliates. |
58
Pursuant to the securities purchase agreement for the Series C Preferred Stock, each holder of Series C Preferred Stock has a right to participate in any of our financings, subject to certain exceptions, on a pro-rata basis, for a period expiring 12 months after the effectiveness date of this registration statement.
Warrant
Five-Year Warrants
In connection with the private placement of our Series C Preferred Stock, we issued to the holders of our Series C Preferred Stock warrants to purchase up to an aggregate of 1,330,629 shares of common stock at an exercise price of $2.61 per share. The warrants contain full ratchet anti-dilution price protection upon the issuance of equity or equity-linked securities at an effective common stock purchase price of less than $2.61 per share as well as other customary anti-dilution protection. The warrants are exercisable for cash; or if at any time after six months from the issuance date, there is no effective registration statement registering the resale, or no current prospectus available for the resale, of the shares of common stock underlying the warrants, the warrants may be exercised by means of a “cashless exercise”. As a result of an amendment to the conversion price of our Series C Preferred Stock, the full-ratchet anti-dilution protection provision of the warrants decreased the exercise price of the warrants from $2.61 per share to $1.50 per share and increased the aggregate number of shares issuable under the warrants to 2,315,301.
Five-Year Amendment Warrants
As consideration for (i) extending the termination date of the securities purchase agreement and (ii) extending the filing and effectiveness dates for the filing of the registration statement pursuant to the registration rights agreement related our Series C Preferred Stock, we issued to the holders of our Series C Preferred Stock that purchased shares of our Series C Preferred Stock prior to the July 15, 2013 closing warrants to purchase up to an aggregate of 289,730 shares of common stock. The terms of these warrants are identical to the Five-Year Warrants described above. As a result of an amendment to the conversion price or our Series C Preferred Stock, the full-ratchet anti-dilution protection provision of the warrants decreased the exercise price of the warrants from $2.61 per share to $1.50 per share and increased the aggregate number of shares issuable under the warrants to 504,130.
October 2013 Five-Year Amendment Warrants
As consideration for amending the terms of the securities purchase agreement to permit our private placement of our common stock and warrants in December 2013, we issued to the holders of our Series C Preferred Stock warrants to purchase up to an aggregate of 332,684 shares of common stock. The terms of these warrants are identical to the Five-Year Warrants described above. As a result of an amendment to the conversion price or our Series C Preferred Stock, the full-ratchet anti-dilution protection provision of the warrants decreased the exercise price of the warrants from $2.61 per share to $1.50 per share and increased the aggregate number of shares issuable under the warrants to 578,870.
December 2013 Five-Year Warrants
In connection with the private placement of our common stock in December 2013 and January 2014, we issued to the investors participating in the private placement warrants to purchase up to an aggregate of 107,756 161,611 shares of common stock at an exercise price of $3.67 per share. The warrants contain customary anti-dilution protections. The warrants are exercisable for cash; or if at any time after six months from the issuance date, there is no effective registration statement registering the resale, or no current prospectus available for the resale, of the shares of common stock underlying the warrants, the warrants may be exercised by means of a “cashless exercise”.
Series A Placement Agent Warrant
As consideration for serving as our placement agent in connection with the private placement of Series A Preferred Stock, we issued to Laidlaw & Company (UK) Ltd. a seven-year warrant to purchase up to 35,076 shares of common stock at an exercise price of $1.84 per share. The terms of this warrant are otherwise identical to the Five-Year Warrants described above.
Series B Placement Agent Warrant
As consideration for serving as our placement agent in connection with the private placement of Series B Preferred Stock, we issued to Laidlaw & Company (UK) Ltd. a seven-year warrant to purchase up to 30,755 shares of common stock at an exercise price of $2.02 per share. The terms of this warrant are otherwise identical to the Five-Year Warrants described above.
Series C Placement Agent Warrant
As consideration for serving as our placement agent in connection with the private placement of Series C Preferred Stock, we issued to Laidlaw & Company (UK) Ltd. a warrant to purchase up to 177,057 shares of common stock. The terms of this warrant are identical to the Five-Year Warrants described above. As a result of an amendment to the conversion price or our Series C Preferred Stock, the full-ratchet anti-dilution protection provision of the warrants decreased the exercise price of the warrants from $2.61 per share to $1.50 per share and increased the aggregate number of shares issuable under the warrants to 308,079
Par Value Warrant
As consideration for providing general financial advisory services, we issued to Jamess Capital Group LLC a seven-year warrant to purchase up to 383,320 shares of common stock at an exercise price of $0.001 per share. The terms of this warrant are otherwise identical to the Five-Year Warrants described above.
Common Stock Placement Agent Warrant
As consideration for serving as our placement agent in connection with the private placement of our common stock, we issued to Laidlaw & Company (UK) Ltd. a warrant to purchase up to 21,551 shares of common stock. The terms of this warrant are identical to the December 2013 Five-Year Warrants described above.
Registration Rights
On February 6, 2013, in connection with our private placement of our Series C Preferred Stock and warrants, we entered into a registration rights agreement with the purchasers pursuant to which we agreed to provide certain registration rights with respect to the common stock issuable upon conversion of our Series C Preferred Stock and exercise of the warrants issued to holders of our Series C Preferred Stock. Specifically, we agreed to file a registration statement with the Securities and Exchange Commission covering the resale of the common stock issuable upon conversion of the Series C Preferred Stock and exercise of the warrants on or before July 22, 2013 and to cause such registration statement to be declared effective by the Securities and Exchange Commission, in the event that the registration statement is not reviewed by the Securities and Exchange Commission, within five trading days after we are notified that registration statement is not being reviewed by the Securities and Exchange Commission, and by November 22, 2013 in the event that the registration statement is reviewed by the Securities and Exchange Commission and the Securities and Exchange Commission issues comments.
If (i) the registration statement is not filed by July 22, 2013, (ii) the registration statement is not declared effective by the Securities and Exchange Commission within five trading days after we are notified that registration statement is not being reviewed by the Securities and Exchange Commission, in the case of a no review, (iii) the registration statement is not declared effective by the Securities and Exchange Commission by November 22, 2013 in the case of a review by the Securities and Exchange Commission pursuant to which the Securities and Exchange Commission issues comments or (iv) the registration statement ceases to remain continuously effective for more than 20 consecutive calendar days or more than an aggregate of 45 calendar days during any 12-month period after its first effective date, then we are subject to liquidated damage payments to the holders of the shares sold in the private placement in an amount equal to .25% of the aggregate purchase price paid by such purchasers per month of delinquency. Notwithstanding the foregoing, (i) the maximum aggregate liquidated damages due under the registration rights agreement shall be 3% of the aggregate purchase price paid by the purchasers, and (ii) if any partial amount of liquidated damages remains unpaid for more than seven days, we shall pay interest of 18% per annum, accruing daily, on such unpaid amount.
Pursuant to the registration rights agreement, we must maintain the effectiveness of the registration statement from the effective date until the date on which all securities registered under the registration statement have been sold, or are otherwise able to be sold pursuant to Rule 144 without volume or manner-of-sale restrictions, subject to the our right to suspend or defer the use of the registration statement in certain events.
On December 31, 2013, in connection with our private placement of our common stock and warrants, we entered into a registration rights agreement with the purchasers pursuant to which we agreed to provide certain registration rights with respect to the common stock issued to the investors participating in our private placement and the common stock issuable upon exercise of the related warrants issued such investors. Specifically, we agreed to file a registration statement with the Securities and Exchange Commission covering the resale of the shares of common stock issued pursuant to the private placement and issuable upon the exercise of the warrants within 45 days of January 31, 2014 and to cause such registration statement to be declared effective by the Securities and Exchange Commission, in the event that the registration statement is not reviewed by the Securities and Exchange Commission, within 30 calendar days after we are notified that registration statement is not being reviewed by the Securities and Exchange Commission, and within 180 calendar days of the initial filing date of the registration statement in the event that the registration statement is reviewed by the Securities and Exchange Commission and the Securities and Exchange Commission issues comments.
If (i) the registration statement is not filed within 45 days of January 31, 2014, (ii) the registration statement is not declared effective by the Securities and Exchange Commission within 30 calendar days after we are notified that registration statement is not being reviewed by the Securities and Exchange Commission, in the case of a no review, (iii) the registration statement is not declared effective by the Securities and Exchange Commission within 180 calendar days of the initial filing date of the registration statement in the case of a review by the Securities and Exchange Commission pursuant to which the Securities and Exchange Commission issues comments or (iv) the registration statement ceases to remain continuously effective for more than 10 consecutive calendar days or more than an aggregate of 15 calendar days during any 12-month period after its first effective date, then we are subject to liquidated damage payments to the holders of the shares sold in the private placement in an amount equal to 1.0% of the aggregate purchase price paid by such purchasers per month of delinquency, provided, however, that we will not be required to make any payments any of the foregoing events occurred at such time that all securities registered or to be registered in the registration statement are eligible for resale pursuant to Rule 144 (without volume restrictions or current public information requirements) promulgated by the Securities and Exchange Commission pursuant to the Securities Act of 1933, as amended and provided, further, that we will not be required to make any liquidated damage payments with respect to any securities registered or to be registered in the registration statement that we are unable to register due to limits imposed by the Securities and Exchange Commission’s interpretation of Rule 415 under the Securities Act of 1933, as amended.. Notwithstanding the foregoing, (i) the maximum aggregate liquidated damages due under the registration rights agreement shall be 3% of the aggregate purchase price paid by the purchasers, and (ii) if any partial amount of liquidated damages remains unpaid for more than seven days, we shall pay interest of 18% per annum, accruing daily, on such unpaid amount.
Pursuant to the registration rights agreement, we must maintain the effectiveness of the registration statement from the effective date until the date on which all securities registered under the registration statement have been sold, or are otherwise able to be sold pursuant to Rule 144 without volume or manner-of-sale restrictions, subject to the our right to suspend or defer the use of the registration statement in certain events.
Delaware Anti-Takeover Law and Provisions of our Certificate of Incorporation and Bylaws
Section 203 of the Delaware General Corporation Law, in general, prohibits a business combination between a corporation and an interested stockholder within three years of the time such stockholder became an interested stockholder, unless:
| prior to such time the board of directors of the corporation approved either the business combination or the transaction that resulted in the stockholder becoming an interested stockholder; |
| upon consummation of the transaction that resulted in the stockholder becoming an interested stockholder, the interested stockholder owned at least 85% of the voting stock of the corporation outstanding at the time the transaction commenced, exclusive of shares owned by directors who are also officers and by certain employee stock plans; or |
| at or subsequent to such time, the business combination is approved by the board of directors and authorized by the affirmative vote at a stockholders’ meeting of at least 66 2/3% of the outstanding voting stock that is not owned by the interested stockholder. |
The term “business combination” is defined to include, among other transactions between an interested stockholder and a corporation or any direct or indirect majority owned subsidiary thereof: a merger or consolidation; a sale, lease, exchange, mortgage, pledge, transfer or other disposition (including as part of a dissolution) of assets having an aggregate market value equal to 10% or more of either the aggregate market value of all assets of the corporation on a consolidated basis or the aggregate market value of all the outstanding stock of the corporation; certain transactions that would result in the issuance or transfer by the corporation of any of its stock to the interested stockholder; certain transactions that would increase the interested stockholder’s proportionate share ownership of the stock of any class or series of the corporation or such subsidiary; and any receipt by the interested stockholder of the benefit of any loans, advances, guarantees, pledges or other financial benefits provided by or through the corporation or any such subsidiary. In general, and subject to certain exceptions, an “interested stockholder” is any person who is the owner of 15% or more of the outstanding voting stock of the corporation, an affiliate or associate of the corporation who was the owner of 15% or more of the outstanding voting stock of the corporation at any time within three years immediately prior to the relevant date or the affiliates and associates of such person. The term “owner” is broadly defined to include any person that individually or with or through such person’s affiliates or associates, among other things, beneficially owns such stock, or has the right to acquire such stock (whether such right is exercisable immediately or only after the passage of time) pursuant to any agreement or understanding or upon the exercise of warrants or options or otherwise or has the right to vote such stock pursuant to any agreement or understanding, or has an agreement or understanding with the beneficial owner of such stock for the purpose of acquiring, holding, voting or disposing of such stock.
The restrictions described above do not apply to corporations that have elected, in the manner provided therein, not to be subject to Section 203 of the Delaware General Corporation Law or, with certain exceptions, which do not have a class of voting stock that is listed on a national securities exchange or held of record by more than 2,000 stockholders. We have not opted out of Section 203, but we are not currently subject to it because we are not listed on a national securities exchange and our securities are held of record by fewer than 2,000 stockholders. However, we could become subject to it if we become so listed or so held.
If Section 203 becomes applicable to us, it could delay or prohibit mergers or other takeover or change in control attempts with respect to us and, accordingly, could discourage attempts to acquire us even though such a transaction may offer our stockholders the opportunity to sell their stock at a price above the prevailing market price.
Provisions of our certificate of incorporation and bylaws may delay or discourage transactions involving an actual or potential change in our control or change in our management, including transactions in which stockholders might otherwise receive a premium for their shares, or transactions that our stockholders might otherwise deem to be in their best interests. Therefore, these provisions could adversely affect the price of our common stock. Among other things, our certificate of incorporation and bylaws:
| do not provide for cumulative voting rights (therefore allowing the holders of a majority of the shares of common stock entitled to vote in any election of directors to elect all of the directors standing for election, if they should so choose); |
| provide that special meetings of our stockholders may be called only by our board of directors, chairman, chief executive officer, president or secretary; and |
| provide advance notice provisions with which a stockholder who wishes to nominate a director or propose other business to be considered at a stockholder meeting must comply. |
Indemnification of Directors and Officers
Pursuant to Section 145 of the Delaware General Corporation Law, a corporation has the power to indemnify its directors and officers against expenses, judgments, fines and amounts paid in settlement actually and reasonably incurred in connection with a third-party action, other than a derivative action, and against expenses actually and reasonably incurred in the defense or settlement of a derivative action, provided that there is a determination that the individual acted in good faith and in a manner reasonably believed to be in or not opposed to the best interests of the corporation and, with respect to any criminal action or proceeding, had no reasonable cause to believe the individual’s conduct was unlawful. Such determination will be made, in the case of an individual who is a director or officer at the time of such determination:
| by a majority of the disinterested directors, even though less than a quorum; |
| by a committee of such directors designated by a majority vote of such directors, even though less than a quorum; |
| if there are no disinterested directors, or if such directors so direct, by independent legal counsel; or |
| by a majority vote of the stockholders, at a meeting at which a quorum is present. |
Without court approval, however, no indemnification may be made in respect of any derivative action in which such individual is adjudged liable to the corporation.
The Delaware General Corporation Law requires indemnification of directors and officers for expenses relating to a successful defense on the merits or otherwise of a derivative or third-party action.
The Delaware General Corporation Law permits a corporation to advance expenses relating to the defense of any proceeding to directors and officers contingent upon such individuals’ commitment to repay any advances unless it is determined ultimately that such individuals are entitled to be indemnified.
Under the Delaware General Corporation Law, the rights to indemnification and advancement of expenses provided in the law are non-exclusive, in that, subject to public policy issues, indemnification and advancement of expenses beyond that provided by statute may be provided by bylaw, agreement, vote of stockholders, disinterested directors or otherwise.
Limitation of Personal Liability of Directors
The Delaware General Corporation Law provides that a corporation’s certificate of incorporation may include a provision limiting the personal liability of a director to the corporation or its stockholders for monetary damages for breach of fiduciary duty as a director. However, no such provision can eliminate or limit the liability of a director for:
| any breach of the director’s duty of loyalty to the corporation or its stockholders; |
| acts or omissions not in good faith or that involve intentional misconduct or a knowing violation of the law; |
| violation of certain provisions of the Delaware General Corporation Law; |
| any transaction from which the director derived an improper personal benefit; or |
| any act or omission prior to the adoption of such a provision in the certificate of incorporation. |
Our certificate of incorporation provides that our directors will not be personally liable to us or any of our stockholders for monetary damages for breach of fiduciary duty as a director to the fullest extent permitted by the Delaware General Corporation Law.
Disclosure of Commission Position on Indemnification for Securities Act Liabilities
Insofar as indemnification for liabilities arising under the Securities Act of 1933, as amended, may be permitted to our directors, officers and persons controlling us, we have been advised that it is the Securities and Exchange Commission’s opinion that such indemnification is against public policy as expressed in the Securities Act of 1933, as amended, and is, therefore, unenforceable.
PLAN OF DISTRIBUTIONDISTRIBUTION
As used in this prospectus, “selling stockholders” includes the successors-in-interest, donees, transferees, pledgees or others who may later hold the selling stockholders’ interests. In all cases, the selling stockholders will act independently of us in making decisions with respect to the timing, manner, size and price of each sale.
The selling stockholders may sell some or all of their shares of common stock at a fixed price of $2.09 $ 1.50 per share until our common stock is quoted on the OTC Bulletin Board, and thereafter, at prevailing market prices or privately negotiated prices .prices. After the effective date of the registration statement relating to this prospectus, we hope to have a market maker file an application with the Financial Industry Regulatory Authority for our common stock to eligible for trading on the OTC Bulletin Board. There can be no assurance that a market maker will agree to file the necessary documents with the Financial Industry Regulatory Authority, nor can there be any assurance that such an application for quotation will be approved.
Once a market has developed for our common stock, each selling stockholder of the common stock may, from time to time, sell any or all of their shares of common stock on the OTC Bulletin Board or any other stock exchange, market or trading facility on which the shares are listed or quoted at the time of sale or in private transactions. These sales may be at fixed prices, at prevailing market prices at the time of sale, at varying prices determined at the time of sale or negotiated prices. A selling stockholder may use any one or more of the following methods when selling shares:
| ordinary brokerage transactions and transactions in which the broker-dealer solicits purchasers; |
| block trades in which the broker-dealer will attempt to sell the shares as agent but may position and resell a portion of the block as principal to facilitate the transaction; |
| purchases by a broker-dealer as principal and resale by the broker-dealer for its account; |
| an exchange distribution in accordance with the rules of the applicable exchange; |
| privately negotiated transactions; |
| settlement of short sales entered into after the effective date of the registration statement of which this prospectus is a part; |
| broker-dealers may agree with the selling stockholders to sell a specified number of such shares at a stipulated price per share; |
| through the writing or settlement of options or other hedging transactions, whether through an options exchange or otherwise; |
| loan or pledge the shares to a broker-dealer, who may sell the loaned shares or, in the event of default, sell the pledged shares; |
| through underwriters or dealers; |
| through agents; |
| directly to purchasers, including institutional investors; |
| a combination of any such methods of sale; or |
| any other method permitted pursuant to applicable law. |
In addition, any securities covered by this prospectus which qualify for sale pursuant to Rule 144 under the Securities Act of 1933, as amended, may be sold under Rule 144 rather than under this prospectus.
Broker-dealers engaged by the selling stockholders may arrange for other brokers-dealers to participate in sales. Broker-dealers may receive commissions or discounts from the selling stockholders (or, if any broker-dealer acts as agent for the purchaser of shares, from the purchaser) in amounts to be negotiated, but, except as set forth in a supplement to this prospectus, in the case of an agency transaction not in excess of a customary brokerage commission in compliance with FINRA Rule 2440; and in the case of a principal transaction a markup or markdown in compliance with FINRA IM-2440.
In connection with the sale of the common stock or interests therein, the selling stockholders may enter into hedging transactions with broker-dealers or other financial institutions, which may in turn engage in short sales of the common stock in the course of hedging the positions they assume. The selling stockholders may also sell shares of the common stock short after the effective date of the registration statement of which this prospectus is a part and deliver common stock registered hereby to close out their short positions and to return borrowed shares in connection with such short sales, or loan or pledge the common stock to broker-dealers that in turn may sell these securities. The selling stockholders may also enter into option or other transactions with broker-dealers or other financial institutions or the creation of one or more derivative securities which require the delivery to such broker-dealer or other financial institution of shares offered by this prospectus, which shares such broker-dealer or other financial institution may resell pursuant to this prospectus (as supplemented or amended to reflect such transaction).
The selling stockholders and any broker-dealers or agents that are involved in selling the shares may be deemed to be “underwriters” within the meaning of the Securities Act of 1933, as amended, in connection with such sales. In such event, any commissions received by such broker-dealers or agents and any profit on the resale of the shares purchased by them may be deemed to be underwriting commissions or discounts under the Securities Act of 1933, as amended. Discounts, concessions, commissions and similar selling expenses, if any, that can be attributed to the sale of the shares of common stock will be paid by the selling stockholder and/or the purchasers. Each selling stockholder has represented and warranted to us that it acquired the securities subject to this registration statement solely for its own account and not with a view to, or for offer or sale in connection with, any distribution thereof. In no event shall any broker-dealer receive fees, commissions and markups which, in the aggregate, would exceed eight percent (8%).
We are required to pay certain fees and expenses incurred by us incident to the registration of the shares, but we will not receive any proceeds from the sale of the common stock. We have agreed to indemnify the selling stockholders against certain losses, claims, damages and liabilities, including liabilities under the Securities Act of 1933, as amended.
Because selling stockholders may be deemed to be “underwriters” within the meaning of the Securities Act of 1933, as amended, they will be subject to the prospectus delivery requirements of the Securities Act of 1933, as amended, including Rule 172 thereunder. There is no underwriter or coordinating broker acting in connection with the proposed sale of the common stock by the selling stockholders.
We have agreed to keep this prospectus effective until the earlier of (i) the date on which the shares may be resold by the selling stockholders without registration and without regard to any volume or manner-of-sale limitations by reason of Rule 144, without the requirement for us to be in compliance with the current public information under Rule 144 under the Securities Act of 1933, as amended, or any other rule of similar effect or (ii) all of the shares have been sold pursuant to this prospectus or Rule 144 under the Securities Act of 1933, as amended, or any other rule of similar effect. The shares will be sold only through registered or licensed brokers or dealers if required under applicable state securities laws. In addition, in certain states, the shares covered hereby may not be sold unless they have been registered or qualified for sale in the applicable state or an exemption from the registration or qualification requirement is available and is complied with.
Under applicable rules and regulations under the Securities Exchange Act of 1934, as amended, any person engaged in the distribution of the common stock may not simultaneously engage in market making activities with respect to the common stock for the applicable restricted period, as defined in Regulation M, prior to the commencement of the distribution. In addition, the selling stockholders will be subject to applicable provisions of the Securities Exchange Act of 1934, as amended, and the rules and regulations thereunder, including Regulation M, which may limit the timing of purchases and sales of shares of the common stock by the selling stockholders or any other person. We will make copies of this prospectus available to the selling stockholders and have informed them of the need to deliver a copy of this prospectus to each purchaser at or prior to the time of the sale (including by compliance with Rule 172 under the Securities Act of 1933, as amended).
LEGAL MATTERSMATTERS
Haynes and Boone, LLP, New York, New York, will pass upon the validity of the shares of our common stock offered by the selling stockholders under this prospectus.
Our financial statements as of December 31, 2013 and for the year then ended included in this prospectus have been audited by Liggett, Vogt & Webb, P.A., an independent registered public accounting firm, as stated in its report appearing in the registration statement, and are included in reliance upon the report of such firm given upon its authority as experts in accounting and auditing.
Our financial statements as of December 31, 2012 and 2011 and for the years year then ended included in this prospectus have been audited by Rosenberg Rich Baker Berman & Company, an independent registered public accounting firm, as stated in its report appearing in the registration statement, and are included in reliance upon the report of such firm given upon its authority as experts in accounting and auditing.
Change in Our Public Accounting Firm
On May 28, 2013, we advised Rosenberg Rich Baker Berman & Company that it was dismissed as our independent registered public accounting firm. On June 11, 2013, we engaged Liggett, Vogt & Webb P.A., as our independent registered public accounting firm. The decision to dismiss Rosenberg Rich Baker Berman & Company as our independent registered public accounting firm was approved by our board of directors.
The report of Rosenberg Rich Baker Berman & Company on our financial statements for the fiscal years ended December 31, 2011 and December 31, 2012 did not contain an adverse opinion or disclaimer of opinion, nor was it qualified or modified as to uncertainty, audit scope or accounting principles, except that the report raised substantial doubt as to our ability to continue as a going concern.
From our inception through May 28, 2013, there was a disagreement with Rosenberg Rich Baker Berman & Company with regard to the application of accounting principles to certain anti-dilution provisions embedded within our Series C Preferred Stock and related warrants issued during the three months ended March 31, 2013. This disagreement was not discussed by our board of directors. We authorized Rosenberg Rich Baker Berman & Company to respond fully to the inquiries of Liggett, Vogt & Webb P.A. concerning the application of accounting principles with certain anti-dilution provisions embedded within our Series C Preferred Stock and related warrants issued during the three months ended March 31, 2013.
From our inception through date of engagement (June 11, 2013), we did not consult Liggett, Vogt & Webb P.A. regarding either: (i) the application of accounting principles to a specific completed or contemplated transaction, or the type of audit opinion that might be rendered on our financial statements; or (ii) any matter that was the subject of a disagreement as defined in Item 304(a)(1)(iv) of Regulation S-K.
WHERE YOU CAN FIND ADDITIONAL INFORMATION
We have filed with the Securities and Exchange Commission a registration statement on Form S-1, together with any amendments and related exhibits, under the Securities Act of 1933, as amended, with respect to our shares of common stock offered by this prospectus. The registration statement contains additional information about us and our shares of common stock that the selling stockholders are offering in this prospectus.
Following this offering, we will be required to file annual, quarterly and current reports and other information with the Securities and Exchange Commission under the Securities Exchange Act of 1934, as amended. Our Securities and Exchange Commission filings are available to the public over the Internet at the Securities and Exchange Commission’s website at http://www.sec.gov. You may also read and copy any document we file at the Securities and Exchange Commission’s public reference room located at 100 F Street, N.E., Washington, D.C. 20549. Please call the Securities and Exchange Commission at 1-800-SEC-0330 for further information on the public reference rooms and their copy charges. Access to those electronic filings is available as soon as practicable after filing with the Securities and Exchange Commission. You may also request a copy of those filings, excluding exhibits, from us at no cost. Any such request should be addressed to us at: 12424 Wilshire Boulevard, Suite 745, Los Angeles, California 90025, Attention: Kenneth L. Londoner, Executive Chairman .
Chairman.BIOSIG TECHNOLOGIES, INC.
| F-2 | |
| 2012 | |
| 2013 | |
| 2013 | F-5 |
| 2013 | F-6 |
| F-7 |
REPORT OF INDEPENDENT REGISTERED PUBLIC ACCOUNTING FIRM
To the Board of Directors and Stockholders of
BioSig Technologies, Inc. (a Development Stage Company)
We have audited the accompanying balance sheets of BioSig Technologies. Inc. (a Development Stage Company) as of December 31, 2012 and 2011, and the related statements of operations, stockholders’ deficit, and cash flows for the years then ended and for the period from February 24, 2009 (date of inception) to December 31, 2012. BioSig Technologies, Inc’s management is responsible for these financial statements. Our responsibility is to express an opinion on these financial statements based on our audits.
We conducted our audits in accordance with the standards of the Public Company Accounting Oversight Board (United States). Those standards require that we plan and perform the audit to obtain reasonable assurance about whether the financial statements are free of material misstatement. The company is not required to have, nor were we engaged to perform, an audit of its internal control over financial reporting. Our audits included consideration of internal control over financial reporting as a basis for designing audit procedures that are appropriate in the circumstances, but not for the purpose of expressing an opinion on the effectiveness of the company’s internal control over financial reporting. Accordingly, we express no such opinion. An audit also includes examining, on a test basis, evidence supporting the amounts and disclosures in the financial statements, assessing the accounting principles used and significant estimates made by management, as well as evaluating the overall financial statement presentation. We believe that our audits provide a reasonable basis for our opinion.
In our opinion, the financial statements referred to above present fairly, in all material respects, the financial position of BioSig Technologies, Inc. as of December 31, 2012 and 2011, and the results of its operations and its cash flows for the years then ended and for the period from February 24, 2009 (date of inception) to December 31, 2012 in conformity with accounting principles generally accepted in the United States of America.
The accompanying financial statements have been prepared assuming the Company will continue as a going concern. As discussed in Note 2 to the financial statements, the Company is in the development stage, has incurred losses from operations since its inceptions and has a net stockholders’ deficiency. These factors raise substantial doubt about the Company’s ability to continue as a going concern. Management’s plans in regard to these matters are also described in Note 2. The financial statements do not include any adjustments that might result from the outcome of this uncertainty.
/s/ Rosenberg Rich Baker Berman & Company
Somerset, New Jersey
May 7, 2013, except for note 16 as to which the date is September 11, 2013.
BIOSIG TECHNOLOGIES, INC. | ||||||||
| (a development stage company) | ||||||||
| BALANCE SHEETS | ||||||||
| DECEMBER 31, 2012 AND 2011 | ||||||||
| 2012 | 2011 | |||||||
| ASSETS | ||||||||
| Current assets: | ||||||||
| Cash | $ | 24,237 | $ | 69,020 | ||||
| Prepaid expenses | 33,125 | 82,118 | ||||||
| Capitalized financing costs | 212,635 | 84,167 | ||||||
| Total current assets | 269,997 | 235,305 | ||||||
| Property and equipment, net | 30,209 | 24,752 | ||||||
| Other assets: | ||||||||
| Deposits | 25,000 | 25,000 | ||||||
| Total assets | $ | 325,206 | $ | 285,057 | ||||
| LIABILITIES AND STOCKHOLDERS' DEFICIT | ||||||||
| Current liabilities: | ||||||||
| Accounts payable and accrued expenses | $ | 472,882 | $ | 35,725 | ||||
| Advances, related party | 27,040 | 27,040 | ||||||
| Note payable, related party | 30,000 | - | ||||||
| Liability to placement agent | 94,500 | - | ||||||
| Dividends payable | 117,751 | 26,892 | ||||||
| Total current liabilities | 742,173 | 89,657 | ||||||
| Long term liabilities: | ||||||||
| Deferred rent payable | 5,067 | 5,067 | ||||||
| Note payable, related party | 218,000 | - | ||||||
| Convertible bridge notes payable, $225,000 related party | 613,812 | - | ||||||
| Redeemable Series A preferred stock | 922,000 | 922,000 | ||||||
| Redeemable Series B preferred stock | 887,500 | 100,000 | ||||||
| Total long term liabilities | 2,646,379 | 1,027,067 | ||||||
| Total liabilities | 3,388,552 | 1,116,724 | ||||||
| Commitments and contingencies | ||||||||
| Stockholders' deficit | ||||||||
| Preferred stock, $0.001 par value, authorized 1,000,000 shares | ||||||||
| Common stock, $0.001 par value, authorized 50,000,000 and 10,000,000 shares as of December 31, 2012 and 2011, respectively, 8,166,238 and 8,136,238 issued and outstanding as of December 31, 2012 and 2011, respectively | 8,166 | 8,136 | ||||||
| Additional paid in capital | 833,647 | 588,354 | ||||||
| Deficit accumulated during development stage | (3,905,159 | ) | (1,428,157 | ) | ||||
| Total stockholders' deficit | (3,063,346 | ) | (831,667 | ) | ||||
| Total liabilities and stockholders' deficit | $ | 325,206 | $ | 285,057 | ||||
REPORT OF INDEPENDENT REGISTERED PUBLIC ACCOUNTING FIRM
To the Board of Directors and Stockholders of
BioSig Technologies, Inc. (a Development Stage Company)
We have audited the accompanying notesbalance sheet of BioSig Technologies. Inc. (“the Company”) as of December 31, 2013, and the related statements of operations, stockholders’ deficit, and cash flows for the years then ended. We have also audited the amounts presented for the period January 1, 2013 to December 31, 2013, included in the statements of stockholders’ (deficit) equity and in the total amounts presented in the statements of losses and cash flows for the period from February 24, 2009 (date of inception) to December 31, 2013. We did not audit the period February 24, 2009 (date of inception) to December 31, 2012. Those statements were audited by other auditors whose report has been furnished to us, and our opinion, insofar as it relates to the amounts included for that period is based solely on the report of other auditors. These financial statements are the responsibility of the Company's management. Our responsibility is to express an opinion on the financial statements based upon our audit.
We conducted our audit in accordance with the standards of the Public Company Accounting Oversight Board (United States). Those standards require that we plan and perform the audit to obtain reasonable assurance about whether the financial statements are free of material misstatement. The Company is not required to have, nor were we engaged to perform, an audit of its internal control over financial reporting. Our audit included consideration of internal control over financial reporting as a basis for designing audit procedures that are appropriate in the circumstances, but not for the purpose of expressing an opinion on the effectiveness of the company’s internal control over financial reporting. Accordingly, we express no such opinion. An audit also includes examining, on a test basis, evidence supporting the amounts and disclosures in the financial statements, assessing the accounting principles used and significant estimates made by management, as well as evaluating the overall financial statement presentation. We believe that our audit provide a reasonable basis for our opinion.
In our opinion, the financial statements referred to above present fairly, in all material respects, the financial position of BioSig Technologies, Inc. as of December 31, 2013, and the results of its operations and its cash flows for the year then ended and for the period from February 24, 2009 (date of inception) to December 31, 2013 in conformity with accounting principles generally accepted in the United States of America.
The accompanying financial statements have been prepared assuming the Company will continue as a going concern. As discussed in Note 2 to the financial statements, the Company is in the development stage, has incurred losses from operations since its inceptions and has a net stockholders’ deficiency. These factors raise substantial doubt about the Company’s ability to continue as a going concern. Management’s plans in regard to these matters are also described in Note 2. The financial statements do not include any adjustments that might result from the outcome of this uncertainty.
| /s/ Liggett, Vogt & Webb, P.A. | |
Liggett, Vogt & Webb, P.A. |
March 27, 2014
New York, New York
BIOSIG TECHNOLOGIES, INC. | ||||||||||||
| (a development stage company) | ||||||||||||
| STATEMENTS OF OPERATIONS | ||||||||||||
| From February 24, | ||||||||||||
| 2009 (date of | ||||||||||||
| Year ended December 31, | inception) to | |||||||||||
| 2012 | 2011 | December 31, 2012 | ||||||||||
| Operating expenses: | ||||||||||||
| Research and development | $ | 888,948 | $ | 582,525 | $ | 1,471,473 | ||||||
| General and administrative | 1,363,007 | 484,127 | 2,097,190 | |||||||||
| Depreciation | 10,020 | 6,795 | 16,815 | |||||||||
| Total operating expenses | 2,261,975 | 1,073,447 | 3,585,478 | |||||||||
| Net loss from operations | (2,261,975 | ) | (1,073,447 | ) | (3,585,478 | ) | ||||||
| Other income (expense): | ||||||||||||
| Interest income (expense) | (18,286 | ) | 171 | (18,115 | ) | |||||||
| Financing costs | (105,881 | ) | (77,933 | ) | (183,814 | ) | ||||||
| Net loss before income taxes | (2,386,142 | ) | (1,151,209 | ) | (3,787,407 | ) | ||||||
| Income taxes (benefit) | - | - | - | |||||||||
| Net loss | (2,386,142 | ) | (1,151,209 | ) | (3,787,407 | ) | ||||||
| Preferred stock dividend | (90,860 | ) | (26,892 | ) | (117,752 | ) | ||||||
| NET LOSS AVAILABLE TO COMMON STOCKHOLDERS’ | $ | (2,477,002 | ) | $ | (1,178,101 | ) | $ | (3,905,159 | ) | |||
| Net loss per common share, basic and diluted | $ | (0.30 | ) | $ | (0.18 | ) | ||||||
| Weighted average number of common shares outstanding, basic and diluted | 8,142,222 | 6,650,026 | ||||||||||
| BIOSIG TECHNOLOGIES, INC. | ||||||||
| (a development stage company) | ||||||||
| BALANCE SHEETS | ||||||||
| DECEMBER 31, 2013 AND 2012 | ||||||||
| 2013 | 2012 | |||||||
| ASSETS | ||||||||
| Current assets: | ||||||||
| Cash | $ | 302,187 | $ | 24,237 | ||||
| Prepaid expenses | - | 33,125 | ||||||
| Capitalized financing costs | - | 212,635 | ||||||
| Total current assets | 302,187 | 269,997 | ||||||
| Property and equipment, net | 24,866 | 30,209 | ||||||
| Other assets: | ||||||||
| Deposits | 25,000 | 25,000 | ||||||
| Total assets | $ | 352,053 | $ | 325,206 | ||||
| LIABILITIES AND STOCKHOLDERS' DEFICIT | ||||||||
| Current liabilities: | ||||||||
| Accounts payable and accrued expenses | $ | 819,330 | $ | 472,882 | ||||
| Advances, related party | 30,781 | 27,040 | ||||||
| Note payable, related party | - | 30,000 | ||||||
| Liability to placement agent | 52,800 | 94,500 | ||||||
| Redeemable Series A Preferred Stock, liquidation preference of $922,000, net of debt discount of $37,399 | 884,601 | - | ||||||
| Redeemable Series B Preferred Stock, liquidation preference of $887,500, net of debt discount of $72,478 | 815,022 | - | ||||||
| Dividends payable | 414,967 | 117,751 | ||||||
| Total current liabilities | 3,017,501 | 742,173 | ||||||
| Long term liabilities: | ||||||||
| Deferred rent payable | - | 5,067 | ||||||
| Note payable, related party | - | 218,000 | ||||||
| Convertible bridge notes payable, $229,359 related party | - | 613,812 | ||||||
| Redeemable Series A Preferred Stock, liquidation preference of $922,000 | - | 922,000 | ||||||
| Redeemable Series B Preferred Stock, liquidation preference of $887,500 | - | 887,500 | ||||||
| Total long term liabilities | - | 2,646,379 | ||||||
| Total liabilities | 3,017,501 | 3,388,552 | ||||||
| Commitments and contingencies | - | - | ||||||
| Series C 9% Convertible Preferred stock, liquidation preference of $2,781,000, net of debt discount of $483,893 | 2,297,107 | - | ||||||
| Stockholders' deficit | ||||||||
| Preferred stock, $0.001 par value, authorized 1,000,000 shares, designated 200 shares of Series A, 600 shares of Series B and 4,200 shares of Series C Preferred Stock | ||||||||
| Common stock, $0.001 par value, authorized 50,000,000 shares, 8,412,101 and 8,166,238 issued and outstanding as of December 31, 2013 and 2012, respectively | 8,412 | 8,166 | ||||||
| Additional paid in capital | 9,036,038 | 833,647 | ||||||
| Deficit accumulated during development stage | (14,007,005 | ) | (3,905,159 | ) | ||||
| Total stockholders' deficit | (4,962,555 | ) | (3,063,346 | ) | ||||
See the accompanying notes to the financial statements
BIOSIG TECHNOLOGIES, INC. | ||||||||||||||||||||||||||||||||||||
| (a development stage company) | ||||||||||||||||||||||||||||||||||||
| STATEMENT OF STOCKHOLDERS' DEFICIT | ||||||||||||||||||||||||||||||||||||
| FROM FEBRUARY 24, 2009 (DATE OF INCEPTION) TO DECEMBER 31, 2012 | ||||||||||||||||||||||||||||||||||||
| Deficit | ||||||||||||||||||||||||||||||||||||
| Accumulated | ||||||||||||||||||||||||||||||||||||
| Additional | During | |||||||||||||||||||||||||||||||||||
| Common stock | Shares subscribed | Shares to be issued | Paid in | Development | ||||||||||||||||||||||||||||||||
| Shares | Amount | Shares | Amount | Shares | Amount | Capital | Stage | Total | ||||||||||||||||||||||||||||
| Common stock issued to founders | 4,000,000 | $ | 4,000 | - | $ | - | $ | - | $ | - | $ | - | $ | - | $ | 4,000 | ||||||||||||||||||||
| Common stock issuable to founders | - | - | - | - | 3,400,000 | 3,400 | - | - | 3,400 | |||||||||||||||||||||||||||
| Donated capital | - | - | - | - | - | - | 100 | - | 100 | |||||||||||||||||||||||||||
| Net loss | - | - | - | - | - | - | - | (104,584 | ) | (104,584 | ) | |||||||||||||||||||||||||
| Balance, December 31, 2009 | 4,000,000 | 4,000 | - | - | 3,400,000 | 3,400 | 100 | (104,584 | ) | (97,084 | ) | |||||||||||||||||||||||||
| Proceeds from common stock subscription | - | - | 37,500 | 30,000 | - | - | - | - | 30,000 | |||||||||||||||||||||||||||
| Net loss | - | - | - | - | - | - | - | (145,472 | ) | (145,472 | ) | |||||||||||||||||||||||||
| Balance, December 31, 2010 | 4,000,000 | 4,000 | 37,500 | 30,000 | 3,400,000 | 3,400 | 100 | (250,056 | ) | (212,556 | ) | |||||||||||||||||||||||||
| Sale of common stock | 153,125 | 153 | (37,500 | ) | (30,000 | ) | - | - | 122,347 | - | 92,500 | |||||||||||||||||||||||||
| Common stock issued for services rendered | 408,113 | 408 | - | - | - | - | 326,082 | - | 326,490 | |||||||||||||||||||||||||||
| Common stock issued for future services | 175,000 | 175 | - | - | - | - | 139,825 | - | 140,000 | |||||||||||||||||||||||||||
| Common stock issued to founders | 3,400,000 | 3,400 | - | - | (3,400,000 | ) | (3,400 | ) | - | - | - | |||||||||||||||||||||||||
| Preferred stock dividend | - | - | - | - | - | - | - | (26,892 | ) | (26,892 | ) | |||||||||||||||||||||||||
| Net loss | - | - | - | - | - | - | - | (1,151,209 | ) | (1,151,209 | ) | |||||||||||||||||||||||||
| Balance, December 31, 2011 | 8,136,238 | 8,136 | - | - | - | - | 588,354 | (1,428,157 | ) | (831,667 | ) | |||||||||||||||||||||||||
| Common stock issued for services rendered | 30,000 | 30 | - | - | - | - | 59,970 | - | 60,000 | |||||||||||||||||||||||||||
| Fair value of vested options | - | - | - | - | - | - | 185,323 | - | 185,323 | |||||||||||||||||||||||||||
| Preferred stock dividend | - | - | - | - | - | - | - | (90,860 | ) | (90,860 | ) | |||||||||||||||||||||||||
| Net loss | - | - | - | - | - | - | - | (2,386,142 | ) | (2,386,142 | ) | |||||||||||||||||||||||||
| Balance, December 31, 2012 | 8,166,238 | $ | 8,166 | - | $ | - | $ | - | $ | - | $ | 833,647 | $ | (3,905,159 | ) | $ | (3,063,346 | ) | ||||||||||||||||||
| BIOSIG TECHNOLOGIES, INC. | ||||||||||||
| (a development stage company) | ||||||||||||
| STATEMENTS OF OPERATIONS | ||||||||||||
| From February 24, | ||||||||||||
| 2009 (date of | ||||||||||||
| Year ended December 31, | inception) to | |||||||||||
| 2013 | 2012 | December 31, 2013 | ||||||||||
| Operating expenses: | ||||||||||||
| Research and development | $ | 992,207 | $ | 888,948 | $ | 2,463,680 | ||||||
| General and administrative | 5,229,252 | 1,363,007 | 7,326,442 | |||||||||
| Depreciation | 17,059 | 10,020 | 33,874 | |||||||||
| Total operating expenses | 6,238,518 | 2,261,975 | 9,823,996 | |||||||||
| Net loss from operations | (6,238,518 | ) | (2,261,975 | ) | (9,823,996 | ) | ||||||
| Other income (expense): | ||||||||||||
| Interest income (expense) | (70,061 | ) | (18,286 | ) | (88,176 | ) | ||||||
| Financing costs | (3,496,052 | ) | (105,881 | ) | (3,679,866 | ) | ||||||
| Net loss before income taxes | (9,804,631 | ) | (2,386,142 | ) | (13,592,038 | ) | ||||||
| Income taxes (benefit) | - | - | - | |||||||||
| Net loss | (9,804,631 | ) | (2,386,142 | ) | (13,592,038 | ) | ||||||
| Preferred stock dividend | (297,215 | ) | (90,860 | ) | (414,967 | ) | ||||||
| NET LOSS AVAILABLE TO COMMON STOCKHOLDERS | $ | (10,101,846 | ) | $ | (2,477,002 | ) | $ | (14,007,005 | ) | |||
| Net loss per common share, basic and diluted | $ | (1.23 | ) | $ | (0.30 | ) | ||||||
| Weighted average number of common shares outstanding, basic and diluted | 8,187,648 | 8,142,222 | ||||||||||
See the accompanying notes to the financial statements
BIOSIG TECHNOLOGIES, INC. | ||||||||||||
| (a development stage company) | ||||||||||||
| STATEMENTS OF CASH FLOWS | ||||||||||||
| From February 24, | ||||||||||||
| 2009 (date of | ||||||||||||
| Year ended December 31, | inception) to | |||||||||||
| 2012 | 2011 | December 31, 2012 | ||||||||||
| CASH FLOWS FROM OPERATING ACTIVITIES: | ||||||||||||
| Net loss attributable to common stockholders | $ | (2,386,142 | ) | $ | (1,151,209 | ) | $ | (3,787,407 | ) | |||
| Adjustments to reconcile net loss to cash used in operating activities: | ||||||||||||
| Depreciation | 10,020 | 6,795 | 16,815 | |||||||||
| Amortization of financing costs | 105,881 | 77,933 | 183,814 | |||||||||
| Stock based compensation | 314,316 | 384,372 | 706,088 | |||||||||
| Donated capital | - | - | 100 | |||||||||
| (Increase) in prepaid expenses | (20,000 | ) | - | (20,000 | ) | |||||||
| Increase (Decrease) in accounts payable and accrued expenses | 450,969 | (158,385 | ) | 486,694 | ||||||||
| Decease in accrued expenses, related party | - | (2,940 | ) | - | ||||||||
| Increase in deferred rent payable | - | 5,067 | 5,067 | |||||||||
| Net cash used in operating activities | (1,524,956 | ) | (838,367 | ) | (2,408,829 | ) | ||||||
| CASH FLOWS FROM INVESTING ACTIVITIES: | ||||||||||||
| Purchase of property and equipment | (15,477 | ) | (31,547 | ) | (47,024 | ) | ||||||
| Payment of long term deposit | - | (25,000 | ) | (25,000 | ) | |||||||
| Net cash used in investing activity | (15,477 | ) | (56,547 | ) | (72,024 | ) | ||||||
| CASH FLOWS FROM FINANCING ACTIVITIES: | ||||||||||||
| Proceeds from notes payable, related party | 248,000 | 5,500 | 275,040 | |||||||||
| Proceeds from convertible bridge notes payable | 600,000 | - | 600,000 | |||||||||
| Net proceeds from the sale of Series A preferred stock | - | 788,400 | 788,400 | |||||||||
| Net proceeds from the sale of Series B preferred stock | 647,650 | 71,500 | 719,150 | |||||||||
| Proceeds from sale of common stock | - | 92,500 | 122,500 | |||||||||
| Net cash provided by financing activities | 1,495,650 | 957,900 | 2,505,090 | |||||||||
| Net (decrease) increase in cash and cash equivalents | (44,783 | ) | 62,986 | 24,237 | ||||||||
| Cash and cash equivalents, beginning of the period | 69,020 | 6,034 | - | |||||||||
| Cash and cash equivalents, end of the period | $ | 24,237 | $ | 69,020 | $ | 24,237 | ||||||
| Supplemental disclosures of cash flow information: | ||||||||||||
| Cash paid during the period for interest | $ | - | $ | - | $ | - | ||||||
| Cash paid during the period for income taxes | $ | - | $ | - | $ | - | ||||||
| BIOSIG TECHNOLOGIES, INC. | ||||||||||||||||||||||||||||||||||||
| (a development stage company) | ||||||||||||||||||||||||||||||||||||
| STATEMENT OF STOCKHOLDERS' DEFICIT | ||||||||||||||||||||||||||||||||||||
| FROM FEBRUARY 24, 2009 (DATE OF INCEPTION) THROUGH DECEMBER 31, 2013 | ||||||||||||||||||||||||||||||||||||
| Deficit | ||||||||||||||||||||||||||||||||||||
| Accumulated | ||||||||||||||||||||||||||||||||||||
| Additional | During | |||||||||||||||||||||||||||||||||||
| Common stock | Shares subscribed | Shares to be issued | Paid in | Development | ||||||||||||||||||||||||||||||||
| Shares | Amount | Shares | Amount | Shares | Amount | Capital | Stage | Total | ||||||||||||||||||||||||||||
| Common stock issued to founders | 4,000,000 | $ | 4,000 | - | $ | - | $ | - | $ | - | $ | - | $ | - | $ | 4,000 | ||||||||||||||||||||
| Common stock issuable to founders | - | - | - | - | 3,400,000 | 3,400 | - | - | 3,400 | |||||||||||||||||||||||||||
| Donated capital | - | - | - | - | - | - | 100 | - | 100 | |||||||||||||||||||||||||||
| Net loss | - | - | - | - | - | - | - | (104,584 | ) | (104,584 | ) | |||||||||||||||||||||||||
| Balance, December 31, 2009 | 4,000,000 | 4,000 | - | - | 3,400,000 | 3,400 | 100 | (104,584 | ) | (97,084 | ) | |||||||||||||||||||||||||
| Proceeds from common stock subscription | - | - | 37,500 | 30,000 | - | - | - | - | 30,000 | |||||||||||||||||||||||||||
| Net loss | - | - | - | - | - | - | - | (145,472 | ) | (145,472 | ) | |||||||||||||||||||||||||
| Balance, December 31, 2010 | 4,000,000 | 4,000 | 37,500 | 30,000 | 3,400,000 | 3,400 | 100 | (250,056 | ) | (212,556 | ) | |||||||||||||||||||||||||
| Sale of common stock | 153,125 | 153 | (37,500 | ) | (30,000 | ) | - | - | 122,347 | - | 92,500 | |||||||||||||||||||||||||
| Common stock issued for services rendered | 408,113 | 408 | - | - | - | - | 326,082 | - | 326,490 | |||||||||||||||||||||||||||
| Common stock issued for future services | 175,000 | 175 | - | - | - | - | 139,825 | - | 140,000 | |||||||||||||||||||||||||||
| Common stock issued to founders | 3,400,000 | 3,400 | - | - | (3,400,000 | ) | (3,400 | ) | - | - | - | |||||||||||||||||||||||||
| Preferred stock dividend | - | - | - | - | - | - | - | (26,892 | ) | (26,892 | ) | |||||||||||||||||||||||||
| Net loss | - | - | - | - | - | - | - | (1,151,209 | ) | (1,151,209 | ) | |||||||||||||||||||||||||
| Balance, December 31, 2011 | 8,136,238 | 8,136 | - | - | - | - | 588,354 | (1,428,157 | ) | (831,667 | ) | |||||||||||||||||||||||||
| Common stock issued for services rendered | 30,000 | 30 | - | - | - | - | 59,970 | - | 60,000 | |||||||||||||||||||||||||||
| Fair value of vested options | - | - | - | - | - | - | 185,323 | - | 185,323 | |||||||||||||||||||||||||||
| Preferred stock dividend | - | - | - | - | - | - | - | (90,860 | ) | (90,860 | ) | |||||||||||||||||||||||||
| Net loss | - | - | - | - | - | - | - | (2,386,142 | ) | (2,386,142 | ) | |||||||||||||||||||||||||
| Balance, December 31, 2012 | 8,166,238 | $ | 8,166 | - | $ | - | $ | - | $ | - | $ | 833,647 | $ | (3,905,159 | ) | $ | (3,063,346 | ) | ||||||||||||||||||
See the accompanying notes to the financial statements
| BIOSIG TECHNOLOGIES, INC. | ||||||||||||||||||||||||||||||||||||
| (a development stage company) | ||||||||||||||||||||||||||||||||||||
| STATEMENT OF STOCKHOLDERS' DEFICIT | ||||||||||||||||||||||||||||||||||||
| FROM FEBRUARY 24, 2009 (DATE OF INCEPTION) THROUGH DECEMBER 31, 2013 | ||||||||||||||||||||||||||||||||||||
| Deficit | ||||||||||||||||||||||||||||||||||||
| Accumulated | ||||||||||||||||||||||||||||||||||||
| Additional | During | |||||||||||||||||||||||||||||||||||
| Common stock | Shares subscribed | Shares to be issued | Paid in | Development | ||||||||||||||||||||||||||||||||
| Shares | Amount | Shares | Amount | Shares | Amount | Capital | Stage | Total | ||||||||||||||||||||||||||||
| Balance, December 31, 2012 | 8,166,238 | $ | 8,166 | - | $ | - | $ | - | $ | - | $ | 833,647 | $ | (3,905,159 | ) | $ | (3,063,346 | ) | ||||||||||||||||||
| Common stock issued for services rendered | 21,412 | 22 | - | - | - | - | 44,729 | - | 44,751 | |||||||||||||||||||||||||||
| Common stock issued as payment for accrued interest to note holders at $2.09 per share | 8,941 | 9 | - | - | - | - | 18,668 | - | 18,677 | |||||||||||||||||||||||||||
| Beneficial conversion feature in connection with note payable | - | - | - | - | - | - | 20,000 | - | 20,000 | |||||||||||||||||||||||||||
| Beneficial conversion feature and warrants issued in connection with the Series C Preferred Stock | - | - | - | - | - | - | 2,404,830 | - | 2,404,830 | |||||||||||||||||||||||||||
| Fair value of warrants issued to Series C investors for certificate of designation amendment | - | - | - | - | - | - | 1,074,833 | - | 1,074,833 | |||||||||||||||||||||||||||
| Fair value of warrants issued for services | - | - | - | - | - | - | 916,677 | - | 916,677 | |||||||||||||||||||||||||||
| Common stock issued in settlement of related party note and advances payable | 93,061 | 93 | - | - | - | - | 228,415 | - | 228,508 | |||||||||||||||||||||||||||
| Sale of common stock | 122,449 | 122 | - | - | - | - | 247,052 | 247,174 | ||||||||||||||||||||||||||||
| Fair value of vested options | - | - | - | - | - | - | 3,247,187 | - | 3,247,187 | |||||||||||||||||||||||||||
| Preferred stock dividend | - | - | - | - | - | - | - | (297,215 | ) | (297,215 | ) | |||||||||||||||||||||||||
| Net loss | - | - | - | - | - | - | - | (9,804,631 | ) | (9,804,631 | ) | |||||||||||||||||||||||||
| Balance, December 31, 2013 | 8,412,101 | $ | 8,412 | - | $ | - | $ | - | $ | - | $ | 9,036,038 | $ | (14,007,005 | ) | $ | (4,962,555 | ) | ||||||||||||||||||
See the accompanying notes to the financial statements
| BIOSIG TECHNOLOGIES, INC. | ||||||||||||
| (a development stage company) | ||||||||||||
| STATEMENTS OF CASH FLOWS | ||||||||||||
| From February 24, | ||||||||||||
| 2009 (date of | ||||||||||||
| Year ended December 31, | inception) to | |||||||||||
| 2013 | 2012 | December 31, 2013 | ||||||||||
| CASH FLOWS FROM OPERATING ACTIVITIES: | ||||||||||||
| Net loss attributable to common stockholders | $ | (9,804,631 | ) | $ | (2,386,142 | ) | $ | (13,592,038 | ) | |||
| Adjustments to reconcile net loss to cash used in operating activities: | ||||||||||||
| Depreciation | 17,059 | 10,020 | 33,874 | |||||||||
| Amortization of debt discount | 2,441,220 | 105,881 | 2,625,034 | |||||||||
| Stock based compensation | 3,305,063 | 314,316 | 4,011,151 | |||||||||
| Fair value of warrants issued in connection with Series C preferred stock modification | 1,074,833 | - | 1,074,833 | |||||||||
| Fair value of warrants issued for services | 837,243 | - | 837,243 | |||||||||
| Donated capital | - | - | 100 | |||||||||
| Changes in operating assets and liabilities: | ||||||||||||
| Prepaid expenses | 20,000 | (20,000 | ) | - | ||||||||
| Accounts payable | 349,809 | 450,969 | 836,503 | |||||||||
| Deferred rent payable | (3,055 | ) | - | 2,012 | ||||||||
| Net cash used in operating activities | (1,762,459 | ) | (1,524,956 | ) | (4,171,288 | ) | ||||||
| CASH FLOWS FROM INVESTING ACTIVITIES: | ||||||||||||
| Purchase of property and equipment | (11,716 | ) | (15,477 | ) | (58,740 | ) | ||||||
| Payment of long term deposit | - | - | (25,000 | ) | ||||||||
| Net cash used in investing activity | (11,716 | ) | (15,477 | ) | (83,740 | ) | ||||||
| CASH FLOWS FROM FINANCING ACTIVITIES: | ||||||||||||
| Proceeds from notes payable, related party | - | 248,000 | 275,040 | |||||||||
| Proceeds from convertible bridge notes payable | - | 600,000 | 600,000 | |||||||||
| Net proceeds from the sale of Series A preferred stock | - | - | 788,400 | |||||||||
| Net proceeds from the sale of Series B preferred stock | - | 647,650 | 719,150 | |||||||||
| Net proceeds from the sale of Series C preferred stock and warrants | 1,768,410 | 1,768,410 | ||||||||||
| Proceeds from sale of common stock | 299,974 | - | 422,474 | |||||||||
| Payments of related party notes | (30,000 | ) | - | (30,000 | ) | |||||||
| Net proceeds from related party advances | 13,741 | - | 13,741 | |||||||||
| Net cash provided by financing activities | 2,052,125 | 1,495,650 | 4,557,215 | |||||||||
| Net (decrease) increase in cash and cash equivalents | 277,950 | (44,783 | ) | 302,187 | ||||||||
| Cash and cash equivalents, beginning of the period | 24,237 | 69,020 | - | |||||||||
| Cash and cash equivalents, end of the period | $ | 302,187 | $ | 24,237 | $ | 302,187 | ||||||
| Supplemental disclosures of cash flow information: | ||||||||||||
| Cash paid during the period for interest | $ | - | $ | - | $ | - | ||||||
| Cash paid during the period for income taxes | $ | - | $ | - | $ | - | ||||||
| Non cash investing and financing activities: | ||||||||||||
| Common stock issued in settlement of accrued interest | $ | 18,677 | $ | - | $ | 18,677 | ||||||
| Common stock issued in settlement of related party note and advances payable | $ | 228,508 | $ | - | $ | 228,508 | ||||||
| Convertible bridge notes payable exchanged for preferred shares | $ | 600,000 | $ | - | $ | 600,000 | ||||||
See the accompanying notes to the financial statements
NOTE 1 - SUMMARY OF SIGNIFICANT ACCOUNTING POLICIES
A summary of the significant accounting policies applied in the preparation of the accompanying financial statements follows.
Business and Basis of Presentationorganization
BioSig Technologies Inc. (the “Company”) was initially incorporated on February 24, 2009 under the laws of the State of Nevada and subsequently re-incorporated in the state of Delaware in 2011. The Company is in the development stage as defined under Accounting Standards Codification subtopic 915-10 Development Stage Entities and its efforts are principally devoted to improving the quality of cardiac recordings obtained during ablation of atrial fibrillation (AF). The Company has not generated any revenue to date and consequently its operations are subject to all risks inherent in the establishment of a new business enterprise.
Basis of presentation
As the Company is devoting substantially all of its efforts to establishing a new business, and while planned principal operations have commenced, there has been no revenue generated from sales, license fees or royalties, the Company is considered a development stage enterprise. Accordingly, the Company's financial statements are presented in accordance with authoritative accounting guidance related to a development stage enterprise. Financial position, results of operations and cash flows of a development stage enterprise are presented in conformity with generally accepted accounting principles that apply to established operating enterprises.
Revenue Recognition
The Company recognizes revenue in accordance with Accounting Standards Codification subtopic 605-10, Revenue Recognition (“ASC 605-10”) which requires that four basic criteria must be met before revenue can be recognized: (1) persuasive evidence of an arrangement exists; (2) delivery has occurred; (3) the selling price is fixed and determinable; and (4) collectability is reasonably assured. Determination of criteria (3) and (4) are based on management's judgments regarding the fixed nature of the selling prices of the products delivered and the collectability of those amounts. Provisions for discounts and rebates to customers, estimated returns and allowances, and other adjustments are provided for in the same period the related sales are recorded.
The Company accounts for Multiple-Element Arrangements under ASC 605-10 which incorporates Accounting Standards Codification subtopic 605-25, Multiple-Element Arrangements (“ASC 605-25”). ASC 605-25 addresses accounting for arrangements that may involve the delivery or performance of multiple products, services and/or rights to use assets.
Concentrations of Credit Risk
Financial instruments and related items, which potentially subject the Company to concentrations of credit risk, consist primarily of cash and cash equivalents. The Company places its cash and temporary cash investments with credit quality institutions. At times, such amounts may be in excess of the FDIC insurance limit. The Company periodically reviews its trade receivables in determining its allowance for doubtful accounts. The Company does not have accounts receivable and allowance for doubtful accounts at December 31, 20122013 and 2011.2012.
Prepaid Expenses
From time to time, the Company issues shares of its common stock for services to be performed. The fair value of the common stock is determined at the date of the contract for services and is amortized ratably over the term of the contract. As of December 31, 20122013 and 2011,2012, prepaid expenses relating to stock based payments were $13,135$-0- and $82,118, respectively.
Capitalized financing costs
Capitalized financing costs are comprised of costs incurred in connection with the sale of the Company’s Series A and Series B preferred stock. These costs are amortized ratably and charged to financing expenses through December 31, 2014, the date redemption is available to the preferred shareholders. The amortization for the years ended December 31, 2012 and 2011 was $105,881 and $77,933, respectively.$105,881. Accumulated amortization of capitalized financing costs were $183,815 and $77,993 at December 31, 2012 and 2011, respectively.
2012.BIOSIG TECHNOLOGIES INC.
(A development stage company)
DECEMBER 31, 20122013
The Company accounts for research and development costspreparation of financial statements in accordance with the Accounting Standards Codification subtopic 730-10, Research and Development (“ASC 730-10”). Under ASC 730-10, all research and development costs must be charged to expense as incurred. Accordingly, internal research and development costs are expensed as incurred. Third-party research and developments costs are expensed when the contracted work has been performed or as milestone results have been achieved. Company-sponsored research and development costs related to both present and future products are expensedaccounting principles generally accepted in the period incurred. The Company incurred researchUnited States requires management to make estimates and developmentassumptions that affect the reported amounts of assets, liabilities and expenses and disclosures of $888,948contingent assets and $582,525liabilities at the years ended December 31, 2012date of the financial statements. Actual results could differ from those estimates. Significant estimates include the useful life of fixed assets and 2011, respectively and $1,471,473 fromassumptions used in the period from February 24, 2009 (datefair value of inception) to December 31, 2012.stock-based compensation.
Fair Value of Financial Instruments
The Company’s short-term financial instruments, including cash, prepaid expenses and other assets, accounts payable and accrued expenses and other liabilities, consist primarily of instruments without extended maturities, the fair value of which, based on management’s estimates, reasonably approximate their book value. The fair value of the Company’s convertible securities is based on management estimates and reasonably approximates their book value.
Property and Equipment
Property and equipment are stated at cost and depreciated using the straight-line method over their estimated useful lives of 3 to 5 years. When retired or otherwise disposed, the related carrying value and accumulated depreciation are removed from the respective accounts and the net difference less any amount realized from disposition, is reflected in earnings.
Long-Lived Assets
The Company follows Accounting Standards Codification 360-10-15-3, “Impairment or Disposal of Long-lived Assets,” which established a “primary asset” approach to determine the cash flow estimation period for a group of assets and liabilities that represents the unit of accounting for a long-lived asset to be held and used. Long-lived assets to be held and used are reviewed for impairment whenever events or changes in circumstances indicate that the carrying amount of an asset may not be recoverable. The carrying amount of a long-lived asset is not recoverable if it exceeds the sum of the undiscounted cash flows expected to result from the use and eventual disposition of the asset. Long-lived assets to be disposed of are reported at the lower of carrying amount or fair value less cost to sell.
Net Income (loss) Per Common Share
The Company computes earnings (loss) per share under Accounting Standards Codification subtopic 825-10, Financial Instruments260-10, Earnings Per Share (“ASC 825-10”260-10”) requires disclosure. Net loss per common share is computed by dividing net loss by the weighted average number of shares of common stock outstanding during the year. Diluted earnings per share, if presented, would include the dilution that would occur upon the exercise or conversion of all potentially dilutive securities into common stock using the “treasury stock” and/or “if converted” methods as applicable.
The computation of basic and diluted loss per share as of December 31, 2013 and 2012 excludes potentially dilutive securities when their inclusion would be anti-dilutive, or if their exercise prices were greater than the average market price of the fair valuecommon stock during the period.
Potentially dilutive securities excluded from the computation of certain financial instruments. basic and diluted net income (loss) per share are as follows:
| 2013 | 2012 | |||||||
| Series A convertible preferred stock | 501,089 | |||||||
| Series B convertible preferred stock | 451,726 | |||||||
| Series C convertible preferred stock | 1,330,627 | |||||||
| Options to purchase common stock | 2,990,977 | 1,298,927 | ||||||
| Warrants to purchase common stock | 2,717,258 | - | ||||||
| Totals | 7,991,677 | 1,298,927 | ||||||
Research and development costs
The carrying value of cashCompany accounts for research and cash equivalents, accounts payabledevelopment costs in accordance with the Accounting Standards Codification subtopic 730-10, Research and accrued liabilities,Development (“ASC 730-10”). Under ASC 730-10, all research and short-term borrowings,development costs must be charged to expense as reflectedincurred. Accordingly, internal research and development costs are expensed as incurred. Third-party research and developments costs are expensed when the contracted work has been performed or as milestone results have been achieved. Company-sponsored research and development costs related to both present and future products are expensed in the balance sheets, approximate fair value becauseperiod incurred. The Company incurred research and development expenses of $992,207 and $888,948 for the year ended December 31, 2013 and 2012, respectively; and $2,463,680 from the period from February 24, 2009 (date of inception) to December 31, 2013.
BIOSIG TECHNOLOGIES INC.
(A development stage company)
DECEMBER 31, 2013
Income Taxes
The Company follows Accounting Standards Codification subtopic 740-10, Income Taxes (“ASC 740-10”) for recording the provision for income taxes. Deferred tax assets and liabilities are computed based upon the difference between the financial statement and income tax basis of assets and liabilities using the enacted marginal tax rate applicable when the related asset or liability is expected to be realized or settled. Deferred income tax expenses or benefits are based on the changes in the asset or liability during each period. If available evidence suggests that it is more likely than not that some portion or all of the short-term maturity of these instruments. All other significant financialdeferred tax assets financial liabilities and equity instruments ofwill not be realized, a valuation allowance is required to reduce the Companydeferred tax assets to the amount that is more likely than not to be realized. Future changes in such valuation allowance are either recognized or disclosedincluded in the provision for deferred income taxes in the period of change. Deferred income taxes may arise from temporary differences resulting from income and expense items reported for financial statements together with other information relevant for making a reasonable assessmentaccounting and tax purposes in different periods. Deferred taxes are classified as current or non-current, depending on the classification of future cash flows, interest rate risk and credit risk. Where practicable the fair values of financial assets and financial liabilities have been determinedto which they relate. Deferred taxes arising from temporary differences that are not related to an asset or liability are classified as current or non-current depending on the periods in which the temporary differences are expected to reverse and disclosed; otherwise only available information pertinent to fair value has been disclosed.are considered immaterial.
Stock Based Compensation
The Company measures the cost of services received in exchange for an award of equity instruments based on the fair value of the award. For employees and directors, the fair value of the award is measured on the grant date and for non-employees, the fair value of the award is generally re-measured on vesting dates and interim financial reporting dates until the service period is complete. The fair value amount is then recognized over the period during which services are required to be provided in exchange for the award, usually the vesting period.
As of December 31, 2013, the Company had 2,492,227 and 498,750 employee and non-employee options outstanding to purchase shares of common stock, respectively.
As of December 31, 2012, the Company had 1,273,927 and 25,000 employee and non-employee options outstanding to purchase shares of common stock, respectively. As
Registration Rights
The Company accounts for registration rights agreements in accordance with the Accounting Standards Codification subtopic 825-20, Registration Payment Arraignments (“ASC 825-20”). Under ASC 825-20, the Company is required to disclose the nature and terms of the arraignment, the maximum potential amount and to assess each reporting period the probable liability under these arraignments and, if exists, to record or adjust the liability to current period operations. On December 31, 2011,2013, the Company had Nil employeedetermined that possible payments under its registration rights agreement was probable and non-employee stock options outstanding.therefore accrued $48,668 as interest expense in current period operations for possible liability under the registration rights agreements.
Recent Accounting Pronouncements
There are various updates recently issued, most of which represented technical corrections to the accounting literature or application to specific industries and are not expected to a have a material impact on the Company's financial position, results of operations or cash flows.
NOTE 2 – GOING CONCERN MATTERS
The accompanying financial statements have been prepared on a going concern basis, which contemplates the realization of assets and the satisfaction of liabilities in the normal course of business. As shown in the accompanying financial statements during the years ended December 31, 20122013 and 2011,2012, the Company incurred net losses attributable to common stockholders of $2,477,002$10,101,846 and $1,178,101,$2,477,002, respectively and used $1,524,956$1,762,459 in cash for operating activities for the year ended December 31, 2012.2013. These factors among others raise substantial doubt about the Company’s ability to continue as a going concern for a reasonable period of time.
The Company's existence is dependent upon management's ability to develop profitable operations. The Company completed financing subsequent to the date of these financial statements (See Note 15). However additional capital will be needed to continue developing its products and services and there can be no assurance that the Company's efforts will be successful. There is no assurance that can be given that management's actions will result in profitable operations or the resolution of its liquidity problems. The accompanying statements do not include any adjustments that might result should the Company be unable to continue as a going concern.
BIOSIG TECHNOLOGIES INC.
(A development stage company)
DECEMBER 31, 2013
NOTE 3 – RELATED PARTY TRANSACTIONS
The Company’s President and shareholders have advanced funds to the Company for working capital purposes since the Company’s inception in February 2009. No formal repayment terms or arrangements exist and the Company is not accruing interest on these advances. The net amount outstanding at December 31, 2013 and 2012 was $30,781 and 2011 was $27,040.$27,040, respectively.
Accrued interest and expenses due related parties as of December 31, 2013 and 2012 was $123,089 and 2011 was $54,184, respectively.
During 2013, in connection with the amendments of the Series C 9% Convertible Preferred stock, the Company issued to Company’s president and $nil, respectively.a Director of the Company (Series C holders) an aggregate of 53,830 warrants to purchase the Company’s common stock at $2.61 per share for five years. See Note 9 below.
During 2012, the Company issued promissory notes for funding provided by the Company’s president or a company under his control in the aggregate of $248,000. During 2013, $30,000 was paid off with the remaining $218,000 converted to 93,061 shares of the Company’s common stock and 46,531 warrants to purchase the Company’s common stock at $3.67 per share for five years. See Note 6 below.
During 2012, the Company issued convertible bridge notes for funding provided by the Company’s president and a Director of the Company for an aggregate of $225,000. On January 13, 2013, the convertible bridge notes were converted into 225 shares of the Company’s Series C preferred stock and 107,656 warrants to purchase the Company’s common stock at $2.09 per share for five years. See Note 7 below.
During 2011, the Company issued an aggregate of 3,400,000 shares of its common stock at par value in connection with services provided by founders.
The Company has informal compensation and consulting agreements with employees and outside contractors, certain of whom are also Company stockholders. The Agreements are generally month to month. As of December 31, 20122013 and 2011,2012, total due under these agreements and related expenses were $0 and $43,630, and $nil.respectively.
On December 10, 2010, the Company entered into a two year consulting agreement with one of the Company's directors for certain services with compensation totaling 43,750 shares of the Company's common stock valued at $35,000
NOTE 4 – PROPERTY AND EQUIPMENT
Property and equipment as of December 31, 20122013 and 20112012 is summarized as follows:
| 2013 | 2012 | |||||||
| Computer equipment | $ | 50,937 | $ | 39,221 | ||||
| Furniture and fixtures | 7,803 | 7,803 | ||||||
| Subtotal | 58,740 | 47,024 | ||||||
| Less accumulated depreciation | (33,874 | ) | (16,815 | ) | ||||
| Property and equipment, net | $ | 24,866 | $ | 30,209 | ||||
Property and equipment are stated at cost and depreciated using the straight-line method over their estimated useful lives of 3 to 5 years. When retired or otherwise disposed, the related carrying value and accumulated depreciation are removed from the respective accounts and the net difference less any amount realized from disposition, is reflected in earnings.
| 2012 | 2011 | |||||||
| Computer equipment | $ | 39,221 | $ | 24,735 | ||||
| Furniture and fixtures | 7,803 | 6,813 | ||||||
| Total | 47,024 | 31,548 | ||||||
| Less accumulated depreciation | (16,815 | ) | (6,795 | ) | ||||
| $ | 30,209 | $ | 24,752 | |||||
NOTE 5 – ACCOUNTS PAYABLE AND ACCRUED EXPENSES
Accounts payable and accrued expenses at December 31, 2013 and 2012 consist of the following:
| 2013 | 2012 | |||||||
| Accrued accounting and legal | $ | 300,893 | $ | 120,922 | ||||
| Accrued reimbursements | 17,797 | 44,338 | ||||||
| Accrued consulting | 214,481 | 111,546 | ||||||
| Accrued research and development expenses | 64,670 | 68,120 | ||||||
| Accrued credit card obligations | 20,425 | 21,844 | ||||||
| Accrued payroll | 35,896 | 101,621 | ||||||
| Accrued liquidated damages | 48,668 | - | ||||||
| Accrued office and other | 16,500 | - | ||||||
| Accrued interest | - | 4,491 | ||||||
| Accrued settlement related to arbitration | 100,000 | - | ||||||
| $ | 819,330 | $ | 472,882 | |||||
BIOSIG TECHNOLOGIES INC.
(A development stage company)
DECEMBER 31, 20122013
| 2012 | 2011 | |||||||
| Accrued accounting and legal | $ | 120,922 | $ | 35,725 | ||||
| Accrued reimbursements | 44,338 | - | ||||||
| Accrued consulting | 111,546 | - | ||||||
| Accrued research and development expenses | 68,120 | - | ||||||
| Accrued credit card obligations | 21,844 | - | ||||||
| Accrued payroll | 101,621 | - | ||||||
| Accrued interest | 4,491 | - | ||||||
| $ | 472,882 | $ | 35,725 | |||||
NOTE 6 – NOTES PAYABLE, RELATED PARTY
On November 21, 2012, the Company issued an unsecured promissory note for $218,000 to the Company’s President for previously advanced funds with interest payable annually, in arrears, on each anniversary at the short term “Applicable Federal Rate” within the meaning of Section 1274(d) of the Internal Revenue Code of 1986, as amended adjusted each anniversary date. The promissory note matures November 21, 2021 and may be prepaid, without premium or penalty, at any time. In connection with the issuance of the unsecured promissory note, the Company’s President agreed not to receive payments (by voluntary prepayment, acceleration, set-off or otherwise) associated with the unsecured promissory note absent the prior written consent of the purchasers holding at least 67% interest of the preferred stock outstanding, which purchasers must include Alpha Capital Anstalt so long as Alpha Capital Anstalt holds not less than $100,000 of preferred stock. On December 31, 2013, the Company converted the promissory note and accrued interest to 93,061 shares of the Company’s common stock and 46,531 warrants to purchase the Company’s common stock at $3.67 per share for five years.
On December 6, 2012, the Company issued an unsecured promissory note for $30,000 to a company under the control of the Company’s President for previously advanced funds, interest free and due the earlier of (i) the next financing of not less than $300,000; (ii) February 28, 2013 or (iii) occurrence of an event of default, as defined. During year ended December 31, 2013, the Company paid off the promissory note in full.
NOTE 7 – CONVERTIBLE BRIDGE NOTES
In 2012, the Company issued an aggregate of $600,000 unsecured Senior Convertible Promissory Notes ($225,000 related party) with interest due at maturity at 8% per annum and may be paid, at the Company’s discretion, in cash or the Company’s common stock. The Notes, together with unpaid accrued interest, if any, is due upon written notice by the majority in interest of the holders on or after February 15, 2014 or (ii) upon the occurrence of an event of default, as defined. The Notes may be prepaid in whole or in part prior to the maturity date at the Company’s discretion.
The Convertible Bridge Notes and any accrued and unpaid interest automatically converts at the earlier of (i) (A) a completion of a transaction whereby the Company merges or consolidates with another company that has its common stock approved for quotation on any domestic national stock exchange and (B) the new entity thereafter issues and sells shares for no less than $3.0 million aggregate gross proceeds or (ii) a qualified IPO. The Convertible Bridge Notes shall convert into the new securities issued at 95% of the purchase price of the Conversion Securities offered to investors.
In connection with the issuance of the Senior Convertible Promissory Notes, the Company issued the right to purchase at any time, on or after the Public Financing Closing Date,(as defined above) hereof until the fifth anniversary of the Public Financing Closing date, the number of fully paid and nonassessable shares (the “Warrant Shares”) of the Company’s common stock equal to the quotient of (a) the Warrant Coverage Amount (as defined below), divided by (b) the applicable Conversion Price of the Notes, at the per share exercise price (the “Exercise Price”), which shall initially be, as of the Public Financing Closing Date, equal to the Initial Exercise Price (as defined below), subject to further adjustments, as defined.
Initial Exercise Price” means one hundred twenty-five percent (125%) of the Conversion Price.
Warrant Coverage Amount” shall be the amount obtained by multiplying (x) the Warrant Coverage Percentage by (y) the principal amount outstanding (and not including any accrued and unpaid interest) of the Note, in connection with which this Warrant is concurrently issued.
“Warrant Coverage Percentage” shall be equal to fifty percent (50%) as defined in the Bridge Loan Agreement.
On February 6, 2013, the Convertible Bridge Notes and the above described contingent warrants previously issued as described above were converted into 600 shares of Series C Convertible Preferred Stock and an aggregate of 287,082 warrants to purchase the Company’s common stock at an exercise price of $2.09 per share for 5 years. On August 7, 2013, the Company issued an aggregate of 8,941 shares of its common stock in settlement of accrued interest of $18,677.
NOTE 8 — REDEEMABLE PREFERRED STOCK
Series A Preferred Stock
In May 2011, the Board of Directors authorized the issuance of up to 200 shares of Series A Preferred Stock (the “Series A preferred stock”).
BIOSIG TECHNOLOGIES INC.
(A development stage company)
DECEMBER 31, 2013
The Series A preferred stock is entitled to preference over holders of junior stock upon liquidation in the amount of $5,000 plus any accrued and unpaid dividends ; entitled to dividends as a preference to holders of junior stock at a rate of 5% per annum of the Stated Value of $5,000 per share, payable quarterly beginning on August 31, 2011 and are cumulative. The holders of Series A preferred stock have no voting rights, however without the affirmative vote of all the holders of then outstanding shares of the Series A preferred stock, the Company cannot, (a) alter or change adversely the powers, preferences or rights given to the Series A preferred stock or alter or amend the Certificate of Designation.
The Series A preferred stock is mandatorily redeemable on December 31, 2014 (as modified) at a price equal to the Stated Value ($5,000) plus an amount equal to all accumulated and unpaid dividends. If the Company fails to redeem at redemption, the unpaid redemption price will accrue at 14% per annum until paid.
The Series A preferred stock is convertible (as amended), automatically, inclusive of any accrued and unpaid dividends, immediately into the Company’s common stock upon the Company becoming subject to the reporting requirements under Section 13 or 15(d) of the Securities and Exchange Act of 1934, as amended at conversion price of $1.84 per share.
On February 6, 2013, in connection with the holders discretion, at any timeamendment to convert any whole or partial number ofthe Series A preferred stock into common stock at a price based on $15 million postdefining the conversion calculated on a fully diluted basis. The number of common shares issuable is obtained by multiplying (i)feature, the number of Series A preferred stock to be converted by (ii)Company reclassified the sum of (A) $5,000 and (B) all accrued by unpaid dividends divided the product by $15 million and issuing common shares equal to the quotientassociated financing costs as a percentagedebt discount against the carrying value of the fully diluted common shares of the Company.preferred stock.
Series B Preferred Stock
On November 28, 2011, the Board of Directors authorized the issuance of up to 600 shares of Series B Preferred Stock (the “Series B preferred stock”).
The Series B preferred stock is entitled to preference over holders of junior stock upon liquidation in the amount of $5,000 plus any accrued and unpaid dividends; entitled to dividends as a preference to holders of junior stock at a rate of 5% per annum of the Stated Value of $5,000 per share, payable quarterly beginning on December 31, 2011 and are cumulative. The holders of Series B preferred stock have no voting rights, however without the affirmative vote of all the holders of then outstanding shares of the Series B preferred stock, the Company cannot (a) alter or change adversely the powers, preferences or rights given to the Series A preferred stock or alter or amend the Certificate of Designation.
The Series B preferred stock is mandatorily redeemable on December 31, 2014 at a price equal to the Stated Value ($5,000) plus an amount equal to all accumulated and unpaid dividends. If the Company fails to redeem at redemption, the unpaid redemption price will accrue at 14% per annum until paid.
The Series B preferred stock is convertible (as amended), automatically, inclusive of any accrued and unpaid dividends, immediately into the Company’s common stock upon the Company becoming subject to the reporting requirements under Section 13 or 15(d) of the Securities and Exchange Act of 1934, as amended at conversion price of $2.02 per share.
On February 6, 2013, in connection with the holders discretion, at any timeamendment to convert any whole or partial number ofthe Series B preferred stock into common stock at a price based on $17.5 million postdefining the conversion calculated on a fully diluted basis. The number of common shares issuable is obtained by multiplying (i)feature, the number of Series B preferred stock to be converted by (ii)Company reclassified the sum of (A) $5,000 and (B) all accrued by unpaid dividends divided the product by $17.5 million and issuing common shares equal to the quotientassociated financing costs as a percentagedebt discount against the carrying value of the fully diluted common shares of the Company.preferred stock.
NOTE 9 — SERIES C 9% CONVERTIBLE PREFERRED STOCK
On January 9, 2013, the Board of Directors authorized the issuance of up to 4,200 shares of Series C Convertible Preferred Stock (the “Series C Convertible Preferred Stock”).
The gross proceedsSeries C convertible preferred stock is entitled to preference over holders of junior stock upon liquidation in the amount of $1,000 plus any accrued and unpaid dividends ; entitled to dividends as a preference to holders of junior stock at a rate of 9% per annum of the Stated Value of $1,000 per share, payable quarterly beginning on September 30, 2013 and are cumulative. The holders of Series C preferred stock have no voting rights, however without the affirmative vote of all the holders of then outstanding shares of the Series B Preferred Stock of $887,500 and $100,000 as of December 31, 2012 and 2011, respectively, are shown as a current liability andC preferred stock, the related issuance costs as a current asset labeled capitalized financing costs inCompany cannot (a) alter or change adversely the accompanying balance sheets. The capitalized financing cost are amortized through December 31, 2014, the date redemption is availablepowers, preferences or rights given to the Series C preferred shareholders.
stock or alter or amend the Certificate of Designation.BIOSIG TECHNOLOGIES INC.
(A development stage company)
DECEMBER 31, 20122013
If, at any time while the Series C preferred stock is outstanding, the Company sells or grants any option to purchase or sells or grants any right to re-price, or otherwise disposes of or issues any common stock or common stock equivalents entitling any Person to acquire shares of Common Stock at an effective price per share that is lower than the then conversion price (“Base Conversion Price”), then the conversion price shall be reduced to equal the Base Conversion Price. Such adjustment shall be made whenever such Common Stock or Common Stock Equivalents are issued.
The Series C preferred stock contains triggering events which would require redemption at (i) the greater of 120% of the stated value of $1,000 or the product of product of the variable weighted average price of the Company’s common stock on the trading day immediately preceding the date of the triggering event and the stated value divided by then then conversion price or (ii) either (a) redeem each Series C preferred share for a redemption price, in shares of the Company’s common stock, equal to a number of shares equal to the (i) above divided by 75%. The Company determined that certain of the defined triggering events were outside the Company’s control and therefore classified the Series C preferred stock outside of equity.
In connection with the sale of the Series C preferred stock, the Company issued an aggregate of 1,158,850 warrants to purchase the Company’s common stock at $2.61 per share expiring five years from the initial exercise date. The warrant provides if, at any time while the warrant is outstanding, the Company sells or grants any option to purchase or sells or grants any right to re-price, or otherwise disposes of or issues any common stock or common stock equivalents entitling any person to acquire shares of common stock at an effective price per share that is lower than the then conversion price (“base conversion price”), then the conversion price shall be reduced to equal the Base Conversion Price. Such adjustment shall be made whenever such Common Stock or Common Stock Equivalents are issued. In addition, the warrants provides for at any time after the six month anniversary of the initial exercise date, there is no effective registration statement registering, or no current prospectus available for the resale of the warrant shares by the holder, then the warrant may only be exercised, in whole or in part, at such time by means of a “cashless exercise” in which the holder shall be entitled to receive a number of Warrant Shares equal to defined formula.
In accordance with ASC 470-20, the Company recognized an embedded beneficial conversion feature present in the Series C preferred stock when it was issued. The Company allocated the net proceeds between the intrinsic value of the conversion option ($1,303,671) and the warrants ($1,064,739) to additional paid-in capital. The aggregate debt discount, comprised of the relative intrinsic value the conversion option ($1,303,671), relative fair value of the warrants ($1,064,739), and the issuance costs ($412,590); total of $2,781,000, is amortized over one year as interest expense, the date a possible redemption feature, outside of the Company’s control, would be available to the Series C stockholders
The Company valued the warrants in accordance with ASC 470-20 using the Black-Scholes pricing model and the following assumptions: contractual terms of 5 years, an average risk free interest rate of 0.39% to 1.40%, a dividend yield of 0%, and volatility of 123.41% to 125.33%.
During the month of February 2013, the holders of the Convertible Bridge Notes (See Note 7) converted into 600 shares of the Company’s Series C 9% Convertible Preferred Stock.
During the months of February, March, May, and July 2013, the Company sold an aggregate of 2,181 shares of the Company’s Series C 9% Convertible Preferred Stock for net proceeds of $1,814,910.
The Company determined that the anti-dilutive provisions embedded in the Series C 9% Convertible Preferred Stock and related issued warrants did not meet the defined criteria of a derivative in such that the net settlement requirement of delivery of common shares does not meet the “readily convertible to cash” as described in Accounting Standards Codification 815 and therefore bifurcation is not required. There is no established market for the Company’s common stock.
Series C preferred stock issued and outstanding totaled 2,781 as of December 31, 2013. There were no shares issued as of December 31, 2012.
BIOSIG TECHNOLOGIES INC.
(A development stage company)
DECEMBER 31, 2013
Registration Rights Agreement
The Company entered into a Registration Rights Agreement in connection with the sale and issuance of the Series C preferred stock. The Company is required to file a registration statement registering for resale the (a) common stock issuable upon conversion in full of the Preferred Stock (assuming on such date the shares of Preferred Stock are converted in full without regard to any conversion limitations therein), (b) all shares of Common Stock issuable as dividends and “Make-Whole Payments” (as defined in the Certificate of Designation) on the Preferred Stock assuming all dividend and Make-Whole Payments are made in shares of Common Stock and the Preferred Stock is held for at least 3 years, (c) all warrant shares then issuable upon exercise of the Warrants (assuming on such date the warrants are exercised in full without regard to any exercise limitations therein), (d) any additional shares of Common Stock issuable in connection with any anti-dilution provisions in the Preferred Stock or the Warrants (in each case, without giving effect to any limitations on conversion set forth in the Certificate of Designation or limitations on exercise set forth in the Warrants) and (e) any securities issued or then issuable upon any stock split,
dividend or other distribution, recapitalization or similar event with respect to the foregoing. The Company is required to file a registration statement and must be declared effective no later than 210 days from the date of termination of the sale the Series C preferred stock. The Company is required to maintain the effectiveness of the registration statement from its effective date unless all securities registered under the registration statement have been sold or are otherwise able to be sold. If the Company fails to comply with the registration statement effective date requirements, the Company is required to pay the investors a fee equal to 0.25% of the Purchaser’s investment, for each 30-day period of delay, subject to a maximum payment of 3% to each Purchaser.
On July 22, 2013, the Company met its required filing requirement however did not meet the effectiveness obligation by November 22, 2013, therefore accrued $34,763 as interest expense in current period operations for possible liquidating damages under the registration rights agreement.
NOTE 910 — STOCKHOLDER EQUITY
There is not a viable market for the Company’s common stock to determine its fair value; therefore, management is required to estimate the fair value to be utilized in the determining stock based compensation costs. In estimating the fair value, management considers recent sales of its common stock to independent qualified investors, placement agents’ assessments of the underlying common shares relating to our sale of preferred stock and validation by independent fair value experts. Considerable management judgment is necessary to estimate the fair value. Accordingly, actual results could vary significantly from management’s estimates.
Preferred stock
The Company is authorized to issue 1,000,000 shares of $0.001 par value preferred stock. As of December 31, 2013 and 2012, the Company has designated and issued 200 and 184.4 shares of Series A preferred stock, respectively, designated and issued 600 and 177.5 shares of Series B preferred stock, respectivelyrespectively. See Note 8.
As of December 31, 2013 and 2012, the Company designated 4,200 and 2,000 shares of Series C 9% convertible preferred stock, respectively; and issued 2,0002,781 and -0- shares of Series C 9% convertible preferred stock. See Note 9.
Common stock
On October 17, 2012, the Company amended its Articles of Incorporation to increase the number of authorized shares of its common stock from 10 million to 50 million shares. As of December 31, 2013 and 2012 the Company has 8,412,101 and 8,166,238 shares of common stock issued and outstanding.outstanding, respectively.
During the period from February 24, 2009 to December 31, 2009, the Company issued or designated an aggregate of 7,400,000 shares of common stock as payment for services by founders, 4,000,000 and 3,400,000 shares issued during the years ended December 31, 2009 and 2011, respectively ($0.01 per share).
During the year ended December 31, 2011, the Company issued an aggregate of 408,113 shares of common stock for services rendered totaling $326,490 ($0.80 per share).
During the year ended December 31, 2011, the Company issued an aggregate of 175,000 shares of common stock for future services totally $140,000 ($0.80 per share).
During the year ended December 31, 2012, the Company issued an aggregate of 30,000 shares of common stock for future services totally $60,000 ($2.00 per share).
During the year ended December 31, 2013, the Company issued aggregate of 21,412 shares of common stock for services rendered totaling $44,751 ($2.09 per share).
BIOSIG TECHNOLOGIES INC.
(A development stage company)
DECEMBER 31, 2013
During the year ended December 31, 2013, the Company issued aggregate of 122,449 shares of common stock for cash rendered totaling $247,174 ($2.45 per share).
NOTE 1011 — OPTIONS AND WARRANTS
There is not a viable market for the Company’s common stock to determine its fair value;value, therefore management is required to estimate the fair value to be utilized in the determining stock based compensation costs. In estimating the fair value, management considers recent sales of its common stock to independent qualified investors, placement agents’ assessments of the underlying common shares relating to our sale of preferred stock and validation by independent fair value experts. Considerable management judgment is necessary to estimate the fair value. Accordingly, actual results could vary significantly from management’s estimates.
On October 19, 2012, the Company’s Board of Directors approved the 2012 Equity Incentive Plan (the “ 2012 Plan”). The Plan provides for (“the issuance of options to purchase up to 2,000,000 shares of“2012 Plan) and terminated the Company’s common stock to officers, directors, employees and consultants of the Company including any common stock reserved by not issued pursuant to any awards granted under the Company’s 2011 Long-Term Incentive Plan . Under the terms of the Plan the Company may issue Incentive Stock Options as defined by the Internal Revenue Code to employees of the Company only and nonstatutory options. The Board of Directors of the Company determines the exercise price, vesting and expiration period of the grants under the Plan. However, the exercise price of an Incentive Stock Option should not be less than 110% of fair value of the common stock at the date of the grant for a 10% or more stockholder and 100% of fair value for a grantee who is not 10% stockholder. The fair value of the common stock is determined based on quoted market price or in absence of such quoted market price, by the Board of Directors in good faith. Additionally, the vesting period of the grants under the Plan will be determined by the Committee, in its sole discretion and expiration period not more than ten years. In connection with the Board’s approval, the Company’s 2011 Long-Term Incentive Plan was closed.
Additionally, the vesting period of the grants under the Plan will be determined by the 3, Committee, in its sole discretion and expiration period not more than ten years. The Company reserved 1,500,000500,000 shares of its common stock for future issuance under the terms of the Plan.
As of December 31, 2012,2013, the Company granted an aggregate of 1,298,9272,990,977 options to directors and key consultants with an aggregate estimated fair value of $1,237,868.$3,380,851.
Employee Options
The following table summarizes the employee options outstanding and the related prices for the shares of the Company's common stock issued at December 31, 2012:2013:
| Options Outstanding | Options Exercisable | Options Outstanding | Options Exercisable | |||||||||||||||||||||||||||||||||||||||||
| Weighted Average | Weighted | Weighted | Weighted Average | Weighted | Weighted | |||||||||||||||||||||||||||||||||||||||
| Prices | Prices | Outstanding | (Years) | Price | Exercisable | Price | Prices | Outstanding | (Years) | Price | Exercisable | Price | ||||||||||||||||||||||||||||||||
| $ | 2.00 | 1,273,927 | 6.57 | $ | 2.00 | - | $ | 2.00 | 2.00 | 1,273,927 | 5.63 | $ | 2.00 | 250,821 | $ | 2.00 | ||||||||||||||||||||||||||||
| 2.09 | 1,218,300 | 6.09 | 2.09 | 1,061,364 | 2.09 | |||||||||||||||||||||||||||||||||||||||
| 2,492,227 | 6.85 | 2.04 | 1,312,185 | 2.07 | ||||||||||||||||||||||||||||||||||||||||
Transactions involving stock options issued to employees are summarized as follows:
Number of Shares | Weighted Average Price Per Share | Number of Shares | Weighted Average Price Per Share | |||||||||||||
| Outstanding at December 31, 2010: | - | $ | - | |||||||||||||
| Granted | - | - | ||||||||||||||
| Exercised | - | - | ||||||||||||||
| Expired | - | - | ||||||||||||||
| Outstanding at December 31, 2011: | - | - | - | $ | - | |||||||||||
| Granted | 1,273,927 | 2.00 | 1,273,927 | 2.00 | ||||||||||||
| Exercised | - | - | - | - | ||||||||||||
| Expired | - | - | - | - | ||||||||||||
| Outstanding at December 31, 2012: | 1,273,927 | $ | 2.00 | 1,273,927 | 2.00 | |||||||||||
| Granted | 1,218,300 | 2.09 | ||||||||||||||
| Exercised | - | - | ||||||||||||||
| Expired | - | - | ||||||||||||||
| Outstanding at December 31, 2013: | 2,492,227 | $ | 2.04 | |||||||||||||
During the year ended December 31, 2012, the Company granted 1,273,927 options to purchase the Company stock in connection with the services rendered at the exercise price of $2.00 per share for a term of seven years with 250,821 options vesting at the first, second and third anniversaries of the grant date. The remainder (521,464 options) vest contingent on the occurrence of certain events, as defined.
BIOSIG TECHNOLOGIES INC.
(A development stage company)
DECEMBER 31, 20122013
The fair value of the granted options for the year ended December 31, 2012 was determined using the Black Scholes option pricing model with the following assumptions:
| Dividend yield: | -0- | % | ||
| Volatility | 108.60% to 111.78 | % | ||
| Risk free rate: | 0.97% to 1.14 | % | ||
| Expected life: | 7 years | |||
| Estimated fair value of the Company’s common stock | $2.00 | |||
During the year ended December 31, 2013, the Company granted an aggregate of 1,218,300 options to purchase the Company stock in connection with the services rendered at the exercise price of $2.09 per share for a term of seven years with 283,300 options vesting at ratably over one year and the remainder (935,000 options) vested immediately upon issuance.
The fair value of the granted options for year ended December 31, 2013 was determined using the Black Scholes option pricing model with the following assumptions:
| Dividend yield: | -0- | % | ||
| Volatility | 110.70% to 115.03 % | |||
| Risk free rate: | 1.07% to 1.25 % | |||
| Expected life: | 7 years | |||
| Estimated fair value of the Company’s common stock | $ | 2.09 | ||
The fair value of all employee options vesting during the yearyears ended December 31, 2013 and 2012 of $2,518,785 and 2011 of $142,032, and $-0-, respectively, was charged to current period operations. Unrecognized compensation expense of $1,152,939$862,066 at December 31, 20122013 will be expensed in future periods.
Non-employee Options
The following table summarizes the non-employee options outstanding and the related prices for the shares of the Company's common stock issued at December 31, 2012:2013:
| Options Outstanding | Options Exercisable | Options Outstanding | Options Exercisable | |||||||||||||||||||||||||||||||||||||||||
| Weighted Average | Weighted | Weighted | Weighted Average | Weighted | Weighted | |||||||||||||||||||||||||||||||||||||||
| Prices | Prices | Outstanding | (Years) | Price | Exercisable | Price | Prices | Outstanding | (Years) | Price | Exercisable | Price | ||||||||||||||||||||||||||||||||
| $ | 2.00 | 25,000 | 6.72 | $ | 2.00 | 25,000 | $ | 2.00 | 2.00 | 25,000 | 5.73 | $ | 2.00 | 25,000 | $ | 2.00 | ||||||||||||||||||||||||||||
| 2.09 | 473,750 | 7.04 | 2.09 | 338,473 | 2.09 | |||||||||||||||||||||||||||||||||||||||
| 498,750 | 6.97 | 2.09 | 363,473 | 2.08 | ||||||||||||||||||||||||||||||||||||||||
Transactions involving stock options issued to non- employees are summarized as follows:
Number of Shares | Weighted Average Price Per Share | Number of Shares | Weighted Average Price Per Share | |||||||||||||
| Outstanding at December 31, 2010: | - | $ | - | |||||||||||||
| Granted | - | - | ||||||||||||||
| Exercised | - | - | ||||||||||||||
| Expired | - | - | ||||||||||||||
| Outstanding at December 31, 2011: | - | - | - | $ | - | |||||||||||
| Granted | 25,000 | 2.00 | 25,000 | 2.00 | ||||||||||||
| Exercised | - | - | - | - | ||||||||||||
| Expired | - | - | - | - | ||||||||||||
| Outstanding at December 31, 2012: | 25,000 | $ | 2.00 | 25,000 | 2.00 | |||||||||||
| Granted | 473,750 | 2.09 | ||||||||||||||
| Exercised | - | - | ||||||||||||||
| Expired | - | - | ||||||||||||||
| Outstanding at December 31, 2013: | 498,750 | $ | 2.09 | |||||||||||||
During the year ended December 31, 2012, the Company granted 25,000 options to purchase the Company stock in connection with the services rendered at the exercise price of $2.00 per share for a term of seven years vesting immediately.
The fair value of the granted options of $43,291 for the year ended December 31, 2012 was determined using the Black Scholes option pricing model with the following assumptions:
| Dividend yield: | -0- | % | ||
| Volatility | 111.78 | % | ||
| Risk free rate: | 0.97 | % | ||
| Expected term: | 7 years | |||
| Estimated fair value of the Company’s common stock | $ | 2.00 | ||
Dividend yield: | -0- | % | ||
Volatility | 111.78 | % | ||
Risk free rate: | 0.97 | % | ||
Expected term: | 7 years | |||
Estimated fair value of the Company’s common stock | $ | 2.00 | ||
BIOSIG TECHNOLOGIES INC.
(A development stage company)
DECEMBER 31, 20122013
During the year ended December 31, 2013, the Company granted an aggregate of 473,750 options to purchase the Company stock in connection with the services rendered at the exercise price of $2.09 per share for a term of seven years (30,000) to ten years (443,750), vesting immediately for 160,000 options, 30,000 vesting 1/9 per month on each month anniversary and with the remainder vesting at 48,611 per first three month anniversary with remainder vesting at 1/24 per month.
The fair value of the vesting options of $728,401 for the year ended December 31, 2013 was determined using the Black Scholes option pricing model with the following assumptions:
| Dividend yield: | -0- | % | ||
| Volatility | 110.18% to 121.59 % | |||
| Risk free rate: | 1.23% to 3.04 % | |||
| Expected term: | 7 to 10 years | |||
| Estimated fair value of the Company’s common stock | $ | 2.09 | ||
Warrants
The following table summarizes warrants outstanding and the related prices for the shares of the Company's common stock issued at December 31, 2013:
| Warrants Outstanding | Warrants Exercisable | |||||||||||||||||||||
| Weighted Average | Weighted | Weighted | ||||||||||||||||||||
| Prices | Outstanding | (Years) | Price | Exercisable | Price | |||||||||||||||||
| $ | 0.001 | 383,320 | 6.02 | $ | 0.001 | 383,320 | $ | 0.001 | ||||||||||||||
| 1.84 | 35,076 | 6.05 | 1.84 | 35,076 | 1.84 | |||||||||||||||||
| 2.02 | 30,755 | 6.05 | 2.02 | 30,755 | 2.02 | |||||||||||||||||
| 2.61 | 2,138,800 | 4.36 | 2.61 | 2,138,800 | 2.61 | |||||||||||||||||
| 3.67 | 129,307 | 5.00 | 3.67 | 129,307 | 3.67 | |||||||||||||||||
| 2,717,258 | 4.66 | 2.23 | 2,717,258 | 2.28 | ||||||||||||||||||
Transactions involving warrants issued are summarized as follows:
Number of Shares | Weighted Average Price Per Share | |||||||
| Outstanding at December 31, 2011: | - | $ | - | |||||
| Granted | - | - | ||||||
| Exercised | - | - | ||||||
| Expired | - | - | ||||||
| Outstanding at December 31, 2012: | - | - | ||||||
| Granted | 2,717,258 | 2.28 | ||||||
| Exercised | - | - | ||||||
| Expired | - | - | ||||||
| Outstanding at December 31, 2013: | 2,717,258 | $ | 2.28 | |||||
On January 7, 2013, the Company issued 383,320 warrants to purchase the Company stock in connection with the services rendered at the exercise price of $0.001 per share for a term of seven years exercisable immediately.
The fair value of the issued warrants were determined using the Black Scholes option pricing model with the following assumptions:
| Dividend yield: | -0- | % | ||
| Volatility | 114.99 | % | ||
| Risk free rate: | 1.31 | % | ||
| Expected life: | 7 years | |||
| Estimated fair value of the Company’s common stock | $ | 2.09 | ||
The fair value of all non- employee options vesting during the year ended December 31, 2012 and 2011 of $43,291 and $-0-, respectively,$800,823 was charged to current period operations.
F-19
BIOSIG TECHNOLOGIES INC.
(A development stage company)
DECEMBER 31, 2013
On January 13, 2013, the Company issued an aggregate of 65,831 warrants to purchase the Company stock in connection with the placement services at the exercise prices of $1.84 (35,076 warrants) and $2.02 (30,775 warrants) per share for a term of five years exercisable immediately.
The fair value of the issued warrants were determined using the Black Scholes option pricing model with the following assumptions:
| Dividend yield: | -0- | % | ||
| Volatility | 123.30 | % | ||
| Risk free rate: | 0.72 | % | ||
| Expected life: | 5 years | |||
| Estimated fair value of the Company’s common stock | $ | 2.09 | ||
The fair value of $115,854 was charged to operations ratably as financing costs through December 31, 2014.
During the year ended December 31, 2013, the Company issued an aggregate of 1,516,386 warrants to purchase the Company stock in connection with the sale of the Series C 9% Convertible Preferred Stock at the exercise price of $2.61 per share for a term of five years exercisable immediately.
During the months of July and September, 2013, the Company issued an aggregate of 622,414 warrants to purchase the Company’s stock to holders of Series C preferred stock as an inducement to amend and waive certain defined provisions of the Series C preferred stock.
The fair value of the issued warrants were determined using the Black Scholes option pricing model with the following assumptions:
| Dividend yield: | -0- | % | ||
| Volatility | 125.33 | % | ||
| Risk free rate: | 1.40 | % | ||
| Expected life: | 5 years | |||
| Estimated fair value of the Company’s common stock | $ | 2.09 | ||
The fair value of $1,074,833 was charged to current period operations
On December 31, 2013, the Company issued an aggregate of 129,307 warrants to purchase the Company’s common stock at $3.67 per share for five years in connection with the sale of the Company’s common stock.
The risk-free interest rate assumption is based upon observed interest rates on zero coupon U.S. Treasury bonds whose maturity period is appropriate for the term. Estimated volatility is a measure of the amount by which the Company's stock price is expected to fluctuate each year during the term of the award. The Company's estimated volatility is an average of the historical volatility of the stock prices of its peer entities whose stock prices were publicly available. The Company's calculation of estimated volatility is based on historical stock prices over a period equal to the term of the awards. The Company used the historical volatility of peer entities due to the lack of sufficient historical data of its stock price.
NOTE 1112 - LOSS PER SHARE
The following table presents the computation of basic and diluted loss per share for the years ended December 31, 20122013 and 2011:2012:
| 2012 | 2011 | |||||||||||||||
| 2013 | 2012 | |||||||||||||||
| Net loss available to Common stockholders | $ | (2,477,002 | ) | $ | (1,178,101 | ) | $ | (10,101,846 | ) | $ | (2,477,002 | ) | ||||
| Basic and diluted earnings (loss) per share | $ | (0.30 | ) | $ | (0.18 | ) | $ | (1.23 | ) | $ | (0.30 | ) | ||||
| Weighted average common shares outstanding | 8,142,222 | 6,650,026 | 8,187.648 | 8,142,222 | ||||||||||||
NOTE 1213 - FAIR VALUE OF FINANCIAL INSTRUMENTS
The Company follows the provisions of ASC 825-10. For financial assets and liabilities included within the scope of ASC 825-10, the Company was required to adopt the provisions of ASC 825-10 prospectively as of the beginning of Fiscal 2009. The adoption of ASC 825-10 did not have a material impact on our consolidated financial position or results of operations.
There were no items required to be measured at fair value on a recurring basis in the consolidated financial statements as of December 31, 20122013 and 2011.2012.
BIOSIG TECHNOLOGIES INC.
(A development stage company)
NOTES TO THE FINANCIAL STATEMENTS
DECEMBER 31, 2013
NOTE 1314 - COMMITMENTS AND CONTINGENCIES
Operating leases
On August 9, 2011, the Company entered into a three-year lease for office space in Los Angeles, California, with monthly payments escalating from $60,804 in the first year to $66,456 in the third year.
Future minimum lease payments under the operating lease are as follows:
| Year Ending December 31, | ||||||||
| 2013 | $ | 63,256 | ||||||
| 2014 | 44,304 | $ | 43,504 | |||||
| $ | 107,560 | |||||||
In addition, the Company leases parking in aggregate of approximately $620$700 per month, on a month to month basis.
Total lease rental expenses for the years ended December 31, 2013 and 2012 was $70,950 and 2011 was $72,408, and $8,752, respectively.
Litigation
Drachman vs. BioSig Technologies, Inc., (AAA Case No. 14 166 0001814). Mr. Drachman has asserted claims in aggregate of $612,000 plus 12 months health and dental coverage and 10% of the Company’s common stock on a fully diluted basis with anti-dilution provisions relating to his employment with Company. In addition, Mr. Drachman is also seeking a declaratory judgment that certain intellectual property be adjudicated to belong to him. The Company contents the claims asserted are of little or no merit and will defend vigorously. For the year ended December 31, 2013, the Company has accrued an estimated cost of defense, arbitration and other court fees of $100,000.
The Company is subject at times to other legal proceedings and claims, which arise in the ordinary course of its business. Although occasional adverse decisions or settlements may occur, the Company believes that the final disposition of such matters should not have a material adverse effect on its financial position, results of operations or liquidity. There was no outstanding litigation as of December 31, 2012.
The Company’s short-term financial instruments, including cash, prepaid expenses and Consulting Agreementsother assets, accounts payable and accrued expenses and other liabilities, consist primarily of instruments without extended maturities, the fair value of which, based on management’s estimates, reasonably approximate their book value. The fair value of the Company’s convertible securities is based on management estimates and reasonably approximates their book value.
Property and Equipment
Property and equipment are stated at cost and depreciated using the straight-line method over their estimated useful lives of 3 to 5 years. When retired or otherwise disposed, the related carrying value and accumulated depreciation are removed from the respective accounts and the net difference less any amount realized from disposition, is reflected in earnings.
Long-Lived Assets
The Company follows Accounting Standards Codification 360-10-15-3, “Impairment or Disposal of Long-lived Assets,” which established a “primary asset” approach to determine the cash flow estimation period for a group of assets and liabilities that represents the unit of accounting for a long-lived asset to be held and used. Long-lived assets to be held and used are reviewed for impairment whenever events or changes in circumstances indicate that the carrying amount of an asset may not be recoverable. The carrying amount of a long-lived asset is not recoverable if it exceeds the sum of the undiscounted cash flows expected to result from the use and eventual disposition of the asset. Long-lived assets to be disposed of are reported at the lower of carrying amount or fair value less cost to sell.
Net Income (loss) Per Common Share
The Company computes earnings (loss) per share under Accounting Standards Codification subtopic 260-10, Earnings Per Share (“ASC 260-10”). Net loss per common share is computed by dividing net loss by the weighted average number of shares of common stock outstanding during the year. Diluted earnings per share, if presented, would include the dilution that would occur upon the exercise or conversion of all potentially dilutive securities into common stock using the “treasury stock” and/or “if converted” methods as applicable.
The Company has consulting agreements with outside contractors to provide certain consultingcomputation of basic and advisory services. The Agreements are generally for a term of 12 months from inception and renewable automatically from year to year unless either the Company or Consultant terminates such engagement by written notice. Asdiluted loss per share as of December 31, 2013 and 2012 excludes potentially dilutive securities when their inclusion would be anti-dilutive, or if their exercise prices were greater than the Company has an aggregateaverage market price of $252,000 (annualized) informal consulting/employment agreements.the common stock during the period.
| 2013 | 2012 | |||||||
| Series A convertible preferred stock | 501,089 | |||||||
| Series B convertible preferred stock | 451,726 | |||||||
| Series C convertible preferred stock | 1,330,627 | |||||||
| Options to purchase common stock | 2,990,977 | 1,298,927 | ||||||
| Warrants to purchase common stock | 2,717,258 | - | ||||||
| Totals | 7,991,677 | 1,298,927 | ||||||
The Company is requiredaccounts for research and development costs in accordance with the Accounting Standards Codification subtopic 730-10, Research and Development (“ASC 730-10”). Under ASC 730-10, all research and development costs must be charged to file income tax returnsexpense as incurred. Accordingly, internal research and development costs are expensed as incurred. Third-party research and developments costs are expensed when the contracted work has been performed or as milestone results have been achieved. Company-sponsored research and development costs related to both present and future products are expensed in the U.S. Federal jurisdiction and in California.period incurred. The Company is no longer subject to income tax examinations by tax authoritiesincurred research and development expenses of $992,207 and $888,948 for tax years ending beforethe year ended December 31, 2009.2013 and 2012, respectively; and $2,463,680 from the period from February 24, 2009 (date of inception) to December 31, 2013.
BIOSIG TECHNOLOGIES INC.
(A development stage company)
DECEMBER 31, 2012
2013The Company follows Accounting Standards Codification subtopic 740-10, Income Taxes (“ASC 740-10”) for recording the provision for income taxes. Deferred tax assets and liabilities are computed based upon the difference between the financial statement and income tax basis of assets and liabilities using the enacted marginal tax rate applicable when the related asset or liability is expected to be realized or settled. Deferred income tax expenses or benefits are based on the changes in the asset or liability during each period. If available evidence suggests that it is more likely than not that some portion or all of the deferred tax assets will not be realized, a valuation allowance is required to reduce the deferred tax assets to the amount that is more likely than not to be realized. Future changes in such valuation allowance are included in the provision for deferred income taxes in the period of change. Deferred income taxes may arise from temporary differences resulting from income and expense items reported for financial accounting and tax purposes in different periods. Deferred taxes are classified as current or non-current, depending on the classification of assets and liabilities to which they relate. Deferred taxes arising from temporary differences that are not related to an asset or liability are classified as current or non-current depending on the periods in which the temporary differences are expected to reverse and are considered immaterial.
Stock Based Compensation
The Company measures the cost of services received in exchange for an award of equity instruments based on the fair value of the award. For employees and directors, the fair value of the award is measured on the grant date and for non-employees, the fair value of the award is generally re-measured on vesting dates and interim financial reporting dates until the service period is complete. The fair value amount is then recognized over the period during which services are required to be provided in exchange for the award, usually the vesting period.
As of December 31, 2013, the Company had 2,492,227 and 498,750 employee and non-employee options outstanding to purchase shares of common stock, respectively.
As of December 31, 2012, the Company had 1,273,927 and 25,000 employee and non-employee options outstanding to purchase shares of common stock, respectively.
Registration Rights
The effective rate differs fromCompany accounts for registration rights agreements in accordance with the statutory rateAccounting Standards Codification subtopic 825-20, Registration Payment Arraignments (“ASC 825-20”). Under ASC 825-20, the Company is required to disclose the nature and terms of 34%the arraignment, the maximum potential amount and to assess each reporting period the probable liability under these arraignments and, if exists, to record or adjust the liability to current period operations. On December 31, 2013, the Company determined that possible payments under its registration rights agreement was probable and therefore accrued $48,668 as interest expense in current period operations for duepossible liability under the registration rights agreements.
Recent Accounting Pronouncements
There are various updates recently issued, most of which represented technical corrections to the following:accounting literature or application to specific industries and are not expected to a have a material impact on the Company's financial position, results of operations or cash flows.
NOTE 2 – GOING CONCERN MATTERS
The accompanying financial statements have been prepared on a going concern basis, which contemplates the realization of assets and the satisfaction of liabilities in the normal course of business. As shown in the accompanying financial statements during the years ended December 31, 2013 and 2012, the Company incurred net losses attributable to common stockholders of $10,101,846 and $2,477,002, respectively and used $1,762,459 in cash for operating activities for the year ended December 31, 2013. These factors among others raise substantial doubt about the Company’s ability to continue as a going concern for a reasonable period of time.
The Company's existence is dependent upon management's ability to develop profitable operations. The Company completed financing subsequent to the date of these financial statements (See Note 15). However additional capital will be needed to continue developing its products and services and there can be no assurance that the Company's efforts will be successful. There is no assurance that can be given that management's actions will result in profitable operations or the resolution of its liquidity problems. The accompanying statements do not include any adjustments that might result should the Company be unable to continue as a going concern.
F-11
BIOSIG TECHNOLOGIES INC.
(A development stage company)
DECEMBER 31, 2013
NOTE 3 – RELATED PARTY TRANSACTIONS
The Company’s deferred taxesPresident and shareholders have advanced funds to the Company for working capital purposes since the Company’s inception in February 2009. No formal repayment terms or arrangements exist and the Company is not accruing interest on these advances. The net amount outstanding at December 31, 2013 and 2012 was $30,781 and $27,040, respectively.
Accrued interest and expenses due related parties as of December 31, 2013 and 2012 was $123,089 and $54,184, respectively.
During 2013, in connection with the amendments of the Series C 9% Convertible Preferred stock, the Company issued to Company’s president and a Director of the Company (Series C holders) an aggregate of 53,830 warrants to purchase the Company’s common stock at $2.61 per share for five years. See Note 9 below.
During 2012, the Company issued promissory notes for funding provided by the Company’s president or a company under his control in the aggregate of $248,000. During 2013, $30,000 was paid off with the remaining $218,000 converted to 93,061 shares of the Company’s common stock and 46,531 warrants to purchase the Company’s common stock at $3.67 per share for five years. See Note 6 below.
During 2012, the Company issued convertible bridge notes for funding provided by the Company’s president and a Director of the Company for an aggregate of $225,000. On January 13, 2013, the convertible bridge notes were converted into 225 shares of the Company’s Series C preferred stock and 107,656 warrants to purchase the Company’s common stock at $2.09 per share for five years. See Note 7 below.
During 2011, the Company issued an aggregate of 3,400,000 shares of its common stock at par value in connection with services provided by founders.
The Company has informal compensation and consulting agreements with employees and outside contractors, certain of whom are also Company stockholders. The Agreements are generally month to month. As of December 31, 2013 and 2012, total due under these agreements and related expenses were $0 and $43,630, respectively.
On December 10, 2010, the Company entered into a two year consulting agreement with one of the Company's directors for certain services with compensation totaling 43,750 shares of the Company's common stock valued at $35,000
NOTE 4 – PROPERTY AND EQUIPMENT
Property and equipment as of December 31, 2013 and 2012 is summarized as follows:
| 2013 | 2012 | |||||||
| Computer equipment | $ | 50,937 | $ | 39,221 | ||||
| Furniture and fixtures | 7,803 | 7,803 | ||||||
| Subtotal | 58,740 | 47,024 | ||||||
| Less accumulated depreciation | (33,874 | ) | (16,815 | ) | ||||
| Property and equipment, net | $ | 24,866 | $ | 30,209 | ||||
Property and equipment are stated at cost and depreciated using the straight-line method over their estimated useful lives of 3 to 5 years. When retired or otherwise disposed, the related carrying value and accumulated depreciation are removed from the respective accounts and the net difference less any amount realized from disposition, is reflected in earnings.
Depreciation expense was $17,059 and $10,020 at December 31, 2013 and 2012, respectively.
NOTE 5 – ACCOUNTS PAYABLE AND ACCRUED EXPENSES
Accounts payable and accrued expenses at December 31, 2013 and 2012 consist of the following:
| 2013 | 2012 | |||||||
| Accrued accounting and legal | $ | 300,893 | $ | 120,922 | ||||
| Accrued reimbursements | 17,797 | 44,338 | ||||||
| Accrued consulting | 214,481 | 111,546 | ||||||
| Accrued research and development expenses | 64,670 | 68,120 | ||||||
| Accrued credit card obligations | 20,425 | 21,844 | ||||||
| Accrued payroll | 35,896 | 101,621 | ||||||
| Accrued liquidated damages | 48,668 | - | ||||||
| Accrued office and other | 16,500 | - | ||||||
| Accrued interest | - | 4,491 | ||||||
| Accrued settlement related to arbitration | 100,000 | - | ||||||
| $ | 819,330 | $ | 472,882 | |||||
BIOSIG TECHNOLOGIES INC.
(A development stage company)
DECEMBER 31, 2013
NOTE 6 – NOTES PAYABLE, RELATED PARTY
On December 6, 2012, the Company issued an unsecured promissory note for $30,000 to a company under the control of the Company’s President for previously advanced funds, interest free and due the earlier of (i) the next financing of not less than $300,000; (ii) February 28, 2013 or (iii) occurrence of an event of default, as defined. During year ended December 31, 2013, the Company paid off the promissory note in full.
NOTE 157 – SUBSEQUENT EVENTSCONVERTIBLE BRIDGE NOTES
In 2012, the Company issued an aggregate of $600,000 unsecured Senior Convertible Promissory Notes ($225,000 related party) with interest due at maturity at 8% per annum and may be paid, at the Company’s discretion, in cash or the Company’s common stock. The Notes, together with unpaid accrued interest, if any, is due upon written notice by the majority in interest of the holders on or after February 15, 2014 or (ii) upon the occurrence of an event of default, as defined. The Notes may be prepaid in whole or in part prior to the maturity date at the Company’s discretion.
The Convertible Bridge Notes and any accrued and unpaid interest automatically converts at the earlier of (i) (A) a completion of a transaction whereby the Company merges or consolidates with another company that has its common stock approved for quotation on any domestic national stock exchange and (B) the new entity thereafter issues and sells shares for no less than $3.0 million aggregate gross proceeds or (ii) a qualified IPO. The Convertible Bridge Notes shall convert into the new securities issued at 95% of the purchase price of the Conversion Securities offered to investors.
In connection with the issuance of the Senior Convertible Promissory Notes, the Company issued the right to purchase at any time, on or after the Public Financing Closing Date,(as defined above) hereof until the fifth anniversary of the Public Financing Closing date, the number of fully paid and nonassessable shares (the “Warrant Shares”) of the Company’s common stock equal to the quotient of (a) the Warrant Coverage Amount (as defined below), divided by (b) the applicable Conversion Price of the Notes, at the per share exercise price (the “Exercise Price”), which shall initially be, as of the Public Financing Closing Date, equal to the Initial Exercise Price (as defined below), subject to further adjustments, as defined.
Initial Exercise Price” means one hundred twenty-five percent (125%) of the Conversion Price.
Warrant Coverage Amount” shall be the amount obtained by multiplying (x) the Warrant Coverage Percentageby (y) the principal amount outstanding (and not including any accrued and unpaid interest) of the Note, in connection with which this Warrant is concurrently issued.
“Warrant Coverage Percentage” shall be equal to fifty percent (50%) as defined in the Bridge Loan Agreement.
On February 6, 2013, the Convertible Bridge Notes and the above described contingent warrants previously issued as described above were converted into 600 shares of Series C Convertible Preferred Stock and an aggregate of 287,082 warrants to purchase the Company’s common stock at an exercise price of $2.09 per share for 5 years. On August 7, 2013, the Company issued an aggregate of 8,941 shares of its common stock in settlement of accrued interest of $18,677.
NOTE 8 — REDEEMABLE PREFERRED STOCK
Series A Preferred Stock
In May 2011, the Board of Directors authorized the issuance of up to 200 shares of Series A Preferred Stock (the “Series A preferred stock”).
BIOSIG TECHNOLOGIES INC.
(A development stage company)
DECEMBER 31, 2013
The Series A preferred stock is entitled to preference over holders of junior stock upon liquidation in the amount of $5,000 plus any accrued and unpaid dividends ; entitled to dividends as a preference to holders of junior stock at a rate of 5% per annum of the Stated Value of $5,000 per share, payable quarterly beginning on August 31, 2011 and are cumulative. The holders of Series A preferred stock have no voting rights, however without the affirmative vote of all the holders of then outstanding shares of the Series A preferred stock, the Company cannot, (a) alter or change adversely the powers, preferences or rights given to the Series A preferred stock or alter or amend the Certificate of Designation.
The Series A preferred stock is mandatorily redeemable on December 31, 2014 (as modified) at a price equal to the Stated Value ($5,000) plus an amount equal to all accumulated and unpaid dividends. If the Company fails to redeem at redemption, the unpaid redemption price will accrue at 14% per annum until paid.
The Series A preferred stock is convertible (as amended), automatically, inclusive of any accrued and unpaid dividends, immediately into the Company’s common stock upon the Company becoming subject to the reporting requirements under Section 13 or 15(d) of the Securities and Exchange Act of 1934, as amended at conversion price of $1.84 per share.
On February 6, 2013, in connection with the amendment to the Series A preferred stock defining the conversion feature, the Company reclassified the associated financing costs as a debt discount against the carrying value of the preferred stock.
As of December 31, 2013 and 2012, 184.4 shares of Series A preferred stock were issued and outstanding. As of December 31, 2013 and 2012, the Company has accrued $119,355 and $73,255 dividends payable on the Series A preferred stock.
Series B Preferred Stock
On November 28, 2011, the Board of Directors authorized the issuance of up to 600 shares of Series B Preferred Stock (the “Series B preferred stock”).
The Series B preferred stock is entitled to preference over holders of junior stock upon liquidation in the amount of $5,000 plus any accrued and unpaid dividends; entitled to dividends as a preference to holders of junior stock at a rate of 5% per annum of the Stated Value of $5,000 per share, payable quarterly beginning on December 31, 2011 and are cumulative. The holders of Series B preferred stock have no voting rights, however without the affirmative vote of all the holders of then outstanding shares of the Series B preferred stock, the Company cannot (a) alter or change adversely the powers, preferences or rights given to the Series A preferred stock or alter or amend the Certificate of Designation.
The Series B preferred stock is mandatorily redeemable on December 31, 2014 at a price equal to the Stated Value ($5,000) plus an amount equal to all accumulated and unpaid dividends. If the Company fails to redeem at redemption, the unpaid redemption price will accrue at 14% per annum until paid.
The Series B preferred stock is convertible (as amended), automatically, inclusive of any accrued and unpaid dividends, immediately into the Company’s common stock upon the Company becoming subject to the reporting requirements under Section 13 or 15(d) of the Securities and Exchange Act of 1934, as amended at conversion price of $2.02 per share.
On February 6, 2013, in connection with the amendment to the Series B preferred stock defining the conversion feature, the Company reclassified the associated financing costs as a debt discount against the carrying value of the preferred stock.
As of December 31, 2013 and 2012, 177.5 shares of Series B preferred stock were issued and outstanding. As of December 31, 2013 and 2012, the Company has accrued $88,872 and $44,497 dividends payable on the Series A preferred stock.
NOTE 9 — SERIES C 9% CONVERTIBLE PREFERRED STOCK
On January 9, 2013, the Board of Directors authorized the issuance of up to 3,5004,200 shares of Series C Convertible Preferred Stock (the “Series C Convertible Preferred Stock”).
The Series C convertible preferred stock is entitled to preference over holders of junior stock upon liquidation in the amount of $1,000 plus any accrued and unpaid dividends ; entitled to dividends as a preference to holders of junior stock at a rate of 9% per annum of the Stated Value of $1,000 per share, payable quarterly beginning on September 30, 2013 and are cumulative. The holders of Series C preferred stock have no voting rights, however without the affirmative vote of all the holders of then outstanding shares of the Series C preferred stock, the Company cannot (a) alter or change adversely the powers, preferences or rights given to the Series C preferred stock or alter or amend the Certificate of Designation.
Each share of Series C preferred stock is convertible atautomatically, inclusive of any time ataccrued and unpaid dividends, immediately upon the optionCompany becoming subject to the reporting requirements under Section 13 or 15(d) of the Holder thereof, into that numberSecurities and Exchange Act of shares of Common Stock determined by dividing the Stated Value of such share of Series C preferred stock by the1934, as amended at conversion price $2.30 subject to adjustments.of $2.09, respectively.
BIOSIG TECHNOLOGIES INC.
(A development stage company)
DECEMBER 31, 2013
If, at any time while the Series C preferred stock is outstanding, the Company sells or grants any option to purchase or sells or grants any right to reprice,re-price, or otherwise disposes of or issues any common stock or common stock equivalents entitling any Person to acquire shares of Common Stock at an effective price per share that is lower than the then conversion price (“Base Conversion Price”), then the conversion price shall be reduced to equal the Base Conversion Price. Such adjustment shall be made whenever such Common Stock or Common Stock Equivalents are issued.
The Series C preferred stock contains triggering events which would require redemption at (i) the greater of 120% of the stated value of $1,000 or the product of product of the variable weighted average price of the Company’s common stock on the trading day immediately preceding the date of the triggering event and the stated value divided by then then conversion price or (ii) either (a) redeem each Series C preferred share for a redemption price, in shares of the Company’s common stock, equal to a number of shares equal to the (i) above divided by 75%. The Company determined that certain of the defined triggering events were outside the Company’s control and therefore classified the Series C preferred stock outside of equity.
In connection with the sale of the Series C preferred stock, the Company issued an aggregate of 1,158,850 warrants to purchase the Company’s common stock at $2.61 per share expiring five years from the initial exercise date. The warrant provides if, at any time while the warrant is outstanding, the Company sells or grants any option to purchase or sells or grants any right to re-price, or otherwise disposes of or issues any common stock or common stock equivalents entitling any person to acquire shares of common stock at an effective price per share that is lower than the then conversion price (“base conversion price”), then the conversion price shall be reduced to equal the Base Conversion Price. Such adjustment shall be made whenever such Common Stock or Common Stock Equivalents are issued. In addition, the warrants provides for at any time after the six month anniversary of the initial exercise date, there is no effective registration statement registering, or no current prospectus available for the resale of the warrant shares by the holder, then the warrant may only be exercised, in whole or in part, at such time by means of a “cashless exercise” in which the holder shall be entitled to receive a number of Warrant Shares equal to defined formula.
In accordance with ASC 470-20, the Company recognized an embedded beneficial conversion feature present in the Series C preferred stock when it was issued. The Company allocated the net proceeds between the intrinsic value of the conversion option ($1,303,671) and the warrants ($1,064,739) to additional paid-in capital. The aggregate debt discount, comprised of the relative intrinsic value the conversion option ($1,303,671), relative fair value of the warrants ($1,064,739), and the issuance costs ($412,590); total of $2,781,000, is amortized over one year as interest expense, the date a possible redemption feature, outside of the Company’s control, would be available to the Series C stockholders
The Company valued the warrants in accordance with ASC 470-20 using the Black-Scholes pricing model and the following assumptions: contractual terms of 5 years, an average risk free interest rate of 0.39% to 1.40%, a dividend yield of 0%, and volatility of 123.41% to 125.33%.
During the month of February 2013, the holders of the Convertible Bridge Notes (See Note 7) converted into 600 shares of the Company’s Series C 9% Convertible Preferred Stock.
During the months of February, March, May, and July 2013, the Company sold an aggregate of 2,181 shares of the Company’s Series C 9% Convertible Preferred Stock for net proceeds of $1,814,910.
The Company determined that the anti-dilutive provisions embedded in the Series C 9% Convertible Preferred Stock and related issued warrants did not meet the defined criteria of a derivative in such that the net settlement requirement of delivery of common shares does not meet the “readily convertible to cash” as described in Accounting Standards Codification 815 and therefore bifurcation is not required. There is no established market for the Company’s common stock.
Series C preferred stock issued and outstanding totaled 2,781 as of December 31, 2013. There were no shares issued as of December 31, 2012.
BIOSIG TECHNOLOGIES INC.
(A development stage company)
DECEMBER 31, 20122013
Registration Rights Agreement
The Company entered into a Registration Rights Agreement in connection with the sale and issuance of the Series C preferred stock. The Company is required to file a registration statement registering for resale the (a) the common stock issuable upon conversion in full of the Preferred Stock (assuming on such date the shares of Preferred Stock are converted in full without regard to any conversion limitations therein), (b) all shares of Common Stock issuable as dividends and “Make-Whole Payments” (as defined in the Certificate of Designation) on the Preferred Stock assuming all dividend and Make-Whole Payments are made in shares of Common Stock and the Preferred Stock is held for at least 3 years, (c) all warrant shares then issuable upon exercise of the Warrants (assuming on such date the warrants are exercised in full without regard to any exercise limitations therein), (d) any additional shares of Common Stock issuable in connection with any anti-dilution provisions in the Preferred Stock or the Warrants (in each case, without giving effect to any limitations on conversion set forth in the Certificate of Designation or limitations on exercise set forth in the Warrants) and (e) any securities issued or then issuable upon any stock split,
dividend or other distribution, recapitalization or similar event with respect to the foregoing. The Company is required to file a registration statement and must be declared effective no later than 210 days from the date of termination of the sale the Series C preferred stock.
The Company is required to maintain the effectiveness of the registration statement from its effective date unless all securities registered under the registration statement have been sold or are otherwise able to be sold. If the Company fails to comply with the registration statement effective date requirements, the Company is required to pay the investors a fee equal to 0.25% of the Purchaser’s investment, for each 30-day period of delay, subject to a maximum payment of 3% to each PurchaserPurchaser.
On July 22, 2013, the Company met its required filing requirement however did not meet the effectiveness obligation by November 22, 2013, therefore accrued $34,763 as interest expense in current period operations for possible liquidating damages under the registration rights agreement.
NOTE 10 — STOCKHOLDER EQUITY
There is not a viable market for the Company’s common stock to determine its fair value; therefore, management is required to estimate the fair value to be utilized in the determining stock based compensation costs. In estimating the fair value, management considers recent sales of its common stock to independent qualified investors, placement agents’ assessments of the underlying common shares relating to our sale of preferred stock and validation by independent fair value experts. Considerable management judgment is necessary to estimate the fair value. Accordingly, actual results could vary significantly from management’s estimates.
Preferred stock
The Company is authorized to issue 1,000,000 shares of $0.001 par value preferred stock. As of December 31, 2013 and 2012, the Company has designated and issued 200 and 184.4 shares of Series A preferred stock, respectively, designated and issued 600 and 177.5 shares of Series B preferred stock, respectively. See Note 8.
As of December 31, 2013 and 2012, the Company designated 4,200 and 2,000 shares of Series C 9% convertible preferred stock, respectively; and issued 2,781 and -0- shares of Series C 9% convertible preferred stock. See Note 9.
Common stock
On October 17, 2012, the Company amended its Articles of Incorporation to increase the number of authorized shares of its common stock from 10 million to 50 million shares. As of December 31, 2013 and 2012 the Company has 8,412,101 and 8,166,238 shares of common stock issued and outstanding, respectively.
During the period from February 24, 2009 to December 31, 2009, the Company issued or designated an aggregate of 7,400,000 shares of common stock as payment for services by founders, 4,000,000 and 3,400,000 shares issued during the years ended December 31, 2009 and 2011, respectively ($0.01 per share).
During the year ended December 31, 2011, the Company issued an aggregate of 408,113 shares of common stock for services rendered totaling $326,490 ($0.80 per share).
During the year ended December 31, 2011, the Company issued an aggregate of 175,000 shares of common stock for future services totally $140,000 ($0.80 per share).
During the year ended December 31, 2012, the Company issued an aggregate of 30,000 shares of common stock for future services totally $60,000 ($2.00 per share).
During the year ended December 31, 2013, the Company issued aggregate of 21,412 shares of common stock for services rendered totaling $44,751 ($2.09 per share).
BIOSIG TECHNOLOGIES INC.
(A development stage company)
DECEMBER 31, 2013
During the year ended December 31, 2013, the Company issued aggregate of 122,449 shares of common stock for cash rendered totaling $247,174 ($2.45 per share).
NOTE 11 — OPTIONS AND WARRANTS
There is not a viable market for the Company’s common stock to determine its fair value, therefore management is required to estimate the fair value to be utilized in the determining stock based compensation costs. In estimating the fair value, management considers recent sales of its common stock to independent qualified investors, placement agents’ assessments of the underlying common shares relating to our sale of preferred stock and validation by independent fair value experts. Considerable management judgment is necessary to estimate the fair value. Accordingly, actual results could vary significantly from management’s estimates
On October 19, 2012, the Company’s Board of Directors approved the 2012 Equity Incentive Plan (“the “2012 Plan) and terminated the Long-Term Incentive Plan (the “ 2011 Plan”). The Plan provides for the issuance of options to purchase up to 3,500,000 shares of the Company’s common stock to officers, directors, employees and consultants of the Company. Under the terms of the Plan the Company may issue Incentive Stock Options as defined by the Internal Revenue Code to employees of the Company only and nonstatutory options. The Board of Directors of the Company determines the exercise price, vesting and expiration period of the grants under the Plan. However, the exercise price of an Incentive Stock Option should not be less than 110% of fair value of the common stock at the date of the grant for a 10% or more stockholder and 100% of fair value for a grantee who is not 10% stockholder. The fair value of the common stock is determined based on quoted market price or in absence of such quoted market price, by the Board of Directors in good faith.
Additionally, the vesting period of the grants under the Plan will be determined by the 3, Committee, in its sole discretion and expiration period not more than ten years. The Company reserved 500,000 shares of its common stock for future issuance under the terms of the Plan.
As of December 31, 2013, the Company granted an aggregate of 2,990,977 options to directors and key consultants with an aggregate estimated fair value of $3,380,851.
Employee Options
The following table summarizes the employee options outstanding and the related prices for the shares of the Company's common stock issued at December 31, 2013:
| Options Outstanding | Options Exercisable | |||||||||||||||||||||
| Weighted Average | Weighted | Weighted | ||||||||||||||||||||
| Prices | Outstanding | (Years) | Price | Exercisable | Price | |||||||||||||||||
| $ | 2.00 | 1,273,927 | 5.63 | $ | 2.00 | 250,821 | $ | 2.00 | ||||||||||||||
| 2.09 | 1,218,300 | 6.09 | 2.09 | 1,061,364 | 2.09 | |||||||||||||||||
| 2,492,227 | 6.85 | 2.04 | 1,312,185 | 2.07 | ||||||||||||||||||
Transactions involving stock options issued to employees are summarized as follows:
Number of Shares | Weighted Average Price Per Share | |||||||
| Outstanding at December 31, 2011: | - | $ | - | |||||
| Granted | 1,273,927 | 2.00 | ||||||
| Exercised | - | - | ||||||
| Expired | - | - | ||||||
| Outstanding at December 31, 2012: | 1,273,927 | 2.00 | ||||||
| Granted | 1,218,300 | 2.09 | ||||||
| Exercised | - | - | ||||||
| Expired | - | - | ||||||
| Outstanding at December 31, 2013: | 2,492,227 | $ | 2.04 | |||||
During the year ended December 31, 2012, the Company granted 1,273,927 options to purchase the Company stock in connection with the services rendered at the exercise price of $2.00 per share for a term of seven years with 250,821 options vesting at the first, second and third anniversaries of the grant date. The remainder (521,464 options) vest contingent on the occurrence of certain events, as defined.
BIOSIG TECHNOLOGIES INC.
(A development stage company)
DECEMBER 31, 2013
The fair value of the granted options for the year ended December 31, 2012 was determined using the Black Scholes option pricing model with the following assumptions:
| Dividend yield: | -0- | % | ||
| Volatility | 108.60% to 111.78 | % | ||
| Risk free rate: | 0.97% to 1.14 | % | ||
| Expected life: | 7 years | |||
| Estimated fair value of the Company’s common stock | $2.00 | |||
During the year ended December 31, 2013, the Company granted an aggregate of 1,218,300 options to purchase the Company stock in connection with the services rendered at the exercise price of $2.09 per share for a term of seven years with 283,300 options vesting at ratably over one year and the remainder (935,000 options) vested immediately upon issuance.
The fair value of the granted options for year ended December 31, 2013 was determined using the Black Scholes option pricing model with the following assumptions:
| Dividend yield: | -0- | % | ||
| Volatility | 110.70% to 115.03 % | |||
| Risk free rate: | 1.07% to 1.25 % | |||
| Expected life: | 7 years | |||
| Estimated fair value of the Company’s common stock | $ | 2.09 | ||
The fair value of all employee options vesting during the years ended December 31, 2013 and 2012 of $2,518,785 and $142,032, respectively, was charged to current period operations. Unrecognized compensation expense of $862,066 at December 31, 2013 will be expensed in future periods.
Non-employee Options
The following table summarizes the non-employee options outstanding and the related prices for the shares of the Company's common stock issued at December 31, 2013:
| Options Outstanding | Options Exercisable | |||||||||||||||||||||
| Weighted Average | Weighted | Weighted | ||||||||||||||||||||
| Prices | Outstanding | (Years) | Price | Exercisable | Price | |||||||||||||||||
| $ | 2.00 | 25,000 | 5.73 | $ | 2.00 | 25,000 | $ | 2.00 | ||||||||||||||
| 2.09 | 473,750 | 7.04 | 2.09 | 338,473 | 2.09 | |||||||||||||||||
| 498,750 | 6.97 | 2.09 | 363,473 | 2.08 | ||||||||||||||||||
Transactions involving stock options issued to non- employees are summarized as follows:
Number of Shares | Weighted Average Price Per Share | |||||||
| Outstanding at December 31, 2011: | - | $ | - | |||||
| Granted | 25,000 | 2.00 | ||||||
| Exercised | - | - | ||||||
| Expired | - | - | ||||||
| Outstanding at December 31, 2012: | 25,000 | 2.00 | ||||||
| Granted | 473,750 | 2.09 | ||||||
| Exercised | - | - | ||||||
| Expired | - | - | ||||||
| Outstanding at December 31, 2013: | 498,750 | $ | 2.09 | |||||
During the year ended December 31, 2012, the Company granted 25,000 options to purchase the Company stock in connection with the services rendered at the exercise price of $2.00 per share for a term of seven years vesting immediately.
The fair value of the granted options of $43,291 for the year ended December 31, 2012 was determined using the Black Scholes option pricing model with the following assumptions:
| Dividend yield: | -0- | % | ||
| Volatility | 111.78 | % | ||
| Risk free rate: | 0.97 | % | ||
| Expected term: | 7 years | |||
| Estimated fair value of the Company’s common stock | $ | 2.00 | ||
BIOSIG TECHNOLOGIES INC.
(A development stage company)
DECEMBER 31, 2013
During the year ended December 31, 2013, the Company granted an aggregate of 473,750 options to purchase the Company stock in connection with the services rendered at the exercise price of $2.09 per share for a term of seven years (30,000) to ten years (443,750), vesting immediately for 160,000 options, 30,000 vesting 1/9 per month on each month anniversary and with the remainder vesting at 48,611 per first three month anniversary with remainder vesting at 1/24 per month.
The fair value of the vesting options of $728,401 for the year ended December 31, 2013 was determined using the Black Scholes option pricing model with the following assumptions:
| Dividend yield: | -0- | % | ||
| Volatility | 110.18% to 121.59 % | |||
| Risk free rate: | 1.23% to 3.04 % | |||
| Expected term: | 7 to 10 years | |||
| Estimated fair value of the Company’s common stock | $ | 2.09 | ||
Warrants
The following table summarizes warrants outstanding and the related prices for the shares of the Company's common stock issued at December 31, 2013:
| Warrants Outstanding | Warrants Exercisable | |||||||||||||||||||||
| Weighted Average | Weighted | Weighted | ||||||||||||||||||||
| Prices | Outstanding | (Years) | Price | Exercisable | Price | |||||||||||||||||
| $ | 0.001 | 383,320 | 6.02 | $ | 0.001 | 383,320 | $ | 0.001 | ||||||||||||||
| 1.84 | 35,076 | 6.05 | 1.84 | 35,076 | 1.84 | |||||||||||||||||
| 2.02 | 30,755 | 6.05 | 2.02 | 30,755 | 2.02 | |||||||||||||||||
| 2.61 | 2,138,800 | 4.36 | 2.61 | 2,138,800 | 2.61 | |||||||||||||||||
| 3.67 | 129,307 | 5.00 | 3.67 | 129,307 | 3.67 | |||||||||||||||||
| 2,717,258 | 4.66 | 2.23 | 2,717,258 | 2.28 | ||||||||||||||||||
Transactions involving warrants issued are summarized as follows:
Number of Shares | Weighted Average Price Per Share | |||||||
| Outstanding at December 31, 2011: | - | $ | - | |||||
| Granted | - | - | ||||||
| Exercised | - | - | ||||||
| Expired | - | - | ||||||
| Outstanding at December 31, 2012: | - | - | ||||||
| Granted | 2,717,258 | 2.28 | ||||||
| Exercised | - | - | ||||||
| Expired | - | - | ||||||
| Outstanding at December 31, 2013: | 2,717,258 | $ | 2.28 | |||||
On January 7, 2013, the Company issued 383,320 warrants to purchase the Company’s commonCompany stock in connection with the services rendered at the exercise price of $0.001 per share for fivea term of seven years for future services. In addition, the Company issued 35,076 and 30,755 warrants to purchase the Company’s common stock at $1.84 and $2.02 per share, respectively, for five years in settlement of placement agent liability relating to the sale of the Series A and Series B preferred stock. The Company accrued an estimated fair value of $94,500 included in the December 31, 2012 financial statements.exercisable immediately.
| Dividend yield: | -0- | % | ||
| Volatility | 114.99 | % | ||
| Risk free rate: | 1.31 | % | ||
| Expected life: | 7 years | |||
| Estimated fair value of the Company’s common stock | $ | 2.09 | ||
The fair value of $800,823 was charged to current period operations.
| (a development stage company) | ||||||||
| CONDENSED BALANCE SHEETS | ||||||||
| September 30, | December 31, | |||||||
| 2013 | 2012 | |||||||
| (unaudited) | ||||||||
| ASSETS | ||||||||
| Current assets: | ||||||||
| Cash | $ | 65,481 | $ | 24,237 | ||||
| Prepaid expenses | 20,000 | 33,125 | ||||||
| Capitalized financing costs | - | 212,635 | ||||||
| Total current assets | 85,481 | 269,997 | ||||||
| Property and equipment, net | 29,501 | 30,209 | ||||||
| Other assets: | ||||||||
| Deposits | 25,000 | 25,000 | ||||||
| Total assets | $ | 139,982 | $ | 325,206 | ||||
| LIABILITIES AND STOCKHOLDERS' DEFICIT | ||||||||
| Current liabilities: | ||||||||
| Accounts payable and accrued expenses | $ | 302,501 | $ | 472,882 | ||||
| Advances, related party | 10,500 | 27,040 | ||||||
| Note payable, related party | - | 30,000 | ||||||
| Liability to placement agent | - | 94,500 | ||||||
| Dividends payable | 329,076 | 117,751 | ||||||
| Total current liabilities | 642,078 | 742,173 | ||||||
| Long term liabilities: | ||||||||
| Deferred rent payable | 5,067 | 5,067 | ||||||
| Note payable, related party | 218,000 | 218,000 | ||||||
| Convertible bridge notes payable, $229,359 related party | - | 613,812 | ||||||
| Redeemable Series A Preferred Stock, liquidation preference of $922,000, net of debt discount of $47,764 | 874,236 | 922,000 | ||||||
| Redeemable Series B Preferred Stock, liquidation preference of $887,500, net of debt discount of $91,602 | 795,898 | 887,500 | ||||||
| Total long term liabilities | 1,893,201 | 2,646,379 | ||||||
| Total liabilities | 2,535,279 | 3,388,552 | ||||||
| Series C 9% Convertible Preferred stock, liquidation preference of $2,781,000, net of debt discount of $1,184,858 | 1,596,142 | - | ||||||
| Stockholders' deficit | ||||||||
| Preferred stock, $0.001 par value, authorized 1,000,000 shares, designated 200 shares of Series A, 600 shares of Series B and 4,200 shares of Series C Preferred Stock | ||||||||
| Common stock, $0.001 par value, authorized 50,000,000 shares, 8,196,591 and 8,166,238 issued and outstanding as of September 30, 2013 and December 31, 2012, respectively | 8,197 | 8,166 | ||||||
| Additional paid in capital | 8,260,999 | 833,647 | ||||||
| Deficit accumulated during development stage | (12,260,634 | ) | (3,905,159 | ) | ||||
| Total stockholders' deficit | (3,991,438 | ) | (3,063,346 | ) | ||||
| Total liabilities and stockholders' deficit | $ | 139,982 | $ | 325,206 | ||||
| See the accompanying notes to the unaudited condensed financial statements | ||||||||
BIOSIG TECHNOLOGIES, INC. | ||||||||||||||||||||
| (a development stage company) | ||||||||||||||||||||
| CONDENSED STATEMENTS OF OPERATIONS | ||||||||||||||||||||
| (unaudited) | ||||||||||||||||||||
| From February 24, | ||||||||||||||||||||
| 2009 (date of | ||||||||||||||||||||
| Three months ended | Nine months ended | inception) to | ||||||||||||||||||
| September 30, | September 30, | September 30, | ||||||||||||||||||
| 2013 | 2012 | 2013 | 2012 | 2013 | ||||||||||||||||
| Operating expenses: | ||||||||||||||||||||
| Research and development | $ | 289,964 | $ | 290,892 | $ | 774,810 | $ | 815,273 | $ | 2,246,283 | ||||||||||
| General and administrative | 509,285 | 342,496 | 4,570,716 | 640,053 | 6,667,906 | |||||||||||||||
| Depreciation | 4,473 | 3,386 | 12,424 | 9,077 | 29,239 | |||||||||||||||
| Total operating expenses | 803,722 | 636,774 | 5,357,950 | 1,464,403 | 8,943,428 | |||||||||||||||
| Net loss from operations | (803,722 | ) | (636,774 | ) | (5,357,950 | ) | (1,464,403 | ) | (8,943,428 | ) | ||||||||||
| Other income (expense): | ||||||||||||||||||||
| Interest income (expense) | (69 | ) | 3 | (20,604 | ) | 17 | (38,719 | ) | ||||||||||||
| Financing costs | (1,790,533 | ) | (26,471 | ) | (2,765,599 | ) | (79,411 | ) | (2,949,413 | ) | ||||||||||
| Net loss before income taxes | (2,594,324 | ) | (663,242 | ) | (8,144,152 | ) | (1,543,797 | ) | (11,931,559 | ) | ||||||||||
| Income taxes (benefit) | - | - | - | - | - | |||||||||||||||
| Net loss | (2,594,324 | ) | (663,242 | ) | (8,144,152 | ) | (1,543,797 | ) | (11,931,559 | ) | ||||||||||
| Preferred stock dividend | (84,563 | ) | (22,805 | ) | (211,323 | ) | (68,055 | ) | (329,075 | ) | ||||||||||
| NET LOSS AVAILABLE TO COMMON STOCKHOLDERS | $ | (2,678,887 | ) | $ | (686,047 | ) | $ | (8,355,475 | ) | $ | (1,611,852 | ) | $ | (12,260,634 | ) | |||||
| Net loss per common share, basic and diluted | $ | (0.33 | ) | $ | (0.08 | ) | $ | (1.02 | ) | $ | (0.20 | ) | ||||||||
| Weighted average number of common shares outstanding, basic and diluted | 8,192,898 | 8,144,553 | 8,184,634 | 8,139,030 | ||||||||||||||||
| See the accompanying notes to the unaudited condensed financial statements | ||||||||||||||||||||
BIOSIG TECHNOLOGIES INC.
(A development stage company)
DECEMBER 31, 2013
On January 13, 2013, the Company issued an aggregate of 65,831 warrants to purchase the Company stock in connection with the placement services at the exercise prices of $1.84 (35,076 warrants) and $2.02 (30,775 warrants) per share for a term of five years exercisable immediately.
The fair value of the issued warrants were determined using the Black Scholes option pricing model with the following assumptions:
| Dividend yield: | -0- | % | ||
| Volatility | 123.30 | % | ||
| Risk free rate: | 0.72 | % | ||
| Expected life: | 5 years | |||
| Estimated fair value of the Company’s common stock | $ | 2.09 | ||
The fair value of $115,854 was charged to operations ratably as financing costs through December 31, 2014.
During the year ended December 31, 2013, the Company issued an aggregate of 1,516,386 warrants to purchase the Company stock in connection with the sale of the Series C 9% Convertible Preferred Stock at the exercise price of $2.61 per share for a term of five years exercisable immediately.
During the months of July and September, 2013, the Company issued an aggregate of 622,414 warrants to purchase the Company’s stock to holders of Series C preferred stock as an inducement to amend and waive certain defined provisions of the Series C preferred stock.
The fair value of the issued warrants were determined using the Black Scholes option pricing model with the following assumptions:
| Dividend yield: | -0- | % | ||
| Volatility | 125.33 | % | ||
| Risk free rate: | 1.40 | % | ||
| Expected life: | 5 years | |||
| Estimated fair value of the Company’s common stock | $ | 2.09 | ||
The fair value of $1,074,833 was charged to current period operations
On December 31, 2013, the Company issued an aggregate of 129,307 warrants to purchase the Company’s common stock at $3.67 per share for five years in connection with the sale of the Company’s common stock.
The risk-free interest rate assumption is based upon observed interest rates on zero coupon U.S. Treasury bonds whose maturity period is appropriate for the term. Estimated volatility is a measure of the amount by which the Company's stock price is expected to fluctuate each year during the term of the award. The Company's estimated volatility is an average of the historical volatility of the stock prices of its peer entities whose stock prices were publicly available. The Company's calculation of estimated volatility is based on historical stock prices over a period equal to the term of the awards. The Company used the historical volatility of peer entities due to the lack of sufficient historical data of its stock price.
NOTE 12 - LOSS PER SHARE
The following table presents the computation of basic and diluted loss per share for the years ended December 31, 2013 and 2012:
| 2013 | 2012 | |||||||
| Net loss available to Common stockholders | $ | (10,101,846 | ) | $ | (2,477,002 | ) | ||
| Basic and diluted earnings (loss) per share | $ | (1.23 | ) | $ | (0.30 | ) | ||
| Weighted average common shares outstanding | 8,187.648 | 8,142,222 | ||||||
NOTE 13 - FAIR VALUE OF FINANCIAL INSTRUMENTS
The Company follows the provisions of ASC 825-10. For financial assets and liabilities included within the scope of ASC 825-10, the Company was required to adopt the provisions of ASC 825-10 prospectively as of the beginning of Fiscal 2009. The adoption of ASC 825-10 did not have a material impact on our consolidated financial position or results of operations.
There were no items required to be measured at fair value on a recurring basis in the consolidated financial statements as of December 31, 2013 and 2012.
BIOSIG TECHNOLOGIES, INC. | ||||||||||||||||||||
| (a development stage company) | ||||||||||||||||||||
| STATEMENT OF STOCKHOLDERS' DEFICIT | ||||||||||||||||||||
| FROM JANUARY 1, 2013 TO SEPTEMBER 30, 2013 | ||||||||||||||||||||
| (unaudited) | ||||||||||||||||||||
| Deficit | ||||||||||||||||||||
| Accumulated | ||||||||||||||||||||
| Additional | During | |||||||||||||||||||
| Common stock | Paid in | Development | ||||||||||||||||||
| Shares | Amount | Capital | Stage | Total | ||||||||||||||||
| Balance, December 31, 2012 | 8,166,238 | $ | 8,166 | $ | 833,647 | $ | (3,905,159 | ) | $ | (3,063,346 | ) | |||||||||
| Common stock issued for services rendered | 21,412 | 22 | 44,729 | - | 44,751 | |||||||||||||||
| Common stock issued as payment for accrued interest to note holders at $2.09 per share | 8,941 | 9 | 18,668 | - | 18,677 | |||||||||||||||
| Beneficial conversion feature in connection with note payable | - | - | 20,000 | - | 20,000 | |||||||||||||||
| Beneficial conversion feature and warrants issued in connection with the Series C Preferred Stock | - | - | 2,404,830 | - | 2,404,830 | |||||||||||||||
| Fair value of warrants issued to Series C investors for certificate of designation amendment | - | - | 1,074,833 | - | 1,074,833 | |||||||||||||||
| Fair value of warrants issued for services | - | - | 916,677 | - | 916,677 | |||||||||||||||
| Fair value of vested options | - | - | 2,947,615 | - | 2,947,615 | |||||||||||||||
| Preferred stock dividend | - | - | - | (211,323 | ) | (211,323 | ) | |||||||||||||
| Net loss | - | - | - | (8,144,152 | ) | (8,144,152 | ) | |||||||||||||
| Balance, September 30, 2013 | 8,196,591 | $ | 8,197 | $ | 8,260,999 | $ | (12,260,634 | ) | $ | (3,991,438 | ) | |||||||||
| See the accompanying notes to the unaudited condensed financial statements | ||||||||||||||||||||
BIOSIG TECHNOLOGIES INC.
(A development stage company)
NOTES TO THE FINANCIAL STATEMENTS
DECEMBER 31, 2013
BIOSIG TECHNOLOGIES, INC. | ||||||||||||
| (a development stage company) | ||||||||||||
| CONDENSED STATEMENTS OF CASH FLOWS | ||||||||||||
| (unaudited) | ||||||||||||
| From February 24, | ||||||||||||
| 2009 (date of | ||||||||||||
| Nine months ended | inception) to | |||||||||||
| September 30, | September 30, | |||||||||||
| 2013 | 2012 | 2013 | ||||||||||
| CASH FLOWS FROM OPERATING ACTIVITIES: | ||||||||||||
| Net loss attributable to common stockholders | $ | (8,144,152 | ) | $ | (1,543,797 | ) | $ | (11,931,559 | ) | |||
| Adjustments to reconcile net loss to cash used in operating activities: | ||||||||||||
| Depreciation | 12,424 | 9,077 | 29,239 | |||||||||
| Amortization of debt discount | 1,710,766 | 79,411 | 1,894,580 | |||||||||
| Stock based compensation | 3,005,491 | 150,152 | 3,711,579 | |||||||||
| Fair value of warrants issued in connection with Series C preferred stock modification | 1,074,833 | - | 1,074,833 | |||||||||
| Fair value of warrants issued for services | 837,243 | - | 837,243 | |||||||||
| Donated capital | - | - | 100 | |||||||||
| Changes in operating assets and liabilities: | ||||||||||||
| Prepaid expenses | - | - | (20,000 | ) | ||||||||
| Accounts payable | (165,515 | ) | 121,996 | 321,179 | ||||||||
| Deferred rent payable | - | - | 5,067 | |||||||||
| Net cash used in operating activities | (1,668,910 | ) | (1,183,161 | ) | (4,077,739 | ) | ||||||
| CASH FLOWS FROM INVESTING ACTIVITIES: | ||||||||||||
| Purchase of property and equipment | (11,716 | ) | (12,179 | ) | (58,740 | ) | ||||||
| Payment of long term deposit | - | - | (25,000 | ) | ||||||||
| Net cash used in investing activity | (11,716 | ) | (12,179 | ) | (83,740 | ) | ||||||
| CASH FLOWS FROM FINANCING ACTIVITIES: | ||||||||||||
| Proceeds from notes payable, related party | - | - | 275,040 | |||||||||
| Proceeds from convertible bridge notes payable | - | 330,000 | 600,000 | |||||||||
| Net proceeds from the sale of Series A preferred stock | - | - | 788,400 | |||||||||
| Net proceeds from the sale of Series B preferred stock | - | 647,650 | 719,150 | |||||||||
| Net proceeds from the sale of Series C preferred stock and warrants | 1,768,410 | 1,768,410 | ||||||||||
| Proceeds from sale of common stock | - | - | 122,500 | |||||||||
| Payments of related party notes | (30,000 | ) | - | (30,000 | ) | |||||||
| Payments of related party advances | (16,540 | ) | 160,500 | (16,540 | ) | |||||||
| Net cash provided by financing activities | 1,721,870 | 1,138,150 | 4,226,960 | |||||||||
| Net (decrease) increase in cash and cash equivalents | 41,244 | (57,190 | ) | 65,481 | ||||||||
| Cash and cash equivalents, beginning of the period | 24,237 | 69,020 | - | |||||||||
| Cash and cash equivalents, end of the period | $ | 65,481 | $ | 11,830 | $ | 65,481 | ||||||
| Supplemental disclosures of cash flow information: | ||||||||||||
| Cash paid during the period for interest | $ | - | $ | - | $ | - | ||||||
| Cash paid during the period for income taxes | $ | - | $ | - | $ | - | ||||||
| Non cash investing and financing activities: | ||||||||||||
| Common stock issued in settlement of accrued interest | $ | 18,677 | $ | - | $ | 18,677 | ||||||
| Convertible bridge notes payable exchanged for preferred shares | $ | 600,000 | $ | - | $ | 600,000 | ||||||
| See the accompanying notes to the unaudited condensed financial statements | ||||||||||||
In addition, the Company leases parking in aggregate of approximately $700 per month, on a month to month basis.
Litigation
Drachman vs. BioSig Technologies, Inc., (AAA Case No. 14 166 0001814). Mr. Drachman has asserted claims in aggregate of $612,000 plus 12 months health and dental coverage and 10% of the significant accounting policies applied in the preparation of the accompanying financial statements follows.
The Company is devoting substantially allsubject at times to other legal proceedings and claims, which arise in the ordinary course of its efforts to establishing a new business, and while planned principal operations have commenced, there has been no revenue generated from sales, license feesbusiness. Although occasional adverse decisions or royalties,settlements may occur, the Company is consideredbelieves that the final disposition of such matters should not have a development stage enterprise. Accordingly, the Company'smaterial adverse effect on its financial statements are presented in accordance with authoritative accounting guidance related to a development stage enterprise. Financial position, results of operations and cash flowsor liquidity. There was no outstanding litigation as of a development stage enterprise are presented in conformity with generally accepted accounting principles that apply to established operating enterprises.December 31, 2012.
Fair Value of Financial Instruments
The Company’s short-term financial instruments, including cash, prepaid expenses and other assets, accounts payable and accrued expenses and other liabilities, consist primarily of instruments without extended maturities, the fair value of which, based on management’s estimates, reasonably approximate their book value. The fair value of the Company’s convertible securities is based on management estimates and reasonably approximates their book value.
Property and Equipment
Property and equipment are stated at cost and depreciated using the straight-line method over their estimated useful lives of 3 to 5 years. When retired or otherwise disposed, the related carrying value and accumulated depreciation are removed from the respective accounts and the net difference less any amount realized from disposition, is reflected in earnings.
Long-Lived Assets
The Company follows Accounting Standards Codification 360-10-15-3, “Impairment or Disposal of Long-lived Assets,” which established a “primary asset” approach to determine the cash flow estimation period for a group of assets and liabilities that represents the unit of accounting for a long-lived asset to be held and used. Long-lived assets to be held and used are reviewed for impairment whenever events or changes in circumstances indicate that the carrying amount of an asset may not be recoverable. The carrying amount of a long-lived asset is not recoverable if it exceeds the sum of the undiscounted cash flows expected to result from the use and eventual disposition of the asset. Long-lived assets to be disposed of are reported at the lower of carrying amount or fair value less cost to sell.
Net Income (loss) Per Common Share
The Company computes earnings (loss) per share under Accounting Standards Codification subtopic 260-10, Earnings Per Share (“ASC 260-10”). Net loss per common share is computed by dividing net loss by the weighted average number of shares of common stock outstanding during the year. Diluted earnings per share, if presented, would include the dilution that would occur upon the exercise or conversion of all potentially dilutive securities into common stock using the “treasury stock” and/or “if converted” methods as applicable.
The computation of basic and diluted loss per share as of December 31, 2013 and 2012 excludes potentially dilutive securities when their inclusion would be anti-dilutive, or if their exercise prices were greater than the average market price of the common stock during the period.
Potentially dilutive securities excluded from the computation of basic and diluted net income (loss) per share are as follows:
| 2013 | 2012 | |||||||
| Series A convertible preferred stock | 501,089 | |||||||
| Series B convertible preferred stock | 451,726 | |||||||
| Series C convertible preferred stock | 1,330,627 | |||||||
| Options to purchase common stock | 2,990,977 | 1,298,927 | ||||||
| Warrants to purchase common stock | 2,717,258 | - | ||||||
| Totals | 7,991,677 | 1,298,927 | ||||||
Research and development costs
The Company accounts for research and development costs in accordance with the Accounting Standards Codification subtopic 730-10, Research and Development (“ASC 730-10”). Under ASC 730-10, all research and development costs must be charged to expense as incurred. Accordingly, internal research and development costs are expensed as incurred. Third-party research and developments costs are expensed when the contracted work has been performed or as milestone results have been achieved. Company-sponsored research and development costs related to both present and future products are expensed in the period incurred. The Company incurred research and development expenses of $289,964$992,207 and $774,810$888,948 for the threeyear ended December 31, 2013 and nine months ended September 30, 2013, respectively; $290,892 and $815,273 for the three and nine months ended September 30, 2012, respectively; and $2,246,283$2,463,680 from the period from February 24, 2009 (date of inception) to September 30,December 31, 2013.
BIOSIG TECHNOLOGIES INC.
(A development stage company)
DECEMBER 31, 2013
Income taxesTaxes
The Company follows Accounting Standards Codification subtopic 740-10, Income Taxes (“ASC 740-10”) for recording the provision for income taxes. Deferred tax provisions or benefits for interim periodsassets and liabilities are computed based upon the difference between the financial statement and income tax basis of assets and liabilities using the enacted marginal tax rate applicable when the related asset or liability is expected to be realized or settled. Deferred income tax expenses or benefits are based on the Company’s estimated annual effective tax rate. Based onchanges in the Company's historical losses and its expectation of continuation of losses for the foreseeable future, the Company has determinedasset or liability during each period. If available evidence suggests that it is more likely than not that some portion or all of the deferred tax assets will not be realized, and, accordingly, has provided a full valuation allowance. Asallowance is required to reduce the Company anticipates or anticipated that its net deferred tax assets at December 31, 2013 and 2012 wouldto the amount that is more likely than not to be fully offset by arealized. Future changes in such valuation allowance there is no federalare included in the provision for deferred income taxes in the period of change. Deferred income taxes may arise from temporary differences resulting from income and expense items reported for financial accounting and tax purposes in different periods. Deferred taxes are classified as current or state income tax benefit fornon-current, depending on the classification of assets and liabilities to which they relate. Deferred taxes arising from temporary differences that are not related to an asset or liability are classified as current or non-current depending on the periods ended June 30, 2013in which the temporary differences are expected to reverse and 2012 related to losses incurred during such periods.are considered immaterial.
Stock Based Compensation
The Company measures the cost of services received in exchange for an award of equity instruments based on the fair value of the award. For employees and directors, the fair value of the award is measured on the grant date and for non-employees, the fair value of the award is generally re-measured on vesting dates and interim financial reporting dates until the service period is complete. The fair value amount is then recognized over the period during which services are required to be provided in exchange for the award, usually the vesting period.
As of September 30,December 31, 2013, the Company had 2,492,227 and 498,750 employee and non-employee options outstanding to purchase shares of common stock, respectively. In addition at September 30, 2013,
As of December 31, 2012, the Company had 1,756,1231,273,927 and 25,000 employee restrictedand non-employee options outstanding to purchase shares of common stock, units outstandingrespectively.
Registration Rights
The Company accounts for registration rights agreements in accordance with the Accounting Standards Codification subtopic 825-20, Registration Payment Arraignments (“ASC 825-20”). Under ASC 825-20, the Company is required to disclose the nature and terms of the arraignment, the maximum potential amount and to assess each reporting period the probable liability under these arraignments and, if exists, to record or adjust the liability to current period operations. On September 30,December 31, 2013, the Company determined that any possible payments under its registration rights agreement was not probable and therefore no accrualaccrued $48,668 as interest expense in current period operations for possible liability was recorded.under the registration rights agreements.
Recent Accounting Pronouncements
There are various updates recently issued, most of which represented technical corrections to the accounting literature or application to specific industries and are not expected to a have a material impact on the Company's financial position, results of operations or cash flows.
NOTE 2 – GOING CONCERN MATTERS
The accompanying financial statements have been prepared on a going concern basis, which contemplates the realization of assets and the satisfaction of liabilities in the normal course of business. As shown in the accompanying financial statements during the years ended December 31, 2013 and 2012, the Company incurred net losses attributable to common stockholders of $10,101,846 and $2,477,002, respectively and used $1,762,459 in cash for operating activities for the year ended December 31, 2013. These factors among others raise substantial doubt about the Company’s ability to continue as a going concern for a reasonable period of time.
The Company's existence is dependent upon management's ability to develop profitable operations. The Company completed financing subsequent to the date of these financial statements (See Note 15). However additional capital will be needed to continue developing its products and services and there can be no assurance that the Company's efforts will be successful. There is no assurance that can be given that management's actions will result in profitable operations or the resolution of its liquidity problems. The accompanying statements do not include any adjustments that might result should the Company be unable to continue as a going concern.
BIOSIG TECHNOLOGIES INC.
(A development stage company)
DECEMBER 31, 2013
NOTE 23 – RELATED PARTY TRANSACTIONS
The Company’s President and shareholders have advanced funds to the Company for working capital purposes since the Company’s inception in February 2009. No formal repayment terms or arrangements exist and the Company is not accruing interest on these advances. The net amount outstanding at September 30,December 31, 2013 and December 31, 2012 was $10,500$30,781 and $27,040, respectively.
Accrued interest and expenses due related parties as of September 30,December 31, 2013 and December 31, 2012 was $393$123,089 and $54,184, respectively.
During 2013, in connection with the amendments of the Series C 9% Convertible Preferred stock, the Company issued to Company’s president and a Director of the Company (Series C holders) an aggregate of 53,830 warrants to purchase the Company’s common stock at $2.61 per share for five years. See Note 9 below.
During 2012, the Company issued promissory notes for funding provided by the Company’s president or a company under his control in the aggregate of $248,000,$248,000. During 2013, $30,000 was paid off with the remaining $218,000 converted to 93,061 shares of which $218,000 was outstanding as of September 30, 2013the Company’s common stock and December 31, 2012.46,531 warrants to purchase the Company’s common stock at $3.67 per share for five years. See Note 6 below.
During 2012, the Company issued convertible bridge notes for funding provided by the Company’s president and a Director of the Company for an aggregate of $225,000. On January 13, 2013, the convertible bridge notes were converted into 225 shares of the Company’s Series C preferred stock and 107,656 warrants to purchase the Company’s common stock at $2.09 per share for five years. See Note 7 below.
During 2011, the Company issued an aggregate of 3,400,000 shares of its common stock at par value in connection with services provided by founders.
The Company has informal compensation and consulting agreements with employees and outside contractors, certain of whom are also Company stockholders. The Agreements are generally month to month. As of September 30,December 31, 2013 and December 31, 2012, total due under these agreements and related expenses were $0 and $43,630, respectively.
On December 10, 2010, the Company entered into a two year consulting agreement with one of the Company's directors for certain services with compensation totaling 43,750 shares of the Company's common stock valued at $35,000
NOTE 34 – PROPERTY AND EQUIPMENT
Property and equipment as of September 30,December 31, 2013 and December 31, 2012 is summarized as follows:
| September 30, 2013 | December 31, 2012 | 2013 | 2012 | |||||||||||||
| Computer equipment | $ | 50,937 | $ | 39,221 | $ | 50,937 | $ | 39,221 | ||||||||
| Furniture and fixtures | 7,803 | 7,803 | 7,803 | 7,803 | ||||||||||||
| Subtotal | 58,740 | 47,024 | 58,740 | 47,024 | ||||||||||||
| Less accumulated depreciation | (29,239 | ) | (16,815 | ) | (33,874 | ) | (16,815 | ) | ||||||||
| Property and equipment, net | $ | 29,501 | $ | 30,209 | $ | 24,866 | $ | 30,209 | ||||||||
Property and equipment are stated at cost and depreciated using the straight-line method over their estimated useful lives of 3 to 5 years. When retired or otherwise disposed, the related carrying value and accumulated depreciation are removed from the respective accounts and the net difference less any amount realized from disposition, is reflected in earnings.
Depreciation expense was $17,059 and $10,020 at December 31, 2013 and 2012, respectively.
NOTE 45 – ACCOUNTS PAYABLE AND ACCRUED EXPENSES
Accounts payable and accrued expenses at December 31, 2013 and 2012 consist of the following:
| 2013 | 2012 | |||||||
| Accrued accounting and legal | $ | 300,893 | $ | 120,922 | ||||
| Accrued reimbursements | 17,797 | 44,338 | ||||||
| Accrued consulting | 214,481 | 111,546 | ||||||
| Accrued research and development expenses | 64,670 | 68,120 | ||||||
| Accrued credit card obligations | 20,425 | 21,844 | ||||||
| Accrued payroll | 35,896 | 101,621 | ||||||
| Accrued liquidated damages | 48,668 | - | ||||||
| Accrued office and other | 16,500 | - | ||||||
| Accrued interest | - | 4,491 | ||||||
| Accrued settlement related to arbitration | 100,000 | - | ||||||
| $ | 819,330 | $ | 472,882 | |||||
BIOSIG TECHNOLOGIES INC.
(A development stage company)
DECEMBER 31, 2013
NOTE 6 – NOTES PAYABLE, RELATED PARTY
On November 21, 2012, the Company issued an unsecured promissory note for $218,000 to the Company’s President for previously advanced funds with interest payable annually, in arrears, on each anniversary at the short term “Applicable Federal Rate” within the meaning of Section 1274(d) of the Internal Revenue Code of 1986, as amended adjusted each anniversary date. The promissory note matures November 21, 2021 and may be prepaid, without premium or penalty, at any time. In connection with the issuance of the unsecured promissory note, the Company’s President agreed not to receive payments (by voluntary prepayment, acceleration, set-off or otherwise) associated with the unsecured promissory note absent the prior written consent of the purchasers holding at least 67% interest of the preferred stock outstanding, which purchasers must include Alpha Capital Anstalt so long as Alpha Capital Anstalt holds not less than $100,000 of preferred stock. On December 31, 2013, the Company converted the promissory note and accrued interest to 93,061 shares of the Company’s common stock and 46,531 warrants to purchase the Company’s common stock at $3.67 per share for five years.
On December 6, 2012, the Company issued an unsecured promissory note for $30,000 to a company under the control of the Company’s President for previously advanced funds, interest free and due the earlier of (i) the next financing of not less than $300,000; (ii) February 28, 2013 or (iii) occurrence of an event of default, as defined. During the nine monthsyear ended September 30,December 31, 2013, the Company paid off the promissory note in full.
NOTE 57 – CONVERTIBLE BRIDGE NOTES
In 2012, the Company issued an aggregate of $600,000 unsecured Senior Convertible Promissory Notes ($225,000 related party) with interest due at maturity at 8% per annum and may be paid, at the Company’s discretion, in cash or the Company’s common stock. The Notes, together with unpaid accrued interest, if any, is due upon written notice by the majority in interest of the holders on or after February 15, 2014 or (ii) upon the occurrence of an event of default, as defined. The Notes may be prepaid in whole or in part prior to the maturity date at the Company’s discretion.
The Convertible Bridge Notes and any accrued and unpaid interest automatically converts at the earlier of (i) (A) a completion of a transaction whereby the Company merges or consolidates with another company that has its common stock approved for quotation on any domestic national stock exchange and (B) the new entity thereafter issues and sells shares for no less than $3.0 million aggregate gross proceeds or (ii) a qualified IPO. The Convertible Bridge Notes shall convert into the new securities issued at 95% of the purchase price of the Conversion Securities offered to investors.
In connection with the issuance of the Senior Convertible Promissory Notes, the Company issued the right to purchase at any time, on or after the Public Financing Closing Date,(as defined above) hereof until the fifth anniversary of the Public Financing Closing date, the number of fully paid and nonassessable shares (the “Warrant Shares”) of the Company’s common stock equal to the quotient of (a) the Warrant Coverage Amount (as defined below), divided by (b) the applicable Conversion Price of the Notes, at the per share exercise price (the “Exercise Price”), which shall initially be, as of the Public Financing Closing Date, equal to the Initial Exercise Price (as defined below), subject to further adjustments, as defined.
Initial Exercise Price” means one hundred twenty-five percent (125%) of the Conversion Price.
Warrant Coverage Amount” shall be the amount obtained by multiplying (x) the Warrant Coverage Percentage by (y) the principal amount outstanding (and not including any accrued and unpaid interest) of the Note, in connection with which this Warrant is concurrently issued.
“Warrant Coverage Percentage” shall be equal to fifty percent (50%) as defined in the Bridge Loan Agreement.
On February 6, 2013, the Convertible Bridge Notes and the above described contingent warrants previously issued as described above were converted into 600 shares of Series C Convertible Preferred Stock and an aggregate of 287,082 warrants to purchase the Company’s common stock at an exercise price of $2.09 per share for 5 years. On August 7, 2013, the Company issued an aggregate of 8,941 shares of its common stock in settlement of accrued interest of $18,677.
NOTE 6 –8 — REDEEMABLE PREFERRED STOCK
Series A Preferred Stock
In May 2011, the Board of Directors authorized the issuance of up to 200 shares of Series A Preferred Stock (the “Series A preferred stock”).
BIOSIG TECHNOLOGIES INC.
(A development stage company)
DECEMBER 31, 2013
The Series A preferred stock is entitled to preference over holders of junior stock upon liquidation in the amount of $5,000 plus any accrued and unpaid dividends ; entitled to dividends as a preference to holders of junior stock at a rate of 5% per annum of the Stated Value of $5,000 per share, payable quarterly beginning on August 31, 2011 and are cumulative. The holders of Series A preferred stock have no voting rights, however without the affirmative vote of all the holders of then outstanding shares of the Series A preferred stock, the Company cannot, (a) alter or change adversely the powers, preferences or rights given to the Series A preferred stock or alter or amend the Certificate of Designation.
The Series A preferred stock is mandatorily redeemable on December 31, 2014 (as modified) at a price equal to the Stated Value ($5,000) plus an amount equal to all accumulated and unpaid dividends. If the Company fails to redeem at redemption, the unpaid redemption price will accrue at 14% per annum until paid.
The Series A preferred stock is convertible (as amended), automatically, inclusive of any accrued and unpaid dividends, immediately into the Company’s common stock upon the Company becoming subject to the reporting requirements under Section 13 or 15(d) of the Securities and Exchange Act of 1934, as amended at conversion price of $1.84 per share.
On February 6, 2013, in connection with the amendment to the Series A preferred stock defining the conversion feature, the Company reclassified the associated financing costs as a debt discount against the carrying value of the preferred stock.
As of September 30,December 31, 2013 and December 31, 2012, 184.4 shares of Series A preferred stock were issued and outstanding. As of September 30,December 31, 2013 and December 31, 2012, the Company has accrued $107,735$119,355 and $73,255 dividends payable on the Series A preferred stock.
Series B Preferred Stock
On November 28, 2011, the Board of Directors authorized the issuance of up to 600 shares of Series B Preferred Stock (the “Series B preferred stock”).
The Series B preferred stock is entitled to preference over holders of junior stock upon liquidation in the amount of $5,000 plus any accrued and unpaid dividends; entitled to dividends as a preference to holders of junior stock at a rate of 5% per annum of the Stated Value of $5,000 per share, payable quarterly beginning on December 31, 2011 and are cumulative. The holders of Series B preferred stock have no voting rights, however without the affirmative vote of all the holders of then outstanding shares of the Series B preferred stock, the Company cannot (a) alter or change adversely the powers, preferences or rights given to the Series A preferred stock or alter or amend the Certificate of Designation.
The Series B preferred stock is mandatorily redeemable on December 31, 2014 at a price equal to the Stated Value ($5,000) plus an amount equal to all accumulated and unpaid dividends. If the Company fails to redeem at redemption, the unpaid redemption price will accrue at 14% per annum until paid.
The Series B preferred stock is convertible (as amended), automatically, inclusive of any accrued and unpaid dividends, immediately into the Company’s common stock upon the Company becoming subject to the reporting requirements under Section 13 or 15(d) of the Securities and Exchange Act of 1934, as amended at conversion price of $2.02 per share.
On February 6, 2013, in connection with the amendment to the Series B preferred stock defining the conversion feature, the Company reclassified the associated financing costs as a debt discount against the carrying value of the preferred stock.
As of September 30,December 31, 2013 and December 31, 2012, 177.5 shares of Series B preferred stock were issued and outstanding. As of September 30,December 31, 2013 and December 31, 2012, the Company has accrued $77,687$88,872 and $44,497 dividends payable on the Series A preferred stock.
NOTE 7 –9 — SERIES C 9% CONVERTIBLE PREFERRED STOCK
On January 9, 2013, the Board of Directors authorized the issuance of up to 4,200 shares of Series C Convertible Preferred Stock (the “Series C Convertible Preferred Stock”).
The Series C convertible preferred stock is entitled to preference over holders of junior stock upon liquidation in the amount of $1,000 plus any accrued and unpaid dividends ; entitled to dividends as a preference to holders of junior stock at a rate of 9% per annum of the Stated Value of $1,000 per share, payable quarterly beginning on September 30, 2013 and are cumulative. The holders of Series C preferred stock have no voting rights, however without the affirmative vote of all the holders of then outstanding shares of the Series C preferred stock, the Company cannot (a) alter or change adversely the powers, preferences or rights given to the Series C preferred stock or alter or amend the Certificate of Designation.
Each share of Series C preferred stock is convertible automatically, inclusive of any accrued and unpaid dividends, immediately upon the Company becoming subject to the reporting requirements under Section 13 or 15(d) of the Securities and Exchange Act of 1934, as amended at conversion price of $2.09, respectively.
BIOSIG TECHNOLOGIES INC.
(A development stage company)
DECEMBER 31, 2013
If, at any time while the Series C preferred stock is outstanding, the Company sells or grants any option to purchase or sells or grants any right to re-price, or otherwise disposes of or issues any common stock or common stock equivalents entitling any Person to acquire shares of Common Stock at an effective price per share that is lower than the then conversion price (“Base Conversion Price”), then the conversion price shall be reduced to equal the Base Conversion Price. Such adjustment shall be made whenever such Common Stock or Common Stock Equivalents are issued.
The Series C preferred stock contains triggering events which would require redemption at (i) the greater of 120% of the stated value of $1,000 or the product of product of the variable weighted average price of the Company’s common stock on the trading day immediately preceding the date of the triggering event and the stated value divided by then then conversion price or (ii) either (a) redeem each Series C preferred share for a redemption price, in shares of the Company’s common stock, equal to a number of shares equal to the (i) above divided by 75%. The Company determined that certain of the defined triggering events were outside the Company’s control and therefore classified the Series C preferred stock outside of equity.
In connection with the sale of the Series C preferred stock, the Company issued an aggregate of 1,158,850 warrants to purchase the Company’s common stock at $2.61 per share expiring five years from the initial exercise date. The warrant provides if, at any time while the warrant is outstanding, the Company sells or grants any option to purchase or sells or grants any right to re-price, or otherwise disposes of or issues any common stock or common stock equivalents entitling any person to acquire shares of common stock at an effective price per share that is lower than the then conversion price (“base conversion price”), then the conversion price shall be reduced to equal the Base Conversion Price. Such adjustment shall be made whenever such Common Stock or Common Stock Equivalents are issued. In addition, the warrants provides for at any time after the six month anniversary of the initial exercise date, there is no effective registration statement registering, or no current prospectus available for the resale of the warrant shares by the holder, then the warrant may only be exercised, in whole or in part, at such time by means of a “cashless exercise” in which the holder shall be entitled to receive a number of Warrant Shares equal to defined formula.
In accordance with ASC 470-20, the Company recognized an embedded beneficial conversion feature present in the Series C preferred stock when it was issued. The Company allocated the net proceeds between the intrinsic value of the conversion option ($1,303,671) and the warrants ($1,064,739) to additional paid-in capital. The aggregate debt discount, comprised of the relative intrinsic value the conversion option ($1,303,671), relative fair value of the warrants ($1,064,739), and the issuance costs ($412,590); total of $2,781,000, is amortized over one year as interest expense, the date a possible redemption feature, outside of the Company’s control, would be available to the Series C stockholders
The Company valued the warrants in accordance with ASC 470-20 using the Black-Scholes pricing model and the following assumptions: contractual terms of 5 years, an average risk free interest rate of 0.39% to 1.40%, a dividend yield of 0%, and volatility of 123.41% to 125.33%.
During the month of February 2013, the holders of the Convertible Bridge Notes (See Note 7) converted into 600 shares of the Company’s Series C 9% Convertible Preferred Stock.
During the months of February, March, May, and July 2013, the Company sold an aggregate of 2,181 shares of the Company’s Series C 9% Convertible Preferred Stock for net proceeds of $1,814,910.
The Company determined that the anti-dilutive provisions embedded in the Series C 9% Convertible Preferred Stock and related issued warrants did not meet the defined criteria of a derivative in such that the net settlement requirement of delivery of common shares does not meet the “readily convertible to cash” as described in Accounting Standards Codification 815 and therefore bifurcation is not required. There is no established market for the Company’s common stock.
Series C preferred stock issued and outstanding totaled 2,781 as of September 30,December 31, 2013. There were no shares issued as of December 31, 2012.
BIOSIG TECHNOLOGIES INC.
(A development stage company)
DECEMBER 31, 2013
Registration Rights Agreement
The Company entered into a Registration Rights Agreement in connection with the sale and issuance of the Series C preferred stock. The Company is required to file a registration statement registering for resale the (a) common stock issuable upon conversion in full of the Preferred Stock (assuming on such date the shares of Preferred Stock are converted in full without regard to any conversion limitations therein), (b) all shares of Common Stock issuable as dividends and “Make-Whole Payments” (as defined in the Certificate of Designation) on the Preferred Stock assuming all dividend and Make-Whole Payments are made in shares of Common Stock and the Preferred Stock is held for at least 3 years, (c) all warrant shares then issuable upon exercise of the Warrants (assuming on such date the warrants are exercised in full without regard to any exercise limitations therein), (d) any additional shares of Common Stock issuable in connection with any anti-dilution provisions in the Preferred Stock or the Warrants (in each case, without giving effect to any limitations on conversion set forth in the Certificate of Designation or limitations on exercise set forth in the Warrants) and (e) any securities issued or then issuable upon any stock split,
dividend or other distribution, recapitalization or similar event with respect to the foregoing. The Company is required to file a registration statement and must be declared effective no later than 210 days from the date of termination of the sale the Series C preferred stock. The Company is required to maintain the effectiveness of the registration statement from its effective date unless all securities registered under the registration statement have been sold or are otherwise able to be sold. If the Company fails to comply with the registration statement effective date requirements, the Company is required to pay the investors a fee equal to 0.25% of the Purchaser’s investment, for each 30-day period of delay, subject to a maximum payment of 3% to each Purchaser.
On July 22, 2013, the Company met its required filing requirement and expects tohowever did not meet the effectiveness obligation andby November 22, 2013, therefore has not accrued $34,763 as interest expense in current period operations for possible liquidating damages under the registration rights agreement.
NOTE 10 — STOCKHOLDER EQUITY
There is not a viable market for the Company’s common stock to determine its fair value; therefore, management is required to estimate the fair value to be utilized in the determining stock based compensation costs. In estimating the fair value, management considers recent sales of its common stock to independent qualified investors, placement agents’ assessments of the underlying common shares relating to our sale of preferred stock and validation by independent fair value experts. Considerable management judgment is necessary to estimate the fair value. Accordingly, actual results could vary significantly from management’s estimates.
Preferred stock
The Company is authorized to issue 1,000,000 shares of $0.001 par value preferred stock. As of December 31, 2013 and 2012, the Company has designated and issued 200 and 184.4 shares of Series A preferred stock, respectively, designated and issued 600 and 177.5 shares of Series B preferred stock, respectively. See Note 8.
As of December 31, 2013 and 2012, the Company designated 4,200 and 2,000 shares of Series C 9% convertible preferred stock, respectively; and issued 2,781 and -0- shares of Series C 9% convertible preferred stock. See Note 9.
Common stock
On October 17, 2012, the Company amended its Articles of Incorporation to increase the number of authorized shares of its common stock from 10 million to 50 million shares. As of December 31, 2013 and 2012 the Company has 8,412,101 and 8,166,238 shares of common stock issued and outstanding, respectively.
During the period from February 24, 2009 to December 31, 2009, the Company issued or designated an aggregate of 7,400,000 shares of common stock as payment for services by founders, 4,000,000 and 3,400,000 shares issued during the years ended December 31, 2009 and 2011, respectively ($0.01 per share).
During the year ended December 31, 2011, the Company issued an aggregate of September 30, 2013.408,113 shares of common stock for services rendered totaling $326,490 ($0.80 per share).
During the year ended December 31, 2011, the Company issued an aggregate of 175,000 shares of common stock for future services totally $140,000 ($0.80 per share).
During the year ended December 31, 2012, the Company issued an aggregate of 30,000 shares of common stock for future services totally $60,000 ($2.00 per share).
During the year ended December 31, 2013, the Company issued aggregate of 21,412 shares of common stock for services rendered totaling $44,751 ($2.09 per share).
BIOSIG TECHNOLOGIES INC.
(A development stage company)
DECEMBER 31, 2013
During the year ended December 31, 2013, the Company issued aggregate of 122,449 shares of common stock for cash rendered totaling $247,174 ($2.45 per share).
NOTE 11 — OPTIONS AND WARRANTS
There is not a viable market for the Company’s common stock to determine its fair value, therefore management is required to estimate the fair value to be utilized in the determining stock based compensation costs. In estimating the fair value, management considers recent sales of its common stock to independent qualified investors, placement agents’ assessments of the underlying common shares relating to our sale of preferred stock and validation by independent fair value experts. Considerable management judgment is necessary to estimate the fair value. Accordingly, actual results could vary significantly from management’s estimates
On October 19, 2012, the Company’s Board of Directors approved the 2012 Equity Incentive Plan (“the “2012 Plan) and terminated the Long-Term Incentive Plan (the “ 2011 Plan”). The Plan provides for the issuance of options to purchase up to 3,500,000 shares of the Company’s common stock to officers, directors, employees and consultants of the Company. Under the terms of the Plan the Company may issue Incentive Stock Options as defined by the Internal Revenue Code to employees of the Company only and nonstatutory options. The Board of Directors of the Company determines the exercise price, vesting and expiration period of the grants under the Plan. However, the exercise price of an Incentive Stock Option should not be less than 110% of fair value of the common stock at the date of the grant for a 10% or more stockholder and 100% of fair value for a grantee who is not 10% stockholder. The fair value of the common stock is determined based on quoted market price or in absence of such quoted market price, by the Board of Directors in good faith.
Additionally, the vesting period of the grants under the Plan will be determined by the 3, Committee, in its sole discretion and expiration period not more than ten years. The Company reserved 500,000 shares of its common stock for future issuance under the terms of the Plan.
As of September 30,December 31, 2013, the Company granted an aggregate of 2,990,977 options to directors and key consultants with an aggregate estimated fair value of $3,380,851.
Employee Options
The following table summarizes the employee options outstanding and the related prices for the shares of the Company's common stock issued at September 30,December 31, 2013:
| Options Outstanding | Options Exercisable | Options Outstanding | Options Exercisable | |||||||||||||||||||||||||||||||||||||||||
| Weighted Average | Weighted | Weighted | Weighted Average | Weighted | Weighted | |||||||||||||||||||||||||||||||||||||||
| Prices | Prices | Outstanding | (Years) | Price | Exercisable | Price | Prices | Outstanding | (Years) | Price | Exercisable | Price | ||||||||||||||||||||||||||||||||
| $ | 2.00 | 1,273,927 | 5.82 | $ | 2.00 | 250,821 | $ | 2.00 | 2.00 | 1,273,927 | 5.63 | $ | 2.00 | 250,821 | $ | 2.00 | ||||||||||||||||||||||||||||
| 2.09 | 1,218,300 | 6.32 | 2.09 | 1,061,364 | 2.09 | 2.09 | 1,218,300 | 6.09 | 2.09 | 1,061,364 | 2.09 | |||||||||||||||||||||||||||||||||
| 2,492,227 | 6.06 | 2.04 | 1,312,185 | 2.07 | 2,492,227 | 6.85 | 2.04 | 1,312,185 | 2.07 | |||||||||||||||||||||||||||||||||||
Transactions involving stock options issued to employees are summarized as follows:
Number of Shares | Weighted Average Price Per Share | Number of Shares | Weighted Average Price Per Share | |||||||||||||
| Outstanding at December 31, 2011: | - | $ | - | - | $ | - | ||||||||||
| Granted | 1,273,927 | 2.00 | 1,273,927 | 2.00 | ||||||||||||
| Exercised | - | - | - | - | ||||||||||||
| Expired | - | - | - | - | ||||||||||||
| Outstanding at December 31, 2012: | 1,273,927 | 2.00 | 1,273,927 | 2.00 | ||||||||||||
| Granted | 1,218,300 | 2.09 | 1,218,300 | 2.09 | ||||||||||||
| Exercised | - | - | - | - | ||||||||||||
| Expired | - | - | - | - | ||||||||||||
| Outstanding at September 30, 2013: | 2,492,227 | $ | 2.04 | |||||||||||||
| Outstanding at December 31, 2013: | 2,492,227 | $ | 2.04 | |||||||||||||
During the nine monthsyear ended September 30,December 31, 2012, the Company granted 1,273,927 options to purchase the Company stock in connection with the services rendered at the exercise price of $2.00 per share for a term of seven years with 250,821 options vesting at the first, second and third anniversaries of the grant date. The remainder (521,464 options) vest contingent on the occurrence of certain events, as defined.
BIOSIG TECHNOLOGIES INC.
(A development stage company)
DECEMBER 31, 2013
The fair value of the granted options for the year ended December 31, 2012 was determined using the Black Scholes option pricing model with the following assumptions:
| Dividend yield: | -0- | % | ||
| Volatility | 108.60% to 111.78 | % | ||
| Risk free rate: | 0.97% to 1.14 | % | ||
| Expected life: | 7 years | |||
| Estimated fair value of the Company’s common stock | $2.00 | |||
During the year ended December 31, 2013, the Company granted an aggregate of 1,218,300 options to purchase the Company stock in connection with the services rendered at the exercise price of $2.09 per share for a term of seven years with 283,300 options vesting at ratably over one year and the remainder (935,000 options) vested immediately upon issuance.
The fair value of the granted options for the nine monthsyear ended September 30,December 31, 2013 was determined using the Black Scholes option pricing model with the following assumptions:
| Dividend yield: | -0- | % | ||
| Volatility | 110.70% to 115.03 % | |||
| Risk free rate: | 1.07% to 1.25 % | |||
| Expected life: | 7 years | |||
| Estimated fair value of the Company’s common stock | $ | 2.09 | ||
The fair value of all employee options vesting during the threeyears ended December 31, 2013 and nine months ended September 30, 20132012 of $236,290$2,518,785 and $2,282,495, respectively; and $34,118 for the three and nine months ended September 30, 2012,$142,032, respectively, was charged to current period operations. Unrecognized compensation expense of $1,098,356$862,066 at September 30,December 31, 2013 will be expensed in future periods.
Non-employee Options
The following table summarizes the non-employee options outstanding and the related prices for the shares of the Company's common stock issued at June 30,December 31, 2013:
| Options Outstanding | Options Exercisable | Options Outstanding | Options Exercisable | |||||||||||||||||||||||||||||||||||||||||
| Weighted Average | Weighted | Weighted | Weighted Average | Weighted | Weighted | |||||||||||||||||||||||||||||||||||||||
| Prices | Prices | Outstanding | (Years) | Price | Exercisable | Price | Prices | Outstanding | (Years) | Price | Exercisable | Price | ||||||||||||||||||||||||||||||||
| $ | 2.00 | 25,000 | 5.97 | $ | 2.00 | 25,000 | $ | 2.00 | 2.00 | 25,000 | 5.73 | $ | 2.00 | 25,000 | $ | 2.00 | ||||||||||||||||||||||||||||
| 2.09 | 473,750 | 9.33 | 2.09 | 345,486 | 2.09 | 2.09 | 473,750 | 7.04 | 2.09 | 338,473 | 2.09 | |||||||||||||||||||||||||||||||||
| 498,750 | 9.16 | 2.09 | 370,486 | 2.08 | 498,750 | 6.97 | 2.09 | 363,473 | 2.08 | |||||||||||||||||||||||||||||||||||
Transactions involving stock options issued to non- employees are summarized as follows:
Number of Shares | Weighted Average Price Per Share | Number of Shares | Weighted Average Price Per Share | |||||||||||||
| Outstanding at December 31, 2011: | - | $ | - | - | $ | - | ||||||||||
| Granted | 25,000 | 2.00 | 25,000 | 2.00 | ||||||||||||
| Exercised | - | - | - | - | ||||||||||||
| Expired | - | - | - | - | ||||||||||||
| Outstanding at December 31, 2012: | 25,000 | 2.00 | 25,000 | 2.00 | ||||||||||||
| Granted | 473,750 | 2.09 | 473,750 | 2.09 | ||||||||||||
| Exercised | - | - | - | - | ||||||||||||
| Expired | - | - | - | - | ||||||||||||
| Outstanding at September 30, 2013: | 498,750 | $ | 2.09 | |||||||||||||
| Outstanding at December 31, 2013: | 498,750 | $ | 2.09 | |||||||||||||
During the nine monthsyear ended September 30,December 31, 2012, the Company granted 25,000 options to purchase the Company stock in connection with the services rendered at the exercise price of $2.00 per share for a term of seven years vesting immediately.
The fair value of the granted options of $43,291 for the year ended December 31, 2012 was determined using the Black Scholes option pricing model with the following assumptions:
| Dividend yield: | -0- | % | ||
| Volatility | 111.78 | % | ||
| Risk free rate: | 0.97 | % | ||
| Expected term: | 7 years | |||
| Estimated fair value of the Company’s common stock | $ | 2.00 | ||
BIOSIG TECHNOLOGIES INC.
(A development stage company)
DECEMBER 31, 2013
During the year ended December 31, 2013, the Company granted an aggregate of 473,750 options to purchase the Company stock in connection with the services rendered at the exercise price of $2.09 per share for a term of seven years (30,000) to ten years (443,750), vesting immediately for 160,000 options, 30,000 vesting 1/9 per month on each month anniversary and with the remainder vesting at 48,611 per first three month anniversary with remainder vesting at 1/24 per month.
The fair value of the vesting options of $52,455 and $665,119$728,401 for the three and nine monthsyear ended September 30,December 31, 2013 was determined using the Black Scholes option pricing model with the following assumptions:
| Dividend yield: | -0- | % | -0- | % | ||||
| Volatility | 110.18% to 115.03 % | 110.18% to 121.59 % | ||||||
| Risk free rate: | 1.23% to 2.64 % | 1.23% to 3.04 % | ||||||
| Expected term: | 7 to 10 years | 7 to 10 years | ||||||
| Estimated fair value of the Company’s common stock | $ | 2.09 | $ | 2.09 | ||||
Warrants
The following table summarizes warrants outstanding and the related prices for the shares of the Company's common stock issued at September 30,December 31, 2013:
| Warrants Outstanding | Warrants Exercisable | Warrants Outstanding | Warrants Exercisable | |||||||||||||||||||||||||||||||||||||||||
| Weighted Average | Weighted | Weighted | Weighted Average | Weighted | Weighted | |||||||||||||||||||||||||||||||||||||||
| Prices | Prices | Outstanding | (Years) | Price | Exercisable | Price | Prices | Outstanding | (Years) | Price | Exercisable | Price | ||||||||||||||||||||||||||||||||
| $ | 0.001 | 383,320 | 6.27 | $ | 0.001 | 383,320 | $ | 0.001 | 0.001 | 383,320 | 6.02 | $ | 0.001 | 383,320 | $ | 0.001 | ||||||||||||||||||||||||||||
| 1.84 | 35,076 | 4.29 | 1.84 | 35,076 | 1.84 | 1.84 | 35,076 | 6.05 | 1.84 | 35,076 | 1.84 | |||||||||||||||||||||||||||||||||
| 2.02 | 30,755 | 4.29 | 2.02 | 30,755 | 2.02 | 2.02 | 30,755 | 6.05 | 2.02 | 30,755 | 2.02 | |||||||||||||||||||||||||||||||||
| 2.61 | 2,138,800 | 4.65 | 2.61 | 2,138,800 | 2.61 | 2.61 | 2,138,800 | 4.36 | 2.61 | 2,138,800 | 2.61 | |||||||||||||||||||||||||||||||||
| 2,587,951 | 4.88 | 1.96 | 2,587,951 | 2.21 | 3.67 | 129,307 | 5.00 | 3.67 | 129,307 | 3.67 | ||||||||||||||||||||||||||||||||||
| 2,717,258 | 4.66 | 2.23 | 2,717,258 | 2.28 | ||||||||||||||||||||||||||||||||||||||||
Transactions involving warrants issued are summarized as follows:
Number of Shares | Weighted Average Price Per Share | Number of Shares | Weighted Average Price Per Share | |||||||||||||
| Outstanding at December 31, 2011: | - | $ | - | - | $ | - | ||||||||||
| Granted | - | - | - | - | ||||||||||||
| Exercised | - | - | - | - | ||||||||||||
| Expired | - | - | - | - | ||||||||||||
| Outstanding at December 31, 2012: | - | - | - | - | ||||||||||||
| Granted | 2,587,951 | 2.21 | 2,717,258 | 2.28 | ||||||||||||
| Exercised | - | - | - | - | ||||||||||||
| Expired | - | - | - | - | ||||||||||||
| Outstanding at June 30, 2013: | 2,587,951 | $ | 2.21 | |||||||||||||
| Outstanding at December 31, 2013: | 2,717,258 | $ | 2.28 | |||||||||||||
On January 7, 2013, the Company issued 383,320 warrants to purchase the Company stock in connection with the services rendered at the exercise price of $0.001 per share for a term of seven years exercisable immediately.
The fair value of the issued warrants were determined using the Black Scholes option pricing model with the following assumptions:
| Dividend yield: | -0- | % | ||
| Volatility | 114.99 | % | ||
| Risk free rate: | 1.31 | % | ||
| Expected life: | 7 years | |||
| Estimated fair value of the Company’s common stock | $ | 2.09 | ||
The fair value of $800,823 was charged to current period operations.
F-19
BIOSIG TECHNOLOGIES INC.
(A development stage company)
DECEMBER 31, 2013
On January 13, 2013, the Company issued an aggregate of 65,831 warrants to purchase the Company stock in connection with the placement services at the exercise prices of $1.84 (35,076 warrants) and $2.02 (30,775 warrants) per share for a term of five years exercisable immediately.
The fair value of the issued warrants were determined using the Black Scholes option pricing model with the following assumptions:
| Dividend yield: | -0- | % | ||
| Volatility | 123.30 | % | ||
| Risk free rate: | 0.72 | % | ||
| Expected life: | 5 years | |||
| Estimated fair value of the Company’s common stock | $ | 2.09 | ||
The fair value of $115,854 was charged to operations ratably as financing costs through December 31, 2014.
During the nine monthsyear ended September 30,December 31, 2013, the Company issued an aggregate of 1,516,386 warrants to purchase the Company stock in connection with the sale of the Series C 9% Convertible Preferred Stock at the exercise price of $2.61 per share for a term of five years exercisable immediately.
During the months of July and September, 2013, the Company issued an aggregate of 622,414 warrants to purchase the Company’s stock to holders of Series C preferred stock as an inducement to amend and waive certain defined provisions of the Series C preferred stock.
The fair value of the issued warrants were determined using the Black Scholes option pricing model with the following assumptions:
| Dividend yield: | -0- | % | ||
| Volatility | 125.33 | % | ||
| Risk free rate: | 1.40 | % | ||
| Expected life: | 5 years | |||
| Estimated fair value of the Company’s common stock | $ | 2.09 | ||
The fair value of $1,074,833 was charged to current period operations.operations
On December 31, 2013, the Company issued an aggregate of 129,307 warrants to purchase the Company’s common stock at $3.67 per share for five years in connection with the sale of the Company’s common stock.
The risk-free interest rate assumption is based upon observed interest rates on zero coupon U.S. Treasury bonds whose maturity period is appropriate for the term. Estimated volatility is a measure of the amount by which the Company's stock price is expected to fluctuate each year during the term of the award. The Company's estimated volatility is an average of the historical volatility of the stock prices of its peer entities whose stock prices were publicly available. The Company's calculation of estimated volatility is based on historical stock prices over a period equal to the term of the awards. The Company used the historical volatility of peer entities due to the lack of sufficient historical data of its stock price.
NOTE 10 –12 - LOSS PER SHARE
The following table presents the computation of basic and diluted loss per share for the years ended December 31, 2013 and 2012:
| 2013 | 2012 | |||||||
| Net loss available to Common stockholders | $ | (10,101,846 | ) | $ | (2,477,002 | ) | ||
| Basic and diluted earnings (loss) per share | $ | (1.23 | ) | $ | (0.30 | ) | ||
| Weighted average common shares outstanding | 8,187.648 | 8,142,222 | ||||||
NOTE 13 - FAIR VALUE OF FINANCIAL INSTRUMENTS
The Company follows the provisions of ASC 825-10. For financial assets and liabilities included within the scope of ASC 825-10, the Company was required to adopt the provisions of ASC 825-10 prospectively as of the beginning of Fiscal 2009. The adoption of ASC 825-10 did not have a material impact on our consolidated financial position or results of operations.
There were no items required to be measured at fair value on a recurring basis in the consolidated financial statements as of September 30,December 31, 2013 and 2012.
BIOSIG TECHNOLOGIES INC.
(A development stage company)
NOTES TO THE FINANCIAL STATEMENTS
DECEMBER 31, 2013
NOTE 14 - COMMITMENTS AND CONTINGENCIES
Operating leases
On August 9, 2011, the Company entered into a three-year lease for office space in Los Angeles, California, with monthly payments escalating from $60,804 in the first year to $66,456 in the third year.
Future minimum lease payments under the operating lease are as follows:
| Year Ending December 31, | ||||
| 2014 | $ | 43,504 | ||
In addition, the Company leases parking in aggregate of approximately $700 per month, on a month to month basis.
Total lease rental expenses for the years ended December 31, 2013 and 2012 was $70,950 and $72,408, respectively.
Litigation
Drachman vs. BioSig Technologies, Inc., (AAA Case No. 14 166 0001814). Mr. Drachman has asserted claims in aggregate of $612,000 plus 12 months health and dental coverage and 10% of the Company’s common stock on a fully diluted basis with anti-dilution provisions relating to his employment with Company. In addition, Mr. Drachman is also seeking a declaratory judgment that certain intellectual property be adjudicated to belong to him. The Company contents the claims asserted are of little or no merit and will defend vigorously. For the year ended December 31, 2013, the Company has accrued an estimated cost of defense, arbitration and other court fees of $100,000.
The Company is subject at times to other legal proceedings and claims, which arise in the ordinary course of its business. Although occasional adverse decisions or settlements may occur, the Company believes that the final disposition of such matters should not have a material adverse effect on its financial position, results of operations or liquidity. There was no outstanding litigation as of December 31, 2012.
Employment and Consulting Agreements
The Company has consulting agreements with outside contractors to provide certain consulting and advisory services. The Agreements are generally for a term of 12 months from inception and renewable automatically from year to year unless either the Company or Consultant terminates such engagement by written notice. As of December 31, 2013, the Company has an aggregate of $252,000 (annualized) informal consulting/employment agreements.
NOTE 1115 -INCOME TAXES
At December 31, 2013, the Company has available for federal income tax purposes a net operating loss carry forward of approximately $4,900,000, expiring in the year 2032, that may be used to offset future taxable income. The Company has provided a valuation reserve against the full amount of the net operating loss benefit, since in the opinion of management based upon the earnings history ofthe Company; it is more likely than not that the benefits will not be realized. Due to possible significant changes in the Company's ownership, the future use of its existing net operating losses may be limited. All or portion of the remaining valuation allowance may be reduced in future years based on an assessment of earnings sufficient to fully utilize these potential tax benefits.
We have adopted the provisions of ASC 740-10-25, which provides recognition criteria and a related measurement model for uncertain tax positions taken or expected to be taken in income tax returns. ASC 740-10-25 requires that a position taken or expected to be taken in a tax return be recognized in the financial statements when it is more likely than not that the position would be sustained upon examination by tax authorities. Tax position that meet the more likely than not threshold are then measured using a probability weighted approach recognizing the largest amount of tax benefit that is greater than 50% likely of being realized upon ultimate settlement. The Company had no tax positions relating to open income tax returns that were considered to be uncertain.
The Company is required to file income tax returns in the U.S. Federal jurisdiction and in California. The Company is no longer subject to income tax examinations by tax authorities for tax years ending before December 31, 2010.
The effective rate differs from the statutory rate of 34% for due to the following:
| Statutory rate on pre-tax book loss | (34.00 | )% | ||
| Stock based compensation | 11.70 | % | ||
| Financing costs | 2.40 | % | ||
| Valuation allowance | 19.90 | % | ||
| 0.00 | % |
BIOSIG TECHNOLOGIES INC.
(A development stage company)
NOTES TO THE FINANCIAL STATEMENTS
DECEMBER 31, 2013
The Company’s deferred taxes as of December 31, 2013 consist of the following:
| Non-Current deferred tax asset: | ||||
| Net operating loss carry-forwards | $ | 1,400,000 | ||
| Valuation allowance | (1,400,000 | ) | ||
| Net non-current deferred tax asset | $ | - |
NOTE 16 – SUBSEQUENT EVENTS
On DecemberJanuary 31, 2013, the Company entered into a securities purchase agreement with Mr. Londoner and one other investor,investors, pursuant to which the Company issued 215,510107,708 shares of our common stock and five-year warrants to purchase 107,75653,855 shares of our common stock for aggregate cash proceeds of $528,000, including a conversion of debt of $228,000.$229,237.
PART II