
As filed with the Securities and Exchange Commission on March 5,16, 2004
Registration Statement No. 333-111338
SECURITIES AND EXCHANGE COMMISSION
Washington, D.C. 20549
Pre-Effective
Amendment No. 23 to
FORM S-1
REGISTRATION STATEMENT
Under
The Securities Act of 1933
PERINI CORPORATION
(Exact Name of Registrant as Specified in its Charter)
| Massachusetts | 1542 | 04-1717070 | ||
(State or Other Jurisdiction of Incorporation or Organization) | (Primary Standard Industrial Classification Code Number) | (I.R.S. Employer Identification No.) |
73 Mt. Wayte Avenue
Framingham, MA 01701
(508) 628-2000
(Address, including zip code, and telephone number, including area code, of registrant’s principal executive office)
Robert Band
President and Chief Operating Officer
Perini Corporation
73 Mt. Wayte Avenue
Framingham, MA 01701
(508) 628-2000
(Name, address, including zip code and telephone number, including area code, of agent for service)
Copies to:
| Richard A. Soden, Esq. | Kris F. Heinzelman, Esq. | |
| Robert P. Whalen, Jr., Esq. | Cravath, Swaine & Moore LLP | |
| Goodwin Procter LLP | 825 Eighth Avenue | |
| Exchange Place | New York, New York 10019 | |
| Boston, Massachusetts 02109 | (212) 474-1000 | |
| (617) 570-1000 | Fax: (212) 474-3700 | |
| Fax: (617) 523-1231 |
Approximate date of commencement of proposed sale to public: As soon as practicable after this Registration Statement becomes effective.
If any of the securities being registered on this Form are to be offered on a delayed or continuous basis pursuant to Rule 415 under the Securities Act of 1933, check the following box. ¨
If this Form is used to register additional securities for an offering pursuant to Rule 462(b) under the Securities Act, check the following box and list the Securities Act registration statement number of the earlier effective registration statement for the same offering. ¨
If this Form is a post-effective amendment filed pursuant to Rule 462(c) under the Securities Act, check the following box and list the Securities Act registration statement number of the earlier effective registration statement for the same offering. ¨
If this Form is a post-effective amendment filed pursuant to Rule 462(d) under the Securities Act, check the following box and list the Securities Act registration statement number of the earlier effective registration statement for the same offering. ¨
If delivery of the prospectus is expected to be made pursuant to Rule 434, please check the following box. ¨
The registrant hereby amends this registration statement on such date or dates as may be necessary to delay its effective date until the registrant shall file a further amendment which specifically states that this registration statement shall thereafter become effective in accordance with Section 8(a) of the Securities Act of 1933 or until the registration statement shall become effective on such date as the Securities and Exchange Commission, acting pursuant to said Section 8(a), may determine.
The information in this prospectus is not complete and may be changed. The selling stockholders may not sell these securities until the registration statement filed with the Securities and Exchange Commission is effective. This prospectus is not an offer to sell these securities and it is not soliciting an offer to buy these securities in any state where the offer or sale is not permitted.
SUBJECT TO COMPLETION, DATED ,MARCH 16, 2004
5,910,800 Shares
Common Stock
The shares of common stock are being sold by the selling stockholders. We will not receive any of the proceeds from the shares of common stock sold by the selling stockholders.
Our common stock is listed on the American Stock Exchange under the symbol “PCR.” The last reported sale price on March 2,12, 2004, was $13.70$16.47 per share.
The underwriters have an option to purchase a maximum of 886,620 additional shares to cover over-allotments of shares.
Investing in our common stock involves risks. See “Risk Factors” on page 7.
Price to Public | Underwriting Discounts and Commissions | Proceeds to Selling Stockholders | |||||||
Per Share | $ | $ | $ | ||||||
Total | $ | $ | $ | ||||||
Delivery of the shares of common stock will be made on or about , .2004.
Neither the Securities and Exchange Commission nor any state securities commission has approved or disapproved of these securities or determined if this prospectus is truthful or complete. Any representation to the contrary is a criminal offense.
Credit Suisse First Boston
D.A. Davidson & Co.
Morgan Joseph & Co. Inc.
The date of this prospectus is , .2004.
[Headings “Perini Building Company”, “Perini Civil Construction” and “Perini Management Services” with various pictures of completed construction sites.]
| Page | ||
| 1 | ||
| 7 | ||
| 16 | ||
| 17 | ||
| 17 | ||
| 17 | ||
| 18 | ||
| 19 | ||
MANAGEMENT’S DISCUSSIONAND ANALYSISOF FINANCIAL CONDITIONAND RESULTSOF OPERATIONS | 21 | |
| 53 | ||
| Page | ||
| 63 | ||
| 66 | ||
| 71 | ||
| 77 | ||
| 78 | ||
| 81 | ||
| 84 | ||
| 85 | ||
| 85 | ||
| 85 | ||
| F-1 | ||
You should rely only on the information contained in this document or to which we have referred you. We have not authorized anyone to provide you with information that is different. This document may only be used where it is legal to sell these securities. The information in this document may only be accurate on the date of this document.
The following summary contains information about our business and the offering of our common stock. It does not contain all of the information that you need to consider in making an investment decision. You should read this entire prospectus carefully, including the information under “Risk Factors” and our consolidated financial statements and the related notes included elsewhere in this prospectus. In this prospectus, unless the context requires otherwise, “Perini,” “we,” “us” and “our” refer to Perini Corporation, a Massachusetts corporation, and our subsidiaries, including the operations of businesses we acquired prior to the date of acquisition, and not to the underwriters.
Our Company
We are a leading construction services company, based on revenues, as ranked by Engineering News-Record, offering diversified general contracting, construction management and design-build services to private clients and public agencies throughout the world. We have provided construction services since 1894 and have established a strong reputation within our markets by executing large, complex projects on time and within budget while adhering to strict quality control measures. We offer general contracting, preconstruction planning and comprehensive project management services, including the planning and scheduling of the manpower, equipment, materials and subcontractors required for a project. We also offer self-performed construction services including earthwork,site work, concrete forming and placement and steel erection. During the nine monthsyear ended September 30,December 31, 2003, we performed work on over 100 construction projects for over 75 federal, state and local government agencies or authorities and private customers. Our headquarters are in Framingham, Massachusetts, and we have seven other principal offices throughout the United States. As of September 30,December 31, 2003, we employed approximately 3,4001,725 people. Our common stock is currently listed on the American Stock Exchange under the symbol “PCR.” We have applied for the listing of our common stock on the New York Stock Exchange. We expect our common stock to begin trading on the New York Stock Exchange in April 2004 under the symbol “PCR.”
Our business is now conducted through three primary segments: building, civil, and management services. Our building segment is comprised of Perini Building Company and James A. Cummings, Inc., or Cummings, and focuses on large, complex projects in the hospitality and gaming, sports and entertainment, educational, transportation and healthcare markets. Our civil segment is involved in public works construction primarily in the northeastern United States, including the repair, replacement and reconstruction of the United States public infrastructure such as highways, bridges and mass transit systems. Our management services segment provides diversified construction, design-build and maintenance services to the U.S. military and government agencies as well as power producers, surety companies and multi-national corporations.
For the nine monthsyear ended September 30,December 31, 2003, our revenues were $873.4$1,374.1 million and income before income taxes was $15.0$30.9 million, which represents a 6.2%26.6% and 6.5%29.5% increase, respectively, over the same period in 2002. Our backlog was $1.33 billion$1,666.5 million as of September 30,December 31, 2003, an increase of 34.5%68.3% from $990 million at the end of 2002.
The following chart presents our revenues by segment for the nine monthsyear ended September 30,December 31, 2003 and our backlog by segment as of September 30,December 31, 2003 (in millions):
Revenue by Segment ( | Backlog by Segment (As of | |
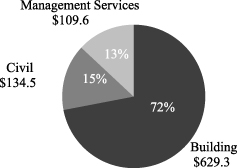 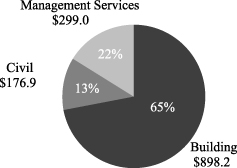 |   |
Our Strengths
We believe our competitive position is augmented by the following principal competitive strengths:
| • | Market Leadership in Several High-Growth Building End Markets. Our significant experience, strong relationships, market leadership, design-build expertise and presence in certain key areas throughout the United States allow us to successfully compete for projects in certain end markets such as hospitality and gaming. |
| • | Extensive Experience in Complex Civil Construction. For over 100 years, we have provided specialized civil construction services, with an emphasis on large, complex projects in dense urban areas. |
| • | Responsiveness and Performance with Challenging Projects. Our clients often rely on us to respond rapidly to complete projects in challenging business or operating environments throughout the world. |
| • | Long-Term Relationships and Operating History with Clients. We maintain strong, long-term relationships with many of our clients. |
| • | Focus on Managing Contract and Project Risk. Our extensive experience and history in our markets provide us with an understanding of the risks associated with certain projects. |
| • | Experienced Management Team and Highly Skilled Workforce. Our senior management team and workforce bring significant industry work experience and specialized project expertise to our project execution capabilities. |
Our Strategy
We will seek to increase shareholder value by pursuing the following growth strategies:
| • | Leverage Leadership Position in Hospitality and Gaming Market. We intend to leverage our leadership position in this market by emphasizing our experience and our proven ability to complete challenging projects on accelerated schedules. |
| • | Extend Building Construction Expertise to Additional Markets. As we expand our market presence within particular project types or geographic areas, we will seek opportunities to cross-utilize our building construction expertise. |
| • | Pursue Expanding Federal Contracting Opportunities for Defense, Reconstruction and Security. We have well established relationships with U.S. government agencies that include, among others, the Departments of Defense and State. We will continue to pursue construction and support projects at various domestic and overseas locations such as military bases, military installations and U.S. embassies. |
| • | Seek Complex Civil Construction Projects in the Northeast. We intend to maintain and build upon our established position as a leading civil construction contractor in the northeastern United States. As one of a limited number of firms that has the ability to consistently pre-qualify for major projects, we will selectively focus on large, complex projects where our competitive advantages can be leveraged. |
| • | Focus on Margin Expansion Opportunities. We will actively seek to expand our profit margins by managing our business mix, targeting high value-added projects and continuously evaluating our corporate support and field operations cost structures. |
| • | Pursue Selected Strategic Acquisitions. We intend to supplement our internal growth and achieve strategic benefits by pursuing selected acquisitions. |
We are a Massachusetts corporation. Our principal office is located at 73 Mt. Wayte Avenue, Framingham, Massachusetts 01701 and our telephone number is (508) 628-2000.
Risk Factors
You should carefully consider the matters discussed in the “Risk Factors” section beginning on page 7 of this prospectus prior to deciding whether to invest in shares of our common stock. Some of the risks include:
The Offering
Common stock offered by the selling stockholders (1) | 5,910,800 shares | |
Common stock outstanding before and after this offering | ||
Dividend policy | We have not paid any cash dividends on our common stock since 1990 and currently do not expect to pay dividends or make any other distributions on such stock in the immediate future. | |
Use of proceeds | We will not receive any proceeds from the sale of common stock by the selling stockholders. | |
American Stock Exchange Symbol | PCR | |
| (1) | Assumes no exercise by the underwriters of their option to purchase up to 886,620 additional shares from the selling stockholders to cover over-allotments. |
All of the shares offered by this prospectus are being offered by the selling stockholders.
The number of shares of common stock outstanding before and after this offering is based on the number of shares outstanding as of December 15, 2003February 23, 2004 and excludes:
As of December 15, 2003February 23, 2004 the selling stockholders held approximately 52% of our outstanding common stock. After giving effect to this offering and assuming the full exercise of the underwriters’ option to purchase 886,620 additional shares, the selling stockholders will own approximately 22% of our outstanding common stock.
Unless otherwise indicated, the information in this prospectus assumes that the underwriters will not exercise the over-allotment option granted to them by the selling stockholders.
Our common stock is listed on the American Stock Exchange. We have applied for the listing of our common stock on the New York Stock Exchange. We expect our common stock to begin trading on the New York Stock Exchange in April 2004 under the symbol “PCR.”
Summary Consolidated Financial Data
The following summary consolidated financial data should be read in conjunction with “Management’s Discussion and Analysis of Financial Condition and Results of Operations” and “Selected Historical Financial Data” and our consolidated financial statements and related notes included elsewhere in this prospectus. The summary consolidated financial data for the years ended December 31, 2003, 2002 2001 and 2000,2001, and as of December 31, 20022003 and 2001,2002, are derived from our audited consolidated financial statements included elsewhere in this prospectus. The summary consolidated financial data for the years ended December 31, 19992000 and 19981999 and as of December 31, 2001, 2000 1999 and 19981999 are derived from our audited financial statements not included in this prospectus. The summary consolidated condensed financial data for the nine months ended September 30, 2003 and 2002 and as of September 30, 2003 and 2002, are derived from our unaudited consolidated condensed financial statements included elsewhere in this prospectus. Backlog and new business awarded are not measures defined in generally accepted accounting principles and have not been derived from our consolidated financial statements. In the opinion of management the unaudited consolidated financial statements include all adjustments, consisting only of normal recurring adjustments, necessary to present fairly the information set forth therein. The historical results are not necessarily indicative of our future results of operations or financial performance and the results for the nine months ended September 30, 2003 should not be considered indicative of results expected for the full fiscal year.performance.
| Nine Months Ended September 30, | Year Ended December 31, | Year Ended December 31, | ||||||||||||||||||||||||||||||||||||||||||
| 2003 | 2002 | 2002 | 2001 | 2000 | 1999 | 1998 | 2003 | 2002 | 2001 | 2000 | 1999 | |||||||||||||||||||||||||||||||||
| (in thousands, except per share data) | (in thousands, except per share data) | |||||||||||||||||||||||||||||||||||||||||||
Statement of Operations Data: | ||||||||||||||||||||||||||||||||||||||||||||
Statement of Operations Data | ||||||||||||||||||||||||||||||||||||||||||||
CONTINUING OPERATIONS: | ||||||||||||||||||||||||||||||||||||||||||||
Revenues | $ | 873,451 | $ | 822,482 | $ | 1,085,041 | $ | 1,553,396 | $ | 1,105,660 | $ | 1,019,484 | $ | 1,011,322 | $1,374,103 | $ | 1,085,041 | $ | 1,553,396 | $ | 1,105,660 | $ | 1,019,484 | |||||||||||||||||||||
Cost of Operations | 829,590 | 784,744 | 1,026,391 | 1,495,834 | 1,053,328 | 969,015 | 957,651 | |||||||||||||||||||||||||||||||||||||
Cost Of Operations | 1,303,851 | 1,026,391 | 1,495,834 | 1,053,328 | 969,015 | |||||||||||||||||||||||||||||||||||||||
Gross Profit | 43,861 | 37,738 | 58,650 | 57,562 | 52,332 | 50,469 | 53,671 | 70,252 | 58,650 | 57,562 | 52,332 | 50,469 | ||||||||||||||||||||||||||||||||
G&A Expense | 27,709 | 22,132 | 32,770 | 28,061 | 24,977 | 26,635 | 27,397 | 39,762 | 32,770 | 28,061 | 24,977 | 26,635 | ||||||||||||||||||||||||||||||||
Income From Operations | 16,152 | 15,606 | 25,880 | 29,501 | 27,355 | 23,834 | 26,274 | |||||||||||||||||||||||||||||||||||||
Income From Construction Operations | 30,490 | 25,880 | 29,501 | 27,355 | 23,834 | |||||||||||||||||||||||||||||||||||||||
Other (Income) Expense, Net | 428 | 360 | 520 | 227 | (949 | ) | (72 | ) | 652 | (1,435) | 520 | 227 | (949 | ) | (72 | ) | ||||||||||||||||||||||||||||
Interest Expense | 701 | 1,146 | 1,485 | 2,006 | 3,966 | 7,128 | 8,473 | 1,003 | 1,485 | 2,006 | 3,966 | 7,128 | ||||||||||||||||||||||||||||||||
Income Before Income Taxes | 15,023 | 14,100 | 23,875 | 27,268 | 24,338 | 16,778 | 17,149 | 30,922 | 23,875 | 27,268 | 24,338 | 16,778 | ||||||||||||||||||||||||||||||||
Provision (Credit) for Income Taxes | (6,410 | ) | 551 | 801 | 850 | (43 | ) | 421 | 1,100 | |||||||||||||||||||||||||||||||||||
(Provision) Credit For Income Taxes | 13,096 | (801 | ) | (850 | ) | 43 | (421 | ) | ||||||||||||||||||||||||||||||||||||
Income From Continuing Operations | 21,433 | 13,549 | 23,074 | 26,418 | 24,381 | 16,357 | 16,049 | 44,018 | 23,074 | 26,418 | 24,381 | 16,357 | ||||||||||||||||||||||||||||||||
DISCONTINUED OPERATIONS: | ||||||||||||||||||||||||||||||||||||||||||||
Loss From Operations | — | — | — | — | — | (694 | ) | (4,397 | ) | |||||||||||||||||||||||||||||||||||
Loss on Disposal of Real Estate Business Segment | — | — | — | — | — | (99,311 | ) | — | ||||||||||||||||||||||||||||||||||||
Loss From Discontinued Operations | — | — | — | — | — | (100,005 | ) | (4,397 | ) | — | — | — | — | (100,005 | ) | |||||||||||||||||||||||||||||
Net Income (Loss) | $ | 21,433 | $ | 13,549 | $ | 23,074 | $ | 26,418 | $ | 24,381 | $ | (83,648 | ) | $ | 11,652 | $ | 44,018 | $ | 23,074 | $ | 26,418 | $ | 24,381 | $ | (83,648 | ) | ||||||||||||||||||
Income Available for Common Stockholders (1) | $ | 27,331 | $ | 11,955 | $ | 20,949 | $ | 24,293 | $ | 7,299 | $ | (89,917 | ) | $ | 5,743 | |||||||||||||||||||||||||||||
Income Available For Common Stockholders (1) | $ | 49,619 | $ | 20,949 | $ | 24,293 | $ | 7,299 | $ | (89,917 | ) | |||||||||||||||||||||||||||||||||
Per Share of Common Stock: | ||||||||||||||||||||||||||||||||||||||||||||
Per Share Of Common Stock: | ||||||||||||||||||||||||||||||||||||||||||||
Basic Earnings (Loss): | ||||||||||||||||||||||||||||||||||||||||||||
Income From Continuing Operations (2) | $ | 1.20 | $ | 0.53 | $ | 0.92 | $ | 1.07 | $ | 0.39 | $ | 1.80 | $ | 1.91 | ||||||||||||||||||||||||||||||
Income From Continuing Operations | $ | 2.18 | $ | 0.92 | $ | 1.07 | $ | 0.39 | $ | 1.80 | ||||||||||||||||||||||||||||||||||
Loss From Discontinued Operations | — | — | — | — | — | (0.12 | ) | (0.83 | ) | — | — | — | — | (17.84 | ) | |||||||||||||||||||||||||||||
Estimated Loss on Disposal | — | — | — | — | — | (17.72 | ) | — | ||||||||||||||||||||||||||||||||||||
Total | $ | 1.20 | $ | 0.53 | $ | 0.92 | $ | 1.07 | $ | 0.39 | $ | (16.04 | ) | $ | 1.08 | $ | 2.18 | $ | 0.92 | $ | 1.07 | $ | 0.39 | $ | (16.04 | ) | ||||||||||||||||||
Diluted Earnings (Loss): | ||||||||||||||||||||||||||||||||||||||||||||
Income From Continuing Operations (2) | $ | 1.17 | $ | 0.52 | $ | 0.91 | $ | 1.04 | $ | 0.39 | $ | 1.80 | $ | 1.91 | ||||||||||||||||||||||||||||||
Income From Continuing Operations | $ | 2.10 | $ | 0.91 | $ | 1.04 | $ | 0.39 | $ | 1.80 | ||||||||||||||||||||||||||||||||||
Loss From Discontinued Operations | — | — | — | — | — | (0.12 | ) | (0.83 | ) | — | — | — | — | (17.84 | ) | |||||||||||||||||||||||||||||
Estimated Loss on Disposal | — | — | — | — | — | (17.72 | ) | — | ||||||||||||||||||||||||||||||||||||
Total | $ | 1.17 | $ | 0.52 | $ | 0.91 | $ | 1.04 | $ | 0.39 | $ | (16.04 | ) | $ | 1.08 | $ | 2.10 | $ | 0.91 | $ | 1.04 | $ | 0.39 | $ | (16.04 | ) | ||||||||||||||||||
Weighted Average Common Shares Outstanding: | ||||||||||||||||||||||||||||||||||||||||||||
Basic | 22,726 | 22,664 | 22,664 | 22,623 | 18,521 | 5,606 | 5,318 | 22,763 | 22,664 | 22,623 | 18,521 | 5,606 | ||||||||||||||||||||||||||||||||
Diluted | 23,399 | 23,028 | 22,939 | 23,442 | 18,527 | 5,606 | 5,318 | 23,583 | 22,939 | 23,442 | 18,527 | 5,606 | ||||||||||||||||||||||||||||||||
| Nine Months Ended September 30, | Year Ended December 31, | Year Ended December 31, | ||||||||||||||||||||||||||||||||||||
| 2003 | 2002 | 2002 | 2001 | 2000 | 1999 | 1998 | 2003 | 2002 | 2001 | 2000 | 1999 | |||||||||||||||||||||||||||
| (in thousands, except per share data) | (in thousands, except per share data) | |||||||||||||||||||||||||||||||||||||
Balance Sheet Data (end of period): | ||||||||||||||||||||||||||||||||||||||
Total Assets | $ | 464,412 | $ | 395,326 | $ | 402,389 | $ | 501,241 | $ | 487,478 | $ | 385,767 | $ | 452,496 | $ | 565,443 | $ | 402,389 | $ | 501,241 | $ | 487,478 | $ | 385,767 | ||||||||||||||
Working Capital | 122,110 | 130,346 | 115,908 | 93,369 | 80,477 | 48,430 | 57,665 | 125,397 | 115,908 | 93,369 | 80,477 | 48,430 | ||||||||||||||||||||||||||
Long-term Debt, Less Current Maturities | 25,566 | 33,700 | 12,123 | 7,540 | 17,218 | 41,091 | 75,857 | 8,522 | 12,123 | 7,540 | 17,218 | 41,091 | ||||||||||||||||||||||||||
Stockholders’ Equity (Deficit) | 103,510 | 91,364 | 86,649 | 79,408 | 60,622 | (36,618 | ) | 50,558 | 120,560 | 86,649 | 79,408 | 60,622 | (36,618 | ) | ||||||||||||||||||||||||
Other Data: | ||||||||||||||||||||||||||||||||||||||
Depreciation and Amortization | $ | 2,524 | $ | 2,309 | $ | 3,202 | $ | 2,602 | $ | 2,191 | $ | 3,342 | $ | 3,059 | $ | 3,389 | $ | 3,202 | $ | 2,602 | $ | 2,191 | $ | 3,342 | ||||||||||||||
Capital Expenditures | 4,406 | 3,710 | 4,510 | 4,528 | 1,793 | 1,599 | 1,418 | 5,399 | 4,510 | 4,528 | 1,793 | 1,599 | ||||||||||||||||||||||||||
Backlog (end of period) | 1,332,148 | 1,124,818 | 990,175 | 1,213,535 | 1,788,731 | 1,658,077 | 1,232,256 | 1,666,464 | 990,175 | 1,213,535 | 1,788,731 | 1,658,077 | ||||||||||||||||||||||||||
New Business Awarded | 1,215,423 | 733,256 | 861,681 | 978,200 | 1,236,314 | 1,445,305 | 934,124 | 2,050,392 | 861,681 | 978,200 | 1,236,314 | 1,445,305 | ||||||||||||||||||||||||||
| (1) | Income available for common stockholders includes adjustments to net income for (a) accrued and unpaid dividends on our $21.25 Preferred Stock, or $2.125 Depositary Shares, (b) the reversal of previously accrued and unpaid dividends in the amount of approximately $7.3 million applicable to 440,627 of the $2.125 Depositary Shares purchased and retired by us on June 9, 2003, (c) dividends declared and paid on our Series B Preferred Stock until its exchange for shares of common stock on March 29, 2000 and (d) the $13.7 million assigned to the induced conversion of the Series B Preferred Stock into common stock on March 29, |
| (2) |
| A construction project is included in our backlog at such time as a contract is awarded or a firm letter of commitment is obtained and funding is in place. Backlog is not a measure defined in generally accepted accounting principles, or GAAP, and our backlog may not be comparable to the backlog of other companies. Management uses backlog to assist in forecasting future results. |
| New business awarded consists of the original contract price of projects added to our backlog in accordance with Note |
You should carefully consider the following risks and all other information contained in this prospectus before purchasing our common stock. If any of the following risks occur, our business, prospects, reputation, results of operations or financial condition could be harmed. In that case, the trading price of our common stock could decline, and you could lose all or part of your investment. This prospectus also contains forward-looking statements that involve risks and uncertainties. Our actual results could differ materially from those anticipated in the forward-looking statements as a result of specific factors, including the risks described below and elsewhere in this prospectus.
Risks Relating to Our Business
We are subject to significant legal proceedings, which, if determined adversely to us, could harm our reputation, preclude us from bidding on future projects and/or have a material adverse effect on us.
We are involved in various lawsuits, including the legal proceedings described under “Business—Legal Proceedings.” Some of these proceedings involve claims and judgments against us for significant amounts. For example, the litigation with the Los Angeles MTA has resulted in an award against the Tutor-Saliba-Perini joint venture (a joint venture in which we have a 40% interest), Tutor-Saliba and us, jointly and severally, for $63.0 million plus accrued interest. This award is currently being appealed by the joint venture. We do not believe that this or any other pending litigation will ultimately result in a final judgment against us that would materially adversely affect us. Litigation is, however, inherently uncertain and it is not possible to predict what the final outcome will be of any legal proceeding. A final judgment against us would require us to record the related liability and fund the payment of the judgment and, if such adverse judgment is significant, it could have a material adverse effect on us.
In addition, legal proceedings resulting in judgments or findings against us may harm our reputation and prospects for future contract awards. For example, we are defendants in a civil action brought by the San Francisco City Attorney on behalf of the City and County of San Francisco and the citizens of California, in which it is alleged, among other things, that we violated various bidding practices and minority contracting regulations and committed acts of fraud. If a final judgment is determined adversely to us, it may harm our reputation among other municipalities, which could preclude us from being qualified to bid on future municipal projects.
Our contracts require us to perform extra or change order work, which can result in disputes and adversely affect our working capital, profits and cash flows.
Our contracts generally require us to perform extra or change order work as directed by the client even if the client has not agreed in advance on the scope or price of the work to be performed. This process may result in disputes over whether the work performed is beyond the scope of the work included in the original project plans and specifications or, if the client agrees that the work performed qualifies as extra work, the price the client is willing to pay for the extra work. Even when the client agrees to pay for the extra work, we may be required to fund the cost of such work for a lengthy period of time until the change order is approved and funded by the client.
Also, these unapproved change orders, contract disputes or claims result in costs being incurred by us that cannot be billed currently and therefore, are reflected as “unbilled work” in our balance sheet. See Note 1(d) of Notes to Consolidated Financial Statements. To the extent actual recoveries with respect to unapproved change orders, contract disputes or claims are lower than our estimates, the amount of any shortfall will reduce our revenues and the amount of unbilled work recorded on our balance sheet, and could have a material adverse effect on our working capital, results of operations and cash flows. In addition, any delay caused by the extra work may adversely impact the timely scheduling of other project work and our ability to meet specified contract
milestone dates. For example, we are currently, along with our joint venture partners, pursuing a series of claims for additional contract time and compensation against the Massachusetts Highway Department for work performed by the joint venture on a portion of the Central Artery/Tunnel project in Boston, Massachusetts. During construction, the Massachusetts Highway Department ordered the joint venture to perform changes to the work and issued related direct cost changes with an estimated value, excluding time delay and inefficiency costs, in excess of $100 million. In addition, we encountered a number of unforeseen conditions during construction that greatly increased our cost of performance. See “Business—Legal Proceedings.”
Economic, political and other risks associated with our international operations involve risks not faced by our domestic competitors, which could adversely affect our revenue and earnings.
Approximately 10%18% of our revenuerevenues for the nine monthsyear ended September 30,December 31, 2003 waswere derived from our work on projects located outside of the United States. We expect non-U.S. projects to continue to contribute to our revenue and earnings for the foreseeable future. Our international operations expose us to risks inherent in doing business outside the United States, including:
Any of these factors could harm our international operations and, consequently, our business and consolidated operating results. Specifically, failure to successfully manage international growth could result in higher operating costs than anticipated or could delay or preclude altogether our ability to generate revenues in key international markets.
A decrease in U.S. government funding or change in government plans, particularly with respect to rebuilding Iraq and Afghanistan, as well as the risks associated with undertaking projects in these countries, could adversely affect the continuation of existing projects or the number of projects available to us in the future.
We recently performed design-build security upgrades at United States embassies and consulates throughout the world, and we are currently engaged in significant building and infrastructure re-construction activities in Iraq and Afghanistan. The United States federal government has recently approved a spending bill for the reconstruction and defense of Iraq and has allocated significant funds to the defense of United States interests around the world from the threat of terrorism. A decrease in government funding of these projects or a decision by the federal government to reduce or eliminate the use of outside contractors to perform this work would decrease the number of projects available to us and limit our ability to obtain new contracts in this area.
In addition, our projects in Iraq, Afghanistan and other areas of political and economic instability carry with them specific security and operational risks. Intentional or unintentional acts in those countries could result in damage to our construction sites or harm to our employees and could result in our decision to withdraw our operations from the area. Also, as a result of these acts, the federal government could decide to cancel or suspend our operations in these areas.
Increased regulation of the hospitality and gaming industry could reduce the number of future hospitality and gaming projects available, which, in turn, could adversely impact our future earnings.
The hospitality and gaming industry is regulated extensively by federal and state regulatory bodies, including state gaming commissions, the National Indian Gaming Commission and state and federal taxing and law enforcement agencies. From time to time, legislation is proposed in the legislatures of some of these jurisdictions that, if enacted, could adversely affect the tax, regulatory, operational or other aspects of the hospitality and gaming industry. Legislation of this type may be enacted in the future. The federal government has also previously considered a federal tax on casino revenues and may consider such a tax in the future. In addition, companies that operate in the hospitality and gaming industry are currently subject to significant state and local taxes and fees in addition to normal federal and state corporate income taxes, and such taxes and fees are subject to increase at any time. For example, a new tax law enacted in Nevada on July 22, 2003 increased the taxes applicable to Nevada gaming operations. Similar legislation or new hospitality and gaming regulations could deter future hospitality and gaming construction projects in jurisdictions in which we derive significant revenue. As a result, the enactment of such legislation or regulations could adversely impact our future earnings.
A decrease in government funding of infrastructure projects could reduce revenues within our civil construction business segment.
Our civil construction markets are dependent on the amount of infrastructure work funded by various governmental agencies which, in turn, depends on the condition of the existing infrastructure, the need for new or expanded infrastructure and federal, state or local government spending levels. A decrease in government funding of infrastructure projects could decrease the number of civil construction projects available and limit our ability to obtain new contracts, which could reduce revenues within our civil construction segment.
If we are unable to accurately estimate the overall risks, revenues or costs on a contract, we may achieve a lower than anticipated profit or incur a loss on the contract.
We generally enter into four principal types of contracts with our clients: fixed price contracts, cost plus award fee contracts, guaranteed maximum price contracts, and, to a lesser extent, construction management, or design-build, contracts. A significant portion of our revenues and backlog are derived from fixed price contracts. For example, approximately 25%18% of our revenues for the first nine months ofyear ended December 31, 2003 were derived from fixed price contracts. Fixed price contracts require us to perform the contract for a fixed price irrespective of our actual costs. As a result, we realize a profit on these contracts only if we successfully control our costs and avoid cost overruns. Cost plus award fee contracts provide for reimbursement of the costs required to complete a project, but generally have a lower base fee and an incentive fee based on cost and/or schedule performance. If our costs exceed the revenues available under such a contract or are not allowable under the provisions of the contract, we may not receive reimbursement for these costs. Guaranteed maximum price contracts provide for a cost plus fee arrangement up to a maximum agreed-upon price. These contracts also place the risk on us for cost overruns that exceed the guaranteed maximum price. Construction management and design-build contracts are those under which we agree to manage a project for the client for an agreed upon fee, which may be fixed or may vary based upon negotiated factors. Profitability on these types of contracts is driven by changes in the scope of work or design issues, which could cause cost overruns beyond our control and limit profits on these contracts.
Cost overruns, whether due to inefficiency, faulty estimates or other factors, result in lower profit or a loss on a project. A significant number of our contracts are based in part on cost estimates that are subject to a number of assumptions. If our estimates of the overall risks, revenues or costs prove inaccurate or circumstances change, then we may incur a lower profit or a loss on the contract.
The percentage-of-completion method of accounting for contract revenue may result in material adjustments, which could result in a charge against our earnings.
We recognize contract revenue using the percentage-of-completion method. Under this method, estimated contract revenue is recognized by applying the percentage of completion of the project for the period to the total
estimated revenue for the contract. Estimated contract losses are recognized in full when determined. Contract revenue and total cost estimates are reviewed and revised at a minimum on a quarterly basis as the work progresses and as change orders are approved, and adjustments based upon the percentage of completion are reflected in contract revenue in the period when these estimates are revised. To the extent that these adjustments result in an increase, a reduction or an elimination of previously reported contract profit, we recognize a credit or a charge against current earnings, which could be material.
We are subject to a number of risks as a government contractor, which could harm our reputation, result in fines or penalties against us and/or adversely impact our financial condition.
We are a major provider of services to government agencies and therefore are exposed to risks associated with government contracting. For example, we must comply with and are affected by laws and regulations relating to the formation, administration and performance of government contracts, such as the Federal Acquisition Regulation, the Cost Accounting Standards and Department of Defense security regulations. A violation of these laws or regulations could require us to pay fines and penalties, result in the termination of existing contracts or result in our being suspended from future government contracts. If a government agency determines that we or a subcontractor engaged in improper conduct, we may be subject to civil and criminal penalties and administrative sanctions, including termination of contracts, forfeiture of profits, suspension of payments, fines and suspension or prohibition from doing business with the government, any of which could impact our future earnings or harm our reputation.
Government clients generally can terminate or modify their contract with us at their convenience and some government contracts must be renewed annually. If a government client terminates or fails to renew a contract, our backlog may be reduced. If a government client terminates a contract due to our unsatisfactory performance, it could result in liability to us and harm our ability to compete for future contracts.
We have been, are and will be in the future, the subject of audits and cost reviews by contracting agencies, such as the United States Defense Contract Audit Agency, or the DCAA. These agencies review a contractor’s performance and may disallow costs if the agency determines that we accounted for such costs in a manner inconsistent with Cost Accounting Standards or other regulatory and contractual requirements. Therefore, a negative audit could result in a substantial adverse adjustment to our revenues and costs, harm our reputation and result in civil and criminal penalties.
Our participation in construction joint ventures exposes us to liability and/or reputational harm for failures of our partners.
We sometimes enter into joint venture arrangements with outside partners on a joint and several basis so that we can jointly bid on and execute a particular project and reduce our financial or operational risk with respect to such projects. Success on these joint projects depends in large part on whether our joint venture partners satisfy their contractual obligations. If a joint venture partner fails to perform or is financially unable to bear its portion of required capital contributions, we could be required to make additional investments and provide additional services in order to make up for our partner’s shortfall. Further, if we are unable to adequately address our partner’s performance issues, the client may terminate the project, which could result in legal liability to us, harm our reputation and reduce profit on a project.
Our pension plan is underfunded and we may be required to make significant future contributions to the plan.
Our defined benefit pension plan is a non-contributory pension plan covering substantially all of our employees. As of December 31, 2002,2003, our pension plan was underfunded by approximately $32.3$37.2 million. We are required to make cash contributions to our pension plan to the extent necessary to comply with minimum funding requirements imposed by employee benefit and tax laws. The amount of any such required contributions
is determined based on an annual actuarial valuation of the plan as performed by the plan’s actuaries. During 2002,2003, we contributed $2.4$3.0 million in cash to our defined benefit pension plan, of which $2.2 million was voluntary. Through September 30, 2003, we contributed $3.1 million to our defined benefit pension plan, of which $3.0 million was voluntary.plan. The amount of future contributions will depend upon asset returns, then-current discount rates and a number of other factors, and, as a result, the amount we may elect or be required to contribute to our pension plan in the future may increase significantly. See “Management’s Discussion and Analysis of Financial Condition and Results of Operations—Critical Accounting Policies—Defined Benefit Retirement Plan.”
The construction services industry is highly schedule driven, and our failure to meet schedule requirements of our contracts could adversely affect our reputation and/or expose us to financial liability.
Many of our contracts are subject to specific completion schedule requirements with liquidated damages charged to us in the event the construction schedules are not achieved. Failure to meet any such schedule requirements could cause us to suffer damage to our reputation within our industry and client base, as well as pay significant liquidated damages.
Procurement of new project awards is very competitive and our failure to compete effectively could reduce our market share and profits.
New project awards are often determined through either a competitive bid basis or a negotiated basis. Bids or negotiated contracts with public or private owners are generally awarded based upon price, but many times other factors, such as shorter project schedules or prior experience with the owner, result in the award of the contract. Within our industry, we compete with many national, regional and local construction firms. Some of these competitors have achieved greater market penetration than we have in the markets in which we compete, and some have greater financial and other resources than we do. As a result, we may need to accept lower contract margins or more fixed price or unit price contracts in order for us to compete against competitors that have the ability to accept awards at lower prices or have a pre-existing relationship with the owner. If we are unable to compete successfully in such markets, our relative market share and profits could be reduced.
Economic downturns could reduce the level of consumer spending within the hospitality and gaming industry, which could adversely affect demand for our services.
Consumer spending in the hospitality and gaming industry is discretionary and may decline during economic downturns, when consumers have less disposable income. Even an uncertain economic outlook may adversely affect consumer spending in hospitality and gaming operations, as consumers may spend less in anticipation of a potential economic downturn. Decreased spending in the hospitality and gaming market could deter new projects within the industry and the expansion or renovation of existing hospitality and gaming facilities, which could impact our revenues and earnings.
An inability to obtain bonding could limit the number of projects we are able to pursue.
As is customary in the construction business, we often are required to provide surety bonds to secure our performance under construction contracts. Our ability to obtain surety bonds primarily depends upon our capitalization, working capital, past performance, management expertise and certain external factors, including the overall capacity of the surety market. Surety companies consider such factors in relationship to the amount of our backlog and their underwriting standards, which may change from time to time. Since 2001, the surety industry has undergone significant changes with several companies withdrawing completely from the industry or significantly reducing their bonding commitment. In addition, certain re-insurers of surety risk have limited their participation in this market. Therefore, we may be unable to obtain surety bonds, which could adversely affect our results of operations and revenues.
Conflicts of interest may arise with respect to our Chairman and Chief Executive Officer.
Ronald N. Tutor, our chief executive officer and chairman of our Board of Directors, is the sole shareholder and chief executive officer of Tutor-Saliba Corporation, or Tutor-Saliba, a California corporation that beneficially
owns approximately 27% of our common stock. Mr. Tutor also devotes a substantial amount of time to the business activities of Tutor-Saliba. Tutor-Saliba is engaged in the construction industry, and, as described under “Certain Transactions,” we have participated in joint ventures with Tutor-Saliba and expect to continue to do so. Although our joint ventures with Tutor-Saliba are discussed with our Audit Committee, transactions we enter into with Tutor-Saliba could be influenced by Mr. Tutor. As in any joint venture, we could have disagreements with Tutor-Saliba over the operation of the joint ventures or the joint ventures could be involved in disputes with third parties, such as the litigation described under “Business—Legal Proceedings,” where we may or may not have an identity of interest with Tutor-Saliba. When such situations arise, we may feel constrained in aggressively pursuing all options available to us because of Mr. Tutor’s importance to us as our Chief Executive Officer and Chairman and a significant shareholder. If we face such a situation and elect to pursue options against Tutor-Saliba, it is possible that Mr. Tutor or we could terminate his management relationship with us, which could harm our reputation and impact our ability to procure future projects.
We could incur significant costs as a result of liability under environmental laws.
Our operations are subject to environmental laws and regulations governing among other things, the discharge of pollutants to air and water, the handling, storage and disposal of solid or hazardous materials or wastes and the remediation of contamination, sometimes associated with leaks or releases of hazardous substances. For example, we own, lease, or have used, in our construction, real estate and environmental remediation operations property upon which solid or hazardous wastes may have been disposed of or released. Any release of such materials or wastes by us or by third parties who operated on these properties may result in liability for investigation or remediation costs. In addition, violations of these environmental laws and regulations could subject us and our management to fines, civil and criminal penalties, cleanup costs and third party property damage or personal injury claims.
Various federal, state and local environmental laws and regulations may impose liability for the entire cost of investigation and clean-up of hazardous or toxic substances. These laws may impose liability without regard to ownership at the time of the contamination or whether or not we caused the presence of contaminants.
If we are unable to attract and retain key personnel, our reputation may be harmed and our future earnings may be negatively impacted.
Our business substantially depends on the continued service of key members of our management, particularly Ronald N. Tutor, Robert Band, Craig W. Shaw, Zohrab B. Marashlian and Michael E. Ciskey who, collectively, have an average of 29 years in the construction industry and 23 years with us. The loss of the services of any of our key senior management could have a material adverse effect on us. Our future success will also depend on our ability to attract and retain highly skilled personnel, such as engineering, project management and senior management professionals. Competition for these employees is intense, and we could experience difficulty from time to time in hiring and retaining the personnel necessary to support our business. If we do not succeed in retaining our current employees and attracting new high quality employees, our reputation may be harmed and our future earnings may be negatively impacted.
Work stoppages and other labor problems could adversely affect portions of our business, financial position, results of operations and cash flows.
We are a signatory to numerous local and regional collective bargaining agreements, both directly and through trade associations. Future agreements reached in collective bargaining could increase our operating expenses and reduce our profits as a result of increased wages and benefits. If the industry were unable to negotiate with any of the unions, it could result in strikes, work stoppages or increased operating costs as a result of higher than anticipated wages or benefits. If the unionized workers engage in a strike or other work stoppage, or other employees become unionized, we could experience a disruption of our operations and higher ongoing labor costs, which could adversely affect portions of our business, financial position, results of operations and cash flows.
We are subject to restrictive covenants under our credit facility that could limit our flexibility in managing the business.
Our credit facility imposes operating and financial restrictions on us. These restrictions include, among other things, limitations on our ability to:
In addition, our credit facility prohibits us from incurring any debt, other than debt incurred for financing our corporate headquarters, insurance premiums and construction equipment, from other sources without the consent of our lenders. The amount available to us under our credit facility at September 30,December 31, 2003 was $30.2$67.2 million.
Our credit facility contains financial covenants that require us to maintain specified working capital, tangible net worth and operating profit levels. Our credit facility also requires us to comply with a minimum interest coverage ratio. Our ability to borrow funds for any purpose will depend on our satisfying these tests. If we are unable to meet the terms of the financial covenants or fail to comply with any of the other restrictions contained in our credit facility, an event of default could occur. An event of default, if not waived by our lenders, could result in the acceleration of any outstanding indebtedness, causing such debt to become immediately due and payable. If such an acceleration occurs, we may not be able to repay such indebtedness on a timely basis. As our credit facility is secured by substantially all of our assets, acceleration of this debt could result in foreclosure of those assets. In the event of a foreclosure, we would be unable to conduct our business and may be forced to discontinue ongoing operations.
We may have difficulty raising needed capital in the future, which could limit our available working capital and our ability to make acquisitions or future investments.
We may require additional financing in order to make future investments, make acquisitions or provide needed additional working capital. Our ability to arrange such financing in the future will depend in part upon prevailing capital market conditions, as well as conditions in our business and our operating results; such factors may impact our efforts to arrange additional financing on terms satisfactory to us. We have pledged substantially all of our assets as collateral in connection with our credit facility. As a result, we may have difficulty obtaining additional financing in the future if such financing requires us to pledge our assets as collateral. Also, under our credit facility, we must obtain the consent of our lenders to incur any amount of additional debt from other sources. If additional financing is obtained by the issuance of additional shares of common stock, control of Perini may change and stockholders may suffer dilution. If adequate funds are not available, or are not available on acceptable terms, we may not be able to make future investments, take advantage of acquisition or other opportunities, or otherwise respond to competitive challenges.
Timing of the award and performance of new contracts could have an adverse effect on our operating results.
At any point in time, a substantial portion of our revenues is directly or indirectly derived from a limited number of large construction projects. It is generally very difficult to predict whether and when we will receive such awards as these contracts frequently involve a lengthy and complex bidding and selection process which is affected by a number of factors, such as market conditions, financing arrangements and governmental approvals. Because a significant portion of our revenue is generated from large projects, our results of operations and cash flows can fluctuate from quarter to quarter depending on the timing of our new contract awards.
In addition, timing of the revenues, earnings and cash flows from our projects can be delayed by a number of factors, including weather conditions, delays in receiving material and equipment from vendors and changes in the scope of work to be performed. Such delays, if they occur, could have an adverse effect on our operating results for a particular period.
We may not be able to fully realize the revenue value reported in our backlog.
As of September 30,December 31, 2003, our backlog was approximately $1.3 billion.$1,666.5 million. We include a construction project in our backlog at such time as a contract is awarded or a firm letter of commitment is obtained and funding is in place. The revenue projected in our backlog may not be realized or, if realized, may not result in profits. For example, if a project reflected in our backlog is terminated, suspended or reduced in scope, it would result in a reduction to our backlog which would reduce, potentially to a material extent, the revenue and profit we actually receive from contracts in backlog. If a client cancels a project, we may be reimbursed for certain costs but typically have no contractual right to the total revenues reflected in our backlog. Significant cancellations or delays of projects in our backlog could have a material adverse effect on our revenues and profits.
We have not paid dividends on our $21.25 Preferred Stock in several years and are currently in litigation with certain of our preferred stockholders.
Under the terms of our $21.25 Preferred Stock, the holders of shares of our $21.25 Preferred Stock are entitled to receive an annual cash dividend of $21.25 per share when and as declared by the Board of Directors out of funds legally available for such purposes. We have not paid dividends on our $21.25 Preferred Stock since 1995, though they have been fully accrued due to the “cumulative” feature of the $21.25 Preferred Stock. The holders of our $21.25 Preferred Stock have the right to elect two directors to our board in the event that dividends are in arrears for at least six quarters, and they have done so at each of our last six annual meetings of stockholders. We are currently in litigation with certain holders of our $21.25 Preferred Stock. See “Management’s Discussion and Analysis of Financial Condition and Results of Operations—Dividends” and “Business—Legal Proceedings—$21.25 Preferred Shareholders Class Action Lawsuit.” If this litigation results in a final judgment against us, and such adverse judgment is significant, it could have a material adverse effect on our revenues and profits.
Our acquisition strategy involves a number of risks, which could adversely impact our future revenues and the revenues of the businesses that we acquire.
As a part of our growth strategy, we plan to pursue selective strategic acquisitions of businesses. This strategy involves risks, including diversion of management’s attention, potential loss of key employees of acquired businesses and difficulties in integrating operations and systems. We cannot be certain that we will be able to locate suitable acquisitions or consummate any such transactions on terms and conditions acceptable to us or that such transactions will be successful. An inability to successfully integrate acquired businesses into our operations could result in significant losses for us.
Risks Relating to Our Common Stock
This offering will result in a substantial amount of previously unregistered shares of our common stock being registered, which may depress the market price of our common stock.
As of December 15, 2003,February 23, 2004, the number of shares of our outstanding common stock freely tradeable on the American Stock Exchange and not owned by our officers, directors, or affiliates was approximately 5.55.4 million. The sale of the shares of common stock in this offering could depress the market price of our common stock.
Future sales of a substantial amount of our common stock may cause our stock price to decline.
Upon completing this offering, we will have approximately 22.923.0 million shares of common stock outstanding. Our principal stockholders, directors and executive officers will own approximately 11.5 million of
these shares. These stockholders will be free to sell those shares, subject to the limitations of Rule 144 or Rule 144(k) under the Securities Act of 1933, as amended (which are discussed under “Shares Eligible for Future Sale”), applicable restrictions on transfer contained in our shareholders agreement and, subject to certain exceptions, the 90-day lock-up agreements that these stockholders will enter into with the underwriters. See “Underwriting.” In addition, after giving effect to the sale of shares in this offering (excluding any exercise of the over-allotment option granted to the underwriters), the holders of approximately11.8 million of our shares (including warrants to purchase 420,000 shares of our common stock which are not subject to lock-up agreements) have the right to require us to register all or part of their shares under registration rights agreements. See “Description of Capital Stock—Registration Rights Agreements” for a more detailed discussion of the registration rights agreements. Registration of these restricted shares of common stock would permit their sale into the public market immediately. See “Shares Eligible for Future Sale.” We cannot predict when these stockholders may sell their shares or in what volumes. However, the market price of our common stock could decline significantly if these stockholders sell a large number of shares into the public market after this offering or if the market believes that these sales may occur.
We may also issue our common stock from time to time as consideration for future acquisitions and investments. In the event any such acquisition or investment is significant, the number of shares of our common stock that we may issue could in turn be significant. In addition, we may also grant registration rights covering those shares in connection with any such acquisitions and investments.
Limited trading volume of our common stock may contribute to its price volatility.
Our common stock is traded on the American Stock Exchange. For the fourth quarter of 2003, the average daily trading volume for our common stock as reported by the American Stock Exchange was approximately 22,400 shares. Even if we achieve a wider dissemination by means of the shares offered pursuant to this prospectus, we are uncertain as to whether a more active trading market in our common stock will develop. As a result, relatively small trades may have a significant impact on the price of our common stock.
Our stock price has been and may continue to be volatile and may result in substantial losses for investors.
The market price of our common stock has been, and is likely to continue to be, volatile. Since January 1, 2003, the market price for our common stock has been as high as $14.90$16.70 per share and as low as $3.62 per share. Additionally, the stock market in general has been highly volatile since 2000. This volatility in stock price often has been unrelated to our operating performance.
In addition, the trading price of our common stock could be subject to wide fluctuations in response to:
Fluctuations in our stock price as a result of any of the foregoing factors may result in substantial losses for investors.
Fluctuations in our quarterly revenues and operating results may lead to reduced prices for our stock.
Because our operating results are primarily generated from a limited number of significant active construction projects, operating results in any given fiscal quarter can vary depending on the timing of progress
achieved and changes in the estimated profitability of the projects being reported. Progress on projects in certain areas may also be delayed by weather conditions. Such delays, if they occur, may result in inconsistent quarterly operating results due to more or less progress than anticipated being achieved on certain projects, which may in turn lead to reduced prices for our stock.
Ownership of our common stock is concentrated among a few stockholders who could act in a way that favors their interests to the detriment of our interests and those of other stockholders.
Following this offering and assuming that all of the selling stockholders sell all of the shares of common stock being registered in this offering, the percentage of shares owned by our executive officers, directors and 5% stockholders would be reduced to 50.2%49.8%. These stockholders have the powerability to controlsignificantly influence the outcome of the election of most of our directors, and the approval of any action requiring majority approval of our common stockholders, including certain amendments to our charter. In addition, without the consent of these stockholders, we may not be able to enter into transactions that could be beneficial to us or our other stockholders.
Provisions of Massachusetts law and of our charter and bylaws may make a takeover of us more difficult, which could impede the ability of our stockholders to benefit from a change in control or to change our management and Board of Directors.
Provisions in our restated articles of organization and bylaws and in the Massachusetts corporate law may make it difficult and expensive for a third party to pursue a tender offer, change in control or takeover attempt which is opposed by our management and Board of Directors. Public stockholders who might desire to participate in such a transaction may not have an opportunity to do so. Our bylaws provide for a staggered Board of Directors which makes it difficult for stockholders to change the composition of the Board of Directors in any one year. Our Board of Directors has the authority to issue preferred stock with voting or other rights or preferences that could impede the success of any attempt to effect a change in control or takeover of Perini. Also, we have adopted a rights plan that limits the ability of any person to acquire more than 10% of our common stock, except in limited circumstances. These anti-takeover provisions could substantially impede the ability of public stockholders to benefit from a change in control or to change our management and Board of Directors. See “Description of Capital Stock.”
CAUTIONARY NOTE REGARDING FORWARD-LOOKING STATEMENTS
The statements contained in this prospectus, including under the section titled “Management’s Discussion and Analysis of Financial Condition and Results of Operations,” and other sections of this prospectus that are not purely historical are forward-looking statements within the meaning of Section 27A of the Securities Act of 1933 and Section 21E of the Securities Exchange Act of 1934, including without limitation, statements regarding Perini’s or our management’s expectations, hopes, beliefs, intentions or strategies regarding the future. These forward-looking statements are based on our current expectations and beliefs concerning future developments and their potential effects on us. There can be no assurance that future developments affecting us will be those that we have anticipated. These forward-looking statements involve a number of risks, uncertainties (some of which are beyond our control) or other assumptions that may cause actual results or performance to be materially different from those expressed or implied by such forward-looking statements. These risks and uncertainties include, but are not limited to, those factors described under the heading “Risk Factors.” We undertake no obligation to publicly update or revise any forward-looking statements, whether as a result of new information, future events or otherwise except as may be required under applicable securities laws.
We will not receive any proceeds from the sale of shares by the selling stockholders or the additional shares to be sold by the selling stockholders if the underwriters exercise their over-allotment option.
We have not paid any cash dividends on our common stock since 1990. For the foreseeable future, we intend to retain any earnings in our business and we do not anticipate paying any cash dividends. In addition, under the terms of our preferred stock, we cannot pay dividends on our common stock until all accrued dividends on our preferred stock have been paid. Whether or not to declare any dividends will be at the discretion of our Board of Directors, considering then existing conditions, including our financial condition and results of operations, capital requirements, bonding prospects, contractual restrictions, business prospects and other factors that our Board of Directors considers relevant.
MARKET PRICE OF OUR COMMON STOCK
Our common stock is traded on the American Stock Exchange under the symbol “PCR.” The quarterly market high and low sales prices for our common stock for 2004 (through March 2,16, 2004), 2003, and 2002 are summarized below:
| High | Low | High | Low | |||||||
Year Ending December 31, 2002 | ||||||||||
First Quarter | 7.28 | 5.75 | $ | 7.28 | $ | 5.75 | ||||
Second Quarter | 6.40 | 3.40 | 6.40 | 3.40 | ||||||
Third Quarter | 4.58 | 3.50 | 4.58 | 3.50 | ||||||
Fourth Quarter | 4.44 | 3.00 | 4.44 | 3.00 | ||||||
Year Ending December 31, 2003 | ||||||||||
First Quarter | 4.70 | 3.62 | 4.70 | 3.62 | ||||||
Second Quarter | 9.05 | 3.80 | 9.05 | 3.80 | ||||||
Third Quarter | 8.99 | 6.26 | 8.99 | 6.26 | ||||||
Fourth Quarter | 10.10 | 6.95 | 10.10 | 6.95 | ||||||
Year ending December 31, 2004 | ||||||||||
First Quarter (through March 2, 2004) | 14.90 | 8.80 | ||||||||
First Quarter (through March 16, 2004) | 16.70 | 8.80 | ||||||||
On March 2,16, 2004, the closing sale price of our common stock as reported on the American Stock Exchange was $13.70$16.47 per share. At March 2,16, 2004, there were 1,0411,038 holders of record of our common stock, based on the stockholders list maintained by our transfer agent.
Our common stock is listed on the American Stock Exchange. We have applied for the listing of our common stock on the New York Stock Exchange. We expect our common stock to begin trading on the New York Stock Exchange in April 2004 under the symbol “PCR.”
The table below sets forth our consolidated short-term debt and capitalization as of September 30,December 31, 2003 (in thousands, except share data). We have not provided an adjusted capitalization table because we will not receive any of the proceeds from this offering. You should read the following information in conjunction with our consolidated financial statements and related notes and the information provided under the captions “Selected Historical Financial Data” and “Management’s Discussion and Analysis of Financial Condition and Results of Operations” which are included elsewhere in this prospectus.
Short-term debt: | ||||||||
Notes payable to banks | $ | – | $ | – | ||||
Current maturities of long-term debt | 831 | 490 | ||||||
Total short-term debt | $ | 831 | $ | 490 | ||||
Long-term debt: | ||||||||
Mortgages on real estate | $ | 8,489 | $ | 8,426 | ||||
Revolving credit loans (1) | 17,000 | — | ||||||
Other indebtedness | 77 | 96 | ||||||
Total long-term debt | 25,566 | 8,522 | ||||||
Stockholders’ equity: | ||||||||
Preferred stock, $1.00 par value | ||||||||
Authorized - 1,000,000 shares | ||||||||
Designated, issued and outstanding – 55,927 shares, aggregate liquidation preference of $13,982 | 56 | 56 | ||||||
Series A junior participating preferred stock, $1.00 par value | ||||||||
Designated - 200,000 shares | ||||||||
Issued – none | – | – | ||||||
Stock purchase warrants | 2,233 | 2,233 | ||||||
Common stock, $1.00 par value | ||||||||
Authorized - 40,000,000 shares (2) | ||||||||
Issued – 22,903,064 shares (2) | 22,903 | |||||||
Issued – 22,946,064 shares (2) | 22,946 | |||||||
Paid-in surplus (2) | 91,137 | 90,296 | ||||||
Retained earnings | 7,719 | 30,007 | ||||||
Less - common stock in treasury, at cost - 60,529 shares (2) | (965 | ) | (965 | ) | ||||
Accumulated other comprehensive loss | (19,573 | ) | (24,013 | ) | ||||
Total stockholders’ equity | 103,510 | 120,560 | ||||||
Total capitalization | $ | 129,076 | $ | 129,082 | ||||
| (1) | The revolving credit facility provides for revolving loans up to a maximum of $50 million to June 20, 2005, at which time any amounts unpaid convert to a three-year term loan with equal quarterly principal payments. The weighted average interest rate at |
| (2) | As of |
SELECTED HISTORICAL CONSOLIDATED FINANCIAL DATA
The selected historical consolidated financial data shown below for the five-year period ended December 31, 20022003 has been derived from our consolidated financial statements audited by Deloitte & Touche LLP (three-year(four-year period ended December 31, 2002)2003) and by Arthur Andersen LLP (two-year(one-year period ended December 31, 1999), our current and former independent auditors, respectively.
The information for the nine months ended September 30, 2003 and 2002 has been derived from unaudited consolidated condensed financial statements and, in our opinion, includes all adjustments (consisting only of normal recurring adjustments) necessary to present fairly such financial information in accordance with generally accepted accounting principles applied on a consistent basis. Our results are generated from a limited number of significant active construction projects. Consequently, quarterly results can vary depending on the timing of progress and changes in the estimated profitability of the projects being reported. For the foregoing and other reasons, results for the nine months ended September 30, 2003 may not necessarily be indicative of results to be expected for the full year ended December 31, 2003. Backlog and new business awarded are not measures defined in generally accepted accounting principles and have not been derived from our consolidated financial statements. The selected historical consolidated financial data should be read in conjunction with our consolidated financial statements and related notes, “Capitalization” and “Management’s Discussion and Analysis of Financial Condition and Results of Operations,” which are included elsewhere in this prospectus.
| Nine Months Ended September 30, | Year Ended December 31, | Year Ended December 31, | ||||||||||||||||||||||||||||||||||||||||||
| 2003 | 2002 | 2002 | 2001 | 2000 | 1999 | 1998 | 2003 | 2002 | 2001 | 2000 | 1999 | |||||||||||||||||||||||||||||||||
| (in thousands, except per share data) | (in thousands, except per share data) | |||||||||||||||||||||||||||||||||||||||||||
Statement of Operations Data: | ||||||||||||||||||||||||||||||||||||||||||||
CONTINUING OPERATIONS: | ||||||||||||||||||||||||||||||||||||||||||||
Revenues | $ | 873,451 | $ | 822,482 | $ | 1,085,041 | $ | 1,553,396 | $ | 1,105,660 | $ | 1,019,484 | $ | 1,011,322 | $1,374,103 | $ | 1,085,041 | $ | 1,553,396 | $ | 1,105,660 | $ | 1,019,484 | |||||||||||||||||||||
Cost of Operations | 829,590 | 784,744 | 1,026,391 | 1,495,834 | 1,053,328 | 969,015 | 957,651 | |||||||||||||||||||||||||||||||||||||
Cost Of Operations | 1,303,851 | 1,026,391 | 1,495,834 | 1,053,328 | 969,015 | |||||||||||||||||||||||||||||||||||||||
Gross Profit | 43,861 | 37,738 | 58,650 | 57,562 | 52,332 | 50,469 | 53,671 | 70,252 | 58,650 | 57,562 | 52,332 | 50,469 | ||||||||||||||||||||||||||||||||
G&A Expense | 27,709 | 22,132 | 32,770 | 28,061 | 24,977 | 26,635 | 27,397 | 39,762 | 32,770 | 28,061 | 24,977 | 26,635 | ||||||||||||||||||||||||||||||||
Income From Operations | 16,152 | 15,606 | 25,880 | 29,501 | 27,355 | 23,834 | 26,274 | |||||||||||||||||||||||||||||||||||||
Income From Construction Operations | 30,490 | 25,880 | 29,501 | 27,355 | 23,834 | |||||||||||||||||||||||||||||||||||||||
Other (Income) Expense, Net | 428 | 360 | 520 | 227 | (949 | ) | (72 | ) | 652 | (1,435) | 520 | 227 | (949 | ) | (72 | ) | ||||||||||||||||||||||||||||
Interest Expense | 701 | 1,146 | 1,485 | 2,006 | 3,966 | 7,128 | 8,473 | 1,003 | 1,485 | 2,006 | 3,966 | 7,128 | ||||||||||||||||||||||||||||||||
Income Before Income Taxes | 15,023 | 14,100 | 23,875 | 27,268 | 24,338 | 16,778 | 17,149 | 30,922 | 23,875 | 27,268 | 24,338 | 16,778 | ||||||||||||||||||||||||||||||||
Provision (Credit) for Income Taxes | (6,410 | ) | 551 | 801 | 850 | (43 | ) | 421 | 1,100 | |||||||||||||||||||||||||||||||||||
(Provision) Credit For Income Taxes | 13,096 | (801 | ) | (850 | ) | 43 | (421 | ) | ||||||||||||||||||||||||||||||||||||
Income From Continuing Operations | 21,433 | 13,549 | 23,074 | 26,418 | 24,381 | 16,357 | 16,049 | 44,018 | 23,074 | 26,418 | 24,381 | 16,357 | ||||||||||||||||||||||||||||||||
DISCONTINUED OPERATIONS: | ||||||||||||||||||||||||||||||||||||||||||||
Loss From Operations | – | – | – | – | – | (694 | ) | (4,397 | ) | |||||||||||||||||||||||||||||||||||
Loss on Disposal of Real Estate Business Segment | – | – | – | – | – | (99,311 | ) | – | ||||||||||||||||||||||||||||||||||||
Loss From Discontinued Operations | – | – | – | – | – | (100,005 | ) | (4,397 | ) | – | – | – | – | (100,005 | ) | |||||||||||||||||||||||||||||
Net Income (Loss) | $ | 21,433 | $ | 13,549 | $ | 23,074 | $ | 26,418 | $ | 24,381 | $ | (83,648 | ) | $ | 11,652 | $ | 44,018 | $ | 23,074 | $ | 26,418 | $ | 24,381 | $ | (83,648 | ) | ||||||||||||||||||
Income Available for Common Stockholders (1) | $ | 27,331 | $ | 11,955 | $ | 20,949 | $ | 24,293 | $ | 7,299 | $ | (89,917 | ) | $ | 5,743 | |||||||||||||||||||||||||||||
Income Available For Common Stockholders (1) | $ | 49,619 | $ | 20,949 | $ | 24,293 | $ | 7,299 | $ | (89,917 | ) | |||||||||||||||||||||||||||||||||
Per Share Of Common Stock: | ||||||||||||||||||||||||||||||||||||||||||||
Basic Earnings (Loss): | ||||||||||||||||||||||||||||||||||||||||||||
Income From Continuing Operations | $ | 2.18 | $ | 0.92 | $ | 1.07 | $ | 0.39 | $ | 1.80 | ||||||||||||||||||||||||||||||||||
Loss From Discontinued Operations | — | — | — | — | (17.84 | ) | ||||||||||||||||||||||||||||||||||||||
Total | $ | 2.18 | $ | 0.92 | $ | 1.07 | $ | 0.39 | $ | (16.04 | ) | |||||||||||||||||||||||||||||||||
Diluted Earnings (Loss): | ||||||||||||||||||||||||||||||||||||||||||||
Income From Continuing Operations | $ | 2.10 | $ | 0.91 | $ | 1.04 | $ | 0.39 | $ | 1.80 | ||||||||||||||||||||||||||||||||||
Loss From Discontinued Operations | — | — | — | — | (17.84 | ) | ||||||||||||||||||||||||||||||||||||||
Total | $ | 2.10 | $ | 0.91 | $ | 1.04 | $ | 0.39 | $ | (16.04 | ) | |||||||||||||||||||||||||||||||||
Weighted Average Common Shares Outstanding: | ||||||||||||||||||||||||||||||||||||||||||||
Basic | 22,763 | 22,664 | 22,623 | 18,521 | 5,606 | |||||||||||||||||||||||||||||||||||||||
Diluted | 23,583 | 22,939 | 23,442 | 18,527 | 5,606 | |||||||||||||||||||||||||||||||||||||||
Balance Sheet Data (end of period): | ||||||||||||||||||||||||||||||||||||||||||||
Total Assets | $ | 565,443 | $ | 402,389 | $ | 501,241 | $ | 487,478 | $ | 385,767 | ||||||||||||||||||||||||||||||||||
Working Capital | 125,397 | 115,908 | 93,369 | 80,477 | 48,430 | |||||||||||||||||||||||||||||||||||||||
Long-term Debt, Less Current Maturities | 8,522 | 12,123 | 7,540 | 17,218 | 41,091 | |||||||||||||||||||||||||||||||||||||||
Stockholders’ Equity (Deficit) | 120,560 | 86,649 | 79,408 | 60,622 | (36,618 | ) | ||||||||||||||||||||||||||||||||||||||
Redeemable Series B Cumulative Convertible Preferred Stock | — | — | — | — | 37,685 | |||||||||||||||||||||||||||||||||||||||
Per Share of Common Stock: Basic Earnings (Loss): Income from Continuing Operations (2) Loss From Discontinued Operations Estimated Loss on Disposal Total Diluted Earnings (Loss): Income From Continuing Operations (2) Loss From Discontinued Operations Estimated Loss on Disposal Total Weighted Average Common Shares Outstanding: Basic Diluted Total Assets (3) Working Capital Long-term Debt, Less Current Maturities Stockholders’ Equity (Deficit) Redeemable Series B Cumulative Convertible Preferred Stock Depreciation and Amortization Capital Expenditures Backlog (end of period) (4) New Business Awarded (5) Other Data: Depreciation and Amortization Capital Expenditures Backlog (end of period) (2) New Business Awarded (3) Nine Months Ended
September 30, Year Ended December 31, 2003 2002 2002 2001 2000 1999 1998 (in thousands, except per share data) $ 1.20 $ 0.53 $ 0.92 $ 1.07 $ 0.39 $ 1.80 $ 1.91 — — — — — (0.12 ) (0.83 ) — — — — — (17.72 ) — $ 1.20 $ 0.53 $ 0.92 $ 1.07 $ 0.39 $ (16.04 ) $ 1.08 $ 1.17 $ 0.52 $ 0.91 $ 1.04 $ 0.39 $ 1.80 $ 1.91 — — — — — (0.12 ) (0.83 ) — — — — — (17.72 ) — $ 1.17 $ 0.52 $ 0.91 $ 1.04 $ 0.39 $ (16.04 ) $ 1.08 22,726 22,664 22,664 22,623 18,521 5,606 5,318 23,399 23,028 22,939 23,442 18,527 5,606 5,318 Balance Sheet Data (end of period): $ 464,412 $ 395,326 $ 402,389 $ 501,241 $ 487,478 $ 385,767 $ 452,496 122,110 130,346 115,908 93,369 80,477 48,430 57,665 25,566 33,700 12,123 7,540 17,218 41,091 75,857 103,510 91,364 86,649 79,408 60,622 (36,618 ) 50,558 — — — — — 37,685 33,540 Other Data: $ 2,524 $ 2,309 $ 3,202 $ 2,602 $ 2,191 $ 3,342 $ 3,059 4,406 3,710 4,510 4,528 1,793 1,599 1,418 1,332,148 1,124,818 990,175 1,213,535 1,788,731 1,658,077 1,232,256 1,215,423 733,256 861,681 978,200 1,236,314 1,445,305 934,124 Year Ended December 31, 2003 2002 2001 2000 1999 (in thousands, except per share data) $ 3,389 $ 3,202 $ 2,602 $ 2,191 $ 3,342 5,399 4,510 4,528 1,793 1,599 1,666,464 990,175 1,213,535 1,788,731 1,658,077 2,050,392 861,681 978,200 1,236,314 1,445,305
| (1) | Income available for common stockholders includes adjustments to net income for (a) accrued and unpaid dividends on our $21.25 Preferred Stock, or $2.125 Depositary Shares, (b) the reversal of previously accrued and unpaid dividends in the amount of approximately $7.3 million applicable to 440,627 of the $2.125 Depositary Shares purchased and retired by us on June 9, 2003, (c) dividends declared and paid on our Series B Preferred Stock until its exchange for shares of common stock on March 29, 2000 and (d) the $13.7 million assigned to the induced conversion of the Series B Preferred Stock into common stock on March 29, |
| (2) |
| A construction project is included in our backlog at such time as a contract is awarded or a firm letter of commitment is obtained and funding is in place. Backlog is not a measure defined in generally accepted accounting principles, or GAAP, and our backlog may not be comparable to the backlog of other companies. Management uses backlog to assist in forecasting future results. |
| New business awarded consists of the original contract price of projects added to our backlog in accordance with Note |
MANAGEMENT’S DISCUSSION AND ANALYSIS OF
FINANCIAL CONDITION AND RESULTS OF OPERATIONS
GeneralOverview
We were incorporated in 1918 as a successor to businesses which had been engaged in providing construction services since 1894. We provide diversified general contracting, construction management and design-build services to private clients and public agencies throughout the world. Our construction business is now conducted through three businessbasic segments or operations: building, civil and management services. The general contracting and management services that we provide consist of general contracting, preconstruction planning and comprehensive project management services, including planning and scheduling the manpower, equipment, materials and subcontractors required for the timely completion of a project in accordance with the terms and specifications contained in a construction contract. We also offer self-performed construction services including site work, concrete forming and placement and steel erection. We provide these services by using traditional general contracting arrangements, such as fixed price, guaranteed maximum price and cost plus award fee contracts and, to a lesser extent, construction management or design-build contracting arrangements. In the normal conduct of our business, we enter into partnership arrangements, referred to as “joint ventures,” for certain construction projects. Each of the joint venture participants is usually committed to supply a predetermined percentage of capital, as required, and to share in a predetermined percentage of the income or loss of the project.
Recent Developments
Acquisition of James A. Cummings, Inc.
On January 23, 2003, we completed the acquisition of James A. Cummings, Inc., or Cummings, a privately held construction company based in Fort Lauderdale, Florida. The acquisition was effective as of January 1, 2003 and, accordingly, the financial results of Cummings are included in our consolidated financial statements since that date. See Note 3 of Notes to Consolidated Financial Statements for a further discussion and analysis of the acquisition of Cummings and related pro forma financial information.
Amendments to Revolving Credit Facility
In February 2003, the terms of our existing revolving credit facility were amended to, among other things, increase the revolving credit facility from $45 million to $50 million and to extend the term of our credit facility from January 2004 to June 2005. The credit facility, as amended, provides us with greater flexibility in providing the working capital needed to support the anticipated growth of our construction activities. On November 5, 2003 and January 31, 2004, the terms of our revolving credit facility were further amended to provide a temporary $20 million increase in the revolving credit facility from $50 million to $70 million until April 30, 2004, to support the procurement requirements of a major project. At December 31, 2003, we had $67.2 million available to borrow under our credit facility.
Results of Tender Offer for our $21.25 Preferred Stock
On June 9, 2003, we completed a tender offer for our $2.125 Depositary Convertible Exchangeable Preferred Shares, or Depositary Shares, each of which represent 1/10th of a share of $21.25 Convertible Exchangeable Preferred Stock, or the $21.25 Preferred Stock. As a result of this transaction, we purchased 440,627 of our Depositary Shares (representing approximately 44.1% of the outstanding $21.25 Preferred Stock) at a purchase price of $25.00 per Depositary Share, net to the seller without interest. See Note 8 of Notes to Consolidated Financial Statements. Including related expenses, this transaction resulted in an $11.3 million decrease in stockholders’ equity. Also as a result of this transaction, approximately $7.3 million of previously accrued and unpaid dividends on the $21.25 Preferred Stock were reversed and restored to paid-in surplus in the Consolidated Balance Sheets. Since these accrued dividends had previously been deducted from net income in
the computation of earnings per share in prior years, the reversal of these accrued dividends resulted in the addition of $7.3 million to income available for common stockholders in the computation of earnings per share for the year ended December 31, 2003.
Business Segments Redefined
Historically, we have evaluated our operating results based on two reportable segments: building and civil. During the fourth quarter of 2003, we adjusted the responsibilities of certain of our executive officers and, in accordance with Statement of Financial Accounting Standards No. 131, “Disclosures about Segments of an Enterprise and Related Information,” we reevaluated the criteria for determining our reportable segments. We have determined that a third business segment, management services, will be included as a reportable segment prospectively to align our reportable segments with current management responsibilities. Previously, our management services operations were included as part of our building segment. The management services segment will aggregate contracts that have a higher than normal geopolitical and operational risk and corresponding potential for greater than normal gross margin volatility. See Note 11 of Notes to Consolidated Financial Statements for an analysis of operating results by segment.
New Contract Awards
In December 2003, our task order with the U.S. Army Corps of Engineers (COE) for additional power restoration work in Iraq was increased from an award of $66 million to a total task order value of $357 million. The task order was awarded under our contingent contract with COE’s Transatlantic Programs Center to provide design-build, general construction and operations and maintenance services in the U.S. Central Command’s area of operations. The maximum potential value of the contract, which was originally $100 million, has been increased to $500 million, subject to identification and award of specific contract task orders.
On January 14, 2004,we were awarded a new contract for the COE Transatlantic Programs Center. The contract is an indefinite-delivery/indefinite-quantity (IDIQ) contract for design and construction work throughout the U.S. Central Command Area of Responsibility which includes 25 countries, including Iraq and Afghanistan. The maximum potential value of the contract is $1.5 billion, with maximum values of $500 million for the base year and $250 million each for four option years, subject to identification and award of specific contract task orders.
On March 12, 2004, we were awarded a new IDIQ contract. The contract has a maximum potential value of $500 million to design and build electrical transmission and distribution systems in southern Iraq over five years.
Critical Accounting Policies
Our significant accounting policies are described in Note 1 of Notes to Consolidated Financial Statements included in this prospectus.
Use of Estimates – The preparation of financial statements in conformity with accounting principles generally accepted in the United States of America requires management to make estimates and assumptions that affect the reported amounts of assets and liabilities and disclosure of contingent assets and liabilities at the date of the financial statements and the reported amounts of revenues and expenses during the reporting period. Our construction business involves making significant estimates and assumptions in the normal course of business relating to our contracts and our joint venture contracts due to, among other things, the one-of-a-kind nature of most of our projects, the long-term duration of our contract cycle and the type of contract utilized. Therefore, management believes that “Method of Accounting for Contracts” is the most important and critical accounting policy. The most significant estimates with regard to these financial statements relate to the estimating of total forecasted construction contract revenues, costs and profits in accordance with accounting for long-term contracts (see Note 1(d) of Notes to Consolidated Financial Statements) and estimating potential liabilities in conjunction with certain contingencies, including the outcome of pending or future litigation, arbitration or other dispute resolution proceedings relating to contract claims. See Note 2 of Notes to Consolidated Financial Statements. Actual results could differ from these estimates and such differences could be material.
Our estimates of contract revenue and cost are highly detailed. We believe, based on our experience, that our current systems of management and accounting controls allow management to produce materially reliable estimates of total contract revenue and cost during any measurementaccounting period. However, many factors can and do change during a contract performance period which can result in a change to contract profitability from one financial reporting period to another. Some of the factors that can change the estimate of total contract revenue and cost include differing site conditions (to the extent that contract remedies are unavailable), the availability of skilled contract labor, the performance of major material suppliers to deliver on time, the performance of major subcontractors, unusual weather conditions and the accuracy of the original bid estimate. Because we have many contracts in process at any given time, these changes in estimates can offset each other without impacting overall profitability. However, large changes in cost estimates on larger, more complex civil construction projects can have a material impact on our financial statements and are reflected in our results of operationoperations when they become known.
When recording revenue on contracts relating to unapproved change orders and claims, we include in revenue an amount equal to the amount of costs incurred by us to date for contract price adjustments that we seek to collect from customers for delays, errors in specifications or designs, change orders in dispute or unapproved as to scope or price, or other unanticipated additional costs, in each case when recovery of the costs are considered probable. When determining the likelihood of eventual recovery, we consider such factors as indicationevaluation of entitlement, from the customersettlements reached to date and our prior experience with the customer. The settlement of these issues often takes years depending upon whether the item can be resolved directly with the customer or involves litigation or arbitration. When new facts become known, an adjustment to the estimated recovery is made and reflected in the current period results.
UnapprovedThe amount of unapproved change order and claims represent a portion of “Unbilled Work”claim revenue is included in our balance sheet and are summarized below as Unbilled Work. The amount of September 30, 2003 and December 31, 2002 and 2001:
| September 30, | December 31, | December 31 | |||||||
| 2003 | 2002 | 2001 | |||||||
| (in thousands) | |||||||||
Unapproved Change Orders | $ | 23,096 | $ | 30,289 | $ | 25,638 | |||
Claims | 69,274 | 62,776 | 48,003 | ||||||
Total | $ | 92,370 | $ | 93,065 | $ | 73,641 | |||
The $19.4 million increase inUnbilled Work relating to unapproved change orders and claims included in unbilled work at the end of 2002 compared with the end of 2001, in light of a decrease in revenues during the same period, is due to a combination of factors. Approximately 80% of unapproved change orders and claim revenue included in unbilled work relate to our civil construction business. The large, complex nature of civil construction in major metropolitan areas (such as Boston and New York) and the form of contract used by many state and local governments result in more frequent change order activity, often leading to significant amounts of unapproved change orders and/or claims. State and local government agencies are frequently reluctant to enter into negotiations to resolve the change orders and claims prior to the completion of the project. It is not unusual for large change orders and/or claims in state and local government public works contracts to take two to three years, or longer, to reach resolution. Many projects that had amounts included in unbilled workbalance sheet at December 31, 2001 were still under construction during 2002. The result was fewer settlements in2003 and 2002 than originally anticipated and, in some cases, an overall increase in the amount of unapproved change orders and/or claim revenue on a project. In addition, our building construction business, which typically does not involve large amounts of unbilled work, experienced a significant revenue decline during 2002. This contributed to the overall revenue decrease for the year ended December 31, 2002 compared to the year ended December 31, 2001 while having little impact on the level of unbilled work.is summarized below:
| December 31, | December 31, | |||||
| 2003 | 2002 | |||||
| (in thousands) | ||||||
Unapproved Change Orders | $ | 17,936 | $ | 30,289 | ||
Claims | 64,515 | 62,776 | ||||
Total | $ | 82,451 | $ | 93,065 | ||
Of the balance of unapproved change orders and claims included in our Consolidated Balance SheetsUnbilled Work at September 30,December 31, 2003 and December 31, 2002, and December 31, 2001, approximately $36.0 million $40.0 million and $37.4$40.0 million, respectively, are amounts subject to pending litigation or dispute resolution proceedings as described in “Business – Legal Proceedings” and Note 2, “Contingencies and Commitments” of Notes to Consolidated Financial Statements for the respective periods. These amounts are management’s estimate of the probable recovery from the disputed claims considering such factors as evaluation of entitlement, settlements reached to date and knowledge of the customer. In the event that future facts and circumstances, including the resolution of disputed claims, cause us to reduce the aggregate amount of our estimated probable recovery from the disputed claims, we will record the amount of such reduction against future earnings in the relevant period.
Method of Accounting for Contracts – Revenues and profits from our contracts and construction joint venture contracts are recognized by applying percentages of completion for the period to the total estimated profits for the respective contracts. Percentage of completion is determined by relating the actual cost of the work performed to date to the current estimated total cost of the respective contracts. When the estimate on a contract indicates a loss, our policy is to record the entire loss during the accounting period in which it is estimated. In the ordinary course of business, at a minimum on a quarterly basis, we prepare updated estimates of the total forecasted revenue, cost and profit or loss for each contract. The cumulative effect of revisions in estimates of the
total forecasted revenue and costs, including unapproved change orders and claims, during the course of the work is reflected in the accounting period in which the facts that caused the revision become known. The financial impact of these revisions to any one contract is a function of both the amount of the revision and the percentage of completion of the contract. An amount equal to the costs incurred which are attributable to unapproved change orders and claims is included in the total estimated revenue when realization is probable. For a further discussion of unapproved change orders and claims, see “Business—Types of Contracts and The Contract Process.” Profit from unapproved change orders and claims is recorded in the period such amounts are resolved.
Deferred contract revenue represents the excess of billings to date over the amount of contract costs and profits (or contract revenue) recognized to date on the percentage of completion accounting method on certain contracts. Unbilled work represents the excess of contract costs and profits (or contract revenue) recognized to date on the percentage of completion accounting method over billings to date on the remaining contracts. Unbilled work results when (1) the appropriate contract revenue amount has been recognized in accordance with the percentage of completion accounting method, but a portion of the revenue recorded cannot be billed currently due to the billing terms defined in the contract and/or (2) costs, recorded at estimated realizable value, related to unapproved change orders or claims are incurred. For unapproved change orders or claims that cannot be resolved in accordance with the normal change order process as defined in the contract, we may employ other dispute resolution methods, including mediation, binding and non-binding arbitration, or litigation. See “Business—Legal Proceedings” and Note 2, “Contingencies and Commitments,” of Notes to Consolidated Financial Statements. The prerequisite for billing unapproved change orders and claims is the final resolution and agreement between the parties. Unbilled work related to our contracts and joint venture contracts at December 31, 20022003 is discussed in Note 1(d) of Notes to Consolidated Financial Statements.
Accounting for Construction Joint Ventures – Prior to 2002, our interests in construction joint ventures were accounted for on the equity method in the Consolidated Balance Sheets and on the proportionate consolidation method in the Consolidated Statements of Income, with our share of revenues and costs in these interests included in revenues and cost of operations, respectively. Beginning in 2002, construction joint venture interests are accounted for using the proportionate consolidation method in the Consolidated Balance Sheets as well as the Consolidated Statements of Income, whereby our proportionate share of each joint venture’s assets, liabilities, revenues and cost of operations are included in the appropriate classifications in the consolidated financial statements. We believe the change, which results in presenting all joint venture activity using a consistent methodology in both the Consolidated Balance Sheets and Consolidated Statements of Income, is preferable.
Although this change impacted various classifications within current assets and current liabilities in the consolidated Balance Sheets and the Consolidated Statements of Cash Flows, it had no impact on net working capital or other categories of long-term assets or liabilities in the Consolidated Balance Sheets. It also had no impact on the Consolidated Statements of Income or basic or diluted earnings per common share for any period presented. Prior year Consolidated Balance Sheets and Consolidated Statements of Cash Flows have been restated to conform to the 2002 presentation.
Accounting for Income Taxes – Information relating to our provision (credit) for income taxes and the status of our deferred tax assets and liabilities is presented in Note 4,5, “Income Taxes”, of Notes to Consolidated Financial Statements. A key assumption in the determination of our book tax provision (credit) is the amount of the valuation allowance required to reduce the related deferred tax assets. A valuation allowance reduces the deferred tax assets to a level which will, more likely than not, be realized. Whether the deferred tax assets will be realized depends on the generation of future taxable income during the periods in which the deferred tax assets become deductible. The net deferred tax assets reflect management’s estimate of the amount which will, more likely than not, reduce future taxable income.
As of December 31, 2002, management believed that a valuation allowance was required to reduce the deferred tax assets, primarily relating to certain net operating loss carryforwards or NOLs,(“NOLs”), for the following reasons:
Although we had generated approximately $75 million of pretax profits during the three-year period ended December 31, 2002, the construction business, in general, and our future operating performance
is difficult to predict. This is illustrated by our cumulative pretax loss of $164 million during the five-year period immediately preceding the three-year period referred to above.
|
During the first quarter of 2003, we reduced the valuation allowance by $7.0 million and recognized a $7.0 million tax benefit based on the expectation that we would be able to utilize at least a portion of the previously unrecognized NOLs due to the impact of not having a Section 382 restriction as of the end of the three year testing period. During the fourth quarter of 2003, we further reduced the valuation allowance by $7.9 million based on the expectation that we would be able to utilize an additional amount of our NOLs in future years due to a significant increase in backlog as a result of a robust new work acquisition period experienced during the second half of 2003.
As of September 30,December 31, 2003, we believedmanagement estimates that the remaininga valuation allowance of approximately $8.4 million was still required forto reduce the reasons stated above. In addition,deferred tax assets, primarily relating to NOLs, to a level we had received notice from somecurrently believe will be utilized to offset future taxable income based on our current backlog and forecasts. The valuation allowance is required due to our inability to predict on a longer term basis that we will “more likely than not” acquire the additional amount of profitable new work required to utilize additional NOLs and the ongoing concern that an adverse outcome on one or more of the legal matters referred to above could significantly limit our major stockholders of their intentability to sell a portion of their common stock through this offering, thereby once again raising uncertainty with respect to the Section 382 restriction.utilize additional NOLs.
Defined Benefit Retirement Plan – The status of our defined benefit pension plan obligations, related plan assets and cost is presented in Note 10 of Notes to Consolidated Financial Statements entitled “Employee Benefit Plans.” Plan obligations and annual pension expense are determined by actuaries using a number of key assumptions which include, among other things, the discount rate, the estimated future return on plan assets and the anticipated rate of future salary increases. The discount rate of 7.25%6.75% used for purposes of computing the 20022003 annual pension expense was determined at the beginning of the calendar year based on high-quality corporate bond yields as of that date. We plan to lower the discount rate used for computing the 20032004 annual pension expense to 6.75%6.25% due to a decline in high-quality corporate bond yields as of the end of 2002.2003.
The estimated return on plan assets is primarily based on historical long-term returns of equity and fixed income markets according to our targeted allocation of plan assets (70% equity and 30% fixed income). While the weighted estimated return on asset rate assumption has been approximately 9% in recent years, we plan to lower this rate to 7%7.5% for 20032004 based on recent equity market performance compared to long-term historical averages.
The plan’s accumulated benefit obligation exceeded the fair value of plan assets on December 31, 2003, 2002 and 2001 in amounts greater than the accrued pension liability previously recorded. Accordingly, we increased our accrual by $4.4 million in 2003, $13.7 million in 2002 and $5.9 million in 2001 with the $24.0 million offset to accumulated other comprehensive loss,Accumulated Other Comprehensive Loss, a reduction of stockholders’ equity.
As a result of the expected changes in assumptions for 20032004 noted above and asset losses during 2003 and 2002, we anticipate that pension expense will increase from $1.2$2.7 million in 20022003 to $3.4$4.7 million in 2003.2004. Cash contributions are anticipated to stay at the 2002 levelbe $4 million in the range of $2 million to $3 million for 2003 and 2004, but using our current assumptions regarding asset performance and the interest rate environment, these will likely increase significantly in the future.
Related Party Transactions
As part ofa condition to a $30 million equity infusion in January 1997, we entered into an agreement with Tutor-Saliba Corporation, or Tutor-Saliba, a construction company based in California, and Ronald N. Tutor, chief executive officerChief Executive Officer and sole stockholder of Tutor-Saliba, to provide certain management services. Tutor-Saliba participated in joint ventures with us before the agreement and continues to participate in joint ventures with us after the agreement. Our share of revenue from these joint ventures amounted to $36.8$49.0 million, for the nine months ended September 30, 2003 and $48.8 million $17.9 million and $4.6$17.9 million for the years ended December 31, 2003, 2002 2001 and 2000,2001, respectively. Primarily as a result of Tutor-Saliba participating in a $40 million equity infusion in March 2000, Tutor-Saliba currently owns
approximately 12% of our outstanding common stock. Mr. Tutor has been our Chairman and Chief Executive Officer since March 2000. For details of compensation to Mr. Tutor, arrangements with Tutor-Saliba and other information on related party transactions, see Note 1312 of Notes to Consolidated Financial Statements, “Management” and “Certain Transactions” included elsewhere in this prospectus.
Recent Developments
On January 23, 2003, we completed the acquisition of James A. Cummings, Inc., or Cummings, a privately held construction company based in Fort Lauderdale, Florida. The acquisition was effective as of January 1, 2003 and, accordingly, the financial results of Cummings are included in our consolidated condensed financial statements since that date. See Note 5 of Notes to Consolidated Condensed Financial Statements as of September 30, 2003, for a further discussion and analysis of the acquisition of Cummings and related pro forma financial information.
In February 2003, the terms of our existing revolving credit facility were amended to, among other things, increase the revolving credit facility from $45 million to $50 million and to extend the term of our credit facility from January 2004 to June 2005. The credit facility, as amended, will provide us with greater flexibility in providing the working capital needed to support the anticipated growth of our construction activities. At September 30, 2003, we had $30.2 million available to borrow under our credit facility. On November 5, 2003, the terms of our revolving credit facility were further amended to provide a temporary $20 million increase in the revolving credit facility from $50 million to $70 million until January 31, 2004, to support the procurement requirements of a major project.
On June 9, 2003, we completed a tender offer for our $2.125 Depositary Convertible Exchangeable Preferred Shares, or Depositary Shares, each of which represent 1/10th of a share of $21.25 Convertible Exchangeable Preferred Stock, or the $21.25 Preferred Stock. As a result of this transaction, we purchased 440,627 of our Depositary Shares (representing approximately 44.1% of the outstanding $21.25 Preferred Stock) at a purchase price of $25.00 per Depositary Share, net to the seller without interest. See Note 8 of Notes to Consolidated Condensed Financial Statements. Including related expenses, this transaction resulted in an $11.3 million decrease in stockholders’ equity. Also as a result of this transaction, approximately $7.3 million of previously accrued and unpaid dividends on the $21.25 Preferred Stock was reversed and restored to paid-in surplus in the Consolidated Condensed Balance Sheets. Since these accrued dividends had previously been deducted from net income in the computation of earnings per share in prior fiscal quarters, the reversal of these accrued dividends resulted in the addition of $7.3 million to income available for common stockholders in the computation of earnings per share for the nine month period ended September 30, 2003.
Historically, we have evaluated our operating results based on two reportable segments: building and civil. During the fourth quarter of 2003, we adjusted the responsibilities of certain of our executive officers and, in accordance with Statement of Financial Accounting Standards No. 131, “Disclosures about Segments of an Enterprise and Related Information,” we reevaluated the criteria for determining our reportable segments. We have determined that a third business segment, management services, will be included as a reportable segment prospectively to align our reportable segments with current management responsibilities. Previously, our
management services operations were included as part of our building segment. The management services segment will aggregate contracts that have a higher than normal geopolitical and operational risk and a corresponding potential for greater than normal gross margin volatility. The results to reflect this change for the nine months ended September 30, 2003 and 2002 and for each of the years ended December 31, 2002, 2001 and 2000 are set forth below:
Nine Months Ended September 30, 2003
| Reportable Segments | |||||||||||||||||||
| Building | Civil | Management Services | Totals | Corporate | Consolidated Total | ||||||||||||||
| (in thousands) | |||||||||||||||||||
Revenues | $ | 629,305 | $ | 134,507 | $ | 109,639 | $ | 873,451 | $ | – | $ | 873,451 | |||||||
Income from Operations | 9,228 | 1,684 | 11,389 | 22,301 | (6,149 | ) | 16,152 | ||||||||||||
Assets | 163,055 | 245,573 | 23,618 | 432,246 | 32,166 | 464,412 | |||||||||||||
Nine Months Ended September 30, 2002
| |||||||||||||||||||
| Reportable Segments | |||||||||||||||||||
| Building | Civil | Management Services | Totals | Corporate | Consolidated Total | ||||||||||||||
| (in thousands) | |||||||||||||||||||
Revenues | $ | 488,111 | $ | 236,409 | $ | 97,962 | $ | 822,482 | $ | – | $ | 822,482 | |||||||
Income from Operations | 11,087 | 1,849 | 7,345 | 20,281 | (4,675 | ) | 15,606 | ||||||||||||
Assets | 129,794 | 224,126 | 20,008 | 373,928 | 21,398 | 395,326 | |||||||||||||
Year Ended December 31, 2002
| |||||||||||||||||||
| Reportable Segments | |||||||||||||||||||
| Building | Civil | Management Services | Totals | Corporate | Consolidated Total | ||||||||||||||
| (in thousands) | |||||||||||||||||||
Revenues | $ | 631,860 | $ | 312,528 | $ | 140,653 | $ | 1,085,041 | $ | – | $ | 1,085,041 | |||||||
Income from Operations | 14,487 | 6,390 | 11,738 | 32,615 | (6,735 | ) | 25,880 | ||||||||||||
Assets | 130,270 | 223,036 | 27,971 | 381,277 | 21,112 | 402,389 | |||||||||||||
Capital Expenditures | 1,828 | 2,335 | 347 | 4,510 | – | 4,510 | |||||||||||||
Year Ended December 31, 2001
| |||||||||||||||||||
| Reportable Segments | |||||||||||||||||||
| Building | Civil | Management Services | Totals | Corporate | Consolidated Total | ||||||||||||||
| (in thousands) | |||||||||||||||||||
Revenues | $ | 1,120,161 | $ | 353,957 | $ | 79,278 | $ | 1,553,396 | $ | – | $ | 1,553,396 | |||||||
Income from Operations | 26,596 | 3,918 | 5,016 | 35,530 | (6,029 | ) | 29,501 | ||||||||||||
Assets | 213,463 | 246,326 | 20,559 | 480,348 | 20,893 | 501,241 | |||||||||||||
Capital Expenditures | 1,005 | 3,120 | 403 | 4,528 | – | 4,528 | |||||||||||||
Year Ended December 31, 2000
| |||||||||||||||||||
| Reportable Segments | |||||||||||||||||||
| Building | Civil | Management Services | Totals | Corporate | Consolidated Total | ||||||||||||||
| (in thousands) | |||||||||||||||||||
Revenues | $ | 740,555 | $ | 279,469 | $ | 85,636 | $ | 1,105,660 | $ | – | $ | 1,105,660 | |||||||
Income from Operations | 22,892 | 5,624 | 4,184 | 32,700 | (5,345 | ) | 27,355 | ||||||||||||
Assets | 209,739 | 215,886 | 14,763 | 440,388 | 47,090 | 487,478 | |||||||||||||
Capital Expenditures | 513 | 1,066 | 214 | 1,793 | – | 1,793 | |||||||||||||
In December 2003, our Task Order with the U.S. Army Corps of Engineers (COE) for additional power restoration work in Iraq was increased from an award of $66 million to a total Task Order value of $220 million. The Task Order was awarded under our Contingent Contract with COE’s Transatlantic Program Center to provide design-build, general construction and operations and maintenance services in the U.S. Central Command’s area of operations. The maximum potential value of the contract, which was originally $100 million, has been increased to $500 million.
On January 14, 2004,we were awarded a new contract for the COE Transatlantic Programs Center. The contract is an indefinite-delivery/indefinite quantity (IDIQ) contract for design and construction work throughout the U.S. Central Command Area of Responsibility which includes 25 countries, including Iraq and Afghanistan. The maximum potential value of the contract is $1.5 billion, with maximum values of $500 million for the base year and $250 million each for four option years.
Results of Operations
As discussed above, during the fourth quarter of 2003, we determined that a third business segment, management services, will be included as a reportable segment prospectively. Therefore, in order to provide a more meaningful discussion and analysis based on our prospective segment reporting structure, the historical “Results of Operations” below has been adjusted to reflect three business segments instead of two.
Comparison of the Nine MonthsYear Ended September 30,December 31, 2003 with the Nine MonthsYear Ended September 30,December 31, 2002
Net income for the year ended December 31, 2003 was a record $44.0 million, a 90% increase from the $23.1 million net income recorded in 2002. The overall increase in net income of $7.9 million, from $13.5 million to $21.4$20.9 million was due primarily to the recognition of a $7.0$14.9 million federal tax benefit based on the expectation that we will be able to utilize a portion of our net operating loss (NOL) carryforwards in future years. In addition, the record net income in 2003 reflects the impact of an increased volume of work acquired and put in place in 2003, in particular our contract awards in Iraq and Afghanistan, as well as the acquisition of Cummings in January 2003.
Basic earnings per common share were $2.18 for the year ended 2003 compared to $0.92 for the year ended 2002. Diluted earnings per common share were $2.10 for the year ended 2003 compared to $0.91 for the year ended 2002. As discussed above, as a result of the completion of our tender offer on our $21.25 Preferred Stock in June 2003, $7.3 million in previously accrued preferred stock dividends was reversed and added back to income available for common stockholders in the computation of earnings per share for the year ended December 31, 2003. Accordingly, basic and diluted earnings per common share calculations for the year ended December 31, 2003 were favorably impacted by $0.32 and $0.31 per share, respectively, due to the reversal of a pro rata portion of accumulated but unpaid dividends on our $21.25 Preferred Stock as a result of the tender offer completed in 2003.
Overall revenues increased by $50.9$289.1 million (or 6.2%26.6%), from $822.5$1,085.0 million in 2002 to $873.4$1,374.1 million in 2003. This increase was due primarily to ana increase in building construction revenues of $141.2$266.3 million (or 28.9%42.1%), from $488.1$631.9 million in 2002 to $629.3$898.2 million in 2003, due primarily to the impact of the Cummings acquisition in January 2003 and improved new work acquisition results during the second and third quarters of 2003. Management services revenues increased by $11.6$158.4 million (or 11.8%112.7%), from $98.0$140.6 million in 2002 to $109.6$299.0 million in 2003, due primarily to the start-upnew contracts we were awarded in late 20022003 related to the rebuilding of our initial contract inIraq and Afghanistan. These increases were partly offset by a decrease in civil construction revenues of $101.9$135.6 million (or 43.1%43.4%), from $236.4$312.5 million in 2002 to $134.5$176.9 million in 2003. The decrease in revenues from civil construction operations primarily reflects the decrease in our year-end backlog at December 31, 2002 compared to the year-end backlog at December 31, 2001, as the pace of new contract awards slowed during 2002 and the past 18 monthsfirst half of 2003 due to a temporary decrease in the number of public works projects available to bid and increased competition encountered from other contractors when bidding on the reduced level of work available .available.
| Revenues for the Year Ended December 31, | Increase (Decrease) | % Change | |||||||||||
| 2003 | 2002 | ||||||||||||
| (in millions) | |||||||||||||
Building | $ | 898.2 | $ | 631.9 | $ | 266.3 | 42.1 | % | |||||
Civil | 176.9 | 312.5 | (135.6 | ) | (43.4 | )% | |||||||
Management Services | 299.0 | 140.6 | 158.4 | 112.7 | % | ||||||||
Total | $ | 1,374.1 | $ | 1,085.0 | $ | 289.1 | 26.6 | % | |||||
Income from operations (excluding corporate) increased by $2.0$6.7 million (or 9.9%20.6%), from $20.3$32.6 million in 2002 to $22.3$39.3 million in 2003. Management services income from operations increased by $4.0$12.0 million (or 54.1%102.6%), from $7.4$11.7 million in 2002 to $11.4$23.7 million in 2003, due primarily to the increase in revenues discussed above as well as favorable cost experience on two fixed price overseas projects.related to
the rebuilding of Iraq and Afghanistan. Despite the favorable impact of the Cummings acquisition, building construction income from operations decreased by $1.8$2.1 million (or 14.5%), from $11.0$14.5 million in 2002 to $9.2$12.4 million in 2003. Building construction income from operations was negatively impacted by a $1.5$1.0 million increase in building construction-related general and administrative expenses (exclusive of Cummings) primarily in connection with the pursuit of new work opportunities including the opening or expansion of new regional offices in Florida and California. Civil construction income from operations decreased by $0.2$3.2 million (or 50.0%), from $1.9$6.4 million in 2002 to $1.7$3.2 million in 2003, due primarily to the decrease in revenues discussed above and partly offset by a higher gross profit margin in 2003 primarily because 2002 included recognition of our share of a loss on a Central Artery/TunnelArtery “Big Dig” joint venture project or the Big Dig Project, in Boston, Massachusetts. Income from operations was negatively impacted by a $1.5$2.1 million increase in corporate general and administrative expenses, from
$4.7 $6.7 million in 2002 to $6.2$8.8 million in 2003, due primarily to an aggregate increase in several items including corporate incentive compensation, outside professional fees relating to the annual audit of ourthe Company’s financial statements and to the $21.25 Preferred Shareholders Class Action Lawsuit (see Note 6(g)2(f) of Notes to Consolidated Condensed Financial Statements), and certain corporate insurance premium costs.
| Income from Construction Operations for the Year Ended December 31, | Increase (Decrease) | % Change | |||||||||||||
| 2003 | 2002 | ||||||||||||||
| (in millions) | |||||||||||||||
Building | $ | 12.4 | $ | 14.5 | $ | (2.1 | ) | (14.5 | )% | ||||||
Civil | 3.2 | 6.4 | (3.2 | ) | (50.0 | )% | |||||||||
Management Services | 23.7 | 11.7 | 12.0 | 102.6 | % | ||||||||||
Subtotal | $ | 39.3 | $ | 32.6 | $ | 6.7 | 20.6 | % | |||||||
Less: Corporate | (8.8 | ) | (6.7 | ) | (2.1 | ) | 31.3 | % | |||||||
Total | $ | 30.5 | $ | 25.9 | $ | 4.6 | 17.8 | % | |||||||
Other (income) expense increased by $1.9 million, from an expense of $0.5 million in 2002 to income of $1.4 million in 2003, due primarily to a $2.2 million net gain recorded from the sale of certain parcels of developed land held for sale. Based on our remaining inventory of developed land held for sale and the anticipated potential selling prices for those parcels, we believe that the net gain recorded in 2003 is of a non-recurring nature and is not indicative of expected future results.
Interest expense decreased by $0.4$0.5 million, from $1.1$1.5 million in 2002 to $0.7$1.0 million in 2003, due to a lower average borrowing level in 2003 as a result of improved cash flow from operations as well as lower interest rates.
The credit for income taxes in 2003 is due primarily to the recognition of a $7.0$14.9 million federal tax benefit in accordance with SFAS No. 109, “Accounting for Income Taxes,”Taxes” based on the expectation that we will be able to utilize an additional amounta portion of our net operating lossNOL carryforwards in future years. In addition, the (provision) credit for income taxes reflects a lower-than-normal tax rate in both years due primarily to the realization of a portion of the federal tax benefit not recognized in prior years due to certain accounting limitations. Also, the provision for income taxes in 2002 reflects the reversal of the federal alternative minimum tax provided in 2001 which was no longer required based on the provisions of the Job Creation and Worker Assistance Act of 2002.
As discussed above, as a result of the completionrecognition of our tender offer for our Depositary Shares, $7.3the $14.9 million in previously accrued preferred stock dividends was reversed and added back to income available for common stockholders in the computation of earnings per share for the nine months ended September 30, 2003. Accordingly, in addition to the higher net income for the nine months ended September 30, 2003 compared to the nine months ended September 30, 2002,NOL tax benefit, basic and diluted earnings per common share incalculations for the year ended December 31, 2003 benefitedwere favorably impacted by $0.32$0.65 and $0.31$0.63 per share, respectively,respectively.
Reconciliation of Reported Net Income to Pro Forma Net Income
Assuming an effective income tax rate of 39% and also assuming that we completed our tender offer for our $21.25 Preferred Stock prior to January 1, 2002, pro forma net income for the year ended December 31, 2003 would have been $18.9 million, compared to $14.6 million for the year ended December 31, 2002. Similarly, pro forma basic earnings per share for the year ended December 31, 2003 would have been $0.78, compared to $0.59 for the year ended December 31, 2002. Pro forma diluted earnings per share for the year ended December 31,
2003 would have been $0.75, compared to $0.58 for the year ended December 31, 2002. The reconciliation of reported net income to pro forma net income for the years ended December 31, 2003 and 2002 is set forth in a table below:
| Year Ended December 31, | ||||||||
| 2003 | 2002 | |||||||
| (in thousands, except per share data) | ||||||||
Reported net income | $ | 44,018 | $ | 23,074 | ||||
Less: Credit (provision) for income taxes | 13,096 | (801 | ) | |||||
Income before income taxes | 30,922 | 23,875 | ||||||
Provision for income taxes assuming 39% effective rate | 12,060 | 9,311 | ||||||
Pro forma net income | 18,862 | 14,564 | ||||||
Less: Dividends accrued on Preferred Stock assuming the tender offer took place prior to January 1, 2002 | (1,188 | ) | (1,188 | ) | ||||
Pro forma total available for common stockholders | $ | 17,674 | $ | 13,376 | ||||
Pro forma basic earnings per common share | $ | 0.78 | $ | 0.59 | ||||
Pro forma diluted earnings per common share | $ | 0.75 | $ | 0.58 | ||||
To supplement our consolidated financial statements presented on a generally accepted accounting principles (GAAP) basis, we sometimes use non-GAAP measures of net income, earnings per share and other measures that we believe are appropriate to enhance an overall understanding of our historical financial performance and future prospects. The non-GAAP results, which are adjusted to exclude certain costs, expenses, gains and losses from the impactcomparable GAAP measures, are an indication of our baseline performance before gains, loses or other charges that are considered by management to be outside of our core operating results. These non-GAAP results are among the completionindicators management uses as a basis for evaluating our financial performance as well as for forecasting future periods. For these reasons, management believes these non-GAAP measures can be useful to investors, potential investors and others. The presentation of the tender offer transaction. Basicthis additional information is not meant to be considered in isolation or as a substitute for net income or earnings per common share were $1.20prepared in 2003 compared to $0.53 in 2002. Diluted earnings per common share were $1.17 in 2003 compared to $0.52 in 2002.accordance with GAAP.
Comparison of the Year Ended December 31, 2002 to December 31, 2001
Net income for the year ended 2002 was $23.1 million, a 12.5% decrease from the record $26.4 million net income recorded in 2001. Basic earnings per common share were $0.92 for the year ended 2002 compared to $1.07 for the year ended 2001. Diluted earnings per common share were $0.91 per common share compared to $1.04 for the year ended 2001. Overall, the decrease in 2002 operating results reflected a continued strong but lower profit contribution from the building construction segment and increased profit contributions from both the management services and civil construction segments.
Overall, revenues decreased by $468.4 million (or 30.2%), from $1,553.4 million in 2001 to $1,085.0 million in 2002. This decrease was due primarily to a decrease in building construction revenues of $488.2 million (or 43.6%), from $1,120.1 million in 2001 to $631.9 million in 2002. Civil construction revenues decreased $41.5 million (or 11.7%), from $354.0 million in 2001 to $312.5 million in 2002. The decrease in revenues from building construction operations was due primarily to the decrease in our year-end backlog at December 31, 2001 compared to the record year-end backlog at December 31, 2000, including a decreased volume of work at the Mohegan Sun Project in Connecticut, as well as on two large hotel/casino projects in the southwestern United States, all of which were substantially completed in early 2002. The decrease in revenues from civil construction operations was also due primarily to the decrease in our year-end backlog at December 31, 2001 compared to the record year-end backlog at December 31, 2000. These decreases were partly offset by
an increase in management services revenues of $61.3 million (or 77.3%), from $79.3 million in 2001 to $140.6 million in 2002, due primarily to a higher volume of work on power facilities maintenance projects due to a higher number of scheduled plant shutdowns in 2002. Based on the current backlog of such work, this trend is not expected to continue in future years.
| Revenues for the Year Ended December 31, | Increase (Decrease) | % Change | |||||||||||
| 2002 | 2001 | ||||||||||||
| (in millions) | |||||||||||||
Building | $ | 631.9 | $ | 1,120.1 | $ | (488.2 | ) | (43.6 | )% | ||||
Civil | 312.5 | 354.0 | (41.5 | ) | (11.7 | )% | |||||||
Management Services | 140.6 | 79.3 | 61.3 | 77.3 | % | ||||||||
Total | $ | 1,085.0 | $ | 1,553.4 | $ | (468.4 | ) | (30.2 | )% | ||||
Income from operations (excluding corporate) decreased by $2.9 million (or 8.2%), from $35.5 million in 2001 to $32.6 million in 2002. Building construction income from operations decreased by $12.1 million, from $26.6 million in 2001 to $14.5 million in 2002, due primarily to the decrease in revenues discussed above. This decrease was partly
offset by an increase in the average gross margin on building construction contracts from 3.5% in 2001 to 4.7% in 2002, due primarily to favorable close-out experience on several hotel/casino projects in 2002. In addition, building construction income from operations was negatively impacted by a $1.8 million (or 13.7%) increase in building construction-related general and administrative expenses primarily in connection with the pursuit of new work opportunities, including the opening of a new office near Orlando, Florida. Management services income from operations increased by $6.7 million, from $5.0 million in 2001 to $11.7 million in 2002, due primarily to the increase in revenues discussed above as well as favorable cost experience on a fixed price overseas project. Civil construction income from operations increased by $2.5 million, from $3.9 million in 2001 to $6.4 million in 2002, due primarily to favorable cost experience on a fixed price civil infrastructure project in New York City in 2002 as well as recognition of a smaller loss in 2002 compared to 2001 on the Big Dig Project.a Central Artery/Tunnel “Big Dig” joint venture project in Boston, Massachusetts. In addition, civil construction income from operations was negatively impacted by a $1.2 million (or 20.7%) increase in civil construction-related general and administrative expenses, due primarily to a reduced ability to allocate expenses to various joint ventures as well as an increase in outside legal fees attributable to increased work on pending litigation matters and new work acquisition efforts.
Income from Construction Year Ended December 31, | Increase (Decrease) | % Change | |||||||||||||
| 2002 | 2001 | ||||||||||||||
| (in millions) | |||||||||||||||
Building | $ | 14.5 | $ | 26.6 | $ | (12.1 | ) | (45.5 | )% | ||||||
Civil | 6.4 | 3.9 | 2.5 | 64.1 | % | ||||||||||
Management Services | 11.7 | 5.0 | 6.7 | 134.0 | % | ||||||||||
Subtotal | $ | 32.6 | $ | 35.5 | $ | (2.9 | ) | (8.2 | )% | ||||||
Less: Corporate | (6.7 | ) | (6.0 | ) | (0.7 | ) | 11.7 | % | |||||||
Total | $ | 25.9 | $ | 29.5 | $ | (3.6 | ) | (12.2 | )% | ||||||
Interest expense decreased by $0.5 million, from $2.0 million in 2001 to $1.5 million in 2002, due primarily to a reduction in the average amount of debt outstanding under our credit facility as well as lower interest rates in 2002.
The lower than normal tax rate for the three-yeartwo year period ended December 31, 2002 is primarily due to the utilization of tax loss carryforwards from prior years. Because of certain accounting limitations, we were not able to recognize a portion of the tax benefit related to the operating losses experienced in fiscal 1999, 1996 and 1995. As of December 31, 2002, an amount estimated to be approximately $79 million of future pretax earnings could benefit from minimal, if any, federal tax provisions. The net deferred tax assets reflect management’s estimate of the amount that will, more likely than not, be realized. See Note 45 of Notes to Consolidated Financial Statements. In addition, the provision for income taxes in 2002 reflects the reversal of the federal alternative minimum tax provided in 2001 which isthat was no longer required based on the provisions of the Job Creation and Worker Assistance Act of 2002, and the credit for income taxes in 2000 reflect the reversal of foreign taxes accrued in prior years that were no longer required.2002.
Comparison of the Year Ended December 31, 2001 to December 31, 2000
Net income for the year ended 2001 increased 8% to a record $26.4 million, compared to net income of $24.4 million for the year ended 2000. Basic earnings per common share were $1.07 for the year ended 2001, as compared to $0.39 for the year ended 2000. Diluted earnings per common share were $1.04 for the year ended 2001, as compared to $0.39 for the year ended 2000. Overall, the improved 2001 operating results reflect a continued strong and improved profit contribution from the building construction segment and, to a lesser extent, the positive impact of lower interest expense due primarily to continued reduction in the amount of long-term debt outstanding and lower interest rates in 2001.
Overall, revenues increased $447.7 million (or 40.5%), from $1,105.7 million in 2000 to a record $1,553.4 million in 2001. This increase was due primarily to an increase in building construction revenues of $379.5 million (or 51.2%), from $740.6 million in 2000 to $1,120.1 million in 2001. In addition, civil construction revenues increased $74.5 million (or 26.7%), from $279.5 million in 2000 to $354.0 million in 2001. Management services revenues decreased by $6.3 million (or 7.4%), from $85.6 million in 2000 to $79.3 million in 2001. The increase in revenues from building construction operations was due primarily to our record year-end backlog at December 31, 2000, including an increase in the volume of work completed at the Mohegan Sun Project in Connecticut, as well as the construction of three large hotel/casino projects in the southwestern United States. The increase in revenues from civil construction operations also reflected our record year-end backlog at December 31, 2000, including the start-up of several infrastructure projects in the metropolitan New York area.
Income from operations (excluding corporate) increased by $2.8 million (or 8.6%), from $32.7 million in 2000 to $35.5 million in 2001 due to increases in income from building construction operations and management services
operations that more than offset a decrease in income from civil construction operations. Building construction income from operations increased by $3.7 million (or 16.2%), from $22.9 million in 2000 to $26.6 million in 2001, due primarily to the increase in revenues discussed above which was largely offset by a decrease in the gross margin from 4.6% in 2000 to 3.5% in 2001 because 2000 included the favorable close-out of certain projects. In addition, building construction income from operations was negatively impacted by a $2.1 million (or 19.1%) increase in building construction-related general and administrative expenses primarily in connection with the pursuit of new work opportunities. Despite the slight decrease in management services revenues discussed above, management services income from operations increased by $0.8 million (or 19.0%), from $4.2 million in 2000 to $5.0 million in 2001, due primarily to an upward profit revision on an overseas project. Moreover, management services income from operations was negatively impacted by a $1.5 million (or 88.2%) increase in management services related general and administrative expenses primarily in connection with the pursuit of new work opportunities. Despite the increase in civil construction revenues discussed above, civil construction income from operations decreased by $1.7 million (or 30.4%), from $5.6 million in 2000 to $3.9 million in 2001, due primarily to a downward profit revision on the Big Dig Project.
Other (income) expense decreased by $1.1 million, from a net income of $0.9 million in 2000 to a net expense of $0.2 million in 2001, due primarily to a decrease in interest income as a result of a decrease in the level of short-term cash investments, as well as lower interest rates in 2001.
Interest expense decreased by $2.0 million, from $4.0 million in 2000 to $2.0 million in 2001, due primarily to the continued reduction in the amount of long-term debt outstanding under our credit facility as described in Note 3 of Notes to Consolidated Financial Statements, as well as lower interest rates in 2001.
Liquidity and Capital Resources
Cash and Working Capital
Cash and cash equivalents as reported in the accompanying Consolidated Condensed Statements of Cash Flows consist of amounts held by us as well as our proportionate share of amounts held by construction joint ventures. Cash held by us is available for general corporate purposes while cash held by construction joint ventures is available only for joint venture-related uses. Cash held by construction joint ventures is distributed from time to time to us and to the other joint venture participants in accordance with their percentage interest after the joint venture partners determine that a cash distribution is prudent. Cash distributions received by us from our construction joint ventures are then available for general corporate purposes. At September 30,December 31, 2003, and December 31, 2002 and 2001, cash held by us and available for general corporate purposes was $17.0$33.4 million, $11.2 million and $11.2$7.2 million, respectively, and our proportionate share of cash held by joint ventures and available only for joint venture-related uses was $28.4$34.4 million, $35.8 million and $35.8$49.3 million, respectively.
Billing procedures in the construction industry generally are based on the specific billing terms of a contract and are often not correlated with performance. For example, billings may be based on various measures of performance, such as cubic yards excavated, architect’s estimates of completion, costs incurred on cost-plus type contracts or weighted progress from a cost loaded construction time schedule. Billings are generally on a monthly basis and are reviewed and approved by the customer prior to submission. Therefore, once a bill is submitted, we are generally able to collect amounts owed to us in accordance with the payment terms of the contract. In addition, contractor’s receivables usually include retentions, or amounts that are not due until contracts are completed or until specified contract conditions or guarantees are met. Retentions are governed by contract provisions and are typically a fixed percentage (for example, 5% or 10%) of each billing. We generally follow the policy of paying our vendors and subcontractors on a particular project after we receive payment from our customer.
A summary of our cash flows for the nine months ended September 30, 2003 and for each of the three years ended December 31, 2003, 2002 2001 and 20002001 is set forth below:
| Nine Months Ended | Year Ended December 31, | Year Ended December 31, | ||||||||||||||||||||||||||
| September 30, 2003 | 2002 | 2001 | 2000 | 2003 | 2002 | 2001 | ||||||||||||||||||||||
| (in millions) | (in millions) | |||||||||||||||||||||||||||
Cash flows from: | ||||||||||||||||||||||||||||
Operating activities | $ | 4.7 | $ | (3.6 | ) | $ | (24.2 | ) | $ | 0.8 | $ | 42.6 | $ | (3.6 | ) | $ | (24.3 | ) | ||||||||||
Investing activities | (9.7 | ) | (0.6 | ) | (5.5 | ) | 0.1 | (7.9 | ) | (0.6 | ) | (5.5 | ) | |||||||||||||||
Financing activities | 3.4 | (5.3 | ) | (9.5 | ) | (8.3 | ) | (13.9 | ) | (5.3 | ) | (9.5 | ) | |||||||||||||||
Net decrease in cash | $ | (1.6 | ) | $ | (9.5 | ) | $ | (39.2 | ) | $ | (7.4 | ) | ||||||||||||||||
Net increase (decrease) in cash | $ | 20.8 | $ | (9.5 | ) | $ | (39.3 | ) | ||||||||||||||||||||
Cash at beginning of period | 47.0 | 56.5 | 95.8 | 103.2 | ||||||||||||||||||||||||
Cash at end of period | $ | 45.4 | $ | 47.0 | $ | 56.6 | $ | 95.8 | ||||||||||||||||||||
Cash at beginning of year | 47.0 | 56.5 | 95.8 | |||||||||||||||||||||||||
Cash at end of year | $ | 67.8 | $ | 47.0 | $ | 56.5 | ||||||||||||||||||||||
During the first nine months of 2003, we generated $4.7$42.6 million in cash flow from operating activities $13.9 million from a net increase in debt and $2.1$5.0 million in net proceeds from the sale of certain remaining parcels of developed land held for sale to fund the $11.3 million required to complete our tender offer for our Depositary Shares, to reduce debt by a net amount of $3.5 million, as well as to fund a net $11.8$12.9 million used by investing activities, primarily for the acquisition of Cummings in January and to acquire construction equipment and an office building and equipment storage facility to be used by our civil construction operations. As a result, our consolidated cash balance decreasedincreased by $1.6$20.8 million, from $47.0 million at December 31, 2002 to $45.4$67.8 million at September 30,December 31, 2003. As more fully
discussed in Note 6(d)2(d) of Notes to Consolidated Condensed Financial Statements, in the first quarter of 2003, we received our proportionate share of provisional payments against outstanding claims on the Big Dig Project, as a result of an agreement reached in December 2002. This approximately $13.3 millionOur share of this payment ($13.3 million) was a significant contributor to the $4.7$42.6 million in cash flow generated from operating activities in the first nine months of 2003.
During 2002, we used $9.5 million of cash on hand to fund operating activities ($3.6 million), investing activities ($0.6 million), and financing activities to reduce debt by a net amount of $5.3 million. The $3.6 million in cash used by operating activities was due primarily to the need to fund working capital requirements on certain joint venture construction contracts where unapproved change orders andand/or contract claims remain to be resolved. See Note 1(d) of Notes to Consolidated Financial Statements.
During 2001, we used $39.2 million of cash on hand to fund operating activities ($24.2 million),; investing activities ($5.5 million), primarily for the acquisition of property and equipment,equipment; and financing activities ($9.5 million), primarily to reduce debt by a net amount of $9.8 million. Cash generated from operating activities decreased from a positive $0.8 million in 2000 to a negative $24.2 million in 2001 due primarily to the need to fund working capital requirements on certain of our construction contracts where unapproved change orders and/or contract claims remain to be resolved. See Note 1(d) of Notes to Consolidated Financial Statements.
During 2000, we generated $0.8 million in cash from operating activities and $0.1 million in cash from investing activities. The funds generated together with $7.4 million in cash on hand were used for financing activities ($8.3 million) primarily to reduce debt. Financing activities in 2000 include net proceeds of $37.3 million received from the issuance of common stock in connection with our recapitalization as discussed in Note 7 of Notes to Consolidated Financial Statements, as well as net proceeds of $7.1 million received from a refinancing of our corporate headquarters building. These funds were primarily used to reduce debt.
During 2000, our liquidity was significantly enhanced by the sale of 9,411,765 shares of common stock for an aggregate of $40 million (before fees and expenses) and by the refinancing of our corporate headquarters building for $7.5 million (before fees and expenses). See Notes 3 and 7 of Notes to Consolidated Financial Statements. These financing transactions enabled us to reduce our dependence on bank debt to fund the working capital needs of our core construction operations, resulting in a significant reduction in interest expense. Also, in
January 2002, we entered into an agreement with a new lender group to refinance our existing credit facility with a new $45 million revolving credit facility.
Working capital increased, from $115.9 million at the end of 2002 to $122.1$125.4 million at September 30,December 31, 2003. TheOur current ratio decreased from 1.44x compared to 1.40x1.31x during the same period. Since December 31, 2000,2001, working capital has increased by $41.6$32.0 million (or 52%34%), from $80.5$93.4 million to $122.1$125.4 million at September 30,December 31, 2003, and theour current ratio has improved from 1.24x to 1.40x from 1.20x1.31x during the same period. As of September 30,December 31, 2003, accounts and notes receivable amounted to $256.3$328.0 million and comprised approximately 60%62% of our total current assets. This compares to accounts and notes receivable of $218.2 million, or approximately 57% of our total current assets at December 31, 2002. The approximate $110 million increase in accounts receivable at December 31, 2003 primarily reflects the increased revenues during the fourth quarter of 2003.
In January 2002, we entered into an agreement with a new bank group to refinance our existing credit facility with a new $45 million revolving credit facility. In February 2003, the terms of our existing revolving credit facility were amended to, among other things, increase the revolving credit facility from $45 million to $50 million and to extend the term of our credit facility from January 2004 to June 2005. On November 5, 2003 and January 31, 2004, the terms of our revolving credit facility were further amended to provide a temporary $20 million increase in the revolving credit facility from $50 million to $70 million until April 30, 2004, to support the procurement requirements of a major project.
The terms of our credit facility require us to meet certain financial covenants, including:
The terms of our credit facility also prohibit us from incurring any additional indebtedness without the consent of our lenders, other than financing for our corporate headquarters, insurance premiums and construction equipment, and impose limitations on the level of capital expenditures that we may make for a period, as well as the purchase and sale of assets outside of the normal course of business.
Our obligations under our credit facility are guaranteed by substantially all of our current and future subsidiaries, and secured by substantially all of our and our subsidiary guarantors’subsidiaries’ assets, including a pledge of all of the capital stock of our subsidiary guarantors.subsidiaries. At September 30,December 31, 2003, we had $30.2$67.2 million available to borrow under our credit facility.facility and $2.8 million in outstanding letters of credit.
Long-term Debt
Long-term debt at September 30,December 31, 2003 was $25.6$8.5 million, an increasea decrease of $13.4$3.6 million from December 31, 2002, due primarily todespite our completion in June of a tender offer for our Depositary Shares which required a cash outlay of approximately $11.3 million (including related expenses). The and the acquisition of Cummings which required a net
cash outlay of approximately $8.6 million. Our long-term debt to equity ratio was .25x.07x at September 30,December 31, 2003, compared to .14x at December 31, 2002. Long-term debt was $12.1 million at the end of 2002 up fromas compared to $7.5 million at the end of 2001.
Contractual Obligations
Our outstanding contractual obligations as of December 31, 2003 are summarized in 2001 and down compared to $17.2 million in 2000 and $41.1 million in 1999.the following table:
| Payments Due by Period | |||||||||||||||||||
| (in thousands) | |||||||||||||||||||
| Total | Less Than 1 Year | 1-3 Years | 3-5 Years | More Than 5 Years | |||||||||||||||
Total debt | $ | 9,012 | (a) | $ | 490 | $ | 634 | $ | 2,026 | $ | 5,862 | ||||||||
Operating leases, net | 12,181 | 4,279 | 5,481 | 1,940 | 481 | ||||||||||||||
Purchase obligations | — | — | — | — | — | ||||||||||||||
Other long-term liabilities: | |||||||||||||||||||
Accrued dividends on $21.25 Preferred Stock | 9,805 | — | — | — | 9,805 | (b) | |||||||||||||
Employee benefit related liabilities | 2,043 | 158 | 316 | 316 | 1,253 | ||||||||||||||
Minimum pension liability adjustments | 25,488 | 4,000 | 8,000 | (c) | 8,000 | (c) | 5,488 | (c) | |||||||||||
Total contractual obligations | $ | 58,529 | $ | 8,927 | $ | 14,431 | $ | 12,282 | $ | 22,889 | |||||||||
| (a) | Includes capital leases in the amount of $325. |
| (b) | Assumes current policy described below under “Dividends — $21.25 Preferred Stock” does not change during the 5-year period. |
| (c) | Assumes annual pension fund contributions equal to the contribution amount anticipated in 2004. |
Stockholders’ Equity
As more fully described in Note 7 of Notes to Consolidated Financial Statements, effective March 29, 2000, we completed a recapitalization which included the sale of 9,411,765 shares of common stock for an aggregate of $40 million in cash (before fees and expenses) and the exchange of 100% of our Redeemable Series B Cumulative Convertible Preferred Stock for an aggregate of 7,490,417 shares of common stock. The effect of the recapitalization on our stockholders’ equity was to increase stockholders’ equity by approximately $76.2 million, from a negative net worth of approximately $36.6 million at December 31, 1999 to a positive net worth of approximately $39.6 million upon completion of the recapitalization.
Our book value per common share was $3.92$4.65 at September 30,December 31, 2003, compared to $2.72 at December 31, 2002 and $2.40 at December 31, 2001, and $1.57 at December 31, 2000.2001. The major factors impacting stockholders’ equity during the three year and nine month period ended September 30, 2003 were the recapitalization completed in 2000, the net income recorded in all three years, the cost of our tender offer ($11.3 million) completed in June 2003, including the reversal of dividends ($7.3 million) previously accrued related to the preferred stock tendered and, to a lesser extent, preferred stock dividends paid in-kind or accrued, and common stock options exercised. Also, we were required to recognize an additional minimum pension liability of approximately $4.4 million in 2003, $13.7 million in 2002 and $5.9 million in 2001 in accordance with SFAS No. 87, “Employers’ Accounting for Pensions” which resulted in an aggregate $19.6$24.0 million accumulated other comprehensive lossAccumulated Other Comprehensive Loss deduction in stockholders’ equity. See Note 10 of Notes to Consolidated Financial Statements. Adjustments to the amount of this additional minimum pension liability will be recorded in future years based upon periodic re-evaluation of the funded status of our pension plans.
Dividends
Common Stock
There were no cash dividends declared or paid on our outstanding common stock during the three years ended December 31, 2002 or during the nine months ended September 30, 2003.
$21.25 Preferred Stock
The covenants in our prior credit agreements required us to suspend the payment of quarterly dividends on our $21.25 Preferred Stock in 1995 until certain financial criteria were met. While quarterly dividends on the $21.25 Preferred Stock have not been paid since 1995, they have been fully accrued due to the “cumulative” feature of the $21.25 Preferred Stock.
As of December 31, 2002, the aggregate amount of dividends in arrears was approximately $15.4 million, which represented approximately $154.05 per share of $21.25 Preferred Stock or approximately $15.41 per Depositary Share and is included in other long-term liabilities in the Consolidated Balance Sheets. On June 9, 2003, we completed a tender offer for our Depositary Shares pursuant to which we purchased 440,627 Depositary Shares for $25 per share. See “—Overview—Recent Developments.” As a result of this transaction, approximately $7.3 million of previously accrued and unpaid dividends was reversed and restored to paid-in surplusPaid-in Surplus in the Consolidated Condensed Balance Sheets. Accordingly, the aggregate amount of dividends in arrears at September 30,December 31, 2003 is $9.5$9.8 million, which represents approximately $170.00$175.32 per share of $21.25 Preferred Stock or approximately $17.00$17.53 per Depositary Share and is included in other long-term liabilities in the Consolidated Condensed Balance Sheets. Under the terms of the $21.25 Preferred Stock, the holders of Depositary Shares became entitled to elect two additional Directors once dividends were deferred for more than six quarters, and they have done so at each of the last six annual meetings of stockholders.
As of December 31, 2000, our credit facility no longer restricted the payment of dividends. However, ourOur Board of Directors has not since then decided that our working capital and other conditions warrantedwarrant the resumption of payment of the regular dividend or any of the dividends in arrears on the $21.25 Preferred Stock. We do not have any plans or target date for resuming the dividend, given the following circumstances:
Series B Cumulative Convertible Preferred StockNew Accounting Pronouncements
ForIn January 2003, the FASB issued FIN No. 46, “Consolidation of Variable Interest Entities, an analysisInterpretation of in-kind dividends paidARB 51.” In December 2003, the FASB revised FIN No. 46 to reflect decisions it made regarding a number of implementation issues. FIN No. 46, addresses consolidation by business enterprises of variable interest entities, or VIEs. FIN 46 applies immediately to VIEs created or obtained after January 31, 2003 and it applies in the first fiscal year or interim period ending after December 15, 2003, to VIEs in which an enterprise holds a variable interest that is acquired before February 1, 2003. This pronouncement is currently not anticipated to have a material effect on the Series B Cumulative Convertible Preferred Stock,our consolidated financial position or the Series B Preferred Stock, for the period from December 31, 1999 to March 29, 2000, the date on which the holdersresults of Series B Preferred Stock exchanged their shares of Series B Preferred Stock into shares of our common stock, see Note 8(b) of Notes to Consolidated Financial Statements.operations.
Quantitative and Qualitative Disclosures About Market Risk
Our exposure to market risk for changes in interest rates relates primarily to our revolving credit debt (see Note 34 of Notes to Consolidated Financial Statements) and short-term investment portfolio. As of September 30,During 2003, we had $17.0an average daily borrowing of approximately $5.5 million borrowed under our revolving credit facilityagreement and $37.3$60.0 million of short-term investments classified as cash equivalents.equivalents as of December 31, 2003.
We borrow under our revolving credit facility for general corporate purposes, including working capital requirements and capital expenditures. Borrowings under the credit facility bear interest at the applicable LIBOR or base rate, as defined, and therefore, we are subject to fluctuations in interest rates. If theBased on our average effective 2003 borrowing rate to date of 3.75% changed by 10% (or 0.375%) during the next twelve months, the impact, based onand our September 30, 2003average daily revolving debt balance in 2003, a change of 1% (or 100 basis points) in our effective borrowing rate would beresult in an increase or decrease in net income and cash flow of approximately $64,000.$55,000 per year.
Our short-term investment portfolio consists primarily of highly liquid instruments with maturities of three months or less.less, all classified as cash and cash equivalents in the accompanying Consolidated Financial Statements.
General
We are a leading construction services company, based on revenues, as ranked by Engineering News-Record, offering diversified general contracting, construction management and design-build services to private clients and public agencies throughout the world. We have provided construction services since 1894 and have established a strong reputation within our markets by executing large, complex projects on time and within budget while adhering to strict quality control measures. We offer general contracting, preconstruction planning and comprehensive project management services, including the planning and scheduling of the manpower, equipment, materials and subcontractors required for a project. We also offer self-performed construction services including earthwork,site work, concrete forming and placement and steel erection. During the nine months ended September 30, 2003, we performed work on over 100 construction projects for over 75 federal, state and local government agencies or authorities and private customers. Our headquarters are in Framingham, Massachusetts, and we have seven other principal offices throughout the United States. As of September 30,December 31, 2003, we employed approximately 3,4001,725 people. Our common stock is currently listed on the American Stock Exchange under the symbol “PCR.” We have applied for the listing of our common stock on the New York Stock Exchange. We expect our common stock to begin trading on the New York Stock Exchange in April 2004 under the symbol “PCR.”
Our business is now conducted through three primary segments: building, civil, and management services. Our building segment, comprised of Perini Building Company and James A. Cummings, Inc., focuses on large, complex projects in the hospitality and gaming, sports and entertainment, educational, transportation and healthcare markets. Our civil segment is involved in public works construction primarily in the northeastern United States, including the repair, replacement and reconstruction of the United States public infrastructure such as highways, bridges and mass transit systems. Our management services segment provides diversified construction, design-build and maintenance services to the U.S. military and government agencies as well as power producers, surety companies and multi-national corporations.
Industry Overview
The overall construction industry has experienced significant growth over the past seven years. Based on data from the U.S. Census Bureau, the annual value of construction put-in-place has grown at a 6.4% compound annual growth rate since 1995. Growth in our private end markets is largely driven by the continued strong demand for hospitality and gaming, sports and entertainment, education and healthcare facilities. McGraw-Hill, an industry data source, is projecting that the value of contracts for hotels and motels will increase 14.6% in 2004, representing one of the fastest growing segments of non-residential construction, which is projected to grow by approximately 4.0% in 2004. In addition, the U.S. Department of Commerce is projecting 5.0% and 1.9% growth in 2004 for construction put-in-place within healthcare and education construction, respectively.
In our public end markets, despite declining tax revenues, the federal government has increased expenditures on national defense, and municipalities have increased expenditures on the repair, replacement and reconstruction of the public infrastructure. For example, the United States federal government has recently approved a spending bill for the reconstruction and defense of Iraq and has allocated significant funds to the defense of United States interests around the world from the threat of terrorism. In addition, McGraw-Hill is forecasting an increase in the value of contracts in highways and bridges of 2.0% in 2004.
We are currently tracking more than 90 opportunities for our building segment, which include private and public projects with combined potential revenue to the successful contractors in excess of $10 billion for the period between 2004 and 2006. In the civil segment, we have identified approximately 60 opportunities with potential revenue to the successful contractors of $8 billion over that same time period to repair and replace the aging infrastructure in the markets we serve. Our management services segment has identified approximately 10 opportunities with potential revenues to the successful contractors in excess of $2 billion during that same time period.
Business Segment Overview
Historically, we have evaluated our operating results based on two reportable segments: building and civil. During the fourth quarter of 2003, we adjusted the responsibilities of certain of our executive officers and, in accordance with Statement of Financial Accounting Standards No. 131, “Disclosures about Segments of an Enterprise and Related Information,” we reevaluated the criteria for determining our reportable segments. We have determined that a third business segment, management services, will be included as a reportable segment prospectively to align our reportable segments with current management responsibilities. Previously, our management services operations were included as part of our building segment. The management services segment will aggregate contracts that have a higher than normal geopolitical and operational risk and a corresponding potential for greater than normal gross margin volatility.
Building Segment
Our building segment has significant experience providing services to a number of high growth, specialized building markets, including the hospitality and gaming, sports and entertainment, education, transportation and healthcare markets. We believe our success within the building segment results from our proven ability to manage and perform large, complex projects with aggressive fast-track schedules, elaborate designs and advanced systems while providing accurate budgeting and strict quality control. Although price is a key competitive factor, we believe our strong reputation, long-standing customer relationships and significant levels of repeat and referral business have enabled us to achieve our leading position.
We believe the hospitality and gaming market provides significant opportunities for growth. We are a recognized leader in this market, specializing in the construction of high-end destination resorts and casinos and Native American developments. We work with hotel operators, Native American tribal councils, developers and architectural firms to provide diversified construction services to meet the challenges of new construction and renovation of hotel and resort properties. We believe that our reputation for completing projects on time is a significant competitive advantage in this market, as any delay in project completion may result in significant loss of revenues for the customer. In Engineering News-Record’s, or ENR’s, 2003 rankings, we ranked as the nation’s 26th largest contractor in the general building market, 3rd largest builder in the hotel, motel and convention center market and as one of the top 25 builders in the sports, entertainment and government office buildings markets, based on revenue.
As a result of our reputation and track record, we have been involved in many marquee projects. These include hospitality and gaming projects such as the Paris Hotel and Casino in Las Vegas, NV; the Gaylord Palms Resort and Convention Center in Orlando, FL; and the Grand Resorts Hotel/Casino Expansion in Atlantic City, NJ. In the sports and entertainment market, we have been involved in projects such as the Bank One Ballpark in Phoenix, AZ and The Palace at Auburn Hills in Auburn Hills, MI. In our other end markets, we have been involved in large, complex projects such as the Airport Parking Garage and Rental Car Facility in Ft. Lauderdale, FL; the Florida International University Health & Life Sciences Building in Miami, FL; and the South Shore Hospital expansion in Weymouth, MA.
In January 2003, we acquired Cummings to expand our presence in the southeast region of the United States. Cummings, which is now our wholly owned subsidiary, specializes in the construction of schools, municipal buildings and commercial developments.
Our building segment revenues and income from operations for the nine monthsyear ended September 30,December 31, 2003 were $629.3$898.2 million and $9.2$12.4 million, respectively, which is an increase of 28.9%42.1% and a decrease of 16.4%14.5%, respectively, over the same period in 2002. This segment also accounted for $749$897 million, or 56%54%, of our $1.33$1.67 billion backlog as of September 30,December 31, 2003.
Civil Segment
Our civil segment specializes in new public works construction and the repair, replacement and reconstruction of infrastructure, principally in the metropolitan New York and Boston markets. Our civil contracting services include construction and rehabilitation of highways, bridges, light rail transit systems, subways, airports and wastewater treatment facilities. Our customers primarily award contracts through one of two methods: the traditional public “competitive bid” method, in which price is the major determining factor, or through a request for proposals where contracts are awarded based on a combination of technical capability and price. Traditionally, our customers require each contractor to pre-qualify for construction business by meeting criteria that include technical capabilities, financial strength and corporate integrity. We believe that our corporate integrity, financial strength and outstanding record of performance on challenging civil works projects enables us to pre-qualify for projects in situations where smaller, less diversified contractors are unable to meet the qualification requirements. We believe this is a competitive advantage that makes us an attractive partner on the largest infrastructure projects and prestigious DBOM (design-build-operate-maintain) contracts, which combine the nation’s top contractors with engineering firms, equipment manufacturers and project development consultants in a competitive bid selection process to execute highly sophisticated public works projects.
We have been active in civil construction since 1894 and believe we have developed a particular expertise in large, complex civil construction projects. ENR’s 2003 rankings place us as the 20th largest builder of general transportation projects in the country and as a top 25 builder in mass transit and rail, bridges and highways. We have completed or are currently working on some of the most significant civil construction projects in the northeast including a portion of Boston’s “Big Dig” project, the Williamsburg Bridge reconstruction, New Jersey Light Rail Transit, the Triborough Bridge, Jamaica Station and the Long Island Expressway.
Our civil segment revenues and income from operations for the nine monthsyear ended September 30,December 31, 2003 were $134.5$176.9 million and $1.7$3.2 million, respectively, which is a decrease of 43.1%43.4% and 10.5%50.0%, respectively, over the same period in 2002. This segment also accounted for $243$305 million, or 18%, of our $1.33$1.67 billion backlog as of September 30,December 31, 2003.
Management Services Segment
Our management services segment provides diversified construction, design-build and maintenance services to the U.S. military and government agencies, power suppliers, surety companies and multi-national corporations in the United States and overseas. We believe customers choose our services based on our ability to plan and execute rapid response assignments and multi-year contracts through our diversified construction and design-build abilities. Furthermore, we believe we have demonstrated consistently superior performance on competitively bid or negotiated multi-year, multi-trade, task order and ID/IQ (Indefinite Delivery/Indefinite Quantity) construction programs. Most recently, we have been chosen by the federal government for significant projects related to defense and reconstruction projects in Iraq and Afghanistan. For example, we are currently working on the reconstruction of electric power facilities in southern Iraq. In addition, we recently completed a project to construct the entire infrastructure for a 6,000-person base for the new Afghan army and have recently begun construction of similar facilities at another base.
We believe we are well positioned to capture additional projects that involve long-term contracts and provide a recurring source of revenues as government expenditures for defense and homeland security increase in response to the global threat of terrorism. For example, we have a multi-year contract with the U.S. Department of State, Office of Overseas Buildings Operations, to perform design-build security upgrades at U.S. embassies and consulates throughout the world including Argentina, Brazil, Czech Republic, Laos, Pakistan, the Philippines and Taiwan. In addition, our proven abilities with federal government projects have enabled us to win contracts from private defense contractors who are executing projects for the federal government. For example, we have been awarded design and construction contracts by Raytheon Integrated Defense Systems for upgrades to radar facilities at Beale Air Force Base in California and the Cobra Dane Facility on Shemya Island, Alaska, to meet the requirements of a new early warning radar system.
We also provide diversified management services to power producers, surety companies and multi-national corporations. Under a five-year contract expiring at the end of 2006, we provide planning, management, maintenance and modification services at 10 nuclear power generating stations, including 17 operating units. We are also under agreement with a major North American surety company to provide rapid response, contract completion services. Upon notification from the surety of a contractor bond default, we provide management or general contracting services to fulfill the contractual and financial obligations of the surety.
Our management services segment revenuerevenues and income from operations for the nine monthsyear ended September 30,December 31, 2003 were $109.6$299.0 million and $11.4$23.7 million, respectively, which is an increase of 11.8%112.7% and 54.1%102.6%, respectively, over the same period in 2002. This segment also accounted for $340$464 million, or 26%28%, of our $1.33$1.67 billion backlog as of September 30,December 31, 2003.
Competitive Strengths
We believe our record of delivering large, complex construction projects on time for our clients provides us with a significant competitive advantage. Our commitment to producing high quality results is augmented by the following principal competitive strengths:
Market Leadership in Several High-Growth Building End Markets. In ENR’s 2003 rankings, based on revenue, we ranked as the nation’s 26th largest contractor in the general building market, 3rd largest builder in the hotel, motel and convention center market and one of the top 25 builders in the sports, entertainment and government office buildings markets. We also have significant experience in constructing educational facilities, such as university buildings and schools, correctional and healthcare facilities. Our significant experience, strong relationships, market leadership, design-build expertise and presence in key domestic markets allow us to successfully complete large projects that often require responsiveness, fast-track schedules, elaborate designs and advanced construction techniques in these high-growth building end markets.
Extensive Experience in Complex Civil Construction. For over 100 years, we have specialized in the repair, replacement and construction of highways and bridges, mass transit systems and water and wastewater systems, principally in the metropolitan New York and Boston markets. Our expertise and focus is on large, complex projects, particularly in dense urban areas and extends from publicly bid construction projects to negotiated design-build contracts.
Responsiveness and Performance with Challenging Projects. We have established a favorable reputation for our ability to execute challenging projects on time, on budget and to the customer’s specifications. For example, we have been the contractor of choice for many large hotels, casinos and sports arenas because of our demonstrated ability to complete technically challenging construction projects. These projects often have accelerated completion schedules and demanding standards for quality, factors which are often more important to their owners than achieving the lowest cost. Furthermore, in providing services to government agencies, we have demonstrated our ability to rapidly and effectively respond to construction and related support needs in remote and sometimes volatile environments. For example, we recently performed design-build security upgrades at U.S. embassies throughout the world and currently are engaged in significant re-construction activities in Iraq and Afghanistan. Our clients often rely on us to respond rapidly to complete large, complex projects in challenging business or operating environments throughout the world.
Long-Term Relationships and Operating History with Clients. We maintain strong, long-term relationships with many of our clients. This is particularly beneficial in our building and management services segments where it often enables us to negotiate, rather than bid for, contracts. These relationships are very valuable as project owners begin to plan renovations of, or expansions to, existing projects, which occurs frequently in the hospitality and gaming market, or when owners such as the U.S. Army Corps of Engineers seek to execute support facility construction. Due to our historical involvement with numerous large projects, we have developed a detailed database of significant contract cost elements, project specifications and owner requirements, which often allows us to complete expansions or renovations, or to integrate improvements into new projects faster and more efficiently than our competitors.
Focus on Managing Contract and Project Risk. Our extensive experience and history in our markets provide us with an understanding of the risks associated with certain projects. We mitigate risk in a variety of ways, including a thorough bid review and approval process, incorporating safeguards into our contracts, subcontracting certain project components to other contractors, quickly and effectively communicating with our clients with regard to changes in project scope or size and by structuring our contracts or pursuing joint venture arrangements to provide a balance between risk and reward opportunity. For example, approximately 25%18% of our revenues for the first nine months of 2003 were earned through fixed price contracts, which provide greater reward opportunities but are accompanied by higher risk, while the remaining 75%82% were earned through lower risk cost-plus, guaranteed maximum price or construction management contracts. We constantly weigh opportunity and risks in our overall project portfolio and balance exposures across project types, industries, owners and contract types.
Experienced Management Team and Highly Skilled Workforce. Our senior management team has an average of 29 years in the construction industry and 23 years with us. We benefit from this experience in many ways, including construction and management expertise, extensive customer relationships, longstanding relationships with experienced subcontractors in various markets and a strong corporate culture. Our workforce is also key to our success, bringing diverse work experiences as well as specialized project expertise to our team.
Growth Strategy
We will seek to increase shareholder value by pursuing the following growth strategies:
Leverage Leadership Position in Hospitality and Gaming Market.We are among the nation’s largest contractors for casinos, hotels and convention centers. We believe that demand for new construction in the hospitality and gaming market will continue to expand due to increased consumer spending on leisure and sports and entertainment activities driven by increasing consumer disposable income. In addition, we are observing increased planning and construction activities for hospitality and gaming projects among Native American sovereign nations in locations throughout the country. Moreover, even after initial construction, hospitality and gaming facilities often undertake significant renovation and expansion projects in order to continue to attract clientele. These market dynamics present an attractive business opportunity for our building segment. We intend to leverage our leadership position in this market by emphasizing our experience and expertise, as well as our proven ability to complete challenging projects on accelerated schedules on time and within budget, and our strong relationships and reputation among industry participants.
Extend Building Construction Expertise to Additional Markets.As we expand our market presence within particular project types or geographic areas, we will seek opportunities to cross-utilize our building construction expertise. For instance, we have been able to successfully leverage the experience we gained from constructing hospitality and gaming projects in Nevada and selected sports arenas into new markets and related projects. Also, with our recent acquisition of Cummings, we established a significant market presence in south Florida, particularly in the construction of schools, municipal buildings and commercial facilities. We believe this market presence will enhance and accelerate our ability to successfully compete in other end markets in the state of Florida. We will pursue these and related opportunities to extend our construction expertise to building end markets and geographical areas where we hold a competitive advantage.
Pursue Expanding Federal Contracting Opportunities for Defense, Reconstruction and Security. We have well established relationships with U.S. government agencies that include, among others, the Departments of Defense and State. These customers represent growth opportunities for us, particularly with the expanded outsourcing of federal jobs and increased spending on defense, reconstruction and security. Our ability to effectively compete for this growing business is strengthened by our proven ability to respond rapidly to technically challenging assignments. During the 1995 through 2001 period, we were under contract with the United States Navy to provide rapid response construction services worldwide. In Afghanistan, we recently completed the construction of buildings and infrastructure for a 6,000-person base to be used by the new Afghan army and have recently begun construction of similar facilities at another base. In April 2003, we were awarded a
contract by the U.S. Army Corps of Engineers to help rebuild Iraq, a contract for which spending authorization was recently increased from $100 million to a maximum of $500 million, subject to identification and award of specific contract task orders. In January 2004, we were awarded a new contract for the U.S. Army Corps of Engineers Transatlantic Programs Center, with a maximum potential value of $1.5 billion, subject to identification and award of specific contract task orders. We will continue to pursue additional opportunities in Iraq and Afghanistan, as well as construction and support projects at various domestic and overseas locations, including military bases, military installations and U.S. embassies.
Seek Complex Civil Construction Projects in the Northeast. We intend to maintain and build upon our established position as a leading civil construction contractor in the northeastern United States. However, we will do so selectively, with our business levels reflective of our risk tolerance, resource allocation, joint venture opportunities and targeted profit margins. As an example, duringfor the nine monthsyear ended September 30,December 31, 2003, our revenues from civil construction declined to $134.5$176.9 million from $236.4$312.5 million during the same period in 2002. This decline in revenue occurred despite the fact that our overall bidding activity in the civil market during the periods remained relatively constant. Our reduced revenues were reflective of our unwillingness to bid work at unacceptable levels of profit or business risk in an unusually competitive bidding environment. We believe our opportunities and activity in winning civil work will increase as some competitors experience unacceptable profit margins and challenging construction conditions. Moreover, we believe there is a substantial and growing backlog of infrastructure replacement and repair needs in our principal markets that must be addressed in the near future. We will focus on large, complex public works projects in dense urban areas, particularly in the metropolitan New York area, where we are one of a limited number of construction firms that can consistently pre-qualify for these types of projects. We believe we have a competitive advantage on these projects as a result of our technical expertise, our significant local resources and our proven record of performance.
Focus on Margin Expansion Opportunities.We will actively seek to expand our profit margins by managing our business mix, targeting high value-added projects and continuously evaluating our corporate support and field operations cost structures. We anticipate that our business opportunities and revenues will grow more rapidly in our building and management services segments, as a result of both private and federal contracting opportunities. Additionally, in targeting our business development and bidding activity, we will emphasize large, complex projects that require innovative engineering, challenging logistics or completion schedules and construction capabilities where we have demonstrated expertise. These projects can generate and justify higher profit margins due to the higher value-added nature of our services. We will also seek to control our corporate overhead expenses and closely monitor field operations, with a view toward discontinuing unprofitable and unpromising operations. For example, in 1998 we closed unprofitable business units in the Midwest region after concluding that future business prospects did not justify the operating losses experienced by the units. As we pursue opportunities to expand our profit margins, we will remain attentive to our rigorous standards for quality, risk mitigation, market leadership and safety.
Pursue Selected Strategic Acquisitions. We intend to supplement our internal growth and achieve strategic benefits by pursuing selected acquisitions. In particular, we will seek profitable, well managed businesses with operations complementary to our building and management services activities. We believe that our recent acquisition of Cummings demonstrates our ability to successfully identify, execute and integrate strategic acquisitions.
Representative Clients and Projects
The table below is a summary of on-going and recently completed projects organized by our current primary end markets within each of our business segments:
End Market | Representative Clients/Projects | Location | ||||||
Building Segment | ||||||||
• | Hospitality and Gaming | |||||||
General | • | Paris Hotel & Casino | Las Vegas, NV | |||||
| • | Gaylord Palms Resort and Convention Center | Orlando, FL | ||||||
Native American | • | Mohegan Sun Hotel/Casino Expansion | Uncasville, CT | |||||
End Market | Representative Clients/Projects | Location | ||||||
| • | Seminole Hard Rock Hotel and Casino | Hollywood, FL | ||||||
• | Sports and Entertainment | • | Bank One Ballpark | Phoenix, AZ | ||||
| • | The Palace at Auburn Hills | Auburn Hills, MI | ||||||
• | Education Facilities | • | Florida International University, Health & Life Sciences Building | Miami, FL | ||||
| • | East Connecticut State University Dormitory | Willimantic, CT | ||||||
• | Transportation Facilities | • | 100th Street Bus Depot | New York, NY | ||||
| • | Airport Parking Garage and Rental Car Facility | Ft. Lauderdale, FL | ||||||
• | Healthcare Facilities | • | South Shore Hospital Expansion | Weymouth, MA | ||||
| • | La Posada Senior Living Community | Palm Beach Gardens, FL | ||||||
| Civil Segment | ||||||||
• | Highways | • | I-93 Northbound Tunnel/Atlantic Avenue (Central Artery/Tunnel Project) | Boston, MA | ||||
| • | Long Island Expressway Reconstruction | Queens, NY | ||||||
• | Bridges | • | Williamsburg Bridge Reconstruction | New York, NY | ||||
| • | Triborough Bridge Deck Replacement | New York, NY | ||||||
• | Mass Transit | • | Hudson-Bergen Light Rail | Jersey City, NJ | ||||
| • | Jamaica Station Reconstruction | Jamaica, NY | ||||||
| Management Services Segment | ||||||||
• | U.S. Government Services | • | U.S. Embassy Security Upgrade | Worldwide | ||||
| • | Reconstruction of Electric Power Facilities | Southern Iraq | ||||||
• | Power Facilities Maintenance | • | Exelon Nuclear (10 Stations, 17 Units) | IL, NJ and PA | ||||
Markets and Clients
Our construction services are targeted toward end markets that are diversified across project types, client characteristics and geographic locations. Revenues by business segment for the nine months ended September 30, 2003 and 2002 and for each of the three years in the period ended December 31, 2002, 2001 and 20002003 are set forth below:
| Revenues by Segment | Revenues by Segment | |||||||||||||||||||||||
Nine Months Ended September 30, | Year Ended December 31, | Year Ended December 31, | ||||||||||||||||||||||
| 2003 | 2002 | 2002 | 2001 | 2000 | 2003 | 2002 | 2001 | |||||||||||||||||
| (in thousands) | (in thousands) | |||||||||||||||||||||||
Building | $ | 629,305 | $ | 488,111 | $ | 631,860 | $ | 1,120,161 | $ | 740,555 | $ | 898,254 | $ | 631,860 | $ | 1,120,161 | ||||||||
Civil | 134,507 | 236,409 | 312,528 | 353,957 | 279,469 | 176,877 | 312,528 | 353,957 | ||||||||||||||||
Management Services | 109,639 | 97,962 | 140,653 | 79,278 | 85,636 | 298,972 | 140,653 | 79,278 | ||||||||||||||||
Total | $ | 873,451 | $ | 822,482 | $ | 1,085,041 | $ | 1,553,396 | $ | 1,105,660 | $ | 1,374,103 | $ | 1,085,041 | $ | 1,553,396 | ||||||||
Revenues by end market for the building segment for the nine months ended September 30, 2003 and 2002 and for each of the three years in the period ended December 31, 2002, 2001 and 20002003 are set forth below:
| Building Segment Revenues by End Market | Building Segment Revenues by End Market | |||||||||||||||||||||||
Nine Months Ended September 30, | Year Ended December 31, | Year Ended December 31, | ||||||||||||||||||||||
| 2003 | 2002 | 2002 | 2001 | 2000 | 2003 | 2002 | 2001 | |||||||||||||||||
| (in thousands) | (in thousands) | |||||||||||||||||||||||
Hospitality and Gaming | $ | 375,605 | $ | 406,188 | $ | 513,374 | $ | 1,013,206 | $ | 583,918 | $ | 541,575 | $ | 513,374 | $ | 1,013,206 | ||||||||
Sports and Entertainment | 95,808 | 49,508 | 72,729 | 22,699 | 21,845 | 126,705 | 72,729 | 22,699 | ||||||||||||||||
Education Facilities | 72,256 | 103 | 1,181 | 8,460 | 6,197 | 98,730 | 1,181 | 8,460 | ||||||||||||||||
Transportation Facilities | 32,507 | 12,006 | 14,096 | 18,134 | 10,827 | 46,266 | 14,096 | 18,134 | ||||||||||||||||
Healthcare Facilities | 31,629 | 7,393 | 11,264 | 28,121 | 14,121 | 53,351 | 11,264 | 28,121 | ||||||||||||||||
Other | 21,500 | 12,913 | 19,216 | 29,541 | 103,647 | 31,627 | 19,216 | 29,541 | ||||||||||||||||
Total | $ | 629,305 | $ | 488,111 | $ | 631,860 | $ | 1,120,161 | $ | 740,555 | $ | 898,254 | $ | 631,860 | $ | 1,120,161 | ||||||||
Revenues by end market for the civil segment for the nine months ended September 30, 2003 and 2002 and for each of the three years in the period ended December 31, 2002, 2001 and 20002003 are set forth below:
| Civil Segment Revenues by End Market | Civil Segment Revenues by End Market | |||||||||||||||||||||||
Nine Months Ended September 30, | Year Ended December 31, | Year Ended December 31, | ||||||||||||||||||||||
| 2003 | 2002 | 2002 | 2001 | 2000 | 2003 | 2002 | 2001 | |||||||||||||||||
| (in thousands) | (in thousands) | |||||||||||||||||||||||
Highways | $ | 48,935 | $ | 71,334 | $ | 92,486 | $ | 142,144 | $ | 135,565 | $ | 64,322 | $ | 92,486 | $ | 142,144 | ||||||||
Bridges | 15,073 | 56,972 | 72,312 | 65,117 | 47,481 | 16,519 | 72,312 | 65,117 | ||||||||||||||||
Mass Transit | 65,781 | 88,176 | 145,160 | 146,397 | 87,930 | 84,967 | 145,160 | 146,397 | ||||||||||||||||
Other | 4,718 | 19,927 | 2,570 | 299 | 8,493 | |||||||||||||||||||
Wastewater Treatment and Other | 11,069 | 2,570 | 299 | |||||||||||||||||||||
Total | $ | 134,507 | $ | 236,409 | $ | 312,528 | $ | 353,957 | $ | 279,469 | $ | 176,877 | $ | 312,528 | $ | 353,957 | ||||||||
Revenues by end market for the management services segment for the nine months ended September 30, 2003 and 2002 and for each of the three years in the period ended December 31, 2002, 2001 and 20002003 are set forth below:
| Management Services Segment Revenues by End Market | Management Services Segment Revenues by End Market | |||||||||||||||||||||||
Nine Months Ended September 30, | Year Ended December 31, | Year Ended December 31, | ||||||||||||||||||||||
| 2003 | 2002 | 2002 | 2001 | 2000 | 2003 | 2002 | 2001 | |||||||||||||||||
| (in thousands) | (in thousands) | |||||||||||||||||||||||
U.S. Government Services | $ | 56,430 | $ | 32,306 | $ | 46,749 | $ | 37,348 | $ | 39,125 | $ | 218,688 | $ | 46,749 | $ | 37,348 | ||||||||
Power Facilities Maintenance | 31,774 | 54,411 | 74,948 | 28,616 | 37,126 | 51,724 | 74,948 | 28,616 | ||||||||||||||||
Other | 21,435 | 11,245 | 18,956 | 13,314 | 9,385 | 28,560 | 18,956 | 13,314 | ||||||||||||||||
Total | $ | 109,639 | $ | 97,962 | $ | 140,653 | $ | 79,278 | $ | 85,636 | $ | 298,972 | $ | 140,653 | $ | 79,278 | ||||||||
We provide our services to a broad range of private and public clients. The allocation of our revenues by client source for the nine months ended September 30, 2003 and 2002 and for each of the three years in the period ended December 31, 2002, 2001 and 20002003 is set forth below:
| Revenues by Client Source | Revenues by Client Source | |||||||||||||||||||||||
Nine Months Ended September 30, | Year Ended December 31, | Year Ended December 31, | ||||||||||||||||||||||
| 2003 | 2002 | 2002 | 2001 | 2000 | 2003 | 2002 | 2001 | |||||||||||||||||
Private Owners | 67 | % | 66 | % | 65 | % | 73 | % | 68 | % | 61 | % | 65 | % | 73 | % | ||||||||
State and Local Governments | 26 | 30 | 30 | 24 | 28 | 23 | 30 | 24 | ||||||||||||||||
Federal Governmental Agencies | 7 | 4 | 5 | 3 | 4 | 16 | 5 | 3 | ||||||||||||||||
Total | 100 | % | 100 | % | 100 | % | 100 | % | 100 | % | 100 | % | 100 | % | 100 | % | ||||||||
Private Owners. We derived approximately 67%61% of our revenues from private clients during the first nine months of 2003. Our private clients include major hospitality and gaming resort owners, Native American sovereign nations, private developers, healthcare and retirement companies and a leading owner and operator of power facilities. We provide services to our private clientscustomers primarily through negotiated contract arrangements, as opposed to competitive bids.
State and Local Governments. We derived approximately 26%23% of our revenues from state and local government clientscustomers during the first nine months of 2003. Our state and local government clientscustomers include state transportation departments, state and local correctional departments, metropolitan authorities, cities, municipal agencies, school districts and public universities. We provide services to our state and local clientscustomers primarily pursuant to contracts awarded through competitive bidding processes. Our civil contracting services are concentrated in the northeast, principally in the metropolitan New York and Boston markets. Our building construction services for state and local government clients,customers, which have included schools and dormitories, correctional and healthcare facilities, parking structures and municipal buildings, are in locations throughout the country. Since our acquisition of Cummings in January 2003, we have been particularly active in providing construction services for local government clientscustomers in Florida.
Federal GovernmentGovernmental Agencies.We derived approximately 7%16% of our revenues from federal governmental agencies during the first nine months of 2003. These agencies have included the State Department, the U.S. Navy and the U.S. Army Corps of Engineers. We provide services to federal agencies primarily pursuant to contracts for specific or multi-year assignments that involve new construction or infrastructure improvements. A substantial portion of our revenues from federal agencies is derived from projects in overseas locations. Our share of revenues derived from federal customers has increased steadily in recent years. We expect this trend to continue for the foreseeable future as a result of our expanding base of experience and relationships with federal agencies, together with favorable market and expenditure trends for defense, security and reconstruction work.
Backlog
We include a construction project in our backlog at such time as a contract is awarded or a firm letter of commitment is obtained and funding is in place. As a result, the backlog figures are firm, subject only to the cancellation provisions contained in the various contracts. Historically, these provisions have not had a material adverse effect on us.
As of September 30, 2003, we had aOur construction backlog of $1.332 billionat December 31, 2003 was $1,666.5 million compared to $990 million at December 31, 2002 $1.214 billion at December 31, 2001 and compared to(or $1,160 million when adjusted for the record year-endaddition of backlog from the January 2003 acquisition of $1.789 billion at December 31, 2000. Backlog is summarized below by business segment asCummings). We experienced a robust new work acquisition period during the second half of September 30, 2003 and December 31, 2002:each of our business segments ended 2003 with a higher backlog than it began the year with as illustrated in the following table:
| Backlog by Business Segment | |||||||||||||||||||||||||
September 30, 2003 | December 31, 2002 | Backlog at December 31, 2002 | New Business Awarded | Revenue Recognized | Backlog at December 31, 2003 | ||||||||||||||||||||
| (dollars in thousands) | (in thousands) | ||||||||||||||||||||||||
Building | $ | 749,450 | 56 | % | $ | 525,433 | 53 | % | $ | 525,433 | $ | 1,269,620 | $ | (898,254 | ) | $ | 896,799 | ||||||||
Civil | 243,044 | 18 | 210,562 | 21 | 210,562 | 272,013 | (176,877 | ) | 305,698 | ||||||||||||||||
Management Services | 339,654 | 26 | 254,180 | 26 | 254,180 | 508,759 | (298,972 | ) | 463,967 | ||||||||||||||||
Total | $ | 1,332,148 | 100 | % | $ | 990,175 | 100 | % | $ | 990,175 | $ | 2,050,392 | $ | (1,374,103 | ) | $ | 1,666,464 | ||||||||
We estimate that approximately $364$460 million (or 27%28%) of our backlog at September 30,December 31, 2003 will not be completed during the next 12 months.in 2004.
Backlog by end market for the building segment as of September 30,December 31, 2003 and December 31, 2002 is set forth below:
| Building Segment Backlog by End Market | Building Segment Backlog by End Market | |||||||||||||||||||||||
September 30, 2003 | December 31, 2002 | December 31, 2003 | December 31, 2002 | |||||||||||||||||||||
| (dollars in thousands) | (in thousands) | |||||||||||||||||||||||
Hospitality and Gaming | $ | 393,593 | 53 | % | $ | 341,115 | 65 | % | $ | 608,161 | 68 | % | $ | 341,115 | 65 | % | ||||||||
Sports and Entertainment | 36,259 | 5 | 115,759 | 22 | 9,235 | 1 | 115,759 | 22 | ||||||||||||||||
Education Facilities | 135,251 | 18 | 13,805 | 3 | 116,013 | 13 | 13,805 | 3 | ||||||||||||||||
Transportation Facilities | 61,932 | 8 | 2,931 | – | 45,529 | 5 | 2,931 | – | ||||||||||||||||
Healthcare Facilities | 47,477 | 6 | 42,504 | 8 | 26,048 | 3 | 42,504 | 8 | ||||||||||||||||
Other | 74,938 | 10 | 9,319 | 2 | 91,813 | 10 | 9,319 | 2 | ||||||||||||||||
Total | $ | 749,450 | 100 | % | $ | 525,433 | 100 | % | $ | 896,799 | 100 | % | $ | 525,433 | 100 | % | ||||||||
Backlog by end market for the civil segment as of September 30,December 31, 2003 and December 31, 2002 is set forth below:
| Civil Segment Backlog by End Market | Civil Segment Backlog by End Market | |||||||||||||||||||||||
September 30, 2003 | December 31, 2002 | December 31, 2003 | December 31, 2002 | |||||||||||||||||||||
| (dollars in thousands) | (in thousands) | |||||||||||||||||||||||
Highways | $ | 36,192 | 15 | % | $ | 65,260 | 31 | % | $ | 24,736 | 8 | % | $ | 65,260 | 31 | % | ||||||||
Bridges | 8,862 | 4 | 20,815 | 10 | 102,155 | 33 | 20,815 | 10 | ||||||||||||||||
Mass Transit | 73,435 | 30 | 106,473 | 51 | 60,603 | 20 | 106,473 | 51 | ||||||||||||||||
Other | 124,555 | 51 | 18,014 | 8 | ||||||||||||||||||||
Wastewater Treatment and Other | 118,204 | 39 | 18,014 | 8 | ||||||||||||||||||||
Total | $ | 243,044 | 100 | % | $ | 210,562 | 100 | % | $ | 305,698 | 100 | % | $ | 210,562 | 100 | % | ||||||||
Backlog by end market for the management services segment as of September 30,December 31, 2003 and December 31, 2002 is set forth below:
| Management Services Segment Backlog by End Market | Management Services Segment Backlog by End Market | |||||||||||||||||||||||
| September 30, 2003 | December 31, 2002 | December 31, 2003 | December 31, 2002 | |||||||||||||||||||||
| (dollars in thousands) | (in thousands) | |||||||||||||||||||||||
U.S. Government Services | $ | 161,309 | 48 | % | $ | 69,904 | 27 | % | $ | 305,496 | 66 | % | $ | 69,904 | 27 | % | ||||||||
Power Facilities Maintenance | 170,258 | 50 | 175,032 | 69 | 150,308 | 32 | 175,032 | 69 | ||||||||||||||||
Other | 8,087 | 2 | 9,244 | 4 | 8,163 | 2 | 9,244 | 4 | ||||||||||||||||
Total | $ | 339,654 | 100 | % | $ | 254,180 | 100 | % | $ | 463,967 | 100 | % | $ | 254,180 | 100 | % | ||||||||
Competition
The construction industry is highly competitive and the markets in which we compete have numerous and often larger companies that provide similar services. In certain end markets of the building segment, such as hospitality and gaming, we are one of the largest providers of construction services in the United States, but within other end markets of the building segment, and within the civil and management services segments, there are competitors with significantly greater capabilities and resources. In our building segment, we compete with a variety of national and regional contractors. In the west, our primary competitors are Marnell-Carrao, Huntcor and McCarthy. In the northeast, our primary competitors are Suffolk, Gilbane and Turner and in the southeast our primary competitors include Centex-Rooney, James B. Pirtle and Whiting-Turner. In our management services segment, we compete principally with national engineering and construction firms such as Fluor, Bechtel, Washington Group International and Kellogg Brown & Root.In our civil segment, we compete principally with large civil construction firms that operate in the northeast, including Slattery/Skanska, Granite Construction/Halmar, Tully and Schiavone. We believe price, experience, reputation, responsiveness, customer relationships, project completion track record and quality of work are key factors in clients awarding contracts across our end markets.
Types of Contracts and The Contract Process
Types of Contracts
The general contracting and management services we provide consist of planning and scheduling the manpower, equipment, materials and subcontractors required for the timely completion of a project in accordance with the terms, plans and specifications contained in a construction contract. We provide these services by using traditional general contracting arrangements, such as fixed price, guaranteed maximum price and cost plus award fee contracts and, to a lesser extent, construction management or design-build contracting arrangements. These contract types and the risks generally inherent therein are discussed below:
Historically, a high percentage of our contracts have been of the fixed price and GMP type. A summary of revenues and backlog by type of contract for the nine-month period ended September 30, 2003 and for each of the three years in the period ended December 31, 20022003 follows:
| Backlog as of | |||||||||||||||||||||
September 30, 2003 | December 31, | Backlog as of December 31 | |||||||||||||||||||
| 2002 | 2001 | 2000 | 2003 | 2002 | 2001 | ||||||||||||||||
Fixed Price | 30 | % | 30 | % | 41 | % | 46 | % | 30 | % | 30 | % | 41 | % | |||||||
CPAF, GMP or CM | 70 | 70 | 59 | 54 | |||||||||||||||||
Cost Plus, GMP or CM | 70 | 70 | 59 | ||||||||||||||||||
| 100 | % | 100 | % | 100 | % | 100 | % | ||||||||||||||
| 100 | % | 100 | % | 100 | % | ||||||||||||||||
| Revenues | |||||||||||||||||||||
September 30, 2003 | December 31, | Revenues for the Year Ended December 31, | |||||||||||||||||||
| 2002 | 2001 | 2000 | 2003 | 2002 | 2001 | ||||||||||||||||
Fixed Price | 25 | % | 35 | % | 25 | % | 32 | % | 18 | % | 35 | % | 25 | % | |||||||
CPAF, GMP or CM | 75 | 65 | 75 | 68 | |||||||||||||||||
Cost Plus, GMP or CM | 82 | 65 | 75 | ||||||||||||||||||
| 100 | % | 100 | % | 100 | % | 100 | % | 100 | % | 100 | % | 100 | % | ||||||||
The Contract Process
We identify potential projects from a variety of sources, including advertisements by federal, state and local governmental agencies, through the efforts of our business development personnel and through meetings with other participants in the construction industry such as architects and engineers. After determining which projects are available, we make a decision on which projects to pursue based on such factors as project size, duration, availability of personnel, current backlog, competitive advantages and disadvantages, prior experience, contracting agency or owner, source of project funding, geographic location and type of contract.
After deciding which contracts to pursue, we generally have to complete a prequalification process with the applicable agency or owner.customer. The prequalification process generally limits bidders to those companies with operational experience and financial capability to effectively complete the particular project(s) in accordance with the plans, specifications and construction schedule.
The estimating process typically involves three phases. Initially, we perform a detailed review of the plans and specifications, summarize the various types of work involved and related estimated quantities, determine the project duration or schedule and highlight the unique and riskier aspects of the project. TheAfter the initial review, we decide whether or not to continue to pursue the project. If the answer is positive, we perform the second phase of the estimating process which consists of estimating the cost and availability of labor, material, equipment, subcontractors and the project team required to complete the project on time and in accordance with the plans and specifications. The final phase consists of a detailed review of the estimate by management including, among other things, assumptions regarding cost, approach, means and methods, productivity and risk. After the final review of the cost estimate, management adds an amount for profit to arrive at the total bid amount.
Public bids to various governmental agencies are generally awarded to the lowest bidder. Requests for proposals or negotiated contracts with public or private owners are generally awarded based on a combination of technical capability and price, taking into consideration factors such as project schedule and prior experience.
During the construction phase of a project, we monitor our progress by comparing actual costs incurred and quantities completed to date with budgeted amounts and the project schedule and periodically, at a minimum on a quarterly basis, prepare an updated estimate of total forecasted revenue, cost and profit for the project.
During the normal course of most projects, the owner and sometimes the contractor initiate modifications or changes to the original contract to reflect, among other things, changes in specifications or design, method or manner of performance, facilities, equipment, materials, site conditions and period for completion of the work. Generally, the scope and price of these modifications are documented in a “change order” to the original contract and reviewed, approved and paid in accordance with the normal change order provisions of the contract.
Many times we are required to perform extra or change order work as directed by the customer even if the customer has not agreed in advance on the scope or price of the work to be performed. This process may result in disputes over whether the work performed is beyond the scope of the work included in the original project plans and specifications or, if the customer agrees that the work performed qualifies as extra work, the price the customer is willing to pay for the extra work. Even when the customer agrees to pay for the extra work, we may be required to fund the cost of such work for a lengthy period of time until the change order is approved and funded by the customer. Also, these unapproved change orders, contract disputes or claims result in costs being incurred by us that cannot be billed currently and, therefore, are reflected as “Unbilled Work” in our balance sheet. See Note 1(d) of Notes to Consolidated Financial Statements. In addition, any delay caused by the extra work may adversely impact the timely scheduling of other project work and our ability to meet specified contract milestone dates.
The process for resolving claims vary from one contract to another but, in general, we attempt to resolve claims at the project supervisory level through the normal change order process or with higher levels of management within theour organization of the contractor and the customer.customer’s organization. Depending upon the terms of the contract,
claim resolution may employ a variety of other resolution methods, including mediation, binding or non-binding arbitration or litigation. Regardless of the process, when a potential claim arises on a project, the contractorwe typically hashave the contractual obligation to perform the work and must incur the related costs. The contractor doesWe do not recoup the costs until the claim is resolved. It is not uncommon for the claim resolution process to take months or years to resolve, especially if it involves litigation.
Our contracts generally involve work durations in excess of one year. Revenue on contracts in process is generally recorded under the percentage of completion contract accounting method. For a more detailed discussion of our policy in these areas, see Note 1(d) of Notes to Consolidated Financial Statements, entitled “Method of Accounting for Contracts.”
Construction Costs
While our business may experience some adverse consequences if shortages develop or if prices for materials, labor or equipment increase significantly,excessively, provisions in certain types of contracts often shift all or a major portion of any adverse impact to the customer. On fixed price contracts, we attempt to insulate ourselves
from the unfavorable effects of inflation by incorporating escalating wage and price assumptions, where appropriate, into our construction bids and by obtaining firm fixed price quotes from major subcontractors and material suppliers at the time of the bid. Construction and other materials used in our construction activities are generally available locally from multiple sources and have been in adequate supply during recent years. Construction work in selected overseas areas primarily employs expatriate and local labor which can usually be obtained as required.
Environmental Matters
Our properties and operations are subject to federal, state and municipal laws and regulations relating to the protection of the environment, including requirements for water discharges, air emissions, the use, management and disposal of solid or hazardous materials or wastes and the cleanup of contamination. For example, we must apply water or chemicals to reduce dust on road construction projects and to contain contaminants in storm run-off water at construction sites. In certain circumstances, we may also be required to hire subcontractors to dispose of hazardous wastes encountered on a project in accordance with a plan approved in advance by the owner. We believe that we are in substantial compliance with all applicable laws and regulations. However, future requirements or amendments to current laws or regulations imposing more stringent requirements could require us to incur costs to maintain or achieve compliance.
In addition, some environmental laws, such as the U.S. federal “Superfund” law and similar state statutes, can impose liability for the entire cost of cleanup of contaminated sites upon any of the current or former owners or operators or upon parties who sent wastes to these sites, regardless of who owned the site at the time of the release or the lawfulness of the original disposal activity. Contaminants have been detected at some of the sites that we own, or where we worked as a contractor in the past, and we have incurred costs for investigation or remediation of hazardous substances. We also believe that our liability for these sites will not be material, either individually or in the aggregate, and have pollution legal liability insurance available for such matters. We believe that we have minimal exposure to environmental liability as a result of the activities of Perini Environmental Services, Inc., or Perini Environmental, a wholly owned subsidiary of Perini that was phased out during 1997. Perini Environmental provided hazardous waste engineering and construction services to both private clients and public agencies nationwide. Perini Environmental was responsible for compliance with applicable laws in connection with its activities; however, Perini and Perini Environmental generally carried insurance or received indemnification from customers to cover the risks associated with the remediation business.
We currently own real estate in three states and as an owner, are subject to laws governing environmental responsibility and liability based on ownership. We are not aware of any significant environmental liability associated with our ownership of real estate.
Real Estate Operations
Effective June 30, 1999, management adopted a plan to withdraw completely from the real estate development business and to wind down the operations of Perini Land and Development Company, or PL&D, our wholly owned real estate development subsidiary. Accordingly, approximately 97%97.5% of the property has been liquidated since June 30, 1999. As of September 30,December 31, 2003, the only land remaining propertyto be sold consists of 92 buildable acres available for sale in the Raynham Woods Commerce Center, an industrial park locatedcertain fully developed parcels in Raynham, Massachusetts. This property is classified on the balance sheet as either “Land held for sale, net” or included in “Other Assets.”Assets” on the Consolidated Balance Sheet. See Note 5Note13 of Notes to Consolidated Financial Statements.
Insurance and Bonding
All of our properties and equipment, both directly owned or owned through joint ventures with others, are covered by insurance and management believes that such insurance is adequate. In addition, we maintain general liability, excess liability and workers’ compensation insurance in amounts that we believe are consistent with our risk of loss and industry practice. During 2000 and 2001, we were able to significantly limit our financial risk under our workers’ compensation and general liability insurance coverage by purchasing traditional insurance
policies in a favorable insurance market. Due to tight conditions in the insurance market, effective for the calendar year 2002 and continuing into 2003, we found it necessary to purchase workers’ compensation and general liability policies at substantially higher premiums with a self-insured deductible limit of $250,000 per occurrence, with appropriate aggregate caps on losses retained.
As a normal part of the construction business, we are often required to provide various types of surety bonds as an additional level of security of our performance. We have surety arrangements with several sureties, one of which we have dealt with for over 75 years and another of which owns approximately 21% of our outstanding common stock. See Note 1312 of Notes to Consolidated Financial Statements.
Employees
The total number of personnel employed by us is subject to seasonal fluctuations, the volume of construction in progress and the relative amount of work performed by subcontractors. During 2002,2003, the average number of employees was approximately 3,200,2,400, with a maximum of approximately 4,8003,500 and a minimum of approximately 1,800.1,600. As of September 30,December 31, 2003, the number of employees waswe employed approximately 3,400.1,725 people.
We operate as a union contractor. As such, we are a signatory to numerous local and regional collective bargaining agreements, both directly and through trade associations, throughout the country. These agreements cover all necessary union crafts and are subject to various renewal dates. Estimated amounts for wage escalation related to the expiration of union contracts are included in our bids on various projects and, as a result, the expiration of any union contract in the next fiscal year is not expected to have any material impact on us. As of September 30,December 31, 2003, approximately 2,600825 of our total of 1,725 employees were union employees. During the past several years, we have not experienced any work stoppages.
Properties
Properties used in our construction operations as of September 30,December 31, 2003 are summarized below:
Business Segment(s) | Owned or Leased by Perini | Approximate Acres | Approximate Square Feet of Office Space | |||||
Principal Offices | ||||||||
Framingham, MA | Building, Civil and Management Services | Owned | 9 | 100,000 | ||||
Phoenix, AZ | Building | Leased | – | 22,700 | ||||
Peekskill, NY | Civil | Owned | 2 | 21,000 | ||||
Ft. Lauderdale, FL | Building | Leased | – | 17,500 | ||||
Las Vegas, NV | Building | Leased | – | 7,400 | ||||
Celebration, FL | Building | Leased | – | 4,800 | ||||
Carlsbad, CA | Building | Leased | – | 3,900 | ||||
Detroit, MI | Building | Leased | – | 2,500 | ||||
| 11 | 179,800 | |||||||
Principal Permanent Storage Yards | ||||||||
Bow, NH | Civil | Owned | 70 | |||||
Framingham, MA | Building and Civil | Owned | 6 | |||||
Las Vegas, NV | Building | Leased | 2 | |||||
Peekskill, NY | Civil | Owned | 3 | |||||
| 81 | ||||||||
We believe our properties are well maintained, in good condition, adequate and suitable for our purpose and fully utilized. Properties for sale applicable to our previously discontinued real estate activities are described above in “—Realunder “Real Estate Operations.”
Legal Proceedings
Mergentime – Perini Joint Ventures vs. WMATA Matter
On May 11, 1990, contracts with two joint ventures in which Perini held a 40% interest were terminated by the Washington Metropolitan Area Transit Authority, or WMATA, on two subway construction projects in the District of Columbia. The contracts were awarded to the joint ventures in 1985 and 1986. However, Perini and Mergentime Corporation, or Mergentime, the 60% managing partner, entered into an agreement in 1987 under which Perini withdrew from the joint ventures and Mergentime assumed complete control over the performance of both projects. This agreement did not relieve Perini of its responsibilities to WMATA as a joint venture partner. After Perini withdrew from the joint ventures, Mergentime and WMATA had a dispute regarding progress on the projects. After both construction contracts were terminated, WMATA retained Perini, acting independently, to complete both projects.
Subsequently, the joint ventures brought an action in the United States District Court for the District of Columbia against WMATA, seeking damages for delays, unpaid extra work and wrongful termination and WMATA brought an action against the joint ventures seeking damages for additional costs to complete the projects. After a bench trial, the District Court found the joint ventures liable to WMATA for damages in the amount of approximately $16.5 million and WMATA liable to the joint ventures for damages in the amount of approximately $4.3 million.
The joint ventures appealed the judgment to the United States Court of Appeals for the District of Columbia, and on February 16, 1999, the Court of Appeals vacated the District Court’s final judgment and ordered the District Court to review its prior findings and hold further hearings in regard to the joint venture’s affirmative claims. In addition, the Court of Appeals held that statutory interest on any of the claims will not accrue until final judgment is entered sometime in the future.
On February 28, 2001, a successor District Court Judge informed the parties that he could not certify adequate familiarity with the record to complete the remaining proceedings; therefore, he granted the joint ventures’ motion for a new trial. The joint ventures are seeking $28.9 million, plus interest, from WMATA, and WMATA is seeking $29.3 million from the joint ventures. A new trial was completed in January 2002 and a decision is still pending. The ultimate financial impact of the Judge’s pending decision is not yet determinable; therefore, no provision for loss, if any, has been recorded in the financial statements.
Tutor-Saliba-Perini Joint Venture vs. Los Angeles MTA Matter
During 1995, a joint venture, Tutor-Saliba-Perini, or TSP, in which Perini is the 40% minority partner and Tutor-Saliba Corporation of Sylmar, California is the 60% managing partner, filed a complaint in the Superior Court of the State of California for the County of Los Angeles against the Los Angeles County Metropolitan Transportation Authority, or the MTA, seeking to recover costs for extra work required by the MTA in connection with the construction of certain tunnel and station projects. In February 1999 the MTA countered with civil claims under the California False Claims Act against TSP, Tutor-Saliba and Perini jointly and severally. Ronald N. Tutor, the Chairman and Chief Executive Officer of Perini since March 2000, is also the chief executive officer and the sole stockholder of Tutor-Saliba Corporation.
Claims concerning the construction of the MTA projects were tried before a jury in 2001. During trial, the Judge ruled that TSP had failed to comply with the Court’s prior discovery orders and the Judge penalized TSP, Tutor-Saliba and Perini for the alleged non-compliance by dismissing TSP’s claims and by ruling, without a jury finding, that TSP, Tutor-Saliba and Perini were liable to the MTA for damages on the MTA’s counterclaims. The Judge then instructed the jury that TSP, Tutor-Saliba and Perini were liable to the MTA and charged the jury with the responsibility of determining the amount of the damages based on the Judge’s ruling. The jury awarded the MTA approximately $29.6 million in damages.
On March 26, 2002, the Judge amended the award, ordering TSP to pay the MTA an additional $33.4 million in costs and attorney fees, with the aggregate $63.0 million award subject to interest at an annual rate of 10% from the date of the award.
TSP and the other plaintiffs/defendants in the counterclaim have appealed the Judge’s discovery sanction, the subsequent jury award and the amended award. Oral arguments on the appeal are anticipated to be set some time in Summer 2004. The ultimate financial impact of the Judge’s ruling and/or the awards is not yet determinable. Therefore, no provision for loss, if any, has been recorded in the financial statements.
City of San Francisco vs. Tutor-Saliba, Perini & Buckley Joint Venture Matter
In November 2002, the San Francisco City Attorney, on behalf of the City and County of San Francisco and the citizens of California, filed a civil action with a demand for a jury trial against Perini, Tutor-Saliba Corporation, or TSC, the Tutor-Saliba, Perini & Buckley Joint Venture, Buckley & Company, Inc. and their bonding companies in the United States District Court in San Francisco relating to seven projects for work on the expansion of the San Francisco International Airport. A second amended complaint was filed in July 2003 which, among other things, added Ronald N. Tutor as a defendant. The joint venture was established by TSC, Perini and Buckley through two joint venture agreements dated October 28, 1996 and February 11, 1997. The joint venture had agreements with the Owner to perform work (“Contracts”) on only two of the above projects (“Projects”) and, as part of those Contracts, the joint venture provided performance and payment bonds to the Owner (“Bonds”).
In the second amended complaint, the plaintiffs allege, among other things, various overcharges, bidding violations, violations of minority contracting regulations, civil fraud and violation of the California and San Francisco False Claims and California Unfair Competition Acts. In addition, the plaintiffs allege that the defendants have violated the United States Racketeer Influenced Corrupt Organizations Act. The plaintiffs have asserted $30 million in damages and are seeking treble damages, punitive and exemplary damages, various civil penalties and a declaration that TSC and the joint venture are irresponsible bidders. It is unclear based on the plaintiff’s current complaint what portion of the plaintiff’s claims relate to the two projects that the joint venture participated in.
On October 3, 2003, the Court granted the defendants’ motion to specify damages allegedly sustained for each contract. The defendants’ motion to dismiss the plaintiff’s second amended complaint is pending.
TSC is the managing partner of the joint venture and, in December 1997, Perini sold its entire 20% interest in the joint venture to TSC. As part of that sale agreement, TSC agreed to indemnify Perini from any liability that Perini is required to pay by reason of or arising out of any event or occurrence subsequent to the date of the sale of Perini’s interest in the joint venture in any way connected with the joint venture agreements, the Contracts, the Projects and the Bonds. It is unclear based on the plaintiff’s current complaint whether the claims against the joint venture arise out of events that occurred subsequent to the date of the sale of Perini’s interest. The ultimate financial impact of this action is not yet determinable.
Perini/Kiewit/Cashman Joint Venture – Central Artery/Tunnel Project Matter
Perini/Kiewit/Cashman Joint Venture, or PKC, a joint venture in which Perini holds a 56% interest and is the managing partner, is currently pursuing a series of claims for additional contract time and/or compensation against the Massachusetts Highway Department, or MHD, for work performed by PKC on a portion of the Central Artery/Tunnel project in Boston, Massachusetts. During construction, MHD ordered PKC to perform changes to the work and issued related direct cost changes with an estimated value, excluding time delay and inefficiency costs, in excess of $100 million. In addition, PKC encountered a number of unforeseen conditions during construction that greatly increased PKC’s cost of performance.
Certain of PKC’s claims have been presented to a Disputes Review Board, or the DRB, which consists of three construction experts chosen by the parties. To date, the DRB has ruled on a binding basis that PKC is entitled to additional compensation for its contract time delay claim in the amount of $17.4 million. On March 20, 2002, the Superior Court of the Commonwealth of Massachusetts approved PKC’s request to have MHD comply with the DRB’s $17.4 million award. The MHD has appealed the Superior Court decision to the Appeals Court of the Commonwealth of Massachusetts.
The DRB has also ruled on a binding basis that PKC is entitled to additional compensation awards totaling $17.1 million for impacts and inefficiencies caused by MHD to certain of PKC’s work. PKC has filed applications in these actions seeking to confirm the awards and MHD has filed civil actions in Massachusetts Superior Court seeking to vacate these awards.
Under the Dispute Resolution Rules of the contract, either party may periodically terminate the services of some or all of the DRB members provided that members who are removed under this provision will remain on the DRB through the completion of any then pending claims. The MHD has chosen to remove the current DRB members under this provision and those members are in the process of completing hearings on all pending claims. Although the replacement DRB members have been agreed upon, proceedings before the current DRB and the new DRB have been postponed pending completion of the negotiation and mediation discussed below.
The pending claims yet to be decided by the current DRB on a binding basis have an anticipated value of $49.4 million. The remaining claims to be decided by the replacement DRB on a non-binding basis have an anticipated value of $72.6 million.
On August 14, 2002 the Massachusetts Attorney General’s office, pursuant to its authority under the Massachusetts False Claims Act, served a Civil Investigative Demand (“CID”) on Perini and the other joint venture partners. The CID sought the production of certain construction claims documentation in connection with the Central Artery/Tunnel Contract No. C11A1. PKC vigorously denies that it submitted any false claims and is cooperating with the Attorney General’s Office in the ongoing investigation.
In December 2002, PKC and MHD entered into an agreement to attempt to resolve by negotiation and mediation all of the outstanding claims on the project. As part of the agreement, the MHD recommended for approval by the Massachusetts Turnpike Authority a contract modification that provides for provisional payments to PKC totaling $25 million against PKC’s outstanding claims. To date, PKC has received $23.75 million of those provisional payments. The parties also agreed to stay the pending litigation and DRB proceedings during the negotiations. Perini began mediation on all claims in September 2003. The ultimate financial impact of resolving allManagement has made an estimate of the claimstotal anticipated cost recovery on this project and it is not yet determinable.included in revenue recorded to date. To the extent new facts become known or the final cost recovery included in the claim settlement varies from this estimate, the impact of the change will be reflected in the financial statements at that time.
Redondo/Perini Joint Venture vs. Siemens Transportation Matter
This is a binding arbitration proceeding arising out of a contract between the Redondo/Perini Joint Venture, or RPJV, a joint venture in which Perini and Redondo Construction Corp., or Redondo, each have a 50% interest and the Siemens Transportation Partnership, S.E., Puerto Rico, or STP. STP is constructing a public metropolitan passenger rail transportation project for the Commonwealth of Puerto Rico and RPJV is responsible for the design and construction of a portion of the project.
On March 19, 2002, Redondo filed a petition for reorganization under 11 U.S.C. Chapter 11 in U.S. Bankruptcy Court for the District of Puerto Rico.
On December 23, 2002, RPJV filed an arbitration demand against STP seeking the recovery of approximately $38 million of additional costs related to design changes and the late completion of the design. On January 31, 2003, STP filed a counter-demand against RPJV seeking the recovery of damages allegedly related to defects in design and construction and the late completion of RPJV’s work in the amount of approximately $17.9 million along with the repayment of approximately $22.6 million for alleged advances previously paid to RPJV.
On October 31, 2003, the parties each revised their statement of damages. RPJV’s total claim is now approximately $71 million. STP’s revised claim is approximately $69.5 million, including its claim for alleged advances already paid.
Discovery has begun, an arbitration panel has been chosen and arbitration evidentiary hearings are scheduled to begin on February 23,March 22, 2004. The ultimate financial impact of resolving allManagement has made an estimate of the claimstotal cost recovery on this project and it is not yet determinable.included in revenue recorded to date. To the extent new facts become known or the final cost recovery included in the claim settlement varies from this estimate, the impact of the change will be reflected in the financial statements at that time.
$21.25 Preferred Shareholders Class Action Lawsuit
On October 15, 2002, Frederick Doppelt, Arthur I. Caplan and Leland D. Zulch filed a lawsuit individually, and as representatives of a class of holders of our Depositary Shares against certain current and former directors of Perini. This lawsuit is captioned Doppelt, et al. v. Tutor, et al., United States District Court for the District of Massachusetts, No. 02CV12010MLW. Mr. Doppelt is a current director of Perini and Mr. Caplan is a former director of Perini.
Specifically, the original complaint alleged that the defendants breached their fiduciary duties owed to the holders of the Depositary Shares and to Perini. The plaintiffs principally allege that the defendants improperly authorized the exchange of Series B Preferred Stock for common stock while simultaneously refusing to pay accrued dividends due on the Depositary Shares.
On January 6, 2003, the defendants moved to dismiss the lawsuit. Among other things, the defendants argued that: (1) they did not owe fiduciary duties to the holders of the Depositary Shares and (2) the claims of breach of fiduciary duty owed to Perini must be dismissed because the claim could only be brought as a derivative action.
On March 21, 2003, the plaintiffs filed an opposition to the motion to dismiss and in May 2003 the plaintiffs asked the Court for leave to file an amended complaint.
In June 2003 the plaintiffs were given leave to file an amended complaint. The amended complaint filed in July 2003 adds an allegation that the defendants have further breached their fiduciary duties by authorizing a tender offer for the purchase of up to 90% of the Depositary Shares and an allegation that the collective actions of the defendants constitute unfair and deceptive business practices under the provisions of the Massachusetts Consumer Protection Act. The amended complaint withdrew the allegation of a breach of fiduciary duty owed to Perini, but retained the allegation with respect to a breach of those duties owed to the holders of the Depositary Shares. The plaintiffs seek damages in an amount not less than $15,937,500, trebled, plus interest, costs, fees and other unspecified punitive and exemplary damages.
On August 29, 2003, the defendants filed a motion to dismiss the amended complaint. The plaintiffs filed an opposition thereto and on October 14, 2003, the defendants filed their reply.
In 2001, a similar lawsuit was filed by some of the same plaintiffs in the United States District Court for the Southern District of New York, which claimed that we breached our contract with the holders of Depositary Shares. In 2002, the case was dismissed and upon appeal by the plaintiffs to the United States Court of Appeals for the Second Circuit, the Court of Appeals affirmed the dismissal.
The following table shows information about our executive officers and directors as of March 1, 2004:
Name | Age | Position | ||
Ronald N. Tutor | 62 | Chairman, Chief Executive Officer and Director (Class II) | ||
Robert Band | 56 | President, Chief Operating Officer and Director (Class I) | ||
Michael E. Ciskey | 53 | Vice President, Chief Financial Officer | ||
Zohrab B. Marashlian | 59 | President, Perini Civil Construction, a division of Perini | ||
Craig W. Shaw | 49 | President, Perini Building Company, Inc., a wholly owned subsidiary of Perini | ||
Peter Arkley | 49 | Director (Class III) | ||
James A. Cummings | 58 | Director (Class III) | ||
Frederick Doppelt | Director | |||
Asher B. Edelman | 63 | Director | ||
Robert A. Kennedy | 67 | Director (Class II) | ||
Michael R. Klein | 61 | Director (Class I) | ||
Raymond R. Oneglia | 55 | Director (Class III) |
Ronald N. Tutor has served as our Chief Executive Officer since March 2000 and as one of our directors since January 1997. He has also served as our Chairman since July 1999. He previously served as our Vice Chairman from January 1998 to July 1999, and Chief Operating Officer from January 1997 until March 2000 when he became Chief Executive Officer. Mr. Tutor also serves as chairman, president and chief executive officer of Tutor-Saliba Corporation, a California corporation engaged in the construction industry.
Robert Band has served as a director since May 1999. He has also served as Chief Operating Officer since March 2000 and as President since May 1999. He previously served as Chief Executive Officer from May 1999 until March 2000, Executive Vice President and Chief Financial Officer from December 1997 until May 1999 and President of Perini Management Services, Inc. since January 1996.
Michael E. Ciskeyhas served as Chief Financial Officer since November 2003 and as Vice President since May 1984. He previously served as Corporate Controller from April 1999 until November 2003, Operations Controller from May 1998 until April 1999 and as Division Controller for various Perini civil construction business units from 1984 until 1998.
Zohrab B. Marashlian has served as President of Perini Civil Construction, a division of Perini that is responsible for Perini’s civil construction operations, since December 1997. From April 1995 until December 1997, he served as President of Perini’s Metropolitan New York Division.
Craig W. Shaw has served as President of Perini Building Company, a wholly owned subsidiary of Perini that is responsible for Perini’s building construction operations, since October 1999. From April 1995 until October 1999, he served as President of Perini Building Company, Western U.S. Division.
Peter Arkley has served as a director since May 2000. He has served as Western Regional Managing Director of AON Risk Services, Inc., an insurance and bonding brokerage firm, since January 1996.
James A. Cummings has served as a director since March 2003. He has served as Chairman and Chief Executive Officer of James A. Cummings, Inc. since 2001. He previously served as President of Cummings from 1981 until 2003.
Frederick Doppelt has served as a director since May 1998. He has been a self-employed attorney specializing in trust and estate matters since 1983.
Asher B. Edelman has served as a director since May 2001. Mr. Edelman has served as general partner of Asco Partners, a general partner of Edelman Securities Company L.P. (formerly Arbitrage Securities Company) since June 1984 and is a General Partner and Manager of various investment partnerships and funds. Mr. Edelman also serves as chairman of the board of directors of Canal Capital Corporation, a company engaged in the management and development of agri-business related real estate properties and chairman of the board of directors of Cattle Sale Company, formerly Dynacore Holdings Corp., a provider of auction trading services to beef and dairy producers.On May 3, 2000, while Mr. Edelman was chairman of the board of directors, Dynacore Holdings Corporation filed for bankruptcy pursuant to Chapter 11 of the United States Bankruptcy Code. Dynacore Holdings Corp. emerged from bankruptcy in December 2000. In addition, Mr. Edelman was a member of a member-managed limited liability company that was a general partner in each of the following two partnerships that declared bankruptcy pursuant to Chapter 11 of the United States Bankruptcy Code: Papier I Partners, L.P. and Papier II Partners, L.P.
Robert A. Kennedy has served as a director since March 2000. From 1994 to 2003, Mr. Kennedy served in various capacities for The Union Labor Life Insurance Company, a provider of insurance and certain financial services to its union members and related trust funds, including as Vice President of Special Projects from 2001 to 2003. Mr. Kennedy currently serves as a consultant to The Union Labor Life Insurance Company.
Michael R. Klein has served as a director since January 1997 and as Vice Chairman of our Board since September 2000. Mr. Klein has been a partner of the law firm of Wilmer, Cutler & Pickering since 1974. Mr. Klein also serves as Chairman of the boardBoard of directorsDirectors of CoStar Group, Inc., a provider of commercial real estate information, and as a director of SRA International, Inc., a provider of technology services and solutions to the United States federal government organizations.
Raymond R. Oneglia has served as a director since March 2000. He has also served as vice chairman of the board of directors of O&G Industries, Inc., a Connecticut corporation engaged in the construction industry, since 1997 and has served in various operating and administrative capacities since 1970.
Information Regarding our Board of Directors
Our affairs are managed under the direction of our Board of Directors. Our Directors serve until their successors are duly elected and qualified or until their earlier resignation, removal or disqualification. There are no family relationships between our directors and executive officers. For certain relationships between Perini and our directors see “Certain Transactions.” The Board of Directors met fourseven times during 2002.2003. Our Board of Directors is divided into three approximately equal classes, each of whose members will serve for a staggered three-year term. Our Board of Directors consists of Mr. Band and Mr. Klein as Class I directors, whose term of office will continue until the 2006 annual meeting of stockholders, Mr. Kennedy and Mr. Tutor as Class II directors, whose term of office will continue until the 2004 annual meeting of stockholders, and Mr. Arkley, Mr. Cummings and Mr. Oneglia as Class III directors, whose term of office will continue until the 2005 annual meeting of stockholders.
The holders of the $21.25 Preferred Stock have the right to elect, voting as a separate class, two directors in the event that dividends on the $21.25 Preferred Stock are in arrears for at least six quarters. We have not paid any dividends on the $21.25 Preferred Stock since 1995. Mr. Edelman and Mr. Doppelt have been elected by the holders of the $21.25 Preferred Stock to serve as directors of Perini, and their terms will continue until the 2004 annual meeting of stockholders.
During 20022003 all of our Directors attended at least 75% of the meetings of our Board of Directors and committees of which they are members, except for James A. Cummings, who attended approximately 71% of such meetings, and Peter Arkley who attended approximately 38%50% of such meetings.
Committees of Our Board of Directors
Audit Committee
Our Board of Directors has an Audit Committee, which consists of Raymond R. Oneglia, Michael R. Klein and Robert A. Kennedy. We believe that eachEach of the members of the Audit Committee is independentmeets the independence and experience requirements under the rules of the American Stock Exchange. The Audit Committee met nineeight times during 20022003 and is required to have at least four regular meetings each year. The primary duties and responsibilities of the Audit Committee are to oversee that management:
Compensation Committee
Our Board of Directors has a Compensation Committee, which consists of Raymond R. Oneglia, Michael R. Klein and Peter Arkley. The duties of the Compensation Committee are summarized in “The Compensation Committee Report” on pages 5256 through 5458 herein. The Compensation Committee met fourfive times during 20022003 and is required to have at least twothree regular meetings each year.
Nominating Committee
Our Board of Directors has a Nominating Committee, which consists of Raymond R. Oneglia and Michael R. Klein and Ronald N. Tutor.Klein. The duties of the Nominating Committee include identifying individuals qualified to become directors and recommending to the Board the persons to be nominated for election as directors at the annual meeting of stockholders.
Directors’ Compensation
During 2002,2003, fees for our outside directors consisted of an annual retainer fee of $25,000, plus $900 per Board meeting attended, as well as $900 per Committee meeting attended by members of the Audit, Compensation and Nominating Committees. Mr. Ronald N. Tutor, our Chairman since July 1, 1999 and our Chairman and Chief Executive Officer since March 29, 2000, has opted to receive no director fees since he is party to a Management Agreement described in “Certain Transactions” below.
On September 10, 2003, the directors’ fees were reviewed and the following changes made: The Chair of the Audit Committee will receive an additional annual retainer fee of $10,000 and each member will receive a per meeting fee of $2,000 for meetings attended in person and $500 for meetings attended telephonically. In addition, the per meeting fee of $900 for attendance at meetings of the Board of Directors, Compensation and Nominating Committees was reduced to $300 for members that attend telephonically. The new fee schedule was instituted in the fourth quarter of 2003.
Director and Officer Indemnification
Our charter provides that no director shall be personally liable to us or to our stockholders for monetary damages for breach of fiduciary duty as a director, except for liability for any breach of the director’s duty of loyalty to us or our stockholders, for acts or omissions not in good faith, for acts or omissions involving intentional misconduct or a knowing violation of law or for any transaction from which the director derived an improper personal benefit. Our bylaws provide that our directors and officers will be indemnified against liabilities that arise from their service as directors and officers, subject to certain exceptions. We have entered into agreements with our directors and officers that also provide for such indemnification and expenses and liability reimbursement. We have obtained insurance which insures our directors and officers against certain losses and which insures us against our obligations to indemnify our directors and officers.
Tutor-Saliba Management Agreement
In January 1997 we entered into a management agreement with Tutor-Saliba and Ronald N. Tutor, chief executive officer and sole stockholder of Tutor-Saliba, pursuant to which Mr. Tutor provides us with certain management services. This agreement is described under “Certain Transactions—Tutor-Saliba Management Agreement.”
Employment Agreement with James A. Cummings
Mr. Cummings, a director of Perini, serves as chief executive officer of Cummings pursuant to an employment agreement dated January 21, 2003. The employment agreement has a five-year term, subject to termination by notice. The employment agreement provides for an initial base salary of $250,000 through May 31, 2004 with the opportunity to earn an annual bonus of 100% of base salary if certain performance goals are met by Cummings. Under the employment agreement, Mr. Cummings is entitled to participate in any compensation, benefit and insurance programs maintained by us in which our senior executives are eligible to participate and certain other benefits, including reimbursement for automobile leases, general contracting license fees and any continuing education fees to maintain such license and certain reimbursements for country club dues.
If Mr. Cummings’ employment is terminated by Cummings without cause or Mr. Cummings terminates his employment with Cummings for cause (as such term is defined in the employment agreement), then Mr. Cummings is entitled to receive his base salary until the earlier of (i) one year from the date of termination or (ii) the expiration of the employment agreement, subject to certain limitations, a pro rata portion of his annual bonus and approximately $727,000 as payment for amounts otherwise due to Mr. Cummings in January 2008 under the purchase agreement pursuant to which we acquired Cummings. The agreement contains confidentiality and noncompetition provisions applicable to Mr. Cummings that are customary for an agreement of this type.
Compensation Committee Interlocks and Insider Participation
None of our executive officers serves as a member of the board of directors or compensation committee, or other committee serving an equivalent function, of any other entity that has one or more of its executive officers serving as a member of our Board of Directors or Compensation Committee. None of the current members of our Compensation Committee has ever been an employee of Perini.
Executive Officers
Each officer serves at the discretion of our Board of Directors and holds office until his or her successor is elected and qualified or until his or her earlier resignation or removal.
The Compensation Committee Report
During 2002,2003, the Compensation Committee of ourthe Board of Directors of the Company consisted of three Directors, none of whom is an employee or an officer of Perini.the Company. The principal powers and duties of the Compensation Committee as established by the Board of Directors are:
| 1. | To review the Executive Compensation programs and policies and to employ outside expert assistance, if required, to analyze |
| 2. | To recommend to the Board of Directors for its approval the base compensation of |
| 3. | To recommend to the Board of Directors annual profit and other targets for |
| 4. | To administer the Incentive Compensation Plan; such administration includes power to (i) approve |
Compensation Policy
The Compensation Committee strives to maintain corporate base salaries and the total compensation package appropriate to attract and retain highly qualified executives. This results in base salaries that generally are at the median range of those of other construction companies but allows executives to substantially exceed the median compensation levels when incentive compensation is earned. While recognizing that it may be difficult to find other companies with the same mix of business as Perini,the Company, the Committee, nevertheless, believes that a comparison with other construction companies is appropriate.
The compensation program for executive officers is composed of three elements: base salaries, annual incentive bonuses and long-term incentive stock awards. These elements of compensation are designed to provide incentives to achieve both short-term and long-term objectives and to reward exceptional performance. Salaries and annual incentive compensation bonuses result in payment for performance and are tied to the achievement of profit and/or cash flow targets. The value ofif the incentive stock awards depends upon the appreciation in market value of our common stock.
Executive Salary Increases in 20022003
Although certain members of top management designated as Named Executive Officers in the “Summary Compensation Table” on page 55 did not receive salary increases in 2001,2003, they did receive salary increases at the beginning of 2002 that ranged from 15% to 32%. Other senior officers received salary increases in March 2002 that ranged from approximately 3 1/2% to 5 1/2%.
Section 162 (m) of the Internal Revenue Code, enacted in 1993, generally disallows a tax deduction to public companies for compensation over $1,000,000 paid to ourthe Company’s Chief Executive Officer and four other most highly compensated executive officers. The Compensation Committee has not established any policy regarding annual compensation to such executive officers in excess of $1,000,000. However, to date, noneno officer of our officersthe Company has received compensation in excess of $1,000,000 for any annual period.
Compensation of the Chairman and Chief Executive Officer
Our Chairman and Chief Executive Officer, Ronald N. Tutor, is generally compensated for his services under a management services contract between Perini and Tutor-Saliba Corporation, a company in which Mr. Tutor is the chief executive officerChief Executive Officer and sole stockholder, at an annual rate of $250,000, which represented the same annual rate as 2001.2002. The annual rate for 2004 will be $375,000, which was approved by the Committee and the Board. In addition, Mr. Tutor was awarded $231,000$500,000 in incentive compensation for 2002.2003.
The Perini Incentive Compensation Plan of the Company
The Incentive Compensation Plan is an integral part of the total compensation package of the Chairman and Chief Executive Officer, as well as the six5 executives whose salaries were reviewed by the Compensation Committee in 20022003 and approximately 5565 other employees.employees of the Company. Eligibility and designated levels of
participation are determined by the Chairman and Chief Executive Officer subject to Compensation Committee approval. Eligibility to participate under the Incentive Compensation Plan is limited to individuals who are executives, managers and key employees of Perinithe Company and ourits wholly owned subsidiaries, whose duties and responsibilities provide them the opportunity to (i) make a material and significant impact to ourthe financial performance;performance of the Company; (ii) have major responsibility in the control of the corporate assets; and (iii) provide critical staff support necessary to enhance operating profitability.
Under the terms of the Incentive Compensation Plan, participants can achieve incentive compensation awards ranging from zero to as much as 100% of base salary, which depends on the achievement of certain corporate goals, as defined. In addition, the Committee has the authority, when appropriate, to make certain discretionary incentive compensation awards. The mechanisms of the Incentive Compensation Plan are expressed in terms of levels of participation, points deriving therefrom calculated on base salary, and achievement of our net income target for the year.
No sums attributed to a participant in the Incentive Compensation Plan become vested until the Compensation Committee approves the payment, usually in March following the year earned. At the discretion of the Committee, payment can be made in cash, stock or a combination of cash and stock.
In 2003,2004, the Committee authorized the payment of $3,912,000$4,795,000 of incentive compensation payments for 20022003 operations, to 6270 participants. Payment of incentive compensation awards for 20022003 performance werewill be paid 100% in cash.
COMPENSATION COMMITTEE
Raymond R. Oneglia, Chair Peter Arkley Michael R. Klein |
|
|
|
Executive Compensation and Other Information
Summary of Cash and Certain Other Compensation
The following table sets forth the cash compensation paid by us and our subsidiaries, as well as certain other compensation paid or accrued for those years, to our Chief Executive Officer and each of our three other most highly compensated Executive Officers whose salary and bonus exceeded $100,000 (the “Named Executive Officers”) for the years ended December 31, 2003, 2002 2001 and 2000,2001, or for each year in which a Named Executive Officer served as such.
Summary Compensation Table
|
| ||||||||||||||||||
|
| ||||||||||||||||||
| |||||||||||||||||||
| |||||||||||||||||||
| |||||||||||||||||||
| |||||||||||||||||||
Name and Principal Position | Long-Term Compensation | All Other Compensation (3) | ||||||||||||||||||
| Awards | Payouts | |||||||||||||||||||
| Annual Compensation | Number of Securities Underlying Options Granted | Long-Term Performance Units – Payout | ||||||||||||||||||
| Year | Salary | Bonus | Other (1) | |||||||||||||||||
Ronald N. Tutor | 2003 2002 2001 | $ | — — — | $ | 500,000 231,000 250,000 | $ | 250,000 250,000 250,000 | (2) (2) (2) | — — — | $ | — — — | $ | — — — | |||||||
Robert Band | 2003 2002 2001 | | 375,000 375,000 285,000 | | 525,000 346,000 385,000 | | — — — | | — — — | | — — — | | 3,000 2,800 200 | |||||||
Zohrab B. Marashlian | 2003 2002 2001 | | 375,000 375,000 325,000 | | 150,000 325,000 425,000 | | — — — | | — — — | | — — — | | 3,000 2,800 200 | |||||||
Craig W. Shaw | 2003 2002 2001 | | 375,000 375,000 325,000 | | 375,000 348,000 425,000 | | — — — | | — — — | | — — — | | 3,000 2,800 200 | |||||||
Michael E. Ciskey | 2003 | 198,000 | 149,000 | — | — | — | 3,000 | |||||||||||||
| (1) | “Other” annual compensation does not include a dollar amount which we are unable to quantify, but which is estimated at not more than the lesser of $50,000 or 10% of the salary and bonus reported for each Named Executive Officer, resulting from executive perquisites which may be of personal benefit to such individuals. |
| (2) | Represents a management services fee paid to Tutor-Saliba Corporation of which Mr. Tutor is the chief executive officer and sole stockholder. See “Certain Transactions—Tutor-Saliba Management Agreement.” |
| (3) | “All Other Compensation” primarily represents estimated annual Perini 401(k) retirement contributions for each of the Named Executive Officers, except for Mr. Tutor. |
Equity Compensation Plans
The following table sets forth certain summary information with respect to stock options granted and available for future grants under equity compensation plans approved and not approved by our stockholders as of December 31, 2002:2003:
Equity Compensation Plan Information
Plan category | Shares of Common Stock to be issued upon exercise of outstanding options | Weighted-average exercise price of outstanding options | Shares of Common Stock remaining available for future issuance under equity compensation plans (excluding shares of Common Stock reflected in column (a)) | Shares of Common Stock to be issued upon exercise of outstanding options | Weighted-average exercise price of outstanding options | Shares of Common Stock remaining available for future issuance under equity compensation plans (excluding shares of Common Stock reflected in column (a)) | ||||||||
| (a) | (b) | (c) | (a) | (b) | (c) | |||||||||
Equity Compensation Plans: Approved by Stockholders - Special Equity Incentive Plan* | 2,733,034 | $ | 4.50 | 187,300 | 2,503,300 | $ | 4.49 | 195,634 | ||||||
1982 Stock Option Plan* | 67,500 | 5.29 | – | 67,500 | 5.29 | – | ||||||||
Not approved by Stockholders - | ||||||||||||||
Options Granted to Certain Directors and Executive Officers* | 435,000 | 7.92 | – | 435,000 | 7.92 | – | ||||||||
Total | 3,235,534 | $ | 4.98 | 187,300 | 3,005,800 | $ | 5.00 | 195,634 | ||||||
| * | For detailed information concerning our equity compensation plans, see Note 9 entitled “Stock Options” of Notes to Consolidated Financial Statements. |
Special Equity Incentive Plan - On May 25, 2000, our stockholders approved our Special Equity Incentive Plan. The aggregate number of shares of common stock that may be subject to outstanding options under the plan is 3,000,000 shares. As of September 30,December 31, 2003, options to purchase a total of 2,812,700 shares of common stock have been granted, options to purchase 258,066309,400 shares of common stock have been exercised and 195,634 shares remain available for future grants under this plan.
Under the plan we are authorized to grant non-qualified stock options to our key executives, employees and directors. Options granted under the plan may not be granted at less than 100% of the fair market value of a share of common stock as of the date of grant and must be exercised within ten years of the date of grant.
The plan is administered by the Compensation Committee or other committee designated by the Board of Directors (the “Plan Administrator”). Subject to the provisions of the plan, the Plan Administrator has the authority to select the persons to whom options are granted and determine the terms of each option, including the number of options to be granted and the vesting schedule of each option. Unless otherwise permitted by us, options are not assignable or transferable except by will or the laws of descent and distribution.
The Plan Administrator may, in its sole discretion, amend, modify, or terminate any option granted or made under the plan, so long as such amendment, modification or termination would not materially and adversely affect the participant. The Plan Administrator may also, in its sole discretion, accelerate or extend the date or dates on which all or any particular option or options granted under the plan may be exercised.
1982 Stock Option Plan - During 2002, the provisions of the 1982 Stock Option Plan expired. Therefore, the only shares of our authorized, but unissued, common stock still reserved under this plan are the 67,500 shares applicable to the remaining outstanding options.
Option Exercises and Holdings
The following table sets forth information with respect to our Named Executive Officers concerning the exercise of options during the year ended December 31, 20022003 and unexercised options held as of December 31, 2002:2003:
Aggregated Option Exercises in the Last Fiscal Year
and Fiscal Year-End Option Values
Name | Number of Securities Underlying Shares Acquired on Exercise | Value Realized | Number of Unexercised Options at December 31, 2002 | Value of Unexercised In-the-Money Options at December 31, 2002 | Number of Securities Underlying Shares Acquired on Exercise | Value Realized | Number of Unexercised Options at December 31, 2003 | Value of Unexercised In-the-Money Options at December 31, 2003 | ||||||||||||||||||||||
| Exercisable | Unexercisable | Exercisable | Unexercisable | Exercisable | Unexercisable | Exercisable | Unexercisable | |||||||||||||||||||||||
Ronald N. Tutor | – | $ | – | 1,225,000 | – | $ | – | $ | – | – | $ | – | 1,225,000 | – | $ | 5,060,800 | $ | – | ||||||||||||
Robert Band | – | – | 237,500 | – | – | – | – | – | 237,500 | – | 990,500 | – | ||||||||||||||||||
Zohrab B. Marashlian | – | – | 475,000 | – | – | – | 30,400 | 118,180 | 444,600 | – | 1,839,600 | – | ||||||||||||||||||
Craig W. Shaw | – | – | 475,000 | – | – | – | 30,000 | 110,176 | 445,000 | – | 1,841,400 | – | ||||||||||||||||||
Michael E. Ciskey | – | – | 30,000 | – | 139,500 | – | ||||||||||||||||||||||||
There were no stock options or Stock Appreciation Rights granted to any of the Named Executive Officers during the year ended December 31, 2002.2003.
Incentive Compensation Plans
We have an incentive compensation plan for certain employees at the corporate level (The Perini Corporation Amended and Restated (2004) General Incentive Compensation Plan), or corporate plan, and an incentive compensation plan for certain employees at the business unit level (The Perini Corporation Amended and Restated (2004) Construction Business Unit Incentive Compensation Plan), or business unit plan. Under these plans, eligibility and designated levels of participation are determined by our Chief Executive Officer subject to Compensation Committee approval. Eligibility to participate under the corporate plan is limited to individuals who are executives, managers and key employees at the corporate level and eligibility to participate under the business unit plan is limited to individuals who are managers and key employees at our construction business unit level.
Under the terms of the plans, participants can receive incentive compensation awards ranging from zero to as much as 100% of base salary. Awards are based on established corporate goals, levels of achievement of these goals and the base salaries and individual bonus limits assigned to the participants. In addition, the actual incentive compensation amounts available to participants at a business unit are based on the level of achievement of the corporate goal applied to the profit generated by that business unit. No amounts attributed to a participant in the plans become vested until the Compensation Committee approves the payment, usually in March following the year earned. At the discretion of the Compensation Committee, payment can be made in cash, stock or a combination of cash and stock. Incentive compensation for the Named Executive Officers is included in the Summary Compensation Table under the “Bonus” column.
401(k) Plan
We have a tax-qualified Section 401(k) Retirement Plan covering all of our executive, professional, administrative and clerical employees who are over 21 years of age and who have completed three months of service with us. Under the 401(k) plan, participants may elect to defer a portion of their compensation on a pre-tax basis and have it contributed to the plan. In addition, we make employer contributions into the 401(k) plan based on a non-discretionary match of employees’ contributions, as defined, since 2002. Prior to 2002, our contribution to the 401(k) plan was based on a specified level of profits, subject to certain limitations, as well as approval by our Board of Directors of any discretionary contributions.
Pension Plan Disclosure
The following table sets forth pension benefits payable based on an employee’s remuneration (“final average earnings”) and “years of service” as defined under our non-contributory Retirement Plan for all its full-time employees, and to the extent covered remuneration is limited by the Internal Revenue Code of 1986, as amended, pension benefits payable have been augmented based on our Benefit Equalization Plan:
Pension Plan Table – Estimated Annual Pension Benefits (2) for Years of Service Indicated (3) | Pension Plan Table – Estimated Annual Pension Benefits (2) for Years of Service Indicated (3) | |||||||||||||||||||
Remuneration (1) | 15 Years | 20 Years | 25 Years | 30 Years | 35 Years | 15 Years | 20 Years | 25 Years | 30 Years | 35 Years | ||||||||||
$ 125,000 | $ 23,688 | $ 31,583 | $ 39,479 | $ 39,479 | $ 39,479 | $ 23,179 | $ 30,905 | $ 38,631 | $ 38,631 | $ 38,631 | ||||||||||
150,000 | 29,313 | 39,083 | 48,854 | 48,854 | 48,854 | 28,804 | 38,405 | 48,006 | 48,006 | 48,006 | ||||||||||
175,000 | 34,938 | 46,583 | 58,229 | 58,229 | 58,229 | 34,429 | 45,905 | 57,381 | 57,381 | 57,381 | ||||||||||
200,000 | 40,563 | 54,083 | 67,604 | 67,604 | 67,604 | 40,054 | 53,405 | 66,756 | 66,756 | 66,756 | ||||||||||
225,000 | 46,188 | 61,583 | 76,979 | 76,979 | 76,979 | 45,679 | 60,905 | 76,131 | 76,131 | 76,131 | ||||||||||
250,000 | 51,813 | 69,083 | 86,354 | 86,354 | 86,354 | 51,304 | 68,405 | 85,506 | 85,506 | 85,506 | ||||||||||
300,000 | 63,063 | 84,083 | 105,104 | 105,104 | 105,104 | 62,554 | 83,405 | 104,256 | 104,256 | 104,256 | ||||||||||
400,000 | 85,563 | 114,083 | 142,604 | 142,604 | 142,604 | 85,054 | 113,405 | 141,756 | 141,756 | 141,756 | ||||||||||
500,000 | 108,063 | 144,083 | 180,104 | 180,104 | 180,104 | 107,554 | 143,405 | 179,256 | 179,256 | 179,256 | ||||||||||
| (1) | Remuneration covered by the plan and the Benefit Equalization Plan is limited to an employee’s annual salary and for the Named Executive Officers is limited to the amounts in the “Annual Salary” column included in the Summary Compensation Table on page 59. |
| (2) | The estimated annual benefits are calculated on a straight-line annuity basis and are not subject to any further deductions for Social Security since the Plan formula integrates the calculation of the benefits with certain adjustments for Social Security, as defined. |
| (3) | The estimated credited years of service for our Named Executive Officers are as follows: R. Band |
We believe that the transactions described below were on terms that were at least as favorable to us as we would have expected to negotiate with other unaffiliated third parties at the point in time these respective transactions were consummated.
Tutor-Saliba Management Agreement
As a condition to a new investor group’s acquisition of shares of our Series B Preferred Stock for an aggregate of $30 million, which was approved by our stockholders on January 1997, we entered into a management agreement with Tutor-Saliba, a California corporation engaged in the construction industry, and Ronald N. Tutor, chief executive officer and sole stockholder of Tutor-Saliba, to provide certain management services. The management agreement has been renewed annually by our Compensation Committee, which consists entirely of independent directors, under the same basic terms and conditions as the initial agreement except that the amount of the fee payable thereunder by us to Tutor-Saliba was increased effective January 1, 2000, from $150,000 to $250,000 per year and effective January 1, 2004, from $250,000 to $375,000 per year. Effective December 31, 2001, Mr. Tutor was included as a participant in our incentive compensation plan. Tutor-Saliba initially held 351,318 shares of our common stock before Tutor-Saliba’s additional investment in our common stock effective March 29, 2000. Since January 17, 1997, Mr. Tutor has been a member of our Board of Directors and an officer of Perini and effective July 1, 1999 was elected Chairman of our Board of Directors and effective March 29, 2000 was elected Chairman and Chief Executive Officer.
Compensation for the management services consists of payments to Tutor-Saliba under the management agreement described above, options granted to Mr. Tutor and incentive compensation awarded to Mr. Tutor as a participant in our incentive compensation plan. See “Management—Summary Compensation Table.” All of the stock options granted to Mr. Tutor were granted at or above fair market value on the date of grant, are currently exercisable and are otherwise summarized below:
Grant Date | Option Price Per Share | Number of Shares | Expiration Date | |||
01-17-97 | $8.3750 | 150,000 | 01-16-05 | |||
12-10-98 | $5.2875 | 45,000 | 12-09-06 | |||
01-04-99 | $5.1250 | 30,000 | 01-03-07 | |||
03-29-00 | $4.5000 | 1,000,000 | 03-28-10 |
Series B Preferred Stock Exchange
Effective March 29, 2000, a new investor group led by Tutor-Saliba, and including O&G Industries, Inc., or O&G, and National Union Fire Insurance Company of Pittsburgh, Pa., or National Union, a wholly owned subsidiary of American International Group, Inc., or AIG, collectively purchased 9,411,765 shares of our common stock, hereafter referred to as the “Purchase Shares,” for $40 million, or $4.25 per share, in what we refer to herein as the “Transaction.” Each of Tutor-Saliba, O&G and National Union are referred to herein individually as a “Purchaser,” and collectively as the “Purchasers.” In connection therewith, we exchanged 7,490,417 shares of common stock for all of the outstanding shares of Series B Preferred Stock at an exchange price of $5.50 per share of common stock, hereafter referred to as the “Exchange.” See “Principal and Selling Stockholders.”
Prior to the Transaction, the Board of Directors formed a Special Committee, comprised of three independent directors, to review a financing proposal from Mr. Tutor and to actively solicit and negotiate alternative proposals from third parties. The Special Committee recommended the Transaction to the Board of Directors which approved the Transaction, subject to the approval of a majority of our disinterested common stockholders. Our disinterested common stockholders approved the Transaction on March 29, 2000.
Perini and the Purchasers and former holders of the Series B Preferred Stock entered into a Shareholders’ Agreement and a Registration Rights Agreement at the closing of the Transaction. Among other things, the Shareholders’ Agreement provides for the following:
After this offering and assuming the sale of all of the shares offered hereby, ULLICO will hold less than 2.5% of our outstanding common stock and, as a result, it will no longer have the right to designate a director for election or appoint an observer on our Board of Directors.
Since the common stock issued in connection with the Transaction and the Exchange was not registered under the Securities Act of 1933, as amended, we entered into a Registration Rights Agreement with the Purchasers and former holders of the Series B Preferred Stock which requires us, under certain circumstances, to register some or all of the shares held by such parties under the Securities Act after March 29, 2003. See “Description of Capital Stock—Registration Rights Agreements.”
Joint Ventures
Tutor-Saliba Joint Ventures
Historically, we have participated in joint ventures with Tutor-Saliba both on a sponsored and a non-sponsored basis and currently participate in certain joint ventures with them, our share of which contributed $36.8$49.0 million (or 4.2%3.6%), $48.8 million (or 4.5%), and $17.9 million (or 1.1%) and $4.6 million (or 0.4%) to our consolidated revenues for the nine months ended September 30, 2003 and the years ended December 31, 2003, 2002 2001 and 2000,2001, respectively.
In late 2000, we entered into a joint venture arrangement with Tutor-Saliba, the sponsoring partner, whereby we were to primarily provide certain prequalification and proposal support services to the joint venture in return for a fixed fee of $500,000 payable subsequent to the award and start-up of the project. In addition, the agreement provided that we would not be liable for any costs, losses, liabilities or damages that may arise from the project. Payment of the fee was received from Tutor-Saliba in February 2002. In late 2001, we entered into a similar joint venture arrangement with Tutor-Saliba, the sponsoring partner, whereby we were to primarily provide certain prequalification and proposal support services to the joint venture in return for a fixed fee of $200,000 payable subsequent to the award and start-up of the project. In addition, the agreement provided that we would not be liable for any costs, losses, liabilities or damages that may arise from the project. Payment of the fee was received from Tutor-Saliba in February 2002.
In late 2002, we entered into an arrangement with Tutor-Saliba whereby Tutor-Saliba provided a financial guarantee in order for us to secure a performance and payment bond on a building project with an estimated contract value of approximately $135 million. As compensation for the financial guarantee, we paid Tutor-Saliba a fee of $1.0 million in February 2003.
As more fully discussed in “Business—Legal Proceedings,” we have been a party to certain joint ventures with Tutor-Saliba in the past which are currently in litigation.
O&G Joint Ventures
We also participated in certain joint ventures with O&G Industries, Inc., of which Raymond R. Oneglia, a director of Perini, is vice chairman of the board of directors. Our share of these joint ventures contributed $0.9$0.8 million and $0.6 million to our consolidated revenues for the nine months ended September 30, 2003 and the yearyears ended December 31, 2003 and 2001, respectively.
AIG Relationship
National Union Fire Insurance Company of Pittsburgh, Pa., a wholly owned subsidiary of AIG, is one of our sureties and a provider of insurance and insurance related services to us. Payments to AIG for surety, insurance and insurance related services approximated $6.3$7.8 million, $9.5 million and $8.2 million and $4.6 million for the nine months ended September 30, 2003 and the years ended December 31, 2003, 2002 2001 and 2000,2001, respectively. The quality and cost of insurance services rendered are reviewed on an annual basis and competitive bids are obtained when deemed appropriate.
Tender Offer for Depositary Shares
On June 9, 2003, we completed a tender offer for our Depositary Shares at a purchase price of $25.00 per Depositary Share, net to the seller without interest. See “Management’s Discussion and Analysis of Financial Condition and Results of Operations—Overview—Recent Developments.” Mr. Asher Edelman, a director of Perini, tendered or caused to be tendered 174,500 Depositary Shares that he beneficially owned or controlled.
PRINCIPAL AND SELLING STOCKHOLDERS
The following table sets forth certain information concerning beneficial ownership as of December 15,February 23, 2003 of our common stock by:
Pursuant to the Registration Rights Agreement described under “Description of Capital Stock—Registration Rights Agreements,” certain of the stockholders listed below have requested that we register for sale their previously unregistered shares. The following table sets forth the number of shares of common stock beneficially owned by all of our principal stockholders (including the selling stockholders) as of December 15, 2003,February 23, 2004, the number of shares of common stock covered by this prospectus and the percentage of total shares of common stock that the selling stockholders will beneficially own upon completion of this offering if such percentage exceeds one percent, in each case, assuming that the underwriters do not exercise the over-allotment option granted to them by the selling stockholders. This table assumes that the selling stockholders will offer for sale all of the shares of common stock covered by this prospectus.
The amounts and information set forth below are based upon information provided to us by representatives of the selling stockholders, or on our records, as of December 15, 2003February 23, 2004, and are accurate to the best of our knowledge. It is possible, however, that the selling stockholders may acquire or dispose of additional shares of common stock from time to time after the date of this prospectus. Certain affiliates of National Union Fire Insurance Company of Pittsburgh, Pa., or National Union, are registered broker-dealers. National Union purchased the securities listed below in the ordinary course of business and at the time of purchase of such securities, had no agreements or understandings, directly or indirectly, to distribute these securities.
Shares Beneficially Owned Prior to the Offering (1) | Shares Beneficially Owned After the Offering (3) | Shares Beneficially Owned Prior to the Offering (1) | Shares Beneficially Owned After the Offering (3) | |||||||||||||||||||||||||
Name and Address | Shares | % | Amount Offered (2) | Shares | % | Shares | % | Amount Offered (2) | Shares | % | ||||||||||||||||||
Beneficial Ownership of 5% or More | ||||||||||||||||||||||||||||
Tutor-Saliba Corporation 15901 Olden Street Sylmar, CA 91342 | 6,527,729 | (4),(10) | 27.07 | % | – | 6,527,729 | 27.07 | % | 6,527,729 | (4),(10) | 26.90 | % | – | 6,527,729 | 26.90 | % | ||||||||||||
Ronald N. Tutor 73 Mt. Wayte Avenue Framingham, MA 01701 | 6,527,729 | (4)(10) | 27.07 | % | – | 6,527,729 | 27.07 | % | 6,527,729 | (4)(10) | 26.90 | % | – | 6,527,729 | 26.90 | % | ||||||||||||
National Union Fire Insurance Company of Pittsburgh, Pa. 70 Pine Street New York, NY 10270 | 4,705,882 | (5),(10) | 20.56 | % | 2,046,036 | 2,659,846 | 11.62 | % | 4,705,882 | (5),(10) | 20.42 | % | 2,046,036 | 2,659,846 | 11.54 | % | ||||||||||||
O&G Industries, Inc. 112 Wall Street Torrington, CT 06790 | 2,502,941 | (6),(10) | 10.94 | % | – | 2,502,941 | 10.94 | % | 2,502,941 | (6),(10) | 10.86 | % | – | 2,502,941 | 10.86 | % | ||||||||||||
Blum Capital Partners, L.P. 909 Montgomery Street, Suite 400 San Francisco, CA 94133 | 5,485,324 | (7),(10) | 23.97 | % | 22,421 | 3,117,147 | (8) | 13.62 | % | 5,485,324 | (7),(10) | 23.80 | % | 22,421 | 3,117,147 | (8) | 13.53 | % | ||||||||||
PB Capital Partners, L.P. 909 Montgomery Street, Suite 400 San Francisco, CA 94133 | 4,244,149 | (10) | 18.55 | % | 1,183,408 | 3,060,741 | 13.37 | % | 4,244,149 | (10) | 18.42 | % | 1,183,408 | 3,060,741 | 13.28 | % | ||||||||||||
Shares Beneficially Owned Prior to the Offering (1) | Shares Beneficially Owned After the Offering (3) | Shares Beneficially Owned Prior to the Offering (1) | Shares Beneficially Owned After the Offering (3) | |||||||||||||||||||||||||
Name and Address | Shares | % | Amount Offered (2) | Shares | % | Shares | % | Amount Offered (2) | Shares | % | ||||||||||||||||||
The Common Fund for Non-Profit Organizations c/o Blum Capital Partners, L.P. 909 Montgomery Street, Suite 400 San Francisco, CA 94133 | 1,162,348 | (10) | 5.08 | % | 1,162,348 | – | – | 1,162,348 | (10) | 5.04 | % | 1,162,348 | – | – | ||||||||||||||
Richard C. Blum 909 Montgomery Street, Suite 400 San Francisco, CA 94133 | 5,485,324 | (7) | 23.97 | % | — | 3,117,147 | (8) | 13.62 | % | 5,485,324 | (7) | 23.80 | % | — | 3,117,147 | (8) | 13.53 | % | ||||||||||
Richard C. Blum & Associates, Inc. 909 Montgomery Street, Suite 400 San Francisco, CA 94133 | 5,485,324 | (7) | 23.97 | % | — | 3,117,147 | (8) | 13.62 | % | 5,485,324 | (7) | 23.80 | % | — | 3,117,147 | (8) | 13.53 | % | ||||||||||
The Union Labor Life Insurance Company, acting on behalf of 111 Massachusetts Avenue, NW Washington, DC 20001 | 1,721,075 | (9),(10) | 7.52 | % | 1,496,587 | 224,488 | 0.98 | % | 1,721,075 | (9),(10) | 7.47 | % | 1,496,587 | 224,488 | * | |||||||||||||
Total beneficial owners of more than 5% of Perini’s Common Stock | 18,590,010 | (11) | 77.10 | %(11) | 5,910,800 | 12,679,210 | (12) | 52.59 | %(12) | 18,590,010 | (11) | 76.60 | %(11) | 5,910,800 | 12,679,210 | (12) | 52.25 | %(12) | ||||||||||
| Beneficial Ownership of Directors and Executive Officers | ||||||||||||||||||||||||||||
Ronald N. Tutor | 6,527,729 | (4) | 27.07 | % | – | 6,527,729 | 27.07 | % | 6,527,729 | (4) | 26.90 | % | – | 6,527,729 | 26.90 | % | ||||||||||||
Robert Band | 242,011 | (13) | 1.05 | % | – | 242,011 | 1.05 | % | 242,011 | (13) | 1.04 | % | – | 242,011 | 1.04 | % | ||||||||||||
Peter Arkley | 4,700 | (14) | * | – | 4,700 | * | 4,700 | (14) | * | – | 4,700 | * | ||||||||||||||||
Michael R. Klein (15) | 202,255 | (16) | * | – | 202,255 | * | 202,255 | (16) | * | – | 202,255 | * | ||||||||||||||||
Robert A. Kennedy (17) | 6,000 | (18) | * | – | 6,000 | * | 6,000 | (18) | * | – | 6,000 | * | ||||||||||||||||
Raymond R. Oneglia (19) | 6,000 | (20) | * | – | 6,000 | * | 6,000 | (20) | * | – | 6,000 | * | ||||||||||||||||
Wayne L. Berman(21) | – | * | – | – | * | – | * | – | – | * | ||||||||||||||||||
James A. Cummings (22) | – | * | – | – | * | – | * | – | – | * | ||||||||||||||||||
Michael E. Ciskey | 33,000 | (23) | * | – | 33,000 | * | 30,000 | (23) | * | – | 30,000 | * | ||||||||||||||||
Zohrab B. Marashlian | 444,600 | (24) | 1.91 | % | – | 444,600 | 1.91 | % | 444,600 | (24) | 1.89 | % | – | 444,600 | 1.89 | % | ||||||||||||
Craig W. Shaw | 447,120 | (25) | 1.92 | % | – | 447,120 | 1.92 | % | 447,120 | (25) | 1.90 | % | – | 447,120 | 1.90 | % | ||||||||||||
Frederick Doppelt | 54,622 | (26) | * | – | 54,622 | * | 62,168 | (26) | * | – | 62,168 | * | ||||||||||||||||
Asher B. Edelman | 699 | (27) | * | – | 699 | * | 632 | (27) | * | – | 632 | * | ||||||||||||||||
All Directors and Executive Officers | 7,968,736 | 31.29 | % | – | 7,968,736 | 31.29 | % | 7,973,215 | 31.10 | % | – | 7,973,215 | 31.10 | % | ||||||||||||||
| * | Represents less than 1% of the outstanding shares of common stock |
| (1) | Beneficial ownership is determined in accordance with the rules of the Securities and Exchange Commission and generally includes voting or investment power with respect to securities. Shares of common stock and options or warrants that are currently exercisable or exercisable within 60 days of |
| (2) | The number of shares being offered excludes any shares that may be sold as a result of the exercise by the underwriters of their over-allotment option and any shares beneficially owned. |
| (3) | Based on |
| (4) | Includes 2,704,260 shares of common stock that represent sole voting and investing power based on information contained in Schedule 13D/A of Tutor-Saliba Corporation, or Tutor-Saliba, dated April 5, 2000. Ronald N. Tutor, our Chairman and Chief Executive Officer, is also the sole stockholder and chief executive officer of Tutor-Saliba. Also includes 1,225,000 shares for which Mr. Tutor holds options and 2,352,941 shares for which Tutor-Saliba has the right to call and purchase from National Union during a three-year period commencing on March 29, 2003 in accordance with the Shareholders’ Agreement discussed under “Certain Transactions.” Also includes 245,528 shares of common stock representing Tutor-Saliba’s former limited partnership interest in PB Capital Partners, L.P., or PB Capital (see Note 7 below), that was distributed to Tutor-Saliba on November 13, 2003. Upon such distribution by PB Capital, Tutor-Saliba’s limited partnership interest in PB Capital was liquidated. |
| (5) | Represents shared voting and investment powers based on information contained in Schedule 13D/A of American International Group, Inc., the parent company of National Union, filed on April 12, 2000. See “Certain Transactions.” |
| (6) | Represents sole voting and investment powers based on information contained in Schedule 13D of O&G Industries, Inc., or O&G, filed on February 15, 2000 and as updated for O&G’s participation in the Transaction, as described in “Certain Transactions.” |
| (7) | Blum Capital Partners, L.P., or BCP, formerly known as Richard C. Blum & Associates, L.P., is the sole general partner of PB Capital. |
Until November 13, 2003, Tutor-Saliba was a limited partner of PB Capital. See Note 4 above. Richard C. Blum & Associates, Inc., or RCBA Inc., is the sole general partner of BCP. Richard C. Blum is the chairman and a substantial shareholder of RCBA Inc. Each of BCP, RCBA Inc. and Mr. Blum disclaims beneficial ownership of the securities reported in the table except to the extent of any pecuniary interest therein. The Common Fund expressly disclaims membership in any group with BCP, Richard C. Blum or any other related entity and disclaims beneficial ownership of securities owned directly or indirectly by any other person or entity. Also, see “Certain Transactions.”
| (8) | Includes (a) 3,060,741 shares of common stock held by PB Capital after this offering, over which BCP beneficially has shared voting and investment power, (b) 6,605 shares of common stock which will be held directly by BCP and (c) the 49,801 shares of common stock held by a limited partner of PB Capital for which BCP serves as an investment advisor. RCBA Inc. is the sole general partner of BCP and Mr. Blum is the chairman and a substantial shareholder of RCBA Inc. (see Note 7 above). |
| (9) | Represents sole voting and investing power based on information contained in Schedule 13D/A dated April 12, 2000, filed by The Union Labor Life Insurance Company, or ULLICO. Also, see “Certain Transactions.” |
| (10) | Pursuant to the Shareholders’ Agreement discussed under “Certain Transactions,” these stockholders and Perini agreed to, among other things, nominate certain individuals designated by these stockholders for election or appointment to our Board of Directors and the stockholders have agreed to vote for each of the designated nominees. |
| (11) | The share amount and share percentage eliminates the duplication relating to (a) PB Capital’s 4,244,149 shares of common stock and The Common Fund’s 1,162,348 shares of common stock listed separately above and also included in the totals for BCP (see Note 7 above), (b) the shares of common stock beneficially owned by RCBA Inc. and Mr. Blum as a result of their relationship with BCP (see Notes 7 and |
8 above), (c) 6,527,729 shares of common stock beneficially owned by Mr. Tutor which are also included in Tutor-Saliba’s total (see Note 4 above) and (d) 2,352,941 shares of common stock included in Tutor-Saliba’s total for which Tutor-Saliba has the right to call and purchase from National Union (see Note 4 above) and also included in National Union’s total (see Note 5 above). |
| (12) | The share amount and share percentage eliminates the duplication relating to (a) PB Capital’s 3,060,741 shares of common stock which are also included in BCP’s total (see Note 8 above), (b) the shares of common stock beneficially owned by RCBA Inc. and Mr. Blum as a result of their relationship with BCP (see Notes 7 and 8 above), (c) 6,527,729 shares of common stock beneficially owned by Mr. Tutor which are also included in Tutor-Saliba’s total (see Note 4 above) and (d) 2,352,941 shares of common stock included in Tutor-Saliba’s total for which Tutor-Saliba has the right to call and purchase from National Union (see Note 4 above) and also included in National Union’s total (see Note 5 above). |
| (13) | Includes 237,500 shares for which Mr. Band holds options. |
| (14) | Includes 4,700 shares for which Mr. Arkley holds options. |
| (15) | Mr. Klein was originally elected to our Board of Directors as the designated nominee of PB Capital, a partnership that owned 4,244,149 shares of common stock and a partnership whose sole general partner is BCP. BCP is an investment advisor to The Common Fund for Non-Profit Organizations for the account of its Equity Fund that owns 1,162,348 shares of common stock. Mr. Klein generally disclaims beneficial ownership in these shares owned by these entities. See Note 7 and Note 16. |
| (16) | Includes: 53,694 shares of common stock directly owned by Mr. Klein and 8,300 shares (as to which he disclaims beneficial interest) owned by a trust for his children, all 61,994 of which shares previously were owned indirectly by them as limited partners of PB Capital (see Note 7 above); 7,261 shares of common stock Mr. Klein received as payment for director’s annual retainer from 1997-1999 (See “Management— Directors’ Compensation”); and 133,000 shares of common stock for which Mr. Klein owns options. |
| (17) | Mr. Kennedy is the designated nominee to the Board of Directors of ULLICO, a company that owns 1,721,075 shares of common stock on behalf of its Separate Account P and a company in which Mr. Kennedy was the Vice President of Special Projects until his retirement in 2003. Mr. Kennedy disclaims any beneficial ownership of these shares. See Note 9 above. |
| (18) | Includes 6,000 shares for which Mr. Kennedy holds options. |
| (19 | Mr. Oneglia is the designated nominee to the Board of Directors of O&G, a company that owns 2,502,941 shares of common stock, and a company in which Mr. Oneglia is the vice chairman. Mr. Oneglia disclaims any beneficial ownership of these shares. See Note 6 above. |
| (20) | Includes 6,000 shares for which Mr. Oneglia holds options. |
| (21) | In February 2004, Mr. Berman resigned from his position as a member of our Board of Directors. |
| (22) | Mr. Cummings’ appointment as a director was in accordance with the terms of the Stock Purchase and Sale Agreement dated December 16, 2002 between Perini, James A. Cummings, Inc. and the James A. Cummings, Inc. stockholders, of which Mr. Cummings was one, whereby Perini purchased 100% of the outstanding common stock of James A. Cummings, Inc. effective as of January 1, 2003. See Note |
| (23) | Includes |
| (24) | Includes 444,600 shares for which Mr. Marashlian holds options. |
| (25) | Includes 445,000 shares for which Mr. Shaw holds options. |
| (26) | Includes 3,121 shares of common stock received in payment of the 1999 director’s annual retainer and 8,000 shares for which Mr. Doppelt holds options. See “Management—Directors’ Compensation.” Also includes |
| (27) | Includes |
Each of the principal stockholders listed above as well as certain of our directors and executive officers listed above have agreed, subject to certain exceptions, not to dispose of or hedge any common stock or any securities convertible into or exchangeable or exercisable for any shares of our common stock without the prior consent of Credit Suisse First Boston LLC for a period of 90 days after the date of this prospectus. As of the date of this filing, one of our directors, who currently beneficially owns 199632 shares of our common stock, (issuable upon conversion of Depositary Shares at a conversion rate of .662 shares of common stock for each Depositary Share), has not signed the lock-up agreementsagreement described above.elsewhere in this prospectus. See “Underwriting.” Following the expiration of the lock-up period, the shareholders party thereto will be able to dispose of certain of their shares of common stock pursuant to the Registration Rights Agreement discussed under “Description of Capital Stock—Registration Rights Agreements.”
Our articles of organization, as amended, authorize the issuance of 40,000,000 shares of common stock, par value $1.00 per share and 1,000,000 shares of preferred stock, par value $1.00 per share. As of September 30,December 31, 2003, there were 22,842,53522,885,535 shares of common stock outstanding, 55,927 shares of $21.25 Preferred Stock outstanding, 370,239 shares of common stock reserved for issuance upon conversion of the $21.25 Preferred Stock, options to purchase 3,048,8003,005,800 shares of common stock outstanding, and warrants to purchase 420,000 shares of our common stock outstanding.
Our common stock is listed on the American Stock Exchange. We have applied for the listing of our common stock on the New York Stock Exchange. We expect our common stock to begin trading on the New York Stock Exchange in April 2004 under the symbol “PCR.”
Common Stock
Subject to the rights of the holders of preferred stock then outstanding, holders of common stock are entitled to one vote per share on matters to be voted on by stockholders and are entitled to receive such dividends, if any, as may be declared from time to time by our Board of Directors in its discretion out of funds legally available therefor. Upon our liquidation or dissolution, the holders of common stock are entitled to receive pro rata all assets remaining available for distribution to stockholders after payment of all liabilities and provision for the liquidation of any shares of preferred stock at the time outstanding. The common stock has no preemptive or other subscription rights, and there are no conversion rights or redemption or sinking fund provisions with respect to such stock. The payment of dividends on the common stock is subject to the prior payment of dividends on any outstanding preferred stock. Further, our revolving credit facility, as well as certain other agreements, provides for, among other things, maintaining minimum working capital and tangible net worth levels and limitations on indebtedness, all of which could impact our ability to pay dividends.
Preferred Stock
Our charter authorizes the issuance of 1,000,000 shares of preferred stock, par value $1.00 per share. Currently, 100,000 shares of preferred stock are designated as the $21.25 Convertible Exchangeable Preferred Stock, of which 55,927 shares are outstanding, and 200,000 shares are designated as Series A Junior Participating Cumulative Preferred Stock in connection with the adoption of our Shareholder Rights Plan described below. Our authorized but unissued preferred stock may be issued from time to time in one or more series, without stockholders’ approval. Subject to limitations prescribed by law and by our charter, the Board of Directors is authorized to determine the relative rights and preferences for each series of preferred stock that may be issued, and to fix the number of shares of such series. Thus, our Board of Directors, without stockholder approval, could authorize the issuance of additional preferred stock with voting, conversion and other rights that could adversely affect the voting power and other rights of holders of our common stock or that could make it more difficult for another company to effect certain business combinations with us.
Notwithstanding the fixing of the number of shares constituting a particular series, our Board of Directors may at any time authorize the issuance of additional shares of the same series. Any preferred stock converted, redeemed, exchanged or otherwise acquired by us will, upon cancellation, have the status of authorized but unissued preferred stock undesignated as to series subject to reissuance by our Board of Directors.
$21.25 Preferred Stock
Holders of shares of $21.25 Preferred Stock are entitled to receive an annual cash dividend of $21.25 per share, or $2.125 per Depositary Share, when and as declared by the Board of Directors out of funds legally available for such purposes. Unless full cumulative dividends have been paid or declared, no cash dividends may be declared or paid or other cash distribution made on the common stock. Holders of the $21.25 Preferred Stock are entitled at any time to convert shares of $21.25 Preferred Stock into our common stock at the conversion price of $377.50, subject to adjustment in certain circumstances. Each share of the $21.25 Preferred Stock is
exchangeable, in whole but not in part, at our option, for $250 principal amount of our 8 1/2% Convertible Subordinated Debentures Due 2012. Holders of such debentures will be entitled at any time to convert such debentures into common stock at the conversion price of $377.50 per Depositary Share, subject to adjustment in certain circumstances.
The $21.25 Preferred Stock is redeemable at our option, in whole or in part, at specified redemption prices per share. The $21.25 Preferred Stock is not entitled to vote, except as to certain matters in regard to the creation of an additional series of preferred stock or in the event of an arrearage on dividends. The terms of the $21.25 Preferred Stock provide that if six quarterly dividends on the $21.25 Preferred Stock shall have accumulated and been unpaid, the number of directors on our Board will be increased by two and the holders of the $21.25 Preferred Stock, voting together as a class with any other series of preferred stock with the same rank similarly affected, will be entitled to elect those additional two directors until all dividends in default have been paid or declared and funds have been set apart for payment therefor, at which time those two directors would resign from our Board and the number of directors would be reduced by two. While quarterly dividends on the $21.25 Preferred Stock have not been paid since 1995, they have been fully accrued due to the “cumulative” feature of the $21.25 Preferred Stock. As a result of exceeding the six-quarter limitation, the holders of the $21.25 Preferred Stock have been entitled to elect two additional Directors, and they have done so at each of the last six annual meetings of stockholders. As discussed under “Management’s Discussion and Analysis of Financial Condition and Results of Operations—Dividends—$21.25 Preferred Stock,” there are no plans for payment of any such dividends.
In the event of an involuntary liquidation, or an amount equal to the then applicable optional redemption price in the event of a voluntary liquidation, holders of the $21.25 Preferred Stock are entitled to receive a liquidating distribution of $250 per share.
The outstanding $21.25 Preferred Stock are represented by Depositary Shares. Each Depositary Share (evidenced by a depositary receipt) represents a one-tenth fractional interest in the respective share of $21.25 Preferred Stock (including dividend, voting, redemption and liquidation rights and preferences). The $21.25 Preferred Stock have been deposited with EquiServe Trust Company, N.A., as Depositary, under a Deposit Agreement between Perini, EquiServe Trust Company, N.A., and the holders from time to time of the depositary receipts issued under the Deposit Agreement. The depositary receipts evidence the Depositary Shares.
Stock Purchase Warrants
As of September 30,December 31, 2003, we have reserved 420,000 shares of common stock for issuance upon the exercise of stock purchase warrants issued in January 1997 to members of our banking group at that time in connection with an amended credit agreement. The warrants are exercisable at a per share exercise price of $8.30 subject to anti-dilution adjustment in the event of certain distributions and other corporate events. The warrants expire on January 17, 2007.
Registration Rights Agreements
Registration Rights Agreements
The following is a summary of material terms and provisions of registration rights agreements that we have entered into with certain existing stockholders.
In March 2000, we entered into a registration rights agreement with certain existing stockholders, as may hereafter be referred to as the March 2000 Registration Rights Agreement. Under this agreement, we granted these stockholders the right to require us, subject to the terms and conditions set forth in the agreement, to register shares of common stock held by them for sale.
Each of the stockholders that is a party to this agreement may request one demand registration, except National Union, which may request two. Subject to limitations set forth in this agreement, the parties also have the right to
participate in any demand registration requested by any other stockholder that is a party to the agreement. In addition, we have granted the parties to this agreement the right, subject to exceptions set forth therein, to participate in registrations of common stock initiated by us on our own behalf or on behalf of any other stockholder. BCP, PB Capital and The Common Fund have exercised their right requiring us to register a portion of their shares under the Securities Act, precipitating this offering. All of the other selling stockholders named in this offering have exercised their piggyback rights in connection with this offering.
Under the March 2000 Registration Rights Agreement, we are required to pay the fees and expenses of the selling stockholders in connection with any demand and piggyback registrations. We also have agreed to indemnify the holders of registration rights under this agreement against specified liabilities, including liabilities under the Securities Act, and to contribute to payments they may be required to make. Insofar as indemnification for liabilities arising under the Securities Act may be permitted to our directors, officers and persons controlling us as described above, we have been advised that in the opinion of the SEC such indemnification is against public policy as expressed in the Securities Act and is therefore unenforceable. The March 2000 Registration Rights Agreement will terminate on the earlier of the date upon which the parties to the agreement no longer hold any shares of common stock that must be registered in order to be sold or the date upon which the parties agree that the agreement should be terminated.
In December 2003, we entered into a letter agreement with BCP, PB Capital and The Common Fund, hereinafter collectively referred to as the Blum parties. Under this letter agreement, we granted these stockholders an additional demand registration right to require us, subject to the terms and conditions set forth in the letter agreement, to register shares of common stock held by them for sale. The letter agreement provides that this demand registration right is subject to certain terms and conditions set forth in the March 2000 Registration Rights Agreement discussed above. Parties to the March 2000 Registration Rights Agreement may participate in the demand registration of common stock requested by the Blum parties.
Under this letter agreement, we agreed to pay the fees and expenses of the selling stockholders in connection with the exercise of their demand right and any piggyback registrations. This letter agreement will not become effective, and the Blum holders will have no right to exercise their demand registration rights until this Registration Statement has become effective. Under this letter agreement, the Blum holders may exercise their demand registration rights until they no longer hold any shares of common stock that must be registered in order to be sold.
Warrantholders Rights Agreement
In January 1997, we issued warrants to purchase our common stock to members of our banking group in connection with an amended credit agreement. As part of this issuance, we entered into a warrantholder rights agreement with the warrantholders. Under this agreement, we granted these warrantholders the right to require us, upon request by holders of a majority of warrants and common stock received upon exercise of warrants, subject to the terms and conditions set forth in this agreement, to register the resale of shares of the common stock held by them upon exercise of their warrants. Under this agreement, we agreed to pay the fees and expenses of one counsel to the selling stockholders in connection with their registration. We have also agreed to indemnify the holders of these registration rights under this agreement against specified liabilities, including liabilities under the Securities Act, and to contribute to payments that they may be required to make. This warrantholders rights agreement will terminate on the date upon which the parties to the warrantholders rights agreement no longer hold any shares, or warrants to purchase shares, of common stock that must be registered in order to be sold. The warrants expire in January 2007.
Shareholder Rights Plan
We have adopted a Shareholder Rights Plan pursuant to which we issued one preferred stock purchase right, or a Right, for each outstanding share of common stock. Each Right entitles the registered holder to purchase
from us a unit consisting of one one-hundredth of a share of Series A Junior Participating Cumulative Preferred Stock, par value $1.00 per share, or the Series A Preferred Stock, at a cash exercise price of $100 per unit, subject to adjustment. Each share of Series A Preferred Stock will be entitled to receive a minimum preferential quarterly dividend equal to the greater of $20.00 or 100 times the dividend payable to holders of shares of common stock. In the event of a liquidation, no distribution shall be made (x) to the holders of stock ranking junior to the Series A Preferred Stock unless, prior thereto, the holders of Series A Preferred Stock receive a distribution equal to the greater of $10,000.00 or 100 times the payment made for each share of common stock or (y) to the holders of any other class or series of stock ranking on a parity (either as to dividends or liquidation preferences) with the Series A Preferred Stock except distributions made ratably on the Series A Preferred Stock and all other such parity stock in proportion to the total amounts to which holders of all such shares are entitled upon a liquidation. The Series A Preferred Stock ranks junior to the $21.25 Preferred Stock with respect to dividends and liquidation preferences but senior to the common stock.
The Shareholder Rights Plan may have the effect of delaying, deferring or preventing a change in control of us. State Street Bank and Trust Company is the agent for the Rights. Currently, the Rights are not exercisable and are attached to all outstanding shares of common stock and will be attached to the shares of common stock being offered hereby. No separate Right Certificates will be distributed until the distribution date. Upon occurrence of the distribution date, the Rights will separate from the common stock.
Under the Shareholder Rights Plan, the “distribution date” is defined as the earlier of (i) 10 days following a public announcement that a person or group of affiliated or associated persons is an acquiring person (the date of said announcement being referred to as the “stock acquisition date”), or (ii) 10 business days following the commencement of a tender offer or exchange offer that would result in a person or group becoming an acquiring person, or (iii) the declaration by the Board of Directors that any person is an adverse person.
Under the Shareholder Rights Plan, an “acquiring person” is defined as a person or group of affiliated or associated persons (other than us and certain of our affiliates and other exempted persons) that has acquired beneficial ownership of 10% or more of the outstanding shares of common stock.
Under the Shareholder Rights Plan, an “adverse person” is defined as any individual, group, firm, corporation, partnership or other entity (other than us and certain of our affiliates and other exempted persons) declared to be an adverse person by our Board of Directors upon a determination of our Board that the criteria set forth in the Shareholder Rights Plan apply to such individual, group or entity.
In the event that a stock acquisition date occurs or our Board of Directors determines that a person is an adverse person, proper provision will be made so that after the distribution date each holder of a Right will thereafter have the right to receive upon exercise that number of units of Series A Preferred Stock having a market value of two times the exercise price of the Right, such right hereafter referred to as the “subscription right.” In the event that, at any time following the stock acquisition date, (i) we are acquired in a merger or other business combination transaction or (ii) 50% or more of our assets or earning power is sold, after the distribution date each holder of a Right shall thereafter have the right to receive, upon exercise, common stock of the acquiring company having a market value equal to two times the exercise price of the Right, such right hereafter referred to as a “merger right.” The holder of a Right will continue to have the merger right whether or not such holder has exercised the subscription right. Rights that are or were beneficially owned by an acquiring person or an adverse person may (under certain circumstances specified in the Shareholder Rights Plan) become null and void. At any time after a stock acquisition date occurs or the Board of Directors determines that a person is an adverse person, the Board of Directors may, at its option, exchange all or any part of the then outstanding and exercisable Rights for shares of common stock or units of preferred stock at an exchange ratio of one share of common stock or one unit of preferred stock per Right.
The Rights may be redeemed in whole, but not in part, at a price of $0.02 per Right (payable in cash, common stock or other consideration deemed appropriate by the Board of Directors) by the Board of Directors at
any time prior to the date on which a person is declared to be an adverse person, the tenth day after the stock acquisition date or the occurrence of an event giving rise to the merger right. Immediately upon the action of the Board of Directors ordering redemption of the Rights, the Rights will terminate and thereafter the only right of the holders of Rights will be to receive the redemption price. Until a Right is exercised, the holder will have no rights as a stockholder of Perini (beyond those as an existing stockholder, including the right to vote or to receive dividends).
On January 17, 1997, the Board of Directors amended our Shareholder Rights Plan to (i) permit the acquisition of the Series B Preferred Stock by certain investors, any additional preferred stock issued as a dividend thereon, any common stock issued upon conversion of the Series B Preferred Stock and certain other events without triggering the distribution of the Rights and (ii) extend the expiration date of the Shareholder Rights Plan from September 23, 1998 to January 21, 2007. In addition, our Board of Directors amended the Shareholder Rights Plan, effective March 29, 2000, to permit the transactions as described in under “Certain Transactions—Series B Preferred Stock Exchange” and certain other events without triggering the distribution of the Rights.
Massachusetts Anti-Takeover Laws
We are subject to Chapter 110F of the Massachusetts General Laws, an anti-takeover law. In general, this statute prohibits a publicly held Massachusetts corporation from engaging in a business combination with an interested stockholder for a period of three years after the date of the transaction which results in the stockholder becoming an interested stockholder, unless:
The Massachusetts General Laws defines the term “business combination” to include a merger, a stock or asset sale, and certain other transactions resulting in a financial benefit to the interested stockholder. An “interested stockholder” is generally a person who, together with affiliates and associates, owns, or within three years, owned, 5% or more of our voting stock.
Our bylaws include a provision excluding us from the applicability of Massachusetts General Laws Chapter 110D, entitled “Regulation of Control Share Acquisitions.” In general, this statute provides that any stockholder of a corporation subject to this statute who acquires 20% or more of the outstanding voting stock of a corporation may not vote such stock unless the stockholders of the corporation so authorize. Our Board of Directors may amend our bylaws at any time to subject us to this statute prospectively.
Certain Anti-takeover Provisions of our Charter and Bylaws
Our charter and bylaws contain provisions which may prevent, discourage or delay any change in the control of Perini and may make it more difficult to remove a member of the Board of Directors or management. These provisions include:
Blank Check Preferred Stock
Our Board of Directors has the authority to issue preferred stock with voting or other rights or preferences that could impede the success of any attempt to effect a change in control or takeover of Perini.
Staggered Board of Directors
Massachusetts General Laws Chapter 156B, Section 50A requires publicly-held Massachusetts corporations, such as Perini, to have a classified board of directors consisting of three classes as nearly equal in size as possible, unless the corporation elects to opt out of the statute’s coverage. Our Board of Directors is currently divided into three classes. Each class of directors serves a three-year term. The classification of Directors could have the effect of making it more difficult for our stockholders, including those holding a majority of the outstanding shares, to force an immediate change in the composition of our Board.
Director Removal and Vacancies
Pursuant to our bylaws, stockholders may effectuate the removal of a director only for cause and with the affirmative vote of the majority of shares outstanding and entitled to vote. Vacancies in our Board of Directors may be filled only by the affirmative vote of a majority of the directors then in office.
Meeting of Stockholders
Our bylaws provide that a special meeting of stockholders may be called by our Chairman, President, our Board of Directors, or upon written application of one or more stockholders who hold at least 40% of our common stock entitled to vote at such meeting. In addition, our bylaws include advance notice and information requirements and time limitations on any director nomination or any new proposal which a stockholder desires to make at an annual meeting of stockholders.
Limitation on Liability and Indemnification of Directors and Officers
Our charter provides that no director shall be personally liable to us or to our stockholders for monetary damages for breach of fiduciary duty as a director, except for liability for any breach of the director’s duty of loyalty to us or our stockholders, for acts or omissions not in good faith, for acts or omissions involving intentional misconduct or a knowing violation of law or for any transaction, or for any transaction from which the director derived an improper personal benefit. Our bylaws provide that our directors and officers will be indemnified against liabilities that arise from their service as directors and officers, subject to certain exceptions. We have entered into agreements with our directors and officers that also provide for such indemnification and expenses and liability reimbursement. We have obtained insurance which insures our directors and officers against certain losses and which insures us against our obligations to indemnify the directors and officers.
Transfer Agent and Registrar
The transfer agent and registrar for our common stock is EquiServe Trust Company, N.A.
SHARES ELIGIBLE FOR FUTURE SALE
We cannot predict what effect, if any, market sales of shares of common stock or the availability of shares of common stock for sale will have on the market price of our common stock. Nevertheless, sales of substantial amounts of common stock, including shares issued upon the exercise of outstanding options, in the public market, or the perception that these sales could occur, could materially and adversely affect the market price of our common stock and could impair our future ability to raise capital through the sale of our equity or equity-related securities at a time and price that we deem appropriate.
As of the close of business on December 15, 2003,February 23, 2004, we had outstanding an aggregate of 22,885,53523,043,335 shares of common stock, and this offering will not affect the number of our outstanding shares. All the shares sold in this offering will be freely tradable without restriction or further registration under the Securities Act, except that any shares held by our “Affiliates,” as that term is defined under Rule 144 of the Securities Act, may be sold only in compliance with the limitations described below.
Assuming the underwriters do not exercise their over-allotment option, 90 days after the date of this prospectus, 11,576,71811,484,416 shares of our common stock, which are not being registered in this offering, will be available for sale in the public market pursuant to Rule 144.
Tutor-Saliba, Ronald N. Tutor, BCP, National Union, PB Capital, O&G and ULLICO, which will beneficially own 52.6%52.2% of our shares (or 48.9%48.6% if the underwriters exercise their over-allotment option in full) upon the closing of this offering, have the ability, subject to certain restrictions, to cause us to register the resale of certain of their shares.
Rule 144
In general, under Rule 144 as currently in effect, a person (or persons whose shares are required to be aggregated), including an affiliate, who has beneficially owned shares of our common stock for at least one year is entitled to sell in any three-month period a number of shares that does not exceed the greater of:
Sales under Rule 144 are also subject to manner of sale provisions and notice requirements and to the availability of current public information about us.
Rule 144(k)
In addition, a person who is not deemed to have been an affiliate of ours at any time during the 90 days preceding a sale and who has beneficially owned the shares proposed to be sold for at least two years, would be entitled to sell those shares under Rule 144(k) without regard to the manner of sale, public information, volume limitation or notice requirements of Rule 144. To the extent that our affiliates sell their shares, other than pursuant to Rule 144 or a registration statement, the purchaser’s holding period for the purpose of effecting a sale under Rule 144 commences on the date of transfer from the affiliate.
Lock-Up Agreements
The selling stockholders and certain of our directors and executive officers have entered into the lock-up agreements described in “Underwriting.”
MATERIAL U.S. FEDERAL INCOME TAX CONSEQUENCES
General
The following is a general discussion of the material United States federal income and estate tax consequences of the ownership and disposition of common stock that may be relevant to you if you are a non-United States Holder. In general, a “non-United States Holder” is any person or entity that is, for United States federal income tax purposes, a foreign corporation, a nonresident alien individual, a foreign partnership or a foreign estate or trust. This discussion is based on current law, which is subject to change, possibly with retroactive effect, or different interpretations that could affect the tax consequences described herein. This discussion is limited to non-United States Holders who hold shares of common stock as capital assets. Moreover, this discussion is for general information only and does not address all the tax consequences that may be relevant to you in light of your personal circumstances, nor does it discuss special tax provisions that may apply to you if you relinquished United States citizenship or residence.
If you are an individual, you may, in many cases, be deemed to be a resident alien, as opposed to a nonresident alien, by virtue of being present in the United States for at least 31 days in the current calendar year and for an aggregate of at least 183 days during a three-year period ending in the current calendar year. For the aggregate days test, all of the days present in the current year, one-third of the days present in the immediately preceding year, and one-sixth of the days present in the second preceding year are counted. Resident aliens are subject to United States federal income tax as if they were United States citizens.
EACH PROSPECTIVE PURCHASER OF COMMON STOCK IS ADVISED TO CONSULT A TAX ADVISOR WITH RESPECT TO CURRENT AND POSSIBLE FUTURE TAX CONSEQUENCES OF PURCHASING, OWNING AND DISPOSING OF OUR COMMON STOCK AS WELL AS ANY TAX CONSEQUENCES THAT MAY ARISE AS A RESULT OF YOUR PARTICULAR SITUATION OR UNDER THE LAWS OF ANY UNITED STATES STATE, MUNICIPALITY, FOREIGN OR OTHER TAXING JURISDICTION.
Dividends
If dividends are paid on the common stock, as a non-United States Holder, you generally will be subject to withholding of United States federal income tax at a 30% rate or at a lower rate as may be specified by an applicable income tax treaty, unless you are a foreign government or other foreign organization exempt from U.S. withholding. To claim the benefit of a lower rate under an income tax treaty, you must properly file with the payor an Internal Revenue Service Form W-8BEN, or successor form, claiming an exemption from or reduction in withholding under the applicable tax treaty. In addition, where dividends are paid to a non-United States Holder that is a partnership or other flow-through entity, the entity must properly file an Internal Revenue Service Form W-8IMY, or successor form, and persons holding an interest in the entity may need to provide certification claiming an exemption or reduction in withholding under the applicable treaty.
If dividends are considered effectively connected with the conduct of a trade or business by you within the United States and, where a tax treaty applies, are attributable to a United States permanent establishment of yours, those dividends generally will not be subject to withholding tax, but instead will be subject to United States federal income tax on a net basis at applicable graduated individual or corporate rates, provided you file an Internal Revenue Service Form W-8ECI, or successor form, with the payor. If you are a foreign corporation, any effectively connected dividends may, under certain circumstances, be subject to an additional “branch profits tax” at a rate of 30% or at a lower rate as may be specified by an applicable income tax treaty.
If you are a foreign government, foreign tax-exempt organization or other foreign organization exempt from U.S. withholding, you must properly file an Internal Revenue Service Form W-8EXP with the payor.
You must comply with either the certification procedures described above, or, in the case of payments made outside the United States with respect to an offshore account, certain documentary evidence procedures, directly
or under certain circumstances through an intermediary, to obtain the benefits of a reduced rate under an income tax treaty with respect to dividends paid with respect to your common stock. In addition, if you are required to provide an Internal Revenue Service Form W-8ECI or successor form, as discussed above, you must also provide your tax identification number.
If you are eligible for a reduced rate of United States withholding tax pursuant to an income tax treaty, you may obtain a refund of any excess amounts withheld by filing an appropriate claim for refund with the Internal Revenue Service.
Gain on Disposition of Common Stock
As a non-United States Holder, you generally will not be subject to United States federal income tax on any gain recognized on the sale or other disposition of common stock unless:
Federal Estate Tax
If you are an individual, common stock held at the time of your death will be included in your gross estate for United States federal estate tax purposes, and may be subject to United States federal estate tax, unless an applicable estate tax treaty provides otherwise. You should consult your tax advisor for a full discussion of United States federal estate tax treatment.
Information Reporting and Backup Withholding Tax
We must report annually to the Internal Revenue Service and to you the amount of dividends paid to you and the tax withheld with respect to those dividends, regardless of whether withholding was required. Copies of the information returns reporting those dividends and withholding may also be made available to the tax authorities in the country in which you reside under the provisions of an applicable income tax treaty or other applicable agreements.
Backup withholding is currently imposed at a rate of 28% on certain payments to persons that fail to furnish the necessary identifying information to the payor. You generally will be subject to backup withholding tax with respect to dividends paid on your common stock unless you certify your non-United States status.
The payment of proceeds of a sale of common stock effected by or through a United States office of a broker is subject to both backup withholding and information reporting unless you provide the payor with your name and address and you certify your non-United States status or you otherwise establish an exemption. In general, backup withholding and information reporting will not apply to the payment of the proceeds of a sale of common stock by or through a foreign office of a broker. If, however, such broker is, for United States federal income tax purposes, a United States person, a controlled foreign corporation, a foreign person that derives 50% or more of its gross income for certain periods from the conduct of a trade or business in the United States, or, a foreign partnership that at any time during its tax year either is engaged in the conduct of a trade or business in the United States or has as partners one or more United States persons that, in the aggregate, hold more than 50% of the income or capital interest in the partnership, such payments will be subject to information reporting, but not backup withholding, unless such broker has documentary evidence in its records that you are a non-United States Holder and certain other conditions are met or you otherwise establish an exemption.
Any amounts withheld under the backup withholding rules generally will be allowed as a refund or a credit against your United States federal income tax liability provided the required information is furnished in a timely manner to the Internal Revenue Service.
Under the terms and subject to the conditions contained in an underwriting agreement dated , 2004, the selling stockholders have agreed to sell to the underwriters named below, for whom Credit Suisse First Boston LLC is acting as representative, the following respective numbers of shares of common stock:
| Underwriter | Number of Shares | |
Credit Suisse First Boston LLC | ||
D.A. Davidson & Co. | ||
Morgan Joseph & Co. Inc. | ||
Total | ||
The underwriting agreement provides that the underwriters are obligated to purchase all the shares of common stock in the offering if any are purchased, other than those shares covered by the over-allotment option described below. The underwriting agreement also provides that if an underwriter defaults the purchase commitments of non-defaulting underwriters may be increased or the offering may be terminated.
The selling stockholders have granted to the underwriters a 30-day option to purchase on a pro rata basis up to an aggregate of 886,620 additional outstanding shares at the initial public offering price less the underwriting discounts and commissions. The option may be exercised only to cover any over-allotments of common stock.
The underwriters propose to offer the shares of common stock initially at the public offering price on the cover page of this prospectus and to selling group members at that price less a selling concession of $ per share. The underwriters and selling group members may allow a discount of $ per share on sales to other broker/dealers. After the initial public offering, the representative may change the public offering price and concession and discount to broker/dealers.
The following table summarizes the compensation and estimated expenses we and the selling stockholders will pay:
| Per Share | Total | |||||||||||
| Without Over-allotment | With Over-allotment | Without Over-allotment | With Over-allotment | |||||||||
| ||||||||||||
| Expenses payable by us | $ | $ | $ | $ | ||||||||
Underwriting Discounts and Commissions | ||||||||||||
| $ | $ | $ | $ | ||||||||
We have agreed that we will not offer, sell, contract to sell, pledge or otherwise dispose of, directly or indirectly, or file with the Securities and Exchange Commission a registration statement under the Securities Act relating to, any shares of our common stock or securities convertible into or exchangeable or exercisable for any shares of our common stock, or publicly disclose the intention to make any offer, sale, pledge, disposition or filing, without the prior written consent of Credit Suisse First Boston LLC for a period of 90 days after the date of this prospectus, other than issuances of common stock pursuant to the conversion or exchange of convertible or exchangeable securities or the exercise of warrants or options, in each case outstanding on the date of this prospectus, grants of employee stock options pursuant to the terms of a plan in effect on the date of this prospectus or issuances of common stock pursuant to the exercise of such options.options; provided, however that in the case of the 1997 warrantholders registration rights agreement, if a majority of warrantholders demand their registration rights, we will file as soon as practicable, but in any event not later than 60 days of receiving such demand notice, a registration statement with the Securities and Exchange Commission for such warrants.
Our officers, certain of our directors and principal stockholders have agreed that they will not offer, sell, contract to sell, pledge or otherwise dispose of, directly or indirectly, any shares of our common stock or securities convertible into or exchangeable or exercisable for any shares of our common stock, enter into a transaction that would have the same effect, or enter into any swap, hedge or other arrangement that transfers, in whole or in part, any of the economic consequences of ownership of our common stock, whether any of these transactions are to be settled by delivery of our common stock or other securities, in cash or otherwise, or publicly disclose the intention to make any offer, sale, pledge or disposition, or to enter into any transaction, swap, hedge or other arrangement, without, in each case, the prior written consent of Credit Suisse First Boston LLC for a period of 90 days after the date of this prospectus, other than:
As of the date of this filing, one of our directors, who currently beneficially owns 199632 shares of our common stock, (issuable upon conversion of Depositary Shares at a conversion rate of .662 shares of common stock for each Depositary Share), has not signed the lock-up agreementsagreement described above.
Credit Suisse First Boston LLC has no current intent or arrangement to release any shares subject to these lock-ups. The release of any lock-up will be considered on a case by case basis. In considering whether to release any shares, Credit Suisse First Boston LLC would consider the particular circumstances surrounding the request, including but not limited to, the length of time before the lock-up expires, the number of shares requested to be released, the reasons for the request, the possible impact on the market for our common stock and whether the holder of our shares requesting the release is an officer, director or other affiliate of ours.
We and the selling stockholders have agreed to indemnify the underwriters against liabilities under the Securities Act, or contribute to payments that the underwriters may be required to make in that respect.
Certain of the underwriters and their respective affiliates may have from time to time performed and may in the future perform various financial advisory, commercial banking and investment banking services for us in the ordinary course of business, for which they received or will receive customary fees.
In connection with the offering, the underwriters may engage in stabilizing transactions, over-allotment transactions, syndicate covering transactions, and penalty bids in accordance with Regulation M under the Exchange Act.
Over-allotment involves sales by the underwriters of shares in excess of the number of shares the underwriters are obligated to purchase, which creates a syndicate short position. The short position may be either a covered short position or a naked short position. In a covered short position, the number of
shares over-allotted by the underwriters is not greater than the number of shares that they may purchase in the over-allotment option. In a naked short position, the number of shares involved is greater than the number of shares in the over-allotment option. The underwriters may close out any covered short position by either exercising their over-allotment option and/or purchasing shares in the open market. |
These stabilizing transactions, syndicate covering transactions and penalty bids may have the effect of raising or maintaining the market price of our common stock or preventing or retarding a decline in the market price of the common stock. As a result, the price of our common stock may be higher than the price that might otherwise exist in the open market. These transactions may be effected on The American Stock Exchange and, if commenced, may be discontinued at any time.
Our common stock is listed on the American Stock Exchange. We have applied for the listing of our common stock on the New York Stock Exchange. We expect our common stock to begin trading on the New York Stock Exchange in April 2004 under the symbol “PCR.”
A prospectus in electronic format may be made available on the web sites maintained by one or more of the underwriters, or selling group members, if any, participating in this offering and one or more of the underwriters participating in this offering may deliver prospectuses electronically. The representative may agree to allocate a number of shares to underwriters and selling group members for sale to their online brokerage account holders. Internet distributions will be allocated by the underwriters and selling group members that will make internet distributions on the same basis as other allocations.
Resale Restrictions
The distribution of the common stock in Canada is being made only on a private placement basis exempt from the requirement that we and the selling stockholders prepare and file a prospectus with the securities regulatory authorities in each province where trades of common stock are made. Any resale of the common stock in Canada must be made under applicable securities laws which will vary depending on the relevant jurisdiction, and which may require resales to be made under available statutory exemptions or under a discretionary exemption granted by the applicable Canadian securities regulatory authority. Purchasers are advised to seek legal advice prior to any resale of the common stock.
Representations of Purchasers
By purchasing common stock in Canada and accepting a purchase confirmation a purchaser is representing to us, the selling stockholders and the dealer from whom the purchase confirmation is received that
Rights of Action - Ontario Purchasers Only
Under Ontario securities legislation, a purchaser who purchases a security offered by this prospectus during the period of distribution will have a statutory right of action for damages, or while still the owner of the shares, for rescission against us and the selling stockholders in the event that this prospectus contains a misrepresentation. A purchaser will be deemed to have relied on the misrepresentation. The right of action for damages is exercisable not later than the earlier of 180 days from the date the purchaser first had knowledge of the facts giving rise to the cause of action and three years from the date on which payment is made for the shares. The right of action for rescission is exercisable not later than 180 days from the date on which payment is made for the shares. If a purchaser elects to exercise the right of action for rescission, the purchaser will have no right of action for damages against us or the selling stockholders. In no case will the amount recoverable in any action exceed the price at which the shares were offered to the purchaser and if the purchaser is shown to have purchased the securities with knowledge of the misrepresentation, we and the selling stockholders will have no liability. In the case of an action for damages, we and the selling stockholders will not be liable for all or any portion of the damages that are proven to not represent the depreciation in value of the shares as a result of the misrepresentation relied upon. These rights are in addition to, and without derogation from, any other rights or remedies available at law to an Ontario purchaser. The foregoing is a summary of the rights available to an Ontario purchaser. Ontario purchasers should refer to the complete text of the relevant statutory provisions.
Enforcement of Legal Rights
All of our directors and officers as well as the experts named herein and the selling stockholders may be located outside of Canada and, as a result, it may not be possible for Canadian purchasers to effect service of process within Canada upon us or those persons. All or a substantial portion of our assets and the assets of those persons may be located outside of Canada and, as a result, it may not be possible to satisfy a judgment against us or those persons in Canada or to enforce a judgment obtained in Canadian courts against us or those persons outside of Canada.
Taxation and Eligibility for Investment
Canadian purchasers of common stock should consult their own legal and tax advisors with respect to the tax consequences of an investment in the common stock in their particular circumstances and about the eligibility of the common stock for investment by the purchaser under relevant Canadian legislation.
The validity of the shares of common stock offered by this prospectus will be passed upon by Goodwin Procter LLP, Boston, Massachusetts. The underwriters have been represented by Cravath, Swaine & Moore LLP, New York, New York.
The consolidated financial statements included in this prospectus and the related financial statement schedules included elsewhere in the registration statement have been audited by Deloitte & Touche LLP, independent auditors, as stated in their reports appearing herein and elsewhere in the registration statement (which reports express an unqualified opinion and include an explanatory paragraph referring to a retroactive change in presentation of Perini’s joint ventures in the consolidated balance sheets from the equity method to the proportionate consolidation method and the restatement of basic and diluted earnings per share for the year ended December 31, 2000), and have been soare included in reliance upon the reports of such firm given upon their authority as experts in accounting and auditing.
WHERE YOU CAN FIND MORE INFORMATION
We are subject to the informational requirements of the Securities Exchange Act of 1934, as amended, and file reports, proxy statements and other information with the Securities and Exchange Commission. We have also filed with the Securities and Exchange Commission a registration statement on Form S-1 to register our common stock. This prospectus, which forms part of the registration statement, does not contain all of the information included in the registration statement. For further information about us and our common stock offered in this prospectus, you should refer to the registration statement and its exhibits. You may read and copy the registration statement and any other document we file with the Securities and Exchange Commission at the Securities and Exchange Commission’s Public Reference Room, 450 Fifth Street, N.W., Washington, D.C. 20549. Please call the Securities and Exchange Commission at 1-800-SEC-0330 for further information on the operation of the Public Reference Room. In addition, the Securities and Exchange Commission maintains a web site that contains registration statements, reports, proxy statements and other information regarding registrants, such as us, that file electronically with the Securities and Exchange Commission. The address of the web site is www.sec.gov. Except for the registration statement and its exhibits, the information we file with the Securities and Exchange Commission is not included or incorporated in the registration statement and should not be relied upon by potential investors in determining whether to purchase shares of our common stock in this offering.
Our common stock is listed on the American Stock Exchange under the symbol “PCR,” and you may also read and copy the documents referenced above at the offices of the American Stock Exchange, 86 Trinity Place, New York, New York 10006. We have applied for the listing of our common stock on the New York Stock Exchange. We expect our common stock to begin trading on the New York Stock Exchange in April 2004 under the symbol “PCR.”
INDEXTO CONSOLIDATED FINANCIAL STATEMENTS
| Page | ||
| AUDITED FINANCIAL STATEMENTS | ||
| F-2 | ||
Consolidated Balance Sheets as of December 31, | F-3 | |
Consolidated Statements of Income for the year ended December 31, 2003, 2002 | F-4 | |
| F-5 | ||
Consolidated Statements of Cash Flows for the year ended December 31, 2003, 2002 | F-6 | |
| F-7 | ||
| ||
To the Stockholders of Perini Corporation:
We have audited the accompanying consolidated balance sheets of PERINI CORPORATION (a Massachusetts corporation)Perini Corporation and subsidiariesSubsidiaries (collectively, the “Company”) as of December 31, 20022003 and 2001,2002, and the related consolidated statements of income, stockholders’ equity and cash flows for each of the three years in the period ended December 31, 2002.2003. These financial statements are the responsibility of the Company’s management. Our responsibility is to express an opinion on these financial statements based on our audits.
We conducted our audits in accordance with auditing standards generally accepted in the United States of America.States. Those standards require that we plan and perform the audit to obtain reasonable assurance about whether the financial statements are free of material misstatement. An audit includes examining, on a test basis, evidence supporting the amounts and disclosures in the financial statements. An audit also includes assessing the accounting principles used and significant estimates made by management, as well as evaluating the overall financial statement presentation. We believe that our audits provide a reasonable basis for our opinion.
In our opinion, the consolidated financial statements referred to above present fairly, in all material respects, the financial position of Perini Corporation and subsidiaries as of December 31, 20022003 and 2001,2002, and the results of their operations and their cash flows for each of the three years in the period ended December 31, 2002,2003, in conformity with accounting principles generally accepted in the United States of America.
As discussed in Note (1)(b) to the consolidated financial statements, in 2002 the Company changed its method of reporting its interests in construction joint ventures in the Consolidated Balance Sheets from the equity method to the proportionate consolidation method and retroactively restated the 2001 and 2000 consolidated financial statements for the change. As discussed in Note (1)(i) to the consolidated financial statements, basic and diluted earnings per share for the year ended December 31, 2000 have been restated.States.
DELOITTE & TOUCHE LLP
Boston, Massachusetts
March 21, 200311, 2004
December 31, 20022003 and 20012002
(In thousands, except share data)
| 2002 | 2001 | 2003 | 2002 | |||||||||||||
Assets | ||||||||||||||||
CURRENT ASSETS: | ||||||||||||||||
Cash, including cash equivalents of $30,042 and $36,686 (Note 1) | $ | 47,031 | $ | 56,542 | ||||||||||||
Accounts and notes receivable, including retainage of $66,284 and $97,610 | 218,172 | 318,174 | ||||||||||||||
Cash, including cash equivalents of $60,462 and $30,042 (Note 1) | $ | 67,823 | $ | 47,031 | ||||||||||||
Accounts and notes receivable, including retainage of $86,273 and $66,284 | 328,025 | 218,172 | ||||||||||||||
Unbilled work (Note 1) | 112,563 | 97,425 | 116,572 | 112,563 | ||||||||||||
Land held for sale, net (Note 5) | 2,173 | 11,740 | ||||||||||||||
Deferred tax asset (Note 5) | 10,844 | – | ||||||||||||||
Other current assets | 1,992 | 1,949 | 2,479 | 4,165 | ||||||||||||
Total current assets | $ | 381,931 | $ | 485,830 | $ | 525,743 | $ | 381,931 | ||||||||
PROPERTY AND EQUIPMENT, at cost (Note 1): | ||||||||||||||||
Land | $ | 489 | $ | 489 | $ | 1,041 | $ | 489 | ||||||||
Buildings and improvements | 13,496 | 12,850 | 16,685 | 13,496 | ||||||||||||
Construction equipment | 12,338 | 10,240 | 12,428 | 12,338 | ||||||||||||
Other equipment | 7,577 | 7,594 | 8,569 | 7,577 | ||||||||||||
| $ | 33,900 | $ | 31,173 | $ | 38,723 | $ | 33,900 | |||||||||
Less – Accumulated depreciation | 19,858 | 18,768 | 22,125 | 19,858 | ||||||||||||
Total property and equipment, net | $ | 14,042 | $ | 12,405 | $ | 16,598 | $ | 14,042 | ||||||||
OTHER ASSETS (Notes 5 and 6) | $ | 6,416 | $ | 3,006 | ||||||||||||
OTHER ASSETS: | ||||||||||||||||
Goodwill (Notes 1 and 3) | $ | 14,007 | $ | 1,017 | ||||||||||||
Deferred tax asset (Note 5) | 4,161 | – | ||||||||||||||
Other (Note 6) | 4,934 | 5,399 | ||||||||||||||
Total other assets | $ | 23,102 | $ | 6,416 | ||||||||||||
| $ | 402,389 | $ | 501,241 | $ | 565,443 | $ | 402,389 | |||||||||
Liabilities and Stockholders’ Equity | ||||||||||||||||
CURRENT LIABILITIES: | ||||||||||||||||
Current maturities of long-term debt (Note 3) | $ | 416 | $ | 10,249 | ||||||||||||
Accounts payable, including retainage of $37,357 and $72,275 | 162,456 | 265,008 | ||||||||||||||
Current maturities of long-term debt (Note 4) | $ | 490 | $ | 416 | ||||||||||||
Accounts payable, including retainage of $64,141 and $37,357 | 318,448 | 162,456 | ||||||||||||||
Deferred contract revenue (Note 1) | 65,868 | 72,129 | 48,431 | 65,868 | ||||||||||||
Accrued expenses | 37,283 | 45,075 | 32,977 | 37,283 | ||||||||||||
Total current liabilities | $ | 266,023 | $ | 392,461 | $ | 400,346 | $ | 266,023 | ||||||||
LONG-TERM DEBT, less current maturities included above (Note 3) | $ | 12,123 | $ | 7,540 | ||||||||||||
LONG-TERM DEBT, less current maturities included above (Note 4) | $ | 8,522 | $ | 12,123 | ||||||||||||
OTHER LONG-TERM LIABILITIES (Notes 6, 8 and 10) | $ | 37,594 | $ | 21,832 | $ | 36,015 | $ | 37,594 | ||||||||
CONTINGENCIES AND COMMITMENTS (Note 2) | ||||||||||||||||
STOCKHOLDERS’ EQUITY (Notes 1, 7, 8, 9 and 10): | ||||||||||||||||
Preferred stock, $1 par value - | ||||||||||||||||
Authorized – 1,000,000 shares | ||||||||||||||||
Designated, issued and outstanding – 99,990 shares of $21.25 convertible exchangeable preferred stock ($24,998 aggregate liquidation preference) | $ | 100 | $ | 100 | ||||||||||||
Designated – 100,000 shares Issued and outstanding – 55,927 shares and 99,990 shares of $21.25 convertible exchangeable preferred stock ($13,982 aggregate liquidation preference at December 31, 2003) | $ | 56 | $ | 100 | ||||||||||||
Series A junior participating preferred stock, $1 par value - | ||||||||||||||||
Designated – 200,000 shares | ||||||||||||||||
Issued – none | — | — | — | — | ||||||||||||
Stock purchase warrants | 2,233 | 2,233 | 2,233 | 2,233 | ||||||||||||
Common stock, $1 par value - | ||||||||||||||||
Authorized – 40,000,000 shares | ||||||||||||||||
Issued – 22,724,664 shares | 22,725 | 22,725 | ||||||||||||||
Issued – 22,946,064 shares and 22,724,664 shares | 22,946 | 22,725 | ||||||||||||||
Paid-in surplus | 95,546 | 97,671 | 90,296 | 95,546 | ||||||||||||
Retained earnings (deficit) | (13,417 | ) | (36,491 | ) | 30,007 | (13,417 | ) | |||||||||
Less – common stock in treasury, at cost – 60,529 shares | (965 | ) | (965 | ) | (965 | ) | (965 | ) | ||||||||
| $ | 106,222 | $ | 85,273 | $ | 144,573 | $ | 106,222 | |||||||||
Accumulated other comprehensive loss | (19,573 | ) | (5,865 | ) | (24,013 | ) | (19,573 | ) | ||||||||
Total stockholders’ equity | $ | 86,649 | $ | 79,408 | $ | 120,560 | $ | 86,649 | ||||||||
| $ | 402,389 | $ | 501,241 | $ | 565,443 | $ | 402,389 | |||||||||
The accompanying notes are an integral part of these consolidated financial statements.
Consolidated Statements of Income
For the Years Ended December 31, 2003, 2002 2001 and 20002001
(In thousands, except per share data)
| 2002 | 2001 | 2000 | 2003 | 2002 | 2001 | |||||||||||||||||
Revenues (Note 12) | $ | 1,085,041 | $ | 1,553,396 | $ | 1,105,660 | ||||||||||||||||
Revenues (Note 11) | $ | 1,374,103 | $ | 1,085,041 | $ | 1,553,396 | ||||||||||||||||
Cost of Operations | 1,026,391 | 1,495,834 | 1,053,328 | 1,303,851 | 1,026,391 | 1,495,834 | ||||||||||||||||
Gross Profit | $ | 58,650 | $ | 57,562 | $ | 52,332 | $ | 70,252 | $ | 58,650 | $ | 57,562 | ||||||||||
General and Administrative Expenses | 32,770 | 28,061 | 24,977 | 39,762 | 32,770 | 28,061 | ||||||||||||||||
INCOME FROM OPERATIONS (Note 12) | $ | 25,880 | $ | 29,501 | $ | 27,355 | ||||||||||||||||
INCOME FROM CONSTRUCTION OPERATIONS (Note 11) | $ | 30,490 | $ | 25,880 | $ | 29,501 | ||||||||||||||||
Other (Income) Expense, Net (Note 6) | 520 | 227 | (949 | ) | (1,435 | ) | 520 | 227 | ||||||||||||||
Interest Expense (Note 3) | 1,485 | 2,006 | 3,966 | |||||||||||||||||||
Interest Expense (Note 4) | 1,003 | 1,485 | 2,006 | |||||||||||||||||||
Income before Income Taxes | $ | 23,875 | $ | 27,268 | $ | 24,338 | $ | 30,922 | $ | 23,875 | $ | 27,268 | ||||||||||
Provision (Credit) for Income Taxes (Notes 1 and 4) | 801 | 850 | (43 | ) | ||||||||||||||||||
Credit (Provision) for Income Taxes (Notes 1 and 5) | 13,096 | (801 | ) | (850 | ) | |||||||||||||||||
NET INCOME | $ | 23,074 | $ | 26,418 | $ | 24,381 | $ | 44,018 | $ | 23,074 | $ | 26,418 | ||||||||||
NET INCOME AVAILABLE FOR COMMON STOCKHOLDERS (Note 1) | $ | 20,949 | $ | 24,293 | $ | 7,299 | ||||||||||||||||
Less: Accrued Dividends on $21.25 Preferred Stock (Note 8) | (1,653 | ) | (2,125 | ) | (2,125 | ) | ||||||||||||||||
Plus: Reversal of Accrued Dividends on $21.25 Preferred Stock based on results of 2003 tender offer (Note 8) | 7,254 | – | – | |||||||||||||||||||
NET INCOME AVAILABLE FOR COMMON STOCKHOLDERS | $ | 49,619 | $ | 20,949 | $ | 24,293 | ||||||||||||||||
BASIC EARNINGS PER COMMON SHARE (Note 1) | $ | 0.92 | $ | 1.07 | $ | 0.39 | $ | 2.18 | $ | 0.92 | $ | 1.07 | ||||||||||
DILUTED EARNINGS PER COMMON SHARE (Note 1) | $ | 0.91 | $ | 1.04 | $ | 0.39 | $ | 2.10 | $ | 0.91 | $ | 1.04 | ||||||||||
WEIGHTED AVERAGE COMMON SHARES OUTSTANDING (Note 1) | ||||||||||||||||||||||
BASIC | 22,763 | 22,664 | 22,623 | |||||||||||||||||||
Effect of Dilutive Stock Options and Warrants Outstanding | 820 | 275 | 819 | |||||||||||||||||||
DILUTED | 23,583 | 22,939 | 23,442 | |||||||||||||||||||
The accompanying notes are an integral part of these consolidated financial statements.
Consolidated Statements of Stockholders’ Equity
For the Years Ended December 31, 2003, 2002 2001 and 20002001
(In thousands, except per share data)
| Preferred Stock | Stock Purchase Warrants | Common Stock | Paid-In Surplus | Retained Earnings (Deficit) | Treasury Stock | Accumulated Other Comprehensive Loss | Total | ||||||||||||||||||||||||||||||||||||||||||||||||||||
Balance - December 31, 1999 | $ | 100 | $ | 2,233 | $ | 5,743 | $ | 43,561 | $ | (87,290 | ) | $ | (965 | ) | $ | — | $ | (36,618 | ) | ||||||||||||||||||||||||||||||||||||||||
Net Income | — | — | — | — | 24,381 | — | — | 24,381 | |||||||||||||||||||||||||||||||||||||||||||||||||||
Preferred Stock dividends accrued ($21.25 per share*) | — | — | — | (2,125 | ) | — | — | — | (2,125 | ) | |||||||||||||||||||||||||||||||||||||||||||||||||
Series B Preferred Stock dividends in kind issued (Note 8) | — | — | — | (1,161 | ) | — | — | — | (1,161 | ) | |||||||||||||||||||||||||||||||||||||||||||||||||
Accretion related to Series B Preferred Stock (Note 8) | — | — | — | (96 | ) | — | — | — | (96 | ) | |||||||||||||||||||||||||||||||||||||||||||||||||
Net proceeds received from issuance of Common Stock (Note 7) | — | — | 9,412 | 27,887 | — | — | — | 37,299 | |||||||||||||||||||||||||||||||||||||||||||||||||||
Exchange of Series B Preferred Stock for Common Stock (Note 7) | — | — | 7,490 | 31,452 | — | — | — | 38,942 | |||||||||||||||||||||||||||||||||||||||||||||||||||
| Preferred Stock | Stock Purchase Warrants | Common Stock | Paid-In Surplus | Retained Earnings (Deficit) | Treasury Stock | Accumulated Other Comprehensive Loss | Total | ||||||||||||||||||||||||||||||||||||||||||||||||||||
Balance - December 31, 2000 | $ | 100 | $ | 2,233 | $ | 22,645 | $ | 99,518 | $ | (62,909 | ) | $ | (965 | ) | $ | — | $ | 60,622 | $ | 100 | $ | 2,233 | $ | 22,645 | $ | 99,518 | $ | (62,909 | ) | $ | (965 | ) | $ | — | $ | 60,622 | |||||||||||||||||||||||
Net Income | — | — | — | — | 26,418 | — | — | 26,418 | — | — | — | — | 26,418 | — | — | 26,418 | |||||||||||||||||||||||||||||||||||||||||||
Other comprehensive income (loss): | |||||||||||||||||||||||||||||||||||||||||||||||||||||||||||
Minimum pension liability (Note 10) | — | — | — | — | — | — | (5,865 | ) | (5,865 | ) | — | — | — | — | — | — | (5,865 | ) | (5,865 | ) | |||||||||||||||||||||||||||||||||||||||
Total comprehensive income | 20,553 | 20,553 | |||||||||||||||||||||||||||||||||||||||||||||||||||||||||
Preferred Stock dividends accrued ($21.25 per share*) | — | — | — | (2,125 | ) | — | — | — | (2,125 | ) | — | — | — | (2,125 | ) | — | — | — | (2,125 | ) | |||||||||||||||||||||||||||||||||||||||
Common Stock options exercised | — | — | 80 | 278 | — | — | — | 358 | — | — | 80 | 278 | — | — | — | 358 | |||||||||||||||||||||||||||||||||||||||||||
Balance - December 31, 2001 | $ | 100 | $ | 2,233 | $ | 22,725 | $ | 97,671 | $ | (36,491 | ) | $ | (965 | ) | $ | (5,865 | ) | $ | 79,408 | $ | 100 | $ | 2,233 | $ | 22,725 | $ | 97,671 | $ | (36,491 | ) | $ | (965 | ) | $ | (5,865 | ) | $ | 79,408 | |||||||||||||||||||||
Net Income | — | — | — | — | 23,074 | — | — | 23,074 | — | — | — | — | 23,074 | — | — | 23,074 | |||||||||||||||||||||||||||||||||||||||||||
Other comprehensive income (loss): | |||||||||||||||||||||||||||||||||||||||||||||||||||||||||||
Minimum pension liability (Note 10) | — | — | — | — | — | — | (13,708 | ) | (13,708 | ) | — | — | — | — | — | — | (13,708 | ) | (13,708 | ) | |||||||||||||||||||||||||||||||||||||||
Total comprehensive income | 9,366 | 9,366 | |||||||||||||||||||||||||||||||||||||||||||||||||||||||||
Preferred Stock dividends accrued ($21.25 per share*) | — | — | — | (2,125 | ) | — | — | — | (2,125 | ) | — | — | — | (2,125 | ) | — | — | — | (2,125 | ) | |||||||||||||||||||||||||||||||||||||||
Balance - December 31, 2002 | $ | 100 | $ | 2,233 | $ | 22,725 | $ | 95,546 | $ | (13,417 | ) | $ | (965 | ) | $ | (19,573 | ) | $ | 86,649 | $ | 100 | $ | 2,233 | $ | 22,725 | $ | 95,546 | $ | (13,417 | ) | $ | (965 | ) | $ | (19,573 | ) | $ | 86,649 | |||||||||||||||||||||
Net Income | — | — | — | — | 44,018 | — | — | 44,018 | |||||||||||||||||||||||||||||||||||||||||||||||||||
Other comprehensive income (loss): | |||||||||||||||||||||||||||||||||||||||||||||||||||||||||||
Minimum pension liability (Note 10) | — | — | — | — | — | — | (4,440 | ) | (4,440 | ) | |||||||||||||||||||||||||||||||||||||||||||||||||
Total comprehensive income | — | — | — | — | — | — | — | 39,578 | |||||||||||||||||||||||||||||||||||||||||||||||||||
Preferred Stock dividends accrued ($21.25 per share*) | — | — | — | (1,048 | ) | (605 | ) | — | — | (1,653 | ) | ||||||||||||||||||||||||||||||||||||||||||||||||
Preferred Stock tendered (Note 8) | (44 | ) | — | — | (11,217 | ) | — | — | — | (11,261 | ) | ||||||||||||||||||||||||||||||||||||||||||||||||
Reversal of dividends previously accrued on Preferred Stock tendered (Note 8) | — | — | — | 7,243 | 11 | — | — | 7,254 | |||||||||||||||||||||||||||||||||||||||||||||||||||
Common Stock options exercised | — | — | 221 | 763 | — | — | — | 984 | |||||||||||||||||||||||||||||||||||||||||||||||||||
Estimated cost of stock registration (Note 15) | — | — | — | (991 | ) | — | — | — | (991 | ) | |||||||||||||||||||||||||||||||||||||||||||||||||
Balance - December 31, 2003 | $ | 56 | $ | 2,233 | $ | 22,946 | $ | 90,296 | $ | 30,007 | $ | (965 | ) | $ | (24,013 | ) | $ | 120,560 | |||||||||||||||||||||||||||||||||||||||||
| * | Equivalent to $2.125 per Depositary Share (see Note 8). |
The accompanying notes are an integral part of these consolidated financial statements.
Consolidated Statements of Cash Flows
For the Years Ended December 31, 2003, 2002 2001 and 20002001
(In thousands)
| 2002 | 2001 | 2000 | 2003 | 2002 | 2001 | |||||||||||||||||||
Cash Flows from Operating Activities: | ||||||||||||||||||||||||
Net income | $ | 23,074 | $ | 26,418 | $ | 24,381 | $ | 44,018 | $ | 23,074 | $ | 26,418 | ||||||||||||
Adjustments to reconcile net income to net cash from operating activities - | ||||||||||||||||||||||||
Depreciation | 2,457 | 1,915 | 1,617 | 2,773 | 2,457 | 1,915 | ||||||||||||||||||
Amortization of deferred debt expense and other deferred expenses | 745 | 687 | 574 | 616 | 745 | 687 | ||||||||||||||||||
Cash provided from (used by) changes in components of working capital other than cash and current maturities of long-term debt: | ||||||||||||||||||||||||
Cash provided from (used by) changes in components of working capital other than cash, current maturities of long-term debt, deferred tax asset and land held for sale, net: | ||||||||||||||||||||||||
(Increase) decrease in: | ||||||||||||||||||||||||
Accounts and notes receivable | 102,322 | (49,253 | ) | (87,467 | ) | |||||||||||||||||||
Accounts receivable | (88,544 | ) | 102,322 | (49,253 | ) | |||||||||||||||||||
Unbilled work | (15,138 | ) | (1,008 | ) | (25,850 | ) | (3,422 | ) | (15,138 | ) | (1,008 | ) | ||||||||||||
Other current assets | (43 | ) | 309 | 2,215 | (333 | ) | (43 | ) | 309 | |||||||||||||||
Increase (decrease) in: | ||||||||||||||||||||||||
Accounts payable | (102,552 | ) | 13,606 | 106,655 | 132,507 | (102,552 | ) | 13,606 | ||||||||||||||||
Deferred contract revenue | (6,261 | ) | 4,159 | (18,658 | ) | (21,211 | ) | (6,261 | ) | 4,159 | ||||||||||||||
Accrued expenses | (7,792 | ) | (18,656 | ) | 3,319 | (5,929 | ) | (7,792 | ) | (18,656 | ) | |||||||||||||
Net deferred tax asset | (15,005 | ) | — | — | ||||||||||||||||||||
Gain on sale of land held for sale | (2,207 | ) | — | — | ||||||||||||||||||||
Other long-term liabilities | (405 | ) | (2,321 | ) | (5,652 | ) | (370 | ) | (405 | ) | (2,321 | ) | ||||||||||||
Other items, net | (39 | ) | (101 | ) | (332 | ) | (317 | ) | (39 | ) | (101 | ) | ||||||||||||
NET CASH (USED BY) PROVIDED FROM OPERATING ACTIVITIES | $ | (3,632 | ) | $ | (24,245 | ) | $ | 802 | ||||||||||||||||
NET CASH PROVIDED FROM (USED BY) OPERATING ACTIVITIES | $ | 42,576 | $ | (3,632 | ) | $ | (24,245 | ) | ||||||||||||||||
Cash Flows from Investing Activities: | ||||||||||||||||||||||||
Acquisitions of James A. Cummings, Inc., net of cash balance acquired | $ | (8,613 | ) | $ | — | $ | — | |||||||||||||||||
Acquisition of property and equipment | (5,399 | ) | (4,510 | ) | (4,528 | ) | ||||||||||||||||||
Proceeds from sale of property and equipment | $ | 455 | $ | 199 | $ | 435 | 793 | 455 | 199 | |||||||||||||||
Acquisition of property and equipment | (4,510 | ) | (4,528 | ) | (1,793 | ) | ||||||||||||||||||
Proceeds from (investment in) land held for sale, net | 4,072 | (1,126 | ) | 2,081 | 4,996 | 4,072 | (1,126 | ) | ||||||||||||||||
Proceeds from sale of marketable securities | 380 | — | — | |||||||||||||||||||||
Investment in other activities | (646 | ) | (57 | ) | (609 | ) | (37 | ) | (646 | ) | (57 | ) | ||||||||||||
NET CASH (USED BY) PROVIDED FROM INVESTING ACTIVITIES | $ | (629 | ) | $ | (5,512 | ) | $ | 114 | ||||||||||||||||
NET CASH USED BY INVESTING ACTIVITIES | $ | (7,880 | ) | $ | (629 | ) | $ | (5,512 | ) | |||||||||||||||
Cash Flows from Financing Activities: | ||||||||||||||||||||||||
Proceeds from issuance of common stock, net | $ | — | $ | — | $ | 37,299 | ||||||||||||||||||
Purchase of preferred stock pursuant to tender offer | $ | (11,261 | ) | $ | — | $ | — | |||||||||||||||||
Proceeds from long-term debt | 5,000 | 572 | 7,757 | 1,883 | 5,000 | 572 | ||||||||||||||||||
Reduction of long-term debt | (10,250 | ) | (10,399 | ) | (53,390 | ) | (5,410 | ) | (10,250 | ) | (10,399 | ) | ||||||||||||
Proceeds from exercise of common stock options | — | 358 | — | 984 | — | 358 | ||||||||||||||||||
Expenditure for stock registration | (100 | ) | — | — | ||||||||||||||||||||
NET CASH USED BY FINANCING ACTIVITIES | $ | (5,250 | ) | $ | (9,469 | ) | $ | (8,334 | ) | $ | (13,904 | ) | $ | (5,250 | ) | $ | (9,469 | ) | ||||||
Net Decrease in Cash | $ | (9,511 | ) | $ | (39,226 | ) | $ | (7,418 | ) | |||||||||||||||
Net Increase (Decrease) in Cash | $ | 20,792 | $ | (9,511 | ) | $ | (39,226 | ) | ||||||||||||||||
Cash and Cash Equivalents at Beginning of Year | 56,542 | 95,768 | 103,186 | 47,031 | 56,542 | 95,768 | ||||||||||||||||||
Cash and Cash Equivalents at End of Year (Note (1)(j) | $ | 47,031 | $ | 56,542 | $ | 95,768 | ||||||||||||||||||
Cash and Cash Equivalents at End of Year (Note (1)(j)) | $ | 67,823 | $ | 47,031 | $ | 56,542 | ||||||||||||||||||
Supplemental Disclosures of Cash Paid During the Year For: | ||||||||||||||||||||||||
Interest | $ | 2,441 | $ | 2,063 | $ | 4,242 | $ | 1,060 | $ | 2,441 | $ | 2,063 | ||||||||||||
Income tax payments | $ | 1,885 | $ | 1,130 | $ | 1,320 | $ | 974 | $ | 1,885 | $ | 1,130 | ||||||||||||
Supplemental Disclosure of Noncash Transactions: | ||||||||||||||||||||||||
Dividends paid in shares of Series B Preferred Stock (Note 8) | $ | — | $ | — | $ | 1,161 | ||||||||||||||||||
Exchange of Series B Preferred Stock into Common Stock at $5.50 per share (Note 7) | $ | — | $ | — | $ | 38,942 | ||||||||||||||||||
The accompanying notes are an integral part of these consolidated financial statements.
NOTES TO CONSOLIDATED FINANCIAL STATEMENTS
For the Years Ended December 31, 2003, 2002 2001 and 20002001
[1] Summary of Significant Accounting Policies
[a] Nature of Business
The Company was incorporated in 1918 as a successor to businesses which had been engaged in providing construction services since 1894. The Company currently provides diversified general contracting, construction management and design-build services to private clients and public agencies throughout the United States and selected overseas locations.world. The Company’s construction business involves twois now conducted through three basic segments or operations: building, civil and civil.management services. The Company offers general building and civil contracting, services provided by the Company consist ofpreconstruction planning and comprehensive project management services, including the planning and scheduling of the manpower, equipment, materials and subcontractors required for the timely completion of a project in accordance with the terms and specifications contained in a construction contract. The Company also offers self-performed construction services, including site work, concrete forming and placement and steel erection. The Company provides these services by using traditional general contracting arrangements, such as fixed price, guaranteed maximum price and cost plus award fee contracts and, to a lesser extent, construction management or design-build contracting arrangements.
In an effort to limit its financial and/or operational risk on certain large or complex projects, the Company participates in construction joint ventures, often as sponsor or manager of the project, for the purpose of bidding and, if awarded, providing the agreed upon construction services. Each participant usually agrees in advance to provide a predetermined percentage of capital, as required, and to share in the same percentage of profit or loss of the project.
[b] Principles of Consolidation
The consolidated financial statements include the accounts of Perini Corporation and its wholly owned subsidiaries (the “Company”). All significant intercompany transactions and balances have been eliminated in consolidation.
Prior to 2002, theThe Company’s interests in construction joint ventures were accounted for on the equity method in the Consolidated Balance Sheets and on the proportionate consolidation method in the Consolidated Statements of Income. Beginning in 2002, construction joint venture interests are accounted for using the proportionate consolidation method in the Consolidated Balance Sheets as well as the Consolidated Statements of Income, whereby the Company’s proportionate share of each joint venture’s assets, liabilities, revenues and cost of operations are included in the appropriate classifications in the consolidated financial statements. The Company believes the change, which results in presenting all joint venture activity using a consistent methodology in both the Consolidated Balance SheetsAll significant intercompany transactions and Consolidated Statements of Income, is preferable.
Although this change impacted various classifications within Current Assets and Current Liabilities in the Consolidated Balance Sheets and the Consolidated Statements of Cash Flows, it had no impact on net working capital or other categories of long-term assets or liabilities in the Consolidated Balance Sheets. It also had no impact on the Consolidated Statements of Income or basic or diluted earnings per common share for any period presented. Prior year Consolidated Balance Sheets and Consolidated Statements of Cash Flowsbalances have been restated to conform to the 2002 presentation.eliminated in consolidation.
[c] Use of Estimates
The preparation of financial statements in conformity with accounting principles generally accepted in the United States requires management to make estimates and assumptions that affect the reported amounts of assets and liabilities and disclosure of contingent assets and liabilities at the date of the financial statements and the reported amounts of revenues and expenses during the reporting period. The Company’s construction business involves making significant estimates and assumptions in the normal course of business relating to its Companycontracts and joint venture construction contracts due to, among other things, the one-of-a-kind nature of most of its
NOTES TO CONSOLIDATED FINANCIAL STATEMENTS
For projects, the Years Ended December 31, 2002, 2001 and 2000 (continued)
[1] Summary of Significant Accounting Policies (continued)
[c] Use of Estimates (continued)
projects, long-term duration of its contract cycle and the type of contract utilized. The most significant estimates with regard to these financial statements relate to the estimating of total forecasted construction contract revenues, costs and profits in accordance with accounting for long-term contracts (see Note 1(d) below) and estimating potential liabilities in conjunction with certain contingencies, including the outcome of pending or future litigation, arbitration or other dispute resolution proceedings (seerelating to contract claims. (See Note 2 below).below.) Actual results could differ in the near term from these estimates and such differences could have a material adverse effect on the Company’s financial condition, results of operations and cash flows.be material.
[d] Method of Accounting for Contracts
Revenues and profits from the Company’s contracts and construction joint venture contracts are generally recognized by applying percentages of completion for the period to the total estimated profits for the respective
NOTES TO CONSOLIDATED FINANCIAL STATEMENTS
For the Years Ended December 31, 2003, 2002 and 2001 (continued)
[1] Summary of Significant Accounting Policies (continued)
[d] Method of Accounting for Contracts(continued)
contracts. The percentagesPercentage of completion areis determined by relating the actual cost of the work performed to date to the current estimated total cost of the respective contracts. However, on construction management contracts, profit is generally recognized in accordance with the contract terms, usually on the as billed method, which is generally consistent with the level of effort incurred over the contract period. When the estimate on a contract indicates a loss, the Company’s policy is to record the entire loss during the accounting period in which it is estimated. In the ordinary course of business, at a minimum on a quarterly basis, the Company prepares updated estimates of the total forecasted revenue, cost and profit or loss for each contract. The cumulative effect of revisions in estimates of the total cost orforecasted revenue and costs, including unapproved change orders and claims, during the course of the work is reflected in the accounting period in which the facts that caused the revision become known. The financial impact of these revisions to any one contract is a function of both the amount of the revision and the percentage of completion of the contract. An amount equal to the costs incurred which are attributable to unapproved change orders and claims is included in the total estimated revenue when realization is probable. Profit from unapproved change orders and claims is recorded in the period such amounts are resolved.
In accordance with normal practice in the construction industry, the Company includes in current assets and current liabilities amounts related to construction contracts realizable and payable over a period in excess of one year. Deferred contract revenue represents the excess of billings to date over the amount of contract costs and profits (or contract revenue) recognized to date on the percentage of completion accounting method on certain contracts. Unbilled work represents the excess of contract costs and profits (or contract revenue) recognized to date on the percentage of completion accounting method over billings to date on the remaining contracts. Unbilled work results when (1) the appropriate contract revenue amount has been recognized in accordance with the percentage of completion accounting method, but a portion of the revenue recorded cannot be billed currently due to the billing terms defined in the contract and/or (2) costs, recorded at estimated realizable value, related to unapproved change orders or claims are incurred. Unbilled work related to the Company’s contracts and joint venture contracts at December 31, 20022003 and 2001,2002, consisted of the following (in thousands):
| 2002 | 2001 | 2003 | 2002 | |||||||||||
Unbilled costs and profits incurred to date | $ | 19,498 | * | $ | 23,784 | * | ||||||||
Unbilled costs and profits incurred to date* | $ | 34,121 | $ | 19,498 | ||||||||||
Unapproved change orders | 30,289 | 25,638 | 17,936 | 30,289 | ||||||||||
Claims | 62,776 | 48,003 | 64,515 | 62,776 | ||||||||||
| $ | 112,563 | $ | 97,425 | $ | 116,572 | $ | 112,563 | |||||||
| * | Represents the excess of contract costs and profits recognized to date on the percentage of completion accounting method over billings to date on certain contracts. |
Of the balance of “unapproved change orders” and “claims” included above in unbilled work at December 31, 2003 and December 31, 2002 approximately $36.0 and $40.0 million respectively, are amounts subject to pending litigation or dispute resolution proceedings as described in Item 3—“Legal Proceedings” and Note 2, “Contingencies and Commitments” of Notes to Consolidated Financial Statements for the respective periods. These amounts are management’s estimate of the probable recovery from the disputed claims considering such factors as evaluation of entitlement, settlements reached to date and knowledge of customer. In the event that future facts and circumstances, including the resolution of disputed claims, cause us to reduce the aggregate amount of our estimated probable recovery from the disputed claims, we will record the amount of such reduction against future earnings in the relevant period.
NOTES TO CONSOLIDATED FINANCIAL STATEMENTS
For the Years Ended December 31, 2003, 2002 and 2001 (continued)
[1] Summary of Significant Accounting Policies (continued)
[d] Method of Accounting for Contracts(continued)
The prerequisite for billing “Unbilled costs and profits incurred to date” is provided in the defined billing terms of each of the applicable contracts. The prerequisite for billing “Unapproved change orders” or “Claims” is the final resolution and agreement between the parties. The amount of unbilled work at December 31, 20022003 estimated by management to be collected beyond one year is approximately $22.1$19.0 million.
NOTES TO CONSOLIDATED FINANCIAL STATEMENTS
For the Years Ended December 31, 2002, 2001 and 2000 (continued)
[1] Summary of Significant Accounting Policies (continued)
[e] Property and Equipment
Land, buildings and improvements, construction and computer-related equipment and other equipment are recorded at cost. Depreciation is provided primarily using accelerated methods for construction and computer-related equipment over lives from three to seven years and the straight-line method for the remaining depreciable property over lives from three to thirty years.
[f] Long-Lived Assets
Long-lived assets are reviewed for impairment whenever events or changes in circumstances indicate that the carrying value may not be recoverable. Recoverability is evaluated by comparing the carrying value of the asset to the undiscounted cash flows associated with the affected assets. When this comparison indicates that the carrying value of the asset is greater than the undiscounted cash flows, a loss is recognized for the difference between the carrying value and estimated fair value. Fair value is determined based on market quotes, if available, or is based on valuation techniques.
[g] Goodwill
Effective January 1,As of December 31, 2002, the accounting for goodwill changed to comply with SFAS No. 142, “Goodwill and Other Intangible Assets.” Goodwill in the amount of approximately $1$1.0 million iswas included in “Other Assets” in the accompanying Consolidated Balance Sheets and representsrepresented the excess of the costs of subsidiaries acquired over the fair value of their net assets as of the dates of acquisition (seeacquisition. Effective January 1, 2003, the Company acquired 100% of the outstanding stock of James A. Cummings, Inc., a privately held construction company based in Ft. Lauderdale, FL. (See Note 6). While these amounts were being amortized on3.) As a straight-line basis over 40 years through 2001 at an annual rateresult of $63,000, amortizationthis transaction, approximately $13.0 million of additional goodwill was discontinuedrecorded in 2002 in2003, bringing the total amount of goodwill to approximately $14.0 million as of December 31, 2003.
In accordance with SFAS No. 142. Goodwill is now subject to an assessment142, “Goodwill and Other Intangible Assets”, the Company assesses the amount of goodwill for impairment by applying a fair value test, at a minimum, on an annual basis.annually as of December 31. Based on the initial and annual impairment tests completed during 2002 and 2003, the Company concluded that goodwill was not impaired. Therefore, the implementation of SFAS No. 142 did not have a material impact on the Company’s financial statements.
[h] Income Taxes
The Company accounts for income taxes in accordance with SFAS No. 109, “Accounting for Income Taxes,” (seeTaxes”. (See Note 4)5). Deferred income tax assets and liabilities are recognized for the effects of temporary differences between the financial statement carrying amounts and the income tax basis of assets and liabilities using enacted tax rates.rates expected to be in effect when such differences reverse. In addition, future tax benefits, such as net operating loss carryforwards, are recognized currently to the extent such benefits are more likely than not to be realized as an economic benefit in the form of a reduction of income taxes in future years.
NOTES TO CONSOLIDATED FINANCIAL STATEMENTS
For the Years Ended December 31, 2003, 2002 and 2001 (continued)
[1] Summary of Significant Accounting Policies (continued)
[i] Earnings Per Common Share
Earnings per common share amounts were calculated in accordance with SFAS No. 128, “Earnings Per Share.”per Share”. Basic earnings per common share (“EPS”) was computed by dividing net income less dividends other requirements related toaccrued on the $21.25 Preferred Stock during all years presented plus the reversal in 2003 of approximately $7.3 million of previously accrued and the lossunpaid dividends on the induced conversion$21.25 Preferred Stock no longer required based on the results of Series B Preferredthe tender offer completed in 2000June 2003 (see Notes 8 and 14) by the weighted average number of common shares outstanding. Diluted earnings per common share was similarly computed byafter giving consideration to the dilutive effect to all dilutive potentialof stock options and warrants outstanding on the weighted average number of common shares outstanding. For all
Options to purchase 135,000 shares of the applicable periods presented, the assumed conversionCommon Stock at a price of the Company’s Depositary Convertible Exchangeable Preferred Shares, Series B Preferred Shares and Stock Purchase Warrants into common stock was$8.66 per share were outstanding at December 31, 2003, but were not included in the computation of diluted earnings per common share sincebecause the effect would be antidilutive.
NOTES TO CONSOLIDATED FINANCIAL STATEMENTS
Foroptions’ exercise price was greater than the Years Endedaverage market price of the Common Stock. Options to purchase 3,172,834 shares of Common Stock at prices ranging from $4.50 to $8.66 per share were outstanding at December 31, 2002, 2001 and 2000 (continued)
[1] Summary of Significant Accounting Policies (continued)
[i] Earnings Per Common Share (continued)
Basic and diluted earnings per common share for each of the three yearsbut were not included in the period ending December 31, 2002 are calculated as follows (in thousands except per share amounts):
| 2002 | 2001 | 2000, As Restated | ||||||||||
Net Income | $ | 23,074 | $ | 26,418 | $ | 24,381 | ||||||
Less: | ||||||||||||
Accrued dividends on $21.25 Preferred Stock (Note 8) | $ | (2,125 | ) | $ | (2,125 | ) | $ | (2,125 | ) | |||
Dividends declared on Series B Preferred Stock (Note 8) | — | — | (1,161 | ) | ||||||||
Accretion deduction required to reinstate mandatory redemption value of Series B Preferred Stock over a period of 8-10 years (Note 8) | — | — | (96 | ) | ||||||||
Loss on the induced conversion of Series B Preferred (Note 7) | — | — | (13,700 | ) | ||||||||
| $ | (2,125 | ) | $ | (2,125 | ) | $ | (17,082 | ) | ||||
Net income available for common stockholders | $ | 20,949 | $ | 24,293 | $ | 7,299 | ||||||
Weighted average shares outstanding for basic EPS | 22,664 | 22,623 | 18,521 | |||||||||
Effect of dilutive stock options outstanding | 275 | 819 | 6 | |||||||||
Weighted average shares outstanding for diluted EPS | 22,939 | 23,442 | 18,527 | |||||||||
Basic earnings per Common Share | $ | 0.92 | $ | 1.07 | $ | 0.39 | ||||||
Diluted earnings per Common Share | $ | 0.91 | $ | 1.04 | $ | 0.39 | ||||||
Subsequent to the issuancecomputation of the 2001 financial statements, management has determined that EITF D-42,The Effect on the Calculation of Earnings per Share for the Redemption or Induced Conversion of Preferred Stock, required that the fair value of the common shares issued in excess of the common shares issuable under the original conversion terms as a result of the recapitalization discussed in Note 7, should have been subtracted from net income to determine net earnings available for common stockholders for the purpose of computing earnings per share. This charge had previously been excluded from the calculation. Accordingly, actual basic and diluted earnings per share for 2000 have been restatedbecause the options’ exercise price was greater than the average market price of the Common Stock. Options to purchase 574,000 shares of Common Stock at prices ranging from $1.13$8.10 to $16.44 were outstanding at December 31, 2001 but were not included in the computation of diluted earnings per share to $0.39 per share.because the options’ exercise price was greater than the average market price of the Common Stock. In addition, the effect of the assumed conversion of the Company’s outstanding $21.25 Preferred Stock into Common Stock is antidilutive for all years presented and the effect of the assumed conversion of the Company’s Stock Purchase Warrants is antidilutive for 2002 and 2001.
[j] Cash and Cash Equivalents
Cash equivalents include short-term, highly liquid investments with original maturities of three months or less.
Cash and cash equivalents as reported in the accompanying Consolidated Balance Sheets consist of amounts held by the Company that are available for general corporate purposes and the Company’s proportionate share of amounts held by construction joint ventures that are available only for joint venture-related uses. Cash held by construction joint ventures is distributed from time to time to the Company and to the other joint venture participants in accordance with their percentage interest after the joint venture partners determine that a cash distribution is prudent. Cash distributions received by the Company from its construction joint ventures are then available for general corporate purposes. At December 31, 20022003 and 2001,2002, cash and cash equivalents consisted of the following (in thousands):
| 2002 | 2001 | 2003 | 2002 | |||||||||
Corporate cash and cash equivalents (available for general corporate purposes) | $ | 11,220 | $ | 7,164 | $ | 33,426 | $ | 11,220 | ||||
Company’s share of joint venture cash and cash equivalents (available only for joint venture purposes, including future distributions) | 35,811 | 49,378 | 34,397 | 35,811 | ||||||||
| $ | 47,031 | $ | 56,542 | $ | 67,823 | $ | 47,031 | |||||
NOTES TO CONSOLIDATED FINANCIAL STATEMENTS
For the Years Ended December 31, 2003, 2002 and 2001 and 2000—(continued)
[1] Summary of Significant Accounting Policies (continued)
[k] Stock-Based Compensation
The Company accounts for stock options granted to employees and directors using the intrinsic value method prescribed in Accounting Principles Board Opinion No. 25, “Accounting for Stock Issued to Employees,”Employees”, and related Interpretations. No stock-based employee compensation cost is reflected in net income since all stock options granted by the Company had an exercise price equal to or greater than the fair market value of the underlying common stock on the date of grant. The following table illustrates the effect on net income and earnings per share if the Company had applied the fair value recognition provisions of SFAS No. 123, “Accounting for Stock-Based Compensation,”Compensation”, to stock-based employee and director compensation (in thousands). The effect of applying SFAS No. 123 in this pro forma disclosure may not be indicative of future charges.
| Year Ended December 31, | Year Ended December 31, | ||||||||||||||||||||||
| 2002 | 2001 | 2000 | 2003 | 2002 | 2001 | ||||||||||||||||||
Net income, as reported | $ | 23,074 | $ | 26,418 | $ | 24,381 | $ | 44,018 | $ | 23,074 | $ | 26,418 | |||||||||||
Plus: Total stock-based employee compensation recognized under APB No. 25 | — | — | — | ||||||||||||||||||||
Less: Total stock-based employee compensation expense determined under fair value based method for all awards | (2,831 | ) | (2,846 | ) | (3,194 | ) | — | (2,831 | ) | (2,846 | ) | ||||||||||||
Net income, pro forma | $ | 20,243 | $ | 23,572 | $ | 21,187 | $ | 44,018 | $ | 20,243 | $ | 23,572 | |||||||||||
Basic earnings per share: | |||||||||||||||||||||||
As reported (see Note (1)(i)) | $ | 0.92 | $ | 1.07 | $ | 0.39 | |||||||||||||||||
As reported | $ | 2.18 | $ | 0.92 | $ | 1.07 | |||||||||||||||||
Pro forma | $ | 0.80 | $ | 0.94 | $ | 0.22 | $ | 2.18 | $ | 0.80 | $ | 0.94 | |||||||||||
Diluted earnings per share: | |||||||||||||||||||||||
As reported (see Note (1)(i)) | $ | 0.91 | $ | 1.04 | $ | 0.39 | |||||||||||||||||
As reported | $ | 2.10 | $ | 0.91 | $ | 1.04 | |||||||||||||||||
Pro forma | $ | 0.79 | $ | 0.91 | $ | 0.22 | $ | 2.10 | $ | 0.79 | $ | 0.91 | |||||||||||
[l] Fair Value of Financial Instruments
The carrying amount of cash and cash equivalents approximate fair value due to the short term nature of these items. The carrying value of receivables and other amounts arising out of normal contract activities, including retentions, which may be settled beyond one year, is estimated to approximate fair value. See Note 3, “Financial Commitments”4 for disclosure of the fair value of long-term debt.
[m] Reclassifications
Certain prior year amounts have been reclassified to be consistent with the current year classifications.
[n] New Accounting Pronouncements
In June 2002,January 2003, the Financial Accounting Standards BoardFASB issued FIN No. 46, “Consolidation of Variable Interest Entities, an Interpretation of ARB 51”. In December 2003, the FASB revised FIN No. 46 to reflect decisions it made regarding a number of implementation issues. FIN No. 46, addresses consolidation by business enterprises of variable interest entities (“FASB”VIEs”) issued SFAS No. 146, “Accounting for Costs Associated with Exit. FIN 46 applies immediately to variable interest entities created or Disposal Activities.” The FASB also issued SFAS No. 148, “Accounting for Stock-Based Compensation – Transitionobtained after January 31, 2003 and Disclosure – an Amendment of FASB Statement No. 123.”
SFAS No. 146 addresses financial accounting and reporting for costs associated with exitit applies in the first fiscal year or disposal activities and is effective for exit or disposal activities that are initiatedinterim period ending after December 31, 2002. The Company expects15, 2003, to VIEs in which an enterprise holds a variable interest that the adoption of the provisions of SFAS No. 146 willis acquired before February 1, 2003. This pronouncement is currently not anticipated to have a material impacteffect on itsour consolidated financial position or results of operations.
SFAS No. 148 provides alternative methods of transition for a voluntary change to the fair value based method of accounting for stock-based compensation and amends the disclosure requirements prescribed by SFAS No. 123, “Accounting for Stock-Based Compensation.” As permitted under SFAS No. 148, the Company adopted the disclosure requirements in 2002 and plans to evaluate the effect of the remaining provisions of SFAS No. 148 in 2003.
NOTES TO CONSOLIDATED FINANCIAL STATEMENTS
For the Years Ended December 31, 2003, 2002 2001 and 20002001 (continued)
[2] Contingencies and Commitments
(a) Mergentime – Mergentime—Perini Joint Ventures vs. WMATA Matter
On May 11, 1990, contracts with two joint ventures in which Perini Corporation held a minority40% interest (“Joint Ventures”) were terminated by the Washington Metropolitan Area Transit Authority, (“WMATA”)or WMATA, on two adjacent subway construction contractsprojects in the District of Columbia. The contracts were awarded to the Joint Venturesjoint ventures in 1985 and 1986. However, Perini and Mergentime Corporation, (“Mergentime”),or Mergentime, the 60% managing partner, entered into an agreement in 1987 under which Perini withdrew from the Joint Venturesjoint ventures and Mergentime assumed complete control over the performance of both projects. This agreement did not relieve Perini of its responsibilities to WMATA as a Joint Venturejoint venture partner. After Perini withdrew from the Joint Ventures,joint ventures, Mergentime and WMATA were embroiled inhad a dispute regarding progress on the projects. Each party blamed the other for delays that were impacting both cost and progress and the parties were unable to resolve their dispute. Ultimately,After both construction contracts were terminated, by WMATA and WMATA retained Perini, acting independently, to complete both projects.
Subsequently, the Joint Venturesjoint ventures brought an action in the United States District Court for the District of Columbia against WMATA, seeking damages for delays, unpaid extra work and wrongful termination and WMATA brought an action against the Joint Venturesjoint ventures seeking damages for additional costs to complete the projects. After a bench trial, before two District Court Judges (the initial Judge died before the matter could be concluded), the District Court found the Joint Venturesjoint ventures liable to WMATA for damages in the amount of approximately $16.5 million and WMATA liable to the Joint Venturesjoint ventures for damages in the amount of approximately $4.3 million.
The Joint Venturesjoint ventures appealed the judgment to the United States Court of Appeals for the District of Columbia, (“Court of Appeals”), arguing, among other things, that the second District Court Judge had issued his final decision without fully familiarizing himself with the record of the initial District Court Judge. Onand on February 16, 1999, the Court of Appeals vacated the District Court’s final judgment and ordered the successor District Court Judge to review theits prior findings of the initial Judge and hold further hearings in regard to the Joint Venture’sjoint venture’s affirmative claims. In addition, the Court of Appeals held that statutory interest on any of the claims will not accrue until final judgment is entered sometime in the future. Later in 1999, the case was transferred to a new successor District Court Judge.
On February 28, 2001, the newa successor District Court Judge informed the parties that in the absence of a new trial, he could not certify adequate familiarity with the record to complete the remaining proceedings; therefore, he ordered thatgranted the Joint Ventures’joint ventures’ motion for a new trial be granted.
trial. The joint ventures are seeking $28.9 million, plus interest, from WMATA, and WMATA is seeking $29.3 million from the joint ventures. A new trial before the new successor District Court Judge was completed in January 2002 and a decision is still pending. The ultimate financial impact of the Judge’s pending decision is not yet determinable; therefore, no provision for loss, if any, has been recorded in the financial statements.
(b) Tutor–Saliba–PeriniTutor-Saliba-Perini Joint Venture vs. Los Angeles MTA Matter
During 1995, a joint venture, Tutor-Saliba-Perini, (“TSP”),or TSP, in which Perini Corporation is athe 40% minority partner and Tutor-Saliba Corporation of Sylmar, CACalifornia is the 60% managing partner, filed a complaint in the Superior Court of the State of California for the County of Los Angeles against the Los Angeles County Metropolitan Transportation Authority, (“MTA”)or the MTA, seeking to recover costs for extra work required by the MTA in connection with the construction of the Wilshire/Normandie Subway Station. TSP is seeking additional compensation from the MTA for claims related to the constructioncertain tunnel and instation projects. In February 1999 the MTA countered
NOTES TO CONSOLIDATED FINANCIAL STATEMENTS
For the Years Ended December 31, 2002, 2001 and 2000 (continued)
[2] Contingencies and Commitments (continued)
(b) Tutor–Saliba–Perini Joint Venture vs. Los Angeles MTA Matter(continued)
with civil claims under the California False Claims Act against TSP, Tutor-Saliba Corporation,and Perini Corporationjointly and other parties.severally. Ronald N. Tutor, the Chairman and CEOChief Executive Officer of Perini Corporation since March of 2000, is also the CEOchief executive officer and the sole stockholder of Tutor-Saliba Corporation (see Note 13).Corporation.
Claims concerning the construction of the Wilshire/Normandie Subway StationMTA projects were tried before a Juryjury in 2001. During trial, the Judge ruled that TSP had failed to comply with the Court’s prior discovery orders and the Judge penalized TSP, Tutor-Saliba and Perini for itsthe alleged non-compliance by dismissing TSP’s claimclaims and by ruling, without a Juryjury finding, that TSP, wasTutor-Saliba and Perini were liable to the MTA for damages on the MTA’s counterclaim.counterclaims. The Judge then instructed the Juryjury that TSP, wasTutor-Saliba and Perini were liable to the MTA and charged the Jury jury
NOTES TO CONSOLIDATED FINANCIAL STATEMENTS
For the Years Ended December 31, 2003, 2002 and 2001 (continued)
[2] Contingencies and Commitments (continued)
(b) Tutor-Saliba-Perini Joint Venture vs. Los Angeles MTA Matter(continued)
with the responsibility of determining the amount of the damages based on the Judge’s ruling. The Juryjury awarded the MTA approximately $29.6 million in damages.
On March 26, 2002, the Judge amended the award, ordering TSP to pay the MTA an additional $33.4 million in costs and attorney fees, with the aggregate $63.0 million award subject to interest at an annual rate of 10% from the date of the award.
TSP and the other plaintiffs/defendants in the counterclaim have appealed the Judge’s discovery sanction, the subsequent Juryjury award and the amended award. Oral arguments on the appeal are anticipated to be set some time in the Summer 2004. The ultimate financial impact of the Judge’s ruling and/or the awards is not yet determinable. Therefore, no provision for loss, if any, has been recorded in the financial statements.
(c) City of San Francisco vs. Tutor-Saliba, Perini & Buckley Joint Venture Matter
OnIn November 1, 2002, the San Francisco City Attorney, on behalf of the City and County of San Francisco and the citizens of California, (“Plaintiffs”), filed a civil action with a demand for a jury trial against Perini, Tutor-Saliba Corporation, (“TSC”),or TSC, the Tutor-Saliba, Perini & Buckley Joint Venture, (“JV”), Perini Corporation (“Perini”), Buckley & Company, Inc. (“Buckley”) and their bonding companies in the United States District Court in San Francisco relating to seven contractsprojects for work on the expansion of the San Francisco International Airport. A second amended complaint was filed in July 2003 which, among other things, added Ronald N. Tutor as a defendant. The Plaintiffsjoint venture was established by TSC, Perini and Buckley through two joint venture agreements dated October 28, 1996 and February 11, 1997. The joint venture had agreements with the Owner to perform work (“Contracts”) on only two of the above projects (“Projects”) and, as part of those Contracts, the joint venture provided performance and payment bonds to the Owner (“Bonds”).
In the second amended complaint, the plaintiffs allege, among other things, various overcharges, bidding violations, violations of minority contracting regulations, civil fraud and violation of the California and San Francisco False Claims and California Unfair Competition Acts. In addition, the Plaintiffsplaintiffs allege that TSC hasthe defendants have violated the United States Racketeer Influenced Corrupt Organizations Act. The Plaintiffsplaintiffs have asserted $30 million in damages and are seeking treble damages, punitive and exemplary damages, various civil penalties and debarmenta declaration that TSC and the joint venture are irresponsible bidders. It is unclear based on the plaintiff’s current complaint what portion of the JV and TSC from doing business withplaintiff’s claims relate to the City of San Francisco.two projects that the joint venture participated in.
On October 3, 2003, the Court granted the defendants’ motion to specify damages allegedly sustained for each contract. The Plaintiffs have not allocated their claims for damages and penalties amongstdefendants’ motion to dismiss the defendants or the seven contracts at issue, only two of which involved the JV. plaintiff’s second amended complaint is pending.
TSC is the managing partner of the JV,joint venture and, in December 1997, Perini sold its entire 20% interest in the JVjoint venture to TSC. As part of that sale agreement, TSC has agreed to indemnify Perini from any liability that Perini is required to pay by reason of or arising out of any event or occurrence subsequent to the date of the sale of Perini’s interest in the joint venture including legal feesin any way connected with the joint venture agreements, the Contracts, the Projects and expenses.the Bonds. It is unclear based on the plaintiff’s current complaint whether the claims against the joint venture arise out of events that occurred subsequent to the date of the sale of Perini’s interest. The ultimate financial impact of this action is not yet determinable.
NOTES TO CONSOLIDATED FINANCIAL STATEMENTS
For the Years Ended December 31, 2003, 2002 and 2001 (continued)
[2] Contingencies and Commitments (continued)
(d) Perini/Kiewit/Cashman Joint Venture – Venture—Central Artery/Tunnel Project Matter
Perini/Kiewit/Cashman Joint Venture, (“PKC”),or PKC, a joint venture in which Perini Corporation holds a 56% interest and is the managing partner, is currently pursuing a series of claims for additional contract time and/or compensation against the Massachusetts Highway Department, (“MHD”)or MHD, for work performed by PKC on a portion of the Central Artery/Tunnel project in Boston, Massachusetts. The claims relate to the construction of the Northbound Mainline Central Artery Tunnel from Kneeland Street to Congress Street. During construction, MHD ordered PKC to perform changes to the work and issued related direct cost changes with an estimated value, excluding time delay and inefficiency costs, in excess of $100 million. In addition, PKC encountered a number of unforeseen conditions during construction that greatly increased PKC’s cost of performance.
NOTES TO CONSOLIDATED FINANCIAL STATEMENTS
For the Years Ended December 31, 2002, 2001 and 2000 (continued)
[2] Contingencies and Commitments (continued)
(d) Perini/Kiewit/Cashman Joint Venture – Central Artery/Tunnel Project Matter(continued)
Certain of PKC’s claims have been presented to a Disputes Review Board, (“DRB”)or the DRB, which consists of three construction experts chosen by the parties. To date, the DRB has ruled on a binding basis that PKC is entitled to additional compensation for its contract time delay claim in the amount of $17.4 million. A Judge of the Massachusetts Superior Court has issued a decision upholding the DRB’s binding award to PKC. Although MHD challenged several of the DRB’s decisions relative to the contract time delay award discussed above, PKC received a favorable ruling onOn March 20, 2002, from the Superior Court of the Commonwealth of Massachusetts that approved PKC’s request to have MHD comply with the DRB’s decision to award the $17.4 million for the time delay.award. The MHD has appealed the Superior Court decision to the Appeals Court of the Commonwealth of Massachusetts.
The DRB has also ruled on a binding basis that PKC is entitled to additional compensation awards totaling $17.1 million for impacts and inefficiencies caused by MHD to certain of PKC’s underpinning work in the amount of $5.6 million and that PKC is entitled to additional compensation for impacts and inefficiencies caused by MHD to PKC’s utility work in the amount of $11.5 million.work. PKC has filed applications in these actions seeking to confirm the awards and MHD has filed civil actions in Massachusetts Superior Court seeking to vacate these awards.
Under the Dispute Resolution Rules of the contract, either party may periodically terminate the services of some or all of the DRB members provided that members who are removed under this provision will remain on the DRB through the completion of any then pending claims. The MHD has chosen to remove the current DRB members under this provision and those members are in the process of completing hearings on all pending claims. Although the replacement DRB members have been agreed upon, proceedings before the current DRB and the new DRB have been postponed pending resolutioncompletion of the current negotiationsnegotiation and mediation discussed below.
The pending claims yet to be decided by the current/replacementcurrent DRB on a binding basis have an anticipated value of $43$49.4 million. The remaining claims to be decided by the replacement DRB on a non-binding basis have an anticipated value of $80$72.6 million.
On August 14, 2002 the Massachusetts Attorney General’s office, pursuant to its authority under the Massachusetts False Claims Act, served a Civil Investigative Demand (“CID”) on Perini and the other joint venture partners. The CID sought the production of certain construction claims documentation in connection with the Central Artery/Tunnel Contract No. C11A1. PKC vigorously denies that it submitted any false claims and is cooperating with the Attorney General’s Office in the ongoing investigationinvestigation.
In December 2002, PKC and MHD entered into an agreement whereby the parties agreed to attempt to resolve by negotiation and mediation all of the outstanding claims on the project. As part of the agreement, the MHD recommended for approval by the Massachusetts Turnpike Authority a contract modification that provides for provisional payments to PKC totaling $25 million against PKC’s outstanding claims. To date, PKC has received $23.75 million of those provisional payments. The parties also agreed to stay the pending litigation and DRB proceedings during the negotiations. The ultimate financial impact of resolvingPerini began mediation on all claims in September 2003. Management has made an estimate of the claimstotal anticipated cost recovery on this project and it is not yet determinable.
(e) $21.25 Preferred Shareholders Class Action Lawsuit
On May 3, 2001included in revenue recorded to date. To the Company, including several of its current and former directors (“Defendant Directors”), was served with a complaint entitledFrederick Doppelt, Arthur I. Caplan and Michael Miller v. Perini Corporation, et al,Supreme Courtextent new facts become known or the final cost recovery included in the claim settlement varies from this estimate, the impact of the State of New York, County of New York, Civil Action No. 602156/01.change will be reflected in the financial statements at that time.
NOTES TO CONSOLIDATED FINANCIAL STATEMENTS
For the Years Ended December 31, 2003, 2002 2001 and 20002001 (continued)
[2] Contingencies and Commitments (continued)
(e) Redondo/Perini Joint Venture vs. Siemens Transportation Matter
This is a binding arbitration proceeding arising out of a contract between the Redondo/Perini Joint Venture, or RPJV, a joint venture in which Perini and Redondo Construction Corp., or Redondo, each have a 50% interest and the Siemens Transportation Partnership, S.E., Puerto Rico, or STP. STP is constructing a public metropolitan passenger rail transportation project for the Commonwealth of Puerto Rico and RPJV is responsible for the design and construction of a portion of the project.
On March 19, 2002, Redondo filed a petition for reorganization under 11 U.S.C. Chapter 11 in U.S. Bankruptcy Court for the District of Puerto Rico.
On December 23, 2002, RPJV filed an arbitration demand against STP seeking the recovery of approximately $38 million of additional costs related to design changes and the late completion of the design. On January 31, 2003, STP filed a counter-demand against RPJV seeking the recovery of damages allegedly related to defects in design and construction and the late completion of RPJV’s work in the amount of approximately $17.9 million along with the repayment of approximately $22.6 million for alleged advances previously paid to RPJV.
On October 31, 2003, the parties each revised their statement of damages. RPJV’s total claim is now approximately $71 million. STP’s revised claim is approximately $69.5 million, including its claim for alleged advances already paid.
Discovery has begun, an arbitration panel has been chosen and arbitration evidentiary hearings are scheduled to begin on March 22, 2004. Management has made an estimate of the total anticipated cost recovery on this project and it is included in revenue recorded to date. To the extent new facts become known or the final cost recovery included in the claim settlement varies from this estimate, the impact of the change will be reflected in the financial statements at that time.
(f) $21.25 Preferred Shareholders Class Action Lawsuit(continued)
Each plaintiffOn October 15, 2002, Frederick Doppelt, Arthur I. Caplan and Leland D. Zulch filed a lawsuit individually, and as representatives of a class of holders of our Depositary Shares against certain current and former directors of Perini. This lawsuit is a holdercaptioned Doppelt, et al. v. Tutor, et al., United States District Court for the District of the Company’s $21.25 Convertible Exchangeable Preferred Stock (“$21.25 Preferred Stock”). One plaintiff,Massachusetts, No. 02CV12010MLW. Mr. Doppelt is a current Directordirector of the CompanyPerini and one plaintiff, Mr. Caplan is a former Directordirector of Perini.
Specifically, the Company. Plaintiffs purportoriginal complaint alleged that the defendants breached their fiduciary duties owed to bring the action individually and on behalf of the entire class of holders of the $21.25 Preferred Stock.
Depositary Shares and to Perini. The Plaintiffs have asserted claims for breach of contract, breach of fiduciary duty, fraud and negligent misrepresentation. The Plaintiffsplaintiffs principally allege that the Company and its Defendant Directorsdefendants improperly authorized the exchange of Series B Preferred Stock for Common Stock without first paying allcommon stock while simultaneously refusing to pay accrued dividends due on the $21.25 Preferred Stock. More specifically, Plaintiffs allege that the Company and its Defendant Directors violated the terms of the $21.25 Preferred Stock when, in March 2000, the Company authorized the exchange of Series B Preferred Stock for Common Stock. The Plaintiffs further allege that the Company and its Defendant Directors issued a false and misleading prospectus in 1987 relating to the issuance of the $21.25 Preferred Stock. The Plaintiffs seek payment of accrued dividends, claiming they are owed approximately $11.7 million as of May 3, 2001, and other unspecified punitive and exemplary damages.Depositary Shares.
On May 23, 2001, the Company and the Defendant Directors removed the action from the Supreme Court of New York to the United States District Court for the Southern District of New York. On June 26, 2001, the Plaintiffs filed an Amended Complaint whereby the Plaintiffs limited their Class Action to an action for breach of contract against the Company and an action for breach of fiduciary duty against the Defendant Directors. The Company and the Defendant Directors moved to dismiss all of Plaintiffs’ claims. On March 12, 2002, all claims against the Company and the Defendant Directors were dismissed by the United States District Court for the Southern District of New York.
In April 2002, the Plaintiffs appealed the dismissal to the United States Court of Appeals for the Second Circuit. On December 23, 2002, the Plaintiffs’ appeal was dismissed by the United States Court of Appeals for the Second Circuit.
On October 15, 2002, the Plaintiffs filed a new action for breach of fiduciary duty against the Defendant Directors in the United States District Court for the District of Massachusetts. On January 6, 2003, the Defendant Directorsdefendants moved to dismiss allthe lawsuit. Among other things, the defendants argued that: (1) they did not owe fiduciary duties to the holders of the Plaintiffs’ Massachusetts claims. The Defendant Directors are awaitingDepositary Shares and (2) the Plaintiffs’ response.claims of breach of fiduciary duty owed to Perini must be dismissed because the claim could only be brought as a derivative action.
(f) Other
Contingent liabilities also include liability of contractors for performance and completion of both Company and joint venture construction contracts. In additionOn March 21, 2003, the plaintiffs filed an opposition to the legal matters described above,motion to dismiss and in May 2003 the Company is involved in various lawsuits, arbitration and alternative dispute resolution (“ADR”) proceedings. Inplaintiffs asked the opinion of management, the resolution of these proceedings will not have a material effect on the Company’s results of operations or financial condition.Court for leave to file an amended complaint.
NOTES TO CONSOLIDATED FINANCIAL STATEMENTS
For the Years Ended December 31, 2003, 2002 and 2001 (continued)
[2] Contingencies and 2000Commitments (continued)
(f) $21.25 Preferred Shareholders Class Action Lawsuit(continued)
In June 2003 the plaintiffs were given leave to file an amended complaint. The amended complaint filed in July 2003 adds an allegation that the defendants have further breached their fiduciary duties by authorizing a tender offer for the purchase of up to 90% of the Depositary Shares and an allegation that the collective actions of the defendants constitute unfair and deceptive business practices under the provisions of the Massachusetts Consumer Protection Act. The amended complaint withdrew the allegation of a breach of fiduciary duty owed to Perini, but retained the allegation with respect to a breach of those duties owed to the holders of the Depositary Shares. The plaintiffs seek damages in an amount not less than $15,937,500, trebled, plus interest, costs, fees and other unspecified punitive and exemplary damages.
On August 29, 2003, the defendants filed a motion to dismiss the amended complaint. The plaintiffs filed an opposition thereto and on October 14, 2003, the defendants filed their reply.
In 2001, a similar lawsuit was filed by some of the same plaintiffs in the United States District Court for the Southern District of New York, which claimed that we breached our contract with the holders of Depositary Shares. In 2002, the case was dismissed and upon appeal by the plaintiffs to the United States Court of Appeals for the Second Circuit, the Court of Appeals affirmed the dismissal.
[3] Acquisition of James A. Cummings, Inc.
On January 23, 2003, the Company completed the acquisition of 100% of the outstanding common stock of James A. Cummings, Inc. (“Cummings”), a privately held construction company based in Fort Lauderdale, Florida, for $20 million in cash, financed in part through the Company’s credit facility. Cummings is an established building construction and construction management company in the South Florida region specializing in the construction of schools, municipal buildings, and commercial facilities. Cummings strong regional reputation, successful in-place management team and focus on growing niche markets should effectively extend the Company’s expansion into the Southeast region of the United States. At January 1, 2003, Cummings had a firm backlog of approximately $170 million. The acquisition was effective as of January 1, 2003 and, accordingly, Cummings’ financial results are included in the Company’s consolidated results of operations and financial position since that date.
The transaction was accounted for using the purchase method of accounting as required by FASB Statement No. 141, “Business Combinations”. Goodwill and identifiable intangible assets recorded in the acquisition were tested during 2003 and will be tested periodically in the future for impairment as required by FASB Statement No. 142 “Goodwill and Other Intangible Assets”. The allocation of acquisition costs, which consists of the $20 million cash consideration referred to above and $565,000 of other direct acquisition costs, is as follows (in thousands):
Current assets | $ | 34,419 | ||
Property and equipment, net | 394 | |||
Other long-term assets | 23 | |||
Goodwill | 12,990 | |||
Other identifiable intangible assets | 575 | |||
Total assets acquired | $ | 48,401 | ||
Less—Liabilities assumed | (27,836 | ) | ||
Total Consideration and Acquisition Costs | $ | 20,565 | ||
NOTES TO CONSOLIDATED FINANCIAL STATEMENTS
For the Years Ended December 31, 2003, 2002 and 2001 (continued)
[3] Acquisition of James A. Cummings, Inc. (continued)
Other identifiable intangible assets represent the estimated costs incurred in obtaining the backlog referred to above and are being amortized over the average two year operating cycle of the related contracts. Approximately $288,000 was amortized during 2003. The $13.0 million of “Goodwill” referred to above has been allocated to the building construction segment and will be fully deductible for tax purposes.
Since the acquisition was effective as of January 1, 2003, the Company’s 2003 year to date results include Cummings for the full year. Therefore, the following pro forma financial information is presented for the comparative years ended December 31, 2002 and 2001 (in thousands, except per share data):
| Year Ended December 31, | ||||||
| 2002 | 2001 | |||||
| Pro forma (unaudited) | ||||||
Revenues | $ | 1,182,413 | $ | 1,664,490 | ||
Gross profit | $ | 65,030 | $ | 64,358 | ||
Net income | $ | 25,694 | $ | 29,309 | ||
Basic earnings per common share | $ | 1.04 | $ | 1.20 | ||
Diluted earnings per common share | $ | 1.03 | $ | 1.16 | ||
The pro forma results have been prepared for comparative purposes only and include certain adjustments such as increased interest expense on acquisition debt and additional amortization expenses related to intangible assets arising from the acquisition. The pro forma results are not necessarily indicative either of the results of operations that actually would have resulted had the acquisition been in effect on January 1, 2001 or of future results.
[4] Financial Commitments
Long-term Debt
Long-term debt of the Company at December 31, 20022003 and 20012002 consists of the following (in thousands):
| 2002 | 2001 | 2003 | 2002 | |||||||||
Borrowing under revolving credit facility at an average rate of 4.5% in 2002 | $ | 5,000 | $ | — | ||||||||
Term loan under credit facility at an average rate of 6.8% in 2001 | — | 9,764 | ||||||||||
Mortgage on corporate headquarters building, at a rate of approximately 9%, payable in equal monthly installments over a ten year period, with a balloon payment of approximately $5.3 million in 2010 | 7,162 | 7,322 | ||||||||||
Borrowing under revolving credit facility at an average rate of 3.8% in 2003 and | $ | — | $ | 5,000 | ||||||||
Mortgage on corporate headquarters building at a rate of 8.96%, payable in equal monthly installments over a ten-year period, with a balloon payment of $5.3 million in 2010 | 6,999 | 7,162 | ||||||||||
Mortgage on office building at a rate of 5.68% payable in equal monthly installments over a five-year period, with a balloon payment of $1.4 million in 2008 | 1,665 | — | ||||||||||
Other indebtedness | 377 | 703 | 348 | 377 | ||||||||
Total | $ | 12,539 | $ | 17,789 | $ | 9,012 | $ | 12,539 | ||||
Less – current maturities | 416 | 10,249 | 490 | 416 | ||||||||
Net long-term debt | $ | 12,123 | $ | 7,540 | $ | 8,522 | $ | 12,123 | ||||
Payments required under these obligations amount to approximately $416,000 in 2003, $272,000$490,000 in 2004, $5,241,000$353,000 in 2005, $241,000$281,000 in 2006, $247,000$305,000 in 2007, and $6,122,000$1,721,000 in 2008 and $5,862,000 in 2009 and beyond.
NOTES TO CONSOLIDATED FINANCIAL STATEMENTS
For the Years Ended December 31, 2003, 2002 and 2001 (continued)
[4] Financial Commitments (continued)
On January 23, 2002, the Company entered into an agreement with two banks to refinance its former credit facility with a new credit agreement (the “Credit Agreement”). The Credit Agreement providesprovided for a $45 million revolving credit facility through January 2004 which, if not extended or repaid, converts amounts then outstanding to a three year term loan with equal quarterly principal payments.
The Credit Agreement provides that the Company can choose from interest rate alternatives including a prime-based rate, as well as options based on LIBOR (London inter-bank offered rate). Up to $5.0 million of the unborrowed revolving commitment is available for letters of credit.
The Credit Agreement requires, among other things, maintaining specifieda minimum working capital ratio, tangible net worth and operating profit levels, interest coverage minimums, and limitations on indebtedness.indebtedness and certain capital expenditures. The Credit Agreement also provides that collateral shall consist of all available assets not included as collateral in other agreements.
In February 2003, the terms of the Credit Agreement were amended to increase the revolving credit facility from $45 million to $50 million; to extend the term of the Credit Agreement from January 2004 to June 2005; to increase the amount of unborrowed revolving commitment available for letters of credit from $5.0 million to $7.5 million; and to adjust certain financial covenants. Other terms of the Credit Agreement remained the same, including the provision that amounts due in June 2005, if not extended or repaid, convert to a three year term loan. On November 5, 2003 and January 31, 2004, the terms of the revolving credit facility were further amended to provide a temporary $20 million increase in the facility, from $50 million to $70 million, until April 30, 2004 to support the procurement requirements of a major project.
The fair value of the balance outstanding under the Credit Agreement approximates the carrying value due to the variable nature of the interest rates. For fixed rate debt, fair value is determined based on discounted cash flows for the debt at the Company’s current incremental borrowing rate for similar types of debt. The estimated fair value of fixed rate debt at December 31, 2003 and 2002 is $9.7 million and $8.2 million.
NOTES TO CONSOLIDATED FINANCIAL STATEMENTS
Formillion, respectively, compared to the Years Ended December 31, 2002, 2001carrying amount of $9.0 million and 2000 (continued)
[3] Financial Commitments (continued)$7.5 million, respectively.
Leases
The Company leases certain construction equipment, vehicles and office space under non-cancelable operating leases. Future minimum rent payments under non-cancelable operating leases as of December 31, 20022003 are as follows (in thousands):
| Amount | Amount | |||||||
2003 | $ | 3,595 | ||||||
2004 | 3,036 | $ | 4,425 | |||||
2005 | 2,516 | 3,593 | ||||||
2006 | 1,432 | 2,196 | ||||||
2007 | 802 | 1,422 | ||||||
2008 | 933 | |||||||
Thereafter | 1,301 | 732 | ||||||
Subtotal | $ | 12,682 | $ | 13,301 | ||||
Less - Sublease rental agreements | (836 | ) | ||||||
Less—Sublease rental agreements | (1,120 | ) | ||||||
Total | $ | 11,846 | $ | 12,181 | ||||
NOTES TO CONSOLIDATED FINANCIAL STATEMENTS
For the Years Ended December 31, 2003, 2002 and 2001 (continued)
[4] Financial Commitments (continued)
Rental expense under long-term operating leases of construction equipment, vehicles and office space was $4,625,000 in 2003, $3,781,000 in 2002 and $3,146,000 in 2001 and $2,567,000 in 2000.2001.
Although not material to the Company’s consolidated financial position or results of operations, the Company also leases certain construction equipment under capital lease arrangements from time to time. Amounts relating to capital leases are included in the accompanying Consolidated Balance Sheets under “Construction Equipment” and “Long-term Debt.”Debt”.
[4]5] Income Taxes
The Company accounts for income taxes in accordance with SFAS No. 109. This standard determines deferred income taxes based on the estimated future tax effects of differences between the financial statement and tax bases of assets and liabilities, given the provisions of enacted tax laws.
The provision (credit)credit (provision) for income taxes expense is comprised of the following (in thousands):
| Federal | State | Foreign | Total | ||||||||||||
2002 | |||||||||||||||
Current | $ | (249 | ) | $ | 1,050 | $ | — | $ | 801 | ||||||
Deferred | — | — | — | — | |||||||||||
| $ | (249 | ) | $ | 1,050 | $ | — | $ | 801 | |||||||
2001 | |||||||||||||||
Current | $ | 360 | $ | 490 | $ | — | $ | 850 | |||||||
Deferred | — | — | — | — | |||||||||||
| $ | 360 | $ | 490 | $ | — | $ | 850 | ||||||||
2000 | |||||||||||||||
Current | $ | 580 | $ | 209 | $ | (832 | ) | $ | (43 | ) | |||||
Deferred | — | — | — | — | |||||||||||
| $ | 580 | $ | 209 | $ | (832 | ) | $ | (43 | ) | ||||||
NOTES TO CONSOLIDATED FINANCIAL STATEMENTS
For the Years Ended December 31, 2002, 2001 and 2000 (continued)
[4] Income Taxes (continued)
| Federal | State | Total | ||||||||||
2003 | ||||||||||||
Current | $ | (529 | ) | $ | (1,380 | ) | $ | (1,909 | ) | |||
Deferred | 16,023 | (1,018 | ) | 15,005 | ||||||||
| $ | 15,494 | $ | (2,398 | ) | $ | 13,096 | ||||||
2002 | ||||||||||||
Current | $ | 249 | $ | (1,050 | ) | $ | (801 | ) | ||||
Deferred | — | — | — | |||||||||
| $ | 249 | $ | (1,050 | ) | $ | (801 | ) | |||||
2001 | ||||||||||||
Current | $ | (360 | ) | $ | (490 | ) | $ | (850 | ) | |||
Deferred | — | — | — | |||||||||
| $ | (360 | ) | $ | (490 | ) | $ | (850 | ) | ||||
The table below reconciles the difference between the statutory federal income tax rate and the effective rate provided for income before income taxes in the consolidated statements of income.
| 2002 | 2001 | 2000 | 2003 | 2002 | 2001 | |||||||||||||
Statutory federal income tax rate | 35 | % | 35 | % | 34 | % | 35 | % | 35 | % | 35 | % | ||||||
State income taxes, net of federal tax benefit | 3 | 1 | 1 | 3 | 3 | 1 | ||||||||||||
Foreign taxes | 0 | 0 | (3 | ) | 0 | 0 | 0 | |||||||||||
Recognition of tax benefit | (35 | ) | (33 | ) | (32 | ) | ||||||||||||
Recognition of current year tax benefit | (35 | ) | (35 | ) | (33 | ) | ||||||||||||
Reversal of valuation allowance | (45 | ) | 0 | 0 | ||||||||||||||
Effective tax rate | 3 | % | 3 | % | 0 | % | (42 | )% | 3 | % | 3 | % | ||||||
NOTES TO CONSOLIDATED FINANCIAL STATEMENTS
For the Years Ended December 31, 2003, 2002 and 2001 (continued)
[5] Income Taxes (continued)
The following is a summary of the significant components of the Company’s deferred tax assets and liabilities as of December 31, 20022003 and 20012002 (in thousands):
| 2002 | 2001 | 2003 | 2002 | |||||||||||||
Deferred Tax Assets | ||||||||||||||||
Provision for estimated real estate losses | $ | 175 | $ | 7,728 | $ | 101 | $ | 175 | ||||||||
Contract losses | 1,985 | 231 | 2,392 | 1,985 | ||||||||||||
Timing of expense recognition | 383 | 3,026 | 10,234 | 7,383 | ||||||||||||
Net operating loss and capital loss carryforwards | 33,689 | 31,759 | 22,325 | 33,689 | ||||||||||||
Alternative minimum tax credit carryforwards | 2,960 | 3,310 | 3,619 | 2,960 | ||||||||||||
General business tax credit carryforwards | 3,045 | 3,533 | — | 3,045 | ||||||||||||
Other, net | 953 | 868 | 1,068 | 953 | ||||||||||||
| $ | 43,190 | $ | 50,455 | $ | 39,739 | $ | 50,190 | |||||||||
Valuation allowance for deferred tax assets* | (28,208 | ) | (35,854 | ) | (8,400 | ) | (35,208 | ) | ||||||||
Deferred tax assets | $ | 14,982 | $ | 14,601 | $ | 31,339 | $ | 14,982 | ||||||||
Deferred Tax Liabilities | ||||||||||||||||
Joint ventures - construction | $ | (14,569 | ) | $ | (11,999 | ) | ||||||||||
Joint ventures - real estate | — | (29 | ) | |||||||||||||
Joint ventures—construction | $ | (15,883 | ) | $ | (14,569 | ) | ||||||||||
Capitalized carrying charges | (413 | ) | (2,573 | ) | (451 | ) | (413 | ) | ||||||||
Deferred tax liabilities | $ | (14,982 | ) | $ | (14,601 | ) | $ | (16,334 | ) | $ | (14,982 | ) | ||||
Net deferred tax asset (liability) | $ | — | $ | — | ||||||||||||
Net deferred tax asset | $ | 15,005 | $ | — | ||||||||||||
The net deferred asset as of December 31, 2003 is classified in the Consolidated Balance Sheet based on when the future benefit is expected to be realized as follows (in thousands):
Short-term “Deferred tax asset” | $ | 10,844 | |||
Long-term “Deferred tax asset” | 4,161 | ||||
| $ | 15,005 | ||||
| * | A valuation allowance is provided to reduce the deferred tax assets to a level which, more likely than not, will be realized. The ultimate realization of deferred tax assets is dependent on the generation of future taxable income during the periods in which those temporary differences become deductible. The net deferred tax assets reflect management’s estimate of the amount which |
As a result of not providing federal income tax benefit applicable to losses recorded in certain prior years for financial reporting purposes, benefit from these losses iswas realized in 2003, 2002 2001 and 20002001 by not having to provide federal income tax of approximately $11.0 million, $8.5 million and $9.0 million, and $8.0 million, respectively. AtIn addition, during the year ended December 31, 2002, approximately $792003, the Company recognized an additional $14.9 million tax benefit based on the expectation that the Company will be able to utilize an additional amount of its net operating loss carryforwards in future pretax book earnings could benefit from minimal, if any, federal tax provisions.years.
NOTES TO CONSOLIDATED FINANCIAL STATEMENTS
For the Years Ended December 31, 2003, 2002 2001 and 20002001 (continued)
[4]5] Income Taxes (continued)
At December 31, 2002,2003, the Company has unused tax credits and net operating loss carryforwards for tax reporting purposes of approximately $63.8 million, of which $1.4 million expires during the 2004 - 2006 period and $62.4 million expires during the 2007 - 2021 period. At December 31, 2003, the Company also has unused alternative minimum tax credit carryforwards for income tax reporting purposes which expire as follows (in thousands):
Unused Investment Tax Credits | Net Operating Loss Carryforwards | |||||
2003 | $ | 3,045 | $ | — | ||
2004 - 2006 | — | 1,404 | ||||
2007 - 2021 | — | 94,849 | ||||
| $ | 3,045 | $ | 96,253 | |||
Net operating loss carryforwards and unused tax credits may be limited in the event of certain changes in ownership interests of significant stockholders. In addition, approximately $1.4 million of the net operating loss carryforwards can only be used against the taxable income of the corporation in which the loss was recorded for tax and financial reporting purposes.
[5] Land Held for Sale, Net
Effective June 30, 1999, management adopted a plan to withdraw completely from the real estate development business and to wind down the operations of Perini Land and Development Company (“PL&D”), the Company’s wholly owned real estate development subsidiary. Accordingly, both the historical and current real estate results were presented as a discontinued operation in accordance with accounting principles generally accepted in the United States of America. A $99,311,000 non-cash provision, which represents the estimated loss on disposal of this business segment, was recorded at that time. Although the Company had a reasonable expectation that the plan, when adopted, could be executed within a twelve-month period, the plan was not entirely completed because potential buyers who had executed purchase and sale agreements with the Company withdrew from the purchase of two properties, namely the bulk sale of the Massachusetts properties and the sale of the Perini Central property in Phoenix, AZ. In addition, a program to pursue the bulk sale of the Sabino Springs property in Tucson, Arizona took longer than originally anticipated. With the sale of the Perini Central property in 2001 and the bulk sale of the Sabino Springs property in the fourth quarter of 2002, the remaining land to be sold at December 31, 2002 consists of certain fully-developed parcels in Raynham, Massachusetts. Management’s current plan is to continue to market the remaining land for sale as a bulk sale or as individual parcels over an estimated 36 to 48 month “sell off” period.
In accordance with SFAS No. 144, “Accounting for the Impairment or Disposal of Long-Lived Assets” and management’s revised plans, the remaining inventory of land has been classified as “Land held for sale, net” in the accompanying Consolidated Balance Sheets as of December 31, 2002 with the amount estimated to be sold during the next twelve months included in Current Assets and the balance included in “Other Assets” (see Note 6 “Other Assets”). Operating results from the remaining land are included in “Other (Income) Expense, Net.”
Real estate revenues related to continuing operations were $8,304,000 in 2002 which were offset by related costs and expenses of a similar amount. Real estate revenues related to discontinued operations were $1,936,000 in 2001 and $3,491,000 in 2000. Also, in accordance with SFAS No. 144, land held for sale is stated at the lower of its carrying amount ($5,348,000) or its fair value less cost to sell. A provision to reflect a write-down of the carrying amount of the remaining land to fair value less cost to sell was not required during 2002.
NOTES TO CONSOLIDATED FINANCIAL STATEMENTS
For the Years Ended December 31, 2002, 2001 and 2000 (continued)have no expiration date.
[6] Other Assets, Other Long-term Liabilities and Other (Income) Expense, Net
Other Assets, Other Long-term Liabilities and Other (Income) Expense, Net consist of the following (in thousands) for the periods presented:
Other Assets
| 2002 | 2001 | |||||
Land held for sale, net (Note 5) | $ | 3,175 | $ | — | ||
Deferred expenses | 1,801 | 1,900 | ||||
Goodwill (Note 1) | 1,017 | 1,017 | ||||
Other investments | 63 | 63 | ||||
Intangible asset (Note 10) | 360 | 26 | ||||
| $ | 6,416 | $ | 3,006 | |||
| 2003 | 2002 | |||||||
Land held for sale, net (Note 13) | $ | 2,762 | $ | 3,175 | ||||
Deferred expenses | 1,510 | 1,801 | ||||||
Other investments | 63 | 63 | ||||||
Intangible assets (Notes 3 and 10) | 599 | 360 | ||||||
| $ | 4,934 | $ | 5,399 | |||||
Other Long-term Liabilities
| 2002 | 2001 | 2003 | 2002 | |||||||||||
Accrued dividends on $21.25 | ||||||||||||||
Preferred Stock (Note 8) | $ | 15,405 | $ | 13,280 | ||||||||||
Accrued dividends on $21.25 | $ | 9,805 | $ | 15,405 | ||||||||||
Employee benefit related liabilities | 2,256 | 2,661 | 1,885 | 2,256 | ||||||||||
Minimum pension liability adjustment (Note 10) | 19,933 | 5,891 | 24,325 | 19,933 | ||||||||||
| $ | 37,594 | $ | 21,832 | $ | 36,015 | $ | 37,594 | |||||||
Other (Income) Expense, Net
| 2002 | 2001 | 2000 | 2003 | 2002 | 2001 | |||||||||||||||||||
Gain from land sales, net (Note 13) | $ | (2,207 | ) | $ | — | $ | — | |||||||||||||||||
Interest income | $ | (297 | ) | $ | (404 | ) | $ | (1,216 | ) | (226 | ) | (297 | ) | (404 | ) | |||||||||
Bank fees | 302 | 328 | 341 | 483 | 302 | 328 | ||||||||||||||||||
Miscellaneous (income) expense, net | 515 | 303 | (74 | ) | 515 | 515 | 303 | |||||||||||||||||
| $ | 520 | $ | 227 | $ | (949 | ) | $ | (1,435 | ) | $ | 520 | $ | 227 | |||||||||||
NOTES TO CONSOLIDATED FINANCIAL STATEMENTS
For the Years Ended December 31, 2003, 2002 and 2001 (continued)
[7] Recapitalization
On March 29, 2000 (the “Closing Date”), the Company completed the sale of 9,411,765 shares of its common stock, par value $1.00 (the “Common Stock”), for an aggregate of $40 million, or $4.25 per share (the “Purchase”), to an investor group led by Tutor-Saliba Corporation (“TSC”), and including O&G Industries, Inc. (“O&G”), and National Union Fire Insurance Company of Pittsburgh, Pa., a wholly owned subsidiary of American International Group, Inc. (“National Union”AIG” and together with TSC and O&G, the “New Investors”) pursuant to a Securities Purchase Agreement dated as of February 5, 2000 by and among the Company and the New Investors. A summary of the shares of common stock issued to and the proceeds received from the New Investors follows:
| Number of Shares | Proceeds | ||||
| (in thousands) | |||||
TSC | 2,352,942 | $ | 10,000 | ||
O&G | 2,352,941 | 10,000 | |||
AIG | 4,705,882 | 20,000 | |||
| 9,411,765 | $ | 40,000 | |||
Tutor-Saliba Corporation is owned and controlled by Ronald N. Tutor, who serves as Chairman of the Company’s Board of Directors and Chief Executive Officer. (See Note 1312 for disclosure of “Related Party Transactions” between the New Investors and the Company.)
In connection with the Purchase, TSC acquired 2,352,942 shares of Common Stock for a total consideration of $10,000,000, O&G acquired 2,352,941 shares of Common Stock for a total consideration of $10,000,000 and National Union acquired 4,705,882 shares of Common Stock for a total consideration of $20,000,000.
NOTES TO CONSOLIDATED FINANCIAL STATEMENTS
For the Years Ended December 31, 2002, 2001 and 2000 (continued)
[7] Recapitalization (continued)
Concurrent with the closing of the Purchase and as a condition thereto, the Company converted, pursuant to what was considered to be an induced conversion from an accounting perspective, 100% of its Redeemable Series B Cumulative Convertible Preferred Stock (the “Series B Preferred Stock”) (which had a current accreted face amount of approximately $41.2 million) for an aggregate of 7,490,417 shares of common stock at an exchange price of $5.50 per share (the “Exchange” and together with the Purchase, the “Transaction”) pursuant to certain Exchange Agreements by and between the Company and each of The Union Labor Life Insurance Company, acting on behalf of its Separate Account P (“ULLICO”), PB Capital Partners, L.P. (“PB Capital”) and The Common Fund for Non-Profit Organizations (“The Common Fund”). The holders of the Series B Preferred Stock had previously been entitled to convert their shares to common stock at an exchange price of $9.68. The Company recognized a charge to earnings available to common shareholders of $13.7 million relative to this transaction in the Company’s calculation of basic and diluted earnings per share in 2000 (see Note (1)(i)).2000.
In connection with the Transaction, the Company amended its bylaws to remove provisions creating an Executive Committee of the Board of Directors and granting certain powers to it and amended its Restated Articles of Organization as of the Closing Date to increase the number of authorized shares of Common Stock from 15,000,000 shares to 40,000,000 shares and to amend the Series B Preferred Stock Certificate of Vote.shares. The Company also entered into a Shareholders’ Agreement and a Registration Rights Agreement, each by and among the Company, the New Investors, Ronald N. Tutor, BLUMBlum Capital Partners, L.P., PB Capital, The Common Fund and ULLICO dated as of the Closing Date. The Shareholders’ Agreement contains provisions that define, among other things, certain put and call rights and rights of first refusal between National Union and TSC, tag-along rights of the New Investors and former holders of Series B Preferred Stock and certain procedures to protect the Company’s use of its net operating losses (“NOLs”) for tax purposes. Since the Common Stock issued in connection with the Transaction was not registered under the Securities Act, the Registration Rights Agreement contains provisions that define the rights of the New Investors and former holders of Series B Preferred Stock to require the Company, under certain circumstances, to register some or all of the shares under the Securities Act after March 29, 2003. (See Note 15 “Subsequent Event” that describes a secondary offering in process based on the provisions of the Registration Rights Agreement.) In addition, the Company entered into an Amendment to the Shareholder Rights Agreement dated as of the Closing Date whereby the Transaction would not trigger the dilutive provisions of the Agreement.Agreement (see Note (8)(b)).
NOTES TO CONSOLIDATED FINANCIAL STATEMENTS
For the Years Ended December 31, 2003, 2002 and 2001 (continued)
[7] Recapitalization (continued)
As of March 29, 2000, the shares of Common Stock issued in the Purchase represented approximately 42% of the Company’s voting rights and the shares of Common Stock issued to the former holders of the Series B Preferred Stock represented approximately 33% of the Company’s voting rights. The New Investors have the right to nominate three members to the Company’s Board of Directors and the former holders of the Series B Preferred Stock continue to be entitled to nominate two members to the Company’s Board of Directors.
A Special Committee of the Company’s Board of Directors approved the Transaction after receiving a fairness opinion from an investment banking firm. A majority of outstanding common shares, including a majority of shares held by disinterested shareholders, were voted in favor of the Transaction at a Special Meeting of Stockholders held on March 29, 2000.
The shares of Common Stock issued in the Purchase represent approximately 42% of the Company’s voting rights and the New Investors have the right to nominate three members to the Company’s Board of Directors. The former holders of the Series B Preferred Stock now control approximately 33% of the Company’s voting rights and continue to be entitled to nominate two members to the Company’s Board of Directors.
In connection with the Transaction and as a condition thereto, the Company also entered into an Amended and Restated Credit Agreement with its lenders that extended the credit facility from January 2001 to January 2003 (see Note 3).
The effect of the Transaction on Stockholders’ Equity was to increase Stockholders’ Equity by approximately $76.2 million, $37.3 million from the Purchase (gross proceeds of $40.0 million less related capital expenses of $2.7 million) and $38.9 million from the Exchange (current accreted value of $41.2 million less non-accreted capital expenses of $2.3 million). See the Consolidated Statement of Stockholders’ Equity for the year ended December 31, 2000.
NOTES TO CONSOLIDATED FINANCIAL STATEMENTS
For the Years Ended December 31, 2002, 2001 and 2000 (continued)
[8] Capital Stock and Stock Purchase Warrants
(a) $21.25 Convertible Exchangeable Preferred Stock (“$21.25 Preferred Stock”)
In June 1987, net proceeds of approximately $23,631,000 were received from the sale of 1,000,000 Depositary Convertible Exchangeable Preferred Shares (each Depositary Share representing ownership of 1/10 of a share of $21.25 Convertible Exchangeable Preferred Stock, $1 par value) at a price of $25 per Depositary Share. Annual dividends are $2.125 per Depositary Share and are cumulative. Generally, the liquidation preference value is $25 per Depositary Share plus any accumulated and unpaid dividends. The $21.25 Preferred Stock of the Company, as evidenced by ownership of Depositary Shares, is convertible at the option of the holder, at any time, into Common Stock of the Company at a conversion price of $37.75 per share of Common Stock. The $21.25 Preferred Stock is$2.125 Depositary Shares are redeemable at the option of the Company at any time at $25 per share plus any unpaid dividends. The $21.25 Preferred Stock is also exchangeable at the option of the Company, in whole but not in part, on any dividend payment date into 8 1/2% 1/2% convertible subordinated debentures due in 2012 at a rate equivalent to $25 principal amount of debentures for each Depositary Share. In conjunction with the covenants of certain of the Company’s prior Credit Agreements, the Company was required to suspend the payment of quarterly dividends on its $21.25 Preferred Stock (equivalent to $2.125 per Depositary Share) until certain financial criteria were met. Dividends on the $21.25 Preferred Stock have not been declared since 1995 (although they have been fully accrued due to the “cumulative” feature of the $21.25 Preferred Stock). The aggregate amount of dividends in arrears is approximately $15,405,000$9,805,000 at December 31, 2002,2003, which represents approximately $154.05$175.32 per share of $21.25 Preferred Stock or approximately $15.41$17.53 per Depositary Share and is included in “Other Long-term Liabilities” in the accompanying Consolidated Balance Sheets. Under the terms of the $21.25 Preferred Stock, the holders of the Depositary Shares were entitled to elect two additional Directors since dividends had been deferred for more than six quarters and have done so at each of the last fivesix Annual Meetings of Stockholders.
(b) Redeemable Series B CumulativeOn June 9, 2003, the Company completed its tender offer to purchase up to 900,000 shares, or approximately 90% of its outstanding $2.125 Depositary Convertible Exchangeable Preferred StockShares (the “Depositary Shares”), each of which represents 1/10
Atth of a special stockholders’ meeting on January 17, 1997,share of the Company’s stockholders approved two proposals that allowed the Company to close an equity transaction with a private investor group. The transaction included, among other things, classification by the Board of Directors of 500,000 shares of Preferred Stock of the Company as Redeemable Series B Cumulative Convertible Preferred Stock, par value $1.00 per share, (the “Series B Preferred Stock”), issuance of 150,150 shares of Series B$21.25 Preferred Stock, at $200a purchase price of $25.00 per share, (or $30 million)net to the investor group, (with the remainder of the shares set aside for possible future payment-in-kind dividends to the holders of the Series B Preferred Stock), amendments to the Company’s Bylaws that redefined the Executive Committee and added certain powers (generally financialseller in nature), including the power to give overall direction to the Company’s Chief Executive Officer, appointment of three new members, recommended by the investor group, to the Board of Directors, and appointment of these same new directors to constitute a majority of the Executive Committee referred to above. Tutor-Saliba Corporation, a corporation controlled by the Chairman of the Board of Directors ofcash without interest. The tender offer which commenced on March 31, 2003, expired on June 9, 2003, at which time the Company who was also a member of the Executive Committee, is a participant in certain construction joint ventures with the Company (see Note 13 “Related Party Transactions”).
In-kind dividends on the Series B Preferred Stock were paid at an annual rate of 10% of the liquidation preference of $200.00 per share with additional shares of Series B Preferred Stock compounded on a quarterly basis. According to the terms of the Series B Preferred Stock, it (i) ranked junior in cash dividend and liquidation preference to the $21.25 Convertible Exchangeable Preferred Stock and senior to Common Stock, (ii) provided that no cash dividends will be paid on any shares of Common Stock except for certain limited dividends beginning in 2001, (iii) was convertible into shares of Common Stock at an initial conversion price of approximately $9.68 per share (equivalent to 3,101,571 shares on January 17, 1997), (iv) had the same voting rights as shareholders of Common Stock immediately equal to the number of shares of Common Stock into which the Series B Preferredpurchased 440,627 Depositary Shares.
NOTES TO CONSOLIDATED FINANCIAL STATEMENTS
For the Years Ended December 31, 2003, 2002 2001 and 20002001 (continued)
[8] Capital Stock and Stock Purchase Warrants (continued)
(b) Redeemable Series B Cumulative(a) $21.25 Convertible Exchangeable Preferred Stock (“$21.25 Preferred Stock”)(continued)
Stock could be converted, (v) generally had a liquidation preferenceThe completion of $200 per share of Series B Preferred Stock, (vi) was optionally redeemable bythe self tender offer resulted in the Company after three years atpurchasing and immediately retiring 440,627 Depositary Shares, a redemption price equalreduction of approximately $11.3 million, including related expenses, in Stockholders’ Equity, and a reversal of approximately $7.3 million of previously accrued and unpaid dividends relating to the liquidating value per share and higher amounts if a Special Default, as defined, had occurred, (vii)purchased shares that was mandatorily redeemable by the Company if a Special Default had occurred and a holder of the Series B Preferred Stock requested such a redemption, (viii) was mandatorily redeemable by the Company for approximately one-third of the shares still outstanding on January 17, 2005 and one-third of the shares in each of the next two years.
The initial proceeds ($30,030,000) received upon the issuance of 150,150 Series B Preferred Shares were reduced by related expenses of approximately $3.5 million. Due to the redeemable feature of the Series B Preferred Stock, this reduction had to be added back (or accreted) to reinstate its mandatory redemption value over a period of 8-10 years, with an offsetting chargerestored to paid-in surplus.
Concurrent with In addition, the Purchase described in Note 7 above$7.3 million of previously accrued and as a condition thereto,unpaid dividends was added to net income to determine net income available for common stockholders for the Company exchanged 100%purpose of its Series B Preferred Stockcomputing earnings per common share for Common Stock, $1.00 par value. See Note 7 for details of the Exchange and other changes related to the Series B Preferred Stock.
An analysis of Series B Preferred Stock transactions fromyear ended December 31, 1999 to the March 29, 2000 Exchange date follows:2003.
Number of Shares | Amount | ||||
| (in thousands) | |||||
Balance at December 31, 1999 | 200,184 | $ | 37,685 | ||
10% in-kind dividends issued | 5,802 | 1,161 | |||
Accretion | — | 96 | |||
Balance March 29, 2000 | 205,986 | $ | 38,942 | ||
(c)(b) Series A Junior Participating Preferred Stock
Under the terms of the Company’s Shareholder Rights Plan,Agreement, as amended, the Board of Directors of the Company declared a distribution on September 23, 1988 of one Preferred Stock purchase right (a “Right”) for each outstanding share of Common Stock. Under certain circumstances, each Right will entitle the holder thereof to purchase from the Company one one-hundredth of a share (a “Unit”) of Series A Junior Participating Cumulative Preferred Stock, $1 par value (the “Preferred Stock”), at an exercise price of $100 per Unit, subject to adjustment. The Rights will not be exercisable or transferable apart from the Common Stock until the earlier to occur of (i) 10 days following a public announcement that a person or group (an “Acquiring Person”) has acquired 20% or more of the Company’s outstanding Common Stock (the “Stock Acquisition Date”), (ii) 10 business days following the announcement by a person or group of an intention to make an offer that would result in such persons or group becoming an Acquiring Person or (iii) the declaration by the Board of Directors that any person is an “Adverse Person,”Person”, as defined under the Plan.Agreement. The Rights will not have any voting rights or be entitled to dividends.
Upon the occurrence of a triggering event as described above, each Right will be entitled to that number of Units of Preferred Stock of the Company having a market value of two times the exercise price of the Right. If the Company is acquired in a merger or 50% or more of its assets or earning power is sold, each Right will be
NOTES TO CONSOLIDATED FINANCIAL STATEMENTS
For the Years Ended December 31, 2002, 2001 and 2000 (continued)
[8] Capital Stock and Stock Purchase Warrants (continued)
(c) Series A Junior Participating Preferred Stock(continued)
entitled to receive Common Stock of the acquiring company having a market value of two times the exercise price of the Right. Rights held by such a person or group causing a triggering event may be null and void. The Rights are redeemable at $.02 per Right by the Board of Directors at any time prior to the occurrence of a triggering event.
On January 17, 1997, the Board of Directors amended the Company’s Shareholder Rights PlanAgreement to (i) permit the acquisition of the Series B Preferred Stock by certain investors (see Note 8(b) above), any additional Preferred Stock issued as a dividend thereon, any Common Stock issued upon conversion of the Series B Preferred Stock and certain other events without triggering the distribution of the Rights; (ii) lower the threshold for the occurrence of a Stock Acquisition Date from 20% to 10%; and (iii) extend the expiration date of the PlanAgreement from September 23, 1998 to January 21, 2007. In addition, the Board of Directors amended the Company’s Shareholder Rights Plan,Agreement, effective March 29, 2000, to permit the Purchase and Exchange as described in Note 7 above and certain other events without triggering the distribution of the Rights.
(d)(c) Stock Purchase Warrants
In connection with an Amended Credit Agreement effective January 17, 1997 with the Company’s bank group at that time, the bankersbanks received Stock Purchase Warrants to purchase up to 420,000 shares of the Company’s Common Stock, $1.00 par value, at a purchase price of $8.30 per share, subject to certain anti-dilution adjustments in the event of certain distributions and other corporate events, at any time during the ten
NOTES TO CONSOLIDATED FINANCIAL STATEMENTS
For the Years Ended December 31, 2003, 2002 and 2001 (continued)
[8] Capital Stock and Stock Purchase Warrants (continued)
(c) Stock Purchase Warrants(continued)
year period ending January 17, 2007. The grant date present value of the Stock Purchase Warrants ($2,233,000) was calculated using the Black-Scholes option pricing model and was accounted for by an increase in Stockholders’ Equity, with the offset being a valuation account netted against the related Revolving Credit Loans. The valuation account was amortized and charged against income over the three year term of the Credit Agreement ended in 2000.
In conjunction with the offsetting charge beingissuance of the Stock Purchase Warrants, the Company entered into a rights agreement with the warrantholders whereby the Company granted the warrantholders the right to Other (Income) Expense, Net.require it, upon request by holders of a majority of warrants and common stock received upon exercise of warrants, subject to the terms and conditions set forth in the agreement, to register the resale of shares of the common stock held by them upon exercise of their warrants. Under the agreement, the Company generally agreed to pay the fees and expenses of the selling stockholders in connection with any such registration.
[9] Stock Options
Effective May 25, 2000, the Company’s stockholders approved the adoption of the Special Equity Incentive Plan which provides that up to 3,000,000 shares of the Company’s Common Stock will be available for the granting of non-qualified stock options to key executives, employees and directors of the Company. Options are granted at not less than the fair market value on the date of grant, as defined. Options granted during the years ended December 31, 2000 and 2001 were granted at amounts ranging from fair market value to $1.50 per share in excess of fair market value. Options generally expire 10 years from the date of grant. Options outstanding under the Special Equity Incentive Plan are generally exercisable in three equal annual installments, on the date of grant and on the first and second anniversary of the date of grant, except for options granted on May 25, 2000 to purchase 62,700 shares that are exercisable in full on the third anniversarygrant. As of December 31, 2003, all of the date of grant.2,503,300 options outstanding were exercisable. A summary of stock option activity related to the Company’s Special Equity Incentive Plan is as follows:
Number of Shares | Option Price Per Share | Shares Available to Grant | ||||||||||
| Range | Weighted Average | |||||||||||
Approved May 25, 2000 | — | — | — | 3,000,000 | ||||||||
Granted | 2,792,700 | $ | 3.13-$4.50 | $ | 4.47 | (2,792,700 | ) | |||||
Outstanding at December 31, 2000 | 2,792,700 | $ | 3.13-$4.50 | $ | 4.47 | 207,300 | ||||||
Granted | 20,000 | $8.10 | $ | 8.10 | (20,000 | ) | ||||||
Exercised | (79,666 | ) | $4.50 | $ | 4.50 | — | ||||||
Outstanding at December 31, 2001 and 2002 | 2,733,034 | $ | 3.13-$8.10 | $ | 4.50 | 187,300 | ||||||
NOTES TO CONSOLIDATED FINANCIAL STATEMENTS
| Option Price Per Share | Shares Available to Grant | |||||||||||
Number of Shares | Range | Weighted Average | ||||||||||
Approved May 25, 2000 | — | — | — | 3,000,000 | ||||||||
Granted | 2,792,700 | $ | 3.13-$4.50 | $ | 4.47 | (2,792,700 | ) | |||||
Outstanding at December 31, 2000 | 2,792,700 | $ | 3.13-$4.50 | $ | 4.47 | 207,300 | ||||||
Granted | 20,000 | $6.85 | $ | 6.85 | (20,000 | ) | ||||||
Exercised | (79,666 | ) | $4.50 | $ | 4.50 | — | ||||||
Outstanding at December 31, 2001 | ||||||||||||
and 2002 | 2,733,034 | $ | 3.13-$6.85 | $ | 4.50 | 187,300 | ||||||
Exercised | (221,400 | ) | $ | 3.13-$4.50 | $ | 4.45 | — | |||||
Terminated | (8,334 | ) | $4.50 | $ | 4.50 | 8,334 | ||||||
Outstanding at December 31, 2003 | 2,503,300 | $ | 3.13-$6.85 | $ | 4.49 | 195,634 | ||||||
For the Years Ended December 31, 2002, 2001 and 2000 (continued)
[9] Stock Options (continued)
At December 31, 2001, 481,610 sharesShares of the Company’s authorized but unissued Common Stock werehave been reserved for issuance to employees under its 1982 Stock Option Plan. Options under this plan were granted at fair market value on the date of grant, as defined, and generally become exercisable in two equal annual installments on the second and third anniversary of the date of grant and expire eight to ten years from the date of grant. Options for 184,000 shares of Common Stock granted in 1992 and options for 10,000 shares of Common Stock granted in 1994 expired in 2002. In addition, during 2002Although the provisions
NOTES TO CONSOLIDATED FINANCIAL STATEMENTS
For the Years Ended December 31, 2003, 2002 and 2001 (continued)
[9] Stock Options (continued)
of the 1982 Stock Option Plan expired. Therefore, at December 31,expired during 2002, the onlyCompany still has 67,500 shares of the Company’s authorized but unissued Common Stock still reserved for issuance under the 1982 Stock Option Plan were the 67,500 shares applicable to the remaining outstanding options. As of December 31, 2003, all of the 67,500 options outstanding were exercisable. A summary of stock option activity related to the Company’s 1982 Stock Option Plan is as follows:
Number of Shares | Option Price Per Share | Shares Available to Grant | |||||||||
| Range | Weighted Average | ||||||||||
Outstanding at December 31, 2000 and 2001 | 261,500 | $ 5.29-$16.44 | $ | 13.43 | 220,110 | ||||||
Canceled | (194,000 | ) | $13.00-$16.44 | $ | 16.26 | (220,110 | ) | ||||
Outstanding at December 31, 2002 | 67,500 | $5.29 | $ | 5.29 | — | ||||||
| Option Price Per Share | Shares Available to Grant | |||||||||||
| Number of Shares | Range | Weighted Average | ||||||||||
Outstanding at December 31, 2001 | 261,500 | $ 5.29-$16.44 | $ | 13.43 | 220,110 | |||||||
Canceled | (194,000 | ) | $ | 13.00-$16.44 | $ | 16.26 | (220,110 | ) | ||||
Outstanding at December 31, 2002 and 2003 | 67,500 | $5.29 | $ | 5.29 | — | |||||||
In addition, the Company has authorized but unissued Common Stock reserved for certain other options granted as follows:
Grantee | Grant Date | Options Outstanding | Exercise Price | Grant Date | Options Outstanding | Exercise Price | ||||||||
Members of former Board Executive Committee, As Redefined (see Note 8) | 01/17/97 | 225,000 | $ | 8.38 | ||||||||||
Members of former Board Executive Committee, As Redefined | 01/17/97 | 225,000 | $ | 8.38 | ||||||||||
Certain Executive Officers | 01/19/98 | 135,000 | $ | 8.66 | 01/19/98 | 135,000 | $ | 8.66 | ||||||
Member of former Board Executive Committee | 12/10/98 | 45,000 | $ | 5.29 | 12/10/98 | 45,000 | $ | 5.29 | ||||||
| 01/04/99 | 30,000 | $ | 5.13 | 01/04/99 | 30,000 | $ | 5.13 | |||||||
The terms of these options are generally similar to options granted under the 1982 Plan, including the exercise price being equal to fair market value, as defined, at date of grant, and timing of installment exercise dates, except for the timing of the exercisability of the January 1997 options, which was May 17, 2000. As of December 31, 2003, all of the 435,000 options outstanding were exercisable.
Options outstanding at December 31, 20022003 and related weighted average price and life information follows:
Remaining Life | Grant Date | Options Outstanding | Options Exercisable | Exercise Price | Grant Date | Options Outstanding | Options Exercisable | Weighted Average Exercise Price | |||||||||
| 2 | 01/17/97 | 225,000 | 225,000 | $ | 8.38 | ||||||||||||
| 3 | 01/19/98 | 135,000 | 135,000 | $ | 8.66 | ||||||||||||
| 3 | 01/17/97 | 225,000 | 225,000 | $8.38 | 12/10/98 | 112,500 | 112,500 | $ | 5.29 | ||||||||
| 4 | 01/19/98 | 135,000 | 135,000 | $8.66 | 01/04/99 | 30,000 | 30,000 | $ | 5.13 | ||||||||
| 4 | 12/10/98 | 112,500 | 112,500 | $5.29 | |||||||||||||
| 5 | 01/04/99 | 30,000 | 30,000 | $5.13 | |||||||||||||
| 7 | 03/29/00 | 1,939,600 | 1,939,600 | $ | 4.50 | ||||||||||||
| 7 | 05/25/00 | 216,700 | 216,700 | $ | 4.15 | ||||||||||||
| 7 | 09/12/00 | 227,000 | 227,000 | $ | 4.50 | ||||||||||||
| 7 | 11/15/00 | 100,000 | 100,000 | $ | 4.50 | ||||||||||||
| 8 | 03/29/00 | 2,000,000 | 2,000,000 | $4.50 | 08/13/01 | 20,000 | 20,000 | $ | 6.85 | ||||||||
| 8 | 05/25/00 | 234,700 | 172,000 | $4.13 | |||||||||||||
| 8 | 09/12/00 | 378,334 | 378,334 | $4.50 | |||||||||||||
| 8 | 11/15/00 | 100,000 | 100,000 | $4.50 | |||||||||||||
| 9 | 07/09/01 | 20,000 | 13,334 | $8.10 | |||||||||||||
When options are exercised, the proceeds are credited to stockholders’ equity. In addition, the income tax savings attributable to nonqualified options exercised are credited to paid-in surplus.
NOTES TO CONSOLIDATED FINANCIAL STATEMENTS
For the Years Ended December 31, 2002, 2001 and 2000 (continued)
[9] Stock Options (continued)
The Company has elected the optional pro forma disclosures under SFAS No. 123, “Accounting for Stock-Based Compensation” as if the Company adopted the cost recognition requirements in 1995 (see Note 1(k)). The
NOTES TO CONSOLIDATED FINANCIAL STATEMENTS
For the Years Ended December 31, 2003, 2002 and 2001 (continued)
[9] Stock Options (continued)
Company has no options outstanding relating to either 1995 or 1996. The estimated values shown below and utilized in the Company’s pro forma SFAS No. 123 disclosures are based on the Black-Scholes option pricing model for options granted in 1997 through 2002.2003.
Grant Date | Fair Value | Assumptions | ||||||||||||||||||||||||||
| Assumptions | ||||||||||||||||||||||||||||
Grant Date | Fair Value | Dividend Yield | Expected Volatility | Risk-free Interest Rate | Expected Life | Fair Value | Dividend Yield | Expected Volatility | Risk-free Interest Rate | Expected Life | ||||||||||||||||||
| 0 | % | 39 | % | 6.50 | % | 8 | $ | 1,070,127 | 0 | % | 39 | % | 6.50 | % | 8 | |||||||||||||
07/08/97 | $ | 44,086 | 0 | % | 38 | % | 6.31 | % | 8 | $ | 44,086 | 0 | % | 38 | % | 6.31 | % | 8 | ||||||||||
01/19/98 | $ | 1,027,758 | 0 | % | 37 | % | 5.57 | % | 8 | $ | 1,027,758 | 0 | % | 37 | % | 5.57 | % | 8 | ||||||||||
12/10/98 | $ | 399,485 | 0 | % | 39 | % | 4.63 | % | 8 | $ | 399,485 | 0 | % | 39 | % | 4.63 | % | 8 | ||||||||||
01/04/99 | $ | 75,600 | 0 | % | 37 | % | 4.82 | % | 8 | $ | 75,600 | 0 | % | 37 | % | 4.82 | % | 8 | ||||||||||
03/29/00 | $ | 6,180,000 | 0 | % | 54 | % | 6.17 | % | 10 | $ | 6,180,000 | 0 | % | 54 | % | 6.17 | % | 10 | ||||||||||
05/25/00 | $ | 125,400 | 0 | % | 49 | % | 6.38 | % | 10 | $ | 125,400 | 0 | % | 49 | % | 6.38 | % | 10 | ||||||||||
05/25/00 | $ | 382,000 | 0 | % | 54 | % | 6.38 | % | 10 | $ | 382,000 | 0 | % | 54 | % | 6.38 | % | 10 | ||||||||||
09/12/00 | $ | 1,358,800 | 0 | % | 55 | % | 5.78 | % | 10 | $ | 1,358,800 | 0 | % | 55 | % | 5.78 | % | 10 | ||||||||||
11/15/00 | $ | 245,000 | 0 | % | 53 | % | 5.71 | % | 10 | $ | 245,000 | 0 | % | 53 | % | 5.71 | % | 10 | ||||||||||
07/09/01 | $ | 124,600 | 0 | % | 66 | % | 5.34 | % | 10 | |||||||||||||||||||
08/13/01 | $ | 124,600 | 0 | % | 66 | % | 5.34 | % | 10 | |||||||||||||||||||
[10] Employee Benefit Plans
The Company has a defined benefit pension plan that covers its executive, professional, administrative and clerical employees, subject to certain specified service requirements. The plan is noncontributory and benefits are based on an employee’s years of service and “final average earnings,”earnings”, as defined. The plan provides reduced benefits for early retirement and takes into account offsets for social security benefits. All employees are vested after five years of service. The Company also has an unfunded supplemental retirement plan for certain employees whose benefits under the defined benefit pension plan are reduced because of compensation limitations under federal tax laws. In accordance with SFAS No. 132,132R, “Employers’ Disclosures About Pensions and Other Post-Retirement Benefits,”Benefits”, pension disclosure as presented below includes aggregated amounts for both of the Company’s plans, except where otherwise indicated.
Net pension cost for 2003, 2002 2001 and 20002001 follows (in thousands):
| 2002 | 2001 | 2000 | 2003 | 2002 | 2001 | |||||||||||||||||||
Service cost – benefits earned during the period | $ | 1,459 | $ | 1,094 | $ | 963 | $ | 1,828 | $ | 1,459 | $ | 1,094 | ||||||||||||
Interest cost on projected benefit obligation | 4,529 | 4,404 | 4,259 | 4,674 | 4,529 | 4,404 | ||||||||||||||||||
Expected return on plan assets | (4,899 | ) | (4,831 | ) | (4,633 | ) | (4,545 | ) | (4,899 | ) | (4,831 | ) | ||||||||||||
Amortization of transition obligation | — | — | 6 | |||||||||||||||||||||
Amortization of prior service costs | 25 | (26 | ) | (4 | ) | 35 | 25 | (26 | ) | |||||||||||||||
Recognized actuarial loss | 56 | 68 | 33 | 665 | 56 | 68 | ||||||||||||||||||
Net pension cost | $ | 1,170 | $ | 709 | $ | 624 | $ | 2,657 | $ | 1,170 | $ | 709 | ||||||||||||
Actuarial assumptions used: | ||||||||||||||||||||||||
Actuarial assumptions used to determine net pension cost: | ||||||||||||||||||||||||
Discount rate | 7.25 | % | 7.50 | % | 7.75 | % | 6.75 | % | 7.25 | % | 7.50 | % | ||||||||||||
Rate of increase in compensation | 6.00 | % | 6.00 | % | 6.00 | % | 6.00 | % | 6.00 | % | 6.00 | % | ||||||||||||
Long-term rate of return on assets | 9.00 | % | 9.00 | % | 9.00 | % | 8.50 | % | 9.00 | % | 9.00 | % | ||||||||||||
The expected long-term rate of return on assets assumption will decrease to 7.50% effective January 1, 2004. The expected long-term rate of return on assets assumption was developed considering historical and future expectations for returns for each asset class.
NOTES TO CONSOLIDATED FINANCIAL STATEMENTS
For the Years Ended December 31, 2003, 2002 2001 and 20002001 (continued)
[10] Employee Benefit Plans (continued)
The target asset allocation for the Company’s pension plan by asset category for 2004 and the actual asset allocation at December 31, 2003 and 2002 by asset category are as follows:
| Percentage of Plan Assets at December 31, | |||||||||
Asset Category | Target Allocation 2004 | 2003 | 2002 | ||||||
Equity securities: | |||||||||
Domestic | 70.00 | % | 72.20 | % | 57.54 | % | |||
International | 0.00 | % | 0.00 | % | 10.09 | % | |||
Fixed income securities | 30.00 | % | 27.78 | % | 32.37 | % | |||
Real estate | 0.00 | % | 0.00 | % | 0.00 | % | |||
Other | 0.00 | % | 0.02 | % | 0.00 | % | |||
Total | 100.00 | % | 100.00 | % | 100.00 | % | |||
The target asset allocation was established to attempt to maximize returns with consideration of the long-term nature of the obligations and to reducing the level of overall market volatility through the allocation to fixed income investments. During the year, the asset allocation is reviewed for adherence to the target asset allocation and the portfolio of investments is rebalanced periodically.
Within the equity portfolio, the investments are primarily large capitalization domestic equities; however, the plan’s asset manager may invest in equities with small and medium capitalizations. The equity assets are invested in a broadly diversified portfolio with approximately 125 individual securities. Currently there is no allocation to international equities. Within the fixed income portfolio, the investments are entirely investment grade U.S. fixed income securities including both U.S. Government and U.S. Credit securities.
The Company expects to contribute $4 million to its pension plan in 2004.
The following tables provide a reconciliation of the changes of the fair value of assets in the plan and plan benefit obligations during the two year period ended December 31, 2002,2003, and a statement of the funded status as of December 31, 20022003 and 20012002 (in thousands):
Reconciliation of Fair Value of Plan Assets | ||||||||||||||||
| 2002 | 2001 | 2003 | 2002 | |||||||||||||
Balance at beginning of year | $ | 46,164 | $ | 52,567 | $ | 38,527 | $ | 46,164 | ||||||||
Actual return on plan assets | (6,387 | ) | (2,994 | ) | 3,403 | (6,387 | ) | |||||||||
Employer contribution | 2,370 | 159 | 3,157 | 2,370 | ||||||||||||
Benefit payments | (3,620 | ) | (3,568 | ) | (3,713 | ) | (3,620 | ) | ||||||||
Balance at end of year | $ | 38,527 | $ | 46,164 | $ | 41,374 | $ | 38,527 | ||||||||
Reconciliation of Projected Benefit Obligation | ||||||||||||||||
| 2002 | 2001 | 2003 | 2002 | |||||||||||||
Balance at beginning of year | $ | 64,244 | $ | 59,992 | $ | 70,803 | $ | 64,244 | ||||||||
Service cost | 1,459 | 1,094 | 1,828 | 1,459 | ||||||||||||
Interest cost | 4,529 | 4,404 | 4,674 | 4,529 | ||||||||||||
Plan amendments | 298 | — | — | 298 | ||||||||||||
Actuarial loss | 3,893 | 2,322 | 4,984 | 3,893 | ||||||||||||
Benefit payments | (3,620 | ) | (3,568 | ) | (3,713 | ) | (3,620 | ) | ||||||||
Balance at end of year | $ | 70,803 | $ | 64,244 | $ | 78,576 | $ | 70,803 | ||||||||
Funded Status | ||||||||||||||||
| 2002 | 2001 | |||||||||||||||
Funded status at December 31, | $ | (32,276 | ) | $ | (18,080 | ) | ||||||||||
Unrecognized prior service cost | 299 | 26 | ||||||||||||||
Unrecognized loss | 28,098 | 12,975 | ||||||||||||||
Net amount recognized, before additional minimum liability | $ | (3,879 | ) | $ | (5,079 | ) | ||||||||||
NOTES TO CONSOLIDATED FINANCIAL STATEMENTS
For the Years Ended December 31, 2003, 2002 and 2001 (continued)
[10] Employee Benefit Plans (continued)
Actuarial assumptions used to determine benefit obligations: | ||||||||
| 2003 | 2002 | |||||||
Discount rate | 6.25 | % | 6.75 | % | ||||
Rate of increase in compensation | 6.00 | % | 6.00 | % | ||||
Funded Status | ||||||||
| 2003 | 2002 | |||||||
Funded status at December 31, | $ | (37,202 | ) | $ | (32,276 | ) | ||
Unrecognized prior service cost | 263 | 299 | ||||||
Unrecognized loss | 33,559 | 28,098 | ||||||
Net liability recognized, before additional minimum liability | $ | (3,380 | ) | $ | (3,879 | ) | ||
The following table presents amounts included in the Consolidated Balance Sheets as of December 31, 20022003 and 20012002 (in thousands):
| 2002 | 2001 | 2003 | 2002 | |||||||||||||
Accrued benefit liability | $ | (23,812 | ) | $ | (10,970 | ) | $ | (27,705 | ) | $ | (23,812 | ) | ||||
Intangible asset (Note 6) | 360 | 26 | 312 | 360 | ||||||||||||
Accumulated other comprehensive income | 19,573 | 5,865 | 24,013 | 19,573 | ||||||||||||
Net amount recognized at year end | $ | (3,879 | ) | $ | (5,079 | ) | $ | (3,380 | ) | $ | (3,879 | ) | ||||
Other comprehensive income attributable to a change in the additional minimum pension liability recognized pursuant to SFAS No. 87, “Employers’ Accounting for Pensions” amounted to $4.4 million in 2003, $13.7 million in 2002 and $5.9 million in 2001. The cumulative amount of $19.6$24.0 million generally represents the excess of the accumulated benefit obligations of the Company’s pension plans over the fair value of the plans’ assets as of December 31, 20022003 compared to the unfunded accrued pension liability previously recognized. This amount is
NOTES TO CONSOLIDATED FINANCIAL STATEMENTS
For the Years Ended December 31, 2002, 2001 and 2000 (continued)
[10] Employee Benefit Plans (continued)
reflected as a long-term liability as of December 31, 20022003 (see Note 6) with the offset being a reduction in stockholders’ equity. Subsequent adjustments to the amount of this additional minimum pension liability will be recorded in future years, if required, based upon periodic re-evaluation of the funded status of the Company’s pension plans.
The Company’s plans have benefit obligations in excess of the fair value of the plans’ assets. Plan assets generally include equity and fixed income funds. The following table provides information relating to each of the plan’s benefit obligations compared to the fair value of its assets as of December 31, 20022003 and 20012002 (in thousands):
| 2002 | 2001 | 2003 | 2002 | |||||||||||||||||||||||||||||||||
| Pension Plan | Benefit Equalization Plan | Total | Pension Plan | Benefit Equalization Plan | Total | Pension Plan | Benefit Equalization Plan | Total | Pension Plan | Benefit Equalization Plan | Total | |||||||||||||||||||||||||
Projected benefit obligation | $ | 68,107 | $ | 2,696 | $ | 70,803 | $ | 61,470 | $ | 2,774 | $ | 64,244 | $ | 75,232 | $ | 3,344 | $ | 78,576 | $ | 68,107 | $ | 2,696 | $ | 70,803 | ||||||||||||
Accumulated benefit obligation | $ | 59,986 | $ | 2,353 | $ | 62,339 | $ | 54,894 | $ | 2,240 | $ | 57,134 | $ | 66,359 | $ | 2,720 | $ | 69,079 | $ | 59,986 | $ | 2,353 | $ | 62,339 | ||||||||||||
Fair value of plan assets | $ | 38,527 | $ | — | $ | 38,527 | $ | 46,164 | $ | — | $ | 46,164 | $ | 41,374 | $ | — | $ | 41,374 | $ | 38,527 | $ | — | $ | 38,527 | ||||||||||||
Projected benefit obligation greater than Fair value of plan assets | $ | 29,580 | $ | 2,696 | $ | 32,276 | $ | 15,306 | $ | 2,774 | $ | 18,080 | $ | 33,858 | $ | 3,344 | $ | 37,202 | $ | 29,580 | $ | 2,696 | $ | 32,276 | ||||||||||||
Accumulated benefit obligation greater than Fair value of plan assets | $ | 21,459 | $ | 2,353 | $ | 23,812 | $ | 8,730 | $ | 2,240 | $ | 10,970 | $ | 24,985 | $ | 2,720 | $ | 27,705 | $ | 21,459 | $ | 2,353 | $ | 23,812 | ||||||||||||
NOTES TO CONSOLIDATED FINANCIAL STATEMENTS
For the Years Ended December 31, 2003, 2002 and 2001 (continued)
[10] Employee Benefit Plans (continued)
The Company has a contributory Section 401(k) plan which covers its executive, professional, administrative and clerical employees, subject to certain specified service requirements. The 401(k) expense provision approximated $0.7 million in 2003 and 2002, and $0.1 million in 2001 and $0.6 million in 2000.2001. Prior to 2002, the Company’s contribution was generally based on a specified percentage of profits, subject to certain limitations, as well as approval by the Company’s Board of Directors of any discretionary Company contributions to the Section 401(k) plan. Beginning in 2002, the Company’s contribution is based on a non-discretionary match of employees’ contributions, as defined.
In addition, theThe Company has an incentive compensation plan for key employees which is generally based on the Company’s achievement of a certain level of profit.
The Company also contributes to various multi-employer union retirement plans under collective bargaining agreements which provide retirement benefits for substantially all of its union employees. The aggregate amounts provided in accordance with the requirements of these plans were approximately $4.3 million in 2003, $7.3 million in 2002 and $8.8 million in 2001 and $4.9 million in 2000.2001. The Multi-employer Pension Plan Amendments Act of 1980 defines certain employer obligations under multi-employer plans. Information regarding union retirement plans is not available from plan administrators to enable the Company to determine its share of unfunded vested liabilities.
NOTES TO CONSOLIDATED FINANCIAL STATEMENTS
For the Years Ended December 31, 2002, 2001 and 2000 (continued)
[11] Unaudited Quarterly Financial Data
The following table sets forth unaudited quarterly financial data for the years ended December 31, 2002 and 2001 (in thousands, except per share amounts):
| 2002 by Quarter | ||||||||||||
| 1st | 2nd | 3rd | 4th | |||||||||
Revenues | $ | 321,370 | $ | 268,307 | $ | 232,805 | $ | 262,559 | ||||
Gross profit | $ | 12,999 | $ | 12,363 | $ | 12,376 | $ | 20,912 | ||||
Net income | $ | 5,215 | $ | 4,690 | $ | 3,644 | $ | 9,525 | ||||
Basic earnings per common share | $ | 0.21 | $ | 0.18 | $ | 0.14 | $ | 0.39 | ||||
Diluted earnings per common share | $ | 0.20 | $ | 0.18 | $ | 0.14 | $ | 0.39 | ||||
| 2001 by Quarter | ||||||||||||
| 1st | 2nd | 3rd | 4th | |||||||||
Revenues | $ | 352,178 | $ | 421,222 | $ | 417,476 | $ | 362,520 | ||||
Gross profit | $ | 13,499 | $ | 14,857 | $ | 13,608 | $ | 15,598 | ||||
Net income | $ | 6,820 | $ | 7,359 | $ | 5,843 | $ | 6,396 | ||||
Basic earnings per common share | $ | 0.28 | $ | 0.30 | $ | 0.23 | $ | 0.26 | ||||
Diluted earnings per common share | $ | 0.28 | $ | 0.29 | $ | 0.22 | $ | 0.25 | ||||
NOTES TO CONSOLIDATED FINANCIAL STATEMENTS
For the Years Ended December 31, 2002, 2001 and 2000 (continued)
[12] Business Segments
Business segment information presented below was determined in accordance with SFAS No. 131, “Disclosures About Segments of an Enterprise and Related Information.”Information”.
The Company provides diversified general contracting, construction management and design-build services to private clients and public agencies throughout the United States and selected overseas locations.world. The Company’s construction business involvesis now conducted through three basic segments: building, civil and management services. The building segment is comprised of Perini Building Company and James A. Cummings, Inc., and focuses on large, complex projects in the hospitality and gaming, sports and entertainment, educational, transportation and healthcare markets. The civil segment is involved in public works construction primarily in the northeastern United States, including the repair, replacement and reconstruction of the United States public infrastructure such as highways, bridges and mass transit systems. The management services segment provides diversified construction, design-build and maintenance services to the U.S. military and government agencies as well as power producers, surety companies and multi-national corporations.
Historically, management had evaluated the Company’s operating results based on two basicreportable segments: building and civil. During the fourth quarter of 2003, the responsibilities of certain of the Company’s executive officers were adjusted and, in accordance with SFAS No. 131, the criteria for determining the Company’s reportable segments were reevaluated. Management determined that a third business segment, management services, would be included as a reportable segment beginning with the year ended December 31, 2003 to align the Company’s reportable segments with current management responsibilities. Previously, the management services operations were included as part of the building segment. The building operationmanagement services both private clientssegment aggregates contracts that have a higher than normal geopolitical and public agencies from offices located in Boston, Phoenix, Las Vegas, Detroitoperational risk and Celebration, FLa corresponding potential for greater than normal gross margin volatility. Segment information for each of the years ended December 31, 2002 and includes a broad range of building construction projects, such as hotels, casinos, healthcare facilities, correctional facilities, sports complexes, multi-unit residential, commercial, civic, cultural and educational facilities. The civil operation is focused on public civil work2001 presented in the East and selectively in other geographic locations and includes large, ongoing urban infrastructure repair and replacement projects such as highway and bridge rehabilitation, mass transit projects and waste water treatment facilities. tables set forth below have been reclassified to reflect this change.
During the years 20002001 through 2002,2003, the Company’s chief operating decision making group consisted of the Chairman and Chief Executive Officer, the President and Chief Operating Officer, the President of Perini
NOTES TO CONSOLIDATED FINANCIAL STATEMENTS
For the Years Ended December 31, 2003, 2002 and 2001 (continued)
[11] Business Segments (continued)
Building Company and the President of Perini Civil Construction. This group decides how to allocate resources and assess performance of the business segments. Generally, the Company evaluates performance of its operating segments on the basis of income from operations and cash flow. The accounting policies applied by each of the segments are the same as those described in the Summary of Significant Accounting Policies (see Note 1). The following tables set forth certain business and geographic segment information relating to the Company’s operations for each of the three years in the period ended December 31, 20022003 (in thousands):
| Reportable Segments | |||||||||||||||||||||||||||||||||||
| Building | Civil | Management Services | Totals | Corporate | Consolidated Total | ||||||||||||||||||||||||||||||
2003 | |||||||||||||||||||||||||||||||||||
Revenues | $ | 898,254 | $ | 176,877 | $ | 298,972 | $ | 1,374,103 | $ | — | $ | 1,374,103 | |||||||||||||||||||||||
Income from Construction Operations | $ | 12,462 | $ | 3,157 | $ | 23,711 | $ | 39,330 | $ | (8,840 | )(a) | $ | 30,490 | ||||||||||||||||||||||
Assets | $ | 225,139 | $ | 204,135 | $ | 80,649 | $ | 509,923 | $ | 55,520 | (b) | $ | 565,443 | ||||||||||||||||||||||
Capital Expenditures | $ | 1,520 | $ | 3,722 | $ | 157 | $ | 5,399 | $ | — | $ | 5,399 | |||||||||||||||||||||||
| Reportable Segments | Corporate | Consolidated Total | Reportable Segments | ||||||||||||||||||||||||||||||||
| Building | Civil | Totals | Building | Civil | Management Services | Totals | Corporate | Consolidated Total | |||||||||||||||||||||||||||
2002 | |||||||||||||||||||||||||||||||||||
Revenues | $ | 772,513 | $ | 312,528 | $ | 1,085,041 | $ | — | $ | 1,085,041 | $ | 631,860 | $ | 312,528 | $ | 140,653 | $ | 1,085,041 | $ | — | $ | 1,085,041 | |||||||||||||
Income from Operations | $ | 26,225 | $ | 6,390 | $ | 32,615 | $ | (6,735 | )(a) | $ | 25,880 | ||||||||||||||||||||||||
Income from Construction Operations | $ | 14,487 | $ | 6,390 | $ | 11,738 | $ | 32,615 | $ | (6,735 | )(a) | $ | 25,880 | ||||||||||||||||||||||
Assets | $ | 158,241 | $ | 223,036 | $ | 381,277 | $ | 21,112 | (b) | $ | 402,389 | $ | 130,270 | $ | 223,036 | $ | 27,971 | $ | 381,277 | $ | 21,112 | (b) | $ | 402,389 | |||||||||||
Capital Expenditures | $ | 2,175 | $ | 2,335 | $ | 4,510 | $ | — | $ | 4,510 | $ | 1,828 | $ | 2,335 | $ | 347 | $ | 4,510 | $ | — | $ | 4,510 | |||||||||||||
| Reportable Segments | Corporate | Consolidated Total | Reportable Segments | ||||||||||||||||||||||||||||||||
| Building | Civil | Totals | Building | Civil | Management Services | Totals | Corporate | Consolidated Total | |||||||||||||||||||||||||||
2001 | |||||||||||||||||||||||||||||||||||
Revenues | $ | 1,199,439 | $ | 353,957 | $ | 1,553,396 | $ | — | $ | 1,553,396 | $ | 1,120,161 | $ | 353,957 | $ | 79,278 | $ | 1,553,396 | $ | — | $ | 1,553,396 | |||||||||||||
Income from Operations | $ | 31,612 | $ | 3,918 | $ | 35,530 | $ | (6,029 | )(a) | $ | 29,501 | ||||||||||||||||||||||||
Income from Construction Operations | $ | 26,596 | $ | 3,918 | $ | 5,016 | $ | 35,530 | $ | (6,029 | )(a) | $ | 29,501 | ||||||||||||||||||||||
Assets | $ | 234,022 | $ | 246,326 | $ | 480,348 | $ | 20,893 | (b) | $ | 501,241 | $ | 213,463 | $ | 246,326 | $ | 20,559 | $ | 480,348 | $ | 20,893 | (b) | $ | 501,241 | |||||||||||
Capital Expenditures | $ | 1,408 | $ | 3,120 | $ | 4,528 | $ | — | $ | 4,528 | $ | 1,005 | $ | 3,120 | $ | 403 | $ | 4,528 | $ | — | $ | 4,528 | |||||||||||||
| Reportable Segments | Corporate | Consolidated Total | |||||||||||||||||||||||||||||||||
| Building | Civil | Totals | |||||||||||||||||||||||||||||||||
2000 | |||||||||||||||||||||||||||||||||||
Revenues | $ | 826,191 | $ | 279,469 | $ | 1,105,660 | $ | — | $ | 1,105,660 | |||||||||||||||||||||||||
Income from Operations | $ | 27,076 | $ | 5,624 | $ | 32,700 | $ | (5,345 | )(a) | $ | 27,355 | ||||||||||||||||||||||||
Assets | $ | 224,502 | $ | 215,886 | $ | 440,388 | $ | 47,090 | (b) | $ | 487,478 | ||||||||||||||||||||||||
Capital Expenditures | $ | 727 | $ | 1,066 | $ | 1,793 | $ | — | $ | 1,793 | |||||||||||||||||||||||||
| (a) | In all years, consists of corporate general and administrative expenses. |
| (b) | In all years, corporate assets consist principally of cash and cash equivalents, |
NOTES TO CONSOLIDATED FINANCIAL STATEMENTS
ForRevenues from various agencies of the Years Ended December 31, 2002, 2001 and 2000 (continued)
[12] Business Segments (continued)
United States federal government in the management services segment totaled approximately $225 million (or 16% of consolidated revenues) in 2003. Revenues from the Mohegan Sun Project in the building segment totaled approximately $153 million (or 14% of consolidated revenues)) in 2002 and $457 million (or 29%) in 2001 and $319 million (or 29%) in 2000.2001. Revenues from various agencies of the City of New York in the civil segment totaled approximately $185 million (or 17%) in 2002 and $185 million (or 12%) in 2001.
NOTES TO CONSOLIDATED FINANCIAL STATEMENTS
For the Years Ended December 31, 2003, 2002 and 2001 and $117 million (or 11%) in 2000.(continued)
[11] Business Segments (continued)
Information concerning principal geographic areas is as follows:follows (in thousands):
| Revenues | Revenues | |||||||||||||||||||||||
| 2002 | 2001 | 2000 | 2003 | 2002 | 2001 | |||||||||||||||||||
United States | $ | 1,029,097 | $ | 1,516,810 | $ | 1,065,304 | $ | 1,120,961 | $ | 1,029,097 | $ | 1,516,810 | ||||||||||||
Foreign and U.S. Territories | 55,944 | 36,586 | 40,356 | 253,142 | 55,944 | 36,586 | ||||||||||||||||||
Total | $ | 1,085,041 | $ | 1,553,396 | $ | 1,105,660 | $ | 1,374,103 | $ | 1,085,041 | $ | 1,553,396 | ||||||||||||
| Income (Loss) from Operations | Income (Loss) from Construction Operations | |||||||||||||||||||||||
| 2002 | 2001 | 2000 | 2003 | 2002 | 2001 | |||||||||||||||||||
United States | $ | 26,731 | $ | 32,654 | $ | 35,106 | $ | 23,009 | $ | 26,731 | $ | 32,654 | ||||||||||||
Foreign and U.S. Territories | 5,884 | 2,876 | (2,406 | ) | 16,321 | 5,884 | 2,876 | |||||||||||||||||
Corporate | (6,735 | ) | (6,029 | ) | (5,345 | ) | (8,840 | ) | (6,735 | ) | (6,029 | ) | ||||||||||||
Total | $ | 25,880 | $ | 29,501 | $ | 27,355 | $ | 30,490 | $ | 25,880 | $ | 29,501 | ||||||||||||
Income (loss) from construction operations has been allocated geographically based on the location of the job site. Long-lived assets outside the United States are immaterial and therefore not presented here.
There have been no differences from the last annual report in the basis of measuring segment profit or loss. The decrease in assets related to the building segment in 2002 compared to 2001 is due primarily to a decrease in retainage receivable on several large projects. This decrease is transitory and is not indicative of any long-term trend.
NOTES TO CONSOLIDATED FINANCIAL STATEMENTS
For the Years Ended December 31, 2002, 2001 and 2000 (continued)
[13]12] Related Party Transactions
Effective withAs a condition to a new investor group’s acquisition of shares of the issuance ofCompany’s Series B Preferred Stock for an aggregate of $30 million, which was approved by the stockholders in January 1997, the Company entered into an agreement with Tutor-Saliba Corporation (“TSC”), a California corporation engaged in the construction industry, and Ronald N. Tutor, Chief Executive Officer and sole stockholder of TSC, to provide certain management services, as defined. At January 17, 1997, TSC held 351,318 shares of the Company’s $1.00 par value Common Stock. TSC participates in joint ventures with the Company, the Company’s share of which contributed $49.0 million (or 3.6%), $48.8 million (or 4.5%), and $17.9 million and $4.6 million(or 1.2%) to the Company’s consolidated revenues in 2003, 2002 and 2001, respectively. The management agreement has been renewed annually by the Company’s Compensation Committee, which consists entirely of independent directors, under the same basic terms and conditions as the initial agreement except that the amount of the fee payable thereunder to Tutor-Saliba was increased effective January 1, 2000, respectively.from $150,000 to $250,000 per year and effective January 1, 2004, from $250,000 to $375,000 per year. Effective December 1, 2001, Mr. Tutor was appointedincluded as one ofa participant in the three new directors in accordance with the terms of the Series B Preferred Stock transaction,Company’s incentive compensation plan. Since January 17, 1997, Mr. Tutor has been a member of the Executive Committee of the Board and, during 1997, acting Chief Operating Officer of the Company. Effective January 1, 1998, Mr. Tutor was elected Vice Chairman of theCompany’s Board of Directors and an officer of Perini and effective July 1, 1999 was elected Chairman of the Board of Directors. EffectiveDirectors and effective March 29, 2000 Mr. Tutor was appointedelected Chairman and Chief Executive Officer of the Company.Officer. Compensation for the management services consists of payment of $250,000 per year to TSC, for each of the three years in the period ended December 31, 2003, stock options granted to Mr. Tutor, and incentive compensation of $231,000 awarded to Mr. Tutor of $250,000 in 2003, $231,000 in 2002 and $250,000 awarded to Mr. Tutor in 2001. All of the stock options granted to Mr. Tutor were granted at or above fair market value on the date of grant and are summarized as follows:
Grant Date | Option Price Per Share | Number of Shares | Expiration Date | ||||
01-17-97 | $ | 8.3750 | 150,000 | 01-16-05 | |||
12-10-98 | $ | 5.2875 | 45,000 | 12-09-06 | |||
01-04-99 | $ | 5.1250 | 30,000 | 01-03-07 | |||
03-29-00 | $ | 4.5000 | 1,000,000 | 03-28-10 | |||
NOTES TO CONSOLIDATED FINANCIAL STATEMENTS
For the Years Ended December 31, 2003, 2002 and 2001 (continued)
[12] Related Party Transactions (continued)
In late 2000, the Company entered into a joint venture arrangement with TSC, the sponsoring partner, whereby the Company was to primarily provide certain prequalification and proposal support services to the joint venture in return for a fixed fee of $500,000 payable subsequent to the award and start-up of the project. In addition, the agreement provided that the Company would not be liable for any costs, losses, liabilities or damages that may arise from the project. The Company recorded the $500,000 fixed fee as income in 2001 when its commitment to the joint venture was fulfilled.
Payment of the fee was received from TSC in February, 2002. In late 2001, the Company entered into a similar joint venture arrangement with TSC, the sponsoring partner, whereby the Company was to primarily provide certain prequalification and proposal support services to the joint venture in return for a fixed fee of $200,000 payable subsequent to the award and start-up of the project. In addition, the agreement provided that the Company would not be liable for any costs, losses, liabilities or damages that may arise from the project. The Company recorded the $200,000 fixed fee as income in 2002 when the contract was awarded to the joint venture. Payment of the fee was received from TSC in February, 2002.
In late 2002, the Company entered into an arrangement with TSC whereby TSC provided a financial guarantee in order for the Company to secure a performance and payment bond on a building project with an estimated contract value of approximately $135 million. As compensation for the financial guarantee, the Company paid TSC a fee of $1.0 million in February 2003.
NOTES TO CONSOLIDATED FINANCIAL STATEMENTS
For the Years Ended December 31, 2002, 2001 and 2000 (continued)
[13] Related Party Transactions (continued)
The new investors that provided $40 million of new equity in the Company on March 29, 2000 as described in Note 7 consist of Tutor-Saliba Corporation (see above), O&G Industries, Inc. (“O&G”), a participant in certain construction joint ventures with the Company, and National Union Fire Insurance Company of Pittsburgh, Pa., a wholly owned subsidiary of American International Group, Inc. (“AIG”), one of the Company’s sureties and a provider of insurance and insurance related services to the Company. After this investment, the cumulative holdings of each of the new investors were as follows:
| Number of Shares | Percentage of Total Shares Outstanding | Number of Common Shares | Percentage of Total Common Shares Outstanding | |||||||
TSC | 2,704,260 | 12.0 | % | 2,704,260 | 12.0 | % | ||||
O&G | 2,502,941 | 11.1 | % | 2,502,941 | 11.1 | % | ||||
AIG | 4,705,882 | 20.8 | % | 4,705,882 | 20.8 | % |
Each of the new investors is entitled to appoint a member to the Company’s Board of Directors. O&G participates in joint ventures with the Company, the Company’s share of which contributed $0.8 million and $0.6 million to the Company’s consolidated revenues in 2001.2003 and 2001, respectively. In addition, O&G is a 30% partner in a joint venture with the Company which was awarded a $137 million contract for a civil construction project in late 2003. Payments to AIG for surety, insurance and insurance related services approximated $7.8 million in 2003, $9.5 million in 2002 and $8.2 million in 2001 and $4.6 million in 2000.2001.
[14] Subsequent Events13] Land Held for Sale, Net
On January 23,Effective June 30, 1999, management adopted a plan to withdraw completely from the real estate development business and to wind down the operations of Perini Land and Development Company, the Company’s wholly owned real estate development subsidiary. Accordingly, approximately 98% of the property has been liquidated since June 30, 1999. Although the Company had a reasonable expectation that the plan, when adopted, could be executed within a twelve-month period, the plan was not entirely completed for a variety of reasons. As of December 31, 2003, the Company completed the acquisition of James A. Cummings, Inc., a privately held construction company based in Fort Lauderdale, Florida, for $20 million in cash, financed in part through the Company’s credit facility. James A. Cummings, Inc. is an established building construction and construction management company in the South Florida region specializing in the construction of schools, public and commercial facilities. At January 1, 2003, James A. Cummings, Inc. had a firm backlogonly land remaining to be sold consists of approximately $170 million. The acquisition will be effective64 fully developed acres in Raynham, Massachusetts. Management’s current plan is to continue to market the remaining land for sale as of January 1, 2003 and, accordingly, James A. Cummings, Inc. will be included in the Company’s consolidated results of operations and financial position beginning in the first quarter of 2003.a bulk sale or as individual parcels over an estimated 24 to 36 month “sell off” period.
PERINI CORPORATION AND SUBSIDIARIES
CONSOLIDATED CONDENSED BALANCE SHEETS (UNAUDITED)
SEPTEMBER 30, 2003 (UNAUDITED) AND DECEMBER 31, 2002
(In Thousands)
| SEPT. 30, 2003 | DEC. 31, 2002 | |||||||
| ASSETS | ||||||||
Cash and Cash Equivalents (Note 4) | $ | 45,376 | $ | 47,031 | ||||
Accounts and Notes Receivable | 256,341 | 218,172 | ||||||
Unbilled Work | 115,017 | 112,563 | ||||||
Land Held for Sale, Net | 2,057 | 2,173 | ||||||
Other Current Assets | 5,984 | 1,992 | ||||||
Total Current Assets | $ | 424,775 | $ | 381,931 | ||||
Property and Equipment, less Accumulated Depreciation of $21,956 in 2003 and $19,858 in 2002 | $ | 16,334 | $ | 14,042 | ||||
Other Assets | $ | 23,303 | $ | 6,416 | ||||
| $ | 464,412 | $ | 402,389 | |||||
| LIABILITIES AND STOCKHOLDERS’ EQUITY | ||||||||
Current Maturities of Long-term Debt (Note 7) | $ | 831 | $ | 416 | ||||
Accounts Payable | 213,093 | 162,456 | ||||||
Deferred Contract Revenue | 61,631 | 65,868 | ||||||
Accrued Expenses | 27,110 | 37,283 | ||||||
Total Current Liabilities | $ | 302,665 | $ | 266,023 | ||||
Long-term Debt, less current maturities included above (Note 7) | $ | 25,566 | $ | 12,123 | ||||
Other Long-term Liabilities (Note 11) | $ | 32,671 | $ | 37,594 | ||||
Contingencies and Commitments (Note 6) | ||||||||
Stockholders’ Equity (Note 8): | ||||||||
Preferred Stock | $ | 56 | $ | 100 | ||||
Series A Junior Participating Preferred Stock | — | — | ||||||
Stock Purchase Warrants | 2,233 | 2,233 | ||||||
Common Stock | 22,903 | 22,725 | ||||||
Paid-In Surplus | 91,137 | 95,546 | ||||||
Retained Earnings (Deficit) | 7,719 | (13,417 | ) | |||||
Less – Treasury Stock | (965 | ) | (965 | ) | ||||
| $ | 123,083 | $ | 106,222 | |||||
Accumulated Other Comprehensive Loss | (19,573 | ) | (19,573 | ) | ||||
Total Stockholders’ Equity | $ | 103,510 | $ | 86,649 | ||||
| $ | 464,412 | $ | 402,389 | |||||
The accompanying notes are an integral part of these consolidated condensed financial statements.
PERINI CORPORATION AND SUBSIDIARIES
CONSOLIDATED CONDENSED STATEMENT OF INCOME (UNAUDITED)
FOR THE NINE MONTHS ENDED SEPTEMBER 30, 2003 AND 2002
(In Thousands, Except Share and Per Share Data)
NINE MONTHS ENDED SEPT. 30, | ||||||||
| 2003 | 2002 | |||||||
Revenues (Note 12) | $ | 873,451 | $ | 822,482 | ||||
Cost of Operations | 829,590 | 784,744 | ||||||
Gross Profit | $ | 43,861 | $ | 37,738 | ||||
General and Administrative Expenses | 27,709 | 22,132 | ||||||
INCOME FROM CONSTRUCTION OPERATIONS (Note 12) | $ | 16,152 | $ | 15,606 | ||||
Other Income (Expense), Net | (428 | ) | (360 | ) | ||||
Interest Expense | (701 | ) | (1,146 | ) | ||||
Income before Income Taxes | $ | 15,023 | $ | 14,100 | ||||
Credit (Provision) for Income Taxes (Note 9) | 6,410 | (551 | ) | |||||
NET INCOME | $ | 21,433 | $ | 13,549 | ||||
Less: Accrued Dividends on $21.25 Preferred Stock (Note 11) | (1,356 | ) | (1,594 | ) | ||||
Plus: Reversal of Accrued Dividends on $21.25 Preferred Stock based on results of 2003 tender offer (Notes 8 and 11) | 7,254 | — | ||||||
NET INCOME AVAILABLE FOR COMMON STOCKHOLDERS | $ | 27,331 | $ | 11,955 | ||||
BASIC EARNINGS PER COMMON SHARE (Note 10) | $ | 1.20 | $ | 0.53 | ||||
DILUTED EARNINGS PER COMMON SHARE (Note 10) | $ | 1.17 | $ | 0.52 | ||||
DIVIDENDS PER COMMON SHARE (Note 11) | $ | — | $ | — | ||||
WEIGHTED AVERAGE COMMON SHARES OUTSTANDING (Note 10): | ||||||||
BASIC | 22,726,132 | 22,664,135 | ||||||
Effect of Dilutive Stock Options Outstanding | 672,564 | 363,945 | ||||||
DILUTED | 23,398,696 | 23,028,080 | ||||||
The accompanying notes are an integral part of these consolidated condensed financial statements.
PERINI CORPORATION AND SUBSIDIARIES
CONSOLIDATED CONDENSED STATEMENT OF STOCKHOLDERS’ EQUITY (UNAUDITED)
FOR THE NINE MONTHS ENDED SEPTEMBER 30, 2003
(In Thousands, Except Share Data )
Preferred Stock | Stock Purchase Warrants | Common Stock | Paid-In Surplus | Retained Earnings (Deficit) | Treasury Stock | Accumulated Other Comprehensive Loss | Total | |||||||||||||||||||||||
Balance - December 31, 2002 | $ | 100 | $ | 2,233 | $ | 22,725 | $ | 95,546 | $ | (13,417 | ) | $ | (965 | ) | $ | (19,573 | ) | $ | 86,649 | |||||||||||
Net income | — | — | — | — | 21,433 | — | — | 21,433 | ||||||||||||||||||||||
Preferred stock tendered (Note 8) | (44 | ) | — | — | (11,217 | ) | — | — | — | (11,261 | ) | |||||||||||||||||||
Reversal of dividends previously accrued on preferred stock tendered (Note 8) | — | — | — | 7,243 | 11 | — | — | 7,254 | ||||||||||||||||||||||
Preferred stock dividends accrued ( $15.938 per share *) | — | — | — | (1,048 | ) | (308 | ) | — | — | (1,356 | ) | |||||||||||||||||||
Common stock options exercised | — | — | 178 | 613 | — | — | — | 791 | ||||||||||||||||||||||
Balance - September 30, 2003 | $ | 56 | $ | 2,233 | $ | 22,903 | $ | 91,137 | $ | 7,719 | $ | (965 | ) | $ | (19,573 | ) | $ | 103,510 | ||||||||||||
The accompanying notes are an integral part of these consolidated condensed financial statements.
PERINI CORPORATION AND SUBSIDIARIES
CONSOLIDATED CONDENSED STATEMENTS OF CASH FLOWS (UNAUDITED)
FOR THE NINE MONTHS ENDED SEPTEMBER 30, 2003 AND 2002
(In Thousands)
NINE MONTHS ENDED SEPTEMBER 30, | ||||||||
| 2003 | 2002 | |||||||
Cash Flows from Operating Activities: | ||||||||
Net income | $ | 21,433 | $ | 13,549 | ||||
Adjustments to reconcile net income to net cash from operating activities: | ||||||||
Depreciation and amortization | 2,524 | 2,309 | ||||||
Cash used by changes in components of working capital other than cash, current maturities of long-term debt and deferred tax asset | (12,592 | ) | (49,607 | ) | ||||
Net deferred tax asset | (7,270 | ) | — | |||||
Other long-term liabilities | 975 | (941 | ) | |||||
Other non-cash items, net | (444 | ) | (32 | ) | ||||
NET CASH PROVIDED FROM (USED BY) OPERATING ACTIVITIES | $ | 4,626 | $ | (34,722 | ) | |||
Cash Flows from Investing Activities: | ||||||||
Proceeds from sale of property and equipment | $ | 767 | $ | 140 | ||||
Acquisition of property and equipment | (4,406 | ) | (3,710 | ) | ||||
Acquisition of James A. Cummings, Inc., net of cash balance acquired (Note 5) | (8,613 | ) | — | |||||
Proceeds from (investment in) land held for sale, net | 2,125 | (265 | ) | |||||
Proceeds from sale of marketable securities | 380 | — | ||||||
Investment in other activities | 78 | (498 | ) | |||||
NET CASH USED BY INVESTING ACTIVITIES | $ | (9,669 | ) | $ | (4,333 | ) | ||
Cash Flows from Financing Activities: | ||||||||
Proceeds from long-term debt | $ | 14,192 | $ | 26,816 | ||||
Reduction of long-term debt | (334 | ) | (10,135 | ) | ||||
Purchase of Preferred Stock pursuant to Tender Offer (Note 8) | (11,261 | ) | — | |||||
Proceeds from exercise of common stock options | 791 | — | ||||||
NET CASH PROVIDED FROM FINANCING ACTIVITIES | $ | 3,388 | $ | 16,681 | ||||
Net Decrease in Cash | $ | (1,655 | ) | $ | (22,374 | ) | ||
Cash at Beginning of Year | 47,031 | 56,542 | ||||||
Cash at End of Period | $ | 45,376 | $ | 34,168 | ||||
Supplemental Disclosure of Cash Paid During the Period For: | ||||||||
Interest | $ | 745 | $ | 1,118 | ||||
Income taxes | $ | 1,078 | $ | 1,401 | ||||
The accompanying notes are an integral part of these consolidated condensed financial statements.
PERINI CORPORATION AND SUBSIDIARIES
NOTES TO CONSOLIDATED CONDENSED FINANCIAL STATEMENTS
(1)Basis of PresentationFor the Years Ended December 31, 2003, 2002 and 2001 (continued)
The unaudited consolidated condensed financial statements presented herein have been prepared in accordance with the instructions to Form 10-Q and do not include all of the information and note disclosures required by accounting principles generally accepted in the United States of America. These statements should be read in conjunction with the financial statements and notes thereto included in the Company’s Form 10-K[13] Land Held for Sale, Net (continued)
During the year ended December 31, 2002. In the opinion2003, 61 acres were sold resulting in a net gain of management, the accompanying unaudited consolidated condensed financial statements include all adjustments, consisting only of normal recurring adjustments, necessary to present fairly the Company’s financial position as of September 30, 2003 and December 31, 2002, results of operations for the three month and nine month periods ended September 30, 2003 and 2002, and cash flows for the nine month periods ended September 30, 2003 and 2002. The results of operations for the nine month period ended September 30, 2003 may not be indicative of the results that may be expected for the year ending December 31, 2003 because the Company’s results are primarily generated from a limited number of significant active construction contracts. Therefore, such results can vary depending on the timing of progress achieved and changes in estimated profitability of projects being reported.
(2)Significant Accounting Policies
The significant accounting policies followed by the Company and its subsidiaries in preparing its consolidated financial statements are set forth inapproximately $2.2 million. (See Note (1) to such financial statements included in Form 10-K for6.) During the year ended December 31, 2002. The Company has made2002, 19 acres were sold with no significant change in these policies during 2003.gain or loss recognized. Land costs are allocated to reduce the related sales proceeds based on both the specific cost identification method for certain parcels and average cost per acre sold method on the remaining parcels.
(3)Stock-Based Compensation[14] Unaudited Quarterly Financial Data
The Company accounts for stock options granted to employees and directors using the intrinsic value method prescribed in Accounting Principles Board Opinion No. 25, “Accounting for Stock Issued to Employees,” and related Interpretations. No stock-based employee compensation cost is reflected in net income since all stock options granted by the Company had an exercise price equal to or greater than the fair market value of the underlying common stock on the measurement date. The following table illustratessets forth unaudited quarterly financial data for the effect on net income and earnings per share if the Company had applied the fair value recognition provisions of SFAS No. 123, “Accounting for Stock-Based Compensation,” to stock-based employee and director compensation (in thousands). The effect of applying SFAS No. 123 in this pro forma disclosure may not be indicative of future charges.
Nine Months Ended September 30, | |||||||
| 2003 | 2002 | ||||||
Net income, as reported | $ | 21,433 | $ | 13,549 | |||
Less: Total stock-based employee compensation expense determined under fair value based method for all awards | — | (2,124 | ) | ||||
Net income, pro forma | $ | 21,433 | $ | 11,425 | |||
Basic earnings per common share: | |||||||
As reported (see Note 10) | $ | 1.20 | $ | 0.53 | |||
Pro forma | $ | 1.20 | $ | 0.43 | |||
Diluted earnings per common share: | |||||||
As reported (see Note 10) | $ | 1.17 | $ | 0.52 | |||
Pro forma | $ | 1.17 | $ | 0.42 | |||
PERINI CORPORATION AND SUBSIDIARIES
NOTES TO CONSOLIDATED CONDENSED FINANCIAL STATEMENTS (Continued)
(4)Cash and Cash Equivalents
Cash equivalents include short-term, highly liquid investments with original maturities of three months or less.
Cash and cash equivalents as reported in the accompanying Consolidated Condensed Balance Sheets consist of amounts held by the Company that are available for general corporate purposes and the Company’s proportionate share of amounts held by construction joint ventures that are available only for joint venture-related uses. Cash held by construction joint ventures is distributed from time to time to the Company and to the other joint venture participants in accordance with their percentage interest after the joint venture partners determine that a cash distribution is prudent. Cash distributions received by the Company from its construction joint ventures are then available for general corporate purposes. At September 30, 2003 andyears ended December 31, 2002, cash and cash equivalents consisted of the following (in thousands):
| Sept. 30, 2003 | Dec. 31, 2002 | |||||
Corporate cash and cash equivalents (available for general corporate purposes) | $ | 16,959 | $ | 11,220 | ||
Company’s share of joint venture cash and cash equivalents (available only for joint venture purposes, including future distributions) | 28,417 | 35,811 | ||||
| $ | 45,376 | $ | 47,031 | |||
(5)Acquisition of James A. Cummings, Inc.
On January 23, 2003, the Company completed the acquisition of 100% of the outstanding common stock of James A. Cummings, Inc. (“Cummings”), a privately held construction company based in Fort Lauderdale, Florida, for $20 million in cash, financed in part through the Company’s credit facility. Cummings is an established building construction and construction management company in the South Florida region specializing in the construction of schools, municipal buildings, and commercial facilities. At January 1, 2003, Cummings had a firm backlog of approximately $170 million. The acquisition is effective as of January 1, 2003 and accordingly, Cummings’ financial results are included in the Company’s consolidated results of operations and financial position beginning in the first quarter of 2003.
The transaction was accounted for using the purchase method of accounting as required by FASB Statement No. 141, “Business Combinations.” Goodwill and identifiable intangible assets recorded in the acquisition will be tested periodically for impairment as required by FASB Statement No. 142 “Goodwill and Other Intangible Assets.” The allocation of acquisition costs, which consists of the $20 million cash consideration referred to above and $565,000 of other direct acquisition costs, is as follows (in thousands):
Current assets | $ | 34,419 | ||
Property and equipment, net | 394 | |||
Other long-term assets | 23 | |||
Goodwill | 12,990 | |||
Other identifiable intangible assets | 575 | |||
Total assets acquired | $ | 48,401 | ||
Less - Liabilities assumed | (27,836 | ) | ||
Total Consideration and Acquisition Costs | $ | 20,565 | ||
PERINI CORPORATION AND SUBSIDIARIES
NOTES TO CONSOLIDATED CONDENSED FINANCIAL STATEMENTS (Continued)
(5)Acquisition of James A. Cummings, Inc. (continued)
Since the acquisition was effective as of January 1, 2003, the Company’s actual 2003 year to date results include Cummings for the total period. Therefore, the following pro forma financial information is only presented for the comparative nine month period ended September 30, 2002 (in thousands, except per share data)amounts):
Nine Months Ended September 30, 2002 | ||||||
| Actual | Pro forma | |||||
Revenues | $ | 822,482 | $ | 895,511 | ||
Gross profit | $ | 37,738 | $ | 42,523 | ||
Net income | $ | 13,549 | $ | 15,461 | ||
Basic earnings per common share | $ | 0.53 | $ | 0.61 | ||
Diluted earnings per common share | $ | 0.52 | $ | 0.60 | ||
The pro forma results have been prepared for comparative purposes only and include certain adjustments such as increased interest expense on acquisition debt and additional amortization expenses related to intangible assets arising from the acquisition. The pro forma results are not necessarily indicative either of the results of operations that actually would have resulted had the acquisition been in effect on January 1, 2002 or of future results.
| 2003 by Quarter | ||||||||||||||||
| 1st | 2nd | 3rd | 4th | |||||||||||||
Revenues | $ | 291,260 | $ | 286,336 | $ | 295,855 | $ | 500,652 | ||||||||
Gross profit | $ | 13,703 | $ | 14,370 | $ | 15,788 | $ | 26,391 | ||||||||
Net income | $ | 11,419 | (a) | $ | 3,618 | $ | 6,396 | $ | 22,585 | (a) | ||||||
Basic earnings per common share | $ | 0.48 | (a) | $ | 0.43 | (b) | $ | 0.29 | (b) | $ | 0.97 | (a) | ||||
Diluted earnings per common share | $ | 0.48 | (a) | $ | 0.41 | (b) | $ | 0.28 | (b) | $ | 0.92 | (a) | ||||
| 2002 by Quarter | ||||||||||||||||
| 1st | 2nd | 3rd | 4th | |||||||||||||
Revenues | $ | 321,370 | $ | 268,307 | $ | 232,805 | $ | 262,559 | ||||||||
Gross profit | $ | 12,999 | $ | 12,363 | $ | 12,376 | $ | 20,912 | ||||||||
Net income | $ | 5,215 | $ | 4,690 | $ | 3,644 | $ | 9,525 | ||||||||
Basic earnings per common share | $ | 0.21 | $ | 0.18 | $ | 0.14 | $ | 0.39 | ||||||||
Diluted earnings per common share | $ | 0.20 | $ | 0.18 | $ | 0.14 | $ | 0.39 | ||||||||
| (a) | The first quarter of 2003 includes the recognition of a $7.0 million tax benefit in accordance with SFAS No. 109 (or approximately $0.31 per share) related to a reduction in the tax valuation allowance and the fourth quarter of 2003 includes the recognition of $7.9 million similar tax benefit (or approximately $0.34 per share). |
| (b) | The second quarter of 2003 includes $6.7 million (or approximately $0.29 per share) and the third quarter of 2003 includes $0.6 million (or approximately $0.03 per share) added back to net income in the calculation of income available for common stockholders that represented the reversal of dividends previously accrued, but no longer required as a result of the Company’s tender offer. See Note 8(a). |
(6)Contingencies and Commitments[15] Subsequent Event
(a) Mergentime – Perini Joint Ventures Vs. WMATA Matter
On May 11, 1990, contractsPursuant to the exercise of registration rights by certain of our stockholders, we have filed a registration statement for an underwritten secondary offering with two joint ventures in which Perini Corporationrespect to 5,910,800 shares of our common stock held a minority interest (“Joint Ventures”) were terminatedby such stockholders. The registration statement is pending with the Securities and Exchange Commission and it has not yet become effective. The shares of common stock are being sold by the Washington Metropolitan Area Transit Authority (“WMATA”) on two adjacent subway construction contractsselling stockholders and we will not receive any proceeds from the sale. We expect the offering to be completed in the Districtsecond quarter of Columbia. The contracts were awarded to the Joint Ventures in 1985 and 1986. However, Perini and Mergentime Corporation (“Mergentime”), the 60% managing partner, entered into an agreement in 1987 under which Perini withdrew from the Joint Ventures and Mergentime assumed complete control over the performance of both projects. This agreement did not relieve Perini of its responsibilities to WMATA as a Joint Venture partner. After Perini withdrew from the Joint Ventures, Mergentime and WMATA were embroiled in a dispute regarding progress on the projects. Each party blamed the other for delays that were impacting both cost and progress and the parties were unable to resolve their dispute. Ultimately, both construction contracts were terminated by WMATA and WMATA retained Perini, acting independently, to complete both projects.
Subsequently, the Joint Ventures brought an action in the United States District Court for the District of Columbia against WMATA, seeking damages for delays, unpaid extra work and wrongful termination and WMATA brought an action against the Joint Ventures seeking damages for additional2004. We have accrued estimated costs to complete the projects. After a bench trial before two District Court Judges (the initial Judge died before the matter could be concluded), the District Court found the Joint Ventures liable to WMATA for damages in the amount of approximately $16.5 million and WMATA liable to the Joint Ventures for damages in the amount of approximately $4.3 million.
The Joint Ventures appealed the judgment to the United States Court of Appeals for the District of Columbia (“Court of Appeals”), arguing, among other things, that the second District Court Judge had issued his final decision without fully familiarizing himself with the record of the initial District Court Judge. On February 16, 1999, the Court of Appeals vacated the District Court’s final judgment and ordered the successor District
PERINI CORPORATION AND SUBSIDIARIES
NOTES TO CONSOLIDATED CONDENSED FINANCIAL STATEMENTS (Continued)
(6)Contingencies and Commitments (continued)
(a) Mergentime – Perini Joint Ventures Vs. WMATA Matter(continued)
Court Judge to review the findings of the initial Judge and hold further hearings in regard to the Joint Venture’s affirmative claims. In addition, the Court of Appeals held that statutory interest on any of the claims will not accrue until final judgment is entered sometime in the future. Later in 1999, the case was transferred to a new successor District Court Judge.
On February 28, 2001, the new successor District Court Judge informed the parties that in the absence of a new trial, he could not certify adequate familiarity with the record to complete the remaining proceedings; therefore, he ordered that the Joint Ventures’ motion for a new trial be granted.
A new trial before the new successor District Court Judge was completed in January 2002 and a decision is still pending. The ultimate financial impact of the Judge’s pending decision is not yet determinable; therefore, no provision for loss, if any, has been recorded in the financial statements.
(b) Tutor–Saliba–Perini Joint Venture vs. Los Angeles MTA Matter
During 1995, a joint venture, Tutor-Saliba-Perini (“TSP”), in which Perini Corporation is a 40% minority partner and Tutor-Saliba Corporation of Sylmar, CA is the 60% managing partner, filed a complaint in the Superior Court of the State of California for the County of Los Angeles against the Los Angeles County Metropolitan Transportation Authority (“MTA”) seeking to recover costs for extra work required by the MTA$991,000 in connection with the construction of certain tunnelsecondary offering and station projects. In February 1999 the MTA countered with civil claims under the California False Claims Act against TSP, Tutor-Saliba Corporation and Perini Corporation. Ronald N. Tutor, the Chairman and CEO of Perini Corporation since March of 2000, is also the CEO and the sole stockholder of Tutor-Saliba Corporation.
Claims concerning the construction of the MTA projects were tried before a Jury in 2001. During trial, the Judge ruled that TSP had failed to comply with the Court’s prior discovery orders and the Judge penalized TSP for its alleged non-compliance by dismissing TSP’s claim and by ruling, without a Jury finding, that TSP was liable to the MTA for damages on the MTA’s counterclaim. The Judge then instructed the Jury that TSP was liable to the MTA and charged the Jury with the responsibility of determining the amount of the damages based on the Judge’s ruling. The Jury awarded the MTA approximately $29.6 million in damages.
On March 26, 2002, the Judge amended the award, ordering TSP to pay the MTA an additional $33.4 million in costs and attorney fees, with the aggregate $63.0 million award subject to interest at an annual rate of 10% from the date of the award.
TSP and the other plaintiffs/defendants in counterclaim have appealed the Judge’s discovery sanction, the subsequent Jury award and the amended award. The ultimate financial impact of the Judge’s ruling and/or the awards is not yet determinable. Therefore, no provision for loss, if any, has been recorded in the financial statements.
(c) Citycharged against paid-in surplus as of San Francisco vs. Tutor-Saliba, Perini & Buckley Joint Venture Matter
In November 2002, the San Francisco City Attorney, on behalf of the City and County of San Francisco and the citizens of California (“Plaintiffs”), filed a civil action with a demand for a jury trial against Tutor-Saliba Corporation (“TSC”), the Tutor-Saliba, Perini & Buckley, Joint Venture (“JV”), Perini Corporation (“Perini”), Buckley & Company, Inc. (“Buckley”) and their bonding companies in the United States District Court in San Francisco relating to seven projects for work on the expansion of the San Francisco International Airport. A
PERINI CORPORATION AND SUBSIDIARIES
NOTES TO CONSOLIDATED CONDENSED FINANCIAL STATEMENTS (Continued)
(6)Contingencies and Commitments (continued)
(c) City of San Francisco vs. Tutor-Saliba, Perini & Buckley Joint Venture Matter (continued)
Second Amended Complaint was filed in July 2003 which, among other things, added Ronald N. Tutor as a defendant. The JV was established by TSC, Perini and Buckley through two Joint Venture Agreements dated October 28, 1996 and February 11, 1997 (“Joint Venture Agreements”). The JV had agreements with the Owner to perform work (“Contracts”) on two of the above projects (“Projects”) and, as part of those Contracts, the JV provided performance and payment bonds to the Owner (“Bonds”).
In the Second Amended Complaint, the Plaintiffs allege, among other things, various overcharges, bidding violations, violations of minority contracting regulations, civil fraud, and violation of the California and San Francisco False Claims and California Unfair Competition Acts. In addition, the Plaintiffs allege that the defendants have violated the United States Racketeer Influenced Corrupt Organizations Act. The Plaintiffs have asserted $30 million in damages and are seeking treble damages, punitive and exemplary damages, various civil penalties and a declaration that TSC and the JV are irresponsible bidders.
On October 3, 2003, the Court granted the defendants’ motion to specify damages allegedly sustained for each contract. The defendants’ motion to dismiss the Plaintiff’s Second Amended Complaint is on file and not yet ruled upon by the Court.
TSC is the managing partner of the JV and, in December 1997, Perini sold its entire 20% interest in the JV to TSC. As part of that sale agreement, TSC agreed to indemnify Perini from any liability that Perini is required to pay by reason of or arising out of any event or occurrence subsequent to the date of the sale of Perini’s interest in the JV in any way connected with the Joint Venture Agreements, the Contracts, the Projects, and the Bonds. The ultimate financial impact of this action is not yet determinable.
(d) Perini/Kiewit/Cashman Joint Venture – Central Artery/Tunnel Project Matter
Perini/Kiewit/Cashman Joint Venture (“PKC”), a joint venture in which Perini Corporation holds a 56% interest and is the managing partner, is currently pursuing a series of claims for additional contract time and/or compensation against the Massachusetts Highway Department (“MHD”) for work performed by PKC on a portion of the Central Artery/Tunnel project in Boston, Massachusetts. The claims relate to the construction of the Northbound Mainline Central Artery Tunnel from Kneeland Street to Congress Street. During construction, MHD ordered PKC to perform changes to the work and issued related direct cost changes with an estimated value, excluding time delay and inefficiency costs, in excess of $100 million.
In addition, PKC encountered a number of unforeseen conditions during construction that greatly increased PKC’s cost of performance.
Certain of PKC’s claims have been presented to a Disputes Review Board (“DRB”) which consists of three construction experts chosen by the parties. To date, the DRB has ruled on a binding basis that PKC is entitled to additional compensation for its contract time delay claim in the amount of $17.4 million. A Judge of the Massachusetts Superior Court has issued a decision upholding the DRB’s binding award to PKC. Although MHD challenged several of the DRB’s decisions relative to the contract time delay award discussed above, PKC received a favorable ruling on March 20, 2002 from the Superior Court of the Commonwealth of Massachusetts that approved PKC’s request to have MHD comply with the DRB’s decision to award the $17.4 million for the time delay. The MHD has appealed the Superior Court decision to the Appeals Court of the Commonwealth of Massachusetts.
PERINI CORPORATION AND SUBSIDIARIES
NOTES TO CONSOLIDATED CONDENSED FINANCIAL STATEMENTS (Continued)
(6)Contingencies and Commitments (continued)
(d) Perini/Kiewit/Cashman Joint Venture – Central Artery/Tunnel Project Matter (continued)
The DRB has also ruled on a binding basis that PKC is entitled to additional compensation for impacts and inefficiencies caused by MHD to PKC’s underpinning work in the amount of $5.6 million and that PKC is entitled to additional compensation for impacts and inefficiencies caused by MHD to PKC’s utility work in the amount of $11.5 million. PKC has filed applications in these actions seeking to confirm the awards and MHD has filed civil actions in Massachusetts Superior Court seeking to vacate these awards.
Under the Dispute Resolution Rules of the contract, either party may periodically terminate the services of some or all of the DRB members provided that members who are removed under this provision will remain on the DRB through the completion of any then pending claims. The MHD has chosen to remove the current DRB members under this provision and those members are in the process of completing hearings on all pending claims. Although the replacement DRB members have been agreed upon, proceedings before the current DRB and the new DRB have been postponed pending resolution of the current negotiations discussed below.
The pending claims yet to be decided by the current/replacement DRB on a binding basis have an anticipated value of $49.4 million. The remaining claims to be decided by the replacement DRB on a non-binding basis have an anticipated value of $72.6 million.
On August 14, 2002 the Massachusetts Attorney General’s office, pursuant to its authority under the Massachusetts False Claims Act, served a Civil Investigative Demand (“CID”) on Perini and the other joint venture partners. The CID sought the production of certain construction claims documentation in connection with the Central Artery/Tunnel Contract No. C11A1. PKC vigorously denies that it submitted any false claims and is cooperating with the Attorney General’s Office in the ongoing investigation.
In December 2002, PKC and MHD entered into an agreement whereby the parties agreed to attempt to resolve by negotiation and mediation all of the outstanding claims on the project. As part of the agreement, the MHD recommended for approval by the Massachusetts Turnpike Authority a contract modification that provides for provisional payments to PKC totaling $25 million against PKC’s outstanding claims. To date, PKC has received $23.75 million of those provisional payments. The parties also agreed to stay the pending litigation and DRB proceedings during the negotiations. Perini began mediation on all claims in September 2003. The ultimate financial impact of resolving all of the claims on this project is not yet determinable.
(e) Redondo/Perini Joint Venture vs. Siemens Transportation Matter
This is a binding arbitration proceeding arising out of a contract between the Redondo/Perini Joint Venture (“RPJV”), a joint venture in which Perini Corporation (“Perini”) and Redondo Construction Corp. (“Redondo”) each have a 50% interest, and the Siemens Transportation Partnership, S.E., Puerto Rico (“STP”). STP, in conjunction with the Siemens Transportation Team, is constructing a public metropolitan passenger rail transportation project for the Commonwealth of Puerto Rico known as the Tren Urbano Phase I Project (the “Project”). Pursuant to its contract with STP, RPJV is responsible for the design and construction of two stations, 2.5 kilometers of guideway, the yard and maintenance shop facilities and all trackwork throughout the 17 kilometers of the Project.
On March 19, 2002, Redondo filed a petition for reorganization under 11 U.S.C. Chapter 11 in U.S. Bankruptcy Court for the District of Puerto Rico.
On December 23, 2002, RPJV filed an arbitration demand against STP seeking the recovery of additional costs related to design changes and the late completion of the design for Alignment Section 3 in the amount of
PERINI CORPORATION AND SUBSIDIARIES
NOTES TO CONSOLIDATED CONDENSED FINANCIAL STATEMENTS (Continued)
(6)Contingencies and Commitments (continued)
(e) Redondo/Perini Joint Venture vs. Siemens Transportation Matter (continued)
approximately $38 million. On January 31, 2003, STP filed a counter-demand against RPJV seeking the recovery of damages allegedly related to defects in design and construction and the late completion of RPJV’s work in the amount of approximately $17.9 million along with the repayment of approximately $22.6 million for alleged advances previously paid to RPJV.2003.
An arbitration panel has been chosen and arbitration evidentiary hearings are scheduled to begin on February 23, 2004. Discovery began on September 8, 2003. The ultimate financial impact of resolving all of the claims on this Project is not yet determinable.
(f) Polo Towers Master Owner’s Association, Inc. vs. Perini Building Company, Inc. et. al.
On July 25, 2003, a civil action was filed in Clark County Nevada District Court by the Polo Towers Master Owner’s Association, Inc. (“Owner’s Association”) against Perini Building Company, Inc. (“PBC”), Hansen Mechanical Contractors, Inc. (“Hansen”) and twenty five unnamed “John Doe” defendants. The Polo Towers is a time-share resort property located in Las Vegas, Nevada and PBC has constructed several projects for the developer of that property, the Nevada Resorts Property Polo Towers Limited Partnership (“Developer”). Hansen was a mechanical subcontractor to PBC on those projects.
The Owner’s Association alleges that Hansen “failed to construct and chlorinate the [Polo Towers Phase III] domestic water system per plans, specifications, building codes and industry standards, and [that PBC] failed to monitor the workmanship of Hansen . . . to insure that the [Polo Towers Phase III] water system was properly prepared for use by employees and guests of the project.” The Owner’s Association claims that those alleged failures caused the Polo Towers Phase III domestic water system to become “infected with legionella” and that several guests who were allegedly exposed to legionella at Polo Towers Phase III have brought personal injury damage actions against the Owner’s Association. Nine personal injury damage actions have been brought by individuals who were allegedly exposed to legionella at Polo Towers Phase III against PBC, the Developer and/or Hansen. PBC previously notified its insurance carrier of these personal injury actions and the insurance carrier is presently defending the actions without any reservation of rights under the insurance policy.
The Owner’s Association alleges that it has suffered in excess of $8.0 million in property damages because of the legionella and that it is the assignee of all rights against PBC under the Developer/PBC contract. PBC has forwarded the Owner’s Association’s complaint to its insurance carrier and is awaiting the carrier’s response. PBC will demand defense and indemnification from Hansen, as the mechanical subcontractor, and from the Developer for deficient maintenance. The Owner’s Association has not categorized the elements of its claim and it is unclear whether any portion of the property damage claim will not be covered by insurance.
(g) $21.25 Preferred Shareholders Class Action Lawsuit
On October 15, 2002, Frederick Doppelt, Arthur I. Caplan and Leland D. Zulch filed a lawsuit individually, and as representatives of a class of holders of the Company’s $2.125 Depositary Convertible Exchangeable Preferred Shares (the “Depositary Shares,” each of which represents 1/10th of a share of the Company’s $21.25 Convertible Exchangeable Preferred Stock), against certain current and former directors of Perini (the “Defendants”). This lawsuit is captionedDoppelt, et al. v. Tutor, et al.,United States District Court for the District of Massachusetts, No. 02CV12010MLW. Mr. Doppelt is a current Director of the Company and Mr. Caplan is a former Director of the Company.
PERINI CORPORATION AND SUBSIDIARIES
NOTES TO CONSOLIDATED CONDENSED FINANCIAL STATEMENTS (Continued)
(6)Contingencies and Commitments (continued)
(g) $21.25 Preferred Shareholders Class Action Lawsuit (continued)
Specifically, the Complaint alleges that the Defendants breached their fiduciary duties owed to the holders of the Depositary Shares and to Perini. The Plaintiffs principally allege that the Defendants improperly authorized the exchange of Series B Preferred Stock for common stock while simultaneously refusing to pay accrued dividends due on the Depositary Shares.
On January 6, 2003, the Defendants moved to dismiss the lawsuit. Among other things, the Defendants argued that: (1) they did not owe fiduciary duties to the holders of the Depositary Shares and (2) the claims of breach of fiduciary duty owed to Perini must be dismissed because the claim could only be brought as a derivative action.
On March 21, 2003, the plaintiffs filed an opposition to the motion to dismiss and in May 2003 the Plaintiffs asked the Court for leave to file an Amended Complaint.
In June 2003 the Plaintiffs were given leave to file an Amended Complaint. The Amended Complaint adds an allegation that the Defendants have further breached their fiduciary duties by authorizing a tender offer for the purchase of up to 90% of the Depositary Shares and an allegation that the collective actions of the Defendants constitute unfair and deceptive business practices under the provisions of the Massachusetts Consumer Protection Act. The Plaintiffs seek damages in an amount not less than $15,937,500, trebled, plus interest, costs, fees, and other unspecified punitive and exemplary damages.
On August 29, 2003, the Defendants filed a Motion to Dismiss. Plaintiffs filed an opposition thereto and on October 14, 2003, the Defendants filed their reply.
In 2001, a somewhat similar lawsuit was filed by some of the same plaintiffs in the United States District Court for the Southern District of New York. In 2002, the case was dismissed and upon appeal by the plaintiffs to the United States Court of Appeals for the Second Circuit, the appeal was dismissed.
(h) Other
Contingent liabilities also include liability of contractors for performance and completion of both Company and joint venture construction contracts. In addition to the legal matters described above, the Company is involved in various lawsuits, arbitration and alternative dispute resolution proceedings. In the opinion of management, the resolution of these proceedings will not have a material effect on the Company’s results of operations or financial condition.
PERINI CORPORATION AND SUBSIDIARIES
NOTES TO CONSOLIDATED CONDENSED FINANCIAL STATEMENTS (Continued)
(7)Long-term Debt
On January 23, 2002, the Company entered into an agreement with a bank group to refinance its former credit facility with a new $45 million credit agreement (the “Credit Agreement”). In February 2003, the terms of the Credit Agreement were amended to increase the revolving credit facility from $45 million to $50 million; to extend the term of the Credit Agreement from January 2004 to June 2005; to increase the amount of unborrowed revolving commitment available for letters of credit from $5.0 million to $7.5 million; and to adjust certain financial covenants. Other terms of the Credit Agreement remained the same, including the provision that amounts due in June 2005, if not extended or repaid, convert to a three year term loan with equal quarterly principal payments. Because of this provision, borrowings under the Credit Agreement are classified as “Long-term Debt” in the accompanying Consolidated Condensed Balance Sheets.
(8)Tender Offer for $21.25 Preferred Stock
On June 9, 2003, the Company completed its tender offer to purchase up to 900,000 shares, or approximately 90% of its outstanding $2.125 Depositary Convertible Exchangeable Preferred Shares (the “Depositary Shares”), each of which represents 1/10th of a share of the Company’s $21.25 Preferred Stock at a purchase price of $25.00 per share, net to the seller in cash without interest. The tender offer which commenced on March 31, 2003, expired on June 9, 2003, at which time the Company purchased 440,627 Depositary Shares.
The completion of the self tender offer resulted in the Company purchasing and immediately retiring 440,627 Depositary Shares and a reduction of approximately $11.3 million, including related expenses, in Stockholders’ Equity. Also, approximately $7.3 million of previously accrued and unpaid dividends relating to the purchased shares was reversed and restored to Paid-In Surplus.
(9)Credit (Provision) For Income Taxes
The credit for income taxes in 2003 is due primarily to the recognition in the first quarter of 2003 of a $7.0 million federal tax benefit in accordance with SFAS No. 109, “Accounting for Income Taxes” based on the expectation that the Company will be able to utilize a portion of its net operating loss carryforwards in future years. In addition, the credit (provision) for income taxes reflects a lower-than-normal tax rate in both years due primarily to the realization of a portion of the federal tax benefit not recognized in prior years. Also, the provision for income taxes for the nine months ended September 30, 2002 reflects the reversal of the federal alternative minimum tax provided in 2001 which was no longer required based on the provisions of the Job Creation and Workers Assistance Act of 2002.
(10)Per Share Data
Basic earnings per common share was computed by dividing net income less dividends accrued on the $21.25 Preferred Stock during all periods presented plus the reversal in both the second and third quarters of 2003 of dividends on the $21.25 Preferred Stock previously accrued, but no longer required based on the results of the tender offer completed in June, 2003 (see Notes 8 and 11) by the weighted average number of common shares outstanding. Diluted earnings per common share was similarly computed after giving consideration to the dilutive effect of stock options outstanding on the weighted average number of common shares outstanding.
Options to purchase 380,000 shares of Common Stock at prices ranging from $8.10 to $8.66 per share were outstanding at September 30, 2003 but were not included in the computation of diluted earnings per share because the options’ exercise price was greater than the average market price of the Common Stock. Options to purchase 3,356,834 shares of Common Stock at prices ranging from $4.50 to $16.44 per share were outstanding at September 30, 2002 but were not included in the computation of diluted earnings per share because the options’ exercise price was greater than the average market price of the Common Stock. In addition, the effect of the assumed conversion of the Company’s outstanding $21.25 Preferred Stock and Stock Purchase Warrants into Common Stock is antidilutive for all periods presented.
PERINI CORPORATION AND SUBSIDIARIES
NOTES TO CONSOLIDATED CONDENSED FINANCIAL STATEMENTS (Continued)
(11)Dividends
(a) Common Stock
There were no cash dividends declared or paid on the Company’s outstanding Common Stock during the periods presented in the consolidated condensed financial statements included herein.
(b) $21.25 Preferred Stock
In conjunction with the covenants of the Company’s prior Credit Agreements, the Company was required to suspend the payment of quarterly dividends on its $21.25 Preferred Stock until certain financial criteria were met. Quarterly dividends on the $21.25 Preferred Stock have not been paid since 1995 (although they have been fully accrued due to the “cumulative” feature of the $21.25 Preferred Stock). On June 9, 2003, the Company completed a tender offer on its $21.25 Preferred Stock whereby the Company purchased 440,627 Depositary Shares (see Note 8 above). As a result of this transaction, approximately $7.3 million of previously accrued and unpaid dividends was reversed and restored to “Paid-In Surplus” in the Consolidated Condensed Balance Sheets. Accordingly, the aggregate amount of dividends in arrears at September 30, 2003 is approximately $9.5 million, which represents approximately $170.00 per share of $21.25 Preferred Stock or approximately $17.00 per Depositary Share and is included in “Other Long-term Liabilities” in the Consolidated Condensed Balance Sheets. Under the terms of the $21.25 Preferred Stock, the holders of Depositary Shares are entitled to elect two additional Directors when dividends have been deferred for more than six quarters, and they did so at each of the last six Annual Meetings of Stockholders.
(12)Business Segments
The following tables set forth certain business segment information relating to the Company’s operations for the three month and nine month periods ended September 30, 2003 and 2002 (in thousands):
Nine months ended September 30, 2003 | ||||||||||||||||
| Reportable Segments | ||||||||||||||||
| Building | Civil | Totals | Corporate | Consolidated Totals | ||||||||||||
Revenues | $ | 738,944 | $ | 134,507 | $ | 873,451 | $ | — | $ | 873,451 | ||||||
Income from Operations | $ | 20,617 | $ | 1,684 | $ | 22,301 | $ | (6,149 | ) * | $ | 16,152 | |||||
Assets | $ | 186,673 | $ | 245,573 | $ | 432,246 | $ | 32,166 | ** | $ | 464,412 | |||||
Nine months ended September 30, 2002 | ||||||||||||||||
| Reportable Segments | ||||||||||||||||
| Building | Civil | Totals | Corporate | Consolidated Totals | ||||||||||||
Revenues | $ | 586,073 | $ | 236,409 | $ | 822,482 | $ | — | $ | 822,482 | ||||||
Income from Operations | $ | 18,432 | $ | 1,849 | $ | 20,281 | $ | (4,675 | ) * | $ | 15,606 | |||||
Assets | $ | 152,044 | $ | 221,884 | $ | 373,928 | $ | 21,398 | ** | $ | 395,326 | |||||

PART II
INFORMATION NOT REQUIRED IN PROSPECTUS
Item 13. Other Expenses of Issuance and Distribution
The following table sets forth the estimated expenses (excluding underwriting discounts and commissions) expected to be paid by the Company in connection with the distribution of the common stock registered hereby:
Nature of Expense | Amount† | ||
SEC Registration Fee | $ | 4,521 | |
National Association of Securities Dealers, Inc. – filing fee | 6,278 | ||
Accounting Fees and Expenses | 150,000 | ||
Legal Fees and Expenses | 627,000 | ||
Printing Expenses | 125,000 | ||
Miscellaneous | 77,974 | ||
TOTAL | $ | 990,773 | |
| † | The amounts set forth above, except for the SEC registration fee, are estimated. |
Item 14. Indemnification of Directors and Officers
The Restated Articles of Organization, as amended, of the Registrant provide for the elimination of liability of directors to the Registrant or its stockholders for monetary damages for negligent acts or omissions to the extent permitted by Section 13 of the Business Corporation Law of the Commonwealth of Massachusetts.
Section 67 of the Business Corporation Law of the Commonwealth of Massachusetts gives corporations the power to indemnify directors, officers, employees and other agents and persons under certain circumstances.
The bylaws of the Registrant provide for indemnification of officers, directors and certain other corporate representatives for all expenses incurred by them in defense of any proceeding or lawsuit in which they are successful on the merits. In such a situation, the right to receive indemnification is mandatory and does not require an affirmative determination by the Board of Directors.
The bylaws also authorize indemnification of officers, directors and certain other corporate representatives for expenses and liabilities in cases other than those in which they are successful on the merits, subject to specified conditions. No indemnification shall be provided with respect to any matter as to which an officer, director or corporate representative shall have been adjudicated not to have acted in good faith and in the reasonable belief that his action was in the best interest of the Registrant, or, with respect to a criminal matter, that he had reasonable cause to believe that his conduct was unlawful. No indemnification shall be provided for any director or officer or corporate representative with respect to a proceeding by or in the right of the Registrant in which he is adjudicated to be liable to the Registrant.
The bylaws provide that if a proceeding is compromised or settled in a manner which imposes a liability or obligation upon a director or officer or corporate representative, no indemnification shall be provided to him with respect to (i) a proceeding by or in the right of the Registrant unless the Board of Directors determines in its discretion that indemnification is appropriate under the circumstances, and (ii) any other type of proceeding if it is determined by the Board of Directors that said director or officer or corporate representative is ineligible to be indemnified under the bylaws of the Registrant.
The bylaws provide that any indemnification other than mandatory indemnification shall be authorized in each case as determined by the Board of Directors, which may act on the indemnification request notwithstanding that one or more of its members are parties to the proceeding or otherwise have an interest in such indemnification.
II-1
The bylaws also authorize the Registrant to purchase and maintain insurance on behalf of officers and directors against liabilities incurred by them in their capacities as such, whether or not the Registrant would have been able to indemnify them for such liabilities.
The bylaws of the Registrant authorize the Registrant to enter into specific agreements with its officers and directors to indemnify them to the full extent permitted by law.
Item 15. Recent Sales of Unregistered Securities
Not applicable.
Item 16. Exhibits and Financial Statement Schedules
(a) Exhibits
Exhibit Number | Description | |
| Form of Underwriting Agreement. | ||
| 3.1 | Restated Articles of Organization (incorporated by reference to Exhibit 4 to Form S-2 (File No. 33-28401) filed on April 28, 1989). | |
| **3.2 | Articles of Amendment to the Restated Articles of Organization of the Perini Corporation. | |
| 3.3 | Articles of Amendment to the Articles of Organization of Perini Corporation (incorporated by reference to Exhibit 3.1 to Form 8-K filed on April 12, 2000). | |
| 3.4 | Amended and Restated Bylaws of Perini Corporation (incorporated by reference to Exhibit 3.2 of Form 8-K (File No. 001-06314) filed on February 14, 1997). | |
| 3.5 | Amendment No. 1 to the Amended and Restated Bylaws of Perini Corporation (incorporated by reference to Exhibit 3.2 to Form 8-K filed on April 12, 2000). | |
| 4.1 | Certificate of Vote of Directors Establishing a Series of a Class of Stock determining the relative rights and preferences of the $21.25 Convertible Exchangeable Preferred Stock (incorporated by reference to Exhibit 4(a) to the Registration Statement on Form S-2 (File No. 33-14434) filed on June 19, 1987). | |
| **4.2 | Certificate of Vote of Directors Establishing a Series of a Class of Stock determining the relative rights and preferences of the Series A Junior Participating Cumulative Preferred Stock. | |
| 4.3 | Certificate of Vote of Directors Establishing a Series of a Class of Stock determining the relative rights and preferences of the Series B Cumulative Convertible Preferred Stock (incorporated by reference to Exhibit 4.8 of Form 8-K (File No. 001-06314) filed on February 14, 1997). | |
| 4.4 | Form of Deposit Agreement, including form of Depositary Receipt (incorporated by reference to Exhibit 4(b) to the Registration Statement on Form S-2 (File No. 33-14434) filed on June 19, 1987). | |
| 4.5 | Form of Indenture with respect to the 8 1/2% Convertible Subordinated Debentures Due June 15, 2012, including form of Debenture (incorporated by reference to Exhibit 4(c) to the Registration Statement on Form S-2 (File No. 33-14434) filed on June 19, 1987). | |
| 4.6 | Shareholder Rights Agreement dated as of September 23, 1988, as amended and restated as of May 17, 1990, as amended and restated as of January 17, 1997, between Perini Corporation and State Street Bank and Trust Company, as Rights Agent (incorporated by reference to Exhibit 4.4 to Amendment No. 1 to the Registration Statement on Form 8-A/A filed on January 29, 1997). | |
II-2
Exhibit Number | Description | |
| 4.7 | Amendment dated March 29, 2000 to the Shareholder Rights Agreement (incorporated by reference to Exhibit 4.3 to Form 8-K filed on April 12, 2000). | |
| 4.8 | Exchange Agreement by and between Perini Corporation and The Union Labor Life Insurance Company, acting on behalf of its Separate Account P, dated as of February 7, 2000 (incorporated by reference to Exhibit 10.1 to Form 8-K filed on April 12, 2000). | |
| 4.9 | Exchange Agreement by and between Perini Corporation and PB Capital Partners, L.P., dated as of February 14, 2000 (incorporated by reference to Exhibit 10.2 to Form 8-K filed on April 12, 2000). | |
| 4.10 | Exchange Agreement by and between Perini Corporation and The Common Fund for Non-Profit Organizations, dated as of February 14, 2000 (incorporated by reference to Exhibit 10.3 to Form 8-K filed on April 12, 2000). | |
| 4.11 | Registration Rights Agreement by and among Perini Corporation, Tutor-Saliba Corporation, Ronald N. Tutor, O&G Industries, Inc. and National Union Fire Insurance Company of Pittsburgh, Pa., BLUM Capital Partners, L.P., PB Capital Partners, L.P., The Common Fund for Non-Profit Organizations, and The Union Labor Life Insurance Company, acting on behalf of its Separate Account P, dated as of March 29, 2000 (incorporated by reference to Exhibit 4.1 to Form 8-K filed on April 12, 2000). | |
| 4.12 | Shareholders’ Agreement by and among Perini Corporation, Tutor-Saliba Corporation, Ronald N. Tutor, O&G Industries, Inc. and National Union Fire Insurance Company of Pittsburgh, Pa., BLUM Capital Partners, L.P., PB Capital Partners, L.P., The Common Fund for Non-Profit Organizations, and The Union Labor Life Insurance Company, acting on behalf of its Separate Account P, dated as of March 29, 2000 (incorporated by reference to Exhibit 4.2 to Form 8-K filed on April 12, 2000). | |
| **4.13 | Form of Warrant to purchase an aggregate of 420,000 shares of common stock of Perini Corporation, dated January 17, 1997 issued to former lenders of Perini Corporation. | |
| **4.14 | Letter Agreement by and among Perini Corporation, Blum Capital Partners, L.P., PB Capital Partners, L.P. and The Common Fund for Non-Profit Organizations, dated as of December 1, 2003. | |
| **4.15 | Warrantholders Rights Agreement by and among Perini Corporation and the former lenders of Perini Corporation, dated January 17, 1997. | |
| *4.16 | Securityholders Agreement by and among Perini Corporation, PB Capital Partners, L.P., The Union Labor Life Insurance Company Separate Account P, The Common Fund for Non-Profit Organizations, for the Account of its Equity Fund and the Initial Warrantholders (as defined therein), dated as of January 17, 1997. | |
| **5.1 | Opinion of Goodwin Procter LLP as to the legality of the securities. | |
| **10.1 | Perini Corporation Amended and Restated (2004) General Incentive Compensation Plan. | |
| **10.2 | Perini Corporation Amended and Restated (2004) Construction Business Unit Incentive Compensation Plan. | |
| 10.3 | Management Agreement dated as of January 17, 1997 by and among the Company, Ronald N. Tutor and Tutor-Saliba Corporation (incorporated by reference to Exhibit 10.16 to Perini Corporation’s Annual Report on Form 10-K for the year ended December 31, 2002 filed on March 31, 2003). | |
| **10.4 | Amendment No. 1 dated as of December 23, 1998 to the Management Agreement by and among the Company, Ronald N. Tutor and Tutor-Saliba Corporation. | |
| 10.5 | Amendment No. 2 dated as of December 31, 1999 to the Management Agreement by and among the Company, Ronald N. Tutor and Tutor-Saliba Corporation (incorporated by reference to Exhibit 10.31 to Perini Corporation’s Quarterly Report on Form 10-Q for the first quarter ended March 31, 2000 filed on May 9, 2000). | |
| **10.6 | Amendment No. 3 dated as of December 31, 2001 to the Management Agreement by and among the Company, Ronald N. Tutor and Tutor-Saliba Corporation. | |
II-3
Exhibit Number | Description | |
| 10.7 | Amendment No. 4 dated as of December 31, 2001 to the Management Agreement by and among the Company, Ronald N. Tutor and Tutor-Saliba Corporation (incorporated by reference to Exhibit 10.36 to Perini Corporation’s Annual Report on Form 10-K for the year ended December 31, 2002 filed on March 31, 2003). |
II-3
|
| |
| **10.8 | Amendment No. 5 dated as of December 31, 2002 to the Management Agreement by and among the Company, Ronald N. Tutor and Tutor-Saliba Corporation. | |
| **10.9 | 1982 Stock Option and Long Term Performance Incentive Plan, as amended. | |
| 10.10 | Special Equity Incentive Plan (incorporated by reference to Exhibit A to Perini Corporation’s Proxy Statement for Annual Meeting of Stockholders dated April 19, 2000). | |
| 10.11 | Securities Purchase Agreement by and among Perini Corporation and Tutor-Saliba Corporation, O&G Industries, Inc. and National Union Fire Insurance Company of Pittsburgh, PA, dated as of February 5, 2000 (incorporated by reference to Exhibit 10.1 to Form 8-K filed on February 9, 2000). | |
| 10.12 | Promissory Note dated as of September 6, 2000 by and among Mt. Wayte Realty, LLC (a wholly-owned subsidiary of Perini Corporation) and The Manufacturers Life Insurance Company (U.S.A.) (incorporated by reference to Exhibit 10.34 to Perini Corporation’s Quarterly Report on Form 10-Q for the period ended September 30, 2000 filed on November 6, 2000). | |
| 10.13 | Credit Agreement dated January 23, 2002 among Perini Corporation, Fleet National Bank, as Administrative Agent, Fleet National Bank, as Arranger, and the Lenders Party Hereto (incorporated by reference to Exhibit 10.35 to Perini Corporation’s Annual Report on Form 10-K for the year ended December 31, 2001 filed on March 21, 2002). | |
| 10.14 | Stock Purchase and Sale Agreement dated December 16, 2002 by and among the Company, James A. Cummings, Inc., James A. Cummings, William R. Derrer and Michael F. Lanciault (incorporated by reference to Exhibit 10.37 to Perini Corporation’s Annual Report on Form 10-K for the year ended December 31, 2002 filed on March 31, 2003). | |
| 10.15 | Employment Agreement dated January 23, 2003 by and among the Company, James A. Cummings, Inc. and James A. Cummings (incorporated by reference to Exhibit 10.38 to Perini Corporation’s Annual Report on Form 10-K for the year ended December 31, 2002 filed on March 31, 2003). | |
| 10.16 | First Amendment and Waiver dated February 14, 2003 to Credit Agreement among Perini Corporation, Fleet National Bank, as Administrative Agent, and the Lenders (incorporated by reference to Exhibit 10.39 to Perini Corporation’s Annual Report on Form 10-K for the year ended December 31, 2002 filed on March 31, 2003). | |
| **10.17 | Second Amendment dated November 5, 2003 to Credit Agreement among Perini Corporation, Fleet National Bank, as Administrative Agent, and the Lenders. | |
| **10.18 | Amendment No. 6 dated as of January 1, 2004 to the Management Agreement by and among the Company, Ronald N. Tutor and Tutor-Saliba Corporation. | |
| **10.19 | Form of Director and Officer Indemnification Agreement. | |
| **10.20 | Third Amendment dated January 31, 2004 to Credit Agreement among Perini Corporation, Fleet National Bank, as Administrative Agent, and the Lenders. | |
| *10.21 | Letter Agreement by and among Perini Corporation, Blum Capital Partners, L.P., PB Capital Partners, L.P., The Common Fund for Non-Profit Organizations, National Union Fire Insurance Company of Pittsburgh, Pa., and The Union Labor Life Insurance Company, acting on behalf of its Separate Account P, dated March 16, 2004. | |
| **21.1 | List of Subsidiaries. | |
| **23.1 | Consent of Goodwin Procter LLP (included in Exhibit 5.1 hereto). | |
| *23.2 | Consent of Deloitte & Touche LLP. | |
| **24.1 | Power of Attorney (included on signature page). | |
| * | Filed herewith. |
| ** | Previously filed. |
II-4
(b) Financial Statement Schedules
The following financial statement schedules and report are filed as part of this report:
INDEX | ||
Schedule | II-5 | |
Independent Auditors’ Report on Schedule | II-6 | |
| ||
All other schedules are omitted because of the absence of the conditions under which they are required or because the required information is included in the Consolidated Financial Statements or in the Notes thereto.
Schedule II(A)II
Perini Corporation and Subsidiaries
Valuation and Qualifying Accounts and Reserves
for the Years Ended December 31, 2003, 2002 2001 and 20002001
(In Thousands of Dollars)
| Additions | Additions | |||||||||||||||||||||||||||||||
Balance at Beginning of Year | Charged to Costs & Expenses | Charged to Other Accounts | Deductions from Reserves | Balance at End of Year | Balance at Beginning of Year | Charged to Costs & Expenses | Charged to Other Accounts | Deductions from Reserves | Balance at End of Year | |||||||||||||||||||||||
Description | ||||||||||||||||||||||||||||||||
Year Ended December 31, 2003 | ||||||||||||||||||||||||||||||||
Reserve for real estate investments | $ | 2,515 | $ | – | $ | – | $ | 2,515 | (2) | $ | – | |||||||||||||||||||||
Year Ended December 31, 2002 | ||||||||||||||||||||||||||||||||
Reserve for real estate investments | $ | 9,972 | $ | – | $ | – | $ | 7,457 | (1) | $ | 2,515 | $ | 9,972 | $ | – | $ | – | $ | 7,457 | (1) | $ | 2,515 | ||||||||||
Year Ended December 31, 2001 | ||||||||||||||||||||||||||||||||
Reserve for real estate investments | $ | 17,621 | $ | – | $ | – | $ | 7,649 | (1) | $ | 9,972 | $ | 17,621 | $ | – | $ | – | $ | 7,649 | (1) | $ | 9,972 | ||||||||||
Year Ended December 31, 2000 | ||||||||||||||||||||||||||||||||
Reserve for real estate investments | $ | 23,622 | $ | – | $ | – | $ | 6,001 | (1) | $ | 17,621 | |||||||||||||||||||||
| (1) | Represents sales or other dispositions of real estate properties. |
II-5
Independent Auditors’ Report on Schedule
To the Stockholders of Perini Corporation:
We have audited, in accordance with auditing standards generally accepted in the United States of America, the consolidated financial statements included in this Registration Statement on Form S-1, and have issued our report thereon dated March 21, 2003, which expresses an unqualified opinion and includes an explanatory paragraph concerning a retroactive change in presentation of the Company’s joint ventures in the consolidated balance sheets from the equity method to the proportionate consolidation method and the restatement of basic and diluted earnings per share for the year ended December 31, 2000. Our audits were made for the purpose of forming an opinion on the consolidated financial statements taken as a whole. The supplemental schedule II(A) listed in the accompanying index is the responsibility of the Company’s management and is presented for the purpose of complying with the Securities and Exchange Commission’s rules and is not part of the consolidated financial statements. This schedule has been subjected to the auditing procedures applied in the audits of the consolidated financial statements and, in our opinion, fairly states, in all material respects, the financial data required to be set forth therein in relation to the consolidated financial statements taken as a whole.
DELOITTE & TOUCHE LLP
Boston, Massachusetts
March 21, 2003
II-6
Schedule II(B)
Perini Corporation and Subsidiaries
Valuation and Qualifying Accounts and Reserves (Unaudited)
for the Nine Months Ended September 30, 2003
(In Thousands of Dollars)
| Additions | ||||||||||||||||
Balance at Beginning of Year | Charged to Costs & Expenses | Charged to Other Accounts | Deductions from Reserves | Balance at End of Year | ||||||||||||
Description | ||||||||||||||||
Nine Months Ended September 30, 2003 | ||||||||||||||||
Reserve for real estate investments | $ | 2,515 | $ | — | $ | — | $ | 2,515 | (1) | $ | — | |||||
| Primarily relates to a reduction in the carrying value of the remaining “Land Held for Sale” ($2,066) and the disposition of certain other real estate assets. |
II-7
II-5
Independent Auditors’ Report on Schedule
To the Stockholders of Perini Corporation:
We have audited the consolidated financial statements of Perini Corporation and Subsidiaries (collectively, the “Company”), as of December 31, 2003 and 2002, and for each of the three years in the period ended December 31, 2003, and have issued our report thereon dated March 11, 2004 (included elsewhere in this Registration Statement on Form S-1). Our audits also included the financial statement Schedule II listed in the accompanying index of this Form S-1. This financial statement schedule is the responsibility of the Company’s management. Our responsibility is to express an opinion based on our audits. In our opinion, such financial statement schedule, when considered in relation to the consolidated financial statements taken as a whole, presents fairly in all material respects the information set forth therein.
DELOITTE & TOUCHE LLP
Boston, Massachusetts
March 11, 2004
II-6
Item 17. Undertakings
(a) The undersigned registrant hereby undertakes:
(1) For purposes of determining any liability under the Securities Act of 1933, the information omitted from the form of prospectus filed as part of this registration statement in reliance upon Rule 430A and contained in a form of prospectus filed by the registrant pursuant to Rule 424(b)(1) or (4) or 497(h) under the Securities Act shall be deemed to be part of this registration statement as of the time it was declared effective.
(2) For the purpose of determining any liability under the Securities Act of 1933, each post-effective amendment that contains a form of prospectus shall be deemed to be a new registration statement relating to the securities offered therein, and the offering of such securities at that time shall be deemed to be the initial bona fide offering thereof.
(b) Insofar as indemnification for liabilities arising under the Securities Act of 1933 may be permitted to directors, officers and controlling persons of the registrant pursuant to the foregoing provisions, or otherwise, the registrant has been advised that in the opinion of the Securities and Exchange Commission such indemnification is against public policy as expressed in the Securities Act of 1933 and is, therefore, unenforceable. In the event that a claim for indemnification against such liabilities (other than the payment by the registrant of expenses incurred or paid by a director, officer or controlling person of the registrant in the successful defense of any action, suit or proceeding) is asserted by such director, officer or controlling person in connection with the securities being registered, the registrant will, unless in the opinion of its counsel the matter has been settled by controlling precedent, submit to a court of appropriate jurisdiction the question whether such indemnification by it is against public policy as expressed in the Securities Act of 1933 and will be governed by the final adjudication of such issue.
II-8II-7
SIGNATURES
Pursuant to the requirements of the Securities Act of 1933, the Registrant has duly caused this Pre-Effective Amendment No. 23 to this Registration Statement to be signed on its behalf by the undersigned, thereunto duly authorized, in the Town of Framingham, Commonwealth of Massachusetts, on March5,16, 2004.
PERINI CORPORATION | ||
By: | /s/ ROBERT BAND | |
Robert Band President and Chief Operating Officer | ||
Pursuant to the requirement of the Securities Act of 1933, as amended, this Pre-Effective Amendment No. 23 to this Registration Statement has been signed by the following person in the capacities and on the date indicated.
Signature | Title | Date | ||
* Ronald N. Tutor | Chairman and Chief Executive Officer and Director (Principal Executive Officer) | March | ||
/s/ ROBERT BAND Robert Band | President, Chief Operating Officer and Director | March | ||
* Michael E. Ciskey | Vice President and Chief Financial Officer (Principal Financial and Accounting Officer) | March | ||
* Peter Arkley | Director | March | ||
II-9II-8
Signature | Title | Date | ||
* James A. Cummings | Director | March | ||
Frederick Doppelt | Director | |||
Asher B. Edelman | Director | |||
* Robert A. Kennedy | Director | March | ||
* Michael R. Klein | Director | March | ||
* Raymond R. Oneglia | Director | March | ||
*By: | /s/ ROBERT BAND | |
Robert Band Attorney-in-fact | ||
II-10II-9
EXHIBIT INDEX
Exhibit Number | Description | |
| Form of Underwriting Agreement. | ||
| 3.1 | Restated Articles of Organization (incorporated by reference to Exhibit 4 to Form S-2 (File No. 33-28401) filed on April 28, 1989). | |
| **3.2 | Articles of Amendment to the Restated Articles of Organization of Perini Corporation. | |
| 3.3 | Articles of Amendment to the Articles of Organization of Perini Corporation (incorporated by reference to Exhibit 3.1 to Form 8-K filed on April 12, 2000). | |
| 3.4 | Amended and Restated Bylaws of Perini Corporation (incorporated by reference to Exhibit 3.2 of Form 8-K (File No. 001-06314) filed on February 14, 1997). | |
| 3.5 | Amendment No. 1 to the Amended and Restated Bylaws of Perini Corporation (incorporated by reference to Exhibit 3.2 to Form 8-K filed on April 12, 2000). | |
| 4.1 | Certificate of Vote of Directors Establishing a Series of a Class of Stock determining the relative rights and preferences of the $21.25 Convertible Exchangeable Preferred Stock (incorporated by reference to Exhibit 4(a) to the Registration Statement on Form S-2 (File No. 33-14434) filed on June 19, 1987). | |
| **4.2 | Certificate of Vote of Directors Establishing a Series of a Class of Stock determining the relative rights and preferences of the Series A Junior Participating Cumulative Preferred Stock. | |
| 4.3 | Certificate of Vote of Directors Establishing a Series of a Class of Stock determining the relative rights and preferences of the Series B Cumulative Convertible Preferred Stock (incorporated by reference to Exhibit 4.8 of Form 8-K (File No. 001-06314) filed on February 14, 1997). | |
| 4.4 | Form of Deposit Agreement, including form of Depositary Receipt (incorporated by reference to Exhibit 4(b) to the Registration Statement on Form S-2 (File No. 33-14434) filed on June 19, 1987). | |
| 4.5 | Form of Indenture with respect to the 8 1/2% Convertible Subordinated Debentures Due June 15, 2012, including form of Debenture (incorporated by reference to Exhibit 4(c) to the Registration Statement on Form S-2 (File No. 33-14434) filed on June 19, 1987). | |
| 4.6 | Shareholder Rights Agreement dated as of September 23, 1988, as amended and restated as of May 17, 1990, as amended and restated as of January 17, 1997, between Perini Corporation and State Street Bank and Trust Company, as Rights Agent (incorporated by reference to Exhibit 4.4 to Amendment No. 1 to the Registration Statement on Form 8-A/A filed on January 29, 1997). | |
| 4.7 | Amendment dated March 29, 2000 to the Shareholder Rights Agreement (incorporated by reference to Exhibit 4.3 to Form 8-K filed on April 12, 2000). | |
| 4.8 | Exchange Agreement by and between Perini Corporation and The Union Labor Life Insurance Company, acting on behalf of its Separate Account P, dated as of February 7, 2000 (incorporated by reference to Exhibit 10.1 to Form 8-K filed on April 12, 2000). | |
| 4.9 | Exchange Agreement by and between Perini Corporation and PB Capital Partners, L.P., dated as of February 14, 2000 (incorporated by reference to Exhibit 10.2 to Form 8-K filed on April 12, 2000). | |
| 4.10 | Exchange Agreement by and between Perini Corporation and The Common Fund for Non-Profit Organizations, dated as of February 14, 2000 (incorporated by reference to Exhibit 10.3 to Form 8-K filed on April 12, 2000). | |
Exhibit Number | Description | |
| 4.11 | Registration Rights Agreement by and among Perini Corporation, Tutor-Saliba Corporation, Ronald N. Tutor, O&G Industries, Inc. and National Union Fire Insurance Company of Pittsburgh, Pa., BLUM Capital Partners, L.P., PB Capital Partners, L.P., The Common Fund for Non-Profit Organizations, and The Union Labor Life Insurance Company, acting on behalf of its Separate Account P, dated as of March 29, 2000 (incorporated by reference to Exhibit 4.1 to Form 8-K filed on April 12, 2000). | |
| 4.12 | Shareholders’ Agreement by and among Perini Corporation, Tutor-Saliba Corporation, Ronald N. Tutor, O&G Industries, Inc. and National Union Fire Insurance Company of Pittsburgh, Pa., BLUM Capital Partners, L.P., PB Capital Partners, L.P., The Common Fund for Non-Profit Organizations, and The Union Labor Life Insurance Company, acting on behalf of its Separate Account P, dated as of March 29, 2000 (incorporated by reference to Exhibit 4.2 to Form 8-K filed on April 12, 2000). | |
| **4.13 | Form of Warrant to purchase an aggregate of 420,000 shares of common stock of Perini Corporation, dated January 17, 1997 issued to former lenders of Perini Corporation. | |
| **4.14 | Letter Agreement by and among Perini Corporation, Blum Capital Partners, L.P., PB Capital Partners, L.P. and The Common Fund for Non-Profit Organizations, dated as of December 1, 2003. | |
| **4.15 | Warrantholders Rights Agreement by and among Perini Corporation and the former lenders of Perini Corporation, dated January 17, 1997. | |
| *4.16 | Securityholders Agreement by and among Perini Corporation, PB Capital Partners, L.P., The Union Labor Life Insurance Company Separate Account P, The Common Fund for Non-Profit Organizations, for the Account of its Equity Fund and the Initial Warrantholders (as defined therein), dated as of January 17, 1997. | |
| **5.1 | Opinion of Goodwin Procter LLP as to the legality of the securities. | |
| **10.1 | Perini Corporation Amended and Restated (2004) General Incentive Compensation Plan. | |
| **10.2 | Perini Corporation Amended and Restated (2004) Construction Business Unit Incentive Compensation Plan. | |
| 10.3 | Management Agreement dated as of January 17, 1997 by and among the Company, Ronald N. Tutor and Tutor-Saliba Corporation (incorporated by reference to Exhibit 10.16 to Perini Corporation’s Annual Report on Form 10-K for the year ended December 31, 2002 filed on March 31, 2003). | |
| **10.4 | Amendment No. 1 dated as of December 23, 1998 to the Management Agreement by and among the Company, Ronald N. Tutor and Tutor-Saliba Corporation. | |
| 10.5 | Amendment No. 2 dated as of December 31, 1999 to the Management Agreement by and among the Company, Ronald N. Tutor and Tutor-Saliba Corporation (incorporated by reference to Exhibit 10.31 to Perini Corporation’s Quarterly Report on Form 10-Q for the first quarter ended March 31, 2000 filed on May 9, 2000). | |
| **10.6 | Amendment No. 3 dated as of December 31, 2001 to the Management Agreement by and among the Company, Ronald N. Tutor and Tutor-Saliba Corporation. | |
| 10.7 | Amendment No. 4 dated as of December 31, 2001 to the Management Agreement by and among the Company, Ronald N. Tutor and Tutor-Saliba Corporation (incorporated by reference to Exhibit 10.36 to Perini Corporation’s Annual Report on Form 10-K for the year ended December 31, 2002 filed on March 31, 2003). | |
| **10.8 | Amendment No. 5 dated as of December 31, 2002 to the Management Agreement by and among the Company, Ronald N. Tutor and Tutor-Saliba Corporation. | |
| **10.9 | 1982 Stock Option and Long Term Performance Incentive Plan, as amended. | |
| 10.10 | Special Equity Incentive Plan (incorporated by reference to Exhibit A to Perini Corporation’s Proxy Statement for Annual Meeting of Stockholders dated April 19, 2000). | |
Exhibit Number | Description | |
| 10.11 | Securities Purchase Agreement by and among Perini Corporation and Tutor-Saliba Corporation, O&G Industries, Inc. and National Union Fire Insurance Company of Pittsburgh, PA, dated as of February 5, 2000 (incorporated by reference to Exhibit 10.1 to Form 8-K filed on February 9, 2000). |
|
| |
| 10.12 | Promissory Note dated as of September 6, 2000 by and among Mt. Wayte Realty, LLC (a wholly-owned subsidiary of Perini Corporation) and The Manufacturers Life Insurance Company (U.S.A.) (incorporated by reference to Exhibit 10.34 to Perini Corporation’s Quarterly Report on Form 10-Q for the period ended September 30, 2000 filed on November 6, 2000). | |
| 10.13 | Credit Agreement dated January 23, 2002 among Perini Corporation, Fleet National Bank, as Administrative Agent, Fleet National Bank, as Arranger, and the Lenders Party Hereto (incorporated by reference to Exhibit 10.35 to Perini Corporation’s Annual Report on Form 10-K for the year ended December 31, 2001 filed on March 21, 2002). | |
| 10.14 | Stock Purchase and Sale Agreement dated December 16, 2002 by and among the Company, James A. Cummings, Inc., James A. Cummings, William R. Derrer and Michael F. Lanciault (incorporated by reference to Exhibit 10.37 to Perini Corporation’s Annual Report on Form 10-K for the year ended December 31, 2002 filed on March 31, 2003). | |
| 10.15 | Employment Agreement dated January 23, 2003 by and among the Company, James A. Cummings, Inc. and James A. Cummings (incorporated by reference to Exhibit 10.38 to Perini Corporation’s Annual Report on Form 10-K for the year ended December 31, 2002 filed on March 31, 2003). | |
| 10.16 | First Amendment and Waiver dated February 14, 2003 to Credit Agreement among Perini Corporation, Fleet National Bank, as Administrative Agent, and the Lenders (incorporated by reference to Exhibit 10.39 to Perini Corporation’s Annual Report on Form 10-K for the year ended December 31, 2002 filed on March 31, 2003). | |
| **10.17 | Second Amendment dated November 5, 2003 to Credit Agreement among Perini Corporation, Fleet National Bank, as Administrative Agent, and the Lenders. | |
| **10.18 | Amendment No. 6 dated as of January 1, 2004 to the Management Agreement by and among the Company, Ronald N. Tutor and Tutor-Saliba Corporation. | |
| **10.19 | Form of Director and Officer Indemnification Agreement. | |
| **10.20 | Third Amendment dated January 31, 2004 to Credit Agreement among Perini Corporation, Fleet National Bank, as Administrative Agent, and the Lenders. | |
| *10.21 | Letter Agreement by and among Perini Corporation, Blum Capital Partners, L.P., PB Capital Partners, L.P., The Common Fund for Non-Profit Organizations, National Union Fire Insurance Company of Pittsburgh, Pa., and The Union Labor Life Insurance Company, acting on behalf of its Separate Account P, dated March 16, 2004. | |
| **21.1 | List of Subsidiaries. | |
| **23.1 | Consent of Goodwin Procter LLP (included in Exhibit 5.1 hereto). | |
| *23.2 | Consent of Deloitte & Touche LLP. | |
| **24.1 | Power of Attorney (included on signature page). | |
| * | Filed herewith. |
| ** | Previously filed. |